2012.
and cash equivalents Collateral September 30, 2012 December 31, 2011 (dollars in thousands) Fair Value (1) Fair Value (1) Agency Securities ) Interest rate swap contracts Futures Contracts Totals 2012. March 31, 2012. September 30, 2012 Fannie Mae Freddie Mac Ginnie Mae Total Agency Securities (dollars in thousands) Principal Amount Net unamortized premium Amortized cost Unrealized gains Unrealized losses ) ) ) Fair value September 30, 2012 Adjustable Rate Fixed Rate Total Agency Securities (dollars in thousands) Principal Amount Net unamortized premium Amortized cost Unrealized gains Unrealized losses ) ) ) Fair value December 31, 2011 Fannie Mae Freddie Mac Ginnie Mae Total Agency Securities (dollars in thousands) Principal Amount Net unamortized premium Amortized cost Unrealized gains Unrealized losses ) ) ) ) Fair value December 31, 2011 Adjustable Rate Fixed Rate Total Agency Securities (dollars in thousands) Principal Amount Net unamortized premium Amortized cost Unrealized gains Unrealized losses ) ) ) Fair value September 30, 2012 December 31, 2011 (dollars in thousands) Weighted Average Life of all Agency Securities Fair Value Amortized Cost Fair Value Amortized Cost Less than one year Greater than one year and less than five years Greater than or equal to five years Total Agency Securities 2012. Unrealized Loss Position For: (dollars in thousands) Less than 12 months 12 Months or More Total As of Fair Value Unrealized Losses Fair Value Unrealized Losses Fair Value Unrealized Losses September 30, 2012 ) ) ) December 31, 2011 ) ) ) 2012. Quoted Prices in Active Markets for Identical Assets (Level 1) Significant Observable Inputs (Level 2) Significant Unobservable Inputs (Level 3) Balance at September 30, 2012 Assets at Fair Value: Agency Securities, available for sale Derivatives, at fair value Liabilities at Fair Value: Derivatives, at fair value 2012. Quoted Prices in Active Markets for Identical Assets (Level 1) Significant Observable Inputs (Level 2) Significant Unobservable Inputs (Level 3) Balance at December 31, 2011 Assets at Fair Value: Agency Securities, available for sale Liabilities at Fair Value: Derivatives, at fair value At September 30, 2012 Fair Value Measurements using: Carrying Value Fair Value Quoted Prices in Active Markets for Identical Assets (Level 1) Significant Observable Inputs (Level 2) Significant Unobservable Inputs (Level 3) (dollars in thousands) Financial Assets: Cash Restricted Cash Receivable for unsettled securities Principal payments receivable Accrued interest receivable Financial Liabilities: Repurchase agreements Payable for unsettled securities Accrued interest payable At December 31, 2011 Fair Value Measurements using: Carrying Value Fair Value Quoted Prices in Active Markets for Identical Assets (Level 1) Significant Observable Inputs (Level 2) Significant Unobservable Inputs (Level 3) (dollars in thousands) Financial Assets: Cash Restricted Cash Receivable for unsettled securities Principal payments receivable Accrued interest receivable Financial Liabilities: Repurchase agreements Payable for unsettled securities Accrued interest payable September 30, 2012 December 31, 2011 (dollars in thousands) Within 30 days 31 days to 60 days 61 days to 90 days Greater than 90 days Total 2012. September 30, 2012 December 31, 2011 (dollars in thousands) Number of MRA's Number of counterparties with repurchase agreements outstanding Weighted average maturity in days Weighted average contractual rate % % Haircut for repurchase agreements(1) % % 2012. The following September 30, 2012 December 31, 2011 (dollars in thousands) Notional Amount Net Fair Value (1) Notional Amount Net Fair Value (1) Interest rate swap contracts ) ) Interest rate swaptions Futures Contracts ) ) Totals ) ) (1) Loss Recognized in Income (dollars in thousands) For the Quarters Ended For the Nine Months Ended Derivatives Location on condensed consolidated statements of operations September 30, 2012 September 30, 2011 September 30, 2012 September 30, 2011 Interest rate swap contracts: Interest income Realized loss on derivatives Interest expense Realized loss on derivatives ) ) ) ) Realized (loss) Realized loss on derivatives ) Changes in fair value Unrealized loss on derivatives ) ) ) ) ) ) ) ) Interest rate swaptions: Changes in fair value Unrealized loss on derivatives ) ) ) ) Futures Contracts: Realized (loss) Realized loss on derivatives ) ) ) ) Changes in fair value Unrealized loss on derivatives ) ) ) ) ) ) Totals ) ) ) ) September 30, 2012 September 30, 2011 Number of Awards Weighted Average Grant Date Fair Value per Award Number of Awards Weighted Average Grant Date Fair Value per Award Unvested Awards Outstanding beginning of period Granted Vested ) ) Unvested Awards Outstanding end of period The following tables present our common stock dividend transactions for the Record Date Payment Date Rate per common share Aggregate amount paid to holders of record (in millions) January 15, 2012(1) January 30, 2012 February 15, 2012 February 28, 2012 March 15, 2012 March 29, 2012 April 16, 2012 April 27, 2012 May 15, 2012 May 30, 2012 June 15, 2012 June 28, 2012 July 16, 2012 July 30, 2012 August 15, 2012 August 30, 2012 September 14, 2012 September 27, 2012 Record Date Payment Date Rate per common share Aggregate amount paid to holders of record (in millions) January 15, 2011(1) January 28, 2011 February 15, 2011 February 25, 2011 March 15, 2011 March 30, 2011 April 15, 2011 April 28, 2011 May 15, 2011 May 27, 2011 June 15, 2011 June 29, 2011 July 15, 2011 July 28, 2011 August 15, 2011 August 30, 2011 September 15, 2011 September 29, 2011 Record Date Payment Date Rate per Series A Preferred share Aggregate amount paid to holders of record (in millions) July 13, 2012(1) July 27, 2012 August 15, 2012 August 27, 2012 September 14, 2012 September 27, 2012 Transaction Type Completion Date Number of Shares Per Share price Net Proceeds (in millions) Follow-on public offering January 13, 2012 Follow-on public offering February 8, 2012 Equity distribution agreement February 29, 2012 Follow-on public offering March 14, 2012 Issuance of Series A Preferred Stock June 7, 2012 Follow-on public offering July 13, 2012 Follow-on public offering August 8, 2012 Common equity distributionagreements January 1, 2012 to September 30, 2012 Preferred equity distributionagreements January 1, 2012 to September 30, 2012 Dividend Reinvestment andStock Purchase Plan January 1, 2012 to September 30, 2012 Transaction Type Completion Date Number of Shares Per Share price Net Proceeds (in millions) Follow-on public offering January 26, 2011 Follow-on public offering February 8, 2011 Equity distribution agreement February 28, 2011 to September 30, 2011 Follow-on public offering April 13, 2011 Follow-on public offering June 6, 2011 Dividend Reinvestment andStock Purchase Plan April 7, 2011 to September 30, 2011 For the Quarters Ended For the Nine Months Ended September 30, 2012 September 30, 2011 September 30, 2012 September 30, 2011 Net Income (Loss) ) ) Less: Preferred dividends ) ) Net Income (Loss) available (related) to common stockholders ) ) Weighted average common shares outstanding - basic Add: Effect of dilutive non-vested restricted stock awards, assumed vested Weighted average common shares outstanding - diluted March 31, 2012. March 31, 2012. each month of the quarter. In addition, we paid dividends of $0.25 per outstanding share of Series B Preferred stock for the month of March, resulting in total payments to stockholders of $82.3 million. Our estimated REIT taxable income available to pay dividends was $86.0 million for the quarter ended March 31, 2013. At March 31, 2013, our under distributed estimated REIT taxable income was $3.7 million. 2012. Advising us with respect to, arrange for and manage the acquisition, financing, management and disposition of, elements of our investment portfolio, Evaluating the duration risk and prepayment risk within the investment portfolio and arranging borrowing and hedging strategies, Coordinating capital raising activities, Advising us on the formulation and implementation of operating strategies and policies, arranging for the acquisition of assets, monitoring the performance of those assets and providing administrative and managerial services in connection with our day-to-day operations and Providing executive and administrative personnel, office space and other appropriate services required in rendering management services to us. For the quarter ended March 31, 2013 we reimbursed ARRM $0.4 million for expenses incurred on our behalf. For the quarter ended March 31, 2012 we did not reimburse ARRM for any expenses. 2013. our degree of leverage; our access to funding and borrowing capacity; our use of derivatives to hedge interest rate risk; the REIT requirements; and the requirements to qualify for an exemption under the 1940 Act and other regulatory and accounting policies related to our business. For the quarter ended March 31, 2013, we reimbursed ARRM $0.4 million for expenses incurred on our behalf. For the quarter ended March 31, 2012, we did not reimburse ARRM for any expenses. ARRM is entitled to receive a monthly management fee regardless of the performance of our portfolio. Accordingly, the payment of our monthly management fee may not decline in the event of a decline in our earnings and may cause us to incur losses. In the short term, Requiring regulation and oversight of large, systemically important financial institutions by establishing an interagency council on systemic risk and implementation of heightened prudential standards and regulation by the Board of Governors of the Applying the same leverage and risk-based capital requirements that apply to insured depository institutions to most bank holding companies, savings and loan holding companies and systemically important nonbank financial companies; Limiting the Creating regimes for regulation of over-the-counter derivatives and non-admitted property and casualty insurers and reinsurers; Implementing regulation of hedge fund and private equity advisers by requiring such advisers to register with the SEC; Providing for the implementation of corporate governance provisions for all public companies concerning proxy access and executive compensation; and Reforming regulation of credit rating agencies. On September 28, 2012 the United Kingdom Financial Services Authority (“FSA”) released the results of its review of the process for setting the London Interbank Offered Rate (“LIBOR”) interest rate for various currencies and maturities (“Wheatley Review”). Some of our derivative positions use various maturities of U.S. dollar LIBOR. Our borrowings in the repurchase market have also historically tracked these LIBOR rates. The Wheatley Review found, among other things, that potential conflicts of interests coupled with insufficient oversight and accountability resulted in some reported LIBOR rates that did not reflect the true cost of inter-bank borrowings they were meant to represent. New statutory authority for the FSA to supervise and regulate the LIBOR setting process. Establishing a new independent oversight body to administer the LIBOR setting process. Eliminating LIBOR rates for certain currencies and maturities where markets are not sufficiently deep and liquid. Ceasing immediate reporting of rates submitted by individual participating banks. Establishing controls to ensure that submitted rates represent actual transactions. Quarter ended 30-Day LIBOR Effective Federal Funds Rate September 30, 2012 % % June 30, 2012 March 31, 2012 December 31, 2011 September 30, 2011 at March 31, 2013 and March 31, 2012. Quarter Ended Asset Yield Cost of Funds Net Interest Margin Interest Expense on Repurchase Agreements September 30, 2012 % % % % June 30, 2012 March 31, 2012 December 31, 2011 September 30, 2011 March 31, 2012. March 31, 2013. REIT status. For the quarter ended March 31, 2013, we paid dividends of $0.08 per outstanding share of common stock and Quarter ended Principal Amount Net Unamortized Premium Amortized Cost Amortized Cost divided by Principal Fair Value Fair Value divided by Principal September 30, 2012 % % June 30, 2012 March 31, 2012 December 31, 2011 September 30, 2011 Quarter ended Principal Amount Weighted Average Coupon Weighted Average Months to Reset Percentage of Total Agency Securities September 30, 2012 % % June 30, 2012 March 31, 2012 December 31, 2011 September 30, 2011 Quarter ended Principal Amount Weighted Average Coupon Weighted Average Months to Maturity Percentage of Total Agency Securities September 30, 2012 % % June 30, 2012 March 31, 2012 December 31, 2011 September 30, 2011 Quarter ended % March 31, 2012 available derivatives may not correspond directly with the interest rate risk for which protection is sought; the duration of the derivatives may not match the duration of the related liability; the party owing money on the derivatives may default on its obligation to pay; the credit-quality of the party owing money on the derivatives may be downgraded to such an extent that it impairs our ability to sell or assign our side of the hedging transaction; and the value of derivatives may be adjusted from time to time in accordance with GAAP to reflect changes in fair value; downward adjustments, or “mark-to-market losses,” would reduce our net income or increase any net loss. future. cash collateral held as of March 31, 2013. September 30, 2012 December 31, 2011 (dollars in thousands) Within 30 days 31 days to 60 days 61 days to 90 days Greater than 90 days Total September 30, 2012 December 31, 2011 (dollars in thousands) Number of MRAs Number of counterparties with repurchase agreements outstanding Weighted average maturity in days Weighted average contractual rate % % Haircut for repurchase agreements % % 2012. increased volatility of many financial assets, including Agency Securities and other high-quality RMBS assets; increased volatility and deterioration in the broader residential mortgage and RMBS markets; and significant disruption in financing of RMBS. Record Date Payment Date Rate per common share Aggregate amount paid to holders of record (in millions) January 15, 2012(1) January 30, 2012 February 15, 2012 February 28, 2012 March 15, 2012 March 29, 2012 April 16, 2012 April 27, 2012 May 15, 2012 May 30, 2012 June 15, 2012 June 28, 2012 July 16, 2012 July 30, 2012 August 15, 2012 August 30, 2012 September 14, 2012 September 27, 2012 Record Date Payment Date Rate per common share Aggregate amount paid to holders of record (in millions) January 15, 2011(1) January 28, 2011 February 15, 2011 February 25, 2011 March 15, 2011 March 30, 2011 April 15, 2011 April 28, 2011 May 15, 2011 May 27, 2011 June 15, 2011 June 29, 2011 July 15, 2011 July 28, 2011 August 15, 2011 August 30, 2011 September 15, 2011 September 29, 2011 The following table presents our Series A Preferred Stock dividend transactions for the Record Date Payment Date Rate per Series A Preferred share Aggregate amount paid to holders of record (in millions) July 13, 2012(1) July 27, 2012 August 15, 2012 August 27, 2012 September 14, 2012 September 27, 2012 March 31, 2013. Transaction Type Completion Date Number of Shares Per Share price Net Proceeds (in millions) Follow-on public offering January 13, 2012 Follow-on public offering February 8, 2012 Equity distribution agreement February 29, 2012 Follow-on public offering March 14, 2012 Issuance of Series APreferred Stock June 7, 2012 Follow-on public offering July 13, 2012 Follow-on public offering August 8, 2012 Common equity distributionagreements January 1, 2012 to September 30, 2012 Preferred equity distributionagreements January 1, 2012 to September 30, 2012 Dividend Reinvestment andStock Purchase Plan January 1, 2012 to September 30, 2012 Transaction Type Completion Date Number of Shares Per Share price Net Proceeds (in millions) Follow-on public offering January 26, 2011 Follow-on public offering February 8, 2011 Equity distribution agreement February 28, 2011 to September 30, 2011 Follow-on public offering April 13, 2011 Follow-on public offering June 6, 2011 Dividend Reinvestment andStock Purchase Plan April 7, 2011 to September 30, 2011 match the pricing dates of both derivative transactions and repurchase agreements. Operational issues and credit market volatility make such matching impractical for us. Since we have not elected cash flow hedge accounting treatment, our operating results may suffer because losses on the derivative instruments may not be offset by a changes in the fair value or cash flows of the related hedged transaction. Consequently, any declines in the hedged interest rates would result in a charge to earnings. We will continue to designate derivative transactions as hedges for tax purposes and any unrealized gains or losses should not affect our distributable net taxable income. Change in Interest Rates Percentage Change in Projected Net Interest Income Percentage Change in Projected Portfolio Value Including Derivatives 1.00 % 9.01 % (0.46) % 0.50 12.81 (0.41) (0.50) (3.97) (1.38) (1.00) (24.79) (2.10) March 31, 2013 Change in Interest Rates Percentage Change in Projected Net Interest Income Percentage Change in Projected Portfolio Value Including Derivatives 1.00 % (9.79) % 0.08 % 0.50 1.35 0.19 (0.50) 8.91 (0.41) (1.00) (7.53) (0.94) 2012 Date: /s/ James R. Mountain James R. Mountain Chief Financial Officer, Duly Authorized Officer and Principal Financial and Accounting Officer Description Certification of Chief Executive Officer Pursuant to SEC Rule 13a-14(a)/15d-14(a) 31.2 Certification of Chief Executive Officer Pursuant to SEC Rule 13a-14(a)/15d-14(a) 31.3 Certification of Chief Financial Officer Pursuant to SEC Rule 13a14(a)/15d-14(a) 32.1 Certification of Chief Executive Officer Pursuant to 18 U.S.C. §1350 32.2 Certification of Chief Executive Officer Pursuant to 18 U.S.C. §1350 32.3 Certification of Chief Financial Officer Pursuant to 18 U.S.C. §1350 101.INS# XBRL Instance Document 101.SCH# XBRL Taxonomy Extension Schema Document 101.CAL# XBRL Taxonomy Extension Calculation Linkbase Document 101.DEF# XBRL Taxonomy Extension Definition Linkbase Document 101.LAB# XBRL Taxonomy Extension Label Linkbase Document 101.PRE# XBRL Taxonomy Extension Presentation Linkbase Document (1) Incorporated by reference to Exhibit 3.1 to Filed herewith Furnished herewith # Pursuant to Rule 406T of Regulation S-T, these interactive data files are deemed not filed or part of a registration statement or prospectus for purposes of Sections 11 or 12 of the Securities Act of 1933, are deemed not filed for purposes of Section 18 of the Securities Exchange Act of 1934 and otherwise are not subject to liability under those sections.-– Organization and Nature of Business OperationsBusiness“we”, “us”, “our”,“we,” “us,” “our,” "ARMOUR" or the “Company” are to ARMOUR Residential REIT, Inc. References to "ARRM" are to ARMOUR Residential Management LLC, a Delaware limited liability company. References to “Enterprise” are to Enterprise Acquisition Corp., which is a wholly-owned subsidiary of ARMOUR. “Related“Related Party Transactions”for additional discussion). We invest primarily in fixed rate, hybrid adjustable rate and adjustable rate residential mortgage backed securities. These securities are issued or guaranteed by a U.S. Government-sponsored entity (“GSE”), such as the Federal National Mortgage Association (Fannie Mae), the Federal Home Loan Mortgage Corporation (Freddie Mac) or guaranteed by the Government National Mortgage Administration (Ginnie Mae) (collectively, "Agency Securities"). As of September 30, 2012,March 31, 2013, Agency Securities account for 100% of our portfolio. It is expected that the percentage will continue to be 100% or close thereto. Our portfolio consists primarily of securities backed by fixed rate, hybrid adjustable rate, and adjustable rate home loans. From time to time, a portion of our portfolio may be invested in unsecured notes and bonds issued by U.S. Government-charteredGovernment-sponsored entities (collectively, “Agency Debt”), U.S. Treasuries and money market instruments, subject to certain income tests we must satisfy for our qualification as a real estate investment trust (“REIT”). On December 1, 2011, our stockholders approved an amendment to our charter to alter our investment asset class restriction in response to potential changes in Agency Securities to include non-AgencyNon-Agency as well as Agency Securities in our investment asset class restriction. While we remain committed to investing in Agency Securities for so long as an adequate supply and pricing exists, we believe it is prudent for us to have the flexibility to invest in non-AgencyNon-Agency Securities and respond to changes in GSE policy.-– Summary of Significant Accounting PoliciesRestricted posted for Agency Securities, interest rate swap contracts, interest rate swaptions and Eurodollar Futures Contracts (“Futures Contracts”) which are included in restricted cash collateral on the accompanying condensed consolidated balance sheets as of September 30, 2012March 31, 2013 and December 31, 2011. $ (14,426 $ - 247,278 141,326 4,937 5,873 $ 237,789 $ 147,199 (1) See Note 6, “Fair Value of Financial Instruments” for additional discussion. (in thousands) Interest rate swap contracts $ 227,008 $ 261,364 Interest rate swaptions (10,155 ) - Futures Contracts 3,443 4,188 Totals $ 220,296 $ 265,552 (1) September 30,March 31, 2013 and December 31, 2012, all of our financial instrument investments consist of Agency Securities and hedging and other derivative instruments related to the foregoing investments.long-term periods.long periods of time. We may, from time to time, sell any of our Agency Securities as part of the overall management of our portfolio. Management determines the appropriate classifications of the securities at the time they are acquired and evaluates the appropriateness of such classifications at each balance sheet date. As of September 30,March 31, 2013 and December 31, 2012, all of our Agency Securities were classified as available for sale. Agency securitiesSecurities classified as available for sale are reported at their estimated fair values, based on fair values obtained from third-party sources, with unrealized gains and losses excluded from earnings and reported as part of the separate condensed consolidated statements of comprehensive income. Agency securities transactions are recorded on the trade date and are valued using third-party pricing services and dealer quotes.nine months ended September 30, 2012 and September 30, 2011.derivative instrumentsderivatives as either assets or liabilities at fair value on our condensed consolidated balance sheets. We do not designate our derivative activitiesderivatives as cash flow hedges, which, among other factors, would require us to match the pricing dates of both derivative transactionsderivatives and repurchase agreements. Operational issues and credit market volatility make such matching impractical for us. Since we have not elected cash flow hedge accounting treatment as allowed by GAAP, all changes in the fair values of our derivatives are reflected in our condensed consolidated statements of operations currently.operations. Accordingly, our operating results may reflect greater volatility than otherwise would be the case, because gains or losses on derivatives may not be offset by changes in the fair value or cash flows of the transaction within the same accounting period or ever. Consequently, any declines in the fair value of our derivatives result in a charge to earnings. We will continue to designate derivative activitiesderivatives as hedges for tax purposes and any unrealized derivative gains or losses would not affect our distributable net taxable income.Securities by only purchasing securities issued by Freddie Mac, Fannie Mae or Ginnie Mae.Securities. The payment of principal and interest on the Freddie Mac and Fannie Mae Agency Securities are guaranteed by those respective agencies and the payment of principal and interest on the Ginnie Mae Agency Securities are backed by the full faith and credit of the U.S. Government.While it is hoped that the conservatorship will help stabilize Freddie Mac's and Fannie Mae's losses and overall financial position, there can be no assurance that it will succeed or that, if necessary, Freddie Mac or Fannie Mae will be able to satisfy their guarantees of Agency Securities. On August 5, 2011, Standard & Poor'sPoor’s Corporation downgraded the U.S.'s Government’s credit rating from AAA to AA+ and on August 8, 2011, Fannie Mae and Freddie Mac'sMac’s credit ratings were downgraded from AAA to AA+. Because Fannie Mae and Freddie Mac areremain in conservatorship of the U.S. Government,Government. There can be no assurances how or when the U.S.'s credit rating downgrade and Government will end these conservatorships or how the future profitability of Fannie Mae and Freddie Mac'sMac and any future credit rating downgrades willactions may impact the credit risk associated with Agency Securities and, therefore, may decrease the value of the Agency Securities in our portfolio.September 30, 2012,March 31, 2013, we were authorized to issue up to 25,000,00050,000,000 shares of preferred stock, par value $0.001 per share with such designations, voting and other rights and preferences as may be determined from time to time by our Board of Directors (“Board”) or a committee thereof.25,000,00050,000,000 authorized preferred stock as 8.250% Series A Cumulative Preferred Shares (“Series A Preferred Stock”)Stock with the powers, designations, preferences and other rights as set forth therein. On July 13, 2012, we entered into an At Market Issuance Sales Agreement with MLV & Co. LLC, as our agent, to offer and sell, from time to time, up to 6,000,000 shares of Series A Preferred Stock. On July 27, 2012, we entered into an Equity Distribution Agreement with Citadel Securities LLC, as our agent, to offer and sell, from time to time, up to 2,000,000 shares of Series A Preferred Stock. At September 30, 2012March 31, 2013, there were 9,610,000 shares designated as Series A Preferred Stock.September 30, 2012,March 31, 2013, we had issued and outstanding 1,785,0002,180,572 shares of Series A Preferred Stock, with a par value of $0.001 per share and a liquidation preference of $25.00 per share plus accrued and unpaid dividends. The Series A Preferred Stock is entitled to a dividend at a rate of 8.250% per year based on the $25.00 liquidation preference before the common stock is entitled to receive any dividends. The Series A Preferred Stock is redeemable at $25.00 per share plus accrued and unpaid dividends exclusively at our option commencing on June 7, 2017 (subject to our right under limited circumstances to redeem the Series A Preferred Stock earlier in order to preserve our qualification as a REIT). The Series A Preferred Stock is senior to our common stock and therefore in the event of liquidation, dissolution or winding up, the Series A Preferred Stock will receive a liquidation preference of $25.00 per share plus accumulated and unpaid dividends before distributions are paid to holders of our common stock, with no right or claim to any of our remaining assets thereafter. The Series A Preferred Stock generally does not have voting rights except if we fail to pay dividends on the Series A Preferred Stock for eighteen months, whether or not consecutive. Under such circumstances, the Series A Preferred Stock will be entitled to vote to elect two additional directors to the Board, until all unpaid dividends have been paid or declared and set aside for payment. The Series A Preferred Stock has no stated maturity, is not subject to any sinking fund or mandatory redemption and will remain outstanding indefinitely unless repurchased or redeemed by us or converted into our common stock in connection with a change of control by the holders of Series A Preferred Stock.September 30, 2012,March 31, 2013, we were authorized to issue up to 500,000,0001,000,000,000 shares of common stock, par value $0.001 per share, with such designations, voting and other rights and preferences as may be determined from time to time by our Board. We had 308,972,403374,053,198 shares of common stock issued and outstanding at September 30, 2012.March 31, 2013. At September 30, 2012,March 31, 2013, we had outstanding warrants to purchase 32,500,000 shares of common stock, which are exercisable at $11.00 per share and expire in November 2013.changechanges in equity during a period from transactions and other events and circumstances from non-owner sources. It includes all changes in equity during a period except those resulting from investments by owners and distributions to owners.Income TaxesWe intend to qualify and have elected to be taxed as a REIT under the Code. We will generally not be subject to federal income tax to the extent that we distribute our taxable income to our stockholders and as long as we satisfy the ongoing REIT requirements under the Code including meeting certain asset, income and stock ownership tests.Our management is responsible for determining whether a tax position taken by us is more likely than not to be sustained on its merits. We have no material unrecognized tax benefits and have not recognized in the accompanying condensed consolidated financial statements any interest or penalties related to income taxes. Should any such interest and penalties be recognized, they will be included in interest expense and other expenses, respectively. None of our income tax returns have been examined by federal, state or local authorities; therefore our 2009, 2010 and 2011 federal and state tax returns remain open for examination.-– Recent Accounting PronouncementsAccounting Standards Adopted This update to ASU 2011-11 addressed implementation issues and applied to derivatives accounted for in 2012We adopted recent amendments to authoritative guidance issued by the Financial Accounting Standards Board (“FASB”) in April 2011 related to the accounting foraccordance with Topic 815, Derivatives and Hedging, including bifurcated embedded derivatives, repurchase agreements and other agreements that entitle and obligate a transferor to repurchase or redeem financial assets before their maturity. We maintain effective control of our assets financed byreverse repurchase agreements, therefore, this update had no effectand securities borrowing and securities lending transactions that are either offset in accordance with ASC 210-20-45 or ASC 815-10-45 or subject to an enforceable master netting arrangement or similar agreement. The guidance was effective January 1, 2013 and was applied retrospectively. This guidance did not affect the presentation of Derivatives, at fair value on our condensed consolidated financial statements.We adopted recent amendments to authoritative guidance issued by FASB in May 2011 to establish common fair value measurement and disclosure requirements in GAAP and International Financial Reporting Standards. We generally do not hold Level 3 assetsbalance sheets and therefore, thisdid not affect our financial statements.had no significant effect on our condensed consolidated financial statements.We adopted recent amendments to authoritative guidance issued by FASB in June and December 2011 providing forASU 2011-12 addressed improving the option to present the totalreporting of comprehensive income, the componentsreclassifications out of net income, and the components ofaccumulated other comprehensive income eitherby requiring reporting of the effect of significant reclassifications out of accumulated net income if the amount being reclassified is required under GAAP to be classified in a single continuous statement ofits entirety to net income. For amounts not required to be reclassified in their entirety to net income in the same reporting period, an entity is required to cross-reference other disclosures required under GAAP that provide additional detail about these amounts. The update did not change the current requirements for reporting net income or other comprehensive income or in two separate but consecutive statements. This updateand resulted in additional disclosure but had no significant effect on our condensed consolidated financial statements.Accounting Standards to be Adopted in Future PeriodsIn December 2011, the FASB issued amendments to authoritative The guidance requiring entities that have financial instruments and derivative instruments to disclose information about offsetting and related arrangements. The disclosures required under this amended guidance are intended to enable users of an entity's financial statements to evaluate the effect or potential effect of netting arrangements on an entity's financial position, including the effect or potential effect of rights of offset associated with certain financial instruments and derivative instruments. The provisions of these amendments arewas effective for annualreporting periods beginning after January 1, 2013. We anticipate the adoption of these amendments may change the presentation of our financial statementsDecember 15, 2012 and related disclosures.ARMOUR Residential REIT, Inc. and SubsidiaryNOTES TO CONDENSED CONSOLIDATED FINANCIAL STATEMENTS(Unaudited)-– Agency Securities, Available for Salevalue.value and reported as part of the condensed consolidated statements of comprehensive income. As of September 30, 2012March 31, 2013 and December 31, 2011,2012, investments in Agency Securities accounted for 100% of our portfolio.September 30, 2012,March 31, 2013, we had the following securities in an unrealized gain or loss position as presented below. The components of the carrying value of our Agency Securities as of September 30, 2012March 31, 2013 are also presented below. $ 14,408,545 $ 5,899,771 $ 318,873 $ 20,627,189 755,692 314,606 14,738 1,085,036 15,164,237 6,214,377 333,611 21,712,225 274,057 122,875 6,985 403,917 (1,057 (210 - (1,267 $ 15,437,237 $ 6,337,042 $ 340,596 $ 22,114,875 $ 2,234,747 $ 18,392,442 $ 20,627,189 92,613 992,423 1,085,036 2,327,360 19,384,865 21,712,225 46,143 357,774 403,917 (9 (1,258 (1,267 $ 2,373,494 $ 19,741,381 $ 22,114,875 March 31, 2013 Fannie Mae Freddie Mac Ginnie Mae (in thousands) Principal Amount $ 16,460,012 $ 6,471,944 $ 265,852 $ 23,197,808 Net unamortized premium 794,430 302,778 12,158 1,109,366 Amortized cost 17,254,442 6,774,722 278,010 24,307,174 Unrealized gains 79,035 31,278 5,894 116,207 Unrealized losses (65,242 ) (18,962 ) (8 ) (84,212 ) Fair value $ 17,268,235 $ 6,787,038 $ 283,896 $ 24,339,169 March 31, 2013 (in thousands) Principal Amount $ 1,812,295 $ 21,385,513 $ 23,197,808 Net unamortized premium 75,239 1,034,127 1,109,366 Amortized cost 1,887,534 22,419,640 24,307,174 Unrealized gains 34,425 81,782 116,207 Unrealized losses (112 ) (84,100 ) (84,212 ) Fair value $ 1,921,847 $ 22,417,322 $ 24,339,169 2011,2012, we had the following securities in an unrealized gain or loss position as presented below. The components of the carrying value of our Agency Securities as of December 31, 20112012 are also presented below. $ 3,451,906 $ 1,283,848 $ 392,476 $ 5,128,230 144,337 54,059 18,301 216,697 3,596,243 1,337,907 410,777 5,344,927 33,558 13,657 5,439 52,654 (3,269 (613 (24 (3,906 $ 3,626,532 $ 1,350,951 $ 416,192 $ 5,393,675 December 31, 2012 Fannie Mae Freddie Mac Ginnie Mae (in thousands) Principal Amount $ 12,328,493 $ 5,305,071 $ 292,434 $ 17,925,998 Net unamortized premium 641,833 284,739 13,428 940,000 Amortized cost 12,970,326 5,589,810 305,862 18,865,998 Unrealized gains 169,227 66,904 6,466 242,597 Unrealized losses (9,815 ) (2,170 ) (48 ) (12,033 ) Fair value $ 13,129,738 $ 5,654,544 $ 312,280 $ 19,096,562 ARMOUR Residential REIT, Inc. and SubsidiaryNOTES TO CONDENSED CONSOLIDATED FINANCIAL STATEMENTS(Unaudited) $ 2,681,911 $ 2,446,319 $ 5,128,230 107,641 109,056 216,697 2,789,552 2,555,375 5,344,927 26,157 26,497 52,654 (2,534 (1,372 (3,906 $ 2,813,175 $ 2,580,500 $ 5,393,675 December 31, 2012 (in thousands) Principal Amount $ 2,037,778 $ 15,888,220 $ 17,925,998 Net unamortized premium 84,255 855,745 940,000 Amortized cost 2,122,033 16,743,965 18,865,998 Unrealized gains 36,758 205,839 242,597 Unrealized losses (222 ) (11,811 ) (12,033 ) Fair value $ 2,158,569 $ 16,937,993 $ 19,096,562 September 30, 2012March 31, 2013 and December 31, 2011. $ 11,083 $ 10,777 $ 179 $ 179 22,096,782 21,694,580 5,274,072 5,226,255 7,010 6,868 119,424 118,493 $ 22,114,875 $ 21,712,225 $ 5,393,675 $ 5,344,927 March 31, 2013 December 31, 2012 (in thousands) Weighted Average Life of all Agency Securities Fair Value Fair Value Less than one year $ 10 $ 10 $ 2,647 $ 2,593 Greater than one year and less than three years 2,603,053 2,554,020 8,618,862 8,476,157 Greater than three years and less than five years 10,926,786 10,882,077 9,681,538 9,592,001 Greater than or equal to five years 10,809,320 10,871,067 793,515 795,247 Total Agency Securities $ 24,339,169 $ 24,307,174 $ 19,096,562 $ 18,865,998 theour Agency Securities as of September 30, 2012March 31, 2013 and December 31, 20112012 in the table above are based upon market factors, assumptions, models and estimates from the third-party model and also incorporate management'smanagement’s judgment and experience. The actual weighted average lives of the Agency Securities could be longer or shorter than estimated.September 30, 2012March 31, 2013 and December 31, 2011. $ 666,322 $ (1,257 $ 1,164 $ (10 $ 667,486 $ (1,267 1,173,098 (3,560 96,684 (346 1,269,782 (3,906 Less than 12 months 12 Months or More Total As of Fair Value Fair Value Fair Value March 31, 2013 $ 13,004,337 $ (84,210 ) $ 65 $ (2 ) $ 13,044,402 $ (84,212 ) December 31, 2012 1,521,052 (12,030 ) 836 (3 ) 1,521,888 (12,033 ) quarterquarters ended March 31, 2013 and nine months ended September 30,March 31, 2012, we sold $1.6$2.3 billion and $1.9$0.2 billion of Agency Securities resulting in a realized gain of $15.1$18.5 million and $20.1$6.3 million, respectively. Of the $20.1 million $1.1 million is a loss due to the bankruptcy of a counterparty to a repurchase agreement. In addition, due to the bankruptcy we also recorded $1.0 million of other income resulting from the non-performance of the counterparty on the related repurchase agreement. During the quarter and nine months ended September 30, 2011 we sold $0.5 billion of Agency Securities resulting in a realized gain of $6.4 million.ARMOUR Residential REIT, Inc. and SubsidiaryNOTES TO CONDENSED CONSOLIDATED FINANCIAL STATEMENTS(Unaudited)-– Fair Value of Financial Instrumentsmanagement'smanagement’s market assumptions. The ASCAccounting Standards Codification Topic No. 820“Fair Value Measurement” classifies these inputs into the following hierarchy:restricted cash -Cashequivalents includes cash on deposit with financial institutions and investments in high quality overnight money market funds, all of which have maturities of three months or less, at the time of purchase. The carrying amount of cash is deemed to be its fair value. Restricted cash includes cash held by counterparties as collateral. Our cash balances are classified as Level 1 and our restricted cash1. Cash balances posted or held by counterparties as collateral are classified as Level 2.September 30, 2012March 31, 2013 and December 31, 2011,2012, all of our Agency Security values were based solely on third-party sources and therefore were classified as Level 2.1.2. - The fair values of our – Our Futures Contracts are based on closing pricestraded on the Chicago Mercantile Exchange (“CME”). and are classified as Level 1. The fair values of our interest rate swap contracts and interest rate swaptions are valued using third-party pricing services that incorporates common market pricing methods that may include current interest rate curves, forward interest rate curves and market spreads to interest rate curves. Management compares pricing used to dealer quotes to ensure that the current market conditions are properly represented. Our Futures Contracts are classified as Level 1 and theThe fair values of our interest rate swap contracts and our interest rate swaptions are classified as Level 2.ARMOUR Residential REIT, Inc. and SubsidiaryNOTES TO CONDENSED CONSOLIDATED FINANCIAL STATEMENTS(Unaudited)September 30, 2012March 31, 2013 and December 31, 2011. (dollars in thousands) $ - $ 22,114,875 $ - $ 22,114,875 $ - $ 8,069 $ - $ 8,069 $ 4,656 $ 193,742 $ - $ 198,398 (dollars in thousands) $ - $ 5,393,675 $ - $ 5,393,675 $ 5,292 $ 116,435 $ - $ 121,727 (in thousands) Assets at Fair Value: Agency Securities, available for sale $ - $ 24,339,169 $ - $ 24,339,169 Derivatives $ - $ 38,923 $ - $ 38,923 Liabilities at Fair Value: Derivatives $ 3,262 $ 188,252 $ - $ 191,514 (in thousands) Assets at Fair Value: Agency Securities, available for sale $ - $ 19,096,562 $ - $ 19,096,562 Derivatives $ - $ 5,367 $ - $ 5,367 Liabilities at Fair Value: Derivatives $ 3,919 $ 186,621 $ - $ 190,540 September 30, 2012March 31, 2013 and December 31, 2011. $ 727,306 $ 727,306 $ 727,306 $ - $ - 237,789 237,789 - 237,789 - 357,218 357,218 - 357,218 - 10,799 10,799 - 10,799 - 60,548 60,548 - 60,548 - $ 19,826,988 $ 19,826,988 $ - $ 19,826,988 $ - 1,036,450 1,036,450 - 1,036,450 - 9,302 9,302 - 9,302 - At March 31, 2013 Fair Value Measurements using: Carrying Value (in thousands) Financial Assets: Cash $ 836,501 $ 836,501 $ 836,501 $ $ - Cash collateral posted 230,451 230,451 - 230,451 - Receivable for unsettled securities 2,226,168 2,226,168 - 2,226,168 - Principal payments receivable 9,381 9,381 - 9,381 - Accrued interest receivable 71,664 71,664 - 71,664 - Financial Liabilities: Repurchase agreements $ 24,828,614 $ 24,828,614 $ - $ 24,828,614 $ - Accrued interest payable 10,302 10,302 - 10,302 - Cash collateral held 10,155 10,155 - 10,155 - ARMOUR Residential REIT, Inc. and SubsidiaryNOTES TO CONDENSED CONSOLIDATED FINANCIAL STATEMENTS(Unaudited) $ 252,372 $ 252,372 $ 252,372 $ - $ - 147,199 147,199 - 147,199 - 382,931 382,931 - 382,931 - 12,493 12,493 - 12,493 - 18,637 18,637 - 18,637 - $ 5,335,962 $ 5,335,962 $ - $ 5,335,962 $ - 117,885 117,885 - 117,885 - 2,154 2,154 - 2,154 - At December 31, 2012 Fair Value Measurements using: Carrying Value (in thousands) Financial Assets: Cash and cash equivalents $ 771,282 $ 771,282 $ 771,282 $ - $ - Cash collateral posted 265,552 265,552 - 265,552 - Receivable for unsettled securities 668,244 668,244 - 668,244 - Principal payments receivable 16,037 16,037 - 16,037 - Accrued interest receivable 55,430 55,430 - 55,430 - Financial Liabilities: Repurchase agreements $ 18,366,095 $ 18,366,095 $ - $ 18,366,095 $ - Accrued interest payable 10,064 10,064 - 10,064 - -– Repurchase AgreementsSeptember 30, 2012March 31, 2013 and December 31, 2011. $ 9,925,408 $ 4,068,197 5,679,332 1,111,480 2,933,517 156,285 1,288,731 - $ 19,826,988 $ 5,335,962 (in thousands) Within 30 days $ 11,626,612 $ 7,771,444 31 days to 60 days 11,540,240 7,840,268 61 days to 90 days 562,762 2,699,706 Greater than 90 days 1,099,000 54,677 Total $ 24,828,614 $ 18,366,095 September 30, 2012March 31, 2013 and December 31, 2011. 32 29 26 23 39 18 0.43 0.37 4.8 5.0 Number of MRA’s 33 33 Number of counterparties with repurchase agreements outstanding 28 26 Weighted average maturity in days 36 34 Weighted average contractual rate 0.43 % 0.49 % 4.8 % 4.8 % -– Derivativesfinancing activitiesrepurchase agreements associated with our assets in such a way to help assure the realization of net interest margins. Such transactions are based on assumptions about prepayments which, if not realized, will cause transaction results to differ from expectations. Our derivative instrumentsderivatives are carried on our condensed consolidated balance sheets, as assets or as liabilities at their fair value. We do not designate our activitiesderivatives as cash flow hedges and as such, we recognize changes in the marketfair value of these transactionsderivatives through earnings. For the quarter and nine months ended September 30, 2012, we recognized unrealized losses of $31.5 million and $84.3 million, respectively related to our derivatives. For the quarter and nine months ended September 30, 2011, we recognized unrealized losses of $65.8 million and $91.9 million, respectively related to our derivatives.value,value; notional amount and remaining term of the swap.interest rate swap contracts. Certain interest rate swap contracts provide for cross collateralization and cross default with repurchase agreements and other contracts with the same counterparty.counterparty'scounterparty’s transactions would be immediately payable by us pursuant to the applicable agreement. ARMOUR Residential REIT, Inc. and SubsidiaryNOTES TO CONDENSED CONSOLIDATED FINANCIAL STATEMENTS(Unaudited)table presentstables present information about interest rate swap contracts, interest rate swaptions and Futures Contracts which are included in derivatives on the accompanying condensed consolidated balance sheets as of September 30, 2012March 31, 2013 and December 31, 2011. $ 8,690,000 $ (192,120 $ 2,765,000 $ (116,435 1,050,000 6,447 - - 121,000 (4,656 131,000 (5,292 $ 9,861,000 $ (190,329 $ 2,896,000 $ (121,727 Notional Amount (in thousands) Interest rate swap contracts $ 12,320,000 $ 17,503 $ (188,252 ) Interest rate swaptions 1,550,000 21,420 - Futures Contracts 99,000 - (3,262 ) Totals $ 13,969,000 $ 38,923 $ (191,514 ) Instruments”Instruments” for additional discussion. Notional Amount (in thousands) Interest rate swap contracts $ 8,670,000 $ 1,718 $ (186,621 ) Interest rate swaptions 1,050,000 3,649 - Futures Contracts 102,000 - (3,919 ) Totals $ 9,822,000 $ 5,367 $ (190,540 ) (1) Gross Amounts Not Offset in the Condensed Consolidated Balance Sheet Assets Gross Amounts of Assets Presented in the Condensed Consolidated Balance Sheet Financial Instruments Cash Collateral Held Net Amount (in thousands) Interest rate swap contracts $ 17,503 $ (17,503 ) $ - $ - Interest rate swaptions 21,420 - (10,155 ) 11,265 Totals $ 38,923 $ (17,503 ) $ (10,155 ) $ 11,265 Gross Amounts Not Offset in the Condensed Consolidated Balance Sheet Liabilities Gross Amounts of Liabilities Presented in the Condensed Consolidated Balance Sheet Financial Instruments Cash Collateral Posted Net Amount (in thousands) Interest rate swap contracts $ (188,252 ) $ 17,503 $ 227,008 $ 56,259 Futures Contracts (3,262 ) - 3,443 181 Totals $ (191,514 ) $ 17,503 $ 230,451 $ 56,440 Gross Amounts Not Offset in the Condensed Consolidated Balance Sheet Assets Gross Amounts of Assets Presented in the Condensed Consolidated Balance Sheet Financial Instruments Cash Collateral Held Net Amount (in thousands) Interest rate swap contracts $ 1,718 $ (1,718 ) $ - $ - Swaptions 3,649 - - 3,649 Totals $ 5,367 $ (1,718 ) $ - $ 3,649 Gross Amounts Not Offset in the Condensed Consolidated Balance Sheet Liabilities Gross Amounts of Liabilities Presented in the Condensed Consolidated Balance Sheet Financial Instruments Cash Collateral Posted Net Amount (in thousands) Interest rate swap contracts $ (186,621 ) $ 1,718 $ 261,364 $ 76,461 Futures Contracts (3,919 ) - 4,188 269 Totals $ (190,540 ) $ 1,718 $ 265,552 $ 76,730 total other lossOther (Loss) Income in the accompanying condensed consolidated statements of operations for the quarters ended March 31, 2013 and nine months ended September 30, 2012 and September 30, 2011. $ 2,562 $ 415 $ 5,421 $ 983 (20,832 (8,213 (44,779 (16,343 - (256 - (239 ) (25,153 (64,581 (66,831 (88,742 (43,423 (72,635 (106,189 (104,341 (6,593 - (18,070 - (6,593 - (18,070 - (644 (366 (1,697 (826 260 (1,228 636 (3,149 (384 (1,594 (1,061 (3,975 $ (50,400 $ (74,229 $ (125,320 $ (108,316 Derivatives Interest rate swap contracts: Interest income Realized loss on derivatives $ 4,099 $ 931 Interest expense Realized loss on derivatives (32,501 ) (10,191 ) Realized loss Realized loss on derivatives - - Changes in fair value Unrealized gain on derivatives 16,953 17,556 (11,449 ) 8,296 Interest rate swaptions: Changes in fair value Unrealized gain on derivatives (1,309 ) - (1,309 ) - Futures Contracts: Realized loss Realized loss on derivatives (651 ) (481 ) Changes in fair value Unrealized gain on derivatives 657 58 6 (423 ) Totals $ (12,752 ) $ 7,873 -– Share-Based Compensation officers and other employees of ours and other persons who provide services to us in the course of operations. The Plan authorizes the Board to grant awards including common stock, restricted shares of common stock (“RSUs”), stock options, performance shares, performance units, stock appreciation rights and other equity and cash-based awards (collectively “Awards”), subject to terms as provided in the Plan.nine monthsquarter ended September 30, 2012,March 31, 2013, we awarded a total of 655,5241,278,195 RSUs to members of our Board and employeesto ARRM for its employees. Of these awards, 150,208 shares vesting in 2017 were awarded subject to shareholder approval of ARRM.ARMOUR Residential REIT, Inc. and SubsidiaryNOTES TO CONDENSED CONSOLIDATED FINANCIAL STATEMENTS(Unaudited)nine monthsquarter ended September 30, 2012 and September 30, 2011March 31, 2013 are summarized below: 153,980 $ 7.91 - - 655,524 7.13 192,500 7.91 (138,730 7.29 (28,890 7.91 670,774 $ 7.28 163,610 $ 7.91 March 31, 2013 Unvested Awards Outstanding beginning of period 628,367 $ 7.28 Granted 1,278,195 6.78 Vested (106,315 ) 7.27 Unvested Awards Outstanding end of period 1,800,247 $ 6.94 September 30, 2012,March 31, 2013, there was approximately $5.3$12.5 million of unearned non-cash stock-based compensation related to the Awards (based on the September 30, 2012March 31, 2013 stock price)price of $6.53 per share), that we expect to recognize as an expense over the remaining average service period of 3.73.6 years.- Stockholders'– Stockholders’ EquityDividendsnine monthsquarter ended September 30, 2012 and September 30, 2011.September 30, 2012 $ 0.11 $ 11.6 0.11 15.3 0.11 19.9 0.10 17.8 0.10 18.1 0.10 18.6 0.10 23.5 0.10 30.0 0.10 31.0 (1) This amount included $0.006 per common share of taxable income related to the year ended DecemberMarch 31, 2011.September 30, 20112013. $ 0.12 $ 2.0 0.12 3.9 0.12 3.9 0.12 5.9 0.12 5.9 0.12 8.3 0.12 9.1 0.12 9.1 0.12 10.1 (1) This amount included $0.02 per common share of taxable income related to the year ended December 31, 2010.Record Date Payment Date Rate per common share January 15, 2013 January 30, 2013 $ 0.08 $ 24.8 February 15, 2013 February 27, 2013 0.08 24.8 March 15, 2013 March 27, 2013 0.08 30.2 ARMOUR Residential REIT, Inc. and SubsidiaryNOTES TO CONDENSED CONSOLIDATED FINANCIAL STATEMENTS(Unaudited)nine monthsquarter ended September 30, 2012. There were noMarch 31, 2013.Record Date Payment Date January 15, 2013 January 28, 2013 $ 0.17 $ 0.3 February 15, 2013 February 26, 2013 0.17 0.4 March 15, 2013 March 26, 2013 0.17 0.4 AB Preferred Stock dividend transactions for the nine monthsquarter ended September 30, 2011.September 30, 2012March 31, 2013. $ 0.286500 $ 0.4 0.171875 0.3 0.171875 0.3 (1) This amount included $0.2 million paid to holders of record on July 13, 2012 for the period of June 7, 2012 through June 30, 2012.Record Date Payment Date March 15, 2013 March 27, 2013 $ 0.25 $ 1.4 tables presenttable presents our equity transactions for the nine monthsquarter ended September 30, 2012 and September 30, 2011.September 30, 2012March 31, 2013. 10,350,000 $ 6.80 $ 70.1 29,900,000 6.80 203.0 1,287,570 7.06 8.9 35,650,000 6.72 239.2 1,400,000 25.00 33.8 46,000,000 7.06 324.5 63,250,000 7.30 461.4 19,750,000 7.14 (1) 138.2 385,000 25.56 (1) 9.5 7,273,020 7.28 (1) 52.9 (1)Weighted average priceSeptember 30, 2011 6,900,000 $ 7.55 $ 49.0 8,912,500 7.60 64.0 5,212,430 7.39 (1) 37.5 17,000,000 7.40 121.1 18,400,000 7.40 131.0 11,879,844 7.30 (1) 86.8 (1) Weighted average priceTransaction Type Completion Date Series A Preferred equity distribution agreements January 2, 2013 through January 30, 2013 174,961 $ 25.51 (1) $ 4.4 Dividend reinvestment and stock purchase plan January 25, 2013 through March 27, 2013 10,110 6.64 (1) 0.1 Series B Preferred initial offering February 12, 2013 5,650,000 25.00 136.6 Common stock follow-on public offering February 20, 2013 65,000,000 6.75 438.4 (1) Weighted average price the net income (loss) and the shares used in calculating weighted average basic and diluted earnings per common share for the quarters ended March 31, 2013 and nine months ended September 30, 2012 and September 30, 2011. $ 54,942 $ (34,472 $ 106,561 $ (33,149 (804 - (964 - $ 54,138 $ (34,472 $ 105,597 $ (33,149 269,325 78,360 195,272 52,863 685 - 1,015 - 270,010 78,360 196,287 52,863 For the Quarters Ended �� (in thousands) Net Income $ 102,290 $ 65,224 Less: Preferred dividends (2,497 ) - Net Income available to common stockholders $ 99,793 $ 65,224 Weighted average common shares outstanding - basic 337,935 134,903 Add: Effect of dilutive non-vested restricted stock awards, assumed vested 1,787 - Weighted average common shares outstanding - diluted 339,722 134,903 nine months ended September 30, 2012 and September 30, 2011. For the Quarters Ended (in millions) GAAP Net income $ 102.3 $ 65.2 Book to tax differences: Unrealized gain on derivatives (16.3 ) (17.6 ) Estimated taxable income $ 86.0 $ 47.6 currentlytimely distribute substantially all of our REIT taxable income. Accordingly, there is no provision requiredincome in order to maintain our REIT status. For the quarter ended March 31, 2013, we paid dividends of $0.08 per outstanding share of common stock and $0.17 per outstanding share of Series A Preferred stock for ARMOUR's reported GAAP earnings.-– Commitments and Contingencies12th12th of the sum of (a) 1.5% of gross equity raised up to $1 billion plus (b) 0.75% of gross equity raised in excess of $1 billion. We are also obligated to reimburse certain expenses incurred by ARRM and its affiliates. ARRM is further entitled to receive a termination fee from us under certain circumstances. The ARRM monthly management fee is not calculated based on the performance of our portfolio. Accordingly, the payment of our monthly management fee may not decline in the event of a decline in our earnings and may cause us to incur losses.September 30, 2012March 31, 2013 and December 31, 2011.ARMOUR Residential REIT, Inc. and SubsidiaryNOTES TO CONDENSED CONSOLIDATED FINANCIAL STATEMENTS(Unaudited)-– Related Party Transactions10ten years on June 18, 2022 and is thereafter automatically renewed for an additional five-year term unless terminated under certain circumstances. Either party must provide 180 days prior written notice of any such termination.●●●●●· ARRM is also responsible for the payment of a sub-management fee payable monthly in arrears to Staton Bell Blank Check LLC in an amount equal to 25% of the monthly base management fee earned by ARRM, net of expenses. tjhanthan the various overhead expenses specified in the terms of the 2012 Management Agreement.nine monthsSubsidiarySeptember 30,March 31, 2013 and March 31, 2012 we incurred $5.6$6.6 million and $13.4$3.5 million in management fees to ARRM, respectively. For the quarter and nine months ended September 30, 2011, we incurred $2.2 million and $4.4 million in management fees to ARRM, respectively.-– Interest Rate RiskOctoberApril 29, 2012,2013, a cash dividend of $0.171875$0.17 per outstanding share of Series A Preferred Stock, or $0.3$0.4 million in the aggregate, was paid to holders of record on OctoberApril 15, 2012.2013. We have also announced cash dividends of $0.171875$0.17 per outstanding share of Series A Preferred Stock payable NovemberMay 27, 20122013 to holders of record on NovemberMay 15, 20122013 and payable DecemberJune 27, 20122013 to holders of record on DecemberJune 14, 2012.October 30, 2012,April 29, 2013, a cash dividend of $0.09$0.16 per outstanding common share of Series B Preferred Stock, or $27.9$0.9 million in the aggregate, was paid to holders of record on OctoberApril 15, 2012.2013. We have also announced an expected fourth quartercash dividends of $0.16 per outstanding share of Series B Preferred Stock payable May 27, 2013 to holders of record on May 15, 2013 and payable June 27, 2013 to holders of record on June 14, 2013.rate of $0.09$0.07 per outstanding common share.On October 30, 2012 our Board approved an amendmentshare, or $26.2 million in the aggregate, was paid to our charter to increase our authorized sharesholders of common stock from 500,000,000 shares to 1,000,000,000 shares and to increase our authorized shares of preferred stock from 25,000,000 shares to 50,000,000 shares. Pursuant to Maryland corporate law and Section 6.1 of our charter, the amendment was approved by our Board and did not require any action by our stockholders. Our charter was amended effectivelyrecord on October 31, 2012 to increase our authorized shares of common stock from 500,000,000 shares to 1,000,000,000 shares and to increase our authorized shares of preferred stock from 25,000,000 shares to 50,000,000 shares.Management'sManagement’s Discussion and Analysis of Financial Condition and Results of Operations In addition, reference should be made to our audited financial statements and notes thereto and related Management's Discussion and Analysis of Financial Condition and Results of Operations included in our most recent Annual Report on Form 10-K.“we”, “us”, “our”,“we,” “us,” “our,” “ARMOUR” or the “Company” are to ARMOUR Residential REIT, Inc. References to “ARRM” are to ARMOUR Residential Management LLC, a Delaware limited liability company.CAUTIONARY NOTE REGARDING FORWARD-LOOKING STATEMENTSThis report contains various “forward-looking statements.” Forward-looking statements relate to expectations, beliefs, projections, future plans and strategies, anticipated events or trends and similar expressions concerning matters that are not historical facts. In some cases, you can identify forward-looking statements by the use of forward-looking terminology such as “believes,” “expects,” “may,” “will,” “would,” “could,” “should,” “seeks,” “approximately,” “intends,” “plans,” “projects,” “estimates” or “anticipates” or the negative of these words and phrases or similar words or phrases. All forward-looking statements may be impacted by a number of risks and uncertainties, including statements regarding the following subjects:●our business and investment strategy;●our anticipated results of operations;●statements about future dividends;●our ability to obtain financing arrangements;●our understanding of our competition and ability to compete effectively;●market, industry and economic trends; and●interest rates.The forward-looking statements in this report are based on our beliefs, assumptions and expectations of our future performance, taking into account all information currently available to us. These beliefs, assumptions and expectations are subject to risks and uncertainties and can change as a result of many possible events or factors, not all of which are known to us. If a change occurs, our business, financial condition, liquidity and results of operations may vary materially from those expressed in our forward-looking statements. You should carefully consider these risks before you make an investment decision with respect to our stock.We cannot guarantee future results, levels of activity, performance or achievements. You should not place undue reliance on forward-looking statements, which apply only as of the date of this report. We do not intend and disclaim any duty or obligation to update or revise any industry information or forward-looking statements set forth in this report to reflect new information, future events or otherwise, except as required under the U.S. Federal securities laws.aan externally managed Maryland corporation formed toin 2008, managed by ARRM. We invest primarily in hybrid adjustable rate, adjustable rate and fixed rate residential mortgage backed securities (“RMBS”). These securities are issued or guaranteed by a U.S. Government-sponsored entity (“GSE”), such as the Federal National Mortgage Association (Fannie Mae), the Federal Home Loan Mortgage Corporation (Freddie Mac), or guaranteed by the Government National Mortgage Administration (Ginnie Mae) (collectively, “Agency Securities”). Our portfolio consists primarily of securities backed by fixed rate, hybrid adjustable rate, and adjustable rate home loans. From time to time, a portion of our portfolio may be invested in unsecured notes and bonds issued by U.S. Government-chartered entities (collectively, “Agency Debt”), U.S. Treasuries and money market instruments, subject to certain income tests we must satisfy for our qualification as a real estate investment trust (“REIT”). Our charter permits us to invest in Agency Securities and Non-Agency Securities. As of September 30, 2012,March 31, 2013, Agency Securities account for 100% of our portfolio. It is expected that the percentage will continue to be 100% or close thereto. On December 1, 2011, our stockholders approved an amendment to our charter to alter our investment asset class restriction in response to potential changes in Agency Securities to include non-Agency as well as Agency Securities in our investment asset class restriction. While we remain committed to investing in Agency Securities for so long as an adequate supply and pricing exists, we believe it is prudent for us to have the flexibility to invest in non-Agency Securities and respond to changes in GSE policy.We are externally managed by ARRM, an investment advisor registered with the Securities and Exchange Commission ("SEC"). ARRM is also the external manager of JAVELIN Mortgage Investment Corp. ("JAVELIN"), a publicly traded REIT, which invests in and manages a leveraged portfolio of Agency Securities, non-Agency Securities and other mortgage-related investments. Our Co-Chief Executive Officers ("Co-CEOs"), Scott J. Ulm and Jeffrey J. Zimmer, and Chief Financial Officer ("CFO"), James R. Mountain, also serve as the Co-CEOs and CFO of JAVELIN, respectively. ARRM is an entity affiliated with the executive officers of ARMOUR and JAVELIN. intend to qualify and have elected to be taxed as a REIT under the Internal Revenue Code (“the Code”). We will generally not be subject to federal income tax to the extent that we distribute our taxable income to our stockholders and as long as we satisfy the ongoing REIT requirements including meeting certain asset, income and stock ownership tests. Our business plan is to identify and acquire Agency Securities, finance our acquisitions with borrowings under a series of short-term repurchase agreements at the most competitive interest rates available to us and then cost-effectively hedge our interest rate and other risks based on our entire portfolio of assets, liabilities and derivatives and our management's view of the market. Successful implementation of our business plan requires us to address interest rate risk, maintain adequate liquidity and effectively hedge interest rate risks. We execute our business plan in a manner consistent with our intention of qualifying as a REIT and avoid regulation as an investment company under the Investment Company Act of 1940 (the “1940 Act”).U.S. generally accepted accounting principles in the U.S. (“GAAP”) will fluctuate even in situations where our derivatives are operating as intended. As a result of this mark-to-market accounting treatment, our results of operations are likely to fluctuate far more than if we were to designate our derivative activities as cash flow hedges. Comparisons with companies that use cash flow hedge accounting for all or part of their derivative activities may not be meaningful.●●●●●For a discussion of additional risks relating to our business see “Risk Factors” in Item 1A, the Risk Factors below, and in our Annual Report on Form 10-K for the year ended December 31, 2011.an amended and restateda management agreement as furthermost recently amended and restated on June 18, 2012 (the “2012 Management Agreement”). ARRM is an investment advisor registered with the Securities and Exchange Commission (“SEC”) (see Note 14 to the condensed consolidated financial statements). All of our executive officers are also employees of ARRM. ARRM is also the external manager of JAVELIN Mortgage Investment Corp. (“JAVELIN”), a publicly traded REIT which invests in and manages a leveraged portfolio of Agency Securities and Non-Agency Securities. Our executive officers also serve as executive officers of JAVELIN. ARRM manages our day-to-day operations, subject to the direction and oversight of the Board of Directors (“Board”). The 2012 Management Agreement expires after an initial term of 10ten years on June 18, 2022 and is thereafter automatically renewed for an additional five-year term unless terminated under certain circumstances. Either party must provide 180 days prior written notice of any such termination.12th12th of 1% of gross equity raised until gross equity raised was $50 million. Thereafter, the monthly management fee would be 1/12th12th of the sum of (a) 1.5% of gross equity raised up to $1 billion plus (b) 0.75% of gross equity raised in excess of $1 billion. We are also obligated to reimburse certain expenses incurred by ARRM and its affiliates. ARRM is further entitled to receive a termination fee from us under certain circumstances.America'sAmerica’s Housing Finance Market” to the U.S. Congress outlining recommendations for reforming the U.S. housing system, specifically Fannie Mae and Freddie Mac and transforming the U.S. Government'sGovernment’s involvement in the housing market. It is unclear how future legislation may impact the housing finance market and the investing environment for Agency Securities as the method of reform is undecided and has not yet been defined by the regulators. Without U.S. Government support for residential mortgages, we may not be able to execute our current business model in an efficient manner.The U.S. Federal Reserve's (“the Fed”) program to purchase Agency Securities which had commenced in January 2009 and was terminated on March 31, 2010 had a significant impact on market prices. In total, $1.3 trillion of Agency Securities were purchased. In addition, through the course of 2009, the U.S. Treasury purchased $250.0 billion of Agency Securities. An effect of these purchases has been an increase in the prices of Agency Securities, which has decreased our net interest margin. When these programs terminated, the market expectation was that it might cause a decrease in demand for these securities which would likely reduce their market price. However, this has not happened and we continue to see strong demand as these securities remain desirable assets in this rather volatile economic environment. It is difficult to quantify the impact, as there are many factors at work at the same time that affect the price of Agency Securities and, therefore, our yield and book value. Due to the unpredictability in the markets for our securities in particular and yield generating assets in general, there is no pattern that can be implied with any certainty. In March 2011, the U.S. Treasury announced that it will begin the orderly wind down of its remaining Agency Securities with sales up to $10.0 billion per month, subject to market conditions. It is unclear how these sales will affect market conditions and pricing. On September 21, 2011, the U.S. Federal Reserve announced that it will begin reinvesting principal payments from its holdings of Agency Debt and Agency Securities.Fed'sFed’s Agency Securities holding by approximately $85 billion per month at least through the end of 2012. The FedOn December 12, 2012, the Federal Reserve also extended through at least mid-2015 its plan toannounced that it will keep the target range for the Federal Funds Rate between zero and 0.25%. for at least as long as the unemployment rate remains above 6.5%, inflation between one and two years ahead is projected to be no more than 0.5% above the Federal Reserve’s 2% longer-run goal, and longer-term inflation expectations continue to be well anchored.willto put downward pressure on long-term interest rates.the Fed'sthese actions have driven Agency Securities prices to recordall-time highs, thereby compressingwhich have further compressed interest rate spreads, and reducingremoved the historical correlation between mortgage rates and rates on U.S. Treasuries andTreasury or interest rate swaps. These factors have contributed to a challenging reinvestment and interest rate hedging environment.under the 1940 Act pursuant to the exemptionexclusion provided by Section 3(c)(5)(C) of the 1940 Act for entities that are primarily engaged in the business of purchasing or otherwise acquiring “mortgages and other liens on and interests in real estate.” On August 31, 2011, the SEC issued a concept release (No. IC-29778; File No. SW7-34-11, Companies Engaged in the Business of Acquiring Mortgages and Mortgage-RelatedMortgage Related Instruments) pursuant to which it is reviewing whether certain companies that invest in mortgage backed securities (“MBS”) and rely on the exemptionexclusion from registration under Section 3(c)(5)(C) of the 1940 Act (such as us) should continue to be allowed to rely on such exemptionexclusion from registration. If we fail to continue to qualify for this exemptionexclusion from registration as an investment company, or the SEC determines that companies that invest in MBS are no longer able to rely on this exemption,exclusion, our ability to use leverage would be substantially reduced and we would be unable to conduct our business as planned, or we may be required to register as an investment company under the 1940 Act, either of which could negatively affect the value of shares of our stock and our ability to make distributions to our stockholders.Federal Housing AdministrationFHFA and the Federal Deposit Insurance Corporation (“FDIC”), to provide homeowners with assistance in avoiding residential mortgage loan foreclosures are currently in effect. The programs may involve, among other things, the modification of mortgage loans to reduce the principal amount of the loans or the rate of interest payable on the loans, or to extend the payment terms of the loans. While the effect of these programs has not been as extensive as originally expected, the effect of such programs for holders of Agency Securities could be that such holders would experience changes in the anticipated yields of their Agency Securities due to (i) increased prepayment rates andand/or (ii) lower interest and principal payments.●U.S. Federal ReserveFed for systemically important financial institutions (including nonbank financial companies), as well as the implementation of the FDIC resolution procedures for liquidation of large financial companies to avoid market disruption;●●U.S. Federal Reserve'sFed’s emergency authority to lend to nondepository institutions to facilities with broad-based eligibility, and authorizing the FDIC to establish an emergency financial stabilization fund for solvent depository institutions and their holding companies, subject to the approval of Congress, the Secretary of the U.S. Treasury and the U.S. Federal Reserve;●●●●bill'sbill’s implementation has not yet been defined by the regulators.United States by January 1, 2013.U.S., which is continuing to evaluate comments on its specific implementation proposals. It is presently unclear howwhen the U.S. will complete its implementation of Basel III reforms and whether the adoption of Basel IIIthese reforms will affect our business at this time.In September 2011, the White House announced work on a major initiative to allow certain homeowners who owe more on their mortgages than their homes are worth to refinance. In October 2011, the FHFA announced changes to the Home Affordable Refinance Program, (“HARP”) to expand access to refinancing for qualified individuals and families whose homes have lost value, including increasing the HARP loan-to-value ratio above 125%. However, this would only apply to mortgages guaranteed by the GSEs. In addition, the expansion does not change the time period which these loans were originated, maintaining the requirement that the loans must have been guaranteed by Fannie Mae or Freddie Mac prior to June 2009. There are many challenging issues to this proposal, notably the question as to whether a loan with a loan-to-value ratio of 125% qualifies as a mortgage or an unsecured consumer loan. The chances of this initiative's success have created additional uncertainty in the Agency Securities market, particularly with respect to possible increases in prepayment rates. We do not expect this announcement to have a significant impact on our results of operations.On January 4, 2012, the Fed released a report titled “The U.S. Housing Market: Current Conditions and Policy Considerations” to Congress providing a framework for contemplating certain issues and tradeoffs that policy makers might consider. It is unclear how future legislation may impact the housing finance market and the investing environment for Agency Securities as the method of reform is undecided and has not yet been defined by the regulators.●●●●●company'scompany’s derivatives and repurchase borrowings are conducted in U.S. dollars for maturities with historically deep and liquid markets. However, there can be no assurance whether the implementation of any Wheatley Review recommendations would have a material impact on the future reported levels of LIBOR rates relevant to the company'scompany’s derivatives or repurchase borrowings. Despite modest economic expansion during the first quarter of 2012, signs of decline remain evident in job growth, housing, and inflation. While the first quarter of 2012 U.S. economic performance reflected an upward trend in job growth and U.S. real gross domestic product, preliminary second quarter results reflect a slowing in the first quarter improvements, notably in job growth and the unemployment rate, which, in May, remained unchanged at 8.2% in March. Consumer price inflation also declined, reflecting decreases in crude oil and gasoline prices. Expectations of long-run inflation are projected to be subdued, at or below 2% due to a slightly increased unemployment rate as well as anchored long run inflation projections. Data suggests that the economy continues to grow modestly, however, not at the rate anticipated.The overall credit market deterioration since August 2007 has also affected prevailing interest rates. For example, interest rates have been unusually volatile between September of 2007 and October of 2008. Since September 18, 2007, the Fed has lowered the target for the Federal Funds Rate nine times from 4.75% to 1.00% in October 2008. Federal ReserveFed to other depository institutions overnight (actual transactions, rather than target rate).for the quarterly periods presented. 0.21 0.09 0.25 0.09 0.24 0.09 0.30 0.04 0.24 0.06 Quarter ended March 31, 2013 0.20 % 0.09 % March 31, 2012 0.24 0.09 and nine months ended September 30, 2012March 31, 2013 available to common stockholders was $54.1$99.8 million, and $105.6 million, respectively, or $0.20 and $0.54$0.30 per basic and $0.29 per diluted weighted average common share. These results compare to net lossincome of ($34.5)$65.2 million and ($33.1) million, respectively, relatedavailable to common stockholders or ($0.44) and ($0.63)$0.48 per basic and diluted weighted average common share for the quarter and nine months ended September 30, 2011.March 31, 2012. The main driversfactors of the difference from the quarter ended 2012 to the quarter ended 2013 were the increased equity capital resources from 2011 through the nine months ended September 30, 2012 and the continued implementation of our investment strategy, offset by unrealized losses from our derivatives and increased management fees.September 30, 2012March 31, 2013 and December 31, 2011,2012, our Agency Securities portfolio was carried at a net premium to par value with a weighted average amortized cost, of 105.26%104.78% and 104.23%105.24% respectively, due to the average interest rates on these securities being higher than prevailing market rates.quarterly periods presented. 2.70 0.89 1.82 0.45 2.97 0.82 2.15 0.39 3.04 0.81 2.23 0.34 2.60 0.98 1.62 0.35 3.11 0.93 2.18 0.27 Quarter Ended Asset Yield March 31, 2013 2.33 % 0.98 % 1.35 % 0.46 % March 31, 2012 3.04 0.81 2.23 0.34 September 30, 2012,March 31, 2013, was 13.0%15.7% on a constant prepayment basis compared to 12.4%11.4% for the quarter ended September 30, 2011.0.21%0.20% at September 30, 2012.March 31, 2013. During the quarterquarters ended March 31, 2013 and nine months ended September 30,March 31, 2012, we realized losses of $18.9$29.1 million, and $41.1 million, respectively, related to our derivatives. During the quarter and nine months ended September 30, 2011, we realized losses of $8.4 million and $16.4$9.7 million, respectively related to our derivatives. We increased our total interest rate swap contracts aggregate notional balance from $2.8$8.7 billion at December 31, 20112012 to $8.7$12.3 billion at September 30, 2012, with,March 31, 2013. Our interest rate swap contracts had a weighted average swap rate of 1.2%1.4% and a weighted average term of 67 months.75 months at March 31, 2013. During the quarter ended September 30, 2012,March 31, 2013, we entered intoincreased our total interest rate swaptions with an aggregate notional balance offrom $1.1 billion withat December 31, 2012 to $1.6 billion at March 31, 2013. Our swaptions had an underlying weighted average swap rate of 2.1% and a weighted average term of 8 months. We had not entered into any interest rate swaptions as of December4 months at March 31, 2011.2013. Our total Eurodollar Futures Contracts (“Futures Contracts”) notional amount decreased from $131.0$102.0 million at December 31, 20112012 to $121.0$99.0 million at September 30, 2012March 31, 2013 due to the maturity of contracts. Our Futures Contracts had a weighted average swap equivalent rate of 1.8%1.9% and weighted average term of 2118 months as of September 30, 2012.and nine months ended September 30, 2012,March 31, 2013 was $97.5$105.2 million and $228.4 million, respectively compared to $36.2$55.8 million and $75.1 million, respectively for the quarter and nine months ended September 30, 2011.March 31, 2012. The continued growth of our net interest income from year to year is due to the completion of equity raises in the nine months ended September 30, 2012.raises. The proceeds from these equity raises were invested in Agency Securities, creating a larger investment portfolio able to generate increasing levels of interest income. As of September 30, 2012March 31, 2013 and December 31, 2011,2012, our portfolio of Agency Securities consisted of $22.1$24.3 billion and $5.4$19.1 billion of securities, respectively.and nine months ended September 30, 2012March 31, 2013, we sold $1.6 billion and $1.9$2.3 billion of Agency Securities resulting in a realized gain of $15.1 million and $20.1 million, respectively. Of the $20.1 million $1.1 million is a loss due$18.5 million. These results compare to the bankruptcy of a counterparty to a repurchase agreement. In addition, due to the bankruptcy we also recorded $1.0 million of other income resulting from the non-performance of the counterparty on the related repurchase agreement. During the quarter and nine months ended September 30, 2011, we sold $0.5$0.2 billion of Agency Securities sold resulting in a realized gain of $6.5 million.Operating $6.3 million for the quarter ended March 31, 2012. operating expenses for the quarter and nine months ended September 30, 2012,March 31, 2013 were $7.2$8.6 million and $17.7 million, respectively as compared to $2.9$4.8 million and $6.4 million, respectively for the quarter and nine months ended September 30, 2011.March 31, 2012. The increase in operating expenses from 2011year to 2012year is primarily due to two factors. The first factor beingis due to increased management fees. Our total management fee expense for the quarter and nine months ended September 30, 2012, were $5.6March 31, 2013, was $6.6 million and $13.4 million, respectively as compared to $2.2$3.5 million and $4.4 million, respectively for the quarter and nine months ended September 30, 2011.March 31, 2012. Management fees are determined based on gross equity raised. Therefore as we continue to successfully raise capital our management fee continues to increase. However, because the management fee rate stepped downdecreased to 0.75% per annum for gross equity raised in excess of $1 billion;billion pursuant to the 2012 management agreement; the effective average management fee rate will continue to decline. The second factor is an increase in professional fees and operating costs to support our current portfolio.negative retained earnings (titled “Accumulated deficit” inelected to be taxed as a REIT under the stockholders' equity sectionCode. We will generally not be subject to federal income tax to the extent that we distribute our taxable income to our stockholders and as long as we satisfy the ongoing REIT requirements under the Code including meeting certain asset, income and stock ownership tests. For the Quarters Ended (in millions) GAAP Net income $ 102.3 $ 65.2 Book to tax differences: Unrealized gain on derivatives (16.3 ) (17.6 ) Estimated taxable income $ 86.0 $ 47.6 accompanying condensed consolidated balance sheets) asassets and liabilities is greater than our total Stockholders’ Equity at March 31, 2013 by approximately $120.6 million, or approximately $0.32 per share (based on the 374,053,198 shares then outstanding). September 30, 2012, due to the consequences of our tax qualification as a REIT. Our dividends are based on our REIT taxable income as determined for federal income tax purposes and notin order to maintain our net income computed in accordance with GAAP as reported in our condensed consolidated financial statements. Accordingly, we may be required to pay out more in dividends than we have calculated in distributable earnings on a GAAP basis.nine months$0.17 per outstanding share of Series A Preferred stock for each month of the quarter. In addition we paid dividends of $0.25 per outstanding share of Series B Preferred stock for the month of March, resulting in total payments stockholders of $82.3 million. Our estimated REIT taxable income available to pay dividends was $86.0 million for the quarter ended September 30, 2012,March 31, 2013. At March 31, 2013, our under distributed estimated REIT taxable income was approximately $86.4 million and $190.9 million, respectively. For the quarter and nine months ended September 30, 2011, our estimated REIT taxable income was approximately $31.3 million and $58.8 million, respectively. The most significant difference between GAAP and tax income was the unrealized loss on derivatives which is reflected in GAAP earnings but does not decrease REIT taxable income.for the periods presentedas of March 31, 2013 and December 31, 2012 (dollars in thousands). $ 20,627,189 $ 1,085,036 $ 21,712,225 105.26 $ 22,114,875 107.21 12,561,600 599,264 13,160,864 104.77 13,328,514 106.11 11,550,912 532,588 12,083,500 104.61 12,137,554 105.08 5,128,230 216,697 5,344,927 104.23 5,393,675 105.18 5,675,822 236,695 5,912,517 104.17 5,975,823 105.29 As of March 31, 2013 $ 23,197,808 $ 1,109,366 $ 24,307,174 104.78 % $ 24,339,169 104.92 % December 31, 2012 17,925,998 940,000 18,865,998 105.24 19,096,562 106.53 $ 2,234,747 3.70 $ 68 10.8 2,685,281 3.71 75 21.4 2,514,725 3.72 73 21.8 2,681,911 3.72 76 52.2 2,858,964 3.71 75 50.4 As of March 31, 2013 $ 1,812,296 3.68 % $ 62 7.8 % December 31, 2012 2,037,778 3.69 66 11.4 $ 18,392,442 3.52 271 89.2 9,876,319 3.62 217 78.6 9,036,187 3.64 219 78.2 2,446,319 3.97 188 47.8 2,816,858 4.00 172 49.6 As of March 31, 2013 $ 21,385,512 3.35 % 309 92.2 % December 31, 2012 15,888,220 3.52 276 88.6 September 30, 2012 13.015.7June 30, 20129.1 11.4 December 31, 201119.3September 30, 201112.4September 30, 2012,March 31, 2013, our Agency Security portfolio consisted of approximately $22.1$24.3 billion in market value of Agency Securities with initial fixed-interest rate periods of three, five, seven, ten, fifteen, twenty, twenty five and twentythirty years.assetsAgency Securities at a premium to par, the main item that can affect the yield on our assetsAgency Securities after they are purchased is the rate at which the mortgage borrowers repay the loan. While the scheduled repayments, which are the principal portion of the homeowners'homeowners’ regular monthly payments, are fairly predictable, the unscheduled repayments, which are generally refinancing of the mortgage but can also result from repurchases of delinquent, defaulted, or modified loans, are less so. Being able to accurately estimate and manage these repayment rates is a critical portion of the management of our portfolio, not only for estimating current yield but also for considering the rate of reinvestment of those proceeds into new securities, the yields which those new securities may add to our portfolio and our hedging strategy. We expect that prepayment rates will be elevated due to repurchases of loans that reach 120 day or more delinquency by Freddie Mac and Fannie Mae on a continuing basis.September 30, 2012March 31, 2013 and December 31, 2011,2012, the adjustable and hybrid adjustable rate mortgage loans underlying our Agency Securities have fixed-interest rates for an average period of approximately 6862 months and 7666 months, respectively, after which time the interest rates reset and become adjustable. After a reset date, interest rates on our adjustable and hybrid adjustable Agency Securities float based on spreads over various indices, typically LIBOR or the one-year Constant Maturity Treasury rate. These interest rates are subject to caps that limit the amount the applicable interest rate can increase during any year, known as an annual cap and through the maturity of the security, known as a lifetime cap.2628 of which we had done repurchase trades with as of September 30, 2012March 31, 2013 and 2326 of which we had done repurchases trades with as of December 31, 2011.2012. We had outstanding balances under our repurchase agreements as of September 30, 2012March 31, 2013 and December 31, 20112012 of $19.8$24.8 billion and $5.3$18.4 billion, respectively.intend to hedge as much of our interest rate risk as our managerARRM deems prudent in light of market conditions and the associated costs. We generally pay a fixed rate and receive a floating rate with the objective of fixing a portion of our borrowing costs and hedging the change in our book value to some degree. The floating rate we receive is generally the Federal Funds Rate or LIBOR. While our policies do not contain specific requirements as to the percentages or amount of interest rate risk that we are required to hedge, we maintain an overall target of hedging at least 40% of our non-adjustable rate mortgages (“ARMs”).mortgages. For interest rate risk mitigation purposes, we consider Agency Securities to be ARMsadjustable rate mortgages (“ARMs”) if their interest rate is either currently subject to adjustment according to prevailing rates or if they are within 18 months of the period where such adjustments will occur. No assurance can be given that our derivatives will have the desired beneficial impact on our results of operations or financial condition. We have not elected cash flow hedge accounting treatment as allowed by GAAP. Since we do not designate our derivative activities as cash flow hedges, realized as well as unrealized gains/losses from these transactions will impact our earnings.●●●●●September 30, 2012March 31, 2013 and December 31, 2011,2012, we had interest rate swap contracts with an aggregate notional balance of $8.7$12.3 billion and $2.8$8.7 billion, respectively. As of September 30,March 31, 2013 and December 31, 2012, we had entered into interest rate swaptions with an aggregate notional balance of $1.6 billion and $1.1 billion. We had not entered into any interest rate swaptions as of December 31, 2011.billion, respectively. In addition, as of September 30, 2012March 31, 2013 and December 31, 20112012, we had purchased or sold Futures Contracts with an aggregate notional balance of $121.0$99.0 million and $131.0$102.0 million, respectively. Futures Contracts are traded on the Chicago Mercantile Exchange (“CME”). Counterparty risk of interest rate swap contracts, interest rate swaptions and Futures Contracts are limited to some degree because of daily mark-to-market and collateral requirements. In addition, substantial credit support for the Futures Contracts is provided by the CME. These derivative transactions are designed to lock in some funding costs for financing activities associated with our assets in such a way as to help assure the realization of attractive net interest margins and to vary inversely in value with our Agency Securities. Such contracts are based on assumptions about prepayments which, if not realized, will cause results to differ from expectations.nine monthsquarters ended September 30,March 31, 2013 and March 31, 2012 the change in the fair valuewe recognized losses of our derivative positions decreased by $68.6$12.8 million and gains of $7.9 million, respectively, related to our derivatives. For the quarters ended March 31, 2013 and March 31, 2012, the unrealized change in the fair value of our Agency Securities (decreased) increased by $374.0 million. For($180.1) million and $11.6 million, respectively.nine months ended September 30, 2011,Dodd-Frank Act, the unrealized changeCommodity Futures Trading Commission has adopted rules requiring certain interest rate swap contracts to be cleared through a derivatives clearing organization. We may be required to begin clearing certain new interest rate swap contracts as early as June 2013. There can be no assurances what effects, if any, these interest rate swap clearing requirements will have on the availability, pricing, liquidity or margin requirements associated with cleared or un-cleared interest rate swap contracts that we might enter into in the fair value of our derivative positions decreased by $91.9 million and the unrealized change in the fair value of our Agency Securities increased by $74.0 million.nine monthsquarter ended September 30, 2012,March 31, 2013, we issued 213,460,59065,010,110 shares of common stock and raised additional net common equity of approximately $1.5 billion.$438.5 million. During the nine monthsquarter ended September 30, 2012,March 31, 2013, we issued 1,785,000174,961 shares of 8.250% Series A Cumulative Redeemable Preferred Stock (“Series A Preferred Stock”) and raisedissued 5,650,000 shares of 7.875% Series B Cumulative Preferred Stock (“Series B Preferred Stock”) for a combined net preferred equity of approximately $43.3$141.0 million. As a result, we were able to acquire additional assets, arrange additional repurchase agreement funding and increase economies of scale. At times, we purchased assets for forward settlement up to 90 days in the future to minimize purchase prices. Our management fee expense also increased in absolute terms under the provisions of our management agreement. However, pursuant to the 2012 Management Agreement, the average effective management fee rate declined because the management fee rate stepped down as the amounts of equity raised exceeded $1.0 billion.nine monthsquarter ended September 30, 2012,March 31, 2013, we purchased $18.9$8.9 billion current face amount of Agency Securities using proceeds from equity raises, repurchase agreements and principal repayments. During the nine monthsquarter ended September 30, 2012,March 31, 2013, we received cash of $1.6$1.2 billion from prepayments and scheduled principal payments on our Agency Securities. We received net proceeds of $1.5 billion$438.5 million from common equity issuances, including our dividend reinvestment and stock purchase plan (“DRIP”) and $43.3$4.4 million of proceeds from the issuance of 1,785,000174,961 shares of Series A Preferred Stock and $136.6 million of proceeds from the issuance of 5,650,000 shares of Series B Preferred Stock during the nine monthsquarter ended September 30, 2012.March 31, 2013. We had a net cash increase from our repurchase agreements of $14.5$6.5 billion for the nine monthsquarter ended September 30, 2012March 31, 2013 and made cash interest payments of approximately $61.2$55.3 million on our liabilities for the nine monthsquarter ended September 30, 2012.March 31, 2013. Part of funding our operations includes providing margin cash to offset liability balances on our derivatives. This required an additional $90.6We recovered $35.1 million of cash to be maintained in a restricted accountcollateral posted with counterparties and increased our counterpartiesliability by $10.2 million for the nine months ended September 30, 2012.September 30, 2012March 31, 2013 and December 31, 2011. $ 9,925,408 $ 4,068,197 5,679,332 1,111,480 2,933,517 156,285 1,288,731 - $ 19,826,988 $ 5,335,962 (in thousands) Within 30 days $ 11,626,612 $ 7,771,444 31 days to 60 days 11,540,240 7,840,268 61 days to 90 days 562,762 2,699,706 Greater than 90 days 1,099,000 54,677 Total $ 24,828,614 $ 18,366,095 September 30, 2012March 31, 2013 and December 31, 2011. 32 29 26 23 39 18 0.43 0.37 4.8 5.0 Number of MRA’s 33 33 Number of counterparties with repurchase agreements outstanding 28 26 Weighted average maturity in days 36 34 Weighted average contractual rate 0.43 % 0.49 % 4.8 % 4.8 % ●●●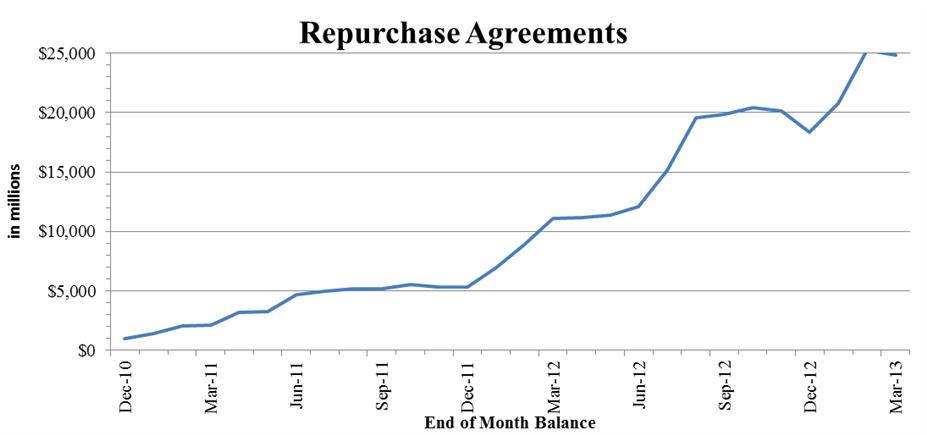
stockholders'stockholders’ equity as well as termination events in the case of significant reductions in equity capital.stockholders'stockholders’ equity. At September 30, 2012March 31, 2013 and December 31, 2011,2012, our total borrowings were approximately $19.8$24.8 billion and $5.3$18.4 billion (excluding accrued interest), respectively, which represented a leverage ratio of approximately 8.12:9.17:1 and 8.52:7.96:1, respectively.We may increase our capital resources by obtaining long-term credit facilities or making public or private offerings of equity or debt securities, including classes of preferred stock, common stock and senior or subordinated notes to meet our long-term (greater than one year) liquidity. Such financing will depend on market conditions for capital raises and for the investment of any proceeds.Stockholder'snine monthsquarter ended September 30, 2012 and September 30, 2011.September 30, 2012 $ 0.11 $ 11.6 0.11 15.3 0.11 19.9 0.10 17.8 0.10 18.1 0.10 18.6 0.10 23.5 0.10 30.0 0.10 31.0 (1) This amount included $0.006 per common share of taxable income related to the year ended DecemberMarch 31, 2011.September 30, 2011 $ 0.12 $ 2.0 0.12 3.9 0.12 3.9 0.12 5.9 0.12 5.9 0.12 8.3 0.12 9.1 0.12 9.1 0.12 10.1 (1) This amount included $0.02 per common share of taxable income related to the year ended December 31, 2010.We have announced an expected fourth quarter cash dividend rate of $0.09 per outstanding common share.Record Date Payment Date January 15, 2013 January 30, 2013 $ 0.08 $ 24.8 February 15, 2013 February 27, 2013 0.08 24.8 March 15, 2013 March 27, 2013 0.08 30.2 nine monthsquarter ended September 30, 2012. There were noMarch 31, 2013.Record Date Payment Date January 15, 2013 January 28, 2013 $ 0.17 $ 0.3 February 15, 2013 February 26, 2013 0.17 0.4 March 15, 2013 March 26, 2013 0.17 0.4 AB Preferred Stock dividend transactions for the nine monthsquarter ended September 30, 2011.September 30, 2012 $ 0.286500 $ 0.4 0.171875 0.3 0.171875 0.3 (1) This amount included $0.2 million paid to holders of record on July 13, 2012 for the period of June 7, 2012 through June 30, 2012Series A Preferred Stock dividends will continue to be contractually payable without further declaration at the rate of $0.171875 per outstanding share per month.Record Date Payment Date March 15, 2013 March 27, 2013 $ 0.25 $ 1.4 tables presenttable presents our equity transactions for the nine monthsquarter ended September 30, 2012 and September 30, 2011.September 30, 2012 10,350,000 $ 6.80 $ 70.1 29,900,000 6.80 203.0 1,287,570 7.06 8.9 35,650,000 6.72 239.2 1,400,000 25.00 33.8 46,000,000 7.06 324.5 63,250,000 7.30 461.4 19,750,000 7.14 (1) 138.2 385,000 25.56 (1) 9.5 7,273,020 7.28 (1) 52.9 (1) Weighted average priceSeptember 30, 2011 6,900,000 $ 7.55 $ 49.0 8,912,500 7.60 64.0 5,212,430 7.39 (1) 37.5 17,000,000 7.40 121.1 18,400,000 7.40 131.0 11,879,844 7.30 (1) 86.8 (1) Weighted average priceTransaction Type Completion Date Series A Preferred equity distribution agreements January 2, 2013 through January 30, 2013 174,961 $ 25.51 (1) $ 4.4 DRIP January 25, 2013 through March 27, 2013 10,110 6.64 (1) 0.1 Series B Preferred initial offering February 12, 2013 5,650,000 25.00 136.6 Common stock follow-on public offering February 20, 2013 65,000,000 6.75 438.4 (1) Weighted average price September 30, 2012March 31, 2013 and December 31, 2011,2012, we did not maintain any relationships with unconsolidated entities or financial partnerships, such as entities often referred to as structured finance, or special purpose or variable interest entities, established for the purpose of facilitating off-balance sheet arrangements or other contractually narrow or limited purposes. Further, as of September 30, 2012March 31, 2013 and December 31, 2011,2012, we had not guaranteed any obligations of any unconsolidated entities or entered into any commitment or intent to provide funding to any such entities.Acritical accounting policies most affected by management’s judgments, estimates and assumptions.Item 7other comprehensive income or loss as a component of stockholders’ equity. We utilize a third party pricing service to value our Annual Reportportfolio. The pricing service incorporates common market pricing methods including a spread measurement to the Treasury yield curve as well as underlying characteristics of the particular security including coupon, periodic and life caps, rate reset period and expected life of the security.Form 10-Kthe trade date. Gains or losses realized from the sale of securities are included in income and are determined using the specific identification method.year ended December 31, 2011. Therefair value of an investment is less than its amortized cost at the balance sheet date of the reporting period for which impairment is assessed, the impairment is designated as either “temporary” or “other than temporary.” In deciding on whether or not a security is other than temporarily impaired, we use a two-step evaluation process. First, we determine whether we have made any decision to sell a security that is in an unrealized loss position, or, if not, is it more likely than not that we will be forced to sell the security prior to recovering its amortized cost basis. If we determine that the answer to either of these questions is “yes” then the security is considered other than temporarily impaired. To date there have been no significantsuch impairment losses recognized.those policies during 2012.· our business and investment strategy; · our anticipated results of operations; · statements about future dividends; · our ability to obtain financing arrangements; · our understanding of our competition and ability to compete effectively; · market, industry and economic trends; and · interest rates. the factors referenced in this report and including those set forth under Item 1A “Risk Factors” in our Annual Report on Form 10-K for the year ended December 31, 2012. Aboutabout Market RiskARM-related assetsARM-related asset'sARMs interest rate can change during any given period. ARM securitiesARMs are also typically subject to a minimum interest rate payable. Our borrowings are not subject to similar restrictions. Hence, in a period of increasing interest rates, interest rates on our borrowings could increase without limitation, while the interest rates on our mortgage related assets could be limited. This exposure would be magnified to the extent we acquire fixed rate Agency Securities or ARM securitiesARMs that are not fully indexed. Further, some ARM-related assetsARMs may be subject to periodic payment caps that result in some portion of the interest being deferred and added to the principal outstanding. These factors could lower our net interest income or cause a net loss during periods of rising interest rates, which would negatively impact our liquidity, net income and our ability to make distributions to stockholders.ARM-related assetsARMs with borrowings that have interest rates based on indices and repricing terms similar to, but of shorter maturities than, the interest rate indices and repricing terms of our mortgage assets. Thus, we anticipate that in most cases the interest rate indices and repricing terms of our mortgage assets and our funding sources will not be identical, thereby creating an interest rate mismatch between assets and liabilities. During periods of changing interest rates, such interest rate mismatches could negatively impact our net interest income, dividend yield and the market price of our stock. Most of our adjustable rate assets are based on the one-year constant maturity treasury rate and the one-year LIBOR rate and our debt obligations are generally based on LIBOR. These indices generally move in the same direction, but there can be no assurance that this will continue to occur.ARM-related assetsARMs and borrowings reset at various different dates for the specific asset or obligation. In general, the repricing of our debt obligations occurs more quickly than on our assets. Therefore, on average, our cost of funds may rise or fall more quickly than does our earnings rate on our assets.September 30,March 31, 2013 and March 31, 2012, and December 31, 2011, assuming a static portfolio. When evaluating the impact of changes in interest rates, prepayment assumptions and principal reinvestment rates are adjusted based on our manager'sARRM’s expectations. The analysis presented utilized assumptions, models and estimates of the manager based on the manager'smanager’s judgment and experience.September 30, 2012Change in Interest Rates 1.00 % (11.89) % (2.42) % 0.50 (4.16) (1.27) (0.50) 4.67 (0.04) (1.00) (9.62) (0.04) 2011Change in Interest Rates 1.00 % 4.90 % (0.99) % 0.50 12.81 (0.60) (0.50) (6.38) (1.31) (1.00) (41.89) (2.17) September 30, 2012March 31, 2013 and December 31, 2011,2012, we applied a floor of 0% for all anticipated interest rates included in our assumptions. Due to the presence of this floor, it is anticipated that any hypothetical interest rate decrease would have a limited positive impact on our funding costs beyond a certain level; however, because prepayments speeds are unaffected by this floor, it is expected that any increase in our prepayment speeds (occurring as a result of any interest rate decrease or otherwise) could result in an acceleration of our premium amortization and the reinvestment of such prepaid principal in lower yielding assets. As a result, the presence of this floor limits the positive impact of any interest rate decrease on our funding costs. Therefore, at some point, hypothetical interest rate decreases could cause the fair value of our financial instruments and our net interest income to decline.reflectedreported as part of “Accumulated other comprehensive income” that is included in the stockholders'stockholders’ equity section of our condensed consolidated balance sheets. The market value of our assets can fluctuate due to changes in interest rates and other factors. Weakness in the mortgage market may adversely affect the performance and market value of our investments. This could negatively impact our book value. Furthermore, if our lenders are unwilling or unable to provide additional financing, we could be forced to sell our Agency Securities at an inopportune time when prices are depressed. The principal payments are guaranteed by Freddie Mac, Fannie Mae, or Ginnie Mae on our Agency Securities.Co-CEOsCo-Chief Executive Officers (“Co-CEOs”) and CFOChief Financial Officer (“CFO”) participated in an evaluation by our management of the effectiveness of our disclosure controls and procedures as of the end of our fiscal quarter that ended on September 30, 2012. Based on their participation in that evaluation, our Co-CEOs and (as defined in Rules 13a-15(e) and 15d-15(e) under the Securities Exchange Act of 1934, as amended (the “Exchange Act”)) as of the end of our fiscal quarter that ended on March 31, 2013. Based on their participation in that evaluation, our Co-CEOs and CFO concluded that our disclosure controls and procedures were effective as of September 30, 2012March 31, 2013 to ensure that information required to be disclosed in our reports filed or submitted under the Securities Exchange Act, of 1934, as amended, is recorded, processed, summarized and reported within the time periods specified in the SEC'sSEC’s rules and forms, and to ensure that information required to be disclosed in our reports filed or furnished under the Securities Exchange Act, of 1934, as amended, is accumulated and communicated to our management, including our Co-CEOs and CFO, as appropriate, to allow timely decisions regarding required disclosures. Our Co-CEOs and CFO also participated in an evaluation by our management of any changes in our internal control over financial reporting (as defined in Rules 13a-15(f) and 15d-15(f) under the Exchange Act) that occurred during the quarter ended September 30, 2012.March 31, 2013. That evaluation did not identify any changes that have materially affected, or are reasonably likely to materially affect, our internal control over financial reporting.our managerARRM are not currently subject to any legal proceedings.proceedings, as described in Item 103 of Regulation S-K.March 6, 2012February 22, 2013 with the SEC, except as set forth below.There are conflicts of interest in our relationship with ARRM and its affiliates, which could result in decisions that are not in the best interests of our stockholders or warrant holders.We are subject to conflicts of interest arising out of our relationship with JAVELIN, ARRM and their affiliates. Each of our executive officers and certain of our non-independent directors is also an employee or affiliated with JAVELIN and ARRM and they will not be exclusively dedicated to our business. Each of Mr. Ulm and Mr. Zimmer is a Co-Managing Member of ARRM and owner of equity interests in JAVELIN.In addition, Daniel C. Staton and Marc H. Bell, two of our directors, are principal owners of Staton Bell Blank Check LLC, our Sub-Manager, which, in consideration for services to be provided to ARRM under a sub-management agreement is entitled to receive a percentage of the net management fee earned by ARRM from us and JAVELIN. As a result, the Management Agreement with ARRM may create a conflict of interest and its terms, including fees payable to ARRM, may not be as favorable to us as if they had been negotiated with an unaffiliated third party. In addition, we may choose not to enforce, or to enforce less vigorously, our rights under the Management Agreement because of our desire to maintain our ongoing relationship with ARRM. ARRM maintains a contractual and fiduciary relationship with us. The Management Agreement with ARRM does not prevent ARRM and its affiliates from engaging in additional management or investment opportunities some of which will compete with us. ARRM and its affiliates may engage in additional management or investment opportunities that have overlapping objectives with ours and may thus face conflicts in the allocation of investment opportunities to these other investments. Such allocation is at the discretion of ARRM and there is no guarantee that this allocation would be made in the best interest of our stockholders or warrant holders. We are not entitled to receive preferential treatment as compared with the treatment given by ARRM or its affiliates to any investment company, fund or advisory account other than any fund or advisory account which contains only funds invested by ARRM (and not of any of its clients or customers) or its officers and directors. Additionally, the ability of ARRM and its respective officers and employees to engage in other business activities, including their activities related to JAVELIN, may reduce the time spent managing our activities.In the future, we may enter, or ARRM may cause us to enter, into additional transactions with ARRM or its affiliates. In particular, we may purchase, or ARRM may cause us to purchase, assets from ARRM or its affiliates or make co-purchases alongside ARRM or its affiliates. These transactions may not be the result of arm's length negotiations and may involve conflicts between our interests and the interests of ARRM and/or its affiliates in obtaining favorable terms and conditions.Members of our management team have competing duties to other entities, which could result in decisions that are not in the best interests of our stockholders or warrant holders.Our executive officers and the employees of ARRM do not spend all of their time managing our activities and our investment portfolio. Our executive officers and the employees of ARRM allocate some, or a material portion, of their time to other businesses and activities. For example, each of our executive officers is also an officer of JAVELIN and an employee of ARRM. None of these individuals is required to devote a specific amount of time to our affairs. As a result of these overlapping responsibilities, there may be conflicts of interest among and reduced time commitments from our officers and the officers and employees of JAVELIN and our Manager that we will face in making investment decisions on behalf of ARMOUR. Accordingly, we will compete with both JAVELIN and ARRM, and their existing activities, other ventures and possibly other entities in the future for the time and attention of these officers.We cannot predict the impact of QE3 on the prices and liquidity of Agency Securities or other securities in which we invest, although the Federal Reserve action could increase the prices of our target assets and reduce the spread on our investments.On November 25, 2008, the Federal Reserve announced a program to purchase Agency Securities in the open market. The stated goal of this program was to provide support to mortgage and housing markets and to foster improved conditions in financial markets more generally. On March 18, 2009, this program was expanded to a target size of $1.25 trillion. The Federal Reserve completed this purchase program in March 2010. The Federal Reserve announced on November 3, 2010 that it intended to purchase an additional $600 billion of long-term securities by the end of the second quarter of 2011, at a pace of about $75 billion per month. On September 13, 2012, the Federal Reserve announced a program, popularly referred to as “QE3,” to purchase an additional $40 billion of Agency Securities per month until the unemployment rate and other economic indicators improve. QE3 plus its existing investment programs are expected to grow the Federal Reserve's Agency Securities holding by approximately $85 billion per month at least through the end of 2012. The Fed also extended through at least mid-2015 its plan to keep the Federal Funds Rate between zero and 0.25%. The Federal Reserve expects these measures will put downward pressure on long-term interest rates.While the Federal Reserve hopes that QE3 will expedite an economic recovery, stabilize prices, reduce unemployment and restart business and household spending, we cannot predict the long-term impact of these programs or any future actions by the Federal Reserve on the prices and liquidity of Agency Securities or other securities in which we invest. In the short term, the Federal Reserve's actions have driven Agency Securities prices to record highs, thereby compressing interest rate spreads and reducing the correlation between mortgage rates and rates on U.S. Treasuries and interest rate swaps. These factors have contributed to a challenging reinvestment and interest rate hedging environment.Failure to obtain and maintain an exemption from being regulated as a commodity pool operator could subject us to additional regulation and compliance requirements and may result in fines and other penalties which could materially adversely affect our business and financial condition.Recently adopted rules under the Dodd-Frank Act establish a comprehensive new regulatory framework for derivative contracts commonly referred to as “swaps.” Under these recently adopted rules, any investment fund that trades in swaps may be considered a “commodity pool,” which would cause its directors to be regulated as “commodity pool operators” ("CPOs"). Under the new rules, which become effective on October 12, 2012 for those who become CPOs solely because of their use of swaps, CPOs must register with the National Futures Association (the "NFA"), which requires compliance with NFA's rules, and are subject to regulation by the U.S. Commodity Futures Trading Commission (the “CFTC”) including with respect to disclosure, reporting, recordkeeping and business conduct.Our hedging strategies are designed to reduce the impact on our earnings caused by the potential adverse effects of changes in interest rates on our assets and liabilities. Subject to complying with REIT requirements, we use hedging techniques to limit the risk of adverse changes in interest rates on the value of our assets as well as the differences between the interest rate adjustments on our assets and borrowings. These techniques primarily consist of entering into interest rate swap contracts and purchasing or selling Futures Contracts and may also include entering into interest rate cap or floor agreements, purchasing put and call options on securities or securities underlying Futures Contracts, or entering into forward rate agreements. Although we are not legally limited to our use of hedging, we intend to limit our use of derivative instruments to only those techniques described above and to enter into derivative transactions only with counterparties that we believe have a strong credit rating to help limit the risk of counterparty default or insolvency. These transactions are not entered into for speculative purposes. We do not use these instruments for the purpose of trading in commodity interests, and we do not consider our company or its operations to be a commodity pool as to which CPO regulation or compliance is required. We, along with numerous other mortgage REITs, have submitted a no-action letter request to the CFTC seeking exemptive relief for our directors from CPO registration under these new rules. However, at this time, our directors do not intend to register as CPOs with the NFA. While we have reason to believe that the CFTC may provide us with exemptive relief prior to December 31, 2012, there can be no assurance that any such relief will be granted. If exemptive relief is granted, we may be restricted to operating within certain parameters discussed in the no-action letter we submitted to the CFTC. For example, exemptive relief might limit our ability to enter into interest rate hedging transactions if the amount of income we receive from such hedges will exceed five percent of our gross income or the initial margin and premiums for such hedges will exceed five percent of the fair market value of our total assets.The CFTC has substantial enforcement power with respect to violations of the laws over which it has jurisdiction, including their anti-fraud and anti-manipulation provisions. Among other things, CFTC may suspend or revoke the registration of a person who fails to comply, prohibit such a person from trading or doing business with registered entities, impose civil money penalties, require restitution and seek fines or imprisonment for criminal violations. Additionally, a private right of action exists against those who violate the laws over which CFTC has jurisdiction or who willfully aid, abet, counsel, induce or procure a violation of those laws. In the event we fail to receive exemptive relief from the CFTC on this matter and our directors fail to comply with the regulatory requirements of these new rules, we may be subject to significant fines, penalties and other civil or governmental actions or proceedings, any of which could have a materially adverse effect on our business, financial condition and results of operations.We cannot predict the impact, if any, on our earnings or cash available for distribution to our stockholders of the FHFA's proposed revisions to Fannie Mae's, Freddie Mac's and Ginnie Mae's existing infrastructures to align the standards and practices of the three entities.On February 21, 2012, the FHFA released itsStrategic Plan for Enterprise Conservatorships, which set forth three goals for the next phase of the Fannie Mae and Freddie Mac conservatorships. These three goals are to (i) build a new infrastructure for the secondary mortgage market, (ii) gradually contract Fannie Mae and Freddie Mac's presence in the marketplace while simplifying and shrinking their operations, and (iii) maintain foreclosure prevention activities and credit availability for new and refinanced mortgages. On October 4, 2012, the FHFA released its white paper entitledBuilding a New Infrastructure for the Secondary Mortgage Market, which proposes a new infrastructure for Fannie Mae and Freddie Mac that has two basic goals.The first such goal is to replace the current, outdated infrastructures of Fannie Mae and Freddie Mac with a common, more efficient infrastructure that aligns the standards and practices of the two entities, beginning with core functions performed by both entities such as issuance, master servicing, bond administration, collateral management and data integration. The second goal is to establish an operating framework for Fannie Mae and Freddie Mac that is consistent with the progress of housing finance reform and encourages and accommodates the increased participation of private capital in assuming credit risk associated with the secondary mortgage market.The FHFA recognizes that there are a number of impediments to their goals which may or may not be surmountable, such as the absence of any significant secondary mortgage market mechanisms beyond Fannie Mae, Freddie Mac and Ginnie Mae, and that their proposals are in the formative stages. As a result, it is unclear if the proposals will be enacted. If such proposals are enacted, it is unclear how closely what is enacted will resemble the proposals from the FHFA White Paper or what the effects of the enactment will be in terms of our net asset value, earnings or cash available for distribution to our stockholders.None.On October 30, 2012, our Board approved an amendment to our charter to increase our authorized shares of common stock from 500,000,000 shares to 1,000,000,000 shares and to increase our authorized shares of preferred stock from 25,000,000 shares to 50,000,000 shares. Pursuant to Maryland corporate law and Section 6.1 of our charter, the amendment was approved by our Board and did not require any action by our stockholders. Accordingly, our charter was amended effectively on October 31, 2012 to increase our authorized shares of common stock from 500,000,000 shares to 1,000,000,000 shares and to increase our authorized shares of preferred stock from 25,000,000 shares to 50,000,000 shares. A copy of the Articles of Amendment is attached hereto as Exhibit 3.3 and is incorporated herein by reference.SIGNATURESNovember 1, 2012Description3.1 3.1 Articles Supplementary classifying 6,000,0006,210,000 shares of ARMOUR Residential REIT, Inc.'s’s preferred stock into additional shares of 7.875% Series AB Cumulative Redeemable Preferred Stock (1)3.2 Articles Supplementary classifying 2,000,000 shares of ARMOUR Residential REIT, Inc.'s preferred stock into additional shares of Series A Cumulative Preferred Stock (2)3.3Articles of Amendment to the charter of ARMOUR Residential REIT, Inc. (3)31.1(3)(3) (3)(4)(4) (4)ARMOUR's Current report on Form 8-K filed with the SEC on July 13, 2012(2)Incorporated by reference to Exhibit 3.1 to ARMOUR'sARMOUR’s Current Report on Form 8-K filed with the SEC on July 27, 2012. (3) (4)42