Large Accelerated Filer XX. | Accelerated Filer . | |||
| Non-Accelerated Filer. (Do not check if a smaller reporting company) | Smaller Reporting Company. | |||
Emerging growth company. |
If an emerging growth company, indicate by check mark if the registrant has elected not to use the extended transition period for complying with any new or revised financial accounting standards provided pursuant to Section 13(a) of the Exchange Act. .
Indicate by check mark whether the registrant is a shell company (as defined in Rule 12b-2 of the Exchange Act).
Yes . NoXX.
Indicate the number of shares outstanding of each of the issuer’s classes of common stock, as of the latest practicable date.
Class | Shares Outstanding May 4, 2017 | |
Common stock, par value $0.25 per share | 395,992,936 |
EXPLANATORY NOTE
This Amendment No. 1 on Form 10-Q/A is being filed to amend the Hecla Mining Company and Subsidiaries
Quarterly Report on Form 10-Q
For for the Quarter Endedperiod ended March 31, 2017
PartI - Financial Information
Item1. Financial Statements
Hecla Mining Company and Subsidiaries
CondensedConsolidated Balance Sheets (Unaudited)
(In thousands, except shares)
March 31, 2017 | December 31, 2016 | |||||||
ASSETS | ||||||||
Current assets: | ||||||||
Cash and cash equivalents | $ | 176,786 | $ | 169,777 | ||||
Short-term investments | 36,505 | 29,117 | ||||||
Accounts receivable: | ||||||||
Trade | 17,210 | 20,082 | �� | |||||
Other, net | 22,234 | 9,967 | ||||||
Inventories: | ||||||||
Concentrates, doré, and stockpiled ore | 30,816 | 25,944 | ||||||
Materials and supplies | 23,348 | 24,079 | ||||||
Other current assets | 8,256 | 12,125 | ||||||
Total current assets | 315,155 | 291,091 | ||||||
Non-current investments | 5,104 | 5,002 | ||||||
Non-current restricted cash and investments | 2,200 | 2,200 | ||||||
Properties, plants, equipment and mineral interests, net | 2,032,983 | 2,032,685 | ||||||
Non-current deferred income taxes | 48,410 | 35,815 | ||||||
Other non-current assets | 2,609 | 4,884 | ||||||
Total assets | $ | 2,406,461 | $ | 2,371,677 | ||||
LIABILITIES | ||||||||
Current liabilities: | ||||||||
Accounts payable and accrued liabilities | $ | 51,739 | $ | 60,064 | ||||
Accrued payroll and related benefits | 38,554 | 36,515 | ||||||
Accrued taxes | 11,089 | 9,061 | ||||||
Current portion of capital leases | 5,647 | 5,653 | ||||||
Current portion of accrued reclamation and closure costs | 7,453 | 5,653 | ||||||
Current portion of debt | — | 470 | ||||||
Other current liabilities | 18,173 | 8,809 | ||||||
Total current liabilities | 132,655 | 126,225 | ||||||
Capital leases | 6,088 | 5,838 | ||||||
Accrued reclamation and closure costs | 79,334 | 79,927 | ||||||
Long-term debt | 501,292 | 500,979 | ||||||
Non-current deferred tax liability | 121,025 | 122,855 | ||||||
Non-current pension liability | 46,443 | 44,491 | ||||||
Other non-current liabilities | 5,321 | 11,518 | ||||||
Total liabilities | 892,158 | 891,833 | ||||||
Commitments and contingencies (Notes 2, 4, 7, 9, and 11) | ||||||||
STOCKHOLDERS’ EQUITY | ||||||||
Preferred stock, 5,000,000 shares authorized: | ||||||||
Series B preferred stock, $0.25 par value, 157,816 shares issued and outstanding, liquidation preference — $7,891 | 39 | 39 | ||||||
Common stock, $0.25 par value, 500,000,000 shares authorized; issued and outstanding 2017 — 395,825,410 shares and 2016 — 395,286,875 shares | 99,973 | 99,806 | ||||||
Capital surplus | 1,603,324 | 1,597,212 | ||||||
Accumulated deficit | (141,730 | ) | (167,437 | ) | ||||
Accumulated other comprehensive loss | (31,398 | ) | (34,602 | ) | ||||
Less treasury stock, at cost; 2017 - 4,085,599 and 2016 - 3,941,210 shares issued and held in treasury | (15,905 | ) | (15,174 | ) | ||||
Total stockholders’ equity | 1,514,303 | 1,479,844 | ||||||
Total liabilities and stockholders’ equity | $ | 2,406,461 | $ | 2,371,677 | ||||
The accompanying notes are an integral part of the interim condensed consolidated financial statements.
Hecla Mining Company and Subsidiaries
CondensedConsolidated Statements of Operations and Comprehensive Income (Loss) (Unaudited)
(Dollars and shares in thousands, except for per-share amounts)
Three Months Ended | ||||||||
March 31, 2017 | March 31, 2016 | |||||||
Sales of products | $ | 142,544 | $ | 131,017 | ||||
Cost of sales and other direct production costs | 78,676 | 74,320 | ||||||
Depreciation, depletion and amortization | 28,952 | 25,875 | ||||||
Total cost of sales | 107,628 | 100,195 | ||||||
Gross profit | 34,916 | 30,822 | ||||||
Other operating expenses: | ||||||||
General and administrative | 9,206 | 10,214 | ||||||
Exploration | 4,514 | 2,950 | ||||||
Pre-development | 1,252 | 404 | ||||||
Research and development | 683 | — | ||||||
Other operating expense | 690 | 640 | ||||||
Lucky Friday suspension-related costs | 1,581 | — | ||||||
Provision for closed operations and environmental matters | 1,119 | 1,041 | ||||||
Total other operating expense | 19,045 | 15,249 | ||||||
Income from operations | 15,871 | 15,573 | ||||||
Other income (expense): | ||||||||
Loss on disposal of investments | (167 | ) | — | |||||
Unrealized income (loss) on investments | 327 | (711 | ) | |||||
Loss on derivative contracts | (7,809 | ) | — | |||||
Net foreign exchange loss | (2,262 | ) | (8,203 | ) | ||||
Interest and other income | 325 | 88 | ||||||
Interest expense, net of amounts capitalized | (8,522 | ) | (5,711 | ) | ||||
Total other expense | (18,108 | ) | (14,537 | ) | ||||
(Loss) income before income taxes | (2,237 | ) | 1,036 | |||||
Income tax benefit (provision) | 29,071 | (1,654 | ) | |||||
Net income (loss) | 26,834 | (618 | ) | |||||
Preferred stock dividends | (138 | ) | (138 | ) | ||||
Income (loss) applicable to common stockholders | $ | 26,696 | $ | (756 | ) | |||
Comprehensive income: | ||||||||
Net income (loss) | $ | 26,834 | $ | (618 | ) | |||
Reclassification of disposal and impairment of investments included in net income | 167 | 1,000 | ||||||
Unrealized holding (losses) gains on investments | (256 | ) | 65 | |||||
Unrealized gain (loss) and amortization of prior service on pension plans | 32 | — | ||||||
Change in fair value of derivative contracts designated as hedge transactions | 3,261 | — | ||||||
Comprehensive income | $ | 30,038 | $ | 447 | ||||
Basic income per common share after preferred dividends | $ | 0.07 | $ | — | ||||
Diluted income per common share after preferred dividends | $ | 0.07 | $ | — | ||||
Weighted average number of common shares outstanding - basic | 395,370 | 379,022 | ||||||
Weighted average number of common shares outstanding - diluted | 398,149 | 379,022 | ||||||
The accompanying notes are an integral part of the interim condensed consolidated financial statements.
Hecla Mining Company and Subsidiaries
CondensedConsolidated Statements of Cash Flows (Unaudited)
(In thousands)
Three Months Ended | ||||||||
March 31, 2017 | March 31, 2016 | |||||||
Operating activities: | ||||||||
Net income (loss) | $ | 26,834 | $ | (618 | ) | |||
Non-cash elements included in net income (loss): | ||||||||
Depreciation, depletion and amortization | 29,590 | 26,153 | ||||||
Unrealized (gain) loss on investments | (327 | ) | 711 | |||||
Loss on disposal of investments | 167 | — | ||||||
Gain on disposition of properties, plants, equipment, and mineral interests | (32 | ) | (210 | ) | ||||
Provision for reclamation and closure costs | 1,026 | 999 | ||||||
Stock compensation | 1,349 | 1,231 | ||||||
Deferred income taxes | (21,234 | ) | 3,320 | |||||
Amortization of loan origination fees | 480 | 459 | ||||||
Loss on derivative contracts | 7,343 | 170 | ||||||
Foreign exchange loss | 506 | 7,989 | ||||||
Other non-cash gains, net | 2 | 6 | ||||||
Change in assets and liabilities: | ||||||||
Accounts receivable | (8,738 | ) | (20,036 | ) | ||||
Inventories | (3,358 | ) | (5,922 | ) | ||||
Other current and non-current assets | 1,363 | (619 | ) | |||||
Accounts payable and accrued liabilities | (1,510 | ) | 10,036 | |||||
Accrued payroll and related benefits | 6,881 | (2,826 | ) | |||||
Accrued taxes | 1,754 | (37 | ) | |||||
Accrued reclamation and closure costs and other non-current liabilities | (3,811 | ) | (2,058 | ) | ||||
Cash provided by operating activities | 38,285 | 18,748 | ||||||
Investing activities: | ||||||||
Additions to properties, plants, equipment and mineral interests | (21,658 | ) | (34,654 | ) | ||||
Proceeds from disposition of properties, plants and equipment | 61 | 215 | ||||||
Purchases of investments | (11,113 | ) | — | |||||
Maturities of investments | 3,634 | — | ||||||
Addition to restricted cash for environmental matters | — | (3,900 | ) | |||||
Net cash used in investing activities | (29,076 | ) | (38,339 | ) | ||||
Financing activities: | ||||||||
Proceeds from sale of common stock, net of offering costs | — | 2,052 | ||||||
Acquisition of treasury shares | (731 | ) | (1,256 | ) | ||||
Dividends paid to common stockholders | (989 | ) | (952 | ) | ||||
Dividends paid to preferred stockholders | (138 | ) | (138 | ) | ||||
Credit facility fees paid | (91 | ) | (59 | ) | ||||
Repayments of debt | (470 | ) | (664 | ) | ||||
Repayments of capital leases | (1,595 | ) | (2,118 | ) | ||||
Net cash used in financing activities | (4,014 | ) | (3,135 | ) | ||||
Effect of exchange rates on cash | 1,814 | 1,535 | ||||||
Net increase (decrease) in cash and cash equivalents | 7,009 | (21,191 | ) | |||||
Cash and cash equivalents at beginning of period | 169,777 | 155,209 | ||||||
Cash and cash equivalents at end of period | $ | 176,786 | $ | 134,018 | ||||
Significant non-cash investing and financing activities: | ||||||||
Addition of capital lease obligations | $ | 1,798 | $ | — | ||||
Payment of accrued compensation in stock | $ | 4,240 | $ | 5,511 | ||||
The accompanying notes are an integral part of the interim condensed consolidated financial statements.
Note1. Basis of Preparation of Financial Statements
In the opinion of management, the accompanying unaudited interim condensed consolidated financial statements and notes to the unaudited interim condensed consolidated financial statements contain all adjustments, consisting of normal recurring items and items which are nonrecurring, necessary to present fairly, in all material respects, the financial position of Hecla Mining Company and its consolidated subsidiaries ("Hecla" or "the Company" or “we” or “our” or “us” (“Form 10-Q”). These unaudited interim condensed consolidated financial statements should be read in conjunction with our audited consolidated financial statements and related footnotes, as set forth in our annual report filed on Form 10-K for the year ended December 31, 2016, as it may be amended from time to time.
The results of operations for the periods presented may not be indicative of those which may be expected for a full year. The unaudited interim condensed consolidated financial statements have been prepared pursuant to the rules and regulations ofwith the Securities and Exchange Commission ("SEC"). Certain information and footnote disclosures normally included in audited financial statements prepared in accordance with generally accepted accounting principles in the United States (“GAAP”) have been condensed or omitted pursuant to those rules and regulations, although we believe that the disclosures are adequate for the information not to be misleading.
The preparation of financial statements in conformity with GAAP requires management to make estimates and assumptions that affect the reported amounts of assets and liabilities as of the date of the financial statements, the reported amounts of revenues and expenses during the reporting period, and the disclosures of contingent liabilities. Accordingly, ultimate results could differ materially from those estimates.
Note 2. Investments and Restricted Cash
Investments
Our current investments, which are classified as "available for sale" and consist of bonds having maturities of greater than 90 days and less than 365 days, had a fair value of $36.5 million and $29.1 million, respectively, at March 31, 2017 and December 31, 2016. During the first quarter of 2017, we had purchases of such investments of $11.1 million and maturities of $3.6 million. We held no such investments during the first quarter of 2016. Our current investments at March 31, 2017 and December 31, 2016 consisted of the following:
March 31, 2017 | December 31, 2016 | |||||||||||||||||||||||
Amortized cost | Unrealized loss | Fair market value | Amortized cost | Unrealized loss | Fair market value | |||||||||||||||||||
Corporate bonds | $ | 30,077 | $ | (38 | ) | $ | 30,039 | $ | 22,100 | $ | (46 | ) | $ | 22,054 | ||||||||||
Municipal bonds | 3,138 | — | 3,138 | 3,727 | (1 | ) | 3,726 | |||||||||||||||||
Agency bonds | 3,331 | (3 | ) | 3,328 | 3,339 | (2 | ) | 3,337 | ||||||||||||||||
Total | $ | 36,546 | $ | (41 | ) | $ | 36,505 | $ | 29,166 | $ | (49 | ) | $ | 29,117 | ||||||||||
At March 31, 2017 and December 31, 2016, the fair value of our non-current investments was $5.1 million and $5.0 million, respectively. Our non-current investments consist of marketable equity securities which are carried at fair value, and are primarily classified as “available-for-sale.” The cost basis of our non-current investments was approximately $3.9 million and $4.1 million, respectively, at March 31, 2017 and December 31, 2016. In the first quarter of 2016, we recognized total impairment charges against earnings of $1.0 million, as we determined the impairments to be other-than-temporary.
Note 3. Income Taxes
Major components of our income tax provision for the three months ended March 31, 2017 and 2016 are as follows (in thousands):
Three Months Ended | ||||||||
March 31, | ||||||||
2017 | 2016 | |||||||
Current: | ||||||||
Domestic | $ | (12,797 | ) | $ | (2,506 | ) | ||
Foreign | 5,515 | 1,015 | ||||||
Total current income tax benefit | (7,282 | ) | (1,491 | ) | ||||
Deferred: | ||||||||
Domestic | (18,903 | ) | 588 | |||||
Foreign | (2,886 | ) | 2,557 | |||||
Total deferred income tax (benefit) provision | (21,789 | ) | 3,145 | |||||
Total income tax (benefit) provision | $ | (29,071 | ) | $ | 1,654 | |||
As of March 31, 2017, we have a net deferred tax asset in the U.S. of $48.4 million and a net deferred tax liability in Canada of $121.0 million, for a consolidated worldwide net deferred tax liability of $72.6 million. Our ability to utilize our deferred tax assets depends on future taxable income generated from operations and various tax planning strategies. In the first quarter of 2017, we received consent from the Internal Revenue Service to permit us to take a different income tax position relating to the timing of deductions for the #4 Shaft development costs at Lucky Friday. This tax accounting method change substantially revised the timing of deductions for these costs for regular tax and Alternative Minimum Tax ("AMT") relative to our projected life of mine and projected taxable income. These timing changes caused us to revise our assessment of the ability to generate sufficient future taxable income to realize our deferred tax assets, resulting in a valuation allowance release of approximately $15 million. At March 31, 2017 and December 31, 2016, the balances of the valuation allowances on our deferred tax assets were approximately $81 million and $100 million, respectively, primarily for net operating losses and tax credit carryforwards. The amount of the deferred tax asset considered recoverable, however, could be reduced in the near term if estimates of future taxable income are reduced.
The current income tax provisions for the three months ended March 31, 2017 and 2016 vary from the amounts that would have resulted from applying the statutory income tax rate to pre-tax income due primarily to the impact of the change in accounting method treatment of the #4 Shaft development costs described above, as well as the effects of percentage depletion and the impact of taxation in foreign jurisdictions.
Note 4. Commitments, Contingencies and Obligations
General
We follow GAAP guidance in determining our accruals and disclosures with respect to loss contingencies, and evaluate such accruals and contingencies for each reporting period. Accordingly, estimated losses from loss contingencies are accrued by a charge to income when information available prior to issuance of the financial statements indicates that it is probable that a liability could be incurred and the amount of the loss can be reasonably estimated. Legal expenses associated with the contingency are expensed as incurred. If a loss contingency is not probable or reasonably estimable, disclosure of the loss contingency is made in the financial statements when it is at least reasonably possible that a material loss could be incurred.
Rio Grande Silver Guaranty
Our wholly-owned subsidiary, Rio Grande Silver Inc. (“Rio”), is party to a joint venture with Emerald Mining & Leasing, LLC (“EML”) and certain other parties with respect to a land package in the Creede Mining District of Colorado that is adjacent to other land held by Rio. Rio holds a 70% interest in the joint venture. In connection with the joint venture, we are required to guarantee certain environmental remediation-related obligations of EML to a third party up to a maximum liability to us of $2.5 million. As of March 31, 2017, we have not been required to make any payments pursuant to the guaranty. We may be required to make payments in the future, limited to the $2.5 million maximum liability, should EML fail to meet its obligations to the third party. However, to the extent that any payments are made by us under the guaranty, EML, in addition to other parties, has jointly and severally agreed to reimburse and indemnify us for any such payments. We have not recorded a liability relating to the guaranty as of March 31, 2017.
Lucky Friday Water Permit Matters
Over the last several years the Lucky Friday unit has experienced several regulatory issues relating to its water discharge permits and water management more generally. In December 2013, the EPA issued to Hecla Limited a notice of violation (“2013 NOV”) alleging certain storm water reporting violations under Lucky Friday’s Clean Water Act Multi-Sector General Stormwater Permit for Industrial Activities. The alleged violations were resolved. The 2013 NOV also contained a request for information under Section 308 of the Clean Water Act directing Hecla Limited to undertake a comprehensive groundwater investigation of Lucky Friday’s tailings pond no. 3 to evaluate whether the pond is causing the discharge of pollutants via seepage to groundwater that is discharging to surface water.
We completed the investigation mandated by the EPA and submitted a draft report to the agency in December 2015. We are waiting for the EPA’s response and we cannot predict what the impact of the investigation will be.
Hecla Limited strives to maintain its water discharges at the Lucky Friday unit in full compliance with its permits and applicable laws, however, we cannot provide assurance that in the future it will be able to fully comply with the permit limits and other regulatory requirements regarding water management.
Johnny M Mine Area near San Mateo, McKinley County, New Mexico
In May 2011, the EPA made a formal request to Hecla Mining Company for information regarding the Johnny M Mine Area near San Mateo, McKinley County, New Mexico, and asserted that Hecla Mining Company may be responsible under CERCLA for environmental remediation and past costs the EPA has incurred at the site. Mining at the Johnny M was conducted for a limited period of time by a predecessor of our subsidiary, Hecla Limited. In August 2012, Hecla Limited and the EPA entered into a Settlement Agreement and Administrative Order on Consent for Removal Action (“Consent Order”), pursuant to which Hecla Limited agreed to pay (i) $1.1 million to the EPA for its past response costs at the site and (ii) any future response costs at the site under the Consent Order, in exchange for a covenant not to sue by the EPA. Hecla Limited paid the $1.1 million to the EPA for its past response costs and in December 2014, submitted to EPA the Engineering Evaluation and Cost Analysis (“EE/CA”) for the site. The EE/CA evaluates three alternative response actions: 1) no action, 2) off-site disposal, and 3) on-site disposal. The range in estimated costs of these alternatives is $0 to $221 million. In the EE/CA, Hecla Limited recommended that EPA approve on-site disposal, which is currently estimated to cost $5.6 million, on the basis that it is the most appropriate response action under CERCLA. In June 2015, the EPA approved the EE/CA, with a few minor conditions. The EPA still needs to publish the EE/CA for public notice and comment, and the agency will not make a final decision on the appropriate response action until the public comment process is complete. It is anticipated that Hecla Limited will implement the response action selected by the EPA pursuant to an amendment to the Consent Order or a new order. Based on the foregoing, we believe it is probable that Hecla Limited will incur a liability for remediation at the site, and our best estimate of that liability as of the date of this report is $5.6 million, and we have accrued that amount. There can be no assurance that Hecla Limited’s liability will not be more than $5.6 million, or that its ultimate liability will not have a material adverse effect on Hecla Limited’s or our results of operations or financial position.
In September 2016, Hecla Limited was served with a lawsuit filed by an individual in state court in New Mexico alleging personal injury claims of several millions of dollars arising from alleged exposure to contaminants as a result of allegedly living on land adjacent to the Johnny M Mine site. The case was subsequently removed to federal court in New Mexico, and Hecla Limited filed a motion to dismiss. We do not yet have enough information to conclude if Hecla Limited has any liability or to estimate any loss that it may incur.
Carpenter Snow Creek Site, Cascade County, Montana
In July 2010, the EPA made a formal request to Hecla Mining Company for information regarding the Carpenter Snow Creek Superfund Site located in Cascade County, Montana. The Carpenter Snow Creek Site is located in a historic mining district, and in the early 1980s Hecla Limited leased 6 mining claims and performed limited exploration activities at the site. Hecla Limited terminated the mining lease in 1988.
In June 2011, the EPA informed Hecla Limited that it believes Hecla Limited, among several other viable companies, may be liable for cleanup of the site or for costs incurred by the EPA in cleaning up the site. The EPA stated in the June 2011 letter that it has incurred approximately $4.5 million in response costs and estimated that total remediation costs may exceed $100 million. Hecla Limited cannot with reasonable certainty estimate the amount or range of liability, if any, relating to this matter because of, among other reasons, the lack of information concerning the site.
Senior Notes
On April 12, 2013, we completed an offering of $500 million aggregate principal amount of 6.875% Senior Notes due 2021. The net proceeds from the offering of the Senior Notes were used to partially fund the acquisition of Aurizon Mines Ltd. ("Aurizon") and for general corporate purposes, including expenses related to the Aurizon acquisition. Aurizon held our Casa Berardi mine and other interests in Quebec, Canada. In 2014, we completed additional issuances of our Senior Notes in the aggregate principal amount of $6.5 million, which were contributed to one of our pension plans to satisfy the funding requirement for 2014. Interest on the Senior Notes is payable on May 1 and November 1 of each year, commencing November 1, 2013. SeeNote 9 for more information.
Other Commitments
Our contractual obligations as of March 31,8, 2017, included approximately $1.8 million for various costs. In addition, our open purchase orders at March 31, 2017 included approximately $0.2 million, $2.1 million and $9.5 million, respectively, for various capital and non-capital items at the Lucky Friday, Casa Berardi and Greens Creek units. We also have total commitments of approximately $12.3 million relatingin order to scheduled payments on capital leases, including interest, primarily for equipment at our Greens Creek, Lucky Friday and Casa Berardi units (seeNote 9 for more information). As part of our ongoing business and operations, we are required to provide surety bonds, bank letters of credit, and restricted deposits for various purposes, including financial support for environmental reclamation obligations and workers compensation programs. As of March 31, 2017, we had surety bonds totaling $112.8 million in place as financial support for future reclamation and closure costs, self-insurance, and employee benefit plans. The obligations associated with these instruments are generally related to performance requirements that we address through ongoing operations. As the requirements are met, the beneficiary of the associated instruments cancels or returns the instrument to the issuing entity. Certain of these instruments are associated with operating sites with long-lived assets and will remain outstanding until closure of the sites. We believe we are in compliance with all applicable bonding requirements and will be able to satisfy future bonding requirements as they arise.
Other Contingencies
When we acquired Revett Mining Company, Inc. (now known as Hecla Montana, Inc.) in June 2015, it was the subject of a lawsuit filed in Montana state court by a former employee of its wholly owned subsidiary, Troy Mine, Inc., alleging that Revett was responsible for injuries he suffered while working for Troy Mine. The case is continuing with plaintiff claiming injuries totaling several millions of dollars. Although we are vigorously defending the suit, it is possible that Revett faces some liability in the case; however, we are unable to estimate the amount or range of any potential liability. Insurance is currently providing a defense to Revett, however there is no guarantee it would provide coverage for any losses incurred.
We also have certain other contingencies resulting from litigation, claims, EPA investigations, and other commitments and are subject to a variety of environmental and safety laws and regulations incident to the ordinary course of business. We currently expect that the resolution of such contingencies will not materially affect our financial position, results of operations or cash flows. However, in the future, there may be changes to these contingencies, or additional contingencies may occur, any of which might result in an accrual or a change in current accruals recorded by us, and there can be no assurance that their ultimate disposition will not have a material adverse effect on our financial position, results of operations or cash flows.
Note 5. Earnings (Loss) Per Common Share
We are authorized to issue 500,000,000 shares of common stock, $0.25 par value per share. At March 31, 2017, there were 399,911,009 shares of our common stock issued and 4,085,599 shares issued and held in treasury, for a net of 395,825,410 shares outstanding.
Diluted income (loss) per share for the three months ended March 31, 2017 and 2016 excludes the potential effects of outstanding shares of our convertible preferred stock, as their conversion would have no effect on the calculation of dilutive shares.
For the three months ended March 31, 2017, 2,735,569 restricted stock units that were unvested during the quarter and 727,262 in deferred shares were included in the calculation of diluted earnings (loss) per share. For the three-month period ended March 31, 2016, all outstanding restricted share units and warrants were excluded from the computation of diluted earnings (loss) per share, as our reported net loss for that period would cause their vesting and exercise to have no effect on the calculation of earnings (loss) per share. There were no warrants outstanding during the three months ended March 31, 2017.
Note 6. Business Segments
We are currently organized and managed in four segments, which represent our operating units: the Greens Creek unit, the Lucky Friday unit, the Casa Berardi unit, and the San Sebastian unit.
General corporate activities not associated with operating units and their various exploration activities, as well as discontinued operations and idle properties, are presented as “other.” Interest expense, interest income and income taxes are considered general corporate items, and are not allocated to our segments.
The following tables present information about reportable segments for the three months ended March 31, 2017 and 2016 (in thousands):
Three Months Ended March 31, | ||||||||
2017 | 2016 | |||||||
Net sales to unaffiliated customers: | ||||||||
Greens Creek | $ | 58,850 | $ | 53,882 | ||||
Lucky Friday | 20,010 | 21,252 | ||||||
Casa Berardi | 41,712 | 32,198 | ||||||
San Sebastian | 21,972 | 23,685 | ||||||
| $ | 142,544 | $ | 131,017 | |||||
Income (loss) from operations: | ||||||||
Greens Creek | $ | 14,114 | $ | 8,078 | ||||
Lucky Friday | 3,880 | 2,743 | ||||||
Casa Berardi | (2,245 | ) | 1,934 | |||||
San Sebastian | 13,454 | 14,912 | ||||||
Other | (13,332 | ) | (12,094 | ) | ||||
| $ | 15,871 | $ | 15,573 | |||||
The following table presents identifiable assets by reportable segment as of March 31, 2017 and December 31, 2016 (in thousands):
March 31, 2017 | December 31, 2016 | |||||||
Identifiable assets: | ||||||||
Greens Creek | $ | 681,266 | $ | 681,303 | ||||
Lucky Friday | 439,991 | 442,829 | ||||||
Casa Berardi | 804,886 | 806,044 | ||||||
San Sebastian | 47,561 | 33,608 | ||||||
Other | 432,757 | 407,893 | ||||||
| $ | 2,406,461 | $ | 2,371,677 | |||||
The sales and income (loss) from operations amounts reported above include results from our Lucky Friday segment. The Lucky Friday mine is our only operation where some of our employees are subject to a collective bargaining agreement, and the most recent agreement expired on April 30, 2016. On February 19, 2017, the unionized employees voted against our contract offer and on March 13, 2017 went on strike and have been on strike since that time. Production at the Lucky Friday has been suspended since the start of the strike. Costs related to care-and-maintenance of the mine during the strike period are reported in a separate line item on our condensed consolidated statement of operations and totaled $1.6 million in the first quarter of 2017. We cannot predict how long the strike will last or whether an agreement will be reached. As a result of the strike or other events related to labor at the Lucky Friday, operations at Lucky Friday could continue to be disrupted, which could adversely affect our financial condition and results of operations.
Note 7.Employee Benefit Plans
We sponsor defined benefit pension plans covering substantially all U.S. employees. Net periodic pension cost for the plans consisted of the following for the three months ended March 31, 2017 and 2016 (in thousands):
Three Months Ended March 31, | ||||||||
2017 | 2016 | |||||||
Service cost | $ | 1,196 | $ | 1,077 | ||||
Interest cost | 1,339 | 1,307 | ||||||
Expected return on plan assets | (1,462 | ) | (1,325 | ) | ||||
Amortization of prior service benefit | (84 | ) | (84 | ) | ||||
Amortization of net loss | 1,033 | 1,093 | ||||||
Net periodic benefit cost | $ | 2,022 | $ | 2,068 | ||||
In April 2017, we contributed $1.2 million in cash to our defined benefit plans, and expect to contribute an additional $2.8 million in cash or shares of our common stock to our defined benefit plans in 2017. We expect to contribute approximately $0.4 million to our unfunded supplemental executive retirement plan during 2017.
Note 8. Stockholders’ Equity
Stock-based Compensation Plans
We periodically grant restricted stock unit awards and/or shares of common stock to our employees and directors. We measure compensation cost for restricted stock units and stock grants at the closing price of our stock at the time of grant. Restricted stock unit grants vest after a specified period with compensation cost amortized over that period. Although we have no current plans to issue stock options, we may do so in the future.
In March 2017, the Board of Directors granted 641,406 shares of common stock to employees for payment of annual and long-term incentive compensation for the period ended December 31, 2016. The shares were distributed in March 2017, and $4.2 million in expense related to the stock awards was recognized in the periods prior to March 31, 2017.
Stock-based compensation expense for vesting restricted stock unit grants to employees and shares issued to nonemployee directors recorded in the first three months of 2017 totaled $1.3 million, compared to $1.2 million in the same period last year.
In connection with the vesting of restricted stock units and other stock grants, employees have in the past, at their election and when permitted by us, chosen to satisfy their minimum tax withholding obligations through net share settlement, pursuant to which the Company withholds the number of shares necessary to satisfy such withholding obligations. As a result, in the first three months of 2017 we withheld 154,933 shares valued at approximately $0.7 million, or approximately $4.67 per share. In the first three months of 2016 we withheld 532,157 shares valued at approximately $1.3 million, or approximately $2.36 per share.
Common Stock Dividends
In September 2011 and February 2012, our Board of Directors adopted a common stock dividend policy that has two components: (1) a dividend that links the amount of dividends on our common stock to our average quarterly realized silver price in the preceding quarter, and (2) a minimum annual dividend of $0.01 per share of common stock, in each case, payable quarterly, if and when declared. For illustrative purposes only, the table below summarizes potential per share dividend amounts at different quarterly average realized price levels according to the first component of the policy:
Quarterly average realized silver price per ounce | Quarterly dividend per share | Annualized dividend per share | ||||||||
| $30 | $0.01 | $0.04 | ||||||||
| $35 | $0.02 | $0.08 | ||||||||
| $40 | $0.03 | $0.12 | ||||||||
| $45 | $0.04 | $0.16 | ||||||||
| $50 | $0.05 | $0.20 | ||||||||
On May 4, 2017, our Board of Directors declared a common stock dividend, pursuant to the minimum annual dividend component of the policy described above, of $0.0025 per share, for a total dividend of approximately $1.0 million payable in June 2017. Because the average realized silver price for the first quarter of 2017 was $17.90 per ounce, below the minimum threshold of $30 according to the policy, no silver-price-linked component was declared or paid. The declaration and payment of common stock dividends is at the sole discretion of our Board of Directors.
At-The-Market Equity Distribution Agreement
Pursuant to an equity distribution agreement dated February 23, 2016, we may issue and sell shares of our common stock from time to time through ordinary broker transactions having an aggregate offering price of up to $75 million, with the net proceeds available for general corporate purposes. The terms of sales transactionscorrect data input errors contained under the agreement, including trading day(s), number of shares sold in the aggregate, number of shares sold per trading day, and the floor selling price per share, are proposed by us to the sales agent. Whether or not we engage in sales from time to time may depend on a variety of factors, including share price, our cash resources, customary black-out restrictions, and whether we have any material inside information. The agreement can be terminated by us at any time. The shares issued under the equity distribution agreement are registered under the Securities Act of 1933, as amended, pursuant to our shelf registration statement on Form S-3, which was filed with the SEC on February 23, 2016. As of March 31, 2017, we had sold 2,780,087 shares under the agreement for total proceeds of approximately $8.1 million, net of commissions of approximately $166 thousand.
Common Stock Repurchase Program
On May 8, 2012, we announced that our Board of Directors approved a stock repurchase program. Under the program, we are authorized to repurchase up to 20 million shares of our outstanding common stock from time to time in open market or privately negotiated transactions, depending on prevailing market conditions and other factors. The repurchase program may be modified, suspended or discontinued by us at any time. Whether or not we engage in repurchases from time to time may depend on a variety of factors, including not only price and cash resources, but customary black-out restrictions, whether we have any material inside information, limitations on share repurchases or cash usage that may be imposed by our credit agreement or in connection with issuances of securities, alternative uses for cash, applicable law, and other investment opportunities from time to time. As of March 31, 2017, 934,100 shares have been purchased at an average price of $3.99 per share, leaving approximately 19.1 million shares that may yet be purchased under the program. The closing price of our common stock at May 4, 2017, was $5.14 per share.
Note 9. Senior Notes, Credit Facilities and Capital Leases
Senior Notes
On April 12, 2013, we completed an offering of $500 million in aggregate principal amount of our Senior Notes due May 1, 2021 in a private placement conducted pursuant to Rule 144A and Regulation S under the Securities Act of 1933, as amended, and in 2014, an additional $6.5 million aggregate principal amount of the Senior Notes were issued to one of our pension plans. The Senior Notes were subsequently exchanged for substantially identical Senior Notes registered with the SEC. The Senior Notes are governed by the Indenture, dated as of April 12, 2013, as amended (the "Indenture"), among Hecla Mining Company ("Hecla") and certain of our subsidiaries and The Bank of New York Mellon Trust Company, N.A., as trustee. The net proceeds from the initial offering of the Senior Notes ($490 million) were used to partially fund the acquisition of Aurizon and for general corporate purposes, including expenses related to the Aurizon acquisition.
The Senior Notes are recorded net of a 2% initial purchaser discount totaling $10 million at the time of the April 2013 issuance and having an unamortized balance of $5.2 million as of March 31, 2017. The Senior Notes bear interest at a rate of 6.875% per year from the date of original issuance or from the most recent payment date on which interest has been paid or provided for. Interest on the Senior Notes is payable on May 1 and November 1 of each year, commencing November 1, 2013. During the three months ended March 31, 2017 and 2016, interest expense related to the Senior Notes and amortization of the initial purchaser discount and fees related to the issuance of the Senior Notes totaled $8.1 million and $5.2 million, respectively. The interest expense related to the Senior Notes for the three months ended March 31, 2017 and 2016 was net of $0.9 million and $3.8 million, respectively, in capitalized interest, primarily related to the #4 Shaft project at our Lucky Friday unit which was completed in January 2017.
The Senior Notes are guaranteed on a senior unsecured basis by certain of our subsidiaries (the "Guarantors"). The Senior Notes and the guarantees are, respectively, Hecla's and the Guarantors' general senior unsecured obligations and are subordinated to all of Hecla's and the Guarantors' existing and future secured debt to the extent of the assets securing that secured debt. In addition, the Senior Notes are effectively subordinated to all of the liabilities of Hecla's subsidiaries that are not guaranteeing the Senior Notes, to the extent of the assets of those subsidiaries.
The Senior Notes became redeemable in whole or in part, at any time and from time to time after May 1, 2016, on the redemption dates and at the redemption prices specified in the Indenture, plus accrued and unpaid interest, if any, to the date of redemption.
Upon the occurrence of a change of control (as defined in the Indenture), each holder of Senior Notes will have the right to require us to purchase all or a portion of such holder's Senior Notes pursuant to a change of control offer (as defined in the Indenture), at a purchase price equal to 101% of the principal amount thereof plus accrued and unpaid interest, if any, to the date of purchase, subject to the rights of holders of the Senior Notes on the relevant record date to receive interest due on the relevant interest payment date.
Credit Facilities
In May 2016, we entered into a $100 million senior secured revolving credit facility with a three year term. The credit facility is collateralized by the shares of common stock held in our material domestic subsidiaries and by our joint venture interests in the Greens Creek mine, all of our rights and interests in the joint venture agreement, and all of our rights and interests in the assets of the joint venture. This credit facility replaced our previous $100 million credit facility which had the same terms of collateral as described above. Below is information on the interest rates, standby fee, and financial covenant terms under our current credit facility:
Interest rates: | ||||||
Spread over the London Interbank Offer Rate | 2.25 | - | 3.25% | |||
Spread over alternative base rate | 1.25 | - | 2.25% | |||
Standby fee per annum on undrawn amounts | 0.50% | |||||
Covenant financial ratios: | ||||||
Senior leverage ratio (debt secured by liens/EBITDA) | not more than 2.50:1 | |||||
Leverage ratio (total debt less unencumbered cash/EBITDA)(1) | not more than 4.00:1 | |||||
Interest coverage ratio (EBITDA/interest expense) | not more than 3.00:1 | |||||
(1) The leverage ratio was amended for to be 5.00:1 for 2016, and reverted back to 4.00:1 effective January 1, 2017.
We are also able to obtain letters of credit under the facility, and for any such letters we are required to pay a participation fee of between 2.25% and 3.25% based on our total leverage ratio, as well as a fronting fee to each issuing bank of 0.20% annually on the average daily dollar amount of any outstanding letters of credit. There were $2.6 million in letters of credit outstanding as of March 31, 2017.
We believe we were substantially in compliance with all covenants under the credit agreement and no amounts were outstanding as of March 31, 2017. We have not drawn funds on the current revolving credit facility as of the filing date of this report.
Capital Leases
We have entered into various lease agreements, primarily for equipment at our Greens Creek, Lucky Friday and Casa Berardi units, which we have determined to be capital leases. At March 31, 2017, the total liability associated with the capital leases, including certain purchase option amounts, was $11.7 million, with $5.6 million of the liability classified as current and $6.1 million classified as non-current. At December 31, 2016, the total liability balance associated with capital leases was $11.5 million, with $5.7 million of the liability classified as current and $5.8 million classified as non-current. The total obligation for future minimum lease payments was $12.3 million at March 31, 2017, with $0.6 million attributed to interest.
At March 31, 2017, the annual maturities of capital lease commitments, including interest, were (in thousands):
Twelve-month period ending March 31, | ||||
2018 | $ | 5,988 | ||
2019 | 3,946 | |||
2020 | 1,771 | |||
2021 | 604 | |||
Total | 12,309 | |||
Less: imputed interest | (585 | ) | ||
Net capital lease obligation | $ | 11,724 |
Note 10. Developments in Accounting Pronouncements
In May 2014, the Financial Accounting Standards Board ("FASB") issued Accounting Standards Update ("ASU") No. 2014-09 Revenue Recognition, replacing guidance currently codified in Subtopic 605-10 Revenue Recognition-Overall with various SEC Staff Accounting Bulletins providing interpretive guidance. The new ASU establishes a new five step principle-based framework in an effort to significantly enhance comparability of revenue recognition practices across entities, industries, jurisdictions, and capital markets. In August 2015, the FASB issued ASU No. 2015-14 Revenue from Contracts with Customers (Topic 606): Deferral of the Effective Date. ASU No. 2015-14 defers the effective date of ASU No. 2014-09 until annual and interim reporting periods beginning after December 15, 2017.
We have performed a preliminary assessment of the impact of implementation of ASU No. 2014-09, and do not believe it will change the timing of revenue recognition or amounts of revenue recognized compared to how we recognize revenue under our current policies. Our revenues involve a relatively limited number of types of contracts and customers. In addition, our revenue contracts do not involve multiple types of performance obligations. Revenues from doré are recognized, and the transaction price is known, at the time the metals sold are delivered to the customer. Concentrate revenues are generally recognized at the time of shipment. Concentrates sold at our Lucky Friday unit typically leave the mine and are received by the customer within the same day. There is a period of time between shipment of concentrates from our Greens Creek unit and their physical receipt by the customer. However, based on our assessment, we believe control of the concentrate parcels is generally obtained by the customer at the time of shipment.
Our concentrate sales involve variable consideration, as they are subject to changes in metals prices between the time of shipment and their final settlement. However, we are able to reasonably estimate the transaction price for the concentrate sales at the time of shipment using forward prices for the month of settlement, and we then adjust the values each period until final settlement. Also, it is unlikely a significant reversal of revenue for any one concentrate parcel will occur.
During 2017, we plan to finalize our assessment of the impact of ASU No. 2014-09 on our revenue recognition, and assess the additional disclosure requirements under the new guidance.
In July 2015, the FASB issued ASU No. 2015-11 Inventory (Topic 330): Simplifying the Measurement of Inventory. The update provides for inventory to be measured at the lower of cost and net realizable value, and is effective for fiscal years beginning after December 15, 2016. This update did not have a material impact on our consolidated financial statements.
In November 2015, the FASB issued ASU No. 2015-17 Income Taxes - Balance Sheet Classification of Deferred Taxes (Topic 740). The update is designed to reduce complexity of reporting deferred income tax liabilities and assets into current and non-current amounts in a statement of financial position. ASU No. 2015-17 requires the presentation of deferred income taxes, changes to deferred tax liabilities and assets be classified as non-current in the statement of financial position. The update is effective for fiscal years beginning after December 15, 2016. We have elected to implement ASU No. 2015-17 retrospectively, and our deferred tax asset and liability balances are classified as non-current. Deferred tax assets of $12.3 million and deferred tax liabilities of $1.3 million previously classified as current as of December 31, 2016 are now classified as non-current on our condensed consolidated balance sheet.
In January 2016, the FASB issued ASU No. 2016-01 Financial Instruments - Overall (Subtopic 825-10): Recognition and Measurement of Financial Assets and Financial Liabilities. The guidance requires entities to measure equity investments that are not accounted for under the equity method at fair value, with any changes in fair value included in current earnings, and updates certain disclosure requirements. The update is effective for fiscal years beginning after December 15, 2017. We are currently evaluating the impact of implementing this update on our consolidated financial statements. At March 31, 2017, we had net unrealized gains of $1.1 million related to equity investments included in accumulated other comprehensive loss.
In February 2016, the FASB issued ASU No. 2016-02 Leases (Topic 842). The update modifies the classification criteria and requires lessees to recognize the assets and liabilities on the balance sheet for most leases. The update is effective for fiscal years beginning after December 15, 2018, with early adoption permitted. We are currently evaluating the impact of implementing this update on our consolidated financial statements.
In March 2016, the FASB issued ASU No. 2016-09 Compensation - Stock Compensation (Topic 718): Improvements to Employee Share-Based Payment Accounting. The update simplifies the accounting for stock-based compensation, including income tax consequences and balance sheet and cash flow statement classification of awards. The update is effective for fiscal years beginning after December 15, 2016. This update has not had a material impact on our consolidated financial statements.
In August 2016, the FASB issued ASU No. 2016-15 Statement of Cash Flows (Topic 230): Classification of Certain Cash Receipts and Cash Payments. The update provides guidance on classification for cash receipts and payments related to eight specific issues. The update is effective for fiscal years beginning after December 15, 2017, and interim periods within those fiscal years, with early adoption permitted. We are currently evaluating the potential impact of implementing this update on our consolidated financial statements.
In November 2016, the FASB issued ASU No. 2016-18 Statement of Cash Flows (Topic 230): Restricted Cash. The update requires that a statement of cash flows explain the change during the period in the total of cash, cash equivalents, and amounts generally described as restricted cash or restricted cash equivalents. The update is effective for fiscal years beginning after December 15, 2017, and interim periods within those fiscal years, with early adoption permitted. We are currently evaluating the potential impact of implementing this update on our consolidated financial statements.
In January 2017, the FASB issued ASU No. 2017-01 Business Combinations (Topic 805): Clarifying the Definition of a Business. The update clarifies the definition of a business with the objective of adding guidance to assist entities with evaluating whether transactions should be accounted for as acquisitions (or disposals) of assets or businesses. The update is effective for fiscal years beginning after December 15, 2017, and interim periods within those fiscal years. We will apply the provisions of the update to potential future acquisitions occurring after the effective date.
In March 2017, the FASB issued ASU No. 2107-07 Compensation - Retirement Benefits (Topic 715): Improving the Presentation of Net Periodic Pension Cost and Net Period Postretirement Benefit Cost. The update provides specific requirements for classification and disclosure regarding the service cost component and other components of net benefit cost related to pension plans. The update is effective for fiscal years beginning after December 15, 2017, and interim periods within those fiscal years. We are currently evaluating the potential impact of implementing this update on our consolidated financial statements.
Note 11. Derivative Instruments
Foreign Currency
Our wholly-owned subsidiaries owning the Casa Berardi and San Sebastian mines are U.S. dollar ("USD")-functional entities which routinely incur expenses denominated in Canadian dollar ("CAD") and Mexican peso ("MXN"), and such expenses expose us to exchange rate fluctuations between the USD and CAD and MXN. In April 2016, we initiated a program to manage our exposure to fluctuations in the exchange rate between the USD and CAD and the impact on our future operating costs denominated in CAD. In October 2016, we also initiated a program to manage our exposure to the impact of fluctuations in the exchange rate between the USD and MXN on our future operating costs denominated in MXN. The programs utilize forward contracts to buy CAD and MXN, and each contract is designated as a cash flow hedge. As of March 31, 2017, we have 118 forward contracts outstanding to buy CAD$260.1 million having a notional amount of USD$200.0 million, and 18 forward contracts outstanding to buy MXN$150.0 million having a notional amount of USD$7.6 million. The CAD contracts represent between approximately 20% and 75% of our annual forecasted cash operating costs at Casa Berardi from 2017 through 2020 and have CAD-to-USD exchange rates ranging between 1.2787 and 1.3380. The MXN contracts represent approximately 75% of our forecasted cash operating costs at San Sebastian for 2017 and have MXN-to-USD exchange rates ranging between 19.1956 and 21.0000. Our risk management policy allows for up to 75% of our planned cost exposure for five years into the future to be hedged under such programs, and for potential additional programs to manage other foreign currency-related exposure areas.
As of March 31, 2017, we recorded the following balances for the fair value of the contracts:
a current asset of $0.2 million, which is included in other current assets;
a non-current asset of $0.1 million, which is included in other non-current assets;
a current liability of $1.6 million, which is included in other current liabilities, and
a non-current liability of $1.2 million, which is included in other non-current liabilities.
Net unrealized losses of approximately $2.0 million related to the effective portion of the hedges were included in accumulated other comprehensive income as of March 31, 2017, and are net of related deferred taxes. Unrealized gains and losses will be transferred from accumulated other comprehensive loss to current earnings as the underlying operating expenses are recognized. We estimate approximately $1.4 million in net unrealized losses included in accumulated other comprehensive income as of March 31, 2017 would be reclassified to current earnings in the next twelve months. Net realized losses of approximately $0.1 million on contracts related to underlying expenses which have been recognized were transferred from accumulated other comprehensive loss and included in cost of sales and other direct production costs for the three months ended March 31, 2017. Net unrealized gains of approximately $10 thousand related to ineffectiveness of the hedges were included in gain (loss) on derivatives contracts on our consolidated statements of operations and comprehensive income (loss) for the three months ended March 31, 2017.
Metals Prices
At times, we may use commodity forward sales commitments, commodity swap contracts and commodity put and call option contracts to manage our exposure to fluctuation in the prices of certain metals that we produce. Contract positions are designed to ensure that we will receive a defined minimum price for certain quantities of our production, thereby partially offsetting our exposure to fluctuations in the market. Our risk management policy allows for up to 75% of our planned metals price exposure for five years into the future, with certain other limitations, to be hedged under such programs. These instruments do, however, expose us to (i) credit risk in the event of non-performance by counterparties for contracts in which the contract price exceeds the spot price of a commodity and (ii) price risk to the extent that the spot price exceeds the contract price for quantities of our production covered under contract positions.
We are currently using financially-settled forward contracts to manage the exposure to changes in prices of silver, gold, zinc and lead contained in our concentrate shipments between the time of shipment and final settlement. In addition, we currently use financially-settled forward contracts to manage the exposure to changes in prices of zinc and lead (but not silver and gold) contained in our forecasted future concentrate shipments. These contracts are not designated as hedges and are marked-to-market through earnings each period.
As of March 31, 2017, we recorded the following balances for the fair value of the contracts:
a current asset of $0.2 million, which is included in other current assets;
a current liability of $2.0 million, which is included in other current liabilities and is net of $0.7 million for contracts in a fair value current asset position; and
a non-current liability of $0.4 million, which is included in other non-current liabilities and is net of $0.2 million for contracts in a fair value non-current asset position.
We recognized a $4.1 million net loss during the first quarter of 2017 on the contracts utilized to manage exposure to prices of metals in our concentrate shipments, which is included in sales of products. The net loss recognized on the contracts offsets gains related to price adjustments on our provisional concentrate sales due to changes to silver, gold, lead and zinc prices between the time of sale and final settlement.
We recognized a $7.8 million net loss during the first quarter of 2017 on the contracts utilized to manage exposure to prices for forecasted future concentrate shipments. The net loss on these contracts is included as a separate line item under other income (expense), as they relate to forecasted future shipments, as opposed to sales that have already taken place but are subject to final pricing as discussed in the preceding paragraph. The net loss for the first quarter of 2017 is the result of increasing zinc and lead prices. This program, when utilized, is designed to mitigate the impact of potential future declines in lead and zinc prices from the price levels established in the contracts (see average price information below).
The following tables summarize the quantities of metals committed under forward sales contracts at March 31, 2017 and December 31, 2016:
March 31, 2017 | Ounces/pounds under contract (in 000's) | Average price per ounce/pound | ||||||||||||||||||||||||||||||
Silver | Gold | Zinc | Lead | Silver | Gold | Zinc | Lead | |||||||||||||||||||||||||
(ounces) | (ounces) | (pounds) | (pounds) | (ounces) | (ounces) | (pounds) | (pounds) | |||||||||||||||||||||||||
Contracts on provisional sales | ||||||||||||||||||||||||||||||||
2017 settlements | 1,455 | 6 | 20,999 | 4,079 | $ | 18.10 | $ | 1,245 | $ | 1.27 | $ | 1.03 | ||||||||||||||||||||
Contracts on forecasted sales | ||||||||||||||||||||||||||||||||
2017 settlements | — | — | 17,527 | 11,133 | N/A | N/A | $ | 1.23 | $ | 1.05 | ||||||||||||||||||||||
2018 settlements | — | — | 20,613 | 9,700 | N/A | N/A | $ | 1.23 | $ | 1.06 | ||||||||||||||||||||||
2019 settlements | — | — | 1,102 | — | N/A | N/A | $ | 1.21 | N/A | |||||||||||||||||||||||
December 31, 2016 | Ounces/pounds under contract (in 000's) | Average price per ounce/pound | ||||||||||||||||||||||||||||||
Silver | Gold | Zinc | Lead | Silver | Gold | Zinc | Lead | |||||||||||||||||||||||||
(ounces) | (ounces) | (pounds) | (pounds) | (ounces) | (ounces) | (pounds) | (pounds) | |||||||||||||||||||||||||
Contracts on provisional sales | ||||||||||||||||||||||||||||||||
2017 settlements | 1,295 | 4 | 19,070 | 7,441 | $ | 16.29 | $ | 1,172 | $ | 1.18 | $ | 0.97 | ||||||||||||||||||||
Contracts on forecasted sales | ||||||||||||||||||||||||||||||||
2017 settlements | — | — | 35,384 | 17,637 | N/A | N/A | $ | 1.19 | $ | 1.03 | ||||||||||||||||||||||
2018 settlements | — | — | 13,779 | 5,732 | N/A | N/A | $ | 1.21 | $ | 1.05 | ||||||||||||||||||||||
Our concentrate sales are based on a provisional sales price containing an embedded derivative that is required to be separated from the host contract for accounting purposes. The host contract is the receivable from the sale of the concentrates at the forward price at the time of the sale. The embedded derivative, which results from changes to silver, gold, lead and zinc prices between the time of sale and final settlement, does not qualify for hedge accounting and is marked-to-market through earnings each period prior to final settlement.
Credit-risk-related Contingent Features
Certain of our derivative contracts contain cross default provisions which provide that a default under our revolving credit agreement would cause a default under the derivative contracts. As of March 31, 2017, we have not posted any collateral related to these agreements. The fair value of derivatives in a net liability position, which includes accrued interest but excludes any adjustment for nonperformance risk, related to these agreements was $5.9 million as of March 31, 2017. If we had breached any of these provisions at March 31, 2017, we could have been required to settle our obligations under the agreements at their termination value of approximately $5.9 million.
Note 12. Fair Value Measurement
The table below sets forth our assets and liabilities that were accounted for at fair value on a recurring basis and the fair value calculation input hierarchy level that we have determined applies to each asset and liability category (in thousands).
Description | Balance at March 31, 2017 | Balance at December 31, 2016 | Input Hierarchy Level | ||||||
Assets: | |||||||||
Cash and cash equivalents: | |||||||||
Money market funds and other bank deposits | $ | 176,786 | $ | 169,777 | Level 1 | ||||
Available for sale securities: | |||||||||
Debt securities – municipal and corporate bonds | 36,505 | 29,117 | Level 2 | ||||||
Equity securities – mining industry | 5,104 | 5,002 | Level 1 | ||||||
Trade accounts receivable: | |||||||||
Receivables from provisional concentrate sales | 17,210 | 20,082 | Level 2 | ||||||
Restricted cash balances: | |||||||||
Certificates of deposit and other bank deposits | 2,200 | 2,200 | Level 1 | ||||||
Derivative contracts: | |||||||||
Metal forward contracts | 254 | 5,403 | Level 2 | ||||||
Foreign exchange contracts | 364 | 27 | Level 2 | ||||||
Total assets | $ | 238,423 | $ | 231,608 | |||||
Liabilities: | |||||||||
Derivative contracts: | |||||||||
Metal forward contracts | $ | 2,386 | $ | 192 | Level 2 | ||||
Foreign exchange contracts | 2,723 | 5,288 | Level 2 | ||||||
Total Liabilities | $ | 5,109 | $ | 5,480 | |||||
Cash and cash equivalents consist primarily of money market funds and are valued at cost, which approximates fair value, and a small portion consists of municipal bonds having maturities of less than 90 days, which are recorded at fair value.
Current available-for-sale securities consist of municipal and corporate bonds having maturities of more than 90 days, which are recorded at fair value.
Current and non-current restricted cash balances consist primarily of certificates of deposit, U.S. Treasury securities, and other deposits and are valued at cost, which approximates fair value.
Our non-current available for sale securities consist of marketable equity securities of companies in the mining industry which are valued using quoted market prices for each security.
Trade accounts receivable include amounts due to us for shipments of concentrates, doré and precipitate sold to customers. Revenues and the corresponding accounts receivable for sales of metals products are recorded when title and risk of loss transfer to the customer (generally at the time of ship loading, or at the time of customer arrival for trucked products). Sales of concentrates are recorded using estimated forward prices for the anticipated month of settlement applied to our estimate of payable metal quantities contained in each shipment. Sales are recorded net of estimated treatment and refining charges, which are also impacted by changes in metals prices and quantities of contained metals. We estimate the prices at which sales of our concentrates will be settled due to the time elapsed between shipment and final settlement with the customer. Receivables for previously recorded concentrate sales are adjusted to reflect estimated forward metals prices at the end of each period until final settlement by the customer. We obtain the forward metals prices used each period from a pricing service. Changes in metal prices between shipment and final settlement result in changes to revenues previously recorded upon shipment. The embedded derivative contained in our concentrate sales is adjusted to fair market value through earnings each period prior to final settlement.
We use financially-settled forward contracts to manage exposure to changes in the exchange rate between the U.S. dollar and Canadian dollar and Mexican peso, and the impact on Canadian dollar and Mexican peso denominated operating costs incurred at our Casa Berardi and San Sebastian units (seeNote 11 for more information). These contracts qualify for hedge accounting, with unrealized gains and losses related to the effective portion of the contracts included in accumulated other comprehensive loss, and unrealized gains and losses related to the ineffective portion of the contracts included in earnings each period. The fair value of each contract represents the present value of the difference between the forward exchange rate for the contract settlement period as of the measurement date and the contract settlement exchange rate.
We use financially-settled forward contracts to manage the exposure to changes in prices of silver, gold, zinc and lead contained in our concentrate shipments that have not reached final settlement. We also use financially-settled forward contracts to manage the exposure to changes in prices of zinc and lead contained in our forecasted future concentrate shipments (seeNote 11 for more information). These contracts do not qualify for hedge accounting, and are marked-to-market through earnings each period. The fair value of each contract represents the present value of the difference between the forward metal price for the contract settlement period as of the measurement date and the contract settlement metal price.
Our Senior Notes issued in April 2013, which were recorded at their carrying value of $501.3 million, net of unamortized initial purchaser discount at March 31, 2017, had a fair value of $509.1 million at March 31, 2017. Quoted market prices, which we consider to be Level 1 inputs, are utilized to estimate fair values of the Senior Notes. SeeNote 9 for more information.
Note 13. Guarantor Subsidiaries
Presented below are Hecla’s unaudited interim condensed consolidating financial statements as required by Rule 3-10 of Regulation S-X of the Securities Exchange Act of 1934, as amended, resulting from the guarantees by certain of Hecla's subsidiaries (the "Guarantors") of the Senior Notes (seeNote 9 for more information). The Guarantors consist of the following of Hecla's 100%-owned subsidiaries: Hecla Limited; Silver Hunter Mining Company; Rio Grande Silver, Inc.; Hecla MC Subsidiary, LLC; Hecla Silver Valley, Inc.; Burke Trading, Inc.; Hecla Montana, Inc.; Revett Silver Company; RC Resources, Inc.; Troy Mine Inc.; Revett Exploration, Inc.; Revett Holdings, Inc.; Mines Management, Inc.; Newhi Corp.; Montanore Minerals Corp.; Hecla Alaska LLC; Hecla Greens Creek Mining Company; Hecla Admiralty Company; and Hecla Juneau Mining Company. We completed the initial offering of the Senior Notes on April 12, 2013, and a related exchange offer for virtually identical notes registered with the SEC on January 3, 2014.
The unaudited interim condensed consolidating financial statements below have been prepared from our financial information on the same basis of accounting as the unaudited interim condensed consolidated financial statements set forth elsewhere in this report. Investments in the subsidiaries are accounted for under the equity method. Accordingly, the entries necessary to consolidate Hecla, the Guarantors, and our non-guarantor subsidiaries are reflected in the intercompany eliminations column. In the course of preparing consolidated financial statements, we eliminate the effects of various transactions conducted between Hecla and its subsidiaries and among the subsidiaries. While valid at an individual subsidiary level, such activities are eliminated in consolidation because, when taken as a whole, they do not represent business activity with third-party customers, vendors, and other parties. Examples of such eliminations include the following:
|
|
|
|
|
|
|
|
|
|
Separate financial statements of the Guarantors are not presented because the guarantees by the Guarantors are joint and several and full and unconditional, except for certain customary release provisions, including: (1) the sale or disposal of all or substantially all of the assets of the Guarantor; (2) the sale or other disposition of the capital stock of the Guarantor; (3) the Guarantor is designated as an unrestricted entity in accordance with the applicable provisions of the indenture; (4) Hecla ceases to be a borrower as defined in the indenture; and (5) upon legal or covenant defeasance or satisfaction and discharge of the indenture.
Effective December 31, 2015, Hecla Limited (our wholly owned subsidiary) sold 100% of its ownership of Hecla Alaska LLC (its wholly owned subsidiary) to Hecla Mining Company for consideration totaling approximately $240.8 million. The consideration consisted of satisfaction of inter-company debt between Hecla Limited and Hecla Mining Company and an obligation by Hecla Mining Company, under certain circumstances, to fund a limited amount of the capital requirements of Hecla Limited for up to five years. Hecla Alaska LLC owns a 29.7331% interest in the joint venture which owns the Greens Creek mine. The presentation of unaudited interim condensed consolidating financial statements below reflects the effective date for accounting purposes of January 1, 2016.
Unaudited Interim Condensed Consolidating Balance Sheets
As of March 31, 2017 | ||||||||||||||||||||
Parent | Guarantors | Non-Guarantors | Eliminations | Consolidated | ||||||||||||||||
(in thousands) | ||||||||||||||||||||
Assets | ||||||||||||||||||||
Cash and cash equivalents | $ | 104,526 | $ | 29,783 | $ | 42,477 | $ | — | $ | 176,786 | ||||||||||
Other current assets | 49,158 | 51,092 | 38,693 | (574 | ) | 138,369 | ||||||||||||||
Properties, plants, and equipment - net | 2,031 | 1,259,079 | 771,873 | — | 2,032,983 | |||||||||||||||
Intercompany receivable (payable) | 453,210 | (243,979 | ) | (314,308 | ) | 105,077 | — | |||||||||||||
Investments in subsidiaries | 1,499,401 | — | — | (1,499,401 | ) | — | ||||||||||||||
Other non-current assets | 1,761 | 188,815 | 5,534 | (137,787 | ) | 58,323 | ||||||||||||||
Total assets | $ | 2,110,087 | $ | 1,284,790 | $ | 544,269 | $ | (1,532,685 | ) | $ | 2,406,461 | |||||||||
Liabilities and Stockholders' Equity | ||||||||||||||||||||
Current liabilities | $ | 47,831 | $ | 52,762 | $ | 47,968 | $ | (15,906 | ) | $ | 132,655 | |||||||||
Long-term debt | 501,292 | 3,692 | 2,396 | — | 507,380 | |||||||||||||||
Non-current portion of accrued reclamation | — | 61,706 | 17,628 | — | 79,334 | |||||||||||||||
Non-current deferred tax liability | — | 11,767 | 126,635 | (17,377 | ) | 121,025 | ||||||||||||||
Other non-current liabilities | 46,661 | 5,328 | (225 | ) | — | 51,764 | ||||||||||||||
Stockholders' equity | 1,514,303 | 1,149,535 | 349,867 | (1,499,402 | ) | 1,514,303 | ||||||||||||||
Total liabilities and stockholders' equity | $ | 2,110,087 | $ | 1,284,790 | $ | 544,269 | $ | (1,532,685 | ) | $ | 2,406,461 | |||||||||
As of December 31, 2016 | ||||||||||||||||||||
Parent | Guarantors | Non-Guarantors | Eliminations | Consolidated | ||||||||||||||||
(in thousands) | ||||||||||||||||||||
Assets | ||||||||||||||||||||
Cash and cash equivalents | $ | 113,275 | $ | 24,388 | $ | 32,114 | $ | — | $ | 169,777 | ||||||||||
Other current assets | 33,950 | 65,369 | 35,524 | (1,236 | ) | 133,607 | ||||||||||||||
Properties, plants, and equipment - net | 2,103 | 1,258,890 | 771,692 | — | 2,032,685 | |||||||||||||||
Intercompany receivable (payable) | 404,121 | (222,072 | ) | (307,018 | ) | 124,969 | — | |||||||||||||
Investments in subsidiaries | 1,496,787 | — | — | (1,496,787 | ) | — | ||||||||||||||
Other non-current assets | 4,186 | 186,988 | 5,350 | (160,916 | ) | 35,608 | ||||||||||||||
Total assets | $ | 2,054,422 | $ | 1,313,563 | $ | 537,662 | $ | (1,533,970 | ) | $ | 2,371,677 | |||||||||
Liabilities and Stockholders' Equity | ||||||||||||||||||||
Current liabilities | $ | 22,401 | $ | 86,730 | $ | 41,348 | $ | (22,999 | ) | $ | 127,480 | |||||||||
Long-term debt | 500,979 | 3,065 | 2,773 | — | 506,817 | |||||||||||||||
Non-current portion of accrued reclamation | — | 63,025 | 16,902 | — | 79,927 | |||||||||||||||
Non-current deferred tax liability | — | 14,212 | 121,600 | (14,212 | ) | 121,600 | ||||||||||||||
Other non-current liabilities | 51,198 | 5,108 | (325 | ) | 28 | 56,009 | ||||||||||||||
Stockholders' equity | 1,479,844 | 1,141,423 | 355,364 | (1,496,787 | ) | 1,479,844 | ||||||||||||||
Total liabilities and stockholders' equity | $ | 2,054,422 | $ | 1,313,563 | $ | 537,662 | $ | (1,533,970 | ) | $ | 2,371,677 | |||||||||
Unaudited Interim Condensed Consolidating Statements of Operations
Three Months Ended March 31, 2017 | ||||||||||||||||||||
Parent | Guarantors | Non-Guarantors | Eliminations | Consolidated | ||||||||||||||||
(in thousands) | ||||||||||||||||||||
Revenues | $ | (4,093 | ) | $ | 82,953 | $ | 63,684 | $ | — | $ | 142,544 | |||||||||
Cost of sales | (148 | ) | (42,772 | ) | (35,756 | ) | — | (78,676 | ) | |||||||||||
Depreciation, depletion, amortization | — | (15,766 | ) | (13,186 | ) | — | (28,952 | ) | ||||||||||||
General and administrative | (6,469 | ) | (2,319 | ) | (418 | ) | — | (9,206 | ) | |||||||||||
Exploration and pre-development | (244 | ) | (1,901 | ) | (3,621 | ) | — | (5,766 | ) | |||||||||||
Gain on derivative contracts | (7,809 | ) | — | — | — | (7,809 | ) | |||||||||||||
Equity in earnings of subsidiaries | 2,701 | — | — | (2,701 | ) | — | ||||||||||||||
Other (expense) income | 42,896 | (3,116 | ) | (9,332 | ) | (44,820 | ) | (14,372 | ) | |||||||||||
Income (loss) before income taxes | 26,834 | 17,079 | 1,371 | (47,521 | ) | (2,237 | ) | |||||||||||||
(Provision) benefit from income taxes | — | (8,969 | ) | (6,780 | ) | 44,820 | 29,071 | |||||||||||||
Net income (loss) | 26,834 | 8,110 | (5,409 | ) | (2,701 | ) | 26,834 | |||||||||||||
Preferred stock dividends | (138 | ) | — | — | — | (138 | ) | |||||||||||||
Income (loss) applicable to common stockholders | 26,696 | 8,110 | (5,409 | ) | (2,701 | ) | 26,696 | |||||||||||||
Net income (loss) | 26,834 | 8,110 | (5,409 | ) | (2,701 | ) | 26,834 | |||||||||||||
Changes in comprehensive income (loss) | 3,204 | — | (89 | ) | 89 | 3,204 | ||||||||||||||
Comprehensive income (loss) | $ | 30,038 | $ | 8,110 | $ | (5,498 | ) | $ | (2,612 | ) | $ | 30,038 | ||||||||
Three Months Ended March 31, 2016 | ||||||||||||||||||||
Parent | Guarantors | Non- Guarantors | Eliminations | Consolidated | ||||||||||||||||
(in thousands) | ||||||||||||||||||||
Revenues | $ | (6,135 | ) | $ | 81,269 | $ | 55,883 | $ | — | $ | 131,017 | |||||||||
Cost of sales | — | (46,753 | ) | (27,567 | ) | — | (74,320 | ) | ||||||||||||
Depreciation, depletion, amortization | — | (16,606 | ) | (9,269 | ) | — | (25,875 | ) | ||||||||||||
General and administrative | (5,240 | ) | (4,523 | ) | (451 | ) | — | (10,214 | ) | |||||||||||
Exploration and pre-development | (45 | ) | (1,287 | ) | (2,022 | ) | — | (3,354 | ) | |||||||||||
Gain on derivative contracts | — | — | — | — | — | |||||||||||||||
Equity in earnings of subsidiaries | (20,991 | ) | — | — | 20,991 | — | ||||||||||||||
Other (expense) income | 31,793 | 4,336 | (35,518 | ) | (16,829 | ) | (16,218 | ) | ||||||||||||
Income (loss) before income taxes | (618 | ) | 16,436 | (18,944 | ) | 4,162 | 1,036 | |||||||||||||
(Provision) benefit from income taxes | — | (4,833 | ) | (13,650 | ) | 16,829 | (1,654 | ) | ||||||||||||
Net income (loss) | (618 | ) | 11,603 | (32,594 | ) | 20,991 | (618 | ) | ||||||||||||
Preferred stock dividends | (138 | ) | — | — | — | (138 | ) | |||||||||||||
Income (loss) applicable to common stockholders | (756 | ) | 11,603 | (32,594 | ) | 20,991 | (756 | ) | ||||||||||||
Net income (loss) | (618 | ) | 11,603 | (32,594 | ) | 20,991 | (618 | ) | ||||||||||||
Changes in comprehensive income (loss) | 1,065 | 8 | 1,060 | (1,068 | ) | 1,065 | ||||||||||||||
Comprehensive income (loss) | $ | 447 | $ | 11,611 | $ | (31,534 | ) | $ | 19,923 | $ | 447 | |||||||||
Unaudited Interim Condensed Consolidating Statements of Cash Flows
Three Months Ended March 31, 2017 | ||||||||||||||||||||
Parent | Guarantors | Non- Guarantors | Eliminations | Consolidated | ||||||||||||||||
(in thousands) | ||||||||||||||||||||
Cash flows from operating activities | $ | 40,953 | $ | 11,508 | $ | 15,642 | $ | (29,818 | ) | $ | 38,285 | |||||||||
Cash flows from investing activities: | ||||||||||||||||||||
Additions to properties, plants, and equipment | — | (7,540 | ) | (14,118 | ) | — | (21,658 | ) | ||||||||||||
Other investing activities, net | (7,479 | ) | 61 | — | — | (7,418 | ) | |||||||||||||
Cash flows from financing activities: | ||||||||||||||||||||
Dividends paid to stockholders | (1,127 | ) | — | — | — | (1,127 | ) | |||||||||||||
Payments on debt | — | (1,658 | ) | (407 | ) | — | (2,065 | ) | ||||||||||||
Other financing activity | (41,096 | ) | 3,024 | 7,432 | 29,818 | (822 | ) | |||||||||||||
Effect of exchange rate changes on cash | — | — | 1,814 | — | 1,814 | |||||||||||||||
Changes in cash and cash equivalents | (8,749 | ) | 5,395 | 10,363 | — | 7,009 | ||||||||||||||
Beginning cash and cash equivalents | 113,275 | 24,388 | 32,114 | — | 169,777 | |||||||||||||||
Ending cash and cash equivalents | $ | 104,526 | $ | 29,783 | $ | 42,477 | $ | — | $ | 176,786 | ||||||||||
Three Months Ended March 31, 2016 | ||||||||||||||||||||
Parent | Guarantors | Non- Guarantors | Eliminations | Consolidated | ||||||||||||||||
(in thousands) | ||||||||||||||||||||
Cash flows from operating activities | $ | 7,848 | $ | (21,658 | ) | $ | (7,884 | ) | $ | 40,442 | $ | 18,748 | ||||||||
Cash flows from investing activities: | ||||||||||||||||||||
Additions to properties, plants, and equipment | (53 | ) | (18,552 | ) | (16,049 | ) | — | (34,654 | ) | |||||||||||
Other investing activities, net | — | 215 | (3,900 | ) | — | (3,685 | ) | |||||||||||||
Cash flows from financing activities: | ||||||||||||||||||||
Dividends paid to stockholders | (1,090 | ) | — | — | — | (1,090 | ) | |||||||||||||
Payments on debt | — | (2,556 | ) | (226 | ) | (2,782 | ) | |||||||||||||
Other financing activity | (9,833 | ) | 27,189 | 23,823 | (40,442 | ) | 737 | |||||||||||||
Effect of exchange rate changes on cash | — | — | 1,535 | — | 1,535 | |||||||||||||||
Changes in cash and cash equivalents | (3,128 | ) | (15,362 | ) | (2,701 | ) | — | (21,191 | ) | |||||||||||
Beginning cash and cash equivalents | 94,167 | 42,692 | 18,350 | — | 155,209 | |||||||||||||||
Ending cash and cash equivalents | $ | 91,039 | $ | 27,330 | $ | 15,649 | $ | — | $ | 134,018 | ||||||||||
Item“Item 2. Management's Discussion and Analysis of Financial Condition and Results of Operations - Financial Liquidity and Capital Resources” in the last full paragraph on page 46. That paragraph is amended and restated as follows (with changes appearing in the last three sentences only):
OriginalDisclosure | Amended and RestatedDisclosure | |
Cash provided by operating activities in the first quarter of 2017 increased by $19.6 million compared to the same period in 2016. The increase was primarily due to working capital and other operating asset and liability changes which resulted in a net cash flow increase of $21.7 million in the first three months of 2017 compared to a net decrease in cash flows of $21.5 million in the 2016 period. The $0.2 million variance in working capital changes is attributed to lower accounts receivable due to the timing of sales at Greens Creek and Casa Berardi and higher payroll accruals due to the timing of payment of incentive compensation related to prior year performance. In addition, income, as adjusted for non-cash items, was higher by $19.5 million, due primarily to higher metals prices. | Cash provided by operating activities in the first quarter of 2017 increased by $19.6 million compared to the same period in 2016. The increase was primarily due to working capital and other operating asset and liability changes which resulted in a net cash flow decrease of $7.4 million in the first three months of 2017 compared to a net decrease in cash flows of $21.5 million in the 2016 period. The $14.1 million variance in working capital changes is attributed to lower accounts receivable due to the timing of sales at Greens Creek and Casa Berardi and higher payroll accruals due to the timing of payment of incentive compensation related to prior year performance. In addition, income, as adjusted for non-cash items, was higher by $5.5 million, due primarily to higher metals prices. |
Pursuant to Rule 12b-15 promulgated under the Securities Exchange Act of 1934, as amended, we have repeated the entire text of Item 2 of the Form 10-Q in this Amendment, however, there have been no changes to the text of such item other than the changes described above and reflected in the paragraph under the heading “Amended and Restated Disclosure.”
This Amendment amends only the item of the Form 10-Q specified above and amends that item solely to reflect the changes described above. This Amendment does not reflect events occurring after May 8, 2017.
Item 2. Management's Discussion and Analysis of Financial Condition and Results of Operations
Certain statements contained in this Form 10-Q, including in Management’s Discussion and Analysis of Financial Condition and Results of Operations and Quantitative and Qualitative Disclosure About Market Risk, are intended to be covered by the safe harbor provided for under Section 27A of the Securities Act of 1933, as amended, and Section 21E of the Securities Exchange Act of 1934, as amended. Our forward-looking statements include our current expectations and projections about future results, performance, results of litigation, prospects and opportunities, including reserves and other mineralization. We have tried to identify these forward-looking statements by using words such as “may,” “will,” “expect,” “anticipate,” “believe,” “intend,” “feel,” “plan,” “estimate,” “project,” “forecast” and similar expressions. These forward-looking statements are based on information currently available to us and are expressed in good faith and believed to have a reasonable basis. However, our forward-looking statements are subject to a number of risks, uncertainties and other factors that could cause our actual results, performance, prospects or opportunities to differ materially from those expressed in, or implied by, these forward-looking statements.
These risks, uncertainties and other factors include, but are not limited to, those set forth under Part I, Item 1A – Business – Risk Factors in our annual report filed on Form 10-K for the year ended December 31, 2016. Given these risks and uncertainties, readers are cautioned not to place undue reliance on our forward-looking statements. All subsequent written and oral forward-looking statements attributable to Hecla Mining Company or to persons acting on our behalf are expressly qualified in their entirety by these cautionary statements. Except as required by federal securities laws, we do not intend to update or revise any forward-looking statements, whether as a result of new information, future events or otherwise.
Overview
Hecla Mining Company and our subsidiaries have provided precious and base metals to the U.S. and worldwide since 1891. We discover, acquire, develop, and produce silver, gold, lead and zinc.
We produce lead, zinc and bulk concentrates, which we sell to custom smelters and brokers, and unrefined precipitate and bullion bars (doré) containing gold and silver, which are further refined before sale to precious metals traders. We are organized into four segments that encompass our operating and development units: Greens Creek, Lucky Friday, Casa Berardi, and San Sebastian. The map below shows the locations of our operating units and our exploration and pre-development projects, as well as our corporate offices located in Coeur d'Alene, Idaho and Vancouver, British Columbia.
|
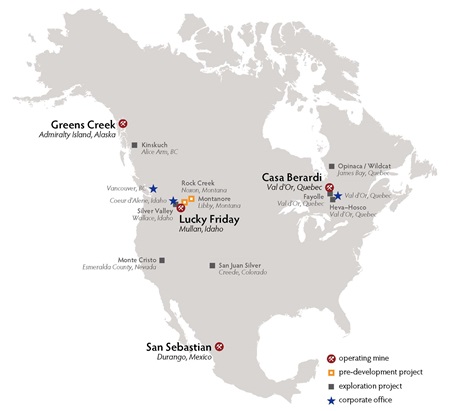
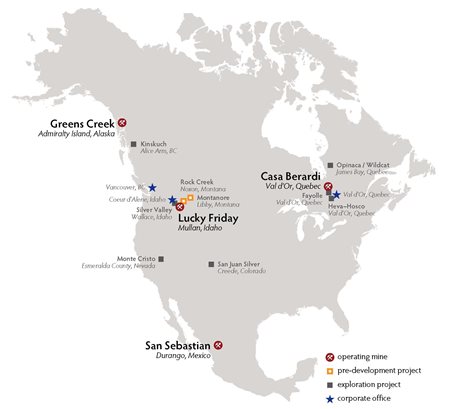
Our current business strategy is to focus our financial and human resources in the following areas:
operating our properties safely, in an environmentally responsible manner, and cost-effectively;
continue optimizing and improving operations at our Greens Creek, Lucky Friday, Casa Berardi, and San Sebastian units;
expanding our proven and probable reserves and production capacity at our operating properties;
conducting our business with financial stewardship to preserve our financial position in varying metals price environments;
advance permitting of the Rock Creek and Montanore projects. We acquired Rock Creek as part of the acquisition of Revett Mining Company, Inc. ("Revett") in June 2015, and we acquired Montanore through the acquisition of Mines Management, Inc. ("Mines Management") in September 2016;
maintaining and investing in exploration and pre-development projects in the vicinities of six mining districts and projects we believe to be under-explored and under-invested: North Idaho's Silver Valley in the historic Coeur d'Alene Mining District; our Greens Creek unit on Alaska's Admiralty Island located near Juneau; the silver-producing district near Durango, Mexico; the Abitibi region of northwestern Quebec, Canada; the Rock Creek and Montanore projects in northwestern Montana; and the Creede district of Southwestern Colorado; and
continuing to seek opportunities to acquire and invest in mining properties and companies.
A number of key factors may impact the execution of our strategy, including regulatory issues and metals prices. Metals prices can be very volatile. As discussed in theCritical Accounting Estimates section below, metals prices are influenced by a number of factors beyond our control. Average market prices of silver, gold, lead, and zinc in the first three months of 2017 were higher than their levels from the comparable period last year, as illustrated by the table inResults of Operations below. While we believe current global economic and industrial trends could result in continued demand for the metals we produce, prices have been volatile and there can be no assurance that current prices will continue.
The total principal amount of our Senior Notes due May 1, 2021 is $506.5 million and they bear interest at a rate of 6.875% per year. The net proceeds from the Senior Notes were primarily used for the acquisition of Aurizon in June 2013 (seeNote 9 ofNotes to Condensed Consolidated Financial Statements (Unaudited)).As discussed in theFinancial Liquidity and Capital Resourcessection below, we believe that we will be able to meet the obligations associated with the Senior Notes; however, a number of factors could impact our ability to meet the debt obligations and fund our other projects.
On June 15, 2015, we completed the acquisition of Revett, giving us 100% ownership of the Rock Creek project, a significant undeveloped silver and copper deposit in northwestern Montana. In addition, on September 13, 2016, we completed the acquisition of Mines Management, giving us 100% ownership of the Montanore project, another significant undeveloped silver and copper deposit located approximately 10 miles from our Rock Creek project. Development of Rock Creek and Montanore has been challenged by conservation groups at various times, and there can be no assurance that we will be able to obtain the permitting required to develop these projects.InPart I, Item 1A. Risk Factorsin our annual report filed on Form 10-K for the year ended December 31, 2016, seeLegal challenges could prevent the Rock Creek or Montanore projects from ever being developedfor more information.
As further discussed in theLucky Friday Segment section below, the union employees at Lucky Friday have been on strike since March 13, 2017, and production at Lucky Friday has been suspended since that time. We cannot predict how long the strike will last or whether an agreement will be reached. As a result of the strike or other related events, operations at Lucky Friday could continue to be disrupted, which could adversely affect our financial condition and results of operations.
During the third quarter of 2015, we made a development decision to mine near surface, high grade portions of silver and gold deposits at our San Sebastian project in Mexico. Ore production commenced in the fourth quarter of 2015 and has continued since that time. In addition, work began in the first quarter of 2017 to develop and rehabilitate underground access which would allow us to mine deeper portions of the deposits at San Sebastian. See theSan Sebastian Segment section below for more information. We have generated positive cash flows at San Sebastian since the start of production there, and we believe that will continue through 2018. However, our ability to generate positive cash flows at San Sebastian may be impacted by changes in estimated costs, precious metals prices, or other factors, and there can be no assurance that we will be able to develop and operate San Sebastian as anticipated.
We strive to achieve excellent mine safety and health performance. We seek to implement this goal by: training employees in safe work practices; establishing, following and improving safety standards; investigating accidents, incidents and losses to avoid recurrence; involving employees in the establishment of safety standards; and participating in the National Mining Association'sCORESafety program. We attempt to implement reasonable best practices with respect to mine safety and emergency preparedness. We work with the Mine Safety and Health Administration ("MSHA") to address issues outlined in its investigations and inspections and continue to evaluate our safety practices.
Another challenge for us is the risk associated with environmental litigation and ongoing reclamation activities. As described inPart I, Item 1A. Risk Factors of our annual report filed on Form 10-K for the year ended December 31, 2016 andNote 4 ofNotes to Condensed Consolidated Financial Statements (Unaudited), it is possible that our estimate of these liabilities (and our ability to estimate liabilities in general) may change in the future, affecting our strategic plans. We are involved in various environmental legal matters and the estimate of our environmental liabilities, liquidity needs, or strategic plans may be significantly impacted as a result of these matters or new matters that may arise. We strive to ensure that our activities are conducted in compliance with applicable laws and regulations and attempt to resolve environmental litigation on as favorable terms as possible.
Results of Operations
Sales of products by metal for the three-month periods ended March 31, 2017 and 2016 were as follows:
Three Months Ended | ||||||||
(in thousands) | 2017 | 2016 | ||||||
Silver | $ | 51,357 | $ | 56,670 | ||||
Gold | 62,701 | 54,892 | ||||||
Lead | 13,619 | 13,724 | ||||||
Zinc | 29,865 | 22,525 | ||||||
Less: Smelter and refining charges | (14,998 | ) | (16,794 | ) | ||||
Sales of products | $ | 142,544 | $ | 131,017 | ||||
For the first quarter of 2017, we recorded income applicable to common stockholders of $26.7 million ($0.07 per basic common share), compared to a loss of $0.8 million ($0.00 per basic common share) during the first quarter of 2016. The following factors contributed to the results for the first three months of 2017 compared to the same period in 2016:
• | An income tax benefit of $29.1 million in first quarter of 2017 compared to an income tax provision of $1.7 million in the first quarter of 2016. The benefit in the 2017 period is primarily the result of a change in income tax position relating to the timing of deduction for #4 Shaft development costs at Lucky Friday, as further discussed inCorporate Matters below. |
Higher average silver, gold, lead and zinc prices for the first quarter of 2017 compared to the same period in 2016.
Three months ended March 31, | |||||||||
2017 | 2016 | ||||||||
Silver – | London PM Fix ($/ounce) | $ | 17.42 | $ | 14.84 | ||||
Realized price per ounce | $ | 17.90 | $ | 14.93 | |||||
Gold – | London PM Fix ($/ounce) | $ | 1,219 | $ | 1,181 | ||||
Realized price per ounce | $ | 1,221 | $ | 1,187 | |||||
Lead – | LME Final Cash Buyer ($/pound) | $ | 1.03 | $ | 0.79 | ||||
Realized price per pound | $ | 1.06 | $ | 0.78 | |||||
Zinc – | LME Final Cash Buyer ($/pound) | $ | 1.26 | $ | 0.76 | ||||
Realized price per pound | $ | 1.26 | $ | 0.79 | |||||
Average realized prices differ from average market prices primarily because concentrate sales are generally recorded as revenues at the time of shipment at forward prices for the estimated month of settlement, which differ from average market prices. Due to the time elapsed between shipment of concentrates and final settlement with customers, we must estimate the prices at which sales of our metals will be settled. Previously recorded sales are adjusted to estimated settlement metal prices each period through final settlement. For the first quarter of 2017, we recorded net positive price adjustments to provisional settlements of $0.6 million compared to net positive price adjustments to provisional settlements of $0.5 million in the first quarter of 2016. The price adjustments related to silver, gold, zinc and lead contained in our concentrate shipments were largely offset by gains and losses on forward contracts for those metals for each period. SeeNote 11 ofNotes to Condensed Consolidated Financial Statements (Unaudited)for more information. The gains and losses on these contracts are included in revenues and impact the realized prices for silver, gold, lead and zinc. Realized prices are calculated by dividing gross revenues for each metal (which include the price adjustments and gains and losses on the forward contracts discussed above) by the payable quantities of each metal included in concentrate and doré shipped during the period.
A net foreign exchange loss in the first quarter of 2017 of $2.3 million versus a net loss of $8.2 million in the same period of 2016, with the variance primarily related to the impact of smaller decreases in the CAD-to-USD exchange rate on the remeasurement of our net monetary liabilities in Quebec. During the first quarter of 2017, the applicable CAD-to-USD exchange rate decreased from 1.3426 to 1.3310, compared to a decrease in the rate from 1.4006 to 1.2987 during the first quarter of 2016.
• | Increased gross profit at our Greens Creek and Lucky Friday units in the first quarter of 2017 of $5.8 million and $2.7 million, respectively, compared to the first quarter of 2016. This was partially offset by decreases in gross profit of $0.7 million and $3.8 million, respectively, in the first quarter of 2017 at our Casa Berardi and San Sebastian units. SeeThe Greens Creek Segment,The Lucky Friday Segment, The Casa Berardi Segment,and The San Sebastian Segment sections below. |
Unrealized gains on investments of $0.3 million in the first quarter of 2017 compared to losses of $0.7 million in the first quarter of 2016. The losses in 2016 were the result of impairments of certain investments being deemed to be other-than-temporary.
Exploration and pre-development expense increased by $2.4 million in the first quarter of 2017 compared to the first quarter of 2016. In 2017, we have continued exploration work at our Greens Creek, San Sebastian, and Casa Berardi units, and at our other projects in Quebec, Canada. "Pre-development expense" is defined as costs incurred in the exploration stage that may ultimately benefit production, such as underground ramp development, which are expensed due to the lack of proven and probable reserves. Pre-development expense of $1.3 million in the first quarter of 2017 was related to advancement of our Montanore and Rock Creek projects.
Higher interest expense by $2.8 million in the first quarter of 2017 compared to the same period of 2016. Interest expense in the first quarters of 2017 and 2016 was net of $0.9 million and $3.8 million, respectively, in capitalized interest primarily related to the #4 Shaft project, with the decrease due to completion of #4 Shaft in January 2017.
• | A loss on base metal derivatives contracts of $7.8 million in the first quarter of 2017, with no net activity on base metal derivative contracts in the first quarter of 2016. SeeNote 11 ofNotes to Condensed Consolidated Financial Statements (Unaudited)for more information. |
The Greens Creek Segment
Dollars are in thousands (except per ounce and per ton amounts) | Three months ended March 31, | |||||||
2017 | 2016 | |||||||
Sales | $ | 58,850 | $ | 53,882 | ||||
Cost of sales and other direct production costs | (30,664 | ) | (31,252 | ) | ||||
Depreciation, depletion and amortization | (13,332 | ) | (13,601 | ) | ||||
Gross profit | $ | 14,854 | $ | 9,029 | ||||
Tons of ore milled | 197,129 | 204,968 | ||||||
Production: | ||||||||
Silver (ounces) | 1,929,297 | 2,458,276 | ||||||
Gold (ounces) | 14,022 | 15,981 | ||||||
Zinc (tons) | 13,406 | 14,611 | ||||||
Lead (tons) | 4,809 | 5,087 | ||||||
Payable metal quantities sold: | ||||||||
Silver (ounces) | 1,439,461 | 1,901,143 | ||||||
Gold (ounces) | 10,290 | 11,420 | ||||||
Zinc (tons) | 10,159 | 12,412 | ||||||
Lead (tons) | 2,830 | 3,244 | ||||||
Ore grades: | ||||||||
Silver ounces per ton | 12.71 | 15.17 | ||||||
Gold ounces per ton | 0.10 | 0.11 | ||||||
Zinc percent | 7.82 | 8.13 | ||||||
Lead percent | 3.06 | 3.05 | ||||||
Mining cost per ton | $ | 71.41 | $ | 66.96 | ||||
Milling cost per ton | $ | 33.72 | $ | 30.99 | ||||
Cash Cost, After By-product Credits, per Silver Ounce(1) | $ | 0.65 | $ | 3.96 | ||||
All-In Sustaining Cost ("AISC"), After By-product Credits, per Silver Ounce(1) | $ | 3.86 | $ | 7.03 | ||||
(1) | A reconciliation of these non-GAAP measures to cost of sales and other direct production costs and depreciation, depletion and amortization, the most comparable GAAP measure, can be found below inReconciliation of Cost of Sales and Other Direct Production Costs and Depreciation, Depletion and Amortization (GAAP) to Cash Cost, Before By-product Credits and Cash Cost, After By-product Credits (non-GAAP) and All-In Sustaining Cost, Before By-product Credits and All-In Sustaining Cost, After By-product Credits (non-GAAP). |
The $5.8 million increase in gross profit during the first quarter of 2017 compared to the same 2016 period was the result of higher average prices for silver, gold, zinc and lead, impacting sales by approximately $14.4 million. These factors were partially offset by lower sales volume due to the timing of shipments, and decreased ore production, grades and mill recoveries. In addition, gross profit at Greens Creek was impacted by positive price adjustments to revenues of $0.5 million for the first quarter of 2017 compared to positive price adjustments of $0.4 million for the first quarter of 2016. Price adjustments to revenues result from changes in metals prices between transfer of title of concentrates to buyers and final settlements during the period. The price adjustments related to silver, gold, zinc and lead contained in concentrate shipments were net of gains and losses on forward contracts for those metals for each period. The price adjustments and gains and losses on forward contracts discussed above are included in sales.
Mining costs per ton increased by 7% in the first quarter of 2017 compared to the same period in 2016, primarily as a result of higher labor cost, due to higher staffing levels, higher fuel and power costs, and lower milled tons. Milling costs per ton increased 9% in the first quarter of 2017 compared to the same period in 2016 due to lower tons milled and higher power and reagents costs, partially offset by lower labor costs. The increase in cost of hydroelectric power is the result of a price increase per kilowatt-hour purchased from $0.10 to $0.16 in September 2016.
The chart below illustrates the factors contributing to the variances in Cash Cost, After By-product Credits, per Silver Ounce for the first quarter of 2017 compared to the same period of 2016:
|
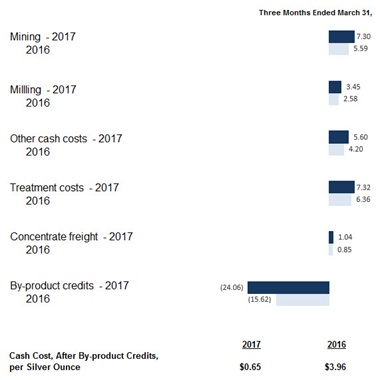

The following table summarizes the components of Cash Cost, After By-product Credits, per Silver Ounce:
Three Months Ended March 31, | ||||||||
2017 | 2016 | |||||||
Cash Cost, Before By-product Credits, per Silver Ounce | $ | 24.71 | $ | 19.58 | ||||
By-product credits | (24.06 | ) | (15.62 | ) | ||||
Cash Cost, After By-product Credits, per Silver Ounce | $ | 0.65 | $ | 3.96 | ||||
The following table summarizes the components of AISC, After By-product Credits, per Silver Ounce:
Three Months Ended March 31, | ||||||||
2017 | 2016 | |||||||
AISC, Before By-product Credits, per Silver Ounce | $ | 27.92 | $ | 22.65 | ||||
By-product credits | (24.06 | ) | (15.62 | ) | ||||
AISC, After By-product Credits, per Silver Ounce | $ | 3.86 | $ | 7.03 | ||||
The decrease in Cash Costs, After By-Product Credits, per Silver Ounce for the first quarter of 2017 compared to 2016 was the result of higher by-product credits, partially offset by lower silver production. The decrease in AISC, After By-Product Credits, per Silver Ounce was due to the same factors impacting Cash Costs, After By-Product Credits, per Silver Ounce, along with lower capital and exploration spending.
Mining and milling costs per ounce increased in the first quarter of 2017 compared to 2016 on a per-ounce basis due primarily to lower silver production resulting from lower silver grades and ore throughput.
Other cash costs per ounce for the first quarter of 2017 were higher compared to 2016 due to the effect of lower silver production.
Treatment costs were higher in the first quarter of 2017 compared to 2016 as a result of lower silver production and higher silver prices, as treatment costs include the value of silver not payable to us through the smelting process. The silver not payable to us is either recovered by the smelters through further processing or ultimately not recovered and included in the smelters’ waste material.
By-product credits per ounce were higher in the first quarter of 2017 compared to 2016 due to higher gold, zinc and lead prices and lower silver production.
The difference between what we report as “production” and “payable metal quantities sold” is attributable to the difference between the quantities of metals contained in the concentrates we produce versus the portion of those metals actually paid for by our customers according to the terms of our sales contracts. Differences can also arise from inventory changes incidental to shipping schedules, or variances in ore grades which impact the amount of metals contained in concentrates produced and sold. The difference in payable quantities sold for 2017 compared to 2016 is due mainly to timing of concentrate shipments.
While revenue from zinc, lead and gold by-products is significant, we believe that identification of silver as the primary product of the Greens Creek unit is appropriate because:
silver has historically accounted for a higher proportion of revenue than any other metal and is expected to do so in the future;
we have historically presented Greens Creek as a producer primarily of silver, based on the original analysis that justified putting the project into production, and believe that consistency in disclosure is important to our investors regardless of the relationships of metals prices and production from year to year;
metallurgical treatment maximizes silver recovery;
the Greens Creek deposit is a massive sulfide deposit containing an unusually high proportion of silver; and
in most of its working areas, Greens Creek utilizes selective mining methods in which silver is the metal targeted for highest recovery.
Likewise, we believe the identification of gold, lead and zinc as by-product credits is appropriate because of their lower economic value compared to silver and due to the fact that silver is the primary product we intend to produce. In addition, we have not consistently received sufficient revenue from any single by-product metal to warrant classification of such as a co-product.
We periodically review our revenues to ensure that reporting of primary products and by-products is appropriate. Because we consider zinc, lead and gold to be by-products of our silver production, the values of these metals offset operating costs within our calculations of Cash Cost, After By-product Credits, per Silver Ounce and AISC, After By-product Credits, per Silver Ounce.
The Lucky Friday Segment
Dollars are in thousands (except per ounce and per ton amounts) | Three Months Ended March 31, | |||||||
2017 | 2016 | |||||||
Sales | $ | 20,010 | $ | 21,252 | ||||
Cost of sales and other direct production costs | (12,110 | ) | (15,500 | ) | ||||
Depreciation, depletion and amortization | (2,433 | ) | (3,004 | ) | ||||
Gross profit | $ | 5,467 | $ | 2,748 | ||||
Tons of ore milled | 57,069 | 74,021 | ||||||
Production: | ||||||||
Silver (ounces) | 680,782 | 977,084 | ||||||
Lead (tons) | 3,827 | 5,951 | ||||||
Zinc (tons) | 2,131 | 2,753 | ||||||
Payable metal quantities sold: | ||||||||
Silver (ounces) | 641,004 | 928,801 | ||||||
Lead (tons) | 3,596 | 5,507 | ||||||
Zinc (tons) | 1,688 | 1,930 | ||||||
Ore grades: | ||||||||
Silver ounces per ton | 12.39 | 13.67 | ||||||
Lead percent | 7.05 | 8.36 | ||||||
Zinc percent | 3.99 | 3.97 | ||||||
Mining cost per ton | $ | 104.72 | $ | 98.02 | ||||
Milling cost per ton | $ | 27.16 | $ | 23.35 | ||||
Cash Cost, After By-product Credits, per Silver Ounce(1) | $ | 5.93 | $ | 9.05 | ||||
AISC, After By-product Credits, per Silver Ounce(1) | $ | 12.06 | $ | 21.78 | ||||
(1) | A reconciliation of these non-GAAP measures to cost of sales and other direct production costs and depreciation, depletion and amortization, the most comparable GAAP measure, can be found below inReconciliation of Cost of Sales and Other Direct Production Costs and Depreciation, Depletion and Amortization (GAAP) to Cash Cost, Before By-product Credits and Cash Cost, After By-product Credits (non-GAAP) and All-In Sustaining Cost, Before By-product Credits and All-In Sustaining Cost, After By-product Credits (non-GAAP). |
Gross profit increased by $2.7 million in the first quarter of 2017 compared to 2016. The variance is primarily due to higher silver, lead, and zinc prices, partially offset by reduced metal production as a result of the suspension of operations starting in mid-March 2017 due to a strike by unionized employees, discussed further below. Silver and lead production was also impacted by lower ore grades.
Mining and milling cost per ton increased by 7% and 16%, respectively, in the first quarter of 2017 compared to the same period in 2016 due primarily to lower ore production as a result of the strike described below.
The chart below illustrates the factors contributing to the variances in Cash Cost, After By-product Credits, per Silver Ounce for the first quarter of 2017 compared to the same period of 2016:
|
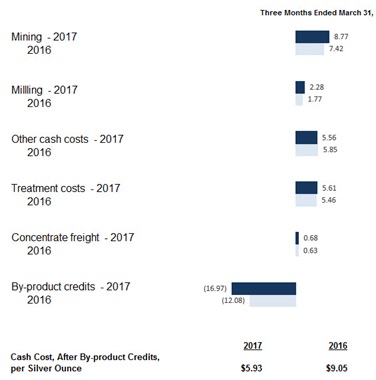

The following table summarizes the components of Cash Cost, After By-product Credits, per Silver Ounce:
Three Months Ended March 31, | ||||||||
2017 | 2016 | |||||||
Cash Cost, Before By-product Credits, per Silver Ounce | $ | 22.90 | $ | 21.13 | ||||
By-product credits | (16.97 | ) | (12.08 | ) | ||||
Cash Cost, After By-product Credits, per Silver Ounce | $ | 5.93 | $ | 9.05 | ||||
The following table summarizes the components of AISC, After By-product Credits, per Silver Ounce:
Three Months Ended March 31, | ||||||||
2017 | 2016 | |||||||
AISC, Before By-product Credits, per Silver Ounce | $ | 29.03 | $ | 33.86 | ||||
By-product credits | (16.97 | ) | (12.08 | ) | ||||
AISC, After By-product Credits, per Silver Ounce | $ | 12.06 | $ | 21.78 | ||||
The decrease in Cash Cost, After By-product Credits, per Silver Ounce in the first quarter of 2017 compared to the first quarter of 2016 was the result of higher by-product credits due to higher lead and zinc prices, partially offset by lower silver production. The decrease in AISC, After By-product Credits, per Silver Ounce is due to the same factors impacting Cash Cost, After By-product Credits, per Silver Ounce, along with lower capital costs primarily as a result of completion of the #4 Shaft project in January 2017.
Similar to the Greens Creek segment, the difference between what we report as “production” and “payable metal quantities sold” is due essentially to the difference between the quantities of metals contained in the concentrates we produce versus the portion of those metals actually paid for by our customers according to the terms of our sales contracts.
While value from lead and zinc is significant, we believe that identification of silver as the primary product of the Lucky Friday unit is appropriate because:
silver has historically accounted for a higher proportion of revenue than any other metal and is expected to do so in the future;
the Lucky Friday unit is situated in a mining district long associated with silver production; and
the Lucky Friday unit generally utilizes selective mining methods to target silver production.
Likewise, we believe the identification of lead and zinc as by-product credits is appropriate because of their lower economic value compared to silver and due to the fact that silver is the primary product we intend to produce. In addition, we do not receive sufficient revenue from any single by-product metal to warrant classification of such as a co-product.
We periodically review our revenues to ensure that reporting of primary products and by-products is appropriate. Because we consider zinc and lead to be by-products of our silver production, the values of these metals offset operating costs within our calculations of Cash Cost, After By-product Credits, per Silver Ounce and AISC, After By-product Credits, per Silver Ounce.
Many of the employees at our Lucky Friday unit are represented by a union, and the most recent collective bargaining agreement with the union expired on April 30, 2016. On February 19, 2017, the unionized employees voted against our contract offer. On March 13, 2017, the unionized employees went on strike, and have been on strike since that time. Production at the Lucky Friday has been suspended since start of the strike. Costs related to care-and-maintenance of the mine during the strike period are reported in a separate line item on our condensed consolidated statement of operations and totaled $1.6 million in the first quarter of 2017. These care-and-maintenance costs are excluded from the calculation of gross profit, Cash Cost, After By-product Credits, per Silver Ounce and AISC, After By-product Credits, per Silver Ounce. We cannot predict how long the strike will last or whether an agreement will be reached. As a result of the strike or other related events, operations at Lucky Friday could continue to be disrupted, which could adversely affect our financial condition and results of operations.
SeeNote 4 ofNotes to Condensed Consolidated Financial Statements (Unaudited) for contingencies related to various accidents and other events occurring at the Lucky Friday mine in prior periods.
The Casa Berardi Segment
Dollars are in thousands (except per ounce and per ton amounts) | Three Months Ended March 31, | Three Months Ended March 31, | ||||||||||||||
2017 | 2016 | 2017 | 2016 | |||||||||||||
Sales | $ | 41,712 | $ | 32,198 | $ | 41,712 | $ | 32,198 | ||||||||
Cost of sales and other direct production costs | (29,953 | ) | (20,659 | ) | (29,953 | ) | (20,659 | ) | ||||||||
Depreciation, depletion and amortization | (12,514 | ) | (8,501 | ) | (12,514 | ) | (8,501 | ) | ||||||||
Gross (loss) profit | $ | (755 | ) | $ | 3,038 | $ | (755 | ) | $ | 3,038 | ||||||
Tons of ore milled | 293,697 | 216,962 | 293,696 | 216,962 | ||||||||||||
Production: | ||||||||||||||||
Gold (ounces) | 35,807 | 30,378 | 35,807 | 30,378 | ||||||||||||
Silver (ounces) | 8,545 | 7,005 | 8,545 | 7,005 | ||||||||||||
Payable metal quantities sold: | ||||||||||||||||
Gold (ounces) | 34,166 | 27,427 | 34,166 | 27,427 | ||||||||||||
Silver (ounces) | 7,899 | 7,864 | 7,899 | 7,864 | ||||||||||||
Ore grades: | ||||||||||||||||
Gold ounces per ton | 0.14 | 0.16 | 0.14 | 0.16 | ||||||||||||
Silver ounces per ton | 0.03 | 0.04 | 0.03 | 0.04 | ||||||||||||
Mining cost per ton | $ | 86.58 | $ | 87.54 | $ | 86.58 | $ | 87.54 | ||||||||
Milling cost per ton | $ | 17.26 | $ | 18.91 | $ | 17.26 | $ | 18.91 | ||||||||
Cash Cost, After By-product Credits, per Gold Ounce(1) | $ | 886 | $ | 781 | $ | 886 | $ | 781 | ||||||||
AISC, After By-product Credits, per Gold Ounce(1) | $ | 1,256 | $ | 1,322 | $ | 1,256 | $ | 1,322 | ||||||||
(1) | A reconciliation of these non-GAAP measures to cost of sales and other direct production costs and depreciation, depletion and amortization, the most comparable GAAP measure, can be found below inReconciliation of Cost of Sales and Other Direct Production Costs and Depreciation, Depletion and Amortization (GAAP) to Cash Cost, Before By-product Credits and Cash Cost, After By-product Credits (non-GAAP) and All-In Sustaining Cost, Before By-product Credits and All-In Sustaining Cost, After By-product Credits (non-GAAP). |
Gross profit decreased by $3.8 million for the first quarter of 2017 compared to the same period in 2016. The decrease is primarily due to increased costs, mainly resulting from the additional costs related to the East Mine Crown Pillar ("EMCP") pit, including ongoing stripping costs, and lower ore grades, partially offset by higher gold prices and ore production. Processing of ore from the EMCP pit began in July 2016, resulting in increased ore volume, but at a lower grade.
Mining and milling cost per ton for the first quarter of 2017 were lower than the first quarter of 2016 by 1% and 9%, respectively, primarily due to higher ore production. This was partially offset by foreign exchange differences, as the U.S. dollar was weaker relative to the Canadian dollar in the first quarter of 2017 than it was in the first quarter of 2016.
The chart below illustrates the factors contributing to Cash Cost, After By-product Credits, per Gold Ounce for the first quarter of 2017 compared to the same period of 2016:
|


The following table summarizes the components of Cash Cost, After By-product Credits, per Gold Ounce:
Three Months Ended March 31, | ||||||||
2017 | 2016 | |||||||
Cash Cost, Before By-product Credits, per Gold Ounce | $ | 890 | $ | 785 | ||||
By-product credits | (4 | ) | (3 | ) | ||||
Cash Cost, After By-product Credits, per Gold Ounce | $ | 886 | $ | 782 | ||||
The following table summarizes the components of AISC, After By-product Credits, per Gold Ounce:
Three Months Ended March 31, | ||||||||
2017 | 2016 | |||||||
AISC, Before By-product Credits, per Gold Ounce | $ | 1,260 | $ | 1,325 | ||||
By-product credits | (4 | ) | (3 | ) | ||||
AISC, After By-product Credits, per Gold Ounce | $ | 1,256 | $ | 1,322 | ||||
The increase in Cash Cost, After By-product Credits, per Gold Ounce for the first quarter of 2017 compared to the first quarter of 2016 was primarily the result of higher costs as a result of addition of production from the EMCP pit, partially offset by higher gold production. The decrease in AISC, After By-product Credits, per Gold Ounce was due to lower capital spending and higher gold production, partially offset by higher production costs.
The difference between what we report as "production" and "payable metal quantities sold" is mainly attributable to inventory changes incidental to the timing of sales of refined metals and shipping schedules.
We believe the identification of silver as a by-product credit is appropriate at Casa Berardi because of its lower economic value compared to gold and due to the fact that gold is the primary product we intend to produce there. In addition, we do not receive sufficient revenue from silver at Casa Berardi to warrant classification of such as a co-product. Because we consider silver to be a by-product of our gold production at Casa Berardi, the value of silver offsets operating costs within our calculations of Cash Cost, After By-product Credits, per Gold Ounce and AISC, After By-product Credits, per Gold Ounce.
The San Sebastian Segment
Dollars are in thousands (except per ounce and per ton amounts) | Three Months Ended March 31, | |||||||
2017 | 2016 | |||||||
Sales | $ | 21,972 | $ | 23,685 | ||||
Cost of sales and other direct production costs | (5,950 | ) | (6,909 | ) | ||||
Depreciation, depletion and amortization | (673 | ) | (769 | ) | ||||
Gross profit | $ | 15,349 | $ | 16,007 | ||||
Tons of ore milled | 36,663 | 31,158 | ||||||
Production: | ||||||||
Silver (ounces) | 750,803 | 1,200,339 | ||||||
Gold (ounces) | 6,284 | 9,329 | ||||||
Payable metal quantities sold: | ||||||||
Silver (ounces) | 780,750 | 958,007 | ||||||
Gold (ounces) | 6,915 | 7,413 | ||||||
Ore grades: | ||||||||
Silver ounces per ton | 21.78 | 41.26 | ||||||
Gold ounces per ton | 0.183 | 0.322 | ||||||
Mining cost per ton | $ | 38.99 | $ | 103.72 | ||||
Milling cost per ton | $ | 64.15 | $ | 69.62 | ||||
Cash Cost, After By-product Credits, per Silver Ounce(1) | $ | (3.27 | ) | $ | (3.26 | ) | ||
AISC, After By-product Credits, per Silver Ounce(1) | $ | 0.43 | $ | (2.28 | ) | |||
(1) | A reconciliation of this non-GAAP measure to cost of sales and other direct production costs and depreciation, depletion and amortization, the most comparable GAAP measure, can be found below inReconciliation of Cost of Sales and Other Direct Production Costs and Depreciation, Depletion and Amortization (GAAP) to Cash Cost, Before By-product Credits and Cash Cost, After By-product Credits (non-GAAP) and All-In Sustaining Cost, Before By-product Credits and All-In Sustaining Cost, After By-product Credits (non-GAAP). |
The $0.7 million decrease in gross profit in the first quarter of 2017 compared to the same period of 2016 is primarily due to lower silver and gold production as a result of lower ore grades, partially offset by higher ore throughput. The ore processed in the first quarter of 2016 had considerably higher grades than anticipated over the mine life. The impact of lower metals production was partially offset by higher average silver and gold prices.
The chart below illustrates the factors contributing to Cash Cost, After By-product Credits, Per Silver Ounce for the first quarter of 2017 compared to the same period of 2016:
|
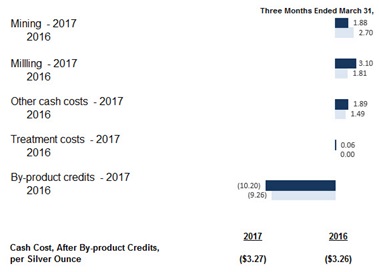
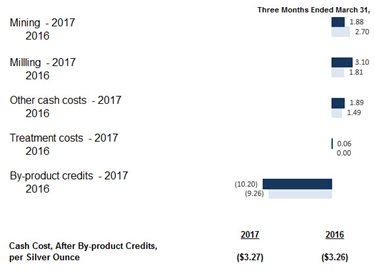
The following table summarizes the components of Cash Cost, After By-product Credits, per Silver Ounce:
Three Months Ended March 31, | ||||||||
2017 | 2016 | |||||||
Cash Cost, Before By-product Credits, per Silver Ounce | $ | 6.93 | $ | 6.00 | ||||
By-product credits | (10.20 | ) | (9.26 | ) | ||||
Cash Cost, After By-product Credits, per Silver Ounce | $ | (3.27 | ) | $ | (3.26 | ) | ||
The following table summarizes the components of AISC, After By-product Credits, per Silver Ounce:
Three Months Ended March 31, | ||||||||
2017 | 2016 | |||||||
AISC, Before By-product Credits, per Silver Ounce | $ | 10.63 | $ | 6.98 | ||||
By-product credits | (10.20 | ) | (9.26 | ) | ||||
AISC, After By-product Credits, per Silver Ounce | $ | 0.43 | $ | (2.28 | ) | |||
The slight decrease in Cash Cost, After By-product Credits, per Silver Ounce in the first quarter of 2017 compared to the same period of 2016 was primarily the result of higher by-product credits per ounce due to higher gold prices and the impact of lower silver production, partially offset by lower gold production, and lower mining costs as a result of reduced mining of waste. The increase in AISC, After By-product Credits, per Silver Ounce was the result of higher exploration and capital spending, partially offset by higher by-product credits per ounce.
The difference between what we report as "production" and "payable metal quantities sold" is mainly attributable to inventory changes incidental to the timing of sales of refined metals and shipping schedules.
We believe the identification of gold as a by-product credit is appropriate at San Sebastian because of its anticipated lower economic value compared to silver over the life of the mine. In addition, we will not receive sufficient revenue from gold at San Sebastian to warrant classification of such as a co-product. Because we consider gold to be a by-product of our silver production at San Sebastian, the value of gold offsets operating costs within our calculations of Cash Cost, After By-product Credits, per Silver Ounce and AISC, After By-product Credits, per Silver Ounce. In addition to the impact of the by-product credits from gold, Cash Cost, After By-product Credits, per Silver Ounce and AISC, After By-product Credits, per Silver Ounce at San Sebastian are lower compared to our other operations due to the orebody being near surface and having higher precious metal grades, resulting in a lower Cash Cost, Before By-product Credits, per Silver Ounce and AISC, After By-product Credits, per Silver Ounce.
In the first quarter of 2017, we began construction of a new underground ramp and rehabilitation of the historical underground access. Once completed, these underground accesses should allow us to mine deeper portions of the deposits at San Sebastian, and we anticipate underground ore production to begin in late 2017. Capital costs related to the underground development are expected to total approximately $5.0 million.
Corporate Matters
Employee Benefit Plans
Our defined benefit pension plans, while affording a significant benefit to our employees, also represent a significant liability to us. The liability recorded for the funded status of our plans was $46.9 million and $44.9 million as of March 31, 2017 and December 31, 2016, respectively. In April 2017, we contributed $1.2 million in cash to our defined benefits plans, and expect to contribute an additional $2.8 million in cash or shares of our common stock to our defined benefit plans in 2017. While the economic variables which will determine future funding requirements are uncertain, we expect contributions to continue to be required in future years under current plan provisions, and we periodically examine the plans for affordability and competitiveness. See Note 7 of Notes to Condensed Consolidated Financial Statements (Unaudited) for more information.
Income Taxes
Each reporting period we assess our deferred tax assets utilizing long-range forecasts to provide reasonable assurance that they will be realized through future earnings. We continue to have a net deferred tax asset in the U.S. and a net deferred tax liability in Canada.
Our U.S. net deferred tax asset at March 31, 2017 totaled $48.4 million, or 2% of total assets, an increase of $12.6 million from the $35.8 million net deferred tax asset at December 31, 2016. The largest component of the deferred tax asset is net operating loss carryforwards. The next largest component is deferred foreign exchange losses. We have previously determined that we are an indefinite AMT taxpayer, resulting in additional valuation allowance primarily related to forecasted utilization of regular net operating loss carryforwards and the effect of re-measuring temporary deferred tax assets using a tax rate of 20% which differed from the previous rate of 35%. During the fourth quarter of 2016, we determined that we are eligible to take a different income tax position relating to the timing of deductions for #4 Shaft development costs at Lucky Friday. We filed with the Internal Revenue Service ("IRS") a request for approval to use this method, which was approved in the first quarter of 2017. The change resulted in additional deductions of approximately $203 million and $110 million for regular tax and AMT, respectively, resulting in a current tax benefit of approximately $10.7 million for the reduction in 2016 AMT payable. In addition, this change in tax position substantially changes the timing of additional deductions for these costs for regular tax and AMT relative to our projected life of mine and projected taxable income. These timing changes caused us to change our assessment of the ability to generate sufficient future taxable income to realize our deferred tax assets, resulting in a valuation allowance decrease and deferred tax benefit of approximately $15.1 million in the first quarter of 2017. At March 31, 2017, we retained a valuation allowance on U.S. deferred tax assets of approximately $78 million, primarily for net operating loss carryforwards.
Our net Canadian deferred tax liability at March 31, 2017 was $121.0 million, a decrease of $1.9 million from the $122.9 million net deferred tax liability at December 31, 2016. The deferred tax liability is primarily related to the excess of the carrying value of the mineral resource assets over the tax bases of those assets for Canadian tax reporting.
We had no Mexican deferred tax asset or liability at March 31, 2017 or December 31, 2016. We expect to have unremitted earnings in Mexico by the end 2017; however, we anticipate being able to fully offset any U.S. tax impact of repatriating any Mexican earnings with foreign tax credits that are available to use for both regular tax and AMT. Accordingly, we estimate the net U.S. income tax impact of unremitted earnings to be zero. A $3.6 million valuation allowance remains on deferred tax assets in foreign jurisdictions.
Reconciliation of Cost of Sales and Other Direct Production Costs and Depreciation, Depletion and Amortization (GAAP)to Cash Cost, Before By-product Credits and Cash Cost, After By-product Credits (non-GAAP) and All-In Sustaining Cost (“AISC”("AISC"), Before By-product Credits and All-In Sustaining Cost, After By-product Credits (non-GAAP)
The tables below present reconciliations between the most comparable GAAP measure of cost of sales and other direct production costs and depreciation, depletion and amortization to the non-GAAP measures of Cash Cost, Before By-product Credits, Cash Cost, After By-product Credits, AISC, Before By-product Credits and AISC, After By-product Credits for our operations at the Greens Creek, Lucky Friday, San Sebastian and Casa Berardi units and for the Company for the three-month periods ended March 31, 2017 and 2016.
Cash Cost, After By-product Credits, per Ounce is an important operating statistic that we utilize to measure each mine's operating performance. We have recently started reporting AISC, After By-product Credits, per Ounce which we use as a measure of our mines' net cash flow after costs for exploration, pre-development, reclamation, and sustaining capital. This is similar to the Cash Cost, After By-product Credits, per Ounce non-GAAP measure we report, but also includes on-site exploration, reclamation, and sustaining capital costs. Current GAAP measures used in the mining industry, such as cost of goods sold, do not capture all the expenditures incurred to discover, develop and sustain silver and gold production. Cash Cost, After By-product Credits, per Ounce and AISC, After By-product Credits, per Ounce also allow us to benchmark the performance of each of our mines versus those of our competitors. As a primary silver mining company, we also use these statistics on an aggregate basis - aggregating the Greens Creek, Lucky Friday and San Sebastian mines - to compare our performance with that of other primary silver mining companies. With regard to Casa Berardi, we use Cash Cost, After By-product Credits, per Gold Ounce and AISC, After By-product Credits, per Gold Ounce to compare its performance with other gold mines. Similarly, these statistics are useful in identifying acquisition and investment opportunities as they provide a common tool for measuring the financial performance of other mines with varying geologic, metallurgical and operating characteristics.
Cash Cost, Before By-product Credits and AISC, Before By-product Credits include all direct and indirect operating cash costs related directly to the physical activities of producing metals, including mining, processing and other plant costs, third-party refining expense, on-site general and administrative costs, royalties and mining production taxes. AISC, Before By-product Credits for each mine also includes on-site exploration, reclamation, and sustaining capital costs. AISC, Before By-product Credits for our consolidated silver properties also includes corporate costs for general and administrative expense, exploration and sustaining capital projects. By-product credits include revenues earned from all metals other than the primary metal produced at each unit. As depicted in the tables below, by-product credits comprise an essential element of our silver unit cost structure, distinguishing our silver operations due to the polymetallic nature of their orebodies. Cash Cost, After By-product Credits, per Ounce and AISC, After By-product Credits, per Ounce provide management and investors an indication of operating cash flow, after consideration of the average price, received from production. We also use these measurements for the comparative monitoring of performance of our mining operations period-to-period from a cash flow perspective. Cash Cost, After By-product Credits, per Ounce is a measure developed by precious metals companies (including the Silver Institute) in an effort to provide a uniform standard for comparison purposes. There can be no assurance, however, that these non-GAAP measures as we report them are the same as those reported by other mining companies.
The Casa Berardi section below reports Cash Cost, After By-product Credits, per Gold Ounce and AISC, After By-product Credits, per Gold Ounce for the production of gold, its primary product, and by-product revenues earned from silver, which is a by-product at Casa Berardi. Only costs and ounces produced relating to units with the same primary product are combined to represent Cash Cost, After By-product Credits, per Ounce and AISC, After By-product Credits, per Ounce. Thus, the gold produced at our Casa Berardi unit is not included as a by-product credit when calculating CashCost, After By-product Credits, per Silver Ounce and AISC, After By-product Credits, per Silver Ounce for the total of Greens Creek, Lucky Friday and San Sebastian, our combined silver properties.
In thousands (except per ounce amounts) | Three Months Ended March 31, 2017 | |||||||||||||||||||||||||||
Greens Creek | Lucky Friday(2) | San Sebastian | Corporate(3) | Total Silver | Casa Berardi (Gold) | Total | ||||||||||||||||||||||
Cost of sales and other direct production costs and depreciation, depletion and amortization | $ | 43,996 | $ | 14,543 | $ | 6,623 | $ | 65,162 | $ | 42,466 | $ | 107,628 | ||||||||||||||||
Depreciation, depletion and amortization | (13,332 | ) | (2,433 | ) | (673 | ) | (16,438 | ) | (12,514 | ) | (28,952 | ) | ||||||||||||||||
Treatment costs | 14,131 | 3,817 | 225 | 18,173 | 571 | 18,744 | ||||||||||||||||||||||
Change in product inventory | 3,265 | (149 | ) | (380 | ) | 2,736 | 1,381 | 4,117 | ||||||||||||||||||||
Reclamation and other costs | (386 | ) | (182 | ) | (590 | ) | (1,158 | ) | (17 | ) | (1,175 | ) | ||||||||||||||||
Cash Cost, Before By-product Credits(1) | 47,674 | 15,596 | 5,205 | 68,475 | 31,887 | 100,362 | ||||||||||||||||||||||
Reclamation and other costs | 666 | 179 | 117 | 962 | 17 | 979 | ||||||||||||||||||||||
Exploration | 278 | 1 | 1,532 | 378 | 2,189 | 797 | 2,986 | |||||||||||||||||||||
Sustaining capital | 5,234 | 3,990 | 1,132 | 5 | 10,361 | 12,411 | 22,772 | |||||||||||||||||||||
General and administrative | 9,206 | 9,206 | 9,206 | |||||||||||||||||||||||||
AISC, Before By-product Credits(1) | 53,852 | 19,766 | 7,986 | 91,193 | 45,112 | 136,305 | ||||||||||||||||||||||
By-product credits: | ||||||||||||||||||||||||||||
Zinc | (23,779 | ) | (4,060 | ) | (27,839 | ) | (27,839 | ) | ||||||||||||||||||||
Gold | (14,852 | ) | (7,657 | ) | (22,509 | ) | (22,509 | ) | ||||||||||||||||||||
Lead | (7,782 | ) | (7,496 | ) | (15,278 | ) | (15,278 | ) | ||||||||||||||||||||
Silver | (147 | ) | (147 | ) | ||||||||||||||||||||||||
Total By-product credits | (46,413 | ) | (11,556 | ) | (7,657 | ) | (65,626 | ) | (147 | ) | (65,773 | ) | ||||||||||||||||
Cash Cost, After By-product Credits | $ | 1,261 | $ | 4,040 | $ | (2,452 | ) | $ | 2,849 | $ | 31,740 | $ | 34,589 | |||||||||||||||
AISC, After By-product Credits | $ | 7,439 | $ | 8,210 | $ | 329 | $ | 25,567 | $ | 44,965 | $ | 70,532 | ||||||||||||||||
Divided by ounces produced | 1,929 | 681 | 751 | 3,361 | 36 | |||||||||||||||||||||||
Cash Cost, Before By-product Credits, per Ounce | $ | 24.71 | $ | 22.90 | $ | 6.93 | $ | 20.37 | $ | 890.53 | ||||||||||||||||||
By-product credits per ounce | (24.06 | ) | (16.97 | ) | (10.20 | ) | (19.53 | ) | (4.11 | ) | ||||||||||||||||||
Cash Cost, After By-product Credits, per Ounce | $ | 0.65 | $ | 5.93 | $ | (3.27 | ) | $ | 0.84 | $ | 886.42 | |||||||||||||||||
AISC, Before By-product Credits, per Ounce | $ | 27.92 | $ | 29.03 | $ | 10.63 | $ | 27.13 | $ | 1,259.87 | ||||||||||||||||||
By-product credits per ounce | (24.06 | ) | (16.97 | ) | (10.20 | ) | (19.53 | ) | (4.11 | ) | ||||||||||||||||||
AISC, After By-product Credits, per Ounce | $ | 3.86 | $ | 12.06 | $ | 0.43 | $ | 7.60 | $ | 1,255.76 | ||||||||||||||||||
In thousands (except per ounce amounts) | Three Months Ended March 31, 2016 | |||||||||||||||||||||||||||
Greens Creek | Lucky Friday(2) | San Sebastian | Corporate(3) | Total Silver | Casa Berardi (Gold) | Total | ||||||||||||||||||||||
Cost of sales and other direct production costs and depreciation, depletion and amortization | $ | 44,854 | $ | 18,505 | $ | 7,677 | $ | 71,036 | $ | 29,159 | $ | 100,195 | ||||||||||||||||
Depreciation, depletion and amortization | (13,601 | ) | (3,004 | ) | (769 | ) | (17,374 | ) | (8,501 | ) | (25,875 | ) | ||||||||||||||||
Treatment costs | 15,638 | 5,334 | (9 | ) | 20,963 | 171 | 21,134 | |||||||||||||||||||||
Change in product inventory | 1,640 | (21 | ) | 340 | 1,959 | 3,118 | 5,077 | |||||||||||||||||||||
Reclamation and other costs | (398 | ) | (166 | ) | (41 | ) | (605 | ) | (111 | ) | (716 | ) | ||||||||||||||||
Cash Cost, Before By-product Credits(1) | 48,133 | 20,648 | 7,198 | 75,979 | 23,836 | 99,815 | ||||||||||||||||||||||
Reclamation and other costs | 682 | 165 | 42 | 889 | 111 | 1,000 | ||||||||||||||||||||||
Exploration | 488 | — | 650 | 473 | 1,611 | 717 | 2,328 | |||||||||||||||||||||
Sustaining capital | 6,376 | 12,266 | 490 | 37 | 19,169 | 15,611 | 34,780 | |||||||||||||||||||||
General and administrative | 10,214 | 10,214 | 10,214 | |||||||||||||||||||||||||
AISC, Before By-product Credits(1) | 55,679 | 33,079 | 8,380 | 107,862 | 40,275 | 148,137 | ||||||||||||||||||||||
By-product credits: | ||||||||||||||||||||||||||||
Zinc | (15,684 | ) | (3,133 | ) | (18,817 | ) | (18,817 | ) | ||||||||||||||||||||
Gold | (16,340 | ) | (11,116 | ) | (27,456 | ) | (27,456 | ) | ||||||||||||||||||||
Lead | (6,384 | ) | (8,673 | ) | (15,057 | ) | (15,057 | ) | ||||||||||||||||||||
Silver | (103 | ) | (103 | ) | ||||||||||||||||||||||||
Total By-product credits | �� | (38,408 | ) | (11,806 | ) | (11,116 | ) | (61,330 | ) | (103 | ) | (61,433 | ) | |||||||||||||||
Cash Cost, After By-product Credits | $ | 9,725 | $ | 8,842 | $ | (3,918 | ) | $ | 14,649 | $ | 23,733 | $ | 38,382 | |||||||||||||||
AISC, After By-product Credits | $ | 17,271 | $ | 21,273 | $ | (2,736 | ) | $ | 46,532 | $ | 40,172 | $ | 86,704 | |||||||||||||||
Divided by ounces produced | 2,458 | 977 | 1,200 | 4,635 | 30 | |||||||||||||||||||||||
Cash Cost, Before By-product Credits, per Ounce | $ | 19.58 | $ | 21.13 | $ | 6.00 | $ | 16.39 | $ | 784.66 | ||||||||||||||||||
By-product credits per ounce | (15.62 | ) | (12.08 | ) | (9.26 | ) | (13.23 | ) | (3.39 | ) | ||||||||||||||||||
Cash Cost, After By-product Credits, per Ounce | $ | 3.96 | $ | 9.05 | $ | (3.26 | ) | $ | 3.16 | $ | 781.27 | |||||||||||||||||
AISC, Before By-product Credits, per Ounce | $ | 22.65 | $ | 33.86 | $ | 6.98 | $ | 23.27 | $ | 1,325.79 | ||||||||||||||||||
By-product credits per ounce | (15.62 | ) | (12.08 | ) | (9.26 | ) | (13.23 | ) | (3.39 | ) | ||||||||||||||||||
AISC, After By-product Credits, per Ounce | $ | 7.03 | $ | 21.78 | $ | (2.28 | ) | $ | 10.04 | $ | 1,322.40 | |||||||||||||||||
(1) | Includes all direct and indirect operating costs related directly to the physical activities of producing metals, including mining, processing and other plant costs, third-party refining and marketing expense, on-site general and administrative costs, royalties and mining production taxes, after by-product revenues earned from all metals other than the primary metal produced at each unit. AISC, Before By-product Credits also includes on-site exploration, reclamation, and sustaining capital costs. |
(2) | The unionized employees at Lucky Friday have been on strike since March 13, 2017, and production at Lucky Friday has been suspended since that time. Costs related to the suspension period totaling approximately $1.6 million in the first quarter of 2017 have been excluded from the calculations of cost of sales and other direct production costs and depreciation, depletion and amortization, Cash Cost, Before By-product Credits, Cash Cost, After By-product Credits, AISC, Before By-product Credits, and AISC, After By-product Credits. |
(3) | AISC, Before By-product Credits for our consolidated silver properties includes corporate costs for general and administrative expense, exploration and sustaining capital. |
Financial Liquidity and Capital Resources
Our liquid assets include (in millions):
March 31, 2017 | December 31, 2016 | |||||||
Cash and cash equivalents held in U.S. dollars | $ | 152.2 | $ | 156.1 | ||||
Cash and cash equivalents held in foreign currency | 24.6 | 13.7 | ||||||
Total cash and cash equivalents | 176.8 | 169.8 | ||||||
Marketable debt securities, current | 36.5 | 29.1 | ||||||
Marketable equity securities, non-current | 5.1 | 5.0 | ||||||
Total cash, cash equivalents and investments | $ | 218.4 | $ | 203.9 | ||||
Cash and cash equivalents increased by $7.0 million in the first three months of 2017, as discussed below. Cash held in foreign currencies represents balances in Canadian dollars and Mexican pesos, with the $10.9 million increase in the first quarter of 2017 resulting primarily from an increase in Mexican pesos held. Current marketable debt securities increased by $7.4 million (discussed below), and the value of non-current marketable equity securities increased by $0.1 million (seeNote 2 ofNotes to Condensed Consolidated Financial Statements (Unaudited) for more information).
As discussed inNote 9 ofNotes to Condensed Consolidated Financial Statements (Unaudited),on April 12, 2013, we completed an offering of Senior Notes in the total principal amount of US$500 million, which have a total principal balance of $506.5 million as of March 31, 2017.The Senior Notes are due May 1, 2021 and bear interest at a rate of 6.875% per year from the most recent payment date to which interest has been paid or provided for. Interest on the Senior Notes is payable on May 1 and November 1 of each year, commencing November 1, 2013, and we have made all interest payments payable to date.
In the third quarter of 2015, we made a development decision to mine near surface, high grade portions of the silver and gold deposits at our San Sebastian project in Mexico and commenced ore production at the end of 2015. As a result, San Sebastian has generated positive cash flows since the start of production there. In January 2017, we initiated work to develop and rehabilitate underground access which, upon completion, would allow us to mine deeper portions of the deposits at San Sebastian. We anticipate San Sebastian will continue to generate positive cash flows in 2017 and 2018. However, our estimate of costs could change, and our ability to generate cash flow at San Sebastian could be impacted by changes in precious metals prices or other factors, and there can be no assurance that we will be able to develop and operate San Sebastian as anticipated.
As further discussed in theLucky Friday Segment section above, the union employees at Lucky Friday have been on strike since March 13, 2017, and production at Lucky Friday has been suspended since that time. We cannot predict how long the strike will last or whether an agreement will be reached. As a result of the strike or other related events, operations at Lucky Friday could continue to be disrupted, which could adversely affect our financial condition and results of operations.
As discussed inNote 8 ofNotes to Condensed Consolidated Financial Statements (Unaudited), in February 2016 we entered into an equity distribution agreement under which we may issue and sell shares of our common stock from time to time having an aggregate offering price of up to $75 million, with the net proceeds available for general corporate purposes. Whether or not we engage in sales from time to time may depend on a variety of factors, including share price, our cash resources, customary black-out restrictions, and whether we have any material inside information, and the agreement can be terminated by us at any time. As of March 31, 2017, we had sold 2,780,087 shares through the at-the-market program for net proceeds of $8.1 million.
Pursuant to our common stock dividend policy described inNote 8 ofNotes to Condensed Consolidated Financial Statements (Unaudited), our Board of Directors declared and paid dividends on common stock totaling $1.0 million in the first quarter of each of 2017 and 2016. On May X,4, 2017, our Board of Directors declared a dividend on common stock totaling $1.0 million payable in June 2017. Our dividend policy has a silver-price-linked component which ties the amount of declared common stock dividends to our realized silver price for the preceding quarter. Another component of our common stock dividend policy anticipates paying an annual minimum dividend. The declaration and payment of dividends on common stock is at the sole discretion of our board of directors, and there can be no assurance that we will continue to declare and pay common stock dividends in the future.
On May 8, 2012, we announced that our board of directors approved a stock repurchase program. Under the program, we are authorized to repurchase up to 20 million shares of our outstanding common stock from time to time in open market or privately negotiated transactions, depending on prevailing market conditions and other factors. The repurchase program may be modified, suspended or discontinued by us at any time. Whether or not we engage in repurchases from time to time may depend on a variety of factors, including not only price and cash resources, but customary black-out restrictions, whether we have any material inside information, limitations on share repurchases or cash usage that may be imposed by our credit agreement or in connection with issuances of securities, alternative uses for cash, applicable law, and other investment opportunities from time to time.As of March 31, 2017, 934,100 shares have been purchased in prior periods at an average price of $3.99 per share, leaving 19.1 million shares that may yet be purchased under the program. The closing price of our common stock at May 4, 2017, was $5.14 per share.
We may defer some capital investment and/or exploration and pre-development activities, engage in asset sales or secure additional capital if necessary to maintain liquidity. We also may pursue additional acquisition opportunities, which could require additional equity issuances or other forms of financing. There can be no assurance that such financing will be available to us.
As a result of our current cash balances, the performance of our current and expected operations, current metals prices, proceeds from potential at-the-market sales of common stock, and full availability of our $100 million revolving credit facility, we believe our cash, cash equivalents, investments, projected cash from operations, and availability of financing (including equity issuances), if needed, will be adequate to meet our obligations and other potential cash requirements during the next 12 months. Our obligations and other uses of cash may include, but are not limited to: debt service obligations related to the Senior Notes, capital expenditures at our operations, potential acquisitions of other mining companies or properties, regulatory matters, litigation, potential repurchases of our common stock under the program described above, and payment of dividends on common stock, if declared by our board of directors. Capital expenditures are closely tied to operations, and because mining at Lucky Friday has halted due to the strike and we cannot predict how long the strike will last, we currently do not have an estimate of capital expenditures for the full year of 2017. We incurred $21.7 million in capital expenditures in the first three months of March 31, 2017. We estimate that exploration and pre-development expenditures will total between $25 million and $30 million in 2017, including $5.8 million already incurred as of March 31, 2017. However, capital, exploration, and pre-development expenditures may change based upon our financial position, metals prices, and other considerations. Our ability to fund the activities described above will depend on our operating performance, metals prices, our ability to estimate costs, sources of liquidity available to us, and other factors. A sustained downturn in metals prices or significant increase in operational or capital costs, other uses of cash, or other factors beyond our control could impact our plans.
Three Months Ended | ||||||||||
March 31, 2017 | March 31, 2016 | |||||||||
Cash provided by operating activities (in millions) | $ | 38.3 | $ | 18.7 | ||||||
Cash provided by operating activities in the first quarter of 2017 increased by $19.6 million compared to the same period in 2016. The increase was primarily due to working capital and other operating asset and liability changes which resulted in a net cash flow increasedecrease of $21.7$7.4 million in the first three months of 2017 compared to a net decrease in cash flows of $21.5 million in the 2016 period. The $0.2$14.1 million variance in working capital changes is attributed to lower accounts receivable due to the timing of sales at Greens Creek and Casa Berardi and higher payroll accruals due to the timing of payment of incentive compensation related to prior year performance. In addition, income, as adjusted for non-cash items, was higher by $19.5$5.5 million, due primarily to higher metals prices.
Three Months Ended | ||||||||
March 31, 2017 | March 31, 2016 | |||||||
Cash used in investing activities (in millions) | $ | (29.1 | ) | $ | (38.3 | ) | ||
Three Months Ended | ||||||||
March 31, 2017 | March 31, 2016 | |||||||
Cash used in investing activities (in millions) | $ | (29.1 | ) | $ | (38.3 | ) | ||
During the first quarter of 2017 we invested $21.7 million in capital expenditures, not including $1.8 million in capital lease additions, compared to $34.7 million in the same period in 2016, with the variance primarily due to lower costs for the #4 Shaft project, which was completed in January 2017. During the first quarter of 2017, we purchased bonds having a cost basis of $11.1 million and maturities of greater than 90 days and less than 365 days. Bonds valued at $3.6 million matured during the first quarter of 2017. We incurred an increase in restricted cash of $3.9 million in the first quarter of 2016 related to the settlement of response costs at the Gilt Edge site by CoCa Mines, Inc., our wholly-owned subsidiary.
Three Months Ended | ||||||||
March 31, 2017 | March 31, 2016 | |||||||
Cash used in financing activities (in millions) | $ | (4.0 | ) | $ | (3.1 | ) | ||
Three Months Ended | ||||||||
March 31, 2017 | March 31, 2016 | |||||||
Cash used in financing activities (in millions) | $ | (4.0 | ) | $ | (3.1 | ) | ||
We paid cash dividends of $1.0 million on our common stock and cash dividends of $0.1 million on our Series B Preferred Stock during the first quarter of each of 2017 and 2016. We made repayments on our capital leases of $1.6 million and $2.1 million, respectively, in the first quarter of 2017 and 2016. In the first quarter of 2017 and 2016, we also made repayments of debt totaling $0.5 million and $0.7 million, respectively. In addition, during the first quarter of 2017 and 2016, we acquired treasury shares for $0.7 million and $1.3 million, respectively, as the result of employees' elections to satisfy their tax withholding obligations related to incentive compensation paid in stock through net share settlement. SeeNote 8 ofNotes to Condensed Consolidated Financial Statements (Unaudited)for more information. During the first quarter of 2016, we received $2.1 million in proceeds from the sale of shares of our common stock under the equity distribution agreement discussed above.
Contractual Obligations, Contingent Liabilities and Commitments
The table below presents our fixed, non-cancelable contractual obligations and commitments primarily related to our Senior Notes, outstanding purchase orders, certain capital expenditures, our credit facility and lease arrangements as of March 31, 2017 (in thousands):
Payments Due By Period | ||||||||||||||||||||
Less than 1 year | 1-3 years | 4-5 years | More than 5 years | Total | ||||||||||||||||
Purchase obligations(1) | $ | 11,810 | $ | — | $ | — | $ | — | $ | 11,810 | ||||||||||
Commitment fees(2) | 500 | 317 | — | — | 817 | |||||||||||||||
Contractual obligations(3) | 1,769 | — | — | — | 1,769 | |||||||||||||||
Capital lease commitments(4) | 5,988 | 5,717 | 604 | — | 12,309 | |||||||||||||||
Operating lease commitments(5) | 4,045 | 3,074 | 1,556 | 476 | 9,151 | |||||||||||||||
Supplemental executive retirement plan(6) | 428 | 991 | 1,296 | 4,169 | 6,884 | |||||||||||||||
Defined benefit pension plans(6) | 3,986 | — | — | — | 3,986 | |||||||||||||||
Senior Notes(7) | 34,822 | 69,644 | 544,224 | — | 648,690 | |||||||||||||||
Total contractual cash obligations | $ | 63,348 | $ | 79,743 | $ | 547,680 | $ | 4,645 | $ | 695,416 | ||||||||||
(1) | Consist of open purchase orders of approximately $9.5 million at the Greens Creek unit, $0.2 million at the Lucky Friday unit and $2.1 million at the Casa Berardi unit. |
(2) | We have a $100 million revolving credit agreement under which we are required to pay a standby fee of 0.5% per annum on undrawn amounts under the revolving credit agreement. There was no amount drawn under the revolving credit agreement as of March 31, 2017, and the amounts above assume no amounts will be drawn during the agreement's term. For more information on our credit facility, seeNote 9 ofNotes to Condensed Consolidated Financial Statements (Unaudited). |
(3) | As of March 31, 2017, we were committed to approximately $1.8 million for various items. |
(4) | Includes scheduled capital lease payments of $3.4 million, $4.7 million, and $4.2 million (including interest), respectively, for equipment at our Greens Creek, Lucky Friday and Casa Berardi units. These leases have fixed payment terms and contain bargain purchase options at the end of the lease periods (seeNote 9 ofNotes to Condensed Consolidated Financial Statements (Unaudited) for more information). |
(5) | We enter into operating leases in the normal course of business. Substantially all lease agreements have fixed payment terms based on the passage of time. Some lease agreements provide us with the option to renew the lease or purchase the leased property. Our future operating lease obligations would change if we exercised these renewal options and if we entered into additional operating lease arrangements. |
(6) | We sponsor defined benefit pension plans covering substantially all U.S. employees and provide certain post-retirement benefits for qualifying retired employees, along with a supplemental executive retirement plan. These amounts represent our estimate of the future funding requirements for these plans. We believe we will have funding requirements related to our defined benefit plans beyond one year; however, such obligations are not fixed in nature and are difficult to estimate, as they involve significant assumptions. SeeNote 7 ofNotes to Condensed Consolidated Financial Statements (Unaudited) for more information. |
(7) | On April 12, 2013, we completed an offering of $500 million in aggregate principal amount of our Senior Notes due May 1, 2021. The Senior Notes bear interest at a rate of 6.875% per year from the date of original issuance or from the most recent payment date to which interest has been paid or provided for. Interest on the Senior Notes is payable on May 1 and November 1 of each year, commencing November 1, 2013, and we have made all interest payments payable to date. Since the initial offering, we have issued an additional $6.5 million in aggregate principal amount of the Senior Notes to fund obligations under our defined benefit pension plan. SeeNote 9ofNotes to Condensed Consolidated Financial Statements (Unaudited) for more information. |
We record liabilities for costs associated with mine closure, reclamation of land and other environmental matters. At March 31, 2017, our liabilities for these matters totaled $86.8 million. Future expenditures related to closure, reclamation and environmental expenditures at our sites are difficult to estimate, although we anticipate we will incur expenditures relating to these obligations over the next 30 years. For additional information relating to our environmental obligations, seeNote 4 ofNotes to Condensed Consolidated Financial Statements (Unaudited).
Off-Balance Sheet Arrangements
At March 31, 2017, we had no existing off-balance sheet arrangements, as defined under SEC regulations, that have or are reasonably likely to have a current or future effect on our financial condition, revenues or expenses, results of operations, liquidity, capital expenditures or capital resources that are material to investors.
Critical Accounting Estimates
Our significant accounting policies are described inNote 1 ofNotes to Consolidated Financial Statements in our annual report filed on Form 10-K for the year ended December 31, 2016. As described inNote 1of the annual report, we are required to make estimates and assumptions that affect the reported amounts and related disclosures of assets, liabilities, revenue, and expenses. Our estimates are based on our experience and our interpretation of economic, political, regulatory, and other factors that affect our business prospects. Actual results may differ significantly from our estimates.
We believe that our most critical accounting estimates are related to future metals prices; obligations for environmental, reclamation, and closure matters; mineral reserves; and accounting for business combinations, as they require us to make assumptions that were highly uncertain at the time the accounting estimates were made and changes in them are reasonably likely to occur from period to period. Management has discussed the development and selection of these critical accounting estimates with the Audit Committee of our Board of Directors, and the Audit Committee has reviewed the disclosures presented below. In addition, there are other items within our financial statements that require estimation, but are not deemed to be critical. However, changes in estimates used in these and other items could have a material impact on our financial statements.
Future Metals Prices
Metals prices are key components in estimates that determine the valuation of some of our significant assets and liabilities, including properties, plants and equipment, deferred tax assets, and certain accounts receivable. Metals prices are also an important component in the estimation of reserves. As shown underItem 1A. - Risk Factorsin our annual report filed on Form 10-K for the year ended December 31, 2016, metals prices have historically been volatile. Silver demand arises from investment demand, particularly in exchange-traded funds, industrial demand, and consumer demand. Gold demand arises primarily from investment and consumer demand. Investment demand for silver and gold is influenced by various factors, including: the value of the U.S. Dollar and other currencies, changing U.S. budget deficits, widening availability of exchange-traded funds, interest rate levels, the health of credit markets, and inflationary expectations. Uncertainty related to the political environment in the U.S., Britain's exit from the European Union and a global economic recovery, including recent uncertainty in China, could result in continued investment demand for precious metals. Industrial demand for silver is closely linked to world Gross Domestic Product growth and industrial fabrication levels, as it is difficult to substitute for silver in industrial fabrication. Consumer demand is driven significantly by demand for jewelry and other retail products. We believe that long-term industrial and economic trends, including urbanization and growth of the middle class in countries such as China and India, will result in continued consumer demand for silver and gold and industrial demand for silver. However, China has recently experienced a lower rate of economic growth which could continue in the near term. There can be no assurance whether these trends will continue or how they will impact prices of the metals we produce. In the past, we have recorded impairments to our asset carrying value because of low prices, and we can offer no assurance that prices will either remain at their current levels or increase.
Processes supporting valuation of our assets and liabilities that are most significantly affected by prices include analysis of asset carrying values, depreciation, reserves, and deferred income taxes. On at least an annual basis - and more frequently if circumstances warrant - we examine our depreciation rates, reserve estimates, and the valuation allowances on our deferred tax assets. We examine the carrying values of our assets as changes in facts and circumstances warrant. In our evaluation of carrying values and deferred taxes, we apply several pricing views to our forecasting model, including current prices, analyst price estimates, forward-curve prices, and historical prices (seeMineral Reserves, below, regarding prices used for reserve estimates). Using applicable accounting guidance and our view of metals markets, we use the probability-weighted average of the various methods to determine whether the values of our assets are fairly stated, and to determine the level of valuation allowances, if any, on our deferred tax assets. In addition, estimates of future metals prices are used in the valuation of certain assets in the determination of the purchase price allocations for our acquisitions (seeBusiness Combinations below).
Sales of concentrates sold directly to customers are recorded as revenues when title and risk of loss transfer to the customer (generally at the time of shipment) at estimated forward metals prices for the estimated month of settlement. Due to the time elapsed between the time of shipment of concentrates to the customer and final settlement with the customer, we must estimate the prices at which sales of our metals will be settled. Previously recorded sales and trade accounts receivable are adjusted to estimated settlement metals prices until final settlement by the customer. Changes in metals prices between shipment and final settlement result in changes to revenues and accounts receivable previously recorded upon shipment. As a result, our trade accounts receivable balances related to concentrate sales are subject to changes in metals prices until final settlement occurs. For more information, see part N. Revenue Recognition ofNote 1 ofNotes to Consolidated Financial Statementsin our annual report filed on Form 10-K for the year ended December 31, 2016.
We utilize financially-settled forward contracts to manage our exposure to changes in prices for silver, gold, zinc and lead. SeeItem 7A. Quantitative and Qualitative Disclosures About Market Risk - Commodity-Price Risk Management below for more information on our contract programs. These contracts do not qualify for hedge accounting and are therefore marked-to-market through earnings each period. Changes in silver, gold, zinc and lead prices between the dates that the contracts are entered into and their settlements will result in changes to the fair value asset or liability associated with the contracts, with a corresponding gain or loss recognized in earnings.
Obligations for Environmental, Reclamation and Closure Matters
Accrued reclamation and closure costs can represent a significant and variable liability on our balance sheet. We have estimated our liabilities under appropriate accounting guidance, and on at least an annual basis - and more frequently if warranted - management reviews our liabilities with our Audit Committee. However, the ranges of liability could exceed the liabilities recognized. If substantial damages were awarded, claims were settled, or remediation costs incurred in excess of our accruals, our financial results or condition could be materially adversely affected.
Mineral Reserves
Critical estimates are inherent in the process of determining our reserves. Our reserves are affected largely by our assessment of future metals prices, as well as by engineering and geological estimates of ore grade, accessibility and production cost. Metals prices are estimated at long-term averages, as described inItem 2. - Property Descriptionsin our annual report filed on Form 10-K for the year ended December 31, 2016. Our assessment of reserves occurs at least annually, and periodically utilizes external audits.
Reserves are a key component in the valuation of our properties, plants and equipment. Reserve estimates are used in determining appropriate rates of units-of-production depreciation, with net book value of many assets depreciated over remaining estimated reserves. Reserves are also a key component in forecasts, with which we compare future cash flows to current asset values in an effort to ensure that carrying values are reported appropriately. Our forecasts are also used in determining the level of valuation allowances on our deferred tax assets. Reserves also play a key role in the valuation of certain assets in the determination of the purchase price allocations for acquisitions. Annual reserve estimates are also used to determine conversions of mineral assets beyond the known reserve resulting from business combinations to depreciable reserves, in periods subsequent to the business combinations (seeBusiness Combinations below). Reserves are a culmination of many estimates and are not guarantees that we will recover the indicated quantities of metals or that we will do so at a profitable level.
Business Combinations
We are required to allocate the purchase price of acquired companies to the tangible and intangible assets acquired and liabilities assumed based on their estimated fair values at the acquisition date. The valuation of assets acquired and liabilities assumed requires management to make significant estimates and assumptions, especially with respect to long-lived assets (including mineral assets beyond the known reserve); these include estimates of future metals prices and mineral reserves, as discussed above. Management may also be required to make estimates related to the valuation of deferred tax assets or liabilities as part of the the purchase price allocation for business combinations. In some cases, we use third-party appraisers to determine the fair values and lives of property and other identifiable assets. In addition, costs related to business combinations are included in earnings as incurred, and our financial results for periods in which business combinations are pursued could be adversely affected as a result.
Item3. Quantitative and Qualitative Disclosures About Market Risk
The following discussion about our risk management activities includes forward-looking statements that involve risk and uncertainties, as well as summarizes the financial instruments held by us at March 31, 2017, which are sensitive to changes in commodity prices and foreign exchange rates and are not held for trading purposes. Actual results could differ materially from those projected in the forward-looking statements. In the normal course of business, we also face risks that are either non-financial or non-quantifiable (SeePart II,Item 1A. – Risk Factors of our annual report filed on Form 10-K for the year ended December 31, 2016).
Provisional Sales
Sales of all metals products sold directly to customers, including by-product metals, are recorded as revenues when title and risk of loss transfers to the customer (generally at the time of shipment) at forward prices for the estimated month of settlement. Due to the time elapsed between shipment to the customer and the final settlement with the customer we must estimate the prices at which sales of our metals will be settled. Previously recorded sales are adjusted to estimated settlement metals prices until final settlement by the customer. Changes in metals prices between shipment and final settlement will result in changes to revenues previously recorded upon shipment. Metals prices can and often do fluctuate widely and are affected by numerous factors beyond our control (seeItem 1A – Risk Factors –A substantial or extended decline in metals prices would have a material adverse effect on usin our annual report filed on Form 10-K for the year ended December 31, 2016). At March 31, 2017, metals contained in concentrates and exposed to future price changes totaled approximately 1.5 million ounces of silver, 6,313 ounces of gold, 11,108 tons of zinc, and 2,180 tons of lead. If the price for each metal were to change by 10%, the change in the total value of the concentrates sold would be approximately $6.7 million. However, as discussed inCommodity-Price Risk Management below, we utilize a program designed and intended to mitigate the risk of negative price adjustments with limited mark-to-market financially-settled forward contracts for our silver, gold, zinc and lead sales.
Commodity-Price Risk Management
At times, we may use commodity forward sales commitments, commodity swap contracts and commodity put and call option contracts to manage our exposure to fluctuation in the prices of certain metals which we produce. Contract positions are designed to ensure that we will receive a defined minimum price for certain quantities of our production, thereby partially offsetting our exposure to fluctuations in the market. Our risk management policy allows for up to 75% of our planned metals price exposure for five years into the future, with certain other limitations, to be hedged under such programs. These instruments do, however, expose us to (i) credit risk in the event of non-performance by counterparties for contracts in which the contract price exceeds the spot price of a commodity and (ii) price risk to the extent that the spot price exceeds the contract price for quantities of our production covered under contract positions.
We are currently using financially-settled forward contracts to manage the exposure to changes in prices of silver, gold, zinc and lead contained in our concentrate shipments between the time of shipment and final settlement. In addition, we are using financially-settled forward contracts to manage the exposure to changes in prices of zinc and lead (but not silver and gold) contained in our forecasted future concentrate shipments. These contracts do not qualify for hedge accounting and are marked-to-market through earnings each period.
As of March 31, 2017, we recorded the following balances for the fair value of the contracts:
a current asset of $0.2 million, which is included in other current assets;
a current liability of $2.0 million, which is included in other current liabilities and is net of $0.7 million for contracts in a fair value current asset position; and
a non-current liability of $0.4 million, which is included in other non-current liabilities and is net of $0.2 million for contracts in a fair value non-current asset position.
We recognized a $4.1 million net loss during the first quarter of 2017 on the contracts utilized to manage exposure to prices of metals in our concentrate shipments, which is included in sales of products. The net loss recognized on the contracts offsets gains related to price adjustments on our provisional concentrate sales due to changes to silver, gold, lead and zinc prices between the time of sale and final settlement.
We recognized a $7.8 million net loss during the first quarter of 2017 on the contracts utilized to manage exposure to prices for forecasted future concentrate shipments. The net loss on these contracts is included as a separate line item under other income (expense), as they relate to forecasted future shipments, as opposed to sales that have already taken place but are subject to final pricing as discussed in the preceding paragraph. The net loss for the first quarter of 2017 is the result of higher zinc and lead prices. This program, when utilized, is designed to mitigate the impact of potential future declines in lead and zinc prices from the price levels established in the contracts (see average price information below).6. Exhibits
The following tables summarize the quantities of metals committed under forward sales contracts at March 31, 2017 and December 31, 2016:
March 31, 2017 | Ounces/pounds under contract (in 000's) | Average price per ounce/pound | ||||||||||||||||||||||||||||||
Silver | Gold | Zinc | Lead | Silver | Gold | Zinc | Lead | |||||||||||||||||||||||||
(ounces) | (ounces) | (pounds) | (pounds) | (ounces) | (ounces) | (pounds) | (pounds) | |||||||||||||||||||||||||
Contracts on provisional sales | ||||||||||||||||||||||||||||||||
2017 settlements | 1,455 | 6 | 20,999 | 4,079 | $ | 18.10 | $ | 1,245 | $ | 1.27 | $ | 1.03 | ||||||||||||||||||||
Contracts on forecasted sales | ||||||||||||||||||||||||||||||||
2017 settlements | — | — | 17,527 | 11,133 | N/A | N/A | $ | 1.23 | $ | 1.05 | ||||||||||||||||||||||
2018 settlements | — | — | 20,613 | 9,700 | N/A | N/A | $ | 1.23 | $ | 1.06 | ||||||||||||||||||||||
2019 settlements | — | — | 1,102 | — | N/A | N/A | $ | 1.21 | N/A | |||||||||||||||||||||||
December 31, 2016 | Ounces/pounds under contract (in 000's) | Average price per ounce/pound | ||||||||||||||||||||||||||||||
Silver | Gold | Zinc | Lead | Silver | Gold | Zinc | Lead | |||||||||||||||||||||||||
(ounces) | (ounces) | (pounds) | (pounds) | (ounces) | (ounces) | (pounds) | (pounds) | |||||||||||||||||||||||||
Contracts on provisional sales | ||||||||||||||||||||||||||||||||
2017 settlements | 1,295 | 4 | 19,070 | 7,441 | $ | 16.29 | $ | 1,172 | $ | 1.18 | $ | 0.97 | ||||||||||||||||||||
Contracts on forecasted sales | ||||||||||||||||||||||||||||||||
2017 settlements | — | — | 35,384 | 17,637 | N/A | N/A | $ | 1.19 | $ | 1.03 | ||||||||||||||||||||||
2018 settlements | — | — | 13,779 | 5,732 | N/A | N/A | $ | 1.21 | $ | 1.05 | ||||||||||||||||||||||
Our concentrate salesexhibits are based on a provisional sales price containing an embedded derivative that is required to be separated from the host contract for accounting purposes. The host contract is the receivable from the sale of the concentrates at the forward price at the time of the sale. The embedded derivative, which does not qualify for hedge accounting, is marked-to-market through earnings each period prior to final settlement.
Foreign Currency
We operate or have mining interests in Canada and Mexico, which exposes us to risks associated with fluctuations in the exchange rates between the U.S. dollar and the Canadian dollar and Mexican peso. We have determined that the functional currency for our Canadian and Mexican operations is the USD. As such, foreign exchange gains and losses associated with the re-measurement of monetary assets and liabilities from CAD and MXN to USD are recorded to earnings each period. For the three months ended March 31, 2017, we recognized a net foreign exchange loss of $2.3 million. Foreign currency exchange rates are influenced by a number of factors beyond our control. A 10% change in the exchange rate between the USD and CAD from the rate at March 31, 2017 would have resulted in a change of approximately $13.7 million in our net foreign exchange gain or loss. A 10% change in the exchange rate between the USD and MXN from the rate at March 31, 2017 would have resulted in a change of approximately $0.9 million in our net foreign exchange gain or loss.
In April 2016, we initiated a program to manage our exposure to fluctuations in the exchange rate between the USD and CAD and the impact on our future operating costs denominated in CAD. In October 2016, we also initiated a program to manage our exposure to the impact of fluctuations in the exchange rate between the USD and MXN on our future operating costs denominated in MXN. The programs utilize forward contracts to buy CAD and MXN, and each contract is designatedfiled as a cash flow hedge. Aspart of March 31, 2017, we have 118 forward contracts outstanding to buy CAD$260.1 million having a notional amount of USD$200.0 million, and 18 forward contracts outstanding to buy MXN$150.0 million having a notional amount of USD$7.6 million. The CAD contracts represent between approximately 20% and 75% of our annual forecasted cash operating costs at Casa Berardi from 2017 through 2020 and have CAD-to-USD exchange rates ranging between 1.2787 and 1.3380. The MXN contracts represent approximately 75% of our forecasted cash operating costs at San Sebastian for 2017 and have MXN-to-USD exchange rates ranging between 19.1956 and 21.0000. Our risk management policy allows for up to 75% of our planned cost exposure for five years into the future to be hedged under such programs, and for potential additional programs to manage other foreign currency-related exposure areas.
As of March 31, 2017, we recorded the following balances for the fair value of the contracts:
a current asset of $0.2 million, which is included in other current assets;
a non-current asset of $0.1 million, which is included in other non-current assets;
a current liability of $1.6 million, which is included in other current liabilities, and
a non-current liability of $1.2 million, which is included in other non-current liabilities.
Net unrealized losses of approximately $2.0 million related to the effective portion of the hedges were included in accumulated other comprehensive income as of March 31, 2017, and are net of related deferred taxes. Unrealized gains and losses will be transferred from accumulated other comprehensive loss to current earnings as the underlying operating expenses are recognized. We estimate approximately $1.4 million in net unrealized losses included in accumulated other comprehensive income as of March 31, 2017 would be reclassified to current earnings in the next twelve months. Net realized losses of approximately $0.1 million on contracts related to underlying expenses which have been recognized were transferred from accumulated other comprehensive loss and included in cost of sales and other direct production costs for the three months ended March 31, 2017. Net unrealized gains of approximately $10 thousand related to ineffectiveness of the hedges were included in gain (loss) on derivatives contracts on our consolidated statements of operations and comprehensive income (loss) for the three months ended March 31, 2017.
Item4. Controls and Procedures
An evaluation was performed under the supervision and with the participation of our management, including the Chief Executive Officer (“CEO”) and Chief Financial Officer (“CFO”), of the effectiveness of the design and operation of our disclosure controls and procedures as required by Securities Exchange Act Rules 13a-15(e) and 15d-15(e) as of the end of the period covered by this report. Based on that evaluation, our CEO and CFO concluded that our disclosure controls and procedures, including controls and procedures designed to ensure that information required to be disclosed by us is accumulated and communicated to our management (including our CEO and CFO), were effective as of March 31, 2017, in assuring them in a timely manner that material information required to be disclosed in this report has been properly recorded, processed, summarized and reported. There were no changes in our internal control over financial reporting during the quarter ended March 31, 2017, that have materially affected, or are reasonably likely to materially affect, our internal control over financial reporting.report:
Internal control systems, no matter how well designed and operated, have inherent limitations. Therefore, even a system which is determined to be effective cannot provide absolute assurance that all control issues have been detected or prevented. Our systems of internal controls are designed to provide reasonable assurance with respect to financial statement preparation and presentation.
PartII - Other Information
Hecla Mining Company and Subsidiaries
Item1. Legal Proceedings
For information concerning legal proceedings, refer toNote 4 ofNotes to Condensed Consolidated Financial Statements (Unaudited), which is incorporated by reference into this Item 1.
Item1A. Risk Factors
Item 1A – Risk Factors of our annual report filed on Form 10-K for the year ended December 31, 2016 sets forth information relating to important risks and uncertainties that could materially adversely affect our business, financial condition or operating results. Those risk factors continue to be relevant to an understanding of our business, financial condition and operating results.
Item4. Mine Safety Disclosures
The information concerning mine safety violations or other regulatory matters required by Section 1503(a) of the Dodd-Frank Wall Street Reform and Consumer Protection Act and Item 104 of Regulation S-K is included in exhibit 95 to this Quarterly Report.
Item6. Exhibits
See the exhibit index to this Form 10-Q for the list of exhibits.
Items 2, 3 and 5 of Part II are not applicable and are omitted from this report.
Hecla Mining Company and Subsidiaries
Pursuant to the requirements of the Securities Exchange Act of 1934, the registrant has duly caused this report to be signed on its behalf by the undersigned thereunto duly authorized.
| |||
| |||
|
|
|
|
| |||
| |||
|
|
|
|
| |||
| |||
Hecla Mining Company and Wholly Owned Subsidiaries
Form 10-Q – March��31, 2017
Indexto Exhibits
|
|
|
|
|
|
|
|
|
|
|
|
|
|
|
|
|
|
|
|
31.1 | Certification pursuant to Section 302 of the Sarbanes-Oxley Act of 2002. * |
31.2 | Certification pursuant to Section 302 of the Sarbanes-Oxley Act of 2002. * |
32.1 | Certification pursuant to Section 906 of the Sarbanes-Oxley Act of 2002. * |
32.2 | Certification pursuant to Section 906 of the Sarbanes-Oxley Act of 2002. * |
|
|
|
|
|
|
|
|
|
|
|
|
|
|
___________________
(1) Indicates a management contract or compensatory plan or arrangement.
* Filed herewith.
** XBRL information is furnished and not filed or a part of a registration statement or prospectus for purposes of Sections 11 or 12
SIGNATURES
Pursuant to the requirements of the Securities and Exchange Act of 1933, as amended, is deemed not filed for purposes of Section 18 of the Securities and Exchange Act of 1934, as amended, and otherwise is not subjectthe registrant has duly caused this report to liability under these sections.be signed on its behalf by the undersigned thereunto duly authorized.
HECLA MINING COMPANY | |||
(Registrant) | |||
Date: | May 10, 2017 | By: | /s/ Phillips S. Baker, Jr. |
Phillips S. Baker, Jr., President, | |||
Chief Executive Officer and Director | |||
Date: | May 10, 2017 | By: | /s/ Lindsay A. Hall |
Lindsay A. Hall, Senior Vice President and | |||
Chief Financial Officer | |||
57