Table of Contents
UNITED STATES
SECURITIES AND EXCHANGE COMMISSION
Washington, D.C. 20549
FORM 10-Q
[X] | QUARTERLY REPORT PURSUANT TO SECTION 13 OR 15(d) OF THE SECURITIES EXCHANGE ACT OF 1934 |
| |
| For the quarterly period ended June 30, 20172018 |
or
[ ] | TRANSITION REPORT PURSUANT TO SECTION 13 OR 15(d) OF THE SECURITIES EXCHANGE ACT OF 1934 |
| |
| For the transition period from ________ to ________ |
Commission File Number 0-29466001-35929
National Research Corporation
(Exact name of Registrant as specified in its charter)
Wisconsin | | 47-0634000 |
(State or other jurisdiction of | | (I.R.S. Employer |
incorporation or organization) | | Identification No.) |
| 1245 Q Street, Lincoln, Nebraska 68508 | |
| (Address of principal executive offices) (Zip Code) | |
| (402) 475-2525 | |
| (Registrant’sRegistrant’s telephone number, including area code) | |
Indicate by check mark whether the registrant (1) has filed all reports required to be filed by Section 13 or 15(d) of the Securities Exchange Act of 1934 during the preceding 12 months (or for such shorter period that the registrant was required to file such reports), and (2) has been subject to such filing requirements for the past 90 days.
Yes ☒ No ☐
Indicate by check mark whether the registrant has submitted electronically and posted on its corporate Web site, if any, every Interactive Data File required to be submitted and posted pursuant to Rule 405 of Regulation S-T during the preceding 12 months (or for such shorter period that the registrant was required to submit and post such files). Yes ☒ No ☐
Indicate by check mark whether the registrant is a large accelerated filer, an accelerated filer, a non-accelerated filer, smaller reporting company, or an emerging growth company. See the definitions of "large accelerated filer," "accelerated "accelerated filer," "smaller reporting company," and "emerging growth company" in Rule 12b-2 of the Exchange Act.
Large accelerated filer | ☐ | Accelerated filer | ☒ |
Non-accelerated filer | ☐ (Do not check if a smaller reporting company) | Smaller reporting company | ☐ |
| | Emerging growth company | ☐ |
If an emerging growth company, indicate by check mark if the registrant has elected not to use the extended transition period for complying with any new or revised financial accounting standards provided pursuant to Section 13(a) of the Exchange Act. ☐
Indicate by check mark whether the registrant is a shell company (as defined in Rule 12b-2 of the Act.)
Yes ☐ No ☒
Indicate the number of shares outstanding of each of the issuer’sissuer’s classes of common stock as of the latest practicable date.
Class A Common Stock, $.001 par value, outstanding as of July 27, 2018: 24,738,983July 28, 2017: 20,942,785 shares
Class B Common Stock, $.001 par value, outstanding as of July 28, 2017: 3,540,244 shares
NATIONAL RESEARCH CORPORATION
FORM 10-Q INDEX
For the Quarter Ended June 30, 20172018
Special Note Regarding Forward-Looking Statements
Certain matters discussed in this Quarterly Report on Form 10-Q are “forward-looking statements” within the meaning of Section 21E of the Securities Exchange Act of 1934, as amended. These forward-looking statements can generally be identified as such because the context of the statement includes phrases such as National Research Corporation, doing business as NRC Health (“NRC Health,” the “Company,” “we,” “our,” “us” or similar terms), “believes,” “expects,” or other words of similar import. Similarly, statements that describe the Company’s future plans, objectives or goals are also forward-looking statements. Such forward-looking statements are subject to certain risks and uncertainties which could cause actual results or outcomes to differ materially from those currently anticipated. Factors that could affect actual results or outcomes include, without limitation, the following factors:
| ● | The possibility of non-renewal of the Company’sCompany’s client service contracts and retention of key clients; |
| ● | The Company’sCompany’s ability to compete in its markets, which are highly competitive, and the possibility of increased price pressure and expenses; |
| ● | The effects of an economic downturn; |
| ● | The impact of consolidation in the healthcare industry; |
| ● | The impact of federal healthcare reform legislation or other regulatory changes; |
| ● | The Company’sCompany’s ability to attract and retain key managers and other personnel; |
| ● | The possibility that the Company’sCompany’s intellectual property and other proprietary information technology could be copied or independently developed by its competitors; |
| ● | The possibility that the Company could be subject to security breaches or computer viruses; and |
| ● | The factors set forth under the caption “Risk Factors” in Part I, Item 1A of the Company’sCompany’s Annual Report on Form 10-K for the year ended December 31, 2016,2017, as such section may be updated or supplemented by Part II, Item 1A of the Company’s subsequently filed Quarterly Reports on Form 10-Q (including this Report). |
Shareholders, potential investors and other readers are urged to consider these and other factors in evaluating the forward-looking statements, and are cautioned not to place undue reliance on such forward-looking statements. The forward-looking statements included are only made as of the date of this Quarterly Report on Form 10-Q and the Company undertakes no obligation to publicly update such forward-looking statements to reflect subsequent events or circumstances.circumstances except as required by the federal securities laws.
PART I – Financial Information
ITEM 1. Financial Statements
NATIONAL RESEARCH CORPORATION AND SUBSIDIARY
CONDENSED CONSOLIDATED BALANCE SHEETS
(In thousands, except share amounts and par value)
| | | June 30, 2017 | | | December 31, 2016 | | | June 30, 2018 | | | December 31, 2017 | |
| | | (unaudited) | | | | | | | (unaudited) | | | | | |
Assets | | | | | | | | | | | | | | | | |
Current assets: | | | | | | | | | | | | | | | | |
Cash and cash equivalents | | $ | 31,628 | | | $ | 33,021 | | | $ | 6,698 | | | $ | 34,733 | |
Trade accounts receivable, less allowance for doubtful accounts of $182 and $169 in 2017 and 2016, respectively | | | 13,138 | | | | 10,864 | | |
Unbilled revenue | | | 1,644 | | | | 1,546 | | |
Trade accounts receivable, less allowance for doubtful accounts of $219 and $200, respectively | | | | 10,689 | | | | 14,806 | |
Prepaid expenses | | | 3,378 | | | | 1,585 | | | | 4,408 | | | | 2,310 | |
Income tax receivable | | | 1,172 | | | | 14 | | |
Income taxes receivable | | | | 1,713 | | | | 375 | |
Other current assets | | | 23 | | | | 35 | | | | 125 | | | | 35 | |
Total current assets | | | 50,983 | | | | 47,065 | | | | 23,633 | | | | 52,259 | |
| | | | | | | | | | | | | | | | | |
Property and equipment, net | | | 12,138 | | | | 11,806 | | |
Net property and equipment | | | | 13,320 | | | | 12,359 | |
Intangible assets, net | | | 2,830 | | | | 3,124 | | | | 2,428 | | | | 2,764 | |
Goodwill | | | 57,942 | | | | 57,861 | | | | 57,913 | | | | 58,021 | |
Deferred contract costs, net | | | | 3,369 | | | | -- | |
Other | | | 683 | | | | 768 | | | | 2,222 | | | | 1,913 | |
| | | | | | | | | | |
Total assets | | $ | 124,576 | | | $ | 120,624 | | | $ | 102,885 | | | $ | 127,316 | |
Liabilities and Shareholders’ Equity | | | | | | | | | |
| | | | | | | | | | |
Liabilities and Shareholders’ Equity | | | | | | | | | |
Current liabilities: | | | | | | | | | | | | | | | | |
Current portion of notes payable | | $ | 2,107 | | | $ | 2,683 | | | $ | 3,575 | | | $ | 1,067 | |
Accounts payable | | | 883 | | | | 765 | | | | 1,362 | | | | 593 | |
Accrued wages, bonus and profit sharing | | | 4,076 | | | | 4,543 | | | | 4,669 | | | | 6,597 | |
Accrued expenses | | | 2,730 | | | | 3,069 | | | | 2,261 | | | | 2,882 | |
Current portion of capital lease obligations | | | 102 | | | | 82 | | | | 87 | | | | 71 | |
Income taxes payable | | | - | | | | 662 | | | | 97 | | | | -- | |
Dividends payable | | | 4,218 | | | | 4,213 | | | | 4,206 | | | | 4,222 | |
Deferred revenue | | | 16,735 | | | | 15,497 | | | | 16,660 | | | | 16,878 | |
Total current liabilities | | | 30,851 | | | | 31,514 | | | | 32,917 | | | | 32,310 | |
| | | | | | | | | | | | | | | | | |
Notes payable, net of current portion | | | - | | | | 857 | | | | 36,029 | | | | - | |
Deferred income taxes | | | 5,057 | | | | 4,670 | | | | 5,808 | | | | 4,030 | |
Other long term liabilities | | | 838 | | | | 777 | | | | 1,314 | | | | 935 | |
Total liabilities | | | 36,746 | | | | 37,818 | | | | 76,068 | | | | 37,275 | |
| | | | | | | | | | | | | | | | | |
Shareholders’ equity: | | | | | | | | | |
Preferred stock, $0.01 par value; authorized 2,000,000 shares, none issued | | | -- | | | | -- | | |
Class A Common stock, $0.001 par value; authorized 60,000,000 shares, issued 25,796,457 in 2017 and 25,656,760 in 2016, outstanding 20,940,790 in 2017 and 20,891,069 in 2016 | | | 26 | | | | 26 | | |
Class B Common stock, $0.001 par value; authorized 80,000,000 shares, issued 4,317,656 in 2017 and 4,308,875 in 2016, outstanding 3,540,244 in 2017 and 3,539,931 in 2016 | | | 4 | | | | 4 | | |
Shareholders’ equity: | | | | | | | | | |
Preferred stock, $0.01 par value, authorized 2,000,000 shares, none issued | | | | -- | | | | -- | |
Common Stock (formerly Class A), $0.001 par value; authorized 60,000,000 shares, issued 29,794,307 in 2018 and 25,835,230 in 2017, outstanding 24,738,983 in 2018 and 20,936,703 in 2017 | | | | 30 | | | | 26 | |
Class B Common stock, $0.001 par value; 4,319,256 issued and 3,535,238 outstanding in 2017 | | | | -- | | | | 4 | |
Additional paid-in capital | | | 49,620 | | | | 46,725 | | | | 155,614 | | | | 51,025 | |
Retained earnings | | | 75,343 | | | | 71,507 | | |
Accumulated other comprehensive loss | | | (2,127 | ) | | | (2,626 | ) | |
Treasury stock, at cost; 4,855,667 Class A shares, 777,412 Class B shares in 2017 and 4,765,691 Class A shares, 768,944 Class B shares in 2016 | | | (35,036 | ) | | | (32,830 | ) | |
Total shareholders’ equity | | | 87,830 | | | | 82,806 | | |
Total liabilities and shareholders’ equity | | $ | 124,576 | | | $ | 120,624 | | |
Retained earnings (accumulated deficit) | | | | (99,810 | ) | | | 77,574 | |
Accumulated other comprehensive (loss) income | | | | (2,333 | ) | | | (1,635 | ) |
Treasury stock, at cost; 5,055,324 Common (formerly Class A) shares in 2018 and 4,898,527 in 2017 and 784,018 Class B shares in 2017 | | | | (26,684 | ) | | | (36,953 | ) |
Total shareholders’ equity | | | | 26,817 | | | | 90,041 | |
| | | | | | | | | | |
Total liabilities and shareholders’ equity | | | $ | 102,885 | | | $ | 127,316 | |
See accompanying notes to condensed consolidated financial statements
NATIONAL RESEARCH CORPORATION AND SUBSIDIARY
CONDENSED CONSOLIDATED STATEMENTS OF INCOME
(In thousands, except for per share amounts, unaudited)
| | | Three months ended
June 30, | | | Six months ended
June 30, | | | Three months ended
June 30, | | | Six months ended
June 30, | |
| | | 2017 | | | 2016 | | | 2017 | | | 2016 | | | 2018 | | | 2017 | | | 2018 | | | 2017 | |
| | | | | | | | | | | | | | | | | | | | | | | | | | | | | | | | | |
Revenue | | $ | 28,435 | | | $ | 26,114 | | | $ | 58,710 | | | $ | 53,984 | | | $ | 28,017 | | | $ | 28,435 | | | $ | 59,034 | | | $ | 58,710 | |
| | | | | | | | | | | | | | | | | | | | | | | | | | | | | | | | | |
Operating expenses: | | | | | | | | | | | | | | | | | | | | | | | | | | | | | | | | |
Direct | | | 11,939 | | | | 10,734 | | | | 24,439 | | | | 22,273 | | | | 10,996 | | | | 11,939 | | | | 23,904 | | | | 24,439 | |
Selling, general and administrative | | | 6,905 | | | | 7,270 | | | | 13,591 | | | | 14,627 | | | | 7,940 | | | | 6,905 | | | | 15,808 | | | | 13,591 | |
Depreciation and amortization | | | 1,139 | | | | 1,092 | | | | 2,244 | | | | 2,060 | | | | 1,325 | | | | 1,139 | | | | 2,608 | | | | 2,244 | |
Total operating expenses | | | 19,983 | | | | 19,096 | | | | 40,274 | | | | 38,960 | | | | 20,261 | | | | 19,983 | | | | 42,320 | | | | 40,274 | |
| | | | | | | | | | | | | | | | | | | | | | | | | | | | | | | | | |
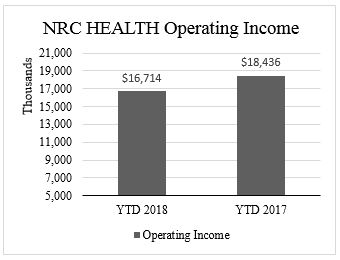
Operating income | | | 8,452 | | | | 7,018 | | | | 18,436 | | | | 15,024 | | | | 7,756 | | | | 8,452 | | | | 16,714 | | | | 18,436 | |
| | | | | | | | | | | | | | | | | | | | | | | | | | | | | | | | | |
Other income (expense): | | | | | | | | | | | | | | | | | | | | | | | | | | | | | | | | |
Interest income | | | 15 | | | | 11 | | | | 29 | | | | 22 | | | | 9 | | | | 15 | | | | 54 | | | | 29 | |
Interest expense | | | (23 | ) | | | (36 | ) | | | (50 | ) | | | (121 | ) | | | (439 | ) | | | (23 | ) | | | (447 | ) | | | (50 | ) |
Other, net | | | 27 | | | | 43 | | | | 35 | | | | 118 | | | | 493 | | | | 27 | | | | 464 | | | | 35 | |
| | | | | | | | | | | | | | | | | | | | | | | | | | | | | | | | | |
Total other income (expense) | | | 19 | | | | 18 | | | | 14 | | | | 19 | | | | 63 | | | | 19 | | | | 71 | | | | 14 | |
| | | | | | | | | | | | | | | | | | | | | | | | | | | | | | | | | |
Income before income taxes | | | 8,471 | | | | 7,036 | | | | 18,450 | | | | 15,043 | | | | 7,819 | | | | 8,471 | | | | 16,785 | | | | 18,450 | |
| | | | | | | | | | | | | | | | | | | | | | | | | | | | | | | | | |
Provision for income taxes | | | 2,719 | | | | 2,478 | | | | 6,178 | | | | 4,978 | | |
Provision (benefit) for income taxes | | | | (129 | ) | | | 2,719 | | | | 1,531 | | | | 6,178 | |
| | | | | | | | | | | | | | | | | | | | | | | | | | | | | | | | | |
Net income | | $ | 5,752 | | | $ | 4,558 | | | $ | 12,272 | | | $ | 10,065 | | | $ | 7,948 | | | $ | 5,752 | | | $ | 15,254 | | | $ | 12,272 | |
| | | | | | | | | | | | | | | | | | | | | | | | | | | | | | | | | |
Earnings Per Share of Common Stock: | | | | | | | | | | | | | | | | | | | | | | | | | | | | | | | | |
Basic Earnings Per Share: | | | | | | | | | | | | | | | | | | | | | | | | | | | | | | | | |
Class A | | $ | 0.14 | | | $ | 0.11 | | | $ | 0.29 | | | $ | 0.24 | | |
Common (formerly Class A) | | | $ | 0.29 | | | $ | 0.14 | | | $ | 0.47 | | | $ | 0.29 | |
Class B | | $ | 0.82 | | | $ | 0.65 | | | $ | 1.75 | | | $ | 1.44 | | | $ | 0.27 | | | $ | 0.82 | | | $ | 1.31 | | | $ | 1.75 | |
Diluted Earnings Per Share: | | | | | | | | | | | | | | | | | | | | | | | | | | | | | | | | |
Class A | | $ | 0.13 | | | $ | 0.11 | | | $ | 0.28 | | | $ | 0.24 | | |
Common (formerly Class A) | | | $ | 0.28 | | | $ | 0.13 | | | $ | 0.45 | | | $ | 0.28 | |
Class B | | $ | 0.80 | | | $ | 0.64 | | | $ | 1.71 | | | $ | 1.41 | | | $ | 0.26 | | | $ | 0.80 | | | $ | 1.27 | | | $ | 1.71 | |
| | | | | | | | | | | | | | | | | | | | | | | | | | | | | | | | | |
Dividends Per Share of Common Stock: | | | | | | | | | | | | | | | | | | | | | | | | | | | | | | | | |
Class A | | $ | 0.10 | | | $ | 0.08 | | | $ | 0.20 | | | $ | 0.16 | | |
Common (formerly Class A) | | | $ | 0.17 | | | $ | 0.10 | | | $ | 0.27 | | | $ | 0.20 | |
Class B | | $ | 0.60 | | | $ | 0.48 | | | $ | 1.20 | | | $ | 0.96 | | | $ | -- | | | $ | 0.60 | | | $ | 0.60 | | | $ | 1.20 | |
| | | | | | | | | | | | | | | | | | | | | | | | | | | | | | | | | |
Weighted average shares and share equivalents outstanding: | | | | | | | | | | | | | | | | | | | | | | | | | | | | | | | | |
Class A – basic | | | 20,752 | | | | 20,711 | | | | 20,745 | | | | 20,711 | | |
Common (formerly Class A) – basic | | | | 23,957 | | | | 20,752 | | | | 22,429 | | | | 20,745 | |
Class B – basic | | | 3,514 | | | | 3,508 | | | | 3,514 | | | | 3,498 | | | | 3,527 | | | | 3,514 | | | | 3,527 | | | | 3,514 | |
Class A – diluted | | | 21,525 | | | | 20,992 | | | | 21,404 | | | | 21,002 | | |
Common (formerly Class A) – diluted | | | | 24,846 | | | | 21,525 | | | | 23,350 | | | | 21,404 | |
Class B – diluted | | | 3,591 | | | | 3,565 | | | | 3,584 | | | | 3,557 | | | | 3,620 | | | | 3,591 | | | | 3,628 | | | | 3,584 | |
See accompanying notes to condensed consolidated financial statements
NATIONAL RESEARCH CORPORATION AND SUBSIDIARY
CONDENSED CONSOLIDATED STATEMENTS OF COMPREHENSIVE INCOME
(In thousands, unaudited)
| | | Three months ended
June 30, | | | Six months ended June 30, | | | Three months ended
June 30, | | | Six months ended June 30, | |
| | | 2017 | | | 2016 | | | 2017 | | | 2016 | | | 2018 | | | 2017 | | | 2018 | | | 2017 | |
| | | | | | | | | | | | | | | | | | | | | | | | | | | | | | | | | |
Net income | | $ | 5,752 | | | $ | 4,558 | | | $ | 12,272 | | | $ | 10,065 | | | $ | 7,948 | | | $ | 5,752 | | | $ | 15,254 | | | $ | 12,272 | |
Other comprehensive income: | | | | | | | | | | | | | | | | | | | | | | | | | | | | | | | | |
Foreign currency translation adjustment | | | 381 | | | | 5 | | | | 499 | | | | 878 | | | | (283 | ) | | | 381 | | | | (698 | ) | | | 499 | |
Other comprehensive income | | $ | 381 | | | $ | 5 | | | $ | 499 | | | $ | 878 | | | $ | (283 | ) | | $ | 381 | | | $ | (698 | ) | | $ | 499 | |
| | | | | | | | | | | | | | | | | | | | | | | | | | | | | | | | | |
Comprehensive Income | | $ | 6,133 | | | $ | 4,563 | | | $ | 12,771 | | | $ | 10,943 | | | $ | 7,665 | | | $ | 6,133 | | | $ | 14,556 | | | $ | 12,771 | |
See accompanying notes to condensed consolidated financial statements.
NATIONAL RESEARCH CORPORATION AND SUBSIDIARY
CONDENSED Consolidated Statements of Shareholders’ Equity
(In thousands, except share and per share amounts, unaudited)
| | | Common
Stock (formerly Class A) | | | Class B Common
Stock | | | Additional
Paid-in
Capital | | | Retained
Earnings (Accumulated deficit) | | | Accumulated Other
Comprehensive
Income(Loss) | | | Treasury Stock | | | Total | |
| | | | | | | | | | | | | | | | | | | | | | | | | | | | | |
Balances at December 31, 2017 | | $ | 26 | | | $ | 4 | | | $ | 51,025 | | | $ | 77,574 | | | $ | (1,635 | ) | | $ | (36,953 | ) | | $ | 90,041 | |
Purchase of 156,797 shares of class A and 3,677 shares of class B treasury stock | | | -- | | | | -- | | | | -- | | | | -- | | | | -- | | | | (5,630 | ) | | | (5,630 | ) |
Issuance of 344,958 class A common shares and 9,296 class B common shares for the exercise of stock options | | | -- | | | | -- | | | | 4,919 | | | | -- | | | | -- | | | | -- | | | | 4,919 | |
Issuance of restricted common shares, net of forfeitures (3,496 class A shares) | | | -- | | | | -- | | | | -- | | | | -- | | | | -- | | | | -- | | | | -- | |
Non-cash stock compensation expense | | | -- | | | | -- | | | | 995 | | | | -- | | | | -- | | | | -- | | | | 995 | |
Settlement of restricted common shares and stock options in connection with Recapitalization for cash of $3,271 and 90,369 class A common shares | | | - | | | | -- | | | | (2,548 | ) | | | -- | | | | -- | | | | (723 | ) | | | (3,271 | ) |
Settlement of class B common shares in connection with Recapitalization (3,527,246 class B common shares exchanged for $69,099 cash and 3,527,246 class A common shares) | | | 4 | | | | -- | | | | 118,335 | | | | -- | | | | -- | | | | (187,438 | ) | | | (69,099 | ) |
Retirement of class B common shares in connection with Recapitalization (retirement of 4,328,552 class B common shares) | | | -- | | | | (4 | ) | | | (17,112 | ) | | | (186,944 | ) | | | -- | | | | 204,060 | | | | -- | |
Dividends declared of $0.27 and $0.60 per A and B common share, respectively | | | -- | | | | -- | | | | -- | | | | (8,429 | ) | | | -- | | | | -- | | | | (8,429 | ) |
Cumulative effect adjustment for adoption of ASC 606 | | | -- | | | | -- | | | | -- | | | | 2,735 | | | | -- | | | | -- | | | | 2,735 | |
Other comprehensive income, foreign currency translation adjustment | | | -- | | | | -- | | | | -- | | | | -- | | | | (698 | ) | | | -- | | | | (698 | ) |
Net income | | | -- | | | | -- | | | | -- | | | | 15,254 | | | | -- | | | | -- | | | | 15,254 | |
Balances at June 30, 2018 | | $ | 30 | | | $ | -- | | | $ | 155,614 | | | $ | (99,810 | ) | | $ | (2,333 | ) | | $ | (26,684 | ) | | $ | 26,817 | |
See accompanying notes to condensed consolidated financial statements.
NATIONAL RESEARCH CORPORATION AND SUBSIDIARY
CONDENSED CONSOLIDATED STATEMENTS OF CASH FLOWS
(In thousands, unaudited)
| | | Six months ended | | | Six months ended | |
| | | June 30, | | | June 30, | |
| | | 2017 | | | 2016 | | | 2018 | | | 2017 | |
Cash flows from operating activities: | | | | | | | | | | | | | | | | |
Net income | | $ | 12,272 | | | $ | 10,065 | | | $ | 15,254 | | | $ | 12,272 | |
Adjustments to reconcile net income to net cash provided by operating activities: | | | | | | | | | | | | | | | | |
Depreciation and amortization | | | 2,244 | | | | 2,060 | | | | 2,608 | | | | 2,244 | |
Deferred income taxes | | | 386 | | | | 926 | | | | 996 | | | | 386 | |
Reserve for uncertain tax positions | | | 73 | | | | (84 | ) | | | 92 | | | | 73 | |
Non-cash share-based compensation expense | | | 792 | | | | 1,081 | | | | 995 | | | | 792 | |
Impairment of property and equipment | | | | 2 | | | | -- | |
Net changes in assets and liabilities: | | | | | | | | | | | | | | | | |
Trade accounts receivable | | | (2,217 | ) | | | (1,225 | ) | | | 3,955 | | | | (2,299 | ) |
Unbilled revenue | | | (82 | ) | | | (356 | ) | |
Prepaid expenses | | | (1,696 | ) | | | (637 | ) | |
Prepaid expenses and other current assets | | | | (2,393 | ) | | | (1,696 | ) |
Deferred contract costs, net | | | | 2 | | | | | |
Accounts payable | | | 222 | | | | 74 | | | | 481 | | | | 222 | |
Accrued expenses, wages, bonuses and profit sharing | | | (750 | ) | | | (627 | ) | | | (2,371 | ) | | | (750 | ) |
Income taxes receivable and payable | | | (1,818 | ) | | | (1,271 | ) | | | (1,235 | ) | | | (1,818 | ) |
Deferred revenue | | | 1,194 | | | | 1,219 | | | | 5 | | | | 1,194 | |
Net cash provided by operating activities | | | 10,620 | | | | 11,225 | | | | 18,391 | | | | 10,620 | |
| | | | | | | | | | | | | | | | | |
Cash flows from investing activities: | | | | | | | | | | | | | | | | |
Purchases of property and equipment | | | (2,390 | ) | | | (2,217 | ) | | | (2,773 | ) | | | (2,390 | ) |
Net cash used in investing activities | | | (2,390 | ) | | | (2,217 | ) | | | (2,773 | ) | | | (2,390 | ) |
| | | | | | | | | | | | | | | | | |
Cash flows from financing activities: | | | | | | | | | | | | | | | | |
Payments related to Recapitalization | | | | (72,370 | ) | | | -- | |
Proceeds from issuance of note payable | | | | 40,000 | | | | -- | |
Borrowings on line of credit | | | | 1,000 | | | | -- | |
Payments on line of credit | | | | (1,000 | ) | | | -- | |
Payment of debt issuance costs | | | | (187 | ) | | | -- | |
Payments on notes payable | | | (1,433 | ) | | | (1,192 | ) | | | (1,286 | ) | | | (1,433 | ) |
Payments on capital lease obligations | | | (53 | ) | | | (46 | ) | | | (58 | ) | | | (53 | ) |
Cash paid for non-controlling interest | | | -- | | | | (2,000 | ) | |
Proceeds from exercise of stock options | | | -- | | | | 547 | | |
Payment of employee payroll tax withholdings on share-based awards exercised | | | (105 | ) | | | (147 | ) | | | (712 | ) | | | (105 | ) |
Payment of dividends on common stock | | | (8,431 | ) | | | (21,809 | ) | | | (8,445 | ) | | | (8,431 | ) |
Net cash used in financing activities | | | (10,022 | ) | | | (24,647 | ) | | | (43,058 | ) | | | (10,022 | ) |
| | | | | | | | | | | | | | | | | |
Effect of exchange rate changes on cash | | | 399 | | | | 686 | | | | (595 | ) | | | 399 | |
Change in cash and cash equivalents | | | (1,393 | ) | | | (14,953 | ) | | | (28,035 | ) | | | (1,393 | ) |
Cash and cash equivalents at beginning of period | | | 33,021 | | | | 42,145 | | | | 34,733 | | | | 33,021 | |
Cash and cash equivalents at end of period | | $ | 31,628 | | | $ | 27,192 | | | $ | 6,698 | | | $ | 31,628 | |
| | | | | | | | | | | | | | | | | |
Supplemental disclosure of cash paid for: | | | | | | | | | | | | | | | | |
Interest, net of capitalized amounts | | $ | 44 | | | $ | 118 | | | $ | 256 | | | $ | 44 | |
Income taxes | | $ | 7,539 | | | $ | 5,484 | | | $ | 1,703 | | | $ | 7,539 | |
Supplemental disclosure of non-cash investing and financing activities: | | | | | | | | | | | | | | | | |
Common stock (formerly class A) issued in the Recapitalization in exchange for then-existing class B shares and options. | | | $ | 121,371 | | | $ | -- | |
Capital lease obligations originated for property and equipment | | $ | 64 | | | $ | 109 | | | $ | 210 | | | $ | 64 | |
Stock tendered to the Company for cashless exercise of stock options in connection with equity incentive plans | | $ | 2,101 | | | $ | 162 | | | $ | 4,919 | | | $ | 2,101 | |
See accompanying notes to condensed consolidated financial statements.
NATIONAL RESEARCH CORPORATION AND SUBSIDIARY
NOTES TO CONDENSED CONSOLIDATED FINANCIAL STATEMENTS
1. | BASISSUMMARY OF CONSOLIDATION AND PRESENTATIONSIGNIFICANT ACCOUNTING POLICIES
|
Description of business and basis of presentation
National Research Corporation, doing business as NRC Health (“NRC Health,” the “Company,” “we,” “our,” “us” or similar terms), is a leading provider of analytics and insights that facilitate measurement and improvement of the patient and employee experience while also increasing patient engagement and customer loyalty for healthcare providers, payers and other healthcare organizations in the United States and Canada. The Company’sCompany’s solutions enable its clients to understand the voice of the customer with greater clarity, immediacy and depth.
The Company’sCompany’s six operating segments are aggregated into one reporting segment because they have similar economic characteristics and meet the other aggregation criteria from the Financial Accounting Standards Board (“FASB”) guidance on segment disclosure. The six operating segments are Experience, The Governance Institute, Market Insights, Transparency, NRC Health Canada and Transitions (formerly Connect), which offer a portfolio of solutions that address specific needs around market insight, experience, transparency and governance for healthcare providers, payers and other healthcare organizations.
The condensed consolidated balance sheet of the Company at December 31, 2016,2017, was derived from the Company’sCompany’s audited consolidated balance sheet as of that date. All other financial statements contained herein are unaudited and, in the opinion of management, include all adjustments (consisting only of normal recurring adjustments) the Company considers necessary for a fair presentation of financial position, results of operations and cash flows in accordance with accounting principles generally accepted in the United States.
Information and footnote disclosures included in financial statements prepared in accordance with accounting principles generally accepted in the United States have been condensed or omitted. These condensed consolidated financial statements should be read in conjunction with the consolidated financial statements and notes thereto that are included in the Company’sCompany’s Form 10-K for the year ended December 31, 2016,2017, filed with the Securities and Exchange Commission (the “SEC”) on March 3, 2017.14, 2018.
The preparation of financial statements in conformity with accounting principles generally accepted in the United States requires management to make certain estimates and assumptions that affect the reported amounts of assets and liabilities at the date of the financial statements and the reported amounts of revenue and expenses during the reporting period. Actual results could differ from those estimates.
The condensed consolidated financial statements include the accounts of the Company and its wholly-owned subsidiary, National Research Corporation Canada, doing business as NRC Health Canada. The condensed consolidated statement of income for the three and six months ended June 30, 2016 also included Customer-Connect LLC. Customer-Connect LLC became a wholly-owned subsidiary in March 2016 and was previously a variable interest entity for which NRC Health was deemed the primary beneficiary. On June 30, 2016, Customer-Connect LLC was dissolved. All significant intercompany transactions and balances have been eliminated.
The Company’s Canadian subsidiary uses as its functional currency the local currency of the Company’s foreign subsidiary, National Research Corporation Canada, doing business as NRC Health Canada, is the subsidiary’s local currency. The Companycountry in which it operates. It translates theits assets and liabilities of its foreign subsidiaryinto U.S. dollars at the period-endexchange rate of exchangein effect at the balance sheet date. It translates its revenue and its foreign subsidiary’s income statement balancesexpenses at the average exchange rate prevailing during the period. The Company records the resultingincludes translation adjustmentgains and losses in accumulated other comprehensive loss,income (loss), a component of shareholders’ equity. Since the undistributed earnings of the Company’s foreign subsidiary are considered to be indefinitely reinvested, no taxes were provided for on currency translation adjustments arising from converting the investment denominated in a foreign currency to U.S. dollars. Gains and losses related to transactions denominated in a currency other than the subsidiary’s localfunctional currency of the country in which the Company operates and short-term intercompany accounts are included in other income (expense) in the condensed consolidated statements of income.
Revenue Recognition
Reclassifications
Reclassifications have been madeOn January 1, 2018, the Company adopted Accounting Standards Update (“ASU”) 2014-09, Revenue- Revenue from noncurrent deferred income taxesContracts with Customers and all related amendments (“ASC 606” or “new revenue standard”) using the modified retrospective method for all incomplete contracts as of the date of adoption. The Company applied the practical expedient to other noncurrent liabilitiesreflect the total of all contract modifications occurring before January 1, 2018 in the 2016 condensed consolidated balance sheettransaction price and performance obligations at transition rather than accounting for each modification separately. Results for reporting periods beginning on or after January 1, 2018 are presented under ASC 606, while prior period amounts are not adjusted and continue to presentbe reported under the unrecognized tax benefitsaccounting standards in effect for the prior period. As discussed in more detail below and under “Deferred Contract Costs”, the largest impact of implementing the new revenue standard was the deferral and amortization of direct and incremental costs of obtaining contracts. In addition, there were other revisions to the revenue recognition primarily related to state taxes grossperformance obligation determinations and estimating variable consideration. The Company recorded a transition adjustment of federalapproximately $2.7 million, net of $814,000 of tax, benefits, consistent withto the 2017 financial statement presentation. There was no impact on the previously reported net income and earnings per share.opening balance of retained earnings.
The Company derives a majority of its revenues from its annually renewable subscription-based service agreements with its customers, which include performance measurement and improvement services, healthcare analytics and governance education services. Such agreements are generally cancelable on short or no notice without penalty. See Note 3 for further information about the Company's contracts with customers. Under ASC 606, the Company accounts for revenue using the following steps:
| ● | Identify the contract, or contracts, with a customer |
| ● | Identify the performance obligations in the contract |
| ● | Determine the transaction price |
| ● | Allocate the transaction price to the identified performance obligations |
| ● | Recognize revenue when, or as, the Company satisfies the performance obligations. |
The Company’s revenue arrangements with a client may include combinations of more than one service offering which may be executed at the same time, or within close proximity of one another. The Company combines contracts with the same customer into a single contract for accounting purposes when the contract is entered into at or near the same time and the contracts are negotiated as a single performance obligation. For contracts that contain more than one separately identifiable performance obligation, the total transaction price is allocated to the identified performance obligations based upon the relative stand-alone selling prices of the performance obligations. The stand-alone selling prices are based on an observable price for services sold to other comparable customers, when available, or an estimated selling price using a cost plus margin or residual approach. The Company estimates the amount of total contract consideration it expects to receive for variable arrangements based on the most likely amount it expects to earn from the arrangement based on the expected quantities of services it expects to provide and the contractual pricing based on those quantities. The Company only includes some or a portion of variable consideration in the transaction price when it is probable that a significant reversal in the amount of cumulative revenue recognized will not occur. The Company considers the sensitivity of the estimate, its relationship and experience with the client and variable services being performed, the range of possible revenue amounts and the magnitude of the variable consideration to the overall arrangement.
Prior to 2018, total contract consideration was allocated to each separate unit of accounting that was separately sold by the Company or a competitor, based on relative selling price using a selling price hierarchy: vendor-specific objective evidence (“VSOE”), if available, third-party evidence (“TPE”) if VSOE was not available, or estimated selling price if VSOE nor TPE was available. VSOE was established based on the services normal selling prices and discounts for the specific services when sold separately. TPE was established by evaluating similar competitor services in standalone arrangements. If neither existed for a deliverable, the best estimate of the selling price (“ESP”) was used for that deliverable based on list price, representing a component of management’s market strategy, and an analysis of historical prices for bundled and standalone arrangements. Revenue allocated to an element was limited to revenue that was not subject to refund or otherwise represented contingent revenue.
The Company’s arrangements with customers consist principally of four different types of arrangements: 1) subscription-based service agreements; 2) one-time specified services performed at a single point in time; 3) fixed, non-subscription service agreements; and 4) unit-priced service agreements.
Subscription-based services - Services that are provided under subscription-based service agreements are usually for a twelve month period and represent a single promise to stand ready to provide reporting, tools and services throughout the subscription period as requested by the customer. These agreements are renewable at the option of the customer at the completion of the initial contract term for an agreed upon price increase each year. These agreements represent a series of distinct monthly services that are substantially the same, with the same pattern of transfer to the customer as the customer receives and consumes the benefits throughout the contract period. Accordingly, subscription services are recognized ratably over the subscription period. Subscription services are typically billed annually in advance, but may also be billed on a quarterly and monthly basis.
One-time services – These agreements typically require the Company to perform a specific one-time service in a particular month. The Company is entitled to fixed payment upon completion of the service. Under these arrangements, the Company recognizes revenue at the point in time the service is completed by the Company and accepted by the customer.
Fixed, non-subscription services – These arrangements typically require the Company to perform an unspecified amount of services for a fixed price during a fixed period of time. Revenues are recognized over time based upon the costs incurred to date in relation to the total estimated contract costs. In determining cost estimates, management uses historical and forecasted cost information which is based on estimated volumes, external and internal costs and other factors necessary in estimating the total costs over the term of the contract. Changes in estimates are accounted for using a cumulative catch up adjustment which could impact the amount and timing of revenue for any period. Prior to 2018, these arrangements were recognized under the proportional performance method based on cost inputs, output measures or key milestones such as survey set-up, survey mailings, survey returns and reporting.
Unit-price services – These arrangements typically require the Company to perform certain services on a periodic basis as requested by the customer for a per-unit amount which is typically billed in the month following the performance of the service. Revenue under these arrangements is recognized over the time the services are performed at the per-unit amount.
The Company recognizes contract assets or unbilled receivables related to revenue recognized for services completed but not invoiced to the clients. Unbilled receivables are classified as receivables when the Company has an unconditional right to contract consideration. A contract liability is recognized as deferred revenue when we invoice clients in advance of performing the related services under the terms of a contract. Deferred revenue is recognized as revenue when we have satisfied the related performance obligation.
The following tables summarize the impact the adoption of ASC 606 had on the Company’s consolidated financial statements (in thousands, except per share data):
Consolidated balance sheet:
| | | As reported June 30, 2018 | | | Adjustments | | | Balances without Adoption of ASC 606 | |
Accounts receivable, net | | $ | 10,689 | | | $ | 5 | | | $ | 10,694 | |
Other current assets | | | 125 | | | | (72 | ) | | | 53 | |
All other current assets | | | 12,819 | | | | -- | | | | 12,819 | |
Total current assets | | | 23,633 | | | | (67 | ) | | | 23,566 | |
Deferred contract costs | | | 3,369 | | | | (3,369 | ) | | | -- | |
All other noncurrent assets | | | 75,883 | | | | -- | | | | 75,883 | |
Total assets | | $ | 102,885 | | | $ | (3,436 | ) | | $ | 99,449 | |
| | | | | | | | | | | | | |
Deferred revenue | | $ | 16,660 | | | $ | 61 | | | $ | 16,721 | |
Other current liabilities | | | 16,257 | | | | -- | | | | 16,257 | |
Total current liabilities | | | 32,917 | | | | 61 | | | | 32,978 | |
Deferred income taxes | | | 5,808 | | | | (802 | ) | | | 5,006 | |
Other long term liabilities | | | 37,343 | | | | -- | | | | 37,343 | |
Total liabilities | | | 76,068 | | | | (741 | ) | | | 75,327 | |
| | | | | | | | | | | | | |
Retained earnings | | | (99,810 | ) | | | (2,697 | ) | | | (102,507 | ) |
Accumulated other comprehensive income | | | (2,333 | ) | | | 2 | | | | (2,331 | ) |
Other stockholders’ equity | | | 128,960 | | | | -- | | | | 128,960 | |
Total stockholders’ equity | | | 26,817 | | | | (2,695 | ) | | | 24,122 | |
Total liabilities and stockholders’ equity | | $ | 102,885 | | | $ | (3,436 | ) | | $ | 99,449 | |
Consolidated statement of income:
| | | Three months ended June 30, 2018 | | | Six months ended June 30, 2018 | |
| | | As reported | | | Adjustments | | | Balances Without Adoption of ASC 606 | | | As reported | | | Adjustments | | | Balances Without Adoption of ASC 606 | |
Revenue | | $ | 28,017 | | | $ | 120 | | | $ | 28,137 | | | $ | 59,034 | | | $ | 48 | | | $ | 59,082 | |
| | | | | | | | | | | | | | | | | | | | | | | | | |
Direct expenses | | | 10,996 | | | | (28 | ) | | | 10,968 | | | | 23,904 | | | | (59 | ) | | | 23,845 | |
Selling, general and administrative | | | 7,940 | | | | (173 | ) | | | 7,767 | | | | 15,808 | | | | 57 | | | | 15,865 | |
Depreciation and amortization | | | 1,325 | | | | -- | | | | 1,325 | | | | 2,608 | | | | -- | | | | 2,608 | |
Total operating expenses | | | 20,261 | | | | (201 | ) | | | 20,060 | | | | 42,320 | | | | (2 | ) | | | 42,318 | |
Operating income | | | 7,756 | | | | 321 | | | | 8,077 | | | | 16,714 | | | | 50 | | | | 16,764 | |
Other income (expense) | | | 63 | | | | -- | | | | 63 | | | | 71 | | | | -- | | | | 71 | |
Income before income taxes | | | 7,819 | | | | 321 | | | | 8,140 | | | | 16,785 | | | | 50 | | | | 16,835 | |
Provision (benefit) for income taxes | | | (129 | ) | | | 74 | | | | (55 | ) | | | 1,531 | | | | 12 | | | | 1,543 | |
Net income | | $ | 7,948 | | | $ | 247 | | | $ | 8,195 | | | $ | 15,254 | | | $ | 38 | | | $ | 15,292 | |
Earnings per share of common stock: | | | | | | | | | | | | | | | | | | | | | | | | |
Basic earnings per share: | | | | | | | | | | | | | | | | | | | | | | | | |
Common (formerly Class A) | | $ | 0.29 | | | $ | 0.01 | | | $ | 0.30 | | | $ | 0.47 | | | $ | -- | | | $ | 0.47 | |
Class B | | | 0.27 | | | | -- | | | | 0.27 | | | | 1.31 | | | | -- | | | | 1.31 | |
Diluted earnings per share: | | | | | | | | | | | | | | | | | | | | | | | | |
Common (formerly Class A) | | $ | 0.28 | | | $ | 0.01 | | | $ | 0.29 | | | $ | 0.45 | | | $ | -- | | | $ | 0.45 | |
Class B | | | 0.26 | | | | 0.01 | | | | 0.27 | | | | 1.27 | | | | 0.01 | | | | 1.28 | |
Consolidated statement of comprehensive income:
| | | Three months ended June 30, 2018 | | | Six months ended June 30, 2018 | |
| | | As reported | | | Adjustments | | | Balances without adoption of ASC 606 | | | As reported | | | Adjustments | | | Balances without adoption of ASC 606 | |
Net Income | | $ | 7,948 | | | $ | 247 | | | $ | 8,195 | | | $ | 15,254 | | | $ | 38 | | | $ | 15,292 | |
Cumulative translation adjustment | | | (283 | ) | | | 4 | | | | (279 | ) | | | (698 | ) | | | 2 | | | | (696 | ) |
Comprehensive Income | | $ | 7,665 | | | $ | 251 | | | $ | 7,916 | | | $ | 14,556 | | | $ | 40 | | | $ | 14,596 | |
Consolidated statement of cash flows:
| | | Six months ended June 30, 2018 | |
| | | As reported | | | Adjustments | | | Balances without adoption of ASC 606 | |
Cash flows from operating activities: | | | | | | | | | | | | |
Net income | | $ | 15,254 | | | $ | 38 | | | $ | 15,292 | |
Adjustments to reconcile net income to net cash provided by operating activities: | | | | | | | | | | | | |
Depreciation and amortization | | | 2,608 | | | | -- | | | | 2,608 | |
Deferred income taxes | | | 996 | | | | 12 | | | | 1,008 | |
Reserve for uncertain tax positions | | | 92 | | | | -- | | | | 92 | |
Non-cash share-based compensation expense | | | 995 | | | | -- | | | | 995 | |
Impairment of property and equipment | | | 2 | | | | -- | | | | 2 | |
Change in assets and liabilities: | | | | | | | | | | | | |
Trade accounts receivable and unbilled revenue | | | 3,955 | | | | 128 | | | | 4,083 | |
Prepaid expenses and other current assets | | | (2,393 | ) | | | (2 | ) | | | (2,395 | ) |
Deferred contract costs | | | 2 | | | | (2 | ) | | | -- | |
Accounts payable | | | 481 | | | | -- | | | | 481 | |
Accrued expenses, wages, bonus and profit sharing | | | (2,371 | ) | | | -- | | | | (2,371 | ) |
Income taxes receivable and payable | | | (1,235 | ) | | | -- | | | | (1,235 | ) |
Deferred revenue | | | 5 | | | | (176 | ) | | | (171 | ) |
Net cash provided by operating activities | | | 18,391 | | | | (2 | ) | | | 18,389 | |
Net cash used in investing activities | | | (2,773 | ) | | | -- | | | | (2,773 | ) |
Net cash used in financing activities | | | (43,058 | ) | | | -- | | | | (43,058 | ) |
Effect of exchange rate changes on cash | | | (595 | ) | | | 2 | | | | (593 | ) |
Change in cash and cash equivalents | | | (28,035 | ) | | | -- | | | | (28,035 | ) |
Cash and cash equivalents at beginning of period | | | 34,733 | | | | -- | | | | 34,733 | |
Cash and cash equivalents at end of period | | $ | 6,698 | | | | -- | | | $ | 6,698 | |
Deferred Contract Costs
Deferred contract costs, net is stated at gross deferred costs less accumulated amortization. Beginning January 1, 2018, with the adoption of the new revenue standard, the Company defers commissions and incentives, including payroll taxes, if they are incremental and recoverable costs of obtaining a renewable customer contract. Deferred contract costs are amortized over the estimated term of the contract, including renewals, which generally ranges from three to five years. The contract term was estimated by considering factors such as historical customer attrition rates and product life. The amortization period is adjusted for significant changes in the estimated remaining term of a contract. An impairment of deferred contract costs is recognized when the unamortized balance of deferred contract costs exceeds the remaining amount of consideration the Company expects to receive less than the expected future costs directly related to providing those services. The Company deferred incremental costs of obtaining a contract of $445,000 and $1,272,000 in the three and six months ended June 30, 2018, respectively. Total amortization was $639,000 and $1,254,000 for the three and six months ended June 30, 2018, respectively. Amortization of deferred contract costs included in direct expenses was $29,000 and $59,000 for the three and six months ended June 30, 2018, respectively. Amortization of deferred contract costs included in selling, general and administrative expenses was $610,000 and $1,195,000 for the three and six months ended June 30, 2018, respectively. Additional expense included in selling, general and administrative expenses for impairment of costs capitalized due to lost clients was $7,000 and $19,000 in the three and six months ended June 30, 2018, respectively. The Company has elected the practical expedient to expense contract costs when incurred for any nonrenewable contracts with a term of one year or less. Prior to 2018, all commissions and incentives were expensed as incurred. The Company recorded a transition adjustment on January 1, 2018 as an increase to retained earnings of $2.6 million, net of $776,000 of tax, to reflect $3.4 million of commissions and incentives related to contracts that began prior to 2018, net of accumulated amortization.
Fair Value Measurements
The Company’sCompany’s valuation techniques are based on maximizing observable inputs and minimizing the use of unobservable inputs when measuring fair value. Observable inputs reflect readily obtainable data from independent sources, while unobservable inputs reflect the Company’s market assumptions. The inputs are then classified into the following hierarchy: (1) Level 1 Inputs—quoted prices in active markets for identical assets and liabilities; (2) Level 2 Inputs—observable market-based inputs other than Level 1 inputs, such as quoted prices for similar assets or liabilities in active markets, quoted prices for similar or identical assets or liabilities in markets that are not active, or other inputs that are observable or can be corroborated by observable market data; and (3) Level 3 Inputs—unobservable inputs.
Commercial paper and Eurodollar deposits are included in cash equivalents and are valued at amortized cost, which approximates fair value due to their short-term nature. Eurodollar deposits are United States dollars deposited in a foreign bank branch of a United States bank and have daily liquidity. Both of these are included as a Level 2 measurement in the table below.
The following details the Company’sCompany’s financial assets and liabilities within the fair value hierarchy at June 30, 20172018 and December 31, 2016:2017:
Fair Values Measured on a Recurring Basis
| | | Level 1 | | | Level 2 | | | Level 3 | | | Total | | | Level 1 | | | Level 2 | | | Level 3 | | | Total | |
| | | (In thousands) | | | (In thousands) | |
As of June 30, 2017 | | | | | | | | | | | | | | | | | |
As of June 30, 2018 | | | | | | | | | | | | | | | | | |
Money Market Funds | | | $ | 767 | | | $ | -- | | | $ | -- | | | $ | 767 | |
Total | | | $ | 767 | | | $ | -- | | | $ | -- | | | $ | 767 | |
| | | | | | | | | | | | | | | | | | |
As of December 31, 2017 | | | | | | | | | | | | | | | | | |
Money Market Funds | | $ | 12,078 | | | $ | -- | | | $ | -- | | | $ | 12,078 | | | $ | 13,971 | | | $ | -- | | | $ | -- | | | $ | 13,971 | |
Commercial Paper | | | -- | | | | 9,096 | | | | -- | | | | 9,096 | | | | -- | | | | 10,490 | | | | -- | | | | 10,490 | |
Eurodollar Deposits | | | -- | | | | 10,000 | | | | -- | | | | 10,000 | | |
Eurodollar Deposits | | | | -- | | | | 10,017 | | | | -- | | | | 10,017 | |
Total | | $ | 12,078 | | | $ | 19,096 | | | $ | -- | | | $ | 31,174 | | | $ | 13,971 | | | $ | 20,507 | | | $ | -- | | | $ | 34,478 | |
| | | | | | | | | | | | | | | | | | |
As of December 31, 2016 | | | | | | | | | | | | | | | | | |
Money Market Funds | | $ | 11,200 | | | $ | -- | | | $ | -- | | | $ | 11,200 | | |
Commercial Paper | | | -- | | | | 21,450 | | | | -- | | | | 21,450 | | |
Total | | $ | 11,200 | | | $ | 21,450 | | | $ | -- | | | $ | 32,650 | | |
There were no transfers between levels during the three month period ended June 30, 2018.
The Company’sCompany's long-term debt is recorded at historical cost. The following are the carrying amounts and estimated fair values, using avalue of long-term debt is classified in Level 2 discounted cash flow analysisof the fair value hierarchy and was estimated based primarily on estimated current rates available for debt of the same remaining duration and adjusted for nonperformance and credit risk:credit. The following are the carrying amount and estimated fair values of long-term debt:
| | | June 30, 2017 | | | December 31, 2016 | | | June 30, 2018 | | | December 31, 2017 | |
| | | (In thousands) | | | (In thousands) | |
Total carrying amounts of long-term debt | | $ | 2,107 | | | $ | 3,540 | | |
Total carrying amount of long-term debt | | | $ | 39,781 | | | $ | 1,067 | |
Estimated fair value of long-term debt | | $ | 2,102 | | | $ | 3,533 | | | $ | 39,813 | | | $ | 1,066 | |
The Company believes that the carrying amounts of trade accounts receivable, accounts payable and accrued expenses approximate their fair value due to the short maturity of those instruments. All non-financialLong-lived assets that are not recognized or disclosed at fair value in the financial statements on a recurring basis, which includes property and equipment, goodwill, intangibles, and non-financial long-lived assets,cost method investments are measured at fair value in certain circumstances (for example, when there is evidence of impairment). As of June 30, 2017,2018, and December 31, 2016,2017, there was no indication of impairment related to the Company’s non-financialthese assets.
Contingencies
From time to time, the Company is involved in certain claims and litigation arising in the normal course of business. Management assesses the probability of loss for such contingencies and recognizes a liability when a loss is probable and estimable.
Since the September 2017 announcement of the original proposed recapitalization plan (“Original Transaction”) (see Note 2), three purported class action and/or derivative complaints have been filed in state or federal courts by three individuals claiming to be shareholders of the Company. All of the complaints name as defendants the Company and the individual directors of the Company. Two of these lawsuits were filed in the United States District Court for the District of Nebraska— a putative class action lawsuit captioned Gennaro v. National Research Corporation, et al., which was filed on November 15, 2017, and a putative class and derivative action lawsuit captioned Gerson v. Hays, et al., which was filed on November 16, 2017. These lawsuits were consolidated by order of the federal court under the caption In re National Research Corporation Shareholder Litigation. A third lawsuit was filed in the Circuit Court for Milwaukee County, Wisconsin—a putative class action lawsuit captioned Apfel v. Hays, et al., which was filed on December 1, 2017. The allegations in all of the lawsuits were very similar. The plaintiffs alleged, among other things, that the defendants breached their fiduciary duties in connection with the allegedly unfair proposed transaction, at an allegedly unfair price, conducted in an allegedly unfair and conflicted process and in alleged violation of Wisconsin law and the Company’s Articles of Incorporation. The plaintiffs in these lawsuits sought, among other things, an injunction enjoining the defendants from consummating the Original Transaction, damages, equitable relief and an award of attorneys’ fees and costs of litigation. After the announcement of a revised proposed recapitalization plan (the “Recapitalization”), the plaintiffs abandoned their efforts to enjoin the transaction. However, the plaintiffs in In re National Research Corporation Shareholder Litigation in Nebraska filed an Amended Complaint on March 23, 2018 seeking damages for alleged breach of fiduciary duties in connection with the Original Transaction and alleged omission of material facts in the proxy statement relating to the Recapitalization. The plaintiffs in the Apfel case in Wisconsin filed an amended complaint on April 4, 2018 seeking damages for alleged breach of fiduciary duties in connection with the Original Transaction and the Recapitalization. The Company and its directors will defend themselves against these lawsuits vigorously, and have moved to dismiss both lawsuits. These motions are pending. As of June 30, 2018, no losses have been accrued as the Company does not believe the losses are probable or estimable.
Recent Accounting Pronouncements Not Yet Adopted
In January 2016, the FASB issued ASU 2016-01, Financial Instruments—Overall: Recognition and Measurement of Financial Assets and Financial Liabilities. ASU 2016-01 changes certain recognition, measurement, presentation and disclosure aspects related to financial instruments. ASU 2016-01 is effective for financial statements issued for fiscal years beginning after December 15, 2017, and interim periods within those fiscal years. Early adoption is not permitted. The Company believes its adoption will not significantly impact the Company’s results of operations and financial position.
In February 2016, the FASB issued ASU 2016-02, Leases (Topic 842). This ASU requires lessees to recognize a lease liability and a right-to-use asset for all leases, including operating leases, with a term greater than twelve months on its balance sheet. This ASU is effective in fiscal years beginning after December 15, 2018, with early adoption permitted, and requires a modified retrospective transition method. As of June 30, 2018, the Company had approximately $4.0 million of operating lease commitments which would be recorded on the balance sheet under the new guidance. However, the Company is currently in the process of further evaluating the impact that this new guidance will have on its consolidated financial statements and does not plan to elect early adoption. The Company expects to utilize the optional practical expedients to not reassess whether expired or existing contracts contain leases, not reassess the lease classification for expired or existing leases and reassess initial direct costs for existing leases.
In June 2016, the FASB issued ASU 2016-13, Financial Instruments – Credit Losses (Topic 326): Measurement of Credit Losses on Financial Instruments. This ASU will require the measurement of all expected credit losses for financial assets, including trade receivables, held at the reporting date based on historical experience, current conditions, and reasonable and supportable forecasts. The guidance is effective for annual reporting periods beginning after December 15, 2019 and interim periods within those fiscal years. The Company believes its adoption will not significantly impact the Company’s results of operations and financial position.
On April 16, 2018, the shareholders of the Company approved, among other things, an amendment to the Company’s Amended and Restated Articles of Incorporation (the "Articles") to effect the Recapitalization pursuant to which each share of the Company’s then-existing class B common stock was exchanged for one share of the Company’s then-existing class A common stock plus $19.59 in cash, without interest. On April 17, 2018, the Company filed an amendment to its Articles effecting the Recapitalization and then a further amendment and restatement of the Company’s Articles which resulted in the elimination of the Company’s class B common stock and the reclassification of the Company’s class A common stock as a share of Common Stock, par value $0.001 per share (“Common Stock”). The Company issued 3,617,615 shares of Common Stock and paid $72.4 million in exchange for all class B shares outstanding and to settle outstanding share based awards for class B common stock. The Common Stock continues to trade on The NASDAQ Global Market under the revised symbol “NRC.”
In connection with the Recapitalization, on April 18, 2018, the Company entered into a credit agreement with First National Bank of Omaha, a national banking association (“FNB”), as described in Note 5.
3. | CONTRACTS WITH CUSTOMERS |
The following table disaggregates revenue for the three and six month periods ending June 30, 2018 based on timing of revenue recognition (In thousands):
| | | Three months ended June 30, 2018 | | | Six months ended June 30, 2018 | |
Subscription services recognized ratably over time | | $ | 25,653 | | | $ | 51,441 | |
Services recognized at a point in time | | | 157 | | | | 1,902 | |
Fixed, non-subscription recognized over time | | | 487 | | | | 1,779 | |
Unit price services, recognized over time | | | 1,720 | | | | 3,912 | |
Total revenue | | $ | 28,017 | | | $ | 59,034 | |
The following table provides information about receivables, contract assets, and contract liabilities from contracts with customers (In thousands):
| | |
June 30, 2018
| | | Balance at 1/1/2018
as adjusted (1) | |
Accounts receivables | | $ | 10,689 | | | $ | 14,674 | |
Contract assets included in other current assets | | $ | 72 | | | $ | 74 | |
Deferred Revenue | | $ | (16,660 | ) | | $ | (16,642 | ) |
(1) | Represents the December 31, 2017 balance adjusted for the ASC 606 transition adjustments. |
Significant changes in contract assets and contract liabilities during 2018 are as follows (in thousands):
| | | Three months ended June 30, 2018 | | | Six months ended June 30, 2018 | |
| | | Contract Asset | | | Deferred Revenue | | | Contract Asset | | | Deferred Revenue | |
| | | | | | | | | | | Increase (Decrease) | |
Revenue recognized that was included in deferred revenue at beginning of year due to completion of services | | $ | - | | | $ | (7,733 | ) | | $ | - | | | $ | (13,577 | ) |
Increases due to invoicing of client, net of amounts recognized as revenue | | | - | | | | 7,558 | | | | - | | | | 13,796 | |
Decreases due to completion of services (or portion of services) and transferred to accounts receivable | | | (41 | ) | | | - | | | | (58 | ) | | | - | |
Change due to cumulative catch-up adjustments arising from changes in expected contract consideration | | | | | | | (84 | ) | | | | | | | (153 | ) |
Decreases due to impairment | | | - | | | | - | | | | - | | | | - | |
Increases due to revenue recognized in the period with additional performance obligations before invoicing | | | 25 | | | | - | | | | 56 | | | | - | |
The Company has elected to apply the practical expedient to not disclose the value of unsatisfied performance obligations for contracts with an original expected length of one year or less. Total remaining contract revenue for contracts with original duration of greater than one year expected to be recognized in the future related to performance obligations that are unsatisfied at June 30, 2018 approximated $678,000, of which $341,000, $284,000 and $53,000 will be recognized during the remainder of 2018, 2019 and 2020, respectively.
The effective tax rate for the three-month period ended June 30, 20172018 decreased to 32.1%(1.7)% compared to 35.2%32.1% for the same period in 2016.2017 mainly due to income tax benefits from the Recapitalization, due to accelerated vesting of restricted stock and settlement of options of $1.1 million, and the reduction in the corporate tax rate from 35% to 21% due to the Tax Act that was enacted on December 22, 2017. In addition, the Company had increased tax benefits of $558,000 from the exercise of options and dividends paid to non-vested shareholders partially offset by $70,000 additional tax expense from non-deductible Recapitalization expenses. The effective tax rate for the six-month period ended June 30, 2017 increased2018 decreased to 33.5%9.1% compared to 33.1%33.5% for the same period in 2016.2017. The decrease in the effective tax rate for the three-month period ending June 30, 2017 was lower mainly due to a $323,000 increaseincome tax benefits from the Recapitalization and the reduction in the corporate tax rate from 35% to 21% due to the Tax Act. In addition, the Company had increased tax benefits of $908,000 from the exercise of options and dividends paid to non-vested shareholders. The increase in the effective tax rate for the six-month period ended June 30, 2017 was due to increases in the estimated state tax rates as well as a greater proportion of United States income subject to higher tax rates than Canadian income,shareholders partially offset by increased tax benefits in 2017 from the exercise of options and dividends paid to non-vested shareholders. In addition, state tax incentives decreased by $38,000, and, in 2016, the United States federal tax examination adjustments decreased$137,000 additional tax expense by $48,000.from non-deductible Recapitalization expenses.
The Company’sCompany’s long term debt consists of the following:
| | | June 30, 2018 | | | December 31, 2017 | |
Term Loans | | $ | 39,781 | | | $ | 1,067 | |
Less: current portion | | | (3,575 | ) | | | (1,067 | ) |
Less: unamortized debt issuance costs | | | (177 | ) | | | — | |
Notes payable, net of current portion | | $ | 36,029 | | | $ | — | |
The balance on the Company’s former term note with US Bank was paid in full in March 2018.
On April 18, 2018, in connection with the Recapitalization, the Company entered into a credit agreement (the “Credit Agreement”) with FNB providing for (i) a $15,000,000 revolving credit facility (the “Line of Credit”), (ii) a $40,000,000 term loan (the “Term Loan”) and (iii) a $15,000,000 delayed draw-dawn term facility (the “Delayed Draw Term Loan” and, together with the Line of Credit and the Term Loan, the “Credit Facilities”). The Company used the Term Loan to fund, in part, the cash portion paid to holders of the Company’s then-existing class B common stock in connection with the Recapitalization and the accompanying exchange of outstanding equity awards tied to the class B common stock, as well as for the costs of the Recapitalization. The Delayed Draw Term Loan may be used to fund any permitted future business acquisitions or repurchasing of the Company’s Common Stock and the Line of Credit will be used to fund ongoing working capital needs and other general corporate purposes, including to pay the fees and expenses incurred in connection with the Recapitalization and the Credit Agreement.
The Term Loan is payable in monthly installments of $212,468. $462,988 through April 2020 and $526,362 thereafter, with a balloon payment due at maturity in April 2023. The Term Loan bears interest at a fixed rate of 5%.
Borrowings under the term note bear interest at an annual rateLine of 3.12%. The outstanding balance ofCredit and the term note at June 30, 2017 was $2.1 million.
The Company also has a revolving credit note which was amended and extended effective June 30, 2017 with a maturity date of June 30, 2018. The maximum aggregate amount available under the revolving credit note is $12.0 million. Borrowings under the revolving credit noteDelayed Draw Term Loan, if any, bear interest at a variable annualfloating rate with three rate options atequal to the discretion of management as follows: (1) 2.1% plus the one-month30 day London Interbank Offered Rate (“LIBOR”) or (2) 2.1% plus 225 basis points (4.24% at June 30, 2018). Interest on the one-, two- or three- month LIBOR rate, or (3)Line of Credit accrues and is payable monthly. Principal amounts outstanding under the bank’s one-, two, three, six, or twelve month Money Market Loan Rate.Line of Credit are due and payable in full at maturity, in April 2021. As of June 30, 20172018, the revolving credit noteLine of Credit did not have a balancebalance. The weighted average borrowings on the Line of Credit for the three and six months ended June 30, 2018 was $385,000 and $193,000, respectively. The weighted average interest on borrowings on the Company hadLine of Credit for the capacity to borrow $12.0 million.three and six months ended June 30, 2018 was 4.16%. There have been no borrowings on the Delayed Draw Term Loan since origination.
The term note and revolving credit note are secured by certainCompany paid a one-time fee equal to 0.25% of the amount borrowed under the Term Loan at the closing of the Credit Facilities. The Company’s assets, including is also obligated to pay ongoing unused commitment fees quarterly in arrears pursuant to the Line of Credit and the Delayed Draw Term Loan facility at a rate of 0.20% per annum based on the actual daily unused portions of the Line of Credit and the Delayed Draw Term Loan facility, respectively.
The Credit Agreement is collateralized by substantially all of the Company’s land, building, trade accounts receivableassets and intangible assets.contains customary representations, warranties, affirmative and negative covenants (including financial covenants) and events of default. The term notenegative covenants include, among other things, restrictions regarding the incurrence of indebtedness and revolving credit note contain various restrictionsliens, repurchases of the Company’s Common Stock and covenants applicableacquisitions, subject in each case to the Company, including requirements that the Company maintaincertain exceptions. The Credit Agreement also contains certain financial ratios at prescribed levelscovenants with respect to a minimum fixed charge coverage ratio of 1.10x and restrictions on the abilitya maximum cash flow leverage ratio of the Company to consolidate3.00x or merge, create liens, incur additional indebtedness or dispose of assets.less. As of June 30, 2017,2018, the Company was in compliance with its financial covenants.
Scheduled maturities of notes payable at June 30, 2018 are as follows:
Remainder of 2018 | | $ | 1,786 | |
2019 | | | 3,715 | |
2020 | | | 4,418 | |
2021 | | | 4,916 | |
2022 | | | 5,171 | |
Thereafter | | | 19,775 | |
4. 6.
| SHARE-BASED COMPENSATION |
The Company measures and recognizes compensation expense for all share-based payments based on the grant-date fair value of those awards. All of the Company’sCompany’s existing stock option awards and unvested stock awards have been determined to be equity-classified awards. As described in Note 2, the Company completed a Recapitalization in April which, among other things, settled all then-existing outstanding class B share-based awards and resulted in the elimination of the class B common stock. As a result, the Company accelerated vesting of all outstanding class B share based awards, resulting in accelerated share-based compensation of $331,000 in the three and six month periods ended June 30, 2018. All outstanding class B share based awards were then settled for the same stock to cash proportion of the class B common stock described in Note 2, less the exercise price, if any, which approximated the awards’ intrinsic value.
The Company’sCompany’s 2001 Equity Incentive Plan provided for the granting of stock options, stock appreciation rights, restricted stock, performance shares and other share-based awards and benefits up to an aggregate of 1,800,000 shares of the Company's former class A common stock and 300,000 shares of the Company's former class B common stock. Stock options granted could have been either nonqualified or incentive stock options. Stock options vest over one to five years following the date of grant and option terms are generally five to ten years following the date of grant.
The Company’sCompany’s 2004 Non-Employee Director Stock Plan, as amended (the “2004 Director Plan”), is a nonqualified plan that provides for the granting of options with respect to an aggregate of 3,000,000 shares of class A common stockthe Company's Common Stock and, prior to the Recapitalization, 500,000 shares of the Company's former class B common stock. The 2004 Director Plan provides for grants of nonqualified stock options to each director of the Company who is not employed by the Company. OnBeginning in 2018, on the date of each annual meeting of shareholders of the Company, options to purchase 36,000 shares of class A common stock and 6,000 sharesCommon Stock equal to an aggregate grant date fair value of class B common stock$100,000 are granted to directorseach non-employee director that areis elected or retained as a director at such meeting. Stock options vest approximately one year following the date of grant and option terms are generally ten years following the date of grant, or three years in the case of termination of the outside director’s service.
The Company’sCompany’s 2006 Equity Incentive Plan, as amended, provides for the granting of stock options, stock appreciation rights, restricted stock, performance shares and other share-based awards and benefits up to an aggregate of 1,800,000 shares of class A common stockCommon Stock and, prior to the Recapitalization, 300,000 shares of the Company’s former class B common stock. Stock options granted may be either incentive stock options or nonqualified stock options. Vesting terms vary with each grant and option terms are generally five to ten years following the date of grant.
The Company granted options to purchase 299,917116,276 shares of the Company’s class A common stock and 49,986 shares of the class B common stockCommon Stock during the six-month period ended June 30, 2017.2018. Options to purchase shares of common stock were granted with exercise prices equal to the fair value of the common stock on the date of grant. The fair value of the stock options granted was estimated using a Black-Scholes valuation model with the following weighted average assumptions:
| | | 2017 | | | 2016 | | |
| | | Class A | | | Class B | | | Class A | | | Class B | | | 2018 | | | 2017 | |
| | | | | | | | | | | | | | | | | | | | | | | Common Stock (formerly Class A) | | | Class A | | | Class B | |
Expected dividend yield at date of grant | | 2.46 | to | 2.87% | | | 7.99 | to | 8.10% | | | 2.96 | to | 3.02% | | | 6.67 | to | 8.12% | | | | 2.59% | | | | 2.62% | | | | 8.06% | |
Expected stock price volatility | | 32.20 | to | 32.62% | | | 26.47 | to | 27.18% | | | 31.33 | to | 34.61% | | | 27.64 | to | 31.77% | | | | 32.47% | | | | 32.45% | | | | 26.75% | |
Risk-free interest rate | | 2.08 | to | 2.33% | | | 2.08 | to | 2.33% | | | 1.36 | to | 2.12% | | | 1.36 | to | 2.12% | | | | 2.51% | | | | 2.18% | | | | 2.18% | |
Expected life of options (in years) | | 6 | to | 8 | | | 6 | to | 8 | | | 6 | to | 8 | | | 6 | to | 8 | | | | 7.3 | | | | 6.8 | | | | 6.8 | |
The risk-free interest rate assumptions were based on the U.S. Treasury yield curve in effect at the time of the grant. The expected volatility was based on historical monthly price changes of the Company’sCompany’s common stock based on the expected life of the options at the date of grant. The expected life of options is the average number of years the Company estimates that options will be outstanding. The Company considers groups of associates that have similar historical exercise behavior separately for valuation purposes.
The following table summarizes stock option activity under the Company’sCompany’s 2001 and 2006 Equity Incentive Plans and the 2004 Director Plan for the threesix months ended June 30, 2017:2018:
| | | Number of
Options | | | Weighted Average Exercise Price | | | Weighted Average Remaining Contractual Terms (Years) | | | Aggregate Intrinsic Value (In thousands) | | | Number of
Options | | | Weighted Average Exercise Price | | | Weighted Average Remaining Contractual Terms (Years) | | | Aggregate Intrinsic Value (In thousands) | |
Class A | | | | | | | | | | | | | | | | | |
Outstanding at December 31, 2016 | | | 1,705,483 | | | $ | 12.31 | | | | | | | | | | |
Common Stock (formerly Class A) | | | | | | | | | | | | | | | | | |
Outstanding at December 31, 2017 | | | | 1,746,634 | | | $ | 13.88 | | | | | | | | | |
Granted | | | 299,917 | | | $ | 22.13 | | | | | | | | | | | | 116,276 | | | $ | 36.12 | | | | | | | | | |
Exercised | | | (159,011 | ) | | $ | 11.07 | | | | | | | $ | 1,754 | | | | (344,958 | ) | | $ | 13.78 | | | | | | | $ | 7,119 | |
Forfeited | | | (24,982 | ) | | $ | 17.03 | | | | | | | | | | | | (21,383 | ) | | $ | 26.18 | | | | | | | | | |
Outstanding at June 30, 2017 | | | 1,821,407 | | | $ | 13.97 | | | | 6.24 | | | $ | 23,544 | | |
Exercisable at June 30, 2017 | | | 1,313,134 | | | $ | 12.03 | | | | 5.23 | | | $ | 19,523 | | |
Outstanding at June 30, 2018 | | | | 1,496,569 | | | $ | 15.46 | | | | 5.24 | | | $ | 32,838 | |
Exercisable at June 30, 2018 | | | | 1,104,429 | | | $ | 13.29 | | | | 4.22 | | | $ | 26,631 | |
Class B | | | | | | | | | | | | | | | | | | | | | | | | | | | | | | | | |
Outstanding at December 31, 2016 | | | 250,493 | | | $ | 29.70 | | | | | | | | | | |
Outstanding at December 31, 2017 | | | | 276,716 | | | $ | 31.78 | | | | | | | | | |
Granted | | | 49,986 | | | $ | 42.90 | | | | | | | | | | | | -- | | | $ | -- | | | | | | | | | |
Exercised | | | (12,000 | ) | | $ | 28.41 | | | | | | | $ | 142 | | |
Exercised/Settled in Recapitalization | | | | (276,716 | ) | | $ | 31.78 | | | | | | | $ | 5,937 | |
Forfeited | | | (4,163 | ) | | $ | 37.30 | | | | | | | | | | | | -- | | | $ | -- | | | | | | | | | |
Outstanding at June 30, 2017 | | | 284,316 | | | $ | 31.96 | | | | 6.48 | | | $ | 4,486 | | |
Exercisable at June 30, 2017 | | | 200,550 | | | $ | 29.06 | | | | 5.49 | | | $ | 3,747 | | |
Outstanding at June 30, 2018 | | | | -- | | | $ | -- | | | | -- | | | $ | -- | |
Exercisable at June 30, 2018 | | | | -- | | | $ | -- | | | | -- | | | $ | -- | |
As of June 30, 2017,2018 the total unrecognized compensation cost related to non-vested stock option awards was approximately $2.0$1.6 million and $239,000 for class A and class B common shares, respectively, which is expected to be recognized over a weighted average period of 2.33 years and 2.48 years for class A and class B common stock shares, respectively.3.05 years.
The following table summarizes information for the sixthree months ended June 30, 20172018, regarding non-vested stock granted to associates under the 2001 and 2006 Equity Incentive Plans:Plans:
| | | Class A Shares Outstanding | | | Class A Weighted Average Grant Date Fair Value Per Share | | | Class B Shares Outstanding | | | Class B Weighted Average Grant Date Fair Value Per Share | |
Outstanding at December 31, 2016 | | | 174,487 | | | $ | 13.93 | | | | 29,081 | | | $ | 37.21 | |
Granted | | | -- | | | | -- | | | | -- | | | | -- | |
Vested | | | -- | | | | -- | | | | -- | | | | -- | |
Forfeited | | | (19,314 | ) | | $ | 14.27 | | | | (3,219 | ) | | $ | 34.69 | |
Outstanding at June 30, 2017 | | | 155,173 | | | $ | 13.89 | | | | 25,862 | | | $ | 37.53 | |
| | | Common (formerly Class A) Shares Outstanding | | | Common (formerly Class A) Weighted Average Grant Date Fair Value Per Share | | | Class B Shares Outstanding | | | Class B Weighted Average Grant Date Fair Value Per Share | |
Outstanding at December 31, 2017 | | | 81,667 | | | $ | 13.80 | | | | 13,611 | | | $ | 36.65 | |
Granted | | | 6,793 | | | | 36.80 | | | | -- | | | | -- | |
Vested/Settled in Recapitalization | | | -- | | | | -- | | | | (13,611 | ) | | | 36.65 | |
Forfeited | | | (10,289 | ) | | $ | 15.23 | | | | -- | | | $ | -- | |
Outstanding at June 30, 2018 | | | 78,171 | | | $ | 15.56 | | | | -- | | | $ | -- | |
As of June 30, 2017,2018 the total unrecognized compensation cost related to non-vested stock awards was approximately $1.2 million$593,000 and is expected to be recognized over a weighted average period of 2.592.93 years.
5. 7.
| GOODWILL AND OTHER INTANGIBLE ASSETS |
The following represents a summary of changes in the Company’sCompany’s carrying amount of goodwill for the six months ended June 30, 2017:2018:
| | | (In thousands) | |
Balance as of December 31, 2016 | | $ | 57,861 | |
Foreign currency translation | | | 81 | |
Balance as of June 30, 2017 | | $ | 57,942 | |
| | | (In thousands) | |
Balance as of December 31, 2017 | | $ | 58,021 | |
Foreign currency translation | | | (108 | ) |
Balance as of June 30, 2018 | | $ | 57,913 | |
Intangible assets consisted of the following:
| | | June 30, 2017 | | | December 31, 2016 | | | June 30, 2018 | | | December 31, 2017 | |
| | | (In thousands) | | | (In thousands) | |
Non-amortizing other intangible assets: | | | | | | | | | | | | | | | | |
Trade name | | $ | 1,191 | | | $ | 1,191 | | | $ | 1,191 | | | $ | 1,191 | |
Amortizing other intangible assets: | | | | | | | | | | | | | | | | |
Customer related | | | 9,339 | | | | 9,331 | | | | 9,336 | | | | 9,347 | |
Technology | | | 1,110 | | | | 1,110 | | | | 1,360 | | | | 1,360 | |
Trade name | | | 1,572 | | | | 1,572 | | | | 1,572 | | | | 1,572 | |
Total other intangible assets | | | 13,212 | | | | 13,204 | | | | 13,459 | | | | 13,470 | |
Accumulated amortization | | | (10,382 | ) | | | (10,080 | ) | | | (11,031 | ) | | | (10,706 | ) |
Other intangible assets, net | | $ | 2,830 | | | $ | 3,124 | | | $ | 2,428 | | | $ | 2,764 | |
6. 8.
| PROPERTY AND EQUIPMENT |
| | | June 30, 2017 | | | December 31, 2016 | |
| | | (In thousands) | |
Property and equipment | | $ | 40,209 | | | $ | 37,890 | |
Accumulated depreciation | | | (28,071 | ) | | | (26,084 | ) |
Property and equipment, net | | $ | 12,138 | | | $ | 11,806 | |
-12-
| | | June 30, 2018 | | | December 31, 2017 | |
| | | (In thousands) | |
Property and equipment | | $ | 43,223 | | | $ | 40,206 | |
Accumulated depreciation | | | (29,903 | ) | | | (27,847 | ) |
Property and equipment, net | | $ | 13,320 | | | $ | 12,359 | |
Net income per share of the Company's former class A common stock and former class B common stock iswas computed using the two-class method. Basic net income per share is computed by allocating undistributed earnings to common shares and using the weighted-average number of common shares outstanding during the period.
Diluted net income per share is computed using the weighted-average number of common shares and, if dilutive, the potential common shares outstanding during the period. Potential common shares consist of the incremental common shares issuable upon the exercise of stock options and vesting of restricted stock. The dilutive effect of outstanding stock options is reflected in diluted earnings per share by application of the treasury stock method.
The liquidation rights and the rights upon the consummation of an extraordinary transaction arewere the same for the holders of the Company's former class A common stock and former class B common stock. Other than share distributions and liquidation rights, the amount of any dividend or other distribution payable on each share of former class A common stock will bewas equal to one-sixth (1/6th)6th) of the amount of any such dividend or other distribution payable on each share of former class B common stock.stock until the Recapitalization. As a result, the undistributed earnings for each period are allocated based on the contractual participation rights of the former class A and former class B common stock as if the earnings for the period had been distributed.
As described in Note 2, the Company completed a Recapitalization in April which settled all then-existing outstanding class B share-based awards, resulted in the elimination of the class B common stock and reclassified class A common stock to Common Stock. The Recapitalization was effective on April 17, 2018. Therefore, income was allocated between the former class A and class B common stock using the two-class method through April 16, 2018, and fully allocated to the Common Stock (formerly class A) following the Recapitalization.
For the three months ended June 30, 2017,, the Company excluded 17,473 104,835 options of class B shares from the diluted net income per share computation because the exercise or grant price exceeded the fair market value. For the three months ended June 30, 2016, 798,421 options offormer class A shares and 46,813 options of class B shares have been excluded from the diluted net income per share computation because the exercise or grant price exceeded the fair market value. For the three months ended June 30, 2017,2018, an additional 104,83584,963 options of former class A shares, were excluded as their inclusion would be anti-dilutive. Forand for the three months ended June 30, 2016,2017, an additional 66,42817,473 options of class A shares and 34,830 offormer class B shares, were excluded as their inclusion would be anti-dilutive.
| | | For the Three Months Ended June 30, 2017 | | | For the Three Months Ended June 30, 2016 | |
| | | Class A Common Stock | | | Class B Common Stock | | | Class A Common Stock | | | Class B Common Stock | |
| | | (In thousands, except per share data) | |
Numerator for net income per share - basic: | | | | | | | | | | | | | | | | |
Net income | | $ | 2,855 | | | $ | 2,897 | | | $ | 2,260 | | | $ | 2,298 | |
Allocation of distributed and undistributed income to unvested restricted stock shareholders | | | (22 | ) | | | (22 | ) | | | (19 | ) | | | (20 | ) |
Net income attributable to common shareholders | | $ | 2,833 | | | $ | 2,875 | | | $ | 2,241 | | | $ | 2,278 | |
Denominator for net income per share - basic: | | | | | | | | | | | | | | | | |
Weighted average common shares outstanding - basic | | | 20,752 | | | | 3,514 | | | | 20,711 | | | | 3,508 | |
Net income per share – basic | | $ | 0.14 | | | $ | 0.82 | | | $ | 0.11 | | | $ | 0.65 | |
Numerator for net income per share - diluted: | | | | | | | | | | | | | | | | |
Net income attributable to common shareholders for basic computation | | $ | 2,833 | | | $ | 2,875 | | | $ | 2,241 | | | $ | 2,278 | |
Denominator for net income per share - diluted: | | | | | | | | | | | | | | | | |
Weighted average common shares outstanding – basic | | | 20,752 | | | | 3,514 | | | | 20,711 | | | | 3,508 | |
Weighted average effect of dilutive securities – stock options | | | 773 | | | | 77 | | | | 281 | | | | 57 | |
Denominator for diluted earnings per share – adjusted weighted average shares | | | 21,525 | | | | 3,591 | | | | 20,992 | | | | 3,565 | |
Net income per share – diluted | | $ | 0.13 | | | $ | 0.80 | | | $ | 0.11 | | | $ | 0.64 | |
| | | For the Three Months Ended June 30, 2018 | | | For the Three Months Ended June 30, 2017 | |
| | | Common Stock (formerly Class A) | | | Class B Common Stock | | | Common Stock (formerly Class A) | | | Class B Common Stock | |
| | | (In thousands, except per share data) | |
Numerator for net income per share - basic: | | | | | | | | | | | | | | | | |
Net income | | $ | 7,000 | | | $ | 948 | | | $ | 2,855 | | | $ | 2,897 | |
Allocation of distributed and undistributed income to unvested restricted stock shareholders | | | (23 | ) | | | (4 | ) | | | (22 | ) | | | (22 | ) |
Net income attributable to common shareholders | | $ | 6,977 | | | $ | 944 | | | $ | 2,833 | | | $ | 2,875 | |
Denominator for net income per share - basic: | | | | | | | | | | | | | | | | |
Weighted average common shares outstanding - basic | | | 23,957 | | | | 3,527 | | | | 20,752 | | | | 3,514 | |
Net income per share – basic | | $ | 0.29 | | | $ | 0.27 | | | $ | 0.14 | | | $ | 0.82 | |
Numerator for net income per share - diluted: | | | | | | | | | | | | | | | | |
Net income attributable to common shareholders for basic computation | | $ | 6,977 | | | $ | 944 | | | $ | 2,833 | | | $ | 2,875 | |
Denominator for net income per share - diluted: | | | | | | | | | | | | | | | | |
Weighted average common shares outstanding - basic | | | 23,957 | | | | 3,527 | | | | 20,752 | | | | 3,514 | |
Weighted average effect of dilutive securities – stock options | | | 889 | | | | 93 | | | | 773 | | | | 77 | |
Denominator for diluted earnings per share – adjusted weighted average shares | | | 24,846 | | | | 3,620 | | | | 21,525 | | | | 3,591 | |
Net income per share – diluted | | $ | 0.28 | | | $ | 0.26 | | | $ | 0.13 | | | $ | 0.80 | |
For the six months ended June 30, 2017, and 2016, the Company had 52,707 and 550,561115,908 options of former class A shares and 38,784 and 38,40719,318 options of former class B shares, respectively, which have been excluded from the diluted net income per share computation because the exercise or grant price exceeded the fair market value. For the six months ended June 30, 20172018 and 2016,2017, an additional 115,90878,945 and 260,86852,707 options of former class A shares, respectively, and 19,318 and 34,333for the six months ended June 30, 2017, an additional 38,784 options of Classformer class B shares were excluded, as their inclusion would be anti-dilutive, respectively.anti-dilutive.
| | | For the Six Months Ended June 30, 2017 | | | For the Six Months Ended June 30, 2016 | | | For the Six Months Ended June 30, 2018 | | | For the Six Months Ended June 30, 2017 | |
| | | Class A Common Stock | | | Class B Common Stock | | | Class A Common Stock | | | Class B Common Stock | | | Common Stock (formerly Class A) | | | Class B Common Stock | | | Common Stock (formerly Class A) | | | Class B Common Stock | |
| | | (In thousands, except per share data) | | | (In thousands, except per share data) | |
Numerator for net income per share - basic: | | | | | | | | | | | | | | | | | | | | | | | | | | | | | | | | |
Net income | | $ | 6,088 | | | $ | 6,184 | | | $ | 4,994 | | | $ | 5,071 | | | $ | 10,630 | | | $ | 4,624 | | | $ | 6,088 | | | $ | 6,184 | |
Allocation of distributed and undistributed income to unvested restricted stock shareholders | | | (48 | ) | | | (49 | ) | | | (43 | ) | | | (44 | ) | | | (38 | ) | | | (18 | ) | | | (48 | ) | | | (49 | ) |
Net income attributable to common shareholders | | $ | 6,040 | | | $ | 6,135 | | | $ | 4,951 | | | $ | 5,027 | | | $ | 10,592 | | | $ | 4,606 | | | $ | 6,040 | | | $ | 6,135 | |
Denominator for net income per share - basic: | | | | | | | | | | | | | | | | | | | | | | | | | | | | | | | | |
Weighted average common shares outstanding - basic | | | 20,745 | | | | 3,514 | | | | 20,711 | | | | 3,498 | | | | 22,429 | | | | 3,527 | | | | 20,745 | | | | 3,514 | |
Net income per share – basic | | $ | 0.29 | | | $ | 1.75 | | | $ | 0.24 | | | $ | 1.44 | | | $ | 0.47 | | | $ | 1.31 | | | $ | 0.29 | | | $ | 1.75 | |
Numerator for net income per share - diluted: | | | | | | | | | | | | | | | | | | | | | | | | | | | | | | | | |
Net income attributable to common shareholders for basic computation | | $ | 6,040 | | | $ | 6,135 | | | $ | 4,951 | | | $ | 5,027 | | | $ | 10,592 | | | $ | 4,606 | | | $ | 6,040 | | | $ | 6,135 | |
Denominator for net income per share - diluted: | | | | | | | | | | | | | | | | | | | | | | | | | | | | | | | | |
Weighted average common shares outstanding – basic | | | 20,745 | | | | 3,514 | | | | 20,711 | | | | 3,498 | | | | 22,429 | | | | 3,527 | | | | 20,745 | | | | 3,514 | |
Weighted average effect of dilutive securities – stock options | | | 659 | | | | 70 | | | | 291 | | | | 59 | | | | 921 | | | | 101 | | | | 659 | | | | 70 | |
Denominator for diluted earnings per share – adjusted weighted average shares | | | 21,404 | | | | 3,584 | | | | 21,002 | | | | 3,557 | | | | 23,350 | | | | 3,628 | | | | 21,404 | | | | 3,584 | |
Net income per share – diluted | | $ | 0.28 | | | $ | 1.71 | | | $ | 0.24 | | | $ | 1.41 | | | $ | 0.45 | | | $ | 1.27 | | | $ | 0.28 | | | $ | 1.71 | |
8. RELATED PARTY
A director of the Company serves as an officer of Ameritas Life Insurance Corp. (“Ameritas”). In connection with the Company’s regular assessment of its insurance-based associate benefits, which is conducted by an independent insurance broker, and the costs associated therewith, the Company purchases dental and vision insurance for certain of its associates from Ameritas. The total value of these purchases was $62,000$53,000 and $57,000$62,000 for the three-month periods ended June 30, 20172018 and 2016,2017, respectively, and $120,000$94,000 and $115,000$120,000 for the six-month periods ended June 30, 2018 and 2017, and 2016, respectively.
Mr. Hays,
During 2017, the Chief Executive Officer, majority shareholderCompany acquired a cost method investment in convertible preferred stock of Practicing Excellence.com, Inc., a privately-held Delaware corporation (“PX”), which is included in other non-current assets and directoris carried at cost, adjusted for changes resulting from observable price changes in orderly transactions of the same investment in PX, if any. The Company isalso has an owneragreement with PX which commenced in 2016 under which the Company acts as a reseller of 14%PX services and receives a portion of the equity interest of Nebraska Global Investment Company LLC (“Nebraska Global”). The Company, directly or indirectly through its former subsidiary Customer-Connect LLC, purchased certain services from Nebraska Global, primarily consisting of software development services.revenues. The total value of these purchases were $204,000 and $420,000revenue earned from the PX reseller agreement in the three-month periods ended June 30, 2018 and 2017, were $66,000 and $171,000, respectively, and in six-month periods ended June 30, 2016,2018 and 2017, were $109,000 and $295,000, respectively. There were no purchases
The Company’s six operating segments are aggregated into one reporting segment because they have similar economic characteristics and meet the other aggregation criteria from Nebraska Global in 2017.the FASB guidance on segment disclosure. The six operating segments are Experience, The Governance Institute, Market Insights, Transparency, National Research Corporation Canada and Transitions, which offer a portfolio of solutions that address specific needs around market insight, experience, transparency and governance for healthcare providers, payers and other healthcare organizations. The table below presents entity-wide information regarding the Company’s assets, after elimination of intercompany balances by geographic area:
| | | June 30, 2018 | | | December 31, 2017 | |
| | | | | | | | | |
Long-lived assets: | | | | | | | | |
United States | | $ | 76,871 | | | $ | 72,562 | |
Canada | | | 2,381 | | | | 2,495 | |
Total | | $ | 79,252 | | | $ | 75,057 | |
Total assets: | | | | | | | | |
United States | | $ | 97,101 | | | $ | 110,785 | |
Canada | | | 5,784 | | | | 16,531 | |
Total | | $ | 102,855 | | | $ | 127,316 | |
9. RECENT ACCOUNTING PRONOUNCEMENTS
In May 2014, the FASB issued Accounting Standards Update ("ASU") 2014-09, Revenue from Contracts with Customers (Topic 606) (“ASU 2014-09”). ASU 2014-09 requires an entity to recognize the amount of revenue to which it expects to be entitled for the transfer of promised goods or services to customers. ASU 2014-09 will replace most existing revenue recognition guidance in accounting principles generally accepted in the United States when it becomes effective. The standard is effective for annual and interim reporting periods in fiscal years beginning after December 15, 2017, with early adoption allowed for years beginning after December 15, 2016. An entity may choose to adopt ASU 2014-09 either retrospectively or through a cumulative effect adjustment as of the start of the first period for which it applies the standard. The Company is currently in the process of evaluating the impact that this new guidance will have on its consolidated financial statements as well as developing and testing changes to our processes and systems. Due to cost benefit considerations reviewed during the second quarter of 2017, the Company now plans to adopt the guidance beginning January 1, 2018 by recording a cumulative effect adjustment rather than retrospectively, as previously planned. The Company currently expects the most significant changes to result from deferring commissions and recognizing the expense over the estimated life of the client relationship rather than expensing as incurred, which is the Company’s current practice, and estimating variable consideration at the outset of the contract.
In February 2016, the FASB issued ASU 2016-02, Leases(Topic 842). This ASU requires lessees to recognize a lease liability and a right-to-use asset for all leases, including operating leases, with a term greater than twelve months on its balance sheet. This ASU is effective in fiscal years beginning after December 15, 2018, with early adoption permitted, and requires a modified retrospective transition method. The Company is currently in the process of evaluating the impact that this new guidance will have on its consolidated financial statements and does not plan to elect early adoption.
In June 2016, the FASB issued ASU 2016-13, Financial Instruments – Credit Losses (Topic 326): Measurement of Credit Losses on Financial Instruments. This ASU will require the measurement of all expected credit losses for financial assets, including trade receivables, held at the reporting date based on historical experience, current conditions, and reasonable and supportable forecasts. The guidance is effective for annual reporting periods beginning after December 15, 2019 and interim periods within those fiscal years. The Company believes its adoption will not significantly impact the Company’s results of operations and financial position.
In August 2016, the FASB issued ASU 2016-15, Statement of Cash Flows (Topic 230) Classification of Certain Cash Receipts and Cash Payments which eliminates the diversity in practice related to eight cash flow classification issues. This ASU is effective for the Company on January 1, 2018 with early adoption permitted. The Company plans to adopt this update on January 1, 2018 and believes its adoption will not significantly impact the Company’s results of operations and financial position.
In October 2016, the FASB issued ASU 2016-16, Intra-Entity Transfers of Asset Other Than Inventory (“ASU 2016-16”), which requires entities to recognize the tax consequences of intercompany asset transfers other than inventory transfers in the period in which the transfer takes place. ASU 2016-16 is effective for fiscal years and interim periods within fiscal years beginning after December 15, 2017. ASU 2016-16 is to be adopted using a modified retrospective approach with a cumulative effect adjustment to retained earnings as of the beginning of the period of adoption. The cumulative effect adjustment will include recognition of the income tax consequences of intra-entity transfers of assets other than inventory that occur before the adoption date. The Company believes the adoption of ASU 2016-16 will not significantly impact the consolidated financial statements.
In November 2016, the FASB issued ASU 2016-18, Statement of Cash Flows (Topic 230), Restricted Cash (“ASU 2016-18”), which requires that the amounts generally described as restricted cash or restricted cash equivalents be included with cash and cash equivalents when reconciling the beginning-of-the period and end-of-period total amounts shown on the statement of cash flows. ASU 2016-18 does not provide a definition of restricted cash or restricted cash equivalents. ASU 2016-18 is effective for fiscal years and interim periods beginning after December 15, 2017. The Company does not expect the adoption of ASU 2016-18 to have any impact on the consolidated financial statements.
In January 2017, the FASB issued ASU 2017-04, Intangibles—Goodwill and Other (Topic 350), Simplifying the Test for Goodwill Impairment (“ASU 2017-04”). The new guidance eliminates Step 2 of the goodwill impairment testing which requires the fair value of individual assets and liabilities of a reporting unit to be determined when measuring goodwill impairment. The new guidance may result in different amounts of impairment that could be recognized compared to existing guidance. In addition, failing step 1 of the impairment test may not result in impairment under existing guidance. However, under the revised guidance, failing step 1 will always result in a goodwill impairment. ASU 2017-04 is to be applied prospectively for goodwill impairment testing performed in years beginning after December 15, 2019. The Company does not believe the adoption will significantly impact the Company's results of operations or financial position.
ITEM 2.Management’s Discussion and Analysis of Financial Condition and Results of Operations | Management’s Discussion and Analysis of Financial Condition and Results of Operations |
The Company is a leading provider of analytics and insights that facilitate measurement and improvement of the patient and employee experience while also increasing patient engagement and customer loyalty for healthcare providers, payers and other healthcare organizations. The Company’sCompany’s solutions enable its clients to understand the voice of the customer with greater clarity, immediacy and depth. NRC Health’s heritage, proprietary methods, and holistic approach enable our partners to better understand the people they care for and design experiences that inspire loyalty and trust, while also facilitating regulatory compliance and the shift to population-based health management. The Company’s ability to measure what matters most and systematically capture, analyze and deliver insights based on self-reported information from patients, families and consumers is critical in today’s healthcare market. NRC Health believes that access to and analysis of its extensive consumer-driven information is becoming more valuable as healthcare providers increasingly need to more deeply understand and engage patients and consumers in an effort towards effective population-based health management.
The Company’sCompany’s portfolio of subscription-based solutions provide actionable information and analysis to healthcare organizations and payers across a range of mission-critical, constituent-related elements, including patient experience and satisfaction, community population health risks, workforce engagement, community perceptions, and physician engagement. NRC Health partners with clients across the continuum of healthcare services. The Company’s clients range from integrated health systems and post-acute providers, such as home health, long term care and hospice, to numerous payer organizations. The Company believes this cross-continuum positioning is a unique and an increasingly important capability as evolving payment models drive healthcare providers and payers towards a more collaborative and integrated service model.
As described in Note 2, the Company completed a Recapitalization effective April 17, 2018. Pursuant to the Recapitalization, each share of the Company’s then-existing class B common stock was exchanged for one share of the Company’s then-existing class A common stock plus $19.59 in cash, without interest. All class B common stock were subsequently eliminated and the Company’s class A common stock was reclassified as Common Stock. The Company issued 3,617,615 shares of Common Stock and paid $72.4 million in exchange for all class B shares outstanding and to settle outstanding share based awards for class B common stock. In connection with the Recapitalization, the Company entered into a credit agreement with FNB as described in Note 5.
Results of Operations
The following table and graphs set forth, for the periods indicated, select financial information derived from the Company’s condensed consolidated financial statements expressed as a percentage of total revenue. The trends illustrated may not necessarily be indicative of future results. The discussion that follows the table should be read in conjunction with the condensed consolidated financial statements.
| | | Three months ended | | | Six months ended | | | Three months ended | | | Six months ended | |
| | | June 30, | | | June 30, | | | June 30, | | | June 30, | |
| | | 2017 | | | 2016 | | | 2017 | | | 2016 | | | 2018 | | | 2017 | | | 2018 | | | 2017 | |
| | | | | | | | | | | | | | | | | | | | | | | | | | | | | | | | | |
Revenue: | | | 100.0 | % | | | 100.0 | % | | | 100.0 | % | | | 100.0 | % | | | 100.0 | % | | | 100.0 | % | | | 100.0 | % | | | 100.0 | % |
| | | | | | | | | | | | | | | | | | | | | | | | | | | | | | | | | |
Operating expenses: | | | | | | | | | | | | | | | | | | | | | | | | | | | | | | | | |
Direct | | | 42.0 | | | | 41.1 | | | | 41.6 | | | | 41.3 | | | | 39.3 | | | | 42.0 | | | | 40.5 | | | | 41.6 | |
Selling, general and administrative | | | 24.3 | | | | 27.8 | | | | 23.2 | | | | 27.1 | | | | 28.3 | | | | 24.3 | | | | 26.8 | | | | 23.2 | |
Depreciation and amortization | | | 4.0 | | | | 4.2 | | | | 3.8 | | | | 3.8 | | | | 4.7 | | | | 4.0 | | | | 4.4 | | | | 3.8 | |
Total operating expenses | | | 70.3 | | | | 73.1 | | | | 68.6 | | | | 72.2 | | | | 72.3 | | | | 70.3 | | | | 71.7 | | | | 68.6 | |
| | | | | | | | | | | | | | | | | | | | | | | | | | | | | | | | | |
Operating income | | | 29.7 | % | | | 26.9 | % | | | 31.4 | % | | | 27.8 | % | | | 27.7 | % | | | 29.7 | % | | | 28.3 | % | | | 31.4 | % |
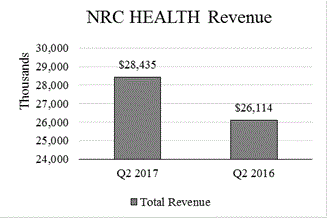
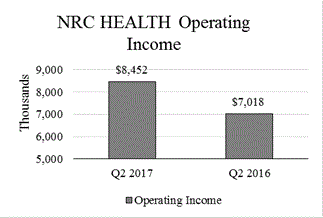
Three Months Ended June 30, 2018, Compared to Three Months Ended June 30, 2017 Compared to Three Months Ended June 30, 2016
Revenue. Revenue for the three-month period ended June 30, 2017, increased 8.9%2018, decreased 1.5% to $28.4$28.0 million, compared to $26.1$28.4 million in the three-month period ended June 30, 2016.2017. This was primarily due to the adoption of ASC 606 and the timing of conferences, combined with minimal contract value growth.
Direct expenses. Direct expenses decreased 7.9% to $11.0 million for the three-month period ended June 30, 2018, compared to $11.9 million in the same period in 2017. This was primarily due to a decrease in variable expenses of $924,000. Variable expenses decreased due to less postage, printing and paper costs due to lower volumes and changes in survey methodologies, and less conference expenses due to timing of conferences held in comparison to the prior year. Direct expenses as a percentage of revenue were 39.3% in the three-month periods ended June 30, 2018 and 42.0% for the same period in 2017 as direct expenses decreased by 7.9% while revenue decreased by 1.5%.
Selling, general and administrative expenses. Selling, general and administrative expenses increased 15.0% to $7.9 million for the three-month period ended June 30, 2018, compared to $6.9 million for the same period in 2017, primarily due to higher salaries and benefit costs of $708,000, including acceleration of shared based compensation expense from the vesting of restricted stock and settlement of stock options associated with the Recapitalization of $331,000, increased software and platform hosting expenses of $494,000, and costs associated with the Recapitalization of $305,000, partially offset by reduced marketing expenses of $140,000 and recruiting expenses of $128,000. Selling, general and administrative expenses as a percentage of revenue were 28.3% in the three-month periods ended June 30, 2018 and 24.3% for the same period in 2017 as selling, general and administrative expenses increased by 15% while revenues decreased by 1.5%.
Depreciation and amortization. Depreciation and amortization increased 16.4% to $1.3 million for the three-month period ended June 30, 2018, compared to $1.1 million for the same period in 2017 mainly due to increased amortization from additional computer software investments. Depreciation and amortization expenses as a percentage of revenue was 4.7% for the three-month period ended June 30, 2018, and 4.0% for the same period in 2017.
Other income (expense). Other income (expense) increased to $63,000 for the three-month period ended June 30, 2018, compared to $19,000 for the same period in 2017 primarily due to increased interest expense, offset by other income. Interest expense increased $416,000 due to interest related to the new Term Loan originated in April 2018. Other income increased $466,000 primarily due to revaluation on intercompany transactions due to changes in the foreign exchange rate.
Provision (benefit) for income taxes. Provision (benefit) for income taxes was $(129,000) ((1.7)% effective tax rate benefit) for the three-month period ended June 30, 2018, compared to $2.7 million (32.1% effective tax rate) for the same period in 2017. The effective tax rate for the three-month period ended June 30, 2018, was lower mainly due to income tax benefits from the Recapitalization, due to accelerated vesting of restricted stock and settlement of stock options of $1.1 million, and the reduction in the corporate tax rate from 35% to 21% due to the Tax Act that was enacted on December 22, 2017. In addition, the Company had increased tax benefits of $558,000 from the exercise of options and dividends paid to non-vested shareholders, partially offset by $70,000 additional tax expense from non-deductible Recapitalization expenses.
Six Months Ended June 30, 2018, Compared to Six Months Ended June 30, 2017
Revenue. Revenue for the six-month period ended June 30, 2018, increased 0.6% to $59.0 million, compared to $58.7 million in the six-month period ended June 30, 2017. The increase was due to new customer sales, as well as increases in sales to the existing client base.
Direct expenses. Direct expenses increased 11.2%decreased 2.2% to $11.9 million for the three-month period ended June 30, 2017, compared to $10.7 million in the same period in 2016. This was due to an increase in variable expenses of $371,000 and fixed expenses of $834,000. Variable expense increased mainly due to higher contracted voice recognition technology, phone costs, and labor costs, partially offset by decreased postage, printing and paper costs due to changes in survey methodologies. Fixed expenses increased primarily as a result of increased salary and benefit costs in the customer service area. Direct expenses increased as a percentage of revenue to 42.0% in the three-month period ended June 30, 2017, compared to 41.1% during the same period of 2016 as expenses increased by 11.2% while revenue for the same period increased by 8.9%.
Selling, general and administrative expenses. Selling, general and administrative expenses decreased 5.0% to $6.9 million for the three-month period ended June 30, 2017, compared to $7.3 million for the same period in 2016, primarily due to lower salary and benefit costs, including lower incentives, commissions, and share based compensation expense totaling $641,000, and reduced bad debt expense of $48,000, partially offset by increased public company related costs and legal expenses of $134,000, computer supplies and software license fees of $122,000, and increased recruiting fees of $116,000. Selling, general, and administrative expenses decreased as a percentage of revenue to 24.3% for the three-month period ended June 30, 2017, from 27.8% for the same period in 2016 as expenses decreased by 5.0% while revenue for the same period increased by 8.9%.
Depreciation and amortization. Depreciation and amortization remained at $1.1 million for the three-month periods ended June 30, 2017 and 2016. Depreciation and amortization expenses as a percentage of revenue was 4.0% for the three-month period ended June 30, 2017, and 4.2% for the same period in 2016.
Provision for income taxes. Provision for income taxes was $2.7 million (32.1% effective tax rate) for the three-month period ended June 30, 2017, compared to $2.5 million (35.2% effective tax rate) for the same period in 2016. The effective tax rate for the three-month period ended June 30, 2017, was lower mainly due to a $323,000 increase in tax benefits from the exercise of options and dividends paid to non-vested shareholders.
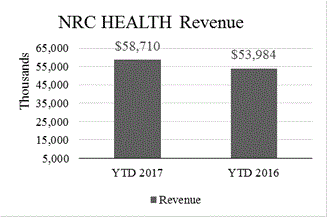
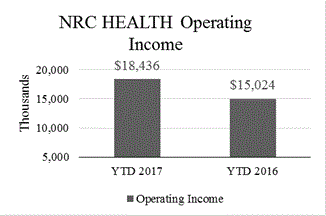
Six Months Ended June 30, 2017, Compared to Six Months Ended June 30, 2016
Revenue. Revenue for the six-month period ended June 30, 2017, increased 8.8% to $58.7 million, compared to $54.0 million in the six-month period ended June 30, 2016. The increase was due to new customer sales, as well as increases in sales to the existing client base.
Direct expenses. Direct expenses increased 9.7% to $24.4$23.9 million for the six-month period ended June 30, 2017,2018, compared to $22.3$24.4 million in the same period in 2016.2017. This was due to an increasea decrease in variable expenses of $587,000 and$921,000, partially offset by an increase in fixed expenses of $1.6 million.$388,000. Variable expense increasedexpenses decreased mainly due to higher contracted voice recognition technology, phone costs, and labor costs, partially offset by decreasedless postage, printing and paper costs due to a reduction in postage feeslower volumes and changes in survey methodologies. Fixed expenses increased primarily as a result of increased salary and benefit costs in the customer service area,and information technology areas. Direct expenses decreased as a percentage of revenue to 40.5% in the six-month period ended June 30, 2018, compared to 41.6% during the same period of 2017 as expenses decreased by 2.2% while revenue for the same period increased by 0.6%.
Selling, general and administrative expenses. Selling, general and administrative expenses increased 16.3% to $15.8 million for the six-month period ended June 30, 2018, compared to $13.6 million for the same period in 2017, primarily due to increased software and platform hosting expenses of $ 863,000, higher salary and benefit costs of $760,000, including acceleration of shared based compensation expense from the vesting of restricted stock and settlement of stock options associated with the Recapitalization of $331,000, legal and accounting expenses associated with the Recapitalization and adoption of ASC 606 of $688,000; partially offset by decreased contracted service costs. Directlower marketing expenses of $181,000 and recruiting expenses of $154,000. Selling, general, and administrative expenses increased as a percentage of revenue to 41.6% in26.8% for the six-month period ended June 30, 2017, compared to 41.3% during2018, from 23.1% for the same period of 2016in 2017 as expenses increased by 9.7%16.3% while revenue for the same period increased by 8.8%0.6%.
Selling, generalDepreciation and administrativeamortization. Depreciation and amortization expenses. Selling, general and administrative expenses decreased 7.1% increased to $13.6$2.6 million for the six-month period ended June 30, 2017,2018, compared to $14.6$2.2 million for the same period in 2016, primarily due to lower salary and benefit costs, including lower incentives, commissions, and share based compensation expense totaling $1.1 million, less public company related costs and legal expenses of $162,000 (mainly due to shelf registration fees expensed in 2016 of $177,000), and lower travel costs of $103,000; partially offset by higher computer supplies and software license fees of $215,000. Selling, general, and administrative expenses decreased as a percentage of revenue to 23.2% for the six-month period ended June 30, 2017 from 27.1% for the same period in 2016 as expenses decreased by 7.1% while revenue for the same period increased by 8.8%.
Depreciation and amortization. Depreciation and amortization expenses increased to $2.2 million for the six-month period ended June 30, 2017, compared to $2.1 million for the same period in 2016 primarily due to increased amortization of $250,000 from additional computer software investments, partially offset by decreased amortization of $66,000 as a result of certain intangibles becoming fully amortized.investments. Depreciation and amortization expenses as a percentage of revenue was 3.8%4.4% for the six-month periods ended June 30, 2018 and 3.8% for the same period in 2017.
Other income (expense). Other income (expense) increased to $71,000 for the three-month period ended June 30, 2018, compared to $14,000 for the same period in 2017 and 2016.primarily due to increased interest expense, offset by other income. Interest expense increased $397,000 due to interest related to the new Term Loan originated in April 2018. Other income increased $454,000 primarily due to revaluation on intercompany transactions due to changes in the foreign exchange rate.
Provision for income taxes. Provision for income taxes was $6.2$1.5 million (33.5%(9.1% effective tax rate) for the six-month period ended June 30, 2017,2018, compared to $5.0$6.2 million (33.1%(33.5% effective tax rate) for the same period in 2016.2017. The effective tax rate for the six-month period ended June 30, 2017 increased slightlywas lower mainly due to increasesincome tax benefits from the Recapitalization, due to accelerated vesting of restricted stock and settlement of stock options of $1.1 million, and the reduction in the estimated statecorporate tax rates as well as a greater proportion of United States income subjectrate from 35% to higher tax rates than Canadian income, partially offset by21% due to the Tax Act that was enacted on December 22, 2017. In addition, the Company had increased tax benefits in 2017of $908,000 from the exercise of options and dividends paid to non-vested shareholders. In addition, state tax incentives decreased $38,000, and, in 2016, the United States federal tax examination adjustments decreasedshareholders, partially offset by $137,000 additional tax expense by $48,000.
from non-deductible Recapitalization expenses.
Liquidity and Capital Resources
The Company believes that its existing sources of liquidity, including cash and cash equivalents, borrowing availability under the Company’s existing Credit Facilities, and operating cash flows will be sufficient to meet its projected capital and debt maturity needs and the dividend policy for the foreseeable future.
As of June 30, 2017,2018, our principal sources of liquidity included $31.6$6.7 million of cash and cash equivalents, and up to $12.0$15 million of unused borrowings under our revolving credit note.Line of Credit and up to $15 million available under our Delayed Draw Down Term Loan. The Delayed Draw Down Term Loan can only be used to fund permitted future business acquisitions or repurchasing the Company’s common stock. Of this cash, $12.6$1.1 million was held in Canada. All of the amounts held in Canada are intended to be indefinitely reinvested in foreign operations. The amounts held in Canada are eligible for repatriation, but under current law, would be subject to U.S. federal income taxes less applicable foreign tax credits. The Company estimated at December 31, 2016, that an additional tax liability of $536,000 would become due if repatriation of undistributed earnings would occur.
Working Capital
The Company'sCompany had a working capital was $20.1deficit of $9.1 million and $15.6a working capital surplus of $19.9 million on June 30, 20172018 and December 31, 2016,2017, respectively. The change was primarily due to increases in trade accounts receivable of $2.3 million, increases in prepaid expenses of $1.8 million, increases in recoverable income taxes of $1.2 million, decreases in income taxable payablecash and cash equivalents of $662,000, decreases$28.0 million and increases in current portion of notes payable of $576,000, decreases in accrued wages, bonus and profit sharing of $467,000 and decreases in accrued expenses of $339,000. This was partially offset by increases in deferred revenue of $1.2$2.5 million increases in accounts payable of $118,000 and decreases in cash and cash equivalents of $1.4 million.due to the Recapitalization (see Note 2). Trade accounts receivable and unbilled revenue increasedalso decreased by $4.1 million due to the timing of billings and collections on new and renewal contracts. These were partially offset by increases in prepaid expenses of $2.1 million and income taxes receivable of $1.2 million and decreases in accrued wages, bonus and profit sharing of $1.9 million. Accrued wages, bonus and profit sharing decreased due to the payment of 20162017 annual bonuses in the six-monththree-month period ended June 30, 2017. AccruedMarch 31, 2018. Income taxes receivable changed due to the timing of income tax payments and prepaid expenses changed due to the timing of vendor payments and pre-paymentspre-payment for services. Income taxes payable and recoverable changed due to the timing of income tax payments. Current portion of notes payable decreased due to normal payment and amortization of the term note. The Company’s working capital is significantly impacted by its large deferred revenue balances which will vary based on the timing and frequency of billings on annual agreements. The deferred revenue balances as of June 30, 20172018 and December 31, 20162017 were $16.7 million and $15.5$16.9 million, respectively.
The deferredDeferred revenue balance is primarily due to timingrecognized when we invoice clients in advance of initial billings on newperforming the related services under the terms of a contract and renewal contracts.is recognized as revenue when we have satisfied the related performance obligation. The Company typically invoices clients for performance tracking services and custom research projects before they have been completed. Billed amounts are recorded as billings in excess of revenue earned, or deferred revenue, on the Company’s consolidated financial statements, and are recognized as income when earned. In addition, when work is performed in advance of billing, the Company records this work as revenue earned in excess of billings, or unbilled revenue. Substantially all deferred revenue and all unbilled revenue will be earned and billed respectively, within 12 months of the respective period ends.
Cash Flow Analysis
A summary of operating, investing, and financing activities is shown in the following table:
| | | Six Months Ended June 30, | | | Six Months Ended June 30, | |
| | | 2017 | | | 2016 | | | 2018 | | | 2017 | |
| | | (In thousands) | | | (In thousands) | |
Provided by operating activities | | $ | 10,620 | | | $ | 11,225 | | | $ | 18,391 | | | $ | 10,620 | |
Used in investing activities | | | (2,390 | ) | | | (2,217 | ) | | | (2,773 | ) | | | (2,390 | ) |
Used in financing activities | | | (10,022 | ) | | | (24,647 | ) | | | (43,058 | ) | | | (10,022 | ) |
Effect of exchange rate change on cash | | | 399 | | | | 686 | | | | (595 | ) | | | 399 | |
Net change in cash and cash equivalents | | | (1,393 | ) | | | (14,953 | ) | | | (28,035 | ) | | | (1,393 | ) |
Cash and cash equivalents at end of period | | $ | 31,628 | | | $ | 27,192 | | | $ | 6,698 | | | $ | 31,628 | |
Cash Flows from Operating Activities
Cash flows from operating activities consist of net income adjusted for non-cash items including depreciation and amortization, deferred taxes, share-based compensation and related taxes, reserve for uncertain tax positions and the effect of working capital changes.
Net cash provided by operating activitiesactivities was $18.4 million for the six months ended June 30, 2018, which included net income of $15.3 million, plus non-cash charges (benefits) for deferred income taxes, depreciation and amortization, reserve for uncertain tax positions, stock compensation and loss on disposal of property and equipment, totaling $4.6 million. Net changes in assets and liabilities decreased cash flows from operating activities by $1.5 million, primarily due to decreases in accrued wages, bonus and profit sharing, increases in prepaid expenses and other current assets and increases in income taxes receivable and payable which fluctuate with the timing of income tax payments partially offset by decreases in trade accounts receivable which fluctuate due to timing and frequency of billings on new and renewal contracts.
Net cash provided by operating activities was $10.6 million for the six months ended June 30, 2017, which included net income of $12.3 million, plus non-cash charges (benefits) for deferred tax expense,income taxes, depreciation and amortization, reserve for uncertain tax positions and non-cash stock compensation totaling $3.5 million. Changes in working capital decreased cash flows from operating activities by $5.1 million, primarily due to increases in trade accounts receivables, increases in prepaid expenses, increases in unbilled revenue and decreases in accrued expenses, wages, bonuses and profit sharing. These were partially offset by increases in deferred revenue, which fluctuate due to the timing and frequency of billings on new and renewal contracts, and increases in accounts payable due to timing of payments.
Net cash provided by operating activities was $11.2 million for the six months ended June 30, 2016, which included net income of $10.1 million, plus non-cash charges (benefits) for deferred tax expense, depreciation and amortization, provision for uncertain tax positions and non-cash stock compensation totaling $4.0 million. Changes in working capital decreased 2016 cash flows from operating activities by $2.8 million, primarily due to increases in trade accounts receivable and income taxes receivable, net of increases in deferred revenue due to the timing of billing, collections and revenue recognition on new or renewal contracts.
Cash Flows from Investing Activities
Net cash of $2.4$2.8 million and $2.2$2.4 million was used for investing activities in the six months ended June 30, 2018 and 2017, and 2016, respectively, for purchasesrespectively. These expenditures consisted mainly of computer software classified in property and equipment. The Company expects similar capital expenditure purchases for the remainder of 2018 consisting primarily of computer software and hardware and other equipment to be funded through cash generated from operations.
Cash Flows from Financing Activities
Net cash usedused in financing activities was $43.1 million in the six months ended June 30, 2018. Cash was used for the Recapitalization of $72.4 million (see Note 2), to repay borrowings under the term notes totaling $1.3 million, to repay borrowings on the line of credit of $1.0 million, to pay loan origination fees on the Credit Agreement of $187,000 and for capital lease obligations of $58,000. Cash was also used to pay $8.4 million of dividends on common stock, and to pay payroll tax withholdings related to share-based compensation of $712,000. Cash was provided from proceeds of the new Term Loan of $40,000,000 and the new Line of Credit for $1,000,000.
Net cash used in financing activities was $10.0 million in the six months ended June 30, 2017. Cash was used to repay borrowings under the then-existing term note totaling $1.4 million and for capital lease obligations of $53,000. Cash was also used to pay $8.4 million of dividends on common stock, and to pay payroll tax withholdings related to share-based compensation of $105,000.
Net cash used in financing activities was $24.6 million in the six months ended June 30, 2016. The exercise of stock options provided cash of $547,000. Cash was used to pay payroll taxes on vested restricted shares of $147,000, to pay capital lease obligations of $46,000, to repay borrowings under the term note totaling $1.2 million, to pay dividends on common stock of $21.8 million, and to pay $2.0 million for Customer-Connect LLC non-controlling interests.
The effect of changes in foreign exchange rates (decreased) increased cash and cash equivalents by $399,000 and $686,000$(595,000) in the six months ended June 30, 20172018 and $399,000 in the six months ended June 30, 2016, respectively.2017.
Capital Expenditures
Cash paid for capital expenditures was $2.4$2.8 million for the six-month periodthree months ended June 30, 2017.2018. These expenditures consisted mainly of computer software classified in property and equipment. The Company expects similar capital expenditure purchases for the remainder of 20172018 consisting primarily of computer software and hardware and other equipment to be funded through cash generated from operations.
Debt and Equity
The Company’sbalance on the Company’s former term note with US Bank was paid in full in March 2018.
On April 18, 2018, in connection with the Recapitalization, the Company entered into a credit agreement (the “Credit Agreement”) with FNB providing for (i) a $15,000,000 revolving credit facility (the “Line of Credit”), (ii) a $40,000,000 term loan (the “Term Loan”) and (iii) a $15,000,000 delayed draw-dawn term facility (the “Delayed Draw Term Loan” and, together with the Line of Credit and the Term Loan, the “Credit Facilities”). The Company used the Term Loan to fund, in part, the cash portion paid to holders of the Company’s then-existing class B common stock in connection with the Recapitalization and the accompanying exchange of outstanding equity awards tied to the class B common stock, as well as for the costs of the Recapitalization. The Delayed Draw Term Loan may be used to fund any permitted future business acquisitions or repurchasing of the Company’s Common Stock and the Line of Credit will be used to fund ongoing working capital needs and other general corporate purposes, including to pay the fees and expenses incurred in connection with the Recapitalization and the Credit Agreement.
The Term Loan is payable in monthly installments of $212,468. $462,988 through April 2020 and $526,362 thereafter, with a balloon payment due at maturity in April 2023. The Term Loan bears interest at a fixed rate of 5%.
Borrowings under the term note bear interest at an annual rateLine of 3.12%. The outstanding balance ofCredit and the term note at June 30, 2017 was $2.1 million.
The Company also has a revolving credit note which was amended and extended effective June 30, 2017 with a maturity date of June 30, 2018. The maximum aggregate amount available under the revolving credit note is $12.0 million. Borrowings under the revolving credit noteDelayed Draw Term Loan, if any, bear interest at a variable annualfloating rate with three rate options atequal to the discretion of management as follows: (1) 2.1% plus the one-month30 day London Interbank Offered Rate (“LIBOR”) or (2) 2.1% plus 225 basis points (4.24% at June 30, 2018). Interest on the one-, two- or three- month LIBOR rate, or (3)Line of Credit accrues and is payable monthly. Principal amounts outstanding under the bank’s one-, two, three, six, or twelve month Money Market Loan Rate.Line of Credit are due and payable in full at maturity, in April 2021. As of June 30, 20172018, the revolving credit noteLine of Credit did not have a balance. The Company hadweighted average borrowings on the capacity to borrow $12.0 million asLine of Credit for the three and six months ended June 30, 2017.2018 was $385,000 and $193,000, respectively. The weighted average interest on borrowings on the Line of Credit for the three and six months ended June 30, 2018 was 4.16%.
In the event that the Delayed Draw Term Loan is used, interest-only payments will be due through the calendar year in which the Delayed Draw Term Loan is drawn upon. After that, amortization will occur at the then current Term Loan rate and schedule with principal and accrued interest amounts outstanding under the Delayed Draw Term Loan due and payable monthly during the term of the Delayed Draw Term Loan, which expires on April 18, 2023. There have been no borrowings on the Delayed Draw Term Loan since origination.
The term noteCompany paid a one-time fee equal to 0.25% of the amount borrowed under the Term Loan at the closing of the Credit Facilities. The Company is also obligated to pay ongoing unused commitment fees quarterly in arrears pursuant to the Line of Credit and revolving credit notethe Delayed Draw Term Loan facility at a rate of 0.20% per annum based on the actual daily unused portions of the Line of Credit and the Delayed Draw Term Loan facility, respectively.
All obligations under the Credit Facilities are to be guaranteed by each of the Company’s direct and indirect wholly owned domestic subsidiaries, if any, and, to the extent required by the Credit Agreement, direct and indirect wholly owned foreign subsidiaries (each, a “guarantor”).
The Credit Facilities are secured, subject to permitted liens and other agreed upon exceptions, by certaina first-priority lien on and perfected security interest in substantially all of the Company’sCompany’s and the guarantors’ present and future assets including(including, without limitation, fee-owned real property, and limited, in the case of the equity interests of foreign subsidiaries, to 65% of the outstanding equity interests of such subsidiaries).
The Credit Agreement contains customary representations, warranties, affirmative and negative covenants (including financial covenants) and events of default. The negative covenants include, among other things, restrictions regarding the incurrence of indebtedness and liens, repurchases of the Company’s land, building, trade accounts receivableCommon Stock and intangible assets.acquisitions, subject in each case to certain exceptions. The term noteCredit Agreement also contains certain financial covenants with respect to minimum fixed charge coverage ratio and revolving credit note contain various restrictions and covenants applicablemaximum cash flow leverage ratio. Pursuant to the Company, including requirements thatCredit Agreement, the Company is required to maintain certain financial ratios at prescribed levels and restrictions ona minimum fixed charge coverage ratio of 1.10x for all testing periods throughout the abilityterms of the Credit Facilities. The Company is also required to consolidatemaintain a cash flow leverage ratio of 3.00x or merge, create liens, incur additional indebtedness or disposeless for all testing periods throughout the terms of assets.the Credit Facilities. As of June 30, 2017,2018, the Company was in compliance with its financial covenants.
The Company has capital leases for computer equipment, office equipment, printing and inserting equipment. The balance of the capital leases as of June 30, 20172018 was $202,000.$310,000.
Shareholders’Shareholders’ equity increased $5.0decreased $63.2 million to $87.8$26.8 million at June 30, 2017,2018, from $82.8$90.0 million at December 31, 2016.2017. The increasedecrease was mainly due to net incomethe effect of $12.3the Recapitalization of $72.4 million share-based compensation(see Note 2), dividends declared of $792,000 and$8.4 million, changes in the cumulative translation adjustment of $499,000.$697,000 and share repurchases exceeding the cost of stock options exercised of $711,000. This was partially offset by dividends declarednet income of $8.4 million.$15.3 million, revenue transition adjustments associated with adoption of ASC 606 of $2.7 million, and share-based compensation of $995,000, including accelerated share-based compensation expense due to the Recapitalization of $331,000.
Contractual Obligations
The Company had contractual obligations to make payments in the following amounts in the future as of June 30, 2017:2018:
Contractual Obligations(1) | | Total Payments | | | Remainder
of 2017 | | | One to Three Years | | | Three to Five Years | | | After Five Years | | | Total Payments | | | Remainder
of 2018 | | | One to Three Years | | | Three to Five Years | | | After Five Years | |
(In thousands) | | | | | | | | | | | | | | | | | | | | | | | | | | | | | | | | | | | | | | | | |
Long-term debt | | | $ | 47,172 | | | $ | 2,778 | | | $ | 11,619 | | | $ | 12,633 | | | $ | 20,142 | |
Operating leases | | $ | 1,168 | | | $ | 266 | | | $ | 796 | | | $ | 106 | | | $ | -- | | | $ | 4,033 | | | $ | 331 | | | $ | 1,630 | | | $ | 1,018 | | | $ | 1,054 | |
Capital leases | | | 213 | | | | 100 | | | | 81 | | | | 32 | | | | -- | | | | 373 | | | | 75 | | | | 205 | | | | 93 | | | | -- | |
Uncertain tax positions(2) | | | -- | | | | -- | | | | -- | | | | -- | | | | -- | | | | -- | | | | -- | | | | -- | | | | -- | | | | -- | |
Long-term debt | | | 2,136 | | | | 1,274 | | | | 862 | | | | -- | | | | -- | | |
Total | | $ | 3,517 | | | $ | 1,640 | | | $ | 1,739 | | | $ | 138 | | | $ | -- | | | $ | 51,578 | | | $ | 3,184 | | | $ | 13,454 | | | $ | 13,744 | | | $ | 21,196 | |
| (1) | Amounts are inclusive of interest payments, where applicable. |
| (2) | We have $730,000$940,000 in liabilities associated with uncertain tax positions. We are unable to reasonably estimate the expected cash settlement dates of these uncertain tax positions with the taxing authorities. |
Stock Repurchase Program
The Board of Directors of the Company authorized the repurchase of up to 2,250,000 then-existing class A shares and 375,000 then-existing class B shares of common stock in the open market or in privately negotiated transactions under a stock repurchase program that was originally approved in February 2006 and subsequently amended in May 2013. In connection with the Recapitalization in April 2018, the Board of Directors further amended the stock repurchase program to eliminate the repurchase of the former class B common stock. As of June 30, 20172018, the remaining number of common stock shares that could be purchased under this authorization was 280,491 class A shares of Common Stock.
Critical Accounting Policies and 69,491 class B shares.Estimates
Except as set forth below in connection with the adoption of ASC 606, there have been no changes to the Company’s critical accounting policies and estimates described in the Annual Report on Form 10-K for the year ended December 31, 2017 that have a material impact on the Company’s Condensed Consolidated Financial Statements and the related Notes.
Revenue Recognition
The Company derives a majority of its revenue from annually renewable subscription-based service agreements with its customers. Refer to Note 1 to the accompanying Condensed Consolidated Financial Statements for a description of the Company’s revenue recognition policies.
The Company’s revenue arrangements with a client may include combinations of more than one service offering which may be executed at the same time, or within close proximity of one another. The Company combines contracts with the same customer into a single contract for accounting purposes when the contract is entered into at or near the same time and the contracts are negotiated as a single performance obligation. For contracts that contain more than one separately identifiable performance obligation, the total transaction price is allocated to the identified performance obligations based upon the relative stand-alone selling prices of the performance obligations. The stand-alone selling prices are based on an observable price for services sold to other comparable customers, when available, or an estimated selling price using a cost plus margin or residual approach. The Company estimates the total contract consideration it expects to receive for variable arrangements based on the most likely amount it expects to earn from the arrangement based on the expected quantities of services it expects to provide and the contractual pricing based on those quantities. The Company only includes some or a portion of variable consideration in the transaction price when it is probable that a significant reversal in the amount of cumulative revenue recognized will not occur. The Company considers the sensitivity of the estimate, its relationship and experience with the client and variable services being performed, the range of possible revenue amounts and the magnitude of the variable consideration to the overall arrangement.
The Company’s fixed, non-subscription arrangements typically require the Company to perform an unspecified amount of services for a fixed price during a fixed period of time. Revenues are recognized over time based upon the costs incurred to date in relation to the total estimated contract costs. In determining cost estimates, management uses historical and forecasted cost information which is based on estimated volumes, external and internal costs and other factors necessary in estimating the total costs over the term of the contract. Changes in estimates are accounted for using a cumulative catch up adjustment which could impact the amount and timing of revenue for any period.
If management made different judgments and estimates, then the amount and timing of revenue for any period could differ from the reported revenue.
ITEM 3. | Quantitative and Qualitative Disclosures about Market Risk |
ITEM 3.QuantitativeThe Company’s primary market risk exposure is changes in foreign currency exchange rates and Qualitative Disclosures about Market Riskinterest rates.
There
The Company’s Canadian subsidiary uses as its functional currency the local currency of the country in which it operates. It translates its assets and liabilities into U.S. dollars at the exchange rate in effect at the balance sheet date. It translates its revenue and expenses at the average exchange rate during the period. The Company includes translation gains and losses in accumulated other comprehensive income (loss), a component of shareholders’ equity. Foreign currency translation gains (losses) were $(283,000) and $381,000 in the three months ended June 30, 2018 and 2017, respectively, and $(698,000) and $499,000 in the six months ended June 30, 2018 and 2017, respectively. Gains and losses related to transactions denominated in a currency other than the functional currency of the countries in which the Company operates and short-term intercompany accounts are no material changesincluded in other income (expense) in the consolidated statements of income. Total transaction gains (losses) included in other income (expense) were $630,000 and $32,000 in the three months ended June 30, 2018 and 2017, respectively, and $587,000 and $40,000 in the six months ended June 30, 2018 and 2017, respectively. A portion of our cash in our Canadian subsidiary is denominated in foreign currencies, where fluctuations in exchange rates will impact our cash balances in U.S. dollar terms. A sensitivity analysis assuming a hypothetical 10% change in the value of the U.S. dollar would impact our reported cash balance by approximately $147,000. Our Canadian subsidiary may also make intercompany loans to the disclosures regardingU.S. parent. As of June 30, 2018, the Company’s market risk exposures made in its Annual Report on Form 10-Kparent company had outstanding loans from our Canadian subsidiary of approximately $16.9 million (Canadian). We did not have any intercompany loans at December 31, 2017.
We have not entered into any foreign currency hedging transactions. We do not purchase or hold any derivative financial instruments for the year ended December 31, 2016.purpose of speculation or arbitrage.
We are exposed to interest rate risk with both our fixed-rate Term Loan and variable rate Line of Credit. Interest rate changes for borrowings under our fixed-rate Term Loan would impact the fair value of such debt, but do not impact earnings or cash flow. At June 30, 2018, our fixed-rate Term Loan totaled $39.8 million. Based on a sensitivity analysis, a one percent change in market interest rates as of June 30, 2018, would change the estimated fair value of our fixed-rate Term Loan outstanding at June 30, 2018 by approximately $1.3 million.
Borrowings, if any, under our Line of Credit and Delayed Draw Down Term Loan bear interest at a variable annual rate. Borrowings under the Line of Credit and the Delayed Draw Down Term Loan may not exceed, in each case, $15.0 million. There were no borrowings outstanding under our Line of Credit or Delayed Draw Down Term Loan at June 30, 2018. A sensitivity analysis assuming a hypothetical 10% movement in interest rates applied to the average daily borrowings and the maximum borrowings available under the revolving credit note indicated that such a movement would not have had a significant impact on our consolidated financial position, results of operations or cash flows.
ITEM 4.Controls and Procedures | Controls and Procedures |
The Company’sCompany’s management, with the participation of the Company’s Chief Executive Officer and Chief Financial Officer, has evaluated the effectiveness of the design and operation of the Company’s disclosure controls and procedures (as such term is defined in Rules 13a-15(e) and 15d-15(e) under the Securities Exchange Act of 1934) as of the end of the period covered by this report, and has concluded that, as of the end of such period, the Company’s disclosure controls and procedures were effective.
On January 1, 2018, we adopted ASC 606 (see Note 1 to the Condensed Consolidated Financial Statements). We implemented internal controls to ensure we adequately evaluated our customer contracts and properly assessed the impact of the new accounting standard on our financial statements. We also implemented changes to our business processes related to revenue recognition and the control activities within them. The changes included training within business operations management, ongoing contract review and monitoring, and gathering of information for disclosures.
There have been no other changes in the Company’sCompany’s internal control over financial reporting (as such term is defined in Rules 13a-15(f) and 15d-15(f) under the Securities Exchange Act of 1934) that occurred during the quarter ended June 30, 2017,2018, that have materially affected, or are reasonably likely to materially affect, the Company’s internal control over financial reporting.
PART II – Other Information
See Note 1, under the heading "Contingencies", to the Company's condensed consolidated financial statements in this Quarterly Report on Form 10-Q.
There have been no material changes to the risk factors relating to the Company set forth in Part I, Item 1A of its Annual Report on Form 10-K for the year ended December 31, 2016.2017.
ITEM 2. | Unregistered Sales of Equity Securities and Use of Proceeds |
The Board of Directors of the Company authorized the repurchase of up to 2,250,000 then-existing class A shares and 375,000 then-existing class B shares of common stock in the open market or in privately negotiated transactions under a stock repurchase program that was originally approved in February 2006 and subsequently amended in May 2013. In connection with the Recapitalization in April 2018, the Board of Directors further amended the stock repurchase program to eliminate the repurchase of the former class B common stock. Unless terminated earlier by resolution of the Company’sCompany’s Board of Directors, the repurchase program will expire when the Company has repurchased all shares authorized for repurchase thereunder. As of July 28, 2017,27, 2018, 1,969,509 shares of Common Stock (formerly class A common stock and 305,509 shares of class B common stockA) have been repurchased under that authorization. No stock was repurchased under the program during the three-month period ended June 30, 2017.2018.
The exhibits listed in the accompanyingexhibit index of exhibitsbelow are filed as part of this Quarterly Report on Form 10-Q.
EXHIBIT INDEX
(101)* | Financial statements from the Quarterly Report on Form 10-Q of National Research Corporation for the quarter ended June 30, 2018, formatted in eXtensible Business Reporting Language (XBRL): (i) the Condensed Consolidated Balance Sheets, (ii) the Condensed Consolidated Statements of Income, (iii) the Condensed Consolidated Statements of Comprehensive Income, (iv) the Condensed Consolidated Statements of Shareholders' Equity, (v) the Condensed Consolidated Statements of Cash Flows, (vi) the Notes to Condensed Consolidated Financial Statements, and (vii) document and entity information. |
* | In accordance with Rule 406T of Regulation S-T, the information in these exhibits shall not be deemed to be “filed” for purposes of Section 18 of the Securities Exchange Act of 1934, as amended, or otherwise subject to liability under that section, and shall not be incorporated by reference into any registration statement or other document filed under the Securities Act of 1933, as amended, except as expressly set forth by specific reference in such filing. |
SIGNATURES
Pursuant to the requirements of the Securities Exchange Act of 1934, the Registrant has duly caused this report to be signed on its behalf by the undersigned thereunto duly authorized.
| NATIONAL RESEARCH CORPORATION | |
| | |
| | | |
Date: August 4, 20179, 2018 | By: | /s/ Michael D. Hays | |
| | Michael D. Hays | |
| | Chief Executive Officer (Principal Executive Officer) | |
| | | |
| | | |
| | | |
Date: August 4, 2017 9, 2018 | By: | /s/ Kevin R. Karas | |
| | Kevin R. Karas Senior Vice President Finance, Treasurer, Secretary and Chief Financial Officer (Principal Financial and Accounting Officer) | |
NATIONAL RESEARCH CORPORATION32
EXHIBIT INDEX TO QUARTERLY REPORT ON FORM 10-Q
For the Quarterly Period ended June 30, 2017
Exhibit
(31.1)
| Certification by the Chief Executive Officer pursuant to Rule 13a-14(a) or 15d-14(a) under the Securities Exchange Act of 1934.
|
(31.2)
| Certification by the Chief Financial Officer pursuant to Rule 13a-14(a) or 15d-14(a) under the Securities Exchange Act of 1934.
|
(32)
| Written Statement of the Chief Executive Officer and Chief Financial Officer pursuant to 18 U.S.C. Section 1350.
|
(101)*
| Financial statements from the Quarterly Report on Form 10-Q of National Research Corporation for the quarter ended June 30, 2017, formatted in eXtensible Business Reporting Language (XBRL): (i) the Condensed Consolidated Balance Sheets, (ii) the Condensed Consolidated Statements of Income, (iii) the Condensed Consolidated Statements of Comprehensive Income, (iv) the Condensed Consolidated Statements of Cash Flows, (v) the Notes to Condensed Consolidated Financial Statements, and (vi) document and entity information.
|
* In accordance with Rule 406T of Regulation S-T, the information in these exhibits shall not be deemed to be “filed” for purposes of Section 18 of the Securities Exchange Act of 1934, as amended, or otherwise subject to liability under that section, and shall not be incorporated by reference into any registration statement or other document filed under the Securities Act of 1933, as amended, except as expressly set forth by specific reference in such filing.
-25-