UNITED STATES
SECURITIES AND EXCHANGE COMMISSION
Washington, D.C.WASHINGTON, DC 20549
FORM 10-Q
(Mark One)
| |
☒ | QUARTERLY REPORT PURSUANT TO SECTION 13 OR 15(d) OF THE SECURITIES EXCHANGE ACT OF 1934 |
[X] QUARTERLY REPORT PURSUANT TO SECTION 13 OR 15(d) OF THE
SECURITIES EXCHANGE ACT OF 1934
For the quarterly period ended September 30, 2017March 31, 2024
OR
| |
Commission file number☐
| | 1-8491TRANSITION REPORT PURSUANT TO SECTION 13 OR 15(d) OF THE SECURITIES EXCHANGE ACT OF 1934
|
For the transition period from to .
Commission File Number: 1-8491
HECLA MINING COMPANY
(Exact nameName of registrantRegistrant as specifiedSpecified in its charter)Charter)
| |
Delaware | Delaware77-0664171
| | 77-0664171
| |
| (State or other jurisdiction of | | (I.R.S. Employer
| |
| incorporation or organization) | | (I.R.S. Employer
Identification No.) | |
| | | | |
| 6500 Mineral Drive, Suite 200 Coeur d’Alene, Idaho | | | 83815-9408 |
| Coeur d'Alene, Idaho
| | 83815-9408
| |
| (Address of principal executive offices) | | (Zip Code) | |
Registrant’s telephone number, including area code: (208) 769-4100
Securities registered pursuant to Section 12(b) of the Act:
| | | | |
208-769-4100Title of each class
|
| Trading Symbol(s) |
| Name of each exchange on which registered |
(Registrant's telephone number, including area code)Common Stock, par value $0.25 per share
|
| HL |
| New York Stock Exchange |
Series B Cumulative Convertible Preferred Stock, par value $0.25 per share |
| HL-PB |
| New York Stock Exchange |
Indicate by check mark whether the registrant:registrant (1) has filed all reports required to be filed by Section 13 or 15(d) of the Securities Exchange Act of 1934 during the preceding 12 months (or for such shorter period that the registrant was required to file such reports), and (2) has been subject to such filing requirements for the past 90 days.Yes ☑ No __
Yes XX . No .
Indicate by check mark whether the registrant has submitted electronically and posted on its corporate Web site, if any, every Interactive Data File required to be submitted and posted pursuant to Rule 405 of Regulation S-T (§232.405 of this chapter) during the preceding 12 months (or for such shorter period that the registrant was required to submit and post such files).Yes☑No __
Yes XX . No___.
Indicate by check mark whether the registrant is a large accelerated filer, an accelerated filer, a non-accelerated filer, a smaller reporting company, or an emerging growth company. See the definitions of “large accelerated filer,” “accelerated filer”filer,” “smaller reporting company,” and "emerging“emerging growth company"company” in Rule 12b-2 of the Exchange Act (check one):Act.
| | | | | | |
Large Accelerated Filer XX.accelerated filer |
| ☑ |
| Accelerated Filer .filer |
| ☐ |
Non-Accelerated Filer . (Do not check if a smaller reporting company)Non-accelerated filer
|
| ☐ |
| Smaller Reporting Company.reporting company |
| ☐ |
Emerging growth company. |
| ☐ |
|
|
|
|
If an emerging growth company, indicate by check mark if the registrant has elected not to use the extended transition period for complying with any new or revised financial accounting standards provided pursuant to Section 13(a) of the Exchange Act. .☐
Indicate by check mark whether the registrant is a shell company (as defined in Rule 12b-2 of the Exchange Act). Yes ☐ No ☑
Yes . No XX.
Indicate the number of shares outstanding of each of the issuer’s classes of common stock, as of the latest practicable date.
| | |
Class |
| Shares Outstanding NovemberMay 3, 20172024 |
Common stock, par value $0.25 par value per share |
| 399,018,708626,290,204
|
Hecla Mining Company and Subsidiaries
Form 10-Q
For the Quarter Ended September 30, 2017March 31, 2024
INDEX*
| | |
|
| Page |
|
|
|
PART I - Financial InformationI. | FINANCIAL INFORMATION | 3 |
|
|
|
Item 1. | Item 1 – Condensed Consolidated Financial Statements (Unaudited)
| 3 |
| | |
| Condensed Consolidated Balance Sheets - September 30, 2017 and December 31, 2016
| 3 |
| | |
| Condensed Consolidated Statements of Operations and Comprehensive Loss - Three Months Ended March 31, 2024 and Nine Months Ended September 30, 2017 and 20162023 | 43 |
| | |
| Condensed Consolidated Statements of Cash Flows - Ninethree months ended March 31, 2024 and 2023 | 4 |
| Condensed Consolidated Balance Sheets - March 31, 2024 and December 31, 2023 | 5 |
| Condensed Consolidated Statements of Changes in Stockholders' Equity – Three Months Ended September 30, 2017March 31, 2024 and 20162023 | 56 |
| | |
| Notes to Condensed Consolidated Financial Statements (Unaudited)(unaudited) | 67 |
| | |
Item 2. | Item 2. Management'sManagement’s Discussion and Analysis of Financial Condition and Results of Operations
| 3019 |
| Overview | 19 |
| Consolidated Results of Operations | 19 |
| Reconciliation of Total Cost of Sales to Cash Cost, Before By-product Credits and Cash Cost, After By-product Credits (non-GAAP) and All-In Sustaining Cost, Before By-product Credits and All-In Sustaining Cost, After By-product Credits (non-GAAP) | 30 |
| Financial Liquidity and Capital Resources | 36 |
| Contractual Obligations, Contingent Liabilities and Commitments | 39 |
| Critical Accounting Estimates | 39 |
| Off-Balance Sheet Arrangements | 39 |
| Guarantor Subsidiaries | 40 |
Item 3. | Quantitative and Qualitative Disclosures About Market Risk | 5942 |
| | |
Item 4. | Item 4. Controls and Procedures
| 6243 |
|
|
|
PART II. | OTHER INFORMATION | 1 |
|
|
|
Item 1. | Legal Proceedings | 1 |
Item 1A. | Risk Factors | 1 |
Item 4. | Mine Safety Disclosures | 1 |
Item 5. | Other Information | 1 |
Item 6. | Exhibits | 2 |
PART II - Other InformationSignatures
| |
| | |
| Item 1 – Legal Proceedings3
| 62 |
| | |
| Item 1A – Risk Factors
| 62 |
| | |
| Item 4 – Mine Safety Disclosures
| 62 |
| | |
| Item 6 – Exhibits
| 62 |
| | |
| Signatures
| 63 |
| | |
| Exhibits
| 64 |
| | |
| | |
*Items 2 3 and 53 of Part II are omitted as they are not applicable. |
|
Part I - Financial Information
Item 1. Financial Statements
Hecla Mining Company and Subsidiaries
Condensed Consolidated Balance SheetsStatements of Operations and Comprehensive Loss (Unaudited)
(InDollars and shares in thousands, except shares)for per-share amounts)
| | | | | | | | |
| | Three Months Ended | |
| | March 31, 2024 | | | March 31, 2023 | |
Sales | | $ | 189,528 | | | $ | 199,500 | |
Cost of sales and other direct production costs | | | 121,461 | | | | 125,550 | |
Depreciation, depletion and amortization | | | 48,907 | | | | 39,002 | |
Total cost of sales | | | 170,368 | | | | 164,552 | |
Gross profit | | | 19,160 | | | | 34,948 | |
Other operating expenses: | | | | | | |
General and administrative | | | 11,216 | | | | 12,070 | |
Exploration and pre-development | | | 4,342 | | | | 4,967 | |
Ramp-up and suspension costs | | | 14,523 | | | | 11,336 | |
Provision for closed operations and environmental matters | | | 986 | | | | 1,044 | |
Other operating (income) expense, net | | | (16,971 | ) | | | (22 | ) |
Total other operating expenses | | | 14,096 | | | | 29,395 | |
Income from operations | | | 5,064 | | | | 5,553 | |
Other expense: | | | | | | |
Interest expense | | | (12,644 | ) | | | (10,165 | ) |
Fair value adjustments, net | | | (1,852 | ) | | | 3,181 | |
Net foreign exchange gain | | | 3,982 | | | | 108 | |
Other income | | | 1,512 | | | | 1,392 | |
Total other expense | | | (9,002 | ) | | | (5,484 | ) |
(Loss) income before income and mining taxes | | | (3,938 | ) | | | 69 | |
Income and mining tax provision | | | (1,815 | ) | | | (3,242 | ) |
Net loss | | | (5,753 | ) | | | (3,173 | ) |
Preferred stock dividends | | | (138 | ) | | | (138 | ) |
Net loss applicable to common stockholders | | $ | (5,891 | ) | | $ | (3,311 | ) |
Comprehensive loss: | | | | | | |
Net loss | | $ | (5,753 | ) | | $ | (3,173 | ) |
Change in fair value of derivative contracts designated as hedge transactions | | | (5,403 | ) | | | 6,516 | |
Comprehensive (loss) income | | $ | (11,156 | ) | | $ | 3,343 | |
Basic loss per common share after preferred dividends | | $ | (0.01 | ) | | $ | (0.01 | ) |
Diluted loss per common share after preferred dividends | | $ | (0.01 | ) | | $ | (0.01 | ) |
Weighted average number of common shares outstanding - basic | | | 616,199 | | | | 600,075 | |
Weighted average number of common shares outstanding - diluted | | | 616,199 | | | | 600,075 | |
| | | September 30, 2017 | | | December 31, 2016 | |
ASSETS | |
Current assets: | | | | | | | | |
Cash and cash equivalents | | $ | 172,923 | | | $ | 169,777 | |
Investments | | | 32,973 | | | | 29,117 | |
Accounts receivable: | | | | | | | | |
Trade | | | 6,982 | | | | 20,082 | |
Taxes | | | 10,382 | | | | 187 | |
Other, net | | | 9,031 | | | | 9,780 | |
Inventories: | | | | | | | | |
Concentrates, doré, and stockpiled ore | | | 38,064 | | | | 25,944 | |
Materials and supplies | | | 24,663 | | | | 24,079 | |
Other current assets | | | 16,317 | | | | 12,125 | |
Total current assets | | | 311,335 | | | | 291,091 | |
Non-current investments | | | 7,098 | | | | 5,002 | |
Non-current restricted cash and investments | | | 1,076 | | | | 2,200 | |
Properties, plants, equipment and mineral interests, net | | | 2,025,607 | | | | 2,032,685 | |
Non-current deferred income taxes | | | 44,683 | | | | 35,815 | |
Other non-current assets and deferred charges | | | 6,384 | | | | 4,884 | |
Total assets | | $ | 2,396,183 | | | $ | 2,371,677 | |
LIABILITIES | |
Current liabilities: | | | | | | | | |
Accounts payable and accrued liabilities | | $ | 46,847 | | | $ | 60,064 | |
Accrued payroll and related benefits | | | 29,085 | | | | 36,515 | |
Accrued taxes | | | 5,081 | | | | 9,061 | |
Current portion of capital leases | | | 5,852 | | | | 5,653 | |
Current portion of debt | | | — | | | | 470 | |
Current portion of accrued reclamation and closure costs | | | 6,514 | | | | 5,653 | |
Accrued interest | | | 14,450 | | | | 5,745 | |
Other current liabilities | | | 7,968 | | | | 3,064 | |
Total current liabilities | | | 115,797 | | | | 126,225 | |
Capital leases | | | 7,436 | | | | 5,838 | |
Accrued reclamation and closure costs | | | 80,758 | | | | 79,927 | |
Long-term debt | | | 501,917 | | | | 500,979 | |
Non-current deferred tax liability | | | 122,723 | | | | 122,855 | |
Non-current pension liability | | | 43,451 | | | | 44,491 | |
Other noncurrent liabilities | | | 11,160 | | | | 11,518 | |
Total liabilities | | | 883,242 | | | | 891,833 | |
Commitments and contingencies (Notes 2, 4, 7, 9, and 11) | | | | | | | | |
SHAREHOLDERS’ EQUITY | |
Preferred stock, 5,000,000 shares authorized: | | | | | | | | |
Series B preferred stock, $0.25 par value, 157,816 shares issued and outstanding, liquidation preference — $7,891 | | | 39 | | | | 39 | |
Common stock, $0.25 par value, authorized 750,000,000 shares; issued and outstanding 2017 — 399,018,708 shares and 2016 — 395,286,875 shares | | | 100,886 | | | | 99,806 | |
Capital surplus | | | 1,617,669 | | | | 1,597,212 | |
Accumulated deficit | | | (166,602 | ) | | | (167,437 | ) |
Accumulated other comprehensive loss | | | (20,884 | ) | | | (34,602 | ) |
Less treasury stock, at cost; 2017 — 4,529,450 and 2016 — 3,941,210 shares issued and held in treasury | | | (18,167 | ) | | | (15,174 | ) |
Total shareholders’ equity | | | 1,512,941 | | | | 1,479,844 | |
Total liabilities and shareholders’ equity | | $ | 2,396,183 | | | $ | 2,371,677 | |
The accompanying notes are an integral part of the interim condensed consolidated financial statements.
Hecla Mining Company and Subsidiaries
Condensed Consolidated Statements of Operations and Comprehensive IncomeCash Flows (Unaudited)
(Dollars and shares in thousands, except for per-share amounts)In thousands)
| | | | | | | | |
| | Three Months Ended | |
| | March 31, 2024 | | | March 31, 2023 | |
Operating activities: | | | | | | |
Net loss | | $ | (5,753 | ) | | $ | (3,173 | ) |
Non-cash elements included in net loss: | | | | | | |
Depreciation, depletion and amortization | | | 51,226 | | | | 39,892 | |
Inventory adjustments | | | 7,671 | | | | 4,521 | |
Fair value adjustments, net | | | 1,852 | | | | (3,181 | ) |
Provision for reclamation and closure costs | | | 1,846 | | | | 1,694 | |
Stock-based compensation | | | 1,164 | | | | 1,190 | |
Deferred income taxes | | | (416 | ) | | | 558 | |
Foreign exchange gain | | | (3,982 | ) | | | (2,218 | ) |
Other non-cash items, net | | | 519 | | | | 186 | |
Change in assets and liabilities: | | | | | | |
Accounts receivable | | | (17,864 | ) | | | 15,477 | |
Inventories | | | (18,746 | ) | | | (9,239 | ) |
Other current and non-current assets | | | 5,238 | | | | (9,856 | ) |
Accounts payable, accrued and other current liabilities | | | (8,819 | ) | | | (9,304 | ) |
Accrued payroll and related benefits | | | 5,498 | | | | 4,705 | |
Accrued taxes | | | 2,085 | | | | 2,226 | |
Accrued reclamation and closure costs and other non-current liabilities | | | (4,439 | ) | | | 7,125 | |
Cash provided by operating activities | | | 17,080 | | | | 40,603 | |
Investing activities: | | | | | | |
Additions to properties, plants, equipment and mineral interests | | | (47,589 | ) | | | (54,443 | ) |
Proceeds from disposition of properties, plants and equipment | | | 47 | | | | — | |
Net cash used in investing activities | | | (47,542 | ) | | | (54,443 | ) |
Financing activities: | | | | | | |
Proceeds from sale of common stock, net | | | 1,103 | | | | 11,885 | |
Acquisition of treasury stock | | | (1,197 | ) | | | (482 | ) |
Borrowing of debt | | | 27,000 | | | | 13,000 | |
Repayment of debt | | | (15,000 | ) | | | (13,000 | ) |
Dividends paid to common and preferred stockholders | | | (3,994 | ) | | | (3,891 | ) |
Repayments of finance leases | | | (3,033 | ) | | | (2,464 | ) |
Net cash provided by financing activities | | | 4,879 | | | | 5,048 | |
Effect of exchange rates on cash | | | (624 | ) | | | 171 | |
Net decrease in cash, cash equivalents and restricted cash and cash equivalents | | | (26,207 | ) | | | (8,621 | ) |
Cash, cash equivalents and restricted cash and cash equivalents at beginning of period | | | 107,539 | | | | 105,907 | |
Cash, cash equivalents and restricted cash and cash equivalents at end of period | | $ | 81,332 | | | $ | 97,286 | |
Supplemental disclosure of cash flow information: | | | | | | |
Cash paid for interest | | $ | 18,706 | | | $ | 18,621 | |
Cash paid for income and mining taxes, net | | $ | 127 | | | $ | 1,634 | |
Significant non-cash investing and financing activities: | | | | | | |
Addition of finance lease obligations and right-of-use assets | | $ | — | | | $ | 850 | |
Common stock issued as incentive compensation | | $ | 3,355 | | | $ | — | |
Common stock issued for 401-K match | | $ | 1,251 | | | $ | 1,145 | |
| | | Three Months Ended | | | Nine Months Ended | |
| | | September 30, 2017 | | | September 30, 2016 | | | September 30, 2017 | | | September 30, 2016 | |
Sales of products | | $ | 140,839 | | | $ | 179,393 | | | $ | 417,662 | | | $ | 481,712 | |
Cost of sales and other direct production costs | | | 68,358 | | | | 90,529 | | | | 224,537 | | | | 249,162 | |
Depreciation, depletion and amortization | | | 28,844 | | | | 30,179 | | | | 83,365 | | | | 84,592 | |
Total cost of sales | | | 97,202 | | | | 120,708 | | | | 307,902 | | | | 333,754 | |
Gross profit | | | 43,637 | | | | 58,685 | | | | 109,760 | | | | 147,958 | |
Other operating expenses: | | | | | | | | | | | | | | | | |
General and administrative | | | 9,529 | | | | 11,155 | | | | 29,044 | | | | 31,728 | |
Exploration | | | 7,255 | | | | 3,859 | | | | 17,622 | | | | 10,171 | |
Pre-development | | | 1,757 | | | | 550 | | | | 4,061 | | | | 1,475 | |
Research and development | | | 1,130 | | | | — | | | | 2,125 | | | | — | |
Other operating expense | | | 134 | | | | 962 | | | | 1,615 | | | | 2,535 | |
Gain on disposition of properties, plants, equipment and mineral interests | | | (4,830 | ) | | | (8 | ) | | | (4,924 | ) | | | (319 | ) |
Provision for closed operations and reclamation | | | 2,940 | | | | 2,162 | | | | 5,044 | | | | 4,779 | |
Lucky Friday suspension-related costs | | | 4,780 | | | | — | | | | 14,385 | | | | — | |
Acquisition costs | | | — | | | | 1,765 | | | | — | | | | 2,167 | |
Total other operating expense | | | 22,695 | | | | 20,445 | | | | 68,972 | | | | 52,536 | |
Income from operations | | | 20,942 | | | | 38,240 | | | | 40,788 | | | | 95,422 | |
Other income (expense): | | | | | | | | | | | | | | | | |
(Loss) gain on derivative contracts | | | (11,226 | ) | | | 7 | | | | (16,548 | ) | | | — | |
Loss on disposition of investments | | | — | | | | — | | | | (167 | ) | | | — | |
Unrealized (loss) gain on investments | | | (124 | ) | | | 49 | | | | (73 | ) | | | 488 | |
Foreign exchange (loss) gain | | | (4,764 | ) | | | 2,375 | | | | (10,909 | ) | | | (7,713 | ) |
Interest and other income | | | 541 | | | | 145 | | | | 1,185 | | | | 346 | |
Interest expense, net of amount capitalized | | | (9,358 | ) | | | (5,574 | ) | | | (28,423 | ) | | | (16,655 | ) |
Total other expense | | | (24,931 | ) | | | (2,998 | ) | | | (54,935 | ) | | | (23,534 | ) |
(Loss) income before income taxes | | | (3,989 | ) | | | 35,242 | | | | (14,147 | ) | | | 71,888 | |
Income tax benefit (provision) | | | 5,401 | | | | (9,453 | ) | | | 18,377 | | | | (22,603 | ) |
Net income | | | 1,412 | | | | 25,789 | | | | 4,230 | | | | 49,285 | |
Preferred stock dividends | | | (138 | ) | | | (138 | ) | | | (414 | ) | | | (414 | ) |
Income applicable to common shareholders | | $ | 1,274 | | | $ | 25,651 | | | $ | 3,816 | | | $ | 48,871 | |
Comprehensive income: | | | | | | | | | | | | | | | | |
Net income | | $ | 1,412 | | | $ | 25,789 | | | $ | 4,230 | | | $ | 49,285 | |
Reclassification of loss on disposition or impairment of marketable securities included in net income | | | — | | | | — | | | | 167 | | | | 1,000 | |
Unrealized loss and amortization of prior service on pension plans | | | (16 | ) | | | — | | | | — | | | | — | |
Change in fair value of derivative contracts designated as hedge transactions | | | 6,760 | | | | (1,602 | ) | | | 12,068 | | | | (1,556 | ) |
Unrealized holding gains on investments | | | 892 | | | | 987 | | | | 1,483 | | | | 2,245 | |
Comprehensive income | | $ | 9,048 | | | $ | 25,174 | | | $ | 17,948 | | | $ | 50,974 | |
Basic income per common share after preferred dividends | | $ | 0.00 | | | $ | 0.07 | | | $ | 0.01 | | | $ | 0.13 | |
Diluted income per common share after preferred dividends | | $ | 0.00 | | | $ | 0.07 | | | $ | 0.01 | | | $ | 0.13 | |
Weighted average number of common shares outstanding - basic | | | 398,848 | | | | 387,578 | | | | 396,809 | | | | 383,458 | |
Weighted average number of common shares outstanding - diluted | | | 401,258 | | | | 389,918 | | | | 400,176 | | | | 386,318 | |
Cash dividends declared per common share | | $ | 0.0025 | | | $ | 0.0025 | | | $ | 0.0075 | | | $ | 0.0075 | |
The accompanying notes are an integral part of the interim condensed consolidated financial statements.
Hecla Mining Company and Subsidiaries
Condensed Consolidated Statements of Cash FlowsBalance Sheets (Unaudited)
(In thousands)thousands, except shares)
| | | | | | | | |
| | March 31, 2024 | | | December 31, 2023 | |
ASSETS | | | | | | |
Current assets: | | | | | | |
Cash and cash equivalents | | $ | 80,169 | | | $ | 106,374 | |
Accounts receivable: | | | | | | |
Trade | | | 30,508 | | | | 14,740 | |
Other, net | | | 19,767 | | | | 18,376 | |
Inventories: | | | | | | |
Product inventories | | | 37,414 | | | | 28,823 | |
Materials and supplies | | | 64,718 | | | | 64,824 | |
Other current assets | | | 22,674 | | | | 27,125 | |
Total current assets | | | 255,250 | | | | 260,262 | |
Investments | | | 32,873 | | | | 33,724 | |
Restricted cash and cash equivalents | | | 1,163 | | | | 1,165 | |
Properties, plants, equipment and mineral interests, net | | | 2,663,155 | | | | 2,666,250 | |
Operating lease right-of-use assets | | | 9,187 | | | | 8,349 | |
Deferred tax assets | | | — | | | | 2,883 | |
Other non-current assets | | | 32,630 | | | | 38,471 | |
Total assets | | $ | 2,994,258 | | | $ | 3,011,104 | |
LIABILITIES | | | | | | |
Current liabilities: | | | | | | |
Accounts payable and accrued liabilities | | $ | 81,289 | | | $ | 81,599 | |
Accrued payroll and related benefits | | | 28,783 | | | | 28,240 | |
Accrued taxes | | | 5,585 | | | | 3,501 | |
Finance leases | | | 8,610 | | | | 9,752 | |
Accrued reclamation and closure costs | | | 9,660 | | | | 9,660 | |
Accrued interest | | | 5,190 | | | | 14,405 | |
Other current liabilities | | | 13,520 | | | | 10,303 | |
Total current liabilities | | | 152,637 | | | | 157,460 | |
Accrued reclamation and closure costs | | | 111,668 | | | | 110,797 | |
Long-term debt including finance leases | | | 662,482 | | | | 653,063 | |
Deferred tax liability | | | 98,011 | | | | 104,835 | |
Other non-current liabilities | | | 10,830 | | | | 16,845 | |
Total liabilities | | | 1,035,628 | | | | 1,043,000 | |
Commitments and contingencies (Notes 4, 7, 8, and 10) | | | | | | |
STOCKHOLDERS’ EQUITY | | | | | | |
| | | | | | |
Preferred stock, 5,000,000 shares authorized: | | | | | | |
Series B preferred stock, $0.25 par value, 157,776 shares issued and outstanding, liquidation preference — $7,889 | | | 39 | | | | 39 | |
Common stock, $0.25 par value, authorized 750,000,000 shares; issued March 31, 2024 — 626,131,125 shares and December 31, 2023 — 624,647,379 shares | | | 156,447 | | | | 156,076 | |
Capital surplus | | | 2,350,249 | | | | 2,343,747 | |
Accumulated deficit | | | (513,608 | ) | | | (503,861 | ) |
Accumulated other comprehensive income, net | | | 434 | | | | 5,837 | |
Less treasury stock, at cost; March 31, 2024 — 8,813,127 and December 31, 2023 — 8,535,161 shares issued and held in treasury | | | (34,931 | ) | | | (33,734 | ) |
Total stockholders’ equity | | | 1,958,630 | | | | 1,968,104 | |
Total liabilities and stockholders’ equity | | $ | 2,994,258 | | | $ | 3,011,104 | |
| | | Nine Months Ended | |
| | | September 30, 2017 | | | September 30, 2016 | |
Operating activities: | | | | | | | | |
Net income | | $ | 4,230 | | | $ | 49,285 | |
Non-cash elements included in net income: | | | | | | | | |
Depreciation, depletion and amortization | | | 87,634 | | | | 83,900 | |
Loss on disposition of investments | | | 167 | | | | — | |
Unrealized loss (gain) on investments | | | 73 | | | | (488 | ) |
Gain on disposition of properties, plants, equipment, and mineral interests | | | (4,924 | ) | | | (319 | ) |
Provision for reclamation and closure costs | | | 3,379 | | | | 3,685 | |
Stock compensation | | | 4,943 | | | | 4,814 | |
Acquisition costs | | | — | | | | 1,048 | |
Deferred income taxes | | | (24,280 | ) | | | 10,330 | |
Amortization of loan origination fees | | | 1,415 | | | | 1,397 | |
Loss on derivative contracts | | | 16,718 | | | | 337 | |
Foreign exchange loss | | | 11,171 | | | | 7,555 | |
Other non-cash items, net | | | (1 | ) | | | 5 | |
Change in assets and liabilities, net of business acquisitions: | | | | | | | | |
Accounts receivable | | | 4,903 | | | | 5,776 | |
Inventories | | | (9,611 | ) | | | (44 | ) |
Other current and non-current assets | | | (2,685 | ) | | | (539 | ) |
Accounts payable and accrued liabilities | | | (7,759 | ) | | | 2,042 | |
Accrued payroll and related benefits | | | (913 | ) | | | 8,621 | |
Accrued taxes | | | (4,469 | ) | | | (2,894 | ) |
Accrued reclamation and closure costs and other non-current liabilities | | | (5,876 | ) | | | (1,397 | ) |
Cash provided by operating activities | | | 74,115 | | | | 173,114 | |
Investing activities: | | | | | | | | |
Additions to properties, plants, equipment and mineral interests | | | (70,390 | ) | | | (120,236 | ) |
Acquisitions of other companies, net of cash acquired | | | — | | | | (3,931 | ) |
Proceeds from disposition of properties, plants, equipment and mineral interests | | | 151 | | | | 348 | |
Insurance proceeds received for damaged property | | | 5,628 | | | | — | |
Purchases of investments | | | (36,916 | ) | | | (32,847 | ) |
Maturities of investments | | | 31,169 | | | | 7,240 | |
Changes in restricted cash and investment balances | | | 1,124 | | | | (3,900 | ) |
Net cash used in investing activities | | | (69,234 | ) | | | (153,326 | ) |
Financing activities: | | | | | | | | |
Proceeds from sale of common stock, net of offering costs | | | 9,610 | | | | 8,121 | |
Acquisition of treasury shares | | | (2,993 | ) | | | (4,363 | ) |
Dividends paid to common shareholders | | | (2,978 | ) | | | (2,882 | ) |
Dividends paid to preferred shareholders | | | (414 | ) | | | (414 | ) |
Credit availability and debt issuance fees | | | (476 | ) | | | (107 | ) |
Repayments of debt | | | (470 | ) | | | (1,807 | ) |
Repayments of capital leases | | | (5,065 | ) | | | (6,328 | ) |
Net cash used in financing activities | | | (2,786 | ) | | | (7,780 | ) |
Effect of exchange rates on cash | | | 1,051 | | | | 627 | |
Net increase in cash and cash equivalents | | | 3,146 | | | | 12,635 | |
Cash and cash equivalents at beginning of period | | | 169,777 | | | | 155,209 | |
Cash and cash equivalents at end of period | | $ | 172,923 | | | $ | 167,844 | |
Significant non-cash investing and financing activities: | | | | | | | | |
Addition of capital lease obligations | | $ | 6,439 | | | $ | 2,297 | |
Common stock issued for the acquisition of other companies | | $ | — | | | $ | 48,109 | |
Payment of accrued compensation in restricted stock units | | $ | 4,240 | | | $ | 5,511 | |
The accompanying notes are an integral part of the interim condensed consolidated financial statements.
Hecla Mining Company and Subsidiaries
Condensed Consolidated Statements of ContentsChanges in Stockholders’ Equity (Unaudited)
(Dollars are in thousands, except for share and per share amounts)
| | | | | | | | | | | | | | | | | | | | | | | | | | | | |
| | Three Months Ended March 31, 2024 | |
| | Series B
Preferred
Stock | | | Common
Stock | | | Capital Surplus | | | Accumulated
Deficit | | | Accumulated
Other
Comprehensive Income (Loss), net | | | Treasury
Stock | | | Total | |
Balances, January 1, 2024 | | $ | 39 | | | $ | 156,076 | | | $ | 2,343,747 | | | $ | (503,861 | ) | | $ | 5,837 | | | $ | (33,734 | ) | | $ | 1,968,104 | |
Net loss | | | — | | | | — | | | | — | | | | (5,753 | ) | | | — | | | | — | | | | (5,753 | ) |
Stock-based compensation expense | | | — | | | | — | | | | 1,164 | | | | — | | | | — | | | | — | | | | 1,164 | |
Common stock ($0.00625 per share) and Series B Preferred Stock ($0.875 per share) dividends declared | | | — | | | | — | | | | — | | | | (3,994 | ) | | | — | | | | — | | | | (3,994 | ) |
Common stock issued for 401(k) match (275,570 shares) | | | — | | | | 69 | | | | 1,182 | | | | — | | | | — | | | | — | | | | 1,251 | |
Common stock issued under ATM Program (248,561 shares) | | | — | | | | 62 | | | | 1,041 | | | | — | | | | — | | | | — | | | | 1,103 | |
Common stock issued as incentive compensation (959,615 shares) | | | — | | | | 240 | | | | 3,115 | | | | — | | | | — | | | | (1,197 | ) | | | 2,158 | |
Other comprehensive (loss) | | | — | | | | — | | | | — | | | | — | | | | (5,403 | ) | | | — | | | | (5,403 | ) |
Balances, March 31, 2024 | | $ | 39 | | | $ | 156,447 | | | $ | 2,350,249 | | | $ | (513,608 | ) | | $ | 434 | | | $ | (34,931 | ) | | $ | 1,958,630 | |
| | | | | | | | | | | | | | | | | | | | | | | | | | | | |
| | Three Months Ended March 31, 2023 | |
| | Series B
Preferred
Stock | | | Common
Stock | | | Capital Surplus | | | Accumulated
Deficit | | | Accumulated
Other
Comprehensive Income (Loss), net | | | Treasury
Stock | | | Total | |
Balances, January 1, 2023 | | $ | 39 | | | $ | 151,819 | | | $ | 2,260,290 | | | $ | (403,931 | ) | | $ | 2,448 | | | $ | (31,698 | ) | | $ | 1,978,967 | |
Net loss | | | — | | | | — | | | | — | | | | (3,173 | ) | | | — | | | | — | | | | (3,173 | ) |
Stock-based compensation expense | | | — | | | | — | | | | 1,190 | | | | — | | | | — | | | | — | | | | 1,190 | |
Common stock ($0.00625 per share) and Series B Preferred Stock ($0.875 per share) dividends declared | | | — | | | | — | | | | — | | | | (3,891 | ) | | | — | | | | — | | | | (3,891 | ) |
Common stock issue for 401(k) match (199,623 shares) | | | — | | | | 50 | | | | 1,095 | | | | — | | | | — | | | | — | | | | 1,145 | |
Common stock issued as incentive compensation (498,348 shares) | | | — | | | | 125 | | | | (125 | ) | | | — | | | | — | | | | (482 | ) | | | (482 | ) |
Common stock issued under ATM Program (2,173,274 shares) | | | — | | | | 542 | | | | 11,343 | | | | — | | | | — | | | | — | | | | 11,885 | |
Other comprehensive income | | | — | | | | — | | | | — | | | | — | | | | 6,516 | | | | — | | | | 6,516 | |
Balances, March 31, 2023 | | $ | 39 | | | $ | 152,536 | | | $ | 2,273,793 | | | $ | (410,995 | ) | | $ | 8,964 | | | $ | (32,180 | ) | | $ | 1,992,157 | |
The accompanying notes are an integral part of the interim condensed consolidated financial statements.
Note 1. Basis of Preparation of Financial Statements
In the opinion of management, theThe accompanying unaudited interim condensed consolidated financial statements and notes to the unaudited interim condensed consolidated financial statements contain all adjustments, consisting of normal recurring items and items which are nonrecurring, necessary to present fairly, in all material respects, the financial position of Hecla Mining Company and its consolidated subsidiaries (except as(collectively, “Hecla,” “the Company,” “we,” “our,” or “us,” except where the context otherwise requires “we” or “our” or “us”otherwise) have been prepared in accordance with the instructions to Form 10-Q and do not include all information and disclosures required annually by accounting principles generally accepted in the United States of America (“GAAP”). These unaudited interim condensed consolidated financial statementsTherefore, this information should be read in conjunction with our auditedthe Company’s consolidated financial statements and related footnotes as set forthnotes contained in our annual report filed on Form 10-K for the year ended December 31, 2016, as it may be amended2023 (“2023 Form 10-K”). The consolidated December 31, 2023 balance sheet data was derived from time to time.
our audited consolidated financial statements. The resultsinformation furnished herein reflects all adjustments that are, in the opinion of operationsmanagement, necessary for a fair statement of the results for the interim periods presented mayreported. All such adjustments are, in the opinion of management, of a normal recurring nature. Operating results for the three months ended March 31, 2024 are not benecessarily indicative of those whichthe results that may be expected for a full year. The unaudited interim condensed consolidatedthe year ending December 31, 2024.
Note 2. Business Segments and Sales of Products
We discover, acquire and develop mines and other mineral interests and produce and market (i) concentrates containing silver, gold, lead and zinc, (ii) carbon material containing silver and gold, and (iii) doré containing silver and gold. We are currently organized and managed in four segments: Greens Creek, Lucky Friday, Keno Hill and Casa Berardi.
Effective January 2024 we revised our internal reporting provided to our Chief Operating Decision Maker to no longer include any financial statements have been prepared pursuant toperformance information for our Nevada Operations, reflecting the rules and regulationscurrent status of the SecuritiesNevada Operations being on care and Exchange Commission ("SEC"). Certain informationmaintenance. General corporate activities not associated with operating mines and footnote disclosures normally included in audited financial statements prepared in accordance with generally accepted accounting principlestheir various exploration activities, as well as idle properties and environmental remediation services in the United States (“GAAP”) have been condensed or omitted pursuant to those rulesYukon, Canada, and regulations, although we believe that the disclosurespreviously separately reported Nevada Operations are adequate for the information not to be misleading.
Certain condensed consolidated financial statement amounts forpresented as “Other.” The presentation of the prior period haveinformation disclosed below has been reclassifiedrevised to conformreflect this change.
The following tables present information about our reportable segments sales for the three months ended March 31, 2024 and 2023 (in thousands):
| | | | | | | | |
| | Three Months Ended
March 31, | |
| | 2024 | | | 2023 | |
Total sales to external customers: | | | | | | |
Greens Creek | | $ | 97,310 | | | $ | 98,611 | |
Lucky Friday | | | 35,340 | | | | 49,110 | |
Keno Hill | | | 10,847 | | | | — | |
Casa Berardi | | | 41,584 | | | | 50,998 | |
Other | | | 4,447 | | | | 781 | |
| | $ | 189,528 | | | $ | 199,500 | |
| |
Income (loss) from operations: | | | | | | |
Greens Creek | | $ | 26,216 | | | $ | 31,241 | |
Lucky Friday | | | 22,953 | | | | 14,568 | |
Keno Hill | | | (9,085 | ) | | | (6,763 | ) |
Casa Berardi | | | (17,995 | ) | | | (13,693 | ) |
Other | | | (17,025 | ) | | | (19,800 | ) |
| | $ | 5,064 | | | $ | 5,553 | |
Reconciliation of income from operations to (loss) income before income and mining taxes: | | | | | | |
Income from operations: | | $ | 5,064 | | | $ | 5,553 | |
Adjustments all attributable to the Other segment | | | | | | |
Interest expense | | | (12,644 | ) | | | (10,165 | ) |
Fair value adjustments, net | | | (1,852 | ) | | | 3,181 | |
Net foreign exchange gain | | | 3,982 | | | | 108 | |
Other income | | | 1,512 | | | | 1,392 | |
(Loss) income before income and mining taxes | | $ | (3,938 | ) | | $ | 69 | |
Other sales for the three months ended March 31, 2024 and 2023 is comprised of revenue from our environmental remediation services subsidiary in the Yukon for both periods presented and Nevada Operations metal sales in the prior period.
Lucky Friday's income from operations for the three months ended March 31, 2024, includes $17.4 million of business interruption insurance proceeds received during the quarter related to the current period presentation. These reclassifications had no effectfire which suspended Lucky Friday's operations from August 2023 through January 8, 2024.
Total sales to external customers for the three months ended March 31, 2024 and 2023 were as follows (in thousands):
| | | | | | | | |
| | Three Months Ended March 31, | |
| | 2024 | | | 2023 | |
Silver | | $ | 86,233 | | | $ | 81,532 | |
Gold | | | 67,415 | | | | 75,087 | |
Lead | | | 19,483 | | | | 25,402 | |
Zinc | | | 24,964 | | | | 32,943 | |
Less: Smelter and refining charges | | | (13,014 | ) | | | (15,973 | ) |
Total metal sales | | | 185,081 | | | | 198,991 | |
Environmental remediation services | | | 4,447 | | | | 509 | |
Total sales | | $ | 189,528 | | | $ | 199,500 | |
Sales of metals for the three months ended March 31, 2024 and 2023 include net gains of $3.1 million and $0.9 million, respectively, on the net income, comprehensive income, or accumulated deficit as previously reported.financially-settled forward contracts for silver, gold, lead and zinc. See Note 8 for more information.
The preparation of financial statements in conformity with GAAP requires management to make estimates and assumptions that affect the reported amounts offollowing table presents total assets and liabilitiesby reportable segment as of the date of the financial statements, the reported amounts of revenues and expenses during the reporting period, and the disclosures of contingent liabilities. Accordingly, ultimate results could differ materially from those estimates.
On September 13, 2016, we completed the acquisition of Mines Management, Inc. ("Mines Management"), giving us ownership of the Montanore project in Northwest Montana. The unaudited interim condensed consolidated financial statements included herein reflect our ownership of the assets previously held by Mines Management as of the September 13, 2016 acquisition date.
Note 2. Investments
Investments
Our current investments, which are classified as "available for sale" and consist of bonds having maturities of greater than 90 days and less than 365 days, had a fair value and cost basis of $33.0 million and $29.1 million at September 30, 2017March 31, 2024 and December 31, 2016, respectively. During the first nine months of 2017, we had purchases of such investments of $35.3 million and maturities of $31.2 million. Our current investments at September 30, 2017 and December 31, 2016 consisted of the following2023 (in thousands):
| | | September 30, 2017 | | | December 31, 2016 | |
| | | Amortized cost | | | Unrealized loss | | | Fair value | | | Amortized cost | | | Unrealized loss | | | Fair value | |
Corporate bonds | | $ | 32,987 | | | $ | (14 | ) | | $ | 32,973 | | | $ | 22,100 | | | $ | (46 | ) | | $ | 22,054 | |
Municipal bonds | | | — | | | | — | | | | — | | | | 3,727 | | | | (1 | ) | | | 3,726 | |
Agency bonds | | | — | | | | — | | | | | | | | 3,339 | | | | (2 | ) | | | 3,337 | |
Total | | $ | 32,987 | | | $ | (14 | ) | | $ | 32,973 | | | $ | 29,166 | | | $ | (49 | ) | | $ | 29,117 | |
6
Table of Contents | | | | | | | | |
| | March 31, 2024 | | | December 31, 2023 | |
Total assets: | | | | | | |
Greens Creek | | $ | 571,684 | | | $ | 569,369 | |
Lucky Friday | | | 571,700 | | | | 578,110 | |
Keno Hill | | | 374,630 | | | | 362,986 | |
Casa Berardi | | | 669,626 | | | | 683,035 | |
Other | | | 806,618 | | | | 817,604 | |
| | $ | 2,994,258 | | | $ | 3,011,104 | |
At September 30, 2017 and December 31, 2016, the fair value of our non-current investments was $7.1 million and $5.0 million, respectively. Our non-current investments consist of marketable equity securities which are carried at fair value, and are primarily classified as “available-for-sale.” The cost basis of our non-current investments was approximately $5.7 million and $4.0 million at September 30, 2017 and December 31, 2016, respectively. In the first nine months of 2017 and 2016, we acquired marketable equity securities having a cost basis of $1.6 million and $0.9 million, respectively. During the first quarter of 2016, we recognized an impairment charge against current earnings of $1.0 million, as we determined the impairment to be other-than-temporary.
Note 3. Income and Mining Taxes
Major components of our income and mining tax (benefit) provision(provision) benefit for the three and nine months ended September 30, 2017March 31, 2024 and 20162023 are as follows (in thousands):
| | | | | | | | |
| | Three Months Ended | |
| | March 31, | |
| | 2024 | | | 2023 | |
Current: | | | | | | |
Domestic | | $ | (992 | ) | | $ | (1,528 | ) |
Foreign | | | (979 | ) | | | (1,174 | ) |
Total current income and mining tax (provision) | | | (1,971 | ) | | | (2,702 | ) |
Deferred: | | | | | | |
Domestic | | | (5,183 | ) | | | (5,341 | ) |
Foreign | | | 5,339 | | | | 4,801 | |
Total deferred income and mining tax benefit (provision) | | | 156 | | | | (540 | ) |
Total income and mining tax (provision) | | $ | (1,815 | ) | | $ | (3,242 | ) |
| | | Three Months Ended | | | Nine Months Ended | |
| | | September 30, | | | September 30, | |
| | | 2017 | | | 2016 | | | 2017 | | | 2016 | |
Current: | | | | | | | | | | | | | | | | |
Domestic | | $ | — | | | $ | 4,123 | | | $ | (12,797 | ) | | $ | 4,122 | |
Foreign | | | (3,959 | ) | | | 5,773 | | | | 17,491 | | | | 8,416 | |
Total current income tax (benefit) provision | | | (3,959 | ) | | | 9,896 | | | | 4,694 | | | | 12,538 | |
| | | | | | | | | | | | | | | | | |
Deferred: | | | | | | | | | | | | | | | | |
Domestic | | | 1,980 | | | | (5,723 | ) | | | (13,958 | ) | | | 3,642 | |
Foreign | | | (3,422 | ) | | | 5,280 | | | | (9,113 | ) | | | 6,423 | |
Total deferred income tax (benefit) provision | | | (1,442 | ) | | | (443 | ) | | | (23,071 | ) | | | 10,065 | |
Total income tax (benefit) provision | | $ | (5,401 | ) | | $ | 9,453 | | | $ | (18,377 | ) | | $ | 22,603 | |
As of September 30, 2017, we have a net deferredThe income and mining tax asset in the U.S. of $44.7 million and a net deferred tax liability in Canada of $122.7 million, for a consolidated worldwide net deferred tax liability of $78.0 million. Our ability to utilize our deferred tax assets depends on future taxable income generated from operations. In the first quarter of 2017, we received consent from the Internal Revenue Service to permit us to take a different income tax position relating to the timing of deductions for the #4 Shaft development costs at Lucky Friday. This tax accounting method change substantially revised the timing of deductions for these costs for regular tax and Alternative Minimum Tax ("AMT") relative to our projected life of mine and projected taxable income. These timing changes caused us to revise our assessment of the ability to generate sufficient future taxable income to realize our deferred tax assets, resulting in a valuation allowance release of approximately $15 million. At September 30, 2017 and December 31, 2016, the balances of the valuation allowances on our deferred tax assets were $72 million and $100 million, respectively, primarily for net operating losses and tax credit carryforwards. The amount of the deferred tax asset considered recoverable, however, could be reduced in the near term if estimates of future taxable income are reduced.
The current income tax provisionsprovision for the three and nine months ended September 30, 2017March 31, 2024 and 2016 vary2023 varies from the amounts that would have resulted from applying the statutory income tax raterates to pre-tax incomeloss due primarily to the impact of the change in accounting method treatment of the #4 Shaft development costs described above, the impact of taxation in foreign jurisdictions, non-recognition of net operating losses and foreign exchange gains and losses in certain jurisdictions.
For the Company's status as an indefinite AMT taxpayer.
We have historically calculated the provision for income taxes during interim reporting periods by applying an estimate ofthree months ended March 31, 2024, we used the annual effective tax rate ("AETR") for the full fiscal year to “ordinary” pretax income or loss (excluding unusual or infrequently occurring discrete items) for the reporting period. We have determined that since small changes in estimated annual “ordinary” pre-tax income would result in significant changes in the estimated AETR, the AETR method would not provide a reliable estimate for the fiscal three- and nine-month periods ended September 30, 2017. Therefore, we have used a discrete effective tax rate method to calculate taxesthe tax provision. Valuation allowances on Nevada, Mexico and certain Canadian net operating losses were treated as discrete adjustments to the tax provision.
Note 4.Employee Benefit Plans
We sponsor three defined benefit pension plans, two of which cover substantially all U.S. employees. Net periodic pension (benefit) cost for the fiscal three-plans consisted of the following for the three months ended March 31, 2024 and nine-month periods2023 (in thousands):
| | | | | | | | |
| | Three Months Ended
March 31, | |
| | 2024 | | | 2023 | |
Service cost | | $ | 915 | | | $ | 949 | |
Interest cost | | | 2,076 | | | | 1,993 | |
Expected return on plan assets | | | (3,136 | ) | | | (3,107 | ) |
Amortization of prior service cost | | | 66 | | | | 125 | |
Amortization of net loss | | | 15 | | | | (47 | ) |
Net periodic pension (benefit) cost | | $ | (64 | ) | | $ | (87 | ) |
For the three months ended September 30, 2017.
Note 4. Commitments, Contingencies and Obligations
General
We follow GAAP guidancenet periodic pension cost is included in determiningthe same line items of our accruals and disclosures with respectcondensed consolidated financial statements as other employee compensation costs. The net benefit related to loss contingencies, and evaluate such accruals and contingenciesall other components of net periodic pension cost of $1.0 million for each reporting period. Accordingly, estimated losses from loss contingencies are accrued by a charge to income when information available prior to issuance of the financialthree months ended March 31, 2024, and 2023, is included in other income on our condensed consolidated statements indicates that it is probable that a liability could be incurredof operations and the amount of thecomprehensive loss.
Note 5. Loss Per Common Share
We calculate basic loss can be reasonably estimated. Legal expenses associated with the contingency are expensed as incurred. If a loss contingency is not probable or reasonably estimable, disclosure of the loss contingency is made in the financial statements when it is at least reasonably possible that a material loss could be incurred.
Rio Grande Silver Guaranty
Our wholly-owned subsidiary, Rio Grande Silver Inc. (“Rio”), is party to a joint venture with Emerald Mining & Leasing, LLC (“EML”) and certain other parties with respect to a land package in the Creede Mining District of Colorado that is adjacent to other land held by Rio. Rio holds a 70% interest in the joint venture. In connection with the joint venture, we are required to guarantee certain environmental remediation-related obligations of EML to a third party up to a maximum liability to us of $2.5 million. As of September 30, 2017, we have not been required to make any payments pursuant to the guaranty. We may be required to make payments in the future, limited to the $2.5 million maximum liability, should EML fail to meet its obligations to the third party. However, to the extent that any payments are made by us under the guaranty, EML, in addition to other parties, has jointly and severally agreed to reimburse and indemnify us for any such payments. We have not recorded a liability relating to the guaranty as of September 30, 2017.
Lucky Friday Water Permit Matters
In the past, the Lucky Friday unit experienced multiple regulatory issues relating to its water discharge permits and water management more generally. All of these issues have been resolved except for one: in December 2013, the EPA issued to Hecla Limited a request for information under Section 308 of the Clean Water Act directing Hecla Limited to undertake a comprehensive groundwater investigation of Lucky Friday’s tailings pond no. 3 to evaluate whether the pond is causing the discharge of pollutants via seepage to groundwater that is discharging to surface water. We completed the investigation mandated by the EPA and submitted a draft report to the agency in December 2015. We are waiting for the EPA’s response and we cannot predict what the impact of the investigation will be.
Hecla Limited strives to maintain its water discharges at the Lucky Friday unit in full compliance with its permits and applicable laws, however, we cannot provide assurance that in the future it will be able to fully comply with the permit limits and other regulatory requirements regarding water management.
Johnny M Mine Area near San Mateo, McKinley County, New Mexico
In May 2011, the EPA made a formal request to Hecla Mining Company for information regarding the Johnny M Mine Area near San Mateo, McKinley County, New Mexico, and asserted that Hecla Mining Company may be responsible under the Comprehensive Environmental Response, Compensation and Liability Act ("CERCLA") for environmental remediation and past costs the EPA has incurred at the site. Mining at the Johnny M was conducted for a limited period of time by a predecessor of our subsidiary, Hecla Limited. In August 2012, Hecla Limited and the EPA entered into a Settlement Agreement and Administrative Order on Consent for Removal Action (“Consent Order”), pursuant to which Hecla Limited agreed to pay (i) $1.1 million to the EPA for its past response costs at the site and (ii) any future response costs at the site under the Consent Order, in exchange for a covenant not to sue by the EPA. Hecla Limited paid the $1.1 million to the EPA for its past response costs and in December 2014, submitted to EPA the Engineering Evaluation and Cost Analysis (“EE/CA”) for the site. The EE/CA evaluates three alternative response actions: 1) no action, 2) off-site disposal, and 3) on-site disposal. The range in estimated costs of these alternatives is $0 to $221 million. In the EE/CA, Hecla Limited recommended that EPA approve on-site disposal, which is currently estimated to cost $5.6 million,per common share on the basis that it is the most appropriate response action under CERCLA. In June 2015, the EPA approved the EE/CA, with a few minor conditions. The EPA still needs to publish the EE/CA for public notice and comment, and the agency will not make a final decision on the appropriate response action until the public comment process is complete. It is anticipated that Hecla Limited will implement the response action selected by the EPA pursuant to an amendment to the Consent Order or a new order. Based on the foregoing, we believe it is probable that Hecla Limited will incur a liability for remediation at the site. In the fourth quarter of 2014, we accrued $5.6 million, which continues to be our best estimate of that liability as of the dateweighted average number of this report. There can be no assurance that Hecla Limited’s liability will not be more than $5.6 million, or that its ultimate liability will not have a material adverse effect on Hecla Limited’s or our results of operations or financial position.
In September 2016, Hecla Limited was served with a lawsuit filed by an individual in state court in New Mexico alleging personal injury claims of several millions of dollars arising from alleged exposure to contaminants as a result of allegedly living on land adjacent to the Johnny M Mine site. The case was subsequently removed to federal court in New Mexico, and Hecla Limited filed a motion to dismiss. We do not yet have enough information to conclude if Hecla Limited has any liability or to estimate any loss that it may incur.
Carpenter Snow Creek and Barker-Hughesville Sites in Montana
In July 2010, the EPA made a formal request to Hecla Mining Company for information regarding the Carpenter Snow Creek Superfund site located in Cascade County, Montana. The Carpenter Snow Creek site is located in a historic mining district, and in the early 1980s Hecla Limited leased 6 mining claims and performed limited exploration activities at the site. Hecla Limited terminated the mining lease in 1988.
In June 2011, the EPA informed Hecla Limited that it believes Hecla Limited, among several other viable companies, may be liable for cleanup of the site or for costs incurred by the EPA in cleaning up the site. The EPA stated in the June 2011 letter that it has incurred approximately $4.5 million in response costs and estimated that total remediation costs may exceed $100 million. Hecla Limited cannot with reasonable certainty estimate the amount or range of liability, if any, relating to this matter because of, among other reasons, the lack of information concerning the site.
In February 2017, the EPA made a formal request to Hecla Mining Company for information regarding the Barker-Hughesville Mining District Superfund site located in Judith Basin and Cascade Counties, Montana. The Barker-Hughesville site is located in a historic mining district, and between approximately June and December 1983, Hecla Limited was party to an agreement with another mining company under which limited exploration activities occurred at or near the site. Neither the EPA nor any other party has made any claims against Hecla Limited (or Hecla Mining Company), however, it is possible that such a claim will be made in the future. Unless and until such a claim is made, Hecla Limited cannot estimate the amount or range of liability, if any, relating to this matter.
Senior Notes
On April 12, 2013, we completed an offering of $500 million aggregate principal amount of 6.875% Senior Notes due 2021. The net proceeds from the offering of the Senior Notes were used to partially fund the acquisition of Aurizon Mines Ltd. ("Aurizon") and for general corporate purposes, including expenses related to the Aurizon acquisition. Through the acquisition of Aurizon, we acquired our Casa Berardi mine and other interests in Quebec, Canada. In 2014, we completed additional issuances of our Senior Notes in the aggregate principal amount of $6.5 million, which were contributed to one of our pension plans to satisfy the funding requirement for 2014. Interest on the Senior Notes is payable on May 1 and November 1 of each year, commencing November 1, 2013. See Note 9 for more information.
Other Commitments
Our contractual obligations as of September 30, 2017 included approximately $0.5 million for various costs. In addition, our open purchase orders at September 30, 2017 included approximately $0.3 million, $1.9 million and $20.9 million for various capital and non-capital items at the Lucky Friday, Casa Berardi and Greens Creek units, respectively. We also have total commitments of approximately $14.1 million relating to scheduled payments on capital leases, including interest, primarily for equipment at our Greens Creek, Lucky Friday and Casa Berardi units (see Note 9 for more information). As part of our ongoing business and operations, we are required to provide surety bonds, bank letters of credit, and restricted deposits for various purposes, including financial support for environmental reclamation obligations and workers compensation programs. As of September 30, 2017, we had surety bonds totaling $117.4 million in place as financial support for future reclamation and closure costs, self-insurance, and employee benefit plans. The obligations associated with these instruments are generally related to performance requirements that we address through ongoing operations. As the requirements are met, the beneficiary of the associated instruments cancels or returns the instrument to the issuing entity. Certain of these instruments are associated with operating sites with long-lived assets and will remain outstanding until closure of the sites. We believe we are in compliance with all applicable bonding requirements and will be able to satisfy future bonding requirements as they arise.
Other Contingencies
We also have certain other contingencies resulting from litigation, claims, EPA investigations, and other commitments and are subject to a variety of environmental and safety laws and regulations incident to the ordinary course of business. We currently expect that the resolution of such contingencies will not materially affect our financial position, results of operations or cash flows. However, in the future, there may be changes to these contingencies, or additional contingencies may occur, any of which might result in an accrual or a change in current accruals recorded by us, and there can be no assurance that their ultimate disposition will not have a material adverse effect on our financial position, results of operations or cash flows.
Note 5. Earnings Per Common Share
We are authorized to issue 750,000,000 shares of common stock $0.25 par valueoutstanding during the period. Diluted income per share. At September 30, 2017, thereshare is calculated using the weighted average number of shares of common stock outstanding during the period plus the effect of potential dilutive common shares during the period using the treasury stock and if-converted methods.
Potential dilutive shares of common stock include outstanding unvested restricted stock awards, deferred restricted stock units, warrants and convertible preferred stock for periods in which we have reported net income. For periods in which we report net losses, potential dilutive shares of common stock are excluded, as their conversion and exercise would be anti-dilutive.
The following table represents net loss per common share – basic and diluted (in thousands, except income (loss) per share):
| | | | | | | | |
| | Three Months Ended March 31, | |
| | 2024 | | | 2023 | |
Numerator | | | | | | |
Net loss | | $ | (5,753 | ) | | $ | (3,173 | ) |
Preferred stock dividends | | | (138 | ) | | | (138 | ) |
Net loss applicable to common stockholders | | $ | (5,891 | ) | | $ | (3,311 | ) |
| | | | | | |
Denominator | | | | | | |
Basic weighted average common shares | | | 616,199 | | | | 600,075 | |
Dilutive restricted stock units, warrants and deferred shares | | | — | | | | — | |
Diluted weighted average common shares | | | 616,199 | | | | 600,075 | |
| | | | | | |
Basic loss per common share | | $ | (0.01 | ) | | $ | (0.01 | ) |
Diluted loss per common share | | $ | (0.01 | ) | | $ | (0.01 | ) |
For the three months ended March 31, 2024 and 2023, all outstanding unvested restricted stock units, deferred restricted stock units, warrants and convertible preferred stock were 403,548,158excluded from the computation of diluted loss per share, as our reported net loss would cause their conversion and exercise to have an anti-dilutive effect on the calculation of diluted loss per share.
Note 6. Stockholders’ Equity
At-The-Market Equity Distribution Agreement
Pursuant to an equity distribution agreement dated February 18, 2021, we may offer and sell up to 60 million shares of our common stock issuedfrom time to time to or through sales agents. Sales of the shares, if any, will be made by means of ordinary brokers transactions or as otherwise agreed between the Company and 4,529,450the agents as principals. Whether or not we engage in sales from time to time may depend on a variety of factors, including our share price, our cash resources, customary black-out restrictions, and whether we have any material inside information. The agreement can be terminated by us at any time. Any sales of shares issued and held in treasury,under the equity distribution agreement are registered under the Securities Act of 1933, as amended, pursuant to a shelf registration statement on Form
S-3. Under the agreement we have sold 14,753,958 shares for atotal proceeds of $76.7 million, net of 399,018,708commissions and fees of $1.2million from September 2022 through March 31, 2024. During the three months ended March 31, 2024, we sold 248,561 shares outstanding. Basicunder the agreement for proceeds of $1.1 million, net of commissions and diluted income per common share, after preferred dividends, was $0.00fees of $0.04million.
Stock-based Compensation Plans
The Company has stock incentive plans for executives, directors and $0.01eligible employees, comprised of performance shares and restricted stock. Stock-based compensation expense for the three-restricted stock unit and nine-month periods ended September 30, 2017, respectively. Basic and diluted income per common share, after preferred dividends, was $0.07 and $0.13 for the three- and nine-month periods ended September 30, 2016, respectively.
Diluted income per shareperformance-based grants (collectively "incentive compensation") to employees totaled $1.2 million for the three and nine months ended September 30, 2017March 31, 2024 and 2016 excludes2023, respectively. At March 31, 2024, there was $5.2 million of unrecognized stock-based compensation cost which is expected to be recognized over a weighted-average remaining vesting period of 1.3 years.
In connection with the potential effectsvesting of outstandingincentive compensation, employees have in the past, at their election and when permitted by us, chosen to satisfy their minimum tax withholding obligations through net share settlement, pursuant to which the Company withholds the number of shares necessary to satisfy such withholding obligations and pays the obligations in cash. As a result, in the three months ended March 31, 2024, we withheld 277,966 shares valued at approximately $1.2million, or approximately $4.31 per share.
Common Stock Dividends
The following table summarizes the dividends our Board of Directors have declared and we have paid during 2024 pursuant to our dividend policy:
| | | | | | | | |
Quarter | | Prior Quarter Realized Silver Price | | Silver-linked component | | Minimum component | | Total dividend per share |
First 2024 | | 23.47 | | $0.0025 | | $0.00375 | | $0.00625 |
First 2023 | | 22.03 | | $0.0025 | | $0.00375 | | $0.00625 |
Accumulated Other Comprehensive Income (Loss), Net
The following table lists the beginning balance, quarterly activity and ending balances, net of income and mining tax, of each component of “Accumulated other comprehensive income (loss), net” (in thousands):
| | | | | | | | | | | | |
| | Changes in fair value of derivative contracts designated as hedge transactions | | | Adjustments
For Pension Plans | | | Total
Accumulated
Other
Comprehensive
Income (Loss), Net | |
Balance January 1, 2024 | | $ | 13,708 | | | $ | (7,871 | ) | | | 5,837 | |
Change in fair value of derivative contracts | | | (6,835 | ) | | | — | | | | (6,835 | ) |
Gains and deferred gains transferred from accumulated other comprehensive income | | | 1,432 | | | | — | | | | 1,432 | |
Balance March 31, 2024 | | $ | 8,305 | | | $ | (7,871 | ) | | $ | 434 | |
| | | | | | | | | |
Balance January 1, 2023 | | $ | 9,162 | | | $ | (6,714 | ) | | $ | 2,448 | |
Changes in fair value of derivative contracts | | $ | 8,665 | | | | — | | | $ | 8,665 | |
Gains and deferred gains transferred from accumulated other comprehensive income | | $ | (2,149 | ) | | | — | | | $ | (2,149 | ) |
Balance March 31, 2023 | | $ | 15,678 | | | $ | (6,714 | ) | | $ | 8,964 | |
| | | | | | | | | |
Note 7. Debt, Credit Agreement and Leases
Our debt as of March 31, 2024 and December 31, 2023 consisted of our convertible preferred stock,7.25% Senior Notes due February 15, 2028 (“Senior Notes”), our Series 2020-A Senior Notes due July 9, 2025 (the “IQ Notes”) and any drawn amounts on our $150 million Credit Agreement, which is described separately below. The following tables summarize our long-term debt balances, excluding interest and borrowings under the Credit Agreement, as their conversion would have no effectof March 31, 2024 and December 31, 2023 (in thousands):
| | | | | | | | | | | | |
| | March 31, 2024 | |
| | Senior Notes | | | IQ Notes | | | Total | |
Principal | | $ | 475,000 | | | $ | 35,600 | | | $ | 510,600 | |
Unamortized discount/premium and issuance costs | | | (3,501 | ) | | | 211 | | | | (3,290 | ) |
Long-term debt balance | | $ | 471,499 | | | $ | 35,811 | | | $ | 507,310 | |
| | | | | | | | | | | | |
| | December 31, 2023 | |
| | Senior Notes | | | IQ Notes | | | Total | |
Principal | | $ | 475,000 | | | $ | 36,473 | | | $ | 511,473 | |
Unamortized discount/premium and issuance costs | | | (3,730 | ) | | | 257 | | | | (3,473 | ) |
Long-term debt balance | | $ | 471,270 | | | $ | 36,730 | | | $ | 508,000 | |
The following table summarizes the scheduled annual future payments, including interest, for our Senior Notes, IQ Notes, and finance and operating leases as of March 31, 2024 (in thousands). Operating leases are included in other current and non-current liabilities on our condensed consolidated balance sheets. The amounts for the IQ Notes are stated in U.S. dollars (“USD”) based on the calculation of dilutive shares.
For the three-month and nine-month periods ended September 30, 2017, 3,591,697 restricted stock units that were unvested or which vested in the current period and 1,509,159 deferred shares were included in the calculation of diluted income per share. For the three-month and nine-month periods ended September 30, 2016, 4,309,440 restricted stock units that were unvested or which vested in the current period and 635,602 deferred shares were included in the calculation of diluted income per share. There were no options or warrants outstandingUSD/Canadian dollar (“CAD”) exchange rate as of September 30, 2017March 31, 2024.
| | | | | | | | | | | | | | | | |
Twelve-month period ending March 31, | | Senior Notes | | | IQ Notes | | | Finance Leases | | | Operating Leases | |
2025 | | $ | 34,438 | | | $ | 2,322 | | | $ | 9,669 | | | $ | 2,431 | |
2026 | | | 34,438 | | | | 38,605 | | | | 7,322 | | | | 1,297 | |
2027 | | | 34,438 | | | | — | | | | 4,967 | | | | 1,829 | |
2028 | | | 505,131 | | | | — | | | | 2,237 | | | | 1,182 | |
2029 | | | | | | | | | 1,167 | | | | |
Thereafter | | | — | | | | — | | | | 1,027 | | | | 6,736 | |
| | | 608,445 | | | | 40,927 | | | | 26,389 | | | | 13,475 | |
Less: effect of discounting | | | — | | | | — | | | | (2,606 | ) | | | (3,250 | ) |
Total | | $ | 608,445 | | | $ | 40,927 | | | $ | 23,783 | | | $ | 10,225 | |
Credit Agreement
On July 21, 2022, we entered into a revolving credit facility (the "Credit Agreement") with various financial institutions (the “Lenders”), Bank of Montreal and Bank of America, N.A. as letters of credit issuers, and Bank of America, N.A., as administrative agent for the Lenders and as swingline lender, to replace our prior credit agreement. The Credit Agreement is a $150 million senior secured revolving facility, with an option to be increased in an aggregate amount not to exceed $75 million. Any revolving loans under the Credit Agreement have a maturity date of July 21, 2026. Proceeds of the revolving loans under the Credit Agreement may be used for general corporate purposes. The interest rate on the outstanding loans under the Credit Agreement is based on the Company’s net leverage ratio and is calculated at (i) Term Secured Overnight Financing Rate ("SOFR") plus 2% to 3.5% or September 30, 2016.(ii) Bank of America’s Base Rate plus 1% to 2.5% with Base Rate being the highest of (i) the Bank of America prime rate, (ii) the Federal Funds rate plus .50% or (iii) Term SOFR plus 1.00%. For each amount drawn, we elect whether we draw on a one, three or six month basis or annual basis for SOFR. If we elect to draw for greater than six months, we pay interest quarterly on the outstanding amount.
Note 6. Business Segments
We are currently organizedalso required to pay a commitment fee of between 0.45% to 0.78750%, depending on our net leverage ratio. Letters of credit issued under the Credit Agreement bear a fee between 2.00% and managed in four reporting segments:3.50% based on our net leverage ratio, as well as a fronting fee to each issuing bank at an agreed upon rate per annum on the average daily dollar amount of our letter of credit exposure.
Hecla Mining Company and certain of our subsidiaries are the borrowers under the Credit Agreement, while certain of our other subsidiaries are guarantors of the borrowers’ obligations under the Credit Agreement. As further security, the Credit Agreement is collateralized by a mortgage on the Greens Creek unit,mine, the Lucky Friday unit,equity interests of subsidiaries that own the Casa Berardi unitGreens Creek mine or are part of the Greens Creek Joint Venture and our subsidiary Hecla Admiralty Company (the “Greens Creek Group”), and by all of the San Sebastian unit.Greens Creek Group’s rights and interests in the Greens Creek Joint Venture Agreement, and in all assets of the joint venture and of any member of the Greens Creek Group.
$140.0 million outstanding at an interest rate of 8.0%, and $6.8 million of outstanding letters of credit. Letters of credit that are outstanding reduce availability under the Credit Agreement.
General corporate activities not associated
We believe we were in compliance with operating units and their various exploration activities, as well as discontinued operations and idle properties, are presented as “other.” Interest expense, interest income and income taxes are considered general corporate items, and are not allocated to our segments.
The following tables present information about reportable segments forall covenants under the three and nine months ended September 30, 2017 and 2016 (in thousands):
| | | Three Months Ended
September 30, | | | Nine Months Ended September 30, | |
| | | 2017 | | | 2016 | | | 2017 | | | 2016 | |
Net sales to unaffiliated customers: | | | | | | | | | | | | | | | | |
Greens Creek | | $ | 61,061 | | | $ | 85,804 | | | $ | 191,250 | | | $ | 199,260 | |
Lucky Friday (1) | | | 199 | | | | 26,140 | | | | 20,022 | | | | 70,152 | |
Casa Berardi | | | 53,990 | | | | 41,131 | | | | 139,524 | | | | 126,614 | |
San Sebastian | | | 25,589 | | | | 26,318 | | | | 66,866 | | | | 85,686 | |
| | | $ | 140,839 | | | $ | 179,393 | | | $ | 417,662 | | | $ | 481,712 | |
Income (loss) from operations: | | | | | | | | | | | | | | | | |
Greens Creek | | $ | 16,575 | | | $ | 26,498 | | | $ | 46,107 | | | $ | 49,407 | |
Lucky Friday | | | (4,642 | ) | | | 6,652 | | | | (8,974 | ) | | | 13,442 | |
Casa Berardi | | | 2,882 | | | | 3,691 | | | | (1,071 | ) | | | 16,246 | |
San Sebastian | | | 17,017 | | | | 18,415 | | | | 42,363 | | | | 58,911 | |
Other | | | (10,890 | ) | | | (17,016 | ) | | | (37,637 | ) | | | (42,584 | ) |
| | | $ | 20,942 | | | $ | 38,240 | | | $ | 40,788 | | | $ | 95,422 | |
(1) The $0.2 million in sales reported for Lucky Friday for the third quarter of 2017 represents gains on base metal derivatives contracts.
The following table presents identifiable assets by reportable segmentCredit Agreement as of September 30, 2017 and DecemberMarch 31, 2016 (in thousands):2024.
| | | September 30, 2017 | | | December 31, 2016 | |
Identifiable assets: | | | | | | | | |
Greens Creek | | $ | 666,463 | | | $ | 681,303 | |
Lucky Friday | | | 432,752 | | | | 442,829 | |
Casa Berardi | | | 814,053 | | | | 806,044 | |
San Sebastian | | | 55,395 | | | | 33,608 | |
Other | | | 427,520 | | | | 407,893 | |
| | | $ | 2,396,183 | | | $ | 2,371,677 | |
The sales and income (loss) from operations amounts reported above include results from our Lucky Friday segment. The Lucky Friday mine is our only operation where some of our employees are subject to a collective bargaining agreement, andSee Note 13: for updates regarding the most recent agreement expired on April 30, 2016. On February 19, 2017, the unionized employees voted against our contract offer. On March 13, 2017, the unionized employees went on strike and have been on strike since that time. Production at Lucky Friday was suspended from the start of the strike until July 2017, when limited production resumed. For the first nine months of 2017, suspension costs not related to production of $11.1 million, along with $3.3 million in non-cash depreciation expense, are reported in a separate line item on our unaudited condensed consolidated statement of operations. We cannot predict how long the strike will last or whether an agreement will be reached. As a result of the strike or other related events, operations at Lucky Friday could continue to be disrupted, which could adversely affect our financial condition and results of operations.Credit Agreement.
Note 8. Derivative Instruments
Note 7.Employee Benefit Plans
General
Our current risk management policy provides that up to 75% of five years of our foreign currency, lead and zinc metals price and silver and gold price exposure may be covered under a derivatives program with certain other limitations. Our program also utilizes derivatives to manage price risk exposure created from when revenue is recognized from a shipment of concentrate until final settlement.
These instruments expose us to (i) credit risk in the form of non-performance by counterparties for contracts in which the contract price exceeds the spot price of the hedged commodity or foreign currency and (ii) price risk to the extent that the spot price or currency exchange rate exceeds the contract price for quantities of our production and/or forecasted costs covered under contract positions.
Foreign Currency
Our wholly-owned subsidiaries owning the Casa Berardi operation and Keno Hill operation are USD-functional entities which routinely incur expenses denominated in CAD. Such expenses expose us to exchange rate fluctuations between the USD and CAD. We sponsor defined benefit pension plans covering substantially all U.S. employees. Net periodic pension costhave a program to manage our exposure to fluctuations in the USD exchange rate for these subsidiaries' future operating and capital costs denominated in CAD. The program related to forecasted cash operating costs at Casa Berardi and Keno Hill utilizes forward contracts to buy CAD, some of which are designated as cash flow hedges. As of March 31, 2024, we have a total of 493forward contracts outstanding to buy a total of CAD $370.6 million having a notional amount of USD$278.6 million for Casa Berardi, Keno Hill, and some corporate Canadian expenses. The CAD contracts related to forecasted cash operating costs at Casa Berardi and Keno Hill from 2024-2026 have a total notional value of CAD$299.7 million and have CAD-to-USD exchange rates ranging between 1.278and 1.3665 The CAD contracts related to forecasted capital expenditures at Casa Berardi from 2024-2026 have a total notional value of CAD$35.1 million at an average CAD-to-USD exchange rate of 1.351. The CAD contracts related to forecasted capital expenditures at Keno Hill from 2024-2026 have a total notional value of CAD$19.2 million at an average CAD-to-USD exchange rate of 1.354.
As of March 31, 2024 and December 31, 2023, we recorded the following balances for the plans consistedfair value of the followingforeign currency forward contracts (in millions):
| | | | | | | | |
| | March 31, | | | December 31, | |
Balance sheet line item: | | 2024 | | | 2023 | |
Other current assets | | $ | 0.4 | | | $ | 2.7 | |
Other non-current assets | | $ | 0.3 | | | $ | 2.0 | |
Other current liabilities | | $ | (3.1 | ) | | $ | (1.1 | ) |
Other non-current liabilities | | $ | (1.2 | ) | | $ | (0.4 | ) |
Net unrealized losses of $3.9 million related to the effective portion of the foreign currency forward contracts designated as hedges are included in accumulated other comprehensive income (loss) as of March 31, 2024. Unrealized gains and losses will be transferred from accumulated other comprehensive income (loss) to current earnings as the underlying operating expenses are recognized. We estimate $2.9 million in net unrealized losses included in accumulated other comprehensive income (loss) as of March 31, 2024 will be reclassified to current earnings in the next twelve months. Net realized losses of $0.4 million and $0.9 million on contracts related to underlying expenses which have been recognized were transferred from accumulated other comprehensive income (loss) and included in cost of sales and other direct production costs for the three and nine months ended September 30, 2017March 31, 2024 and 2016 (in thousands):
| | | Three Months Ended September 30, | |
| | | 2017 | | | 2016 | |
Service cost | | $ | 1,196 | | | $ | 1,077 | |
Interest cost | | | 1,339 | | | | 1,307 | |
Expected return on plan assets | | | (1,462 | ) | | | (1,325 | ) |
Amortization of prior service cost | | | (84 | ) | | | (84 | ) |
Amortization of net loss | | | 1,033 | | | | 1,093 | |
Net periodic pension cost | | $ | 2,022 | | | $ | 2,068 | |
| | | Nine Months Ended September 30, | |
| | | 2017 | | | 2016 | |
Service cost | | $ | 3,588 | | | $ | 3,231 | |
Interest cost | | | 4,017 | | | | 3,921 | |
Expected return on plan assets | | | (4,386 | ) | | | (3,975 | ) |
Amortization of prior service cost | | | (252 | ) | | | (252 | ) |
Amortization of net loss | | | 3,099 | | | | 3,279 | |
Net periodic pension cost | | $ | 6,066 | | | $ | 6,204 | |
We made cash contributions to our defined benefit plans2023, respectively. Net losses of $1.2$1.9 million in April 2017 and $5.7net gains of $0.7 million in July 2017. We expect to contribute approximately $0.4 million to our unfunded supplemental executive retirement plan during 2017.
Note 8. Shareholders’ Equity
Stock-based Compensation Plans
We periodically grant restricted stock unit awards, performance-based share awards and shares of common stock to our employees and directors as part of their compensation. We measure compensation cost for restricted stock units and stock grants at the closing price of our stock at the time of grant. We measure compensation cost for performance-based grants using a Monte Carlo simulation to estimate their value at grant date. Restricted stock unit and performance-based share grants vest after a specified period with compensation cost amortized over that period. Although we have no current plans to issue stock options, we may do so in the future.
In March 2017, the Board of Directors granted 641,406 shares of common stock to employees for payment of annual and long-term incentive compensation for the periodthree months ended DecemberMarch 31, 2016. The shares2024 and 2023, respectively, were distributed in March 2017, and $4.2 million in expense related to the stock awards was recognized in the periods prior to March 31, 2017.
In June 2017, the Board of Directors granted the following restricted stock unit awards to employees:
775,379 restricted stock units, with one third of those vesting in June 2018, one third vesting in June 2019, and one third vesting in June 2020;
93,691 restricted stock units, with one half of those vesting in June 2018 and one-half vesting in June 2019; and
15,336 restricted stock units that vest in June 2018.
The $1.9 million in expensecontracts not designated as hedges. No net unrealized gains or losses related to the unit awards discussed above vesting in 2018 will be recognized on a straight-line basis over the twelve months following the dateineffectiveness of the award. The $1.8 millionhedges are included in expense related to the unit awards discussed above vesting in 2019 will be recognized on a straight-line basis over the twenty-four months following the date of the award. The $1.5 million in expense related to the unit awards discussed above vesting in 2020 will be recognized on a straight-line basis over the thirty-six-month period following the date of the award.
In June 2017, the Board of Directors granted performance-based share awards to certain executive employees. Thefair value of the awards will be based on the ranking of the market performance of our common stock relative to the performance of the common stock of a group of peer companies over the three-year measurement period ending December 31, 2019. The number of shares to be issued will be based on the value of the awards divided by the share price at grant date. The $0.6 million in expense related to the performance-based awards will be recognized on a straight-line base over the thirty months following the date of the award.
Stock-based compensation expense for restricted stock unit and performance-based grants to employees and shares issued to nonemployee directors recorded in the first nine months of 2017 totaled $4.9 million, compared to $4.8 million in the same period last year.
In connection with the vesting of restricted stock units and other stock grants, employees have in the past, at their election and when permitted by us, chosen to satisfy their minimum tax withholding obligations throughadjustments, net share settlement, pursuant to which the Company withholds the number of shares necessary to satisfy such withholding obligations. As a result, in the first nine months of 2017 we withheld 588,240 shares valued at approximately $3.0 million, or approximately $5.09 per share. In the first nine months of 2016 we withheld 1,010,509 shares valued at approximately $3.5 million, or approximately $3.44 per share.
Common Stock Dividends
In September 2011 and February 2012, our Board of Directors adopted a common stock dividend policy that has two components: (1) a dividend that links the amount of dividends on our common stock to our average quarterly realized silver price in the preceding quarter,consolidated statements of operations and (2) a minimum annual dividend of $0.01 per share of common stock, in each case, payable quarterly, when and if declared. For illustrative purposes only, the table below summarizes potential per share dividend amounts at different quarterly average realized price levels according to the first component of the policy:
Quarterly average realized silver price per ounce | | | Quarterly dividend per share | | | Annualized dividend per share | |
| $ | 30 | | | $ | 0.01 | | | $ | 0.04 | |
| $ | 35 | | | $ | 0.02 | | | $ | 0.08 | |
| $ | 40 | | | $ | 0.03 | | | $ | 0.12 | |
| $ | 45 | | | $ | 0.04 | | | $ | 0.16 | |
| $ | 50 | | | $ | 0.05 | | | $ | 0.20 | |
On November 7, 2017, our Board of Directors declared a common stock dividend, pursuant to the minimum annual dividend component of the policy described above, of $0.0025 per share, for a total dividend of $1.0 million payable in December 2017. Because the average realized silver pricecomprehensive loss for the third quarter of 2017 was $17.01 per ounce, below the minimum threshold of $30 according to the policy, no silver-price-linked component was declared or paid. The declaration and payment of common stock dividends is at the sole discretion of our Board of Directors.
At-The-Market Equity Distribution Agreement
Pursuant to an equity distribution agreement dated February 23, 2016, we may issue and sell shares of our common stock from time to time through ordinary broker transactions having an aggregate offering price of up to $75 million, with the net proceeds available for general corporate purposes. The terms of sales transactions under the agreement, including trading day(s), number of shares sold in the aggregate, number of shares sold per trading day, and the floor selling price per share, are proposed by us to the sales agent. Whether or not we engage in sales from time to time may depend on a variety of factors, including share price, our cash resources, customary black-out restrictions, and whether we have any material inside information. The agreement can be terminated by us at any time. The shares issued under the equity distribution agreement are registered under the Securities Act of 1933, as amended, pursuant to our shelf registration statement on Form S-3, which was filed with the Securities and Exchange Commission ("SEC") on February 23, 2016. As of September 30, 2017, we had sold 4,608,847 shares under the agreement for total proceeds of approximately $17.7 million, net of commissions and fees of approximately $362 thousand. Of those amounts, 1,828,760 shares were sold in the first nine months of 2017 for total proceeds of approximately $9.6 million, net of commissions and fees of approximately $196 thousand.
Common Stock Repurchase Program
On May 8, 2012, we announced that our Board of Directors approved a stock repurchase program. Under the program, we are authorized to repurchase up to 20 million shares of our outstanding common stock from time to time in open market or privately negotiated transactions, depending on prevailing market conditions and other factors. The repurchase program may be modified, suspended or discontinued by us at any time. Whether or not we engage in repurchases from time to time may depend on a variety of factors, including not only price and cash resources, but customary black-out restrictions, whether we have any material inside information, limitations on share repurchases or cash usage that may be imposed by our credit agreement or in connection with issuances of securities, alternative uses for cash, applicable law, and other investment opportunities from time to time. As of September 30, 2017, 934,100 shares have been purchased at an average price of $3.99 per share, leaving 19.1 million shares that may yet be purchased under the program. No shares were purchased during the ninethree months ended September 30, 2017. The closing priceMarch 31, 2024 and 2023, respectively.
Metals Prices
We are currently using financially-settled forward contracts to manage the exposure to:
•changes in prices of
our common stock at November 3, 2017, was $4.45 per share.Note 9. Senior Notes, Credit Facilitysilver, gold, zinc and Capital Leases
Senior Notes
On April 12, 2013, we completed an offering of $500 million in aggregate principal amount of our Senior Notes due May 1, 2021 in a private placement conducted pursuant to Rule 144A and Regulation S under the Securities Act of 1933, as amended, and in 2014, an additional $6.5 million aggregate principal amount of the Senior Notes were issued to one of our pension plans. The Senior Notes were subsequently exchanged for substantially identical Senior Notes registered with the SEC. The Senior Notes are governed by the Indenture, dated as of April 12, 2013, as amended (the "Indenture"), among Hecla Mining Company ("Hecla") and certain of our subsidiaries and The Bank of New York Mellon Trust Company, N.A., as trustee. The net proceeds from the initial offering of the Senior Notes ($490 million) were used to partially fund the acquisition of Aurizon and for general corporate purposes, including expenses related to the Aurizon acquisition.
The Senior Notes are recorded net of a 2% initial purchaser discount totaling $10 million at the time of the April 2013 issuance and having an unamortized balance of $4.6 million as of September 30, 2017. The Senior Notes bear interest at a rate of 6.875% per year from the date of original issuance or from the most recent payment date on which interest has been paid or provided for. Interest on the Senior Notes is payable on May 1 and November 1 of each year, commencing November 1, 2013. During the nine months ended September 30, 2017 and 2016, interest expense related to the Senior Notes, including amortization of the initial purchaser discount and fees related to the issuances of the Senior Notes, was $26.3 million and $15.2 million, respectively. The interest expense related to the Senior Notes for the nine months ended September 30, 2017 and 2016 was net of $0.9 million and $12.0 million, respectively, in capitalized interest, primarily related to the #4 Shaft project at our Lucky Friday unit which was completed in January 2017. Interest expense for the nine months ended September 30, 2017 also includes $0.9 million in costs related to our proposed private offering of new Senior Notes in June 2017 and concurrent tender offer to purchase our existing Senior Notes, which were not completed.
The Senior Notes are guaranteed on a senior unsecured basis by certain of our subsidiaries (the "Guarantors"). The Senior Notes and the guarantees are, respectively, Hecla's and the Guarantors' general senior unsecured obligations and are subordinated to all of Hecla's and the Guarantors' existing and future secured debt to the extent of the assets securing that secured debt. In addition, the Senior Notes are effectively subordinated to all of the liabilities of Hecla's subsidiaries that are not guaranteeing the Senior Notes, to the extent of the assets of those subsidiaries.
The Senior Notes became redeemable in whole or in part, at any time and from time to time after May 1, 2016, on the redemption dates and at the redemption prices specified in the Indenture, plus accrued and unpaid interest, if any, to the date of redemption.
Upon the occurrence of a change of control (as defined in the Indenture), each holder of Senior Notes will have the right to require us to purchase all or a portion of such holder's Senior Notes pursuant to a change of control offer (as defined in the Indenture), at a purchase price equal to 101% of the principal amount thereof plus accrued and unpaid interest, if any, to the date of purchase, subject to the rights of holders of the Senior Notes on the relevant record date to receive interest due on the relevant interest payment date.
Credit Facility
In May 2016, we entered into a $100 million senior secured revolving credit facility with a three-year term, which was amended in July 2017 to extend the term until July 14, 2020. The credit facility is collateralized by the shares of common stock heldlead contained in our material domestic subsidiaries and by our joint venture interests in the Greens Creek mine, all of our rights and interests in the joint venture agreement, and all of our rights and interests in the assets of the joint venture. Below is information on the interest rates, standby fee, and financial covenant terms under our credit facility:
Interest rates: | | | | | | |
Spread over the London Interbank Offer Rate | | | 2.25 | - | 3.25% | |
Spread over alternative base rate | | | 1.25 | - | 2.25% | |
Standby fee per annum on undrawn amounts | | | | 0.50% | | |
Covenant financial ratios: | | | | | | |
Senior leverage ratio (debt secured by liens/EBITDA) | | | not more than 2.50:1 | |
Leverage ratio (total debt less unencumbered cash/EBITDA) | | | not more than 4.00:1 | |
Interest coverage ratio (EBITDA/interest expense) | | | not more than 3.00:1 | |
We are also able to obtain letters of credit under the facility, and for any such letters we are required to pay a participation fee of between 2.25% and 3.25% based on our total leverage ratio, as well as a fronting fee to each issuing bank of 0.20% annually on the average daily dollar amount of any outstanding letters of credit.
We believe we were in compliance with all covenants under the credit agreement and no amounts were outstanding as of September 30, 2017. With the exception of $2.6 million in letters of credit outstanding as of September 30, 2017, we have not drawn funds on the current revolving credit facility as of the filing date of this report.
Capital Leases
We have entered into various lease agreements, primarily for equipment at our Greens Creek, Lucky Friday, and Casa Berardi units, which we have determined to be capital leases. At September 30, 2017, the total liability balance associated with capital leases, including certain purchase option amounts, was $13.3 million, with $5.9 million of the liability classified as current and the remaining $7.4 million classified as non-current. At December 31, 2016, the total liability balance associated with capital leases was $11.5 million, with $5.7 million of the liability classified as current and $5.8 million classified as non-current. The total obligation for future minimum lease payments was $14.1 million at September 30, 2017, with $0.8 million attributed to interest.
At September 30, 2017, the annual maturities of capital lease commitments, including interest, are (in thousands):
Twelve-month period ending September 30, | | | | |
2018 | | $ | 6,293 | |
2019 | | | 4,179 | |
2020 | | | 2,369 | |
2021 | | | 1,260 | |
Total | | | 14,101 | |
Less: imputed interest | | | (813 | ) |
Net capital lease obligation | | $ | 13,288 | |
Note 10. Developments in Accounting Pronouncements
In May 2014, the Financial Accounting Standards Board ("FASB") issued Accounting Standards Update ("ASU") No. 2014-09 Revenue Recognition, replacing guidance currently codified in Subtopic 605-10 Revenue Recognition-Overall with various SEC Staff Accounting Bulletins providing interpretive guidance. The new ASU establishes a new five step principles-based framework in an effort to significantly enhance comparability of revenue recognition practices across entities, industries, jurisdictions, and capital markets. In August 2015, the FASB issued ASU No. 2015-14 Revenue from Contracts with Customers (Topic 606): Deferral of the Effective Date. ASU No. 2015-14 defers the effective date of ASU No. 2014-09 until annual and interim reporting periods beginning after December 15, 2017.
We have performed an assessment of the impact of implementation of ASU No. 2014-09, and do not believe it will change the timing of revenue recognition or amounts of revenue recognized compared to how we recognize revenue under our current policies. Our revenues involve a relatively limited number of types of contracts and customers. In addition, our revenue contracts do not involve multiple types of performance obligations. Revenues from doré are recognized, and the transaction price is known, at the time the metals sold are delivered to the customer. Concentrate revenues are generally recognized at the time of shipment. Concentrates sold at our Lucky Friday unit typically leave the mine and are received by the customer within the same day. There is a period of time between shipment of concentrates from our Greens Creek unit and their physical receipt by the customer. However, based on our assessment, we believe control of the concentrate parcels is generally obtained by the customer at the time of shipment.
Our concentrate sales involve variable consideration, as they are subject to changes in metals pricesshipments between the time of shipment and their final settlement. However, we are able to reasonably estimatesettlement; and
•changes in prices of zinc and lead (but not silver and gold) contained in our forecasted future concentrate shipments.
The following tables summarize the transaction pricequantities of metals committed under forward metals contracts at March 31, 2024 and December 31, 2023:
| | | | | | | | | | | | | | | | | | | | | | | | | | | | |
March 31, 2024 | | Ounces/pounds under contract (in 000's except gold) | | | Average price per ounce/pound | |
| | Silver | | | Gold | | | Zinc | | Lead | | | Silver | | | Gold | | | Zinc | | Lead | |
| | (ounces) | | | (ounces) | | | (pounds) | | (pounds) | | | (ounces) | | | (ounces) | | | (pounds) | | (pounds) | |
Contracts on provisional sales | | | | | | | | | | | | | | | | | | | | | | |
2024 settlements | | | 2,617 | | | | 9,060 | | | - | | | 12,015 | | | $ | 24.81 | | | $ | 2,165 | | | N/A | | $ | 0.98 | |
Contracts on forecasted sales | | | | | | | | | | | | | | | | | | | | | | |
2024 settlements | | - | | | - | | | - | | | 45,691 | | | N/A | | | N/A | | | N/A | | $ | 0.98 | |
2025 settlements | | - | | | - | | | - | | | 43,541 | | | N/A | | | N/A | | | N/A | | $ | 0.98 | |
| | | | | | | | | | | | | | | | | | | | | | | | | | | | | | | | |
December 31, 2023 | | Ounces/pounds under contract (in 000's except gold) | | | Average price per ounce/pound | |
| | Silver | | | Gold | | | Zinc | | | Lead | | | Silver | | | Gold | | | Zinc | | | Lead | |
| | (ounces) | | | (ounces) | | | (pounds) | | | (pounds) | | | (ounces) | | | (ounces) | | | (pounds) | | | (pounds) | |
Contracts on provisional sales | | | | | | | | | | | | | | | | | | | | | | | | |
2023 settlements | | | 735 | | | | 3 | | | | 441 | | | | 15,542 | | | $ | 24.40 | | | $ | 2,045 | | | $ | 1.51 | | | $ | 1.00 | |
Contracts on forecasted sales | | | | | | | | | | | | | | | | | | | | | | | | |
2024 settlements | | | — | | | | — | | | | — | | | | 56,713 | | | N/A | | | N/A | | | N/A | | | $ | 0.98 | |
2025 settlements | | | — | | | | — | | | | — | | | | 49,273 | | | N/A | | | N/A | | | N/A | | | $ | 0.98 | |
We recorded the following balances for the concentrate sales atfair value of the time of shipment using forward prices for the month of settlement, and we then adjust the values each period until final settlement. Also, it is unlikely a significant reversal of revenue for any one concentrate parcel will occur.
ASU No. 2014-09 will require additional disclosures, where applicable, on (i)metals contracts with customers, (ii) significant judgments and changes in judgments in determining the timing of satisfaction of performance obligations and the transaction price, and (iii) assets recognized for costs to obtain or fulfill contracts. We are in the process of assessing the impact of these additional requirements on our disclosure.
In July 2015, the FASB issued ASU No. 2015-11 Inventory (Topic 330): Simplifying the Measurement of Inventory. The update provides for inventory to be measured at the lower of cost and net realizable value, and is effective for fiscal years beginning after December 15, 2016. We adopted this update effective January 1, 2017, and it did not have a material impact on our consolidated financial statements.
In November 2015, the FASB issued ASU No. 2015-17 Income Taxes - Balance Sheet Classification of Deferred Taxes (Topic 740). The update is designed to reduce complexity of reporting deferred income tax liabilities and assets into current and non-current amounts in a balance sheet. ASU No. 2015-17 requires the presentation of deferred income taxes, changes to deferred tax liabilities and assets be classified as non-current in the statement of financial position. The update is effective for fiscal years beginning after December 15, 2016. We have elected to implement ASU No. 2015-17 retrospectively, and our deferred tax asset and liability balances are classified as non-current. Deferred tax assets of $12.3 million and deferred tax liabilities of $1.3 million previously classified as current as of March 31, 2024 and December 31, 2016 are now classified as non-current on our condensed consolidated balance sheet.2023 (in millions):
| | | | | | | | | | | | | | | | | | | | | | | | |
| | March 31, 2024 | | | December 31, 2023 | |
Balance sheet line item: | | Contracts in an asset position | | | Contracts in a liability position | | | Net asset (liability) | | | Contracts in an asset position | | | Contracts in a liability position | | | Net asset (liability) | |
Other current assets | | $ | 2.4 | | | $ | — | | | $ | 2.4 | | | $ | 3.1 | | | $ | — | | | $ | 3.1 | |
Other non-current assets | | $ | 0.8 | | | $ | — | | | $ | 0.8 | | | $ | 1.5 | | | $ | — | | | $ | 1.5 | |
Other current liabilities | | $ | — | | | $ | — | | | $ | — | | | $ | — | | | $ | (0.1 | ) | | $ | (0.1 | ) |
Other non-current liabilities | | $ | — | | | $ | — | | | $ | — | | | $ | — | | | $ | — | | | $ | — | |
In January 2016, the FASB issued ASU No. 2016-01 Financial Instruments - Overall (Subtopic 825-10): RecognitionNet realized and Measurement of Financial Assets and Financial Liabilities. The guidance requires entities to measure equity investments that are not accounted for under the equity method at fair value, with any changes in fair value included in current earnings, and updates certain disclosure requirements. The update is effective for fiscal years beginning after December 15, 2017. Adoption will be accounted for using the modified-retrospective approach, with a cumulative-effect adjustment to our balance sheet as of January 1, 2018. At September 30, 2017, we had net unrealized gains of $12.5 million related to equity investmentsthe effective portion of $3.2 millionthe forward metals contracts designated as hedges were included in accumulated other comprehensive loss.income (loss) as of March 31, 2024. Unrealized gains and losses will be transferred from accumulated other comprehensive income (loss) to current earnings as the underlying forecasted sales are recognized. We estimate $11.2million in net realized and unrealized gains included in accumulated other comprehensive income (loss) as of March 31, 2024 would be reclassified to current earnings in the next twelve months. The realized gains arose due to cash settlement of zinc contracts prior to maturity in 2022 and zinc and lead contracts during 2023 for net proceeds of $17.4 million and $8.5 million, respectively. We recognized a net gain of $3.1 million, including a $1.9 million gain transferred from accumulated other comprehensive income (loss), and a net gain of $0.9 million, including a $3.0 million loss transferred from accumulated other comprehensive income(loss) during the three months ended March 31, 2024 and 2023, respectively. These gains and losses were recognized on the contracts utilized to manage exposure to prices of metals in our concentrate shipments, which are included in sales. The net losses and gains recognized on the contracts offset gains and losses related to price adjustments on our provisional concentrate sales due to changes to silver, gold, lead and zinc prices between the time of sale and final settlement.
In February 2016,Credit-risk-related Contingent Features
Certain of our derivative contracts contain cross default provisions which provide that a default under our Credit Agreement would cause a default under the FASB issued ASU No. 2016-02 Leases (Topic 842).derivative contract. As of March 31, 2024, we have not posted any collateral related to these contracts. The update modifiesfair value of derivatives in a net liability position related to these agreements was $5.4 million as of March 31, 2024, which includes accrued interest but excludes any adjustment for nonperformance risk. If we were in breach of any of these provisions at March 31, 2024, we could have been required to settle our obligations under the classification criteria and requires lesseesagreements at their termination value of $5.4 million.
Note 9. Fair Value Measurement
Fair value adjustments, net is comprised of the following (in thousands):
| | | | | | | | |
| | Three Months Ended March 31, | |
| | 2024 | | | 2023 | |
(Loss) gain on derivative contracts | | $ | (1,899 | ) | | $ | 987 | |
Unrealized gain (loss) on equity securities investments | | | 47 | | | | 2,194 | |
Total fair value adjustments, net | | $ | (1,852 | ) | | $ | 3,181 | |
Accounting guidance has established a hierarchy for inputs used to recognize themeasure assets and liabilities at fair value on a recurring basis. The three levels included in the balance sheethierarchy are:
Level 1: quoted prices in active markets for most leases. identical assets or liabilities;
Level 2: significant other observable inputs; and
Level 3: significant unobservable inputs.
The update is effectivetable below sets forth our assets and liabilities that were accounted for fiscal years beginning after December 15, 2018, with early adoption permitted. at fair value on a recurring basis and the fair value calculation input hierarchy level that we have determined applies to each asset and liability category (in thousands).
| | | | | | | | | | |
Description | | Balance at
March 31,
2024 | | | Balance at
December 31,
2023 | | | Input
Hierarchy Level |
Assets: | | | | | | | | |
Cash and cash equivalents: | | | | | | | | |
Money market funds and other bank deposits | | $ | 80,169 | | | $ | 106,374 | | | Level 1 |
Current and non-current investments: | | | | | | | | |
Equity securities | | | 32,873 | | | | 32,284 | | | Level 1 |
Trade accounts receivable: | | | | | | | | |
Receivables from provisional concentrate sales | | | 30,508 | | | | 14,740 | | | Level 2 |
Restricted cash and cash equivalent balances: | | | | | | | | |
Certificates of deposit and other deposits | | | 1,163 | | | | 1,165 | | | Level 1 |
Derivative contracts - current and non-current derivative assets: | | | | | | | | |
Foreign exchange contracts | | | 685 | | | | 4,657 | | | Level 2 |
Metal forward contracts | | | 3,246 | | | | 4,698 | | | Level 2 |
Total assets | | $ | 148,644 | | | $ | 163,918 | | | |
| | | | | | | | |
Liabilities: | | | | | | | | |
Derivative contracts - current and non-current derivative liabilities: | | | | | | | | |
Foreign exchange contracts | | $ | 4,267 | | | $ | 1,508 | | | Level 2 |
Metal forward contracts | | | — | | | | 40 | | | Level 2 |
Total liabilities | | $ | 4,267 | | | $ | 1,548 | | | |
Cash and cash equivalents consist primarily of money market funds and are valued at cost, which approximates fair value.
Current and non-current restricted cash and cash equivalent balances consist primarily of certificates of deposit, U.S. Treasury securities, and other deposits and are valued at cost, which approximates fair value.
Our non-current investments consist of marketable equity securities of companies in the mining industry which are valued using quoted market prices for each security.
Trade accounts receivable from provisional concentrate sales are subject to final pricing and valued using quoted prices based on forward curves for the particular metals.
We are currently evaluatinguse financially-settled forward contracts to manage exposure to changes in the exchange rate between USD and CAD, and the impact on CAD-denominated operating and capital costs incurred at our Casa Berardi operation and the Keno Hill operation (see Note 8 for more information). The fair value of implementing this update oneach contract represents the present value of the difference between the forward exchange rate for the contract settlement period as of the measurement date and the contract settlement exchange rate.
We use financially-settled forward contracts to manage the exposure to changes in prices of silver, gold, zinc and lead contained in our consolidated financial statements.concentrate shipments that have not reached final settlement. We also use financially-settled forward contracts to manage the exposure to changes in prices of silver, gold, zinc and lead contained in our forecasted future sales (see Note 8 for more information). The fair value of each forward contract represents the present value of the difference between the forward metal price for the contract settlement period as of the measurement date and the contract settlement metal price.
InAt March 2016,31, 2024, our Senior Notes and IQ Notes were recorded at their carrying value of $471.5million and $35.8million, respectively, net of unamortized initial purchaser discount/premium and issuance costs. The estimated fair values of our Senior Notes and IQ Notes were $477.6 million and $35.9million, respectively, at March 31, 2024. Quoted market prices, which we consider to be
Level 1 inputs, are utilized to estimate fair values of the FASB issued ASU No. 2016-09 Compensation - Stock Compensation (Topic 718): ImprovementsSenior Notes. Unobservable inputs which we consider to Employee Share-Based Payment Accounting.be Level 3, including an assumed current annual yield of 8.06%, are utilized to estimate the fair value of the IQ Notes. See Note 7 for more information. The update simplifies the accounting for stock-based compensation, including income tax consequences and balance sheet and cash flow statement classification of awards. The update is effective for fiscal years beginning after December 15, 2016. We adopted this update effective JanuaryCredit Agreement, which we consider to be Level 1 2017, and it did not have a material impact on our consolidated financial statements.
In August 2016, the FASB issued ASU No. 2016-15 Statement of Cash Flows (Topic 230): Classification of Certain Cash Receipts and Cash Payments. The update provides guidance on classification for cash receipts and payments related to eight specific issues. The update is effective for fiscal years beginning after December 15, 2017, and interim periods within those fiscal years, with early adoption permitted. We are currently evaluating the potential impact of implementing this update on our consolidated financial statements.
In November 2016, the FASB issued ASU No. 2016-18 Statement of Cash Flows (Topic 230): Restricted Cash. The update requires that a statement of cash flows explain the change during the period in the totalfair value hierarchy, has a carrying and fair value of cash, cash equivalents, and amounts generally described as restricted cash or restricted cash equivalents. The update is effective for fiscal years beginning after December 15, 2017, and interim periods within those fiscal years, with early adoption permitted. We are currently evaluating the potential impact of implementing this update on our consolidated financial statements.$140 million.
Note 10. Product Inventories
In January 2017, the FASB issued ASU No. 2017-01 Business Combinations (Topic 805): Clarifying the Definition of a Business. The update clarifies the definition of a business with the objective of adding guidance to assist entities with evaluating whether transactions should be accounted for as acquisitions (or disposals) of assets or businesses. The update is effective for fiscal years beginning after December 15, 2017, and interim periods within those fiscal years. We will apply the applicable provisions of the update to any acquisitions occurring after the effective date.
In March 2017, the FASB issued ASU No. 2017-07 Compensation - Retirement Benefits (Topic 715): Improving the Presentation of Net Periodic Pension Cost and Net Period Postretirement Benefit Cost. The update provides specific requirements for classification and disclosure regarding the service cost component and otherOur major components of net benefit cost related to pension plans. The update is effective for fiscal years beginning after December 15, 2017, and interim periods within those fiscal years. Weproduct inventories are currently evaluating the potential impact of implementing this update on our consolidated financial statements.(in thousands):
17
Table of Contents | | | | | | | | |
| | March 31, 2024 | | | December 31, 2023 | |
Concentrates | | $ | 16,423 | | | $ | 13,328 | |
Stockpiled ore | | | 8,870 | | | | 7,168 | |
In-process | | | 12,121 | | | | 8,327 | |
Total product inventories | | $ | 37,414 | | | $ | 28,823 | |
In August 2017, the FASB issued ASU No. 2017-12 Derivatives and Hedging (Topic 815): Targeted Improvements to Accounting for Hedging Activities. The objective of the update is to improve the financial reporting of hedging relationships to better portray the economic results of an entity's risk management activities in its financial statements, and simplify the application of existing hedge accounting guidance. The update is effective for fiscal years beginning after December 15, 2018, and interim periods within those fiscal years, with early adoption permitted. We are currently evaluating the potential impact of implementing this update on our consolidated financial statements.
Note 11. Derivative Instruments Commitments, Contingencies and Obligations
Foreign Currency
Our wholly-owned subsidiaries owning the Casa BerardiJohnny M Mine Area near San Mateo, McKinley County and San Sebastian mines areMateo Creek Basin, New Mexico
In August 2012, Hecla Limited and the U.S. dollar ("USD"Environmental Protection Agency (the “EPA”)-functional entities entered into a Settlement Agreement and Administrative Order on Consent for Removal Action (“Consent Order”) regarding the Johnny M Mine Area near San Mateo, McKinley County, New Mexico. Mining at the Johnny M Mine was conducted for a limited period of time by a predecessor of Hecla Limited, and the EPA had previously asserted that Hecla Limited may be responsible under the Comprehensive Environmental Response, Compensation and Liability Act (“CERCLA”) for environmental remediation and past costs incurred by the EPA at the site. Under the Consent Order, Hecla Limited agreed to pay (i) $1.1 million to the EPA for its past response costs at the site and (ii) any future response costs at the site under the Consent Order, in exchange for a covenant not to sue by the EPA. In December 2014, Hecla Limited submitted to the EPA the Engineering Evaluation and Cost Analysis (“EE/CA”) for the site which routinely incur expenses denominated in Canadian dollars ("CAD")recommended on-site disposal of mine-related material. In January 2021, the parties began negotiating a new consent order to design and Mexican pesos ("MXN"), and such expenses expose us to exchange rate fluctuations betweenimplement the USD and CAD and MXN. In April 2016, we initiated a program to manage our exposure to fluctuationson-site disposal response action recommended in the exchange rateEE/CA. Based on the foregoing, we believe it is probable that Hecla Limited will incur a liability for the CERCLA removal action and we have accrued $10.1 million, primarily representing estimated current costs to design and implement the remedy, which are subject to change as fieldwork is performed. It is possible that Hecla Limited’s liability will be more than $10.1 million, and any increase in liability could have a material adverse effect on Hecla Limited’s or our results of operations or financial position.
The Johnny M Mine is in an area known as the San Mateo Creek Basin (“SMCB”), which is an approximately 321 square mile area in New Mexico that contains numerous legacy uranium mines and mills. In addition to Johnny M, Hecla Limited’s predecessor was involved at other mining sites within the SMCB. The EPA appears to have deferred consideration of listing the SMCB site on CERCLA’s National Priorities List (“Superfund”) by removing the site from its emphasis list, and is working with various potentially responsible parties (“PRPs”) at the site in order to study and potentially address perceived groundwater issues within the SMCB. The EE/CA discussed above relates primarily to contaminated rock and soil at the Johnny M site, not groundwater and not elsewhere within the SMCB site. It is possible that Hecla Limited’s liability at the Johnny M Site, and for any other mine site within the SMCB at which Hecla Limited’s predecessor may have operated, will be greater than our current accrual of $10.1 million due to the increased scope of required remediation.
In July 2018, the EPA informed Hecla Limited that it and several other PRPs may be liable for cleanup of the SMCB site or for costs incurred by the EPA in cleaning up the site. The EPA stated it has incurred approximately $9.6 million in response costs to date. On May 2, 2022, Hecla Limited received a letter from a PRP notifying Hecla Limited that three PRPs will seek cost recovery and contribution from Hecla Limited under CERCLA for certain investigatory work performed by the PRPs at the SMCB site. Hecla Limited cannot with reasonable certainty estimate the amount or range of liability, if any, relating to this matter because of, among other reasons, the lack of information concerning the site, including the relative contributions of contamination by the various PRPs.
Carpenter Snow Creek and Barker-Hughesville Sites in Montana
In July 2010, the EPA made a formal request to Hecla for information regarding the Carpenter Snow Creek Superfund site located in Cascade County, Montana. The Carpenter Snow Creek site is located in a historical mining district, and in the early 1980s Hecla Limited leased 6 mining claims and performed limited exploration activities at the site. Hecla Limited terminated the mining lease in 1988.
In June 2011, the EPA informed Hecla Limited that it believes Hecla Limited, and several other PRPs, may be liable for cleanup of the site or for costs incurred by the EPA in cleaning up the site. The EPA stated in the letter that it has incurred approximately $4.5 million in response costs and estimated that total remediation costs may exceed $100 million. Hecla Limited cannot with reasonable certainty estimate the amount or range of liability, if any, relating to this matter because of, among other reasons, the lack of information concerning the site, including the relative contributions of contamination by various other PRPs.
In February 2017, the EPA made a formal request to Hecla for information regarding the Barker-Hughesville Mining District Superfund site located in Judith Basin and Cascade Counties, Montana. Hecla Limited submitted a response in April 2017. The Barker-Hughesville site is located in a historic mining district, and between approximately June and December 1983, Hecla Limited was party to an agreement with another mining company under which limited exploration activities occurred at or near the USDsite.
In August 2018, the EPA informed Hecla Limited that it and CADseveral other PRPs may be liable for cleanup of the site or for costs incurred by the EPA in cleaning up the site. The EPA did not include an amount of its alleged response costs to date. Hecla Limited cannot with reasonable certainty estimate the amount or range of liability, if any, relating to this matter because of, among other reasons, the lack of information concerning past or anticipated future costs at the site and the impact onrelative contributions of contamination by various other PRPs.
Lucky Friday and Keno Hill Environmental Issues
On July 12, 2022, our future operating costs denominated in CAD. In October 2016, we also initiatedLucky Friday mine received a program to manage our exposure tonotice of violation from the impact of fluctuations in the exchange rate between the USD and MXN on our future operating costs denominated in MXN. The programs utilize forward contracts to buy CAD and MXN, and each contract is designated as a cash flow hedge. As of September 30, 2017, we have 94 forward contracts outstanding to buy CAD$200.1 million having a notational amount of US$154.0 million, and 6 forward contracts outstanding to buy MXN$43.3 million having a notional amount of USD$2.2 million. The CAD contracts are related to forecasted cash operating costs at Casa Berardi to be incurred from 2017 through 2020 and have USD-to-CAD exchange rates ranging between 1.2787 and 1.3380. The MXN contracts are related to forecasted cash operating costs at San Sebastian for 2017 and have MXN-to-USD exchange rates ranging between 19.5910 and 21.0000. Our risk management policy provides for up to 75% of our planned cost exposure for five years into the future to be hedged under such programs, and for potential additional programs to manage other foreign currency-related exposure areas.
As of September 30, 2017, we recorded the following balances for the fair valueEPA alleging violations of the contracts:
a current asset of $2.8 million, which is included in other current assets;Clean Water Act between 2018 and
a non-current asset of $3.7 million, which is included in other non-current assets.
Net unrealized gains of approximately $6.8 million related 2021 relating primarily to the effective portion of the hedges were included in accumulated other comprehensive income as of September 30, 2017. Unrealized gains and losses will be transferred from accumulated other comprehensive loss to current earnings as the underlying operating expenses are recognized. We estimate approximately $2.9 million in net unrealized gains included in accumulated other comprehensive income as of September 30, 2017 would be reclassified to current earnings in the next twelve months. Net realized gains of approximately $0.4 million on contracts related to underlying expenses which have been recognized were transferred from accumulated other comprehensive loss and included in cost of sales and other direct production costs for the nine months ended September 30, 2017. Net unrealized gains of approximately $2 thousand related to ineffectiveness of the hedges were included in current earnings for the nine months ended September 30, 2017.
Metals Prices
At times, we use commodity forward sales commitments, commodity swap contracts and commodity put and call option contracts to manage our exposure to fluctuations in the prices of certain metals we produce. Contract positions are designed to ensure that we will receive a defined minimum price for certain quantities of our production, thereby partially offsetting our exposure to fluctuations in the market. These instruments do, however, expose us to (i) credit risk in the form of possible non-performance by counterparties for contracts in which the contract price exceeds the spot price of a commodity and (ii) price risk to the extent that the spot price exceeds the contract price for quantities of our production covered under contract positions.
We are currently using financially-settled forward contracts to manage the exposure to changes in prices of silver, gold, zinc and lead contained in our concentrate shipments between the time of shipment and final settlement. In addition, we currently use financially-settled forward contracts to manage the exposure to changes in pricesconcentration levels of zinc and lead (butin the mine’s permitted water discharges. Currently, the EPA has not silverinitiated any formal enforcement proceeding against our Lucky Friday subsidiary. In civil judicial cases, the EPA can seek statutory penalties up to $59,973 per day per violation and, gold) contained in administrative actions, the EPA can seek administrative penalties up to $23,989 per day per violation with a maximum administrative penalty of $299,989 for all alleged violations. The EPA typically pursues administrative penalties. At this time, we cannot reasonably assess the amount of penalties the EPA may seek, or predict the terms of any potential settlement with the EPA.
On December 14, 2023 and January 29, 2024, our forecasted future concentrate shipments. These contractsKeno Hill mine received notice from the Yukon government that it is charged with violating the Quartz Mining Act and the Waters Act, two statutes of the Yukon Territory, relating to alleged violations of Keno Hill’s mining license and water license. The allegations are not designatedthat the mine stored hazardous materials inconsistent with the terms of its mining license on or between April 19, 2022 and July 25, 2023 and exceeded water discharge limits in its water license on June 27 and December 6, 2023. If convicted, the maximum fine for an offense under both of these laws is $100,000 per offense. Because we are at the initial stages of this regulatory proceeding, we cannot reasonably predict the outcome of this matter at this time.
Litigation Related to Klondex Acquisition
On May 24, 2019, a purported Hecla stockholder filed a putative class action lawsuit in the U.S. District Court for the Southern District of New York against Hecla and certain of our executive officers, one of whom is also a director. The complaint, purportedly brought on behalf of all purchasers of Hecla common stock from March 19, 2018 through and including May 8, 2019, asserts claims under Sections 10(b) and 20(a) of the Securities Exchange Act of 1934 and Rule 10b-5 promulgated thereunder and seeks, among other things, damages and costs and expenses. Specifically, the complaint alleges that Hecla, under the authority and control of the individual defendants, made certain material false and misleading statements and omitted certain material information regarding Hecla’s Nevada Operations. The complaint alleges that these misstatements and omissions artificially inflated the market price of Hecla common stock during the class period, thus purportedly harming investors. The Court granted our Motion to Dismiss the lawsuit, without prejudice, in February 2023, and the plaintiffs filed an amended complaint in March 2023 which repeats the same claims. We have filed a Motion to Dismiss the amended complaint. We cannot predict the outcome of this lawsuit or estimate damages if plaintiffs were to prevail. We believe that these claims are without merit and intend to defend them vigorously.
Related to this class action lawsuit, Hecla has been named as hedgesa nominal defendant in a shareholder derivative lawsuit which also names as defendants certain current and past (i) members of Hecla’s Board of Directors and (ii) officers of Hecla. The case was filed on May 4, 2022 in the Delaware Chancery Court. In general terms, the suit alleges breaches of fiduciary duties by the individual defendants, waste of corporate assets and unjust enrichment, and seeks damages, purportedly on behalf of Hecla.
Debt
See Note 7 for information on the commitments related to our debt arrangements as of March 31, 2024.
Other Commitments
Our contractual obligations as of March 31, 2024 included open purchase orders and commitments of $11.1 million, $17.5 million, $10.2 million, $2.5 million and $0.8 million for various capital and non-capital items at Greens Creek, Lucky Friday, Keno Hill, Casa Berardi and Other, respectively. We also have total commitments of $26.4 million relating to scheduled payments on finance leases, including interest, primarily for equipment at our Greens Creek, Lucky Friday, Casa Berardi, and Keno Hill units, and total commitments of $13.5 million relating to payments on operating leases (see Note 7 for more information). As part of our ongoing business and operations, we are marked-to-market through earnings each period.required to provide surety bonds, bank letters of credit, and restricted deposits for various purposes, including financial support for environmental reclamation obligations and workers compensation programs. As of September 30, 2017,March 31, 2024, we recordedhad surety bonds totaling $195.3 million and letters of credit totaling $6.8 million in place as financial support for future reclamation and closure costs, self-insurance, and employee benefit plans. The obligations associated with these instruments are generally related to performance requirements that we address through ongoing operations. As the following balances forrequirements are met, the fair valuebeneficiary of the contracts:
a current assetassociated instruments cancels or returns the instrument to the issuing entity. Certain of $0.4 million, which is netthese instruments are associated with operating sites with long-lived assets and will remain outstanding until closure of $0.1 million for contractsthe sites. We believe we are in a liability positioncompliance with all applicable bonding requirements and included in other current assets;
a current liability of $7.9 million, which is net of $0.2 million for contracts in an asset position and included in other current liabilities; and
a non-current liability of $4.0 million, which is included in other non-current liabilities.
We recognized a $3.9 million net loss during the first nine months of 2017 on the contracts utilizedwill be able to manage exposure to prices of metals in our concentrate shipments, which is included in sales of products. The net loss recognized on the contracts offsets gains related to price adjustments on our provisional concentrate sales due to changes to silver, gold, lead and zinc prices between the time of sale and final settlement.
We recognized a $16.5 million net loss during the first nine months of 2017 on the contracts utilized to manage exposure to prices for forecastedsatisfy future concentrate shipments. The net loss on these contracts is included as a separate line item under other income (expense),bonding requirements as they relate to forecasted future shipments, as opposed to sales thatarise.
Other Contingencies
We also have already taken place butcertain other contingencies resulting from litigation, claims, EPA investigations, and other commitments and are subject to final pricing as discusseda variety of environmental and safety laws and regulations incident to the ordinary course of business. We currently have no basis to conclude that any or all of such contingencies will materially affect our financial position, results of operations or cash flows. However, in the preceding paragraph.future, there may be changes to these contingencies, or additional contingencies may occur, any of which might result in an accrual or a change in current accruals recorded by us, and there can be no assurance that their ultimate disposition will not have a material adverse effect on our financial position, results of operations or cash flows.
Note 12. Developments in Accounting Pronouncements
Accounting Standards Updates Adopted
In March 2020, ASU No. 2020-04 was issued which provides optional guidance for a limited period of time to ease the potential burden on accounting for contract modifications caused by reference rate reform. In January 2021, ASU No. 2021-01 was issued which broadened the scope of ASU No. 2020-04 to include certain derivative instruments. In December 2022, ASU No. 2022-06 was issued which deferred the sunset date of ASU No. 2020-04. The net lossguidance is effective for the first nine monthsall entities as of 2017 is the result of higher zinc and lead prices. This program, when utilized, is designed to mitigate the impact of potential future declines in lead and zinc prices from the price levels established in the contracts (see average price information below). When those prices increase compared to the contract prices, we recognize losses.
The following tables summarize the quantities of metals committed under forward sales contracts at September 30, 2017 andMarch 12, 2020 through December 31, 2016:
September 30, 2017 | | Ounces/pounds under contract (in 000's) | | | Average price per ounce/pound | |
| | | Silver | | | Gold | | | Zinc | | | Lead | | | Silver | | | Gold | | | Zinc | | | Lead | |
| | | (ounces) | | | (ounces) | | | (pounds) | | | (pounds) | | | (ounces) | | | (ounces) | | | (pounds) | | | (pounds) | |
Contracts on provisional sales | | | | | | | | | | | | | | | | | | | | | | | | | | | | | | | | |
2017 settlements | | | 1,399 | | | | 5 | | | | 19,070 | | | | 2,535 | | | $ | 17.18 | | | $ | 1,298 | | | $ | 1.33 | | | $ | 1.07 | |
2018 settlements | | | — | | | | — | | | | 2,370 | | | | — | | | | N/A | | | | N/A | | | $ | 1.38 | | | | N/A | |
Contracts on forecasted sales | | | | | | | | | | | | | | | | | | | | | | | | | | | | | | | | |
2017 settlements | | | — | | | | — | | | | 441 | | | | 2,866 | | | | N/A | | | | N/A | | | $ | 1.23 | | | $ | 1.05 | |
2018 settlements | | | — | | | | — | | | | 39,463 | | | | 17,968 | | | | N/A | | | | N/A | | | $ | 1.27 | | | $ | 1.05 | |
2019 settlements | | | — | | | | — | | | | 14,330 | | | | 8,267 | | | | N/A | | | | N/A | | | $ | 1.30 | | | $ | 1.07 | |
2020 settlements | | | — | | | | — | | | | 3,307 | | | | 2,205 | | | | N/A | | | | N/A | | | $ | 1.27 | | | $ | 1.07 | |
December 31, 2016 | | Ounces/pounds under contract (in 000's) | | | Average price per ounce/pound | |
| | | Silver | | | Gold | | | Zinc | | | Lead | | | Silver | | | Gold | | | Zinc | | | Lead | |
| | | (ounces) | | | (ounces) | | | (pounds) | | | (pounds) | | | (ounces) | | | (ounces) | | | (pounds) | | | (pounds) | |
Contracts on provisional sales | | | | | | | | | | | | | | | | | | | | | | | | | | | | | | | | |
2017 settlements | | | 1,295 | | | | 4 | | | | 19,070 | | | | 7,441 | | | $ | 16.29 | | | $ | 1,172 | | | $ | 1.18 | | | $ | 0.97 | |
| | | | | | | | | | | | | | | | | | | | | | | | | | | | | | | | | |
Contracts on forecasted sales | | | | | | | | | | | | | | | | | | | | | | | | | | | | | | | | |
2017 settlements | | | — | | | | — | | | | 35,384 | | | | 17,637 | | | | N/A | | | | N/A | | | $ | 1.19 | | | $ | 1.03 | |
2018 settlements | | | — | | | | — | | | | 13,779 | | | | 5,732 | | | | N/A | | | | N/A | | | $ | 1.21 | | | $ | 1.05 | |
Our concentrate sales are based2024. The guidance may be adopted over time as reference rate reform activities occur and should be applied on a provisional sales price containing an embedded derivative that is required to be separated from the host contract for accounting purposes. The host contract is the receivable from the sale of the concentrates at the forward price at the time of the sale. The embedded derivative, which does not qualify for hedge accounting, is adjusted to market through earnings each period prior to final settlement.
Credit-risk-related Contingent Features
prospective basis. Certain of our derivative contracts contain cross default provisions which provide that a default under our revolving credit agreement would cause a default under the derivative contracts. As of September 30, 2017, we have not posted any collateral related to these agreements. The fair value of derivatives in a net liability position, which includes accrued interest but excludes any adjustment for nonperformance risk, related to these agreements was $14.4 million as of September 30, 2017. If we were in breach of any derivative contracts at September 30, 2017, we couldinstruments previously referenced London Interbank Offered Rate ("LIBOR") based rates and have been requiredamended to settleeliminate the LIBOR-based rate references prior to July 1, 2023. There have been no significant impacts to our obligations underfinancial results, financial position or cash flows from the agreements at their termination valuetransition from LIBOR to alternative reference interest rates.
Accounting Standards Updates to Become Effective in Future Periods
In August 2023, the FASB issued ASU 2023-05, Business Combinations - Joint Venture Formations (Subtopic 805-60): Recognition and Initial Measurement, which clarifies the business combination accounting for joint venture formations. The amendments in the ASU seek to reduce diversity in practice that has resulted from a lack of $14.4 million.authoritative guidance regarding the accounting for the formation of joint ventures in separate financial statements. The amendments also seek to clarify the initial measurement of joint venture net assets, including businesses contributed to a joint venture. The guidance is applicable to all entities involved in the formation of a joint venture. The amendments are effective for all joint venture formations with a formation date on or after January 1, 2025. Early adoption and retrospective application of the amendments are permitted. We do not expect adoption of the new guidance to have a material impact on our consolidated financial statements and disclosures.
In November 2023, the FASB issued ASU 2023-07, Segment Reporting (Topic 280): Improvements to Reportable Segment Disclosures, amending reportable segment disclosure requirements to include disclosure of incremental segment information on an annual and interim basis. Among the disclosure enhancements are new disclosures regarding significant segment expenses that are regularly provided to the chief operating decision-maker and included within each reported measure of segment profit or loss, as well as other segment items bridging segment revenue to each reported measure of segment profit or loss. The amendments in ASU 2023-07 are effective for fiscal years beginning after December 15, 2023, and for interim periods within fiscal years beginning after December 15, 2024, and are applied retrospectively. Early adoption is permitted. We continue to evaluate the impact of this update on our consolidated financial statements and disclosures and don't expect any changes to our current reportable segments.
In December 2023, the FASB issued ASU 2023-09, Income Taxes (Topic 740): Improvement to Income Tax Disclosures, amending income tax disclosure requirements for the effective tax rate reconciliation and income taxes paid. The amendments in ASU 2023-09 are effective for fiscal years beginning after December 15, 2024 and are applied prospectively. Early adoption and retrospective
the amendments are permitted. We are currently evaluating the impact of this update on our consolidated financial statements and disclosures.
Note 13. Subsequent Events
Note 12. Fair Value Measurement
The table below sets forthOn May 3, 2024 we entered into a First Amendment to Credit Agreement (the “First Amendment”), which makes certain changes to our assets and liabilities that were accounted for at fair value on a recurring basisexisting Credit Agreement (the “Original Credit Agreement” and the fair value calculation input hierarchy level that we have determined applies to each assetOriginal Credit Agreement, as amended, modified and liability category (in thousands).
Description | | Balance at September 30, 2017 | | | Balance at December 31, 2016 | | Input Hierarchy Level |
Assets: | | | | | | | | | |
Cash and cash equivalents: | | | | | | | | | |
Money market funds and other bank deposits | | $ | 172,923 | | | $ | 169,777 | | Level 1 |
Available for sale securities: | | | | | | | | | |
Debt securities - municipal and corporate bonds | | | 32,973 | | | | 29,117 | | Level 2 |
Equity securities – mining industry | | | 7,098 | | | | 5,002 | | Level 1 |
Trade accounts receivable: | | | | | | | | | |
Receivables from provisional concentrate sales | | | 6,982 | | | | 20,082 | | Level 2 |
Restricted cash balances: | | | | | | | | | |
Certificates of deposit and other bank deposits | | | 1,076 | | | | 2,200 | | Level 1 |
Derivative contracts: | | | | | | | | | |
Foreign exchange contracts | | | 6,533 | | | | 27 | | Level 2 |
Metal forward contracts | | | 394 | | | | 5,403 | | Level 2 |
Total assets | | $ | 227,979 | | | $ | 231,608 | | |
| | | | | | | | | | |
Liabilities: | | | | | | | | | |
Derivative contracts: | | | | | | | | | |
Foreign exchange contracts | | $ | — | | | $ | 5,288 | | Level 2 |
Metal forward contracts | | | 11,902 | | | | 192 | | Level 2 |
Total liabilities | | $ | 11,902 | | | $ | 5,480 | | |
Cash and cash equivalents consist primarily of money market funds and are valued at cost, which approximates fair value, and a small portion consists of municipal bonds having maturities of less than 90 days, which are recorded at fair value.
Current available-for-sale securities consist of municipal and corporate bonds having maturities of more than 90 days, which are recorded at fair value.
Current and non-current restricted cash balances consist primarily of certificates of deposit, U.S. Treasury securities,supplemented by the First Amendment, the “Credit Agreement”), with the various financial institutions and other depositspersons from time to time party thereto as lenders (the “Lenders”), Bank of Montreal and are valued at cost, which approximates fair value.Bank of America, N.A. as letters of credit issuers, and Bank of America, N.A., as administrative agent for the Lenders and as swingline lender. See Note 7. Debt, Credit Agreement and Leases above for a discussion of our Original Credit Agreement. The Original Credit Agreement remains in effect except for the explicit amendments, modifications and supplements made by the First Amendment. The First Amendment made the following changes to our Original Credit Agreement:
Our non-current
•increases the amount available for sale securities consistborrowing to $225 million from $150 million;
•extends the maturity date to July 21, 2028 from July 21, 2026 (the maturity date of marketable equity securitiesthe Credit Agreement will be accelerated to August 15 2027 if our Senior Notes are not refinanced by that date);
•National Bank, TD Securities, Bank of companiesNova Scotia and ING are added as new Lenders and Credit Suisse AG, New York Branch assigned its interests in the mining industry which are valued using quoted market prices for each security.Original Credit Agreement to its affiliate UBS AG, Stamford Branch immediately prior to entering into the First Amendment.
Trade accounts receivable include amounts due to us for shipments of concentrates, doré and precipitate sold to customers. Revenues and the corresponding accounts receivable for sales of metals products are recorded when title and risk of loss transfer to the customer (generally at the time of loading on truck or ship). Sales of concentrates are recorded using estimated forward prices for the anticipated month of settlement applied to our estimate of payable metal quantities
Forward-Looking Statements
Certain statements contained in each shipment. Salesthis Form 10-Q, including in Management’s Discussion and Analysis of Financial Condition and Results of Operations and Quantitative and Qualitative Disclosures About Market Risk, are recorded net of estimated treatment and refining charges, which are also impacted by changes in metals prices and quantities of contained metals. We estimate the prices at which sales of our concentrates willintended to be settled due to the time elapsed between shipment and final settlement with the customer. Receivables for previously recorded concentrate sales are adjusted to reflect estimated forward metals prices at the end of each period until final settlementcovered by the customer. We obtain the forward metals prices used each period from a pricing service. Changes in metal prices between shipment and final settlement result in changes to revenues previously recorded upon shipment. The embedded derivative contained in our concentrate sales is adjusted to fair market value through earnings each period prior to final settlement.
We use financially-settled forward contracts to manage exposure to changes in the exchange rate between the USD and CAD and MXN, and the impact on CAD- and MXN-denominated operating costs incurred at our Casa Berardi and San Sebastian units (see Note 11safe harbor provided for more information). These contracts qualify for hedge accounting, with unrealized gains and losses related to the effective portionunder Section 27A of the contracts included in accumulated other comprehensive loss,Securities Act of 1933, as amended, and unrealized gains and losses related to the ineffective portion of the contracts included in earnings each period. The fair value of each contract represents the present value of the difference between the forward exchange rate for the contract settlement period as of the measurement date and the contract settlement exchange rate.
We use financially-settled forward contracts to manage the exposure to changes in prices of silver, gold, zinc and lead contained in our concentrate shipments that have not reached final settlement. We also use financially-settled forward contracts to manage the exposure to changes in prices of zinc and lead contained in our forecasted future concentrate shipments (see Note 11 for more information). These contracts do not qualify for hedge accounting, and are marked-to-market through earnings each period. The fair value of each contract represents the present value of the difference between the forward metal price for the contract settlement period as of the measurement date and the contract settlement metal price.
Our Senior Notes issued in April 2013, which were recorded at their carrying value of $501.9 million, net of unamortized initial purchaser discount at September 30, 2017 of $4.6 million, had a fair value of $524.6 million at September 30, 2017. Quoted market prices, which we consider to be Level 1 inputs, are utilized to estimate fair values of the Senior Notes. See Note 9 for more information.
Note 13. Guarantor Subsidiaries
Presented below are Hecla’s unaudited interim condensed consolidating financial statements as required by Rule 3-10 of Regulation S-XSection 21E of the Securities Exchange Act of 1934, as amended, resultingamended. Our forward-looking statements include our current expectations and projections about future results, performance, results of litigation, prospects and opportunities, including reserves and other mineralization. We have tried to identify these forward-looking statements by using words such as “may,” “will,” “expect,” “anticipate,” “believe,” “intend,” “feel,” “plan,” “estimate,” “project,” “forecast” and similar expressions. These forward-looking statements are based on information currently available to us and are expressed in good faith and believed to have a reasonable basis. However, our forward-looking statements are subject to a number of risks, uncertainties and other factors that could cause our actual results, performance, prospects or opportunities to differ materially from the guaranteesthose expressed in, or implied by, certain of Hecla's subsidiaries (the "Guarantors") of the Senior Notes (see Note 9 for more information). The Guarantors consist of the following of Hecla's 100%-owned subsidiaries: Hecla Limited; Silver Hunter Mining Company; Rio Grande Silver, Inc.; Hecla MC Subsidiary, LLC; Hecla Silver Valley, Inc.; Burke Trading, Inc.; Hecla Montana, Inc.; Revett Silver Company; RC Resources, Inc.; Troy Mine Inc.; Revett Exploration, Inc.; Revett Holdings, Inc.; Mines Management, Inc.; Newhi Corp.; Montanore Minerals Corp.; Hecla Alaska LLC; Hecla Greens Creek Mining Company; Hecla Admiralty Company;these forward-looking statements.
These risks, uncertainties and Hecla Juneau Mining Company. We completed the initial offering of the Senior Notes on April 12, 2013, and a related exchange offer for virtually identical notes registered with the SEC on January 3, 2014.
The unaudited interim condensed consolidating financial statements below have been prepared from our financial information on the same basis of accounting as the unaudited interim condensed consolidated financial statementsother factors include, but are not limited to, those set forth elsewhereunder Part I, Item 1A. – Risk Factors in this report. Investments in the subsidiariesour 2023 Form 10-K. Given these risks and uncertainties, readers are accounted for under the equity method. Accordingly, the entries necessarycautioned not to consolidate Hecla, the Guarantors,place undue reliance on our forward-looking statements. All subsequent written and our non-guarantor subsidiaries are reflected in the intercompany eliminations column. In the course of preparing consolidated financialoral forward-looking statements we eliminate the effects of various transactions conducted between Hecla and its subsidiaries and among the subsidiaries. While valid at an individual subsidiary level, such activities are eliminated in consolidation because, when taken as a whole, they do not represent business activity with third-party customers, vendors, and other parties. Examples of such eliminations include the following:
| •
| Investments in subsidiaries. The acquisition of a company results in an investment in debt or equity capital on the records of the parent company and a contribution to debt or equity capital on the records of the subsidiary. Such investments and capital contributions are eliminated in consolidation.
|
| •
| Capital contributions. Certain of Hecla's subsidiaries do not generate cash flow, either at all or sufficient to meet their capital needs, and their cash requirements are routinely met with inter-company advances from their parent companies. On at least an annual basis, when not otherwise intended as debt, the boards of directors of such parent companies declare contributions of capital to their subsidiary companies, which increase the parents' investment and the subsidiaries' additional paid-in capital. In consolidation, investments in subsidiaries and related additional paid-in capital are eliminated.
|
| •
| Debt. Inter-company debt agreements have been established between certain of Hecla's subsidiaries and their parents. The related debt liability and receivable balances, accrued interest expense (if any) and income activity (if any), and payments of principal and accrued interest amounts (if any) by the subsidiary companies to their parents are eliminated in consolidation.
|
| •
| Dividends. Certain of Hecla's subsidiaries which generate cash flow routinely provide cash to their parent companies through inter-company transfers. On at least an annual basis, the boards of directors of such subsidiary companies declare dividends to their parent companies, which reduces the subsidiaries' retained earnings and increases the parents' dividend income. In consolidation, such activity is eliminated.
|
| •
| Deferred taxes. Our ability to realize deferred tax assets and liabilities is considered on a consolidated basis for subsidiaries within the United States, with all subsidiaries' estimated future taxable income contributing to the ability to realize all such assets and liabilities. However, when Hecla's subsidiaries are viewed independently, we use the separate return method to assess the realizability of each subsidiary's deferred tax assets and whether a valuation allowance is required against such deferred tax assets. In some instances, a parent company or subsidiary may possess deferred tax assets whose realization depends on the future taxable incomes of other subsidiaries on a consolidated-return basis, but would not be considered realizable if such parent or subsidiary filed on a separate stand-alone basis. In such a situation, a valuation allowance is assessed on that subsidiary's deferred tax assets, with the resulting adjustment reported in the eliminations column of the guarantor and parent's financial statements, as is the case in the unaudited interim financial statements set forth below. The separate return method can result in significant eliminations of deferred tax assets and liabilities and related income tax provisions and benefits. Non-current deferred tax asset balances are included in other non-current assets on the consolidating balance sheets and make up a large portion of that item, particularly for the guarantor balances.
|
Separate financial statements of the Guarantors are not presented because the guarantees by the Guarantors are joint and several and full and unconditional, except for certain customary release provisions, including: (1) the sale or disposal of all or substantially all of the assets of the Guarantor; (2) the sale or other disposition of the capital stock of the Guarantor; (3) the Guarantor is designated as an unrestricted entity in accordance with the applicable provisions of the indenture; (4) Hecla ceases to be a borrower as defined in the indenture; and (5) upon legal or covenant defeasance or satisfaction and discharge of the indenture.
Effective December 31, 2015, Hecla Limited (our wholly owned subsidiary) sold 100% of its ownership of Hecla Alaska LLC (its wholly owned subsidiary)attributable to Hecla Mining Company for consideration totaling approximately $240.8 million. The consideration consistedor to persons acting on our behalf are expressly qualified in their entirety by these cautionary statements. Except as required by federal securities laws, we do not intend to update or revise any forward-looking statements, whether as a result of satisfaction of inter-company debt between Hecla Limited and Hecla Mining Company and an obligation by Hecla Mining Company, under certain circumstances, to fund a limited amount of the capital requirements of Hecla Limited for up to five years. Hecla Alaska LLC owns a 29.7331% interest in the joint venture which owns the Greens Creek mine. The presentation of unaudited interim condensed consolidating financial statements below reflects the effective date for accounting purposes of January 1, 2016.new information, future events or otherwise.
Condensed Consolidating Balance Sheets
| | | As of September 30, 2017 | |
| | | Parent | | | Guarantors | | | Non-Guarantors | | | Eliminations | | | Consolidated | |
| | | (in thousands) | |
Assets | | | | | | | | | | | | | | | | | | | | |
Cash and cash equivalents | | $ | 101,061 | | | $ | 18,124 | | | $ | 53,738 | | | $ | — | | | $ | 172,923 | |
Other current assets | | | 47,514 | | | | 51,190 | | | | 40,283 | | | | (575 | ) | | | 138,412 | |
Properties, plants, and equipment - net | | | 1,964 | | | | 1,248,762 | | | | 774,881 | | | | — | | | | 2,025,607 | |
Intercompany receivable (payable) | | | 461,542 | | | | (222,677 | ) | | | (351,019 | ) | | | 112,154 | | | | — | |
Investments in subsidiaries | | | 1,491,449 | | | | — | | | | — | | | | (1,491,449 | ) | | | — | |
Other non-current assets | | | 6,321 | | | | 199,794 | | | | 6,906 | | | | (153,780 | ) | | | 59,241 | |
Total assets | | $ | 2,109,851 | | | $ | 1,295,193 | | | $ | 524,789 | | | $ | (1,533,650 | ) | | $ | 2,396,183 | |
Liabilities and Stockholders' Equity | | | | | | | | | | | | | | | | | | | | |
Current liabilities | | $ | 46,720 | | | $ | 56,189 | | | $ | 38,183 | | | $ | (25,295 | ) | | $ | 115,797 | |
Long-term debt | | | 501,917 | | | | 3,115 | | | | 4,321 | | | | — | | | | 509,353 | |
Non-current portion of accrued reclamation | | | — | | | | 61,964 | | | | 18,794 | | | | — | | | | 80,758 | |
Non-current deferred tax liability | | | — | | | | 13,349 | | | | 126,280 | | | | (16,906 | ) | | | 122,723 | |
Other non-current liabilities | | | 48,273 | | | | 5,363 | | | | 975 | | | | — | | | | 54,611 | |
Shareholders' equity | | | 1,512,941 | | | | 1,155,213 | | | | 336,236 | | | | (1,491,449 | ) | | | 1,512,941 | |
Total liabilities and stockholders' equity | | $ | 2,109,851 | | | $ | 1,295,193 | | | $ | 524,789 | | | $ | (1,533,650 | ) | | $ | 2,396,183 | |
| | | As of December 31, 2016 | |
| | | Parent | | | Guarantors | | | Non-Guarantors | | | Eliminations | | | Consolidated | |
| | | (in thousands) | |
Assets | | | | | | | | | | | | | | | | | | | | |
Cash and cash equivalents | | $ | 113,275 | | | $ | 24,388 | | | $ | 32,114 | | | $ | — | | | $ | 169,777 | |
Other current assets | | | 33,950 | | | | 52,400 | | | | 35,537 | | | | (573 | ) | | | 121,314 | |
Properties, plants, and equipment - net | | | 2,103 | | | | 1,258,890 | | | | 771,692 | | | | — | | | | 2,032,685 | |
Intercompany receivable (payable) | | | 404,121 | | | | (222,072 | ) | | | (307,018 | ) | | | 124,969 | | | | — | |
Investments in subsidiaries | | | 1,496,787 | | | | — | | | | — | | | | (1,496,787 | ) | | | — | |
Other non-current assets | | | 4,186 | | | | 199,957 | | | | 5,337 | | | | (161,579 | ) | | | 47,901 | |
Total assets | | $ | 2,054,422 | | | $ | 1,313,563 | | | $ | 537,662 | | | $ | (1,533,970 | ) | | $ | 2,371,677 | |
Liabilities and Stockholders' Equity | | | | | | | | | | | | | | | | | | | | |
Current liabilities | | $ | 22,401 | | | $ | 86,730 | | | $ | 40,093 | | | $ | (22,999 | ) | | $ | 126,225 | |
Long-term debt | | | 500,979 | | | | 3,065 | | | | 2,773 | | | | — | | | | 506,817 | |
Non-current portion of accrued reclamation | | | — | | | | 63,025 | | | | 16,902 | | | | — | | | | 79,927 | |
Non-current deferred tax liability | | | — | | | | 14,212 | | | | 122,855 | | | | (14,212 | ) | | | 122,855 | |
Other non-current liabilities | | | 51,198 | | | | 5,108 | | | | (325 | ) | | | 28 | | | | 56,009 | |
Stockholders' equity | | | 1,479,844 | | | | 1,141,423 | | | | 355,364 | | | | (1,496,787 | ) | | | 1,479,844 | |
Total liabilities and stockholders' equity | | $ | 2,054,422 | | | $ | 1,313,563 | | | $ | 537,662 | | | $ | (1,533,970 | ) | | $ | 2,371,677 | |
Condensed Consolidating Statements of Operations
| | | Three Months Ended September 30, 2017 | |
| | | Parent | | | Guarantors | | | Non-Guarantors | | | Eliminations | | | Consolidated | |
| | | (in thousands) | |
Revenues | | $ | (626 | ) | | $ | 61,887 | | | $ | 79,578 | | | $ | — | | | $ | 140,839 | |
Cost of sales | | | 687 | | | | (29,320 | ) | | | (39,725 | ) | | | — | | | | (68,358 | ) |
Depreciation, depletion, amortization | | | — | | | | (12,607 | ) | | | (16,237 | ) | | | — | | | | (28,844 | ) |
General and administrative | | | (4,217 | ) | | | (4,464 | ) | | | (848 | ) | | | — | | | | (9,529 | ) |
Exploration and pre-development | | | (129 | ) | | | (4,339 | ) | | | (4,544 | ) | | | — | | | | (9,012 | ) |
Research and development | | | — | | | | (1,130 | ) | | | — | | | | — | | | | (1,130 | ) |
Loss on derivative contracts | | | (11,226 | ) | | | — | | | | — | | | | — | | | | (11,226 | ) |
Foreign exchange gain (loss) | | | 12,153 | | | | — | | | | (16,917 | ) | | | — | | | | (4,764 | ) |
Lucky Friday suspension-related costs | | | — | | | | (4,780 | ) | | | — | | | | — | | | | (4,780 | ) |
Equity in earnings of subsidiaries | | | (6,271 | ) | | | — | | | | — | | | | 6,271 | | | | — | |
Other (expense) income | | | 11,041 | | | | 1,202 | | | | (4,676 | ) | | | (14,752 | ) | | | (7,185 | ) |
Income (loss) before income taxes | | | 1,412 | | | | 6,449 | | | | (3,369 | ) | | | (8,481 | ) | | | (3,989 | ) |
(Provision) benefit from income taxes | | | — | | | | (1,338 | ) | | | (8,013 | ) | | | 14,752 | | | | 5,401 | |
Net income (loss) | | | 1,412 | | | | 5,111 | | | | (11,382 | ) | | | 6,271 | | | | 1,412 | |
Preferred stock dividends | | | (138 | ) | | | — | | | | — | | | | — | | | | (138 | ) |
Income (loss) applicable to common shareholders | | | 1,274 | | | | 5,111 | | | | (11,382 | ) | | | 6,271 | | | | 1,274 | |
Net income (loss) | | | 1,412 | | | | 5,111 | | | | (11,382 | ) | | | 6,271 | | | | 1,412 | |
Changes in comprehensive income (loss) | | | 7,636 | | | | — | | | | 1,022 | | | | (1,022 | ) | | | 7,636 | |
Comprehensive income (loss) | | $ | 9,048 | | | $ | 5,111 | | | $ | (10,360 | ) | | $ | 5,249 | | | $ | 9,048 | |
| | | Nine Months Ended September 30, 2017 | |
| | | Parent | | | Guarantors | | | Non-Guarantors | | | Eliminations | | | Consolidated | |
| | | (in thousands) | |
Revenues | | $ | (3,912 | ) | | $ | 215,184 | | | $ | 206,390 | | | $ | — | | | $ | 417,662 | |
Cost of sales | | | 353 | | | | (112,908 | ) | | | (111,982 | ) | | | — | | | | (224,537 | ) |
Depreciation, depletion, amortization | | | — | | | | (41,875 | ) | | | (41,490 | ) | | | — | | | | (83,365 | ) |
General and administrative | | | (16,407 | ) | | | (10,877 | ) | | | (1,760 | ) | | | — | | | | (29,044 | ) |
Exploration and pre-development | | | (439 | ) | | | (8,736 | ) | | | (12,508 | ) | | | — | | | | (21,683 | ) |
Research and development | | | — | | | | (2,125 | ) | | | — | | | | — | | | | (2,125 | ) |
Loss on derivative contracts | | | (16,548 | ) | | | — | | | | — | | | | — | | | | (16,548 | ) |
Foreign exchange gain (loss) | | | 22,286 | | | | (43 | ) | | | (33,152 | ) | | | — | | | | (10,909 | ) |
Lucky Friday suspension-related costs | | | — | | | | (14,385 | ) | | | — | | | | — | | | | (14,385 | ) |
Equity in earnings of subsidiaries | | | (5,925 | ) | | | — | | | | — | | | | 5,925 | | | | — | |
Other (expense) income | | | 24,822 | | | | (1,207 | ) | | | (14,146 | ) | | | (38,682 | ) | | | (29,213 | ) |
Income (loss) before income taxes | | | 4,230 | | | | 23,028 | | | | (8,648 | ) | | | (32,757 | ) | | | (14,147 | ) |
(Provision) benefit from income taxes | | | — | | | | (9,239 | ) | | | (11,066 | ) | | | 38,682 | | | | 18,377 | |
Net income (loss) | | | 4,230 | | | | 13,789 | | | | (19,714 | ) | | | 5,925 | | | | 4,230 | |
Preferred stock dividends | | | (414 | ) | | | — | | | | — | | | | — | | | | (414 | ) |
Income (loss) applicable to common shareholders | | | 3,816 | | | | 13,789 | | | | (19,714 | ) | | | 5,925 | | | | 3,816 | |
Net income (loss) | | | 4,230 | | | | 13,789 | | | | (19,714 | ) | | | 5,925 | | | | 4,230 | |
Changes in comprehensive income (loss) | | | 13,718 | | | | — | | | | 1,780 | | | | (1,780 | ) | | | 13,718 | |
Comprehensive income (loss) | | $ | 17,948 | | | $ | 13,789 | | | $ | (17,934 | ) | | $ | 4,145 | | | $ | 17,948 | |
| | | Three Months Ended September 30, 2016 | |
| | | Parent | | | Guarantors | | | Non-Guarantors | | | Eliminations | | | Consolidated | |
| | | (in thousands) | |
Revenues | | $ | (4,072 | ) | | $ | 116,016 | | | $ | 67,449 | | | $ | — | | | $ | 179,393 | |
Cost of sales | | | — | | | | (58,844 | ) | | | (31,685 | ) | | | — | | | | (90,529 | ) |
Depreciation, depletion, amortization | | | — | | | | (19,036 | ) | | | (11,143 | ) | | | — | | | | (30,179 | ) |
General and administrative | | | (5,355 | ) | | | (5,469 | ) | | | (331 | ) | | | — | | | | (11,155 | ) |
Exploration and pre-development | | | (33 | ) | | | (1,343 | ) | | | (3,033 | ) | | | — | | | | (4,409 | ) |
Gain on derivative contracts | | | 7 | | | | — | | | | — | | | | — | | | | 7 | |
Acquisition costs | | | (1,766 | ) | | | 1 | | | | — | | | | — | | | | (1,765 | ) |
Equity in earnings of subsidiaries | | | 52,606 | | | | — | | | | — | | | | (52,606 | ) | | | — | |
Other expense | | | (15,597 | ) | | | 1,187 | | | | 1,211 | | | | 7,078 | | | | (6,121 | ) |
Income (loss) before income taxes | | | 25,790 | | | | 32,512 | | | | 22,468 | | | | (45,528 | ) | | | 35,242 | |
(Provision) benefit from income taxes | | | — | | | | (8,994 | ) | | | 6,621 | | | | (7,080 | ) | | | (9,453 | ) |
Net income (loss) | | | 25,790 | | | | 23,518 | | | | 29,089 | | | | (52,608 | ) | | | 25,789 | |
Preferred stock dividends | | | (138 | ) | | | — | | | | — | | | | — | | | | (138 | ) |
Income (loss) applicable to common shareholders | | | 25,652 | | | | 23,518 | | | | 29,089 | | | | (52,608 | ) | | | 25,651 | |
Net income (loss) | | | 25,790 | | | | 23,518 | | | | 29,089 | | | | (52,608 | ) | | | 25,789 | |
Changes in comprehensive income (loss) | | | (615 | ) | | | — | | | | 985 | | | | (985 | ) | | | (615 | ) |
Comprehensive income (loss) | | $ | 25,175 | | | $ | 23,518 | | | $ | 30,074 | | | $ | (53,593 | ) | | $ | 25,174 | |
| | | Nine Months Ended September 30, 2016 | |
| | | Parent | | | Guarantors | | | Non-Guarantors | | | Eliminations | | | Consolidated | |
| | | (in thousands) | |
Revenues | | $ | (15,866 | ) | | $ | 285,277 | | | $ | 212,301 | | | $ | — | | | $ | 481,712 | |
Cost of sales | | | — | | | | (154,160 | ) | | | (95,002 | ) | | | — | | | | (249,162 | ) |
Depreciation, depletion, amortization | | | — | | | | (49,521 | ) | | | (35,071 | ) | | | — | | | | (84,592 | ) |
General and administrative | | | (17,069 | ) | | | (13,671 | ) | | | (988 | ) | | | — | | | | (31,728 | ) |
Exploration and pre-development | | | (191 | ) | | | (3,990 | ) | | | (7,465 | ) | | | — | | | | (11,646 | ) |
Acquisition costs | | | (2,160 | ) | | | (7 | ) | | | — | | | | — | | | | (2,167 | ) |
Equity in earnings of subsidiaries | | | 68,727 | | | | — | | | | — | | | | (68,727 | ) | | | — | |
Other (expense) income | | | 15,844 | | | | 8,147 | | | | (43,039 | ) | | | (11,481 | ) | | | (30,529 | ) |
Income (loss) before income taxes | | | 49,285 | | | | 72,075 | | | | 30,736 | | | | (80,208 | ) | | | 71,888 | |
(Provision) benefit from income taxes | | | — | | | | (22,213 | ) | | | (11,871 | ) | | | 11,481 | | | | (22,603 | ) |
Net income (loss) | | | 49,285 | | | | 49,862 | | | | 18,865 | | | | (68,727 | ) | | | 49,285 | |
Preferred stock dividends | | | (414 | ) | | | — | | | | — | | | | — | | | | (414 | ) |
Income (loss) applicable to common shareholders | | | 48,871 | | | | 49,862 | | | | 18,865 | | | | (68,727 | ) | | | 48,871 | |
Net income (loss) | | | 49,285 | | | | 49,862 | | | | 18,865 | | | | (68,727 | ) | | | 49,285 | |
Changes in comprehensive income (loss) | | | 1,689 | | | | 8 | | | | 3,238 | | | | (3,246 | ) | | | 1,689 | |
Comprehensive income (loss) | | $ | 50,974 | | | $ | 49,870 | | | $ | 22,103 | | | $ | (71,973 | ) | | $ | 50,974 | |
Condensed Consolidating Statements of Cash Flows
| | | Nine Months Ended September 30, 2017 | |
| | | Parent | | | Guarantors | | | Non-Guarantors | | | Eliminations | | | Consolidated | |
| | | | | | | | | | | | | | | | | | | | | |
Cash flows from operating activities | | $ | 35,764 | | | $ | 41,071 | | | $ | 21,435 | | | $ | (24,155 | ) | | $ | 74,115 | |
Cash flows from investing activities: | | | | | | | | | | | | | | | | | | | | |
Additions to properties, plants, and equipment | | | — | | | | (28,220 | ) | | | (42,170 | ) | | | — | | | | (70,390 | ) |
Other investing activities, net | | | 176 | | | | 6,903 | | | | (584 | ) | | | (5,339 | ) | | | 1,156 | |
Cash flows from financing activities: | | | | | | | | | | | | | | | | | | | | |
Dividends paid to shareholders | | | (3,392 | ) | | | — | | | | — | | | | — | | | | (3,392 | ) |
Proceeds from (payments on) debt | | | — | | | | (4,518 | ) | | | (1,017 | ) | | | — | | | | (5,535 | ) |
Other financing activity, net | | | (44,762 | ) | | | (21,500 | ) | | | 42,909 | | | | 29,494 | | | | 6,141 | |
Effect of exchange rates on cash | | | — | | | | — | | | | 1,051 | | | | — | | | | 1,051 | |
Changes in cash and cash equivalents | | | (12,214 | ) | | | (6,264 | ) | | | 21,624 | | | | — | | | | 3,146 | |
Beginning cash and cash equivalents | | | 113,275 | | | | 24,388 | | | | 32,114 | | | | — | | | | 169,777 | |
Ending cash and cash equivalents | | $ | 101,061 | | | $ | 18,124 | | | $ | 53,738 | | | $ | — | | | $ | 172,923 | |
| | | Nine Months Ended September 30, 2016 | |
| | | Parent | | | Guarantors | | | Non-Guarantors | | | Eliminations | | | Consolidated | |
| | | (in thousands) | |
Cash flows from operating activities | | $ | 14,525 | | | $ | 51,599 | | | $ | 61,710 | | | $ | 45,280 | | | $ | 173,114 | |
Cash flows from investing activities: | | | | | | | | | | | | | | | | | | | | |
Additions to properties, plants, and equipment | | | (348 | ) | | | (71,265 | ) | | | (48,623 | ) | | | — | | | | (120,236 | ) |
Acquisitions of other companies, net of cash acquired | | | (3,931 | ) | | | | | | | — | | | | — | | | | (3,931 | ) |
Other investing activities, net | | | (24,696 | ) | | | (816 | ) | | | (3,647 | ) | | | — | | | | (29,159 | ) |
Cash flows from financing activities: | | | | | | | | | | | | | | | | | | | | |
Dividends paid to shareholders | | | (3,296 | ) | | | — | | | | — | | | | — | | | | (3,296 | ) |
Proceeds from (payments on) debt | | | — | | | | (7,477 | ) | | | (658 | ) | | | — | | | | (8,135 | ) |
Other financing activity, net | | | 33,335 | | | | 24,522 | | | | (8,926 | ) | | | (45,280 | ) | | | 3,651 | |
Effect of exchange rates on cash | | | — | | | | — | | | | 627 | | | | — | | | | 627 | |
Changes in cash and cash equivalents | | | 15,589 | | | | (3,437 | ) | | | 483 | | | | — | | | | 12,635 | |
Beginning cash and cash equivalents | | | 94,167 | | | | 42,692 | | | | 18,350 | | | | — | | | | 155,209 | |
Ending cash and cash equivalents | | $ | 109,756 | | | $ | 39,255 | | | $ | 18,833 | | | $ | — | | | $ | 167,844 | |
Item 2. Management's Discussion and Analysis of Financial Condition and Results of Operations
Certain statements contained inIn this Form 10-Q, including in Management’sManagement’s Discussion and Analysis of Financial Condition and Results of Operations (“MD&A”), “Hecla,” “the Company,” “we,” “us” and Quantitative“our” refer to Hecla Mining Company and Qualitative Disclosure About Market Risk,its consolidated subsidiaries, except where the context requires otherwise. You should read this discussion in conjunction with our consolidated financial statements, the related MD&A and the discussion of our Business and Properties in our 2023 Form 10-K filed with the United States Securities and Exchange Commission (the “SEC”). The results of operations reported and summarized below are intendednot necessarily indicative of future operating results (refer to be covered by“Forward-Looking Statements” above for further discussion). References to “Notes” are Notes included in our Notes to Condensed Consolidated Financial Statements (Unaudited). Throughout MD&A, all references to losses or income per share are on a diluted basis.
Overview
Established in 1891, we are the safe harbor provided for under Section 27Aoldest operating precious metals mining company in the United States. We are also the largest silver producer in the United States, producing over 45% of the Securities ActU.S. silver production at our Greens Creek and Lucky Friday operations. We also produce gold at our Casa Berardi and Greens Creek operations. In addition, we are developing the Keno Hill mine in the Yukon Territory, Canada which we acquired on September 7, 2022 and began ramp-up during the second quarter of 1933, as amended,2023. Based upon the jurisdictions in which we operate, we believe we have lower political and Section 21Eeconomic risk compared to other mining companies whose mines are located in other parts of the Securities Exchange Act of 1934, as amended.world. Our forward-looking statements include our current expectationsexploration interests are located in the United States, Canada and projections about future results, performance, results of litigation, prospectsMexico. Our operating and opportunities, including reserves and other mineralization. We have tried to identify these forward-looking statements by using words such as “may,” “will,” “expect,” “anticipate,” “believe,” “intend,” “feel,” “plan,” “estimate,” “project,” “forecast” and similar expressions. These forward-looking statements arestrategic framework is based on expanding our production and locating and developing new resource potential in a safe and responsible manner.
First Quarter 2024 Highlights
Operational:
•Produced 4.2 million ounces of silver and 36,592 ounces of gold. See Consolidated Results of Operations below for information currently availableon total cost of sales, as well as cash costs and all in sustaining costs, each after by-product credits, per silver and gold ounce for the three-month periods ended March 31, 2024 and 2023.
•Restarted Lucky Friday on January 9, 2024 and ramped up to usfull production in March producing 1.1 million ounces.
•Keno Hill produced 0.6 million ounces of silver as ramp-up of production continued during the quarter.
•Advanced the underground development at Keno Hill mine by 2,339 feet.
Financial:
•Generated sales of $189.5 million.
•Invested in our operations by making capital expenditures of approximately $47.6 million, including $8.8 million at Greens Creek, $15.0 million at Lucky Friday, $13.3 million at Casa Berardi and $10.3 million at Keno Hill.
•Collected $17.4 million in insurance proceeds related to the Lucky Friday fire.
•Returned $4.0 million to our stockholders through dividend payments.
•Spent $4.3 million on exploration and pre-development activities.
External Factors that Impact our Results
Our financial results vary as a result of fluctuations in market prices primarily for silver and gold and, to a lesser extent, zinc and lead. World market prices for these commodities have fluctuated historically and are expressedaffected by numerous factors beyond our control. Beginning in good faith2020, with the onset of the COVID-19 pandemic, and believed to havecontinuing in 2024 because of a reasonable basis. However, our forward-looking statementsseries of macro-economic factors, there has been significant volatility in the financial and commodities markets, including the precious metals market. We believe the outlook for precious metals fundamentals in the medium- and long-term are subject to a number of risks, uncertainties and other factors that could cause our actual results, performance, prospects or opportunities to differ materially from those expressedfavorable. See Item 1A. “Risk Factors” contained in or implied by, these forward-looking statements.
These risks, uncertainties and other factors include, but are not limited to, those set forth under Part I Item 1A. – Business – Risk Factors inof our annual report filed on Form 10-K for the year ended December 31, 2016. Given these risks2023 ("2023 Form 10-K"), for further discussion. Because we cannot control the price of our products, the key measures that management focuses on in operating our business are production volumes, payable sales volumes, Cash Cost, After By-product Credits, per Ounce (non-GAAP) and uncertainties, readers are cautioned notAll-In Sustaining Cost, After By-product Credits, per Ounce (“AISC”) (non-GAAP), operating cash flows, capital expenditures, free cash flow and adjusted EBITDA. The average realized prices for all metals sold by us continued to place undue relianceexhibit significant volatility period over period. We have also experienced significant cost inflation across our operations, principally associated with higher energy prices, increased costs for other consumables such as reagents, explosives and steel, and higher labor and contractor costs.
Consolidated Results of Operations
Total sales for the three months ended March 31, 2024 and 2023 were as follows:
| | | | | | | | |
| | Three Months Ended
March 31, | |
(in thousands) | | 2024 | | | 2023 | |
Silver | | $ | 86,233 | | | $ | 81,532 | |
Gold | | | 67,415 | | | | 75,087 | |
Lead | | | 19,483 | | | | 25,402 | |
Zinc | | | 24,964 | | | | 32,943 | |
Less: Smelter and refining charges | | | (13,014 | ) | | | (15,973 | ) |
Total metal sales | | | 185,081 | | | | 198,991 | |
Environmental remediation services | | | 4,447 | | | | 509 | |
Total sales | | $ | 189,528 | | | $ | 199,500 | |
Environmental remediation services revenue is generated by performing remediation work in the historical Yukon Territory mining district on our forward-looking statements. All subsequent writtenbehalf of the Canadian government. The scope of all work is agreed to in advance by the Canadian government, and oral forward-looking statements attributableit is essentially pass through in nature with minimal margin generated by the Company in performing this work.
Total metal sales for the three months ended March 31, 2024 and 2023, and the approximate variances attributed to Hecla Mining Company or to persons acting on our behalf are expressly qualifieddifferences in their entirety by these cautionary statements. Exceptmetals prices, sales volumes and smelter terms, were as required by federal securities laws, we do not intend to update or revise any forward-looking statements, whether as a result of new information, future events or otherwise.follows:
| | | | | | | | | | | | | | | | | | | | |
(in thousands) | | Silver | | | Gold | | | Base metals | | | Less: smelter and refining charges | | | Total sales of products | |
Three months ended March 31, 2023 | | $ | 81,532 | | | $ | 75,087 | | | $ | 58,345 | | | $ | (15,973 | ) | | $ | 198,991 | |
Variances - 2024 versus 2023: | | | | | | | | | | | | | | | |
Price | | | 7,474 | | | | 6,408 | | | | (7,345 | ) | | | — | | | | 6,537 | |
Volume | | | (2,773 | ) | | | (14,080 | ) | | | (6,553 | ) | | | 876 | | | | (22,530 | ) |
Smelter terms | | | — | | | | — | | | | — | | | | 2,083 | | | | 2,083 | |
Three months ended March 31, 2024 | | $ | 86,233 | | | $ | 67,415 | | | $ | 44,447 | | | $ | (13,014 | ) | | $ | 185,081 | |
Overview
Hecla Mining Company and our subsidiaries have provided precious and base metalsThe fluctuations in sales for the three months ended March 31, 2024 compared to the U.S. and worldwide since 1891. We discover, acquire, develop, produce and market silver, gold, lead and zinc.
We produce lead, zinc and bulk concentrates, which we sellsame period in 2023 were primarily due to custom smelters and brokers, and unrefined precipitate and bullion bars (doré) containing gold and silver, which are further refined before sale to precious metals traders. We are organized into four segments that encompass our operating and development units: Greens Creek, Lucky Friday, Casa Berardi, and San Sebastian. The map below shows the locations of our operating units, our exploration and pre-development projects, and our corporate offices located in Coeur d'Alene, Idaho and Vancouver, British Columbia.
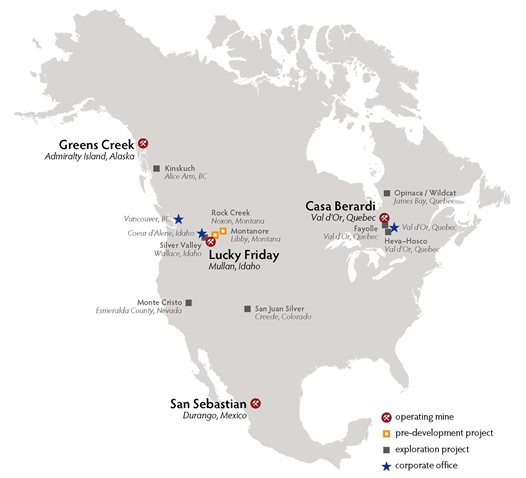
Our current business strategy is to focus our financial and human resources in the following areas:two reasons:
operating our properties safely, in an environmentally responsible manner, and cost-effectively;
continuing to optimize and improve operations at each of our units;
expanding our proven and probable reserves and production capacity at our operating properties;
conducting our business with financial stewardship to preserve our financial position in varying metals price environments;
advancing permitting of the Rock Creek and Montanore projects. We acquired Rock Creek as part of the acquisition of Revett Mining Company, Inc. ("Revett") in June 2015, and we acquired Montanore through the acquisition of Mines Management, Inc. ("Mines Management") in September 2016;
maintaining and investing in exploration and pre-development projects in the vicinities of six mining districts and projects we believe to be under-explored and under-invested: North Idaho's Silver Valley in the historic Coeur d'Alene Mining District; our Greens Creek unit on Alaska's Admiralty Island located near Juneau; the silver-producing district near Durango, Mexico; the Abitibi region of northwestern Quebec, Canada; the Rock Creek and Montanore projects in northwestern Montana; and the Creede district of Southwestern Colorado; and
continuing to seek opportunities to acquire or invest in mining properties and companies.
A number of key factors may impact the execution of our strategy, including regulatory issues and metals prices. MetalsHigher average realized prices can be very volatile. As discussed in the Critical Accounting Estimates section below, metals prices are influenced by a number of factors beyond our control. Average market prices offor silver and gold were slightlypartially offset by lower withaverage realized prices for lead and zinc higher, induring the first ninethree months of 2017ended March 31, 2024, compared to the same period last year, as illustrated by theperiods in 2023.The table in Results of Operations below. While we believe current global economicbelow summarizes spot prices and industrial trends could result in continued demandour realized prices for the metalscommodities we produce,sell:
| | | | | | | | | | |
| | | | Three Months Ended
March 31, | |
| | | | 2024 | | | 2023 | |
Silver – | | London PM Fix ($/ounce) | | $ | 23.36 | | | $ | 22.56 | |
| | Realized price per ounce | | $ | 24.77 | | | $ | 22.62 | |
Gold – | | London PM Fix ($/ounce) | | $ | 2,072 | | | $ | 1,889 | |
| | Realized price per ounce | | $ | 2,094 | | | $ | 1,902 | |
Lead – | | LME Final Cash Buyer ($/pound) | | $ | 0.94 | | | $ | 0.97 | |
| | Realized price per pound | | $ | 0.97 | | | $ | 1.02 | |
Zinc – | | LME Final Cash Buyer ($/pound) | | $ | 1.11 | | | $ | 1.42 | |
| | Realized price per pound | | $ | 1.10 | | | $ | 1.39 | |
Average realized prices have been volatiletypically differ from average market prices primarily because concentrate sales are generally recorded as revenues at the time of shipment at forward prices for the estimated month of settlement, which differ from average market prices. Due to the time elapsed between shipment of concentrates and there can be no assurance that currentfinal settlement with the customers, we must estimate the prices will continue.
The total principal amountat which sales of our Senior Notes due May 1, 2021 is $506.5metals will be settled. Previously recorded sales are adjusted to estimated settlement metals prices each period through final settlement.We recorded net positive price adjustments to provisional settlements of $3.5 million and they bear interest at a rate of 6.875% per year. The net proceeds from the Senior Notes were primarily used$2.1 million for the acquisitionthree months ended March 31, 2024, and 2023, respectively. The price adjustments related to silver, gold, zinc and lead contained in our concentrate shipments were partially offset by gains and losses on forward contracts for those metals. See Note 8 of Aurizon in June 2013 (see Note 9 of Notes to Condensed Consolidated Financial Statements (Unaudited)). As discussed in the Financial Liquidity and Capital Resources section below, we believe that we will be able to meet the obligations associated with the Senior Notes; however, a number of factors could impact our ability to meet the debt obligations and fund our other projects. In June 2017, we announced a private offering under Rule 144A of $500 million in Senior Notes due 2025 and a concurrent tender offer to purchase our existing Senior Notes. Both the private offering of the notes and the tender offer were abandoned in June 2017, as available terms and conditions were not sufficiently attractive to us to complete the proposed transactions. Our ability to restructure or refinance our debt will depend on the condition of capital markets and our financial condition at such time. Any refinancing of our debt could be at higher interest rates and may require us to comply with more onerous covenants, which could further restrict our business operations. There can be no assurance that we will be able to restructure or refinance our debt in the future on terms and conditions favorable to us.
On June 15, 2015, we completed the acquisition of Revett, giving us 100% ownership of the Rock Creek project, a significant undeveloped silver and copper deposit in northwestern Montana. In addition, on September 13, 2016, we completed the acquisition of Mines Management, giving us 100% ownership of the Montanore project, another significant undeveloped silver and copper deposit located approximately 10 miles from our Rock Creek project. Development of Rock Creek and Montanore has been challenged by conservation groups at various times, and there can be no assurance that we will be able to obtain the permits required to develop these projects. See Legal challenges could prevent the Rock Creek or Montanore projects from ever being developed in Part I, Item 1A. – Risk Factors in our annual report filed on Form 10-K for the year ended December 31, 2016 for more information. In May 2017,The gains and losses on these contracts are included in revenues and impact the Montana Federal District Court issued Opinionsrealized prices for silver, gold, lead and Orders in three lawsuits challenging previously granted environmental approvalszinc. Realized prices are calculated by dividing gross revenues for each metal (which include the Montanore project. The Orders overturnedprice adjustments and gains and losses on the approvals for the project grantedforward contracts discussed above) by the United States Forest Servicepayable quantities of each metal included in concentrate, doré and carbon material shipped during the United States Fish and Wildlife Service, and remanded the Record of Decision ("ROD") and associated planning documents for further review by the agencies consistent with its Opinions. In June 2017, the Court vacated the agencies' approvals for the project. As a result, additional work must be performed by the agencies to address the deficiencies in the ROD and associated planning documents identified by the Court, and new approvals must be granted, before the project may proceed beyond certain preliminary actions.period.
As further discussed in the Lucky Friday Segment section below, the union employees at Lucky Friday have been on strike since March 13, 2017. Production at Lucky Friday was suspended from the start of the strike until July 2017, with limited production by salary employees commencing at that time. We cannot predict how long the strike will last or whether an agreement will be reached. We expect to incur cash expenditures of approximately $1.0 million to $1.5 million per month to advance engineering and infrastructure for the restart of full production, in addition to costs related to limited interim production. As a result of the strike or other related events, operations at Lucky Friday could continue to be disrupted, which could adversely affect our financial condition and results of operations.
During the third quarter of 2015, we made a development decision to mine near surface, high grade portions of silver and gold deposits at our San Sebastian project in Mexico. Ore production commenced in the fourth quarter of 2015 and has continued since that time. In addition, work began in the first quarter of 2017 to develop and rehabilitate underground access which is expected to allow us to mine deeper portions of the deposits at San Sebastian. See the San Sebastian Segment section below for more information. We have generated positive cash flows at San Sebastian since the start of production there, and we currently believe that will continue until early or mid-2020. However, our ability to generate positive cash flows at San Sebastian may be impacted by changes in costs, precious metals prices, or other factors, and there can be no assurance that we will be able to develop and operate San Sebastian as currently anticipated.
•Lower quantities of Contents
We strive to operate our properties safely, in an environmentally responsible manner and as cost-effectively as possible. We seek to achieve safe and environmentally sound practices through extensive employee training in safe work practices; establishing, following and improving safety standards withall metals sold during the active participation of employees; investigating accidents, incidents and losses to avoid recurrence; and participation in the National Mining Association’s CORESafety program. We attempt to implement reasonable best practices for mine safety and emergency preparedness. Additionally, we work with the U.S. Mine Safety and Health Administration (“MSHA”) to address issues outlined in inspections and investigations, and continually evaluate our safety practices.
Another challenge for us is the risk associated with environmental litigation and ongoing reclamation activities. As described in Part I, Item 1A. – Risk Factors of our annual report filed on Form 10-K for the yearthree months ended DecemberMarch 31, 2016 and Note 4 of Notes to Condensed Consolidated Financial Statements (Unaudited), it is possible that our estimate of these liabilities (and our ability to estimate liabilities in general) may change in the future, affecting our strategic plans. We are involved in various environmental legal matters and the estimate of our environmental liabilities and liquidity needs, as wells as our strategic plans, may be significantly impacted as a result of these matters or new matters that may arise. We strive to ensure that our activities are conducted in compliance with applicable laws and regulations and attempt to resolve environmental litigation on as favorable terms as possible.
Results of Operations
Sales of products by metal for the three- and nine-month periods ended September 30, 2017 and 2016 were as follows:
| | | Three Months Ended
September 30, | | | Nine Months Ended
September 30, | |
(in thousands) | | 2017 | | | 2016 | | | 2017 | | | 2016 | |
Silver | | $ | 43,228 | | | $ | 83,668 | | | $ | 140,662 | | | $ | 211,825 | |
Gold | | | 73,603 | | | | 67,534 | | | | 203,279 | | | | 203,455 | |
Lead | | | 6,373 | | | | 17,141 | | | | 28,093 | | | | 46,194 | |
Zinc | | | 24,327 | | | | 27,469 | | | | 74,692 | | | | 67,840 | |
Less: Smelter and refining charges | | | (6,692 | ) | | | (16,419 | ) | | | (29,064 | ) | | | (47,602 | ) |
Sales of products | | $ | 140,839 | | | $ | 179,393 | | | $ | 417,662 | | | $ | 481,712 | |
The $38.6 million and $64.1 million decreases in sales of products in the third quarter and first nine months of 2017, respectively,2024 compared to the same periods of 2016 arein 2023. This was primarily due to:to lower gold production and related sales at Casa Berardi, partially offset by sales from Keno Hill during the quarter following production commencing in the second quarter of 2023. See The Greens Creek Segment,The Lucky Friday Segment, The Keno Hill Segment, and Casa Berardi Segment sections below for more information on metal production and sales volumes at each of our operating segments. Total metals production and sales volumes for each period are shown in the following table:
| | | | | | | | | | |
| | | | Three Months Ended
March 31, | |
| | | | 2024 | | | 2023 | |
Silver - | | Ounces produced | | | 4,192,098 | | | | 4,041,878 | |
| | Payable ounces sold | | | 3,481,884 | | | | 3,604,494 | |
Gold - | | Ounces produced | | | 36,592 | | | | 39,717 | |
| | Payable ounces sold | | | 32,189 | | | | 39,473 | |
Lead - | | Tons produced | | | 11,922 | | | | 13,236 | |
| | Payable tons sold | | | 10,020 | | | | 12,513 | |
Zinc - | | Tons produced | | | 16,389 | | | | 15,795 | |
| | Payable tons sold | | | 11,322 | | | | 11,858 | |
| •
| Lower quantities of silver, zinc and lead sold, due to lower production of those metals and the timing of concentrate shipments at Greens Creek, partially offset by higher gold volumes. See the The Greens Creek Segment,The Lucky Friday Segment, The Casa Berardi Segment, and The San Sebastian Segment sections below for more information on metal production and sales volumes at each of our operating segments. Total metals production and sales volumes for each period are shown in the following table:
|
| | | | Three Months Ended
September 30, | | | Nine Months Ended
September 30, | |
| | | | 2017 | | | 2016 | | | 2017 | | | 2016 | |
Silver - | Ounces produced | | | 3,323,157 | | | | 4,316,663 | | | | 9,500,058 | | | | 13,200,765 | |
| | Payable ounces sold | | | 2,540,817 | | | | 4,284,842 | | | | 8,098,652 | | | | 12,222,084 | |
Gold - | Ounces produced | | | 63,046 | | | | 52,126 | | | | 171,720 | | | | 170,779 | |
| | Payable ounces sold | | | 57,380 | | | | 50,348 | | | | 161,921 | | | | 161,217 | |
Lead - | Tons produced | | | 5,370 | | | | 10,411 | | | | 18,426 | | | | 31,840 | |
| | Payable tons sold | | | 2,936 | | | | 9,967 | | | | 13,612 | | | | 28,380 | |
Zinc - | Tons produced | | | 14,497 | | | | 14,825 | | | | 43,000 | | | | 50,321 | |
| | Payable tons sold | | | 8,444 | | | | 13,596 | | | | 29,269 | | | | 37,948 | |
The difference between what we report as "ounces/“ounces/tons produced"produced” and "payable“payable ounces/tons sold"sold” is attributable to the difference between the quantities of metals contained in the concentrates we produce versus the portion of those metals actually paid for by our customers according to the terms of our sales contracts. Differences can also arise from inventory changes incidental to shipping schedules, or variances in ore grades which impact the amount of metals contained in concentrates produced and sold. The difference in payable quantities sold for the 2017 periods compared to 2016 is due mainly to timing of concentrate shipments, primarily at Greens Creek.
Lower average silver and gold prices, partially offset by higher lead and zinc prices, in the third quarter of 2017 compared to the same period in 2016. For the first nine months of 2017, average silver and gold prices varied slightly, while average lead and zinc prices were higher, compared to the same period of 2016. These price variances are illustrated in the table below.
| | | | Three Months Ended
September 30, | | | Nine Months Ended
September 30, | |
| | | | 2017 | | | 2016 | | | 2017 | | | 2016 | |
Silver – | London PM Fix ($/ounce) | | $ | 16.83 | | | $ | 19.62 | | | $ | 17.17 | | | $ | 17.08 | |
| | Realized price per ounce | | $ | 17.01 | | | $ | 19.53 | | | $ | 17.37 | | | $ | 17.33 | |
Gold – | London PM Fix ($/ounce) | | $ | 1,278 | | | $ | 1,335 | | | $ | 1,251 | | | $ | 1,258 | |
| | Realized price per ounce | | $ | 1,283 | | | $ | 1,341 | | | $ | 1,255 | | | $ | 1,262 | |
Lead – | LME Final Cash Buyer ($/pound) | | $ | 1.06 | | | $ | 0.85 | | | $ | 1.02 | | | $ | 0.81 | |
| | Realized price per pound | | $ | 1.09 | | | $ | 0.86 | | | $ | 1.03 | | | $ | 0.81 | |
Zinc – | LME Final Cash Buyer ($/pound) | | $ | 1.34 | | | $ | 1.02 | | | $ | 1.26 | | | $ | 0.89 | |
| | Realized price per pound | | $ | 1.44 | | | $ | 1.01 | | | $ | 1.28 | | | $ | 0.89 | |
Average realized prices typically differ from average market prices primarily because concentrate sales are generally recorded as revenues at the time of shipment at forward prices for the estimated month of settlement, which differ from average market prices. Due to the time elapsed between shipment of concentrates and final settlement with the customers, we must estimate the prices at which sales of our metals will be settled. Previously recorded sales are adjusted to estimated settlement metals prices each period through final settlement. For the third quarter and first nine months of 2017, we recorded net positive price adjustments to provisional settlements of $1.2 million and $0.6 million, respectively, compared to negative price adjustments to provisional settlements of $1.1 million and positive price adjustments of $0.4 million, respectively, in the third quarter and first nine months of 2016. The price adjustments related to silver, gold, lead and zinc contained in our concentrate shipments were largely offset by gains and losses on forward contracts for those metals for each period (see Note 11 of Notes to Condensed Consolidated Financial Statements (Unaudited) for more information). The gains and losses on these contracts are included in revenues and impact the realized prices for silver, gold, lead and zinc. Realized prices are calculated by dividing gross revenues for each metal (which include the price adjustments and gains and losses on the forward contracts discussed above) by the payable quantities of each metal included in concentrate and doré shipped during the period.
For the third quarter and first nine months of 2017, we recorded income applicable to common shareholders of $1.3 million ($0.00 per basic common share) and $3.8 million ($0.01 per basic common share), respectively, compared to $25.7 million ($0.07 per basic common share) and $48.9 million ($0.13 per basic common share), respectively, for the third quarter and first nine months of 2016. The following factors impacted the results for the third quarter and first nine months of 2017 compared to the same periods in 2016:
| •
| Lower gross profit for the third quarter and first nine months of 2017 compared to the same periods in 2016 at our San Sebastian unit by $0.9 million and $13.8 million, respectively; Lucky Friday unit by $6.5 million and $8.0 million, respectively; and Greens Creek unit by $8.3 million and $1.3 million, respectively. Gross profit for the first nine months of 2017 was also lower at our Casa Berardi unit compared to 2016 by $15.2 million; however, it was higher by $0.6 million for the third quarter of 2017 compared to the same period of 2016. See The Greens Creek Segment,The Lucky Friday Segment, The Casa Berardi Segment, and The San Sebastian Segment sections below.
|
| •
| Losses on base metal derivatives contracts of $11.2 million and $16.5 million, respectively, in the third quarter and first nine months of 2017, with no net activity on base metal derivative contracts for the third quarter and first nine months of 2016. See Note 11 of Notes to Condensed Consolidated Financial Statements (Unaudited) for more information.
|
Lucky Friday suspension costs of $4.8 million and $14.4 million in the third quarter and first nine months of 2017, respectively. These costs, which include $1.1 million and $3.3 million in non-cash depreciation expense, were incurred during the suspension of full production resulting from the strike, which started in March 2017.
Higher interest expense by $3.8 million and $11.8 million in the third quarter and first nine months of 2017, respectively, compared to the same periods of 2016. Interest expense in the first nine months of 2017 and 2016 was net of $0.9 million and $12.0 million, respectively, in capitalized interest primarily related to the #4 Shaft project, with the decrease due to completion of the #4 Shaft in January 2017. In addition, interest expense for the nine months ended September 30, 2017 included $0.9 million in costs related to our proposed private offering of new Senior Notes in June 2017 and concurrent tender offer to purchase our existing Senior Notes, which were not completed.
Exploration and pre-development expense increased by $4.6 million and $10.0 million, respectively, in the third quarter and first nine months of 2017 compared to the same periods in 2016. In 2017, we have continued exploration work at our Greens Creek, San Sebastian and Casa Berardi units, and at our other projects in Quebec, Canada. "Pre-development expense" is defined as costs incurred in the exploration stage that may ultimately benefit production, such as underground ramp development, which are expensed due to the lack of proven and probable reserves. Pre-development expense of $1.8 million and $4.1 million in the third quarter and first nine months of 2017, respectively, was related to advancement of our Montanore and Rock Creek projects.
Net foreign exchange losses in the third quarter and first nine months of 2017 of $4.8 million and $10.9 million, respectively, versus a net gain of $2.4 million in the third quarter of 2016 and net loss of $7.7 million in the first nine months of 2016. The variances are primarily related to the impact of changes in the CAD-to-USD exchange rate on the remeasurement of our net monetary liabilities in Quebec. During the first nine months of 2017, the applicable CAD-to-USD exchange rate decreased from 1.3426 to 1.2480, compared to a decrease in the rate from 1.3841 to 1.3116 during the first nine months of 2016.
Research and development expense of $1.1 million and $2.1 million in the third quarter and first nine months of 2017, respectively, related to evaluation and development of technologies that would be new to our operations.
Lower general and administrative expense by $1.6 million and $2.7 million, respectively, for the third quarter and first nine months of 2017 compared to the same periods of 2016 primarily due to lower accruals for incentive compensation.
Gain on disposal of properties, plants, equipment and mineral interests of $4.8 million recognized in the third quarter of 2017 primarily related to insurance proceeds received for collapse of the mill building at the Troy mine in February 2017 due to snow.
| •
| Income tax benefits of $5.4 million and $18.4 million, in the third quarter and first nine months of 2017, respectively, compared to provisions of $9.5 million of $22.6 million, respectively, in the comparable 2016 periods. The benefit for the first nine months of 2017 includes a benefit from a change in income tax position recognized in the first quarter of 2017 relating to the timing of deduction for #4 Shaft development costs at Lucky Friday. See Corporate Matters below for more information.
|
The Greens Creek Segment
Dollars are in thousands (except per ounce and per ton amounts) | | Three Months Ended
September 30, | | | Nine Months Ended
September 30, | |
| | | 2017 | | | 2016 | | | 2017 | | | 2016 | |
Sales | | $ | 61,061 | | | $ | 85,804 | | | $ | 191,250 | | | $ | 199,260 | |
Cost of sales and other direct production costs | | | (29,320 | ) | | | (42,306 | ) | | | (100,799 | ) | | | (106,238 | ) |
Depreciation, depletion and amortization | | | (12,607 | ) | | | (16,091 | ) | | | (39,442 | ) | | | (40,746 | ) |
Cost of sales and other direct production costs and depreciation, depletion and amortization | | | (41,927 | ) | | | (58,397 | ) | | | (140,241 | ) | | | (146,984 | ) |
Gross profit | | $ | 19,134 | | | $ | 27,407 | | | $ | 51,009 | | | $ | 52,276 | |
Tons of ore milled | | | 219,983 | | | | 202,523 | | | | 627,900 | | | | 610,879 | |
Production: | | | | | | | | | | | | | | | | |
Silver (ounces) | | | 2,344,315 | | | | 2,445,328 | | | | 6,205,659 | | | | 7,020,688 | |
Gold (ounces) | | | 12,563 | | | | 11,988 | | | | 39,289 | | | | 39,497 | |
Zinc (tons) | | | 14,325 | | | | 12,144 | | | | 40,697 | | | | 42,330 | |
Lead (tons) | | | 4,851 | | | | 4,803 | | | | 14,080 | | | | 15,236 | |
Payable metal quantities sold: | | | | | | | | | | | | | | | | |
Silver (ounces) | | | 1,569,092 | | | | 2,603,165 | | | | 4,930,946 | | | | 6,370,660 | |
Gold (ounces) | | | 7,862 | | | | 12,364 | | | | 30,920 | | | | 35,883 | |
Zinc (tons) | | | 8,445 | | | | 11,318 | | | | 27,582 | | | | 31,370 | |
Lead (tons) | | | 2,935 | | | | 4,710 | | | | 10,015 | | | | 12,580 | |
Ore grades: | | | | | | | | | | | | | | | | |
Silver ounces per ton | | | 13.65 | | | | 15.40 | | | | 12.84 | | | | 14.61 | |
Gold ounces per ton | | | 0.09 | | | | 0.09 | | | | 0.10 | | | | 0.10 | |
Zinc percent | | | 7.47 | | | | 6.86 | | | | 7.49 | | | | 7.90 | |
Lead percent | | | 2.77 | | | | 2.92 | | | | 2.83 | | | | 3.05 | |
Mining cost per ton | | $ | 69.46 | | | $ | 69.66 | | | $ | 69.64 | | | $ | 69.20 | |
Milling cost per ton | | $ | 31.01 | | | $ | 31.55 | | | $ | 32.38 | | | $ | 31.07 | |
Total Cash Cost, After By-product Credits, Per Silver Ounce (1) | | $ | (0.15 | ) | | $ | 4.80 | | | $ | 0.73 | | | $ | 4.68 | |
All-In Sustaining Costs ("AISC"), After By-Product Credits, per Silver Ounce (1) | | $ | 4.47 | | | $ | 11.02 | | | $ | 5.60 | | | $ | 10.18 | |
| (1)
| A reconciliation of these non-GAAP measures toSales, total cost of sales, and other direct production costs and depreciation, depletion and amortization, the most comparable GAAP measure, can be found below in Reconciliation of Cost of Sales and Other Direct Production Costs and Depreciation, Depletion and Amortization (GAAP) to Cash Cost, Before By-product Credits and Cash Cost, After By-product Credits (non-GAAP) and All-In Sustaining Cost, Before By-product Credits and All-In Sustaining Cost, After By-product Credits (non-GAAP).
|
The $8.3 million and $1.3 million decreases in gross profit during the third quarter and first nine months of 2017, respectively, compared to the same 2016 periods were primarily a result of lower metals sales volumes due to the timing of concentrate shipments and lower silver ore grades and recoveries, partially offset by higher mill throughput. As a result of differences in the timing of shipments, there were 13,822 tons of concentrate in inventory, including 5,991 tons of higher-valued lead concentrate, having a value of approximately $26.1 million and cost of $15.2 million at September 30, 2017, compared to 3,617 tons (including 1,355 tons of lead concentrate) having a value of approximately $4.7 million and cost of $3.9 million at September 30, 2016. Results for the third quarter of 2017 were also impacted by lower average realized prices for silver and gold, partially offset by higher prices for zinc and lead, compared to the third quarter of 2016. For the first nine months of 2017, silver and gold prices varied only slightly, while prices for zinc and lead were higher, compared to 2016. Gross profit at Greens Creek was affected by positive price adjustments to revenues of $1.0 million and $0.5 million for the third quarter and first nine months of 2017, respectively, compared to negative price adjustments of $1.0 million and positive price adjustments of $0.3 million for the third quarter and first nine months of 2016, respectively. Price adjustments to revenues result from changes in metals prices between transfer of title of concentrates to buyers and final settlements during the period. The price adjustments related to silver, gold, zinc and lead contained in concentrate shipments were net of gains and losses on forward contracts for those metals for each period. The price adjustments and gains and losses on forward contracts discussed above are included in sales.
Mining costs per ton stayed relatively constant for the third quarter and first nine months of 2017 compared to the same periods in 2016. Milling costs per ton decreased 2% in the third quarter of 2017 compared to the same period in 2016 mainly due to higher tonnage. Milling costs per ton increased 4% for the first nine months of 2017 compared to the same period in 2016 due to an increase in power costs, partially offset by higher tonnage.
The chart below illustrates the factors contributing to the variances in Cash Cost, After By-product Credits, Per Silver Ounce for the third quarter and first nine months of 2017 versus the same periods in 2016:
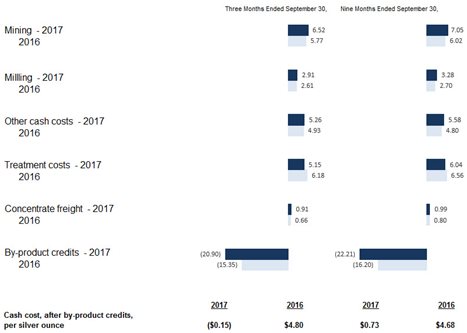
The following table summarizes the components of(loss), Cash Cost, After By-product Credits, per Silver Ounce:Ounce (“Cash Cost”) (non-GAAP) and AISC (non-GAAP) at our operating units for the three months ended March 31, 2024 and 2023 were as follows (in thousands, except for Cash Cost and AISC):
| | | | | | | | | | | | | | | | | | | | | | | | | | | | |
| | Silver | | | Gold and Other | |
| | Greens Creek | | | Lucky Friday | | | Keno Hill | | | Total Silver (2) | | | Casa Berardi | | | Other (3) | | | Total Gold and Other | |
Three Months Ended March 31, 2024: | | | | | | | | | | | | | | | | | | | | | |
Sales | | $ | 97,310 | | | $ | 35,340 | | | $ | 10,847 | | | $ | 143,497 | | | $ | 41,584 | | | $ | 4,447 | | | $ | 46,031 | |
Total cost of sales | | | (69,857 | ) | | | (27,519 | ) | | | (10,847 | ) | | | (108,223 | ) | | | (58,260 | ) | | $ | (3,885 | ) | | | (62,145 | ) |
Gross profit (loss) | | $ | 27,453 | | | $ | 7,821 | | | $ | — | | | $ | 35,274 | | | $ | (16,676 | ) | | $ | 562 | | | $ | (16,114 | ) |
Cash Cost (1) | | $ | 3.45 | | | $ | 8.85 | | | $ | — | | | $ | 4.78 | | | $ | 1,669 | | | $ | — | | | $ | 1,669 | |
AISC (1) | | $ | 7.16 | | | $ | 17.36 | | | $ | — | | | $ | 13.10 | | | $ | 1,899 | | | $ | — | | | $ | 1,899 | |
Three Months Ended March 31, 2023: | | | | | | | | | | | | | | | | | | | | | |
Sales | | $ | 98,611 | | | $ | 49,110 | | | $ | — | | | $ | 147,721 | | | $ | 50,998 | | | $ | 781 | | | $ | 51,779 | |
Total cost of sales | | | (66,288 | ) | | | (34,534 | ) | | | — | | | | (100,822 | ) | | | (62,998 | ) | | | (732 | ) | | | (63,730 | ) |
Gross profit (loss) | | $ | 32,323 | | | $ | 14,576 | | | $ | — | | | $ | 46,899 | | | $ | (12,000 | ) | | $ | 49 | | | $ | (11,951 | ) |
Cash Cost (1) | | $ | 1.16 | | | $ | 4.30 | | | $ | — | | | $ | 2.14 | | | $ | 1,775 | | | $ | — | | | $ | 1,775 | |
AISC (1) | | $ | 3.82 | | | $ | 10.69 | | | $ | — | | | $ | 8.96 | | | $ | 2,392 | | | $ | — | | | $ | 2,392 | |
| | | Three Months Ended
September 30, | | | Nine Months Ended
September 30, | |
| | | 2017 | | | 2016 | | | 2017 | | | 2016 | |
Cash Cost, Before By-product Credits, per Silver Ounce | | $ | 20.75 | | | $ | 20.15 | | | $ | 22.94 | | | $ | 20.88 | |
By-product credits | | | (20.90 | ) | | | (15.35 | ) | | | (22.21 | ) | | | (16.20 | ) |
Cash Cost, After By-product Credits, per Silver Ounce | | $ | (0.15 | ) | | $ | 4.80 | | | $ | 0.73 | | | $ | 4.68 | |
The following table summarizesthese non-GAAP measures to total cost of sales, the componentsmost comparable GAAP measure, can be found below in Reconciliation of AISC, AfterTotal Cost of Sales (GAAP) to Cash Cost, Before By-product Credits per Silver Ounce:
| | | Three Months Ended September 30, | | | Nine Months Ended September 30, | |
| | | 2017 | | | 2016 | | | 2017 | | | 2016 | |
AISC, Before By-product Credits, per Silver Ounce | | $ | 25.37 | | | $ | 26.37 | | | $ | 27.81 | | | $ | 26.38 | |
By-product credits | | | (20.90 | ) | | | (15.35 | ) | | | (22.21 | ) | | | (16.20 | ) |
AISC, After By-product Credits, per Silver Ounce | | $ | 4.47 | | | $ | 11.02 | | | $ | 5.60 | | | $ | 10.18 | |
The decrease inand Cash Cost, After By-product Credits per Silver Ounce(non-GAAP) and All-In Sustaining Cost, Before By-product Credits and All-In Sustaining Cost, After By-product Credits (non-GAAP).
(2)The calculation of AISC for our consolidated silver properties includes corporate costs for general and administrative expense and sustaining capital.
(3)For the three months ended March 31, 2024, Other includes $4.4 million of sales and $3.9 million, of total cost of sales, from our environmental remediation services in the Yukon compared to $0.5 million of sales and $0.4 million of total cost of sales for the third quarter and first ninethree months of 2017 was primarily the result of higher by-product credits, partially offset by lower silver production. The decrease in AISC, After By-Product Credits, per Silver Ounce was due to the same factors, along with lower capital spending.ended March 31, 2023.
Mining and milling costs increased in the third quarter and first nine months of 2017 compared to 2016 on a per-ounce basis due primarily to lower silver production resulting from reduced silver grades.
Other cash costs per ounce for the third quarter and first nine months of 2017 were higher compared to 2016 due to the effect of lower silver production.
Treatment costs were lower in the third quarter and first nine months of 2017 compared to 2016 as a result of improved payment terms from smelters, partially offset by lower silver production. Treatment costs were also impacted by silver price variances, as treatment costs include the value of silver not payable to us through the smelting process. The silver not payable to us is either recovered by the smelters through further processing or ultimately not recovered and included in the smelters' waste material.
By-product credits per ounce were higher in the third quarter and first nine months of 2017 compared to 2016 due to higher zinc and lead prices.
The difference between what we report as "production" and "payable metal quantities sold" is attributable to the difference between the quantities of metals contained in the concentrates we produce versus the portion of those metals actually paid for by our customers according to the terms of our sales contracts. Differences can also arise from inventory changes incidental to shipping schedules, or variances in ore grades which impact the amount of metals contained in concentrates produced and sold. The difference in payable quantities sold for 2017 compared to 2016 is due mainly to timing of concentrate shipments.
While revenue from zinc, lead and gold by-products is significant, we believe that identification of silver as the primary product of the Greens Creek, unitLucky Friday and Keno Hill is appropriate because:
•
silver has historically accounted for a higher proportion of revenue than any other metal and is expected to do so in the future;
•
we have historically presented the Greens Creek and Lucky Friday units as a producer primarily ofprimary silver producers, based on the original analysis that justified putting the project into production, and the same analysis applies to the Keno Hill unit. Further we believe that consistency in disclosure is important to our investors regardless of the relationships of metals prices and production from year to year;
•
metallurgical treatment maximizes silver recovery;
•
the Greens Creek, deposit is aLucky Friday and Keno Hill deposits are massive sulfide depositdeposits containing an unusually high proportion of silver; and
•
in most of itstheir working areas, Greens Creek, utilizesLucky Friday and Keno Hill utilize selective mining methods in which silver is the metal targeted for highest recovery.
Likewise,Accordingly, we believe the identification of gold, lead and zinc as by-product credits at Greens Creek, Lucky Friday and Keno Hill is appropriate because of their lower economic value compared to silver and due to the fact that silver is the primary product we intend to produce.produce at those locations. In addition, we dohave not receiveconsistently received sufficient revenue from any single by-product metal to warrant classification of such as a co-product.
We periodically review our revenues to ensure that reporting of primary products and by-products is appropriate. Because for Greens Creek, Lucky Friday and Keno Hill we consider zinc, lead and gold to be by-products of our silver production, the values of these metals offset operating costs within our calculations of Cash Cost, After By-product Credits, per Silver Ounce and AISC, After By-product Credits, per Silver Ounce.
The Lucky Friday Segment
Dollars are in thousands (except per ounce and per ton amounts) | | Three Months Ended
September 30, | | | Nine Months Ended
September 30, | |
| | | 2017 | | | 2016 | | | 2017 | | | 2016 | |
Sales | | $ | 199 | | | $ | 26,140 | | | $ | 20,022 | | | $ | 70,152 | |
Cost of sales and other direct production costs | | | — | | | | (16,538 | ) | | | (12,109 | ) | | | (47,921 | ) |
Depreciation, depletion and amortization | | | — | | | | (2,946 | ) | | | (2,433 | ) | | | (8,775 | ) |
Cost of sales and other direct production costs and depreciation, depletion and amortization | | | — | | | | (19,484 | ) | | | (14,542 | ) | | | (56,696 | ) |
Gross profit (loss) | | $ | 199 | | | $ | 6,656 | | | $ | 5,479 | | | $ | 13,456 | |
Tons of ore milled | | | 7,302 | | | | 74,397 | | | | 64,371 | | | | 216,247 | |
Production: | | | | | | | | | | | | | | | | |
Silver (ounces) | | | 88,298 | | | | 887,364 | | | | 769,080 | | | | 2,721,991 | |
Lead (tons) | | | 519 | | | | 5,608 | | | | 4,346 | | | | 16,604 | |
Zinc (tons) | | | 172 | | | | 2,681 | | | | 2,303 | | | | 7,991 | |
Payable metal quantities sold: | | | | | | | | | | | | | | | | |
Silver (ounces) | | | — | | | | 829,364 | | | | 641,004 | | | | 2,617,130 | |
Lead (tons) | | | — | | | | 5,257 | | | | 3,596 | | | | 15,800 | |
Zinc (tons) | | | — | | | | 2,279 | | | | 1,688 | | | | 6,578 | |
Ore grades: | | | | | | | | | | | | | | | | |
Silver ounces per ton | | | 12.87 | | | | 12.40 | | | | 12.45 | | | | 13.05 | |
Lead percent | | | 7.68 | | | | 7.89 | | | | 7.12 | | | | 8.01 | |
Zinc percent | | | 3.21 | | | | 3.85 | | | | 3.90 | | | | 3.94 | |
Mining cost per ton | | $ | 150.89 | | | $ | 99.13 | | | $ | 112.60 | | | $ | 99.27 | |
Milling cost per ton | | $ | 13.15 | | | $ | 25.99 | | | $ | 22.93 | | | $ | 24.77 | |
Cash Cost, After By-product Credits, per Silver Ounce (1) | | $ | 11.60 | | | $ | 9.07 | | | $ | 6.58 | | | $ | 9.34 | |
AISC, After By-product Credits, per Silver Ounce (1) | | $ | 13.37 | | | $ | 20.22 | | | $ | 12.21 | | | $ | 21.35 | |
| (1)
| A reconciliation of these non-GAAP measures to cost of sales and other direct production costs and depreciation, depletion and amortization, the most comparable GAAP measure, can be found below in Reconciliation of Cost of Sales and Other Direct Production Costs and Depreciation, Depletion and Amortization (GAAP) to Cash Cost, Before By-product Credits and Cash Cost, After By-product Credits (non-GAAP) and All-In Sustaining Cost, Before By-product Credits and All-In Sustaining Cost, After By-product Credits (non-GAAP).
|
Gross profit decreased by $6.5 million and $8.0 million in the third quarter and first nine months of 2017, respectively, compared to the same periods in 2016. The $0.2 million in sales reported for the third quarter of 2017 represents gains on base metal derivatives contracts. Although there was limited concentrate production during the third quarter of 2017, we have opted to defer shipments until a later period. There were 1,489 tons of concentrate in inventory at September 30, 2017. The variance in gross profit for the first nine months of 2017 was primarily due to reduced metal production resulting from the strike by unionized employees starting in mid-March 2017, discussed further below, and the lack of concentrate shipments during the third quarter. Silver and lead production was also impacted by lower ore grades in the first quarter of 2017. These factors were partially offset by higher average realized silver, lead and zinc prices realized during the first quarter of 2017, prior to the strike.
Mining cost per ton was higher by 13% in the first nine months of 2017 compared to the same periods in 2016 due primarily to lower tonnage as a result of the strike discussed below. Milling cost per ton was lower by 7% in the first nine months of 2017 compared to 2016. Mining and milling cost per ton for the third quarter of 2017 are not indicative of future operating results under full production, as there was reduced mill throughput during the quarter. The mill was idle for most of the third quarter of 2017, and only operated when the limited mine production provided a sufficient ore stockpile. In addition, costs not directly related to mining and processing ore have been classified as suspension costs during the strike period, and excluded from the calculations of mining and milling cost per ton for the third quarter and first nine months of 2017.
The chart below illustrates the factors contributing to the variances in Cash Cost, After By-product Credits, Per Silver Ounce for the third quarter and first nine months of 2017 compared to the same periods of 2016:

The following table summarizes the components of Cash Cost, After By-product Credits, per Silver Ounce:
| | | Three Months Ended
September 30, | | | Nine Months Ended
September 30, | |
| | | 2017 | | | 2016 | | | 2017 | | | 2016 | |
Cash Cost, Before By-product Credits, per Silver Ounce | | $ | 27.44 | | | $ | 24.26 | | | $ | 23.42 | | | $ | 22.63 | |
By-product credits | | | (15.84 | ) | | | (15.19 | ) | | | (16.84 | ) | | | (13.29 | ) |
Cash Cost, After By-product Credits, per Silver Ounce | | $ | 11.60 | | | $ | 9.07 | | | $ | 6.58 | | | $ | 9.34 | |
The following table summarizes the components of AISC, After By-product Credits, per Silver Ounce:
| | | Three Months Ended September 30, | | | Nine Months Ended September 30, | |
| | | 2017 | | | 2016 | | | 2017 | | | 2016 | |
AISC, Before By-product Credits, per Silver Ounce | | $ | 29.21 | | | $ | 35.41 | | | $ | 29.05 | | | $ | 34.64 | |
By-product credits | | | (15.84 | ) | | | (15.19 | ) | | | (16.84 | ) | | | (13.29 | ) |
AISC, After By-product Credits, per Silver Ounce | | $ | 13.37 | | | $ | 20.22 | | | $ | 12.21 | | | $ | 21.35 | |
The increase in Cash Cost, After By-product Credits, per Silver Ounce in the third quarter was the result of lower silver production due to the strike. The decrease in Cash Cost, After By-product Credits, per Silver Ounce for the first nine months of 2017 compared to the same period in 2016 was due to higher by-product credits due to higher lead and zinc prices, partially offset by lower silver production. The decrease in AISC, After By-product Credits, per Silver Ounce in the third quarter and first nine months of 2017 was the result of lower capital costs primarily as a result of completion of the #4 Shaft project in January 2017 and higher by-product credits, partially offset by lower silver production. During the strike period, only costs directly related to the limited production are included in the calculations of Cash Cost, After By-product Credits and AISC, After By-product Credits, per Silver Ounce, and suspension-related costs are excluded from those calculations.
Similar to the Greens Creek segment, the difference between what we report as “production” and “payable metal quantities sold” is due to the difference between the quantities of metals contained in the concentrates we produce versus the portion of those metals actually paid for by our customers according to the terms of our sales contracts.
While value from lead and zinc is significant, we believe that identification of silver as the primary product of the Lucky Friday unit is appropriate because:
silver has historically accounted for a higher proportion of revenue than any other metal and is expected to do so in the future;
the Lucky Friday unit is situated in a mining district long associated with silver production; and
the Lucky Friday unit generally utilizes selective mining methods to target silver production.
Likewise, we believe the identification of lead and zinc as by-product credits is appropriate because of their lower economic value compared to silver and due to the fact that silver is the primary product we intend to produce. In addition, we do not receive sufficient revenue from any single by-product metal to warrant classification of such as a co-product.
We periodically review our revenues to ensure that reporting of primary products and by-products is appropriate. Because we consider zinc and lead to be by-products of our silver production, the values of these metals offset operating costs within our calculations of Cash Cost, After By-product Credits, per Silver Ounce.
Many of the employees at our Lucky Friday unit are represented by a union, and the most recent collective bargaining agreement with the union expired on April 30, 2016. On February 19, 2017, the unionized employees voted against our contract offer. On March 13, 2017, the unionized employees went on strike, and have been on strike since that time. Production at Lucky Friday was suspended from the start of the strike, until limited production by salary personnel commenced in July 2017. Suspension costs during the strike totaled $3.7 million and $11.1 million in the third quarter and first nine months of 2017, respectively. These costs are combined with non-cash depreciation expense of $1.1 million and $3.3 million for those periods and reported in a separate line item on our condensed consolidated statement of operations. These suspension costs are excluded from the calculation of gross profit, Cash Cost, After By-product Credits, per Silver Ounce and AISC, After By-product Credits, per Silver Ounce. We cannot predict how long the strike will last or whether an agreement will be reached. As a result of the strike or other related events, operations at Lucky Friday could continue to be disrupted, which could adversely affect our financial condition and results of operations.
See Note 4 of Notes to Condensed Consolidated Financial Statements (Unaudited) for contingencies related to various events occurring at the Lucky Friday mine in prior periods.
The Casa Berardi Segment
Dollars are in thousands (except per ounce and per ton amounts) | | Three Months Ended
September 30, | | | Nine Months Ended
September 30, | |
| | | 2017 | | | 2016 | | | 2017 | | | 2016 | |
Sales | | $ | 53,990 | | | $ | 41,131 | | | $ | 139,524 | | | $ | 126,614 | |
Cost of sales and other direct production costs | | | (32,999 | ) | | | (25,830 | ) | | | (95,288 | ) | | | (74,076 | ) |
Depreciation, depletion and amortization | | | (15,596 | ) | | | (10,465 | ) | | | (39,454 | ) | | | (32,563 | ) |
Cost of sales and other direct production costs and depreciation, depletion and amortization | | | (48,595 | ) | | | (36,295 | ) | | | (134,742 | ) | | | (106,639 | ) |
Gross profit (loss) | | $ | 5,395 | | | $ | 4,836 | | | $ | 4,782 | | | $ | 19,975 | |
Tons of ore milled | | | 326,145 | | | | 258,100 | | | | 949,946 | | | | 693,288 | |
Production: | | | | | | | | | | | | | | | | |
Gold (ounces) | | | 44,141 | | | | 31,949 | | | | 113,209 | | | | 104,282 | |
Silver (ounces) | | | 9,659 | | | | 8,361 | | | | 26,681 | | | | 24,034 | |
Payable metal quantities sold: | | | | | | | | | | | | | | | | |
Gold (ounces) | | | 42,053 | | | | 30,769 | | | | 111,046 | | | | 100,960 | |
Silver (ounces) | | | 8,725 | | | | 9,076 | | | | 26,952 | | | | 24,506 | |
Ore grades: | | | | | | | | | | | | | | | | |
Gold ounces per ton | | | 0.153 | | | | 0.141 | | | | 0.137 | | | | 0.172 | |
Silver ounces per ton | | | 0.03 | | | | 0.04 | | | | 0.03 | | | | 0.04 | |
Mining cost per ton | | $ | 82.95 | | | $ | 92.17 | | | $ | 81.95 | | | $ | 90.53 | |
Milling cost per ton | | $ | 16.19 | | | $ | 18.07 | | | $ | 16.28 | | | $ | 18.88 | |
Cash Cost, After By-product Credits, per Gold Ounce (1) | | $ | 750 | | | $ | 915 | | | $ | 858 | | | $ | 750 | |
AISC, After By-product Credits, per Gold Ounce (1) | | $ | 1,091 | | | $ | 1,442 | | | $ | 1,226 | | | $ | 1,243 | |
| (1)
| A reconciliation of these non-GAAP measures to cost of sales and other direct production costs and depreciation, depletion and amortization, the most comparable GAAP measure, can be found below in Reconciliation of Cost of Sales and Other Direct Production Costs and Depreciation, Depletion and Amortization (GAAP) to Cash Cost, Before By-product Credits and Cash Cost, After By-product Credits (non-GAAP) and All-In Sustaining Cost, Before By-product Credits and All-In Sustaining Cost, After By-product Credits (non-GAAP).
|
Gross profit increased by $0.6 million and decreased by $15.2 million for the third quarter and first nine months of 2017, respectively, compared to the same periods in 2016. The increase for the third quarter was primarily due to increased gold production due to higher ore throughput and gold grades, partially offset by lower gold prices. The decrease in gross profit for the first nine months of 2017 compared to 2016 was primarily due to lower ore grades and higher stripping costs in the first half of the year, partially offset by higher ore throughput. The lower grades were due to the addition of production from the East Mine Crown Pillar ("EMCP") pit, which commenced in July 2016, and underground mine sequencing. The increase in ore throughput was also a result of the addition of the EMCP pit. Grades improved in the third quarter of 2017 as higher-grade areas of the underground mine become available for production, and we expect the higher grades to continue in the fourth quarter of 2017.
Mining costs per ton were lower by 10% and 9% and milling unit costs decreased by 10% and 14% in the third quarter and first nine months of 2017, respectively, compared to the same periods in 2016 due primarily to higher ore production.
The chart below illustrates the factors contributing to Cash Cost, After By-product Credits, Per Gold Ounce for the third quarter and first nine months of 2017 and 2016:

The following table summarizes the components of Cash Cost, After By-product Credits, per Gold Ounce:
| | | Three Months Ended
September 30, | | | Nine Months Ended
September 30, | |
| | | 2017 | | | 2016 | | | 2017 | | | 2016 | |
Cash Cost, Before By-product Credits, per Gold Ounce | | $ | 754 | | | $ | 920 | | | $ | 862 | | | $ | 754 | |
By-product credits | | | (4 | ) | | | (5 | ) | | | (4 | ) | | | (4 | ) |
Cash Cost, After By-product Credits, per Gold Ounce | | $ | 750 | | | $ | 915 | | | $ | 858 | | | $ | 750 | |
The following table summarizes the components of AISC, After By-product Credits, per Gold Ounce:
| | | Three Months Ended September 30, | | | Nine Months Ended September 30, | |
| | | 2017 | | | 2016 | | | 2017 | | | 2016 | |
AISC, Before By-product Credits, per Gold Ounce | | $ | 1,095 | | | $ | 1,447 | | | $ | 1,230 | | | $ | 1,247 | |
By-product credits | | | (4 | ) | | | (5 | ) | | | (4 | ) | | | (4 | ) |
AISC, After By-product Credits, per Gold Ounce | | $ | 1,091 | | | $ | 1,442 | | | $ | 1,226 | | | $ | 1,243 | |
The decrease in Cash Cost, After By-product Credits, per Gold Ounce for the third quarter of 2017 compared to the same period of 2016 was primarily due to higher gold production. AISC, After By-product Credits, per Gold Ounce was also lower in the third quarter of 2017 compared to the third quarter of 2016 due to the higher gold production, along with lower capital spending. The increase in Cash Cost, After By-product Credits, per Gold Ounce for the first nine months of 2017 compared to 2016 was primarily the result of higher stripping costs in the first half of the year, partially offset by higher gold production. AISC, After By-product Credits, per Gold Ounce was lower for the first nine months of 2017 compared to 2016 due to lower capital spending and higher gold production, partially offset by the increased stripping in the first half of the year.
The difference between what we report as "production" and "payable metal quantities sold" is mainly attributable to inventory changes incidental to the timing of sales of refined metals and shipping schedules.
We believe the identification of silver as a by-product credit is appropriate at Casa Berardi because of its lower economic value compared to gold and due to the fact that gold is the primary product we intend to produce there. In addition, we do not receive sufficient revenue from silver at the Casa Berardi to warrant classification of such as a co-product. Because we consider silver to be a by-product of our gold production at Casa Berardi, the value of silver offsets operating costs within our calculations of Cash Cost, After By-product Credits, per Gold Ounce.
The San Sebastian Segment
Dollars are in thousands (except per ounce and per ton amounts) | | Three Months Ended September 30, | | | Nine Months Ended September 30, | |
| | | 2017 | | | 2016 | | | 2017 | | | 2016 | |
Sales | | $ | 25,589 | | | $ | 26,318 | | | $ | 66,866 | | | $ | 85,686 | |
Cost of sales and other direct production costs | | | (6,039 | ) | | | (5,855 | ) | | | (16,341 | ) | | | (20,927 | ) |
Depreciation, depletion and amortization | | | (641 | ) | | | (677 | ) | | | (2,036 | ) | | | (2,508 | ) |
Cost of sales and other direct production costs and depreciation, depletion and amortization | | | (6,680 | ) | | | (6,532 | ) | | | (18,377 | ) | | | (23,435 | ) |
Gross profit | | $ | 18,909 | | | $ | 19,786 | | | $ | 48,489 | | | $ | 62,251 | |
Tons of ore milled | | | 36,482 | | | | 40,192 | | | | 111,623 | | | | 108,750 | |
Production: | | | | | | | | | | | | | | | | |
Silver (ounces) | | | 880,885 | | | | 975,610 | | | | 2,498,638 | | | | 3,434,052 | |
Gold (ounces) | | | 6,342 | | | | 8,189 | | | | 19,222 | | | | 27,000 | |
Payable metal quantities sold: | | | | | | | | | | | | | | | | |
Silver (ounces) | | | 963,000 | | | | 843,238 | | | | 2,499,750 | | | | 3,209,788 | |
Gold (ounces) | | | 7,465 | | | | 7,215 | | | | 19,955 | | | | 24,374 | |
Ore grades: | | | | | | | | | | | | | | | | |
Silver ounces per ton | | | 25.48 | | | | 25.77 | | | | 23.71 | | | | 33.70 | |
Gold ounces per ton | | | 0.18 | | | | 0.22 | | | | 0.18 | | | | 0.27 | |
Mining cost per ton | | $ | 35.69 | | | $ | 59.49 | | | $ | 38.70 | | | $ | 83.31 | |
Milling cost per ton | | $ | 69.42 | | | $ | 66.88 | | | $ | 66.64 | | | $ | 68.52 | |
Cash Cost, After By-product Credits, per Silver Ounce (1) | | $ | (3.12 | ) | | $ | (4.03 | ) | | $ | (3.23 | ) | | $ | (3.40 | ) |
AISC, After By-product Credits, per Silver Ounce (1) | | $ | (0.83 | ) | | $ | (2.39 | ) | | $ | (0.14 | ) | | $ | (2.25 | ) |
| (1)
| A reconciliation of these non-GAAP measures to cost of sales and other direct production costs and depreciation, depletion and amortization, the most comparable GAAP measure, can be found below in Reconciliation of Cost of Sales and Other Direct Production Costs and Depreciation, Depletion and Amortization (GAAP) to Cash Cost, Before By-product Credits and Cash Cost, After By-product Credits (non-GAAP) and All-In Sustaining Cost, Before By-product Credits and All-In Sustaining Cost, After By-product Credits (non-GAAP).
|
The $0.9 million decrease in gross profit for the third quarter of 2017 compared to the third quarter of 2016 was primarily due to lower silver and gold production and prices. The reduction in silver and gold production was a result of lower ore throughput and grades. The $13.8 million decrease in gross profit for the first nine months of 2017 compared to the same period in 2016 was primarily due to lower silver and gold production as a result of lower ore grades, partially offset by higher ore throughput. The ore processed in the first half of 2016 had considerably higher grades than anticipated over the mine life.
The chart below illustrates the factors contributing to Cash Cost, After By-product Credits, Per Silver Ounce for the third quarter and first nine months of 2017 and 2016:
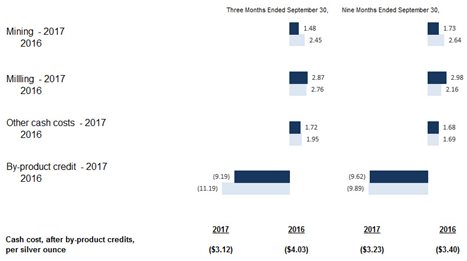
The following table summarizes the components of Cash Cost, After By-product Credits, per Silver Ounce:
| | | Three Months Ended
September 30, | | | Nine Months Ended
September 30, | |
| | | 2017 | | | 2016 | | | 2017 | | | 2016 | |
Cash Cost, Before By-product Credits, per Silver Ounce | | $ | 6.07 | | | $ | 7.16 | | | $ | 6.39 | | | $ | 6.49 | |
By-product credits | | | (9.19 | ) | | | (11.19 | ) | | | (9.62 | ) | | | (9.89 | ) |
Cash Cost, After By-product Credits, per Silver Ounce | | $ | (3.12 | ) | | $ | (4.03 | ) | | $ | (3.23 | ) | | $ | (3.40 | ) |
The following table summarizes the components of AISC, After By-product Credits, per Silver Ounce:
| | | Three Months Ended September 30, | | | Nine Months Ended September 30, | |
| | | 2017 | | | 2016 | | | 2017 | | | 2016 | |
AISC, Before By-product Credits, per Silver Ounce | | $ | 8.36 | | | $ | 8.80 | | | $ | 9.48 | | | $ | 7.64 | |
By-product credits | | | (9.19 | ) | | | (11.19 | ) | | | (9.62 | ) | | | (9.89 | ) |
AISC, After By-product Credits, per Silver Ounce | | $ | (0.83 | ) | | $ | (2.39 | ) | | $ | (0.14 | ) | | $ | (2.25 | ) |
The increase in Cash Cost, After By-product Credits, per Silver Ounce in the third quarter and first nine months of 2017 compared to the same periods of 2016 was primarily the result of lower by-product credits due to lower gold production and prices, partially offset by lower mining costs as a result of reduced mining of waste and the impact of lower silver production on the calculation. The same factors, along with higher exploration and capital spending, resulted in the increases in AISC, After By-product Credits, per Silver Ounce for the third quarter and first nine months of 2017 compared to 2016.
The difference between what we report as "production" and "payable metal quantities sold" is mainly attributable to inventory changes incidental to the timing of sales of refined metals and shipping schedules.
We believe the identification of gold as a by-product credit is appropriate at San Sebastian because of its anticipated lower economic value compared to silver over the life of the mine. In addition, we do not receive sufficient revenue from gold at San Sebastian to warrant classification of such as a co-product. Because we consider gold to be a by-product of our silver production at San Sebastian, the value of gold offsets operating costs within our calculations of Cash Cost, After By-product Credits, per Silver Ounce and AISC, After By-product Credits, per SilverGold Ounce. In addition
We reported a net loss applicable to common stockholders of $5.9 million for the three months ended March 31, 2024, compared to a net loss applicable to common stockholders of $3.3 million in the comparable period in 2023. The following were the significant drivers of changes in net loss applicable to common stockholders compared to 2023:
•Consolidated gross profit decreased by $15.8 million. See The Greens Creek Segment,The Lucky Friday Segment, The Keno Hill Segment, and The Casa Berardi Segment sections below for a discussion on the key drivers by operating unit.
•Ramp-up and suspension costs increased by $3.2 million primarily due to $2.2 million related to the
impactsuspension of
operations at Lucky Friday prior to the
by-product credits from gold, Cash Cost, After By-product Credits, per Silver Ounce and AISC, After By-product Credits, per silver Ounce at San Sebastian are lower compared to our otherrestart of operations
on January 9, 2024 due to the
orebody being near surface and having higher precious metal grades, resulting in a lower Cash Cost, Before By-product Credits, per Silver Ounce and AISC, After By-product Credits, per Silver Ounce.In the first quarter of 2017, we began construction of a new underground ramp and rehabilitation of the historical underground access. Once completed, these underground accesses should allow us to mine deeper portions of the deposits at San Sebastian, and we anticipate underground ore production to beginfire that occurred in the first#2 shaft and $8.7 million of Keno Hill ramp-up activities following the Alexco acquisition, partially offset by a reduction of care and maintenance costs at our non-operating sites.
•Other operating income (expense) increased by $16.9 million primarily due to the $17.4 million of insurance proceeds received during the quarter of 2018. Capital costs related to the underground development are expectedLucky Friday fire.
•Fair value adjustments, net losses increased by $5.0 million primarily due to higher unrealized losses on undesignated derivative contracts of $2.9 million and higher unrealized losses on our marketable equity securities portfolio of $2.1 million than in the comparable period in 2023.
•Net foreign exchange gain increased by $3.9 million to $4.0 million reflecting the continued strengthening of the US dollar against the Canadian dollar impact, and related impact on the revaluation of our Canadian monetary assets and liabilities.
Greens Creek
| | | | | | | | |
Dollars are in thousands (except per ounce and per ton amounts) | | Three Months Ended
March 31, | |
| | 2024 | | | 2023 | |
Sales | | $ | 97,310 | | | $ | 98,611 | |
Cost of sales and other direct production costs | | | (55,414 | ) | | | (51,824 | ) |
Depreciation, depletion and amortization | | | (14,443 | ) | | | (14,464 | ) |
Total cost of sales | | | (69,857 | ) | | | (66,288 | ) |
Gross profit | | $ | 27,453 | | | $ | 32,323 | |
Tons of ore milled | | | 232,188 | | | | 233,167 | |
Production: | | | | | | |
Silver (ounces) | | | 2,478,594 | | | | 2,772,860 | |
Gold (ounces) | | | 14,588 | | | | 14,885 | |
Lead (tons) | | | 4,834 | | | | 5,202 | |
Zinc (tons) | | | 13,062 | | | | 12,482 | |
Payable metal quantities sold: | | | | | | |
Silver (ounces) | | | 2,090,449 | | | | 2,292,035 | |
Gold (ounces) | | | 12,186 | | | | 12,646 | |
Lead (tons) | | | 3,670 | | | | 4,156 | |
Zinc (tons) | | | 9,564 | | | | 9,244 | |
Ore grades: | | | | | | |
Silver ounces per ton | | | 13.3 | | | | 14.4 | |
Gold ounces per ton | | | 0.09 | | | | 0.08 | |
Lead percent | | | 2.6 | % | | | 2.6 | % |
Zinc percent | | | 6.3 | % | | | 6.0 | % |
Total production cost per ton | | $ | 212.92 | | | $ | 198.60 | |
Cash Cost, After By-product Credits, per Silver Ounce (1) | | $ | 3.45 | | | $ | 1.16 | |
AISC, After By-Product Credits, per Silver Ounce (1) | | $ | 7.16 | | | $ | 3.82 | |
Capital additions | | $ | 8,827 | | | $ | 6,658 | |
(1)A reconciliation of these non-GAAP measures to total approximately $5.0 millioncost of sales, the most comparable GAAP measure, can be found below in 2017.Corporate Matters
Employee Benefit Plans
Our defined benefit pension plans provide a significant benefit to our employees, but also represent a significant liability to us. The liability recorded for the funded status
Reconciliation of our plans was $43.9 million and $44.9 million as of September 30, 2017 and December 31, 2016, respectively. We made cash contributions to our defined benefit plans of $1.2 million in April 2017 and $5.7 million in July 2017. While the economic variables which will determine future funding requirements are uncertain, we expect contributions to continue to be required in future years under current plan provisions, and we periodically examine the plans for affordability and competitiveness. See Note 7 of Notes to Condensed Consolidated Financial Statements (Unaudited) for more information.Income Taxes
The income tax expense for the three- and nine-month periods ended September 30, 2017 has been computed using a discrete effective tax rate method. We have historically calculated the provision for income taxes during interim reporting periods by applying an estimate of the annual effective tax rate ("AETR") for the full fiscal year to “ordinary” pretax income or loss (excluding unusual or infrequently occurring discrete items) for the reporting period. However, small changes to estimated annual “ordinary” pre-tax income cause significant volatility to the estimated AETR, due to near break-even levels of pre-tax income and significant permanent differences in the U.S. and Canada. Therefore, we determined that the AETR method would not provide a reliable estimate for the fiscal three- and nine-month periods ended September 30, 2017. As a result of this change in method, an amount representing a recovery of income tax expense reported in the first and second quarters was recorded in this period.
Each reporting period we assess our deferred tax assets utilizing long-range forecasts to provide reasonable assurance that they will be realized through future earnings. We continue to have a net deferred tax asset in the U.S. and a net deferred tax liability in Canada.
Our U.S. net deferred tax asset at September 30, 2017 totaled $44.7 million, or 2% of total assets, an increase of $8.9 million from the $35.8 million net deferred tax asset at December 31, 2016. The largest component of the deferred tax asset is net operating loss carryforwards. The next largest component is reclamation costs. We have previously determined that we are an indefinite AMT taxpayer, resulting in additional valuation allowance primarily related to forecasted utilization of regular net operating loss carryforwards and the effect of re-measuring temporary deferred tax assets using a tax rate of 20% which differed from the previous rate of 35%. During the fourth quarter of 2016, we determined that we were eligible to take a different income tax position relating to the timing of deductions for #4 Shaft development costs at Lucky Friday. We filed with the Internal Revenue Service ("IRS") a request for approval to use this method, which was approved in the first quarter of 2017. The change resulted in additional deductions of approximately $203 million and $110 million for regular tax and AMT, respectively, resulting in a current tax benefit of approximately $10.7 million for the reduction in AMT payable for 2016. In addition, this change in tax position substantially changes the timing of additional deductions for these costs for regular tax and AMT relative to our projected life of mine and projected taxable income. These timing changes caused us to change our assessment of the ability to generate sufficient future taxable income to realize our deferred tax assets, resulting in a valuation allowance decrease and deferred tax benefit of approximately $15.1 million in the first quarter of 2017. At September 30, 2017, we retained a valuation allowance on U.S. deferred tax assets of approximately $66 million, primarily for net operating loss carryforwards.
Our net Canadian deferred tax liability at September 30, 2017 was $122.7 million, a decrease of $0.2 million from the $122.9 million net deferred tax liability at December 31, 2016. The deferred tax liability is primarily related to the excess of the carrying value of the mineral resource assets over the tax bases of those assets for Canadian tax reporting.
We had no Mexican deferred tax asset or liability at September 30, 2017 or December 31, 2016. We expect to have unremitted earnings in Mexico by the end 2017; however, we anticipate being able to fully offset any U.S. tax impact of repatriating any Mexican earnings with foreign tax credits that are available for use under both regular tax and AMT. Accordingly, we estimate the net U.S. income tax impact of unremitted earnings to be zero. A $5.8 million valuation allowance remains on deferred tax assets in foreign jurisdictions.
Reconciliation ofTotal Cost of Sales and Other Direct Production Costs and Depreciation, Depletion and Amortization (GAAP) to Cash Cost, Before By-product Credits and Cash Cost, After By-product Credits (non-GAAP) and All-In Sustaining Cost, Before By-product Credits and All-In Sustaining Cost, After By-product Credits (non-GAAP)
.
The $4.9 million decrease in gross profit for the first quarter of 2024 compared to the same period in 2023 was primarily due to lower sales volumes for all metals produced except zinc and higher cost of sales and other direct production costs attributable to an increase in hourly labor rates during the quarter, higher contractor labor maintenance expense, partially offset by higher realized silver and gold prices and lower treatment and refining charges. Capital additions increased by $2.2 million in the same period primarily due to higher mobile equipment purchases and the mine infrastructure development.
The charts below illustrate the factors contributing to Cash Cost, After By-product Credits, per Silver Ounce:
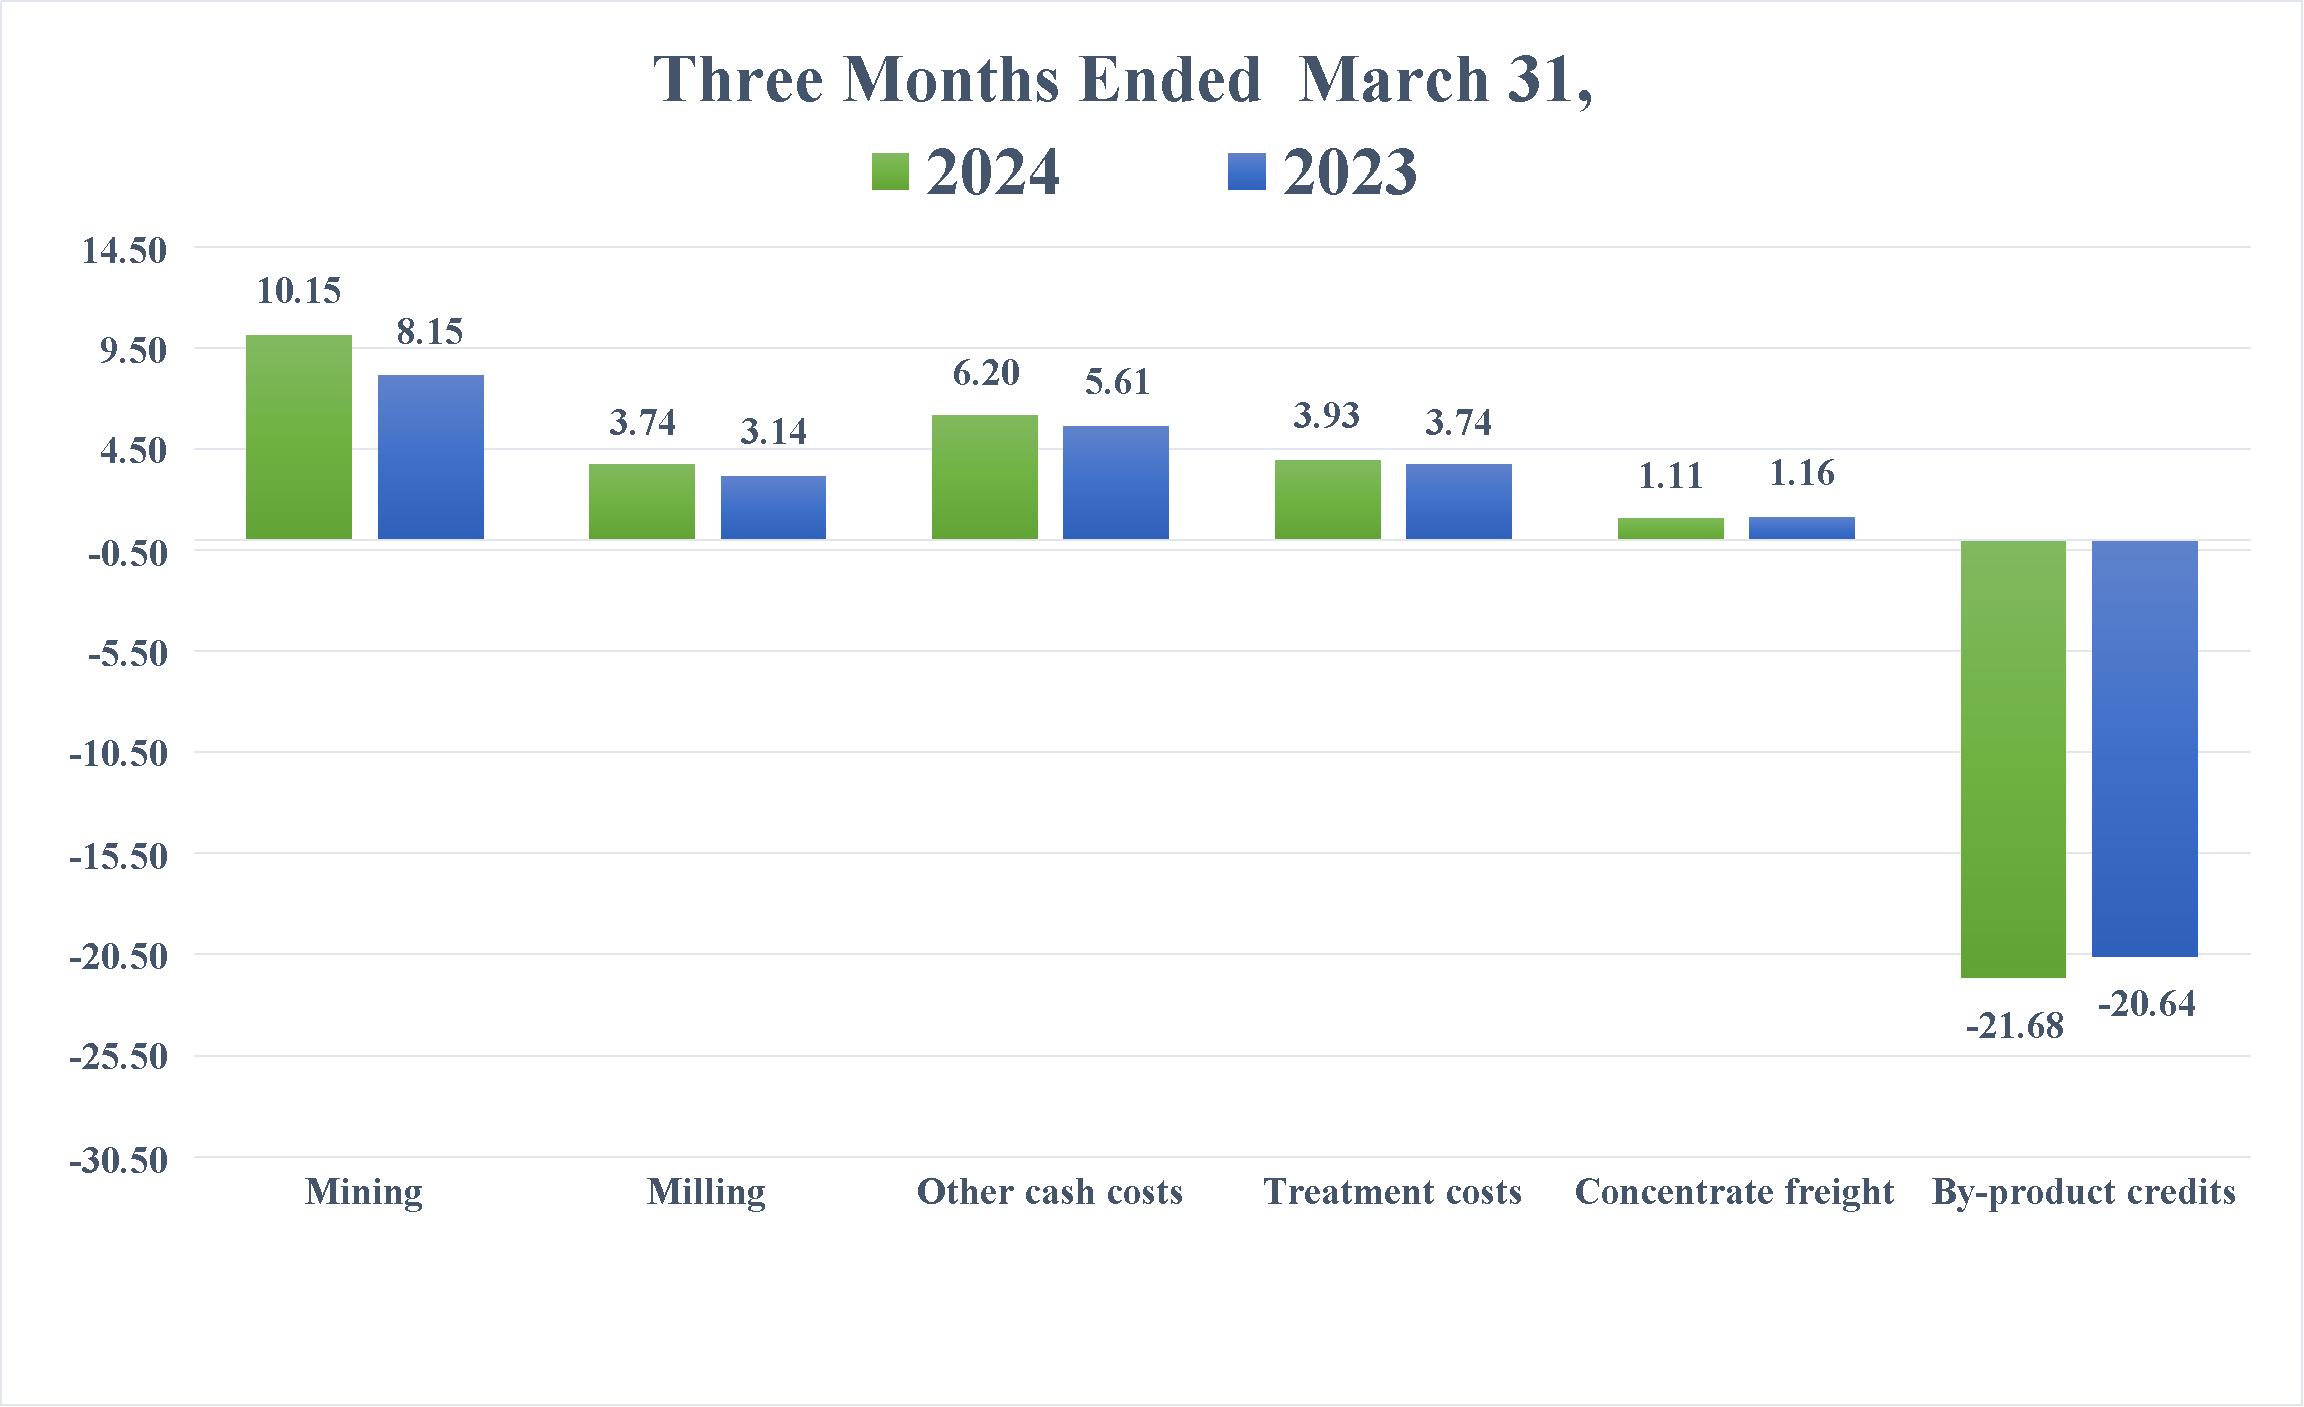
| | | | | | | | |
| | Three Months Ended March 31, | |
| | 2024 | | | 2023 | |
Cash Cost, Before By-product Credits, per Silver Ounce | | $ | 25.13 | | | $ | 21.80 | |
By-product credits | | | (21.68 | ) | | | (20.64 | ) |
Cash Cost, After By-product Credits, per Silver Ounce | | $ | 3.45 | | | $ | 1.16 | |
| | | | | | | | |
| | Three Months Ended March 31, | |
| | 2024 | | | 2023 | |
AISC, Before By-product Credits, per Silver Ounce | | $ | 28.84 | | | $ | 24.46 | |
By-product credits | | | (21.68 | ) | | | (20.64 | ) |
AISC, After By-product Credits, per Silver Ounce | | $ | 7.16 | | | $ | 3.82 | |
Theincrease in Cash Cost, After By-product Credits, per Silver Ounce and AISC, After By-product Credits, per Silver Ounce for the quarter compared to the same quarter in 2023 was primarily due to higher production costs and higher sustaining capital, respectively.
Lucky Friday
| | | | | | | | |
Dollars are in thousands (except per ounce and per ton amounts) | | Three Months Ended
March 31, | |
| | 2024 | | | 2023 | |
Sales | | $ | 35,340 | | | $ | 49,110 | |
Cost of sales and other direct production costs | | | (19,608 | ) | | | (24,079 | ) |
Depreciation, depletion and amortization | | | (7,911 | ) | | | (10,455 | ) |
Total cost of sales | | | (27,519 | ) | | | (34,534 | ) |
Gross profit | | $ | 7,821 | | | $ | 14,576 | |
Tons of ore milled | | | 86,234 | | | | 95,303 | |
Production: | | | | | | |
Silver (ounces) | | | 1,061,065 | | | | 1,262,464 | |
Lead (tons) | | | 6,689 | | | | 8,034 | |
Zinc (tons) | | | 2,851 | | | | 3,313 | |
Payable metal quantities sold: | | | | | | |
Silver (ounces) | | | 953,891 | | | | 1,306,013 | |
Lead (tons) | | | 5,992 | | | | 8,357 | |
Zinc (tons) | | | 1,641 | | | | 2,614 | |
Ore grades: | | | | | | |
Silver ounces per ton | | | 12.9 | | | | 13.8 | |
Lead percent | | | 8.2 | % | | | 8.8 | % |
Zinc percent | | | 3.9 | % | | | 4.1 | % |
Total production cost per ton | | $ | 233.10 | | | $ | 210.72 | |
Cash Cost, After By-product Credits, per Silver Ounce (1) | | $ | 8.85 | | | $ | 4.30 | |
AISC, After By-product Credits, per Silver Ounce (1) | | $ | 17.36 | | | $ | 10.69 | |
Capital additions | | $ | 14,988 | | | $ | 14,707 | |
(1)A reconciliation of these non-GAAP measures to total cost of sales, the most comparable GAAP measure, can be found below in Reconciliation of Total Cost of Sales (GAAP) to Cash Cost, Before By-product Credits and Cash Cost, After By-product Credits (non-GAAP) and All-In Sustaining Cost, Before By-product Credits and All-In Sustaining Cost, After By-product Credits (non-GAAP).
During August 2023, mining was suspended while repairing an unused station in the #2 ventilation shaft, which is also the secondary egress. While under repair, a fire occurred causing damage to the station and shaft. The operation remained suspended due to a fire at the unused station. By early September, the fire had been extinguished, normal ventilation was reestablished and the workforce recalled. Following evaluation of alternatives, it was determined that in order to safely bring the mine back into production in the most rapid and cost-effective way, a new secondary egress needed to be developed to bypass the damaged portion of the #2 shaft. The new egress extends an existing ramp 1,600 feet, installed a 290-foot-long manway raise, and developed an 850-foot ventilation raise. This work resulted in operations being suspended for the remainder of 2023, with the mine restarting production on January 9th, and ramping up to full production during March. The Company has property and business interruption insurance coverage with an underground sub-limit of $50.0 million, and to date has received $17.4 million in property damage and business interruption insurance proceeds. There can be no assurance that we will succeed in receiving the full $50 million.
Gross profit decreased by $6.8 million for the quarter ended March 31, 2024, compared to the same period in 2023, reflecting a combination of lower sales volumes for all metals produced as the mine ramped up to full production and higher maintenance, mining and milling costs, partially offset by higher realized silver prices.
During the first quarter of 2024, $2.2million of site specific suspension costs were included within Ramp-up and suspension costs on our condensed consolidated statements of operations and comprehensive loss.
Capital additions increased by$0.3 million in the quarter ended March 31, 2024, compared to the same period in 2023, reflecting the costs incurred to finalize the secondary egress partially offset by completion of the coarse ore bunker and silver hoist projects during 2023.
The charts below illustrate the factors contributing to Cash Cost, After By-product Credits, Per Silver Ounce:
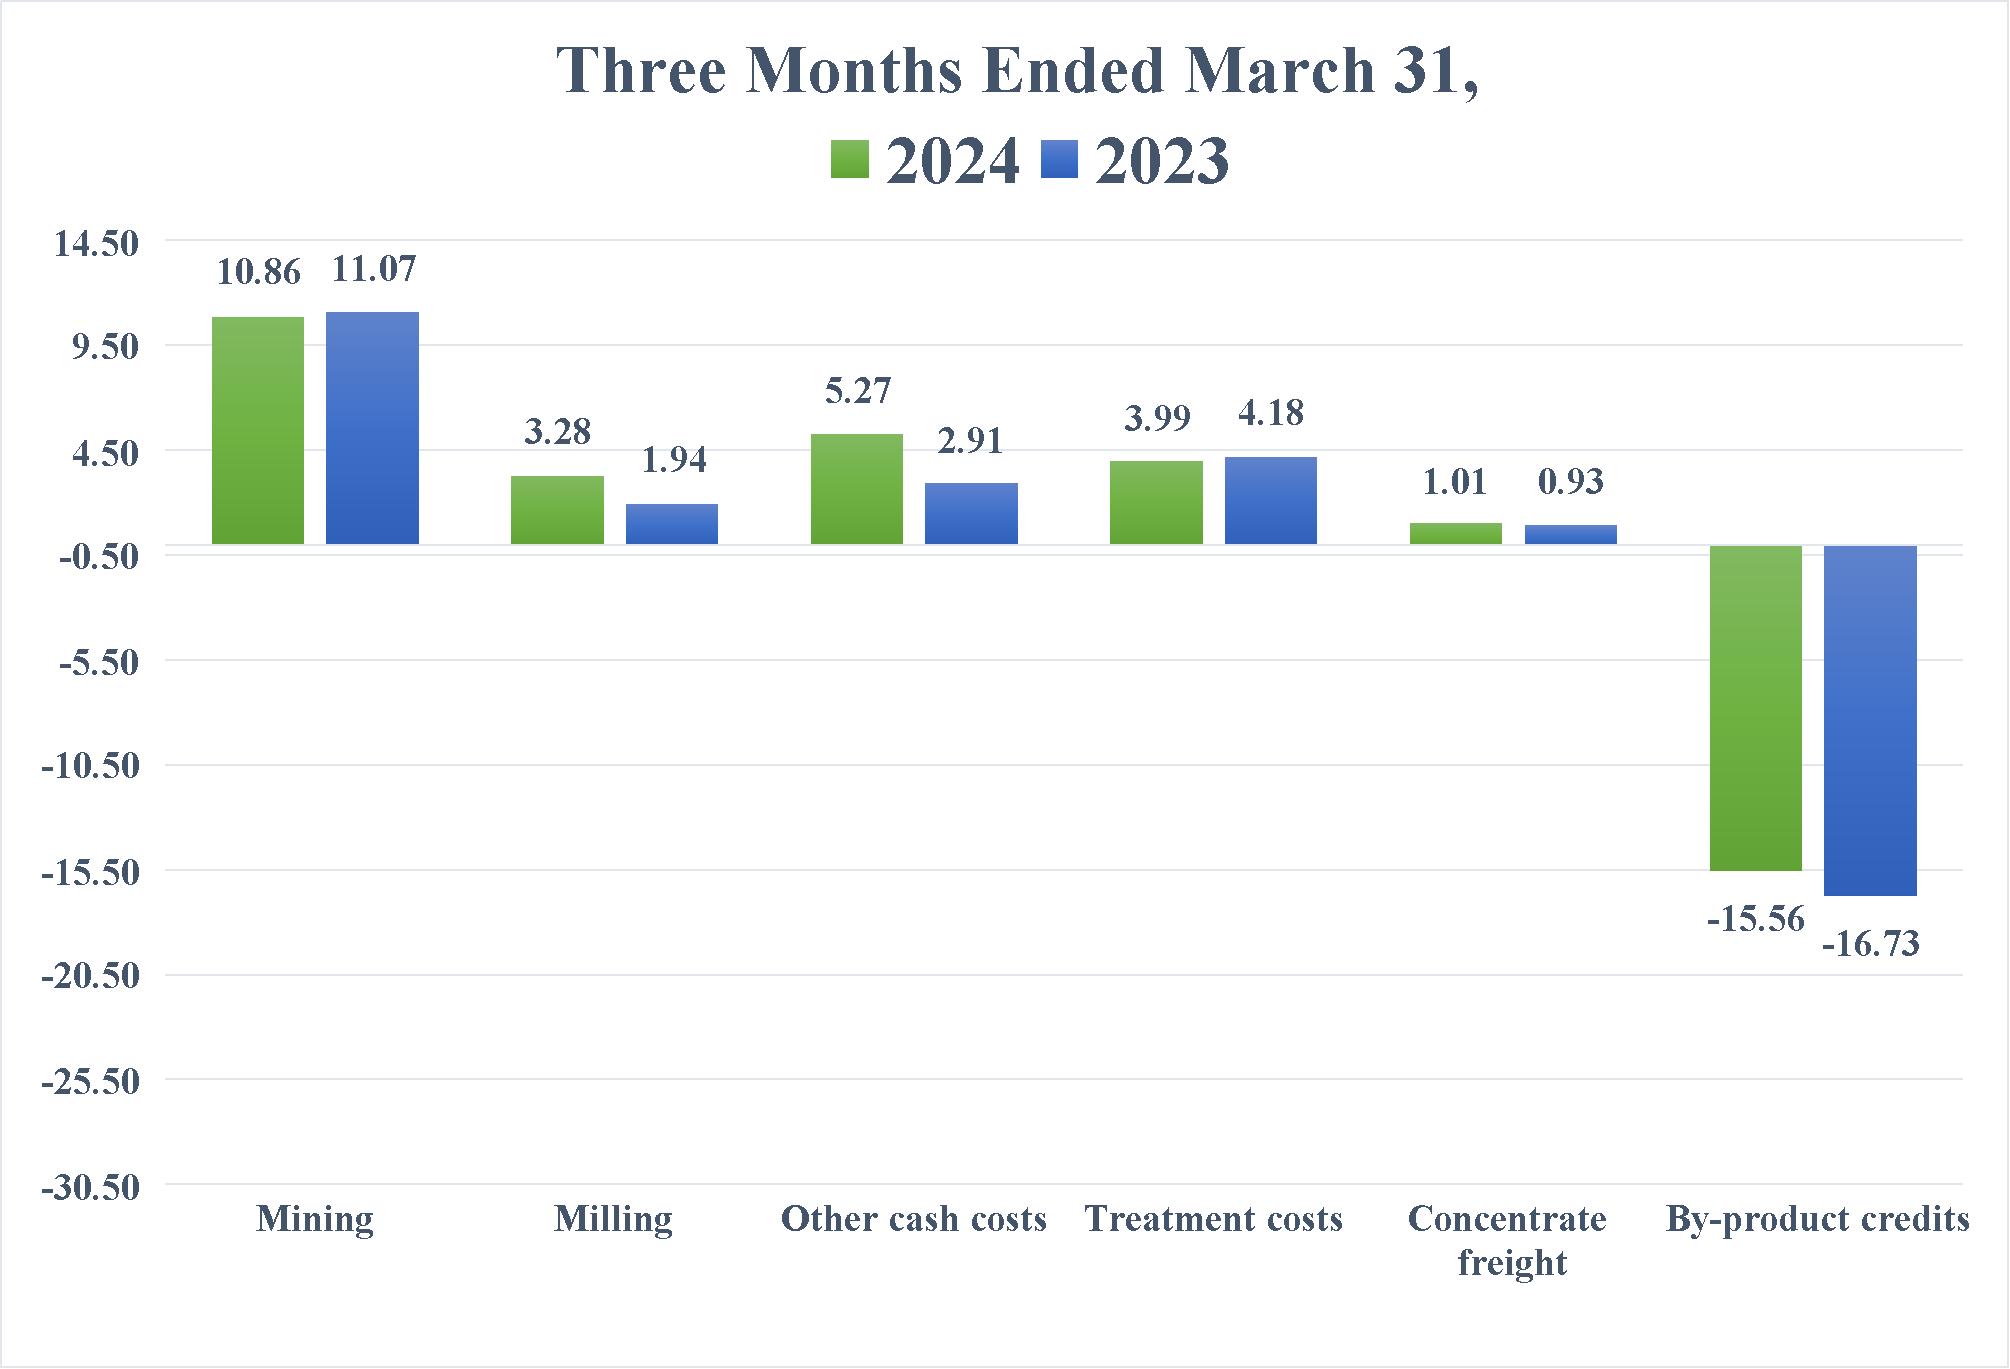
| | | | | | | | |
| | Three Months Ended March 31, | |
| | 2024 | | | 2023 | |
Cash Cost, Before By-product Credits, per Silver Ounce | | $ | 24.41 | | | $ | 21.03 | |
By-product credits | | | (15.56 | ) | | | (16.73 | ) |
Cash Cost, After By-product Credits, per Silver Ounce | | $ | 8.85 | | | $ | 4.30 | |
| | | | | | | | |
| | Three Months Ended March 31, | |
| | 2024 | | | 2023 | |
AISC, Before By-product Credits, per Silver Ounce | | $ | 32.92 | | | $ | 27.42 | |
By-product credits | | | (15.56 | ) | | | (16.73 | ) |
AISC, After By-product Credits, per Silver Ounce | | $ | 17.36 | | | $ | 10.69 | |
Theincrease in Cash Cost, After By-product Credits, per Silver Ounce and AISC, After By-product Credits, per Silver Ounce compared to the same period in 2023 was primarily due to a combination of lower production and lower by-product credits in 2024.
Keno Hill
| | | | |
Dollars are in thousands (except per ounce and per ton amounts) |
| Three Months Ended
March 31, |
|
|
| 2024 |
|
Sales |
| $ | 10,847 |
|
Cost of sales and other direct production costs |
|
| (7,245 | ) |
Depreciation, depletion and amortization |
|
| (3,602 | ) |
Total cost of sales |
|
| (10,847 | ) |
Gross profit |
| $ | — |
|
Tons of ore milled |
|
| 25,165 |
|
Production: |
|
|
|
Silver (ounces) |
|
| 646,312 |
|
Lead (tons) |
|
| 576 |
|
Zinc (tons) |
|
| 298 |
|
Payable metal quantities sold: |
|
|
|
Silver (ounces) |
|
| 432,331 |
|
Lead (tons) |
|
| 359 |
|
Zinc (tons) |
|
| 116 |
|
Ore grades: |
|
|
|
Silver ounces per ton |
|
| 26.3 |
|
Lead percent |
|
| 2.4 | % |
Zinc percent |
|
| 1.3 | % |
Capital additions |
| $ | 10,346 |
|
We acquired our Keno Hill operations as part of the Alexco acquisition on September 7, 2022, and have focused on development activities and began initial operation of the mill during the second quarter of 2023. The average throughput during the first quarter of 2024 was 277 tons per day, with silver grades milled of 26.3 ounces per ton.
During 2024, Keno Hill recorded both sales and total cost of sales of$10.8 million, related to the concentrate produced and sold. The first quarter 2024 had $8.7 million of site-specific ramp up costs included in Ramp-up and suspension costs, compared to $5.9 million in the first quarter of 2023. Keno Hill recorded capital additions of $10.3 million, related to various mine underground development projects, mobile equipment purchases and deposits on long lead items for the the cemented tails batch plant.
Casa Berardi
| | | | | | | | |
Dollars are in thousands (except per ounce and per ton amounts) | | Three Months Ended
March 31, | |
| | 2024 | | | 2023 | |
Sales | | $ | 41,584 | | | $ | 50,998 | |
Cost of sales and other direct production costs | | | (35,309 | ) | | | (48,962 | ) |
Depreciation, depletion and amortization | | | (22,951 | ) | | | (14,036 | ) |
Total cost of sales | | | (58,260 | ) | | | (62,998 | ) |
Gross loss | | $ | (16,676 | ) | | $ | (12,000 | ) |
Tons of ore milled | | | 381,626 | | | | 429,158 | |
Production: | | | | | | |
Gold (ounces) | | | 22,004 | | | | 24,686 | |
Silver (ounces) | | | 6,127 | | | | 6,554 | |
Payable metal quantities sold: | | | | | | |
Gold (ounces) | | | 20,003 | | | | 26,826 | |
Silver (ounces) | | | 5,213 | | | | 6,446 | |
Ore grades: | | | | | | |
Gold ounces per ton | | | 0.07 | | | | 0.07 | |
Silver ounces per ton | | | 0.02 | | | | 0.02 | |
Total production cost per ton | | $ | 96.53 | | | $ | 107.95 | |
Cash Cost, After By-product Credits, per Gold Ounce (1) | | $ | 1,669 | | | $ | 1,775 | |
AISC, After By-product Credits, per Gold Ounce (1) | | $ | 1,899 | | | $ | 2,392 | |
Capital additions | | $ | 13,316 | | | $ | 17,086 | |
(1)A reconciliation of these non-GAAP measures to total cost of sales, the most comparable GAAP measure, can be found below in Reconciliation of Total Cost of Sales (GAAP) to Cash Cost, Before By-product Credits and Cash Cost, After By-product Credits (non-GAAP) and All-In Sustaining Cost, Before By-product Credits and All-In Sustaining Cost, After By-product Credits (non-GAAP).
As part of the transition of the Casa Berardi mine from a combined underground and open pit operation to an open pit only operation, the lower margin east mine underground operations were closed in July 2023 and only the higher margin stopes of the west underground mine will be mined throughout mid-2024, at which time most underground activity, except for exploration will cease. This strategic change has resulted in production and sales decreasing significantly compared to the three-month periodended March 31, 2023. Following the halt to underground mining, Casa Berardi is expected to only produce gold from the 160 open pit, and at lower volumes than historic production levels with production expected to conclude no later than 2027. We forecast a gap in production from at least 2028 to at least 2030 when no ore will be mined and there will be no revenue. During this hiatus, our focus will be on investing in infrastructure and equipment, and on permitting and stripping two expected new open pits, Principal and West Mine Crown Pillar.. We expect to resume open pit mining at Casa Berardi no earlier than 2030, and anticipate that the mine will generate significant free cash flow at current gold prices.
Gross loss increased by $4.7 million to $16.7 million for the period ended March 31, 2024, compared to a gross loss of $12.0 million in the same period in 2023. The increase in gross loss includes $5.1 million in product inventory net realizable value write downs attributable to higher depreciation, depletion and amortization expense, reflecting the accelerated amortization of the west underground mine, the purchase of mobile equipment fleet in June and early July 2023 and the cessation of capitalization of any underground mine development costs effective July 2023. Processing of lower grade tonnage from both the underground and surface operations, higher costs related to mill maintenance and optimization activities, and higher fuel and other consumables costs, also contributed to the increased gross loss compared to the same period in 2023. Capital additions decreased by $3.8 million compared to the same period in 2023, primarily related to the cessation of capitalization of underground development.
The charts below illustrate the factors contributing to Cash Cost, After By-product Credits, Per Gold Ounce:
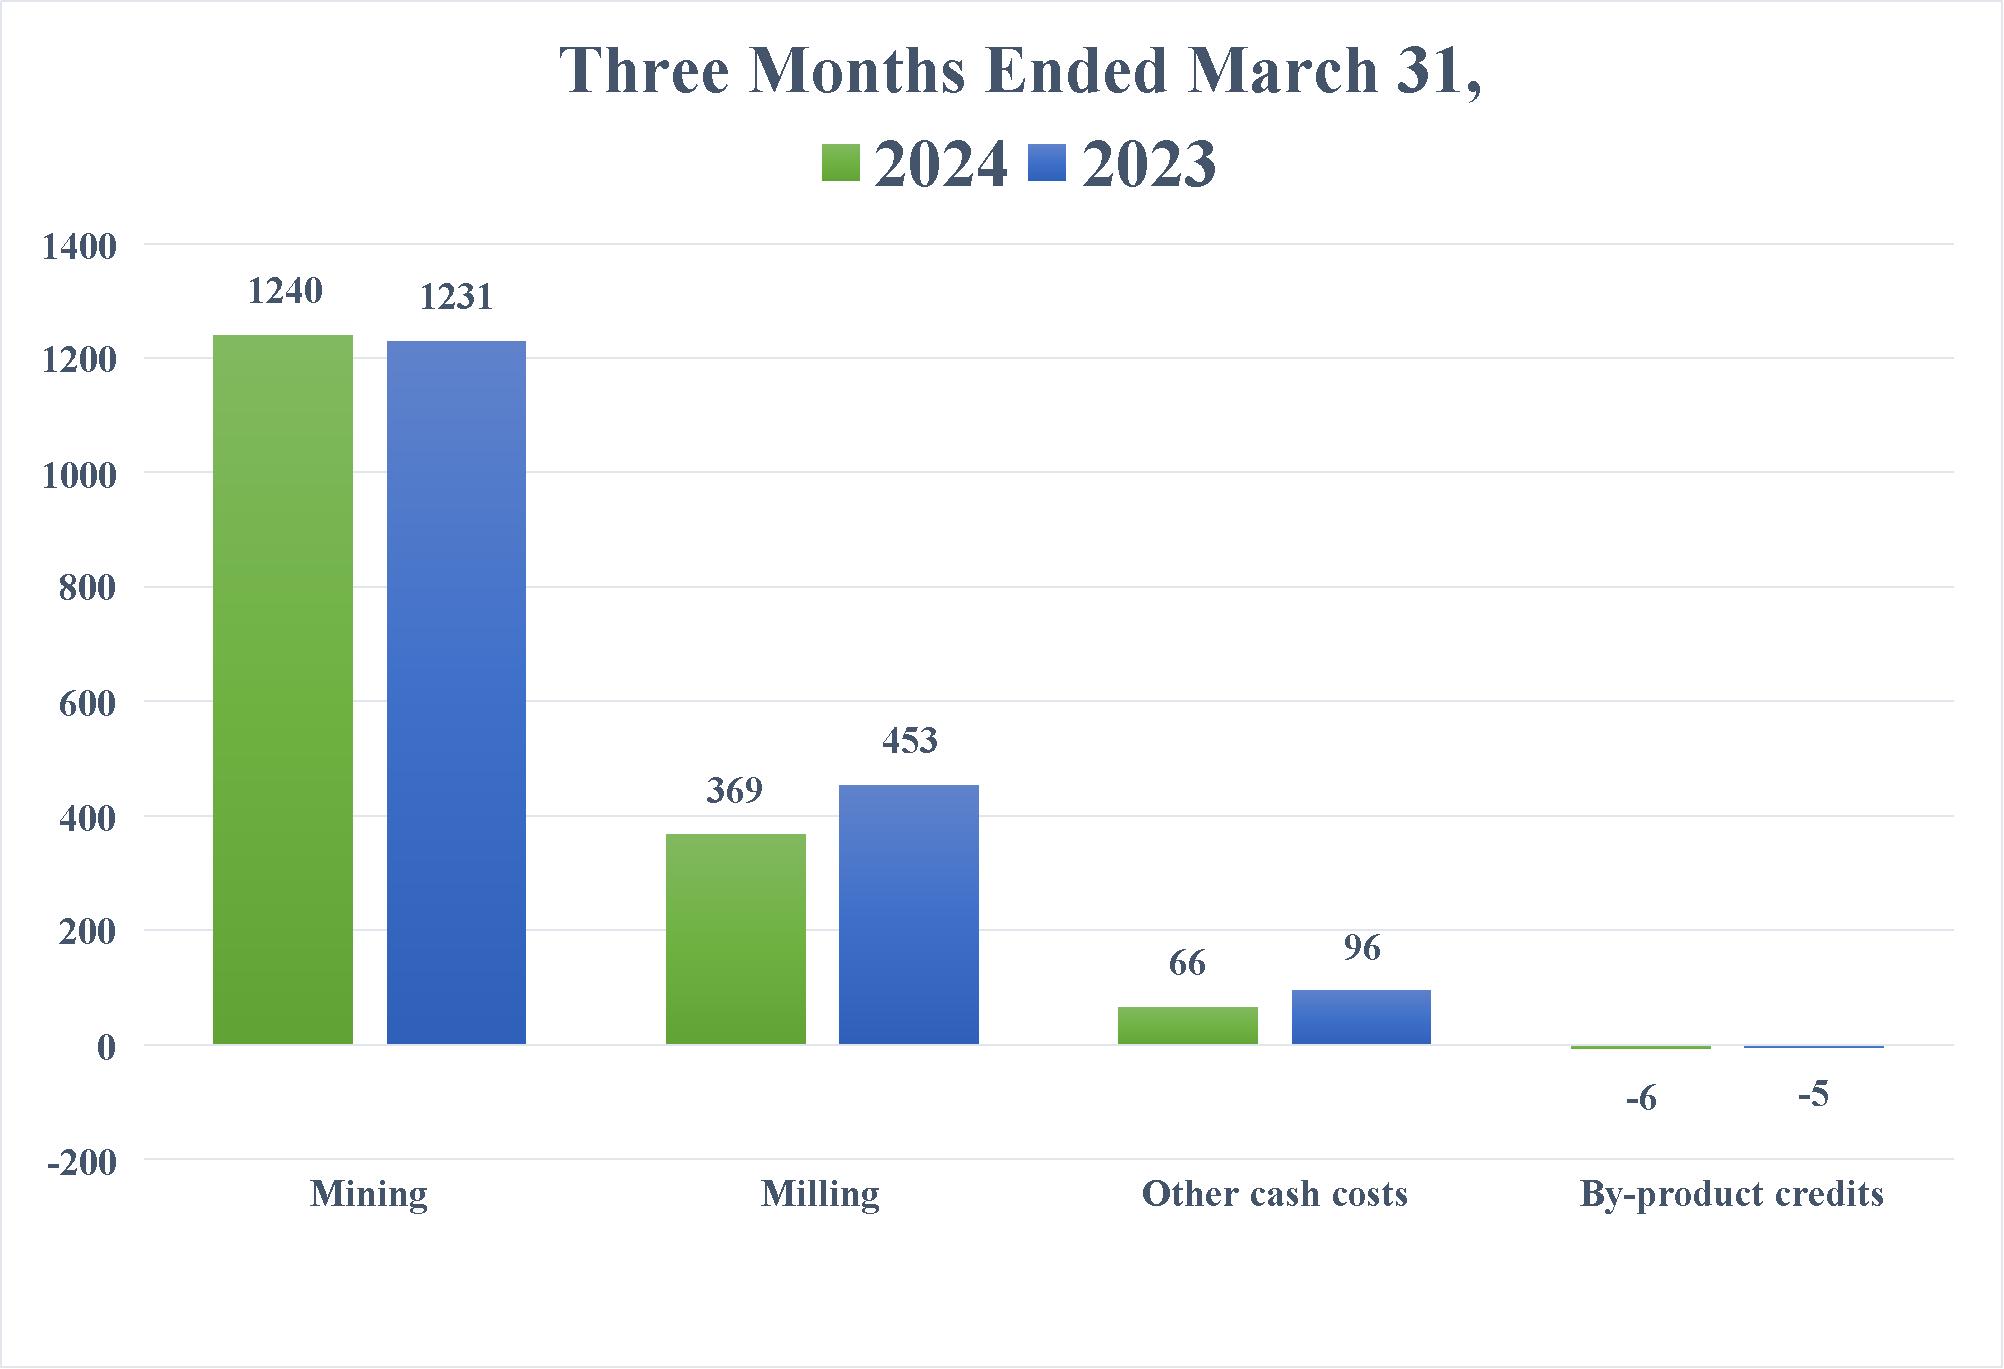
| | | | | | | | |
| | Three Months Ended March 31, | |
| | 2024 | | | 2023 | |
Cash Cost, Before By-product Credits, per Gold Ounce | | $ | 1,675 | | | $ | 1,780 | |
By-product credits | | | (6 | ) | | | (5 | ) |
Cash Cost, After By-product Credits, per Gold Ounce | | $ | 1,669 | | | $ | 1,775 | |
| | | | | | | | |
| | Three Months Ended March 31, | |
| | 2024 | | | 2023 | |
AISC, Before By-product Credits, per Gold Ounce | | $ | 1,905 | | | $ | 2,397 | |
By-product credits | | | (6 | ) | | | (5 | ) |
AISC, After By-product Credits, per Gold Ounce | | $ | 1,899 | | | $ | 2,392 | |
The decrease in Cash Cost After By-product Credits, per Gold Ounce, for the first quarter 2024 compared to the same period for 2023 was primarily due to lower production costs from the cessation of underground mining of the east mine during July 2023, partially offset by lower production. Decreased sustaining capital for the first quarter of 2024, reflecting no underground development positively impacted AISC, After By-product Credits, per Gold Ounce.
Corporate Matters
Income Taxes
During the three months ended March 31, 2024, an income and mining tax provision of $1.8 million resulted in an effective tax rate of negative 46.1%. This compares to an income and mining tax provision of $3.2 million for the three months ended March 31, 2023, which resulted in an effective tax rate of 4699.0%. The comparability of our income and mining tax provision and effective tax rate for the reported periods was impacted by multiple factors, primarily: (i) mining taxes; (ii) variations in our income before income taxes; (iii) geographic distribution of that income; (iv) foreign exchange rates including non-recognition of foreign exchange gains and losses; (v) percentage depletion; and (vi) the non-recognition of tax assets. The effective tax rate will fluctuate, sometimes significantly, period to period. The change in the effective tax rate during the three months ended March 31, 2024 compared to the comparable periods in 2023 is primarily related to the reported consolidated loss as well as the losses incurred at the consolidated Alexco subsidiaries, and the Nevada subsidiaries, for which no tax benefit is recognized due to uncertainty surrounding our ability to utilize these future tax benefits.
Each reporting period we assess our deferred tax balances based on a review of long-range forecasts and quarterly activity. A valuation allowance is provided for deferred tax assets for which it is more likely than not the related tax benefits will not be realized. We analyze our deferred tax assets and, if it is determined that we will not realize all or a portion of our deferred tax assets, we record or increase a valuation allowance. Conversely, if it is determined we will ultimately more likely than not be able to realize all or a portion of the related benefits for which a valuation allowance has been provided, all or a portion of the related valuation allowance will be reduced. There are a number of factors that impact our ability to realize our deferred tax assets. Valuation allowances are provided on deferred tax assets in Nevada, Mexico, and certain Canadian jurisdictions. For additional information, please see risk factors Our accounting and other estimates may be imprecise and Our ability to recognize the benefits of deferred tax assets related to net operating loss carryforwards and other items is dependent on future cash flows and taxable income in Item 1A - Risk Factors in our 2023 Form 10-K.
Reconciliation of Total Cost of Sales to Cash Cost, Before By-product Credits and Cash Cost, After By-product Credits (non-GAAP) and All-In Sustaining Cost, Before By-product Credits and All-In Sustaining Cost, After By-product Credits (non-GAAP)
The tables below present reconciliations between the most comparable GAAP measure of total cost of sales and other direct production costs and depreciation, depletion and amortization to the non-GAAP measures of (i) Cash Cost, Before By-product Credits, (ii) Cash Cost, After By-product Credits, (iii) AISC, Before By-product Credits and (iv) AISC, After By-product Credits for our operations at the Greens Creek, Lucky Friday, San Sebastian and Casa Berardi units and for the Company for the three-three months ended March 31, 2024 and nine-month periods ended September 30, 2017 and 2016.2023.
Cash Cost, After By-product Credits, per Ounce and AISC, After By-product Credits, per Ounce are measures developed by precious metals companies (including the Silver Institute and/orand the World Gold Council) in an effort to provide a uniform standard for comparison purposes. There can be no assurance, however, that these non-GAAP measures as we report them are the same as those reported by other mining companies.
Cash Cost, After By-product Credits, per Ounce is an important operating statistic that we utilize to measure each mine's operating performance. We have recently started reportinguse AISC, After By-product Credits, per Ounce which we use as a measure of our mines' net cash flow after costs for exploration, pre-development, reclamation and sustaining capital. This is similar to the Cash Cost, After By-product Credits, per Ounce non-GAAP measure we report, but also includes on-site exploration, reclamation and sustaining capital costs. Current GAAP measures used in the mining industry, such as cost of goods sold, do not capture all the expenditures incurred to discover, develop and sustain silver and gold production. Cash Cost, After By-product Credits, per Ounce and AISC, After By-product Credits, per Ounce also allow us to benchmark the performance of each of our mines versus those of our competitors. As a primary silver and gold mining company, we also use these statistics on an aggregate basis - aggregating the Greens Creek and Lucky Friday and San Sebastian mines - to compare our performance with that of other primary silver mining companies. With regard to Casa Berardi, we use Cash Cost, After By-product Credits, per Gold Ounce and AISC, After By-product Credits, per Gold Ounce to compare its performance with other gold mines. Similarly, these statistics are useful in identifying acquisition and investment opportunities as they provide a common tool for measuring the financial performance of other mines with varying geologic, metallurgical and operating characteristics.
Cash Cost, Before By-product Credits and AISC, Before By-product Credits include all direct and indirect operating cash costs related directly to the physical activities of producing metals, including mining, processing and other plant costs, third-party refining expense, on-site general and administrative costs, royalties and mining production taxes. AISC, Before By-product Credits for each mine also includes on-site exploration, reclamation and sustaining capital costs. AISC, Before By-product Credits for our consolidated silver properties also includes corporate costs for general and administrative expense exploration and sustaining capital projects.costs. By-product credits include revenues earned from all metals other than the primary metal produced at each unit. As depicted in the tables below, by-product credits comprise an essential element of our silver unit cost structure, distinguishing our silver operations due to the polymetallic nature of their orebodies.
In addition to the uses described above, Cash Cost, After By-product Credits, per Ounce and AISC, After By-product Credits, per Ounce provide management and investors an indication of operating cash flow, after consideration of the average price received from production. We also use these measurements for the comparative monitoring of performance of our mining operations period-to-period from a cash flow perspective.
The Casa Berardi information below reports Cash Cost, After By-product Credits, per Gold Ounce and AISC, After By-product Credits, per Gold Ounce for the production of gold, itstheir primary product, and by-product revenues earned from silver, which is a by-product at Casa Berardi. Only costs and ounces produced relating to units with the same primary product are combined to represent Cash Cost, After By-product Credits, per Ounce and AISC, After By-product Credits, per Ounce. Thus, the gold produced at our Casa Berardi unit is not included as a by-product credit when calculating CashCost, After By-product Credits, per Silver Ounce and AISC, After By-product Credits, per Silver Ounce for the total of Greens Creek and Lucky Friday, and San Sebastian, our combined silver properties. Similarly, the silver produced at our other threetwo units is not included as a by-product credit when calculating the gold metrics for Casa Berardi.
| | | | | | | | | | | | | | | | | | | | |
In thousands (except per ounce amounts) | | Three Months Ended March 31, 2024 | |
| | Greens Creek | | | Lucky Friday | | | Keno Hill (6) | | | Corporate (2) | | | Total Silver | |
Total cost of sales | | $ | 69,857 | | | $ | 27,519 | | | $ | 10,847 | | | $ | — | | | $ | 108,223 | |
Depreciation, depletion and amortization | | | (14,443 | ) | | | (7,911 | ) | | | (3,602 | ) | | | — | | | | (25,956 | ) |
Treatment costs | | | 9,724 | | | | 3,223 | | | | — | | | | — | | | | 12,947 | |
Change in product inventory | | | (2,196 | ) | | | 611 | | | | — | | | | — | | | | (1,585 | ) |
Reclamation and other costs | | | (655 | ) | | | (102 | ) | | | — | | | | — | | | | (757 | ) |
Exclusion of Lucky Friday cash costs (3) | | | — | | | | (3,634 | ) | | | — | | | | — | | | | (3,634 | ) |
Exclusion of Keno Hill cash costs (4) | | | — | | | | — | | | | (7,245 | ) | | | — | | | | (7,245 | ) |
Cash Cost, Before By-product Credits (1) | | | 62,287 | | | | 19,706 | | | | — | | | | — | | | | 81,993 | |
Reclamation and other costs | | | 785 | | | | 222 | | | | — | | | | — | | | | 1,007 | |
Sustaining capital | | | 8,416 | | | | 12,051 | | | | — | | | | 66 | | | | 20,533 | |
Exclusion of Lucky Friday sustaining costs (3) | | | — | | | | (5,396 | ) | | | — | | | | — | | | | (5,396 | ) |
General and administrative | | | — | | | | — | | | | — | | | | 11,216 | | | | 11,216 | |
AISC, Before By-product Credits (1) | | | 71,488 | | | | 26,583 | | | | — | | | | 11,282 | | | | 109,353 | |
By-product credits: | | | | | | | | | | | | | | | |
Zinc | | | (20,206 | ) | | | (4,785 | ) | | | — | | | | — | | | | (24,991 | ) |
Gold | | | (26,551 | ) | | | — | | | | — | | | | — | | | | (26,551 | ) |
Lead | | | (6,980 | ) | | | (11,720 | ) | | | — | | | | — | | | | (18,700 | ) |
Exclusion of Lucky Friday by-product credits (3) | | | — | | | | 3,943 | | | | — | | | | — | | | | 3,943 | |
Total By-product credits | | | (53,737 | ) | | | (12,562 | ) | | | — | | | | — | | | | (66,299 | ) |
Cash Cost, After By-product Credits | | $ | 8,550 | | | $ | 7,144 | | | $ | — | | | $ | — | | | $ | 15,694 | |
AISC, After By-product Credits | | $ | 17,751 | | | $ | 14,021 | | | $ | — | | | $ | 11,282 | | | $ | 43,054 | |
Ounces produced | | | 2,479 | | | | 1,061 | | | | | | | | | | 3,540 | |
Exclusion of Lucky Friday ounces produced (3) | | | — | | | | (253 | ) | | | | | | | | | (253 | ) |
Divided by ounces produced | | | 2,479 | | | | 808 | | | | | | | | | | 3,287 | |
Cash Cost, Before By-product Credits, per Ounce | | $ | 25.13 | | | $ | 24.41 | | | | | | | | | $ | 24.95 | |
By-product credits per ounce | | | (21.68 | ) | | | (15.56 | ) | | | | | | | | | (20.17 | ) |
Cash Cost, After By-product Credits, per Ounce | | $ | 3.45 | | | $ | 8.85 | | | | | | | | | $ | 4.78 | |
AISC, Before By-product Credits, per Ounce | | $ | 28.84 | | | $ | 32.92 | | | | | | | | | $ | 33.27 | |
By-product credits per ounce | | | (21.68 | ) | | | (15.56 | ) | | | | | | | | | (20.17 | ) |
AISC, After By-product Credits, per Ounce | | $ | 7.16 | | | $ | 17.36 | | | | | | | | | $ | 13.10 | |
| | | | | | | | | | | | |
In thousands (except per ounce amounts) | | Three Months Ended March 31, 2024 | |
| | Gold - Casa Berardi | | | Other (4) | | | Total Gold and Other | |
Total cost of sales | | $ | 58,260 | | | $ | 3,885 | | | $ | 62,145 | |
Depreciation, depletion and amortization | | | (22,951 | ) | | | — | | | | (22,951 | ) |
Treatment costs | | | 24 | | | | — | | | | 24 | |
Change in product inventory | | | 1,739 | | | | — | | | | 1,739 | |
Reclamation and other costs | | | (209 | ) | | | — | | | | (209 | ) |
Exclusion of Other costs | | | — | | | | (3,885 | ) | | | (3,885 | ) |
Cash Cost, Before By-product Credits (1) | | | 36,863 | | | | — | | | | 36,863 | |
Reclamation and other costs | | | 209 | | | | — | | | | 209 | |
Sustaining capital | | | 4,861 | | | | — | | | | 4,861 | |
AISC, Before By-product Credits (1) | | | 41,933 | | | | — | | | | 41,933 | |
By-product credits: | | | | | | | | | |
Silver | | | (143 | ) | | | — | | | | (143 | ) |
Total By-product credits | | | (143 | ) | | | — | | | | (143 | ) |
Cash Cost, After By-product Credits | | $ | 36,720 | | | $ | — | | | $ | 36,720 | |
AISC, After By-product Credits | | $ | 41,790 | | | $ | — | | | $ | 41,790 | |
Divided by ounces produced | | | 22 | | | | — | | | | 22 | |
Cash Cost, Before By-product Credits, per Ounce | | $ | 1,675 | | | $ | — | | | $ | 1,675 | |
By-product credits per ounce | | | (6 | ) | | | — | | | | (6 | ) |
Cash Cost, After By-product Credits, per Ounce | | $ | 1,669 | | | $ | — | | | $ | 1,669 | |
AISC, Before By-product Credits, per Ounce | | $ | 1,905 | | | $ | — | | | $ | 1,905 | |
By-product credits per ounce | | | (6 | ) | | | — | | | | (6 | ) |
AISC, After By-product Credits, per Ounce | | $ | 1,899 | | | $ | — | | | $ | 1,899 | |
| | | | | | | | | | | | |
In thousands (except per ounce amounts) | | Three Months Ended March 31, 2024 | |
| | Total Silver | | | Total Gold and Other | | | Total | |
Total cost of sales | | $ | 108,223 | | | $ | 62,145 | | | $ | 170,368 | |
Depreciation, depletion and amortization | | | (25,956 | ) | | | (22,951 | ) | | | (48,907 | ) |
Treatment costs | | | 12,947 | | | | 24 | | | | 12,971 | |
Change in product inventory | | | (1,585 | ) | | | 1,739 | | | | 154 | |
Reclamation and other costs | | | (757 | ) | | | (209 | ) | | | (966 | ) |
Exclusion of Lucky Friday cash costs (3) | | | (3,634 | ) | | | — | | | | (3,634 | ) |
Exclusion of Keno Hill cash costs (6) | | | (7,245 | ) | | | — | | | | (7,245 | ) |
Exclusion of Other costs | | | — | | | | (3,885 | ) | | | (3,885 | ) |
Cash Cost, Before By-product Credits (1) | | | 81,993 | | | | 36,863 | | | | 118,856 | |
Reclamation and other costs | | | 1,007 | | | | 209 | | | | 1,216 | |
Sustaining capital | | | 20,533 | | | | 4,861 | | | | 25,394 | |
Exclusion of Lucky Friday sustaining costs (8) | | | (5,396 | ) | | | — | | | | (5,396 | ) |
General and administrative | | | 11,216 | | | | — | | | | 11,216 | |
AISC, Before By-product Credits (1) | | | 109,353 | | | | 41,933 | | | | 151,286 | |
By-product credits: | | | | | | | | | |
Zinc | | | (24,991 | ) | | | — | | | | (24,991 | ) |
Gold | | | (26,551 | ) | | | — | | | | (26,551 | ) |
Lead | | | (18,700 | ) | | | — | | | | (18,700 | ) |
Silver | | | — | | | | (143 | ) | | | (143 | ) |
Exclusion of Lucky Friday by-product credits (8) | | | 3,943 | | | | — | | | | 3,943 | |
Total By-product credits | | | (66,299 | ) | | | (143 | ) | | | (66,442 | ) |
Cash Cost, After By-product Credits | | $ | 15,694 | | | $ | 36,720 | | | $ | 52,414 | |
AISC, After By-product Credits | | $ | 43,054 | | | $ | 41,790 | | | $ | 84,844 | |
Ounces produced | | | 3,540 | | | | 22 | | | | |
Exclusion of Lucky Friday ounces produced (8) | | | (253 | ) | | | — | | | | |
Divided by ounces produced | | | 3,287 | | | | 22 | | | | |
Cash Cost, Before By-product Credits, per Ounce | | $ | 24.95 | | | $ | 1,675 | | | | |
By-product credits per ounce | | | (20.17 | ) | | | (6 | ) | | | |
Cash Cost, After By-product Credits, per Ounce | | $ | 4.78 | | | $ | 1,669 | | | | |
AISC, Before By-product Credits, per Ounce | | $ | 33.27 | | | $ | 1,905 | | | | |
By-product credits per ounce | | | (20.17 | ) | | | (6 | ) | | | |
AISC, After By-product Credits, per Ounce | | $ | 13.10 | | | $ | 1,899 | | | | |
| | | | | | | | | | | | | | | | |
In thousands (except per ounce amounts) | | Three Months Ended March 31, 2023 (5) | |
| | Greens Creek | | | Lucky Friday | | | Corporate (2) | | | Total Silver | |
Total cost of sales | | $ | 66,288 | | | $ | 34,534 | | | $ | — | | | $ | 100,822 | |
Depreciation, depletion and amortization | | | (14,464 | ) | | | (10,455 | ) | | | — | | | | (24,919 | ) |
Treatment costs | | | 10,368 | | | | 5,277 | | | | — | | | | 15,645 | |
Change in product inventory | | | (1,615 | ) | | | (2,409 | ) | | | — | | | | (4,024 | ) |
Reclamation and other costs | | | (129 | ) | | | (409 | ) | | | — | | | | (538 | ) |
Cash Cost, Before By-product Credits (1) | | | 60,448 | | | | 26,538 | | | | — | | | | 86,986 | |
Reclamation and other costs | | | 722 | | | | 285 | | | | — | | | | 1,007 | |
Sustaining capital | | | 6,641 | | | | 7,784 | | | | — | | | | 14,425 | |
General and administrative | | | — | | | | — | | | | 12,070 | | | | 12,070 | |
AISC, Before By-product Credits (1) | | | 67,811 | | | | 34,607 | | | | 12,070 | | | | 114,488 | |
By-product credits: | | | | | | | | | | | | |
Zinc | | | (24,005 | ) | | | (6,816 | ) | | | — | | | | (30,821 | ) |
Gold | | | (25,286 | ) | | | — | | | | — | | | | (25,286 | ) |
Lead | | | (7,942 | ) | | | (14,299 | ) | | | — | | | | (22,241 | ) |
Total By-product credits | | | (57,233 | ) | | | (21,115 | ) | | | — | | | | (78,348 | ) |
Cash Cost, After By-product Credits | | $ | 3,215 | | | $ | 5,423 | | | $ | — | | | $ | 8,638 | |
AISC, After By-product Credits | | $ | 10,578 | | | $ | 13,492 | | | $ | 12,070 | | | $ | 36,140 | |
Divided by ounces produced | | | 2,773 | | | | 1,262 | | | | | | | 4,035 | |
Cash Cost, Before By-product Credits, per Ounce | | $ | 21.80 | | | $ | 21.03 | | | | | | $ | 21.56 | |
By-product credits per ounce | | | (20.64 | ) | | | (16.73 | ) | | | | | | (19.42 | ) |
Cash Cost, After By-product Credits, per Ounce | | $ | 1.16 | | | $ | 4.30 | | | | | | $ | 2.14 | |
AISC, Before By-product Credits, per Ounce | | $ | 24.46 | | | $ | 27.42 | | | | | | $ | 28.38 | |
By-product credits per ounce | | | (20.64 | ) | | | (16.73 | ) | | | | | | (19.42 | ) |
AISC, After By-product Credits, per Ounce | | $ | 3.82 | | | $ | 10.69 | | | | | | $ | 8.96 | |
| | | | | | | | | | | | |
In thousands (except per ounce amounts) | | Three Months Ended March 31, 2023 (5) | |
| | Gold - Casa Berardi | | | Other | | | Total Gold and Other | |
Total cost of sales | | $ | 62,998 | | | $ | 732 | | | $ | 63,730 | |
Depreciation, depletion and amortization | | | (14,036 | ) | | | (47 | ) | | | (14,083 | ) |
Treatment costs | | | 467 | | | | — | | | | 467 | |
Change in product inventory | | | (2,417 | ) | | | — | | | | (2,417 | ) |
Reclamation and other costs | | | (217 | ) | | | — | | | | (217 | ) |
Exclusion of Casa Berardi cash costs (5) | | | (2,851 | ) | | | — | | | | (2,851 | ) |
Exclusion of Other costs | | | — | | | | (685 | ) | | | (685 | ) |
Cash Cost, Before By-product Credits (1) | | | 43,944 | | | | — | | | | 43,944 | |
Reclamation and other costs | | | 217 | | | | — | | | | 217 | |
Sustaining capital | | | 15,015 | | | | — | | | | 15,015 | |
AISC, Before By-product Credits (1) | | | 59,176 | | | | | | | 59,176 | |
By-product credits: | | | | | | | | | |
Silver | | | (127 | ) | | | — | | | | (127 | ) |
Total By-product credits | | | (127 | ) | | | — | | | | (127 | ) |
Cash Cost, After By-product Credits | | $ | 43,817 | | | $ | — | | | $ | 43,817 | |
AISC, After By-product Credits | | $ | 59,049 | | | $ | — | | | $ | 59,049 | |
Divided by ounces produced | | | 25 | | | | — | | | | 25 | |
Cash Cost, Before By-product Credits, per Ounce | | $ | 1,780 | | | $ | — | | | $ | 1,780 | |
By-product credits per ounce | | | (5 | ) | | | — | | | | (5 | ) |
Cash Cost, After By-product Credits, per Ounce | | $ | 1,775 | | | $ | — | | | $ | 1,775 | |
AISC, Before By-product Credits, per Ounce | | $ | 2,397 | | | $ | — | | | $ | 2,397 | |
By-product credits per ounce | | | (5 | ) | | | — | | | | (5 | ) |
AISC, After By-product Credits, per Ounce | | $ | 2,392 | | | $ | — | | | $ | 2,392 | |
| | | | | | | | | | | | |
In thousands (except per ounce amounts) | | Three Months Ended March 31, 2023 (5) | |
| | Total Silver | | | Total Gold and Other | | | Total | |
Total cost of sales | | $ | 100,822 | | | $ | 63,730 | | | $ | 164,552 | |
Depreciation, depletion and amortization | | | (24,919 | ) | | | (14,083 | ) | | | (39,002 | ) |
Treatment costs | | | 15,645 | | | | 467 | | | | 16,112 | |
Change in product inventory | | | (4,024 | ) | | | (2,417 | ) | | | (6,441 | ) |
Reclamation and other costs | | | (538 | ) | | | (217 | ) | | | (755 | ) |
Exclusion of Casa Berardi cash costs (5) | | | — | | | | (2,851 | ) | | | (2,851 | ) |
Exclusion of Nevada Operations and other costs | | | — | | | | (685 | ) | | | (685 | ) |
Cash Cost, Before By-product Credits (1) | | | 86,986 | | | | 43,944 | | | | 130,930 | |
Reclamation and other costs | | | 1,007 | | | | 217 | | | | 1,224 | |
Sustaining capital | | | 14,425 | | | | 15,015 | | | | 29,440 | |
General and administrative | | | 12,070 | | | | — | | | | 12,070 | |
AISC, Before By-product Credits (1) | | | 114,488 | | | | 59,176 | | | | 173,664 | |
By-product credits: | | | | | | | | | |
Zinc | | | (30,821 | ) | | | — | | | | (30,821 | ) |
Gold | | | (25,286 | ) | | | — | | | | (25,286 | ) |
Lead | | | (22,241 | ) | | | — | | | | (22,241 | ) |
Silver | | | — | | | | (127 | ) | | | (127 | ) |
Total By-product credits | | | (78,348 | ) | | | (127 | ) | | | (78,475 | ) |
Cash Cost, After By-product Credits | | $ | 8,638 | | | $ | 43,817 | | | $ | 52,455 | |
AISC, After By-product Credits | | $ | 36,140 | | | $ | 59,049 | | | $ | 95,189 | |
Divided by ounces produced | | | 4,035 | | | | 25 | | | | |
Cash Cost, Before By-product Credits, per Ounce | | $ | 21.56 | | | $ | 1,780 | | | | |
By-product credits per ounce | | | (19.42 | ) | | | (5 | ) | | | |
Cash Cost, After By-product Credits, per Ounce | | $ | 2.14 | | | $ | 1,775 | | | | |
AISC, Before By-product Credits, per Ounce | | $ | 28.38 | | | $ | 2,397 | | | | |
By-product credits per ounce | | | (19.42 | ) | | | (5 | ) | | | |
AISC, After By-product Credits, per Ounce | | $ | 8.96 | | | $ | 2,392 | | | | |
(1)Includes all direct and indirect operating costs related to the physical activities of Contentsproducing metals, including mining, processing and other plant costs, third-party refining and marketing expense, on-site general and administrative costs and royalties, before by-product revenues earned from all metals other than the primary metal produced at each operation. AISC, Before By-product Credits also includes reclamation and sustaining capital costs.
In thousands (except per ounce amounts) | | Three Months Ended September 30, 2017 | |
| | | Greens Creek | | | Lucky Friday(2) | | | San Sebastian | | | Corporate(3) | | | Total Silver | | | Casa Berardi (Gold) | | | Total | |
Cost of sales and other direct production costs and depreciation, depletion and amortization | | $ | 41,927 | | | | — | | | $ | 6,680 | | | | | | | $ | 48,607 | | | $ | 48,595 | | | $ | 97,202 | |
Depreciation, depletion and amortization | | | (12,607 | ) | | | — | | | | (641 | ) | | | | | | | (13,248 | ) | | | (15,596 | ) | | | (28,844 | ) |
Treatment costs | | | 12,067 | | | | 440 | | | | 422 | | | | | | | | 12,929 | | | | 682 | | | | 13,611 | |
Change in product inventory | | | 7,675 | | | | 1,960 | | | | (627 | ) | | | | | | | 9,008 | | | | (288 | ) | | | 8,720 | |
Reclamation and other costs | | | (394 | ) | | | 18 | | | | (494 | ) | | | | | | | (870 | ) | | | (124 | ) | | | (994 | ) |
Cash Cost, Before By-product Credits (1) | | | 48,668 | | | | 2,418 | | | | 5,340 | | | | | | | | 56,426 | | | | 33,269 | | | | 89,695 | |
Reclamation and other costs | | | 666 | | | | 38 | | | | 117 | | | | | | | | 821 | | | | 123 | | | | 944 | |
Exploration | | | 1,944 | | | | (2 | ) | | | 1,495 | | | | 477 | | | | 3,914 | | | | 1,161 | | | | 5,075 | |
Sustaining capital | | | 8,210 | | | | 119 | | | | 402 | | | | 1,105 | | | | 9,836 | | | | 13,775 | | | | 23,611 | |
General and administrative | | | | | | | | | | | | | | | 9,529 | | | | 9,529 | | | | | | | | 9,529 | |
AISC, Before By-product Credits (1) | | | 59,488 | | | | 2,573 | | | | 7,354 | | | | | | | | 80,526 | | | | 48,328 | | | | 128,854 | |
By-product credits: | | | | | | | | | | | | | | | | | | | | | | | | | | | | |
Zinc | | | (27,046 | ) | | | (293 | ) | | | | | | | | | | | (27,339 | ) | | | | | | | (27,339 | ) |
Gold | | | (13,907 | ) | | | | | | | (8,088 | ) | | | | | | | (21,995 | ) | | | | | | | (21,995 | ) |
Lead | | | (8,067 | ) | | | (1,102 | ) | | | | | | | | | | | (9,169 | ) | | | | | | | (9,169 | ) |
Silver | | | | | | | | | | | | | | | | | | | | | | | (161 | ) | | | (161 | ) |
Total By-product credits | | | (49,020 | ) | | | (1,395 | ) | | | (8,088 | ) | | | | | | | (58,503 | ) | | | (161 | ) | | | (58,664 | ) |
Cash Cost, After By-product Credits | | $ | (352 | ) | | $ | 1,023 | | | $ | (2,748 | ) | | | | | | $ | (2,077 | ) | | $ | 33,108 | | | $ | 31,031 | |
AISC, After By-product Credits | | $ | 10,468 | | | $ | 1,178 | | | $ | (734 | ) | | | | | | $ | 22,023 | | | $ | 48,167 | | | $ | 70,190 | |
Divided by ounces produced | | | 2,344 | | | | 88 | | | | 880 | | | | | | | | 3,312 | | | | 44 | | | | | |
Cash Cost, Before By-product Credits, per Ounce | | $ | 20.75 | | | $ | 27.44 | | | $ | 6.07 | | | | | | | $ | 17.03 | | | $ | 753.70 | | | | | |
By-product credits per ounce | | | (20.90 | ) | | | (15.84 | ) | | | (9.19 | ) | | | | | | | (17.66 | ) | | | (3.65 | ) | | | | |
Cash Cost, After By-product Credits, per Ounce | | $ | (0.15 | ) | | $ | 11.60 | | | $ | (3.12 | ) | | | | | | $ | (0.63 | ) | | $ | 750.05 | | | | | |
AISC, Before By-product Credits, per Ounce | | $ | 25.37 | | | $ | 29.21 | | | $ | 8.36 | | | | | | | $ | 24.31 | | | $ | 1,094.86 | | | | | |
By-product credits per ounce | | | (20.90 | ) | | | (15.84 | ) | | | (9.19 | ) | | | | | | | (17.66 | ) | | | (3.65 | ) | | | | |
AISC, After By-product Credits, per Ounce | | $ | 4.47 | | | $ | 13.37 | | | $ | (0.83 | ) | | | | | | $ | 6.65 | | | $ | 1,091.21 | | | | | |
(2)49
Table of ContentsAISC, Before By-product Credits for our consolidated silver properties includes corporate costs for general and administrative expense and sustaining capital. In thousands (except per ounce amounts) | | Three Months Ended September 30, 2016 | |
| | | Greens Creek | | | Lucky Friday(2) | | | San Sebastian | | | Corporate(3) | | | Total Silver | | | Casa Berardi (Gold) | | | Total | |
Cost of sales and other direct production costs and depreciation, depletion and amortization | | $ | 58,397 | | | $ | 19,484 | | | $ | 6,532 | | | | | | | $ | 84,413 | | | $ | 36,295 | | | $ | 120,708 | |
Depreciation, depletion and amortization | | | (16,091 | ) | | | (2,946 | ) | | | (677 | ) | | | | | | | (19,714 | ) | | | (10,465 | ) | | | (30,179 | ) |
Treatment costs | | | 15,114 | | | | 5,211 | | | | 348 | | | | | | | | 20,673 | | | | 218 | | | | 20,891 | |
Change in product inventory | | | (10,407 | ) | | | (46 | ) | | | 930 | | | | | | | | (9,523 | ) | | | 3,460 | | | | (6,063 | ) |
Reclamation and other costs | | | 2,273 | | | | (171 | ) | | | (140 | ) | | | | | | | 1,962 | | | | (115 | ) | | | 1,847 | |
Cash Cost, Before By-product Credits (1) | | | 49,286 | | | | 21,532 | | | | 6,993 | | | | | | | | 77,811 | | | | 29,393 | | | | 107,204 | |
Reclamation and other costs | | | 682 | | | | 165 | | | | 42 | | | | | | | | 889 | | | | 117 | | | | 1,006 | |
Exploration | | | 349 | | | | — | | | | 1,051 | | | | 421 | | | | 1,821 | | | | 655 | | | | 2,476 | |
Sustaining capital | | | 14,162 | | | | 9,725 | | | | 506 | | | | 76 | | | | 24,469 | | | | 16,078 | | | | 40,547 | |
General and administrative | | | | | | | | | | | | | | | 11,155 | | | | 11,155 | | | | | | | | 11,155 | |
AISC, Before By-product Credits (1) | | | 64,479 | | | | 31,422 | | | | 8,592 | | | | | | | | 116,145 | | | | 46,243 | | | | 162,388 | |
By-product credits: | | | | | | | | | | | | | | | | | | | | | | | | | | | | |
Zinc | | | (17,152 | ) | | | (4,201 | ) | | | | | | | | | | | (21,353 | ) | | | | | | | (21,353 | ) |
Gold | | | (13,807 | ) | | | | | | | (10,922 | ) | | | | | | | (24,729 | ) | | | | | | | (24,729 | ) |
Lead | | | (6,577 | ) | | | (9,284 | ) | | | | | | | | | | | (15,861 | ) | | | | | | | (15,861 | ) |
Silver | | | | | | | | | | | | | | | | | | | | | | | (162 | ) | | | (162 | ) |
Total By-product credits | | | (37,536 | ) | | | (13,485 | ) | | | (10,922 | ) | | | | | | | (61,943 | ) | | | (162 | ) | | | (62,105 | ) |
Cash Cost, After By-product Credits | | $ | 11,750 | | | $ | 8,047 | | | $ | (3,929 | ) | | | | | | $ | 15,868 | | | $ | 29,231 | | | $ | 45,099 | |
AISC, After By-product Credits | | $ | 26,943 | | | $ | 17,937 | | | $ | (2,330 | ) | | | | | | $ | 54,202 | | | $ | 46,081 | | | $ | 100,283 | |
Divided by ounces produced | | | 2,445 | | | | 887 | | | | 976 | | | | | | | | 4,308 | | | | 32 | | | | | |
Cash Cost, Before By-product Credits, per Ounce | | $ | 20.15 | | | $ | 24.26 | | | $ | 7.16 | | | | | | | $ | 18.06 | | | $ | 920.00 | | | | | |
By-product credits per ounce | | | (15.35 | ) | | | (15.19 | ) | | | (11.19 | ) | | | | | | | (14.38 | ) | | | (5.07 | ) | | | | |
Cash Cost, After By-product Credits, per Ounce | | $ | 4.80 | | | $ | 9.07 | | | $ | (4.03 | ) | | | | | | $ | 3.68 | | | $ | 914.93 | | | | | |
AISC, Before By-product Credits, per Ounce | | $ | 26.37 | | | $ | 35.41 | | | $ | 8.80 | | | | | | | $ | 26.96 | | | $ | 1,447.40 | | | | | |
By-product credits per ounce | | | (15.35 | ) | | | (15.19 | ) | | | (11.19 | ) | | | | | | | (14.38 | ) | | | (5.07 | ) | | | | |
AISC, After By-product Credits, per Ounce | | $ | 11.02 | | | $ | 20.22 | | | $ | (2.39 | ) | | | | | | $ | 12.58 | | | $ | 1,442.33 | | | | | |
(3)50
TableLucky Friday operations were suspended in August 2023 following the underground fire in the #2 shaft secondary egress and resumed on January 9, 2024. The portion of Contentscash costs, sustaining costs, by-product credits, and silver production incurred during the suspension period are excluded from the calculation of total cost of sales, Cash Cost, Before By-product Credits, Cash Cost, After By-product Credits, AISC, Before By-product Credits, and AISC, After By-product Credits. In thousands (except per ounce amounts) | | Nine Months Ended September 30, 2017 | |
| | | Greens Creek | | | Lucky Friday(2) | | | San Sebastian | | | Corporate(3) | | | Total Silver | | | Casa Berardi (Gold) | | | Total | |
Cost of sales and other direct production costs and depreciation, depletion and amortization | | $ | 140,241 | | | $ | 14,542 | | | $ | 18,377 | | | | | | | $ | 173,160 | | | $ | 134,742 | | | $ | 307,902 | |
Depreciation, depletion and amortization | | | (39,442 | ) | | | (2,433 | ) | | | (2,036 | ) | | | | | | | (43,911 | ) | | | (39,454 | ) | | | (83,365 | ) |
Treatment costs | | | 37,621 | | | | 4,257 | | | | 906 | | | | | | | | 42,784 | | | | 1,774 | | | | 44,558 | |
Change in product inventory | | | 5,398 | | | | 1,811 | | | | (192 | ) | | | | | | | 7,017 | | | | 881 | | | | 7,898 | |
Reclamation and other costs | | | (1,474 | ) | | | (163 | ) | | | (1,089 | ) | | | | | | | (2,726 | ) | | | (354 | ) | | | (3,080 | ) |
Cash Cost, Before By-product Credits (1) | | | 142,344 | | | | 18,014 | | | | 15,966 | | | | | | | | 176,324 | | | | 97,589 | | | | 273,913 | |
Reclamation and other costs | | | 1,999 | | | | 217 | | | | 351 | | | | | | | | 2,567 | | | | 353 | | | | 2,920 | |
Exploration | | | 3,339 | | | | (1 | ) | | | 4,984 | | | | 1,307 | | | | 9,629 | | | | 3,029 | | | | 12,658 | |
Sustaining capital | | | 24,895 | | | | 4,109 | | | | 2,379 | | | | 2,275 | | | | 33,658 | | | | 38,245 | | | | 71,903 | |
General and administrative | | | | | | | | | | | | | | | 29,044 | | | | 29,044 | | | | | | | | 29,044 | |
AISC, Before By-product Credits (1) | | | 172,577 | | | | 22,339 | | | | 23,680 | | | | | | | | 251,222 | | | | 139,216 | | | | 390,438 | |
By-product credits: | | | | | | | | | | | | | | | | | | | | | | | | | | | | |
Zinc | | | (72,472 | ) | | | (4,353 | ) | | | | | | | | | | | (76,825 | ) | | | | | | | (76,825 | ) |
Gold | | | (42,675 | ) | | | | | | | (24,032 | ) | | | | | | | (66,707 | ) | | | | | | | (66,707 | ) |
Lead | | | (22,696 | ) | | | (8,599 | ) | | | | | | | | | | | (31,295 | ) | | | | | | | (31,295 | ) |
Silver | | | | | | | | | | | | | | | | | | | | | | | (450 | ) | | | (450 | ) |
Total By-product credits | | | (137,843 | ) | | | (12,952 | ) | | | (24,032 | ) | | | | | | | (174,827 | ) | | | (450 | ) | | | (175,277 | ) |
Cash Cost, After By-product Credits | | $ | 4,501 | | | $ | 5,062 | | | $ | (8,066 | ) | | | | | | $ | 1,497 | | | $ | 97,139 | | | $ | 98,636 | |
AISC, After By-product Credits | | $ | 34,734 | | | $ | 9,387 | | | $ | (352 | ) | | | | | | $ | 76,395 | | | $ | 138,766 | | | $ | 215,161 | |
Divided by ounces produced | | | 6,206 | | | | 769 | | | | 2,498 | | | | | | | | 9,473 | | | | 113 | | | | | |
Cash Cost, Before By-product Credits, per Ounce | | $ | 22.94 | | | $ | 23.42 | | | $ | 6.39 | | | | | | | $ | 18.62 | | | $ | 862.02 | | | | | |
By-product credits per ounce | | | (22.21 | ) | | | (16.84 | ) | | | (9.62 | ) | | | | | | | (18.46 | ) | | | (3.97 | ) | | | | |
Cash Cost, After By-product Credits, per Ounce | | $ | 0.73 | | | $ | 6.58 | | | $ | (3.23 | ) | | | | | | $ | 0.16 | | | $ | 858.05 | | | | | |
AISC, Before By-product Credits, per Ounce | | $ | 27.81 | | | $ | 29.05 | | | $ | 9.48 | | | | | | | $ | 26.52 | | | $ | 1,229.72 | | | | | |
By-product credits per ounce | | | (22.21 | ) | | | (16.84 | ) | | | (9.62 | ) | | | | | | | (18.46 | ) | | | (3.97 | ) | | | | |
AISC, After By-product Credits, per Ounce | | $ | 5.60 | | | $ | 12.21 | | | $ | (0.14 | ) | | | | | | $ | 8.06 | | | $ | 1,225.75 | | | | | |
In thousands (except per ounce amounts) | | Nine Months Ended September 30, 2016 | |
| | | Greens Creek | | | Lucky Friday(2) | | | San Sebastian | | | Corporate(3) | | | Total Silver | | | Casa Berardi (Gold) | | | Total | |
Cost of sales and other direct production costs and depreciation, depletion and amortization | | $ | 146,984 | | | $ | 56,696 | | | $ | 23,435 | | | | | | | $ | 227,115 | | | $ | 106,639 | | | $ | 333,754 | |
Depreciation, depletion and amortization | | | (40,746 | ) | | | (8,775 | ) | | | (2,508 | ) | | | | | | | (52,029 | ) | | | (32,563 | ) | | | (84,592 | ) |
Treatment costs | | | 46,069 | | | | 15,323 | | | | 1,193 | | | | | | | | 62,585 | | | | 627 | | | | 63,212 | |
Change in product inventory | | | (6,083 | ) | | | (1,102 | ) | | | 1,743 | | | | | | | | (5,442 | ) | | | 4,212 | | | | (1,230 | ) |
Reclamation and other costs | | | 348 | | | | (556 | ) | | | (1,583 | ) | | | | | | | (1,791 | ) | | | (344 | ) | | | (2,135 | ) |
Cash Cost, Before By-product Credits (1) | | | 146,572 | | | | 61,586 | | | | 22,280 | | | | | | | | 230,438 | | | | 78,571 | | | | 309,009 | |
Reclamation and other costs | | | 2,045 | | | | 495 | | | | 126 | | | | | | | | 2,666 | | | | 345 | | | | 3,011 | |
Exploration | | | 1,368 | | | | — | | | | 2,349 | | | | 1,286 | | | | 5,003 | | | | 2,280 | | | | 7,283 | |
Sustaining capital | | | 35,199 | | | | 32,203 | | | | 1,494 | | | | 486 | | | | 69,382 | | | | 48,860 | | | | 118,242 | |
General and administrative | | | | | | | | | | | | | | | 31,728 | | | | 31,728 | | | | | | | | 31,728 | |
AISC, Before By-product Credits (1) | | | 185,184 | | | | 94,284 | | | | 26,249 | | | | | | | | 339,217 | | | | 130,056 | | | | 469,273 | |
By-product credits: | | | | | | | | | | | | | | | | | | | | | | | | | | | | |
Zinc | | | (52,104 | ) | | | (10,685 | ) | | | | | | | | | | | (62,789 | ) | | | | | | | (62,789 | ) |
Gold | | | (42,017 | ) | | | | | | | (33,961 | ) | | | | | | | (75,978 | ) | | | | | | | (75,978 | ) |
Lead | | | (19,598 | ) | | | (25,485 | ) | | | | | | | | | | | (45,083 | ) | | | | | | | (45,083 | ) |
Silver | | | | | | | | | | | | | | | | | | | | | | | (409 | ) | | | (409 | ) |
Total By-product credits | | | (113,719 | ) | | | (36,170 | ) | | | (33,961 | ) | | | | | | | (183,850 | ) | | | (409 | ) | | | (184,259 | ) |
Cash Cost, After By-product Credits | | $ | 32,853 | | | $ | 25,416 | | | $ | (11,681 | ) | | | | | | $ | 46,588 | | | $ | 78,162 | | | $ | 124,750 | |
AISC, After By-product Credits | | $ | 71,465 | | | $ | 58,114 | | | $ | (7,712 | ) | | | | | | $ | 155,367 | | | $ | 129,647 | | | $ | 285,014 | |
Divided by ounces produced | | | 7,021 | | | | 2,722 | | | | 3,434 | | | | | | | | 13,177 | | | | 104 | | | | | |
Cash Cost, Before By-product Credits, per Ounce | | $ | 20.88 | | | $ | 22.63 | | | $ | 6.49 | | | | | | | $ | 17.49 | | | $ | 753.45 | | | | | |
By-product credits per ounce | | | (16.20 | ) | | | (13.29 | ) | | | (9.89 | ) | | | | | | | (13.95 | ) | | | (3.92 | ) | | | | |
Cash Cost, After By-product Credits, per Ounce | | $ | 4.68 | | | $ | 9.34 | | | $ | (3.40 | ) | | | | | | $ | 3.54 | | | $ | 749.53 | | | | | |
AISC, Before By-product Credits, per Ounce | | $ | 26.38 | | | $ | 34.64 | | | $ | 7.64 | | | | | | | $ | 25.74 | | | $ | 1,247.15 | | | | | |
By-product credits per ounce | | | (16.20 | ) | | | (13.29 | ) | | | (9.89 | ) | | | | | | | (13.95 | ) | | | (3.92 | ) | | | | |
AISC, After By-product Credits, per Ounce | | $ | 10.18 | | | $ | 21.35 | | | $ | (2.25 | ) | | | | | | $ | 11.79 | | | $ | 1,243.23 | | | | | |
(1)
| Includes all direct
(5)During the three months ended March 31, 2023, the Company completed the necessary studies to conclude usage of the F-160 pit as a tailings storage facility after mining is complete. As a result, a portion of the mining costs have been excluded from Cash Cost, Before By-product Credits and indirect operating costs related to the physical activities of producing metals, including mining, processing and other plant costs, third-party refining and marketing expense, on-site general and administrative costs, royalties and mining production taxes, before by-product revenues earned from all metals other than the primary metal produced at each unit. AISC, Before By-product Credits also includes on-site exploration, reclamation, and sustaining capital costs. |
(2)
| The unionized employees at Lucky Friday have been on strike since March 13, 2017, and production at Lucky Friday has been limited since that time. For the first nine months of 2017, costs related to suspension of full production totaling approximately $11.1 million, along with $3.3 million in non-cash depreciation expense for that period, have been excluded from the calculations of cost of sales and other direct production costs and depreciation, depletion and amortization, Cash Cost, Before By-product Credits, Cash Cost, After By-product Credits, AISC, Before By-product Credits, and AISC, After By-product Credits.
|
(3)
| AISC, Before By-product Credits for our consolidated silver properties includes corporate costs for general and administrative expense, exploration and sustaining capital.
|
(6)Keno Hill is in the ramp-up phase of production and is excluded from the calculation of total cost of sales, Cash Cost, Before By-product Credits, Cash Cost, After By-product Credits, AISC, Before By-product Credits, and AISC, After By-product Credits.
Financial Liquidity and Capital Resources
Our liquid assets include (in millions):We have a disciplined cash management strategy of maintaining financial flexibility to execute our capital priorities and provide long-term value to our stockholders. Consistent with that strategy, we aim to maintain an acceptable level of net debt and sufficient liquidity to fund debt service costs, operations, capital expenditures, exploration and pre-development projects, while returning cash to stockholders through dividends and potential share repurchases.
| | | September 30, 2017 | | | December 31, 2016 | |
Cash and cash equivalents held in U.S. dollars | | $ | 146.4 | | | $ | 156.1 | |
Cash and cash equivalents held in foreign currency | | | 26.5 | | | | 13.7 | |
Total cash and cash equivalents | | | 172.9 | | | | 169.8 | |
Marketable debt securities - current | | | 33.0 | | | | 29.1 | |
Marketable equity securities - non-current | | | 7.1 | | | | 5.0 | |
Total cash, cash equivalents and investments | | $ | 213.0 | | | $ | 203.9 | |
CashAt March 31, 2024, we had $80.2 million in cash and cash equivalents, increased by $3.1of which $5.5 million in the first nine months of 2017, as discussed below. Cashwas held in foreign currencies representssubsidiaries' local currency that we anticipate utilizing for near-term operating, exploration or capital costs by those foreign subsidiaries. At March 31, 2024, we had utilized $140.0 million drawn on our credit facility of $150 million, with $6.8 million used for letters of credit and the remainder available as borrowings. We also have USD cash and cash equivalent balances in Canadian dollars and Mexican pesos,held by our foreign subsidiaries that, if repatriated, may be subject to withholding taxes. We expect that there would be no additional tax burden upon repatriation after considering the cash cost associated with the $12.8 million increase in the first nine months of 2017 resultingwithholding taxes. We believe that our liquidity and capital resources from increases in both currencies held. Current marketable debt securities increased by $3.9 million (discussed below) and non-current marketable equity securities increased by $2.1 million (see Note 2 of Notes to Condensed Consolidated Financial Statements (Unaudited) for more information).
As discussed in Note 9 of Notes to Condensed Consolidated Financial Statements (Unaudited), on April 12, 2013, we completed an offering of Senior Notes in the total principal amount of US$500 million, which have a total principal balance of $506.5 million as of September 30, 2017. The Senior Notesour U.S. operations are due May 1, 2021 and bear interest at a rate of 6.875% per year from the most recent payment date to which interest has been paid or provided for. Interest on the Senior Notes is payable on May 1 and November 1 of each year, commencing November 1, 2013, and we have made all interest payments payable to date.
In the third quarter of 2015, we made a development decision to mine near surface, high grade portions of the silver and gold deposits at our San Sebastian project in Mexico and commenced ore production at the end of 2015. As a result, San Sebastian has generated positive cash flows since the start of production there. In January 2017, we initiated work to develop and rehabilitate underground access which, upon completion, is expected to allow us to mine deeper portions of the deposits at San Sebastian. We currently anticipate San Sebastian will continue to generate positive cash flows until early or mid-2020. However, our costs could change, and our ability to generate cash flow at San Sebastian could be impacted by changes in precious metals prices or other factors, and there can be no assurance that we will be able to develop and operate San Sebastian as anticipated.
As further discussed in the Lucky Friday Segment section above, the union employees at Lucky Friday have been on strike since March 13, 2017. Production at Lucky Friday was suspended from the start of the strike until July 2017, with limited production resuming at that time. We cannot predict how long the strike will last or whether an agreement will be reached. We expect to incur cash expenditures of approximately $1.0 million to $1.5 million per month to advance engineering and infrastructure for the restart of full production, in addition to costs related to limited interim production. As a result of the strike or other related events, operations at Lucky Friday could continue to be disrupted, which could adversely affect our financial condition and results of operations.
As discussed in Note 8 of Notes to Condensed Consolidated Financial Statements (Unaudited), in February 2016 we entered into an equity distribution agreement under which we may issue and sell shares of our common stock from time to time having an aggregate offering price of up to $75 million, with the net proceeds available for general corporate purposes. Whether or not we engage in sales from time to time may depend on a variety of factors, including share price, our cash resources, customary black-out restrictions, and whether we have any material inside information, and the agreement can be terminated by us at any time. As of September 30, 2017, we had sold 4,608,847 shares through the at-the-market program for net proceeds of $17.7 million, including 1,828,760 shares sold in the first nine months of 2017 for total proceeds of approximately $9.6 million. In July 2017, we used $5.7 million of the proceeds from shares sold in the second quarter of 2017adequate to fund contributions to our defined benefit pension plans.U.S. operations and corporate activities.
Pursuant to our common stock dividend policy described inNote 812 of Notes to Condensed Consolidated Financial Statements (Unaudited),in our 2023 Form 10-K, our Board of Directors declared and paid dividends on our common stock totaling $3.0of $3.9 million and $2.9$3.8 million, in the first nine monthsquarters of 20172024 and 2016,2023, respectively. On November 7, 2017, our Board of Directors declared a dividend on common stock totaling $1.0 million payable in December 2017. Our dividend policy has a silver-price-linkedsilver-linked component which ties the amount of declared common stock dividends to our realized silver price for the preceding quarter. Another component of our common stock dividend policy anticipates paying an annual minimum dividend.
For illustrative purposes only, the table below summarizes potential dividend amounts under our dividend policy.
| | | | | | | | | | |
Quarterly Average Realized Silver Price ($ per ounce) | | | Quarterly Silver-Linked Dividend ($ per share) | | Annualized Silver-Linked Dividend ($ per share) | | Annualized Minimum Dividend ($ per share) | | Annualized Dividends per Share: Silver-Linked and Minimum ($ per share) |
Less than $20 | | | $— | | $— | | $0.015 | | $0.015 |
$ | 20 | | | $0.0025 | | $0.01 | | $0.015 | | $0.025 |
$ | 25 | | | $0.010 | | $0.04 | | $0.015 | | $0.055 |
$ | 30 | | | $0.015 | | $0.06 | | $0.015 | | $0.075 |
$ | 35 | | | $0.025 | | $0.10 | | $0.015 | | $0.115 |
$ | 40 | | | $0.035 | | $0.14 | | $0.015 | | $0.155 |
$ | 45 | | | $0.045 | | $0.18 | | $0.015 | | $0.195 |
$ | 50 | | | $0.055 | | $0.22 | | $0.015 | | $0.235 |
The declaration and payment of dividends on our common stock is at the sole discretion of our boardBoard of directors,Directors, and there can be no assurance that we will continue to declare and pay common stock dividends in the future.
On May 8, 2012, we announced thatPursuant to our board of directors approved a stock repurchase program. Under the program described in Note 12 of Notes to Consolidated Financial Statements in our 2023 Form 10-K, we are authorized to repurchase up to 20 million shares of our outstanding common stock from time to time in open market or privately negotiated transactions, depending on prevailing market conditions and other factors. The repurchase program may be modified, suspended or discontinued by us at any time. Whether or not we engage in repurchases from time to time may depend on a variety of factors, including not only price and cash resources, but customary black-out restrictions, whether we have any material inside information, limitations on share repurchases or cash usage that may be imposed by our credit agreement or in connection with issuances of securities, alternative uses for cash, applicable law, and other investment opportunities from time to time. As of September 30, 2017,March 31, 2024 and December 31, 2023, 934,100 shares havehad been purchased in prior periods at an average price of $3.99 per share, leaving 19.1 million shares that may yet be purchased under the program. The closing priceWe have not repurchased any shares since June 2014.
As discussed in Note 6 of Notes to Condensed Consolidated Financial Statements (Unaudited) pursuant to an equity distribution agreement dated February 18, 2021, we may offer and sell up to 60 million shares of our common stock from time to time to or through sales agents in “at-the-market” offerings. Sales of the shares, if any, will be made by means of ordinary brokers transactions or as otherwise agreed between the Company and the agents as principals. Whether or not we engage in sales from time to time may depend on a variety of factors, including share price, our cash resources, customary black-out restrictions, and whether we have any material inside information. The equity distribution agreement can be terminated by us at November 3, 2017, was $4.45 per share.any time. Any sales of shares under that agreement are registered under the Securities Act of 1933, as amended, pursuant to a shelf registration statement on Form S-3. During the three months ended March 31, 2024, we sold 248,561 shares under the agreement for proceeds of $1.1 million, net of commissions and fees of $0.04 million.
As a result of our current cash balances, the performance of our current and expected operations, current metals prices, proceeds from potential at-the-market sales of common stock, and availability under our New Credit Agreement, we believe we will be able to meet our obligations and other potential cash requirements during the next 12 months and beyond. Our obligations and other uses of cash may include, but are not limited to: debt service obligations related to the Senior Notes and IQ Notes; principal and interest payments under our Credit Agreement; care-and-maintenance; capital expenditures at our operations; potential acquisitions of other mining companies or properties; regulatory matters; litigation; potential repurchases of our common stock under the program described above; and payment of dividends on common stock, if declared by our Board of Directors.
We currently estimate a range of approximately $190to $210million (before any lease financing) will be spent in 2024 on capital expenditures, primarily for equipment, infrastructure, and development at our mines, including $47.6 million already incurred as of March 31, 2024. We also estimate exploration and pre-development expenditures will total approximately $32.5 million in 2024, including $4.3 million already incurred as of March 31, 2024. Our expenditures for these items and our related plans for 2024 may change based upon our financial position, metals prices, and other considerations. Our ability to fund the activities described above will depend on our operating performance, metals prices, our ability to estimate revenues and costs, sources of liquidity available to us, including the revolving credit facility, and other factors. A sustained downturn in metals prices, significant increase in operational or capital costs or other uses of cash, our inability to access the credit facility or the sources of liquidity discussed above, or other factors beyond our control could impact our plans.
We may defer some capital investment and/or exploration and pre-development activities, engage in asset sales or secure additional capital if necessary to maintain liquidity. We also may pursue additional acquisition opportunities, which could require additional equity issuances or other forms of financing. There can be no assurance that such financing will be available to us.
As a result of our current cash balances, the performance of our currentOur liquid assets include (in millions):
| | | | | | | | |
| | March 31, 2024 | | | December 31, 2023 | |
Cash and cash equivalents held in U.S. dollars | | $ | 74.7 | | | $ | 98.8 | |
Cash and cash equivalents held in foreign currency | | | 5.5 | | | | 7.6 | |
Total cash and cash equivalents | | | 80.2 | | | | 106.4 | |
Marketable equity securities - non-current | | | 32.9 | | | | 33.7 | |
Total cash, cash equivalents and investments | | $ | 113.1 | | | $ | 140.1 | |
Cash and expected operations, current metals prices, proceeds from potential at-the-market sales of common stock, and availability of approximately $97 million of our revolving credit facility, we believe our cash, cash equivalents investments, projected cash from operations, and availability of financing, if needed, will be adequate to meet our obligations and other potential cash requirements during the next 12 months. Our obligations and other uses of cash may include, but are not limited to: debt service obligations related to the Senior Notes, capital expenditures at our operations, potential acquisitions of other mining companies or properties, regulatory matters, litigation, potential repurchases of our common stock under the program described above, and payment of dividends on common stock, if declareddecreased by our board of directors. We estimate capital expenditures will total between $105 and $110$26.2 million in 2017, including $70.4 million already incurred asthe first three months of September 30, 2017. We estimate combined exploration2024. Cash held in foreign currencies represents balances in Canadian dollars and pre-development expenditures will total between $25 million and $30 million in 2017, including $21.7 million already incurred asMexican Pesos. The value of September 30, 2017. However, capital, exploration, and pre-development expenditures may change based upon our financial position, metals prices, and other considerations. Our ability to fund the activities described above will depend on our operating performance, metals prices, our costs (and our ability to estimate future costs), sources of liquidity available to us, and other factors. A sustained downturn in metals prices or significant increase in operational or capital costs, other uses of cash, or other factors beyond our control could impact our plans.non-current marketable equity securities decreased by $0.8 million.
| | | | | | | | |
| | Three Months Ended | |
| | March 31, 2024 | | | March 31, 2023 | |
Cash provided by operating activities (in millions) | | $ | 17.1 | | | $ | 40.6 | |
| | | Nine Months Ended | |
| | | September 30, 2017 | | | September 30, 2016 | |
Cash provided by operating activities (in millions) | | $ | 74.1 | | | $ | 173.1 | |
Cash provided by operating activities for the three months ended March 31, 2024 of $17.1 million represented a $23.5 million decreasecompared to the $40.6 million provided in the first ninesame period for 2023. $14.7 million of the variance was attributable to a higher income adjusted for non-cash items, reflecting higher non-cash depreciation, depletion and amortization expense and higher inventory write downs. The remaining variance was attributable to negative net working capital changes resulting from the resumption of operations following suspension at Lucky Friday consuming working capital, higher accounts receivable balances reflecting the timing of sales at Greens Creek and Keno Hill and an increase in inventory at Keno Hill
| | | | | | | | |
| | Three Months Ended | |
| | March 31, 2024 | | | March 31, 2023 | |
Cash used in investing activities (in millions) | | $ | (47.5 | ) | | $ | (54.4 | ) |
During the three months ended March 31, 2024, we invested $47.6 million in capital expenditures, a decrease of 2017 decreased by $99.0$6.9 million compared to the same period in 2016 due to lower income, as adjusted for non-cash items, resulting primarily from reduced gross profit at our San Sebastian, Casa Berardi and Lucky Friday units. In addition, working capital and other operating asset and liability changes resulted in a net cash flow decrease of $26.4 million in the first nine months of 2017 compared to a net increase of $11.6 million in the first nine months of 2016.2023. The $38.0 million variance in working capital changes is primarily attributable to (i) estimated income tax payments in Mexico in 2017, (ii) higher product inventory due primarily to the timing of shipments at Greens Creek and the strike at Lucky Friday, (iii) lower accruals for incentive compensation, and (iv) reduced accounts payable at Lucky Friday due to completion of the #4 Shaft and the strike. Those factors were partially offset by lower accounts receivable, also due to the timing of shipments at Greens Creek and the strike at Lucky Friday. In addition, in the third quarter of 2016, we reached a settlement on the insurance policy for reclamation at the Troy mine resulting in cash proceeds to us of $16.0 million, which was partially offset by payment of $6.0 million in August 2016 by one of our subsidiaries for settlement of its liability for response costs at a CERCLA/Superfund site.
| | | Nine Months Ended | |
| | | September 30, 2017 | | | September 30, 2016 | |
Cash used in investing activities (in millions) | | $ | (69.2 | ) | | $ | (153.3 | ) |
During the first nine months of 2017, we invested $70.4 million in capital expenditures, not including $6.4 million in non-cash capital lease additions, a decrease of $49.8 million compared to the same period in 2016 primarily due to lower costs for (i) the #4 Shaft project, which was completed in January 2017, (ii) construction of the tailings facilitycapital spending at Greens Creek,Keno Hill and (iii) development of the EMCP pit at Casa Berardi. In the first nine months of 2017 and 2016, we purchased bonds having maturities of greater than 90 days and less than 365 days with a cost basis of $35.3 million and $31.9 million, respectively, and bonds valued at $31.2 million and $7.2 million matured during the first nine months of 2017 and 2016, respectively. We purchased marketable equity securities having a cost basis of $1.6 million and $0.9 million during the first nine months of 2017 and 2016, respectively.
| | | | | | | | |
| | Three Months Ended | |
| | March 31, 2024 | | | March 31, 2023 | |
Cash provided by financing activities (in millions) | | $ | 4.9 | | | $ | 5.0 | |
During the first ninethree months ended March 31, 2024, we had net draws of 2017, we received $5.6$12.0 million on our revolving credit facility resulting in insurance proceeds related collapse$140.0 million outstanding at an interest rate of the mill building at the Troy mine in February 2017 due to snow. We recognized a cash outflow for the acquisition of Mines Management, net of cash acquired, of $3.9 million in September 2016. We reduced restricted cash by $1.1 million during the first nine months of 2017 as a result of replacing cash collateral for future reclamation costs with non-cash bonding.8.0% on March 31, 2024. During the first nine months of 2016, we incurred an increase in restricted cash of $3.9 million related to the settlement of a CERCLA claim for response costs at a CERCLA/Superfund site by one of our subsidiaries.
| | | Nine Months Ended | |
| | | September 30, 2017 | | | September 30, 2016 | |
Cash used in financing activities (in millions) | | $ | (2.8 | ) | | $ | (7.8 | ) |
During the first nine months of 2017 and 2016, we received $9.6 million and $8.1 million, respectively, in net proceeds from the sale of shares of our common stock under the equity distribution agreement discussed above. We made repayments on our capital leases of $5.1 million and $6.3 million in the nine-month periods ended September 30, 2017March 31, 2024 and 2016, respectively. We also made repayments of debt totaling $0.5 million and $1.8 million in the first nine months of 2017 and 2016, respectively. During the first nine months of 2017 and 2016, 2023:
•we paid cash dividends on our common and preferred stock totaling $3.0$4.0 million and $2.9$3.9 million, respectively, and cash dividends of $0.4 million in each period onrespectively.
•we issued stock under our
Series B Preferred Stock. We acquired treasury sharesATM program described above for
$3.0 million and $4.4 million in the first nine months of 2017 and 2016, respectively, resulting primarily from our employees' elections to utilize net
share settlement to satisfy their tax withholding obligations related to incentive compensation paid in stock and vesting of restricted stock units. See Note 8 of Notes to Condensed Consolidated Financial Statements (Unaudited) for more information.Exchange rate fluctuations between the U.S. dollar and the Canadian dollar and Mexican peso resulted in increases in our cash balanceproceeds of $1.1 million and $0.6$11.9 million, respectively, during the nine months ended September 30, 2017and
•we made repayments on our finance leases of $3.0 million and 2016.$2.5 million, respectively.
Contractual Obligations, Contingent Liabilities and Commitments
The table below presents our fixed, non-cancelable contractual obligations and commitments primarily related to our Senior Notes, IQ Notes, credit facility, outstanding purchase orders, certain capital expenditures our credit facilityand lease arrangements as of September 30, 2017March 31, 2024 (in thousands):
| | | | | | | | | | | | | | | | | | | | |
| | Payments Due By Period | |
| | Less than 1 year | | | 1-3 years | | | 4-5 years | | | More than
5 years | | | Total | |
Purchase obligations (1) | | $ | 42,084 | | | $ | — | | | $ | — | | | $ | — | | | $ | 42,084 | |
Credit facility(2) | | | 140,024 | | | | 55 | | | | — | | | | — | | | | 140,079 | |
Finance lease commitments (3) | | | 9,669 | | | | 12,289 | | | | 3,404 | | | | 1,027 | | | | 26,389 | |
Operating lease commitments (4) | | | 2,431 | | | | 3,126 | | | | 1,182 | | | | 6,736 | | | | 13,475 | |
Senior Notes (5) | | | 34,438 | | | | 68,876 | | | | 505,131 | | | | — | | | | 608,445 | |
IQ Notes (6) | | | 2,322 | | | | 38,605 | | | | — | | | | — | | | | 40,927 | |
Total contractual cash obligations | | $ | 230,968 | | | $ | 122,951 | | | $ | 509,717 | | | $ | 7,763 | | | $ | 871,399 | |
| | | Payments Due By Period | |
| | | Less than 1 year | | | 1-3 years | | | 4-5 years | | | More than 5 years | | | Total | |
Purchase obligations (1) | | $ | 23,100 | | | $ | — | | | $ | — | | | $ | — | | | $ | 23,100 | |
Commitment fees (2) | | | 500 | | | | 942 | | | | — | | | | — | | | | 1,442 | |
Contractual obligations (3) | | | 471 | | | | — | | | | — | | | | — | | | | 471 | |
Capital lease commitments (4) | | | 6,293 | | | | 6,548 | | | | 1,260 | | | | — | | | | 14,101 | |
Operating lease commitments (5) | | | 2,993 | | | | 2,337 | | | | 1,377 | | | | 159 | | | | 6,866 | |
Supplemental executive retirement plan (6) | | | 444 | | | | 1,061 | | | | 1,439 | | | | 3,730 | | | | 6,674 | |
Senior Notes (7) | | | 34,822 | | | | 69,644 | | | | 526,813 | | | | — | | | | 631,279 | |
Total contractual cash obligations | | $ | 68,623 | | | $ | 80,532 | | | $ | 530,889 | | | $ | 3,889 | | | $ | 683,933 | |
| (1)
| Consists of open purchase orders of approximately $20.9 million at the Greens Creek unit, $0.3 million at the Lucky Friday unit and $1.9 million as the Casa Berardi unit.
|
| (2)
| We have a $100 million revolving credit agreement under which we are required to pay a standby fee of 0.5% per annum on undrawn amounts under the revolving credit agreement. There was no amount due under the revolving credit agreement as of September 30, 2017, and the amounts above assume no amounts will be due during the agreement's term. For more information on our credit facility, see Note 9 of Notes to Condensed Consolidated Financial Statements (Unaudited).
|
| (3)
| As of September 30, 2017, we were committed to approximately $0.5 million for various items at Greens Creek.
|
| (4)
| Includes scheduled capital lease payments of $2.9 million, $3.8 million, and $7.4 million (including interest) for equipment at our Greens Creek, Lucky Friday and Casa Berardi units, respectively. These leases have fixed payment terms and contain bargain purchase options at the end of the lease periods (see Note 9 of Notes to Condensed Consolidated Financial Statements (Unaudited) for more information).
|
| (5)
| We enter into operating leases in the normal course of business. Substantially all lease agreements have fixed payment terms based on the passage of time. Some lease agreements provide us with the option to renew the lease or purchase the leased property. Our future operating lease obligations would change if we exercised these renewal options and if we entered into additional operating lease arrangements.
|
| (6)
| These amounts represent our estimate of the future funding requirements for the supplemental executive retirement plan. See Note 7 of Notes to Condensed Consolidated Financial Statements (Unaudited) for more information.
|
| (7)
| On April 12, 2013, we completed an offering of $500 million in aggregate principal amount of our Senior Notes due May 1, 2021. See Note 9 of Notes to Condensed Consolidated Financial Statements (Unaudited) for more information. The Senior Notes bear interest at a rate of 6.875% per year from the most recent payment date to which interest has been paid or provided for. Interest on the Senior Notes is payable on May 1 and November 1 of each year, commencing November 1, 2013, and we have made all interest payments payable to date. Since the initial offering, we have issued an additional $6.5 million in aggregate principal amount of the Senior Notes to fund obligations under our defined benefit pension plans. See Note 7 and Note 9 of Notes to Condensed Consolidated Financial Statements (Unaudited) for more information.
|
(1)56
TableConsists of Contentsopen purchase orders and commitments of approximately $11.1 million, $17.5million, $10.2 million, $2.5 million and $0.8 million for various capital and non-capital items at Greens Creek, Lucky Friday, Keno Hill, Casa Berardi and Other Operations, respectively.
(2)The Credit Agreement provides for a $150 million revolving credit facility. We had net draws of $140.0 million and $6.8 million in letters of credit outstanding as of March 31, 2024. The amounts in the table above assume no additional amounts will be drawn in future periods, and include only the standby fee on the current undrawn balance and accrued interest. For more information on our credit facility, see Note 7 of Notes to Condensed Consolidated Financial Statements (Unaudited).
(3)Includes scheduled finance lease payments of $6.3 million, $5.7 million, $7.9 million, and $6.5 million for equipment at Greens Creek, Lucky Friday, Casa Berardi, and Keno Hill, respectively.
(4)We enter into operating leases in the normal course of business. Substantially all lease agreements have fixed payment terms based on the passage of time. Some lease agreements provide us with the option to renew the lease or purchase the leased property. Our future operating lease obligations would change if we exercised these renewal options and if we entered into additional operating lease arrangements.
(5)On February 19, 2020, we completed an offering of $475 million in aggregate principal amount of our Senior Notes due February 15, 2028. The Senior Notes bear interest at a rate of 7.25% per year, with interest payable on February 15 and August 15 of each year. See Note 7 of Notes to Condensed Consolidated Financial Statements (Unaudited) for more information.
(6)On July 9, 2020, we entered into a note purchase agreement pursuant to which we issued our IQ Notes for CAD$50 million (approximately USD$36.8 million at the time of the transaction) in aggregate principal amount. The IQ Notes bear interest on amounts outstanding at a rate of 6.515% per year, payable on January 9 and July 9 of each year. See Note 7 of Notes to Condensed Consolidated Financial Statements (Unaudited) for more information.
We record liabilities for costs associated with mine closure, reclamation of land and other environmental matters. At September 30, 2017,March 31, 2024, our liabilities for these matters totaled $87.3$121.3 million. Future expenditures related to closure, reclamation and environmental expenditures at our sites are difficult to estimate, andalthough we anticipate we will incur expenditures relating to these obligations over the next 30 years. For additional information relating to certain of our environmental obligations, see Note 410 of Notes to Condensed Consolidated Financial Statements (Unaudited).
Critical Accounting Estimates
There have been no significant changes to the critical accounting estimates disclosed in Management's Discussion and Analysis of Financial Condition and Results of Operations in our 2023 Form 10-K.
Off-Balance Sheet Arrangements
At September 30, 2017,March 31, 2024, we had no existing off-balance sheet arrangements, as defined under SEC regulations, that have or are reasonably likely to have a current or future effect on our financial condition, revenues or expenses, results of operations, liquidity, capital expenditures or capital resources that would beare material to investors.
Guarantor Subsidiaries
Critical Accounting Estimates
Our significant accounting policiesPresented below are described in Part IV, Hecla’s unaudited interim condensed consolidating financial statements as required by Rule 3-10 of Regulation S-X of the Securities Exchange Act of 1934, as amended, resulting from the guarantees by certain of Hecla's subsidiaries of the Senior Notes and IQ Notes (see Note 17 of Notes to Condensed Consolidated Financial Statements in our annual report filed on Form 10-K (Unaudited) for the year ended December 31, 2016more information). As described in Note 1 The Guarantors consist of the following of Hecla's 100%-owned subsidiaries: Hecla Limited; Silver Hunter Mining Company; Rio Grande Silver, Inc.; Hecla MC Subsidiary, LLC; Hecla Silver Valley, Inc.; Burke Trading, Inc.; Hecla Montana, Inc.; Revett Silver Company; RC Resources, Inc.; Troy Mine Inc.; Revett Exploration, Inc.; Revett Holdings, Inc.; Mines Management, Inc.; Newhi, Inc.; Montanore Minerals Corp.; Hecla Alaska LLC; Hecla Greens Creek Mining Company; Hecla Admiralty Company; Hecla Juneau Mining Company; Klondex Holdings Inc.; Klondex Gold & Silver Mining Co.; Klondex Midas Holdings Limited; Klondex Aurora Mine Inc.; Klondex Hollister Mine Inc.; Hecla Quebec, Inc.; and Alexco Resource Corp. We completed the offering of the Senior Notes on February 19, 2020 under our shelf registration statement previously filed with the SEC. We issued the IQ Notes in four equal tranches between July and October 2020.
The unaudited interim condensed consolidating financial statements below have been prepared from our financial information on the same basis of accounting as the unaudited interim condensed consolidated financial statements set forth elsewhere in this report. Investments in the subsidiaries are accounted for under the equity method. Accordingly, the entries necessary to consolidate Hecla, the Guarantors, and our non-guarantor subsidiaries are reflected in the intercompany eliminations column. In the course of preparing consolidated financial statements, we eliminate the effects of various transactions conducted between Hecla and its subsidiaries and among the subsidiaries. While valid at an individual subsidiary level, such activities are eliminated in consolidation because, when taken as a whole, they do not represent business activity with third-party customers, vendors, and other parties. Examples of such eliminations include the following:
•Investments in subsidiaries. The acquisition of a company results in an investment in debt or equity capital on the records of the parent company and a contribution to debt or equity capital on the records of the subsidiary. Such investments and capital contributions are eliminated in consolidation.
•Capital contributions. Certain of Hecla's subsidiaries do not generate cash flow, either at all or that is sufficient to meet their capital needs, and their cash requirements are routinely met with inter-company advances from their parent companies. Generally on an annual report, we are requiredbasis, when not otherwise intended as debt, the Boards of Directors of such parent companies declare contributions of capital to make estimatestheir subsidiary companies, which increase the parents' investment and assumptions that affect the reported amountssubsidiaries' additional paid-in capital. Occasionally, parent companies may also subscribe for additional common shares of their subsidiaries. In consolidation, investments in subsidiaries and related disclosuresadditional paid-in capital are eliminated.
•Debt. At times, inter-company debt agreements have been established between certain of assets, liabilities, revenue,Hecla's subsidiaries and expenses. Our estimatestheir parents. The related debt liability and receivable balances, accrued interest expense (if any) and income activity (if any), and payments of principal and accrued interest amounts (if any) by the subsidiary companies to their parents are based on our experience and our interpretationeliminated in consolidation.
•Dividends. Certain of economic, political, regulatory, and other factors that affect our business prospects. Actual results may differ significantly from our estimates.We believe that our most critical accounting estimates are relatedHecla's subsidiaries which generate cash flow routinely provide cash to future metals prices; obligations for environmental, reclamation, and closure matters; mineral reserves; and accounting for business combinations, as they require us to make assumptions that are highly uncertain at the time the accounting estimates are made and changes in them are reasonably likely to occur from period to period. Management has discussed the development and selection of these critical accounting estimates with the Audit Committee of our Board of Directors, and the Audit Committee has reviewed the disclosures presented below. In addition, there are other items within our financial statements that require estimation, but are not deemed to be critical. However, changes in estimates used in these and other items could have a material impact on our financial statements.
Future Metals Prices
Metals prices are key components in estimates that determine the valuation of some of our significant assets and liabilities, including properties, plants and equipment, deferred tax assets, and certain accounts receivable. Metals prices are also an important component in the estimation of reserves. As shown under Part I, Item 1A. – Risk Factors in our annual report filed on Form 10-K for the year ended December 31, 2016, metals prices have historically been volatile. Silver demand arises from investment demand, particularly in exchange-traded funds, industrial demand, and consumer demand. Gold demand arises primarily from investment and consumer demand. Investment demand for silver and gold can be influenced by several factors, including: the value of the U.S. dollar and other currencies, changing U.S. budget deficits, widening availability of exchange-traded funds, interest rate levels, the health of credit markets, and inflationary expectations. Uncertainty related to the political environment in the U.S., Britain's exit from the European Union and a global economic recovery, including recent uncertainty in China, could result in continued investment demand for precious metals. Industrial demand for silver is closely linked to world Gross Domestic Product growth and industrial fabrication levels, as it is difficult to substitute for silver in industrial fabrication. Consumer demand is driven significantly by demand for jewelry and other retail products. We believe that long-term industrial and economic trends, including urbanization and growth of the middle class in countries such as China and India, will result in continued consumer demand for silver and gold and industrial demand for silver. However, China has recently experienced a lower rate of economic growth which could continue in the near term. There can be no assurance whether these trends will continue or how they will impact prices of the metals we produce. In the past, we have recorded impairments to our asset carrying value because of low prices, and we can offer no assurance that prices will either remain at their current levels or increase.
Processes supporting valuation of our assets and liabilities that are most significantly affected by prices include analysis of asset carrying values, depreciation, reserves, and deferred income taxes.parent companies through inter-company transfers. On at least an annual basis, -the Boards of Directors of such subsidiary companies declare dividends to their parent companies, which reduces the subsidiaries' retained earnings and more frequently if circumstances warrant - we examine our depreciation rates, reserve estimates,increases the parents' dividend income. In consolidation, such activity is eliminated.
•Deferred taxes. Our ability to realize deferred tax assets and liabilities is considered for two consolidated tax groups of subsidiaries within the United States: The Nevada U.S. Group and the valuation allowances on our deferredHecla U.S. Group. Within each tax assets. We examinegroup, all subsidiaries' estimated future taxable income contributes to the carrying valuesability of ourtheir tax group to realize all such assets as changes in facts and circumstances warrant. In our evaluation of carrying values and deferred taxes, we apply several pricing views to our forecasting model, including current prices, analyst price estimates, forward-curve prices, and historical prices (see Mineral Reserves, below, regarding prices used for reserve estimates). Using applicable accounting guidance and our view of metals markets,liabilities. However, when Hecla's subsidiaries are viewed independently, we use the probability-weighted averageseparate return method to assess the realizability of the various methods to determineeach subsidiary's deferred tax assets and whether the values of our assets are fairly stated, and to determine the level ofa valuation allowances, if any, on ourallowance is required against such deferred tax assets. In addition, estimatessome instances, a parent company or subsidiary may possess deferred tax assets whose realization depends on the future taxable incomes of future metals prices are usedother subsidiaries on a consolidated-return basis, but would not be considered realizable if such parent or subsidiary filed on a separate stand-alone basis. In such a situation, a valuation allowance is assessed on that subsidiary's deferred tax assets, with the resulting adjustment reported in the valuationeliminations column of certain assetsthe guarantor and parent's financial statements, as is the case in the determination of the purchase price allocations for our acquisitions (see Business Combinations below).Sales of concentrates sold directly to customers are recorded as revenues when title and risk of loss transfer to the customer (generally at the time of shipment) using estimated forward metals prices for the estimated month of settlement. Due to the time elapsed between shipment of concentrates to the customer and final settlement with the customer, we must estimate the prices at which sales of our metals will be settled. Previously recorded sales and trade accounts receivable are adjusted to estimated settlement prices until final settlement by the customer. Changes in metals prices between shipment and final settlementunaudited interim financial statements set forth below. The separate return method can result in changes to revenues and accounts receivable previously recorded upon shipment. As a result, our trade accounts receivable balances related to concentrate sales are subject to changes in metals prices until final settlement occurs. For more information, see part N. Revenue Recognition of Note 1 of Notes to Consolidated Financial Statements in our annual report filed on Form 10-K for the year ended December 31, 2016.
We utilize financially-settled forward contracts to manage our exposure to changes in prices for silver, gold, zinc and lead. See Item 7A. – Quantitative and Qualitative Disclosures About Market Risk - Commodity-Price Risk Management below for more information on our contract programs. These contracts do not qualify for hedge accounting and are therefore marked-to-market through earnings each period. Changes in silver, gold, zinc and lead prices between the dates that the contracts are entered into and their settlements will result in changes to the fair value asset or liability associated with the contracts, with a corresponding gain or loss recognized in earnings.
Obligations for Environmental, Reclamation and Closure Matters
Accrued reclamation and closure costs can represent a significant and variable liability on our balance sheet. We have estimated our liabilities under appropriate accounting guidance, and on at least an annual basis - and more frequently if warranted - management reviews our liabilities with our Audit Committee. However, the ranges of liability could exceed the liabilities recognized. If substantial damages were awarded, claims were settled, or remediation costs incurred in excess of our accruals, our financial results or condition could be materially adversely affected.
Mineral Reserves
Critical estimates are inherent in the process of determining our reserves. Our reserves are affected largely by our assessment of future metals prices, as well as by engineering and geological estimates of ore grade, accessibility and production cost. Metals prices are estimated at long-term averages, as described in Part I, Item 2. – Properties in our annual report filed on Form 10-K for the year ended December 31, 2016. Our assessment of reserves occurs at least annually, and periodically utilizes external audits.
Reserves are a key component in the valuation of our properties, plants and equipment. Reserve estimates are used in determining appropriate rates of units-of-production depreciation, with net book value of many assets depreciated over remaining estimated reserves. Reserves are also a key component in forecasts, with which we compare future cash flows to current asset values in an effort to ensure that carrying values are reported appropriately. Our forecasts are also used in determining the level of valuation allowances on our deferred tax assets. Reserves also play a key role in the valuation of certain assets in the determination of the purchase price allocations for acquisitions. Annual reserve estimates are also used to determine conversions of mineral assets beyond the known reserve resulting from business combinations to depreciable reserves, in periods subsequent to the business combinations (see Business Combinations below). Reserves are a culmination of many estimates and are not guarantees that we will recover the indicated quantities of metals or that we will do so at a profitable level.
Business Combinations
We are required to allocate the purchase price of acquired companies to the tangible and intangible assets acquired and liabilities assumed based on their estimated fair values at the acquisition date. The valuation of assets acquired and liabilities assumed requires management to make significant estimates and assumptions, especially with respect to long-lived assets (including mineral assets beyond the known reserve). These estimates include future metals prices and mineral reserves, as discussed above. Management may also be required to make estimates related to the valuationeliminations of deferred tax assets orand liabilities as part of the purchase price allocation for business combinations. In some cases, we use third-party appraisers to determine the fair values and lives of propertyrelated income tax provisions and other identifiable assets. In addition, costs related to business combinationsbenefits. Non-current deferred tax asset balances are included in earningsother non-current assets on the consolidating balance sheets and make up a large portion of that item, particularly for the guarantor balances.
Separate financial statements of the Guarantors are not presented because the guarantees by the Guarantors are joint and several and full and unconditional, except for certain customary release provisions, including: (1) the sale or disposal of all or substantially all of the assets of the Guarantor; (2) the sale or other disposition of the capital stock of the Guarantor; (3) the Guarantor is designated as incurred,an unrestricted entity in accordance with the applicable provisions of the indenture; (4) Hecla ceases to be a borrower as defined in the indenture; and our financial results for periods in which business combinations are pursued could be adversely affected as a result.(5) upon legal or covenant defeasance or satisfaction and discharge of the indenture.
Unaudited Interim Condensed Consolidating Balance Sheets
| | | | | | | | | | | | | | | | | | | | |
| | As of March 31, 2024 | |
| | Parent | | | Guarantors | | | Non-Guarantors | | | Eliminations | | | Consolidated | |
| | (in thousands) | |
Assets | | | | | | | | | | | | | | | |
Cash and cash equivalents | | $ | 72,059 | | | $ | 7,417 | | | $ | 693 | | | $ | — | | | $ | 80,169 | |
Other current assets | | | 15,761 | | | | 145,794 | | | | 13,526 | | | | — | | | | 175,081 | |
Properties, plants, equipment and mineral interests, net | | | — | | | | 2,654,819 | | | | 8,336 | | | | — | | | | 2,663,155 | |
Intercompany receivable (payable) | | | (84,511 | ) | | | (904,893 | ) | | | 595,872 | | | | 393,532 | | | | 0 | |
Investments in subsidiaries | | | 2,186,720 | | | | — | | | | — | | | | (2,186,720 | ) | | | — | |
Other non-current assets | | | 443,643 | | | | 20,798 | | | | 27,546 | | | | (416,134 | ) | | | 75,853 | |
Total assets | | $ | 2,633,672 | | | $ | 1,923,935 | | | $ | 645,973 | | | $ | (2,209,322 | ) | | $ | 2,994,258 | |
Liabilities and Stockholders' Equity | | | | | | | | | | | | | | | |
Current liabilities | | $ | 27,454 | | | $ | 134,650 | | | $ | 13,134 | | | $ | (22,601 | ) | | $ | 152,637 | |
Long-term debt | | | 647,309 | | | | 15,173 | | | | 0 | | | | (0 | ) | | | 662,482 | |
Non-current portion of accrued reclamation | | | — | | | | 109,575 | | | | 2,093 | | | | — | | | | 111,668 | |
Non-current deferred tax liability | | | 279 | | | | 97,732 | | | | — | | | | — | | | | 98,011 | |
Other non-current liabilities | | | — | | | | 10,830 | | | | — | | | | — | | | | 10,830 | |
Stockholders' equity | | | 1,958,630 | | | | 1,555,975 | | | | 630,746 | | | | (2,186,721 | ) | | | 1,958,630 | |
Total liabilities and stockholders' equity | | $ | 2,633,672 | | | $ | 1,923,935 | | | $ | 645,973 | | | $ | (2,209,322 | ) | | $ | 2,994,258 | |
Unaudited Interim Condensed Consolidating Statements of Operations
| | | | | | | | | | | | | | | | | | | | |
| | Three Months Ended March 31, 2024 | |
| | Parent | | | Guarantors | | | Non-Guarantors | | | Eliminations | | | Consolidated | |
| | (in thousands) | |
Revenues | | $ | 3,057 | | | $ | 186,471 | | | $ | — | | | $ | — | | | $ | 189,528 | |
Cost of sales and other direct production costs | | | (433 | ) | | | (121,028 | ) | | | — | | | | — | | | | (121,461 | ) |
Depreciation, depletion, amortization | | | — | | | | (48,907 | ) | | | — | | | | — | | | | (48,907 | ) |
General and administrative | | | (4,446 | ) | | | (6,396 | ) | | | (374 | ) | | | — | | | | (11,216 | ) |
Exploration and pre-development | | | (165 | ) | | | (3,387 | ) | | | (790 | ) | | | — | | | | (4,342 | ) |
Equity in earnings of subsidiaries | | | (18,252 | ) | | | — | | | | — | | | | 18,252 | | | | — | |
Other (expense) income | | | 19,746 | | | | (13,768 | ) | | | (9,446 | ) | | | (4,072 | ) | | | (7,540 | ) |
Income before income and mining taxes | | | (493 | ) | | | (7,015 | ) | | | (10,610 | ) | | | 14,180 | | | | (3,938 | ) |
Income and mining tax expense | | | (5,260 | ) | | | (625 | ) | | | — | | | | 4,070 | | | | (1,815 | ) |
Net income (loss) | | | (5,753 | ) | | | (7,640 | ) | | | (10,610 | ) | | | 18,250 | | | | (5,753 | ) |
Preferred stock dividends | | | (138 | ) | | | — | | | | — | | | | — | | | | (138 | ) |
Net income (loss) applicable to common stockholders | | $ | (5,891 | ) | | $ | (7,640 | ) | | $ | (10,610 | ) | | $ | 18,250 | | | $ | (5,891 | ) |
Net income (loss) | | | (5,753 | ) | | | (7,640 | ) | | | (10,610 | ) | | | 18,250 | | | | (5,753 | ) |
Changes in comprehensive income (loss) | | | (5,403 | ) | | | — | | | | — | | | | — | | | | (5,403 | ) |
Comprehensive income (loss) | | $ | (11,156 | ) | | $ | (7,640 | ) | | $ | (10,610 | ) | | $ | 18,250 | | | $ | (11,156 | ) |
Item 3. Quantitative and Qualitative Disclosures About Market Risk
The following discussion about our exposure to market risks and risk management activities includes forward-looking statements that involve riskrisks and uncertainties, andas well as summarizes the financial instruments held by us at September 30, 2017,March 31, 2024, which are sensitive to changes in commodity prices and foreign exchange rates and are not held for trading purposes. Actual results could differ materially from those projected in the forward-looking statements. In the normal course of business, we also face risks that are either non-financial or non-quantifiable (See Part I, Item 1A. – Risk Factors of our annual report filed2023 Form 10-K).
Metals Prices
Changes in the market prices of silver, gold, lead and zinc can significantly affect our profitability and cash flow. Metals prices can and often do fluctuate widely and are affected by numerous factors beyond our control (see Item 1A – Risk Factors – A substantial or extended decline in metals prices would have a material adverse effect on us in our 2023 Form 10-K10-K). We utilize financially-settled forward and put option contracts to manage our exposure to changes in prices for the year ended December 31, 2016).silver, gold, zinc and lead.
Provisional Sales
Sales of all metals products sold directly to customers, including by-product metals, are recorded as revenues when titleall performance obligations have been completed and risk of loss transfers to the customer (generallytransaction price can be determined or reasonably estimated. For concentrate sales, revenues are generally recorded at the time of shipment)shipment at forward prices for the estimated month of settlement. Due to the time elapsed between shipment to the customer and the final settlement with the customer we must estimate the prices at which sales of our metals will be settled. Previously recorded sales are adjusted to estimated settlement metals prices until final settlement by the customer. Changes in metals prices between shipment and final settlement will result in changes to revenues previously recorded upon shipment. Metals prices can and often do fluctuate widely and are affected by numerous factors beyond our control (see Part I, Item 1A.1A – Risk Factors –A substantial or extended decline in metals prices would have a material adverse effect on us in our annual report filed on2023 Form 10-K for the year ended December 31, 2016)10-K). At September 30, 2017,March 31, 2024, metals contained in concentratesconcentrate sales and exposed to future price changes totaled approximately 1.52.6 million ounces of silver, 5,5369,060 ounces of gold 9,974 tons of zinc, and 1,4235,450 tons of lead. If the price for each metal were to change by 10%, the change in the total value of the concentrates sold would be approximately $6.4$9.6 million. However, asAs discussed in Commodity-Price Risk Management below,Note 8 of Notes to Condensed Consolidated Financial Statements (Unaudited), we utilize a program designed and intended to mitigate the risk of negative price adjustments with limited mark-to-market financially-settled forward contracts for our silver, gold, zinc and lead sales.
Commodity-Price Risk Management
At times, we use commodity forward sales commitments, commodity swap contractsSee Note 8 of Notes to Condensed Consolidated Financial Statements (Unaudited) and commodity putItem 7A. Quantitative and call option contracts to manageQualitative Disclosures About Market Risk in our exposure to fluctuation in the prices of certain metals which we produce. Contract positions are designed to ensure that we will receive2023 Form 10-K for a defined minimum price for certain quantitiesdescription of our production, thereby partially offsetting our exposure to fluctuations in the market. Ourcommodity-price risk management policy allows for up to 75% of our planned metals price exposure for five years into the future, with certain other limitations, to be hedged under such programs. These instruments do, however, expose us to (i) credit risk in the form of possible non-performance by counterparties for contracts in which the contract price exceeds the spot price of a commodity and (ii) price risk to the extent that the spot price exceeds the contract price for quantities of our production covered under contract positions.program.
We are currently using financially-settled forward contracts to manage the exposure to changes in prices of silver, gold, zinc and lead contained in our concentrate shipments between the time of shipment and final settlement. In addition, we are using financially-settled forward contracts to manage the exposure to changes in prices of zinc and lead (but not silver and gold) contained in our forecasted future concentrate shipments. These contracts do not qualify for hedge accounting and are marked-to-market through earnings each period.
As of September 30, 2017, we recorded the following balances for the fair value of the contracts:
a current asset of $0.4 million, which is net of $0.1 million for contracts in a liability position and included in other current assets;
a current liability of $7.9 million, which is net of $0.2 million for contracts in an asset position and included in other current liabilities; and
a non-current liability of $4.0 million, which is included in other non-current liabilities.
We recognized a $3.9 million net loss during the first nine months of 2017 on the contracts utilized to manage exposure to prices of metals in our concentrate shipments, which is included in sales of products. The net loss recognized on the contracts offsets gains related to price adjustments on our provisional concentrate sales due to changes to silver, gold, lead and zinc prices between the time of sale and final settlement.
We recognized a $16.5 million net loss during the first nine months of 2017 on the contracts utilized to manage exposure to prices for forecasted future concentrate shipments. The net loss on these contracts is included as a separate line item under other income (expense), as they relate to forecasted future shipments, as opposed to sales that have already taken place but are subject to final pricing as discussed in the preceding paragraph. The net loss for the first nine months of 2017 is the result of higher zinc and lead prices. This program, when utilized, is designed to mitigate the impact of potential future declines in lead and zinc prices from the price levels established in the contracts (see average price information below). When those prices increase compared to the contract prices, we recognize losses.
The following tables summarize the quantities of metals committed under forward sales contracts at September 30, 2017 and December 31, 2016:
September 30, 2017 | | Ounces/pounds under contract (in 000's) | | | Average price per ounce/pound | |
| | | Silver | | | Gold | | | Zinc | | | Lead | | | Silver | | | Gold | | | Zinc | | | Lead | |
| | | (ounces) | | | (ounces) | | | (pounds) | | | (pounds) | | | (ounces) | | | (ounces) | | | (pounds) | | | (pounds) | |
Contracts on provisional sales | | | | | | | | | | | | | | | | | | | | | | | | | | | | | | | | |
2017 settlements | | | 1,399 | | | | 5 | | | | 19,070 | | | | 2,535 | | | $ | 17.18 | | | $ | 1,298 | | | $ | 1.33 | | | $ | 1.07 | |
2018 settlements | | | — | | | | — | | | | 2,370 | | | | — | | | | N/A | | | | N/A | | | $ | 1.38 | | | | N/A | |
Contracts on forecasted sales | | | | | | | | | | | | | | | | | | | | | | | | | | | | | | | | |
2017 settlements | | | — | | | | — | | | | 441 | | | | 2,866 | | | | N/A | | | | N/A | | | $ | 1.23 | | | $ | 1.05 | |
2018 settlements | | | — | | | | — | | | | 39,463 | | | | 17,968 | | | | N/A | | | | N/A | | | $ | 1.27 | | | $ | 1.05 | |
2019 settlements | | | — | | | | — | | | | 14,330 | | | | 8,267 | | | | N/A | | | | N/A | | | $ | 1.30 | | | $ | 1.07 | |
2020 settlements | | | — | | | | — | | | | 3,307 | | | | 2,205 | | | | N/A | | | | N/A | | | $ | 1.27 | | | $ | 1.07 | |
December 31, 2016 | | Ounces/pounds under contract (in 000's) | | | Average price per ounce/pound | |
| | | Silver | | | Gold | | | Zinc | | | Lead | | | Silver | | | Gold | | | Zinc | | | Lead | |
| | | (ounces) | | | (ounces) | | | (pounds) | | | (pounds) | | | (ounces) | | | (ounces) | | | (pounds) | | | (pounds) | |
Contracts on provisional sales | | | | | | | | | | | | | | | | | | | | | | | | | | | | | | | | |
2017 settlements | | | 1,295 | | | | 4 | | | | 19,070 | | | | 7,441 | | | $ | 16.29 | | | $ | 1,172 | | | $ | 1.18 | | | $ | 0.97 | |
Contracts on forecasted sales | | | | | | | | | | | | | | | | | | | | | | | | | | | | | | | | |
2017 settlements | | | — | | | | — | | | | 35,384 | | | | 17,637 | | | | N/A | | | | N/A | | | $ | 1.19 | | | $ | 1.03 | |
2018 settlements | | | — | | | | — | | | | 13,779 | | | | 5,732 | | | | N/A | | | | N/A | | | $ | 1.21 | | | $ | 1.05 | |
Our concentrate sales are based on a provisional sales price containing an embedded derivative that is required to be separated from the host contract for accounting purposes. The host contract is the receivable from the sale of the concentrates at the forward price at the time of the sale. The embedded derivative, which does not qualify for hedge accounting, is marked-to-market through earnings each period prior to final settlement.
Foreign Currency Risk Management
We operate or have mining interests in Canada, and Mexico, which exposes us to risks associated with fluctuations in the exchange rates between the U.S. dollar ("USD")USD and the Canadian dollar ("CAD") and Mexican peso ("MXN").CAD. We have determined that the functional currency for our Canadian and Mexican operations is the USD. As such, foreign exchange gains and losses associated with the re-measurement of monetary assets and liabilities from CAD and MXN to USD are recorded to earnings each period. For the ninethree months ended September 30, 2017,March 31, 2024, we recognized a net foreign exchange lossgain of $10.9 million.$4.0 million, compared to a net foreign exchange gain of $0.1 million for the three months ended March 31, 2023. Foreign currency exchange rates are influenced by a number of factors beyond our control. A 10% change in the exchange rate between the USD and CAD from the rate at September 30, 2017March 31, 2024 would have resulted in a change of approximately $11.8$7.3 million in our net foreign exchange gain or loss. A 10% change inWe do not hedge the exchange rate between the USDremeasurement of monetary assets and MXN from the rate at September 30, 2017 would have resulted in a changeliabilities. We do hedge some of approximately $0.9 million in our net foreign exchange gain or loss.
In April 2016, we initiated a program to manage our exposure to fluctuations in the exchange rate between the USDoperating and CAD and the impact on our future operatingcapital costs denominated in CAD. In October 2016, we also initiatedforeign currency.
See Note 8 of Notes to Condensed Consolidated Financial Statements (Unaudited) and Note 9 of Notes to Consolidated Financial Statements in our 2023 Form 10-K for a program to manage our exposure to the impact of fluctuations in the exchange rate between the USD and MXN on our future operating costs denominated in MXN. The programs utilize forward contracts to buy CAD and MXN, and each contract is designated as a cash flow hedge. As of September 30, 2017, we have 94 forward contracts outstanding to buy CAD$200.1 million having a notional amount of US$154.0 million, and 6 forward contracts outstanding to buy MXN$43.3 million having a notional amount of USD$2.2 million. The CAD contracts are related to forecasted cash operating costs at Casa Berardi to be incurred from 2017 through 2020 and have CAD-to-USD exchange rates ranging between 1.2787 and 1.3380. The MXN contracts are related to forecasted cash operating costs at San Sebastian for 2017 and have MXN-to-USD exchange rates ranging between 19.5910 and 21.0000. Our risk management policy allows for up to 75%description of our planned cost exposure for five years into the future to be hedged under such programs, and for potential additional programs to manage other foreign currency-related exposure areas.currency risk management.
As of September 30, 2017, we recorded the following balances for the fair value of the contracts:
a current asset of $2.8 million, which is included in other current assets; and42
a non-current asset of $3.7 million, which is included in other non-current assets.
Net unrealized gains of approximately $6.8 million related to the effective portion of the hedges were included in accumulated other comprehensive income as of September 30, 2017. Unrealized gains and losses will be transferred from accumulated other comprehensive loss to current earnings as the underlying operating expenses are recognized. We estimate approximately $2.9 million in net unrealized gains included in accumulated other comprehensive income as of September 30, 2017 would be reclassified to current earnings in the next twelve months. Net realized gains of approximately $0.4 million on contracts related to underlying expenses which have been recognized were transferred from accumulated other comprehensive loss and included in cost of sales and other direct production costs for the nine months ended September 30, 2017. Net unrealized gains of approximately $2 thousand related to ineffectiveness of the hedges were included in current earnings for the nine months ended September 30, 2017.
Item 4. Controls and Procedures
An evaluation was performed under the supervision and with the participation of our management, including the Chief Executive Officer (“CEO”) and Chief Financial Officer (“CFO”), of the effectiveness of the design and operation of our disclosure controls and procedures as definedrequired by Securities Exchange Act Rules 13a-15(e) and 15d-15(e) as of the end of the period covered by this report. Based on that evaluation, our CEO and CFO concluded that our disclosure controls and procedures, including controls and procedures designed to ensure that information required to be disclosed by us is accumulated and communicated to our management (including our CEO and CFO), were effective as of September 30, 2017,March 31, 2024, in assuring them in a timely manner that material information required to be disclosed in this report has been properly recorded, processed, summarized and reported. There were no changes in our internal control over financial reporting during the quarterthree months ended September 30, 2017March 31, 2024 that have materially affected, or are reasonably likely to materially affect, our internal control over financial reporting.
Internal control systems, no matter how well designed and operated, have inherent limitations. Therefore, even a system which is determined to be effective cannot provide absolute assurance that all control issues have been detected or prevented. Our systems of internal controls are designed to provide reasonable assurance with respect to financial statement preparation and presentation.
Item 5. Other Information
On May 3, 2024 we entered into a First Amendment to Credit Agreement (the “First Amendment”), which makes certain changes to our existing Credit Agreement (the “Original Credit Agreement” and the Original Credit Agreement, as amended, modified and supplemented by the First Amendment, the “Credit Agreement”), with the various financial institutions and other persons from time to time party thereto as lenders (the “Lenders”), Bank of Montreal and Bank of America, N.A. as letters of credit issuers, and Bank of America, N.A., as administrative agent for the Lenders and as swingline lender. See Note 7. Debt, Credit Agreement and Leases above for a discussion of our Original Credit Agreement. The Original Credit Agreement remains in effect except for the explicit amendments, modifications and supplements made by the First Amendment. The First Amendment made the following changes to our Original Credit Agreement:
•increases the amount available for borrowing to $225 million from $150 million;
•extends the maturity date to July 21, 2028 from July 21, 2026 (the maturity date of the Credit Agreement will be accelerated to August 15 2027 if our Senior Notes are not refinanced by that date);
•National Bank, TD Securities, Bank of Nova Scotia and ING are added as new Lenders and Credit Suisse AG, New York Branch assigned its interests in the Original Credit Agreement to its affiliate UBS AG, Stamford Branch immediately prior to entering into the First Amendment; and
•provided updates and changes to certain of our confidential disclosure statements as discussed in the paragraph immediately below.
The Credit Agreement contains representations and warranties made by us. The assertions embodied in those representations and warranties are qualified by information in confidential disclosure schedules that we have exchanged in connection with signing the Original Credit Agreement, with some updates and changes to those confidential disclosure schedules made in connection with the First Amendment. While we do not believe that they contain information securities laws require us to publicly disclose other than information that has already been so disclosed, the disclosure schedules do contain information that modifies, qualifies and creates exceptions to the representations and warranties set forth in the Credit Agreement. Accordingly, you should not rely on the representations and warranties as characterizations of the actual state of facts, since they are modified in important part by the underlying disclosure schedules. The Credit Agreement has been incorporated by reference herein to provide you with information regarding its terms. It is not intended to provide any other factual information about us. Such information about us can be found elsewhere in other public filings we have made with the SEC, which are available without charge at www.sec.gov.
The disclosure schedules contain information that has been included in our general prior public disclosures, as well as potential additional non-public information. Moreover, information concerning the subject matter of the representations and warranties may have changed since the date of the Amended Credit Agreement, which subsequent information may or may not be fully reflected in public disclosures.
A copy of the First Amendment, which includes as an exhibit thereto the Original Credit Agreement, as amended, modified and supplemented by the First Amendment, is attached hereto as Exhibit 10.1 and is incorporated herein by reference.
Part II - Other Information
Hecla Mining Company and Subsidiaries
Item 1. Legal Proceedings
For information concerning legal proceedings, refer to Note 410 of Notes to Condensed Consolidated Financial Statements (Unaudited), which is incorporated by reference into this Item 1.
Item 1A. Risk Factors
Part I, Item 1A. – Risk Factors of our annual report filed on2023 Form 10-K for the year ended December 31, 2016 setsset forth information relating to important risks and uncertainties that could materially adversely affect our business, financial condition or operating results. Those risk factors continue to be relevant to an understanding of our business, financial condition and operating results.
Item 4. Mine Safety Disclosures
The information concerning mine safety violations or other regulatory matters required by Section 1503(a) of the Dodd-Frank Wall Street Reform and Consumer Protection Act and Item 104 of Regulation S-K is included in exhibit 95 to this Quarterly Report.
Item 5. Other Information
Item 5(c)During the three months ended March 31, 2024, no director or officer of the Company adopted or terminated a “Rule 10b5-1 trading arrangement” or “non-Rule 10b5-1 trading arrangement,” as each term is defined in Item 408(a) of Regulation S-K.
Item 6. Exhibits
See the exhibit index to this Form 10-Q for the list of exhibits.
Items 2, 3 and 5 of Part II are not applicable and are omitted from this report.
SIGNATURES
Pursuant to the requirements of the Securities Exchange Act of 1934, the registrant has duly caused this report to be signed on its behalf by the undersigned thereunto duly authorized.
| | HECLA MINING COMPANY
|
| | (Registrant)
|
| | | |
Date:
| November 7, 2017
| By:
| /s/ Phillips S. Baker, Jr.
|
| | | Phillips S. Baker, Jr., President,
|
| | | Chief Executive Officer and Director
|
| | | |
Date:
| November 7, 2017
| By:
| /s/ Lindsay A. Hall
|
| | | Lindsay A. Hall, Senior Vice President and
|
| | | Chief Financial Officer
|
Hecla Mining Company and Wholly Owned Subsidiaries
Form 10-Q – September 30, 2017March 31, 2024
Index to Exhibits
4.2(a)
| IndentureEquity Distribution Agreement, dated as of April 12, 2013February 15, 2024, by and among Hecla Mining Company as Issuer, certain subsidiaries of Hecla Mining Company, as Guarantorsand the sales agents party thereto, and The Bank of New York Mellon Trust Company, N.A., as Trustee. Filed asincorporated by reference to exhibit 10.11.2 to Registrant’s Current Report on Form 8-K filed on April 15, 2013 (File No. 1-8491), and incorporated herein by reference.
|
4.2(b)
| Supplemental Indenture, dated as of April 14, 2014, among Hecla Mining Company, as Issuer, certain subsidiaries of Hecla Mining Company, as Guarantors thereto, and The Bank of New York Mellon Trust Company, N.A., as Trustee. Filed as exhibit 4.2 to Registrant’s Registration Statement on Form S-3ASR filed on April 14, 2014 (File No. 1-8491), and incorporated herein by reference.
|
4.2(c)
| Supplemental Indenture, dated August 5, 2015, among Revett Mining Company, Inc., Revett Silver Company, Troy Mine, Inc., RC Resources, Inc., Revett Exploration, Inc., and Revett Holdings, Inc., as Guaranteeing Subsidiaries, and The Bank of New York Mellon Trust Company, N.A., as Trustee. Filed as exhibit 4.2(d) to Registrant’sthe Company’s Annual Report on Form 10-K for the year ended December 31, 20152023 (File No. 1-8491), and incorporated herein by reference..
|
4.2(d)10.1
|
| Supplemental Indenture, dated October 26, 2016, among Mines Management Inc., Newhi, Inc., Montanore Minerals Corp., as Guaranteeing Subsidiaries, and The Bank of New York Mellon Trust, N.A., as Trustee. Filed as exhibit 4.2(e)First Amendment to Registrant’s Annual Report on Form 10-K for the year ended December 31, 2016 (File No. 1-8491), and incorporated herein by reference.
|
10.1
| Fourth Amended and Restated Credit Agreement, effectivedated as of May 20, 2016,3, 2024, by and among Hecla Mining Company, Hecla Limited, Hecla Alaska LLC, Hecla Greens Creek Mining Company, and Hecla Juneau Mining Company, as the Borrowers, The Bank of Nova Scotia,America, N.A., as the Administrative Agent for the Lenders, and various Lenders. Filed as exhibit 10.1 to Registrant’s Current Report on Form 8-K filed on May 25, 2016 (File No. 1-8491), and incorporated herein by reference.*
|
10.231.1*
|
| First AmendmentCertification of Principal Executive Officer Pursuant to Fourth AmendedRules 13a-14(a) and Restated Credit Agreement effective July 14, 2017, by and among Hecla Mining Company, Hecla Limited, Hecla Alaska LLC, Hecla Greens Creek Mining Company, and Hecla Juneau Mining Company,15d-14(a) under the Securities Exchange Act of 1934, as the Borrowers, The Bank of Nova Scotia, as the Administrative Agent for the Lenders, and various Lenders. Filed as exhibit 10.2 to Registrant’s Quarterly Report on Form 10-Q for the quarter ended June 30, 2017 (File No. 1-8491), and incorporated herein by reference.
|
101.SCH
| Inline XBRL Instance Document – the instance document does not appear in the Interactive Data File as its XBRL tags are embedded within the Inline XBRL document. ** |
101.SCH |
| Inline XBRL Taxonomy Extension Schema.**Schema with Embedded Linkbase Documents ** |
104 |
| Cover page formatted as Inline XBRL and contained in Exhibit 101 ** |
101.CAL
| XBRL Taxonomy Extension Calculation.**
|
101.DEF
| XBRL Taxonomy Extension Definition.**
|
101.LAB
| XBRL Taxonomy Extension Labels.**
|
101.PRE
| XBRL Taxonomy Extension Presentation.**
|
___________________
* Filed herewith.herewith
** XBRL information is furnished and not filed or a part of a registration statement or prospectus for purposes of Sections 11 or 12 of the Securities Act of 1933, as amended, is deemed not filed for purposes of Section 18 of the Securities and Exchange Act of 1934, as amended, and otherwise is not subject to liability under these sections.
65(1) Indicates a management contract or compensatory plan or arrangement.
Items 2 and 3 of Part II are not applicable and are omitted from this report.
SIGNATURES
Pursuant to the requirements of the Securities Exchange Act of 1934, the registrant has duly caused this report to be signed on its behalf by the undersigned thereunto duly authorized.
| | | |
|
| HECLA MINING COMPANY |
|
| (Registrant) |
|
|
|
|
Date: | May 9, 2024 | By: | /s/ Phillips S. Baker, Jr. |
|
|
| Phillips S. Baker, Jr., President, |
|
|
| Chief Executive Officer and Director |
|
|
|
|
Date: | May 9, 2024 | By: | /s/ Russell D. Lawlar |
|
|
| Russell D. Lawlar, Senior Vice President, |
|
|
| Chief Financial Officer |