Table of Contents
UNITED STATES
SECURITIES AND EXCHANGE COMMISSION
Washington, D.C. 20549
FORM 10-Q
[X]☒
| QUARTERLY REPORT PURSUANT TO SECTION 13 OR 15(d) OF THE SECURITIES EXCHANGE ACT OF 1934 |
| |
| For the quarterly period ended September 30, 2017March 31, 2023 |
or
[ ]☐
| TRANSITION REPORT PURSUANT TO SECTION 13 OR 15(d) OF THE SECURITIES EXCHANGE ACT OF 1934 |
| |
| For the transition period from ________ to ________ |
Commission File Number 0-29466001-35929
| National Research Corporation | |
(Exact name of Registrant as specified in its charter)
WisconsinDelaware
| | 47-0634000 |
(State or other jurisdiction of | | (I.R.S. Employer |
incorporation or organization) | | Identification No.) |
| 1245 Q Street, Lincoln, Nebraska 68508 | |
| (Address of principal executive offices) (Zip Code) | |
| (402) 475-2525 | |
| (Registrant’sRegistrant’s telephone number, including area code) | |
Securities registered pursuant to 12(b) of the Act:
Title of Each Class | Trading Symbol(s) | Name of each exchange on which registered |
Common Stock, $.001 par value | NRC | The NASDAQ stock market |
Indicate by check mark whether the registrant (1) has filed all reports required to be filed by Section 13 or 15(d) of the Securities Exchange Act of 1934 during the preceding 12 months (or for such shorter period that the registrant was required to file such reports), and (2) has been subject to such filing requirements for the past 90 days.
Yes ☒ No ☐
Indicate by check mark whether the registrant has submitted electronically and posted on its corporate Web site, if any, every Interactive Data File required to be submitted and posted pursuant to Rule 405 of Regulation S-T during the preceding 12 months (or for such shorter period that the registrant was required to submit and post such files). Yes ☒ No ☐
Indicate by check mark whether the registrant is a large accelerated filer, an accelerated filer, a non-accelerated filer, smaller reporting company, or an emerging growth company. See the definitions of "large accelerated filer," "accelerated "accelerated filer," "smaller reporting company," and "emerging growth company" in Rule 12b-2 of the Exchange Act.
Large accelerated filer | ☐ | Accelerated filer | ☒ |
Non-accelerated filer | ☐ (Do not check if a smaller reporting company) | Smaller reporting company | ☐ |
| | Emerging growth company | ☐ | Emerging growth company
| ☐
|
If an emerging growth company, indicate by check mark if the registrant has elected not to use the extended transition period for complying with any new or revised financial accounting standards provided pursuant to Section 13(a) of the Exchange Act. ☐
Indicate by check mark whether the registrant is a shell company (as defined in Rule 12b-2 of the Act.)
Yes ☐ No ☒
Indicate the number of shares outstanding of each of the issuer’sissuer’s classes of common stock as of the latest practicable date.
Class A Common Stock, $.001 par value, outstanding as of October 27, 2017: 20,942,785 shares
Class B Common Stock, $.001 par value, outstanding as of October 27, 2017: 3,540,244 sharesApril 26, 2023: 24,609,815
NATIONAL RESEARCH CORPORATION
FORM 10-Q INDEX
For the Quarter Ended September 30, 2017March 31, 2023
Special Note Regarding Forward-Looking Statements
Certain matters discussed in this Quarterly Report on Form 10-Q are “forward-looking statements” within the meaning of Section 21E of the Securities Exchange Act of 1934, as amended. These forward-looking statements can generally be identified as such because the context of the statement includes phrases such as National Research Corporation, doing business as NRC Health (“NRC Health,” the “Company,” “we,” “our,” “us” or similar terms), “believes,” “expects,” “may,” “could,” “anticipates,” “estimates,” “plans,” “intends,” or the use of words such as “would,” “will,” “may,” “could,” “goal,” “focus,” or “should,” or other words of similar import. Similarly, statements that describe the Company’sour future plans, objectives or goals are also forward-looking statements. In this Quarterly Report on Form 10-Q, statements regarding the value and utility of, and market demand for, our service offerings, future opportunities for growth with respect to new and existing clients, our future ability to compete and the types of firms with which we will compete, future consolidation in the healthcare industry, future adequacy of our liquidity sources, future revenue sources, future revenue growth, future revenue estimates used to calculate recurring contract value, the expected impact of economic factors, including inflation, future capital expenditures including, without limitation, our headquarters renovation costs, and the timing, amount, and sources of cash to fund such capital expenditures, future stock repurchases and dividends, the expected impact of pending claims and contingencies, the future outcome of uncertain tax positions, our future use of owned and leased real property, the expected impact of the conflict in Ukraine, and the expected impact of the COVID-19 pandemic or other similar outbreak, among others, are forward-looking statements. Such forward-looking statements are subject to certain risks and uncertainties which could cause actual results or outcomes to differ materially from those currently anticipated. Factors that could affect actual results or outcomes include, without limitation, the following factors:
| ● | The possibility of non-renewal of the Company’sour client service contracts, reductions in services purchased or prices, and retention offailure to retain key clients; |
| ● | The Company’slikelihood that the COVID-19 or other similar outbreak will adversely affect our operations, sales, earnings, financial condition and liquidity; |
● | Our ability to compete in itsour markets, which are highly competitive with new market entrants, and the possibility of increased price pressure and expenses; |
| ● | The effects of an economic downturn;likelihood that the ongoing Russian-Ukraine conflict will adversely affect our operations, sales, earnings, financial condition and liquidity; |
● | The effects of an economic downturn; |
● | The impact of consolidation in the healthcare industry; |
● | The impact of consolidation in thefederal healthcare industry;reform legislation or other regulatory changes; |
| ● | The impact of federal healthcare reform legislation orOur ability to attract and retain key managers and other regulatory changes;personnel;
|
| ●
| The Company’s ability to attract and retain key managers and other personnel;
|
| ● | The possibility that the Company’sour intellectual property and other proprietary information technology could be copied or independently developed by itsour competitors; |
● | The possibility for failures or deficiencies in our information technology platform; |
● | The possibility that the Companywe or our third-party providers could be subject to cyber-attacks, security breaches or computer viruses; and |
| ● | The factors set forth under the caption “Risk Factors” in Part I, Item 1A of the Company’sour Annual Report on Form 10-K, for the year ended December 31, 2016, as such section may be updated or supplemented by Part II, Item 1A of the Company’sour subsequently filed Quarterly Reports on Form 10-Q (including this Report). and various disclosures in our press releases, stockholder reports, and other filings with the Securities and Exchange Commission. |
Shareholders, potential investors and other readers are urged to consider these and other factors in evaluating the forward-looking statements and are cautioned not to place undue reliance on such forward-looking statements. The forward-looking statements included are only made as of the date of this Quarterly Report on Form 10-Q and the Company undertakeswe undertake no obligation to publicly update such forward-looking statements to reflect subsequent events or circumstances.circumstances, except as required by the federal securities laws.
PART I – Financial Information
ITEM 1. Financial Statements
NATIONAL RESEARCH CORPORATION AND SUBSIDIARY
CONDENSED CONSOLIDATED BALANCE SHEETS
(In thousands, except share amounts and par value)
| | | September 30, 2017 | | | December 31, 2016 | | | March 31, 2023 | | | December 31, 2022 | |
| | | (unaudited) | | | | | | | (unaudited) | | | | |
Assets | | | | | | | | | | | | | | | | |
Current assets: | | | | | | | | | |
Cash and cash equivalents | | $ | 35,750 | | | $ | 33,021 | | | $ | 23,724 | | | $ | 25,026 | |
Trade accounts receivable, less allowance for doubtful accounts of $188 and $169 in 2017 and 2016, respectively | | | 13,588 | | | | 10,864 | | |
Unbilled revenue | | | 1,283 | | | | 1,546 | | |
Trade accounts receivable, less allowance for doubtful accounts of $65 and $65, respectively | | | 14,220 | | | 14,461 | |
Prepaid expenses | | | 3,075 | | | | 1,585 | | | 6,076 | | | 2,386 | |
Income tax receivable | | | 61 | | | | 14 | | |
Income taxes receivable | | | 110 | | | 733 | |
Other current assets | | | 65 | | | | 35 | | | | 1,042 | | | | 1,110 | |
Total current assets | | | 53,822 | | | | 47,065 | | | 45,172 | | | 43,716 | |
| | | | | | | | | | |
Property and equipment, net | | | 12,089 | | | | 11,806 | | |
Net property and equipment | | | 19,486 | | | 17,248 | |
Intangible assets, net | | | 2,932 | | | | 3,124 | | | 1,576 | | | 1,611 | |
Goodwill | | | 58,036 | | | | 57,861 | | | 61,614 | | | 61,614 | |
Deferred contract costs, net | | | 2,235 | | | 2,441 | |
Deferred income taxes | | | 11 | | | 14 | |
Operating lease right-of-use assets | | | 450 | | | 556 | |
Other | | | 1,861 | | | | 768 | | | | 3,762 | | | | 3,261 | |
Total assets | | $ | 128,740 | | | $ | 120,624 | | | $ | 134,306 | | | $ | 130,461 | |
| | | |
Liabilities and Shareholders’ Equity | | | | | | | | | | | | | | | | |
Current liabilities: | | | | | | | | | |
Current portion of notes payable | | $ | 1,693 | | | $ | 2,683 | | | $ | 4,546 | | | $ | 4,491 | |
Accounts payable | | | 548 | | | | 765 | | | 1,378 | | | 1,153 | |
Accrued wages, bonus and profit sharing | | | 4,151 | | | | 4,543 | | |
Accrued wages and bonuses | | | 4,977 | | | 4,551 | |
Accrued expenses | | | 3,122 | | | | 3,069 | | | 3,815 | | | 3,983 | |
Current portion of capital lease obligations | | | 87 | | | | 82 | | |
Dividends payable | | | 2,953 | | | 2,956 | |
Income taxes payable | | | 1,862 | | | | 662 | | | 1,651 | | | - | |
Dividends payable | | | 4,218 | | | | 4,213 | | |
Deferred revenue | | | 18,486 | | | | 15,497 | | | 15,896 | | | 15,198 | |
Other current liabilities | | | | 896 | | | | 1,085 | |
Total current liabilities | | | 34,167 | | | | 31,514 | | | 36,112 | | | 33,417 | |
| | | | | | | | | | |
Notes payable, net of current portion | | | - | | | | 857 | | |
Notes payable, net of current portion and unamortized debt issuance costs | | | 16,530 | | | 17,690 | |
Deferred income taxes | | | 4,855 | | | | 4,670 | | | 4,894 | | | 5,274 | |
Other long term liabilities | | | 874 | | | | 777 | | |
Other long-term liabilities | | | | 2,105 | | | | 2,047 | |
Total liabilities | | | 39,896 | | | | 37,818 | | | 59,641 | | | 58,428 | |
| | | | | | | | | | |
Shareholders’ equity: | | | | | | | | | |
Preferred stock, $0.01 par value; authorized 2,000,000 shares, none issued | | | -- | | | | -- | | |
Class A Common stock, $0.001 par value; authorized 60,000,000 shares, issued 25,799,230 in 2017 and 25,656,760 in 2016, outstanding 20,942,785 in 2017 and 20,891,069 in 2016 | | | 26 | | | | 26 | | |
Class B Common stock, $0.001 par value; authorized 80,000,000 shares, issued 4,317,656 in 2017 and 4,308,875 in 2016, outstanding 3,540,244 in 2017 and 3,539,931 in 2016 | | | 4 | | | | 4 | | |
Shareholders’ equity: | | |
Preferred stock, $0.01 par value, authorized 2,000,000 shares, none issued | | | - | | | - | |
Common stock, $0.001 par value; authorized 110,000,000 shares, issued 30,943,119 in 2023 and 30,922,181 in 2022, outstanding 24,599,815 in 2023 and 24,628,173 in 2022 | | | 31 | | | 31 | |
Additional paid-in capital | | | 50,121 | | | | 46,725 | | | 176,057 | | | 175,453 | |
Retained earnings | | | 75,278 | | | | 71,507 | | |
Accumulated other comprehensive loss | | | (1,528 | ) | | | (2,626 | ) | |
Treasury stock, at cost; 4,856,445 Class A shares, 777,412 Class B shares in 2017 and 4,765,691 Class A shares, 768,944 Class B shares in 2016 | | | (35,057 | ) | | | (32,830 | ) | |
Total shareholders’ equity | | | 88,844 | | | | 82,806 | | |
Total liabilities and shareholders’ equity | | $ | 128,740 | | | $ | 120,624 | | |
Retained earnings (accumulated deficit) | | | (21,173 | ) | | (25,184 | ) |
Treasury stock, at cost; 6,343,304 and 6,294,008 common stock in 2023 and 2022, respectively | | | | (80,250 | ) | | | (78,267 | ) |
Total shareholders’ equity | | | | 74,665 | | | | 72,033 | |
Total liabilities and shareholders’ equity | | | $ | 134,306 | | | $ | 130,461 | |
See accompanying notes to condensed consolidated financial statements
NATIONAL RESEARCH CORPORATION AND SUBSIDIARY
CONDENSED CONSOLIDATED STATEMENTS OF INCOME
(In thousands, except for per share amounts, unaudited)
| | | Three months ended
September 30, | | | Nine months ended
September 30, | | | Three months ended
March 31, | |
| | | 2017 | | | 2016 | | | 2017 | | | 2016 | | | 2023 | | | 2022 | |
| | | | | | | | | | | | | | | | | | |
Revenue | | $ | 28,951 | | | $ | 27,032 | | | $ | 87,661 | | | $ | 81,016 | | | $ | 36,473 | | | $ | 38,441 | |
| | | | | | | | | | | | | | | | | | |
Operating expenses: | | | | | | | | | | | | | | | | | |
Direct | | | 12,267 | | | | 11,468 | | | | 36,706 | | | | 33,741 | | | 14,280 | | | 14,779 | |
Selling, general and administrative | | | 8,430 | | | | 7,139 | | | | 22,021 | | | | 21,766 | | | 11,783 | | | 10,649 | |
Depreciation and amortization | | | 1,132 | | | | 1,086 | | | | 3,376 | | | | 3,146 | | | | 1,394 | | | | 1,316 | |
Total operating expenses | | | 21,829 | | | | 19,693 | | | | 62,103 | | | | 58,653 | | | | 27,457 | | | | 26,744 | |
| | | | | | | | | | | | | | | | | | |
Operating income | | | 7,122 | | | | 7,339 | | | | 25,558 | | | | 22,363 | | | 9,016 | | | 11,697 | |
| | | | | | | | | | | | | | | | | | |
Other income (expense): | | | | | | | | | | | | | | | | | |
Interest income | | | 29 | | | | 12 | | | | 58 | | | | 34 | | | 250 | | | 5 | |
Interest expense | | | (18 | ) | | | (38 | ) | | | (68 | ) | | | (158 | ) | | (241 | ) | | (317 | ) |
Other, net | | | 40 | | | | (4 | ) | | | 76 | | | | 112 | | | | (14 | ) | | | 48 | |
| | | | | | | | | | | | | | | | | | |
Total other income (expense) | | | 51 | | | | (30 | ) | | | 66 | | | | (12 | ) | | | (5 | ) | | | (264 | ) |
| | | | | | | | | | | | | | | | | | |
Income before income taxes | | | 7,173 | | | | 7,309 | | | | 25,624 | | | | 22,351 | | | 9,011 | | | 11,433 | |
| | | | | | | | | | | | | | | | | | |
Provision for income taxes | | | 3,020 | | | | 2,580 | | | | 9,198 | | | | 7,558 | | | | 2,047 | | | | 2,894 | |
| | | | | | | | | | | | | | | | | | |
Net income | | $ | 4,153 | | | $ | 4,729 | | | $ | 16,426 | | | $ | 14,793 | | | $ | 6,964 | | | $ | 8,539 | |
| | | | | | | | | | | | | | | | | | |
Earnings Per Share of Common Stock: | | | | | | | | | | | | | | | | | |
Basic Earnings Per Share: | | | | | | | | | | | | | | | | | |
Class A | | $ | 0.10 | | | $ | 0.11 | | | $ | 0.39 | | | $ | 0.35 | | |
Class B | | $ | 0.59 | | | $ | 0.67 | | | $ | 2.34 | | | $ | 2.11 | | |
Diluted Earnings Per Share: | | | | | | | | | | | | | | | | | |
Class A | | $ | 0.09 | | | $ | 0.11 | | | $ | 0.38 | | | $ | 0.35 | | |
Class B | | $ | 0.57 | | | $ | 0.66 | | | $ | 2.28 | | | $ | 2.08 | | |
| | | | | | | | | | | | | | | | | | |
Dividends Per Share of Common Stock: | | | | | | | | | | | | | | | | | |
Class A | | $ | 0.10 | | | $ | 0.08 | | | $ | 0.30 | | | $ | 0.24 | | |
Class B | | $ | 0.60 | | | $ | 0.48 | | | $ | 1.80 | | | $ | 1.44 | | |
Basic Earnings Per Share | | | $ | 0.28 | | | $ | 0.34 | |
Diluted Earnings Per Share | | | $ | 0.28 | | | $ | 0.34 | |
| | | | | | | | | | | | | | | | | | |
Weighted average shares and share equivalents outstanding: | | | | | | | | | | | | | | | | | |
Class A – basic | | | 20,788 | | | | 20,716 | | | | 20,759 | | | | 20,712 | | |
Class B – basic | | | 3,514 | | | | 3,511 | | | | 3,514 | | | | 3,503 | | |
Class A – diluted | | | 21,740 | | | | 21,068 | | | | 21,537 | | | | 21,017 | | |
Class B – diluted | | | 3,620 | | | | 3,556 | | | | 3,595 | | | | 3,557 | | |
Basic | | | | 24,585 | | | | 25,251 | |
Diluted | | | | 24,738 | | | | 25,390 | |
See accompanying notes to condensed consolidated financial statements
NATIONAL RESEARCH CORPORATION AND SUBSIDIARY
CONDENSED CONSOLIDATED STATEMENTS OF COMPREHENSIVE INCOME
(In thousands, unaudited)
| | | Three months ended
September 30, | | | Nine months ended September 30, | | | Three months ended March 31, | |
| | | 2017 | | | 2016 | | | 2017 | | | 2016 | | | 2023 | | | 2022 | |
| | | | | | | | | | | | | | | | | | |
Net income | | $ | 4,153 | | | $ | 4,729 | | | $ | 16,426 | | | $ | 14,793 | | | $ | 6,964 | | | $ | 8,539 | |
Other comprehensive income: | | | | | | | | | | | | | | | | | |
Foreign currency translation adjustment | | | 599 | | | | (198 | ) | | | 1,098 | | | | 680 | | | $ | - | | | $ | 51 | |
Other comprehensive income | | $ | 599 | | | $ | (198 | ) | | $ | 1,098 | | | $ | 680 | | | $ | - | | | $ | 51 | |
| | | | | | | | | | | | | | | | | | |
Comprehensive Income | | $ | 4,752 | | | $ | 4,531 | | | $ | 17,524 | | | $ | 15,473 | | |
Comprehensive income | | | $ | 6,964 | | | $ | 8,590 | |
See accompanying notes to condensed consolidated financial statements.
NATIONAL RESEARCH CORPORATION AND SUBSIDIARY
CONDENSED CONSOLIDATED STATEMENTS OF CASH FLOWSSHAREHOLDERS’ EQUITY
(In thousands except share and per share amounts, unaudited)
| | | Nine months ended | |
| | | September 30, | |
| | | 2017 | | | 2016 | |
Cash flows from operating activities: | | | | | | | | |
Net income | | $ | 16,426 | | | $ | 14,793 | |
Adjustments to reconcile net income to net cash provided by operating activities: | | | | | | | | |
Depreciation and amortization | | | 3,376 | | | | 3,146 | |
Deferred income taxes | | | 184 | | | | 905 | |
Reserve for uncertain tax positions | | | 112 | | | | (42 | ) |
Non-cash share-based compensation expense | | | 1,273 | | | | 1,548 | |
Net changes in assets and liabilities: | | | | | | | | |
Trade accounts receivable | | | (2,574 | ) | | | (4,197 | ) |
Unbilled revenue | | | 276 | | | | 141 | |
Prepaid expenses | | | (1,274 | ) | | | (315 | ) |
Accounts payable | | | (108 | ) | | | 73 | |
Accrued expenses, wages, bonuses and profit sharing | | | (293 | ) | | | (90 | ) |
Income taxes receivable and payable | | | 1,157 | | | | (476 | ) |
Deferred revenue | | | 2,925 | | | | 2,533 | |
Net cash provided by operating activities | | | 21,480 | | | | 18,019 | |
| | | | | | | | | |
Cash flows from investing activities: | | | | | | | | |
Purchase of equity investment | | | (1,300 | ) | | | -- | |
Purchase of intangible Content License | | | (250 | ) | | | -- | |
Purchases of property and equipment | | | (3,347 | ) | | | (3,066 | ) |
Net cash used in investing activities | | | (4,897 | ) | | | (3,066 | ) |
| | | | | | | | | |
Cash flows from financing activities: | | | | | | | | |
Payments on notes payable | | | (1,847 | ) | | | (1,795 | ) |
Payments on capital lease obligations | | | (81 | ) | | | (73 | ) |
Cash paid for non-controlling interest | | | -- | | | | (2,000 | ) |
Proceeds from exercise of stock options | | | -- | | | | 548 | |
Payment of employee payroll tax withholdings on share-based awards exercised | | | (105 | ) | | | (204 | ) |
Payment of dividends on common stock | | | (12,649 | ) | | | (25,180 | ) |
Net cash used in financing activities | | | (14,682 | ) | | | (28,704 | ) |
| | | | | | | | | |
Effect of exchange rate changes on cash | | | 828 | | | | 484 | |
Change in cash and cash equivalents | | | 2,729 | | | | (13,267 | ) |
Cash and cash equivalents at beginning of period | | | 33,021 | | | | 42,145 | |
Cash and cash equivalents at end of period | | $ | 35,750 | | | $ | 28,878 | |
| | | | | | | | | |
Supplemental disclosure of cash paid for: | | | | | | | | |
Interest, net of capitalized amounts | | $ | 65 | | | $ | 152 | |
Income taxes | | $ | 7,749 | | | $ | 7,254 | |
Supplemental disclosure of non-cash investing and financing activities: | | | | | | | | |
Capital lease obligations originated for property and equipment | | $ | 74 | | | $ | 109 | |
Stock tendered to the Company for cashless exercise of stock options in connection with equity incentive plans | | $ | 2,123 | | | $ | 397 | |
| | | Common
Stock | | | Additional
Paid-in
Capital | | | Retained
Earnings (Deficit) | | | Treasury Stock | | | Total | |
Balances at December 31, 2022 | | $ | 31 | | | $ | 175,453 | | | $ | (25,184 | ) | | $ | (78,267 | ) | | $ | 72,033 | |
Purchase of 49,296 shares treasury stock | | | - | | | | - | | | | - | | | | (1,983 | ) | | | (1,983 | ) |
Issuance of 20,938 shares of common stock for the exercise of stock options | | | - | | | | 300 | | | | - | | | | - | | | | 300 | |
Non-cash stock compensation expense | | | - | | | | 304 | | | | - | | | | - | | | | 304 | |
Dividends declared of $0.12 per share of common stock | | | - | | | | - | | | | (2,953 | ) | | | - | | | | (2,953 | ) |
Net income | | | - | | | | - | | | | 6,964 | | | | - | | | | 6,964 | |
Balances at March 31, 2023 | | $ | 31 | | | $ | 176,057 | | | $ | (21,173 | ) | | $ | (80,250 | ) | | $ | 74,665 | |
See accompanying notes to condensed consolidated financial statements.
NATIONAL RESEARCH CORPORATION AND SUBSIDIARY
CONDENSED CONSOLIDATED STATEMENTS OF SHAREHOLDERS’ EQUITY
(In thousands except share and per share amounts, unaudited)
| | | Common
Stock | | | Additional
Paid-in
Capital | | | Retained
Earnings (Deficit) | | | Accumulated Other
Comprehensive
Income (Loss) | | | Treasury Stock | | | Total | |
Balances at December 31, 2021 | | $ | 31 | | | $ | 173,942 | | | $ | (36,112 | ) | | $ | (2,375 | ) | | $ | (50,149 | ) | | $ | 85,337 | |
Purchase of 166,962 shares treasury stock | | | - | | | | - | | | | - | | | | - | | | | (6,679 | ) | | | (6,679 | ) |
Non-cash stock compensation expense | | | - | | | | 285 | | | | - | | | | - | | | | - | | | | 285 | |
Dividends declared of $0.24 per share of common stock | | | - | | | | - | | | | (6,047 | ) | | | - | | | | - | | | | (6,047 | ) |
Other comprehensive income, foreign currency translation adjustment | | | - | | | | - | | | | - | | | | 51 | | | | - | | | | 51 | |
Net income | | | - | | | | - | | | | 8,539 | | | | - | | | | - | | | | 8,539 | |
Balances at March 31, 2022 | | $ | 31 | | | $ | 174,227 | | | $ | (33,620 | ) | | $ | (2,324 | ) | | $ | (56,828 | ) | | $ | 81,486 | |
See accompanying notes to condensed consolidated financial statements.
NATIONAL RESEARCH CORPORATION AND SUBSIDIARY
CONDENSED CONSOLIDATED STATEMENTS OF CASH FLOWS
(In thousands, unaudited)
| | | Three months ended | |
| | | March 31 | |
| | | 2023 | | | 2022 | |
Cash flows from operating activities: | | | | | | | | |
Net income | | $ | 6,964 | | | $ | 8,539 | |
Adjustments to reconcile net income to net cash provided by operating activities: | | | | | | | | |
Depreciation and amortization | | | 1,394 | | | | 1,316 | |
Deferred income taxes | | | (377 | ) | | | (498 | ) |
Reserve for uncertain tax positions | | | 124 | | | | 100 | |
Non-cash share-based compensation expense | | | 304 | | | | 285 | |
Net changes in assets and liabilities: | | | | | | | | |
Trade accounts receivable | | | 242 | | | | (2,164 | ) |
Prepaid expenses and other current assets | | | (4,117 | ) | | | (989 | ) |
Deferred contract costs, net | | | 206 | | | | 274 | |
Operating lease assets and liabilities, net | | | (32 | ) | | | (4 | ) |
Accounts payable | | | 171 | | | | (485 | ) |
Accrued expenses, wages and bonuses | | | (97 | ) | | | (777 | ) |
Income taxes receivable and payable | | | 2,273 | | | | 3,215 | |
Deferred revenue | | | 698 | | | | (522 | ) |
Net cash provided by operating activities | | | 7,753 | | | | 8,290 | |
| | | | | | | | | |
Cash flows from investing activities: | | | | | | | | |
Purchases of property and equipment | | | (3,199 | ) | | | (2,542 | ) |
Net cash used in investing activities | | | (3,199 | ) | | | (2,542 | ) |
| | | | | | | | | |
Cash flows from financing activities: | | | | | | | | |
Payments on notes payable | | | (1,114 | ) | | | (1,060 | ) |
Payments on finance lease obligations | | | (115 | ) | | | (125 | ) |
Proceeds from the exercise of share-based awards | | | 301 | | | | - | |
Repurchase of shares for treasury | | | (1,972 | ) | | | (6,679 | ) |
Payments of deferred acquisition consideration | | | - | | | | (1,950 | ) |
Payment of dividends on common stock | | | (2,956 | ) | | | (3,044 | ) |
Net cash used in financing activities | | | (5,856 | ) | | | (12,858 | ) |
| | | | | | | | | |
Effect of exchange rate changes on cash and cash equivalents | | | - | | | | 39 | |
Change in cash and cash equivalents | | | (1,302 | ) | | | (7,071 | ) |
Cash and cash equivalents at beginning of period | | | 25,026 | | | | 54,361 | |
Cash and cash equivalents at end of period | | $ | 23,724 | | | $ | 47,290 | |
| | | | | | | | | |
Supplemental disclosure of cash paid for: | | | | | | | | |
Interest expense, net of capitalized amounts | | $ | 329 | | | $ | 352 | |
Income taxes | | $ | 27 | | | $ | 75 | |
Supplemental disclosure of non-cash investing and financing activities: | | | | | | | | |
Purchase of property and equipment in accounts payable and accrued expenses | | $ | 1,507 | | | $ | 168 | |
Repurchase of shares for treasury in accounts payable and accrued expenses | | $ | 11 | | | $ | - | |
See accompanying notes to condensed consolidated financial statements.
NATIONAL RESEARCH CORPORATION AND SUBSIDIARY
NOTES TO CONDENSED CONSOLIDATED FINANCIAL STATEMENTS
1.(1)
| BASISSUMMARY OF CONSOLIDATION AND PRESENTATIONSIGNIFICANT ACCOUNTING POLICIES
|
Description of business and basis of presentation
National Research Corporation, doing business as NRC Health (“NRC Health,” the “Company,” “we,” “our,” “us” or similar terms), is a leading provider of analytics and insights that facilitate measurement and improvement of the patient and employee experience while also increasing patient engagement and customer loyalty for healthcare providers, payers and other healthcare organizations in the United StatesStates. Our purpose is to humanize healthcare and Canada. The Company’ssupport organizations in their understanding of each person they serve not as point-in-time insights, but as an ongoing relationship. We believe that understanding the story is the key to unlocking the highest-quality and truly personalized care. Our end-to-end solutions enable its clientshealth care organizations to understand what matters most to each person they serve – before, during, after, and outside of clinical encounters – to gain a longitudinal understanding of how life and health intersect, with the voicegoal of the customer with greater clarity, immediacy and depth.
The Company’s six operating segments are aggregated into one reporting segment because they have similar economic characteristics and meet the other aggregation criteria from the Financial Accounting Standards Board (“FASB”) guidance on segment disclosure. The six operating segments are Experience, The Governance Institute, Market Insights, Transparency, NRC Health Canada and Transitions (formerly Connect), which offer adeveloping lasting, trusting relationships. Our portfolio of solutions represents a unique set of capabilities that address specific needs around market insight, experience, transparencyindividually and governance for healthcare providers, payers and other healthcare organizations.collectively provide value to our clients.
TheOur condensed consolidated balance sheet of the Company at December 31, 2016, 2022 was derived from the Company’sour audited consolidated balance sheet as of that date. All other financial statements contained herein are unaudited and, in the opinion of management, include all adjustments (consisting only of normal recurring adjustments) the Company considersthat we consider necessary for a fair presentation of financial position, results of operations and cash flows in accordance with accounting principles generally accepted in the United States.
Information and footnote disclosures included in financial statements prepared in accordance with accounting principles generally accepted in the United States have been condensed or omitted. These condensed consolidated financial statements should be read in conjunction with the consolidated financial statements and notes thereto that are included in the Company’sour Form 10-K10-K for the year ended December 31, 2016, 2022, filed with the Securities and Exchange Commission (the “SEC”) on March 3, 2017.2023.
The preparation of financial statements in conformity with accounting principles generally accepted in the United States requires management to make certain estimates and assumptions that affect the reported amounts of assets and liabilities at the date of the financial statements and the reported amounts of revenue and expenses during the reporting period. Actual results could differ from those estimates.
The condensed consolidated financial statements include the accounts of the Company and itsour wholly-owned subsidiary, National Research Corporation Canada, doing business as NRC Health Canada. The condensed consolidated statement of income for the nine months ended September 30, 2016 also included Customer-Connect LLC. Customer-Connect LLC became a wholly-owned subsidiary in March 2016 and was previously a variable interest entity for which NRC Health was deemed the primary beneficiary. On June 30, 2016, Customer-Connect LLC was dissolved. All significant intercompany transactions and balances have been eliminated.
TheOur Canadian subsidiary uses Canadian dollars as its functional currency of the Company’s foreign subsidiary, National Research Corporation Canada, doing business as NRC Health Canada, is the subsidiary’s local currency. The Company translates theWe translate its assets and liabilities of its foreign subsidiaryinto U.S. dollars at the period-endexchange rate of exchangein effect at the balance sheet date. We translate its revenue and its foreign subsidiary’s income statement balancesexpenses at the average exchange rate prevailing during the period. The Company records the resultingWe included foreign currency translation adjustmentgains and losses in accumulated other comprehensive loss,income (loss), a component of shareholders’ equity. Sinceequity through December 2022. During December 2022, we substantially liquidated our investment in Canada. As a result, we reclassified the undistributed earnings of the Company’scumulative foreign subsidiary are considered to be indefinitely reinvested, no taxes were provided for on currency translation adjustments arising from converting the investment denominatedadjustment balance into earnings in a foreign currency to U.S. dollars. Gains and losses related to transactions denominated2022. Currency translation changes after 2022 are recognized in a currency other than the subsidiary’s local currency and short-term intercompany accounts are includedOther income (expense), net in other income (expense) in the condensed consolidated statementsour Condensed Consolidated Statements of income.Income.
Equity Investments
Revenue Recognition
The Company acquires equity investments to promote businessWe derive a majority of our revenues from our annually renewable subscription-based service agreements with our customers, which include performance measurement and strategic objectives. For investments that do not have a readily determinable fair value,improvement services, healthcare analytics and governance education services. Such agreements are generally cancelable on short or no notice without penalty. See Note 2 for further information about our contracts with customers. We account for revenue using the Company applies either cost or equity method of accounting depending on the nature of its investment and its ability to exercise significant influence. Investments are periodically analyzed to determine whether or not there are any indicators of impairment and written down to fair value if the investment has incurred an other than temporary impairment. During the three-month period ended September 30, 2017, the Company acquired a $1.3 million investment in convertible preferred stock of PracticingExcellence.com, Inc., a privately-held Delaware Corporation (“PX”), which is carried at cost and included in other non-current assets. The Company has a seat on PX's board of directors and the Company's investment, which is not considered to be in-substance common stock, represents approximately 15.7% of the issued and outstanding equity interests in PX at September 30, 2017.following steps:
| ● | Identify the contract, or contracts, with a customer; |
| ● | Identify the performance obligations in the contract; |
| ● | Determine the transaction price; |
| ● | Allocate the transaction price to the identified performance obligations; and |
| ● | Recognize revenue when, or as, we satisfy the performance obligations. |
9
ReclassificationsOur revenue arrangements with a client may include combinations of more than one service offering which may be executed at the same time, or within close proximity of one another. We combine contracts with the same customer into a single contract for accounting purposes when the contract is entered into at or near the same time and the contracts are negotiated together. For contracts that contain more than one separately identifiable performance obligation, the total transaction price is allocated to the identified performance obligations based upon the relative stand-alone selling prices of the performance obligations. The stand-alone selling prices are based on an observable price for services sold to other comparable customers, when available, or an estimated selling price using a cost-plus margin or residual approach. We estimate the amount of total contract consideration we expect to receive for variable arrangements based on the most likely amount we expect to earn from the arrangement based on the expected quantities of services we expect to provide and the contractual pricing based on those quantities. We only include some or a portion of variable consideration in the transaction price when it is probable that a significant reversal in the amount of cumulative revenue recognized will not occur. We consider the sensitivity of the estimate, our relationship and experience with the client and variable services being performed, the range of possible revenue amounts and the magnitude of the variable consideration to the overall arrangement. Our revenue arrangements do not contain any significant financing element due to the contract terms and the timing between when consideration is received and when the service is provided.
ReclassificationsOur arrangements with customers consist principally of four different types of arrangements: 1) subscription-based service agreements; 2) one-time specified services performed at a single point in time; 3) fixed, non-subscription service agreements; and 4) unit-priced service agreements.
Subscription-based services - Services that are provided under subscription-based service agreements are usually for a twelve- month period and represent a single promise to stand ready to provide reporting, tools and services throughout the subscription period as requested by the customer. These agreements are renewable at the option of the customer at the completion of the initial contract term for an agreed upon price increase each year. These agreements represent a series of distinct monthly services that are substantially the same, with the same pattern of transfer to the customer as the customer receives and consumes the benefits throughout the contract period. Accordingly, subscription services are recognized ratably over the subscription period. Subscription services are typically billed either annually or quarterly in advance but may also be billed on a monthly basis.
One-time services –These agreements typically require us to perform a specific one-time service in a particular month. We are entitled to a fixed payment upon completion of the service. Under these arrangements, we recognize revenue at the point in time we complete the service and it is accepted by the customer.
Fixed, non-subscription services –These arrangements typically require us to perform an unspecified amount of services for a fixed price during a fixed period of time. Revenues are recognized over time based upon the costs incurred to date in relation to the total estimated contract costs. In determining cost estimates, management uses historical and forecasted cost information which is based on estimated volumes, external and internal costs and other factors necessary in estimating the total costs over the term of the contract. Changes in estimates are accounted for using a cumulative catch-up adjustment which could impact the amount and timing of revenue for any period.
Unit-price services –These arrangements typically require us to perform certain services on a periodic basis as requested by the customer for a per-unit amount which is typically billed in the month following the performance of the service. Revenue under these arrangements is recognized over the time the services are performed at the per-unit amount.
Revenue is presented net of any sales tax charged to our clients that we are required to remit to taxing authorities. We recognize contract assets or unbilled receivables related to revenue recognized for services completed but not invoiced to the clients. Unbilled receivables are classified as receivables when we have an unconditional right to contract consideration. A contract liability is recognized as deferred revenue when we invoice clients in advance of performing the related services under the terms of a contract. Deferred revenue is recognized as revenue when we have satisfied the related performance obligation.
10
Deferred Contract Costs
Deferred contract costs, net is stated at gross deferred costs less accumulated amortization. We defer commissions and incentives, including payroll taxes, and certain implementation costs if they are incremental and recoverable costs of obtaining a renewable customer contract. Deferred contract costs are amortized over the estimated term of the contract, including renewals, which generally ranges from three to five years. The contract term was estimated by considering factors such as historical customer attrition rates and product life. The amortization period is adjusted for significant changes in the estimated remaining term of a contract. An impairment of deferred contract costs is recognized when the unamortized balance of deferred contract costs exceeds the remaining amount of consideration we expect to receive net of the expected future costs directly related to providing those services. We have elected the practical expedient to expense contract costs when incurred for any nonrenewable contracts with a term of one year or less. We deferred incremental costs of obtaining a contract of $163,000 and $234,000 in the three-month periods ended March 31, 2023 and 2022, respectively. Deferred contract costs, net of accumulated amortization was $2.2 million and 2.4 million at March 31, 2023 and December 31, 2022, respectively. Total amortization by expense classification for the three-month periods ended March 31, 2023 and 2022 was as follows:
| | | 2023 | | | 2022 | |
| | | (In thousands) | |
Direct expenses | | $ | 35 | | | $ | 36 | |
Selling, general and administrative expenses | | $ | 326 | | | $ | 471 | |
Total amortization | | $ | 361 | | | $ | 507 | |
Additional expense included in selling, general and administrative expenses for impairment of costs capitalized due to lost clients was $8,000 and $1,000 for the three-month periods ended March 31, 2023 and 2022, respectively.
Trade Accounts Receivable
Trade accounts receivable are recorded at the invoiced amount. The allowance for doubtful accounts is our best estimate of the amount of probable credit losses in our existing accounts receivable, determined based on our historical write-off experience, current economic conditions and reasonable and supportable forecasts about the future. We review the allowance for doubtful accounts monthly. Account balances are charged off against the allowance after all means of collection have been made from noncurrent deferred income taxes to other noncurrent liabilitiesexhausted and the potential for recovery is considered remote.
The following table provides the activity in the 2016allowance for doubtful accounts for the three-month periods ended March 31, 2023 and 2022 (In thousands):
| | | Balance at Beginning of Period | | | Bad Debt Expense (Benefit) | | | Write-offs | | | Recoveries | | | Balance at End of Period | |
| | | | | | | | | | | | | | | | | | | | | |
Three months ended March 31, 2023 | | $ | 65 | | | $ | - | | | $ | 1 | | | $ | 1 | | | $ | 65 | |
Three months ended March 31, 2022 | | $ | 94 | | | $ | (27 | ) | | $ | - | | | $ | 2 | | | $ | 69 | |
11
Leases
We determine whether a lease is included in an agreement at inception. We recognize a lease liability and a right-of-use (“ROU”) asset on the balance sheet for our operating leases under which we are lessee. Operating lease ROU assets are included in operating lease right-of-use assets in our condensed consolidated balance sheetsheet. Finance lease assets are included in property and equipment. Operating and finance lease liabilities are included in other current liabilities and other long-term liabilities. Certain lease arrangements may include options to extend or terminate the lease. We include these provisions in the ROU asset and lease liabilities only when it is reasonably certain that we will exercise that option. Lease expense for operating lease payments is recognized on a straight-line basis over the lease term and is included in direct expenses and selling, general and administrative expenses. Our lease agreements do not contain any residual value guarantees.
ROU assets represent our right to use an underlying asset for the lease term and lease liabilities represent our obligation to make lease payments during the lease term. ROU assets and lease liabilities are recorded at lease commencement based on the estimated present value of lease payments. Because the unrecognized tax benefits relatedrate of interest implicit in each lease is not readily determinable, we use our estimated incremental collateralized borrowing rate at lease commencement, to state taxes grosscalculate the present value of federal tax benefits, consistentlease payments. When determining the appropriate incremental borrowing rate, we consider our available credit facilities, recently issued debt and public interest rate information.
Due to remote working arrangements, we reassessed our office needs and subleased our Seattle location under an agreement considered to be an operating lease beginning in May 2021. We have not been legally released from our primary obligations under the original lease and therefore we continue to account for the original lease separately. Rent income from the sublessee is included in the statement of operations on a straight-line basis as an offset to rent expense associated with the 2017 financial statement presentation. There was no impact on the previously reported net income and earnings per share.original operating lease included in other expenses.
Fair Value Measurements
The Company’sOur valuation techniques are based on maximizing observable inputs and minimizing the use of unobservable inputs when measuring fair value. Observable inputs reflect readily obtainable data from independent sources, while unobservable inputs reflect the Company’sour market assumptions. The inputs are then classified into the following hierarchy: (1)(1) Level 1 Inputs—quoted prices in active markets for identical assets and liabilities; (2)(2) Level 2 Inputs—observable market-based inputs other than Level 1 inputs, such as quoted prices for similar assets or liabilities in active markets, quoted prices for similar or identical assets or liabilities in markets that are not active, or other inputs that are observable or can be corroborated by observable market data; and (3)(3) Level 3 Inputs—unobservable inputs.
Commercial paper and Eurodollar deposits are included in cash equivalents and are valued at amortized cost, which approximates fair value due to their short-term nature. Eurodollar deposits are United States dollars deposited in a foreign bank branch of a United States bank and have daily liquidity. Both of these are included as a Level 2 measurement in the table below.
The following details the Company’sour financial assets and liabilities within the fair value hierarchy at September 30, 2017 March 31, 2023 and December 31, 2016:2022:
| | | Level 1 | | | Level 2 | | | Level 3 | | | Total | |
| | | (In thousands) | |
As of March 31, 2023 | | | | | | | | | | | | | | | | |
Money Market Funds | | $ | 23,512 | | | $ | - | | | $ | - | | | $ | 23,512 | |
Total Cash Equivalents | | $ | 23,512 | | | $ | - | | | $ | - | | | $ | 23,512 | |
| | | | | | | | | | | | | | | | | |
As of December 31, 2022 | | | | | | | | | | | | | | | | |
Money Market Funds | | $ | 24,927 | | | $ | - | | | $ | - | | | $ | 24,927 | |
Total Cash Equivalents | | $ | 24,927 | | | $ | - | | | $ | - | | | $ | 24,927 | |
Fair Values Measured on a Recurring Basis
There were no transfers between levels during the three months ended March 31, 2023.
| | | Level 1 | | | Level 2 | | | Level 3 | | | Total | |
| | | (In thousands) | |
As of September 30, 2017 | | | | | | | | | | | | | | | | |
Money Market Funds | | $ | 12,586 | | | $ | -- | | | $ | -- | | | $ | 12,586 | |
Commercial Paper | | | -- | | | | 12,948 | | | | -- | | | | 12,948 | |
Eurodollar Deposits | | | -- | | | | 10,008 | | | | -- | | | | 10,008 | |
Total | | $ | 12,586 | | | $ | 22,956 | | | $ | -- | | | $ | 35,542 | |
| | | | | | | | | | | | | | | | | |
As of December 31, 2016 | | | | | | | | | | | | | | | | |
Money Market Funds | | $ | 11,200 | | | $ | -- | | | $ | -- | | | $ | 11,200 | |
Commercial Paper | | | -- | | | | 21,450 | | | | -- | | | | 21,450 | |
Total | | $ | 11,200 | | | $ | 21,450 | | | $ | -- | | | $ | 32,650 | |
12
The Company’sOur long-term debt described in Note 4 is recorded at historical cost. The following arefair value of long-term debt is classified in Level 2 of the carrying amountsfair value hierarchy and was estimated fair values, using a Level 2 discounted cash flow analysis based primarily on estimated current rates available for debt of the same remaining duration and adjusted for nonperformance and credit risk:credit. The following are the carrying amount and estimated fair values of long-term debt:
| | | September 30, 2017 | | | December 31, 2016 | | | March 31,
2023 | | | December 31, 2022 | |
| | | (In thousands) | | | (In thousands) | |
Total carrying amounts of long-term debt | | $ | 1,693 | | | $ | 3,540 | | |
Total carrying amount of long-term debt | | | $ | 21,201 | | | $ | 22,315 | |
Estimated fair value of long-term debt | | $ | 1,690 | | | $ | 3,533 | | | $ | 20,777 | | | $ | 21,668 | |
The Company believes that the carrying amounts of trade accounts receivable, accounts payable, and accrued expenses approximate their fair value due to the short maturity of those instruments. Long-livedvalue. All non-financial assets that are not recognized or disclosed at fair value in the financial statements on a recurring basis, which includes ROU assets, property and equipment, goodwill, intangibles and cost method investments, are measured at fair value in certain circumstances (for example, when there is evidence of impairment). As of September 30, 2017, March 31, 2023 and December 31, 2016, 2022, there was no indication of impairment related to these assets.
Annually, we consider whether the recorded goodwill and indefinite lived intangibles have been impaired. However, goodwill and intangibles must be tested between annual tests if an event occurs or circumstances change to indicate that it is more likely than not that an impairment loss has been incurred (“triggering event”).
Commitments and Contingencies
From time to time, we are involved in certain claims and litigation arising in the normal course of business. Management assesses the probability of loss for such contingencies and recognizes a liability when a loss is probable and estimable. Legal fees, net of estimated insurance recoveries, are expensed as incurred. We do not believe the final disposition of claims at March 31, 2023 will have a material adverse effect on our consolidated financial position, results of operations or liquidity.
2.(2)
| CONTRACTS WITH CUSTOMERS |
The following table disaggregates revenue for the three-month periods ended March 31, 2023 and 2022 based on timing of revenue recognition (in thousands):
| | | 2023 | | | 2022 | |
Subscription services recognized ratably over time | | $ | 34,433 | | | $ | 35,449 | |
Services recognized at a point in time | | | 1,176 | | | | 1,181 | |
Fixed, non-subscription recognized over time | | | 655 | | | | 586 | |
Unit price services recognized over time | | | 209 | | | | 1,225 | |
Total revenue | | $ | 36,473 | | | $ | 38,441 | |
The following table provides information about receivables, contract assets, and contract liabilities from contracts with customers (In thousands):
| | | March 31, 2023 | | | December 31, 2022 | |
Accounts receivables | | $ | 14,220 | | | $ | 14,461 | |
Contract assets included in other current assets | | $ | 153 | | | $ | 102 | |
Deferred Revenue | | $ | 15,896 | | | $ | 15,198 | |
Significant changes in contract assets and contract liabilities during the three-month periods ended March 31, 2023 and 2022 are as follows (in thousands):
| | | 2023 | | | 2022 | |
| | | Contract Asset | | | Deferred Revenue | | | Contract Asset | | | Deferred Revenue | |
| | | Increase (Decrease) | |
Revenue recognized that was included in deferred revenue at beginning of year due to completion of services | | $ | - | | | $ | (7,056 | ) | | $ | - | | | $ | (8,112 | ) |
Increases due to invoicing of client, net of amounts recognized as revenue | | | - | | | | 7,828 | | | | - | | | | 7,542 | |
Decreases due to completion of services (or portion of services) and transferred to accounts receivable | | | (37 | ) | | | - | | | | (49 | ) | | | - | |
Change due to cumulative catch-up adjustments arising from changes in expected contract consideration | | | - | | | | (74 | ) | | | - | | | | 51 | |
Increases due to revenue recognized in the period with additional performance obligations before invoicing | | | 88 | | | | - | | | | 22 | | | | - | |
We have elected to apply the practical expedient to not disclose the value of unsatisfied performance obligations for contracts with an original expected length of one year or less. Total remaining contract revenue for contracts with original duration of greater than one year expected to be recognized in the future related to performance obligations that are unsatisfied at March 31, 2023 approximated $549,000, of which $465,000, $69,000 and $15,000 are expected to be recognized during 2023,2024 and 2025, respectively.
The effective tax rate was 22.7% and 25.3% for the three-month periodthree-month periods ended September 30, 2017 increased to 42.1% compared to 35.3% for the same period in 2016 mainly due to $384,000 of additional tax expense from non-deductible proposed recapitalization expenses (see Note 9).March 31, 2023 and 2022, respectively. The effective tax rate for the nine-month period ended September 30, 2017 increased to 35.9% compared to 33.8% for the same period in 2016. The increase in the effective tax rate for the nine-month period ended September 30, 2017 was primarilydecreased mainly due to $384,000 of additional tax expense from non-deductible proposed recapitalization expenses, increases in the estimated state tax rates as well as a greater proportion of United States income subject to higher tax rates than Canadian income. The Company also had reduced tax expense in 2016 of $105,000 from United States federal tax examination adjustments, net of interest and penalties, and state tax return adjustments decreasing tax expense. These are partially offset by increased tax benefits of $149,000 in 2017$115,000 from the exercise of optionsshare-based compensation awards and dividends paid to non-vested shareholders. lower state income taxes of approximately $265,000 which fluctuate based on various apportionment factors and rates for the states we operate in.
Our long-term debt consists of the following:
| | | March 31,
2023 | | | December 31, 2022 | |
| | | (In thousands) | |
Term Loans | | $ | 21,201 | | | $ | 22,315 | |
Less: current portion | | | (4,546 | ) | | | (4,491 | ) |
Less: unamortized debt issuance costs | | | (125 | ) | | | (134 | ) |
Notes payable, net of current portion | | $ | 16,530 | | | $ | 17,690 | |
Our amended and restated credit agreement (the “Credit Agreement”) with First National Bank of Omaha (“FNB”) includes (i) a $30,000,000 revolving credit facility (the “Line of Credit”), (ii) a $23,412,383 term loan (the “Term Loan”) and (iii) a $75,000,000 delayed draw-down term facility (the “Delayed Draw Term Loan” and, together with the Line of Credit and the Term Loan, the “Credit Facilities”). We may use the Delayed Draw Term Loan to fund any permitted future business acquisitions or repurchases of our common stock and the Line of Credit to fund ongoing working capital needs and for other general corporate purposes.
The Company’s term noteTerm Loan is payable in monthly installments of $212,468. $462,988 through May 2027. The Term Loan bears interest at a fixed rate per annum of 5%.
Borrowings under the term note bear interest at an annual rateLine of 3.12%. The outstanding balance ofCredit and the term note at September 30, 2017 was $1.7 million.
The Company also has a revolving credit note which was amended and extended effective June 30, 2017 with a maturity date of June 30, 2018. The maximum aggregate amount available under the revolving credit note is $12.0 million. Borrowings under the revolving credit noteDelayed Draw Term Loan, if any, bear interest at a variable annualfloating rate with three rate optionsequal to the 30-day Secured Overnight Financing Rate (“SOFR”) plus 235 basis points (6.88% at March 31, 2023). Interest on the discretionLine of management as follows: (1) 2.1% plusCredit accrues and is payable monthly. Principal amounts outstanding under the one-month London Interbank Offered Rate (“LIBOR”) or (2) 2.1% plus the one-, two- or three- month LIBOR rate, or (3) the bank’s one-, two, three, six, or twelve month Money Market Loan Rate. Line of Credit are due and payable in full at maturity, in May 2025. As of September 30, 2017 March 31, 2023, the revolving credit noteLine of Credit did not have a balancebalance. There were no borrowings on the Line of Credit during 2023. There have been no borrowings on the Delayed Draw Term Loan since origination.
We are obligated to pay ongoing unused commitment fees quarterly in arrears pursuant to the Line of Credit and the Company hadDelayed Draw Term Loan facility at a rate of 0.20% per annum based on the capacity to borrow $12.0 million.actual daily unused portions of the Line of Credit and the Delayed Draw Term Loan facility, respectively.
The term noteCredit Agreement is collateralized by substantially all of our assets, subject to permitted liens and revolving credit noteother agreed exceptions, and contains customary representations, warranties, affirmative and negative covenants (including financial covenants) and events of default. The negative covenants include, among other things, restrictions regarding the incurrence of indebtedness and liens, repurchases of our common stock and acquisitions, subject in each case to certain exceptions. Pursuant to the Credit Agreement, we are secured by certainrequired to maintain a minimum fixed charge coverage ratio of 1.10x for all testing periods throughout the term(s) of the Company’s assets, includingCredit Facilities, which calculation excludes, unless our liquidity falls below a specified threshold, (i) any cash dividend in a fiscal quarter that, together with all other cash dividends paid or declared during such fiscal quarter, exceeds $5,500,000 in total cash dividends paid or declared, (ii) the Company’s land, building, trade accounts receivableportion of the purchase price for any permitted share repurchase of our shares paid with cash on hand, and intangible assets. The term note(iii) the portion of any acquisition consideration for a permitted acquisition paid with cash on hand. We are also required to maintain a cash flow leverage ratio of 3.00x or less for all testing periods throughout the term(s) of the Credit Facilities. All obligations under the Credit Facilities are to be guaranteed by each of our direct and revolving credit note contain various restrictionsindirect wholly owned domestic subsidiaries, if any, and, covenants applicable to the Company, including requirements thatextent required by the Company maintain certain financial ratios at prescribed levelsCredit Agreement, direct and restrictions on the ability of the Company to consolidate or merge, create liens, incur additional indebtedness or dispose of assets.indirect wholly owned foreign subsidiaries. As of September 30, 2017, the Company wasMarch 31, 2023, we were in compliance with itsour financial covenants.
4.(5)
| SHARE-BASED COMPENSATION |
The Company measuresWe measure and recognizesrecognize compensation expense for all share-based payments based on the grant-date fair value of those awards. All of the Company’sour existing stock option awards and unvested stock awards have been determined to be equity-classified awards. We account for forfeitures as they occur. We refer to our restricted stock awards as “non-vested” stock in these condensed consolidated financial statements.
The Company’s 2001 Equity Incentive Plan provided for the granting of stock options, stock appreciation rights, restricted stock, performance shares and other share-based awards and benefits up to an aggregate of 1,800,000 shares of class A common stock and 300,000 shares of class B common stock. Stock options granted could have been either nonqualified or incentive stock options. Stock options vest over one to five years following the date of grant and option terms are generally five to ten years following the date of grant.
The Company’s Our 2004 Non-Employee Director Stock Plan, as amended (the “2004“2004 Director Plan”), is a nonqualified plan that provides for the granting of options with respect to 3,000,000 shares of class A common stock and 500,000 shares of class Bour common stock. The 2004 Director Plan provides for grants of nonqualified stock options to each director of the Companyour directors who is we do not employed by the Company. employ. On the date of each annual meeting of shareholders, of the Company, options to purchase 36,000 shares of class A common stock and 6,000 sharesequal to an aggregate grant date fair value of class B common stock$100,000 are granted to directorseach non-employee director that areis elected or retained as a director at each such meeting. Stock options vest approximately one year following the date of grant and option terms are generally the earlier of ten years following the date of grant, or three years infrom the case of termination of the outsidenon-employee director’s service.
The Company’s Our 2006 Equity Incentive Plan (the “2006 Equity Incentive Plan”), as amended, provides for the granting of stock options, stock appreciation rights, restricted stock, performance shares and other share-based awards and benefits up to an aggregate of 1,800,000 shares of class A common stock and 300,000 shares of class Bour common stock. Stock options granted may be either incentive stock options or nonqualified stock options. Vesting terms vary with each grant and option terms are generally five to ten years following the date of grant.
The CompanyDuring the three-month periods ended March 31, 2023 and 2022, we granted options to purchase 299,91759,429 and 54,759 shares of the Company’s class A common stock, and 49,986 shares of the class B common stock during the nine-month period ended September 30, 2017.respectively. Options to purchase shares of common stock wereare typically granted with exercise prices equal to the fair value of the common stock on the date of grant. We do, in certain limited situations, grant options with exercise prices that exceed the fair value of the common stock on the date of grant. The fair value of the stock options granted was estimated using a Black-Scholes valuation model with the following weighted average assumptions:
| | 2017 | | 2016 | | |
| | Class A | | Class B | | Class A | | Class B | | |
| | | | | | | | | | | | | | | | | | | 2023 | | | 2022 | |
Expected dividend yield at date of grant | | 2.46 | to | 2.87% | | 7.99 | to | 8.10% | | 2.96 | to | 3.02% | | 6.67 | to | 8.12% | | | 2.39 | % | | 3.22 | % |
Expected stock price volatility | | 32.20 | to | 32.62% | | 26.47 | to | 27.18% | | 31.33 | to | 34.61% | | 27.64 | to | 31.77% | | | 34.48 | % | | 34.55 | % |
Risk-free interest rate | | 2.08 | to | 2.33% | | 2.08 | to | 2.33% | | 1.36 | to | 2.12% | | 1.36 | to | 2.12% | | | 3.76 | % | | 1.60 | % |
Expected life of options (in years) | | 6 | to | 8 | | 6 | to | 8 | | 6 | to | 8 | | 6 | to | 8 | | | 8.0 | | | 8.0 | |
The risk-free interest rate assumptions were based on the U.S. Treasury yield curve in effect at the time of the grant. The expected volatility was based on historical monthly price changes of the Company’s commonour stock based on the expected life of the options at the date of grant. The expected life of options is the average number of years the Company estimateswe estimate that options will be outstanding. The Company considersWe consider groups of associates that have similar historical exercise behavior separately for valuation purposes.
16
The following table summarizes stock option activity under the Company’s 2001 and 2006 Equity Incentive Plans and the 2004 Director Plan for the nine monthsthree-month periods ended September 30, 2017:March 31, 2023:
| | | Number of
Options | | | Weighted Average Exercise Price | | | Weighted Average Remaining Contractual Terms (Years) | | | Aggregate Intrinsic Value (In thousands) | |
Class A | | | | | | | | | | | | | | | | |
Outstanding at December 31, 2016 | | | 1,705,483 | | | $ | 12.31 | | | | | | | | | |
Granted | | | 299,917 | | | $ | 22.13 | | | | | | | | | |
Exercised | | | (161,784 | ) | | $ | 11.01 | | | | | | | $ | 1,808 | |
Forfeited | | | (60,982 | ) | | $ | 21.35 | | | | | | | | | |
Outstanding at September 30, 2017 | | | 1,782,634 | | | $ | 13.77 | | | | 5.54 | | | $ | 42,651 | |
Exercisable at September 30, 2017 | | | 1,310,361 | | | $ | 12.04 | | | | 4.46 | | | $ | 33,621 | |
Class B | | | | | | | | | | | | | | | | |
Outstanding at December 31, 2016 | | | 250,493 | | | $ | 29.70 | | | | | | | | | |
Granted | | | 49,986 | | | $ | 42.90 | | | | | | | | | |
Exercised | | | (12,000 | ) | | $ | 28.41 | | | | | | | $ | 142 | |
Forfeited | | | (10,163 | ) | | $ | 41.53 | | | | | | | | | |
Outstanding at September 30, 2017 | | | 278,316 | | | $ | 31.69 | | | | 5.74 | | | $ | 6,044 | |
Exercisable at September 30, 2017 | | | 200,550 | | | $ | 29.06 | | | | 4.66 | | | $ | 4,884 | |
| | | Number of
Options | | | Weighted Average Exercise Price | | | Weighted Average Remaining Contractual Terms (Years) | | | Aggregate Intrinsic Value (In thousands) | |
Outstanding at December 31, 2022 | | | 581,286 | | | $ | 32.86 | | | | | | | | | |
Granted | | | 59,429 | | | $ | 38.93 | | | | | | | | | |
Exercised | | | 20,938 | | | $ | 14.35 | | | | | | | | | |
Forfeited | | | - | | | $ | - | | | | | | | | | |
Outstanding at March 31, 2023 | | | 619,777 | | | $ | 34.07 | | | | 5.81 | | | $ | 6,841 | |
Exercisable at March 31, 2023 | | | 340,004 | | | $ | 28.84 | | | | 3.67 | | | $ | 5,490 | |
As of September 30, 2017, March 31, 2023, the total unrecognized compensation cost related to non-vested stock option awards was approximately $1.5$1.7 million and $186,000 for class A and class B common shares, respectively, which iswas expected to be recognized over a weighted average period of 2.46 years3.61 years.
There was $301,000 of cash received from stock options exercised for the three-month period ended March 31, 2023. There were no stock option exercises in the three-month period ended March 31, 2022. We recognized $276,000 and 2.56 years$257,000 of non-cash compensation for class A three-month periods ended March 31, 2023 and class B2022, respectively, related to options, which is included in selling, general and administrative expenses.
We granted 12,698 non-vested shares of common stock under the 2006 Equity Incentive Plan during the three-month periods ended March 31, 2022. As of March 31, 2023, we had 12,698 non-vested shares respectively.
common stock outstanding under the 2006 Equity Incentive Plan. These shares vest over five years following the date of grant and holders thereof are entitled to receive dividends from the date of grant, whether or not vested. The fair value of the awards is calculated as the fair market value of the shares on the date of grant. We recognized $27,000 of non-cash compensation for each of the three-month periods ended March 31, 2023 and 2022, respectively, related to this non-vested stock, which is included in selling, general and administrative expenses. The following table summarizes information for the nine months ended September 30, 2017 regarding non-vested stock granted to associates under the 2001 and 2006 Equity Incentive Plans:Plan for the three-month period ended March 31, 2023:
| | | Class A Shares Outstanding | | | Class A Weighted Average Grant Date Fair Value Per Share | | | Class B Shares Outstanding | | | Class B Weighted Average Grant Date Fair Value Per Share | | | Common Stock Outstanding | | | Weighted Average Grant Date Fair Value Per Share | |
Outstanding at December 31, 2016 | | | 174,487 | | | $ | 13.93 | | | | 29,081 | | | $ | 37.21 | | |
Outstanding at December 31, 2022 | | | 12,698 | | | $ | 42.92 | |
Granted | | | -- | | | | -- | | | | -- | | | | -- | | | - | | | - | |
Vested | | | -- | | | | -- | | | | -- | | | | -- | | | - | | | - | |
Forfeited | | | (19,314 | ) | | $ | 14.26 | | | | (3,219 | ) | | $ | 34.69 | | | | - | | | - | |
Outstanding at September 30, 2017 | | | 155,173 | | | $ | 13.89 | | | | 25,862 | | | $ | 37.53 | | |
Outstanding at March 31, 2023 | | | | 12,698 | | | $ | 42.92 | |
As of September 30, 2017, March 31, 2023, the total unrecognized compensation cost related to non-vested stock awards was approximately $1.0 million$300,000 and is expected to be recognized over a weighted average period of 2.422.75 years.
5.(6)
| GOODWILL AND OTHER INTANGIBLE ASSETS |
The following represents a summary of changes in the Company’s carrying amount of goodwill for the nine months ended September 30, 2017:at March 31, 2023:
| | | (In thousands) | |
Balance as of December 31, 2016 | | $ | 57,861 | |
Foreign currency translation | | | 175 | |
Balance as of September 30, 2017 | | $ | 58,036 | |
| | | Gross | | | Accumulated Impairment | | | Net | |
| | | (In thousands) | |
Balance at March 31, 2023 | | $ | 62,328 | | | | 714 | | | $ | 61,614 | |
Intangible assets consisted of the following:
| | | September 30, 2017 | | | December 31, 2016 | |
| | | (In thousands) | |
Non-amortizing other intangible assets: | | | | | | | | |
Trade name | | $ | 1,191 | | | $ | 1,191 | |
Amortizing other intangible assets: | | | | | | | | |
Customer related | | | 9,349 | | | | 9,331 | |
Technology | | | 1,359 | | | | 1,110 | |
Trade name | | | 1,572 | | | | 1,572 | |
Total other intangible assets | | | 13,471 | | | | 13,204 | |
Accumulated amortization | | | (10,539 | ) | | | (10,080 | ) |
Other intangible assets, net | | $ | 2,932 | | | $ | 3,124 | |
| | | March 31,
2023 | | | December 31, 2022 | |
| | | (In thousands) | |
Non-amortizing intangible assets: | | | | | | | | |
Indefinite trade name | | $ | 1,191 | | | $ | 1,191 | |
Amortizing intangible assets: | | | | | | | | |
Customer related | | | 9,192 | | | | 9,192 | |
Technology | | | 1,959 | | | | 1,959 | |
Trade names | | | 1,572 | | | | 1,572 | |
Total amortizing intangible assets | | | 12,723 | | | | 12,723 | |
Accumulated amortization | | | (12,338 | ) | | | (12,303 | ) |
Other intangible assets, net | | $ | 1,576 | | | $ | 1,611 | |
6.(7)
| PROPERTY AND EQUIPMENT |
| | | September 30, 2017 | | | December 31, 2016 | | | March 31,
2023 | | | December 31, 2022 | |
| | | (In thousands) | | | (In thousands) | |
Property and equipment | | $ | 41,183 | | | $ | 37,890 | | | $ | 54,352 | | | $ | 50,756 | |
Accumulated depreciation | | | (29,094 | ) | | | (26,084 | ) | | | 34,866 | | | | 33,508 | |
Property and equipment, net | | $ | 12,089 | | | $ | 11,806 | | | $ | 19,486 | | | $ | 17,248 | |
Net income per share of class A common stock and class B common stock is computed using the two-class method. Basic net income per share iswas computed by allocating undistributed earnings to common shares and using the weighted-average numbershares of common sharesstock outstanding during the period.
Diluted net income per share iswas computed using the weighted-average numbershares of common sharesstock and, if dilutive, the potential common sharesstock outstanding during the period. Potential shares of common sharesstock consist of the incremental common sharesstock issuable upon the exercise of stock options and vesting of restricted stock. The dilutive effect of outstanding stock options is reflected in diluted earnings per share by application of the treasury stock method.
The liquidation rightsWe had 254,271 and the rights upon the consummation231,319 options of an extraordinary transaction are the samecommon stock for the holders of class A common stock three-month periods ended March 31, 2023 and class B common stock. Other than share distributions and liquidation rights, the amount of any dividend or other distribution payable on each share of class A common stock will be equal to one-sixth (1/6th) of the amount of any such dividend or other distribution payable on each share of class B common stock. As a result, the undistributed earnings for each period are allocated based on the contractual participation rights of the class A and class B common stock as if the earnings for the period had been distributed.
For the three months ended September 30, 2016, 156,610 options of class A shares and 118,830 options of class B shares have been excluded from the diluted net income per share computation because the exercise or grant price exceeded the fair market value. For the three months ended September 30, 2016, an additional 351,620 options of class A shares were excluded as their inclusion would be anti-dilutive.
| | | For the Three Months Ended September 30, 2017 | | | For the Three Months Ended September 30, 2016 | |
| | | Class A Common Stock | | | Class B Common Stock | | | Class A Common Stock | | | Class B Common Stock | |
| | | (In thousands, except per share data) | |
Numerator for net income per share - basic: | | | | | | | | | | | | | | | | |
Net income | | $ | 2,062 | | | $ | 2,091 | | | $ | 2,345 | | | $ | 2,384 | |
Allocation of distributed and undistributed income to unvested restricted stock shareholders | | | (15 | ) | | | (15 | ) | | | (21 | ) | | | (21 | ) |
Net income attributable to common shareholders | | $ | 2,047 | | | $ | 2,076 | | | $ | 2,324 | | | $ | 2,363 | |
Denominator for net income per share - basic: | | | | | | | | | | | | | | | | |
Weighted average common shares outstanding - basic | | | 20,788 | | | | 3,514 | | | | 20,716 | | | | 3,511 | |
Net income per share – basic | | $ | 0.10 | | | $ | 0.59 | | | $ | 0.11 | | | $ | 0.67 | |
Numerator for net income per share - diluted: | | | | | | | | | | | | | | | | |
Net income attributable to common shareholders for basic computation | | $ | 2,047 | | | $ | 2,076 | | | $ | 2,324 | | | $ | 2,363 | |
Denominator for net income per share - diluted: | | | | | | | | | | | | | | | | |
Weighted average common shares outstanding – basic | | | 20,788 | | | | 3,514 | | | | 20,716 | | | | 3,511 | |
Weighted average effect of dilutive securities – stock options | | | 952 | | | | 106 | | | | 352 | | | | 45 | |
Denominator for diluted earnings per share – adjusted weighted average shares | | | 21,740 | | | | 3,620 | | | | 21,068 | | | | 3,556 | |
Net income per share – diluted | | $ | 0.09 | | | $ | 0.57 | | | $ | 0.11 | | | $ | 0.66 | |
For the nine months ended September 30, 2016, the Company had 506,250 options of class A shares and 56,728 options of class B shares,2022, respectively which have been excluded from the diluted net income per share computation because the exercise or grant price exceeded the fair market value. For the nine months ended September 30, 2017 and 2016, an additional 91,385 and 204,170 options of class A shares and 15,231 and 47,429 of Class B shares were excluded as their inclusion would be anti-dilutive, respectively.anti-dilutive.
| | | For the Nine Months Ended September 30, 2017 | | | For the Nine Months Ended September 30, 2016 | |
| | | Class A Common Stock | | | Class B Common Stock | | | Class A Common Stock | | | Class B Common Stock | |
| | | (In thousands, except per share data) | |
Numerator for net income per share - basic: | | | | | | | | | | | | | | | | |
Net income | | $ | 8,151 | | | $ | 8,275 | | | $ | 7,339 | | | $ | 7,454 | |
Allocation of distributed and undistributed income to unvested restricted stock shareholders | | | (63 | ) | | | (64 | ) | | | (64 | ) | | | (64 | ) |
Net income attributable to common shareholders | | $ | 8,088 | | | $ | 8,211 | | | $ | 7,275 | | | $ | 7,390 | |
Denominator for net income per share - basic: | | | | | | | | | | | | | | | | |
Weighted average common shares outstanding – basic | | | 20,759 | | | | 3,514 | | | | 20,712 | | | | 3,503 | |
Net income per share – basic | | $ | 0.39 | | | $ | 2.34 | | | $ | 0.35 | | | $ | 2.11 | |
Numerator for net income per share - diluted: | | | | | | | | | | | | | | | | |
Net income attributable to common shareholders for basic computation | | $ | 8,088 | | | $ | 8,211 | | | $ | 7,275 | | | $ | 7,390 | |
Denominator for net income per share - diluted: | | | | | | | | | | | | | | | | |
Weighted average common shares outstanding – basic | | | 20,759 | | | | 3,514 | | | | 20,712 | | | | 3,503 | |
Weighted average effect of dilutive securities – stock options | | | 778 | | | | 81 | | | | 305 | | | | 54 | |
Denominator for diluted earnings per share – adjusted weighted average shares | | | 21,537 | | | | 3,595 | | | | 21,017 | | | | 3,557 | |
Net income per share – diluted | | $ | 0.38 | | | $ | 2.28 | | | $ | 0.35 | | | $ | 2.08 | |
A director of the Company serves as an officer of Ameritas Life Insurance Corp. (“Ameritas”). In connection with the Company’s regular assessment of its insurance-based associate benefits, which is conducted by an independent insurance broker, and the costs associated therewith, the Company purchases dental and vision insurance for certain of its associates from Ameritas. The total value of these purchases was $63,000 and $59,000 for the three-month periods ended September 30, 2017 and 2016, respectively, and $183,000 and $174,000 for the nine-month periods ended September 30, 2017 and 2016, respectively.
Mr. Hays, the Chief Executive Officer, majority shareholder and director of the Company, is an owner of 14% of the equity interest of Nebraska Global Investment Company LLC (“Nebraska Global”). The Company, directly or indirectly through its former subsidiary Customer-Connect LLC, purchased certain services from Nebraska Global, primarily consisting of software development services. The total value of these purchases were $68,000 and $488,000 in the three-month and nine-month periods ended September 30, 2016, respectively. There were no purchases from Nebraska Global in 2017.
Mr. Hays incurred approximately $538,000 of fees and expenses in connection with exploring strategic alternatives for the Company, including the proposed recapitalization (see Note 9), for which the Company has reimbursed Mr. Hays in the three and nine-month periods ended September 30, 2017.
During the three months ended September 30, 2017, the Company acquired a cost method investment in convertible preferred stock of PX. Prior to the investment, the Company entered into an agreement with PX, under which the Company acts as a reseller of PX services (the “PX reseller agreement”). Additionally, the Company acquired content licenses from PX for content that the Company includes in certain of its subscription services. The total revenue earned from the PX reseller agreement in the three and nine month periods ended September 30, 2017 was $159,000 and $454,000, respectively. There was no revenue earned during the three and nine month periods ended September 30, 2016. The total amount paid for licensed content from PX in the three and nine-month periods ended September 30, 2017 was $250,000. There were no such purchases in 2016.
| | | For the Three Months Ended March 31, 2023 | | | For the Three Months Ended March 31, 2022 | |
| | | (In thousands) | |
Numerator for net income per share – basic: | | $ | 6,964 | | | $ | 8,539 | |
Net income | | | | | | | | |
Allocation of distributed and undistributed income to unvested restricted stock shareholders | | | (4 | ) | | | (5 | ) |
Net income attributable to common shareholders | | | 6,960 | | | | 8,534 | |
Denominator for net income per share – basic: | | | | | | | | |
Weighted average shares of common stock outstanding – basic | | | 24,585 | | | | 25,251 | |
Net income per share – basic | | $ | 0.28 | | | $ | 0.34 | |
| | | | | | | | | |
Numerator for net income per share – diluted: | | | | | | | | |
Net income attributable to common shareholders for basic computation | | | 6,960 | | | | 8,534 | |
Denominator for net income per share – diluted: | | | | | | | | |
Weighted average shares of common stock outstanding – basic | | | 24,585 | | | | 25,251 | |
Weighted average effect of dilutive securities – stock options | | | 153 | | | | 139 | |
Denominator for diluted earnings per share – adjusted weighted average shares | | | 24,738 | | | | 25,390 | |
Net income per share – diluted | | $ | 0.28 | | | $ | 0.34 | |
9.(10)
| PROPOSED RECAPITALIZATIONGeographic Information
|
In September 2017, the Company’s Board of Directors approved a 1-for-1,764,560 reverse stock split of the Company’s class B common stock followed by a 1,764,560-for-1 forward stock split that will cash out all holders of the Company's class B common stock, other than the Company's founder and chief executive officer.
In September 2017, the Company entered into a commitment letter with First National Bank of Omaha, which expires on December 29, 2017, to provide a senior secured term loan of $70 million, a senior secured delayed draw term loan facility of $20 million and a senior secured revolving line of credit facility in an amount equal to $10 million.
The proposed recapitalization is subject to closing of financingtables below present entity-wide information regarding our revenue and approvalassets by the holders of the Company’s class A common stock, class B common stock and both classes of stock voting together as a group.geographic area (in thousands):
The Company incurred expenses related to the proposed recapitalization of approximately $975,000 and $1.1 million in the three and nine months ended September 30, 2017, respectively, which are included in selling and administrative expenses. These expenses include the amount reimbursed to Mr. Hays (see Note 8).
| | | Three months ended March 31, | |
| | | 2023 | | | 2022 | |
Revenue: | | | | | | | | |
United States | | $ | 36,473 | | | $ | 37,850 | |
Canada | | | - | | | | 591 | |
Total | | $ | 36,473 | | | $ | 38,441 | |
10.
| RECENT ACCOUNTING PRONOUNCEMENTS
|
In May 2014, the FASB issued Accounting Standards Update ("ASU") 2014-09, Revenue from Contracts with Customers (Topic 606) (“ASU 2014-09”). ASU 2014-09 requires an entity to recognize the amount of revenue to which it expects to be entitled for the transfer of promised goods or services to customers. ASU 2014-09 will replace most existing revenue recognition guidance in accounting principles generally accepted in the United States when it becomes effective. The standard is effective for annual and interim reporting periods in fiscal years beginning after December 15, 2017, with early adoption allowed for years beginning after December 15, 2016. An entity may choose to adopt ASU 2014-09 either retrospectively or through a cumulative effect adjustment as of the start of the first period for which it applies the standard. The Company is currently in the process of evaluating the impact that this new guidance will have on its consolidated financial statements as well as developing and testing changes to our processes and systems. Due to cost benefit considerations reviewed during the second quarter of 2017, the Company now plans to adopt the guidance beginning January 1, 2018 by recording a cumulative effect adjustment rather than retrospectively, as previously planned. The Company currently expects the most significant changes to result from deferring commissions and recognizing the expense over the estimated life of the client relationship rather than expensing as incurred, which is the Company’s current practice, and estimating variable consideration at the outset of the contract.
| | | March 31, 2023 | | | December 31, 2022 | |
Long-lived assets: | | | | | | | | |
United States | | $ | 89,123 | | | $ | 86,718 | |
Canada | | | 11 | | | | 27 | |
Total | | $ | 89,134 | | | $ | 86,745 | |
| | | | | | | | | |
Total assets: | | | | | | | | |
United States | | $ | 133,993 | | | $ | 130,151 | |
Canada | | | 313 | | | | 310 | |
Total | | $ | 134,306 | | | $ | 130,461 | |
-15-20
In January 2016, the FASB issued ASU 2016-01, Financial Instruments—Overall: Recognition and Measurement of Financial Assets and Financial Liabilities. ASU 2016-01 changes certain recognition, measurement, presentation and disclosure aspects related to financial instruments. ASU 2016-01 is effective for financial statements issued for fiscal years beginning after December 15, 2017, and interim periods within those fiscal years. Early adoption is not permitted. The Company believes its adoption will not significantly impact the Company’s results of operations and financial position.
In February 2016, the FASB issued ASU 2016-02, Leases(Topic 842). This ASU requires lessees to recognize a lease liability and a right-to-use asset for all leases, including operating leases, with a term greater than twelve months on its balance sheet. This ASU is effective in fiscal years beginning after December 15, 2018, with early adoption permitted, and requires a modified retrospective transition method. As of September 30, 2017, the Company had approximately $1.8 million of operating lease commitments which would be recorded on the balance sheet under the new guidance. However, the Company is currently in the process of further evaluating the impact that this new guidance will have on its consolidated financial statements and does not plan to elect early adoption.
In June 2016, the FASB issued ASU 2016-13, Financial Instruments – Credit Losses (Topic 326): Measurement of Credit Losses on Financial Instruments. This ASU will require the measurement of all expected credit losses for financial assets, including trade receivables, held at the reporting date based on historical experience, current conditions, and reasonable and supportable forecasts. The guidance is effective for annual reporting periods beginning after December 15, 2019 and interim periods within those fiscal years. The Company believes its adoption will not significantly impact the Company’s results of operations and financial position.
In August 2016, the FASB issued ASU 2016-15, Statement of Cash Flows (Topic 230) Classification of Certain Cash Receipts and Cash Payments which eliminates the diversity in practice related to eight cash flow classification issues. This ASU is effective for the Company on January 1, 2018 with early adoption permitted. The Company plans to adopt this ASU on January 1, 2018 and believes its adoption will not significantly impact the Company’s results of operations and financial position.
In October 2016, the FASB issued ASU 2016-16, Intra-Entity Transfers of Asset Other Than Inventory (“ASU 2016-16”), which requires entities to recognize the tax consequences of intercompany asset transfers other than inventory transfers in the period in which the transfer takes place. ASU 2016-16 is effective for fiscal years and interim periods within fiscal years beginning after December 15, 2017. ASU 2016-16 is to be adopted using a modified retrospective approach with a cumulative effect adjustment to retained earnings as of the beginning of the period of adoption. The cumulative effect adjustment will include recognition of the income tax consequences of intra-entity transfers of assets other than inventory that occur before the adoption date. The Company believes the adoption of ASU 2016-16 will not significantly impact the Company’s consolidated financial statements.
In November 2016, the FASB issued ASU 2016-18, Statement of Cash Flows (Topic 230), Restricted Cash (“ASU 2016-18”), which requires that the amounts generally described as restricted cash or restricted cash equivalents be included with cash and cash equivalents when reconciling the beginning-of-the period and end-of-period total amounts shown on the statement of cash flows. ASU 2016-18 does not provide a definition of restricted cash or restricted cash equivalents. ASU 2016-18 is effective for fiscal years and interim periods beginning after December 15, 2017. The Company does not expect the adoption of ASU 2016-18 to have any impact on the consolidated financial statements.
In January 2017, the FASB issued ASU 2017-04, Intangibles—Goodwill and Other (Topic 350), Simplifying the Test for Goodwill Impairment (“ASU 2017-04”). The new guidance eliminates Step 2 of the goodwill impairment testing which requires the fair value of individual assets and liabilities of a reporting unit to be determined when measuring goodwill impairment. The new guidance may result in different amounts of impairment that could be recognized compared to existing guidance. In addition, failing step 1 of the impairment test may not result in impairment under existing guidance. However, under the revised guidance, failing step 1 will always result in a goodwill impairment. ASU 2017-04 is to be applied prospectively for goodwill impairment testing performed in years beginning after December 15, 2019. The Company plans to adopt this guidance early with its annual impairment testing as of October 1, 2017 but does not believe the adoption will impact the Company's results of operations or financial position.
ITEM 2. | Management’sManagement’s Discussion and Analysis of Financial Condition and Results of Operations
|
The Companyfollowing discussion of our results of operations and financial conditions should be read in conjunction with our condensed consolidated financial statements and related notes appearing elsewhere in this Quarterly Report on Form 10-Q.
Our purpose is ato humanize healthcare and support organizations in their understanding of each unique individual. Our commitment to Human Understanding® helps leading provider of analytics andhealthcare systems get to know each person they serve not as point-in-time insights, that facilitate measurement and improvement of the patient and employee experience while also increasing patient engagement and customer loyalty for healthcare providers, payers and other healthcare organizations. The Company’sbut as an ongoing relationship. Our end-to-end solutions enable itsour clients to understand what matters most to each person they serve – before, during, after, and beyond clinical encounters – to gain a longitudinal understanding of how life and health intersect, with the voicegoal of the customer with greater clarity, immediacy and depth. NRC Health’s heritage, proprietary methods, and holistic approach enable our partners to better understand the people they care for and design experiences that inspire loyalty and trust, while also facilitating regulatory compliance and the shift to population-based health management. The Company’sdeveloping lasting, trusting relationships. Our ability to measure what matters most and systematically capture, analyze, and deliver insights based on self-reported information from patients, families, and consumers is critical in today’s healthcare market. NRC Health believes thatWe believe access to and analysis of itsour extensive consumer-driven information is becoming moreincreasingly valuable as healthcare providers increasingly need to more deeplybetter understand and engage patientsthe people they serve to create long-term relationships and consumers in an effort towards effective population-based health management.build loyalty.
The Company’sOur portfolio of subscription-based solutions provideprovides actionable information and analysis to healthcare organizations and payers across a range of mission-critical, constituent-related elements, including patient experience, service recovery, care transitions, employee engagement, reputation management, and satisfaction, community population health risks, workforce engagement, community perceptions, and physician engagement. NRC Health partnersbrand loyalty. We partner with clients across the continuum of healthcare services. The Company’s clients range from integrated health systemsservices and post-acute providers, such as home health, long term care and hospice, to numerous payer organizations. The Company believesbelieve this cross-continuum positioning is a unique and an increasingly important capability as evolving payment models drive healthcare providers and payers towards a more collaborative and integrated service model.
Results of Operations
The following table and graphstables set forth, for the periods indicated, selectselected financial information derived from the Company’sour condensed consolidated financial statements expressedand the percentage change in such items versus the prior comparable period, as a percentage of total revenue. The trends illustrated may not necessarily be indicative of future results.well as other key financial metrics. The discussion that follows the tableinformation should be read in conjunction with theour condensed consolidated financial statements.
| | | Three months ended | | | Nine months ended | |
| | | September 30, | | | September 30, | |
| | | 2017 | | | 2016 | | | 2017 | | | 2016 | |
| | | | | | | | | | | | | | | | | |
Revenue: | | | 100.0 | % | | | 100.0 | % | | | 100.0 | % | | | 100.0 | % |
| | | | | | | | | | | | | | | | | |
Operating expenses: | | | | | | | | | | | | | | | | |
Direct | | | 42.4 | | | | 42.4 | | | | 41.9 | | | | 41.6 | |
Selling, general and administrative | | | 29.1 | | | | 26.4 | | | | 25.1 | | | | 26.9 | |
Depreciation and amortization | | | 3.9 | | | | 4.0 | | | | 3.8 | | | | 3.9 | |
Total operating expenses | | | 75.4 | | | | 72.8 | | | | 70.8 | | | | 72.4 | |
| | | | | | | | | | | | | | | | | |
Operating income | | | 24.6 | % | | | 27.2 | % | | | 29.2 | % | | | 27.6 | % |
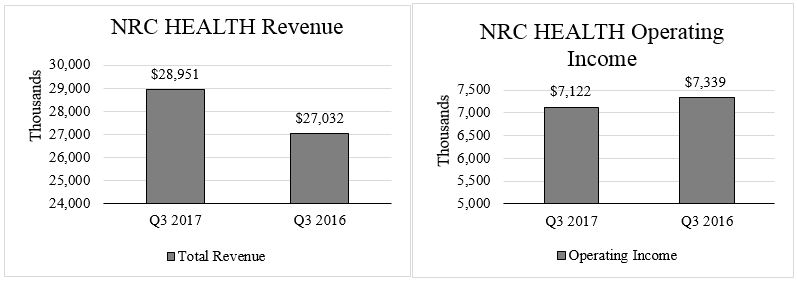
Three Months Ended September 30, 2017,March 31, 2023, Compared to Three Months Ended September 30, 2016March 31, 2022
| | | (In thousands, except percentages)
Three Months Ended March 31, | | | Percentage Increase (Decrease) | |
| | | 2023 | | | 2022 | | | 2023 over 2022 | |
Revenue | | $ | 36,473 | | | $ | 38,441 | | | | (5.1 | ) |
Direct expenses | | | 14,280 | | | | 14,779 | | | | (3.4 | ) |
Selling, general, and administrative | | | 11,783 | | | | 10,649 | | | | 10.6 | |
Depreciation and amortization | | | 1,394 | | | | 1,316 | | | | 5.9 | |
Operating income | | | 9,016 | | | | 11,697 | | | | (22.9 | ) |
Total other income (expense) | | | (5 | ) | | | (264 | ) | | | (98.1 | ) |
Provision for income taxes | | | 2,047 | | | | 2,894 | | | | (29.3 | ) |
Effective Tax Rate | | | 22.7 | % | | | 25.3 | % | | | (2.6 | ) |
| | | | | | | | | | | | | |
Operating margin | | | 24.7 | % | | | 30.4 | % | | | (5.7 | ) |
Recurring Contract Value | | $ | 146,686 | | | $ | 147,574 | | | | (0.6 | ) |
Cash provided by operating activities | | | 7,753 | | | | 8,290 | | | | (6.5 | ) |
RevenueRevenue. . Revenue forin the three-month2023 period ended September 30, 2017, increased 7.1% to $29.0 million,decreased compared to $27.0the 2022 period with reductions in US revenue of $1.4 million in the three-month period ended September 30, 2016. The increase wasand Canadian revenue of $591,000 due to the closure of our Canadian office. US recurring revenue in our existing client base decreased $913,000 which included $412,000 attributed to elimination of a non-core solution. US recurring revenue from new customer sales as well as increasesand non-recurring revenues also decreased $406,000 and $60,000, respectively. We do not expect Canadian revenues in salesthe future due to the existing client base.closure of the Canadian office.
Direct expenses. DirectVariable expenses increased 7.0% to $12.3 million fordecreased $548,000 in the three-month2023 period ended September 30, 2017, compared to $11.5 million in the same2022 period in 2016. This wasprimarily from lower conference expenses due to an increaseone less conference being held in variable expenses of $302,000 and fixed expenses of $497,000.2023. Variable expense increased mainly due increased costs to support the larger revenue and higher contracted voice recognition technology, phone costs, and labor costs, partially offset by decreased postage, printing and paper costs due to changes in survey methodologies. Fixed expenses increased primarily as a result of increased salary and benefit costs in the customer service area. Direct expenses as a percentage of revenue were 42.4%14.2% and 14.9% in the three-month2023 and 2022 periods, ended September 30, 2017respectively. Fixed expenses increased $49,000 primarily due to an increase in contracted services to support our clients of $239,000 and 2016.increased travel costs of $102,000 partially offset by decreased salary and benefit costs of $307,000 from workforce attrition and automation.
Selling, general and administrative expenses. Selling, general and administrative expenses increased 18.1% to $8.4 million forin the three-month2023 period ended September 30, 2017, compared to $7.1 million for the same2022 period in 2016, primarily due to growth in marketing initiative expenses associated with the proposed recapitalization of $975,000, higher recruiting fees$1.3 million to expand brand recognition and support sales development, increased salary and benefit costs of $264,000,$455,000 in sales and client support, and increased computer supplies and software license feestravel costs of $142,000,$262,000 partially offset by lower marketing expensesa reduction in innovation investments of $162,000. Selling, general,$503,000 and administrative expenses increased as a percentagedecreased building demolition costs of revenue$420,000 related to 29.1% for the three-month period ended September 30, 2017, from 26.4% for the same period in 2016 as expenses increased by 18.1% while revenue for the same period increased by 7.1%.remodel of our headquarters.
Depreciation and amortization. amortizationDepreciation and amortization remained at $1.1 million for the three-month periods ended September 30, 2017 and 2016.. Depreciation and amortization expenses asincreased in the 2023 period compared to the 2022 period primarily due to shortening the estimated useful lives of certain building assets.
Operating income and margin. Operating income and margin decreased in the 2023 period compared to the 2022 period primarily due to a percentagedecline in revenue and growth in marketing initiatives.
Total other income (expense). Total other income (expense) decreased in the 2023 period compared to the 2022 period primarily due to higher interest income of revenue was 3.9% for$246,000 from additional money market funds investments and lower interest expense from the declining balance on our term loan of $76,000 partially offset by intercompany revaluation adjustments from changes in the Canadian to U.S. dollar foreign exchange rate of $51,000 during the three-month period ended September 30, 2017, and 4.0% for the same period in 2016.
Provision for income taxes. Provision for income taxes was $3.0 million (42.1% effective tax rate) for the three-month period ended September 30, 2017, compared to $2.6 million (35.3% effective tax rate) for the same period in 2016. The effective tax rate for the three-month period ended September 30, 2017, was higher mainly due to $384,000 of additional tax expense from non-deductible proposed recapitalization expenses.March 31, 2022.
-18-22
Nine Months Ended September 30, 2017, Compared to Nine Months Ended September 30, 2016
Revenue. Revenue for the nine-month period ended September 30, 2017, increased 8.2% to $87.7 million, compared to $81.0 million in the nine-month period ended September 30, 2016. The increase was due to new customer sales, as well as increases in sales to the existing client base.
Direct expenses. Direct expenses increased 8.8% to $36.7 million for the nine-month period ended September 30, 2017, compared to $33.7 million in the same period in 2016. This was due to an increase in variable expenses of $889,000 and fixed expenses of $2.1 million. Variable expense increased mainly increased costs to support the larger revenue and higher contracted voice recognition technology, phone costs, and labor costs, partially offset by decreased postage, printing and paper costs due to a reduction in postage fees and changes in survey methodologies. Fixed expenses increased primarily as a result of increased salary and benefit costs in the customer service area, partially offset by decreased contracted service costs. Direct expenses increased as a percentage of revenue to 41.9% in the nine-month period ended September 30, 2017, compared to 41.6% during the same period of 2016 as expenses increased by 8.8% while revenue for the same period increased by 8.2%.
Selling, general and administrative expenses. Selling, general and administrative expenses increased 1.2% to $22.0 million for the nine-month period ended September 30, 2017, compared to $21.8 million for the same period in 2016, primarily due to expenses associated with the proposed recapitalization of $1.1 million, higher recruiting fees of $412,000, and higher computer supplies and software license fees of $357,000, partially offset by lower salary and benefit costs (including lower incentives, commissions, and share based compensation expense totaling $970,000), lower travel costs of $180,000, $177,000 reduction due to shelf registration fees expensed in 2016, marketing expense decreases of $126,000 and lower development and training costs of $124,000. Selling, general, and administrative expenses decreased as a percentage of revenue to 25.1% for the nine-month period ended September 30, 2017, from 26.9% for the same period in 2016 as expenses increased by 1.2% while revenue for the same period increased by 8.2%.
Depreciation and amortization. Depreciation and amortization expenses increased to $3.4 million for the nine-month period ended September 30, 2017, compared to $3.1 million for the same period in 2016 primarily due to increased amortization of $314,000 from additional computer software investments, partially offset by decreased amortization of $66,000 as a result of certain intangibles becoming fully amortized. Depreciation and amortization expenses as a percentage of revenue was 3.8% and 3.9% for the nine-month periods ended September 30, 2017 and 2016, respectively.
Provision for income taxes and effective tax rate. Provision for income taxes was $9.2 million (35.9% effective tax rate) fordecreased in the nine-month2023 period ended September 30, 2017, compared to $7.6 million (33.8% effective tax rate) for the same2022 period in 2016.primarily due to decreased taxable income. The effective tax rate for the nine-month period ended September 30, 2017 increaseddecreased primarily from $384,000 of additional tax expense from non-deductible proposed recapitalization expenses, increases in the estimated state tax rates as well as a greater proportion of United States income subjectdue to higher tax rates than Canadian income. The Company also had reduced tax expense in 2016 of $105,000 from United States federal tax examination adjustments, net of interest and penalties, and state tax return adjustments decreasing tax expense. These were partially offset by increased tax benefits of $149,000 in 2017$115,000 from the exercise of optionsshare-based compensation awards and dividends paid to non-vested shareholders. lower state income taxes of approximately $265,000 which fluctuate based on various apportionment factors and rates for the states we operate in.
our core digital solutions increased 1.3% at March 31, 2023 compared to March 31, 2022. Our recurring contract value metric represents the total revenue projected under all renewable contracts for their respective next annual renewal periods, assuming no upsells, downsells, price increases, or cancellations, measured as of the most recent quarter end.
Liquidity and Capital Resources
Our Board of Directors has established priorities for capital allocation, which prioritize funding of innovation and growth investments, including merger and acquisition activity as well as internal projects. The Company believessecondary priority is capital allocation for quarterly dividends and share repurchases. We believe that itsour existing sources of liquidity, including cash and cash equivalents, borrowing availability, and operating cash flows will be sufficient to meet itsour projected capital and debt maturity needs and dividend policy for the foreseeable future.
As of September 30, 2017,March 31, 2023, our principal sources of liquidity included $35.8$23.7 million of cash and cash equivalents, and up to $12.0$30 million of unused borrowings under our revolvingline of credit and up to $75 million on our delayed draw term note. Of this cash, $12.8 million$174,000 was held in Canada. AllThe delayed draw term note can only be used to fund permitted future business acquisitions or repurchasing our common stock.
Our cash flows from operating activities consist of the amounts held in Canada are intended to be indefinitely reinvested in foreign operations. The amounts held in Canada are eligiblenet income adjusted for repatriation, but under current law, would be subject to U.S. federalnon-cash items including depreciation and amortization, deferred income taxes, less applicable foreignshare-based compensation and related taxes, reserve for uncertain tax credits. The Company estimated at December 31, 2016, that an additional tax liabilitypositions and the effect of $536,000 would becomeworking capital changes. Cash provided by operating activities decreased mainly due if repatriationto decreased net income net of undistributed earnings would occur.non-cash items. Cash provided by operating activities also decreased due to working capital changes, mainly consisting of changes in prepaid expenses and other current assets primarily due to the timing of our annual business insurance payment and other annual service agreements, partially offset by changes in income taxes receivable and payable due to timing of payments and deferred revenue primarily due to timing of initial billings on new and renewal contracts.
Working CapitalSee the Condensed Consolidated Statements of Cash Flows included in this report for the detail of our operating cash flows.
The Company'sWe had a working capital was $19.7surplus of $9.1 million and $15.6$10.3 million on September 30, 2017March 31, 2023 and December 31, 2016,2022, respectively. The change was primarily due to increasesdecreases in cash and cash equivalents of $2.7 million, increases in trade accounts receivable of $2.7 million, increases in prepaid expenses of $1.5 million, decreases in current portion of notes payable of $990,000, and decreases in accrued wages, bonus, and profit sharing of $392,000. This was partially offset by increases in deferred revenue of $3.0 million and increases in income taxes payable and deferred revenue, partially offset by increases in prepaid expenses. Cash and cash equivalents decreased mainly due to timing of $1.2 million. Trade accounts receivablepayments of annual service agreements and repurchase of shares of our common stock for treasury. Income taxes payable increased due to the timing of billings and collections on new and renewal contracts. Accrued wages, bonus and profit sharing decreased due to the payment of 2016 annual bonuses in the nine-month period ended September 30, 2017. Prepaid expenses changed due to the timing of vendor payments and pre-payments for services. Income taxes payable changed due to the timing of income tax payments. Current portion of notes payable decreased due to normal payment and amortization of the term note. The Company’sOur working capital is significantly impacted by itsour large deferred revenue balances which will vary based on the timing and frequency of billings on annual agreements. The deferred revenue balances as of September 30, 2017 and December 31, 2016 were $18.5 million and $15.5 million, respectively.
The deferred revenue balance is primarily dueCash used in investing activities consisted of purchases of property and equipment including computer software and hardware, building improvements and furniture and equipment.
Cash used in financing activities consisted of payments for borrowings under the term note and finance lease obligations. We also used cash to timingrepurchase shares of initial billingsour common stock for treasury and to pay dividends on new and renewal contracts. The Company typically invoices clients for performance tracking services and custom research projects before they have been completed. Billed amounts are recorded as billings in excesscommon stock. This was partially offset by cash provided from the proceeds from the exercise of revenue earned, or deferred revenue, on the Company’s consolidated financial statements, and are recognized as income when earned. In addition, when work is performed in advance of billing, the Company records this work as revenue earned in excess of billings, or unbilled revenue. Substantially all deferred revenue and all unbilled revenue will be earned and billed respectively, within 12 months of the respective period ends.share-based awards.
Our material cash requirements include the following contractual and other obligations:
Cash Flow Analysis
A summary of operating, investing, and financing activities is shown in the following table:
| | | Nine Months Ended September 30, | |
| | | 2017 | | | 2016 | |
| | | (In thousands) | |
Provided by operating activities | | $ | 21,480 | | | $ | 18,019 | |
Used in investing activities | | | (4,897 | ) | | | (3,066 | ) |
Used in financing activities | | | (14,682 | ) | | | (28,704 | ) |
Effect of exchange rate change on cash | | | 828 | | | | 484 | |
Net change in cash and cash equivalents | | | 2,729 | | | | (13,267 | ) |
Cash and cash equivalents at end of period | | $ | 35,750 | | | $ | 28,878 | |
Cash Flows from Operating ActivitiesDividends
Cash flows from operating activities consistdividends of net income adjusted for non-cash items including depreciation and amortization, deferred taxes, share-based compensation and related taxes, reserve for uncertain tax positions and the effect of working capital changes.
Net cash provided by operating activities was $21.5$3.0 million for the nine months ended September 30, 2017, which included net income of $16.4 million, plus non-cash charges (benefits) for deferred tax expense, depreciation and amortization, reserve for uncertain tax positions and non-cash stock compensation totaling $4.9 million. Changes in working capital increased cash flows from operating activities by $109,000, primarily due to increases in deferred revenue, which fluctuate due to the timing and frequency of billings on new and renewal contracts, and increases in income taxes receivable and payable which fluctuate with the timing of income tax payments. These were partially offset by increases in trade accounts receivable and increases in prepaid expenses.
Net cash provided by operating activities was $18.0 million for the nine months ended September 30, 2016, which included net income of $14.8 million, plus non-cash charges (benefits) for deferred tax expense, depreciation and amortization, provision for uncertain tax positions and non-cash stock compensation totaling $5.6 million. Changes in working capital decreased 2016 cash flows from operating activities by $2.3 million, primarily due to increases in trade accounts receivable and prepaid expenses and a decrease in income taxes payable, net of increases in deferred revenue due to the timing of billing, collections and revenue recognition on new or renewal contracts.
Net cash provided by operating activities increased $3.5 million for the nine months ended September 30, 2017 compared to the nine months ended September 30, 2016. The increase was mainly due to an increase in net income of $1.6 million and working capital changes of $2.4 million. Working capital increased primarily due to changes in trade accounts receivable, income taxes receivable and payable, and prepaid expenses.
Cash Flows from Investing Activities
Net cash of $4.9 million and $3.1 million was used for investing activities in the nine months ended September 30, 2017 and 2016, respectively. Purchases of property and equipment totaled $3.3 million and $3.1 million in the nine months ended September 30, 2017 and 2016, respectively. In addition, the Company used $1.3 million of cashpaid in the three months ended September 30, 2017March 31, 2023. Dividends of $3.0 million were declared in the three months ended March 31, 2023 and paid in April 2023. The dividends were paid from cash on hand. Our board of directors considers whether to acquiredeclare a strategic investment in PX.
Cash Flows from Financing Activitiesany dividends declared on a quarterly basis.
Net cash used in financing activities was $14.7 million in the nine months ended September 30, 2017. Cash was used to repay borrowings under the term note totaling $1.8 million and for capital lease obligations of $81,000. Cash was also used to pay $12.6 million of dividends on common stock, and to pay payroll tax withholdings related to share-based compensation of $105,000.
Net cash used in financing activities was $28.7 million in the nine months ended September 30, 2016. The exercise of stock options provided cash of $548,000. Cash was used to pay payroll taxes on vested restricted shares of $204,000, to pay capital lease obligations of $73,000, to repay borrowings under the term note totaling $1.8 million, to pay dividends on common stock of $25.2 million, and to pay $2.0 million for Customer-Connect LLC non-controlling interests.
The effect of changes in foreign exchange rates increased cash and cash equivalents by $828,000 and $484,000 in the nine months ended September 30, 2017 and 2016, respectively.
Capital Expenditures
CashWe paid cash of $3.2 million for capital expenditures was $3.3 million forin the ninethree months ended September 30, 2017.March 31, 2023. These expenditures consisted mainly of computer software classified in propertydevelopment for our Human Understanding solutions and equipment. The Company expects similar capital expenditure purchases for the remainder of 2017 consisting primarily of computer software and hardware and other equipmentbuilding renovations to our headquarters. We estimate future costs related to our headquarters building renovations to be funded$14.5 million and $2.9 million in 2023 and 2024, respectively, which we expect to fund through operating cash generated from operations.flows.
Debt and Equity
The Company’s term note is payable in monthly installments of $212,468. Borrowings under the term note bear interest at an annual rate of 3.12%. The outstanding balance of the term note at September 30, 2017 was $1.7 million.
The Company also has a revolving credit note which wasOur amended and extended effective June 30, 2017 with a maturity date of June 30, 2018. The maximum aggregate amount available under the revolvingrestated credit note is $12.0 million. Borrowings under the revolving credit note bear interest at a variable annual rate, with three rate options at the discretion of management as follows: (1) 2.1% plus the one-month London Interbank Offered Rate (“LIBOR”) or (2) 2.1% plus the one-, two- or three- month LIBOR rate, or (3) the bank’s one-, two, three, six, or twelve month Money Market Loan Rate. As of September 30, 2017 the revolving credit note did not have a balance. The Company had the capacity to borrow $12.0 million as of September 30, 2017.
The term note and revolving credit note are secured by certain of the Company’s assets, including the Company’s land, building, trade accounts receivable and intangible assets. The term note and revolving credit note contain various restrictions and covenants applicable to the Company, including requirements that the Company maintain certain financial ratios at prescribed levels and restrictions on the ability of the Company to consolidate or merge, create liens, incur additional indebtedness or dispose of assets. As of September 30, 2017, the Company was in compliance with its financial covenants.
The Company has capital leases for computer equipment, office equipment, printing and inserting equipment. The balance of the capital leases as of September 30, 2017 was $185,000.
Shareholders’ equity increased $6.0 million to $88.8 million at September 30, 2017, from $82.8 million at December 31, 2016. The increase was mainly due to net income of $16.4 million, share-based compensation of $1.3 million and changes in the cumulative translation adjustment of $1.1 million. This was partially offset by dividends declared of $12.7 million.
In September 2017, the Company’s Board of Directors approved a 1-for-1,764,560 reverse stock split of the Company’s class B common stock followed by a 1,764,560-for-1 forward stock split that will cash out all holders of the Company's class B common stock, other than the Company's founder and chief executive officer. Outstanding unvested share based awards of class B common stock will vest immediately preceding the reverse stock split. Each holder of class B common stock, other than the Company’s founder and chief executive officer, will receive a cash payment from the Company of $53.44 for each share of class B common stock. The class B common stock will cease trading and be delisted. The transaction is designed to address shareholder concerns with public market trading confusion related to the Company’s two classes of common stockagreement (the class A common stock and class B common stock) and to provide a timely and cost-effective liquidity event for the holders of the Company’s class B common stock. The transaction will be funded by cash on hand in the United States, a $70 million term loan and borrowings on a line of credit.
In September 2017, the Company entered into a commitment letter“Credit Agreement”) with First National Bank of Omaha (“FNB”) includes (i) a $30,000,000 revolving credit facility (the “Line of Credit”), which expires on December 29, 2017, to provide(ii) a senior secured$23,412,383 term loan of $70 million (the “Term Loan”), and (iii) a senior secured$75,000,000 delayed drawdraw-down term loan facility of $20 million (the “Delayed Draw Term Loan”) and, a senior secured revolving line of credit facility in an amount equal to $10 million (the “Line of Credit” and, collectivelytogether with the Term LoanLine of Credit and the Delayed Draw Term Loan, the “Credit Facilities”). IfWe may use the Company closes on the Credit Facilities with FNB, any balances remaining on the existing term note and revolving credit note will be repaid. The Term Loan will be used to fund, in part, the reverse stock split, related costs and cashing out outstanding stock options and restricted shares tied to the class B common stock. The Delayed Draw Term Loan if used, is designated to fund any permitted future business acquisitions or repurchasingrepurchases of class Aour common stock. Thestock and the Line of Credit has a three year term and will be used to fund ongoing working capital needs and for other general corporate purpose. The Company will also pay loan origination fees equal to 0.25% of the amount borrowed under the Term Loan at closing.purposes.
The proposed recapitalizationTerm Loan has an outstanding balance of $21.2 million and is payable in monthly installments of $462,988 through May 2027. The Term Loan bears interest at a fixed rate per annum of 5%.
Borrowings under the Line of Credit and the Delayed Draw Term Loan, if any, bear interest at a floating rate equal to the 30-day Secured Overnight Financing Rate (“SOFR”) plus 235 basis points (6.88% at March 31,2023). Interest on the Line of Credit accrues and is payable monthly. Principal amounts outstanding under the Line of Credit are due and payable in full at maturity, in May 2025. As of March 31, 2023, the Line of Credit did not have a balance. There were no borrowings on the Line of Credit during 2023. There have been no borrowings on the Delayed Draw Term Loan since origination.
We are obligated to pay ongoing unused commitment fees quarterly in arrears pursuant to the Line of Credit and the Delayed Draw Term Loan facility at a rate of 0.20% per annum based on the actual daily unused portions of the Line of Credit and the Delayed Draw Term Loan facility, respectively.
The Credit Agreement is collateralized by substantially all of our assets, subject to closingpermitted liens and other agreed exceptions, and contains customary representations, warranties, affirmative and negative covenants (including financial covenants) and events of financingdefault. The negative covenants include, among other things, restrictions regarding the incurrence of indebtedness and approval by the holdersliens, repurchases of the Company’s class A common stock, class Bour common stock and both classes of stock voting together as a group. The Company incurred expenses relatedacquisitions, subject in each case to certain exceptions. Pursuant to the proposed recapitalizationCredit Agreement, we are required to maintain a minimum fixed charge coverage ratio of approximately $975,0001.10x for all testing periods throughout the term(s) of the Credit Facilities, which calculation excludes, unless our liquidity falls below a specified threshold, (i) any cash dividend in a fiscal quarter that, together with all other cash dividends paid or declared during such fiscal quarter, exceeds $5,500,000 in total cash dividends paid or declared, (ii) the portion of the purchase price for any permitted share repurchase of our shares paid with cash on hand, and $1.1 million(iii) the portion of any acquisition consideration for a permitted acquisition paid with cash on hand. We are also required to maintain a cash flow leverage ratio of 3.00x or less for all testing periods throughout the term(s) of the Credit Facilities. All obligations under the Credit Facilities are to be guaranteed by each of our direct and indirect wholly owned domestic subsidiaries, if any, and, to the extent required by the Credit Agreement, direct and indirect wholly owned foreign subsidiaries. As of March 31, 2023, we were in compliance with our financial covenants.
The Credit Facilities are secured, subject to permitted liens and other agreed upon exceptions, by a first-priority lien on and perfected security interest in substantially all of our and our guarantors’ present and future assets (including, without limitation, fee-owned real property, and limited, in the three and nine months ended September 30, 2017, respectively, which are included in selling and administrative expenses.case of the equity interests of foreign subsidiaries, to 65% of the outstanding equity interests of such subsidiaries).
Contractual ObligationsLeases
We have lease arrangements for certain computer, office, printing and inserting equipment as well as office and data center space. As of March 31, 2023, we had fixed lease payments of $474,000 and $210,000 for operating and finance leases, respectively payable within 12 months.
Taxes
The Company had contractual obligationsliability for gross unrecognized tax benefits related to make paymentsuncertain tax positions was $1.7 million as of March 31, 2023. See Note 3, "Income Taxes", to the Condensed Consolidated Financial Statements contained in this report for income tax related information.
As of March 31, 2023, the balance of the deemed repatriation tax payable imposed by the U.S. Tax Cuts and Jobs Act of 2017 was $11,000, which we expect to pay in early 2024. Withholding tax of $72,000 was paid in the following amountsthree-month period ended March 31, 2023, due to the deemed dividend and return of capital processed in the future as of September 30, 2017:2022.
Contractual Obligations(1) | | Total Payments | | | Remainder
of 2017 | | | One to Three Years | | | Three to Five Years | | | After Five Years | |
(In thousands) | | | | | | | | | | | | | | | | | | | | |
Operating leases | | $ | 1,820 | | | $ | 190 | | | $ | 1,143 | | | $ | 487 | | | $ | -- | |
Capital leases | | | 203 | | | | 30 | | | | 130 | | | | 42 | | | | 1 | |
Uncertain tax positions(2) | | | -- | | | | -- | | | | -- | | | | -- | | | | -- | |
Long-term debt | | | 1,711 | | | | 848 | | | | 863 | | | | -- | | | | -- | |
Total | | $ | 3,734 | | | $ | 1,068 | | | $ | 2,136 | | | $ | 529 | | | $ | 1 | |
| (1)
| Amounts are inclusive of interest payments, where applicable.
|
| (2)
| We have $769,000 in liabilities associated with uncertain tax positions. We are unable to reasonably estimate the expected cash settlement dates of these uncertain tax positions with the taxing authorities.
|
Stock Repurchase Program
TheIn May 2022, our Board of Directors of the Company authorized the repurchase of up to 2,250,000 class A and 375,000 class B2,500,000 shares of common stock in(the “2022 Program”). Under the 2022 Program we are authorized to repurchase from time-to-time shares of our outstanding common stock on the open market or in privately negotiated transactionstransactions. The timing and amount of stock repurchases will depend on a variety of factors, including market conditions as well as corporate and regulatory considerations. The 2022 Program may be suspended, modified, or discontinued at any time and we have no obligation to repurchase any amount of common stock in connection with the 2022 Program. The 2022 Program has no set expiration date.
During the three months ended March 31, 2023, we repurchased 49,296 shares of our common stock under a stock repurchase program that was originally approved in February 2006 and subsequently amended in May 2013.the 2022 Program for an aggregate of $2.0 million. As of September 30, 2017March 31, 2023, the remaining number of shares of common stock shares that could be purchased under this authorizationthe 2022 Program was 280,491 class A shares and 69,491 class B1,875,148 shares.
Critical Accounting Estimates
There have been no changes to our critical accounting estimates described in the Annual Report on Form 10-K for the year ended December 31, 2022 that have a material impact on our Condensed Consolidated Financial Statements and the related Notes.
ITEM 3. | Quantitative and Qualitative Disclosures about Market Risk |
There are no material changes to the disclosures regarding the Company’sour market risk exposures made in its Annual Report on Form 10-K for the year ended December 31, 2016.2022.
ITEM 4. | Controls and Procedures |
The Company’sOur management, with the participation of the Company’sour Chief Executive Officer and Chief Financial Officer, has evaluated the effectiveness of the design and operation of the Company’sour disclosure controls and procedures (as such term is defined in Rules 13a-15(e) and 15d-15(e) under the Securities Exchange Act of 1934) as of the end of the period covered by this report, and hasour Chief Executive Officer and Chief Financial Officer have concluded that, as of the end of such period, the Company’sour disclosure controls and procedures were effective.
Because of its inherent limitations, internal control over financial reporting may not prevent or detect misstatements. Also, projections of any evaluation of effectiveness to future periods are subject to the risk that controls may become inadequate because of changes in conditions, or that the degree of compliance with the policies or procedures may deteriorate. Accordingly, even effective internal control over financial reporting can only provide reasonable assurance of achieving its control objectives.
We have confidence in our internal controls and procedures. Nevertheless, our management, including our Chief Executive Officer and Chief Financial Officer, does not expect that our disclosure procedures and controls or our internal controls will prevent all errors or intentional fraud. An internal control system, no matter how well-conceived and operated, can provide only reasonable, not absolute, assurance that the objectives of such internal controls are met. Further, the design of an internal control system must reflect the fact that there are resource constraints, and the benefits of controls must be considered relative to their costs. As a result of the inherent limitations in all internal control systems, no evaluation of controls can provide absolute assurance that all our control issues and instances of fraud, if any, have been detected.
There have been no changes in the Company’sour internal control over financial reporting (as such term is defined in Rules 13a-15(f) and 15d-15(f) under the Securities Exchange Act of 1934) that occurred during the quarter ended September 30, 2017,March 31, 2023, that have materially affected, or are reasonably likely to materially affect, the Company’sour internal control over financial reporting.
PART II – Other Information
| ITEM 1A.1. | Risk FactorsLegal Proceedings
|
There have been no material changesFrom time to time, we are involved in certain claims and litigation arising in the normal course of business. Management assesses the probability of loss for such contingencies and recognizes a liability when a loss is probable and estimable. For additional information, see Note 1, under the heading “Commitments and Contingencies,” to our condensed consolidated financial statements. Regardless of the final outcome, any legal proceedings, claims, inquiries and investigations, however, can impose a significant burden on management and employees, may include costly defense and settlement costs, and could cause harm to our reputation and brand, and other factors.
The significant risk factors relatingknown to the Company set forthus that could materially adversely affect our business, financial condition, or operating results are described in Part I, Item 2: Management’s Discussion and Analysis of Financial Condition and Results of Operations and in Part I, Item 1A of itsour Annual Report on Form 10-K for the year ended December 31, 2016.2022.
| ITEM 2. | Unregistered Sales of Equity Securities and Use of Proceeds |
In May 2022 our Board of Directors authorized the 2022 Program.
Our Credit Agreement provides that, in order for us to pay dividends or repurchase our common stock, there must be no default or event of default existing or that would result from such payment and we must show that we would comply with the Credit Agreement’s fixed charge coverage ratio and consolidated cash flow leverage ratio after giving pro forma effect to such payment.
The Board of Directors of the Company authorized the repurchase of up to 2,250,000 class A and 375,000 class B sharestable below summarizes repurchases of common stock in the open market or in privately negotiated transactions under a stock repurchase program that was originally approved in February 2006 and subsequently amended in May 2013. Unless terminated earlier by resolution of the Company’s Board of Directors, the repurchase program will expire when the Company has repurchased all shares authorized for repurchase thereunder. As of October 27, 2017, 1,969,509 shares of class A common stock and 305,509 shares of class B common stock have been repurchased under that authorization. No stock was repurchased under the program during the three-month periodthree months ended September 30, 2017.March 31, 2023.
Period | | Total Number of Shares Purchased | | | Average Price Paid per Share (1) | | | Total Number of Shares Purchased as Part of Publicly Announced Plans or Programs(2) | | | Maximum Number of Shares that May Yet Be Purchased Under the Plans or Programs | |
| | | | | | | | | | | | | | | | | |
Jan 1 – Jan 31, 2023 | | | 44,721 | | | | 39.81 | | | | 44,721 | | | | 1,879,723 | |
Feb 1 – Feb 28, 2023 | | | - | | | | - | | | | - | | | | 1,879,723 | |
Mar 1 – Mar 31, 2023 | | | 4,575 | | | | 42.02 | | | | 4,575 | | | | 1,875,148 | |
Total | | | 49,296 | | | | | | | | 49,296 | | | | | |
| ITEM 6.(1)
| ExhibitsThe average price paid per share excludes excise tax incurred on stock repurchases. For the quarter ended March 31, 2023, excise tax expense totaled $11,000.
|
(2) | Shares were repurchased pursuant to the 2022 Program. |
The exhibits listed in the exhibit index below are filed as part of this Quarterly Report on Form 10-Q.
EXHIBIT INDEX
Exhibit
Number | Exhibit Description |
| |
(3.1) | Certificate of Incorporation of National Research Corporation, effective June 30, 2021 [Incorporated by reference to Exhibit 3.3 to National Research Corporation’s Current Report on Form 8-K dated June 29, 2021, and filed on July 2, 2021 (File No. 001-35929)] |
| |
(3.2) | Bylaws of National Research Corporation, as amended to date [Incorporated by reference to Exhibit 3.4 to National Research Corporation’s Current Report on Form 8-K dated June 29, 2021 and filed on July 2, 2021 (File No. 001-35929)] |
| |
(4.1) | Certificate of Incorporation of National Research Corporation, effective June 30, 2021 [Incorporated by reference to Exhibit 3.3 to National Research Corporation’s Current Report on Form 8-K dated June 29, 2021, and filed on July 2, 2021 (File No. 001-35929)] |
| |
(4.2) | Bylaws of National Research Corporation, as amended to date [Incorporated by reference to Exhibit 3.4 to National Research Corporation’s Current Report on Form 8-K dated June 29, 2021 and filed on July 2, 2021 (File No. 001-35929)] |
| |
(31.1)** | Certification by the Chief Executive Officer pursuant to Rule 13a-14(a) or 15d-14(a) under the Securities Exchange Act of 1934.1934 |
| |
(101)* ** | Financial statements from the Quarterly Report on Form 10-Q of National Research Corporation for the quarter ended September 30, 2017,March 31, 2023, formatted in Inline eXtensible Business Reporting Language (XBRL)(iXBRL): (i) the Condensed Consolidated Balance Sheets, (ii) the Condensed Consolidated Statements of Income, (iii) the Condensed Consolidated Statements of Comprehensive Income, (iv) the Condensed Consolidated Statements of Cash Flows, (v) the Notes to Condensed Consolidated Financial Statements, and (vi) document and entity information. |
| |
(104) ** | Cover Page Interactive Data File (formatted in the Inline XBRL and contained in Exhibit 101). |
** Filed herewith | In accordance with Rule 406T of Regulation S-T, the information in these exhibits shall not be deemed to be “filed” for purposes of Section 18 of the Securities Exchange Act of 1934, as amended, or otherwise subject to liability under that section, and shall not be incorporated by reference into any registration statement or other document filed under the Securities Act of 1933, as amended, except as expressly set forth by specific reference in such filing.
|
SIGNATURES
Pursuant to the requirements of the Securities Exchange Act of 1934, the Registrant has duly caused this report to be signed on its behalf by the undersigned thereunto duly authorized.
| NATIONAL RESEARCH CORPORATION | |
| | |
| | | |
Date: November 9, 2017May 5, 2023 | By: | /s/ Michael D. Hays | |
| | Michael D. Hays | |
| | Chief Executive Officer (Principal (Principal Executive Officer) | |
| | | |
| | | |
| | | |
Date: November 9, 2017 May 5, 2023 | By: | /s/ Kevin R. Karas | |
| | Kevin R. Karas Senior Vice President Finance, Treasurer, Secretary and Chief Financial Officer (Principal Financial and Accounting Officer) | |
-26-
