Note 3. Investments
Our current investments, which are classified as "available for sale" and consist of bonds having maturities of greater than 90 days were $33.8 million at December 31, 2017. We held no such investments as of September 30, 2018. During the first nine months of 2018 and 2017, we had purchases of such investments of $31.2 million and $35.3 million, respectively, and maturities of $64.9 million and $31.2 million, respectively. Our current investments at December 31, 2017 consisted of the following (in thousands):
December 31, 2017 | ||||||||||||
Amortized cost | Unrealized+ loss | Fair value | ||||||||||
Corporate bonds | $ | 33,778 | $ | (20 | ) | $ | 33,758 | |||||
At September 30, 20182019 and December 31, 2017,2018, the fair value of our non-current investments was $7.2$7.3 million and $7.6$6.6 million, respectively. Our non-current investments consist of marketable equity securities which are carried at fair value, and are primarily classified as “available-for-sale.” The cost basis of our non-current investments was approximately $7.9$9.6 million and $5.7$7.7 million at September 30, 20182019 and December 31, 2017,2018, respectively. In the firstnine months of 20182019 and 2017,2018, we acquired marketable equity securities having a cost basis of $2.6 million and $0.8 million, and $1.6respectively. In the firstnine months of 2019, we sold marketable equity securities having a cost basis of $0.9 million respectively.for proceeds of $1.8 million, resulting in a gain of $0.9 million. During the firstnine months of 2019 and 2018, we recognized $1.2 million and $2.5 million, in net unrealized losses in current earnings. During the first nine months of 2017, we recognized $1.5 million in net unrealized gains in other comprehensive income and $0.1 millionrespectively, in net unrealized losses in current earnings.
Note 4.3. Income Taxes
Major components of our income tax provision (benefit)benefit (provision) for the three and nine months ended September 30, 2018 2019 and 20172018 are as follows (in thousands):
Three Months Ended | Nine Months Ended | |||||||||||||||
September 30, | September 30, | |||||||||||||||
2018 | 2017 | 2018 | 2017 | |||||||||||||
Current: | ||||||||||||||||
Domestic | $ | — | $ | — | $ | 1 | $ | (12,797 | ) | |||||||
Foreign | 80 | (3,959 | ) | 4,250 | 17,491 | |||||||||||
Total current income tax provision (benefit) | 80 | (3,959 | ) | 4,251 | 4,694 | |||||||||||
Deferred: | ||||||||||||||||
Domestic | (3,778 | ) | 1,980 | (3,778 | ) | (13,958 | ) | |||||||||
Foreign | 1,019 | (3,151 | ) | (1,957 | ) | (8,300 | ) | |||||||||
Total deferred income tax provision (benefit) | (2,759 | ) | (1,171 | ) | (5,735 | ) | (22,258 | ) | ||||||||
Total income tax provision (benefit) | $ | (2,679 | ) | $ | (5,130 | ) | $ | (1,484 | ) | $ | (17,564 | ) | ||||
Three Months Ended | Nine Months Ended | |||||||||||||||
September 30, | September 30, | |||||||||||||||
2019 | 2018 | 2019 | 2018 | |||||||||||||
Current: | ||||||||||||||||
Domestic | $ | (315 | ) | $ | — | $ | (317 | ) | $ | (1 | ) | |||||
Foreign | (2,467 | ) | (80 | ) | (5,260 | ) | (4,250 | ) | ||||||||
Total current income tax benefit (provision) | (2,782 | ) | (80 | ) | (5,577 | ) | (4,251 | ) | ||||||||
Deferred: | ||||||||||||||||
Domestic | 2,652 | 3,778 | 10,585 | 3,778 | ||||||||||||
Foreign | 1,744 | (1,019 | ) | 15,001 | 1,957 | |||||||||||
Total deferred income tax benefit (provision) | 4,396 | 2,759 | 25,586 | 5,735 | ||||||||||||
Total income tax benefit (provision) | $ | 1,614 | $ | 2,679 | $ | 20,009 | $ | 1,484 | ||||||||
The current income tax provisionsbenefits (provisions) for the three and nine months ended September 30, 20182019 and 20172018 vary from the amounts that would have resulted from applying the statutory income tax rate to pre-tax income due primarily to the impact of taxation in foreign jurisdictions and a valuation allowance on the majority of U.S. deferred taxes and the impact of the change in accounting method treatment of the #4 Shaft development costs in 2017.tax assets.
As of September 30, 2018,2019, we have a net deferred tax liability in the U.S. of $46.7$43.1 million, a net deferred tax liability in Canada of $118.1$100.3 million and a net deferred tax asset in Mexico of $1.9$3.7 million, for a consolidated worldwide net deferred tax liability of $162.9$139.7 million.
With the acquisition of Klondex Mines Ltd. ("Klondex") on July 20, 2018 (see(see Note 1413), we acquired a U.S. consolidated tax group (the "Klondex"Nevada U.S. Group") that did not join the existing consolidated U.S. tax group of Hecla Mining Company and subsidiaries (“Legacy Hecla”Hecla U.S.”). Under acquisition accounting, we recorded a net deferred tax liability of $50.1$59.5 million. For the three and nine months ended September 30, 2018,2019, we recorded a tax benefitbenefits of $3.8$2.4 million on a net tax loss of $15.2and $10.3 million, respectively, in the KlondexNevada U.S. group. Net operating losses acquired as of the acquisition date are subject to limitation under Internal Revenue Code Section 382. However, the annual limitation is not expected to have a material impact on our ability to utilize the losses.
For Legacy Hecla U.S., we recorded a full valuation allowance in the U.S. in December 2017 as a result of U.S. tax reform. Our circumstances at September 30, 20182019 continued to support a full valuation allowance in the U.S. for Legacy Hecla. In the first quarter of 2017, we received consent from the Internal Revenue Service to permit us to take a different income tax position relating to the timing of deductions for the #4 Shaft development costs at Lucky Friday. This tax accounting method change substantially revised the timing of deductions for these costs for regular tax and Alternative Minimum Tax ("AMT") relative to our projected life of mine and projected taxable income. These timing changes caused us to revise our assessment of the ability to generate sufficient future taxable income to realize our deferred tax assets, resulting in a valuation allowance release of approximately $15 million.Hecla U.S.
Note 5.4. Commitments, Contingencies and Obligations
General
We follow GAAP guidance in determining our accruals and disclosures with respect to loss contingencies, and evaluate such accruals and contingencies for each reporting period. Accordingly, estimated losses from loss contingencies are accrued by a charge to income when information available prior to issuance of the financial statements indicates that it is probable that a liability could be incurred and the amount of the loss can be reasonably estimated. Legal expenses associated with the contingency are expensed as incurred. If a loss contingency is not probable or reasonably estimable, disclosure of the loss contingency is made in the financial statements when it is at least reasonably possible that a material loss could be incurred.
Rio Grande Silver Guaranty
Our wholly-owned subsidiary, Rio Grande Silver Inc. (“Rio”), is party to a joint venture with Emerald Mining & Leasing, LLC (“EML”) and certain other parties with respect to a land package in the Creede Mining District of Colorado that is adjacent to other land held by Rio. Rio holds a 70% interest in the joint venture. In connection with the joint venture, we are required to guarantee certain environmental remediation-related obligations of EML to a third party up to a maximum liability to us of $2.5 million. As of September 30, 2018, we have not been required to make any payments pursuant to the guaranty. We may be required to make payments in the future, limited to the $2.5 million maximum liability, should EML fail to meet its obligations to the third party. However, to the extent that any payments are made by us under the guaranty, EML, in addition to other parties, has jointly and severally agreed to reimburse and indemnify us for any such payments. We have not recorded a liability relating to the guaranty as of September 30, 2018.
Lucky Friday Water Permit Matters
In December 2013, the EPA issued to Hecla Limited a request for information under Section 308 of the Clean Water Act directing Hecla Limited to undertake a comprehensive groundwater investigation of Lucky Friday’s tailings pond no.3 to evaluate whether the pond is causing the discharge of pollutants via seepage to groundwater that is discharging to surface water. We completed the investigation mandated by the EPA and submitted a draft report to the agency in December 2015. We are waiting for the EPA’s response and we cannot predict what further action, if any, the agency may take.
Hecla Limited strives to maintain its water discharges at the Lucky Friday unit in full compliance with its permits and applicable laws; however, we cannot provide assurance that in the future it will be able to fully comply with the permit limits and other regulatory requirements regarding water management.
Johnny M Mine Area near San Mateo, McKinley County and San Mateo Creek Basin, New Mexico
In May 2011, the EPA made a formal request to Hecla Mining Company for information regarding the Johnny M Mine Area near San Mateo, McKinley County, New Mexico, and asserted that Hecla Mining Company may be responsible under the Comprehensive Environmental Response, Compensation and Liability Act ("CERCLA") for environmental remediation and past costs the EPA has incurred at the site. Mining at the Johnny M Mine was conducted for a limited period of time by a predecessor of our subsidiary, Hecla Limited. In August 2012, Hecla Limited and the EPA entered into a Settlement Agreement and Administrative Order on Consent for Removal Action (“Consent Order”), pursuant to which Hecla Limited agreed to pay (i) $1.1 million to the EPA for its past response costs at the site and (ii) any future response costs at the site under the Consent Order, in exchange for a covenant not to sue by the EPA. Hecla Limited paid the $1.1 million to the EPA for its past response costs and in December 2014 submitted to EPA the Engineering Evaluation and Cost Analysis (“EE/CA”) for the site. The EE/CA evaluates three alternative response actions: 1) 1) no action, 2)2) off-site disposal, and 3)3) on-site disposal. The range in estimated costs of these alternatives is $0 to $221 million. In the EE/CA, Hecla Limited recommended that EPA approve on-site disposal, which is currently estimated to cost $5.6$5.9 million, on the basis that it is the most appropriate response action under CERCLA. In June 2015, October 2019, the EPA approved the EE/CA, with a few minor conditions. The EPA still needs to publishpublished the EE/CA for a 30-day public notice and comment period (which may be extended), and the agency will notis expected to make a final decision on the appropriate response action untilafter the public comment process is complete. It is anticipated that Hecla Limited will implement the response action selected by the EPA pursuant to an amendment to the Consent Order or a new order. Based on the foregoing, we believe it is probable that Hecla Limited will incur a liability for remediation at the site. In the fourth quarter of 2014, we accrued $5.6 million, which continuesand in October 2019 we increased that amount to be our best estimate of that liability as$5.9 million, with the increase representing estimated costs to begin implementation of the date of this report. There can be no assuranceremedy in 2020. It is possible that Hecla Limited’s liability will not be more than $5.6$5.9 million, or that its ultimateand any increase in liability will notcould have a material adverse effect on Hecla Limited’s or our results of operations or financial position.
The Johnny M Mine is in an area known as the San Mateo Creek Basin (“SMCB”), which is an approximately 321 square mile area in New Mexico that contains numerous legacy uranium mines and mills. In addition to Johnny M, Hecla Limited's predecessor was involved at other mining sites within the SMCB. The EPA is considering listing the entire SMCB on CERCLA’s National Priorities List (Superfund) in order to address perceived groundwater issues within the SMCB. The EE/CA discussed above relates primarily to contaminated rock and soil, not groundwater. In the event that the SMCB is listed as a Superfund site, or for other reasons, it is possible that Hecla Limited’s liability at the Johnny M Site, as well asand for any other sitesmine site within the SMCB at which Hecla Limited's predecessor companies of Hecla Limited may have been involved,operated, will be greater than our current accrual of $5.6$5.9 million due to the increased scope of required remediation.
In July 2018, the EPA informed Hecla Limited that it and several other potentially responsible parties ("PRPs") may be liable for cleanup of the site or for costs incurred by the EPA in cleaning up the site. The EPA stated it has incurred approximately $9.6 million in response costs to date. Hecla Limited cannot with reasonable certainty estimate the amount or range of liability, if any, relating to this matter because of, among other reasons, the lack of information concerning the site, including the relative contributions if any, of contamination by the various PRPs.
Carpenter Snow Creek and Barker-Hughesville Sites in Montana
In July 2010, the EPA made a formal request to Hecla Mining Company for information regarding the Carpenter Snow Creek Superfund site located in Cascade County, Montana. The Carpenter Snow Creek site is located in a historic mining district, and in the early 1980s Hecla Limited leased 6 mining claims and performed limited exploration activities at the site. Hecla Limited terminated the mining lease in 1988.
In June 2011, the EPA informed Hecla Limited that it believes Hecla Limited, amongand several other viable companies, PRPs, may be liable for cleanup of the site or for costs incurred by the EPA in cleaning up the site. The EPA stated in the letter that it has incurred approximately $4.5 million in response costs and estimated that total remediation costs may exceed $100 million. Hecla Limited cannot with reasonable certainty estimate the amount or range of liability, if any, relating to this matter because of, among other reasons, the lack of information concerning the site.site, including the relative contributions of contamination by various other PRPs.
In February 2017, the EPA made a formal request to Hecla Mining Company for information regarding the Barker-Hughesville Mining District Superfund site located in Judith Basin and Cascade Counties, Montana. Hecla Limited submitted a response in April 2017. The Barker-Hughesville site is located in a historic mining district, and between approximately June and December 1983, Hecla Limited was party to an agreement with another mining company under which limited exploration activities occurred at or near the site.
In August 2018, the EPA informed Hecla Limited that it and several other PRPs may be liable for cleanup of the site or for costs incurred by the EPA in cleaning up the site. The EPA did not include an amount of its alleged response costs to date. Hecla Limited cannot with reasonable certainty estimate the amount or range of liability, if any, relating to this matter because of, among other reasons, the lack of information concerning past or anticipated future costs at the site and the relative contributions if any, of contamination by the various other PRPs.
Claim for Indemnification Against CoCa Mines, Inc.
In 1991, Hecla Limited acquired CoCa Mines, Inc. (“CoCa”) and its subsidiary Creede Resources, Inc. (“CRI”). CoCa and CRI previously operated in the State of Colorado, but presently have limited assets and operations. Between 2014 and 2019, a PRP has alleged that CoCa and CRI are required by a 1989 agreement to indemnify it for certain environmental costs and liabilities it may incur with respect to the Nelson Tunnel/Commodore Waste Rock Pile Superfund site in Creede, Colorado. On October 30, 2019, the PRP filed a lawsuit in Mineral County, Colorado alleging, among other things, that CoCa and CRI are in breach of contract for failure to indemnify the PRP for its liability to the U.S. under CERCLA with respect to the site. In addition, the lawsuit names Hecla Limited as a defendant in its role as the shareholder of CoCa. The PRP seeks in excess of $5 million in damages, including attorneys’ fees and costs. The lawsuit will be vigorously defended and we believe strong defenses exist against all claims made therein and, as noted above, both CoCa and CRI have limited assets with which to satisfy any claim.
Montanore Project
We face several issues in attempting to advance the Montanore project. In October 2018, a court in Lincoln County, Montana found that the adit (which is an underground tunnel) which we intend to use to develop the Montanore project trespassed on certain unpatented mining claims we do not own, but through which the adit passes. In the case, which dates back to 2008, the jury delivered a verdict against certain of our subsidiaries for $3,325,000. The subsidiaries appealed the finding of trespass and the award of damages to the Montana Supreme Court, and we believe there are strong arguments for reversal. There can be no assurance that the appeal will succeed. On May 6, 2019, one of the subsidiaries received a letter from the Montana Department of Environmental Quality ("DEQ") questioning the validity of its operating permit at Montanore in light of the trespass finding. Our subsidiary responded by explaining that we do not believe the two issues are related. There has been no response to date from DEQ. On July 24, 2019, a Montana state court issued an order vacating Montanore's water discharge permit, which was renewed effective as of May 1, 2014, and remanded the matter back to DEQ. That order has been appealed to the Montana Supreme Court. As of September 30,2019, we have accrued $1.1 million for estimated future reclamation costs at the Montanore project, and have surety bonding in place for that amount.
Litigation Related to Klondex Acquisition
Following the announcement of our proposed acquisition of Klondex, Klondex and members of the Klondex board of directors were named as defendants in fiveseveral putative stockholder class actions brought by purported stockholders of Klondex challenging the proposed merger. The lawsuits were all filed in the United States District Court for the District of Nevada, but only Nevada. On December 18, 2018, the remaining three cases remain, and they are captioned: Gunderson v. Klondex Mines Ltd., et al., No. 3:18-cv-00256 (D. Nev. May 31, 2018); Nelson Baker v. Klondex Mines Ltd., et al., No. 3:18-cv-00288 (D. Nev. June 15, 2018); andwere consolidated into a single case, Lawson v. Klondex Mines Ltd., et al., No.3:18-cv-0028418-cv-00284 (D. Nev. June 15, 2018). The Gunderson complaint also named Hecla Mining Company and our subsidiary now known as Klondex Mines Unlimited Liability Company (“Merger Sub”) as defendants. The other two lawsuits were subsequently dismissed.
The plaintiffs generally claim that Klondex issued a proxy statement that included misstatements or omissions, in violation of sections 14(a)14(a) and 20(a)20(a) of the Securities Exchange Act of 1934, as amended. The Gunderson complaint also asserts a claim that the individual members of the Klondex board of directors breached their fiduciary duties of care, loyalty and good faith by authorizing the merger with Hecla for what the plaintiff asserts is inadequate consideration, an inadequate process, and with inadequate disclosures. The plaintiffs seek, among other things, to enjoin the merger, rescind the transaction or obtain rescissory damages if the merger is consummated, and recover attorneys’ fees and costs.
On September 21, 2018, Plaintiffs Baker and Lawson each filed motions to consolidate the remaining cases and be appointed lead plaintiff.
Although it is not possible to predict the outcome of litigation matters with certainty, each of Klondex and its directors Hecla and Merger Sub believe that each of the lawsuits are without merit, and the parties intend to vigorously defend against all claims asserted.
In addition, on On September 11, 2018, a lawsuit was filed in the Ontario (Canada) Superior Court of Justice by Waterton Nevada Splitter LLC against Hecla Mining Company, our subsidiary Klondex Mines Unlimited Liability Company and Havilah Mining Corporation, an entity that was formed to own the Canadian assets of Klondex that we did not acquire as part of the Klondex acquisition, in July 2018, and of which we own approximately 13%. The lawsuit alleges that Hecla and Havilah are in breach of contract in connection with the issuance to Waterton of warrants to purchase Hecla common stock and Havilah common shares to replace warrants to purchase Klondex common shares that Waterton owned prior to the July 2018 acquisition. The lawsuit claims Hecla and Havilah issued warrants to Waterton valued at $3.7 million but that Waterton was entitled to warrants valued at $8.9 million. We believe the lawsuit is without merit and will vigorously defend it.
On May 24, 2019, a purported Hecla stockholder filed a putative class action lawsuit in U.S. District Court for the Southern District of New York against Hecla and certain of our executive officers, one of whom is also a director. The complaint, purportedly brought on behalf of all purchasers of Hecla common stock from March 19, 2018 through and including May 8, 2019, asserts claims under Sections 10(b) and 20(a) of the Securities Exchange Act of 1934 and Rule 10b-5 promulgated thereunder and seeks, among other things, damages and costs and expenses. Specifically, the complaint alleges that Hecla, under the authority and control of the individual defendants, made certain material false and misleading statements and omitted certain material information regarding Hecla’s Nevada Operations unit. The complaint alleges that these misstatements and omissions artificially inflated the market price of Hecla common stock during the class period, thus purportedly harming investors. A second suit was filed on June 19, 2019, alleging virtually identical claims. We cannot predict the outcome of these lawsuits or estimate damages if plaintiffs were to prevail. We believe that these claims are without merit and intend to defend them vigorously.
Related to the above described class action lawsuits, Hecla has been named as a nominal defendant in a shareholder derivative lawsuit which names as defendants members of Hecla’s board of directors and certain officers. The case was filed on July 12, 2019 in the U.S. District Court for the District of Delaware. In general terms, the suit alleges (i) violations of Sections 10(b) and 14(a) of the Securities Exchange Act of 1934 and Rule 10b-5 promulgated thereunder and (ii) breaches of fiduciary duties by the individual defendants and seeks damages, purportedly on behalf of Hecla.
Debt
On As discussed in Note 9, on April 12, 2013, we completed an offering of $500 million aggregate principal amount of 6.875% Senior Notes due 2021 ("Senior Notes").Notes. The net proceeds from the offering of the Senior Notes were used to partially fund the acquisition of Aurizon Mines Ltd. ("Aurizon") and for general corporate purposes, including expenses related to the Aurizon acquisition. Through the acquisition of Aurizon, we acquired our Casa Berardi mine and other interests in Quebec, Canada. In 2014, we completed additional issuances of our Senior Notes in the aggregate principal amount of $6.5 million, which were contributed to one of our pension plans to satisfy the funding requirement for 2014. Interest on the Senior Notes is payable on May 1 and November 1 of each year, commencing November 1, 2013.
On March 5, 2018, we entered into a note purchase agreement pursuant to which we issued CAD$40$40 million Canadian dollars ("CAD") (approximately USD$30.8$30.8 million U.S. dollars ("USD") at the time of the transaction) in aggregate principal amount of our Series 2018-A2018-A Senior Notes due May 1, 2021 (the(the “Notes”) to Ressources Québec, a subsidiary of Investissment Québec, a financing arm of the Québec government. The Notes were issued at a discount of 0.58%, and bear interest at a rate of 4.68% per year, payable on May 1 and November 1 of each year, commencing May 1, 2018. The Notes are senior and unsecured and are pari passu in all material respects with the Senior Notes, including with respect to guarantees of the Notes by certain of our subsidiaries. The net proceeds from the Notes are required to be used for development and expansion of our Casa Berardi mine.
See Note 109 for more information.
Other Commitments
Our contractual obligations as of September 30, 20182019 included approximately $1.6$1.3 million for various costs. In addition, our open purchase orders at September 30, 20182019 included approximately $0.4$1.8 million, $2.0$1.4 million, $14.2$4.3 million and $5.3$0.5 million for various capital and non-capital items at the Lucky Friday, Casa Berardi, Greens Creek and Nevada Operations units, respectively. We also have total commitments of approximately $15.7$15.2 million relating to scheduled payments on capitalfinance leases, including interest, primarily for equipment at our Greens Creek, Lucky Friday, Casa Berardi and Nevada Operations units and total commitments of approximately $17.4 million on operating leases (see Note 109 for more information). As part of our ongoing business and operations, we are required to provide surety bonds, bank letters of credit, and restricted deposits for various purposes, including financial support for environmental reclamation obligations and workers compensation programs. As of September 30, 2018,2019, we had surety bonds totaling $181.6$191.8 million and letters of credit totaling $38.5 million in place as financial support for future reclamation and closure costs, self-insurance, and employee benefit plans. The obligations associated with these instruments are generally related to performance requirements that we address through ongoing operations. As the requirements are met, the beneficiary of the associated instruments cancels or returns the instrument to the issuing entity. Certain of these instruments are associated with operating sites with long-lived assets and will remain outstanding until closure of the sites. We believe we are in compliance with all applicable bonding requirements and will be able to satisfy future bonding requirements as they arise.
Other Contingencies
We also have certain other contingencies resulting from litigation, claims, EPA investigations, and other commitments and are subject to a variety of environmental and safety laws and regulations incident to the ordinary course of business. We currently have no basis to conclude that any or all of such contingencies will materially affect our financial position, results of operations or cash flows. However, in the future, there may be changes to these contingencies, or additional contingencies may occur, any of which might result in an accrual or a change in current accruals recorded by us, and there can be no assurance that their ultimate disposition will not have a material adverse effect on our financial position, results of operations or cash flows.
Note 6. (Loss) earnings5. Loss Per Common Share
We are authorized to issue 750,000,000 shares of common stock, $0.25 par value per share. At September 30, 2018,2019, there were 485,136,257496,538,038 shares of our common stock issued and 5,226,7916,287,271 shares issued and held in treasury, for a net of 479,909,466490,250,767 shares outstanding. Basic and diluted loss per common share, after preferred dividends, was $(0.04) and $(0.19) for the three- and nine-month periods ended September 30,2019, respectively. Basic and diluted loss per common share, after preferred dividends, was $(0.05) and $(0.01) for the three-three- and nine-monthnine-month periods ended September 30,2018, respectively. Basic and diluted income per common share, after preferred dividends, was $0.00 and $0.00 for the three- and nine-month periods ended September 30, 2017, respectively.
Diluted (loss) incomeloss per share for the three and nine months ended September 30, 20182019 and 20172018 excludes the potential effects of outstanding shares of our convertible preferred stock, as their conversion would have no effect on the calculation of dilutive shares.
For the three-monththree-month and nine-monthnine-month periods ended September 30,2019 and 2018, all restricted share units, deferred shares and warrants were excluded from the computation of diluted loss per share, as our reported loss for that periodthose periods would cause them to have no effect on the calculation of loss per share. For the three-month and nine-month periods ended September 30, 2017, the calculation of diluted income per share included dilutive (i) restricted stock units that were unvested or which vested in the respective period of 901,047 and 1,857,555, respectively, and (ii) deferred shares of 1,509,159 for each period. There were no warrants outstanding during the three-month and nine-month periods ended September 30, 2017.
Note 7.6. Business Segments and Sales of Products
We discover, acquire and develop mines and other mineral interests and produce and market concentrates, carbon material and doré containing silver, gold, lead and zinc. We are currently organized and managed in five reporting segments:5 segments, which represent our operating units: the Greens Creek unit, the Lucky Friday unit, the Casa Berardi unit, the San Sebastian unit and the Nevada Operations unit. The Nevada Operations unit was added as a result of our acquisition of Klondex in July 2018 (see(see Note 1413 for more information).
General corporate activities not associated with operating units and their various exploration activities, as well as discontinued operations and idle properties, are presented as “other.” Interest expense, interest income and income taxes are considered general corporate items, and are not allocated to our segments.
The following tables present information about our reportable segments for the three and nine months ended September 30, 20182019 and 20172018 (in thousands):
Three Months Ended | Nine Months Ended September 30, | |||||||||||||||
2018 | 2017 | 2018 | 2017 | |||||||||||||
Net sales to unaffiliated customers: | ||||||||||||||||
Greens Creek | $ | 65,187 | $ | 61,062 | $ | 205,642 | $ | 191,250 | ||||||||
Lucky Friday | (11 | ) | 199 | 8,253 | 20,022 | |||||||||||
Casa Berardi | 52,850 | 53,989 | 164,501 | 139,524 | ||||||||||||
San Sebastian | 14,129 | 25,589 | 40,727 | 66,866 | ||||||||||||
Nevada Operations | 11,494 | — | 11,494 | — | ||||||||||||
| $ | 143,649 | $ | 140,839 | $ | 430,617 | $ | 417,662 | |||||||||
Income (loss) from operations: | ||||||||||||||||
Greens Creek | $ | 10,705 | $ | 16,575 | $ | 59,373 | $ | 46,107 | ||||||||
Lucky Friday | (5,404 | ) | (4,642 | ) | (14,811 | ) | (8,974 | ) | ||||||||
Casa Berardi | (1,146 | ) | 2,208 | 3,118 | (4,692 | ) | ||||||||||
San Sebastian | (2,381 | ) | 17,017 | 2,275 | 42,363 | |||||||||||
Nevada Operations | (13,741 | ) | — | (13,741 | ) | — | ||||||||||
Other | (18,409 | ) | (10,890 | ) | (50,885 | ) | (37,637 | ) | ||||||||
| $ | (30,376 | ) | $ | 20,268 | $ | (14,671 | ) | $ | 37,167 | |||||||
Three Months Ended | Nine Months Ended September 30, | |||||||||||||||
2019 | 2018 | 2019 | 2018 | |||||||||||||
Net sales to unaffiliated customers: | ||||||||||||||||
Greens Creek | $ | 59,015 | $ | 65,187 | $ | 194,542 | $ | 205,642 | ||||||||
Lucky Friday | 4,017 | (11 | ) | 11,150 | 8,253 | |||||||||||
Casa Berardi | 53,453 | 52,850 | 139,015 | 164,501 | ||||||||||||
San Sebastian | 15,435 | 14,129 | 39,028 | 40,727 | ||||||||||||
Nevada Operations | 29,612 | 11,494 | 64,586 | 11,494 | ||||||||||||
| $ | 161,532 | $ | 143,649 | $ | 448,321 | $ | 430,617 | |||||||||
Income (loss) from operations: | ||||||||||||||||
Greens Creek | $ | 17,556 | $ | 10,705 | $ | 52,130 | $ | 59,373 | ||||||||
Lucky Friday | (3,727 | ) | (5,404 | ) | (8,779 | ) | (14,811 | ) | ||||||||
Casa Berardi | (380 | ) | (1,146 | ) | (26,262 | ) | 3,118 | |||||||||
San Sebastian | 1,077 | (2,381 | ) | (2,358 | ) | 2,275 | ||||||||||
Nevada Operations | (8,346 | ) | (13,741 | ) | (43,812 | ) | (13,741 | ) | ||||||||
Other | (11,293 | ) | (18,409 | ) | (35,633 | ) | (50,885 | ) | ||||||||
| $ | (5,113 | ) | $ | (30,376 | ) | $ | (64,714 | ) | $ | (14,671 | ) | |||||
The following table presents identifiable assets by reportable segment as of September 30, 20182019 and December 31, 20172018 (in thousands):
September 30, 2019 | December 31, 2018 | |||||||
Identifiable assets: | ||||||||
Greens Creek | $ | 648,420 | $ | 637,386 | ||||
Lucky Friday | 438,946 | 437,499 | ||||||
Casa Berardi | 717,631 | 754,248 | ||||||
San Sebastian | 50,549 | 44,152 | ||||||
Nevada Operations | 558,219 | 581,194 | ||||||
Other | 259,413 | 249,465 | ||||||
| $ | 2,673,178 | $ | 2,703,944 | |||||
September 30, 2018 | December 31, 2017 | |||||||
Identifiable assets: | ||||||||
Greens Creek | $ | 651,814 | $ | 671,960 | ||||
Lucky Friday | 429,334 | 432,400 | ||||||
Casa Berardi | 758,415 | 784,706 | ||||||
San Sebastian | 47,352 | 62,198 | ||||||
Nevada Operations | 539,410 | — | ||||||
Other | 283,933 | 393,894 | ||||||
| $ | 2,710,258 | $ | 2,345,158 | |||||
Our products consist of both metal concentrates and carbon material, which we sell to custom smelters, brokers and brokers,third-party processors, and unrefined bullion bars (doré), which may be sold as doré or further refined before sale to precious metals traders. Revenue is recognized upon the completion of the performance obligations and transfer of control of the product to the customer.
For sales of metals from refined doré, which we currently have at our Casa Berardi, San Sebastian and Nevada Operations units, the performance obligation is met, the transaction price is known, and revenue is recognized at the time of transfer of control of the agreed-upon metal quantities to the customer by the refiner, and the transaction price is known at that time.refiner. For sales of doré, the performance obligation is met, the transaction price is known, and revenue is recognized at the time of transfer of title and control of the doré containing the agreed-upon metal quantities to the customer. Refining, selling and shipping costs related to sales of doré and metals from doré are recorded to cost of sales as incurred.
For carbon sales, the performance obligation is met, the transaction price is known, and revenue is recognized generally at the time of arrival at the customer's facility.
For concentrate sales, which we currently have at our Greens Creek and Lucky Friday units, the performance obligation is met, the transaction price can be reasonably estimated, and revenue is recognized generally at the time of shipment. Concentrates sold at our Lucky Friday unit typically leave the mine and are received by the customer within the same day. However, there is a period of time between shipment of concentrates from our Greens Creek unit and their physical receipt by the customer, and judgment is required in determining when control has been transferred to the customer for those shipments. We have determined the performance obligation is met and title is transferred to the customer upon shipment of concentrate parcels from Greens Creek because, at that time, 1)1) legal title is transferred to the customer, 2)2) the customer has accepted the parcel and obtained the ability to realize all of the benefits from the product, 3)3) the concentrate content specifications are known, have been communicated to the customer, and the customer has the significant risks and rewards of ownership of it, 4)4) it is very unlikely a concentrate parcel from Greens Creek will be rejected by a customer upon physical receipt, and 5)5) we have the right to payment for the parcel.
Judgment is also required in identifying the performance obligations for our concentrate sales. Most of our concentrate sales involve “frame contracts” with smelters that can cover multiple years and specify certain terms under which individual parcels of concentrates are sold. However, some terms are not specified in the frame contracts and/or can be renegotiated as part of annual amendments to the frame contract. We have determined parcel shipments represent individual performance obligations satisfied at a point in time when control of the shipment is transferred to the customer.
The consideration we receive for our concentrate sales fluctuates due to changes in metals prices between the time of shipment and final settlement with the customer. However, we are able to reasonably estimate the transaction price for the concentrate sales at the time of shipment using forward prices for the month of settlement, and previously recorded sales and accounts receivable are adjusted to estimated settlement metals prices until final settlement with the customer. Also, it is unlikely a significant reversal of revenue for any one concentrate parcel will occur. As such, we use the expected value method to price the parcels until the final settlement date occurs, at which time the final transaction price is known. At September 30, 2018,2019, metals contained in concentrates and exposed to future price changes totaled 1.22.9 million ounces of silver, 5,7348,831 ounces of gold, 7,27710,737 tons of zinc, and 2,4476,344 tons of lead. However, as discussed in Note 1211, we seek to mitigate the risk of negative price adjustments by using financially-settled forward and put option contracts for some of our sales.
Sales and accounts receivable for concentrate shipments are recorded net of charges for treatment, refining, smelting losses, and other charges negotiated by us with the customers, which represent components of the transaction price. Charges are estimated by us upon shipment of concentrates based on contractual terms, and actual charges typically do not vary materially from our estimates. Costs charged by customers include fixed treatment and refining costs per ton of concentrate and may include price escalators which allow the customers to participate in the increase of lead and zinc prices above a negotiated baseline. Costs for shipping concentrates to customers are recorded to cost of sales as incurred.
Sales of metal concentrates and metal products are made principally to custom smelters, brokers,third-party processors and metals traders. The percentage of sales contributed by each segment is reflected in the following table:
Three Months Ended September 30, | Nine Months Ended September 30, | |||||||||||||||
2018 | 2017 | 2018 | 2017 | |||||||||||||
Greens Creek | 45 | % | 43 | % | 48 | % | 46 | % | ||||||||
Lucky Friday | — | % | — | % | 2 | % | 5 | % | ||||||||
Casa Berardi | 37 | % | 38 | % | 39 | % | 33 | % | ||||||||
San Sebastian | 10 | % | 19 | % | 9 | % | 16 | % | ||||||||
Nevada Operations | 8 | % | — | % | 2 | % | — | % | ||||||||
| 100 | % | 100 | % | 100 | % | 100 | % | |||||||||
Three Months Ended September 30, | Nine Months Ended September 30, | |||||||||||||||
2019 | 2018 | 2019 | 2018 | |||||||||||||
Greens Creek | 37 | % | 45 | % | 44 | % | 48 | % | ||||||||
Lucky Friday | 2 | % | — | % | 2 | % | 2 | % | ||||||||
Casa Berardi | 33 | % | 37 | % | 31 | % | 39 | % | ||||||||
San Sebastian | 10 | % | 10 | % | 9 | % | 9 | % | ||||||||
Nevada Operations | 18 | % | 8 | % | 14 | % | 2 | % | ||||||||
| 100 | % | 100 | % | 100 | % | 100 | % | |||||||||
Sales of products by metal for the three-three- and nine-monthnine-month periods ended September 30, 20182019 and 20172018 were as follows (in thousands):
Three Months Ended September 30, | Nine Months Ended September 30, | |||||||||||||||
2018 | 2017 | 2018 | 2017 | |||||||||||||
Silver | $ | 38,009 | $ | 43,228 | $ | 111,656 | $ | 140,662 | ||||||||
Gold | 82,628 | 73,603 | 233,308 | 203,279 | ||||||||||||
Lead | 7,552 | 6,373 | 27,469 | 28,093 | ||||||||||||
Zinc | 20,990 | 24,327 | 78,714 | 74,692 | ||||||||||||
Less: Smelter and refining charges | (5,530 | ) | (6,692 | ) | (20,530 | ) | (29,064 | ) | ||||||||
| Sales of products | $ | 143,649 | $ | 140,839 | $ | 430,617 | $ | 417,662 | ||||||||
Three Months Ended September 30, | Nine Months Ended September 30, | |||||||||||||||
2019 | 2018 | 2019 | 2018 | |||||||||||||
Silver | $ | 40,588 | $ | 38,009 | $ | 122,392 | $ | 111,656 | ||||||||
Gold | 103,889 | 82,628 | 261,734 | 233,308 | ||||||||||||
Lead | 7,114 | 7,552 | 22,809 | 27,469 | ||||||||||||
Zinc | 15,292 | 20,990 | 62,995 | 78,714 | ||||||||||||
Less: Smelter and refining charges | (5,351 | ) | (5,530 | ) | (21,609 | ) | (20,530 | ) | ||||||||
Sales of products | $ | 161,532 | $ | 143,649 | $ | 448,321 | $ | 430,617 | ||||||||
The following is sales information by geographic area based on the location of smelters and brokers (for concentrate shipments) and location of parent companies (for doré sales to metals traders) for the three-three- and nine-monthnine-month periods ended September 30, 20182019 and 20172018 (in thousands):
Three Months Ended September 30, | Nine Months Ended September 30, | |||||||||||||||
2019 | 2018 | 2019 | 2018 | |||||||||||||
Canada | $ | 88,610 | $ | 83,723 | $ | 258,708 | $ | 266,915 | ||||||||
Korea | 33,683 | 35,796 | 109,184 | 110,036 | ||||||||||||
Japan | 17,339 | 3,301 | 34,924 | 20,971 | ||||||||||||
Netherlands | 445 | — | 16,500 | — | ||||||||||||
China | — | — | — | 66 | ||||||||||||
United States | 20,407 | 15,807 | 29,142 | 24,296 | ||||||||||||
Total, excluding gains/losses on derivative contracts | $ | 160,484 | $ | 138,627 | $ | 448,458 | $ | 422,284 | ||||||||
Three Months Ended September 30, | Nine Months Ended September 30, | |||||||||||||||
2018 | 2017 | 2018 | 2017 | |||||||||||||
Canada | $ | 83,723 | $ | 79,834 | $ | 266,915 | $ | 263,268 | ||||||||
Korea | 35,796 | 27,396 | 110,036 | 75,339 | ||||||||||||
Japan | 3,301 | 14,419 | 20,971 | 38,513 | ||||||||||||
China | — | 16,695 | 66 | 32,047 | ||||||||||||
United States | 15,807 | 3,121 | 24,296 | 12,407 | ||||||||||||
Total, excluding gains/losses on forward contracts | $ | 138,627 | $ | 141,465 | $ | 422,284 | $ | 421,574 | ||||||||
Sales by significant product type for the three-three- and nine-monthnine-month periods ended September 30, 20182019 and 20172018 were as follows (in thousands):
Three Months Ended September 30, | Nine Months Ended September 30, | |||||||||||||||
2018 | 2017 | 2018 | 2017 | |||||||||||||
Doré and metals from doré | $ | 83,068 | $ | 82,764 | $ | 232,085 | $ | 219,276 | ||||||||
Lead concentrate | 36,728 | 31,548 | 113,211 | 124,553 | ||||||||||||
Zinc concentrate | 14,965 | 21,278 | 63,197 | 61,841 | ||||||||||||
Bulk concentrate | 3,866 | 5,875 | 13,791 | 15,904 | ||||||||||||
Total, excluding gains/losses on forward contracts | $ | 138,627 | $ | 141,465 | $ | 422,284 | $ | 421,574 | ||||||||
Three Months Ended September 30, | Nine Months Ended September 30, | |||||||||||||||
2019 | 2018 | 2019 | 2018 | |||||||||||||
Doré and metals from doré | $ | 87,525 | $ | 80,074 | $ | 231,391 | $ | 227,812 | ||||||||
Carbon | 17,745 | 2,994 | 27,376 | 4,273 | ||||||||||||
Lead concentrate | 37,685 | 36,728 | 122,727 | 113,211 | ||||||||||||
Zinc concentrate | 12,345 | 14,965 | 51,876 | 63,197 | ||||||||||||
Bulk concentrate | 5,184 | 3,866 | 15,088 | 13,791 | ||||||||||||
Total, excluding gains/losses on derivative contracts | $ | 160,484 | $ | 138,627 | $ | 448,458 | $ | 422,284 | ||||||||
Sales of products for the three-three- and nine-monthnine-month periods ended September 30,2019 included a net gain of $1.1 million and a net loss of $0.1 million, respectively, on financially-settled forward and put option contracts for silver, gold, lead and zinc contained in our sales. Sales of products for the three- and nine-month periods ended September 30,2018 included net gains of $5.0 million and $8.3 million, respectively, on financially-settled forward contracts for silver, gold, lead and zinc contained in our concentrate sales. Sales of products for the three- and nine-month periods ended September 30, 2017 included net losses of $0.6 million and $3.9 million, respectively, on the forward contracts. See Note 1211 for more information.
Sales of products to significant customers as a percentage of total sales were as follows for the three-three- and nine-monthnine-month periods ended September 30, 20182019 and 2017:2018:
Three Months Ended September 30, | Nine Months Ended September 30, | |||||||||||||||
2018 | 2017 | 2018 | 2017 | |||||||||||||
CIBC | 26 | % | 23 | % | 34 | % | 24 | % | ||||||||
Scotia | 19 | % | 33 | % | 13 | % | 26 | % | ||||||||
Korea Zinc | 15 | % | 25 | % | 22 | % | 20 | % | ||||||||
Teck Metals Ltd. | 11 | % | — | % | 11 | % | 10 | % | ||||||||
Trafigura | 10 | % | — | % | 3 | % | 4 | % | ||||||||
Louis Dreyfus | — | % | 12 | % | — | % | 4 | % | ||||||||
Three Months Ended September 30, | Nine Months Ended September 30, | |||||||||||||||
2019 | 2018 | 2019 | 2018 | |||||||||||||
CIBC | 36 | % | 26 | % | 24 | % | 34 | % | ||||||||
Scotia | 18 | % | 19 | % | 26 | % | 13 | % | ||||||||
Korea Zinc | 9 | % | 15 | % | 16 | % | 22 | % | ||||||||
Teck Metals Ltd. | 3 | % | 11 | % | 7 | % | 11 | % | ||||||||
Cliveden | 12 | % | — | % | 4 | % | — | % | ||||||||
Trafigura | — | % | 10 | % | 4 | % | 3 | % | ||||||||
Our trade accounts receivable balance related to contracts with customers was $12.9$6.2 million at September 30, 20182019 and 2017 and $14.8$4.2 million at December 31, 2017,2018, and included no0 allowance for doubtful accounts.
We have determined our contracts do not include a significant financing component. For doré sales and sales of metal from doré, payment is received at the time the performance obligation is satisfied. Payment for carbon sales is received within a relatively short period of time after the performance obligation is satisfied. The amount of consideration for concentrate sales is variable, and we receive payment for a significant portion of the estimated value of concentrate parcels within a relatively short period of time after the performance obligation is satisfied.
We do not incur significant costs to obtain contracts, nor costs toor fulfill contracts which are not addressed by other accounting standards. Therefore, we have not recognized an asset for such costs as of September 30, 20182019 or December 31, 2017.2018.
In September 2019, we received $20.1 million in proceeds for two parcels of concentrate at our Greens Creek unit which were not shipped and recognized as revenue until October 2019. We sold the concentrate in September, but arrival of the ship at the loading facility at Greens Creek was delayed due to weather, which resulted in the loaded ship leaving Greens Creek shortly after September 30. As of September 30,2019, a current deferred revenue liability was recognized for the $20.1 million in proceeds, and the related cost of sales and other direct production costs of $9.2 million and depreciation, depletion and amortization of $2.6 million were included in inventory.
The sales and income (loss) from operations amounts reported above include results from our Lucky Friday segment. The Lucky Friday mine is our only operation where some of our employees are subject to a collective bargaining agreement, and the most recent agreement expired on April 30, 2016. On February 19, 2017, the unionized employees voted against our contractthe Company's offer, and on March 13, 2017 went on strike and have been on strike since that time. Production at Lucky Friday was suspended from the start of the strike until July 2017, when limited production resumed. For the firstnine months of 20182019 and 2017,2018, suspension costs not related to production of $13.5$5.7 million and $11.5$13.5 million, respectively, along with $3.7$3.1 million and $2.9$3.7 million, respectively, in non-cash depreciation expense, are reported in a separate line item on our consolidated statements of operations. In September 2019, a tentative agreement was reached between the Company and the union negotiating committee. Before the collective bargaining agreement is finalized, it must be ratified by a majority of the union members. If the agreement is voted on and ratified, we would expect the mine to be staffed in stages, and that this would put Lucky Friday on a path back to full production. We believe it would take approximately one year to return to full production after re-staffing starts. We cannot predict whether or when the current tentative agreement will be ratified or if an agreement will otherwise be reached, or, if an agreement is not ratified, how long the strike will last or whether an agreementwhen there will be reached.a return to full production. As a result of the strike or other related events, operations at Lucky Friday could continue to be disrupted, which could adversely affect our financial condition and results of operations. If the strike continues for a further extended period or it is determined an eventual resolution is unlikely, it may be appropriate in the future to review the carrying value of properties, plants, equipment and mineral interests at Lucky Friday. Under such review, if estimated undiscounted cash flows from Lucky Friday were less than its carrying value, an impairment loss would be recognized for the difference between the carrying value and the estimated fair value. The carrying value of properties, plants, equipment and mineral interests at Lucky Friday as of September 30, 20182019 was approximately $428.8$437.0 million. However, Lucky Friday has significant identified reserves and mineralized material and a current estimated mine life of approximately 2217 years.
On April 30, 2018, we settled with the National Labor Relations Board ("NLRB") an unfair labor practice claim made by the union. As part of the settlement, Hecla Limited rescinded its last, best and final contract offer implemented in March 2017. We do not believe the settlement with the NLRB will resolve any of the key differences in the ongoing labor dispute. On May 4, 2018, we gave notice to the union that the parties to the labor dispute are at impasse, and implemented portions of our revised final offer presented in December 2017.
Note 8.7. Employee Benefit Plans
We sponsor defined benefit pension plans covering substantially all U.S. employees. Net periodic pension cost for the plans consisted of the following for the three and nine months ended September 30, 20182019 and 20172018 (in thousands):
Three Months Ended September 30, | Three Months Ended September 30, | |||||||||||||||
2018 | 2017 | 2019 | 2018 | |||||||||||||
Service cost | $ | 1,252 | $ | 1,196 | $ | 1,100 | $ | 1,252 | ||||||||
Interest cost | 1,377 | 1,339 | 1,620 | 1,377 | ||||||||||||
Expected return on plan assets | (1,634 | ) | (1,462 | ) | (1,496 | ) | (1,634 | ) | ||||||||
Amortization of prior service cost | 15 | (84 | ) | 15 | 15 | |||||||||||
Amortization of net loss | 931 | 1,033 | 1,097 | 931 | ||||||||||||
Net periodic pension cost | $ | 1,941 | $ | 2,022 | $ | 2,336 | $ | 1,941 | ||||||||
Nine Months Ended September 30, | Nine Months Ended September 30, | |||||||||||||||
2018 | 2017 | 2019 | 2018 | |||||||||||||
Service cost | $ | 3,756 | $ | 3,588 | $ | 3,300 | $ | 3,756 | ||||||||
Interest cost | 4,131 | 4,017 | 4,860 | 4,131 | ||||||||||||
Expected return on plan assets | (4,902 | ) | (4,386 | ) | (4,488 | ) | (4,902 | ) | ||||||||
Amortization of prior service cost | 45 | (252 | ) | 45 | 45 | |||||||||||
Amortization of net loss | 2,793 | 3,099 | 3,291 | 2,793 | ||||||||||||
Net periodic pension cost | $ | 5,823 | $ | 6,066 | $ | 7,008 | $ | 5,823 | ||||||||
For the three-three- and nine-monthnine-month periods ended September 30,2019 and 2018, the service cost component of net periodic pension cost is included in the same line items of our condensed consolidated financial statements as other employee compensation costs, and thecosts. The net expense of $0.7 million and $2.1 million, respectively, related to all other components of net periodic pension cost of $1.2 million and $3.7 million, respectively, for the three- and nine-month periods ended September 30,2019, and $0.7 million and $2.1 million, respectively, for the three- and nine-month periods ended September 30,2018, is included in other (expense) income on our condensed consolidated statements of operations and comprehensive income (loss). For the three- and nine-month periods ended September 30, 2017, all components of net periodic pension cost are included in the same line items of our condensed consolidated financial statements as other employee compensation costs.loss.
In April 2018 and July 2018, May 2019, we made cash contributions of $1.3contributed $3.6 million and $1.2 million, respectively,in common stock to our defined benefit plans. In September 2018 we contributed $5.5 million in shares of our common stock. We are plans, and do not required expect to make additional contributions to our defined benefitthe plans in 2018.2019. We expect to contribute approximately $0.5 illion$0.6 million to our unfunded supplemental executive retirement plan during 2018.2019.
Note 9.8. Shareholders’ Equity
Stock-based Compensation Plans
We periodically grant restricted stock unit awards, performance-based share awardsshares and shares of common stock to our employees and directors. We measure compensation cost for restricted stock units and stock grants at the closing price of our stock at the time of grant. We measure compensation cost for performance-based grants using a Monte Carlo simulation to estimate their value at grant date. Restricted stock unit and performance-based share grants vest after a specified period with compensation cost amortized over that period. Although we have no current plans to issue stock options, we may do so in the future.
In March 2018, April 2019, the Board of Directors granted 1,237,3693,597,380 shares of common stock to employees for payment of long-term incentive compensation for the period ended December 31, 2017. 2018. The shares were distributed in March 2018, April 2019, and $4.9$8.3 million in expense related to the stock awards was recognized in the periods prior to March 31, 2018.2019.
In June and August 2018, 2019, the Board of Directors granted the following restricted stock unit awards to employees resultingwhich will result in a total expense of $7.0$5.9 million:
• |
|
• |
|
• |
|
An expenseExpense of $2.5$2.1 million related to the unit awards discussed above vesting in 20192020 will be recognized on a straight-line basis over the twelve months following the date of the award. An expenseExpense of $2.4$2.0 million related to the unit awards discussed above vesting in 20202021 will be recognized on a straight-line basis over the twenty-four months following the date of the award. An expenseExpense of $2.2$1.8 million related to the unit awards discussed above vesting in 20212022 will be recognized on a straight-line basis over the thirty-six-monththirty-six-month period following the date of the award.
In June 2018, 2019, the Board of Directors granted performance-based share awards to certain executive employees. The value of the awards will be based on the ranking of the market performance of our common stock relative to the performance of the common stock of a group of peer companies over the three-yearthree-year measurement period ending December 31, 2020. 2021. The number of shares to be issued will be based on the value of the awards divided by the share price at grant date. The expense related to the performance-based awards will be recognized on a straight-line base over the thirty months following the date of the award.
Stock-based compensation expense for restricted stock unit and performance-based grants to employees and shares issued to nonemployee directors recorded in the firstnine months of 20182019 totaled $4.7$4.8 million, compared to $4.9$4.7 million in the same period last year.
In connection with the vesting of restricted stock units and other stock grants, employees have in the past, at their election and when permitted by us, chosen to satisfy their minimum tax withholding obligations through net share settlement, pursuant to which the Company withholds the number of shares necessary to satisfy such withholding obligations and pays the obligations in cash. As a result, in the firstnine months of 2019 we withheld 1,060,480 shares valued at approximately $2.2 million, or approximately $2.11 per share. In the firstnine months of 2018 we withheld 697,341 shares valued at approximately $2.7 million, or approximately $3.86 per share. In the first nine months of 2017 we withheld 588,240 shares valued at approximately $3.0 million, or approximately $5.09 per share.
Common Stock Dividends
In September 2011 and February 2012, our Board of Directors adopted a common stock dividend policy that has two components: (1)(1) a dividend that links the amount of dividends on our common stock to our average quarterly realized silver price in the preceding quarter, and (2)(2) a minimum annual dividend of $0.01 per share of common stock, in each case, payable quarterly, if and when declared. For illustrative purposes only, the table below summarizes potential per share dividend amounts at different quarterly average realized price levels according to the first component of the policy:
Quarterly average realized silver price per ounce | Quarterly dividend per share | Annualized dividend per share | |||||
| $30 | $0.01 | $0.04 | |||||
| $35 | $0.02 | $0.08 | |||||
| $40 | $0.03 | $0.12 | |||||
| $45 | $0.04 | $0.16 | |||||
| $50 | $0.05 | $0.20 |
Quarterly average realized silver price per ounce | Quarterly dividend per share | Annualized dividend per share | ||
$30 | $0.01 | $0.04 | ||
$35 | $0.02 | $0.08 | ||
$40 | $0.03 | $0.12 | ||
$45 | $0.04 | $0.16 | ||
$50 | $0.05 | $0.20 |
On November 6, 2018, August 5, 2019, our Board of Directors declared a common stock dividend, pursuant to the minimum annual dividend component of the policy described above, of $0.0025 per share, for a total dividend of approximately $1.2 million payablepaid in December 2018. September 2019. Because the average realized silver price for the thirdsecond quarter of 20182019 was $14.68$15.01 per ounce, below the minimum threshold of $30 according to the policy, no silver-price-linked component was declared or paid. The declaration and payment of common stock dividends is at the sole discretion of our Board of Directors.
At-The-Market Equity Distribution Agreement
Pursuant to an equity distribution agreement dated February 23, 2016, we may issue and sell shares of our common stock from time to time through ordinary broker transactions having an aggregate offering price of up to $75 million, with the net proceeds available for general corporate purposes. The terms of sales transactions under the agreement, including trading day(s), number of shares sold in the aggregate, number of shares sold per trading day, and the floor selling price per share, are proposed by us to the sales agent. Whether or not we engage in sales from time to time may depend on a variety of factors, including share price, our cash resources, customary black-out restrictions, and whether we have any material inside information. The agreement can be terminated by us at any time. The shares issued under the equity distribution agreement are registered under the Securities Act of 1933, as amended, pursuant to oura shelf registration statement on Form S-3, which was filed with the SEC on February 23, 2016.S-3. As of September 30, 2018,2019, we had sold 5,634,7587,173,614 shares under the agreement for total proceeds of approximately $20.8$24.5 million, net of commissions of approximately $0.5$0.6 million. WeNaN shares were sold 1,025,911 shares under the agreement during the third quarterfirstnine months of 2018 for total proceeds of $3.1 million, net of commissions of approximately $0.1 million.2019.
Common Stock Repurchase Program
On May 8, 2012, we announced that our Board of Directors approved a stock repurchase program. Under the program, we are authorized to repurchase up to 20 million shares of our outstanding common stock from time to time in open market or privately negotiated transactions, depending on prevailing market conditions and other factors. The repurchase program may be modified, suspended or discontinued by us at any time. Whether or not we engage in repurchases from time to time may depend on a variety of factors, including not only price and cash resources, but customary black-out restrictions, whether we have any material inside information, limitations on share repurchases or cash usage that may be imposed by our credit agreement or in connection with issuances of securities, alternative uses for cash, applicable law, and other investment opportunities from time to time. As of September 30, 2018,2019, 934,100 shares havehad been purchased at an average price of $3.99 per share, leaving approximately 19.1 million shares that may yet be purchased under the program. The closing price of our common stock at November 6, 2018,5,2019, was $2.49$2.30 per share. NaN shares were purchased under the program during the firstnine months of 2019.
Warrants
As discussed in Note 1413, we issued 4,136,000 warrants to purchase one1 share of our common stock to holders of warrants to purchase Klondex common stock under the terms of the Klondex acquisition, and all of the warrants were outstanding as of September 30, 2018.2019. Warrants to purchase 2,068,000 shares of the warrantscommon stock have an exercise price of $8.02 and expire in April 2032. Warrants to purchase 2,068,000 shares of the warrantscommon stock have an exercise price of $1.57 and expire in February 2029.
Note 10.9. Debt, Credit Facility and Capital Leases
Senior Notes
On April 12, 2013, we completed an offering of $500 million in aggregate principal amount of our Senior Notes due May 1, 2021 in a private placement conducted pursuant to Rule 144A and Regulation S under the Securities Act of 1933, as amended, and in 2014, an additional $6.5 million aggregate principal amount of the Senior Notes werewas issued to one of our pension plans. The Senior Notes were subsequently exchanged for substantially identical Senior Notes registered with the SEC. The Senior Notes are governed by the Indenture, dated as of April 12, 2013, as amended (the "Indenture"), among Hecla Mining Company ("Hecla") and certain of our subsidiaries and The Bank of New York Mellon Trust Company, N.A., as trustee. The net proceeds from the initial offering of the Senior Notes ($490 million) were used to partially fund the acquisition of Aurizon and for general corporate purposes, including expenses related to the Aurizon acquisition.
The Senior Notes are recorded net of a 2% initial purchaser discount totaling $10 million at the time of the April 2013 issuance and having an unamortized balance of $3.3$2.1 million as of September 30, 2018.2019. The Senior Notes bear interest at a rate of 6.875% per year from the date of original issuance or from the most recent payment date on which interest has been paid or provided for. Interest on the Senior Notes is payable on May 1 and November 1 of each year, commencing November 1, 2013. During each of the nine months-month periods ended September 30, 20182019 and 2017,2018, interest expense related to the Senior Notes and amortization of the initial purchaser discount and fees related to the issuance of the Senior Notes totaled $27.2 million and $26.3 million, respectively. The interest expense related to the Senior Notes for the nine months ended September 30, 2017 was net of $0.9 million in capitalized interest, primarily related to the #4 Shaft project at our Lucky Friday unit which was completed in January 2017. Interest expense for the nine months ended September 30, 2017 also included $1.1 million in costs related to our private offering of new Senior Notes in June 2017 and concurrent tender offer to purchase our existing Senior Notes, which were not completed.million.
The Senior Notes are guaranteed on a senior unsecured basis by certain of our subsidiaries (the "Guarantors"). The Senior Notes and the guarantees are, respectively, Hecla's and the Guarantors' general senior unsecured obligations and are subordinated to all of Hecla's and the Guarantors' existing and future secured debt to the extent of the assets securing that secured debt. In addition, the Senior Notes are effectively subordinated to all of the liabilities of Hecla's subsidiaries that are not guaranteeing the Senior Notes, to the extent of the assets of those subsidiaries.
The Senior Notes became redeemable in whole or in part, at any time and from time to time after May 1, 2016, on the redemption dates and at the redemption prices specified in the Indenture, plus accrued and unpaid interest, if any, to the date of redemption. As of May 1, 2019, the redemption price is 100% of the outstanding principal amount.
Upon the occurrence of a change of control (as defined in the Indenture), each holder of Senior Notes will have the right to require us to purchase all or a portion of such holder's Senior Notes pursuant to a change of control offer (as defined in the Indenture), at a purchase price equal to 101% of the principal amount thereof plus accrued and unpaid interest, if any, to the date of purchase, subject to the rights of holders of the Senior Notes on the relevant record date to receive interest due on the relevant interest payment date.
Ressources Québec Notes
On March 5, 2018, we entered into a note purchase agreement pursuant to which we issued CAD$40 million (approximately USD$30.8 million at the time of the transaction) in aggregate principal amount of our Series 2018-A2018-A Senior Notes due May 1, 2021 (the(the “RQ Notes”) to Ressources Québec, a subsidiary of Investissment Québec, a financing arm of the Québec government. Because the RQ Notes are denominated in CAD, the reported USD-equivalent principal balance changes with movements in the exchange rate. The RQ Notes were issued at a discount of 0.58%, or CAD$0.2 million, and bear interest at a rate of 4.68% per year, payable on May 1 and November 1 of each year, commencing May 1, 2018. The RQ Notes are senior and unsecured and are pari passu in all material respects with the Senior Notes, including with respect to guarantees of the RQ Notes by certain of our subsidiaries. The net proceeds from the RQ Notes arewere required to be used for development and expansion of our Casa Berardi mine. During the nine months ended September 30,2019 and 2018, interest expense related to the RQ Notes, including discount and origination fees, totaled $1.1 million.million for each period.
Credit FacilitiesFacility
In July 2018, we entered into a $200$250 million senior secured revolving credit facility which replaced our previous $100 million credit facility. The facility and has a term ending on June 14, 2022, provided, however, that if we do not refinance our outstanding Senior Notes due May 1, 2021 by on or before November 1, 2020, the term offacility will terminate on November 1, 2020. In July 2019, we entered into an amendment to the credit facility ends on November 1, 2020. The creditto, among other things, change the leverage ratio covenant terms and temporarily reduce the amount available to be borrowed under the facility increasedfrom $250 million to $250$150 million until the earlier of (i) our election to restore the amount available to $250 million following the fiscal quarter ending September 30, 2020 or (ii) our election to restore the amount available to $250 million by demonstrating two consecutive quarters of leverage ratio less than or equal to 4.00:1 beginning in November 2018 upon satisfactionthe third quarter of certain conditions, including adding certain subsidiaries2019. As of Klondex as borrowersSeptember 30, 2019, the maximum leverage ratio in effect under the credit facility was 6.50:1,and pledgingdrops to 6.00:1 for the assetsfourth quarter of those subsidiaries as additional collateral under the credit facility. 2019.
The credit facility is collateralized by the assets of or shares of common stock held in our material domestic subsidiaries, including those owning the Casa Berardi mine and our Nevada operations, and by our joint venture interests inholding 100% ownership of the Greens Creek mine, all of our rights and interests in the joint venture agreement, and all of our rights and interests in the assets of the joint venture. Below is information on the interest rates, standby fee, and financial covenant terms under our credit facility in place as of September 30, 2018:2019:
Interest rates: | ||||||||||
Spread over the London Interbank Offered Rate | 2.25 | - | 3.25% | |||||||
Spread over the London Interbank Offer Rate | 2.25 | - | 4.00% | |||||||
Spread over alternative base rate | 1.25 | - | 2.25% | 1.25 | - | 2.25% | ||||
Standby fee per annum on undrawn amounts | 0.50% | 0.50 | - | 1.00% | ||||||
Covenant financial ratios: | ||||||||||
Senior leverage ratio (debt secured by liens/EBITDA) | not more than 2.50:1 | |||||||||
Leverage ratio (total debt less unencumbered cash/EBITDA) (1) | not more than 4.50:1 | |||||||||
Senior leverage ratio (debt secured by liens/EBITDA) (1) | not more than 2.50:1 | |||||||||
Leverage ratio (total debt less unencumbered cash/EBITDA) (2) | not more than 6.50:1 | |||||||||
Interest coverage ratio (EBITDA/interest expense) | not less than 3.00:1 | not less than 3.00:1 | ||||||||
(1)(1) EBITDA is calculated as defined in the credit agreement.
(2) The leverage ratio will change to 4.00:not more than: (i) 6.00:1 as of October 1, effective 2019; (ii) 5.50:1 as of January 1, 2020.
We are also able to obtain letters of credit under the facility, and for any such letters we are required to pay a participation fee of between 2.25% and 3.25% of the amount of the letters of credit based on our total leverage ratio, as well as a fronting fee to each issuing bank of 0.20% annually on the average daily dollar amount of any outstanding letters of credit. There were $3.0$38.5 million in letters of credit outstanding as of September 30, 2018.2019.
We believe we were in compliance with all covenants under the credit agreement, and no amounts were outstanding as of September 30, 2018. We drew $47.0had $50.0 million ondrawn under the facilityagreement, in July 2018 which we repaid in September 2018. Withaddition to the exception of the $3.0$38.5 million in letters of credit outstanding, we did not have a balance drawn on the revolving credit facility as of September 30, 2018.2019.
Debt Summary
As a result of September 30,2019,the acquisition of Klondex in July 2018 (see Note 14 for more information), we assumed Klondex's revolving credit facility balance outstanding of $35.0 million. We paid the $35.0 million balance, and the Klondex credit facility was terminated, in July 2018.annual future obligations related to our debt, including interest, were (in thousands):
Twelve-month period ending September 30, | Senior Notes | RQ Notes | Revolving Credit Facility | Total | ||||||||||||
2020 (interest and fees only) | $ | 34,822 | $ | 1,414 | $ | 219 | $ | 36,455 | ||||||||
2021 (principal and interest) | 526,813 | 31,028 | — | 557,841 | ||||||||||||
2022 (principal) | — | 50,000 | 50,000 | |||||||||||||
Total | 561,635 | 32,442 | 50,219 | 644,296 | ||||||||||||
Less: interest and fees | (55,135 | ) | (2,238 | ) | (219 | ) | (57,592 | ) | ||||||||
Principal | 506,500 | 30,204 | 50,000 | 586,704 | ||||||||||||
Less: unamortized discount | (2,086 | ) | — | — | (2,086 | ) | ||||||||||
Long-term debt | $ | 504,414 | $ | 30,204 | $ | 50,000 | $ | 584,618 | ||||||||
CapitalFinance Leases
We have entered into various lease agreements, primarily for equipment at our Greens Creek, Lucky Friday, Casa Berardi and Nevada Operations units, which we have determined to be capitalfinance leases. At September 30, 2018,2019, the total liability balance associated with capitalfinance leases, including certain purchase option amounts, was $14.7$14.3 million, with $6.1$5.7 million of the liability classified as current and the remaining $8.6 million classified as non-current. At December 31, 2017,2018, the total liability balance associated with capitalfinance leases was $11.8$13.1 million, with $5.6$5.3 million of the liability classified as current and $6.2$7.9 million classified as non-current. The right-of-use assets for our finance leases are recorded in properties, plants, equipment and mineral interests, net, on our condensed consolidated balance sheets and totaled $21.4 million as of September 30,2019 and $20.0 million as of December 31,2018, net of accumulated depreciation. Expense during the firstnine months of 2019 related to finance leases included $5.1 million for amortization of the right-of-use assets and $0.6 million for interest expense. The total obligation for future minimum lease payments was $15.7$15.2 million at September 30, 2018,2019, with $1.0 million attributed to interest. The weighted-average remaining lease term for our finance leases as of September 30,2019 was approximately 1.9 years.
At September 30, 2018,2019, the annual maturities of capitalfinance lease commitments, including interest, arewere (in thousands):
Twelve-month period ending September 30, | ||||||||
2019 | $ | 6,182 | ||||||
2020 | 4,727 | $ | 6,283 | |||||
2021 | 3,543 | 5,125 | ||||||
2022 | 1,214 | 2,818 | ||||||
2023 | 9 | 1,017 | ||||||
Total | 15,675 | 15,243 | ||||||
Less: imputed interest | (1,019 | ) | (968 | ) | ||||
Net capital lease obligation | $ | 14,656 | ||||||
Net finance lease obligation | $ | 14,275 | ||||||
Operating Leases
We have entered into various lease agreements, primarily for equipment, buildings and other facilities, and land at our operating units and corporate offices, which we have determined to be operating leases. Some of the operating leases allow for extension of the lease beyond the current term at our option. We have considered the likelihood and estimated duration of the extension options in determining the lease term for measurement of the liability and right-of-use asset. For our operating leases as of September 30,2019, we have assumed discount rates of between 5% and 6.5%. At September 30,2019, the total liability balance associated with the operating leases was $17.3 million, with $5.9 million of the liability classified as current and the remaining $11.5 million classified as non-current. The right-of-use assets for our operating leases are recorded as a non-current asset on our condensed consolidated balance sheets and totaled $17.3 million as of September 30,2019. Lease expense on operating leases during the firstnine months of 2019 totaled $5.7 million. The total obligation for future minimum operating lease payments, including assumed extensions beyond the current lease terms, was $17.4 million at September 30,2019. The weighted-average remaining lease term for our operating leases as of September 30,2019 was approximately 4.7 years.
At September 30,2019, the annual maturities of undiscounted operating lease payments, including assumed extensions beyond the current lease terms, were (in thousands):
Twelve-month period ending September 30, | ||||
2020 | $ | 6,570 | ||
2021 | 3,629 | |||
2022 | 2,808 | |||
2023 | 2,250 | |||
2024 | 862 | |||
More than 5 years | 1,274 | |||
Total | 17,393 | |||
Effect of discounting | (63 | ) | ||
Operating lease liability | $ | 17,330 |
Note 11.10. Developments in Accounting Pronouncements
Accounting Standards Updates Adopted
In May 2014, the Financial Accounting Standards Board ("FASB") issued Accounting Standards Update ("ASU") No. 2014-09 Revenue Recognition, replacing guidance currently codified in Subtopic 605-10 Revenue Recognition-Overall. The new ASU establishes a new five step principles-based framework in an effort to significantly enhance comparability of revenue recognition practices across entities, industries, jurisdictions, and capital markets. In August 2015, February 2016, the FASB issued ASU No. 2015-14 Revenue from Contracts with Customers (Topic 606): Deferral of the Effective Date. ASU No. 2015-14 deferred the effective date of ASU No. 2014-09 until annual and interim reporting periods beginning after December 15, 2017. We adopted ASU No. 2014-09 as of January 1, 2018 using the modified-retrospective transition approach. The impact of adoption of the update to our consolidated financial statements for the nine months ended September 30, 2017 would have been a reclassification of $1.2 million in doré refining costs from sales of products to cost of sales and other direct production costs.
We performed an assessment of the impact of implementation of ASU No. 2014-09, and concluded it does not change the timing of revenue recognition or amounts of revenue recognized compared to how we recognize revenue under our current policies. Our revenues involve a relatively limited number of types of contracts and customers. In addition, our revenue contracts do not involve multiple types of performance obligations. Revenues from doré are recognized, and the transaction price is known, at the time the metals sold are delivered to the customer. Concentrate revenues are generally recognized at the time of shipment. Concentrates sold at our Lucky Friday unit typically leave the mine and are received by the customer within the same day. There is a period of time between shipment of concentrates from our Greens Creek unit and their physical receipt by the customer. However, based on our assessment, we believe control of the concentrate parcels is generally obtained by the customer at the time of shipment.
Our concentrate sales involve variable consideration, as they are subject to changes in metals prices between the time of shipment and their final settlement. However, we are able to reasonably estimate the transaction price for the concentrate sales at the time of shipment using forward prices for the month of settlement, and we then adjust the values each period until final settlement. Also, it is unlikely a significant reversal of revenue for any one concentrate parcel will occur.
Adoption of ASU No. 2014-09 involves additional disclosures, where applicable, concerning (i) contracts with customers, (ii) significant judgments and changes in judgments in determining the timing of satisfaction of performance obligations and the transaction price, and (iii) assets recognized for costs to obtain or fulfill contracts. See Note 7 for information on our sales of products.
In January 2016 the FASB issued ASU No. 2016-01 Financial Instruments - Overall (Subtopic 825-10): Recognition and Measurement of Financial Assets and Financial Liabilities. The guidance requires entities to measure equity investments that are not accounted for under the equity method at fair value, with any changes in fair value included in current earnings, and updates certain disclosure requirements. The update is effective for fiscal years beginning after December 15, 2017. We adopted ASU No. 2016-01 as of January 1, 2018 using the modified-retrospective approach, with a cumulative-effect adjustment from accumulated other comprehensive loss to retained deficit on our balance sheet of $1.3 million, net of the income tax effect.
In August 2016, the FASB issued ASU No. 2016-15 Statement of Cash Flows (Topic 230): Classification of Certain Cash Receipts and Cash Payments. The update provides guidance on classification for cash receipts and payments related to eight specific issues. The update is effective for fiscal years beginning after December 15, 2017, and interim periods within those fiscal years, with early adoption permitted. We adopted this update as of January 1, 2018.
In November 2016, the FASB issued ASU No. 2016-18 Statement of Cash Flows (Topic 230): Restricted Cash. The update requires that a statement of cash flows explain the change during the period in the total of cash, cash equivalents, and amounts generally described as restricted cash or restricted cash equivalents. The update is effective for fiscal years beginning after December 15, 2017, and interim periods within those fiscal years, with early adoption permitted. We adopted this update as of January 1, 2018. Cash, cash equivalents, and restricted cash and cash equivalents on the condensed consolidated statement of cash flows includes restricted cash and cash equivalents of $1.0 million as of September 30, 2018 and December 31, 2017, $1.1 million as of September 30, 2017 and $2.2 million as of December 31, 2016, as well as amounts previously reported for cash and cash equivalents.
In January 2017, the FASB issued ASU No. 2017-01 Business Combinations (Topic 805): Clarifying the Definition of a Business. The update clarifies the definition of a business with the objective of adding guidance to assist entities with evaluating whether transactions should be accounted for as acquisitions (or disposals) of assets or businesses. The update is effective for fiscal years beginning after December 15, 2017, and interim periods within those fiscal years. We applied the applicable provisions of the update to our acquisition of Klondex in July 2018 (see Note 14), which was accounted for as a business acquisition, and will apply the applicable provisions of the update to any future acquisitions.
In March 2017, the FASB issued ASU No. 2017-07 Compensation - Retirement Benefits (Topic 715): Improving the Presentation of Net Periodic Pension Cost and Net Period Postretirement Benefit Cost. The update provides specific requirements for classification and disclosure regarding the service cost component and other components of net benefit cost related to pension plans. The update is effective for fiscal years beginning after December 15, 2017, and interim periods within those fiscal years. We have implemented this update effective January 1, 2018. For the full year of 2018, a total net expense of approximately $2.8 million for the components of net benefit cost, except service cost, is expected to be included in other income (expense) on our consolidated statements of operations, and not reported in the same line items as other employee compensation costs.
Accounting Standards Updates to Become Effective in Future Periods
In February 2016, the FASB issued ASU No. 2016-0202 Leases (Topic 842)842). The update modifiesmodified the classification criteria and requires lessees to recognize the assets and liabilities on the balance sheet for most leases. The update iswas effective for fiscal years beginning after December 15, 2018, with early adoption permitted. We are currently reviewingadopted the guidance effective January 1, 2019, and recognized a liability and right-of-use asset of $22.4 million as of that date for our leases and compilingidentified operating leases. We elected the information requiredtransition option to implementapply the new guidance as of that effective date without adjusting comparative periods presented. In the adoption of ASU No.2016-02, we elected to not assess leases with terms less than twelve months in length. We also elected practical expedients which permitted us to forgo reassessing the following upon adoption: (i) whether any expired or existing contracts are or contain leases, (ii) the classification of leases as operating or capital under the previous accounting guidance, and (iii) treatment of initial indirect costs for any existing leases. In addition, we elected to not reassess whether land easements represent leases, as we did not treat them as leases under the previous guidance. See Note 109 for information on future commitments related to our operating leases; the present value of these leases will be recognized on our balance sheet upon implementation of the new guidance. We are currently evaluating the potential impact of implementing this update on our consolidated financial statements.leases.
In August 2017, the FASB issued ASU No. 2017-122017-12 Derivatives and Hedging (Topic 815)815): Targeted Improvements to Accounting for Hedging Activities. The objective of the update is to improve the financial reporting of hedging relationships to better portray the economic results of an entity's risk management activities in its financial statements, and simplify the application of existing hedge accounting guidance. The update iswas effective for fiscal years beginning after December 15, 2018, and interim periods within those fiscal years, with early adoption permitted. We are currently evaluating the potential impactAdoption of implementing this update as of January 1, 2019 did not have a material impact on our consolidated financial statements.
In February 2018, the FASB issued ASU No.2018-02 Income Statement - Reporting Comprehensive Income (Topic 220): Reclassification of Certain Tax Effects from Accumulated Other Comprehensive Income. The amendments in the update allow a reclassification from other comprehensive income to retained earnings for "stranded" tax effects resulting from the reduction in the historical corporate tax rate under the Tax Cuts and Jobs Act enacted in December 2017. The update was effective for fiscal years beginning after December 15, 2018. We elected to not reclassify stranded tax effects, and adoption of this update as of January 1, 2019 did not have a material impact on our consolidated financial statements.
In June 2018, the FASB issued ASU No.2018-07 Compensation - Stock Compensation (Topic 718): Improvements to Nonemployee Share-Based Payment Accounting. The update involves simplification of several aspects of accounting for nonemployee share-based payment transactions by expanding the scope of Topic 718 to include nonemployee awards. The update was effective for fiscal years beginning after December 15, 2018, and interim periods within those fiscal years, with early adoption permitted. Adoption of this update as of January 1, 2019 did not have a material impact on our consolidated financial statements.
Accounting Standards Updates to Become Effective in Future Periods
In August 2018, the FASB issued ASU No.2018-13 Fair Value Measurement (Topic 820): Disclosure Framework - Changes to the Disclosure Requirements for Fair Value Measurement. The update removes, modifies and makes additions to certain disclosure requirements with respect to fair value measurements. The update is effective for fiscal years beginning after December 15, 2019, with early adoption permitted. We are evaluating the impact of this update on our fair value measurement disclosures.
In August 2018, the FASB issued ASU No.2018-14 Compensation - Retirement Benefits - Defined Benefit Plans - General (Subtopic 715-20): Disclosure Framework - Changes to the Disclosure Requirements for Defined Benefit Plans. The update removes several disclosure requirements, adds two new disclosure requirements, and clarifies other disclosure requirements for employers that sponsor defined benefit pension or other post-retirement plans. The update is effective for fiscal years beginning after December 15, 2020, with early adoption permitted. We are evaluating the impact of this update on our disclosures involving our defined benefit pension plans.
Note 12.11. Derivative Instruments
Foreign Currency
Our wholly-owned subsidiaries owning the Casa Berardi and San Sebastian mines are U.S. dollar ("USD")-functionalUSD-functional entities which routinely incur expenses denominated in Canadian dollars ("CAD")CAD and Mexican pesos ("MXN"), respectively, and such expenses expose us to exchange rate fluctuations between the USD and CAD and MXN. In April 2016, we initiated a program to manage our exposure to fluctuations in the exchange rate between the USD and CAD and the impact on our future operating costs denominated in CAD. In October 2016, we also initiated a similar program with respect to manage our exposure to the impact of fluctuations in the exchange rate between the USD and MXN on our future operating costs denominated in MXN. The programs utilize forward contracts to buy CAD and MXN, and each contract is designated as a cash flow hedge. As of September 30, 2018,2019, we had 94135 forward contracts outstanding to buy a total of CAD$225.1300.7 million having a notional amount of US$174.0231.5 million, and 3010 forward contracts outstanding to buy a total of MXN$178.537.3 million having a notional amount of USD$8.81.8 million. The CAD contracts are related to forecasted cash operating costs at Casa Berardi to be incurred from 20182019 through 20222023 and have USD-to-CADCAD-to-USD exchange rates ranging between 1.27291.2702 and 1.3315.1.3332. The MXN contracts are related to forecasted cash operating costs at San Sebastian to be incurred from 20182019 through 2020 and have MXN-to-USD exchange rates ranging between 19.440020.4100 and 20.8550. Our risk management policy provides that up to 75% of our planned cost exposure for five years into the future may be hedged under such programs, and for potential additional programs to manage other foreign currency-related exposure areas.
As of September 30, 2018,2019, we recorded the following balances for the fair value of the contracts:
• | a current asset of | |
|
|
• | a current liability of |
• | a non-current liability of $2.9 million, which is included in other non-current liabilities. |
Net unrealized gainslosses of approximately $1.5$4.3 million related to the effective portion of the hedges were included in accumulated other comprehensive loss as of September 30, 2018.2019. Unrealized gains and losses will be transferred from accumulated other comprehensive loss to current earnings as the underlying operating expenses are recognized. We estimate approximately $0.8$1.3 million in net unrealized gainslosses included in accumulated other comprehensive loss as of September 30, 20182019 would be reclassified to current earnings in the next twelve months. Net realized gainslosses of approximately $0.2$1.2 million on contracts related to underlying expenses which have been recognized were transferred from accumulated other comprehensive loss and included in cost of sales and other direct production costs for the nine months ended September 30, 2018. Net2019. NaN net unrealized gains of approximately $19 thousandor losses related to ineffectiveness of the hedges were included in gain (loss) on derivatives contracts on our consolidated statements of operations and comprehensive income (loss)current earnings for the nine months ended September 30, 2018.2019.
Metals Prices
AtWe may at times we may use commodity forward sales commitments, commodity swap contracts and commodity put and call option contracts to manage our exposure to fluctuation in the prices of certain metals we produce. Contract positions are designed to ensure that we will receive a defined minimum price for certain quantities of our production, thereby partially offsetting our exposure to fluctuations in the market.market prices. Our risk management policy allows for up to 75% of our planned metals price exposure for five years into the future, with certain other limitations, to be hedgedcovered under such programs.programs that would establish a ceiling for prices to be realized on future metals sales. These instruments do, however, expose us to (i) credit risk in the form of non-performance by counterparties for contracts in which the contract price exceeds the spot price of a commodity and (ii) price risk to the extent that the spot price exceeds the contract price for quantities of our production covered under contract positions.
We are currently using financially-settled forward contracts to manage the exposure to changes in prices of silver, gold, zinc and lead contained in our Greens Creek concentrate shipments between the time of shipment and final settlement. In addition, at times we use financially-settled forward contracts to manage the exposure to changes in prices of zinc and lead (but not silver and gold) contained in our forecasted future Greens Creek concentrate shipments. The following tables summarize the quantities of metals committed under forward sales contracts at September 30,2019 and December 31,2018:
September 30, 2019 | Ounces/pounds under contract (in 000's) | Average price per ounce/pound | ||||||||||||||||||||||||||||||
Silver | Gold | Zinc | Lead | Silver | Gold | Zinc | Lead | |||||||||||||||||||||||||
(ounces) | (ounces) | (pounds) | (pounds) | (ounces) | (ounces) | (pounds) | (pounds) | |||||||||||||||||||||||||
Contracts on provisional sales | ||||||||||||||||||||||||||||||||
2019 settlements | 828 | 3 | 16,204 | 2,921 | $ | 18.66 | $ | 1,537 | $ | 1.09 | $ | 0.90 | ||||||||||||||||||||
Contracts on forecasted sales | ||||||||||||||||||||||||||||||||
2019 settlements | — | — | — | 4,409 | N/A | N/A | N/A | $ | 0.95 | |||||||||||||||||||||||
2020 settlements | — | — | — | 4,960 | N/A | N/A | N/A | $ | 0.96 | |||||||||||||||||||||||
December 31, 2018 | Ounces/pounds under contract (in 000's) | Average price per ounce/pound | ||||||||||||||||||||||||||||||
Silver | Gold | Zinc | Lead | Silver | Gold | Zinc | Lead | |||||||||||||||||||||||||
(ounces) | (ounces) | (pounds) | (pounds) | (ounces) | (ounces) | (pounds) | (pounds) | |||||||||||||||||||||||||
Contracts on provisional sales | ||||||||||||||||||||||||||||||||
2019 settlements | 842 | 4 | 18,450 | 2,700 | $ | 14.69 | $ | 1,260 | $ | 1.15 | $ | 0.89 | ||||||||||||||||||||
In June 2019, we began using financially-settled put option contracts to manage the exposure of our forecasted future gold and silver sales to potential declines in market prices for those metals. These put contracts give as the option, but not the obligation, to sell quantities of silver and gold in the future at established prices. The following table summarizes the quantities of metals for which we have entered into put contracts and the average exercise prices as of September 30,2019:
September 30, 2019 | Ounces under contract (in 000's) | Average price per ounce | ||||||||||||||
Silver | Gold | Silver | Gold | |||||||||||||
(ounces) | (ounces) | (ounces) | (ounces) | |||||||||||||
Contracts on forecasted sales | ||||||||||||||||
2019 settlements | 2,493 | 89 | $ | 15.08 | $ | 1,400 | ||||||||||
2020 settlements | 2,634 | 51 | $ | 15.00 | $ | 1,400 | ||||||||||
In October 2019, we entered into additional put contracts which establish the minimum prices at which we can sell silver and gold relating to forecasted production for a portion of 2020 at $16.00 and $1,450, respectively, per ounce. These contracts have total premiums of approximately $3.2 million to be paid upon maturity.
These forward and put option contracts are not designated as hedges and are marked-to-market through earnings each period.
As of September 30, 2018, weWe recorded the following balances as of September 30,2019 for the fair value of the contracts:forward and put option contracts held at that time:
• | a current asset of |
• | a current liability of |
We recognized an $8.3a $0.1 million net gainloss during the firstnine months of 20182019 on the contracts utilized to manage exposure to prices of metals in our concentrate shipments,that have been sold, which is included in sales of products. The net gainloss recognized on the contracts offsets lossesgains related to price adjustments on our provisional concentrate sales due to changes to silver, gold, lead and zinc prices between the time of sale and final settlement.
We recognized a $40.3$2.7 million net gain during the firstnine months of 20182019 on the contracts utilized to manage exposure to prices for forecasted future concentrate shipments.sales. The net gain on these contracts is included as a separate line item under other income (expense), as they relate to forecasted future shipments,sales, as opposed to sales that have already taken place but are subject to final pricing as discussed in the preceding paragraph. The net gain for the firstnine months of 20182019 is the result of decreasing zinc and lead prices, partially offset by increasing gold and silver prices. During the third quarter quarters of 2019 and 2018, we settled, prior to their maturity date, forward contracts in a gain position for cash proceeds to us of approximately $6.7 million and $32.8 million. As a result, there were no metals committed under contracts on forecasted sales as of September 30, 2018. This program,million, respectively. These programs, when utilized isand the contracts are not settled prior to their maturity dates, are designed to mitigate the impact of potential future declines in silver, gold, lead and zinc prices from the price levels established in the contracts (see average price information below)above). When those prices increase compared to the contracts, we incur losses on the contracts.
The following tables summarize the quantities of metals committed under forward sales contracts at September 30, 2018 and December 31, 2017:
September 30, 2018 | Ounces/pounds under contract (in 000's) | Average price per ounce/pound | ||||||||||||||||||||||||||||||
Silver | Gold | Zinc | Lead | Silver | Gold | Zinc | Lead | |||||||||||||||||||||||||
(ounces) | (ounces) | (pounds) | (pounds) | (ounces) | (ounces) | (pounds) | (pounds) | |||||||||||||||||||||||||
Contracts on provisional sales | ||||||||||||||||||||||||||||||||
2018 settlements | 1,221 | 6 | 10,362 | 4,685 | $ | 14.56 | $ | 1,211 | $ | 1.17 | $ | 0.94 | ||||||||||||||||||||
December 31, 2017 | Ounces/pounds under contract (in 000's) | Average price per ounce/pound | ||||||||||||||||||||||||||||||
Silver | Gold | Zinc | Lead | Silver | Gold | Zinc | Lead | |||||||||||||||||||||||||
(ounces) | (ounces) | (pounds) | (pounds) | (ounces) | (ounces) | (pounds) | (pounds) | |||||||||||||||||||||||||
Contracts on provisional sales | ||||||||||||||||||||||||||||||||
2018 settlements | 1,447 | 5 | 21,550 | 4,740 | $ | 16.64 | $ | 1,279 | $ | 1.45 | $ | 1.11 | ||||||||||||||||||||
Contracts on forecasted sales | ||||||||||||||||||||||||||||||||
2018 settlements | — | — | 32,187 | 16,645 | N/A | N/A | $ | 1.29 | $ | 1.06 | ||||||||||||||||||||||
2019 settlements | — | — | 23,589 | 18,078 | N/A | N/A | $ | 1.33 | $ | 1.09 | ||||||||||||||||||||||
2020 settlements | — | — | 3,307 | 2,866 | N/A | N/A | $ | 1.27 | $ | 1.08 | ||||||||||||||||||||||
Credit-risk-related Contingent Features
Certain of our derivative contracts contain cross default provisions which provide that a default under our revolving credit agreement would cause a default under the derivative contract. As of September 30, 2018,2019, we have not posted any collateral related to these contracts. The fair value of derivatives in a net liability position related to these agreements was $12.4 million as of September 30,2019,which includes accrued interest but excludes any adjustment for nonperformance risk, related to these agreements was $1.0 million as of September 30, 2018.risk. If we were in breach of any of these provisions at September 30, 2018,2019, we could have been required to settle our obligations under the agreements at their termination value of $1.0$12.4 million.
Note 13.12. Fair Value Measurement
Accounting guidance has established a hierarchy for inputs used to measure assets and liabilities at fair value on a recurring basis. The three levels included in the hierarchy are:
Level 1: quoted prices in active markets for identical assets or liabilities;
Level 2: significant other observable inputs; and
Level 3: significant unobservable inputs.
The table below sets forth our assets and liabilities that were accounted for at fair value on a recurring basis and the fair value calculation input hierarchy level that we have determined applies to each asset and liability category (in thousands).
Description | Balance at September 30, 2018 | Balance at December 31, 2017 | Input Hierarchy Level | Balance at September 30, 2019 | Balance at December 31, 2018 | Input Hierarchy Level | ||||||||||||
Assets: | ||||||||||||||||||
Cash and cash equivalents: | ||||||||||||||||||
Money market funds and other bank deposits | $ | 60,856 | $ | 186,107 | Level 1 | $ | 32,995 | $ | 27,389 | Level 1 | ||||||||
Available for sale securities: | ||||||||||||||||||
Debt securities - municipal and corporate bonds | — | 33,758 | Level 2 | |||||||||||||||
Equity securities – mining industry | 7,190 | 7,561 | Level 1 | 7,349 | 6,583 | Level 1 | ||||||||||||
Trade accounts receivable: | ||||||||||||||||||
Receivables from provisional concentrate sales | 12,947 | 14,805 | Level 2 | 6,222 | 4,184 | Level 2 | ||||||||||||
Restricted cash balances: | ||||||||||||||||||
Certificates of deposit and other bank deposits | 1,010 | 1,032 | Level 1 | |||||||||||||||
Certificates of deposit and other deposits | 1,025 | 1,025 | Level 1 | |||||||||||||||
Derivative contracts: | ||||||||||||||||||
Foreign exchange contracts | 1,760 | 4,943 | Level 2 | 143 | 23 | Level 2 | ||||||||||||
Metal forward contracts | 282 | — | Level 2 | |||||||||||||||
Metal forward and put option contracts | 1,092 | 209 | Level 2 | |||||||||||||||
Total assets | $ | 84,045 | $ | 248,206 | $ | 48,826 | $ | 39,413 | ||||||||||
Liabilities: | ||||||||||||||||||
Derivative contracts: | ||||||||||||||||||
Foreign exchange contracts | $ | 136 | $ | — | Level 2 | $ | 4,240 | $ | 8,595 | Level 2 | ||||||||
Metal forward contracts | 604 | 15,531 | Level 2 | |||||||||||||||
Metal forward and put option contracts | 7,081 | 373 | Level 2 | |||||||||||||||
Total liabilities | $ | 740 | $ | 15,531 | $ | 11,321 | $ | 8,968 | ||||||||||
Cash and cash equivalents consist primarily of money market funds and are valued at cost, which approximates fair value, and a small portion consists of municipal bonds having maturities of less than 90 days, which are recorded at fair value.
Current available-for-sale securities consist of municipal and corporate bonds having maturities of more than 90 days, which are recorded at fair value.
Current and non-current restricted cash balances consist primarily of certificates of deposit, U.S. Treasury securities, and other deposits and are valued at cost, which approximates fair value.
Our non-current available for sale securities consist of marketable equity securities of companies in the mining industry which are valued using quoted market prices for each security.
Trade accounts receivable include amounts due to us for shipments of concentrates, doré and metals sold from doré sold to customers. Revenues and the corresponding accounts receivable for sales of metals products are recorded when title and risk of loss transfer to the customer (generally at the time of ship loading, or at the time of customer arrival for trucked products). Sales of concentrates are recorded using estimated forward prices for the anticipated month of settlement applied to our estimate of payable metal quantities contained in each shipment. Sales are recorded net of estimated treatment and refining charges, which are also impacted by changes in metals prices and quantities of contained metals. We estimate the prices at which sales of our concentrates will be settled due to the time elapsed between shipment and final settlement with the customer. Receivables for previously recorded concentrate sales are adjusted to reflect estimated forward metals prices at the end of each period until final settlement by the customer. We obtain the forward metals prices used each period from a pricing service. Changes in metals prices between shipment and final settlement result in changes to revenues previously recorded upon shipment. The embedded derivative contained in our concentrate sales is adjusted to fair market value through earnings each period prior to final settlement.
We use financially-settled forward contracts to manage exposure to changes in the exchange rate between the USD and CAD and MXN, and the impact on CAD- and MXN-denominated operating costs incurred at our Casa Berardi and San Sebastian units (see Note 1211 for more information). These contracts qualify for hedge accounting, with unrealized gains and losses related to the effective portion of the contracts included in accumulated other comprehensive loss, and unrealized gains and losses related to the ineffective portion of the contracts included in earnings each period. The fair value of each contract represents the present value of the difference between the forward exchange rate for the contract settlement period as of the measurement date and the contract settlement exchange rate.
We use financially-settled forward contracts to manage the exposure to changes in prices of silver, gold, zinc and lead contained in our concentrate shipments that have not reached final settlement. We also use financially-settled forward and put option contracts to manage the exposure to changes in prices of silver, gold, zinc and lead contained in our forecasted future concentrate shipmentssales (see Note 1211 for more information). These contracts do not qualify for hedge accounting, and are marked-to-market through earnings each period. The fair value of each forward contract represents the present value of the difference between the forward metal price for the contract settlement period as of the measurement date and the contract settlement metal price. The fair value of each put option contract is measured using the Black-Scholes pricing model, with inputs for the period-end metal price and assumed metal price volatility and discount rate.
Our Senior Notes, which were recorded at their carrying value, of $503.2 million, net of unamortized initial purchaser discount, of $504.4 million at September 30, 2018 of $3.3 million,2019, had a fair value of $511.4$503.6 million at September 30, 2018.2019. Quoted market prices, which we consider to be Level 1 inputs, are utilized to estimate fair values of the Senior Notes. See Note 109 for more information.
Note 14.13. Acquisition of Klondex Mines Ltd.
On July 20, 2018, we acquired all of the issued and outstanding common shares of Klondex Mines Ltd. ("Klondex") for consideration valued at $2.24$2.27 per Klondex share (the "Arrangement"). The acquisition resulted in our 100% ownership of three producing land packages in northern Nevada totaling approximately 110 square miles and containing operating or previously-operating mines with a history of high-grade gold mines,production, along with interests in various other gold exploration properties, in northern Nevada. Theproperties. We believe the acquisition is expectedhas the potential to increase our annual gold production, gives us ownership of operating gold mines and identified gold reserves and other mineralized material, and provides access to a large land package with known mineralization.production. Under the terms of the Arrangement, each holder of Klondex common shares had the option to receive either (i) $2.47 in cash per Klondex share (the “Cash Alternative”), (ii) 0.6272 of a Hecla share per Klondex share (the “Share Alternative”), or (iii) US$0.8411 in cash and 0.4136 of a Hecla share per Klondex share (the “Combined Alternative”), subject in the case of the Cash Alternative and the Share Alternative to pro-ration based on a maximum cash consideration of $153.2 million and a maximum number of Hecla shares issued of 75,276,176. Klondex shareholders also received shares of a newly formed company which holds the Canadian assets previously owned by Klondex (Havilah Mining Corporation (“Havilah”("Havilah")). Klondex had 180,499,319 issued and outstanding common shares prior to consummation of the Arrangement. An additional 1,549,626 Klondex common shares were issued immediately prior to consummation of the Arrangement related to conversion of in-the-money Klondex options and certain outstanding restricted share units, resulting in a total of 182,048,945 issued and outstanding Klondex common shares at the time of consummation of the Arrangement. In connection with the Arrangement, we also issued an aggregate of 4,136,000 warrants to purchase one1 share of our common stock (“Hecla Warrants”) to holders of warrants to purchase Klondex common shares. Of the Hecla Warrants, 2,068,000 have an exercise price of $8.02 and expire in April 2032, and 2,068,000 have an exercise price of $1.57 and expire in February 2029. In addition, we settled share-based payment awards held by Klondex directors and employees for cash of $2.0 million. Consideration for the Arrangement was cash of $161.7 million, 75,276,176 shares of our common stock valued at $242.4 million, and issuance of the Hecla Warrants valued at $10.2$9.8 million, for total consideration of $414.2$413.9 million. The Hecla Warrants were valued using the Black-Scholes model and based on the exercise price and term of the warrants, the price of our common stock at the time of issuance of the warrants, and assumptions for the discount rate and volatility and dividend rate of our common stock. The cash consideration includes $7.0 million for our subscription for common shares of Havilah and $1.5 million for settlement of certain equity compensation instruments.
The following summarizes the preliminary allocation of purchase price to the fair value of assets acquired and liabilities assumed as of the date of acquisition (in thousands):
Consideration: | ||||||||
Cash payments | $ | 161,704 | $ | 161,704 | ||||
Hecla stock issued (75,276,176 shares at $3.22 per share) | 242,389 | 242,389 | ||||||
Hecla warrants issued | 10,155 | 9,830 | ||||||
Total consideration | $ | 414,248 | $ | 413,923 | ||||
Fair value of net assets acquired: | ||||||||
Assets: | ||||||||
Cash | $ | 12,874 | $ | 12,874 | ||||
Accounts receivable | 3,453 | 3,453 | ||||||
Inventory - supplies | 6,564 | 6,565 | ||||||
Inventory - finished goods, in-process material and stockpiled ore | 10,302 | 10,075 | ||||||
Other current assets | 2,583 | 2,583 | ||||||
Properties, plants, equipment and mineral interests | 502,285 | 510,015 | ||||||
Non-current investments | 1,596 | 1,596 | ||||||
Non-current restricted cash and investments | 9,504 | 9,504 | ||||||
Total assets | 549,161 | 556,665 | ||||||
Liabilities: | ||||||||
Accounts payable and accrued liabilities | 17,270 | 17,799 | ||||||
Accrued payroll and related benefits | 10,352 | 8,245 | ||||||
Accrued taxes | 421 | 421 | ||||||
Lease liability | 2,080 | 2,080 | ||||||
Debt | 35,086 | 35,086 | ||||||
Asset retirement obligation | 19,571 | 19,571 | ||||||
Deferred tax liability | 50,133 | 59,540 | ||||||
Total liabilities | 134,913 | 142,742 | ||||||
Net assets | $ | 414,248 | $ | 413,923 | ||||
We do not believe there are any specific elements of theThe allocation of purchase price above that are subjectwas finalized in the second quarter of 2019, with adjustments made to change. However, the overallpreviously-reported preliminary allocation is preliminaryto decrease the property, plants, equipment and is subject to change.mineral interests, accrued payroll and related benefits, and deferred tax liability balances by $2.8 million, $2.1 million and $0.7 million, respectively.
Our results forIn the nine months ended September 30, 2018 include salessecond quarter of products of $11.5 million and2019, we conducted a net loss of $10.1 million since the acquisition date related to the operations acquired through the Arrangement.
The unaudited pro forma financial information below represents the combined resultsreview of our Nevada operations which resulted in (i) a plan to curtail development and limit near-term mining at Fire Creek to areas where development has already been completed and (ii) suspension of production at Hollister and development of the Hatter Graben project at Hollister, resulting in lower anticipated near-term production and capitalized development costs. We determined this review and the resulting plans represented a triggering event requiring an assessment of recoverability of the carrying value of our long-lived assets ("carrying value assessment") in Nevada. In our carrying value assessment, our estimate of undiscounted future cash flows exceeded the carrying value of the Nevada assets, and we concluded impairment was not indicated, as ifof June 30, 2019. Estimates of undiscounted future cash flows are dependent upon, among other factors, estimates of: (i) metals to be extracted and recovered from proven and probable ore reserves and identified mineralization beyond proven and probable reserves, (ii) future operating and capital costs, and (iii) future metals prices. The carrying value assessment assumed a slow-down and deferral of near-term production over a period of twelve months as we continue to address operational challenges and assess the acquisition had occurredappropriate next steps. In the assessment, resumption of previously-anticipated production levels is assumed to take place in the first part of 2021; however, this will be contingent upon the resolution of operational issues, including, but not limited to: (i) ore grade control, (ii) mill recoveries and reconciliation, (iii) the potential availability of third-party processing of ore produced at the beginningFire Creek mine, and (iv) availability of sufficient resources (including funding) to resume and complete necessary development work and drilling on a timely basis (collectively the periods presented. The unaudited pro forma financial information is presented for informational purposes only and is not indicative of the results of operations that would have occurred if the acquisition had taken place at the beginning of the periods presented, nor is it indicative of future operating results."Operational Issues").
Three Months Ended | Nine Months Ended | |||||||||||||||
September 30, | September 30, | |||||||||||||||
(in thousands, except per share amounts) | 2018 | 2017 | 2018 | 2017 | ||||||||||||
Sales | $ | 156,731 | $ | 182,489 | $ | 543,741 | $ | 573,950 | ||||||||
Net (loss) income | (20,735 | ) | (8,877 | ) | 4,694 | 2,523 | ||||||||||
(Loss) income applicable to common shareholders | (20,873 | ) | (9,015 | ) | 4,280 | (2,937 | ) | |||||||||
Basic and diluted (loss) income per common share | (0.04 | ) | (0.02 | ) | 0.01 | (0.01 | ) | |||||||||
Our estimates of undiscounted future cash flows for our Nevada assets are most sensitive to (i) changes in metal prices and (ii) the timely resumption of previously-anticipated production levels. Our carrying value assessment assumed a weighted-average gold price of approximately $1,345 per ounce. A sensitivity analysis was performed, and decreasing the weighted-average gold price assumption to below approximately $1,280 per ounce, with all other variables held constant, would have resulted in estimated undiscounted future cash flows that were less than the carrying value of the Nevada assets as of June 30, 2019. In the third quarter of 2019, we continued to pursue third-party ore processing arrangements with the potential to reduce transportation and milling costs. Additionally, we have commenced studies of the assets in order to determine how to mine them with lower costs. There were no significant events or changes in circumstances during the third quarter of 2019 representing a triggering event requiring a carrying value assessment in Nevada. However, if events or changes occur in the future that adversely affect our estimate of undiscounted future cash flows from our Nevada assets, including (i) an increase in expected costs, (ii) a sustained decline in gold prices, or (iii) suspension of production and placement of our Nevada operations on care-and-maintenance due to the inability to resolve the Operational Issues identified above in a timely manner, or other factors, we may be required to again perform the carrying value assessment for our Nevada assets. If a future assessment indicates the carrying value of the assets exceeds the estimated undiscounted future cash flows, an impairment loss, which could be material, would be recognized for the difference between the carrying value and fair value of the assets. The estimate of potential impairment involves significant judgment and assumptions, and no assurance can be given as to whether we will recognize an impairment in the future or the amount of a potential impairment. The carrying value of our properties, plants, equipment and mineral interests in Nevada as of September 30,2019 was $524.8 million, consisting of the following (in millions):
Value beyond proven and probable reserves | $ | 382.2 | ||
Mineral properties and development | 57.7 | |||
Mills and tailings facilities | 46.4 | |||
Buildings and equipment | 33.0 | |||
Land | 2.9 | |||
Asset retirement obligation asset | 2.6 | |||
Total | $ | 524.8 |
The pro forma financial information includes adjustmentsSee Part II, Item 1A - Risk Factors in our quarterly report on Form 10-Q for the period ended June 30, 2019 for a discussion of certain risks relating to eliminate amounts related toour recent and ongoing analysis of the Canadian assets previously owned by Klondex, which were transferred to Havilah and not acquired by us, and costs related tocarrying value of the acquisition.Nevada assets.
Note 15.14. Guarantor Subsidiaries
Presented below are Hecla’s unaudited interim condensed consolidating financial statements as required by Rule 3-103-10 of Regulation S-XS-X of the Securities Exchange Act of 1934, as amended, resulting from the guarantees by certain of Hecla's subsidiaries (the "Guarantors") of the Senior Notes and the RQ Notes (see Note 109 for more information). The Guarantors consist of the following of Hecla's 100%-owned subsidiaries: Hecla Limited; Silver Hunter Mining Company; Rio Grande Silver, Inc.; Hecla MC Subsidiary, LLC; Hecla Silver Valley, Inc.; Burke Trading, Inc.; Hecla Montana, Inc.; Revett Silver Company; RC Resources, Inc.; Troy Mine Inc.; Revett Exploration, Inc.; Revett Holdings, Inc.; Mines Management, Inc.; Newhi, Inc.; Montanore Minerals Corp.; Hecla Alaska LLC; Hecla Greens Creek Mining Company; Hecla Admiralty Company; and Hecla Juneau Mining Company. By November 30, 2018, we expect to add as Guarantors our new domesticCompany; Klondex subsidiaries.Holdings Inc.; Klondex Gold & Silver Mining Co.; Klondex Midas Holdings Limited; Klondex Aurora Mine Inc.; Klondex Hollister Mine Inc.; and Hecla Quebec, Inc. We completed the initial offering of the Senior Notes on April 12, 2013, and a related exchange offer for virtually identical notes registered with the SEC on January 3, 2014. We issued the RQ Notes in on March 5, 2018.
The unaudited interim condensed consolidating financial statements below have been prepared from our financial information on the same basis of accounting as the unaudited interim condensed consolidated financial statements set forth elsewhere in this report. Investments in the subsidiaries are accounted for under the equity method. Accordingly, the entries necessary to consolidate Hecla, the Guarantors, and our non-guarantor subsidiaries are reflected in the intercompany eliminations column. In the course of preparing consolidated financial statements, we eliminate the effects of various transactions conducted between Hecla and its subsidiaries and among the subsidiaries. While valid at an individual subsidiary level, such activities are eliminated in consolidation because, when taken as a whole, they do not represent business activity with third-partythird-party customers, vendors, and other parties. Examples of such eliminations include the following:
• | Investments in subsidiaries. The acquisition of a company results in an investment in debt or equity capital on the records of the parent company and a contribution to debt or equity capital on the records of the |
• | Capital contributions. Certain of Hecla's subsidiaries do not generate cash flow, either at all or that is sufficient to meet their capital needs, and their cash requirements are routinely met with inter-company advances from their parent companies. |
• | Debt. |
• | Dividends. Certain of Hecla's subsidiaries which generate cash flow routinely provide cash to their parent companies through inter-company transfers. On at least an annual basis, the boards of directors of such subsidiary companies declare dividends to their parent companies, |
• | Deferred taxes. Our ability to realize deferred tax assets and liabilities is considered |
Separate financial statements of the Guarantors are not presented because the guarantees by the Guarantors are joint and several and full and unconditional, except for certain customary release provisions, including: (1)(1) the sale or disposal of all or substantially all of the assets of the Guarantor; (2)(2) the sale or other disposition of the capital stock of the Guarantor; (3)(3) the Guarantor is designated as an unrestricted entity in accordance with the applicable provisions of the indenture; (4)(4) Hecla ceases to be a borrower as defined in the indenture; and (5)(5) upon legal or covenant defeasance or satisfaction and discharge of the indenture.
Unaudited Interim Condensed Consolidating Balance Sheets
As of September 30, 2019 | ||||||||||||||||||||
Parent | Guarantors | Non-Guarantors | Eliminations | Consolidated | ||||||||||||||||
(in thousands) | ||||||||||||||||||||
Assets | ||||||||||||||||||||
Cash and cash equivalents | $ | 18,983 | $ | 9,608 | $ | 4,404 | $ | — | $ | 32,995 | ||||||||||
Other current assets | 7,031 | 113,542 | 25,430 | (72 | ) | 145,931 | ||||||||||||||
Properties, plants, equipment and mineral interests - net | 1,913 | 2,438,137 | 15,461 | — | 2,455,511 | |||||||||||||||
Intercompany receivable (payable) | 143,248 | (709,012 | ) | 149,616 | 416,148 | — | ||||||||||||||
Investments in subsidiaries | 1,499,318 | — | — | (1,499,318 | ) | — | ||||||||||||||
Other non-current assets | 284,380 | 25,380 | (120,645 | ) | (150,374 | ) | 38,741 | |||||||||||||
Total assets | $ | 1,954,873 | $ | 1,877,655 | $ | 74,266 | $ | (1,233,616 | ) | $ | 2,673,178 | |||||||||
Liabilities and Stockholders' Equity | ||||||||||||||||||||
Current liabilities | $ | (298,754 | ) | $ | 165,564 | $ | 10,704 | $ | 268,329 | $ | 145,843 | |||||||||
Long-term debt | 584,618 | 19,159 | 876 | — | 604,653 | |||||||||||||||
Non-current portion of accrued reclamation | — | 95,674 | 8,147 | — | 103,821 | |||||||||||||||
Non-current deferred tax liability | — | 146,069 | — | (2,627 | ) | 143,442 | ||||||||||||||
Other non-current liabilities | 52,365 | 5,393 | 1,017 | — | 58,775 | |||||||||||||||
Shareholders' equity | 1,616,644 | 1,445,796 | 53,522 | (1,499,318 | ) | 1,616,644 | ||||||||||||||
Total liabilities and stockholders' equity | $ | 1,954,873 | $ | 1,877,655 | $ | 74,266 | $ | (1,233,616 | ) | $ | 2,673,178 | |||||||||
As of December 31, 2018 | ||||||||||||||||||||
Parent | Guarantors | Non-Guarantors | Eliminations | Consolidated | ||||||||||||||||
| Revised | Revised | |||||||||||||||||||
(in thousands) | ||||||||||||||||||||
Assets | �� | |||||||||||||||||||
Cash and cash equivalents | $ | 6,266 | $ | 17,233 | $ | 3,890 | $ | — | $ | 27,389 | ||||||||||
Other current assets | 6,388 | 105,900 | 24,542 | (69 | ) | 136,761 | ||||||||||||||
Properties, plants, equipment and mineral interests, net | 1,913 | 2,503,467 | 14,624 | — | 2,520,004 | |||||||||||||||
Intercompany receivable (payable) | 171,908 | (546,374 | ) | 152,031 | 222,435 | — | ||||||||||||||
Investments in subsidiaries | 1,577,869 | — | — | (1,577,869 | ) | — | ||||||||||||||
Other non-current assets | 276,641 | 10,906 | (124,845 | ) | (142,912 | ) | 19,790 | |||||||||||||
Total assets | $ | 2,040,985 | $ | 2,091,132 | $ | 70,242 | $ | (1,498,415 | ) | $ | 2,703,944 | |||||||||
Liabilities and Stockholders' Equity | ||||||||||||||||||||
Current liabilities | $ | (233,824 | ) | $ | 157,640 | $ | 7,145 | $ | 205,233 | $ | 136,194 | |||||||||
Long-term debt | 532,799 | 143,858 | 1 | (135,988 | ) | 540,670 | ||||||||||||||
Non-current portion of accrued reclamation | — | 100,445 | 4,534 | — | 104,979 | |||||||||||||||
Non-current deferred tax liability | — | 163,328 | — | 10,209 | 173,537 | |||||||||||||||
Other non-current liabilities | 51,047 | 5,641 | 913 | — | 57,601 | |||||||||||||||
Stockholders' equity | 1,690,963 | 1,520,220 | 57,649 | (1,577,869 | ) | 1,690,963 | ||||||||||||||
Total liabilities and stockholders' equity | $ | 2,040,985 | $ | 2,091,132 | $ | 70,242 | $ | (1,498,415 | ) | $ | 2,703,944 | |||||||||
Unaudited Interim Condensed Consolidating Statements of Operations
Three Months Ended September 30, 2019 | ||||||||||||||||||||
Parent | Guarantors | Non-Guarantors | Eliminations | Consolidated | ||||||||||||||||
(in thousands) | ||||||||||||||||||||
Revenues | $ | 1,049 | $ | 144,999 | $ | 15,484 | $ | — | $ | 161,532 | ||||||||||
Cost of sales | (472 | ) | (85,829 | ) | (9,577 | ) | — | (95,878 | ) | |||||||||||
Depreciation, depletion, amortization | — | (47,448 | ) | (3,326 | ) | — | (50,774 | ) | ||||||||||||
General and administrative | (2,951 | ) | (4,722 | ) | (305 | ) | — | (7,978 | ) | |||||||||||
Exploration and pre-development | (3 | ) | (4,315 | ) | (1,371 | ) | — | (5,689 | ) | |||||||||||
Research and development | — | 37 | (90 | ) | — | (53 | ) | |||||||||||||
Loss on derivative contracts | (4,718 | ) | — | — | — | (4,718 | ) | |||||||||||||
Foreign exchange gain (loss) | (3,201 | ) | 5,129 | (1,155 | ) | — | 773 | |||||||||||||
Lucky Friday suspension-related costs | — | (3,722 | ) | — | — | (3,722 | ) | |||||||||||||
Acquisition costs | (100 | ) | (83 | ) | — | — | (183 | ) | ||||||||||||
Equity in earnings of subsidiaries | (6,761 | ) | — | — | 6,761 | — | ||||||||||||||
Other (expense) income | (2,359 | ) | (9,930 | ) | 1,606 | (3,757 | ) | (14,440 | ) | |||||||||||
Income (loss) before income taxes | (19,516 | ) | (5,884 | ) | 1,266 | 3,004 | (21,130 | ) | ||||||||||||
(Provision) benefit from income taxes | — | (625 | ) | (1,518 | ) | 3,757 | 1,614 | |||||||||||||
Net income (loss) | (19,516 | ) | (6,509 | ) | (252 | ) | 6,761 | (19,516 | ) | |||||||||||
Preferred stock dividends | (138 | ) | — | — | — | (138 | ) | |||||||||||||
Income (loss) applicable to common shareholders | (19,654 | ) | (6,509 | ) | (252 | ) | 6,761 | (19,654 | ) | |||||||||||
Net income (loss) | (19,516 | ) | (6,509 | ) | (252 | ) | 6,761 | (19,516 | ) | |||||||||||
Changes in comprehensive income (loss) | (3,288 | ) | — | — | — | (3,288 | ) | |||||||||||||
Comprehensive income (loss) | $ | (22,804 | ) | $ | (6,509 | ) | $ | (252 | ) | $ | 6,761 | $ | (22,804 | ) | ||||||
Condensed Consolidating Balance Sheets
Nine Months Ended September 30, 2019 | ||||||||||||||||||||
Parent | Guarantors | Non-Guarantors | Eliminations | Consolidated | ||||||||||||||||
(in thousands) | ||||||||||||||||||||
Revenues | $ | (136 | ) | $ | 409,339 | $ | 39,118 | $ | — | $ | 448,321 | |||||||||
Cost of sales | (1,190 | ) | (280,397 | ) | (29,615 | ) | — | (311,202 | ) | |||||||||||
Depreciation, depletion, amortization | — | (132,104 | ) | (6,934 | ) | — | (139,038 | ) | ||||||||||||
General and administrative | (12,110 | ) | (13,571 | ) | (1,174 | ) | — | (26,855 | ) | |||||||||||
Exploration and pre-development | (22 | ) | (10,645 | ) | (5,424 | ) | — | (16,091 | ) | |||||||||||
Research and development | — | (521 | ) | (93 | ) | — | (614 | ) | ||||||||||||
Loss on derivative contracts | (2,719 | ) | — | — | — | (2,719 | ) | |||||||||||||
Foreign exchange gain (loss) | 7,820 | (14,636 | ) | 75 | — | (6,741 | ) | |||||||||||||
Lucky Friday suspension-related costs | — | (8,766 | ) | — | — | (8,766 | ) | |||||||||||||
Acquisition costs | (221 | ) | (219 | ) | (153 | ) | — | (593 | ) | |||||||||||
Equity in earnings of subsidiaries | (77,563 | ) | — | — | 77,563 | — | ||||||||||||||
Other (expense) income | (5,438 | ) | (31,573 | ) | 2,308 | (12,589 | ) | (47,292 | ) | |||||||||||
Income (loss) before income taxes | (91,579 | ) | (83,093 | ) | (1,892 | ) | 64,974 | (111,590 | ) | |||||||||||
(Provision) benefit from income taxes | (2 | ) | 6,864 | 558 | 12,589 | 20,009 | ||||||||||||||
Net income (loss) | (91,581 | ) | (76,229 | ) | (1,334 | ) | 77,563 | (91,581 | ) | |||||||||||
Preferred stock dividends | (414 | ) | — | — | — | (414 | ) | |||||||||||||
Income (loss) applicable to common shareholders | (91,995 | ) | (76,229 | ) | (1,334 | ) | 77,563 | (91,995 | ) | |||||||||||
Net income (loss) | (91,581 | ) | (76,229 | ) | (1,334 | ) | 77,563 | (91,581 | ) | |||||||||||
Changes in comprehensive income (loss) | 4,511 | — | — | — | 4,511 | |||||||||||||||
Comprehensive income (loss) | $ | (87,070 | ) | $ | (76,229 | ) | $ | (1,334 | ) | $ | 77,563 | $ | (87,070 | ) | ||||||
As of September 30, 2018 | ||||||||||||||||||||
Parent | Guarantors | Non-Guarantors | Eliminations | Consolidated | ||||||||||||||||
(in thousands) | ||||||||||||||||||||
Assets | ||||||||||||||||||||
Cash and cash equivalents | $ | 28,081 | $ | 6,198 | $ | 26,577 | $ | — | $ | 60,856 | ||||||||||
Other current assets | 15,219 | 42,515 | 79,807 | (68 | ) | 137,473 | ||||||||||||||
Properties, plants, and equipment - net | 1,920 | 1,246,274 | 1,239,235 | — | 2,487,429 | |||||||||||||||
Intercompany receivable (payable) | 256,831 | (222,897 | ) | (138,477 | ) | 104,543 | — | |||||||||||||
Investments in subsidiaries | 1,767,234 | — | — | (1,767,234 | ) | — | ||||||||||||||
Other non-current assets | 149,034 | 4,390 | 11,670 | (140,594 | ) | 24,500 | ||||||||||||||
Total assets | $ | 2,218,319 | $ | 1,076,480 | $ | 1,218,812 | $ | (1,803,353 | ) | $ | 2,710,258 | |||||||||
Liabilities and Stockholders' Equity | ||||||||||||||||||||
Current liabilities | $ | (79,535 | ) | $ | 77,328 | $ | 55,389 | $ | 79,274 | $ | 132,456 | |||||||||
Long-term debt | 534,067 | 4,911 | 137,938 | (134,211 | ) | 542,705 | ||||||||||||||
Non-current portion of accrued reclamation | — | 67,145 | 32,169 | — | 99,314 | |||||||||||||||
Non-current deferred tax liability | — | 16,497 | 159,613 | (11,182 | ) | 164,928 | ||||||||||||||
Other non-current liabilities | 41,718 | 5,784 | 1,284 | — | 48,786 | |||||||||||||||
Shareholders' equity | 1,722,069 | 904,815 | 862,419 | (1,767,234 | ) | 1,722,069 | ||||||||||||||
Total liabilities and stockholders' equity | $ | 2,218,319 | $ | 1,076,480 | $ | 1,248,812 | $ | (1,833,353 | ) | $ | 2,710,258 | |||||||||
As of December 31, 2017 | ||||||||||||||||||||
Parent | Guarantors | Non-Guarantors | Eliminations | Consolidated | ||||||||||||||||
(in thousands) | ||||||||||||||||||||
Assets | ||||||||||||||||||||
Cash and cash equivalents | $ | 103,878 | $ | 31,016 | $ | 51,213 | $ | — | $ | 186,107 | ||||||||||
Other current assets | 47,555 | 47,608 | 40,541 | (575 | ) | 135,129 | ||||||||||||||
Properties, plants, and equipment - net | 1,946 | 1,244,161 | 753,204 | — | 1,999,311 | |||||||||||||||
Intercompany receivable (payable) | 287,310 | (177,438 | ) | (341,182 | ) | 231,310 | — | |||||||||||||
Investments in subsidiaries | 1,358,025 | — | — | (1,358,025 | ) | — | ||||||||||||||
Other non-current assets | 14,409 | 7,289 | 9,283 | (6,370 | ) | 24,611 | ||||||||||||||
Total assets | $ | 1,813,123 | $ | 1,152,636 | $ | 513,059 | $ | (1,133,660 | ) | $ | 2,345,158 | |||||||||
Liabilities and Stockholders' Equity | ||||||||||||||||||||
Current liabilities | $ | (226,576 | ) | $ | 66,550 | $ | 37,671 | $ | 234,485 | $ | 112,130 | |||||||||
Long-term debt | 502,229 | 2,303 | 3,890 | — | 508,422 | |||||||||||||||
Non-current portion of accrued reclamation | — | 67,565 | 11,801 | — | 79,366 | |||||||||||||||
Non-current deferred tax liability | — | 10,120 | 124,352 | (10,120 | ) | 124,352 | ||||||||||||||
Other non-current liabilities | 53,588 | 5,185 | 838 | — | 59,611 | |||||||||||||||
Stockholders' equity | 1,483,882 | 1,000,913 | 334,507 | (1,358,025 | ) | 1,461,277 | ||||||||||||||
Total liabilities and stockholders' equity | $ | 1,813,123 | $ | 1,152,636 | $ | 513,059 | $ | (1,133,660 | ) | $ | 2,345,158 | |||||||||
Condensed Consolidating Statements of Operations
Three Months Ended September 30, 2018 | ||||||||||||||||||||
Parent | Guarantors | Non-Guarantors | Eliminations | Consolidated | ||||||||||||||||
Revised | Revised | |||||||||||||||||||
(in thousands) | ||||||||||||||||||||
Revenues | $ | 5,020 | $ | 124,497 | $ | 14,132 | $ | — | $ | 143,649 | ||||||||||
Cost of sales | (157 | ) | (80,876 | ) | (12,576 | ) | — | (93,609 | ) | |||||||||||
Depreciation, depletion, amortization | — | (41,669 | ) | (1,795 | ) | — | (43,464 | ) | ||||||||||||
General and administrative | (4,802 | ) | (5,082 | ) | (443 | ) | — | (10,327 | ) | |||||||||||
Exploration and pre-development | (1 | ) | (11,227 | ) | (2,378 | ) | — | (13,606 | ) | |||||||||||
Research and development | — | (732 | ) | (537 | ) | — | (1,269 | ) | ||||||||||||
Gain on derivative contracts | 19,460 | — | — | — | 19,460 | |||||||||||||||
Foreign exchange gain (loss) | 4,640 | (7,629 | ) | 777 | — | (2,212 | ) | |||||||||||||
Lucky Friday suspension costs | — | (6,519 | ) | — | — | (6,519 | ) | |||||||||||||
Acquisition costs | (5,741 | ) | (386 | ) | (12 | ) | — | (6,139 | ) | |||||||||||
Equity in earnings of subsidiaries | (54,618 | ) | — | — | 54,618 | — | ||||||||||||||
Other expense | 13,016 | (4,756 | ) | (262 | ) | (19,825 | ) | (11,827 | ) | |||||||||||
Income (loss) before income taxes | (23,183 | ) | (34,379 | ) | (3,094 | ) | 34,793 | (25,863 | ) | |||||||||||
(Provision) benefit from income taxes | (1 | ) | (17,530 | ) | 385 | 19,825 | 2,679 | |||||||||||||
Net income (loss) | (23,184 | ) | (51,909 | ) | (2,709 | ) | 54,618 | (23,184 | ) | |||||||||||
Preferred stock dividends | (138 | ) | — | — | — | (138 | ) | |||||||||||||
Income (loss) applicable to common shareholders | (23,322 | ) | (51,909 | ) | (2,709 | ) | 54,618 | (23,322 | ) | |||||||||||
Net income (loss) | (23,184 | ) | (51,909 | ) | (2,709 | ) | 54,618 | (23,184 | ) | |||||||||||
Changes in comprehensive income (loss) | 3,746 | — | — | — | 3,746 | |||||||||||||||
Comprehensive income (loss) | $ | (19,438 | ) | $ | (51,909 | ) | $ | (2,709 | ) | $ | 54,618 | $ | (19,438 | ) | ||||||
Three Months Ended September 30, 2018 | ||||||||||||||||||||
Parent | Guarantors | Non-Guarantors | Eliminations | Consolidated | ||||||||||||||||
(in thousands) | ||||||||||||||||||||
Revenues | $ | 5,020 | $ | 60,155 | $ | 78,474 | $ | — | $ | 143,649 | ||||||||||
Cost of sales | (157 | ) | (39,733 | ) | (53,719 | ) | — | (93,609 | ) | |||||||||||
Depreciation, depletion, amortization | — | (12,427 | ) | (31,037 | ) | — | (43,464 | ) | ||||||||||||
General and administrative | (4,802 | ) | (4,866 | ) | (659 | ) | — | (10,327 | ) | |||||||||||
Exploration and pre-development | (1 | ) | (4,056 | ) | (9,549 | ) | — | (13,606 | ) | |||||||||||
Research and development | — | (444 | ) | (825 | ) | — | (1,269 | ) | ||||||||||||
Loss on derivative contracts | 19,460 | — | — | — | 19,460 | |||||||||||||||
Foreign exchange gain (loss) | 4,640 | 74 | (6,926 | ) | — | (2,212 | ) | |||||||||||||
Lucky Friday suspension-related costs | — | (5,388 | ) | (1,131 | ) | — | (6,519 | ) | ||||||||||||
Acquisition costs | (5,741 | ) | (245 | ) | (153 | ) | — | (6,139 | ) | |||||||||||
Equity in earnings of subsidiaries | (54,618 | ) | — | — | 54,618 | — | ||||||||||||||
Other (expense) income | 13,016 | 881 | (5,900 | ) | (19,824 | ) | (11,827 | ) | ||||||||||||
Income (loss) before income taxes | (23,183 | ) | (6,049 | ) | (31,425 | ) | 34,794 | (25,863 | ) | |||||||||||
(Provision) benefit from income taxes | (1 | ) | (18,552 | ) | 1,408 | 19,824 | 2,679 | |||||||||||||
Net income (loss) | (23,184 | ) | (24,601 | ) | (30,017 | ) | 54,618 | (23,184 | ) | |||||||||||
Preferred stock dividends | (138 | ) | — | — | — | (138 | ) | |||||||||||||
Income (loss) applicable to common shareholders | (23,322 | ) | (24,601 | ) | (30,017 | ) | 54,618 | (23,322 | ) | |||||||||||
Net income (loss) | (23,184 | ) | (24,601 | ) | (30,017 | ) | 54,618 | (23,184 | ) | |||||||||||
Changes in comprehensive income (loss) | 3,746 | — | 3 | (3 | ) | 3,746 | ||||||||||||||
Comprehensive income (loss) | $ | (19,438 | ) | $ | (24,601 | ) | $ | (30,014 | ) | $ | 54,615 | $ | (19,438 | ) | ||||||
Nine Months Ended September 30, 2018 | ||||||||||||||||||||
Parent | Guarantors | Non-Guarantors | Eliminations | Consolidated | ||||||||||||||||
(in thousands) | ||||||||||||||||||||
Revenues | $ | 8,332 | $ | 205,563 | $ | 216,722 | $ | — | $ | 430,617 | ||||||||||
Cost of sales | 245 | (111,923 | ) | (135,240 | ) | — | (246,918 | ) | ||||||||||||
Depreciation, depletion, amortization | — | (35,683 | ) | (67,652 | ) | — | (103,335 | ) | ||||||||||||
General and administrative | (13,250 | ) | (12,916 | ) | (1,683 | ) | — | (27,849 | ) | |||||||||||
Exploration and pre-development | (128 | ) | (9,059 | ) | (22,037 | ) | — | (31,224 | ) | |||||||||||
Research and development | — | (2,505 | ) | (2,537 | ) | — | (5,042 | ) | ||||||||||||
Loss on derivative contracts | 40,271 | — | — | — | 40,271 | |||||||||||||||
Foreign exchange gain (loss) | (9,795 | ) | — | 12,651 | — | 2,856 | ||||||||||||||
Lucky Friday suspension-related costs | — | (17,206 | ) | (1,131 | ) | — | (18,337 | ) | ||||||||||||
Acquisition costs | (9,041 | ) | (313 | ) | (302 | ) | — | (9,656 | ) | |||||||||||
Equity in earnings of subsidiaries | (31,105 | ) | — | — | 31,105 | — | ||||||||||||||
Other (expense) income | 11,602 | (2,512 | ) | (15,801 | ) | (29,026 | ) | (35,737 | ) | |||||||||||
Income (loss) before income taxes | (2,869 | ) | 13,446 | (17,010 | ) | 2,079 | (4,354 | ) | ||||||||||||
(Provision) benefit from income taxes | (1 | ) | (27,755 | ) | 214 | 29,026 | 1,484 | |||||||||||||
Net income (loss) | (2,870 | ) | (14,309 | ) | (16,796 | ) | 31,105 | (2,870 | ) | |||||||||||
Preferred stock dividends | (414 | ) | — | — | — | (414 | ) | |||||||||||||
Income (loss) applicable to common shareholders | (3,284 | ) | (14,309 | ) | (16,796 | ) | 31,105 | (3,284 | ) | |||||||||||
Net income (loss) | (2,870 | ) | (14,309 | ) | (16,796 | ) | 31,105 | (2,870 | ) | |||||||||||
Changes in comprehensive income (loss) | (3,520 | ) | — | 41 | (41 | ) | (3,520 | ) | ||||||||||||
Comprehensive income (loss) | $ | (6,390 | ) | $ | (14,309 | ) | $ | (16,755 | ) | $ | 31,064 | $ | (6,390 | ) | ||||||
Nine Months Ended September 30, 2018 | ||||||||||||||||||||
Parent | Guarantors | Non-Guarantors | Eliminations | Consolidated | ||||||||||||||||
Revised | Revised | |||||||||||||||||||
(in thousands) | ||||||||||||||||||||
Revenues | $ | 8,332 | $ | 381,556 | $ | 40,729 | $ | — | $ | 430,617 | ||||||||||
Cost of sales | 245 | (219,497 | ) | (27,666 | ) | — | (246,918 | ) | ||||||||||||
Depreciation, depletion, amortization | — | (99,749 | ) | (3,586 | ) | — | (103,335 | ) | ||||||||||||
General and administrative | (13,250 | ) | (13,247 | ) | (1,352 | ) | — | (27,849 | ) | |||||||||||
Exploration and pre-development | (128 | ) | (22,571 | ) | (8,525 | ) | — | (31,224 | ) | |||||||||||
Research and development | — | (3,702 | ) | (1,340 | ) | — | (5,042 | ) | ||||||||||||
Gain/(loss) on derivative contracts | 40,271 | — | — | — | 40,271 | |||||||||||||||
Foreign exchange gain (loss) | (9,795 | ) | 12,230 | 421 | — | 2,856 | ||||||||||||||
Lucky Friday suspension costs | — | (18,337 | ) | — | — | (18,337 | ) | |||||||||||||
Acquisition costs | (9,041 | ) | (454 | ) | (161 | ) | — | (9,656 | ) | |||||||||||
Equity in earnings of subsidiaries | (31,105 | ) | — | — | 31,105 | — | ||||||||||||||
Other (expense) income | 11,602 | (19,034 | ) | 722 | (29,027 | ) | (35,737 | ) | ||||||||||||
Income (loss) before income taxes | (2,869 | ) | (2,805 | ) | (758 | ) | 2,078 | (4,354 | ) | |||||||||||
(Provision) benefit from income taxes | (1 | ) | (26,348 | ) | (1,194 | ) | 29,027 | 1,484 | ||||||||||||
Net income (loss) | (2,870 | ) | (29,153 | ) | (1,952 | ) | 31,105 | (2,870 | ) | |||||||||||
Preferred stock dividends | (414 | ) | — | — | — | (414 | ) | |||||||||||||
Income (loss) applicable to common shareholders | (3,284 | ) | (29,153 | ) | (1,952 | ) | 31,105 | (3,284 | ) | |||||||||||
Net income (loss) | (2,870 | ) | (29,153 | ) | (1,952 | ) | 31,105 | (2,870 | ) | |||||||||||
Changes in comprehensive income (loss) | (3,520 | ) | 38 | — | (38 | ) | (3,520 | ) | ||||||||||||
Comprehensive income (loss) | $ | (6,390 | ) | $ | (29,115 | ) | $ | (1,952 | ) | $ | 31,067 | $ | (6,390 | ) | ||||||
Unaudited Interim Condensed Consolidating Statements of Cash Flows
Nine Months Ended September 30, 2019 | ||||||||||||||||||||
Parent | Guarantors | Non-Guarantors | Eliminations | Consolidated | ||||||||||||||||
| (in thousands) | ||||||||||||||||||||
Cash flows from operating activities | $ | (140,110 | ) | $ | 92,042 | $ | (15,242 | ) | $ | 126,919 | $ | 63,609 | ||||||||
Cash flows from investing activities: | ||||||||||||||||||||
Additions to properties, plants, equipment and mineral interests | — | (56,329 | ) | (41,009 | ) | — | (97,338 | ) | ||||||||||||
Other investing activities, net | 72,128 | 42 | 1,415 | (72,128 | ) | 1,457 | ||||||||||||||
Cash flows from financing activities: | ||||||||||||||||||||
Dividends paid to shareholders | (4,070 | ) | — | — | — | (4,070 | ) | |||||||||||||
Borrowings on debt | 245,000 | — | — | — | 245,000 | |||||||||||||||
Payments on debt | (195,000 | ) | (4,965 | ) | (519 | ) | — | (200,484 | ) | |||||||||||
Other financing activity, net | 34,769 | (38,672 | ) | 55,869 | (54,791 | ) | (2,825 | ) | ||||||||||||
Effect of exchange rates on cash | — | 257 | — | — | 257 | |||||||||||||||
Changes in cash, cash equivalents and restricted cash and cash equivalents | 12,717 | (7,625 | ) | 514 | — | 5,606 | ||||||||||||||
Beginning cash, cash equivalents and restricted cash and cash equivalents | 6,266 | 18,258 | 3,890 | — | 28,414 | |||||||||||||||
Ending cash, cash equivalents and restricted cash and cash equivalents | $ | 18,983 | $ | 10,633 | $ | 4,404 | $ | — | $ | 34,020 | ||||||||||
Nine Months Ended September 30, 2018 | ||||||||||||||||||||
Parent | Guarantors | Non-Guarantors | Eliminations | Consolidated | ||||||||||||||||
Revised | Revised | |||||||||||||||||||
(in thousands) | ||||||||||||||||||||
Cash flows from operating activities | $ | (29,868 | ) | $ | 88,853 | $ | (40,161 | ) | $ | 56,386 | $ | 75,210 | ||||||||
Cash flows from investing activities: | ||||||||||||||||||||
Additions to properties, plants, equipment and mineral interests | 20,710 | (101,147 | ) | (2,848 | ) | — | (83,285 | ) | ||||||||||||
Acquisitions of other companies, net of cash acquired | (139,326 | ) | — | — | (139,326 | ) | ||||||||||||||
Other investing activities, net | (398,101 | ) | 4,309 | — | 431,815 | 38,023 | ||||||||||||||
Cash flows from financing activities: | ||||||||||||||||||||
Dividends paid to shareholders | (3,607 | ) | — | — | — | (3,607 | ) | |||||||||||||
Borrowings on debt | 78,024 | — | — | — | 78,024 | |||||||||||||||
Payments on debt | (47,000 | ) | (41,028 | ) | — | — | (88,028 | ) | ||||||||||||
Other financing activity, net | 443,372 | 26,051 | 16,709 | (488,201 | ) | (2,069 | ) | |||||||||||||
Effect of exchange rates on cash | — | (215 | ) | — | (215 | ) | ||||||||||||||
Changes in cash, cash equivalents and restricted cash and cash equivalents | (75,796 | ) | (23,177 | ) | (26,300 | ) | — | (125,273 | ) | |||||||||||
Beginning cash, cash equivalents and restricted cash and cash equivalents | 103,877 | 46,619 | 36,643 | — | 187,139 | |||||||||||||||
Ending cash, cash equivalents and restricted cash and cash equivalents | $ | 28,081 | $ | 23,442 | $ | 10,343 | $ | — | $ | 61,866 | ||||||||||
Three Months Ended September 30, 2017 | ||||||||||||||||||||
Parent | Guarantors | Non-Guarantors | Eliminations | Consolidated | ||||||||||||||||
(in thousands) | ||||||||||||||||||||
Revenues | $ | (626 | ) | $ | 61,887 | $ | 79,578 | $ | — | $ | 140,839 | |||||||||
Cost of sales | 687 | (29,320 | ) | (39,725 | ) | — | (68,358 | ) | ||||||||||||
Depreciation, depletion, amortization | — | (12,607 | ) | (16,911 | ) | — | (29,518 | ) | ||||||||||||
General and administrative | (4,217 | ) | (4,464 | ) | (848 | ) | — | (9,529 | ) | |||||||||||
Exploration and pre-development | (129 | ) | (4,339 | ) | (4,544 | ) | — | (9,012 | ) | |||||||||||
Research and development | — | (1,130 | ) | — | — | (1,130 | ) | |||||||||||||
Gain on derivative contracts | (11,226 | ) | — | — | — | (11,226 | ) | |||||||||||||
Foreign exchange gain (loss) | 12,153 | — | (17,070 | ) | — | (4,917 | ) | |||||||||||||
Lucky Friday suspension costs | — | (4,780 | ) | — | — | (4,780 | ) | |||||||||||||
Equity in earnings of subsidiaries | (7,369 | ) | — | — | 7,369 | — | ||||||||||||||
Other expense | 11,041 | 1,202 | (4,676 | ) | (14,752 | ) | (7,185 | ) | ||||||||||||
Income (loss) before income taxes | 314 | 6,449 | (4,196 | ) | (7,383 | ) | (4,816 | ) | ||||||||||||
(Provision) benefit from income taxes | — | (1,338 | ) | (8,284 | ) | 14,752 | 5,130 | |||||||||||||
Net income (loss) | 314 | 5,111 | (12,480 | ) | 7,369 | 314 | ||||||||||||||
Preferred stock dividends | (138 | ) | — | — | — | (138 | ) | |||||||||||||
Income (loss) applicable to common shareholders | 176 | 5,111 | (12,480 | ) | 7,369 | 176 | ||||||||||||||
Net income (loss) | 314 | 5,111 | (12,480 | ) | 7,369 | 314 | ||||||||||||||
Changes in comprehensive income (loss) | 7,636 | — | 1,022 | (1,022 | ) | 7,636 | ||||||||||||||
Comprehensive income (loss) | $ | 7,950 | $ | 5,111 | $ | (11,458 | ) | $ | 6,347 | $ | 7,950 | |||||||||
Nine Months Ended September 30, 2017 | ||||||||||||||||||||
Parent | Guarantors | Non-Guarantors | Eliminations | Consolidated | ||||||||||||||||
(in thousands) | ||||||||||||||||||||
Revenues | $ | (3,912 | ) | $ | 215,184 | $ | 206,390 | $ | — | $ | 417,662 | |||||||||
Cost of sales | 353 | (112,908 | ) | (111,982 | ) | — | (224,537 | ) | ||||||||||||
Depreciation, depletion, amortization | — | (41,875 | ) | (45,111 | ) | — | (86,986 | ) | ||||||||||||
General and administrative | (16,407 | ) | (10,877 | ) | (1,760 | ) | — | (29,044 | ) | |||||||||||
Exploration and pre-development | (439 | ) | (8,736 | ) | (12,508 | ) | — | (21,683 | ) | |||||||||||
Research and development | — | (2,125 | ) | — | — | (2,125 | ) | |||||||||||||
Gain/(loss) on derivative contracts | (16,548 | ) | — | — | — | (16,548 | ) | |||||||||||||
Foreign exchange gain (loss) | 22,286 | (43 | ) | (32,501 | ) | — | (10,258 | ) | ||||||||||||
Lucky Friday suspension costs | — | (14,385 | ) | — |
| — | (14,385 | ) | ||||||||||||
Equity in earnings of subsidiaries | (9,708 | ) | — | — | 9,708 | — | ||||||||||||||
Other (expense) income | 24,822 | (1,207 | ) | (14,146 | ) | (38,682 | ) | (29,213 | ) | |||||||||||
Income (loss) before income taxes | 447 | 23,028 | (11,618 | ) | (28,974 | ) | (17,117 | ) | ||||||||||||
(Provision) benefit from income taxes | — | (9,239 | ) | (11,879 | ) | 38,682 | 17,564 | |||||||||||||
Net income (loss) | 447 | 13,789 | (23,497 | ) | 9,708 | 447 | ||||||||||||||
Preferred stock dividends | (414 | ) | — | — | — | (414 | ) | |||||||||||||
Income (loss) applicable to common shareholders | 33 | 13,789 | (23,497 | ) | 9,708 | 33 | ||||||||||||||
Net income (loss) | 447 | 13,789 | (23,497 | ) | 9,708 | 447 | ||||||||||||||
Changes in comprehensive income (loss) | 13,718 | — | 1,780 | (1,780 | ) | 13,718 | ||||||||||||||
Comprehensive income (loss) | $ | 14,165 | $ | 13,789 | $ | (21,717 | ) | $ | 7,928 | $ | 14,165 | |||||||||
Condensed Consolidating Statements of Cash Flows
Nine Months Ended September 30, 2018 | ||||||||||||||||||||
Parent | Guarantors | Non-Guarantors | Eliminations | Consolidated | ||||||||||||||||
Cash flows from operating activities | $ | (52,473 | ) | $ | 63,796 | $ | (15,107 | ) | $ | 78,994 | $ | 75,210 | ||||||||
Cash flows from investing activities: | ||||||||||||||||||||
Additions to properties, plants, and equipment | — | (39,740 | ) | (43,545 | ) | — | (83,285 | ) | ||||||||||||
Acquisition of Klondex, net of cash acquired | (139,326 | ) | — | — | (139,326 | ) | ||||||||||||||
Other investing activities, net | (375,495 | ) | 4,603 | (294 | ) | 409,209 | 38,023 | |||||||||||||
Cash flows from financing activities: | ||||||||||||||||||||
Dividends paid to shareholders | (3,607 | ) | — | — | — | (3,607 | ) | |||||||||||||
Borrowings on debt | 78,024 | — | — | — | 78,024 | |||||||||||||||
Proceeds from (payments on) debt | (47,000 | ) | (3,094 | ) | (37,934 | ) | — | (88,028 | ) | |||||||||||
Other financing activity, net | 464,080 | (50,409 | ) | 72,463 | (488,203 | ) | (2,069 | ) | ||||||||||||
Effect of exchange rates on cash | — | — | (215 | ) | — | (215 | ) | |||||||||||||
Changes in cash, cash equivalents and restricted cash and cash equivalents | (75,797 | ) | (24,844 | ) | (24,632 | ) | — | (125,273 | ) | |||||||||||
Beginning cash, cash equivalents and restricted cash and cash equivalents | 103,878 | 32,048 | 51,213 | — | 187,139 | |||||||||||||||
Ending cash, cash equivalents and restricted cash and cash equivalents | $ | 28,081 | $ | 7,204 | $ | 26,581 | $ | — | $ | 61,866 | ||||||||||
Nine Months Ended September 30, 2017 | ||||||||||||||||||||
Parent | Guarantors | Non-Guarantors | Eliminations | Consolidated | ||||||||||||||||
(in thousands) | ||||||||||||||||||||
Cash flows from operating activities | $ | 35,764 | $ | 41,071 | $ | 21,435 | $ | (24,155 | ) | $ | 74,115 | |||||||||
Cash flows from investing activities: | ||||||||||||||||||||
Additions to properties, plants, and equipment | — | (28,220 | ) | (42,170 | ) | — | (70,390 | ) | ||||||||||||
Acquisitions of other companies, net of cash acquired | — | — | — | — | ||||||||||||||||
Other investing activities, net | 176 | 5,779 | (584 | ) | (5,339 | ) | 32 | |||||||||||||
Cash flows from financing activities: | ||||||||||||||||||||
Dividends paid to shareholders | (3,392 | ) | — | — | — | (3,392 | ) | |||||||||||||
Proceeds from (payments on) debt | — | (4,518 | ) | (1,017 | ) | — | (5,535 | ) | ||||||||||||
Other financing activity, net | (44,762 | ) | (21,500 | ) | 42,909 | 29,494 | 6,141 | |||||||||||||
Effect of exchange rates on cash | — | — | 1,051 | — | 1,051 | |||||||||||||||
Changes in cash, cash equivalents and restricted cash and cash equivalents | (12,214 | ) | (7,388 | ) | 21,624 | — | 2,022 | |||||||||||||
Beginning cash, cash equivalents and restricted cash and cash equivalents | 113,275 | 26,588 | 32,114 | — | 171,977 | |||||||||||||||
Ending cash, cash equivalents and restricted cash and cash equivalents | $ | 101,061 | $ | 19,200 | $ | 53,738 | $ | — | $ | 173,999 | ||||||||||
Item 2. Management's Discussion and Analysis of Financial Condition and Results of Operations
Certain statements contained in this Form 10-Q, including in Management’s Discussion and Analysis of Financial Condition and Results of Operations and Quantitative and Qualitative Disclosure About Market Risk, are intended to be covered by the safe harbor provided for under Section 27A of the Securities Act of 1933, as amended, and Section 21E of the Securities Exchange Act of 1934, as amended. Our forward-looking statements include our current expectations and projections about future results, performance, results of litigation, prospects and opportunities, including reserves and other mineralization. We have tried to identify these forward-looking statements by using words such as “may,” “will,” “expect,” “anticipate,” “believe,” “intend,” “feel,” “plan,” “estimate,” “project,” “forecast” and similar expressions. These forward-looking statements are based on information currently available to us and are expressed in good faith and believed to have a reasonable basis. However, our forward-looking statements are subject to a number of risks, uncertainties and other factors that could cause our actual results, performance, prospects or opportunities to differ materially from those expressed in, or implied by, these forward-looking statements.
These risks, uncertainties and other factors include, but are not limited to, those set forth under Part I, Item 1A. – Business1A – Risk Factors in our annual report filed on Form 10-K for the year ended December 31, 2017,2018, as updated in Part II, Item 1A -– Risk Factors in this quarterly report and in our quarterly reports on Form 10-Q for the quarters ended March 31, 20182019 and June 30, 2018.2019. Given these risks and uncertainties, readers are cautioned not to place undue reliance on our forward-looking statements. All subsequent written and oral forward-looking statements attributable to Hecla Mining Company or to persons acting on our behalf are expressly qualified in their entirety by these cautionary statements. Except as required by federal securities laws, we do not intend to update or revise any forward-looking statements, whether as a result of new information, future events or otherwise.
Overview
Hecla Mining Company and our subsidiaries have provided precious and base metals to the U.S. and worldwide since 1891. We discover, acquire and develop mines and other mineral interests and produce and market concentrates, carbon material and doré containing silver, gold, lead and zinc.
We produce lead, zinc and bulk concentrates and carbon material, which we sell to custom smelters, brokers and brokers,third-party processors, and unrefined doré containing gold and silver, which areis sold to refiners or further refined before sale of the metals to precious metals traders. We are organized into five segments that encompass our operating and development units: Greens Creek, Lucky Friday, Casa Berardi, San Sebastian and Nevada Operations. The map below shows the locations of our operating units, our exploration and pre-development projects, as well as our corporate offices located in Coeur d'Alene, Idaho and Vancouver, British Columbia.

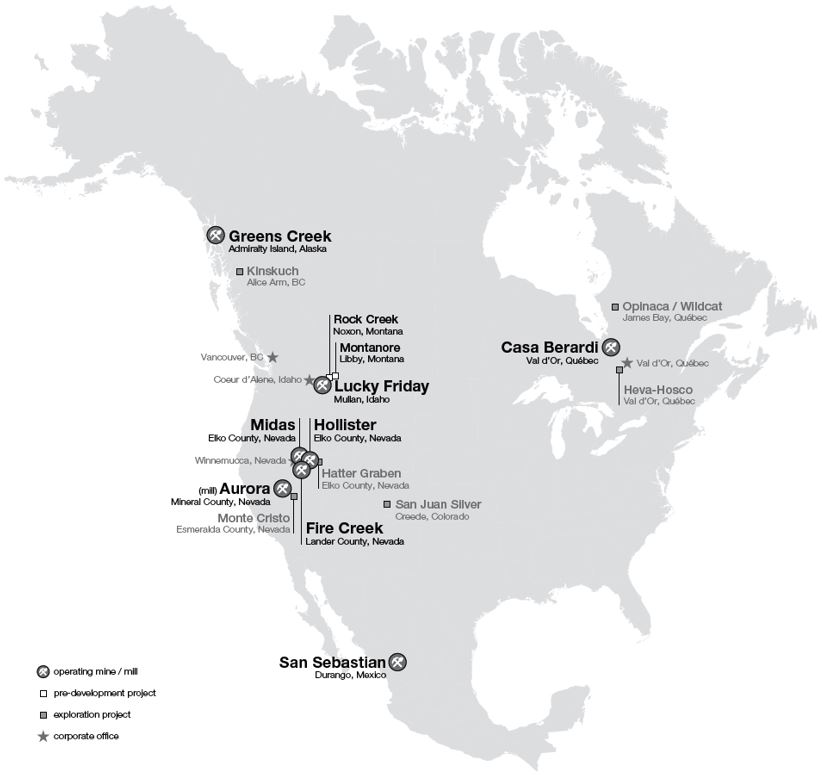
Our current business strategy is to focus our financial and human resources in the following areas:
• | operating our properties safely, in an environmentally responsible manner, and cost-effectively; |
• | fully |
• | continuing to optimize and improve operations at our units, which includes incurring research and development expenditures that may not result in tangible benefits; |
• | expanding our proven and probable reserves and production capacity at our units; |
• | conducting our business with financial stewardship to preserve our financial position in varying metals price environments; |
• |
|
• | maintaining and investing in exploration and pre-development projects in the vicinities of seven mining districts and projects, most of which we believe to be under-explored |
• |
|
|
A number of key factors may impact the execution of our strategy, including metals prices and regulatory issues and metals prices.issues. Metals prices can be very volatile. As discussed in the Critical Accounting Estimates section below, metals prices are influenced by a number of factors beyond our control. Average market prices of gold,silver, lead and zinc in the first nine months of 20182019 were higherlower than their levels from the comparable period last year, with the average silvergold price lower,higher, as illustrated by the table in Results of Operations below. While we believe current global economic and industrial trends could result in continued demand for the metals we produce, prices have been volatile and there can be no assurance that current prices will continue. However, as discussed in Item 3. Quantitative and Qualitative Disclosures About Market Risk below, we utilize financially-settled forward and put option contracts to manage our exposure to changes in prices for the metals we produce.
The total principal amount of our Senior Notes due May 1, 2021 is $506.5 million and they bear interest at a rate of 6.875% per year. The net proceeds from the Senior Notes were primarily used for the acquisition of Aurizon in June 2013. In addition, in March 2018 we entered into a note purchase agreement pursuant to which we issued CAD$40 million (approximately USD$30.8 million at the time of the transaction) in aggregate principal amount of our Series 2018-A Senior Notes due May 1, 2021 (the “RQ Notes”) to Ressources Québec which have an annual coupon rate of 4.68%. The net proceeds from the RQ Notes are required to bewere used for development and expansion of our Casa Berardi unit. Also, we had $50.0 million drawn on our revolving credit facility as of September 30, 2019. See Note 109 of Notes to Condensed Consolidated Financial Statements (Unaudited) for more information on our debt arrangements. As discussed in the Financial Liquidity and Capital Resources section below, we believe that we will be able to meet the obligations associated with the Senior Notes, RQ Notes and RQ Notes;amounts drawn on our revolving credit facility; however, a number of factors could impact our ability to meet the debt obligations and fund our other projects.
On July 20, 2018, we completed the acquisition of all of the issued and outstanding common shares of Klondex for total consideration valued at approximately $414.2$413.9 million at the time of consummation of the acquisition. See Note 1413 of Notes to Condensed Consolidated Financial Statements (Unaudited) for more information. As a result of the acquisition, we own 100% of three producing gold mines, along with interests in various gold exploration properties,land packages in northern Nevada.Nevada totaling approximately 110 square miles and containing operating or previously-operating mines with a history of high-grade gold production, which we believe to be prospective and under-explored. The acquired properties include the Hatter Graben development project near the Hollister mine, where we have started construction of an access drift, the Fire Creek mine, which we believe has been under-developed and has the potential for continued production, and various other gold properties. The acquisition is expected to increasehas increased our annual gold production gives us ownership of operating gold mines and identified gold reserves and other mineralized material, and provides accesshas the potential to a large land package with known mineralization.continue to do so. We are faced with the challenge of integrating the acquisition and assuming operating responsibility for Klondex's mines and other operations. See Part II, Item 1A – Risk Factors – Operating, Development, Exploration and Acquisition Risks in our annual report filed on Form 10-K for the year ended December 31, 2018, as updated in Part II,Item 1A - Risk Factors in our quarterly reportreports filed on Form 10-Q for the quarterquarters ended March 31, 20182019 and June 30, 2019 for risks associated with our acquisition of Klondex. Because total production and capital costs have exceeded sales at our Nevada operations since the acquisition, we conducted a review of our Nevada operations during the second quarter of 2019. The review resulted in a plan for lower anticipated near-term production and capitalized development costs there. See The Nevada Operations section below for more information.
On June 15, 2015, we completed the acquisition of Revett Mining Company, giving us 100% ownership of the Rock Creek project, a significant undeveloped silver and copper deposit in northwestern Montana. In addition, on September 13, 2016, we completed the acquisition of Mines Management, Inc., giving us 100% ownership of the Montanore project, another significant undeveloped silver and copper deposit located approximately 10 miles from our Rock Creek project. Development of Rock Creek and Montanore has been challenged by non-governmental organizations and governmental agenciesmultiple parties at various times, including a recent (i) court order finding a trespass over unpatented mining claims not owned by us at Montanore, (ii) questioning of the validity of the operating permit at Montanore by the Montana Department of Environmental Quality, and (iii) court decision vacating Montanore's most recent water discharge permit renewal. In addition, a State court remanded back to the Montana Department of Natural Resources and Conservation for further consideration a water right permit it had issued for the Rock Creek project. Thus, there can be no assurance that we will be able to obtain the permits required to develop or otherwise move forward with these exploration projects. SeeNote 4 of Notes to Condensed Consolidated Financial Statements (Unaudited) and Part II, Item 1A – Risk Factors in our quarterly report filed on Form 10-Q for the quarter ended March 31, 2019 for more information.
As further discussed in the Lucky Friday Segment section below, the union employees at Lucky Friday have been on strike since March 13, 2017. Production at Lucky Friday was suspended from the start of the strike until July 2017, with limited production by salaried employees commencing at that time. In September 2019, a tentative agreement was reached between the Company and the union negotiating committee. Before the collective bargaining agreement is finalized, it must be ratified by a majority of the union members. If the agreement is voted on and ratified, we would expect the mine to be staffed in stages, and that this would put Lucky Friday on a path back to full production. We believe it would take approximately one year to return to full production after re-staffing starts. We cannot predict whether or when the current tentative agreement will be ratified or if an agreement will otherwise be reached, or, if an agreement is not ratified, how long the strike will last or whether an agreementwhen there will be reached.a return to full production. We expect cash expenditures of about $1.5approximately $1.0 million to $2.0$1.5 million per month to advance engineering and infrastructure for the restart of full production, in addition to costs related to limited interim production. As a result of the strike or other related events, operations at Lucky Friday could continue to be disrupted, which could adversely affect our financial condition and results of operations.
We strive to achieve excellent mine safety and health performance. We seek to implement this goal by: training employees in safe work practices; establishing, following and improving safety standards; investigating accidents, incidents and losses to avoid recurrence; involving employees in the establishment of safety standards; and participating in the National Mining Association’s CORESafety program. We attempt to implement reasonable best practices with respect to mine safety and emergency preparedness. We work with the Mine Safety and Health Administration (“MSHA”) to address issues outlined in its investigations and inspections and continue to evaluate our safety practices.
Another challenge for us is the risk associated with environmental litigation and ongoing reclamation activities. As described in Part I, Item 1A – Risk Factors of our annual report filed on Form 10-K for the year ended December 31, 20172018 and above in Note 54 of Notes to Condensed Consolidated Financial Statements (Unaudited), it is possible that our estimate of these liabilities (and our ability to estimate liabilities in general) may change in the future, affecting our strategic plans. We are involved in various environmental legal matters and the estimate of our environmental liabilities and liquidity needs, as well as our strategic plans, may be significantly impacted as a result of these matters or new matters that may arise. We strive to ensure that our activities are conducted in compliance with applicable laws and regulations and attempt to resolve environmental litigation on terms as favorable to us as possible.
Results of Operations
Sales of products by metal for the three- and nine-month periods ended September 30, 20182019 and 20172018 were as follows:
Three Months Ended | Nine Months Ended | |||||||||||||||
(in thousands) | 2018 | 2017 | 2018 | 2017 | ||||||||||||
Silver | $ | 38,009 | $ | 43,228 | $ | 111,656 | $ | 140,662 | ||||||||
Gold | 82,628 | 73,603 | 233,308 | 203,279 | ||||||||||||
Lead | 7,552 | 6,373 | 27,469 | 28,093 | ||||||||||||
Zinc | 20,990 | 24,327 | 78,714 | 74,692 | ||||||||||||
Less: Smelter and refining charges | (5,530 | ) | (6,692 | ) | (20,530 | ) | (29,064 | ) | ||||||||
Sales of products | $ | 143,649 | $ | 140,839 | $ | 430,617 | $ | 417,662 | ||||||||
Three Months Ended | Nine Months Ended | |||||||||||||||
(in thousands) | 2019 | 2018 | 2019 | 2018 | ||||||||||||
Silver | $ | 40,588 | $ | 38,009 | $ | 122,392 | $ | 111,656 | ||||||||
Gold | 103,889 | 82,628 | 261,734 | 233,308 | ||||||||||||
Lead | 7,114 | 7,552 | 22,809 | 27,469 | ||||||||||||
Zinc | 15,292 | 20,990 | 62,995 | 78,714 | ||||||||||||
Less: Smelter and refining charges | (5,351 | ) | (5,530 | ) | (21,609 | ) | (20,530 | ) | ||||||||
Sales of products | $ | 161,532 | $ | 143,649 | $ | 448,321 | $ | 430,617 | ||||||||
The $2.8 million and $13.0 million increasesfluctuations in sales of products in the third quarter and first nine months of 2018, respectively,2019 compared to the same periods of 20172018 are primarily due to:
• |
|
Three Months Ended | Nine Months Ended | ||||||||||||||||
2018 | 2017 | 2018 | 2017 | ||||||||||||||
Silver - | Ounces produced | 2,523,691 | 3,323,157 | 7,654,118 | 9,500,058 | ||||||||||||
Payable ounces sold | 2,588,478 | 2,540,817 | 6,993,695 | 8,098,652 | |||||||||||||
Gold - | Ounces produced | 72,995 | 63,046 | 191,116 | 171,720 | ||||||||||||
Payable ounces sold | 68,568 | 57,380 | 183,050 | 161,921 | |||||||||||||
Lead - | Tons produced | 4,238 | 5,370 | 15,387 | 18,426 | ||||||||||||
Payable tons sold | 3,986 | 2,936 | 12,599 | 13,612 | |||||||||||||
Zinc - | Tons produced | 12,795 | 14,497 | 42,312 | 43,000 | ||||||||||||
Payable tons sold | 9,282 | 8,444 | 30,072 | 29,269 | |||||||||||||
Three Months Ended | Nine Months Ended | ||||||||||||||||
2019 | 2018 | 2019 | 2018 | ||||||||||||||
Silver - | Ounces produced | 3,251,350 | 2,523,691 | 9,193,246 | 7,654,118 | ||||||||||||
Payable ounces sold | 2,232,691 | 2,588,478 | 7,549,360 | 6,993,695 | |||||||||||||
Gold - | Ounces produced | 77,311 | 72,995 | 198,100 | 191,116 | ||||||||||||
Payable ounces sold | 69,760 | 68,568 | 189,823 | 183,050 | |||||||||||||
Lead - | Tons produced | 6,107 | 4,238 | 17,406 | 15,387 | ||||||||||||
Payable tons sold | 3,817 | 3,986 | 12,628 | 12,599 | |||||||||||||
Zinc - | Tons produced | 15,413 | 12,795 | 42,672 | 42,312 | ||||||||||||
Payable tons sold | 7,878 | 9,282 | 27,234 | 30,072 | |||||||||||||
The difference between what we report as "ounces/tons produced" and "payable ounces/tons sold" is attributable to the difference between the quantities of metals contained in the concentrates we produce versus the portion of those metals actually paid for by our customers according to the terms of our sales contracts. Differences can also arise from inventory changes incidental to shipping schedules, or variances in ore grades which impact the amount of metals contained in concentrates produced and sold.
Lower average silver, gold, lead and zinc prices in the third quarter of 2018 compared to the same period in 2017. For the first nine months of 2018, average gold, lead and zinc prices were higher, while average silver prices were lower, compared to the same period of 2017. These price variances are illustrated in the table below.
• | Higher average realized silver and gold prices, and lower average realized lead and zinc prices, in the third quarter and first nine months of 2019 compared to the same periods in 2018. These price variances are illustrated in the table below. |
Three Months Ended | Nine Months Ended | Three Months Ended | Nine Months Ended | |||||||||||||||||||||||||||||||
2018 | 2017 | 2018 | 2017 | 2019 | 2018 | 2019 | 2018 | |||||||||||||||||||||||||||
Silver – | London PM Fix ($/ounce) | $ | 14.99 | $ | 16.83 | $ | 16.10 | $ | 17.17 | London PM Fix ($/ounce) | $ | 17.02 | $ | 14.99 | $ | 15.83 | $ | 16.10 | ||||||||||||||||
Realized price per ounce | $ | 14.68 | $ | 17.01 | $ | 15.97 | $ | 17.37 | Realized price per ounce | $ | 18.18 | $ | 14.68 | $ | 16.21 | $ | 15.97 | |||||||||||||||||
Gold – | London PM Fix ($/ounce) | $ | 1,213 | $ | 1,278 | $ | 1,283 | $ | 1,251 | London PM Fix ($/ounce) | $ | 1,474 | $ | 1,213 | $ | 1,363 | $ | 1,283 | ||||||||||||||||
Realized price per ounce | $ | 1,205 | $ | 1,283 | $ | 1,275 | $ | 1,255 | Realized price per ounce | $ | 1,475 | $ | 1,205 | $ | 1,374 | $ | 1,275 | |||||||||||||||||
Lead – | LME Final Cash Buyer ($/pound) | $ | 0.95 | $ | 1.06 | $ | 1.06 | $ | 1.02 | LME Final Cash Buyer ($/pound) | $ | 0.92 | $ | 0.95 | $ | 0.90 | $ | 1.06 | ||||||||||||||||
Realized price per pound | $ | 0.95 | $ | 1.09 | $ | 1.09 | $ | 1.03 | Realized price per pound | $ | 0.93 | $ | 0.95 | $ | 0.90 | $ | 1.09 | |||||||||||||||||
Zinc – | LME Final Cash Buyer ($/pound) | $ | 1.15 | $ | 1.34 | $ | 1.37 | $ | 1.26 | LME Final Cash Buyer ($/pound) | $ | 1.06 | $ | 1.15 | $ | 1.18 | $ | 1.37 | ||||||||||||||||
Realized price per pound | $ | 1.13 | $ | 1.44 | $ | 1.31 | $ | 1.28 | Realized price per pound | $ | 0.97 | $ | 1.13 | $ | 1.16 | $ | 1.31 | |||||||||||||||||
Average realized prices typically differ from average market prices primarily because Greens Creek concentrate sales are generally recorded as revenues at the time of shipment at forward prices for the estimated month of settlement, which differ from average market prices. Due to the time elapsed between shipment of concentrates and final settlement with the customers, we must estimate the prices at which sales of our metals will be settled. Previously recorded sales are adjusted to estimated settlement metals prices each period through final settlement. For the third quarter and first nine months of 2018,2019, we recorded net price adjustments to provisional settlements of positive $0.6 million and negative $0.1 million, respectively, compared to net negative price adjustments to provisional settlements of $0.6 million and $3.3 million, respectively, compared to positive price adjustments to provisional settlements of $1.2 million and $0.6 million, respectively, in the third quarter and first nine months of 2017.2018. The price adjustments related to silver, gold, lead and zinc contained in our concentrate shipments were largely offset by gains and losses on forward contracts for those metals for each period. See Note 1211of Notes to Condensed Consolidated Financial Statements (Unaudited) for more information. The gains and losses on these contracts are included in revenues and impact the realized prices for silver, gold, lead and zinc. Realized prices are calculated by dividing gross revenues for each metal (which include the price adjustments and gains and losses on the forward contracts discussed above) by the payable quantities of each metal included in concentrate and doré shipped during the period.
For the third quarter and first nine months of 2018,2019, we recorded losses applicable to common shareholders of $19.7 million ($0.04 per basic common share) and $92.0 million ($0.19 per basic common share), respectively, compared to losses applicable to common shareholders of $23.3 million ($0.05 per basic common share) and $3.3 million ($0.01 per basic common share), respectively, compared to income applicable to common shareholders of $0.2 million ($0.00 per basic common share) and $0.0 million ($0.00 per basic common share), respectively, for the third quarter and first nine months of 2017.2018, respectively. The following factors impacted the results for the third quarter and first nine months of 20182019 compared to the same periods in 2017:2018:
• |
|
Three Months Ended | Nine Months Ended | |||||||||||||||||||||||
September 30, | September 30, | |||||||||||||||||||||||
2019 | 2018 | Variance | 2019 | 2018 | Variance | |||||||||||||||||||
Greens Creek | $ | 18.5 | $ | 13.0 | $ | 5.5 | $ | 54.3 | $ | 63.9 | $ | (9.6 | ) | |||||||||||
Lucky Friday | — | — | — | — | 2.4 | (2.4 | ) | |||||||||||||||||
Casa Berardi | 0.4 | 1.6 | (1.2 | ) | (18.2 | ) | 12.4 | (30.6 | ) | |||||||||||||||
San Sebastian | 2.6 | (0.2 | ) | 2.8 | 2.7 | 9.6 | (6.9 | ) | ||||||||||||||||
Nevada Operations | (6.7 | ) | (7.8 | ) | 1.1 | (40.7 | ) | (7.8 | ) | (32.9 | ) | |||||||||||||
Total gross profit | $ | 14.8 | $ | 6.6 | $ | 8.2 | $ | (1.9 | ) | $ | 80.5 | $ | (82.4 | ) | ||||||||||
See The Greens Creek Segment, The Lucky Friday Segment, The Casa Berardi Segment, The San Sebastian Segment, and The Nevada Operations Segment sections below.
• |
|
• | Losses on disposition of properties, plants, equipment and mineral interests of $24 thousand and $4.7 million in the third quarter and first nine months of 2019, respectively, compared to |
• | Foreign exchange net gain of $0.8 million in the third quarter of 2019 and net loss of $6.7 million in the first nine months of |
• | Lower research and development |
• | Lower general and administrative expense by $2.3 million and $1.0 million in the third quarter and first nine months of 2019, respectively, compared to the same periods of 2018. |
• | Costs of $6.1 million and $9.7 million for the third quarter and first nine months of 2018, respectively, related to the acquisition of Klondex completed in July 2018. |
• | Exploration and pre-development expense |
• |
|
• |
| |
|
| |
|
| |
|
|
The Greens Creek Segment
Dollars are in thousands (except per ounce and per ton amounts) | Three Months Ended | Nine Months Ended | Three Months Ended | Nine Months Ended | ||||||||||||||||||||||||||||
2018 | 2017 | 2018 | 2017 | 2019 | 2018 | 2019 | 2018 | |||||||||||||||||||||||||
Sales | $ | 65,187 | $ | 61,062 | $ | 205,642 | $ | 191,250 | $ | 59,015 | $ | 65,187 | $ | 194,542 | $ | 205,642 | ||||||||||||||||
Cost of sales and other direct production costs | (39,735 | ) | (29,320 | ) | (106,883 | ) | (100,799 | ) | (31,467 | ) | (39,735 | ) | (108,009 | ) | (106,883 | ) | ||||||||||||||||
Depreciation, depletion and amortization | (12,428 | ) | (12,607 | ) | (34,880 | ) | (39,442 | ) | (9,008 | ) | (12,428 | ) | (32,228 | ) | (34,880 | ) | ||||||||||||||||
Cost of sales and other direct production costs and depreciation, depletion and amortization | (52,163 | ) | (41,927 | ) | (141,763 | ) | (140,241 | ) | (40,475 | ) | (52,163 | ) | (140,237 | ) | (141,763 | ) | ||||||||||||||||
Gross profit | $ | 13,024 | $ | 19,135 | $ | 63,879 | $ | 51,009 | $ | 18,540 | $ | 13,024 | $ | 54,305 | $ | 63,879 | ||||||||||||||||
Tons of ore milled | 213,037 | 219,983 | 632,876 | 627,900 | 213,557 | 213,037 | 629,752 | 632,876 | ||||||||||||||||||||||||
Production: | ||||||||||||||||||||||||||||||||
Silver (ounces) | 1,876,417 | 2,344,315 | 5,789,440 | 6,205,659 | 2,544,018 | 1,876,417 | 7,149,035 | 5,789,440 | ||||||||||||||||||||||||
Gold (ounces) | 11,559 | 12,563 | 38,396 | 39,289 | 13,684 | 11,559 | 41,269 | 38,396 | ||||||||||||||||||||||||
Zinc (tons) | 12,695 | 14,325 | 41,673 | 40,697 | 15,073 | 12,695 | 41,330 | 41,673 | ||||||||||||||||||||||||
Lead (tons) | 4,026 | 4,851 | 14,352 | 14,080 | 5,258 | 4,026 | 14,668 | 14,352 | ||||||||||||||||||||||||
Payable metal quantities sold: | ||||||||||||||||||||||||||||||||
Silver (ounces) | 1,928,858 | 1,569,092 | 5,113,799 | 4,930,946 | 1,565,873 | 1,928,858 | 5,545,422 | 5,113,799 | ||||||||||||||||||||||||
Gold (ounces) | 11,613 | 7,862 | 33,402 | 30,920 | 9,863 | 11,613 | 32,466 | 33,402 | ||||||||||||||||||||||||
Zinc (tons) | 9,282 | 8,445 | 29,232 | 27,582 | 7,218 | 9,282 | 26,213 | 29,232 | ||||||||||||||||||||||||
Lead (tons) | 3,986 | 2,935 | 11,169 | 10,015 | 3,045 | 3,986 | 10,199 | 11,169 | ||||||||||||||||||||||||
Ore grades: | ||||||||||||||||||||||||||||||||
Silver ounces per ton | 11.65 | 13.65 | 11.94 | 12.84 | 15.01 | 11.65 | 14.28 | 11.94 | ||||||||||||||||||||||||
Gold ounces per ton | 0.09 | 0.09 | 0.09 | 0.10 | 0.10 | 0.09 | 0.10 | 0.09 | ||||||||||||||||||||||||
Zinc percent | 6.87 | 7.47 | 7.58 | 7.49 | 7.70 | % | 6.87 | % | 7.28 | % | 7.58 | % | ||||||||||||||||||||
Lead percent | 2.40 | 2.77 | 2.84 | 2.83 | 3.00 | % | 2.40 | % | 2.86 | % | 2.84 | % | ||||||||||||||||||||
Mining cost per ton | $ | 68.76 | $ | 69.46 | $ | 69.19 | $ | 69.64 | $ | 81.16 | $ | 68.76 | $ | 80.15 | $ | 69.19 | ||||||||||||||||
Milling cost per ton | $ | 31.97 | $ | 31.01 | $ | 32.73 | $ | 32.38 | $ | 36.67 | $ | 31.97 | $ | 35.89 | $ | 32.73 | ||||||||||||||||
Total Cash Cost, After By-product Credits, Per Silver Ounce (1) | $ | 1.92 | $ | (0.15 | ) | $ | (2.22 | ) | $ | 0.73 | $ | 2.05 | $ | 1.92 | $ | 1.67 | $ | (2.22 | ) | |||||||||||||
All-In Sustaining Costs ("AISC"), After By-Product Credits, per Silver Ounce (1) | $ | 9.20 | $ | 4.47 | $ | 4.71 | $ | 5.60 | $ | 6.05 | $ | 9.20 | $ | 5.28 | $ | 4.71 | ||||||||||||||||
(1) | A reconciliation of these non-GAAP measures to cost of sales and other direct production costs and depreciation, depletion and amortization, the most comparable GAAP measure, can be found below in Reconciliation of Cost of Sales and Other Direct Production Costs and Depreciation, Depletion and Amortization (GAAP) to Cash Cost, Before By-product Credits and Cash Cost, After By-product Credits (non-GAAP) and All-In Sustaining Cost, Before By-product Credits and |
The $6.1$5.5 million decreaseincrease in gross profit in the third quarter of 20182019 compared to the same period in 20172018 is due to lowerhigher realized prices for all four payable metals produced,silver and gold, partially offset by higherlower sales volumes.volumes due to the timing of shipments and lower zinc and lead prices. The $12.9$9.6 million increasedecrease in gross profit during the first nine months of 20182019 compared to the same 20172018 period was primarily a result of higher metals sales volumes due to the timing of concentrate shipmentscosts and higher gold,lower zinc and lead prices, partially offset by lowerhigher realized silver and gold prices.
2019 and by 16% and 10%, respectively, for the first nine months of 2019 compared to the same periods of 2018. The increases were mainly due to higher costs for labor, power and consumables, with the variances for the nine-month period also due to lower ore tonnage.
The chart below illustrates the factors contributing to the variances in Cash Cost, After By-product Credits, Per Silver Ounce for the third quarter and first nine months of 20182019 versus the same periods in 2017:2018:

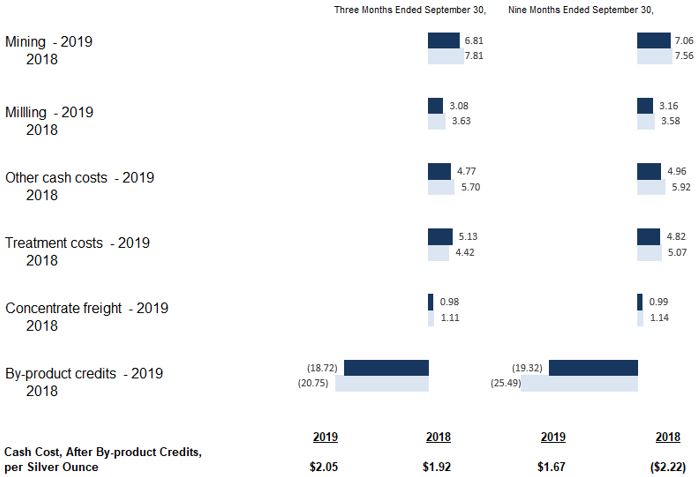
The following table summarizes the components of Cash Cost, After By-product Credits, per Silver Ounce:
Three Months Ended | Nine Months Ended | |||||||||||||||
2018 | 2017 | 2018 | 2017 | |||||||||||||
Cash Cost, Before By-product Credits, per Silver Ounce | $ | 22.67 | $ | 20.75 | $ | 23.27 | $ | 22.94 | ||||||||
By-product credits | (20.75 | ) | (20.90 | ) | (25.49 | ) | (22.21 | ) | ||||||||
Cash Cost, After By-product Credits, per Silver Ounce | $ | 1.92 | $ | (0.15 | ) | $ | (2.22 | ) | $ | 0.73 | ||||||
Three Months Ended | Nine Months Ended | |||||||||||||||
2019 | 2018 | 2019 | 2018 | |||||||||||||
Cash Cost, Before By-product Credits, per Silver Ounce | $ | 20.77 | $ | 22.67 | $ | 20.99 | $ | 23.27 | ||||||||
By-product credits | (18.72 | ) | (20.75 | ) | (19.32 | ) | (25.49 | ) | ||||||||
Cash Cost, After By-product Credits, per Silver Ounce | $ | 2.05 | $ | 1.92 | $ | 1.67 | $ | (2.22 | ) | |||||||
The following table summarizes the components of AISC, After By-product Credits, per Silver Ounce:
Three Months Ended September 30, | Nine Months Ended September 30, | Three Months Ended September 30, | Nine Months Ended September 30, | |||||||||||||||||||||||||||||
2018 | 2017 | 2018 | 2017 | 2019 | 2018 | 2019 | 2018 | |||||||||||||||||||||||||
AISC, Before By-product Credits, per Silver Ounce | $ | 29.95 | $ | 25.37 | $ | 30.20 | $ | 27.81 | $ | 24.77 | $ | 29.95 | $ | 24.60 | $ | 30.20 | ||||||||||||||||
By-product credits | (20.75 | ) | (20.90 | ) | (25.49 | ) | (22.21 | ) | (18.72 | ) | (20.75 | ) | (19.32 | ) | (25.49 | ) | ||||||||||||||||
AISC, After By-product Credits, per Silver Ounce | $ | 9.20 | $ | 4.47 | $ | 4.71 | $ | 5.60 | $ | 6.05 | $ | 9.20 | $ | 5.28 | $ | 4.71 | ||||||||||||||||
The increase in Cash Cost, After By-product Credits, per Silver Ounce for the third quarter and first nine months of 20182019 was due to lower silver production. The increase in AISC, After By-Product Credits,by-product credits per Silver Ounce in the third quarter of 2018 was due to lower silver production and higher capital spending. The decrease in Cash Cost, After By-product Credits, per Silver Ounce in the first nine months of 2018 was primarily the result of higher by-product credits,ounce, partially offset by lower silver production.mining, milling and other costs on a per ounce basis. The decrease in AISC, After By-Product Credits, per Silver Ounce in the third quarter of 20182019 was due to the same factors,lower capital and exploration spending and lower production costs on a per ounce basis, partially offset by higherlower by-product credits. The increase in AISC, After By-Product Credits, per Silver Ounce in the first nine months of 2019 was due to lower by-product credits, partially offset by lower capital spending.and exploration spending and lower production costs on a per ounce basis.
Mining and milling costs increaseddecreased in the third quarter and first nine months of 20182019 compared to 20172018 on a per-ounce basis due primarily to lowerhigher silver production resulting from reducedincreased silver grades.
Other cash costs per ounce for the third quarter and first nine months of 20182019 were higherlower compared to 20172018 on a per-ounce basis due to the effect of lowerhigher silver production.
Treatment costs per ounce were lowerhigher in the third quarter andof 2019 compared to 2018 due to higher silver prices, partially offset by higher silver production. Treatment costs per ounce were lower in first nine months of 20182019 compared to 20172018 as a result of improved payment terms from smelters, partially offset by lowerhigher silver production. Treatment costs were alsoare impacted by lower silver prices, as treatment costs include the value of silver not payable to us through the smelting process. The silver not payable to us is either recovered by the smelters through further processing or ultimately not recovered and included in the smelters' waste material.
By-product credits per ounce were lowerincreased in the third quarter of 2019 compared to the third quarter of 2018, but were lower on a per-silver ounce basis due to the impact of higher silver production. By-product credits decreased in the first nine months of 2019 compared to the same period of 20172018 due to lower gold,lead and zinc and lead prices, and production. By-product creditshigher silver production also reduced the credit per ounce were higher in the first nine months of 2018 compared to 2017 due to higher gold, zinc and lead prices.silver ounce.
The difference between what we report as "production" and "payable metal quantities sold" is attributable to the difference between the quantities of metals contained in the concentrates we produce versus the portion of those metals actually paid for by our customers according to the terms of our sales contracts. Differences can also arise from inventory changes incidental to shipping schedules, or variances in ore grades which impact the amount of metals contained in concentrates produced and sold.
While revenue from zinc, lead and gold by-products is significant, we believe that identification of silver as the primary product of the Greens Creek unit is appropriate because:
• | silver has historically accounted for a higher proportion of revenue than any other metal and is expected to do so in the future; |
• | we have historically presented Greens Creek as a producer primarily of silver, based on the original analysis that justified putting the project into production, and believe that consistency in disclosure is important to our investors regardless of the relationships of metals prices and production from year to year; |
• | metallurgical treatment maximizes silver recovery; |
• | the Greens Creek deposit is a massive sulfide deposit containing an unusually high proportion of silver; and |
• | in most of its working areas, Greens Creek utilizes selective mining methods in which silver is the metal targeted for highest recovery. |
Likewise, we believe the identification of gold, lead and zinc as by-product credits is appropriate because of their lower economic value compared to silver and due to the fact that silver is the primary product we intend to produce. In addition, we have not consistently received sufficient revenue from any single by-product metal to warrant classification of such as a co-product.
We periodically review our revenues to ensure that reporting of primary products and by-products is appropriate. Because we consider zinc, lead and gold to be by-products of our silver production, the values of these metals offset operating costs within our calculations of Cash Cost, After By-product Credits, per Silver Ounce and AISC, After By-product Credits, per Silver Ounce.
The Lucky Friday Segment
Dollars are in thousands (except per ounce and per ton amounts) | Three Months Ended | Nine Months Ended | ||||||||||||||
2018 | 2017 | 2018 | 2017 | |||||||||||||
Sales | $ | (11 | ) | $ | 199 | $ | 8,253 | $ | 20,022 | |||||||
Cost of sales and other direct production costs | (1 | ) | — | (5,041 | ) | (12,109 | ) | |||||||||
Depreciation, depletion and amortization | — | — | (803 | ) | (2,433 | ) | ||||||||||
Cost of sales and other direct production costs and depreciation, depletion and amortization | (1 | ) | — | (5,844 | ) | (14,542 | ) | |||||||||
Gross profit (loss) | $ | (12 | ) | $ | 199 | $ | 2,409 | $ | 5,480 | |||||||
Tons of ore milled | 3,006 | 7,302 | 16,012 | 64,371 | ||||||||||||
Production: | ||||||||||||||||
Silver (ounces) | 31,639 | 88,298 | 156,015 | 769,080 | ||||||||||||
Lead (tons) | 212 | 518 | 1,035 | 4,346 | ||||||||||||
Zinc (tons) | 100 | 172 | 639 | 2,303 | ||||||||||||
Payable metal quantities sold: | ||||||||||||||||
Silver (ounces) | — | — | 232,867 | 641,004 | ||||||||||||
Lead (tons) | — | — | 1,430 | 3,596 | ||||||||||||
Zinc (tons) | — | — | 840 | 1,688 | ||||||||||||
Ore grades: | ||||||||||||||||
Silver ounces per ton | 11.41 | 12.87 | 11.06 | 12.45 | ||||||||||||
Lead percent | 8.06 | 7.68 | 7.21 | 7.12 | ||||||||||||
Zinc percent | 3.64 | 3.21 | 4.28 | 3.90 | ||||||||||||
Mining cost per ton | $ | — | $ | 150.89 | $ | 87.79 | $ | 112.60 | ||||||||
Milling cost per ton | $ | — | $ | 13.15 | $ | 14.26 | $ | 22.93 | ||||||||
Cash Cost, After By-product Credits, per Silver Ounce (1) | $ | — | $ | 11.60 | $ | — | $ | 6.58 | ||||||||
AISC, After By-product Credits, per Silver Ounce (1) | $ | — | $ | 13.37 | $ | — | $ | 12.21 | ||||||||
|
|
Gross profit decreased by $0.2 million and $3.1 million in the third quarter and first nine months of 2018, respectively, compared to the same periods in 2017. The variances are primarily due to the low level of metal production in the third quarter of 2018 as a result of the ongoing strike by unionized employees starting in mid-March 2017, discussed further below, and the lack of concentrate shipments during the quarter. Silver production was also impacted by lower ore grades in the third quarter and first nine months of 2018. Gross profit for the first nine months of 2018 was also impacted by lower silver prices, partially offset by higher lead and zinc prices.
Mining and milling cost per ton were lower by 22% and 38%, respectively, in the first nine months of 2018 compared to the same period in 2017, as costs not directly related to mining and processing ore have been classified as suspension costs during the strike period and excluded from the calculations of mining and milling cost per ton. Mining and milling cost per ton during the strike period are not indicative of future operating results under full production.
Dollars are in thousands (except per ounce and per ton amounts) | Three Months Ended | Nine Months Ended | ||||||||||||||
2019 | 2018 | 2019 | 2018 | |||||||||||||
Sales | $ | 4,017 | $ | (11 | ) | $ | 11,150 | $ | 8,253 | |||||||
Cost of sales and other direct production costs | (3,718 | ) | (1 | ) | (10,258 | ) | (5,041 | ) | ||||||||
Depreciation, depletion and amortization | (300 | ) | — | (891 | ) | (803 | ) | |||||||||
Cost of sales and other direct production costs and depreciation, depletion and amortization | (4,018 | ) | (1 | ) | (11,149 | ) | (5,844 | ) | ||||||||
Gross profit (loss) | $ | (1 | ) | $ | (12 | ) | $ | 1 | $ | 2,409 | ||||||
Tons of ore milled | 13,254 | 3,006 | 40,754 | 16,012 | ||||||||||||
Production: | ||||||||||||||||
Silver (ounces) | 115,682 | 31,639 | 416,456 | 156,015 | ||||||||||||
Lead (tons) | 849 | 212 | 2,738 | 1,035 | ||||||||||||
Zinc (tons) | 340 | 100 | 1,342 | 639 | ||||||||||||
Payable metal quantities sold: | ||||||||||||||||
Silver (ounces) | 107,992 | — | 372,103 | 232,867 | ||||||||||||
Lead (tons) | 771 | — | 2,428 | 1,430 | ||||||||||||
Zinc (tons) | 660 | — | 1,021 | 840 | ||||||||||||
Ore grades: | ||||||||||||||||
Silver ounces per ton | 9.33 | 11.41 | 10.95 | 11.06 | ||||||||||||
Lead percent | 7.01 | % | 8.06 | % | 7.40 | % | 7.21 | % | ||||||||
Zinc percent | 3.13 | % | 3.64 | % | 3.91 | % | 4.28 | % | ||||||||
The chart below illustratesGross profit decreased by $2.4 million in the factors contributing to the variances in Cash Cost, After By-product Credits, Per Silver Ounce for the third quarter and first nine months of 2017. Cash Cost, After By-product Credits, per Silver Ounce and AISC, After By-product Credits, per Silver Ounce, are not presented for the third quarter and first nine months of 2018, as production was limited due2019 compared to the strike and results are not comparable to those from the third quarter and first nine months of 2017, and are not indicative of future operating results under full production.
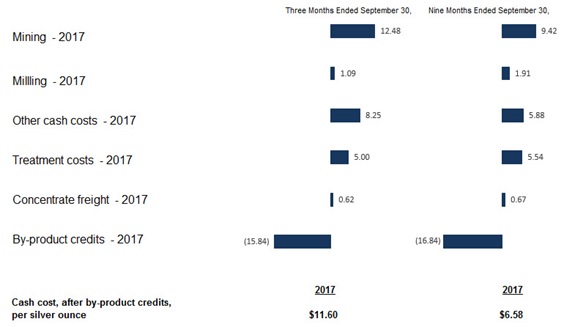
The following table summarizes the components of Cash Cost, After By-product Credits, per Silver Ounce:
Three Months Ended | Nine Months Ended | |||||||
September 30, 2017 | ||||||||
Cash Cost, Before By-product Credits, per Silver Ounce | $ | 27.44 | $ | 23.42 | ||||
By-product credits | (15.84 | ) | (16.84 | ) | ||||
Cash Cost, After By-product Credits, per Silver Ounce | $ | 11.60 | $ | 6.58 | ||||
The following table summarizes the components of AISC, After By-product Credits, per Silver Ounce:
Three Months Ended | Nine Months Ended | |||||||
September 30, 2017 | ||||||||
AISC, Before By-product Credits, per Silver Ounce | $ | 29.21 | $ | 29.05 | ||||
By-product credits | (15.84 | ) | (16.84 | ) | ||||
AISC, After By-product Credits, per Silver Ounce | $ | 13.37 | $ | 12.21 | ||||
Similarsame period in 2018 due primarily to the Greens Creek segment,classification of the difference between what we reportmargin on sales as “production” and “payable metal quantities sold” is due essentially to the difference between the quantities of metals containedoffsetting suspension costs in the concentrates we produce versus the portion of those metals actually paid for by our customers according to the terms of our sales contracts.
While value from lead and zinc is significant, we believe that identification of silver as the primary product of the Lucky Friday unit is appropriate because:
|
| |
|
| |
|
|
Likewise, we believe the identification of lead and zinc as by-product credits is appropriate because of their lower economic value compared to silver and due to the fact that silver is the primary product we intend to produce. In addition, we do not receive sufficient revenue from any single by-product metal to warrant classification of such as a co-product.
We periodically review our revenues to ensure that reporting of primary products and by-products is appropriate. Because we consider zinc and lead to be by-products of our silver production, the values of these metals offset operating costs within our calculations of Cash Cost, After By-product Credits, per Silver Ounce and AISC, After By-product Credits, per Silver Ounce.
2019 period. Many of the employees at our Lucky Friday unit are represented by a union, and the most recent collective bargaining agreement with the union expired on April 30, 2016. On February 19, 2017, the unionized employees voted against our contractthe Company's offer, and on March 13, 2017 went on strike, and have been on strike since that time. Production at Lucky Friday was suspended from the start of the strike, until limited production by salaried personnel commenced in July 2017. Salaried personnel and certain hourly personnel who are working despite the strike have continued to perform limited production and capital improvements. Suspension costs during the strike totaled $13.5$5.7 million and $11.5$13.5 million in the first nine months of 20182019 and 2017,2018, respectively, which are combined with non-cash depreciation expense of $3.1 million and $3.7 million, and $2.9 million, respectively for those periods, in a separate line item on our consolidated statements of operations. These suspension costs are excluded from the calculation of gross profit (to the extent not offset as described above), Cash Cost, After By-product Credits, per Silver Ounce and AISC, After By-product Credits, per Silver Ounce, when presented. In September 2019, a tentative agreement was reached between the Company and the union negotiating committee. Before the collective bargaining agreement is finalized, it must be ratified by a majority of the union members. If the agreement is voted on and ratified, we would expect the mine to be staffed in stages, and that this would put Lucky Friday on a path back to full production. We believe it would take approximately one year to return to full production after re-staffing starts. We cannot predict whether or when the current tentative agreement will be ratified or if an agreement will otherwise be reached, or, if an agreement is not ratified, how long the strike will last or whether an agreementwhen there will be reached.a return to full production. As a result of the strike or other related events, operations at Lucky Friday could continue to be disrupted, which could adversely affect our financial condition and results of operations. If the strike continues for a further extended period or it is determined an eventual resolution is unlikely, it may be appropriate in the future to review the carrying value of properties, plants, equipment and mineral interests at Lucky Friday. Under such review, if estimated undiscounted cash flows from Lucky Friday were less than its carrying value, an impairment loss would be recognized for the difference between the carrying value and the estimated fair value. The carrying value of properties, plants, equipment and mineral interests at Lucky Friday as of September 30, 20182019 was approximately $428.8$437.0 million. However, Lucky Friday has significant identified reserves and mineralized material and a current estimated mine life of approximately 2217 years.
On April 30, 2018, we settled with the National Labor Relations Board ("NLRB") an unfair labor practice claim made by the union. As part of the settlement, Hecla Limited rescinded its last, best and final contract offer implemented in March 2017. On May 4, 2018, we gave notice to the union that the parties to the labor dispute are at impasse, and implemented portions of our revised final offer presented in December 2017.
See Note 54 of Notes to Condensed Consolidated Financial Statements (Unaudited) for contingenciesa contingency related to various events occurringgroundwater monitoring at the Lucky Friday mine in prior periods.
The Casa Berardi Segment
Dollars are in thousands (except per ounce and per ton amounts) | Three Months Ended | Nine Months Ended | Three Months Ended | Nine Months Ended | ||||||||||||||||||||||||||||
2018 | 2017 | 2018 | 2017 | 2019 | 2018 | 2019 | 2018 | |||||||||||||||||||||||||
Sales | $ | 52,850 | $ | 53,989 | $ | 164,501 | $ | 139,524 | $ | 53,453 | $ | 52,850 | $ | 139,015 | $ | 164,501 | ||||||||||||||||
Cost of sales and other direct production costs | (31,213 | ) | (32,999 | ) | (97,271 | ) | (95,288 | ) | (33,916 | ) | (31,213 | ) | (103,433 | ) | (97,271 | ) | ||||||||||||||||
Depreciation, depletion and amortization | (20,054 | ) | (16,270 | ) | (54,879 | ) | (43,075 | ) | (19,090 | ) | (20,054 | ) | (53,806 | ) | (54,879 | ) | ||||||||||||||||
Cost of sales and other direct production costs and depreciation, depletion and amortization | (51,267 | ) | (49,269 | ) | (152,150 | ) | (138,363 | ) | (53,006 | ) | (51,267 | ) | (157,239 | ) | (152,150 | ) | ||||||||||||||||
Gross profit (loss) | $ | 1,583 | $ | 4,720 | $ | 12,351 | $ | 1,161 | $ | 447 | $ | 1,583 | $ | (18,224 | ) | $ | 12,351 | |||||||||||||||
Tons of ore milled | 353,840 | 326,145 | 1,052,326 | 949,946 | 337,351 | 353,840 | 1,014,698 | 1,052,326 | ||||||||||||||||||||||||
Production: | �� | |||||||||||||||||||||||||||||||
Gold (ounces) | 43,981 | 44,141 | 126,880 | 113,209 | 36,547 | 43,981 | 99,616 | 126,880 | ||||||||||||||||||||||||
Silver (ounces) | 9,559 | 9,659 | 30,748 | 26,681 | 6,637 | 9,559 | 21,041 | 30,748 | ||||||||||||||||||||||||
Payable metal quantities sold: | ||||||||||||||||||||||||||||||||
Gold (ounces) | 43,682 | 42,053 | 128,327 | 111,046 | 35,811 | 43,682 | 101,071 | 128,327 | ||||||||||||||||||||||||
Silver (ounces) | 9,026 | 8,725 | 31,530 | 26,952 | 7,190 | 9,026 | 20,552 | 31,530 | ||||||||||||||||||||||||
Ore grades: | ||||||||||||||||||||||||||||||||
Gold ounces per ton | 0.140 | 0.153 | 0.138 | 0.137 | 0.128 | 0.140 | 0.120 | 0.138 | ||||||||||||||||||||||||
Silver ounces per ton | 0.03 | 0.03 | 0.03 | 0.03 | 0.02 | 0.03 | 0.03 | 0.03 | ||||||||||||||||||||||||
Mining cost per ton | $ | 65.97 | $ | 82.95 | $ | 72.15 | $ | 81.95 | $ | 80.67 | $ | 65.97 | $ | 80.97 | $ | 72.15 | ||||||||||||||||
Milling cost per ton | $ | 15.05 | $ | 16.19 | $ | 15.91 | $ | 16.28 | $ | 18.39 | $ | 15.05 | $ | 17.50 | $ | 15.91 | ||||||||||||||||
Cash Cost, After By-product Credits, per Gold Ounce (1) | $ | 686 | $ | 750 | $ | 760 | $ | 858 | $ | 966 | $ | 686 | $ | 1,055 | $ | 760 | ||||||||||||||||
AISC, After By-product Credits, per Gold Ounce (1) | $ | 896 | $ | 1,091 | $ | 1,004 | $ | 1,226 | $ | 1,348 | $ | 896 | $ | 1,373 | $ | 1,004 | ||||||||||||||||
(1) | A reconciliation of these non-GAAP measures to cost of sales and other direct production costs and depreciation, depletion and amortization, the most comparable GAAP measure, can be found below in Reconciliation of Cost of Sales and Other Direct Production Costs and Depreciation, Depletion and Amortization (GAAP) to Cash Cost, Before By-product Credits and Cash Cost, After By-product Credits (non-GAAP) and All-In Sustaining Cost, Before By-product Credits and All-In Sustaining Cost, After By-product Credits (non-GAAP). |
Gross profit decreased by $3.1$1.1 million and increased by $11.2$30.6 million for the third quarter and first nine months of 2018,2019, respectively, compared to the same periods in 2017.2018. The decrease for the third quarter wasdecreases were primarily due to lower gold production due tovolume resulting from reduced mill throughput, average gold grades and recoveries. The lower gold prices. The increasegrades were as expected, and the decrease in gross profit for the first nine months of 2018 compared to 2017 was primarily due to higher gold production, due to increased mill throughput and recoveries resulted from planned adjustments to a number of mill components to accommodate a higher gold prices.throughput, and the requirement for a new carbon-in-leach tank drivetrain, which was installed in May 2019. We anticipate increased production in the fourth quarter of 2019.
Mining costs per ton were lowerhigher by 20%22% and 12% and milling unit costs decreased by 7% and 2%, respectively, in the third quarter and first nine months of 2018,2019, and milling costs were higher by 22% and 10% in the third quarter and first nine months of 2019, respectively, compared to the same periods in 2017,2018. The increases were due primarily to higherlower ore production.
The chart below illustrates the factors contributing to Cash Cost, After By-product Credits, Per Gold Ounce for the third quarter and first nine months of 20182019 and 2017:2018:
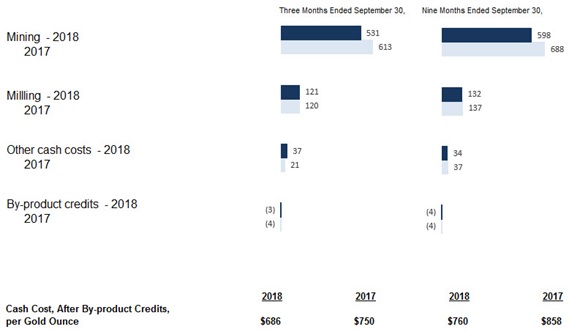

The following table summarizes the components of Cash Cost, After By-product Credits, per Gold Ounce:
Three Months Ended | Nine Months Ended | |||||||||||||||
2018 | 2017 | 2018 | 2017 | |||||||||||||
Cash Cost, Before By-product Credits, per Gold Ounce | $ | 689 | $ | 754 | $ | 764 | $ | 862 | ||||||||
By-product credits | (3 | ) | (4 | ) | (4 | ) | (4 | ) | ||||||||
Cash Cost, After By-product Credits, per Gold Ounce | $ | 686 | $ | 750 | $ | 760 | $ | 858 | ||||||||
Three Months Ended | Nine Months Ended | |||||||||||||||
2019 | 2018 | 2019 | 2018 | |||||||||||||
Cash Cost, Before By-product Credits, per Gold Ounce | $ | 969 | $ | 689 | $ | 1,058 | $ | 764 | ||||||||
By-product credits | (3 | ) | (3 | ) | (3 | ) | (4 | ) | ||||||||
Cash Cost, After By-product Credits, per Gold Ounce | $ | 966 | $ | 686 | $ | 1,055 | $ | 760 | ||||||||
The following table summarizes the components of AISC, After By-product Credits, per Gold Ounce:
Three Months Ended September 30, | Nine Months Ended September 30, | |||||||||||||||
2018 | 2017 | 2018 | 2017 | |||||||||||||
AISC, Before By-product Credits, per Gold Ounce | $ | 899 | $ | 1,095 | $ | 1,008 | $ | 1,230 | ||||||||
By-product credits | (3 | ) | (4 | ) | (4 | ) | (4 | ) | ||||||||
AISC, After By-product Credits, per Gold Ounce | $ | 896 | $ | 1,091 | $ | 1,004 | $ | 1,226 | ||||||||
Three Months Ended September 30, | Nine Months Ended September 30, | |||||||||||||||
2019 | 2018 | 2019 | 2018 | |||||||||||||
AISC, Before By-product Credits, per Gold Ounce | $ | 1,351 | $ | 899 | $ | 1,376 | $ | 1,008 | ||||||||
By-product credits | (3 | ) | (3 | ) | (3 | ) | (4 | ) | ||||||||
AISC, After By-product Credits, per Gold Ounce | $ | 1,348 | $ | 896 | $ | 1,373 | $ | 1,004 | ||||||||
The decreaseincrease in Cash Cost, After By-product Credits, per Gold Ounce for the third quarter and first nine months of 20182019 compared to the same periods of 20172018 was primarily due to lower stripping costs, with the nine-month period also impacted by higher gold production. The same factors, along with lower capital and exploration spending, resultedincrease in AISC, After By-product Credits, per Gold Ounce that was alsodue to lower in the third quartergold production and first nine months of 2018 compared to the same periods of 2017.higher capital spending, which included a tailings dam raise project, partially offset by lower exploration spending.
The difference between what we report as "production" and "payable metal quantities sold" is mainly attributable to inventory changes incidental to the timing of sales of refined metals and shipping schedules.
We believe the identification of silver as a by-product credit is appropriate at Casa Berardi because of its lower economic value compared to gold and due to the fact that gold is the primary product we intend to produce there. In addition, we do not receive sufficient revenue from silver at Casa Berardi to warrant classification of such as a co-product. Because we consider silver to be a by-product of our gold production at Casa Berardi, the value of silver offsets operating costs within our calculations of Cash Cost, After By-product Credits, per Gold Ounce and AISC, After By-product Credits, per Gold Ounce.
The San Sebastian Segment
Dollars are in thousands (except per ounce and per ton amounts) | Three Months Ended September 30, | Nine Months Ended September 30, | Three Months Ended September 30, | Nine Months Ended September 30, | ||||||||||||||||||||||||||||
2018 | 2017 | 2018 | 2017 | 2019 | 2018 | 2019 | 2018 | |||||||||||||||||||||||||
Sales | $ | 14,129 | $ | 25,589 | $ | 40,727 | $ | 66,866 | $ | 15,435 | $ | 14,129 | $ | 39,028 | $ | 40,727 | ||||||||||||||||
Cost of sales and other direct production costs | (12,530 | ) | (6,039 | ) | (27,591 | ) | (16,341 | ) | (9,516 | ) | (12,530 | ) | (29,404 | ) | (27,591 | ) | ||||||||||||||||
Depreciation, depletion and amortization | (1,795 | ) | (641 | ) | (3,586 | ) | (2,036 | ) | (3,326 | ) | (1,795 | ) | (6,934 | ) | (3,586 | ) | ||||||||||||||||
Cost of sales and other direct production costs and depreciation, depletion and amortization | (14,325 | ) | (6,680 | ) | (31,177 | ) | (18,377 | ) | (12,842 | ) | (14,325 | ) | (36,338 | ) | (31,177 | ) | ||||||||||||||||
Gross profit | $ | (196 | ) | $ | 18,909 | $ | 9,550 | $ | 48,489 | $ | 2,593 | $ | (196 | ) | $ | 2,690 | $ | 9,550 | ||||||||||||||
Tons of ore milled | 39,739 | 36,482 | 111,916 | 111,623 | 45,232 | 39,739 | 135,576 | 111,916 | ||||||||||||||||||||||||
Production: | ||||||||||||||||||||||||||||||||
Silver (ounces) | 521,931 | 880,885 | 1,593,770 | 2,498,638 | 541,636 | 521,931 | 1,446,450 | 1,593,770 | ||||||||||||||||||||||||
Gold (ounces) | 3,666 | 6,342 | 12,051 | 19,222 | 4,699 | 3,666 | 11,776 | 12,051 | ||||||||||||||||||||||||
Payable metal quantities sold: | ||||||||||||||||||||||||||||||||
Silver (ounces) | 606,550 | 963,000 | 1,571,455 | 2,499,750 | 514,900 | 606,550 | 1,453,160 | 1,571,455 | ||||||||||||||||||||||||
Gold (ounces) | 4,240 | 7,465 | 12,288 | 19,955 | 4,442 | 4,240 | 11,582 | 12,288 | ||||||||||||||||||||||||
Ore grades: | ||||||||||||||||||||||||||||||||
Silver ounces per ton | 14.16 | 25.48 | 15.36 | 23.71 | 13.36 | 14.16 | 11.78 | 15.36 | ||||||||||||||||||||||||
Gold ounces per ton | 0.11 | 0.18 | 0.12 | 0.18 | 0.12 | 0.11 | 0.10 | 0.12 | ||||||||||||||||||||||||
Mining cost per ton | $ | 171.87 | $ | 35.69 | $ | 157.21 | $ | 38.70 | $ | 102.94 | $ | 171.87 | $ | 112.17 | $ | 157.21 | ||||||||||||||||
Milling cost per ton | $ | 65.98 | $ | 69.42 | $ | 66.16 | $ | 66.64 | $ | 62.85 | $ | 65.98 | $ | 62.16 | $ | 66.16 | ||||||||||||||||
Cash Cost, After By-product Credits, per Silver Ounce (1) | $ | 12.02 | $ | (3.12 | ) | $ | 8.28 | $ | (3.23 | ) | $ | 3.70 | $ | 12.02 | $ | 7.77 | $ | 8.28 | ||||||||||||||
AISC, After By-product Credits, per Silver Ounce (1) | $ | 16.95 | $ | (0.83 | ) | $ | 13.34 | $ | (0.14 | ) | $ | 7.21 | $ | 16.95 | $ | 12.14 | $ | 13.34 | ||||||||||||||
(1) | A reconciliation of these non-GAAP measures to cost of sales and other direct production costs and depreciation, depletion and amortization, the most comparable GAAP measure, can be found below in Reconciliation of Cost of Sales and Other Direct Production Costs and Depreciation, Depletion and Amortization (GAAP) to Cash Cost, Before By-product Credits and Cash Cost, After By-product Credits (non-GAAP) and All-In Sustaining Cost, Before By-product Credits and |
The $19.1$2.8 million and $38.9 million decreasesincrease in gross profit for the third quarter of 2019 compared to the third quarter of 2018 was primarily due to higher average silver and gold prices. The $6.9 million decrease in gross profit for the first nine months of 2018, respectively,2019 compared to the same periodsperiod of 2017 were primarily2018 was mainly due to lower silver and gold production due toas a result of lower ore grades, partially offset by higher mining costsaverage silver and lower silvergold prices. The third quarter was also impacted by lower gold prices and recoveries compared the third quarter of 2017. The lower grades and higher costs are the result of transitioning from open pit to underground mining. The ore processed in the thirdfirst quarter and first nine months of 20172018 came from higher grade deposits mined from shallow open pits. Production from the existing open pits was substantially completedended in December 2017; however, during the first halfquarter of 2018, a portion of the mill throughput primarily came from the ore stockpiled from the open pits and smaller-scale, open pit production.pits. In AprilJanuary 2017, we started development of a new underground portal and work to rehabilitaterehabilitation of historic underground infrastructure which allows us to mine deeper portions of the deposits at San Sebastian. Limited orefacilitate underground production. Ore production from underground began in Januaryin the first quarter of 2018 and has continued to increase during the year.since that time. The underground ore production is expected to havehas lower grades and involve higher mining costs than the open pit.
Mining and milling cost per ton were higherlower by 382%40% and by 306% for5%, respectively, in the third quarter of 2019 and by 29% and 6%, respectively, for the first nine months of 2018, respectively,2019 compared to the same periods of 2017, while there2018. The decreases were minor variances for milling costs compared to the prior year periods. The large increase in mining cost per ton wasmainly due to the transitionhigher ore tonnage.
The chart below illustrates the factors contributing to Cash Cost, After By-product Credits, Per Silver Ounce for the third quarter and first nine months of 20182019 and 2017:2018:
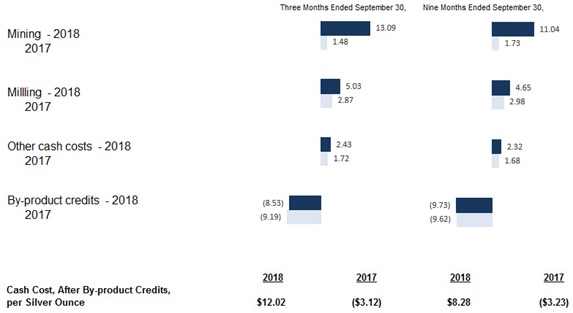
The following table summarizes the components of Cash Cost, After By-product Credits, per Silver Ounce:
Three Months Ended | Nine Months Ended | |||||||||||||||
2018 | 2017 | 2018 | 2017 | |||||||||||||
Cash Cost, Before By-product Credits, per Silver Ounce | $ | 20.55 | $ | 6.07 | $ | 18.01 | $ | 6.39 | ||||||||
By-product credits | (8.53 | ) | (9.19 | ) | (9.73 | ) | (9.62 | ) | ||||||||
Cash Cost, After By-product Credits, per Silver Ounce | $ | 12.02 | $ | (3.12 | ) | $ | 8.28 | $ | (3.23 | ) | ||||||
Three Months Ended | Nine Months Ended | |||||||||||||||
2019 | 2018 | 2019 | 2018 | |||||||||||||
Cash Cost, Before By-product Credits, per Silver Ounce | $ | 16.54 | $ | 20.55 | $ | 18.97 | $ | 18.01 | ||||||||
By-product credits | (12.84 | ) | (8.53 | ) | (11.20 | ) | (9.73 | ) | ||||||||
Cash Cost, After By-product Credits, per Silver Ounce | $ | 3.70 | $ | 12.02 | $ | 7.77 | $ | 8.28 | ||||||||
The following table summarizes the components of AISC, After By-product Credits, per Silver Ounce:
Three Months Ended September 30, | Nine Months Ended September 30, | |||||||||||||||
2018 | 2017 | 2018 | 2017 | |||||||||||||
AISC, Before By-product Credits, per Silver Ounce | $ | 25.48 | $ | 8.36 | $ | 23.07 | $ | 9.48 | ||||||||
By-product credits | (8.53 | ) | (9.19 | ) | (9.73 | ) | (9.62 | ) | ||||||||
AISC, After By-product Credits, per Silver Ounce | $ | 16.95 | $ | (0.83 | ) | $ | 13.34 | $ | (0.14 | ) | ||||||
Three Months Ended September 30, | Nine Months Ended September 30, | |||||||||||||||
2019 | 2018 | 2019 | 2018 | |||||||||||||
AISC, Before By-product Credits, per Silver Ounce | $ | 20.05 | $ | 25.48 | $ | 23.34 | $ | 23.07 | ||||||||
By-product credits | (12.84 | ) | (8.53 | ) | (11.20 | ) | (9.73 | ) | ||||||||
AISC, After By-product Credits, per Silver Ounce | $ | 7.21 | $ | 16.95 | $ | 12.14 | $ | 13.34 | ||||||||
The increasedecrease in Cash Cost, After By-product Credits, per Silver Ounce in the third quarter and first nine months of 20182019 compared to the same periods of 20172018 was primarily the result of higher by-product credits on a per-ounce basis. The reduction in the third quarter was also due to lower silver production and higher mining costs due to the transition from open pit to underground mining.on a per-ounce basis. The same factors along with lower exploration spending, partially offset by higher exploration andsustaining capital, spending, resulted in the increasesdecrease in AISC, After By-product Credits, per Silver Ounce for the third quarter and first nine months of 20182019 compared to 2017.
The difference between what we report as "production" and "payable metal quantities sold" is mainly attributable to inventory changes incidental to the timing of sales of refined metals and shipping schedules.
We periodically review our revenues to ensure that reporting of primary products and by-products is appropriate. We believe the identification of gold as a by-product credit is appropriate at San Sebastian because of its anticipated lower economic value compared to silver over the life of the mine. In addition, we willdo not receive sufficient revenue from gold at San Sebastian to warrant classification of such as a co-product. Because we consider gold to be a by-product of our silver production at San Sebastian, the value of gold offsets operating costs within our calculations of Cash Cost, After By-product Credits, per Silver Ounce and AISC, After By-product Credits, per Silver Ounce.
The Nevada Operations Segment
On July 20, 2018, we completed the acquisition of all of the issued and outstanding common shares of Klondex for total consideration of $414.2$413.9 million. See Note 1413 of Notes to Condensed Consolidated Financial Statements (Unaudited) for more information. The acquisition gives us 100% ownership of the Fire Creek, Midas and Hollister mines, where gold is the primary metal produced, the Midas and Aurora mill,mills, and interests in various gold exploration properties, all located in northern Nevada. The tabular information below reflects our ownership of the Nevada Operations commencing on July 20, 2018.
Dollars are in thousands (except per ounce and per ton amounts) | Three and Nine Months Ended | |||
2018 | ||||
Sales | $ | 11,494 | ||
Cost of sales and other direct production costs | (10,132 | ) | ||
Depreciation, depletion and amortization | (9,187 | ) | ||
Cost of sales and other direct production costs and depreciation, depletion and amortization | (19,319 | ) | ||
Gross profit (loss) | $ | (7,825 | ) | |
Tons of ore milled | 55,899 | |||
Production: | ||||
Gold (ounces) | 13,789 | |||
Silver (ounces) | 84,145 | |||
Payable metal quantities sold: | ||||
Gold (ounces) | 9,033 | |||
Silver (ounces) | 44,044 | |||
Ore grades: | ||||
Gold ounces per ton | 0.288 | |||
Silver ounces per ton | 2.05 | |||
Mining cost per ton | $ | 186.12 | ||
Milling cost per ton | $ | 70.39 | ||
Cash Cost, After By-product Credits, per Gold Ounce (1) | $ | 1,179 | ||
AISC, After By-product Credits, per Gold Ounce (1) | $ | 1,932 | ||
Dollars are in thousands (except per ounce and per ton amounts) | Three Months Ended September 30, | Nine Months Ended | ||||||||||||||
2019 | 2018 | 2019 | 2018 | |||||||||||||
Sales | $ | 29,612 | $ | 11,494 | $ | 64,586 | $ | 11,494 | ||||||||
Cost of sales and other direct production costs | (17,261 | ) | (10,132 | ) | (60,098 | ) | (10,132 | ) | ||||||||
Depreciation, depletion and amortization | (19,050 | ) | (9,187 | ) | (45,179 | ) | (9,187 | ) | ||||||||
Cost of sales and other direct production costs and depreciation, depletion and amortization | (36,311 | ) | (19,319 | ) | (105,277 | ) | (19,319 | ) | ||||||||
Gross profit (loss) | $ | (6,699 | ) | $ | (7,825 | ) | $ | (40,691 | ) | $ | (7,825 | ) | ||||
Tons of ore milled | 63,954 | 55,899 | 163,736 | 55,899 | ||||||||||||
Production: | ||||||||||||||||
Gold (ounces) | 22,381 | 13,789 | 45,439 | 13,789 | ||||||||||||
Silver (ounces) | 43,377 | 84,145 | 160,264 | 84,145 | ||||||||||||
Payable metal quantities sold: | ||||||||||||||||
Gold (ounces) | 19,644 | 9,033 | 44,704 | 9,033 | ||||||||||||
Silver (ounces) | 36,736 | 44,044 | 158,123 | 44,044 | ||||||||||||
Ore grades: | ||||||||||||||||
Gold ounces per ton | 0.389 | 0.288 | 0.320 | 0.288 | ||||||||||||
Silver ounces per ton | 1.54 | 2.05 | 1.81 | 2.05 | ||||||||||||
Mining cost per ton | $ | 149.16 | $ | 186.12 | $ | 158.25 | $ | 186.12 | ||||||||
Milling cost per ton | $ | 67.66 | $ | 70.39 | $ | 81.73 | $ | 70.39 | ||||||||
Cash Cost, After By-product Credits, per Gold Ounce (1) | $ | 817 | $ | 1,179 | $ | 1,165 | $ | 1,179 | ||||||||
AISC, After By-product Credits, per Gold Ounce (1) | $ | 992 | $ | 1,932 | $ | 1,841 | $ | 1,932 | ||||||||
(1) | A reconciliation of these non-GAAP measures to cost of sales and other direct production costs and depreciation, depletion and amortization, the most comparable GAAP measure, can be found below in Reconciliation of Cost of Sales and Other Direct Production Costs and Depreciation, Depletion and Amortization (GAAP) to Cash Cost, Before By-product Credits and Cash Cost, After By-product Credits (non-GAAP) and All-In Sustaining Cost, Before By-product Credits and |
2019 compared to the same period of 2018 was due to higher costs and higher depreciation, depletion and amortization, partially offset by higher gold and silver production and prices. Cost of sales and other direct production costs for the third quarter and first nine months of 2019 includes write-downs totaling approximately $4.6 million and $32.9 million, respectively, of the values of stockpile, in-process and finished goods inventory to their net realizable value. Cost of sales and other direct production costs for the period from July 20 to September 30, 2018 includes write-downs$7.2 million in such write-downs.
Mining costs per ton were lower by 20% and 15% for the valuesthird quarter and first nine months of stockpile, in-process2019, respectively, compared to the same periods of 2018 due to higher tonnage and finished goods inventorylower costs for labor, contractors and consumables. Milling costs per ton were lower by 4% for the third quarter of 2019 compared to their net realizable value, totaling $7.2 million.the third quarter of 2018 due to higher tonnage. Milling costs per ton were higher by 16% for the first nine months of 2019 compared to the same period of 2018 due to higher labor costs, partially offset by higher tonnage.
The chart below illustrates the factors contributing to Cash Cost, After By-product Credits, Per Gold Ounce for the third quarter and first nine months of 2019 and 2018:
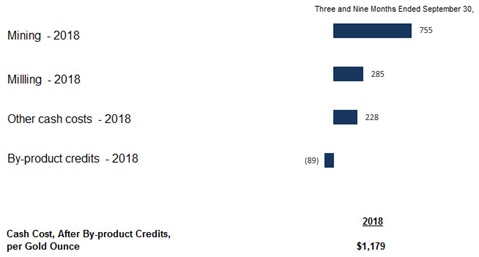
The following table summarizes the components of Cash Cost, After By-product Credits, per Gold Ounce:
Three and Nine Months Ended | Nine Months Ended | |||||||||||||||||||
Three and Nine Months Ended | 2019 | 2018 | 2019 | 2018 | ||||||||||||||||
Cash Cost, Before By-product Credits, per Gold Ounce | $ | 1,268 | $ | 851 | $ | 1,268 | $ | 1,221 | $ | 1,268 | ||||||||||
By-product credits | (89 | ) | (34 | ) | (89 | ) | (56 | ) | (89 | ) | ||||||||||
Cash Cost, After By-product Credits, per Gold Ounce | $ | 1,179 | $ | 817 | $ | 1,179 | $ | 1,165 | $ | 1,179 | ||||||||||
The following table summarizes the components of AISC, After By-product Credits, per Gold Ounce:
Three and Nine Months Ended | Nine Months Ended September 30, | |||||||||||||||||||
Three and Nine Months Ended | 2019 | 2018 | 2019 | 2018 | ||||||||||||||||
AISC, Before By-product Credits, per Gold Ounce | $ | 2,021 | $ | 1,026 | $ | 2,021 | $ | 1,897 | $ | 2,021 | ||||||||||
By-product credits | (89 | ) | (34 | ) | (89 | ) | (56 | ) | (89 | ) | ||||||||||
AISC, After By-product Credits, per Gold Ounce | $ | 1,932 | $ | 992 | $ | 1,932 | $ | 1,841 | $ | 1,932 | ||||||||||
The decrease in Cash Cost, Before By-product Credits, per Gold Ounce in the third quarter and first nine months of 2019 compared to the same periods of 2018 is due to lower mining and milling costs on a per-ounce basis, due primarily to increased gold production resulting from higher ore grades and mill throughput. The same factors, along with lower exploration spending, resulted in the decrease in AISC, After By-product Credits, per Gold Ounce in the third quarter and first nine months of 2019 compared to the same periods of 2018. The lower AISC, After By-product Credits, per Gold Ounce, for the third quarter of 2019 was also due to lower capital spending, while capital spending was higher, on a per ounce basis, in the first nine months of 2019, compared to the same periods of 2018.
We believe the identification of silver as a by-product credit is appropriate at Nevada Operations because of its lower economic value compared to gold and due to the fact that gold is the primary product we intend to produce there. In addition, we do not receive sufficient revenue from silver at Nevada Operations to warrant classification of such as a co-product. Because we consider silver to be a by-product of our gold production at Nevada Operations, the value of silver offsets operating costs within our calculations of Cash Cost, After By-product Credits, per Gold Ounce and AISC, After By-product Credits, per Gold Ounce.
Transition and improvement activities since our acquisition of the Nevada Operations have included an increase in underground development and rehabilitation at the Fire Creek mine, progress on construction of a new tailings dam, and work to installinstallation of a carbon-in-leach circuit in order to improve recoveries at the Midas mill, where ore from each of the mines is processed. In addition,processed, and start of development of a new drift to the Hatter Graben area at Hollister.
Because total production and capital costs have exceeded sales since acquisition, we decidedconducted a review of our Nevada operations during the second quarter of 2019. The review resulted in (i) a plan to curtaillimit near-term mining at Fire Creek to areas where development has already been completed and (ii) suspension of production at the Midas mine,Hollister and are utilizing somedevelopment of the equipment and employees from that location forHatter Graben project at Hollister, resulting in lower anticipated near-term production and capitalized development costs. We determined this review and the resulting plans represented a triggering event requiring an assessment of recoverability of the carrying value of our long-lived assets ("carrying value assessment") in Nevada. In our carrying value assessment, our estimate of undiscounted future cash flows exceeded the carrying value of the Nevada assets, and we concluded impairment was not indicated, as of June 30, 2019. Estimates of undiscounted future cash flows are dependent upon, among other factors, estimates of: (i) metals to be extracted and recovered from proven and probable ore reserves and identified mineralization beyond proven and probable reserves, (ii) future operating and capital costs, and (iii) future metals prices. The carrying value assessment assumed a slow-down and deferral of near-term production over a period of twelve months as we continue to address operational challenges and assess the appropriate next steps. In the assessment, resumption of previously-anticipated production levels is assumed to take place in the first part of 2021; however, this will be contingent upon the resolution of operational issues, including, but not limited to: (i) ore grade control, (ii) mill recoveries and reconciliation, (iii) the potential availability of third-party processing of ore produced at the Fire Creek mine, and Hollister mines.(iv) availability of sufficient resources (including funding) to resume and complete necessary development work and drilling on a timely basis (collectively the "Operational Issues").
Our estimates of undiscounted future cash flows for our Nevada assets are most sensitive to (i) changes in metal prices and (ii) the timely resumption of previously-anticipated production levels. Our carrying value assessment assumed a weighted-average gold price of approximately $1,345 per ounce. A sensitivity analysis was performed, and decreasing the weighted-average gold price assumption to below approximately $1,280 per ounce, with all other variables held constant, would have resulted in estimated undiscounted future cash flows that were less than the carrying value of the Nevada assets as of June 30, 2019. In the third quarter of 2019, we continued to pursue third-party ore processing arrangements with the potential to reduce transportation and milling costs. Additionally, we have commenced studies of the assets in order to determine how to mine them with lower costs. There were no significant events or changes in circumstances during the third quarter of 2019 representing a triggering event requiring a carrying value assessment in Nevada. If events or changes occur that adversely affect our estimate of undiscounted future cash flows from our Nevada assets, including (i) an increase in expected costs, (ii) a sustained decline in gold prices, or (iii) suspension of production and placement of our Nevada operations on care-and-maintenance due to the inability to resolve the Operational Issues identified above in a timely manner, or other factors, we may be required to again perform the carrying value assessment for our Nevada assets. If a future assessment indicates the carrying value of the assets exceeds the estimated undiscounted future cash flows, an impairment loss, which could be material, would be recognized for the difference between the carrying value and fair value of the assets. The estimate of potential impairment involves significant judgment and assumptions, and no assurance can be given as to whether we will recognize an impairment in the future or the amount of a potential impairment. The carrying value of our properties, plants, equipment and mineral interests in Nevada as of September 30, 2019 was $524.8 million, consisting of the following (in millions):
Value beyond proven and probable reserves | $ | 382.2 | ||
Mineral properties and development | 57.7 | |||
Mills and tailings facilities | 46.4 | |||
Buildings and equipment | 33.0 | |||
Land | 2.9 | |||
Asset retirement obligation asset | 2.6 | |||
Total | $ | 524.8 |
See Part II, Item 1A - Risk Factors in our quarterly report on Form 10-Q for the quarter ended June 30, 2019 for a discussion of certain risks relating to our recent and ongoing analysis of the carrying value of the Nevada assets.
Corporate Matters
Employee Benefit Plans
Our defined benefit pension plans provide a significant benefit to our employees, but also represent a significant liability to us. The liability recorded for the funded status of our plans was $44.6$51.3 million and $47.1$48.3 million as of September 30, 20182019 and December 31, 2017,2018, respectively. In April 2018 and July 2018, we made cash contributions of $1.3 million and $1.2 million, respectively, to our defined benefit plans. In September 2018May 2019, we contributed $5.5a total of approximately $3.6 million in shares of our common stock. We arestock to our defined benefit plans, and do not requiredexpect to make additional contributions to our defined benefitthe plans in 2018.2019. While the economic variables which will determine future funding requirements are uncertain, we expect contributions to continue to be required in future years under current plan provisions, and we periodically examine the plans for affordability and competitiveness. See Note 8 7 of Notes to Condensed Consolidated Financial Statements (Unaudited) for more information.
Income Taxes
On July 20, 2018, we acquired all of the issued and outstanding common shares of Klondex in a taxable stock acquisition. Klondex was a Canadian holding company which was amalgamated into our Canadian acquisition entity to form Klondex Mines Unlimited Liability Company (“KMULC”), a Canadian unlimited liability company. KMULC is the Canadian parent of a U.S. consolidated group located in Nevada.Nevada (the "Nevada U.S. Group"). We filed an election to treat KMULC as a corporation. As a result of the Canadian parent U.S. corporate status, the Nevada U.S. consolidated groupGroup did not join the existing U.S. consolidated tax group for Hecla Mining Company and subsidiaries (“Legacy Hecla”Hecla U.S.”). A net deferred tax liability of $50.1$59.5 million was recorded for the fair market value of assets acquired in excess of carryover tax basis. See Note 1413 of Notes to Condensed Consolidated Financial Statements (Unaudited) for additional information regarding the acquisition.
Each reporting period we assess our deferred tax balance based on a review of long-range forecasts and quarterly activity. We recognized a full valuation allowance on our Legacy Hecla U.S. net deferred tax assets at the end of 2017 based on results of tax law changes and maintain a full valuation allowance on Legacy Hecla U.S. net deferred tax assets at September 30, 2018. .2019.
OnOur net U.S. deferred tax liability for the Nevada U.S. Group at September 30, 2019 was $43.1 million compared to the $63.2 million net deferred tax liability at December 22, 2017,31, 2018. The $20.1 million decrease includes $9.8 million related to an adjustment to the United States enacted tax reform legislation known as H.R. 1, commonly referredpurchase price allocation for the July 2018 acquisition of Klondex (see Note 13 of Notes to as the “Tax Cuts and Jobs Act” (the “Act”), resulting in significant modifications to prior law. Among other changes, the Act repealed corporate Alternative Minimum Tax ("AMT"Condensed Consolidated Financial Statements (Unaudited)) and reduced$10.3 million for current period activity in Nevada. The deferred tax liability is primarily related to the U.S. corporate income tax rate to 21 percent. As a resultexcess of the Act, our AMT credit carryforwardcarrying value of $9.4 million became partially refundable through 2020 and fully refundable in 2021. Due to our U.Sthe mineral resource assets over the tax loss position, the AMT refund is classified as a long-term receivable.bases of those assets for U.S. tax reporting.
Our net Canadian deferred tax liability at September 30, 20182019 was $118.1$100.3 million, a decrease of $3.4$10.0 million from the $121.5$110.3 million net deferred tax liability at December 31, 2017.2018. The deferred tax liability is primarily related to the excess of the carrying value of the mineral resource assets over the tax bases of those assets for Canadian tax reporting.
Our Mexican net deferred tax asset at September 30, 20182019 was $1.9$3.7 million, an increase of $0.1$1.7 million from the net deferred tax asset of $1.8$2.0 million at December 31, 2017.2018. A $1.6$2.1 million valuation allowance remains on deferred tax assets in Mexico.
the Tax Cuts and Jobs Act enacted in December 2017, our Alternative Minimum Tax ("AMT") credit carryforward of $11.9 million became partially refundable through 2020 and fully refundable in 2021. In December 2018, the U.S. government determined refunds of AMT credit carried forward will not be subject to sequestration; therefore, the valuation allowance was removed for $0.6 million. $6.9 million of the AMT credit carry forward is classified as a current receivable and $5.0 million is classified as a long-term receivable.
Reconciliation of Cost of Sales and Other Direct Production Costs and Depreciation, Depletion and Amortization (GAAP) to Cash Cost, Before By-product Credits and Cash Cost, After By-product Credits (non-GAAP) and All-In Sustaining Cost, Before By-product Credits and All-In Sustaining Cost, After By-product Credits (non-GAAP)
The tables below present reconciliations between the most comparable GAAP measure of cost of sales and other direct production costs and depreciation, depletion and amortization to the non-GAAP measures of (i) Cash Cost, Before By-product Credits, (ii) Cash Cost, After By-product Credits, (iii) AISC, Before By-product Credits and (iv) AISC, After By-product Credits for our operations at the Greens Creek, Lucky Friday, San Sebastian, Casa Berardi and Nevada Operations units and for the Company for the three- and nine-month periods ended September 30, 20182019 and 2017.2018.
Cash Cost, After By-product Credits, per Ounce and AISC, After By-product Credits, per Ounce are measures developed by precious metals companies (including the Silver Institute and the World Gold Council) in an effort to provide a uniform standard for comparison purposes. There can be no assurance, however, that these non-GAAP measures as we report them are the same as those reported by other mining companies.
Cash Cost, After By-product Credits, per Ounce is an important operating statistic that we utilize to measure each mine's operating performance. We have recently started reportinguse AISC, After By-product Credits, per Ounce which we use as a measure of our mines' net cash flow after costs for exploration, pre-development, reclamation, and sustaining capital. This is similar to the Cash Cost, After By-product Credits, per Ounce non-GAAP measure we report, but also includes on-site exploration, reclamation, and sustaining capital costs. Current GAAP measures used in the mining industry, such as cost of goods sold, do not capture all the expenditures incurred to discover, develop and sustain silver and gold production. Cash Cost, After By-product Credits, per Ounce and AISC, After By-product Credits, per Ounce also allow us to benchmark the performance of each of our mines versus those of our competitors. As a silver and gold mining company, we also use these statistics on an aggregate basis - aggregating the Greens Creek, Lucky Friday and San Sebastian mines to compare our performance with that of other silver mining companies, and aggregating Casa Berardi and Nevada Operations for comparison towith other gold mining companies. Similarly, these statistics are useful in identifying acquisition and investment opportunities as they provide a common tool for measuring the financial performance of other mines with varying geologic, metallurgical and operating characteristics.
Cash Cost, Before By-product Credits and AISC, Before By-product Credits include all direct and indirect operating cash costs related directly to the physical activities of producing metals, including mining, processing and other plant costs, third-party refining expense, on-site general and administrative costs, royalties and mining production taxes. AISC, Before By-product Credits for each mine also includes on-site exploration, reclamation, and sustaining capital costs. AISC, Before By-product Credits for our consolidated silver properties also includes corporate costs for general and administrative expense, exploration and sustaining capital projects. By-product credits include revenues earned from all metals other than the primary metal produced at each unit. As depicted in the tables below, by-product credits comprise an essential element of our silver unit cost structure, distinguishing our silver operations due to the polymetallic nature of their orebodies.
In addition to the uses described above, Cash Cost, After By-product Credits, per Ounce and AISC, After By-product Credits, per Ounce provide management and investors an indication of operating cash flow, after consideration of the average price received from production. We also use these measurements for the comparative monitoring of performance of our mining operations period-to-period from a cash flow perspective.
The Casa Berardi, Nevada Operations and combined gold properties information below reports Cash Cost, After By-product Credits, per Gold Ounce and AISC, After By-product Credits, per Gold Ounce for the production of gold, their primary product, and by-product revenues earned from silver, which is a by-product at Casa Berardi and Nevada Operations. Only costs and ounces produced relating to units with the same primary product are combined to represent Cash Cost, After By-product Credits, per Ounce and AISC, After By-product Credits, per Ounce. Thus, the gold produced at our Casa Berardi and Nevada Operations units is not included as a by-product credit when calculating Cash Cost, After By-product Credits, per Silver Ounce and AISC, After By-product Credits, per Silver Ounce for the total of Greens Creek, Lucky Friday and San Sebastian, our combined silver properties. Similarly, the silver produced at our other three units is not included as a by-product credit when calculating the gold metrics for Casa Berardi and Nevada Operations.
In thousands (except per ounce amounts) | Three Months Ended September 30, 2018 | Three Months Ended September 30, 2019 | ||||||||||||||||||||||||||||||||||||||
Greens Creek | Lucky Friday(2) | San Sebastian | Corporate(3) | Total Silver | Greens Creek | Lucky Friday(2) | San Sebastian | Corporate(3) | Total Silver | |||||||||||||||||||||||||||||||
Cost of sales and other direct production costs and depreciation, depletion and amortization | $ | 52,163 | (1 | ) | $ | 14,325 | $ | 66,487 | $ | 40,475 | 4,018 | $ | 12,842 | $ | 57,335 | |||||||||||||||||||||||||
Depreciation, depletion and amortization | (12,428 | ) | — | (1,795 | ) | (14,223 | ) | (9,008 | ) | (300 | ) | (3,326 | ) | (12,634 | ) | |||||||||||||||||||||||||
Treatment costs | 8,267 | 134 | 205 | 8,606 | 13,003 | 500 | 63 | 13,566 | ||||||||||||||||||||||||||||||||
Change in product inventory | (4,480 | ) | — | (1,549 | ) | (6,029 | ) | 8,456 | (134 | ) | (335 | ) | 7,987 | |||||||||||||||||||||||||||
Reclamation and other costs | (965 | ) | 103 | (458 | ) | (1,320 | ) | (92 | ) | — | (294 | ) | (386 | ) | ||||||||||||||||||||||||||
Exclusion of Lucky Friday costs | — | (236 | ) | — | (236 | ) | — | (4,084 | ) | — | (4,084 | ) | ||||||||||||||||||||||||||||
Cash Cost, Before By-product Credits (1) | 42,557 | — | 10,728 | 53,285 | 52,834 | — | 8,950 | 61,784 | ||||||||||||||||||||||||||||||||
Reclamation and other costs | 849 | — | 105 | 954 | 737 | — | 123 | 860 | ||||||||||||||||||||||||||||||||
Exploration | 1,771 | — | 1,982 | 473 | 4,226 | 465 | — | 1,252 | 167 | 1,884 | ||||||||||||||||||||||||||||||
Sustaining capital | 11,029 | — | 486 | 704 | 12,219 | 8,966 | — | 528 | — | 9,494 | ||||||||||||||||||||||||||||||
General and administrative | 10,327 | 10,327 | 7,978 | 7,978 | ||||||||||||||||||||||||||||||||||||
AISC, Before By-product Credits (1) | 56,206 | — | 13,301 | 81,011 | 63,002 | — | 10,853 | 82,000 | ||||||||||||||||||||||||||||||||
By-product credits: | ||||||||||||||||||||||||||||||||||||||||
Zinc | (20,674 | ) | — | (20,674 | ) | (22,452 | ) | — | (22,452 | ) | ||||||||||||||||||||||||||||||
Gold | (12,229 | ) | — | (4,450 | ) | (16,679 | ) | (17,517 | ) | — | (6,946 | ) | (24,463 | ) | ||||||||||||||||||||||||||
Lead | (6,041 | ) | — | (6,041 | ) | (7,649 | ) | — | (7,649 | ) | ||||||||||||||||||||||||||||||
Total By-product credits | (38,944 | ) | — | (4,450 | ) | (43,394 | ) | (47,618 | ) | — | (6,946 | ) | (54,564 | ) | ||||||||||||||||||||||||||
Cash Cost, After By-product Credits | $ | 3,613 | $ | — | $ | 6,278 | $ | 9,891 | $ | 5,216 | $ | — | $ | 2,004 | $ | 7,220 | ||||||||||||||||||||||||
AISC, After By-product Credits | $ | 17,262 | $ | — | $ | 8,851 | $ | 37,617 | $ | 15,384 | $ | — | $ | 3,907 | $ | 27,436 | ||||||||||||||||||||||||
Divided by silver ounces produced | 1,876 | — | 522 | 2,398 | 2,544 | — | 541 | 3,085 | ||||||||||||||||||||||||||||||||
Cash Cost, Before By-product Credits, per Silver Ounce | $ | 22.67 | $ | — | $ | 20.55 | $ | 22.22 | $ | 20.77 | $ | — | $ | 16.54 | $ | 20.03 | ||||||||||||||||||||||||
By-product credits per ounce | (20.75 | ) | — | (8.53 | ) | (18.10 | ) | (18.72 | ) | — | (12.84 | ) | (17.69 | ) | ||||||||||||||||||||||||||
Cash Cost, After By-product Credits, per Silver Ounce | $ | 1.92 | $ | — | $ | 12.02 | $ | 4.12 | $ | 2.05 | $ | — | $ | 3.70 | $ | 2.34 | ||||||||||||||||||||||||
AISC, Before By-product Credits, per Silver Ounce | $ | 29.95 | $ | — | $ | 25.48 | $ | 33.78 | $ | 24.77 | $ | — | $ | 20.05 | $ | 26.58 | ||||||||||||||||||||||||
By-product credits per ounce | (20.75 | ) | — | (8.53 | ) | (18.10 | ) | (18.72 | ) | — | (12.84 | ) | (17.69 | ) | ||||||||||||||||||||||||||
AISC, After By-product Credits, per Silver Ounce | $ | 9.20 | $ | — | $ | 16.95 | $ | 15.68 | $ | 6.05 | $ | — | $ | 7.21 | $ | 8.89 | ||||||||||||||||||||||||
In thousands (except per ounce amounts) | Three Months Ended September 30, 2018 | Three Months Ended September 30, 2019 | ||||||||||||||||||||||
Casa Berardi | Nevada Operations (4) | Total Gold | Casa Berardi | Nevada Operations (4) | Total Gold | |||||||||||||||||||
Cost of sales and other direct production costs and depreciation, depletion and amortization | $ | 51,267 | $ | 19,319 | $ | 70,586 | $ | 53,006 | $ | 36,311 | $ | 89,317 | ||||||||||||
Depreciation, depletion and amortization | (20,054 | ) | (9,187 | ) | (29,241 | ) | (19,090 | ) | (19,050 | ) | (38,140 | ) | ||||||||||||
Treatment costs | 535 | 42 | 577 | 561 | 45 | 606 | ||||||||||||||||||
Change in product inventory | (1,303 | ) | 7,311 | 6,008 | 1,070 | 2,118 | 3,188 | |||||||||||||||||
Reclamation and other costs | (140 | ) | — | (140 | ) | (129 | ) | (377 | ) | (506 | ) | |||||||||||||
Cash Cost, Before By-product Credits (1) | 30,305 | 17,485 | 47,790 | 35,418 | 19,047 | 54,465 | ||||||||||||||||||
Reclamation and other costs | 138 | — | 138 | 130 | 378 | 508 | ||||||||||||||||||
Exploration | 854 | 3,322 | 4,176 | 603 | 1,232 | 1,835 | ||||||||||||||||||
Sustaining capital | 8,244 | 7,061 | 15,305 | 13,237 | 2,305 | 15,542 | ||||||||||||||||||
General and administrative | — | — | — | |||||||||||||||||||||
AISC, Before By-product Credits (1) | 39,541 | 27,868 | 67,409 | 49,388 | 22,962 | 72,350 | ||||||||||||||||||
By-product credits: | ||||||||||||||||||||||||
Silver | (142 | ) | (1,232 | ) | (1,374 | ) | (111 | ) | (755 | ) | (866 | ) | ||||||||||||
Total By-product credits | (142 | ) | (1,232 | ) | (1,374 | ) | (111 | ) | (755 | ) | (866 | ) | ||||||||||||
Cash Cost, After By-product Credits | $ | 30,163 | $ | 16,253 | $ | 46,416 | $ | 35,307 | $ | 18,292 | $ | 53,599 | ||||||||||||
AISC, After By-product Credits | $ | 39,399 | $ | 26,636 | $ | 66,035 | $ | 49,277 | $ | 22,207 | $ | 71,484 | ||||||||||||
Divided by gold ounces produced | 44 | 14 | 58 | 37 | 22 | 59 | ||||||||||||||||||
Cash Cost, Before By-product Credits, per Gold Ounce | $ | 689 | $ | 1,268 | $ | 827 | $ | 969 | $ | 851 | $ | 924 | ||||||||||||
By-product credits per ounce | (3 | ) | (89 | ) | (24 | ) | (3 | ) | (34 | ) | (15 | ) | ||||||||||||
Cash Cost, After By-product Credits, per Gold Ounce | $ | 686 | $ | 1,179 | $ | 803 | $ | 966 | $ | 817 | $ | 909 | ||||||||||||
AISC, Before By-product Credits, per Gold Ounce | $ | 899 | $ | 2,021 | $ | 1,167 | $ | 1,351 | $ | 1,026 | $ | 1,228 | ||||||||||||
By-product credits per ounce | (3 | ) | (89 | ) | (24 | ) | (3 | ) | (34 | ) | (15 | ) | ||||||||||||
AISC, After By-product Credits, per Gold Ounce | $ | 896 | $ | 1,932 | $ | 1,143 | $ | 1,348 | $ | 992 | $ | 1,213 | ||||||||||||
In thousands (except per ounce amounts) | Three Months Ended September 30, 2018 | Three Months Ended September 30, 2019 | ||||||||||||||||||||||
Total Silver | Total Gold | Total | Total Silver | Total Gold | Total | |||||||||||||||||||
Cost of sales and other direct production costs and depreciation, depletion and amortization | $ | 66,487 | 70,586 | $ | 137,073 | $ | 57,335 | 89,317 | $ | 146,652 | ||||||||||||||
Depreciation, depletion and amortization | (14,223 | ) | (29,241 | ) | (43,464 | ) | (12,634 | ) | (38,140 | ) | (50,774 | ) | ||||||||||||
Treatment costs | 8,606 | 577 | 9,183 | 13,566 | 606 | 14,172 | ||||||||||||||||||
Change in product inventory | (6,029 | ) | 6,008 | (21 | ) | 7,987 | 3,188 | 11,175 | ||||||||||||||||
Reclamation and other costs | (1,320 | ) | (140 | ) | (1,460 | ) | (386 | ) | (506 | ) | (892 | ) | ||||||||||||
Exclusion of Lucky Friday costs | (236 | ) | — | (236 | ) | (4,084 | ) | — | (4,084 | ) | ||||||||||||||
Cash Cost, Before By-product Credits (1) | 53,285 | 47,790 | 101,075 | 61,784 | 54,465 | 116,249 | ||||||||||||||||||
Reclamation and other costs | 954 | 138 | 1,092 | 860 | 508 | 1,368 | ||||||||||||||||||
Exploration | 4,226 | 4,176 | 8,402 | 1,884 | 1,835 | 3,719 | ||||||||||||||||||
Sustaining capital | 12,219 | 15,305 | 27,524 | 9,494 | 15,542 | 25,036 | ||||||||||||||||||
General and administrative | 10,327 | — | 10,327 | 7,978 | — | 7,978 | ||||||||||||||||||
AISC, Before By-product Credits (1) | 81,011 | 67,409 | 148,420 | 82,000 | 72,350 | 154,350 | ||||||||||||||||||
By-product credits: | ||||||||||||||||||||||||
Zinc | (20,674 | ) | — | (20,674 | ) | (22,452 | ) | — | (22,452 | ) | ||||||||||||||
Gold | (16,679 | ) | — | (16,679 | ) | (24,463 | ) | — | (24,463 | ) | ||||||||||||||
Lead | (6,041 | ) | — | (6,041 | ) | (7,649 | ) | — | (7,649 | ) | ||||||||||||||
Silver | (1,374 | ) | (1,374 | ) | (866 | ) | (866 | ) | ||||||||||||||||
Total By-product credits | (43,394 | ) | (1,374 | ) | (44,768 | ) | (54,564 | ) | (866 | ) | (55,430 | ) | ||||||||||||
Cash Cost, After By-product Credits | $ | 9,891 | $ | 46,416 | $ | 56,307 | $ | 7,220 | $ | 53,599 | $ | 60,819 | ||||||||||||
AISC, After By-product Credits | $ | 37,617 | $ | 66,035 | $ | 103,652 | $ | 27,436 | $ | 71,484 | $ | 98,920 | ||||||||||||
Divided by ounces produced | 2,398 | 58 | 3,085 | 59 | ||||||||||||||||||||
Cash Cost, Before By-product Credits, per Ounce | $ | 22.22 | $ | 827 | $ | 20.03 | $ | 924 | ||||||||||||||||
By-product credits per ounce | (18.10 | ) | (24 | ) | (17.69 | ) | (15 | ) | ||||||||||||||||
Cash Cost, After By-product Credits, per Ounce | $ | 4.12 | $ | 803 | $ | 2.34 | $ | 909 | ||||||||||||||||
AISC, Before By-product Credits, per Ounce | $ | 33.78 | $ | 1,167 | $ | 26.58 | $ | 1,228 | ||||||||||||||||
By-product credits per ounce | (18.10 | ) | (24 | ) | (17.69 | ) | (15 | ) | ||||||||||||||||
AISC, After By-product Credits, per Ounce | $ | 15.68 | $ | 1,143 | $ | 8.89 | $ | 1,213 | ||||||||||||||||
In thousands (except per ounce amounts) | Three Months Ended September 30, 2017 | Three Months Ended September 30, 2018 | ||||||||||||||||||||||||||||||||||||||||||||||
Greens Creek | Lucky Friday(2) | San Sebastian | Corporate(3) | Total Silver | Casa Berardi (Gold) | Total | Greens Creek | Lucky Friday(2) | San Sebastian | Corporate(3) | Total Silver | |||||||||||||||||||||||||||||||||||||
Cost of sales and other direct production costs and depreciation, depletion and amortization | $ | 41,927 | $ | — | $ | 6,680 | $ | 48,607 | $ | 49,269 | $ | 97,876 | $ | 52,163 | $ | (1 | ) | $ | 14,325 | $ | 66,487 | |||||||||||||||||||||||||||
Depreciation, depletion and amortization | (12,607 | ) | — | (641 | ) | (13,248 | ) | (16,270 | ) | (29,518 | ) | (12,428 | ) | — | (1,795 | ) | (14,223 | ) | ||||||||||||||||||||||||||||||
Treatment costs | 12,067 | 440 | 422 | 12,929 | 682 | 13,611 | 8,267 | 134 | 205 | 8,606 | ||||||||||||||||||||||||||||||||||||||
Change in product inventory | 7,675 | 1,960 | (627 | ) | 9,008 | (288 | ) | 8,720 | (4,480 | ) | — | (1,549 | ) | (6,029 | ) | |||||||||||||||||||||||||||||||||
Reclamation and other costs | (394 | ) | 18 | (494 | ) | (870 | ) | (124 | ) | (994 | ) | (965 | ) | 103 | (458 | ) | (1,320 | ) | ||||||||||||||||||||||||||||||
Exclusion of Lucky Friday costs | — | (236 | ) | — | (236 | ) | ||||||||||||||||||||||||||||||||||||||||||
Cash Cost, Before By-product Credits (1) | 48,668 | 2,418 | 5,340 | 56,426 | 33,269 | 89,695 | 42,557 | — | 10,728 | 53,285 | ||||||||||||||||||||||||||||||||||||||
Reclamation and other costs | 666 | 38 | 117 | 821 | 123 | 944 | 849 | — | 105 | 954 | ||||||||||||||||||||||||||||||||||||||
Exploration | 1,944 | (2 | ) | 1,495 | 477 | 3,914 | 1,161 | 5,075 | 1,771 | — | 1,982 | 473 | 4,226 | |||||||||||||||||||||||||||||||||||
Sustaining capital | 8,210 | 119 | 402 | 1,105 | 9,836 | 13,775 | 23,611 | 11,029 | — | 486 | 704 | 12,219 | ||||||||||||||||||||||||||||||||||||
General and administrative | 9,529 | 9,529 | 9,529 | 10,327 | 10,327 | |||||||||||||||||||||||||||||||||||||||||||
AISC, Before By-product Credits (1) | 59,488 | 2,573 | 7,354 | 80,526 | 48,328 | 128,854 | 56,206 | — | 13,301 | 81,011 | ||||||||||||||||||||||||||||||||||||||
By-product credits: | ||||||||||||||||||||||||||||||||||||||||||||||||
Zinc | (27,046 | ) | (293 | ) | (27,339 | ) | (27,339 | ) | (20,674 | ) | — | (20,674 | ) | |||||||||||||||||||||||||||||||||||
Gold | (13,907 | ) | — | (8,088 | ) | (21,995 | ) | (21,995 | ) | (12,229 | ) | — | (4,450 | ) | (16,679 | ) | ||||||||||||||||||||||||||||||||
Lead | (8,067 | ) | (1,102 | ) | (9,169 | ) | (9,169 | ) | (6,041 | ) | — | (6,041 | ) | |||||||||||||||||||||||||||||||||||
Silver | (161 | ) | (161 | ) | ||||||||||||||||||||||||||||||||||||||||||||
Total By-product credits | (49,020 | ) | (1,395 | ) | (8,088 | ) | (58,503 | ) | (161 | ) | (58,664 | ) | (38,944 | ) | — | (4,450 | ) | (43,394 | ) | |||||||||||||||||||||||||||||
Cash Cost, After By-product Credits | $ | (352 | ) | $ | 1,023 | $ | (2,748 | ) | $ | (2,077 | ) | $ | 33,108 | $ | 31,031 | $ | 3,613 | $ | — | $ | 6,278 | $ | 9,891 | |||||||||||||||||||||||||
AISC, After By-product Credits | $ | 10,468 | $ | 1,178 | $ | (734 | ) | $ | 22,023 | $ | 48,167 | $ | 70,190 | $ | 17,262 | $ | — | $ | 8,851 | $ | 37,617 | |||||||||||||||||||||||||||
Divided by ounces produced | 2,344 | 88 | 880 | 3,312 | 44 | 1,876 | — | 522 | 2,398 | |||||||||||||||||||||||||||||||||||||||
Cash Cost, Before By-product Credits, per Ounce | $ | 20.75 | $ | 27.44 | $ | 6.07 | $ | 17.03 | $ | 754 | $ | 22.67 | $ | — | $ | 20.55 | $ | 22.22 | ||||||||||||||||||||||||||||||
By-product credits per ounce | (20.90 | ) | (15.84 | ) | (9.19 | ) | (17.66 | ) | (4 | ) | (20.75 | ) | — | (8.53 | ) | (18.10 | ) | |||||||||||||||||||||||||||||||
Cash Cost, After By-product Credits, per Ounce | $ | (0.15 | ) | $ | 11.60 | $ | (3.12 | ) | $ | (0.63 | ) | $ | 750 | $ | 1.92 | $ | — | $ | 12.02 | $ | 4.12 | |||||||||||||||||||||||||||
AISC, Before By-product Credits, per Ounce | $ | 25.37 | $ | 29.21 | $ | 8.36 | $ | 24.31 | $ | 1,095 | $ | 29.95 | $ | — | $ | 25.48 | $ | 33.78 | ||||||||||||||||||||||||||||||
By-product credits per ounce | (20.90 | ) | (15.84 | ) | (9.19 | ) | (17.66 | ) | (4 | ) | (20.75 | ) | — | (8.53 | ) | (18.10 | ) | |||||||||||||||||||||||||||||||
AISC, After By-product Credits, per Ounce | $ | 4.47 | $ | 13.37 | $ | (0.83 | ) | $ | 6.65 | $ | 1,091 | $ | 9.20 | $ | — | $ | 16.95 | $ | 15.68 | |||||||||||||||||||||||||||||
In thousands (except per ounce amounts) | Nine Months Ended September 30, 2018 | Three Months Ended September 30, 2018 | ||||||||||||||||||||||||||||||
Greens Creek | Lucky Friday(2) | San Sebastian | Corporate(3) | Total Silver | Casa Berardi | Nevada Operations (4) | Total Gold | |||||||||||||||||||||||||
Cost of sales and other direct production costs and depreciation, depletion and amortization | $ | 141,763 | $ | 5,844 | $ | 31,177 | $ | 178,784 | $ | 51,267 | $ | 19,319 | $ | 70,586 | ||||||||||||||||||
Depreciation, depletion and amortization | (34,880 | ) | (803 | ) | (3,586 | ) | (39,269 | ) | (20,054 | ) | (9,187 | ) | (29,241 | ) | ||||||||||||||||||
Treatment costs | 29,136 | 761 | 627 | 30,524 | 535 | 42 | 577 | |||||||||||||||||||||||||
Change in product inventory | 995 | (2,182 | ) | 1,858 | 671 | (1,303 | ) | 7,311 | 6,008 | |||||||||||||||||||||||
Reclamation and other costs | (2,323 | ) | — | (1,374 | ) | (3,697 | ) | (140 | ) | — | (140 | ) | ||||||||||||||||||||
Exclusion of Lucky Friday costs | — | (3,620 | ) | (3,620 | ) | |||||||||||||||||||||||||||
Cash Cost, Before By-product Credits (1) | 134,691 | — | 28,702 | 163,393 | 30,305 | 17,485 | 47,790 | |||||||||||||||||||||||||
Reclamation and other costs | 2,548 | — | 314 | 2,862 | 138 | — | 138 | |||||||||||||||||||||||||
Exploration | 2,909 | — | 6,628 | 1,351 | 10,888 | 854 | 3,322 | 4,176 | ||||||||||||||||||||||||
Sustaining capital | 34,694 | — | 1,119 | 1,338 | 37,151 | 8,244 | 7,061 | 15,305 | ||||||||||||||||||||||||
General and administrative | 27,849 | 27,849 | ||||||||||||||||||||||||||||||
AISC, Before By-product Credits (1) | 174,842 | — | 36,763 | 242,143 | 39,541 | 27,868 | 67,409 | |||||||||||||||||||||||||
By-product credits: | ||||||||||||||||||||||||||||||||
Zinc | (80,308 | ) | — | (80,308 | ) | |||||||||||||||||||||||||||
Gold | (43,237 | ) | (15,505 | ) | (58,742 | ) | ||||||||||||||||||||||||||
Lead | (24,037 | ) | — | (24,037 | ) | |||||||||||||||||||||||||||
Silver | (142 | ) | (1,232 | ) | (1,374 | ) | ||||||||||||||||||||||||||
Total By-product credits | (147,582 | ) | — | (15,505 | ) | (163,087 | ) | (142 | ) | (1,232 | ) | (1,374 | ) | |||||||||||||||||||
Cash Cost, After By-product Credits | $ | (12,891 | ) | $ | — | $ | 13,197 | $ | 306 | $ | 30,163 | $ | 16,253 | $ | 46,416 | |||||||||||||||||
AISC, After By-product Credits | $ | 27,260 | $ | — | $ | 21,258 | $ | 79,056 | $ | 39,399 | $ | 26,636 | $ | 66,035 | ||||||||||||||||||
Divided by silver ounces produced | 5,789 | — | 1,594 | 7,383 | ||||||||||||||||||||||||||||
Cash Cost, Before By-product Credits, per Silver Ounce | $ | 23.27 | $ | — | $ | 18.01 | $ | 22.14 | ||||||||||||||||||||||||
Divided by ounces produced | 44 | 14 | 58 | |||||||||||||||||||||||||||||
Cash Cost, Before By-product Credits, per Ounce | $ | 689 | $ | 1,268 | $ | 827 | ||||||||||||||||||||||||||
By-product credits per ounce | (25.49 | ) | — | (9.73 | ) | (22.09 | ) | (3 | ) | (89 | ) | (24 | ) | |||||||||||||||||||
Cash Cost, After By-product Credits, per Silver Ounce | $ | (2.22 | ) | $ | — | $ | 8.28 | $ | 0.05 | |||||||||||||||||||||||
AISC, Before By-product Credits, per Silver Ounce | $ | 30.20 | $ | — | $ | 23.07 | $ | 32.80 | ||||||||||||||||||||||||
Cash Cost, After By-product Credits, per Ounce | $ | 686 | $ | 1,179 | $ | 803 | ||||||||||||||||||||||||||
AISC, Before By-product Credits, per Ounce | $ | 899 | $ | 2,021 | $ | 1,167 | ||||||||||||||||||||||||||
By-product credits per ounce | (25.49 | ) | — | (9.73 | ) | (22.09 | ) | (3 | ) | (89 | ) | (24 | ) | |||||||||||||||||||
AISC, After By-product Credits, per Silver Ounce | $ | 4.71 | $ | — | $ | 13.34 | $ | 10.71 | ||||||||||||||||||||||||
AISC, After By-product Credits, per Ounce | $ | 896 | $ | 1,932 | $ | 1,143 | ||||||||||||||||||||||||||
In thousands (except per ounce amounts) | Nine Months Ended September 30, 2018 | Three Months Ended September 30, 2018 | ||||||||||||||||||||||
Casa Berardi | Nevada Operations (4) | Total Gold | Total Silver | Total Gold | Total | |||||||||||||||||||
Cost of sales and other direct production costs and depreciation, depletion and amortization | $ | 152,150 | $ | 19,319 | $ | 171,469 | $ | 66,487 | 70,586 | $ | 137,073 | |||||||||||||
Depreciation, depletion and amortization | (54,879 | ) | (9,187 | ) | (64,066 | ) | (14,223 | ) | (29,241 | ) | (43,464 | ) | ||||||||||||
Treatment costs | 1,628 | 42 | 1,670 | 8,606 | 577 | 9,183 | ||||||||||||||||||
Change in product inventory | (1,482 | ) | 7,311 | 5,829 | (6,029 | ) | 6,008 | (21 | ) | |||||||||||||||
Reclamation and other costs | (421 | ) | — | (421 | ) | (1,320 | ) | (140 | ) | (1,460 | ) | |||||||||||||
Exclusion of Lucky Friday costs | (236 | ) | — | (236 | ) | |||||||||||||||||||
Cash Cost, Before By-product Credits (1) | 96,996 | 17,485 | 114,481 | 53,285 | 47,790 | 101,075 | ||||||||||||||||||
Reclamation and other costs | 421 | — | 421 | 954 | 138 | 1,092 | ||||||||||||||||||
Exploration | 3,374 | 3,322 | 6,696 | 4,226 | 4,176 | 8,402 | ||||||||||||||||||
Sustaining capital | 27,120 | 7,061 | 34,181 | 12,219 | 15,305 | 27,524 | ||||||||||||||||||
General and administrative | — | — | — | 10,327 | — | 10,327 | ||||||||||||||||||
AISC, Before By-product Credits (1) | 127,911 | 27,868 | 155,779 | 81,011 | 67,409 | 148,420 | ||||||||||||||||||
By-product credits: | ||||||||||||||||||||||||
Zinc | (20,674 | ) | — | (20,674 | ) | |||||||||||||||||||
Gold | (16,679 | ) | — | (16,679 | ) | |||||||||||||||||||
Lead | (6,041 | ) | — | (6,041 | ) | |||||||||||||||||||
Silver | (491 | ) | (1,232 | ) | (1,723 | ) | (1,374 | ) | (1,374 | ) | ||||||||||||||
Total By-product credits | (491 | ) | (1,232 | ) | (1,723 | ) | (43,394 | ) | (1,374 | ) | (44,768 | ) | ||||||||||||
Cash Cost, After By-product Credits | $ | 96,505 | $ | 16,253 | $ | 112,758 | $ | 9,891 | $ | 46,416 | $ | 56,307 | ||||||||||||
AISC, After By-product Credits | $ | 127,420 | $ | 26,636 | $ | 154,056 | $ | 37,617 | $ | 66,035 | $ | 103,652 | ||||||||||||
Divided by gold ounces produced | 127 | 14 | 141 | |||||||||||||||||||||
Cash Cost, Before By-product Credits, per Gold Ounce | $ | 764 | $ | 1,268 | $ | 814 | ||||||||||||||||||
Divided by ounces produced | 2,398 | 58 | ||||||||||||||||||||||
Cash Cost, Before By-product Credits, per Ounce | $ | 22.22 | $ | 827 | ||||||||||||||||||||
By-product credits per ounce | (4 | ) | (89 | ) | (12 | ) | (18.10 | ) | (24 | ) | ||||||||||||||
Cash Cost, After By-product Credits, per Gold Ounce | $ | 760 | $ | 1,179 | $ | 802 | ||||||||||||||||||
AISC, Before By-product Credits, per Gold Ounce | $ | 1,008 | $ | 2,021 | $ | 1,107 | ||||||||||||||||||
Cash Cost, After By-product Credits, per Ounce | $ | 4.12 | $ | 803 | ||||||||||||||||||||
AISC, Before By-product Credits, per Ounce | $ | 33.78 | $ | 1,167 | ||||||||||||||||||||
By-product credits per ounce | (4 | ) | (89 | ) | (12 | ) | (18.10 | ) | (24 | ) | ||||||||||||||
AISC, After By-product Credits, per Gold Ounce | $ | 1,004 | $ | 1,932 | $ | 1,095 | ||||||||||||||||||
AISC, After By-product Credits, per Ounce | $ | 15.68 | $ | 1,143 | ||||||||||||||||||||
In thousands (except per ounce amounts) | Nine Months Ended September 30, 2018 | Nine Months Ended September 30, 2019 | ||||||||||||||||||||||||||||||
Total Silver | Total Gold | Total | Greens Creek | Lucky Friday(2) | San Sebastian | Corporate(3) | Total Silver | |||||||||||||||||||||||||
Cost of sales and other direct production costs and depreciation, depletion and amortization | $ | 178,784 | 171,469 | $ | 350,253 | $ | 140,237 | $ | 11,149 | $ | 36,338 | $ | 187,724 | |||||||||||||||||||
Depreciation, depletion and amortization | (39,269 | ) | (64,066 | ) | (103,335 | ) | (32,228 | ) | (891 | ) | (6,934 | ) | (40,053 | ) | ||||||||||||||||||
Treatment costs | 30,524 | 1,670 | 32,194 | 34,319 | 1,834 | 432 | 36,585 | |||||||||||||||||||||||||
Change in product inventory | 671 | 5,829 | 6,500 | 9,168 | 708 | (1,378 | ) | 8,498 | ||||||||||||||||||||||||
Reclamation and other costs | (3,697 | ) | (421 | ) | (4,118 | ) | (1,439 | ) | — | (1,030 | ) | (2,469 | ) | |||||||||||||||||||
Exclusion of Lucky Friday costs | (3,620 | ) | — | (3,620 | ) | — | (12,800 | ) | (12,800 | ) | ||||||||||||||||||||||
Cash Cost, Before By-product Credits (1) | 163,393 | 114,481 | 277,874 | 150,057 | — | 27,428 | 177,485 | |||||||||||||||||||||||||
Reclamation and other costs | 2,862 | 421 | 3,283 | 2,212 | — | 369 | 2,581 | |||||||||||||||||||||||||
Exploration | 10,888 | 6,696 | 17,584 | 625 | — | 4,452 | 1,105 | 6,182 | ||||||||||||||||||||||||
Sustaining capital | 37,151 | 34,181 | 71,332 | 22,943 | — | 1,496 | 73 | 24,512 | ||||||||||||||||||||||||
General and administrative | 27,849 | — | 27,849 | 26,855 | 26,855 | |||||||||||||||||||||||||||
AISC, Before By-product Credits (1) | 242,143 | 155,779 | 397,922 | 175,837 | — | 33,745 | 237,615 | |||||||||||||||||||||||||
By-product credits: | ||||||||||||||||||||||||||||||||
Zinc | (80,308 | ) | — | (80,308 | ) | (67,957 | ) | — | (67,957 | ) | ||||||||||||||||||||||
Gold | (58,742 | ) | — | (58,742 | ) | (49,385 | ) | (16,193 | ) | (65,578 | ) | |||||||||||||||||||||
Lead | (24,037 | ) | — | (24,037 | ) | (20,764 | ) | — | (20,764 | ) | ||||||||||||||||||||||
Silver | (1,723 | ) | (1,723 | ) | ||||||||||||||||||||||||||||
Total By-product credits | (163,087 | ) | (1,723 | ) | (164,810 | ) | (138,106 | ) | — | (16,193 | ) | (154,299 | ) | |||||||||||||||||||
Cash Cost, After By-product Credits | $ | 306 | $ | 112,758 | $ | 113,064 | $ | 11,951 | $ | — | $ | 11,235 | $ | 23,186 | ||||||||||||||||||
AISC, After By-product Credits | $ | 79,056 | $ | 154,056 | $ | 233,112 | $ | 37,731 | $ | — | $ | 17,552 | $ | 83,316 | ||||||||||||||||||
Divided by ounces produced | 7,383 | 141 | ||||||||||||||||||||||||||||||
Cash Cost, Before By-product Credits, per Ounce | $ | 22.14 | $ | 814 | ||||||||||||||||||||||||||||
Divided by silver ounces produced | 7,149 | — | 1,446 | 8,595 | ||||||||||||||||||||||||||||
Cash Cost, Before By-product Credits, per Silver Ounce | $ | 20.99 | $ | — | $ | 18.97 | $ | 20.65 | ||||||||||||||||||||||||
By-product credits per ounce | (22.09 | ) | (12 | ) | (19.32 | ) | — | (11.20 | ) | (17.95 | ) | |||||||||||||||||||||
Cash Cost, After By-product Credits, per Ounce | $ | 0.05 | $ | 802 | ||||||||||||||||||||||||||||
AISC, Before By-product Credits, per Ounce | $ | 32.80 | $ | 1,107 | ||||||||||||||||||||||||||||
Cash Cost, After By-product Credits, per Silver Ounce | $ | 1.67 | $ | — | $ | 7.77 | $ | 2.70 | ||||||||||||||||||||||||
AISC, Before By-product Credits, per Silver Ounce | $ | 24.60 | $ | — | $ | 23.34 | $ | 27.65 | ||||||||||||||||||||||||
By-product credits per ounce | (22.09 | ) | (12 | ) | (19.32 | ) | — | (11.20 | ) | (17.95 | ) | |||||||||||||||||||||
AISC, After By-product Credits, per Ounce | $ | 10.71 | $ | 1,095 | ||||||||||||||||||||||||||||
AISC, After By-product Credits, per Silver Ounce | $ | 5.28 | $ | — | $ | 12.14 | $ | 9.70 | ||||||||||||||||||||||||
In thousands (except per ounce amounts) | Nine Months Ended September 30, 2017 | Nine Months Ended September 30, 2019 | ||||||||||||||||||||||||||||||||||||||
Greens Creek | Lucky Friday(2) | San Sebastian | Corporate(3) | Total Silver | Casa Berardi (Gold) | Total | Casa Berardi | Nevada Operations (4) | Total Gold | |||||||||||||||||||||||||||||||
Cost of sales and other direct production costs and depreciation, depletion and amortization | $ | 140,241 | $ | 14,542 | $ | 18,377 | $ | 173,160 | $ | 138,363 | $ | 311,523 | $ | 157,239 | $ | 105,277 | $ | 262,516 | ||||||||||||||||||||||
Depreciation, depletion and amortization | (39,442 | ) | (2,433 | ) | (2,036 | ) | (43,911 | ) | (43,075 | ) | (86,986 | ) | (53,806 | ) | (45,179 | ) | (98,985 | ) | ||||||||||||||||||||||
Treatment costs | 37,621 | 4,257 | 906 | 42,784 | 1,774 | 44,558 | 1,429 | 119 | 1,548 | |||||||||||||||||||||||||||||||
Change in product inventory | 5,398 | 1,811 | (192 | ) | 7,017 | 881 | 7,898 | 971 | (3,097 | ) | (2,126 | ) | ||||||||||||||||||||||||||||
Reclamation and other costs | (1,474 | ) | (163 | ) | (1,089 | ) | (2,726 | ) | (354 | ) | (3,080 | ) | (385 | ) | (1,641 | ) | (2,026 | ) | ||||||||||||||||||||||
Cash Cost, Before By-product Credits (1) | 142,344 | 18,014 | 15,966 | 176,324 | 97,589 | 273,913 | 105,448 | 55,479 | 160,927 | |||||||||||||||||||||||||||||||
Reclamation and other costs | 1,999 | 217 | 351 | 2,567 | 353 | 2,920 | 386 | 1,134 | 1,520 | |||||||||||||||||||||||||||||||
Exploration | 3,339 | (1 | ) | 4,984 | 1,307 | 9,629 | 3,029 | 12,658 | 2,890 | 2,048 | 4,938 | |||||||||||||||||||||||||||||
Sustaining capital | 24,895 | 4,109 | 2,379 | 2,275 | 33,658 | 38,245 | 71,903 | 28,360 | 27,565 | 55,925 | ||||||||||||||||||||||||||||||
General and administrative | 29,044 | 29,044 | 29,044 | |||||||||||||||||||||||||||||||||||||
AISC, Before By-product Credits (1) | 172,577 | 22,339 | 23,680 | 251,222 | 139,216 | 390,438 | 137,084 | 86,226 | 223,310 | |||||||||||||||||||||||||||||||
By-product credits: | ||||||||||||||||||||||||||||||||||||||||
Zinc | (72,472 | ) | (4,353 | ) | (76,825 | ) | (76,825 | ) | ||||||||||||||||||||||||||||||||
Gold | (42,675 | ) | (24,032 | ) | (66,707 | ) | (66,707 | ) | ||||||||||||||||||||||||||||||||
Lead | (22,696 | ) | (8,599 | ) | �� | (31,295 | ) | (31,295 | ) | |||||||||||||||||||||||||||||||
Silver | (450 | ) | (450 | ) | (328 | ) | (2,551 | ) | (2,879 | ) | ||||||||||||||||||||||||||||||
Total By-product credits | (137,843 | ) | (12,952 | ) | (24,032 | ) | (174,827 | ) | (450 | ) | (175,277 | ) | (328 | ) | (2,551 | ) | (2,879 | ) | ||||||||||||||||||||||
Cash Cost, After By-product Credits | $ | 4,501 | $ | 5,062 | $ | (8,066 | ) | $ | 1,497 | $ | 97,139 | $ | 98,636 | $ | 105,120 | $ | 52,928 | $ | 158,048 | |||||||||||||||||||||
AISC, After By-product Credits | $ | 34,734 | $ | 9,387 | $ | (352 | ) | $ | 76,395 | $ | 138,766 | $ | 215,161 | $ | 136,756 | $ | 83,675 | $ | 220,431 | |||||||||||||||||||||
Divided by ounces produced | 6,206 | 769 | 2,498 | 9,473 | 113 | |||||||||||||||||||||||||||||||||||
Cash Cost, Before By-product Credits, per Ounce | $ | 22.94 | $ | 23.42 | $ | 6.39 | $ | 18.62 | $ | 862 | ||||||||||||||||||||||||||||||
Divided by gold ounces produced | 100 | 45 | 145 | |||||||||||||||||||||||||||||||||||||
Cash Cost, Before By-product Credits, per Gold Ounce | $ | 1,058 | $ | 1,221 | $ | 1,109 | ||||||||||||||||||||||||||||||||||
By-product credits per ounce | (22.21 | ) | (16.84 | ) | (9.62 | ) | (18.46 | ) | (4 | ) | (3 | ) | (56 | ) | (20 | ) | ||||||||||||||||||||||||
Cash Cost, After By-product Credits, per Ounce | $ | 0.73 | $ | 6.58 | $ | (3.23 | ) | $ | 0.16 | $ | 858 | |||||||||||||||||||||||||||||
AISC, Before By-product Credits, per Ounce | $ | 27.81 | $ | 29.05 | $ | 9.48 | $ | 26.52 | $ | 1,230 | ||||||||||||||||||||||||||||||
Cash Cost, After By-product Credits, per Gold Ounce | $ | 1,055 | $ | 1,165 | $ | 1,089 | ||||||||||||||||||||||||||||||||||
AISC, Before By-product Credits, per Gold Ounce | $ | 1,376 | $ | 1,897 | $ | 1,540 | ||||||||||||||||||||||||||||||||||
By-product credits per ounce | (22.21 | ) | (16.84 | ) | (9.62 | ) | (18.46 | ) | (4 | ) | (3 | ) | (56 | ) | (20 | ) | ||||||||||||||||||||||||
AISC, After By-product Credits, per Ounce | $ | 5.60 | $ | 12.21 | $ | (0.14 | ) | $ | 8.06 | $ | 1,226 | |||||||||||||||||||||||||||||
AISC, After By-product Credits, per Gold Ounce | $ | 1,373 | $ | 1,841 | $ | 1,520 | ||||||||||||||||||||||||||||||||||
In thousands (except per ounce amounts) | Nine Months Ended September 30, 2019 | |||||||||||
Total Silver | Total Gold | Total | ||||||||||
Cost of sales and other direct production costs and depreciation, depletion and amortization | $ | 187,724 | 262,516 | $ | 450,240 | |||||||
Depreciation, depletion and amortization | (40,053 | ) | (98,985 | ) | (139,038 | ) | ||||||
Treatment costs | 36,585 | 1,548 | 38,133 | |||||||||
Change in product inventory | 8,498 | (2,126 | ) | 6,372 | ||||||||
Reclamation and other costs | (2,469 | ) | (2,026 | ) | (4,495 | ) | ||||||
Exclusion of Lucky Friday costs | (12,800 | ) | — | (12,800 | ) | |||||||
Cash Cost, Before By-product Credits (1) | 177,485 | 160,927 | 338,412 | |||||||||
Reclamation and other costs | 2,581 | 1,520 | 4,101 | |||||||||
Exploration | 6,182 | 4,938 | 11,120 | |||||||||
Sustaining capital | 24,512 | 55,925 | 80,437 | |||||||||
General and administrative | 26,855 | — | 26,855 | |||||||||
AISC, Before By-product Credits (1) | 237,615 | 223,310 | 460,925 | |||||||||
By-product credits: | ||||||||||||
Zinc | (67,957 | ) | — | (67,957 | ) | |||||||
Gold | (65,578 | ) | — | (65,578 | ) | |||||||
Lead | (20,764 | ) | — | (20,764 | ) | |||||||
Silver | (2,879 | ) | (2,879 | ) | ||||||||
Total By-product credits | (154,299 | ) | (2,879 | ) | (157,178 | ) | ||||||
Cash Cost, After By-product Credits | $ | 23,186 | $ | 158,048 | $ | 181,234 | ||||||
AISC, After By-product Credits | $ | 83,316 | $ | 220,431 | $ | 303,747 | ||||||
Divided by ounces produced | 8,595 | 145 | ||||||||||
Cash Cost, Before By-product Credits, per Ounce | $ | 20.65 | $ | 1,109 | ||||||||
By-product credits per ounce | (17.95 | ) | (20 | ) | ||||||||
Cash Cost, After By-product Credits, per Ounce | $ | 2.70 | $ | 1,089 | ||||||||
AISC, Before By-product Credits, per Ounce | $ | 27.65 | $ | 1,540 | ||||||||
By-product credits per ounce | (17.95 | ) | (20 | ) | ||||||||
AISC, After By-product Credits, per Ounce | $ | 9.70 | $ | 1,520 | ||||||||
In thousands (except per ounce amounts) | Nine Months Ended September 30, 2018 | |||||||||||||||||||
Greens Creek | Lucky Friday(2) | San Sebastian | Corporate(3) | Total Silver | ||||||||||||||||
Cost of sales and other direct production costs and depreciation, depletion and amortization | $ | 141,763 | $ | 5,844 | $ | 31,177 | $ | 178,784 | ||||||||||||
Depreciation, depletion and amortization | (34,880 | ) | (803 | ) | (3,586 | ) | (39,269 | ) | ||||||||||||
Treatment costs | 29,136 | 761 | 627 | 30,524 | ||||||||||||||||
Change in product inventory | 995 | (2,182 | ) | 1,858 | 671 | |||||||||||||||
Reclamation and other costs | (2,323 | ) | — | (1,374 | ) | (3,697 | ) | |||||||||||||
Exclusion of Lucky Friday costs | — | (3,620 | ) | — | (3,620 | ) | ||||||||||||||
Cash Cost, Before By-product Credits (1) | 134,691 | — | 28,702 | 163,393 | ||||||||||||||||
Reclamation and other costs | 2,548 | — | 314 | 2,862 | ||||||||||||||||
Exploration | 2,909 | — | 6,628 | 1,351 | 10,888 | |||||||||||||||
Sustaining capital | 34,694 | — | 1,119 | 1,338 | 37,151 | |||||||||||||||
General and administrative | 27,849 | 27,849 | ||||||||||||||||||
AISC, Before By-product Credits (1) | 174,842 | — | 36,763 | 242,143 | ||||||||||||||||
By-product credits: | ||||||||||||||||||||
Zinc | (80,308 | ) | — | (80,308 | ) | |||||||||||||||
Gold | (43,237 | ) | — | (15,505 | ) | (58,742 | ) | |||||||||||||
Lead | (24,037 | ) | — | (24,037 | ) | |||||||||||||||
Total By-product credits | (147,582 | ) | — | (15,505 | ) | (163,087 | ) | |||||||||||||
Cash Cost, After By-product Credits | $ | (12,891 | ) | $ | — | $ | 13,197 | $ | 306 | |||||||||||
AISC, After By-product Credits | $ | 27,260 | $ | — | $ | 21,258 | $ | 79,056 | ||||||||||||
Divided by ounces produced | 5,789 | — | 1,594 | 7,383 | ||||||||||||||||
Cash Cost, Before By-product Credits, per Ounce | $ | 23.27 | $ | — | $ | 18.01 | $ | 22.14 | ||||||||||||
By-product credits per ounce | (25.49 | ) | — | (9.73 | ) | (22.09 | ) | |||||||||||||
Cash Cost, After By-product Credits, per Ounce | $ | (2.22 | ) | $ | — | $ | 8.28 | $ | 0.05 | |||||||||||
AISC, Before By-product Credits, per Ounce | $ | 30.20 | $ | — | $ | 23.07 | $ | 32.80 | ||||||||||||
By-product credits per ounce | (25.49 | ) | — | (9.73 | ) | (22.09 | ) | |||||||||||||
AISC, After By-product Credits, per Ounce | $ | 4.71 | $ | — | $ | 13.34 | $ | 10.71 | ||||||||||||
In thousands (except per ounce amounts) | Nine Months Ended September 30, 2018 | |||||||||||
Casa Berardi | Nevada Operations (4) | Total Gold | ||||||||||
Cost of sales and other direct production costs and depreciation, depletion and amortization | $ | 152,150 | $ | 19,319 | $ | 171,469 | ||||||
Depreciation, depletion and amortization | (54,879 | ) | (9,187 | ) | (64,066 | ) | ||||||
Treatment costs | 1,628 | 42 | 1,670 | |||||||||
Change in product inventory | (1,482 | ) | 7,311 | 5,829 | ||||||||
Reclamation and other costs | (421 | ) | — | (421 | ) | |||||||
Cash Cost, Before By-product Credits (1) | 96,996 | 17,485 | 114,481 | |||||||||
Reclamation and other costs | 421 | — | 421 | |||||||||
Exploration | 3,374 | 3,322 | 6,696 | |||||||||
Sustaining capital | 27,120 | 7,061 | 34,181 | |||||||||
AISC, Before By-product Credits (1) | 127,911 | 27,868 | 155,779 | |||||||||
By-product credits: | ||||||||||||
Silver | (491 | ) | (1,232 | ) | (1,723 | ) | ||||||
Total By-product credits | (491 | ) | (1,232 | ) | (1,723 | ) | ||||||
Cash Cost, After By-product Credits | $ | 96,505 | $ | 16,253 | $ | 112,758 | ||||||
AISC, After By-product Credits | $ | 127,420 | $ | 26,636 | $ | 154,056 | ||||||
Divided by ounces produced | 127 | 14 | 141 | |||||||||
Cash Cost, Before By-product Credits, per Ounce | $ | 764 | $ | 1,268 | $ | 814 | ||||||
By-product credits per ounce | (4 | ) | (89 | ) | (12 | ) | ||||||
Cash Cost, After By-product Credits, per Ounce | $ | 760 | $ | 1,179 | $ | 802 | ||||||
AISC, Before By-product Credits, per Ounce | $ | 1,008 | $ | 2,021 | $ | 1,107 | ||||||
By-product credits per ounce | (4 | ) | (89 | ) | (12 | ) | ||||||
AISC, After By-product Credits, per Ounce | $ | 1,004 | $ | 1,932 | $ | 1,095 | ||||||
In thousands (except per ounce amounts) | Nine Months Ended September 30, 2018 | |||||||||||
Total Silver | Total Gold | Total | ||||||||||
Cost of sales and other direct production costs and depreciation, depletion and amortization | $ | 178,784 | 171,469 | $ | 350,253 | |||||||
Depreciation, depletion and amortization | (39,269 | ) | (64,066 | ) | (103,335 | ) | ||||||
Treatment costs | 30,524 | 1,670 | 32,194 | |||||||||
Change in product inventory | 671 | 5,829 | 6,500 | |||||||||
Reclamation and other costs | (3,697 | ) | (421 | ) | (4,118 | ) | ||||||
Exclusion of Lucky Friday costs | (3,620 | ) | — | (3,620 | ) | |||||||
Cash Cost, Before By-product Credits (1) | 163,393 | 114,481 | 277,874 | |||||||||
Reclamation and other costs | 2,862 | 421 | 3,283 | |||||||||
Exploration | 10,888 | 6,696 | 17,584 | |||||||||
Sustaining capital | 37,151 | 34,181 | 71,332 | |||||||||
General and administrative | 27,849 | — | 27,849 | |||||||||
AISC, Before By-product Credits (1) | 242,143 | 155,779 | 397,922 | |||||||||
By-product credits: | ||||||||||||
Zinc | (80,308 | ) | — | (80,308 | ) | |||||||
Gold | (58,742 | ) | — | (58,742 | ) | |||||||
Lead | (24,037 | ) | — | (24,037 | ) | |||||||
Silver | (1,723 | ) | (1,723 | ) | ||||||||
Total By-product credits | (163,087 | ) | (1,723 | ) | (164,810 | ) | ||||||
Cash Cost, After By-product Credits | $ | 306 | $ | 112,758 | $ | 113,064 | ||||||
AISC, After By-product Credits | $ | 79,056 | $ | 154,056 | $ | 233,112 | ||||||
Divided by ounces produced | 7,383 | 141 | ||||||||||
Cash Cost, Before By-product Credits, per Ounce | $ | 22.14 | $ | 814 | ||||||||
By-product credits per ounce | (22.09 | ) | (12 | ) | ||||||||
Cash Cost, After By-product Credits, per Ounce | $ | 0.05 | $ | 802 | ||||||||
AISC, Before By-product Credits, per Ounce | $ | 32.80 | $ | 1,107 | ||||||||
By-product credits per ounce | (22.09 | ) | (12 | ) | ||||||||
AISC, After By-product Credits, per Ounce | $ | 10.71 | $ | 1,095 | ||||||||
(1) | Includes all direct and indirect operating costs related to the physical activities of producing metals, including mining, processing and other plant costs, third-party refining and marketing expense, on-site general and administrative costs, royalties and mining production taxes, before by-product revenues earned from all metals other than the primary metal produced at each unit. AISC, Before By-product Credits also includes on-site exploration, reclamation, and sustaining capital costs. |
(2) | The unionized employees at Lucky Friday have been on strike since March 13, 2017, and production at Lucky Friday has been limited since that time. For the first nine months of |
|
|
|
|
(3) | AISC, Before By-product Credits for |
(4) | The Nevada Operations were acquired on July 20, 2018 as a result of the acquisition of Klondex (see Note 13 of Notes to Condensed Consolidated Financial Statement (Unaudited) for more information). |
Financial Liquidity and Capital Resources
Our liquid assets include (in millions):
September 30, 2018 | December 31, 2017 | September 30, 2019 | December 31, 2018 | |||||||||||||
Cash and cash equivalents held in U.S. dollars | $ | 42.8 | $ | 168.0 | $ | 23.7 | $ | 15.7 | ||||||||
Cash and cash equivalents held in foreign currency | 18.1 | 18.1 | 9.3 | 11.7 | ||||||||||||
Total cash and cash equivalents | 60.9 | 186.1 | 33.0 | 27.4 | ||||||||||||
Marketable debt securities - current | — | 33.8 | ||||||||||||||
Marketable equity securities - non-current | 7.2 | 7.6 | 7.3 | 6.6 | ||||||||||||
Total cash, cash equivalents and investments | $ | 68.1 | $ | 227.5 | $ | 40.3 | $ | 34.0 | ||||||||
Cash and cash equivalents decreasedincreased by $125.2$5.6 million in the first nine months of 2018.2019. Cash held in foreign currencies represents balances in Canadian dollars and Mexican pesos, with the balance remaining consistent during$2.4 million decrease in the first nine months of 2018. Current marketable debt securities decreased by $33.8 million (discussed below) and2019 resulting from decreases in both currencies held. The value of non-current marketable equity securities decreasedincreased by $0.4$0.7 million (see Note 32 of Notes to Condensed Consolidated Financial Statements (Unaudited) for more information).
As further discussed in Note 1413 of Notes to Condensed Consolidated Financial Statements (Unaudited), on July 20, 2018, we completed the acquisition of Klondex for total consideration of approximately $414.2$413.9 million, consisting of $252.6$252.2 million for the issuance ofin shares of our common stock and warrants to purchase shares of our common stock and $161.7 million in cash. Klondex had cash, cash equivalents and restricted cash and cash equivalents not relating to their Canadian assets of approximately $22.4 million and $35.0 million drawn on their revolving credit facility at the time of the acquisition. We paid off the amount drawn on the Klondex revolving credit facility in July 2018.
As discussed in Note 109 of Notes to Condensed Consolidated Financial Statements (Unaudited), on April 12, 2013, we completed an offering of Senior Notes in the total principal amount of US$500 million, which have a total principal balance of $506.5 million as of September 30, 20182019. The Senior Notes are due May 1, 2021 and bear interest at a rate of 6.875% per year from the most recent payment date to which interest has been paid or provided for. In addition, in March 2018 we entered into a note purchase agreement pursuant to which we issued our Series 2018-A Senior Notes due May 1, 2021 (the “RQ Notes”) for total principal of CAD$40 million (approximately USD$30.8 million at the time of the transaction) to Ressources Québec. The RQ Notes bear interest at a rate of 4.68% per year. Interest on the Senior Notes and RQ Notes is payable on May 1 and November 1 of each year, commencing November 1, 2013 and May 1, 2018, respectively, and we have made all interest payments payable to date. Also, in July 2018 we entered into a new $200$250 million revolving credit facility, which increasedwas amended in July 2019 to, among other things, lower the amount available to be borrowed under it to $150 million until the earlier of (i) our election to restore the amount available to $250 million following the fiscal quarter ending September 30, 2020 or (ii) our election to restore the amount available to $250 million by demonstrating two consecutive quarters of leverage ratio less than or equal to 4.00:1 beginning in November upon meeting certain conditions, including adding certain subsidiariesthe third quarter of Klondex as borrowers under the credit facility and pledging the assets of those subsidiaries as additional collateral under the credit facility.2019. Interest is payable on amounts drawn from the revolving credit facility at a rate of between 2.25% and 3.25% over the London Interbank Offered Rate, or between 1.25% and 2.25% over an alternative base rate, with interest payable on March 31, June 30, September 30, and December 31 of each year. There were no amountswas $50.0 million drawn on the credit facility as of September 30, 2018.2019. We frequently use surety bonds provided by a third-party surety for required financial assurance. In addition to paying them a fee, the surety may demand that we post collateral. Such demands could be for material amounts, and could negatively impact our available liquidity. We have utilized letters of credit under the revolving credit facility for such collateral and other financial assurances, and there was a total of $38.5 million in letters of credit outstanding as of September 30, 2019.
As further discussed in the Lucky Friday Segment section above, the union employees at Lucky Friday have been on strike since March 13, 2017, and production at Lucky Friday has been limited since that time. In September 2019, a tentative agreement was reached between the Company and the union negotiating committee. Before the collective bargaining agreement is finalized, it must be ratified by a majority of the union members. If the agreement is voted on and ratified, we would expect the mine to be staffed in stages, and that this would put Lucky Friday on a path back to full production. We believe it would take approximately one year to return to full production after re-staffing starts. We cannot predict whether or when the current tentative agreement will be ratified or if an agreement will otherwise be reached, or, if an agreement is not ratified, how long the strike will last or whether an agreementwhen there will be reached.a return to full production. As a result of the strike or other related events, operations at Lucky Friday could continue to be disrupted, which could adversely affect our financial condition and results of operations.
As discussed in Note 98 of Notes to Condensed Consolidated Financial Statements (Unaudited), in February 2016 we entered into an equity distribution agreement under which we may issue and sell shares of our common stock from time to time having an aggregate offering price of up to $75 million, with the net proceeds available for general corporate purposes. Whether or not we engage in sales from time to time may depend on a variety of factors, including share price, our cash resources, customary black-out restrictions, and whether we haveare in possession of any material insidenon-public information, and the agreement can be terminated by us at any time. As of September 30, 2018,2019, we had sold 5,634,7587,173,614 shares through this program for net proceeds of $20.8 million, including 1,025,911$24.5 million. There were no shares sold under the equity distribution agreement during the third quarterfirst nine months of 2018 for net proceeds of $3.1 million.2019.
Pursuant to our common stock dividend policy described in Note 98 of Notes to Condensed Consolidated Financial Statements (Unaudited), our Board of Directors declared and paid dividends on common stock totaling $3.2$3.7 million and $3.0$3.2 million in the first nine months of 20182019 and 2017,2018, respectively. On November 6, 2018,August 5, 2019, our Board of Directors declared a dividend on common stock totaling $1.2 million payablepaid in December 2018.September 2019. Our dividend policy has a silver-price-linked component which ties the amount of declared common stock dividends to our realized silver price for the preceding quarter. Another component of our common stock dividend policy anticipates paying an annual minimum dividend. The declaration and payment of dividends on common stock is at the sole discretion of our board of directors, and there can be no assurance that we will continue to declare and pay common stock dividends in the future.
On May 8, 2012, we announced that our board of directors approved a stock repurchase program. Under the program, we are authorized to repurchase up to 20 million shares of our outstanding common stock from time to time in open market or privately negotiated transactions, depending on prevailing market conditions and other factors. The repurchase program may be modified, suspended or discontinued by us at any time. Whether or not we engage in repurchases from time to time may depend on a variety of factors, including not only price and cash resources, but customary black-out restrictions, whether we have any material inside information, limitations on share repurchases or cash usage that may be imposed by our credit agreement or in connection with issuances of securities, alternative uses for cash, applicable law, and other investment opportunities from time to time. As of September 30, 2018,2019, 934,100 shares havehad been purchased in prior periods at an average price of $3.99 per share, leaving 19.1 million shares that may yet be purchased under the program. The closing price of our common stock at November 6, 2018,5, 2019, was $2.49$2.30 per share. No shares were purchased under the program during the first nine months of 2019.
We may defer some capital investment and/or exploration and pre-development activities, engage in asset sales or secure additional capital if necessary to maintain liquidity. We also may pursue additional acquisition opportunities, which could require additional equity issuances or other forms of financing. There can be no assurance that such financing will be available to us.
As a result of our current cash balances, the performance of our current and expected operations, current metals prices, proceeds from potential at-the-market sales of common stock, and current and projected availability of approximately $247 million of our $250 million revolving credit facility, we believe our cash, cash equivalents, investments, projected cash from operations, and availability of financing (including equity issuances), if needed,we will be adequateable to meet our obligations and other potential cash requirements during the next 12 months. Our obligations and other uses of cash may include, but are not limited to: debt service obligations related to the Senior Notes, RQ Notes and revolving credit facility, (if amounts are drawn),principal payments under our revolving credit facility, capital expenditures at our operations, potential acquisitions of other mining companies or properties, regulatory matters, litigation, potential repurchases of our common stock under the program described above, and payment of dividends on common stock, if declared by our board of directors. Throughout the second half of 2018 and the first nine months of 2019, we borrowed and repaid amounts under our revolving credit facility in order to meet our ongoing working capital requirements, with $50.0 million outstanding as of September 30, 2019. We anticipate continued borrowing and repayments under our credit facility during the rest of 2019. We currently estimate that in 2018, a total of between $140 million and $145approximately $138 million will be spent on capital expenditures in 2019, including $97.3 million incurred in the first nine months of 2019, primarily for equipment, infrastructure, and development at our mines,mines. We also estimate exploration and pre-development expenditures will total approximately $17.5 million in 2019, including $83.3$16.1 million incurred in the first nine months of 2018. We also estimate that exploration and pre-development expenditures will total approximately $40 million in 2018, including $31.2 million already incurred as of September 30, 2018. In addition, we expect research and development2019. Our expenditures for these items and our current projects in 2018 to total between $6 million and $10 million, including $5.0 million already incurred as of September 30, 2018. However, capital, exploration, pre-development expenditures, and research and developmentrelated plans for 2019 may change based upon our financial position, metals prices, and other considerations. Our ability to fund the activities described above will depend on our operating performance, metals prices, our ability to estimate revenues and costs, sources of liquidity available to us, including the revolving credit facility, and other factors. A sustained downturn in metals prices, or significant increase in operational or capital costs or other uses of cash, our inability to access the credit facility or other sources of liquidity discussed above, or other factors beyond our control could impact our plans. See Part II, Item 1A - Risk Factors - An extended decline in metals prices, an increase in operating or capital costs, mine accidents or closures, increasing environmental obligations, or our inability to convert exploration potential to reserves may cause us to record write-downs, which could negatively impact our results of operations in our quarterly report on 10-Q for the quarter ended June 30, 2019. Also, see Part I, Item 1A - Risk Factors - We may be unable to generate sufficient cash to service all of our indebtedness and meet our other ongoing liquidity needs and may be forced to take other actions to satisfy our obligations under our indebtedness, which may be unsuccessful in our annual report on Form 10-K for the year ended December 31, 2018.
Nine Months Ended | ||||||||
September 30, 2018 | September 30, 2017 | |||||||
Cash provided by operating activities (in millions) | $ | 75.2 | $ | 74.1 | ||||
Nine Months Ended | ||||||||
September 30, 2019 | September 30, 2018 | |||||||
Cash provided by operating activities (in millions) | $ | 63.6 | $ | 75.2 | ||||
Cash provided by operating activities in the first nine months of 2018 increased2019 decreased by $1.1$11.6 million compared to the same period in 20172018 due to a lower decrease in cash from working capital and other asset and liability changes, partially offset by lowernet income, as adjusted for non-cash items.items, partially offset by the impact of working capital and other operating asset and liability changes. Working capital and other operating asset and liability changes resulted in a net cash flow increase of $8.4 million in the first nine months of 2019 compared to a net decrease of $25.2 million in the first nine months of 2018 compared to a net decrease of $26.4 million in the first nine months of 2017.2018. The $1.2$33.6 million variance in working capital changes is primarily attributable to higher accounts payable due to the addition of the Nevada Operations and various projectslower prepaid taxes in progress thereMexico, reduced accruals for incentive compensation, and lower estimated income tax payments in Mexico. Those factors wereproduct inventories, partially offset by higher accounts receivable balances at San Sebastian and Greens Creek. The reduction in income, as adjusted for non-cash items, resulted primarily from reduced gross profit at our San Sebastian unitlower accounts payable and a gross loss at our Nevada Operations unit since its acquisition in July, partially offset by proceeds of $32.8 million from the early settlement of base metals derivatives (see Note 12 of Notes to Condensed Consolidated Financial Statements (Unaudited)).accrued taxes balances.
Nine Months Ended | ||||||||
September 30, 2018 | September 30, 2017 | |||||||
Cash used in investing activities (in millions) | $ | (184.6 | ) | �� | $ | (70.4 | ) | |
Nine Months Ended | ||||||||
September 30, 2019 | September 30, 2018 | |||||||
Cash used in investing activities (in millions) | $ | (95.9 | ) | $ | (184.6 | ) | ||
We had a cash outflow of $139.3 million for the acquisition of Klondex, net of their cash balance acquired, in July 2018. During the first nine months of 2018,2019, we invested $83.3$97.3 million in capital expenditures, not including $7.0$6.5 million in non-cash capital lease additions, an increase of $12.9$14.1 million compared to the same period in 20172018. The increase was primarily due to capital projects at the newly-acquiredaddition of the Nevada Operations.Operations unit acquired in July 2018. In the first nine months of 2018, and 2017, we purchased bonds having maturities of greater than 90 days and less than 365 days with a cost basis of $31.2 million, and $35.3 million, respectively, and bonds valued at $64.9 million and $31.2 million matured during the first nine months of 2018, and 2017, respectively.with no such activity during the first nine months of 2019. We purchased marketable equity securities having a cost basis of $0.8$0.4 million and $1.6$0.8 million during the first nine months of 2019 and 2018, respectively, and 2017, respectively.sold marketable equity securities for proceeds of $1.8 million in the 2019 period. During the first nine months of 2018, and 2017, we received $4.4 million and $5.6 million, respectively, in insurance proceeds related to the collapse of the mill building at the Troy mine in February 2017 due to snow.
Nine Months Ended | ||||||||
September 30, 2018 | September 30, 2017 | |||||||
Cash used in financing activities (in millions) | $ | (15.7 | ) | $ | (2.8 | ) | ||
Nine Months Ended | ||||||||
September 30, 2019 | September 30, 2018 | |||||||
Cash used in financing activities (in millions) | $ | 37.6 | $ | (15.7 | ) | |||
In the first nine months of 2019 and 2018 we had draws of $245.0 million and $47.0 million, respectively, and made repayments of $195.0 million and $47.0 million, respectively, on our revolving credit facility. We also had borrowings $30.8 million for the issuance of the RQ Notes in March 2018, and in July 2018 we repaid the $35.0 million revolving credit facility balance assumed in the acquisition of Klondex. During the first nine months of 2018, and 2017, we received $3.1 million and $9.6 million, respectively, in net proceeds from the sale of shares of our common stock under the equity distribution agreement discussed above. We had borrowings totaling $78.0 in the first nine months of 2018, including $47 million drawn on our revolving credit facility in July 2018, which was repaid in September 2018, and $30.8 million for the issuance of the RQ Notes in March 2018. In addition to repayment of our revolving credit facility balance, in July 2018 we repaid the $35.0 million revolving credit facility balance assumed in the acquisition of Klondex. We made repayments on our capital leases of $6.0$5.5 million and $5.1$6.0 million in the nine-month periods ended September 30, 20182019 and 2017,2018, respectively. During the first nine months of 20182019 and 2017,2018, we paid cash dividends on our common stock totaling $3.2$3.7 million and $3.0$3.2 million, respectively, and cash dividends of $0.4 million in each period on our Series B Preferred Stock.Stock in each of those periods. We acquired treasury shares for $2.7$2.2 million and $3.0$2.7 million in the first nine months of 2019 and 2018, and 2017, respectively, resulting fromas a result of our employees' elections to utilize net share settlement to satisfy their tax withholding obligations related to incentive compensation paid in stock and vesting of restricted stock units through net share settlement.units. See Note 98 of Notes to Condensed Consolidated Financial Statements (Unaudited) for more information.
Exchange rate fluctuations between the U.S. dollar and the Canadian dollar and Mexican peso resulted in a decrease in our cash balance of $0.2 million during the nine months ended September 30, 2018 and an increase of $1.1 million during the nine months ended September 30, 2017, respectively.
Contractual Obligations, Contingent Liabilities and Commitments
The table below presents our fixed, non-cancelable contractual obligations and commitments primarily related to our Senior Notes, RQ Notes, outstanding purchase orders, certain capital expenditures, our credit facility and lease arrangements as of September 30, 20182019 (in thousands):
Payments Due By Period | ||||||||||||||||||||
Less than 1 year | 1-3 years | 4-5 years | More than 5 years | Total | ||||||||||||||||
Purchase obligations (1) | $ | 21,891 | $ | — | $ | — | $ | — | $ | 21,891 | ||||||||||
Commitment fees (2) | 1,000 | 2,000 | 708 | — | 3,708 | |||||||||||||||
Contractual obligations (3) | 1,593 | — | — | — | 1,593 | |||||||||||||||
Capital lease commitments (4) | 6,182 | 8,270 | 1,223 | — | 15,675 | |||||||||||||||
Operating lease commitments (5) | 3,615 | 6,173 | 3,307 | — | 13,095 | |||||||||||||||
Supplemental executive retirement plan (6) | 526 | 1,453 | 1,929 | 4,801 | 8,709 | |||||||||||||||
Senior Notes (7) | 34,822 | 561,635 | — | — | 596,457 | |||||||||||||||
RQ Notes (8) | 1,446 | 33,190 | — | — | 34,636 | |||||||||||||||
Total contractual cash obligations | $ | 71,075 | $ | 612,721 | $ | 7,167 | $ | 4,801 | $ | 695,764 | ||||||||||
Payments Due By Period | ||||||||||||||||||||
Less than 1 year | 1-3 years | 3-5 years | More than 5 years | Total | ||||||||||||||||
Purchase obligations (1) | $ | 7,975 | $ | — | $ | — | $ | — | $ | 7,975 | ||||||||||
Contractual obligations (2) | 1,287 | — | — | — | 1,287 | |||||||||||||||
Finance lease commitments (3) | 6,283 | 7,943 | 1,017 | — | 15,243 | |||||||||||||||
Operating lease commitments (4) | 6,570 | 6,437 | 3,112 | 1,274 | 17,393 | |||||||||||||||
Supplemental executive retirement plan (5) | 738 | 1,757 | 2,377 | 5,421 | 10,293 | |||||||||||||||
Revolving credit facility (6) | 1,274 | 52,135 | — | — | 53,409 | |||||||||||||||
Senior Notes (7) | 34,822 | 526,813 | — | — | 561,635 | |||||||||||||||
RQ Notes (8) | 1,414 | 31,028 | — | — | 32,442 | |||||||||||||||
Total contractual cash obligations | $ | 60,363 | $ | 626,113 | $ | 6,506 | $ | 6,695 | $ | 699,677 | ||||||||||
(1) | Consists of open purchase orders of approximately |
(2) |
|
| As of September 30, |
| Includes scheduled |
(4) | We enter into operating leases in the normal course of business. Substantially all lease agreements have fixed payment terms based on the passage of time. Some lease agreements provide us with the option to renew the lease or purchase the leased property. Our future operating lease obligations would change if we exercised these renewal options and if we entered into additional operating lease arrangements. |
(5) |
|
| These amounts represent our estimate of the future funding requirements for the supplemental executive retirement plan. We believe we will also have funding requirements related to our defined benefit plans in future years; however, such obligations are not fixed in nature and are difficult to estimate, as they involve significant assumptions. See Note |
(6) | We have a $250 million revolving credit agreement under which we are required to pay a standby fee of between 0.5% and 1.0% per annum on undrawn amounts under the revolving credit agreement. There was $50.0 million drawn under the revolving credit agreement as of September 30, 2019, which accrues interest at a rate of between 2.25% and 4.00% over the London Interbank Offer Rate. Because we do not know with any degree of certainty future borrowing needs, there are no additional amounts reflecting future potential obligations to repay borrowings under the credit agreement or related interest or standby fee charges. However, we may have additional amounts drawn under the credit agreement in the future, and the related obligations may differ from the amounts above. In July 2019, we amended the credit facility to, among other things, lower the amount available to be borrowed under it to $150 million until the earlier of (i) our election to restore the amount available to $250 million following the fiscal quarter ending September 30, 2020 or (ii) our election to restore the amount available to $250 million by demonstrating two consecutive quarters of leverage ratio less than or equal to 4.00:1 beginning in the third quarter of 2019. For more information on our credit facilities, see Note 9 of Notes to Condensed Consolidated Financial Statements (Unaudited) |
(7) | On April 12, 2013, we completed an offering of $500 million in aggregate principal amount of our Senior Notes due May 1, 2021. The Senior Notes bear interest at a rate of 6.875% per year from the original date of issuance or the most recent payment date to which interest has been paid or provided for. Interest on the Senior Notes is payable on May 1 and November 1 of each year, commencing November 1, 2013, and we have made all interest payments payable to date. Since the initial offering, we have issued an additional $6.5 million in aggregate principal amount of the Senior Notes to fund obligations under our defined benefit pension plan. See Note |
(8) | On March 5, 2018, we |
We record liabilities for costs associated with mine closure, reclamation of land and other environmental matters. At September 30, 2018,2019, our liabilities for these matters totaled $105.9$111.3 million. Future expenditures related to closure, reclamation and environmental expenditures at our sites are difficult to estimate, although we anticipate we will incur expenditures relating to these obligations over the next 30 years. For additional information relating to our environmental obligations, see Note 54 of Notes to Condensed Consolidated Financial Statements (Unaudited).
Off-Balance Sheet Arrangements
At September 30, 2018,2019, we had no existing off-balance sheet arrangements, as defined under SEC regulations, that have or are reasonably likely to have a current or future effect on our financial condition, revenues or expenses, results of operations, liquidity, capital expenditures or capital resources that are material to investors.
Critical Accounting Estimates
Our significant accounting policies are described in Part IV, Note 1 of Notes to Consolidated Financial Statements in our annual report filed on Form 10-K for the year ended December 31, 20172018. As described in Note 1 of our annual report, we are required to make estimates and assumptions that affect the reported amounts and related disclosures of assets, liabilities, revenue, and expenses. Our estimates are based on our experience and our interpretation of economic, political, regulatory, and other factors that affect our business prospects. Actual results may differ significantly from our estimates.
We believe that our most critical accounting estimates are related to future metals prices; obligations for environmental, reclamation, and closure matters; mineral reserves; and accounting for business combinations, as they require us to make assumptions that are highly uncertain at the time the accounting estimates are made and changes in them are reasonably likely to occur from period to period. Management has discussed the development and selection of these critical accounting estimates with the Audit Committee of our Board of Directors, and the Audit Committee has reviewed the disclosures presented below. In addition, there are other items within our financial statements that require estimation, but are not deemed to be critical. However, changes in estimates used in these and other items could have a material impact on our financial statements.
Future Metals Prices
Metals prices are key components in estimates that determine the valuation of some of our significant assets and liabilities, including properties, plants, equipment and mineral interests, deferred tax assets, and certain accounts receivable. Metals prices are also an important component in the estimation of reserves. As shown under Part I, Item 1. – Business in our annual report filed on Form 10-K for the year ended December 31, 2017,2018, metals prices have historically been volatile. Silver demand arises from investment demand, particularly in exchange-traded funds, industrial demand, and consumer demand. Gold demand arises primarily from investment and consumer demand. Investment demand for silver and gold can be influenced by several factors, including: the value of the U.S. dollar and other currencies, changing U.S. budget deficits, widening availability of exchange-traded funds, interest rate levels, the health of credit markets, and inflationary expectations. Uncertainty related to the political environment in the U.S., Britain's exit from the European Union, U.S. and global trading policies (including tariffs), and a global economic recovery, including recent uncertainty in China, could result in continued investment demand for precious metals. Industrial demand for silver is closely linked to world Gross Domestic Product growth and industrial fabrication levels, as it is difficult to substitute for silver in industrial fabrication. Consumer demand is driven significantly by demand for jewelry and other retail products. We believe that long-term industrial and economic trends, including urbanization and growth of the middle class in countries such as China and India, will result in continued consumer demand for silver and gold and industrial demand for silver. However, China has recently experienced a lower rate of economic growth which could continue in the near term. There can be no assurance whether these trends will continue or how they will impact prices of the metals we produce. In the past, we have recorded impairments to our asset carrying value because of low prices, and we can offer no assurance that prices will either remain at their current levels or increase.
Processes supporting valuation of our assets and liabilities that are most significantly affected by prices include analysis of asset carrying values, depreciation, reserves, and deferred income taxes. On at least an annual basis - and more frequently if circumstances warrant - we examine our depreciation rates, reserve estimates, and the valuation allowances on our deferred tax assets. We examine the carrying values of our assets as changes in facts and circumstances warrant. In our evaluation of carrying values and deferred taxes, we apply several pricing views to our forecasting model, including current prices, analyst price estimates, forward-curve prices, and historical prices (see Mineral Reserves, below, regarding prices used for reserve estimates). Using applicable accounting guidance and our view of metals markets, we use the probability-weighted average of the various methods to determine whether the values of our assets are fairly stated, and to determine the level of valuation allowances, if any, on our deferred tax assets. In addition, estimates of future metals prices are used in the valuation of certain assets in the determination of the purchase price allocations for our acquisitions (see Business Combinations below).
Sales of concentrates sold directly to customers are recorded as revenues when titleupon completion of the performance obligation and risktransfer of loss transfercontrol of the product to the customer (generally at the time of shipment) using estimated forward metals prices for the estimated month of settlement. Due to the time elapsed between shipment of concentrates to the customer and final settlement with the customer, we must estimate the prices at which sales of our metals will be settled. Previously recorded sales and trade accounts receivable are adjusted to estimated settlement prices until final settlement by the customer. Changes in metals prices between shipment and final settlement result in changes to revenues and accounts receivable previously recorded upon shipment. As a result, our trade accounts receivable balances related to concentrate sales are subject to changes in metals prices until final settlement occurs. For more information, see part N. Revenue Recognition of Note 16 of Notes to Condensed Consolidated Financial Statements (Unaudited)in our annual report filed on Form 10-K for the year ended December 31, 2017..
We utilize financially-settled forward and put option contracts to manage our exposure to changes in prices for silver, gold, zinc and lead. See Item 3. – Quantitative and Qualitative Disclosures About Market Risk - Commodity-Price Risk Management below for more information on our contract programs. These contracts do not qualify for hedge accounting and are therefore marked-to-market through earnings each period. Changes in silver, gold, zinc and lead prices between the dates that the contracts are entered into and their settlements will result in changes to the fair value asset or liability associated with the contracts, with a corresponding gain or loss recognized in earnings.
Obligations for Environmental, Reclamation and Closure Matters
Accrued reclamation and closure costs can represent a significant and variable liability on our balance sheet. We have estimated our liabilities under appropriate accounting guidance, and on at least an annual basis - and more frequently if warranted - management reviews our liabilities with our Audit Committee. However, the ranges of liability could exceed the liabilities recognized. If substantial damages were awarded, claims were settled, or remediation costs incurred in excess of our accruals, our financial results or condition could be materially adversely affected.
Mineral Reserves
Critical estimates are inherent in the process of determining our reserves. Our reserves are affected largely by our assessment of future metals prices, as well as by engineering and geological estimates of ore grade, accessibility and production cost. Metals prices are estimated at long-term averages, as described in Part I, Item 2. – Properties in our annual report filed on Form 10-K for the year ended December 31, 2017.2018. Our assessment of reserves occurs at least annually, and periodically utilizes external audits.
Reserves are a key component in the valuation of our properties, plants, equipment and mineral interests. Reserve estimates are used in determining appropriate rates of units-of-production depreciation, with net book value of many assets depreciated over remaining estimated reserves. Reserves are also a key component in forecasts, with which we compare future cash flows to current asset values in an effort to ensure that carrying values are reported appropriately. Our forecasts are also used in determining the level of valuation allowances on our deferred tax assets. Reserves also play a key role in the valuation of certain assets in the determination of the purchase price allocations for acquisitions. Annual reserve estimates are also used to determine conversions of mineral assets beyond the known reserve resulting from business combinations to depreciable reserves, in periods subsequent to the business combinations (see Business Combinations below). Reserves are a culmination of many estimates and are not guarantees that we will recover the indicated quantities of metals or that we will do so at a profitable level.
Business Combinations
We are required to allocate the purchase price of acquired companies to the tangible and intangible assets acquired and liabilities assumed based on their estimated fair values at the acquisition date. The valuation of assets acquired and liabilities assumed requires management to make significant estimates and assumptions, especially with respect to long-lived assets (including mineral assets beyond the known reserve). These estimates include future metals prices and mineral reserves, as discussed above. Management may also be required to make estimates related to the valuation of deferred tax assets or liabilities as part of the purchase price allocation for business combinations. In some cases, we use third-party appraisers to determine the fair values of property and other identifiable assets. In addition, costs related to business combinations are included in earnings as incurred, and our financial results for periods in which business combinations are pursued could be adversely affected as a result.
Item 3. Quantitative and Qualitative Disclosures About Market Risk
The following discussion about our exposure to market risks and risk management activities includes forward-looking statements that involve risks and uncertainties, as well as summarizes the financial instruments held by us at September 30, 2018,2019, which are sensitive to changes in commodity prices and foreign exchange rates and are not held for trading purposes. Actual results could differ materially from those projected in the forward-looking statements. In the normal course of business, we also face risks that are either non-financial or non-quantifiable (See Part I, Item 1A.1A – Risk Factors of our annual report filed on Form 10-K for the year ended December 31, 2017,2018, as updated in Part II, Item 1A -– Risk Factors in our quarterly reports filed on Form 10-Q for the periods ended March 31, 20182019 and June 30, 2018 and this quarterly report filed on Form 10-Q for the period ended September 30, 2018)2019).
Metals Prices
Changes in the market prices of silver, gold, lead and zinc can significantly affect our profitability and cash flow. As discussed in Item 2. Management's Discussion and Analysis - Critical Accounting Estimates, metals prices can fluctuate due to numerous factors beyond our control. As discussed below, we utilize financially-settled forward and put option contracts to manage our exposure to changes in prices for silver, gold, zinc and lead.
Provisional Sales
Sales of all metals products sold directly to customers, including by-product metals, are recorded as revenues when all performance obligations have been completed and the transaction price can be determined or reasonably estimated. For concentrate sales, revenues are generally recorded at the time of shipment at forward prices for the estimated month of settlement. Due to the time elapsed between shipment to the customer and the final settlement with the customer, we must estimate the prices at which sales of our metals will be settled. Previously recorded sales are adjusted to estimated settlement metals prices until final settlement by the customer. Changes in metals prices between shipment and final settlement will result in changes to revenues previously recorded upon shipment. Metals prices can and often do fluctuate widely and are affected by numerous factors beyond our control (see Part I, Item 1A.1A – Risk Factors – A substantial or extended decline in metals prices would have a material adverse effect on us in our annual report filed on Form 10-K for the year ended December 31, 2017)2018). At September 30, 2018,2019, metals contained in concentrates and exposed to future price changes totaled approximately 1.22.9 million ounces of silver, 5,7348,831 ounces of gold, 7,27710,737 tons of zinc, and 2,4476,344 tons of lead. If the price for each metal were to change by 10%, the change in the total value of the concentrates sold would be approximately $4.6$9.9 million. However, as discussed in Commodity-Price Risk Management below, we utilize a program designed and intended to mitigate the risk of negative price adjustments with limited mark-to-market financially-settled forward contracts for our silver, gold, zinc and lead sales.
Commodity-Price Risk Management
AtWe may at times we may use commodity forward sales commitments, commodity swap contracts and commodity put and call option contracts to manage our exposure to fluctuation in the prices of certain metals we produce. Contract positions are designed to ensure that we will receive a defined minimum price for certain quantities of our production, thereby partially offsetting our exposure to fluctuations in market prices. Our risk management policy allowsprovides for up to 75% of our planned metals price exposure for five years into the future, with certain other limitations, to be hedgedcovered under such programs.programs that would establish a ceiling for prices to be realized on future metals sales. These instruments do, however, expose us to (i) credit risk in the form of non-performance by counterparties for contracts in which the contract price exceeds the spot price of a commodity and (ii) price risk to the extent that the spot price exceeds the contract price for quantities of our production covered under contract positions.
We are currently using financially-settled forward contracts to manage the exposure to changes in prices of silver, gold, zinc and lead contained in our Greens Creek concentrate shipments between the time of shipment and final settlement. In addition, at times we useare using financially-settled forward contracts to manage the exposure to changes in prices of zinc and lead (but not silver and gold) contained in our forecasted future Greens Creek concentrate shipments. The following tables summarize the quantities of metals committed under forward sales contracts at September 30, 2019 and December 31, 2018:
September 30, 2019 | Ounces/pounds under contract (in 000's) | Average price per ounce/pound | ||||||||||||||||||||||||||||||
Silver | Gold | Zinc | Lead | Silver | Gold | Zinc | Lead | |||||||||||||||||||||||||
(ounces) | (ounces) | (pounds) | (pounds) | (ounces) | (ounces) | (pounds) | (pounds) | |||||||||||||||||||||||||
Contracts on provisional sales | ||||||||||||||||||||||||||||||||
2019 settlements | 828 | 3 | 16,204 | 2,921 | $ | 18.66 | $ | 1,537 | $ | 1.09 | $ | 0.90 | ||||||||||||||||||||
Contracts on forecasted sales | ||||||||||||||||||||||||||||||||
2019 settlements | — | — | — | 4,409 | N/A | N/A | N/A | $ | 0.95 | |||||||||||||||||||||||
2020 settlements | — | — | — | 4,960 | N/A | N/A | N/A | $ | 0.96 | |||||||||||||||||||||||
December 31, 2018 | Ounces/pounds under contract (in 000's) | Average price per ounce/pound | ||||||||||||||||||||||||||||||
Silver | Gold | Zinc | Lead | Silver | Gold | Zinc | Lead | |||||||||||||||||||||||||
(ounces) | (ounces) | (pounds) | (pounds) | (ounces) | (ounces) | (pounds) | (pounds) | |||||||||||||||||||||||||
Contracts on provisional sales | ||||||||||||||||||||||||||||||||
2019 settlements | 842 | 4 | 18,450 | 2,700 | $ | 14.69 | $ | 1,260 | $ | 1.15 | $ | 0.89 | ||||||||||||||||||||
In June 2019, we began using financially-settled put option contracts to manage the exposure of our forecasted future gold and silver sales to potential declines in market prices for those metals. These put contracts give as the option, but not the obligation, to sell quantities of silver and gold in the future at established prices. The following table summarizes the quantities of metals for which we have entered into put contracts and the average exercise prices as of September 30, 2019:
September 30, 2019 | Ounces under contract (in 000's) | Average price per ounce | ||||||||||||||
Silver | Gold | Silver | Gold | |||||||||||||
(ounces) | (ounces) | (ounces) | (ounces) | |||||||||||||
Contracts on forecasted sales | ||||||||||||||||
2019 settlements | 2,493 | 89 | $ | 15.08 | $ | 1,400 | ||||||||||
2020 settlements | 2,634 | 51 | $ | 15.00 | $ | 1,400 | ||||||||||
In October 2019, we entered into additional put contracts which establish the minimum prices at which we can sell silver and gold relating to forecasted production for a portion of 2020 at $16.00 and $1,450, respectively, per ounce. These contracts have total premiums of approximately $3.2 million to be paid upon maturity.
These forward and put option contracts do not qualify for hedge accounting and are marked-to-market through earnings each period.
AsWe recorded the following balances as of September 30, 2018, we recorded the following balances2019 for the fair value of the contracts:forward and put option contracts held at that time:
• | a current asset of |
• | a current liability of |
We recognized an $8.3a $0.1 million net gainloss during the first nine months of 20182019 on the contracts utilized to manage exposure to prices of metals in our concentrate shipments,that have been sold, which is included in sales of products. The net gainloss recognized on the contracts offsets lossesgains related to price adjustments on our provisional concentrate sales due to changes to silver, gold, lead and zinc prices between the time of sale and final settlement.
We recognized a $40.3$2.7 million net gain during the first nine months of 20182019 on the contracts utilized to manage exposure to prices for forecasted future concentrate shipments.sales. The net gain on these contracts is included as a separate line item under other income (expense), as they relate to forecasted future shipments,sales, as opposed to sales that have already taken place but are subject to final pricing as discussed in the preceding paragraph. The net gain for the first nine months of 20182019 is the result of a decline in zinc and lead prices, partially offset by increasing silver and gold prices. During the third quarterquarters of 2019 and 2018, we settled, prior to their maturity date, contracts in a gain position for cash proceeds to us of approximately $6.7 million and $32.8 million. As a result, there were no metals committed under contracts on forecasted sales as of September 30, 2018. This program,million, respectively. These programs, when utilized isand the contracts are not settled prior to their maturity dates, are designed to mitigate the impact of potential future declines in silver, gold, lead and zinc prices from the price levels established in the contracts (see average price information below)above). When those prices increase compared to the contract prices, we incur losses on the contracts.
The following tables summarize the quantities of metals committed under forward sales contracts at September 30, 2018 and December 31, 2017:
September 30, 2018 | Ounces/pounds under contract (in 000's) | Average price per ounce/pound | ||||||||||||||||||||||||||||||
Silver | Gold | Zinc | Lead | Silver | Gold | Zinc | Lead | |||||||||||||||||||||||||
(ounces) | (ounces) | (pounds) | (pounds) | (ounces) | (ounces) | (pounds) | (pounds) | |||||||||||||||||||||||||
Contracts on provisional sales | ||||||||||||||||||||||||||||||||
2018 settlements | 1,221 | 6 | 10,362 | 4,685 | $ | 14.56 | $ | 1,211 | $ | 1.17 | $ | 0.94 | ||||||||||||||||||||
December 31, 2017 | Ounces/pounds under contract (in 000's) | Average price per ounce/pound | ||||||||||||||||||||||||||||||
Silver | Gold | Zinc | Lead | Silver | Gold | Zinc | Lead | |||||||||||||||||||||||||
(ounces) | (ounces) | (pounds) | (pounds) | (ounces) | (ounces) | (pounds) | (pounds) | |||||||||||||||||||||||||
Contracts on provisional sales | ||||||||||||||||||||||||||||||||
2018 settlements | 1,447 | 5 | 21,550 | 4,740 | $ | 16.64 | $ | 1,279 | $ | 1.45 | $ | 1.11 | ||||||||||||||||||||
Contracts on forecasted sales | ||||||||||||||||||||||||||||||||
2018 settlements | — | — | 32,187 | 16,645 | N/A | N/A | $ | 1.29 | $ | 1.06 | ||||||||||||||||||||||
2019 settlements | — | — | 23,589 | 18,078 | N/A | N/A | $ | 1.30 | $ | 1.09 | ||||||||||||||||||||||
2020 settlements | 3,307 | 2,866 | N/A | N/A | $ | 1.27 | $ | 1.08 | ||||||||||||||||||||||||
Foreign Currency
We operate or have mining interests in Canada and Mexico, which exposes us to risks associated with fluctuations in the exchange rates between the U.S. dollar ("USD") and the Canadian dollar ("CAD") and Mexican peso ("MXN")., respectively. We have determined the functional currency for our Canadian and Mexican operations is the USD. As such, foreign exchange gains and losses associated with the re-measurement of monetary assets and liabilities from CAD and MXN to USD are recorded to earnings each period. For the nine months ended September 30, 2018,2019, we recognized a net foreign exchange gainloss of $2.9$6.7 million. Foreign currency exchange rates are influenced by a number of factors beyond our control. A 10% change in the exchange rate between the USD and CAD from the rate at September 30, 20182019 would have resulted in a change of approximately $11.8$10.6 million in our net foreign exchange gain or loss. A 10% change in the exchange rate between the USD and MXN from the rate at September 30, 20182019 would have resulted in a change of approximately $0.6$1.0 million in our net foreign exchange gain or loss.
In April 2016, we initiated a program to manage our exposure to fluctuations in the exchange rate between the USD and CAD and the impact on our future operating costs denominated in CAD. In October 2016, we also initiated a program to manage our exposure to the impact of fluctuations in the exchange rate between the USD and MXN on our future operating costs denominated in MXN. The programs utilize forward contracts to buy CAD and MXN, and each contract is designated as a cash flow hedge. As of September 30, 2018,2019, we had 94135 forward contracts outstanding to buy a total of CAD$225.1300.7 million having a notional amount of US$174.0231.5 million, and 3010 forward contracts outstanding to buy a total of MXN$178.537.3 million having a notional amount of USD$8.81.8 million. The CAD contracts are related to forecasted cash operating costs at Casa Berardi to be incurred from 20182019 through 20222023 and have CAD-to-USD exchange rates ranging between 1.27291.2702 and 1.3315.1.3332. The MXN contracts are related to forecasted cash operating costs at San Sebastian to be incurred from 20182019 through 2020 and have MXN-to-USD exchange rates ranging between 19.440020.4100 and 20.8550. Our risk management policy allows forprovides that up to 75% of our planned cost exposure for five years into the future tomay be hedged under such programs, and for potential additional programs to manage other foreign currency-related exposure areas.
As of September 30, 2018,2019, we recorded the following balances for the fair value of the contracts:
• | a current asset of | |
|
|
• | a current liability of |
• | a non-current liability of $2.9 million, which is included in other non-current liabilities. |
Net unrealized gainslosses of approximately $1.5$4.3 million related to the effective portion of the hedges were included in accumulated other comprehensive loss as of September 30, 2018.2019. Unrealized gains and losses will be transferred from accumulated other comprehensive loss to current earnings as the underlying operating expenses are recognized. We estimate approximately $0.8$1.3 million in net unrealized gainslosses included in accumulated other comprehensive loss as of September 30, 20182019 would be reclassified to current earnings in the next twelve months. Net realized gains of approximately $0.2$1.2 million on contracts related to underlying expenses which have been recognized were transferred from accumulated other comprehensive loss and included in cost of sales and other direct production costs for the nine months ended September 30, 2018. Net2019. No net unrealized gains of approximately $19 thousandor losses related to ineffectiveness of the hedges were included in gain (loss) on derivatives contracts on our consolidated statements of operations and comprehensive income (loss) for the nine months ended September 30, 2018.2019.
Item 4. Controls and Procedures
An evaluation was performed under the supervision and with the participation of our management, including the Chief Executive Officer (“CEO”) and Chief Financial Officer (“CFO”), of the effectiveness of the design and operation of our disclosure controls and procedures as required by Securities Exchange Act Rules 13a-15(e) and 15d-15(e) as of the end of the period covered by this report. Based on that evaluation, our CEO and CFO concluded that our disclosure controls and procedures, including controls and procedures designed to ensure that information required to be disclosed by us is accumulated and communicated to our management (including our CEO and CFO), were effective, as of September 30, 2018,2019, in assuring them in a timely manner that material information required to be disclosed in this report has been properly recorded, processed, summarized and reported. There were no changes in our internal control over financial reporting during the quarter ended September 30, 20182019 that have materially affected, or are reasonably likely to materially affect, our internal control over financial reporting.
Internal control systems, no matter how well designed and operated, have inherent limitations. Therefore, even a system which is determined to be effective cannot provide absolute assurance that all control issues have been detected or prevented. Our systems of internal controls are designed to provide reasonable assurance with respect to financial statement preparation and presentation.
Part II - Other Information
For information concerning legal proceedings, refer to Note 54 of Notes to Condensed Consolidated Financial Statements (Unaudited), which is incorporated by reference into this Item 1..
Part I, Item 1A.1A – Risk Factors of our annual report filed on Form 10-K for the year ended December 31, 2017,2018, as updated in Part II, Item 1A.1A – Risk Factors in our quarterly reports on Form 10-Q for the periods ended March 31, 20182019 and June 30, 2018,2019, sets forth information relating to important risks and uncertainties that could materially adversely affect our business, financial condition or operating results. Those risk factors continue to be relevant to an understanding of our business, financial condition and operating results. Certain of those risk factors have been updated in this Form 10-Q, as set forth below.
Legal challenges could prevent the Rock Creek or Montanore projects from ever being developed.
The proposed development of our Rock Creek project has been challenged by several regional and national conservation groups at various times since the U.S. Forest Service (“USFS”) issued its initial Record of Decision (“ROD”) in 2003 approving Revett Mining Company’s plan of operation (Revett is now our wholly-owned subsidiary, named Hecla Montana, Inc.). Some of these challenges have alleged violations of a variety of federal and state laws and regulations pertaining to Revett’s permitting activities at Rock Creek, including the Endangered Species Act, the National Environmental Policy Act (“NEPA”), the General Mining Law of 1872, the Federal Land Policy Management Act, the Wilderness Act, the National Forest Management Act, the Clean Water Act, the Clean Air Act, the Forest Service Organic Act of 1897, and the Administrative Procedure Act. Although Revett successfully addressed most of these challenges, Revett was directed by the Montana Federal District Court in May 2010 to produce a Supplemental Environmental Impact Statement (“SEIS”) to address NEPA procedural deficiencies that were identified by the court, which SEIS was posted to the Federal Register on July 20, 2018. We cannot predict how possible future challenges will be resolved. Possible new court challenges in the future to the final SEIS and ROD may delay the planned development at Rock Creek. If we are successful in completing the SEIS and defending any challenges to our Rock Creek project, we would still be required to comply with a number of requirements and conditions as development progresses, failing which could make us unable to continue with development activities.
A joint final Environmental Impact Statement with respect to our Montanore project was issued in December 2015 by the USFS and Montana Department of Environmental Quality, and each agency issued a ROD in February 2016 providing approval for development of the Montanore project. However, private conservation groups have taken and may in the future take actions to oppose or delay the Montanore project. On May 30, 2017, the Montana Federal District Court issued Opinions and Orders in three lawsuits challenging previously granted environmental approvals for the Montanore project. The Orders overturned the approvals for the project granted by the USFS and the United States Fish and Wildlife Service, and in each case remanded the ROD and associated planning documents for further review by the agencies consistent with the Court's Opinions. In June 2017, the Court vacated the agencies’ approvals for the project. As a result, additional work must be performed by the agencies to address the deficiencies in the ROD and associated planning documents identified by the Court, and new approvals must be granted, before the project may proceed beyond certain preliminary actions. In addition, in October 2018, a court in Lincoln County, Montana found that the adit (which is an underground tunnel) which we had intended to use to develop the Montanore project trespassed on certain unpatented mining claims we do not own but which the adit goes through. In the case, which dates back to 2008, the jury delivered a verdict against certain of our subsidiaries for $3,325,000. We plan to appeal the finding of trespass and the award of damages, and we believe there are strong arguments for reversal. There can be no assurance that the appeal will succeed, or that we will remain able to use the portion of the adit that travels beneath the surface of the unpatented claims we do not currently own. As a result, our ability to access, develop or operate the Montanore project is at risk.
Recent events in the State of Montana create additional risks with respect to permitting of the Rock Creek and Montanore projects. In March 2018, each of Hecla Mining Company and our CEO was notified by the Montana Department of Environmental Quality (“DEQ”) of alleged violations of Montana’s mine reclamation statutes and related regulations due to our CEO’s prior role as an officer of a mining company when it declared bankruptcy, together with the fact that subsequently, proceeds from that company's sureties were insufficient to fully fund reclamation at the company’s mine sites in Montana. To date, no enforcement action has been taken to revoke or deny any permits held by our subsidiaries, however, those subsidiaries have commenced litigation challenging the DEQ’s assertion. The DEQ in turn has attempted to initiate litigation against Hecla Mining Company and our CEO. It is possible that the DEQ may bring an enforcement action in the future, or the litigation may be resolved unfavorably, either of which could have the effect of delaying, increasing the costs of, or preventing exploration and development efforts at the two projects.
On November 6, 2018, voters in Montana rejected a ballot initiative (“I-186”) that would have required the DEQ to deny a permit for any new hardrock mines in Montana unless the reclamation plan provides clear and convincing evidence that the mine will not require perpetual treatment of water polluted by acid mine drainage or other contaminants. Although the election results eliminate this risk in the near term, it is possible that a similar initiative will arise in the future, in Montana or other jurisdictions where we operate.
Item 2. Unregistered Sales of Securities and Use of Proceeds
On September 12, 2018, we issued 1,870,749 unregistered shares of our common stock in a private placement to the Hecla Mining Company Retirement Plan Trust in order to satisfy the funding requirements for that defined benefit pension plan. The private placement was exempt from registration under the Securities Act of 1933 pursuant to section 4(a)(2) of that Act. The shares were subsequently registered for resale on a registration statement on Form S-3 filed with the SEC on September 12, 2018. We did not receive any cash proceeds from the issuance of the shares. The shares had a value of approximately $5.0 million at the time of issuance.
Item 4. Mine Safety Disclosures
The information concerning mine safety violations or other regulatory matters required by Section 1503(a) of the Dodd-Frank Wall Street Reform and Consumer Protection Act and Item 104 of Regulation S-K is included in exhibit 95 to this Quarterly Report.
Item 6. Exhibits
Hecla Mining Company and Wholly Owned Subsidiaries
Form 10-Q – September 30, 20182019
Index to Exhibits
| |
3.1 | |
3.2 | |
4.1 | |
4.2(a) | |
4.2(b) | |
4.2(c) |
4.2(d) |
4.2(e) | |
| |
10.1 |
10.2 |
10.3 |
10.4 |
31.1 | Certification pursuant to Section 302 of the Sarbanes-Oxley Act of 2002. * |
31.2 | Certification pursuant to Section 302 of the Sarbanes-Oxley Act of 2002. * |
32.1 | Certification pursuant to Section 906 of the Sarbanes-Oxley Act of 2002. * |
32.2 | Certification pursuant to Section 906 of the Sarbanes-Oxley Act of 2002. * |
95 | |
Mine safety information listed in Section 1503 of the Dodd-Frank Act. * |
101.SCH | |
Inline XBRL Taxonomy Extension Schema.** |
101.CAL | |
Inline XBRL Taxonomy Extension Calculation.** |
101.DEF | |
Inline XBRL Taxonomy Extension Definition.** |
101.LAB | |
Inline XBRL Taxonomy Extension Labels.** |
101.PRE | |
Inline XBRL Taxonomy Extension Presentation.** |
104 | Interactive Data File (formatted as Inline XBRL and contained in Exhibit 101) |
___________________
* Filed herewith.
** XBRL information is furnished and not filed or a part of a registration statement or prospectus for purposes of Sections 11 or 12 of the Securities Act of 1933, as amended, is deemed not filed for purposes of Section 18 of the Securities and Exchange Act of 1934, as amended, and otherwise is not subject to liability under these sections.
Items 2, 3 and 5 of Part II are not applicable and are omitted from this report.
Pursuant to the requirements of the Securities Exchange Act of 1934, the registrant has duly caused this report to be signed on its behalf by the undersigned thereunto duly authorized.
HECLA MINING COMPANY | ||||
(Registrant) | ||||
Date: | November | By: | /s/ Phillips S. Baker, Jr. | |
Phillips S. Baker, Jr., President, | ||||
Chief Executive Officer and Director | ||||
Date: | November | By: | /s/ Lindsay A. Hall | |
Lindsay A. Hall, Senior Vice President and | ||||
Chief Financial Officer | ||||
86
81