NATIONAL RESEARCH CORPORATION AND SUBSIDIARY
CONDENSED Consolidated Statements of Shareholders’ Equity
(In thousands, except share and per share amounts, unaudited)
Common (formerly Class A) | Class B Common | Additional | Retained | Accumulated Other | Treasury Stock | Total | ||||||||||||||||||||||
Balances at June 30, 2018 | $ | 30 | $ | -- | $ | 155,614 | $ | (99,810 | ) | $ | (2,333 | ) | $ | (26,684 | ) | $ | 26,817 | |||||||||||
Purchase of 12,771 shares of class A shares of treasury stock | -- | -- | -- | -- | -- | (511 | ) | (511 | ) | |||||||||||||||||||
Issuance of 36,000 class A common shares for the exercise of stock options | -- | -- | 510 | -- | -- | -- | 510 | |||||||||||||||||||||
Non-cash stock compensation expense | -- | -- | 260 | -- | -- | -- | 260 | |||||||||||||||||||||
Dividends declared of $0.17 per class A common share | -- | -- | -- | (4,209 | ) | -- | -- | (4,209 | ) | |||||||||||||||||||
Other comprehensive income, foreign currency translation adjustment | -- | -- | -- | -- | 280 | -- | 280 | |||||||||||||||||||||
Net income | -- | -- | -- | 6,992 | -- | -- | 6,992 | |||||||||||||||||||||
Balances at September 30, 2018 | $ | 30 | $ | -- | $ | 156,384 | $ | (97,027 | ) | $ | (2,053 | ) | $ | (27,195 | ) | $ | 30,139 | |||||||||||
See accompanying notes to condensed consolidated financial statements.
NATIONAL RESEARCH CORPORATION AND SUBSIDIARY
CONDENSED CONSOLIDATED STATEMENTS OF CASH FLOWS
(In thousands, unaudited)
Nine months ended | Six months ended | |||||||||||||||
September 30, | June 30, | |||||||||||||||
2019 | 2018 | 2020 | 2019 | |||||||||||||
Cash flows from operating activities: | ||||||||||||||||
Net income | $ | 23,708 | $ | 22,246 | $ | 19,470 | $ | 15,589 | ||||||||
Adjustments to reconcile net income to net cash provided by operating activities: | ||||||||||||||||
Depreciation and amortization | 4,285 | 3,996 | 2,777 | 2,855 | ||||||||||||
Deferred income taxes | 919 | 1,775 | 328 | 472 | ||||||||||||
Reserve for uncertain tax positions | (262 | ) | (297 | ) | 143 | (251 | ) | |||||||||
Non-cash share-based compensation expense | 917 | 1,255 | 473 | 609 | ||||||||||||
Loss on disposal of property and equipment | 40 | 212 | - | 40 | ||||||||||||
Net changes in assets and liabilities: | ||||||||||||||||
Trade accounts receivable | (3,343 | ) | (1,842 | ) | (8,382 | ) | (3,088 | ) | ||||||||
Prepaid expenses and other current assets | 978 | (1,632 | ) | (557 | ) | 118 | ||||||||||
Deferred contract costs, net | (508 | ) | 1 | (379 | ) | (259 | ) | |||||||||
Operating lease assets and liability, net | (10 | ) | -- | |||||||||||||
Operating lease assets and liabilities, net | (1 | ) | (4 | ) | ||||||||||||
Accounts payable | 69 | 147 | (338 | ) | 432 | |||||||||||
Accrued expenses, wages, bonuses and profit sharing | 138 | (1,310 | ) | 713 | (222 | ) | ||||||||||
Income taxes receivable and payable | (829 | ) | (554 | ) | (263 | ) | (881 | ) | ||||||||
Deferred revenue | 2,872 | 1,939 | (81 | ) | 696 | |||||||||||
Net cash provided by operating activities | 28,974 | 25,936 | 13,903 | 16,106 | ||||||||||||
Cash flows from investing activities: | ||||||||||||||||
Purchases of property and equipment | (3,429 | ) | (4,858 | ) | (1,427 | ) | (2,280 | ) | ||||||||
Net cash used in investing activities | (3,429 | ) | (4,858 | ) | (1,427 | ) | (2,280 | ) | ||||||||
Cash flows from financing activities: | ||||||||||||||||
Payments related to Recapitalization | -- | (72,370 | ) | |||||||||||||
Proceeds from issuance of note payable | -- | 40,000 | ||||||||||||||
Borrowings on line of credit | 21,000 | 2,500 | - | 16,500 | ||||||||||||
Payments on line of credit | (21,000 | ) | (2,500 | ) | - | (15,500 | ) | |||||||||
Payment of debt issuance costs | -- | (187 | ) | |||||||||||||
Payments on notes payable | (2,767 | ) | (2,170 | ) | (1,600 | ) | (1,837 | ) | ||||||||
Payments on finance lease obligations | (223 | ) | (104 | ) | (124 | ) | (161 | ) | ||||||||
Proceeds from the exercise of stock options | 538 | - | ||||||||||||||
Payment of employee payroll tax withholdings on share-based awards exercised | (1,021 | ) | (712 | ) | (1,859 | ) | (483 | ) | ||||||||
Payment of dividends on common stock | (26,564 | ) | (12,650 | ) | (10,517 | ) | (21,837 | ) | ||||||||
Net cash used in financing activities | (30,575 | ) | (48,193 | ) | (13,562 | ) | (23,318 | ) | ||||||||
Effect of exchange rate changes on cash | 397 | (345 | ) | (474 | ) | 521 | ||||||||||
Change in cash and cash equivalents | (4,633 | ) | (27,460 | ) | (1,560 | ) | (8,971 | ) | ||||||||
Cash and cash equivalents at beginning of period | 12,991 | 34,733 | 13,517 | 12,991 | ||||||||||||
Cash and cash equivalents at end of period | $ | 8,358 | $ | 7,273 | $ | 11,957 | $ | 4,020 | ||||||||
Supplemental disclosure of cash paid for: | ||||||||||||||||
Interest, net of capitalized amounts | $ | 1,558 | $ | 767 | $ | 884 | $ | 1,066 | ||||||||
Income taxes | $ | 5,607 | $ | 2,017 | $ | 261 | $ | 4,404 | ||||||||
Supplemental disclosure of non-cash investing and financing activities: | ||||||||||||||||
Common stock (formerly class A) issued in the Recapitalization in exchange for then-existing class B shares and options. | $ | -- | $ | 121,371 | ||||||||||||
Finance lease obligations originated for property and equipment | $ | 206 | $ | 879 | $ | 105 | $ | 167 | ||||||||
Stock tendered to the Company for cashless exercise of stock options in connection with equity incentive plans | $ | 2,295 | $ | 5,429 | $ | 4,644 | $ | 770 | ||||||||
See accompanying notes to condensed consolidated financial statements.
NATIONAL RESEARCH CORPORATION AND SUBSIDIARY
NOTES TO CONDENSED CONSOLIDATED FINANCIAL STATEMENTS
| SUMMARY OF SIGNIFICANT ACCOUNTING POLICIES |
Description of business and basis of presentation
National Research Corporation, doing business as NRC Health (“NRC Health,” the “Company,” “we,” “our,” “us” or similar terms), is a leading provider of analytics and insights that facilitate measurement and improvement of the patient and employee experience while also increasing patient engagement and customer loyalty for healthcare organizations in the United States and Canada. Our portfolio of solutions representrepresents a unique set of capabilities that individually and collectively provide value to our clients. The solutions are offered at an enterprise level through the Voice of the Customer ("VoC") platform, The Governance Institute, and legacy Experience solutions.
Our six operating segments are aggregated into one reporting segment because they have similar economic characteristics and meet other aggregation criteria from the Financial Accounting Standards Board (“FASB”) guidance on segment disclosure. The six operating segments are Experience, The Governance Institute, Market Insights, Transparency, National Research Corporation Canada and Transitions, which offer a portfolio of solutions that address specific needs around market insight, experience, transparency and governance for healthcare providers, payers and other healthcare organizations.
Our condensed consolidated balance sheet at December 31, 2018 2019 was derived from our audited consolidated balance sheet as of that date. All other financial statements contained herein are unaudited and, in the opinion of management, include all adjustments (consisting only of normal recurring adjustments) that we consider necessary for a fair presentation of financial position, results of operations and cash flows in accordance with accounting principles generally accepted in the United States.
Information and footnote disclosures included in financial statements prepared in accordance with accounting principles generally accepted in the United States have been condensed or omitted. These condensed consolidated financial statements should be read in conjunction with the consolidated financial statements and notes thereto that are included in our Form 10-K10-K for the year ended December 31, 2018, 2019, filed with the Securities and Exchange Commission (the “SEC”) on March 8, 2019.6, 2020.
The preparation of financial statements in conformity with accounting principles generally accepted in the United States requires management to make certain estimates and assumptions that affect the reported amounts of assets and liabilities at the date of the financial statements and the reported amounts of revenue and expenses during the reporting period. Actual results could differ from those estimates.
The condensed consolidated financial statements include the accounts of the Company and itsour wholly-owned subsidiary, National Research Corporation Canada, doing business as NRC Health Canada. All significant intercompany transactions and balances have been eliminated.
Our Canadian subsidiary uses as its functional currency the local currency of the country in which it operates. It translates its assets and liabilities into U.S. dollars at the exchange rate in effect at the balance sheet date. It translates its revenue and expenses at the average exchange rate during the period. We include translation gains and losses in accumulated other comprehensive income (loss), a component of shareholders’ equity. Gains and losses related to transactions denominated in a currency other than the functional currency of the country in which we operate and short-term intercompany accounts are included in other income (expense) in the condensed consolidated statements of income.
Revenue Recognition
We derive a majority of our revenues from our annually renewable subscription-based service agreements with our customers, which include performance measurement and improvement services, healthcare analytics and governance education services. Such agreements are generally cancelable on short or no notice without penalty. See Note 32 for further information about our contracts with customers. We account for revenue using the following steps:
● | Identify the contract, or contracts, with a | |
● | Identify the performance obligations in the | |
● | Determine the transaction | |
● | Allocate the transaction price to the identified performance obligations; and | |
● | Recognize revenue when, or as, we satisfy the performance obligations. |
Our revenue arrangements with a client may include combinations of more than one service offering which may be executed at the same time, or within close proximity of one another. We combine contracts with the same customer into a single contract for accounting purposes when the contract is entered into at or near the same time and the contracts are negotiated together.together, consideration in one contract depends on another contract, or services in one or more contracts are a single performance obligation. For contracts that contain more than one separately identifiable performance obligation, the total transaction price is allocated to the identified performance obligations based upon the relative stand-alone selling prices of the performance obligations. The stand-alone selling prices are based on an observable price for services sold to other comparable customers, when available, or an estimated selling price using a cost-plus margin or residual approach. We estimate the amount of total contract consideration we expect to receive for variable arrangements based on the most likely amount we expect to earn from the arrangement based on the expected quantities of services we expect to provide and the contractual pricing based on those quantities. We only include some or a portion of variable consideration in the transaction price when it is probable that a significant reversal in the amount of cumulative revenue recognized will not occur. We consider the sensitivity of the estimate, our relationship and experience with the client and variable services being performed, the range of possible revenue amounts and the magnitude of the variable consideration to the overall arrangement. Our revenue arrangements do not contain any significant financing element due to the contract terms and the timing between when consideration is received and when the service is provided.
Our arrangements with customers consist principally of four different types of arrangements: 1)1) subscription-based service agreements; 2) one-time2) one-time specified services performed at a single point in time; 3)3) fixed, non-subscription service agreements; and 4)4) unit-priced service agreements.
Subscription-based services - Services that are provided under subscription-based service agreements are usually for a twelve month period and represent a single promise to stand ready to provide reporting, tools and services throughout the subscription period as requested by the customer. These agreements are renewable at the option of the customer at the completion of the initial contract term for an agreed upon price increase each year. These agreements represent a series of distinct monthly services that are substantially the same, with the same pattern of transfer to the customer as the customer receives and consumes the benefits throughout the contract period. Accordingly, subscription services are recognized ratably over the subscription period. Subscription services are typically billed annually in advance but may also be billed on a quarterly and monthly basis.
One-time services – These agreements typically require us to perform a specific one-timeone-time service in a particular month. We are entitled to a fixed payment upon completion of the service. Under these arrangements, we recognize revenue at the point in time we complete the service and it is accepted by the customer.
Fixed, non-subscription services – These arrangements typically require us to perform an unspecified amount of services for a fixed price during a fixed period of time. Revenues are recognized over time based upon the costs incurred to date in relation to the total estimated contract costs. In determining cost estimates, management uses historical and forecasted cost information which is based on estimated volumes, external and internal costs and other factors necessary in estimating the total costs over the term of the contract. Changes in estimates are accounted for using a cumulative catch up adjustment which could impact the amount and timing of revenue for any period.
Unit-price services – These arrangements typically require us to perform certain services on a periodic basis as requested by the customer for a per-unit amount which is typically billed in the month following the performance of the service. Revenue under these arrangements is recognized over the time the services are performed at the per-unit amount.
any sales tax charged to our clients that we are required to remit to taxing authorities. We recognize contract assets or unbilled receivables related to revenue recognized for services completed but not invoiced to the clients. Unbilled receivables are classified as receivables when we have an unconditional right to contract consideration. A contract liability is recognized as deferred revenue when we invoice clients in advance of performing the related services under the terms of a contract. Deferred revenue is recognized as revenue when we have satisfied the related performance obligation.
Deferred
Deferred Contract Costs
Deferred contract costs, net is stated at gross deferred costs less accumulated amortization. We defer commissions and incentives, including payroll taxes, if they are incremental and recoverable costs of obtaining a renewable customer contract. Deferred contract costs are amortized over the estimated term of the contract, including renewals, which generally ranges from three to five years. The contract term was estimated by considering factors such as historical customer attrition rates and product life. The amortization period is adjusted for significant changes in the estimated remaining term of a contract. An impairment of deferred contract costs is recognized when the unamortized balance of deferred contract costs exceeds the remaining amount of consideration we expect to receive net of the expected future costs directly related to providing those services. We deferred incrementalhave elected the practical expedient to expense contract costs when incurred for any nonrenewable contracts with a term of obtaining a contract of $1.0 million and $616,000 in the three-month periods ended September 30, 2019 and 2018, respectively.one year or less. We deferred incremental costs of obtaining a contract of $2.6$599,000 and $741,000 in the three months ended June 30, 2020 and 2019, respectively. The company deferred incremental costs of obtaining a contract of $2.2 million and $1.8$1.6 million in the nine-monthsix-month periods ended SeptemberJune 30, 2020 and 2019, respectively. Deferred contract costs, net of accumulated amortization was $4.6 million and $4.2 million at June 30, 2020 and December 31, 2019, and 2018, respectively. Total amortization by expense classification for the three and nine month-periodssix-months ended SeptemberJune 30, 2019 2020 and 20182019 was as follows:
Three months ended | Nine months ended | |||||||||||||||
September 30, 2019 | September 30, 2018 | September 30, 2019 | September 30, 2018 | |||||||||||||
(In thousands) | ||||||||||||||||
Direct expenses | $ | 10 | $ | 13 | $ | 26 | $ | 73 | ||||||||
Selling, general and administrative expenses | 738 | 601 | 2,072 | 1,815 | ||||||||||||
Total | $ | 748 | $ | 614 | $ | 2,097 | $ | 1,888 | ||||||||
Three months ended | Three months ended | Six month ended | Six months ended | |||||||||||||
(In thousands) | ||||||||||||||||
Direct Expenses | $ | 60 | $ | 13 | $ | 178 | $ | 19 | ||||||||
Selling, general and administrative expenses | 851 | 628 | 1,624 | 1,309 | ||||||||||||
Total amortization | $ | 911 | $ | 641 | $ | 1,802 | $ | 1,328 | ||||||||
Additional expense included in selling, general and administrative expenses for impairment of costs capitalized due to lost clients was $1,000$3,000 and $12,000$1,000 for the three months ended SeptemberJune 30, 2019 2020 and 2018,2019, respectively and $22,000$4,000 and $31,000$21,000 in the ninesix months ended SeptemberJune 30, 2019 2020 and 2018,2019, respectively. We have elected the practical expedient to expense contract costs when incurred for any nonrenewable contracts with a term of one year or less.
Leases
Trade Accounts Receivable
WeTrade accounts receivable are recorded at the invoiced amount. Effective January 1, 2020, we adopted Accounting Standards Update (“ASU”) 2016-02, Leases (Topic 842) (“Topic 842” or2016-13,Measurement of Credit Losses on Financial Instruments. This ASU requires the “New Leases Standard”) effective January 1, 2019 using a modified retrospective transition, withmeasurement of all expected credit losses for financial assets, including trade receivables, held at the cumulative-effect adjustment recorded to retained earnings asreporting date based on historical experience, current conditions, and reasonable and supportable forecasts. The adoption of this standard did not have an impact on our condensed consolidated financial statements. The allowance for doubtful accounts is our best estimate of the effective date. As a result,amount of probable credit losses in our existing accounts receivable, determined based on our historical write-off experience, current economic conditions and reasonable and supportable forecasts about the financial resultsfuture. We review the allowance for periods priordoubtful accounts monthly. Account balances are charged off against the allowance after all means of collection have been exhausted and the potential for recovery is considered remote. Some billing and collections efforts were delayed due to 2019the security incident in the first quarter until we received the forensic report in the second quarter, resulting in an increase in accounts receivable. Additionally, the COVID-19 pandemic has also resulted in an increase in accounts receivables as some clients have not been restated. We elected practical expedients relateddelayed payments and some invoicing was deferred during the second quarter of 2020 due to existing leases at transition to not reassess whether contracts are or contain leases, to not reassess lease classification, initial direct costs, or lease terms. Additionally, we elected the practical expedient to account for lease and non-lease components as a single lease component for all asset classifications. We have also made a policy election to not record short-term leases with a duration of 12 months or less on the balance sheet.our clients’ cash-flow issues.
Topic 842 requires lessees to recognize a lease liability The following table provides the activity in the allowance for doubtful accounts for the six months ended June 30, 2020 and a right-of-use (“ROU”) asset on the balance sheet for operating leases. We recorded $2.3 million of ROU assets and $2.4 million of lease liabilities related to operating leases at the date of transition. The ROU assets recorded were net of $43,000 of accrued liabilities and prepaid expenses representing previously deferred (prepaid) rent. There was no significant impact to the unaudited condensed consolidated statements of income, comprehensive income, shareholders’ equity or cash flows. Accounting for finance leases is substantially unchanged.2019 (In thousands):
Balance at Beginning of Period | Bad Debt Expense (Benefit) | Write-offs | Recoveries | Balance at End of Period | ||||||||||||||||
Six months ended June 30, 2020 | $ | 144 | $ | 40 | $ | 62 | $ | 21 | $ | 143 | ||||||||||
Six months ended June 30, 2019 | $ | 176 | $ | (25 | ) | $ | 37 | $ | 10 | $ | 124 | |||||||||
Leases
We determine whether a lease is included in an agreement at inception. Operating lease ROU assets are included in operating lease right-of-use assets in our consolidated balance sheet. Finance lease assets are included in property and equipment. Operating and finance lease liabilities are included in other current liabilities and other long term liabilities. Certain lease arrangements may include options to extend or terminate the lease. We include these provisions in the ROU and lease liabilities only when it is reasonably certain that we will exercise that option. Lease expense for operating lease payments is recognized on a straight-line basis over the lease term and is included in direct expenses and selling, general and administrative expenses. Our lease agreements do not contain any residual value guarantees.
ROU assets represent our right to use an underlying asset for the lease term and lease liabilities represent our obligation to make lease payments during the lease term. ROU assets and lease liabilities are recorded at lease commencement based on the estimated present value of lease payments. Because the rate of interest implicit in each lease is not readily determinable, we use our estimated incremental collateralized borrowing rate at lease commencement, to calculate the present value of lease payments. When determining the appropriate incremental borrowing rate, we consider our available credit facilities, recently issued debt and public interest rate information.
We elected the practical expedient to account for lease and non-lease components as a single lease component for all asset classifications. We have also made a policy election to not record short-term leases with a duration of 12 months or less on the balance sheet.
Implementation Costs of Hosting Arrangements
When a software license is included in a cloud computing arrangement and we have the ability and feasibility to download the software, it is accounted for as software, included in property and equipment, and amortized. If a software license is not included or we do not have the ability or feasibility to download software included in a cloud computing arrangement, it is accounted for as a service contract, which is expensed to direct expenses or selling, general and administrative expenses during the service period. Effective January 1, 2020, we prospectively adopted ASU 2018-15, Intangibles-Goodwill and Other-Internal Use Software (Subtopic 350-40). This ASU aligns the requirements for capitalizing implementation costs incurred in a hosting arrangement that is a service contract with the requirements for capitalizing implementation costs incurred to develop or obtain internal-use software (and hosting arrangements that include an internal use software license). The adoption did not significantly impact our results of operations and financial position.
Fair Value Measurements
Our valuation techniques are based on maximizing observable inputs and minimizing the use of unobservable inputs when measuring fair value. Observable inputs reflect readily obtainable data from independent sources, while unobservable inputs reflect our market assumptions. The inputs are then classified into the following hierarchy: (1)(1) Level 1 Inputs—quoted prices in active markets for identical assets and liabilities; (2)(2) Level 2 Inputs—observable market-based inputs other than Level 1 inputs, such as quoted prices for similar assets or liabilities in active markets, quoted prices for similar or identical assets or liabilities in markets that are not active, or other inputs that are observable or can be corroborated by observable market data; (3)(3) Level 3 Inputs—unobservable inputs.
The following details our financial assets within the fair value hierarchy at SeptemberJune 30, 2019 2020 and December 31, 2018:2019:
Level 1 | Level 2 | Level 3 | Total | |||||||||||||
(In thousands) | ||||||||||||||||
As of September 30, 2019 | ||||||||||||||||
Money market funds | $ | 2,605 | $ | -- | $ | -- | $ | 2,605 | ||||||||
Total cash equivalents | $ | 2,605 | $ | -- | $ | -- | $ | 2,605 | ||||||||
As of December 31, 2018 | ||||||||||||||||
Money market funds | $ | 1,848 | $ | -- | $ | -- | $ | 1,848 | ||||||||
Total cash equivalents | $ | 1,848 | $ | -- | $ | -- | $ | 1,848 | ||||||||
Level 1 | Level 2 | Level 3 | Total | |||||||||||||
(In thousands) | ||||||||||||||||
As of June 30, 2020 | ||||||||||||||||
Money Market Funds | $ | 3,067 | $ | - | $ | - | $ | 3,067 | ||||||||
Total Cash Equivalents | $ | 3,067 | $ | - | $ | - | $ | 3,067 | ||||||||
As of December 31, 2019 | ||||||||||||||||
Money Market Funds | $ | 3,662 | $ | - | $ | - | $ | 3,662 | ||||||||
Total Cash Equivalents | $ | 3,662 | $ | - | $ | - | $ | 3,662 | ||||||||
There were no transfers between levels during the three and nine-month periods-month period ended SeptemberJune 30, 2019.2020.
Our long-term debt described in Note 54 is recorded at historical cost. The fair value of long-term debt is classified in Level 2 of the fair value hierarchy and was estimated based primarily on estimated current rates available for debt of the same remaining duration and adjusted for nonperformance and credit. The following are the carrying amount and estimated fair values of long-term debt:
September 30, 2019 | December 31, 2018 | June 30, 2020 | December 31, 2019 | |||||||||||||
(In thousands) | (In thousands) | |||||||||||||||
Total carrying amount of long-term debt | $ | 35,229 | $ | 37,966 | $ | 32,681 | $ | 34,281 | ||||||||
Estimated fair value of long-term debt | $ | 36,311 | $ | 38,257 | $ | 35,293 | $ | 35,205 | ||||||||
The carrying amounts of accounts receivable, accounts payable, and accrued expenses approximate their fair value. All non-financial assets that are not recognized or disclosed at fair value in the financial statements on a recurring basis, which includes ROU assets, property and equipment, goodwill, intangibles and cost method investments, are measured at fair value in certain circumstances (for example, when there is evidence of impairment). As of SeptemberJune 30, 2019 2020, and December 31, 2018, 2019, there was no indication of impairment related to these assets.
Annually, we consider whether the recorded goodwill and indefinite lived intangibles have been impaired. However, goodwill and intangibles must be tested between annual tests if an event occurs or circumstances change to indicate that it is more likely than not that an impairment loss has been incurred (“triggering event”). We considered the current and expected future economic and market conditions, including the impact of the COVID-19 pandemic, on each of our reporting units. We also assessed our current market capitalization compared to book value, forecasts and margins in our last quantitative impairment testing. We concluded that a triggering event has not occurred which would require an interim impairment test to be performed as it is not more likely than not that an impairment loss has been incurred at June 30, 2020.
Our Canadian reporting unit generates service revenue from a relatively small number of customers with approximately 62.2% of its annual revenue concentrated in one customer contract which currently expires in March 2021. While historically we have been successful in renewing or retaining contracts with our customers, should we be unable to or choose not to renew a significant contract, it would likely result in an impairment of goodwill at this reporting unit. The carrying amount of goodwill related to our Canadian reporting unit at June 30, 2020 was $2.3 million.
Commitments and Contingencies
From time to time, we are involved in certain claims and litigation arising in the normal course of business. Management assesses the probability of loss for such contingencies and recognizes a liability when a loss is probable and estimable. Legal fees, net of estimated insurance recoveries, are expensed as incurred. There were no outstanding claims at June 30, 2020.
$775,000 was recorded in 2019 after we became aware that a state sales tax liability was both probable and estimable as of December 31, 2019, due to sales taxes that should have been collected from customers in 2019 and certain previous years. In addition, we incurred additional sales tax expense in the three and six-month periods ended June 30, 2020 of $8,000 and $58,000, respectively. We are working through voluntary disclosure agreements with certain states and began remitting sales tax in the second quarter of 2020. We began collecting sales tax in July 2020. State and local jurisdictions have differing rules and regulations governing sales, use, and other taxes and these rules and regulations can be complex and subject to varying interpretations that may change over time. As a result, we could face the possibility of tax assessment and audits, and our liability for these taxes and associated interest and penalties could exceed our original estimates. In July 2020, we received a revenue ruling from the state of Washington noting that our services are not subject to retail sales tax, and therefore, will be reversing $268,000 of sales tax accrual for the state of Washington in the third quarter of 2020.
We received $2.4 million in insurance recoveries in the three-month period ended June 30, 2020, and $400,000 was paid directly to certain vendors from the insurer related to the February incident. These were recorded in selling general and administrative expenses. A final loss claim was submitted to insurance during the three-month period ended June 30, 2020, and an insurance recovery will be recorded when it is probable of collection. Due to insurance recoveries, the February incident has not had and we do not expect it to have a significant impact on our consolidated financial statements.
Recent Accounting Pronouncements Not Yet Adopted
In June 2016, December 2019, the FASB issued ASU 2016-13, Financial Instruments – Credit Losses2019-12, Simplifying the Accounting for Income Taxes (Topic 326): Measurement740). Among other clarifications and simplifications related to income tax accounting, this ASU simplifies the accounting for income taxes by eliminating certain exceptions related to the approach for intraperiod tax allocation, the methodology for calculating income taxes in an interim period, hybrid taxes and the recognition of Credit Losses on Financial Instruments. This ASU will require the measurement of all expected credit lossesdeferred tax liabilities for financial assets, including trade receivables, held at the reporting date based on historical experience, current conditions, and reasonable and supportable forecasts.outside basis differences. The guidance is effective for fiscal years beginning after December 15, 2019 and interim periods within those fiscal years. We believe our adoption will not significantly impact our results of operations and financial position.
In August 2018, the FASB issued ASU 2018-15, Intangibles-Goodwill and Other-Internal Use Software (Subtopic 350-40). This ASU aligns the requirements for capitalizing implementation costs incurred in a hosting arrangement that is a service contract with the requirements for capitalizing implementation costs incurred to develop or obtain internal-use software (and hosting arrangements that include an internal use software license). The guidance is to be applied either retrospectively or prospectively and is effective for annual reporting periods beginning after December 15, 2019 2020 and interim periods within those fiscal years. Early adoption is permitted.permitted in interim or annual periods with any adjustments reflected as of the beginning of the annual period that includes that interim period. Additionally, entities that elect early adoption must adopt all the amendments in the same period. Amendments are to be applied prospectively, except for certain amendments that are to be applied either retrospectively or with a modified retrospective approach through a cumulative effect adjustment recorded to retained earnings. We are currently evaluatingbelieve the method of adoption andwill not significantly impact that this guidance will have upon our results of operations and financial position and have not yet determined whether early adoption will be elected.position.
In March 2020, FASB issued ASU No.2020-04, "Reference Rate Reform (Topic 848): Facilitation of the Effects of Reference Rate Reform on Financial Reporting", which provides optional expedients and exceptions for applying generally accepted accounting principles (GAAP) to contracts, hedging relationships, and other transactions affected by reference rate reform if certain criteria are met. The amendments apply only to contracts, hedging relationships, and other transactions that reference LIBOR or another reference rate expected to be discontinued because of reference rate reform. The amendments are effective for all entities as of March 12, 2020 through December 31, 2022. We expect to apply the optional expedient for contract modification to account for the change in the reference rate on impacted credit facilities prospectively by adjusting the effective interest rate.
|
|
On April 16, 2018, our shareholders approved, among other things, an amendment to our Amended and Restated Articles of Incorporation (the “Articles”) to effect a recapitalization (the “Recapitalization”) pursuant to which each share of our then-existing class B common stock was exchanged for one share of the our then-existing Class A common stock plus $19.59 in cash, without interest. On April 17, 2018, we filed an amendment to our Articles effecting the Recapitalization, followed by an amendment and restatement of our Articles, which resulted in the elimination of our class B common stock and the reclassification of our class A common stock as a share of Common Stock, par value $0.001 per share (“Common Stock”). We issued 3,617,615 shares of Common Stock and paid $72.4 million in exchange for all class B shares outstanding and to settle outstanding share-based awards for class B common stock.
| CONTRACTS WITH CUSTOMERS |
The following table disaggregates revenue for the three and six-month periods ending June 30, 2020 and 2019based on timing of revenue recognition (In(in thousands):
Three months ended | Nine months ended | Three months ended | Six months ended | |||||||||||||||||||||||||||||
September 30, 2019 | September 30, 2018 | September 30, 2019 | September 30, 2018 | June 30, 2020 | June 30, 2019 | June 30, 2020 | June 30, 2019 | |||||||||||||||||||||||||
Subscription services recognized ratably over time | $ | 28,629 | $ | 26,328 | $ | 84,460 | $ | 77,746 | $ | 29,572 | $ | 27,918 | $ | 59,993 | $ | 55,831 | ||||||||||||||||
Services recognized at a point in time | 1,606 | 807 | 4,231 | 2,923 | 191 | 1,625 | 1,287 | 2,625 | ||||||||||||||||||||||||
Fixed, non-subscription recognized over time | 1,043 | 973 | 2,083 | 2,561 | 158 | 506 | 675 | 1,040 | ||||||||||||||||||||||||
Unit price services recognized over time | 1,187 | 1,905 | 4,585 | 5,817 | 1,245 | 1,365 | 3,071 | 3,398 | ||||||||||||||||||||||||
Total revenue | 32,465 | 30,013 | 95,359 | 89,047 | $ | 31,166 | $ | 31,414 | $ | 65,026 | $ | 62,894 | ||||||||||||||||||||
Our solutions within the digital VoC platform accounted for 63.8%72.9% and 51.2%62.1% of total revenue, in the three-monththree-month periods ending SeptemberJune 30, 2019 2020 and 2018,2019, respectively, and 61.3%70.9% and 48.7%60.0% of total revenue in the nine-monthsix-month periods ending SeptemberJune 30, 2019 2020 and 2018,2019, respectively. The remaining revenue consists of legacy Experience and Governance Solutions.
The following table provides information about receivables, contract assets, and contract liabilities from contracts with customers:customers (In thousands):
September 30, 2019 | December 31, 2018 | |||||||
(In thousands) | ||||||||
Accounts receivable | $ | 15,308 | $ | 11,922 | ||||
Contract assets included in other current assets | $ | 133 | $ | 53 | ||||
Deferred revenue | $ | (19,133 | ) | $ | (16,244 | ) | ||
June 30, 2020 | December 31, 2019 | |||||||
Accounts receivables | $ | 19,882 | $ | 11,639 | ||||
Contract assets included in other current assets | $ | 120 | $ | 103 | ||||
Deferred Revenue | $ | (16,275 | ) | $ | (16,354 | ) | ||
Significant changes in contract assets and contract liabilities during the nine monthsthree and six-months ended SeptemberJune 30, 2019 2020 and 20182019 are as follows (in thousands):
Nine months ended | Nine months ended | Six months ended | Six months ended | |||||||||||||||||||||||||||||
Contract Asset | Deferred Revenue | Contract Asset | Deferred Revenue | Contract Asset | Deferred Revenue | Contract Asset | Deferred Revenue | |||||||||||||||||||||||||
Increase (Decrease) | Increase (Decrease) | |||||||||||||||||||||||||||||||
Revenue recognized that was included in deferred revenue at beginning of year due to completion of services | $ | - | $ | (15,214 | ) | $ | - | $ | (15,377 | ) | $ | - | $ | (11,934 | ) | $ | - | $ | (12,226 | ) | ||||||||||||
Increases due to invoicing of client, net of amounts recognized as revenue | - | 17,829 | - | 17,522 | - | 11,821 | - | 12,751 | ||||||||||||||||||||||||
Decreases due to completion of services (or portion of services) and transferred to accounts receivable | (51 | ) | - | (71 | ) | - | (85 | ) | - | (46 | ) | - | ||||||||||||||||||||
Change due to cumulative catch-up adjustments arising from changes in expected contract consideration | 274 | (145 | ) | 34 | 219 | |||||||||||||||||||||||||||
Decreases due to impairment | - | - | - | - | - | - | - | - | ||||||||||||||||||||||||
Increases due to revenue recognized in the period with additional performance obligations before invoicing | 131 | - | 65 | - | 102 | - | 223 | - | ||||||||||||||||||||||||
We have elected to applyapplied the practical expedient to not disclose the value of unsatisfied performance obligations for contracts with an original expected length of one year or less. Total remaining contract revenue for contracts with original duration of greater than one year expected to be recognized in the future related to performance obligations that are unsatisfied at SeptemberJune 30, 2019 2020 approximated $1,252,000,$281,000, of which $308,000, $889,000$161,000 and $55,000 will$120,000 are expected to be recognized during the remainder of 2019, 2020 and 2021, respectively.
( | INCOME TAXES |
The effective tax rate for the three-monththree-month period ended SeptemberJune 30, 2019 increased2020 decreased to 17.2%9.8% compared to 16.6%22.1% for the same period in 2018 primarily due to a tax depreciation method change election for software development costs creating an income tax benefit of $308,000 in 2018, additional withholding on unrepatriated Canadian earnings of $90,0002019 and higher projected state taxes. These were partially offset by increased tax benefits from the exercise of options and dividends paid to non-vested shareholders of $459,000. The effective tax rate for the nine-monthsix-month period ended SeptemberJune 30, 2019 increased2020 decreased to 18.7%2.3% compared to 11.6%19.4% for the same period in 2018. The effective tax rate for the nine-month period ended September 30, 2019 was higher mainly due to income tax benefits from the Recapitalization due to accelerated vesting of restricted stock and settlement of stock options of $1.1 million, a tax depreciation method change election for software development costs creating an income tax benefit of $308,000 in 2018 and a $247,000 reduction in tax benefits primarily from the exercise and vesting of options and dividends paid to non-vested shareholders compared to 2018. In addition, there was additional withholding on unrepatriated Canadian earnings of $90,000. This wasshared-based compensation awards partially offset by less non-deductible fees of $154,000 primarily relatedhigher state income taxes since we are filing in more states.
In March 27, 2020, the U.S. federal government enacted the Coronavirus Aid, Relief, and Economic Security Act (the “CARES Act”). The CARES Act is an emergency economic stimulus package in response to the Recapitalization.coronavirus outbreak which, among other things, contains numerous income tax provisions. As a result of the CARES Act, we have deferred $237,000 of employer social security tax payments into future years. We have had no other impacts to our consolidated financial statements or related disclosures from the CARES Act.
( | NOTES PAYABLE |
Our long-term debt consists of the following (In thousands):following:
September 30, 2019 | December 31, 2018 | |||||||
Term Loans | $ | 35,229 | $ | 37,996 | ||||
Less: current portion | (4,133 | ) | (3,667 | ) | ||||
Less: unamortized debt issuance costs | (119 | ) | (153 | ) | ||||
Notes payable, net of current portion | $ | 30,977 | $ | 34,176 | ||||
June 30, 2020 | December 31, 2019 | |||||||
(In thousands) | ||||||||
Term Loans | $ | 32,681 | $ | 34,281 | ||||
Less: current portion | (3,966 | ) | (4,378 | ) | ||||
Less: unamortized debt issuance costs | (88 | ) | (108 | ) | ||||
Notes payable, net of current portion | $ | 28,627 | $ | 29,795 | ||||
Our credit agreement (the “Credit Agreement”) with First National Bank of Omaha (“FNB”) was amended and restated on May 28, 2020 and includes (i) a $15,000,000$30,000,000 revolving credit facility (the “Line of Credit”), (ii) a $40,000,000$33,002,069 term loan (the “Term Loan”) and (iii) a $15,000,000 delayed draw-dawn term facility (the “Delayed Draw Term Loan”). The and, together with the Line of Credit and the Term Loan, was used to fund, in part, the cash payment to the holders of the class B common stock in connection with the Recapitalization and certain costs of the Recapitalization.“Credit Facilities”). The Delayed Draw Term Loan may be used to fund any permitted future business acquisitions or repurchases of our Common Stock and the Line of Credit iscan be used to fund ongoing working capital needs and for other general corporate purposes. The amendment increased the Line of Credit from $15,000,000 to $30,000,000.
The amended Term Loan is payable inrevised the remaining payments for the existing balance outstanding of $33,002,069 to monthly installments of $462,988 through April 2020 and $526,362 thereafter, May 2025, with a balloon payment due at maturity in April 2023. May 2025. The Term Loan bears interest at a fixed rate per annum of 5%.
Borrowings under the Line of Credit and the Delayed Draw Term Loan, if any, bear interest at a floating rate equal to the 30-day30-day London Interbank Offered Rate plus 225 basis points (4.33%(2.43% at SeptemberJune 30, 2019)2020). Interest on the Line of Credit accrues and is payable monthly. Principal amounts outstanding under the Line of Credit are due and payable in full at maturity, in April 2021. May 2023. As of SeptemberJune 30, 2020, and December 31, 2019, there were no borrowings outstanding under the Line of Credit and we had the availability to borrow $15.0 million.did not have a balance. There were no borrowings outstanding under the Line of Credit at December 31, 2018. The weighted average interest rate on borrowings on the Line of Credit for the three and nine-monthsix-month periods ended SeptemberJune 30, 2019 was 4.62% and 4.72%, respectively. 2020. There have been no0 borrowings on the Delayed Draw Term Loan since origination.
We are obligated to pay ongoing unused commitment fees quarterly in arrears pursuant to the Line of Credit and the Delayed Draw Term Loan facility at a rate of 0.20% per annum based on the actual daily unused portions of the Line of Credit and the Delayed Draw Term Loan facility, respectively.
The Credit Agreement is collateralized by substantially all of our assets, subject to permitted liens and other agreed exceptions, and contains customary representations, warranties, affirmative and negative covenants (including financial covenants) and events of default. The negative covenants include, among other things, restrictions regarding the incurrence of indebtedness and liens, repurchases of our Common Stock and acquisitions, subject in each case to certain exceptions. Theexceptions.. Pursuant to the Credit Agreement, also contains certain financial covenants with respectwe are required to maintain a minimum fixed charge coverage ratio of 1.10x for all testing periods throughout the term(s) of the Credit Facilities, which calculation excludes, unless our liquidity falls below a specified threshold, (i) any cash dividend in a fiscal quarter that, together with all other cash dividends paid or declared during such fiscal quarter, exceeds $5,500,000 in total cash dividends paid or declared, (ii) the portion of the purchase price for any permitted share repurchase of our shares paid with cash on hand, and (iii) the portion of any acquisition consideration for a maximumpermitted acquisition paid with cash on hand. We are also required to maintain a cash flow leverage ratio of 3.00x. The special dividend paid on January 15, 2019, is excluded from3.00x or less for all testing periods throughout the calculationterm(s) of the fixed charge coverage ratio pursuant to a consent received from the lender. Credit Facilities.
As of SeptemberJune 30, 2019, 2020, we were in compliance with theseour financial covenants.
( | SHARE-BASED COMPENSATION |
We measure and recognize compensation expense for all share-based payments based on the grant-date fair value of those awards. All of our existing stock option awards and unvested stock awards have been determined to be equity-classified awards. We account for forfeitures as they occur. We completed a Recapitalization in April 2018 which, among other things, settled all then-existing outstanding class B share-based awards and resulted in the elimination of the class B common stock. As a result, we accelerated vesting of all outstanding class B share based awards, resulting in accelerated share-based compensation of $331,000 in the nine-month period ended September 30, 2018. All outstanding class B share-based awards were then settled for the same stock to cash proportion of the class B common stock, less the exercise price, if any, which approximated the awards’ intrinsic values.
The Our 2001 Equity Incentive Plan provided for the granting of stock options, stock appreciation rights, restricted stock, performance shares and other share-based awards and benefits up to an aggregate of 1,800,000 shares of our former class A common stock and 300,000 shares of our former class B commonCommon stock. Stock options granted could have been either nonqualified or incentive stock options. Stock options vest over one to five years following the date of grant and option terms are generally five to ten years following the date of grant. Due to the expiration of the 2001 Equity Incentive Plan at December 31, 2015, there were no0 shares of stock available for future grants.
The Our 2004 Non-Employee Director Stock Plan, as amended (the “2004“2004 Director Plan”), is a nonqualified plan that provides for the granting of options with respect to 3,000,000 shares of the our Common Stock and, prior to the Recapitalization, 500,000 shares of our former class B common stock.Stock. The 2004 Director Plan provides for grants of nonqualified stock options to each of our non-employee directors.directors who we do not employ. Beginning in 2018, on the date of each annual meeting of our shareholders, options to purchase shares of Common Stock equal to an aggregate grant date fair value of $100,000 are granted to each non-employee director that is elected or retained as a director at each such meeting. Stock options vest approximately one year following the date of grant and option terms are generally the earlier of ten years following the date of grant, or three years infrom the case of termination of the outside director’s service.
The Our 2006 Equity Incentive Plan (the “2006“2006 Equity Incentive Plan”), as amended, provides for the granting of stock options, stock appreciation rights, restricted stock, performance shares and other share-based awards and benefits up to an aggregate of 1,800,000 shares of our Common Stock and, prior to the Recapitalization, 300,000 shares of our former class B common stock.Stock. Stock options granted may be either incentive stock options or nonqualified stock options. Vesting terms vary with each grant and option terms are generally five to ten years following the date of grant.
WeDuring the six months ended June 30, 2020 and 2019, we granted options to purchase 100,61570,471 and 116,276100,615 shares of our Common Stock, during the nine-month periods ended September 30, 2019 and 2018, respectively. Options to purchase shares of common stock wereare typically granted with exercise prices equal to the fair value of the common stock on the date of grant. We do, in certain limited situations, grant options with exercise prices that exceed the fair value of the common shares on the date of grant. The fair value of the stock options granted was estimated using a Black-Scholes valuation model with the following weighted average assumptions:
2019 | 2018 | 2020 | 2019 | |||||||||||||
Expected dividend yield at date of grant | 2.60 | % | 2.59 | % | 1.84 | % | 2.60 | % | ||||||||
Expected stock price volatility | 34.01 | % | 32.47 | % | 33.62 | % | 34.01 | % | ||||||||
Risk-free interest rate | 2.38 | % | 2.51 | % | 1.35 | % | 2.38 | % | ||||||||
Expected life of options (in years) | 7.5 | 7.3 | 7.4 | 7.5 | ||||||||||||
The risk-free interest rate assumptions were based on the U.S. Treasury yield curve in effect at the time of the grant. The expected volatility was based on historical monthly price changes of our stock based on the expected life of the options at the date of grant. The expected life of options is the average number of years we estimate that options will be outstanding. We consider groups of associates that have similar historical exercise behavior separately for valuation purposes.
The following table summarizes stock option activity under the 2001 and 2006 Equity Incentive Plans and the 2004 Director Plan for the nine-monthsix-month period ended SeptemberJune 30, 2019:2020:
Number of | Weighted Average Price | Weighted Average Remaining Contractual Terms (Years) | Aggregate Intrinsic Value (In thousands) | Number of | Weighted Average Exercise Price | Weighted Average Remaining Contractual Terms (Years) | Aggregate Intrinsic Value (In thousands) | |||||||||||||||||||||||||
Outstanding at December 31, 2018 | 1,373,209 | $ | 15.99 | |||||||||||||||||||||||||||||
Outstanding at December 31, 2019 | 1,245,922 | $ | 18.08 | 4.45 | $ | 59,631 | ||||||||||||||||||||||||||
Granted | 100,615 | $ | 41.64 | 70,471 | $ | 62.23 | ||||||||||||||||||||||||||
Exercised | (177,090 | ) | $ | 12.96 | $ | 6,548 | (408,765 | ) | $ | 12.68 | $ | 17,810 | ||||||||||||||||||||
Forfeited | -- | $ | -- | (15,490 | ) | $ | 48.42 | |||||||||||||||||||||||||
Outstanding at September 30, 2019 | 1,296,734 | $ | 18.39 | 4.81 | $ | 51,038 | ||||||||||||||||||||||||||
Exercisable at September 30, 2019 | 858,349 | $ | 15.02 | 3.52 | $ | 36,675 | ||||||||||||||||||||||||||
Outstanding at June 30, 2020 | 892,138 | $ | 23.51 | 5.77 | $ | 31,281 | ||||||||||||||||||||||||||
Exercisable at June 30, 2020 | 492,484 | $ | 17.55 | 4.58 | $ | 20.022 | ||||||||||||||||||||||||||
As of SeptemberJune 30, 2019, 2020, the total unrecognized compensation cost related to non-vested stock option awards was approximately $1.7$2.1 million which was expected to be recognized over a weighted average period of 2.983.2 years.
There was $538,000 of cash received from stock options exercised for the three months ended June 30, 2020 and no cash was received from the exercise of options in the same period of 2019. We recognized $216,000 and $235,000 of non-cash compensation for three months ended June 30, 2020 and 2019, respectively, and $498,000 and $464,000 of non-cash compensation for the six months ended June 30, 2020 and 2019, respectively, related to options, which is included in direct fixed and selling, general and administrative expenses.
During the six months ended June 30, 2019, we granted 6,005 non-vested shares of Common Stock under the 2006 Equity Incentive Plan. No shares were granted during the six months ended June 30, 2020. As of June 30, 2020, we had 42,761 non-vested shares of Common Stock outstanding under the 2006 Equity Incentive Plan. These shares vest over five years following the date of grant and holders thereof are entitled to receive dividends from the date of grant, whether or not vested. The fair value of the awards is calculated as the fair market value of the shares on the date of grant. We recognized ($75,000) and $73,000 of non-cash compensation for the three months ended June 30, 2020 and 2019, respectively, and ($26,000) and $145,000 of non-cash compensation for the six months ended June 30, 2020 and 2019, respectively, related to this non-vested stock, which is included in direct fixed and selling, general and administrative expenses. During the six months ended June 30 2020, 34,622 shares vested and 6,793 shares were forfeited.
The following table summarizes information regarding non-vested stock granted to associates under the 2006 Equity Incentive Plan for the nine-monthsix-month period ended SeptemberJune 30, 2019:2020:
Common Shares Outstanding | Weighted Average Grant Date Fair Value Per Share | Common Shares Outstanding | Weighted Average Grant Date Fair Value Per Share | |||||||||||||
Outstanding at December 31, 2018 | 78,171 | $ | 15.61 | |||||||||||||
Outstanding at December 31, 2019 | 84,176 | $ | 17.23 | |||||||||||||
Granted | 6,005 | 38.30 | - | - | ||||||||||||
Vested | -- | -- | (34,622 | ) | 13.17 | |||||||||||
Forfeited | -- | $ | -- | (6,793 | ) | $ | 36.80 | |||||||||
Outstanding at September 30, 2019 | 84,176 | $ | 17.23 | |||||||||||||
Outstanding at June 30, 2020 | 42,761 | $ | 17.40 | |||||||||||||
As of SeptemberJune 30, 2019, 2020, the total unrecognized compensation cost related to non-vested stock awards was approximately $484,000$187,000 and is expected to be recognized over a weighted average period of 3.033.05 years.
( | GOODWILL AND OTHER INTANGIBLE ASSETS |
The following represents a summary of changes in ourthe carrying amount of goodwill for the nine monthssix-month period ended SeptemberJune 30, 2019:2020:
| (In thousands) | ||||
Balance as of December 31, 2018 | $ | 57,831 | ||
Foreign currency translation | 65 | |||
Balance as of September 30, 2019 | $ | 57,896 | ||
(In thousands) | ||||
Balance as of December 31, 2019 | $ | 57,935 | ||
Foreign currency translation | (106 | ) | ||
Balance as of June 30, 2020 | $ | 57,829 | ||
Intangible assets consisted of the following:
September 30, 2019 | December 31, 2018 | |||||||
(In thousands) | ||||||||
Non-amortizing other intangible assets: | ||||||||
Trade name | $ | 1,191 | $ | 1,191 | ||||
Amortizing other intangible assets: | ||||||||
Customer related | 9,334 | 9,327 | ||||||
Technology | 1,360 | 1,360 | ||||||
Trade name | 1,572 | 1,572 | ||||||
Total other intangible assets | 13,457 | 13,450 | ||||||
Accumulated amortization | (11,635 | ) | (11,348 | ) | ||||
Other intangible assets, net | $ | 1,822 | $ | 2,102 | ||||
June 30, 2020 | December 31, 2019 | |||||||
(In thousands) | ||||||||
Non-amortizing intangible assets: | ||||||||
Indefinite trade name | $ | 1,191 | $ | 1,191 | ||||
Amortizing intangible assets: | ||||||||
Customer related | 9,326 | 9,338 | ||||||
Technology | 1,360 | 1,360 | ||||||
Trade names | 1,572 | 1,572 | ||||||
Total amortizing intangible assets | 12,258 | 12,270 | ||||||
Accumulated amortization | (11,908 | ) | (11,733 | ) | ||||
Other intangible assets, net | $ | 1,541 | $ | 1,728 | ||||
( | PROPERTY AND EQUIPMENT |
Property and equipment consisted of the following:
September 30, 2019 | December 31, 2018 | June 30, 2020 | December 31, 2019 | |||||||||||||
(In thousands) | (In thousands) | |||||||||||||||
Property and equipment at cost | $ | 48,245 | $ | 44,730 | ||||||||||||
Property and equipment | $ | 43,477 | $ | 42,078 | ||||||||||||
Accumulated depreciation | (34,549 | ) | (30,577 | ) | (31,122 | ) | (28,548 | ) | ||||||||
Property and equipment, net | $ | 13,696 | $ | 14,153 | $ | 12,355 | $ | 13,530 | ||||||||
| EARNINGS PER SHARE |
Prior to the Recapitalization, net income per share of our former class A common stock and former class B common stock was computed using the two-class method. Basic net income per share was computed by allocating undistributed earnings to common shares and using the weighted-average number of common shares outstanding during the period.
Diluted net income per share was computed using the weighted-average number of common shares and, if dilutive, the potential common shares outstanding during the period. Potential common shares consist of the incremental common shares issuable upon the exercise of stock options and vesting of restricted stock. The dilutive effect of outstanding stock options is reflected in diluted earnings per share by application of the treasury stock method.
The liquidation rights and the rights upon the consummation of an extraordinary transaction were the same for the holders of our former class A common stock and former class B common stock. Other than share distributions and liquidation rights, the amount of any dividend or other distribution payable on each share of former class A common stock was equal to one-sixth (1/6th) of the amount of any such dividend or other distribution payable on each share of former class B common stock. As a result, the undistributed earnings for each period were allocated based on the contractual participation rights of the former class A and former class B common stock as if the earnings for the year had been distributed.
As described in Note 2, we completed a Recapitalization in April 2018, resulting in the elimination of the class B common stock and settlement of all then-existing outstanding class B share-based awards and reclassification of all class A common stock to Common Stock. The Recapitalization was effective on April 17, 2018. Therefore, income was allocated between the former class A and class B stock using the two-class method through April 16, 2018, and fully allocated to the Common Stock (formerly class A) following the Recapitalization.
We had 27,28457,719 and 107,51283,225 options of Common Stock (former class A shares) for the three-monththree-month periods ended SeptemberJune 30, 2019 2020 and 2018,2019, respectively which have been excluded from the diluted net income per share computation because their inclusion would be anti-dilutive. We had 52,789 and 143,247 options of Common Stock for the six-month periods ended June 30, 2020 and 2019, respectively which have been excluded from the diluted net income per share computation because their inclusion would be anti-dilutive.
Three months Ended September 30, 2019 | Three months Ended September 30, 2018 | |||||||
Common Stock | Common Stock (formerly Class A) | |||||||
(In thousands, except per share data) | ||||||||
Numerator for net income per share - basic: | ||||||||
Net income | $ | 8,119 | $ | 6,992 | ||||
Allocation of distributed and undistributed income to unvested restricted stock shareholders | (27 | ) | (22 | ) | ||||
Net income attributable to common shareholders | $ | 8,092 | $ | 6,970 | ||||
Denominator for net income per share - basic: | ||||||||
Weighted average common shares outstanding - basic | 24,827 | 24,671 | ||||||
Net income per share – basic | $ | 0.33 | $ | 0.28 | ||||
Numerator for net income per share - diluted: | ||||||||
Net income attributable to common shareholders for basic computation | $ | 8,092 | $ | 6,970 | ||||
Denominator for net income per share - diluted: | ||||||||
Weighted average common shares outstanding - basic | 24,827 | 24,671 | ||||||
Weighted average effect of dilutive securities – stock options | 914 | 855 | ||||||
Denominator for diluted earnings per share – adjusted weighted average shares | 25,741 | 25,526 | ||||||
Net income per share – diluted | $ | 0.31 | $ | 0.27 | ||||
We had 12,493 and 88,572 options of Common Stock (former class A shares) for the nine-month periods ended September 30, 2019 and 2018, respectively which have been excluded from the diluted net income per share computation because their inclusion would be anti-dilutive
Nine Months Ended September 30, 2019 | Nine Months Ended | For the Three Months Ended June 30 | For the Six Months Ended June 30 | |||||||||||||||||||||||||
Common Stock | Common Stock (formerly Class A) | Class B Common Stock | 2020 | 2019 | 2020 | 2019 | ||||||||||||||||||||||
(In thousands, except per share data) | (In thousands, except per share data) | |||||||||||||||||||||||||||
Numerator for net income per share - basic: | ||||||||||||||||||||||||||||
Numerator for net income per share – basic: | $ | 7,715 | $ | 7,393 | $ | 19,470 | $ | 15,589 | ||||||||||||||||||||
Net income | $ | 23,708 | $ | 17,622 | $ | 4,624 | ||||||||||||||||||||||
Allocation of distributed and undistributed income to unvested restricted stock shareholders | (80 | ) | (61 | ) | (18 | ) | (15 | ) | (25 | ) | (38 | ) | (53 | ) | ||||||||||||||
Net income attributable to common shareholders | $ | 23,628 | $ | 17,561 | $ | 4,606 | 7,700 | 7,368 | 19,432 | 15,536 | ||||||||||||||||||
Denominator for net income per share - basic: | ||||||||||||||||||||||||||||
Weighted average common shares outstanding - basic | 24,794 | 23,184 | 3,527 | |||||||||||||||||||||||||
Denominator for net income per share – basic: | ||||||||||||||||||||||||||||
Weighted average common shares outstanding – basic | 25,148 | 24,789 | 25,060 | 24,777 | ||||||||||||||||||||||||
Net income per share – basic | $ | 0.95 | $ | 0.76 | $ | 1.31 | $ | 0.31 | $ | 0.30 | $ | 0.78 | $ | 0.63 | ||||||||||||||
Numerator for net income per share - diluted: | ||||||||||||||||||||||||||||
Numerator for net income per share – diluted: | ||||||||||||||||||||||||||||
Net income attributable to common shareholders for basic computation | $ | 23,628 | $ | 17,561 | $ | 4,606 | 7,700 | 7,368 | 19,432 | 15,536 | ||||||||||||||||||
Denominator for net income per share - diluted: | ||||||||||||||||||||||||||||
Weighted average common shares outstanding - basic | 24,794 | 23,184 | 3,527 | |||||||||||||||||||||||||
Denominator for net income per share – diluted: | ||||||||||||||||||||||||||||
Weighted average common shares outstanding – basic | 25,148 | 24,789 | 25,060 | 24,777 | ||||||||||||||||||||||||
Weighted average effect of dilutive securities – stock options | 830 | 899 | 101 | 532 | 797 | 642 | 772 | |||||||||||||||||||||
Denominator for diluted earnings per share – adjusted weighted average shares | 25,624 | 24,083 | 3,628 | 25,680 | 25,586 | 25,702 | 25,549 | |||||||||||||||||||||
Net income per share – diluted | $ | 0.92 | $ | 0.73 | $ | 1.27 | ||||||||||||||||||||||
Net income per share - diluted | $ | 0.30 | $ | 0.29 | $ | 0.76 | $ | 0.61 | ||||||||||||||||||||
|
|
We lease printing equipment in the United States, and office space in Canada, California, Georgia, Washington, and Tennessee. The leases remaining terms as of September 30, 2019 range from less than one year to 5.9 years.
Certain equipment and office lease agreements include provisions for periodic adjustments to rates and charges. The rates and charges are adjusted based on actual usage or actual costs for internet, common area maintenance, taxes or insurance, as determined by the lessor and are considered variable lease costs.
The components of lease expense for the three and nine-month periods ended September 30, 2019 included:
Three months ended September 30, 2019 | Nine months ended | |||||||
(In thousands) | ||||||||
Operating leases | $ | 196 | $ | 601 | ||||
Finance leases: | ||||||||
Asset amortization | 65 | 189 | ||||||
Interest on lease liabilities | 11 | 31 | ||||||
Variable lease cost | 29 | 72 | ||||||
Short-term lease cost | 10 | 29 | ||||||
Total net lease cost | $ | 311 | $ | 922 | ||||
Supplemental balance sheet information related to leases (in thousands):
September 30, 2019 | January 1, 2019 | |||||||
Operating leases: | ||||||||
Operating ROU assets | $ | 1,805 | $ | 2,308 | (1) | |||
Current operating lease liabilities | 589 | 699 | (1) | |||||
Noncurrent operating lease liabilities | 1,248 | 1,652 | (1) | |||||
Total operating lease liabilities | $ | 1,837 | $ | 2,351 | (1) | |||
(1) Represents the December 31, 2018 balance recorded at implementation of Topic 842
September 30, 2019 | December 31, 2018 | |||||||
Finance leases: | ||||||||
Furniture and equipment | $ | 1,095 | $ | 1,062 | ||||
Computer Equipment | 551 | 487 | ||||||
Computer Software | 224 | 224 | ||||||
Property and equipment under finance lease, gross | 1,870 | 1,773 | ||||||
Less accumulated amortization | (959 | ) | (839 | ) | ||||
Property and equipment under finance lease, net | $ | 911 | $ | 934 | ||||
Current obligations of finance leases | $ | 235 | $ | 204 | ||||
Noncurrent obligations of finance leases | 629 | 676 | ||||||
Total finance lease liabilities | $ | 864 | $ | 880 | ||||
Weighted average remaining lease term (in years): | ||||||||
Operating leases | 4.22 | |||||||
Finance leases | 3.77 | |||||||
Weighted average discount rate: | ||||||||
Operating leases | 4.81 | % | ||||||
Finance leases | 4.68 | % | ||||||
Supplemental cash flow and other information related to leases was as follows (in thousands):
Nine months ended September 30, 2019 | ||||
Cash paid for amounts included in the measurement of lease liabilities: | ||||
Operating cash flows from operating leases | $ | 601 | ||
Operating cash flows from finance leases | 31 | |||
Financing cash flows from finance leases | 223 | |||
ROU assets obtained in exchange for operating lease liabilities | 16 | |||
ROU assets obtained in exchange for finance lease liabilities | 206 | |||
Undiscounted payments under non-cancelable operating leases and finance leases at September 30, 2019 are as follows (in thousands):
Finance Leases | Operating Leases | |||||||
Remainder 2019 | $ | 70 | $ | 191 | ||||
2020 | 263 | 597 | ||||||
2021 | 257 | 452 | ||||||
2022 | 208 | 225 | ||||||
2023 | 125 | 246 | ||||||
Thereafter | 13 | 321 | ||||||
Total minimum lease payments | 936 | 2,032 | ||||||
Less: Amount representing interest | (72 | ) | (195 | ) | ||||
Present value of minimum lease payments | 864 | 1,837 | ||||||
Less: Current maturities | (235 | ) | (589 | ) | ||||
Lease obligations, net of current portion | $ | 629 | $ | 1,248 | ||||
Undiscounted payments under non-cancelable operating leases and finance leases at December 31, 2018 were as follows (in thousands):
Year Ending December 31, | Finance Leases | Operating Leases | ||||||
2019 | $ | 258 | $ | 882 | ||||
2020 | 241 | 672 | ||||||
2021 | 214 | 564 | ||||||
2022 | 168 | 273 | ||||||
2023 | 85 | 262 | ||||||
Total minimum lease payments | 966 | |||||||
Less: Amount representing interest | (86 | ) | ||||||
Present value of minimum lease payments | 880 | |||||||
Less: Current maturities | (204 | ) | ||||||
Capital lease obligations, net of current portion | $ | 676 | ||||||
| RELATED PARTY |
OneUntil January 2020, one of our directors also servesserved as an officer and board memberdirector of Ameritas Life Insurance Corp. (“Ameritas”). and continues to serve on the board of directors of Ameritas. In connection with our regular assessment of our insurance-based associate benefits, which is conducted by an independent insurance broker, and the costs associated therewith, we purchase dental and vision insurance for certain of our associates from Ameritas. The total value of these purchases was $61,000$42,000 and $54,000$67,000 in the three-monththree-month periods ended SeptemberJune 30, 2019 2020 and 2018,2019, respectively and $187,000$114,000 and $148,000$127,000 in the nine-monthsix-month periods ended SeptemberJune 30, 2019 2020 and 2018, 2019, respectively.
A director, who served on our board through May 2020, also served as a board member of IMA Financial Group. In connection with our regular assessment of our liability coverage, during 2020 we began purchasing directors and officers and employment practices liability insurance through IMA Financial Group. These purchases totaled $478,000 in the three and six-month periods ended June 30, 2020, respectively.
During 2017, we acquired a cost method investment in convertible preferred stock of Practicing Excellence.com, Inc., a privately-held Delaware Corporation (“PX”), which is included in other non-current assets and is carried at cost, adjusted for changes resulting from observable price changes in orderly transactions of the same investment in PX, if any. We also have an agreement with PX which commenced in 2016 under which we act as a reseller of PX services and receivePX receives a portion of the revenues. OurThe total revenue earned from the PX reseller agreement was $170,000$83,000 and $87,000 agreement$170,000 in the three-monththree-month periods ended SeptemberJune 30, 2019 2020 and 2018,2019, respectively, and $493,000$166,000 and $195,000$323,000 in nine-monthsix-month periods ended SeptemberJune 30, 2019 2020 and 2018,2019, respectively. We will no longer earn revenue under this agreement after June 30, 2021.
| SEGMENT INFORMATION |
Our The Company’s six operating segments are aggregated into one reporting segment because they have similar economic characteristics and meet the other aggregation criteria from the FASB guidance on segment disclosure. The six operating segments are Experience, The Governance Institute, Market Insights, Transparency, National Research Corporation Canada and Transitions, which offer a portfolio of solutions that address specific needs around market insight, experience, transparency and governance for healthcare providers, payers and other healthcare organizations. The table below presents entity-wide information regarding ourthe Company’s assets, after elimination of intercompany balances by geographic area:
September 30, 2019 | December 31, 2018 | June 30, 2020 | December 31, 2019 | |||||||||||||
(In thousands) | (In thousands) | |||||||||||||||
Long-lived assets: | ||||||||||||||||
United States | $ | 78,490 | $ | 77,331 | $ | 77,621 | $ | 78,906 | ||||||||
Canada | 2,589 | 2,291 | 2,463 | 2,622 | ||||||||||||
Total | $ | 81,079 | $ | 79,622 | $ | 80,084 | $ | 81,528 | ||||||||
Total assets: | ||||||||||||||||
United States | $ | 92,849 | $ | 91,080 | $ | 101,134 | $ | 95,668 | ||||||||
Canada | 14,800 | 16,952 | 15,647 | 15,017 | ||||||||||||
Total | $ | 107,649 | $ | 108,032 | $ | 116,781 | $ | 110,685 | ||||||||
ITEM 2. | Management’s Discussion and Analysis of Financial Condition and Results of Operations |
The following discussion of our results of operations and financial conditions should be read in conjunction with our condensed consolidated financial statements and related notes appearing elsewhere in this Quarterly Report on Form 10-Q.
We are a leading provider of analytics and insights that facilitate measurement and improvement of the patient and employee experience while also increasing patient engagement and customer loyalty for healthcare organizations. Our solutions enable our clients to understand the voice of the customer with greater clarity, immediacy and depth. Our heritage, proprietary methods, and holistic approach enable our partners to better understand the people they care for and design experiences that inspire loyalty and trust, while also facilitating regulatory compliance and the shift to population-based health management. Our ability to measure what matters most and systematically capture, analyze and deliver insights based on self-reported information from patients, families and consumers is critical in today’s healthcare market. We believe that access to and analysis of our extensive consumer-driven information is becoming more valuable as healthcare providers increasingly need to more deeply understand and engage the people they serve to build customer loyalty.
Our portfolio of subscription-based solutions provides actionable information and analysis to healthcare organizations across a range of mission-critical, constituent-related elements, including patient experience, service recovery, care transitions, health risk assessments, employee engagement, reputation management, and brand loyalty. We partner with clients across the continuum of healthcare services. Our clients include integrated health systems, post-acute providers and payer organizations. We believe this cross-continuum positioning is a unique and an increasingly important capability as evolving payment models drive healthcare providers and payers towards a more collaborative and integrated service model.
The outbreak of COVID-19, and the associated responses, have impacted our business in a variety of ways. Governments have implemented business and travel restrictions, recommended social distancing and other guidelines, and temporarily suspended the requirement for certain healthcare organizations to periodically assess the performance of the care they provide (although many providers continue to do so). Many businesses, including many of our clients, have de-emphasized external business opportunities and restricted in-person meetings while shifting their attention toward addressing COVID-19 planning, business disruptions, higher costs, and revenue shortfalls. At NRC, our workforce remains intact and highly engaged. The vast majority of our associates are working remotely, and to date we have been capable of providing our services without significant disruption. Historically, we have relied on national travel as part of our sales efforts, but as a result of the pandemic we have placed an indefinite hold on all company related travel. The duration and severity of the COVID-19 pandemic and associated responses on our business, including the impact on our revenue, expenses, and cash flows, cannot be predicted at this time. Some clients cost reducing measures have included and could continue to include reducing or eliminating the services they purchase from us. Based on the foregoing, we do not expect our recent revenue and earnings growth to be indicative of future expectations. We do, however, expect to have adequate sources of liquidity to meet our current and expected needs for the foreseeable future.
We received $2.4 million in insurance recoveries in the three-month period ended June 30, 2020, and $400,000 was paid directly to certain vendors from the insurer related to the February incident. These were recorded in selling general and administrative expenses. A final loss claim was submitted to insurance during the three-month period ended June 30, 2020, and an insurance recovery will be recorded when it is probable of collection. Due to insurance recoveries, the February incident has not had and we do not expect it to have a significant impact on our consolidated financial statements or liquidity.
Results of Operations
The following table and graphs set forth, for the periods indicated, selectselected financial information derived from our condensed consolidated financial statements, including amounts expressed as a percentage of total revenue.revenue and the percentage change in such items versus the prior comparable period (please note that all columns may not add up to 100% due to rounding). The trends illustrated in the following table and graphs may not necessarily be indicative of future results. The discussion that follows the tableinformation should be read in conjunction with the condensedour consolidated financial statements.
Three months ended | Nine months ended | |||||||||||||||
September 30, | September 30, | |||||||||||||||
2019 | 2018 | 2019 | 2018 | |||||||||||||
Revenue: | 100.0 | % | 100.0 | % | 100.0 | % | 100.0 | % | ||||||||
Operating expenses: | ||||||||||||||||
Direct | 37.3 | 39.3 | 37.0 | 40.1 | ||||||||||||
Selling, general and administrative | 26.8 | 25.6 | 25.9 | 26.4 | ||||||||||||
Depreciation and amortization | 4.4 | 4.6 | 4.5 | 4.4 | ||||||||||||
Total operating expenses | 68.5 | 69.5 | 67.4 | 70.9 | ||||||||||||
Operating income | 31.5 | % | 30.5 | % | 32.6 | % | 29.1 | % | ||||||||
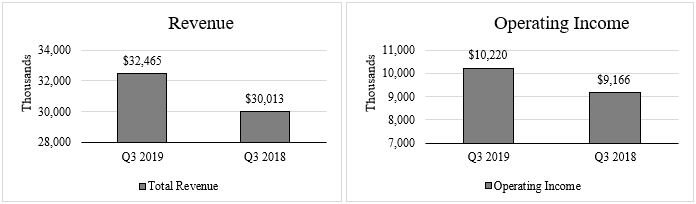
Three months ended June 30, | Six months ended June 30, | |||||||||||||||
2020 | 2019 | 2020 | 2019 | |||||||||||||
Revenue: | 100.0 | % | 100.0 | % | 100.0 | % | 100.0 | % | ||||||||
Operating expenses: | ||||||||||||||||
Direct | 37.3 | 36.6 | 37.2 | 36.8 | ||||||||||||
Selling, general and administrative | 28.4 | 26.5 | 27.1 | 25.5 | ||||||||||||
Depreciation and amortization | 4.5 | 4.6 | 4.3 | 4.5 | ||||||||||||
Total operating expenses | 70.2 | 67.7 | 68.6 | 66.8 | ||||||||||||
Operating income | 29.8 | % | 32.3 | % | 31.4 | % | 33.2 | % | ||||||||
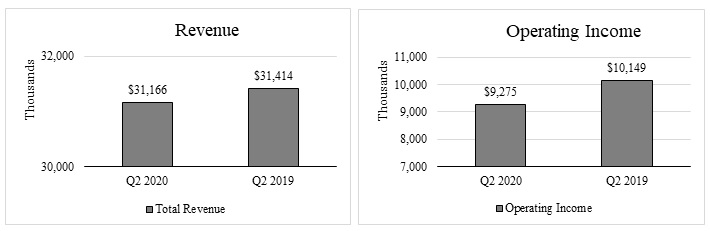
Three Months Ended SeptemberJune 30 2019, 2020, Compared to Three Months Ended SeptemberJune 30 2018, 2019
Revenue. Revenue for the three-month period ended SeptemberJune 30, 2019, increased 8.2%2020, decreased 0.8% to $32.5$31.2 million, compared to $30.0$31.4 million, in the three-month period ended SeptemberJune 30, 2018.2019. The decrease was due to revenue reductions from COVID-19 as some clients have reduced or eliminated services they purchase from us as cost reducing measures, partially offset by growth in overall contract value.
Direct expenses. Direct expenses increased 1.1% to $11.6 million for the three-month periods ended June 30, 2020, compared to $11.5 million for the same period in 2019. This was due to an increase in fixed expenses of $1.1 million, partially offset by a decrease in variable expenses of $1.0 million. Fixed expenses increased primarily as a result of increased salary and benefit costs and contracted services in the customer service and information technology areas partially offset by lower travel and meal costs due to restricted travel associated with COVID-19. Variable expenses decreased due to less postage, printing, and paper costs, primarily resulting from increased use of digital survey methodologies and decreased conference expenses due to rescheduling of a conference on account of COVID-19. Direct expenses as a percentage of revenue were 37.3% in the three-month period ended June 30, 2020 and 36.6% for the same period in 2019 as expenses increased by 1.1% while revenue for the same period decreased by 0.8% in the June 30, 2020 period compared to the same period in 2019.
Selling, general and administrative expenses. Selling, general and administrative expenses increased 6.4% to $8.9 million for the three-month period ended June 30, 2020, compared to $8.3 million for the same period in 2019, primarily due to an increase in salary and benefit costs of $487,000, increased software and platform hosting expenses of $382,000, additional contracted services of $125,000, increased company incentive event costs of $75,000, higher building repair costs of $41,000 and increased business insurance costs of $34,000. These were partially offset by lower travel and meals costs of $447,000 due to restricted travel associated with COVID-19 and lower marketing costs of $161,000. Selling, general and administrative expenses as a percentage of revenue were 28.4% in the three-month periods ended June 30, 2020 and 26.5% for the same period in 2019 as expenses increased by 6.4% and revenue decreased by 0.8% in the June 30, 2020 period compared to the same period in 2019.
Depreciation and amortization. Depreciation and amortization was $1.4 million for the three-month period ended June 30, 2020 and 2019. Depreciation and amortization expense as a percentage of revenue was 4.5% for the three-month period ended June 30, 2020, and 4.6% for the same period in 2019.
Other income (expense). Other expense, net increased to $718,000 for the three-month period ended June 30, 2020, compared to other expense, net of $664,000 for the same period in 2019, primarily due to foreign exchange rate changes, partially offset by decreased interest expense. Interest expense decreased to $450,000 in the 2020 period from $533,000 for the same period in 2019 primarily due to the declining balance on our Term Loan and no borrowings on our Line of Credit during the 2020 period. Other non-interest expense increased to $270,000 in the 2020 period compared to other expense of $139,000 for the same period of 2019 primarily due to revaluation on intercompany transactions due to changes in the foreign exchange rate.
Income tax provision. Income tax provision was $842,000 for the three-month period ended June 30, 2020, compared to $2.1 million for the same period in 2019. The effective tax rate for the three-month period ended June 30, 2020 decreased to 9.8% compared to 22.1% primarily due to increased tax benefits of $1.1 million from the exercise and vesting of share-based compensation awards, partially offset by higher state income taxes since we are filing in more states.

Six Months Ended June 30, 2020, Compared to Six Months Ended June 30, 2019
Revenue. Revenue for the six-month period ended June 30, 2020, increased 3.4% to $65.0 million, compared to $62.9 million in the six-month period ended June 30, 2019. The increase was due to new customer sales, as well as increases in sales to the existing client base. Revenue growth was partially offset by revenue reductions due to COVID-19 as some clients have reduced or eliminated the services they purchase from us as cost reducing measures.
Direct expenses. Direct expenses which represent direct costs of fulfilling our performance obligations, increased 2.8%4.4% to $12.1$24.2 million for the three-monthsix-month period ended SeptemberJune 30, 2019,2020, compared to $11.8$23.2 million in the same period in 2018.2019. This was primarily due to an increase in fixed expenses of $744,000$2.6 million, partially offset by a decrease in variable expenses of $416,000. Variable expenses decreased due to less postage, printing and paper costs due to lower volumes and increased use of digital survey methodologies.$1.6 million. Fixed expenses increased primarily due to higheras a result of increased salary and benefit and contracted services costs in the customer service and information technology areas, and higher company incentive event costs. Direct expenses as a percentage of revenue were 37.3% in the three-month periods ended September 30, 2019 and 39.3% for the same period in 2018 as direct expenses increased by 2.8% while revenue increased by 8.2%.
Selling, general and administrative expenses. Selling, general and administrative expenses increased 13.4% to $8.7 million for the three-month period ended September 30, 2019, compared to $7.7 million for the same period in 2018, primarily due to higher salary and benefit costs of $488,000, increased legal and accounting expenses of $293,000, higher increased software license fees and platform hosting expenses of $221,000, additional marketing program costs of $133,000, higher insurance costs of $71,000 and additional travel costs of $56,000. These were partially offset by lower contracted services of $334,000. Selling, generaldecreased travel and administrative expenses as a percentage of revenue were 26.8% in the three-month period ended September 30, 2019 and 25.6% for the same period in 2018 as selling, general and administrative expenses increased by 13.4% while revenues increased by 8.2%.
Depreciation and amortization. Depreciation and amortization increased 3.0% to $1.4 million for the three-month period ended September 30, 2019meal costs due to increased amortizationrestricted travel from additional computer software investments, partially offset by an intangible asset that was fully amortized prior to the 2019 period. Depreciation and amortization expenses as a percentage of revenue was 4.4% for the three-month period ended September 30, 2019, and 4.6% for the same period in 2018.
Other income (expense). OtherCOVID-19. Variable expense net was $411,000 for the three-month period ended September 30, 2019, compared to $783,000 for the same period in 2018. This decrease in other expense was primarily due to revaluation on intercompany transactions due to changes in the foreign exchange rate.
Provision for income taxes. Provision for income taxes was $1.7 million (17.2% effective tax rate) for the three-month period ended September 30, 2019, compared to $1.4 million (16.6% effective tax rate) for the same period in 2018. The effective tax rate for the three-month period ended September 30, 2019, was higher mainly due to a tax depreciation method change election for software development costs creating an income tax benefit of $308,000 in the 2018 period, additional withholding on unrepatriated Canadian earnings of $90,000 in the 2019 period, and higher projected state taxes in the 2019 period. These were partially offset by increased tax benefits from the exercise of options and dividends paid to non-vested shareholders of $459,000.

Nine Months Ended September 30, 2019, Compared to Nine Months Ended September 30, 2018
Revenue. Revenue for the nine-month period ended September 30, 2019, increased 7.1% to $95.4 million, compared to $89.0 million in the nine-month period ended September 30, 2018. The increase was due to new customer sales and increases in sales to the existing client base.
Direct expenses. Direct expenses, which represent direct costs of fulfilling our performance obligations, decreased 1.2% to $35.3 million for the nine-month period ended September 30, 2019, compared to $35.7 million in the same period in 2018. This was due to a decrease in variable expenses of $2.0 million, partially offset by an increase in fixed expenses of $1.6 million. Variable expenses decreased mainly due to less postage, printing and paper costs due to lower volumes and increased use of digital survey methodologies. FixedDirect expenses increased primarily as a result of increased salary and benefit costs in the customer service and information technology areas partially offset by lower contracted services. Direct expenses decreased as a percentage of revenue to 37.0%37.2% in the nine-monthsix-month period ended SeptemberJune 30, 2019,2020, compared to 40.1%36.8% during the same period of 20182019, as expenses decreasedincreased by 1.2%4.4% while revenue for the same period increased by 7.1%3.4%.
Selling, general and administrative expenses. Selling, general and administrative expenses increased 5.3%9.8% to $24.7$17.6 million for the nine-monthsix-month period ended SeptemberJune 30, 2019,2020, compared to $23.5$16.0 million for the same period in 20182019, primarily due to increasedan increase in salary and benefit costs of $750,000, higher$1.0 million, an increase in software license fees and platform hosting expenses of $772,000, additional travel$558,000, an increase in company incentive event costs of $204,000, increased marketing program expenses of $143,000 and higher$178,000, an increase in business insurance costs of $214,000.$168,000, additional legal and accounting costs of $156,000 primarily due to an insurance refund of legal expenses associated with litigation related to our April 2018 recapitalization (the “Recapitalization”) in the same period in 2019, an increase in contracted services of $130,000, higher bad debt expense of $65,000 and sales tax expense of $58,000. These were partially offset by a reductiondecrease in legaltravel and accountingmeals costs of $410,000 mainly$572,000 due to restricted travel associated with the RecapitalizationCOVID-19 and a decrease in the 2018 period, the Tax Cut and Jobs Act and adoption of ASC 606 in the 2018 period, as well as decreased contracted services of $327,000, lower bad debt expense of $55,000 and decreased repairs and maintenancemarketing costs of $40,000 in the 2019 period.$184,000. Selling, general, and administrative expenses increased as a percentage of revenue were 25.9% into 27.1% for the nine-month periodssix-month period ended SeptemberJune 30, 2019 and 26.4%2020, from 25.5% for the same period in 20182019 as selling, general and administrative expenses increased by 5.3%9.8% while revenuesrevenue increased by 7.1%.3.4% in the 2020 period compared to the 2019 period.
Depreciation and amortization. Depreciation and amortization expenses increased 7.2%decreased 2.7% to $4.3$2.8 million for the nine-monthsix-month period ended SeptemberJune 30, 2019,2020, compared to $4.0$2.9 million for the same period in 20182019, due to increased amortizationdecreased depreciation from additional computer software investments, partially offset by an intangible asset that was fully amortized prior to the 2019 period.equipment investments. Depreciation and amortization expenses as a percentage of revenue was 4.5% and 4.4%were 4.3% for the nine-month periodssix-month period ended SeptemberJune 30, 20192020 and 2018, respectively.4.5% for the same period in 2019.
Other income (expense). Other expense, net was $1.9 milliondecreased to $541,000 for the nine-monthsix-month period ended SeptemberJune 30, 2019,2020, compared to $711,000$1.5 million of other expense, net for the same period in 2018.2019. Interest expense increased $623,000decreased $190,000 primarily due to additional interest related to the term loan originated in April 2018declining balance on our Term Loan and no borrowings on our Line of Credit during the line2020 period. Other non-interest income(expense), net changed to other income of credit. Other$360,000 for the six-month period ended June 30, 2020 compared to other expense net increased $552,000of $779,000 for the same period in 2019 primarily due to revaluation of intercompany transactions for changes in the foreign exchange ratesrates.
Provision for income taxes. Income tax provisionProvision for income taxes. Income tax provision was $5.4 million (18.7% effective tax rate)$458,000 for the nine-monthsix-month period ended SeptemberJune 30, 2019,2020, compared to $2.9$3.8 million (11.6% effective tax rate) for the same period in 2018.2019. The effective tax rate for the nine-monthsix-month period ended SeptemberJune 30, 2020, decreased to a 2.3% effective tax rate from a 19.4% effective tax rate for the same period in 2019 was higher mainlyprimarily due to incomeincreased tax benefits from the Recapitalization due to accelerated vesting of restricted stock and settlement of stock options of $1.1$3.7 million a tax depreciation method change election for software development costs creating an income tax benefit of $308,000 in 2018 and a $247,000 reduction in tax benefits from the exercise and vesting of options and dividends paid to non-vested shareholders compared to 2018. In addition, there was additional withholding on unrepatriated Canadian earnings of $90,000 in the 2019 period. This wasshare-based compensation awards, partially offset by less non-deductible fees of $154,000 primarily related to the Recapitalizationhigher state income taxes since we are filing in the 2018 period.more states.
Liquidity and Capital Resources
We believe that our existing sources of liquidity, including cash and cash equivalents, borrowing availability, and operating cash flows, will be sufficient to meet our projected capitalcurrent and debt maturityexpected needs and dividend policy for the foreseeable future,future. Cash dividends in the aggregate amount of $10.5 million paid in the six-month period ended June 30, 2020 were funded with cash on hand. No dividends were declared in the three-month period ended June 30, 2020. Our board of directors considers whether to declare a dividend and therefore we feel that our working capital deficit has little impactthe amount of any dividends declared on our liquidity. Requirements for working capital, capital expenditures, and debt maturities will continue to be funded by operations and our borrowing arrangements.a quarterly basis.
As of SeptemberJune 30, 2019,2020, our principal sources of liquidity included $8.4$12.0 million of cash and cash equivalents, up to $15.0$30 million of unused borrowings under our lineLine of creditCredit and up to $15.0$15 million on our delayed draw term note.Delayed Draw Term Loan. Of this cash, $3.0$3.3 million was held in Canada. On May 28, 2020, the credit agreement with FNB was amended. As part of this amendment the Line of Credit was expanded from $15 million to $30 million. The delayed draw term noteDelayed Draw Term Loan can only be used to fund permitted future business acquisitions or repurchasing our Common Stock.
Working Capital
We had a working capital balance of $4.4 million and deficit of $11.7 million and $18.7$9.0 million on SeptemberJune 30, 20192020 and December 31, 2018,2019, respectively.
The change was primarily due to a decrease in dividends payable of $12.4 million, an increaseincreases in trade accounts receivable of $3.4$8.2 million, aprepaid expenses of $784,000, and income taxes receivable of $198,000; and decreases in dividends payable of $5.2 million, accrued expenses of $483,000, current portion of notes payable of $412,000 and accounts payable of $322,000. These were partially offset by decrease in income taxes payablecash and cash equivalents of $622,000$1.6 million and a decreasean increase in accrued wages, bonus and profit sharing of $606,000 million. These were partially offset by a decrease in cash and cash equivalents of $4.6 million, a $2.9 million increase in deferred revenue, an increase in accrued expenses of $670,000 and an increase in the current portion of operating lease liability included in other current liabilities of $589,000 (mainly due to the adoption of the New Leases Standard). Dividends payable decreased due to a special dividend, in addition to a quarterly dividend declaration, that was declared in 2018 and paid in January 2019. $744,000.
Trade accounts receivable increased due to the timing of billings and collections on new and renewal contracts. Accrued expenses changedThe COVID-19 pandemic has also resulted in an increase in accounts receivables as some clients have delayed payments and some invoicing was deferred during the second quarter of 2020 due to the timing of payment for services and supplies.our clients’ cash-flow issues. Accrued wages, bonus and profit sharing decreasedincreased due to the payment of 2018 annual bonuses in the three-month period ended March 31, 2019.increased payroll accruals. Income taxes payablereceivable changed due to the timing of income tax payments. Accounts payable, accrued expenses and prepaid expenses changed due to timing of payment for services and supplies. Dividends payable varies due to the timing of dividends being declared and paid. The current portion of notes payable decreased due to the changes in the payment terms due to amending the Term Loan. Our working capital is significantly impacted by our large deferred revenue balances which will vary based on the timing and frequency of billings on annual agreements. The deferred revenue balances as of SeptemberJune 30, 20192020, and December 31, 2018,2019, were $19.1$16.3 million and $16.2$16.4 million, respectively.
The deferred revenue balance is primarily due to timing of initial billings on new and renewal contracts. We typically invoice clients for services before they have been completed. Billed amounts are recorded as billings in excess of revenue earned, or deferred revenue, inon our consolidated financial statements, and are recognized as income when earned. In addition, when work is performed in advance of billing, we record this work as contract assetsrevenue earned in excess of billings, or unbilled revenue. Substantially all deferred revenue and all unbilled revenue will be earned and billed, respectively, within 12 months of the respective period ends.
Cash Flow Analysis
A summary of operating, investing, and financing activities is shown in the following table:
Six Months Ended June 30, | ||||||||||||||||
Nine Months Ended September 30, | ||||||||||||||||
2019 | 2018 | 2020 | 2019 | |||||||||||||
(In thousands) | (In thousands) | |||||||||||||||
Provided by operating activities | $ | 28,974 | $ | 25,936 | $ | 13,903 | $ | 16,106 | ||||||||
Used in investing activities | (3,429 | ) | (4,858 | ) | (1,427 | ) | (2,280 | ) | ||||||||
Used in financing activities | (30,575 | ) | (48,193 | ) | (13,562 | ) | (23,318 | ) | ||||||||
Effect of exchange rate change on cash | 397 | (345 | ) | (474 | ) | 521 | ||||||||||
Net change in cash and cash equivalents | (4,633 | ) | (27,460 | ) | (1,560 | ) | (8,971 | ) | ||||||||
Cash and cash equivalents at end of period | $ | 8,358 | $ | 7,273 | $ | 11,957 | $ | 4,020 | ||||||||
Cash Flows from Operating Activities
Cash flows from operating activities consist of net income adjusted for non-cash items including depreciation and amortization, deferred income taxes, share-based compensation and related taxes, reserve for uncertain tax positions loss on disposal of property and equipment and the effect of working capital changes.
Net cash provided by operating activities was $29.0$13.9 million for the nine-monthsix-month period ended SeptemberJune 30, 2019,2020, which included net income of $23.7$19.5 million, plus non-cash charges (benefits) for deferred income taxes, depreciation and amortization, reserve for uncertain tax positions and share-based compensation and related taxes totaling $3.7 million. Net changes in assets and liabilities decreased cash flows from operating activities by $9.3 million, primarily due to increases in trade accounts receivable, prepaid and other current assets, and deferred contract costs, as well as decreases in accounts payable, income taxes receivable and payable, which fluctuate due to the timing of payments of prepaids, accounts payable, accrued expenses, direct and incremental costs directly related to sales and timing of income tax payments. Deferred revenue also decreased, which will vary based on the timing and frequency of billings on annual agreements. These decreases to cash flows were partially offset by increases in accrued expenses, wages, bonuses, and profit sharing.
Net cash provided by operating activities was $16.1 million for the six-month period ended June 30, 2019, which included net income of $15.6 million, plus non-cash charges (benefits) for deferred tax expense, depreciation and amortization, reserve for uncertain tax positions, non-cash share-based compensation expense, and loss on disposal of property and equipment totaling $5.9 million. Net changes in assets and liabilities decreased cash flows from operating activities by $633,000, primarily due to increases in trade accounts receivable, deferred contract costs, net, and income taxes receivable and payable. These were partially offset by increases in deferred revenue and decreases in prepaid expenses and other current assets.
Net cash provided by operating activities was $25.9 million for the nine months ended September 30, 2018, which included net income of $22.2 million, plus non-cash charges (benefits) for deferred income taxes, depreciation and amortization, reserve for uncertain tax positions, stock compensation and loss on disposal of property and equipment, totaling $6.9$3.7 million. Net changes in assets and liabilities decreased cash flows from operating activities by $3.2 million, primarily due to increases in trade accounts receivable, deferred contract costs and decreases in accrued expense, wages, bonus and profit sharing, and increases in trade accounts receivable, prepaid expenses and other current assets, and income taxes receivablepayable and payable,receivable which fluctuate with the timing of income tax payments. These werepayments, partially offset by a decreasedecreases in prepaids and other current assets and increases in accounts payable and deferred revenue which fluctuates due to timing and frequency of billings on new and renewal contract.revenue.
Cash Flows from Investing Activities
Net cash of $3.4$1.4 million and $4.9$2.3 million was used for investing activities in each of the ninesix months ended SeptemberJune 30, 20192020 and 2018,2019, respectively. These expenditures consisted mainly of computer software classified in property and equipment. We expect similar capital expenditure purchases for the remainder of 20192020, consisting primarily of computer software and hardware and other equipment, to be funded through cash generated from operations.
Cash Flows from Financing Activities
Net cash used in financing activities was $13.6 million in the six months ended June 30, 2020. Cash was used to repay borrowings under the term notes totaling $1.6 million and for finance lease obligations of $124,000. Cash was also used to pay $10.5 million of dividends on our common stock, and to pay payroll tax withholdings related to share-based compensation of $1.9 million. These decreases to cash flows were partially offset by proceeds from the exercise of stock options of $538,000.
Net cash used in financing activities was $30.6$23.3 million in the ninesix months ended SeptemberJune 30, 2019. Cash was used to repay borrowings on the lineLine of creditCredit of $21.0$15.5 million, repay borrowings under the note payableTerm Loan totaling $2.8$1.8 million, and for finance lease obligations of $223,000.$161,000. Cash was also used to pay $26.6$21.8 million of dividends on common stock, and to pay payroll tax withholdings related to share-based compensation of $1.0 million.$483,000. Cash was provided from proceeds of the lineLine of creditCredit of $21.0 million.
Net cash used in financing activities was $48.2 million in the nine months ended September 30, 2018. Cash was used for the Recapitalization of $72.4 million (see Note 2), to repay borrowings under the term notes totaling $2.2 million, to repay borrowings on the line of credit of $2.5 million, to pay loan origination fees on the Credit Agreement of $187,000 and for capital lease obligations of $104,000. Cash was also used to pay $12.7 million of dividends on common stock, and to pay payroll tax withholdings related to share-based compensation of $712,000. Cash was provided from proceeds of the new term loan of $40 million and the line of credit for $2.5$16.5 million.
The effect of changes in foreign exchange rates (decreased)decreased cash and cash equivalents by $474,000 in the six months ended June 30, 2020 and increased cash and cash equivalents by $397,000$521,000 in the ninesix months ended SeptemberJune 30, 2019 and $(345,000) in the nine months ended September 30, 2018.2019.
Capital Expenditures
Cash paid for capital expenditures was $3.4$1.4 million for the ninesix months ended SeptemberJune 30, 2019.2020. These expenditures consisted mainly of computer software classified in property and equipment. We expect similarslightly higher capital expenditure purchases for the remainder of 20192020 consisting primarily of computer software and hardware and other equipmentbuilding improvements to be funded through cash generated from operations.
Debt and Equity
Our credit agreement (the “Credit Agreement”) with First National Bank of Omaha (“FNB”) provides forwas amended and restated on May 28, 2020 and includes (i) a $15,000,000$30,000,000 revolving credit facility (the “Line of Credit”), (ii) a $40,000,000$33,002,069 term loan (the “Term Loan”) and (iii) a $15,000,000 delayed draw-downdraw-dawn term facility (the “Delayed Draw Term Loan” and, together with the Line of Credit and the Term Loan, the “Credit Facilities”). The Term Loan was used to fund, in part, the cash payment to the holders of the class B common stock in connection with the Recapitalization and certain costs of the Recapitalization. The Delayed Draw Term Loan may be used to fund any permitted future business acquisitions or repurchases of our Common Stock and the Line of Credit iscan be used to fund ongoing working capital needs and for other general corporate purposes.
The amended Term Loan is payable inrevised the remaining payments for the existing balance outstanding of $33,002,069 to monthly installments of $462,988 through April 2020 and $526,362 thereafter,May 2025, with a balloon payment due at maturity in April 2023.May 2025. The Term Loan bears interest at a fixed rate per annum of 5%.
Borrowings under the Line of Credit and the Delayed Draw Term Loan, if any, bear interest at a floating rate equal to the 30 day30-day London Interbank Offered Rate (“LIBOR”) plus 225 basis points (4.33%(2.43% at SeptemberJune 30, 2019)2020). Interest on the Line of Credit accrues and is payable monthly. Principal amounts outstanding under the Line of Credit are due and payable in full at maturity, in April 2021. At SeptemberMay 2023. As of June 30, 2020, and December 31, 2019, the Line of Credit did not have an outstandinga balance. The weighted averageThere were no borrowings on the Line of Credit for the nine-month periodthree and six-month periods ended SeptemberJune 30, 2019 was $4.9 million. The weighted average interest rate on2020. There have been no borrowings on the Line of Credit for the nine-month period ended September 30, 2019 was 4.72%. Delayed Draw Term Loan since origination.
We are also obligated to pay ongoing unused commitment fees quarterly in arrears pursuant to the Line of Credit and the Delayed Draw Term Loan facility at a rate of 0.20% per annum based on the actual daily unused portions of the Line of Credit and the Delayed Draw Term Loan facility, respectively.
InThe Credit Agreement contains customary representations, warranties, affirmative and negative covenants (including financial covenants) and events of default. The negative covenants include, among other things, restrictions regarding the event thatincurrence of indebtedness and liens, repurchases of our Common Stock and acquisitions, subject in each case to certain exceptions. Pursuant to the Delayed Draw Term Loan is used, interest-only payments will be due throughCredit Agreement, we are required to maintain a minimum fixed charge coverage ratio of 1.10x for all testing periods throughout the calendar year in which the Delayed Draw Term Loan is drawn upon. After that, amortization will occur at the then current Term Loan rate and schedule with principal and accrued interest amounts outstanding under the Delayed Draw Term Loan due and payable monthly during the termterm(s) of the Delayed Draw Term Loan,Credit Facilities, which expirescalculation excludes, unless our liquidity falls below a specified threshold, (i) any cash dividend in a fiscal quarter that, together with all other cash dividends paid or declared during such fiscal quarter, exceeds $5,500,000 in total cash dividends paid or declared, (ii) the portion of the purchase price for any permitted share repurchase of our shares paid with cash on April 18, 2023. There have been no borrowingshand, and (iii) the portion of any acquisition consideration for a permitted acquisition paid with cash on hand. We are also required to maintain a cash flow leverage ratio of 3.00x or less for all testing periods throughout the Delayed Draw Term Loan since origination.term(s) of the Credit Facilities. As of June 30, 2020, we were in compliance with our financial covenants.
All obligations under the Credit Facilities are to be guaranteed by each of our direct and indirect wholly owned domestic subsidiaries, if any, and, to the extent required by the Credit Agreement, direct and indirect wholly owned foreign subsidiaries (each, a “guarantor”).
The Credit Facilities are secured, subject to permitted liens and other agreed upon exceptions, by a first-priority lien on and perfected security interest in substantially all of our and theour guarantors’ present and future assets (including, without limitation, fee-owned real property, and limited, in the case of the equity interests of foreign subsidiaries, to 65% of the outstanding equity interests of such subsidiaries).
The Credit Agreement contains customary representations, warranties, affirmative and negative covenants (including financial covenants) and events of default. The negative covenants include, among other things, restrictions regarding the incurrence of indebtedness and liens, repurchases of our Common Stock and acquisitions, subject in each case to certain exceptions. The Credit Agreement also contains certain financial covenants with respect to minimum fixed charge coverage ratio and maximum cash flow leverage ratio. Pursuant to the Credit Agreement, we are required to maintain a minimum fixed charge coverage ratio of 1.10x for all testing periods throughout the terms of the Credit Facilities. The special dividend paid on January 15, 2019, is excluded from the calculation of the fixed charge coverage ratio pursuant to a consent received from the lender. We are also required to comply with a maximum cash flow leverage ratio of 3.00x for all testing periods throughout the terms of the Credit Facilities. As of September 30, 2019, we were in compliance with these financial covenants.
LIBOR is currently expected to be phased out in 2021. We are required to pay interest on borrowings under our Line of Credit and Delayed Draw Term Loan at floating rates based on LIBOR. Future debt that we may incur may also require that we pay interest based upon LIBOR. Under the terms of our Credit Agreement with FNB, if LIBOR becomes unavailable during the term of the agreement, FNB may, in its reasonable discretion and in a manner consistent with market practice, designate a substitute index. We currently expect that the determination of interest under our Credit Agreement would be revised as to provide for an interest rate that approximates the existing interest rate as calculated in accordance with LIBOR. Despite our current expectations, we cannot be sure that if LIBOR is phased out or transitioned, the changes to the determination of interest under our agreements would approximate the current calculation in accordance with LIBOR. We do not know what standard, if any, will replace LIBOR if it is phased out or transitioned.
We have finance leases for computer equipment, office equipment, printing and inserting equipment. The balance of the finance leases as of SeptemberJune 30, 20192020 was $863,000.$767,000.
Shareholders’ equity increased $9.9$12.7 million to $29.0$45.6 million at SeptemberJune 30, 2019,2020, from $19.1$32.9 million at December 31, 2018.2019. The increase was mainly due to net income of $23.7$19.5 million and share-based compensation of $917,000 and changes in the cumulative currency translation adjustment of $474,000.$473,000. This was partially offset by dividends declared of $14.2$5.3 million, and share repurchases exceeding the cost of stock options exercised of $1.0 million.$1.3 million and changes in the cumulative translation adjustment of $663,000.
$775,000 was recorded in 2019 after we became aware that a state sales tax liability was both probable and estimable as of December 31, 2019, due to sales taxes that should have been collected from customers in 2019 and certain previous years. In addition, we incurred additional sales tax expense in the three and six-month periods ended June 30, 2020 of $8,000 and $58,000, respectively. We are working through voluntary disclosure agreements with certain states and began remitting sales tax in the second quarter of 2020. We began collecting sales tax in July 2020. State and local jurisdictions have differing rules and regulations governing sales, use, and other taxes and these rules and regulations can be complex and subject to varying interpretations that may change over time. As a result, we could face the possibility of tax assessment and audits, and our liability for these taxes and associated interest and penalties could exceed our original estimates. In July 2020, we received a revenue ruling from the state of Washington noting that our services are not subject to retail sales tax, and therefore, will be reversing $268,000 of sales tax accrual for the state of Washington in the third quarter of 2020.
Contractual Obligations
We had contractual obligations to make payments in the following amounts in the future as of SeptemberJune 30, 2019:2020:
Contractual Obligations(1) | Total Payments | Remainder | One to Three Years | Three to Five Years | After Five Years | Total Payments | Less than One Year | One to Three Years | Three to Five Years | After Five Years | ||||||||||||||||||||||||||||||
(In thousands) | ||||||||||||||||||||||||||||||||||||||||
Operating leases | $ | 2,032 | $ | 191 | $ | 1,049 | $ | 471 | $ | 321 | $ | 1,643 | $ | 410 | $ | 671 | $ | 445 | $ | 117 | ||||||||||||||||||||
Finance leases | 936 | 70 | 520 | 333 | 13 | 779 | 188 | 455 | 136 | -- | ||||||||||||||||||||||||||||||
Uncertain tax positions | -- | -- | -- | -- | -- | -- | -- | -- | -- | -- | ||||||||||||||||||||||||||||||
Line of credit | -- | -- | ||||||||||||||||||||||||||||||||||||||
Long term debt | 40,226 | 1,389 | 12,379 | 26,458 | -- | |||||||||||||||||||||||||||||||||||
Long-term debt | 38,322 | 2,777 | 11,112 | 11,112 | 13,321 | |||||||||||||||||||||||||||||||||||
Total | $ | 43,194 | $ | 1,650 | $ | 13,948 | $ | 27,262 | $ | 334 | $ | 40,744 | $ | 3,375 | $ | 12,238 | $ | 11,693 | $ | 13,438 | ||||||||||||||||||||
(1) | Amounts are inclusive of interest payments, where applicable. |
(2) |
| |
| We have |
We generally do not make unconditional, non-cancelable purchase commitments. We enter into purchase orders in the normal course of business, but these purchase obligations do not exceed one year.
Stock Repurchase Program
Our Board of Directors authorized the repurchase of up to 2,250,000 then-existing class A shares and 375,000 then-existing class B shares of common stock in the open market or in privately negotiated transactions under a stock repurchase program that was originally approved in February 2006 and subsequently amended in May 2013. In connection with the Recapitalization in April 2018, theour Board of Directors further amended the stock repurchase program to eliminate the repurchase of the former class B common stock. As of SeptemberJune 30, 2019,2020, the remaining number of shares of Common Stock that could be purchased under this authorization was 280,491 shares.
Critical Accounting Estimates
There have been no changes to our critical accounting estimates described in the Annual Report on Form 10-K for the year ended December 31, 20182019 that have a material impact on our Condensed Consolidated Financial Statements and the related Notes.
Quantitative and Qualitative Disclosures about Market Risk |
There are no material changes to the disclosures regarding our market risk exposures made in ourits Annual Report on Form 10-K for the year ended December 31, 2018.2019.
Controls and Procedures |
Our management, with the participation of our Chief Executive Officer and Chief Financial Officer, havehas evaluated the effectiveness of the design and operation of our disclosure controls and procedures (as such term is defined in Rules 13a-15(e) and 15d-15(e) under the Securities Exchange Act of 1934) as of the end of the period covered by this report, and has concluded that, as of the end of such period, our disclosure controls and procedures were effective.
On January 1, 2019, we adopted the New Leases Standard, Topic 842 (see Note 1 to the Condensed Consolidated Financial Statements). We implemented internal controls to ensure we adequately evaluated our vendor contracts and properly assessed the impact of the new accounting standard on our financial statements. We also implemented changes to our business processes related to lease arrangements and the control activities within them. The changes included training within business operations management, ongoing vendor contract review and monitoring, and gathering of information for disclosures.
There have been no other changes in our internal control over financial reporting (as such term is defined in Rules 13a-15(f) and 15d-15(f) under the Securities Exchange Act of 1934) that occurred during the quarter ended SeptemberJune 30, 2019,2020, that have materially affected, or are reasonably likely to materially affect, our internal control over financial reporting.
Legal Proceedings |
From time to time, we are involved in certain claims and litigation arising in the normal course of business. Management assesses the probability of loss for such contingencies and recognizes a liability when a loss is probable and estimable. Based on our knowledge of the facts and, in certain cases, advice of outside counsel, management believes the resolution ofThere were no outstanding claims and pending litigation, taking into account existing reserves, will not have a materially adverse effect on our consolidated financial statements.
at June 30, 2020.
Risk Factors |
There have been no material changes to ourThe significant risk factors set forthknown to us that could materially adversely affect our business, financial condition, or operating results are described in Part I, Item 2: Management’s Discussion and analysis of Financial Condition and Results of Operations and in Part I, Item 1A of our Annual Reportannual report on Form 10-K for the year ended December 31, 2018.2019, and in Part II, Item 1A of our quarterly report on Form 10-Q for the quarter ended March 31, 2020.
Unregistered Sales of Equity Securities and Use of Proceeds |
In February 2006 and subsequently amended in May 2013, our Board of Directors authorized the repurchase of 2,250,000 shares of class A common stock and 375,000 shares of class B common stock in the open market or in privately negotiated transactions. In connection with the Recapitalization in April 2018, theour Board of Directors further amended the stock repurchase program to eliminate the repurchase of the former class B common stock. Unless terminated earlier by resolution of our Board of Directors, the repurchase program will expire when we have repurchased all shares of Common Stock authorized for repurchase thereunder. No Common Stock was repurchased under that authorization during the three-month period ended SeptemberJune 30, 2019.2020. The remaining shares of Common Stock that may be purchased under that authorization are 280,491.
Our Credit Agreement provides that, in order for us to pay dividends, there must be no default or event of default existing or that would result from such payment and we must show that we would comply with the Credit Agreement’s fixed charge coverage ratio and consolidated cash flow leverage ratio after giving pro forma effect to such payment.
Exhibits |
The exhibits listed in the exhibit index below are filed as part of this Quarterly Report on Form 10-Q.
EXHIBIT INDEX
Exhibit | Exhibit Description |
(3.1) | |
(3.2) | |
(4.1) | |
(4.2) |
(10.1) |
| (10.2) | Form of Grant used in connection with the National Research Corporation 2004 Non-Employee Director Stock Plan, as amended |
(31.1) | |
(31.2) | |
(32) | |
(101) | Financial statements from the Quarterly Report on Form 10-Q of National Research Corporation for the quarter ended |
| (104) | Cover Page Interactive Data File (formatted in the Inline XBRL and contained in Exhibit 101). |
|
|
Pursuant to the requirements of the Securities Exchange Act of 1934, the Registrant has duly caused this report to be signed on its behalf by the undersigned thereunto duly authorized.
| NATIONAL RESEARCH CORPORATION |
| |
|
|
| |
|
|
|
|
Date: | By: | /s/ Michael D. Hays |
|
|
| Michael D. Hays |
|
|
| Chief Executive Officer (Principal Executive Officer) | |
|
|
|
|
|
|
|
|
|
|
|
|
Date: | By: | /s/ Kevin R. Karas |
|
|
| Kevin R. Karas Senior Vice President Finance, Treasurer, Secretary and Chief Financial Officer (Principal Financial
| |
33