41
| Kansas | 26-3212879 | |||||||||||||||||||
| (State or other jurisdiction of incorporation or organization) | (I.R.S. Employer Identification No.) | |||||||||||||||||||
| 11440 Tomahawk Creek Parkway | ||||||||||||||||||||
| Leawood, | KS | 66211 | ||||||||||||||||||
| (Address of principal executive offices) | (Zip Code) | |||||||||||||||||||
| Title of each class | Trading Symbol | Name of each exchange on which registered | ||||||||||||
| Common Stock, par value $0.01 per share | CFB | The Nasdaq Stock Market LLC | ||||||||||||
| Large accelerated filer | ☐ | Accelerated filer | ☐ | |||||||||||||||||
| Non-accelerated filer | ☒ | Smaller reporting company | ☐ | |||||||||||||||||
| Emerging growth company | ☒ | |||||||||||||||||||
| Part I. Financial Information | |||||
| Item 1. Financial Statements | |||||
| Notes to Consolidated Financial Statements (unaudited) | |||||
| Item 2. Management’s Discussion and Analysis of Financial Condition and Results of Operations | |||||
| Part II. Other Information | |||||
| Signatures | |||||
| March 31, 2020 | December 31, 2019 | June 30, 2020 | December 31, 2019 | |||||||||||||||||||||||||||||||
| (Unaudited) | (Unaudited) | |||||||||||||||||||||||||||||||||
| (Dollars in thousands) | (Dollars in thousands) | |||||||||||||||||||||||||||||||||
| Assets | Assets | Assets | ||||||||||||||||||||||||||||||||
| Cash and cash equivalents | Cash and cash equivalents | $ | 158,987 | $ | 187,320 | Cash and cash equivalents | $ | 194,371 | $ | 187,320 | ||||||||||||||||||||||||
| Available-for-sale securities - taxable | Available-for-sale securities - taxable | 285,426 | 298,208 | Available-for-sale securities - taxable | 256,121 | 298,208 | ||||||||||||||||||||||||||||
| Available-for-sale securities - tax-exempt | Available-for-sale securities - tax-exempt | 449,805 | 443,426 | Available-for-sale securities - tax-exempt | 443,962 | 443,426 | ||||||||||||||||||||||||||||
| Loans, net of allowance for loan losses of $51,458 and $56,896 at March 31, 2020 and December 31, 2019, respectively | 3,950,993 | 3,795,348 | ||||||||||||||||||||||||||||||||
| Loans, net of allowance for loan losses of $71,185 and $56,896 at June 30, 2020 and December 31, 2019, respectively | Loans, net of allowance for loan losses of $71,185 and $56,896 at June 30, 2020 and December 31, 2019, respectively | 4,342,039 | 3,795,348 | |||||||||||||||||||||||||||||||
| Premises and equipment, net | Premises and equipment, net | 68,817 | 70,210 | Premises and equipment, net | 68,889 | 70,210 | ||||||||||||||||||||||||||||
| Restricted equity securities | Restricted equity securities | 18,539 | 17,278 | Restricted equity securities | 20,675 | 17,278 | ||||||||||||||||||||||||||||
| Interest receivable | Interest receivable | 16,958 | 15,716 | Interest receivable | 19,399 | 15,716 | ||||||||||||||||||||||||||||
| Foreclosed assets held for sale | Foreclosed assets held for sale | 3,619 | 3,619 | Foreclosed assets held for sale | 2,502 | 3,619 | ||||||||||||||||||||||||||||
| Deferred tax asset | Deferred tax asset | 8,914 | 13,782 | Deferred tax asset | 14,841 | 13,782 | ||||||||||||||||||||||||||||
| Goodwill and other intangible assets, net | Goodwill and other intangible assets, net | 7,669 | 7,694 | Goodwill and other intangible assets, net | 247 | 7,694 | ||||||||||||||||||||||||||||
| Bank-owned life insurance | Bank-owned life insurance | 66,145 | 65,689 | Bank-owned life insurance | 66,598 | 65,689 | ||||||||||||||||||||||||||||
| Other | Other | 31,535 | 12,943 | Other | 32,610 | 12,943 | ||||||||||||||||||||||||||||
| Total assets | Total assets | $ | 5,067,407 | $ | 4,931,233 | Total assets | $ | 5,462,254 | $ | 4,931,233 | ||||||||||||||||||||||||
| Liabilities and stockholders’ equity | Liabilities and stockholders’ equity | Liabilities and stockholders’ equity | ||||||||||||||||||||||||||||||||
| Deposits | Deposits | Deposits | ||||||||||||||||||||||||||||||||
| Non-interest bearing | Non-interest bearing | $ | 567,215 | $ | 521,826 | Non-interest bearing | $ | 750,333 | $ | 521,826 | ||||||||||||||||||||||||
| Savings, NOW and money market | Savings, NOW and money market | 2,302,545 | 2,162,187 | Savings, NOW and money market | 2,393,269 | 2,162,187 | ||||||||||||||||||||||||||||
| Time | Time | 1,103,062 | 1,239,746 | Time | 1,160,541 | 1,239,746 | ||||||||||||||||||||||||||||
| Total deposits | Total deposits | 3,972,822 | 3,923,759 | Total deposits | 4,304,143 | 3,923,759 | ||||||||||||||||||||||||||||
| Federal funds purchased and repurchase agreements | Federal funds purchased and repurchase agreements | 38,946 | 14,921 | Federal funds purchased and repurchase agreements | 49,881 | 14,921 | ||||||||||||||||||||||||||||
| Federal Home Loan Bank advances | Federal Home Loan Bank advances | 402,680 | 358,743 | Federal Home Loan Bank advances | 450,617 | 358,743 | ||||||||||||||||||||||||||||
| Other borrowings | Other borrowings | 931 | 921 | Other borrowings | 942 | 921 | ||||||||||||||||||||||||||||
| Interest payable and other liabilities | Interest payable and other liabilities | 40,082 | 31,245 | Interest payable and other liabilities | 48,579 | 31,245 | ||||||||||||||||||||||||||||
| Total liabilities | Total liabilities | 4,455,461 | 4,329,589 | Total liabilities | 4,854,162 | 4,329,589 | ||||||||||||||||||||||||||||
| Stockholders’ equity | Stockholders’ equity | Stockholders’ equity | ||||||||||||||||||||||||||||||||
| Redeemable preferred stock, $0.01 par value, $25.00 liquidation value: | Redeemable preferred stock, $0.01 par value, $25.00 liquidation value: | Redeemable preferred stock, $0.01 par value, $25.00 liquidation value: | ||||||||||||||||||||||||||||||||
| authorized - 5,000,000 shares, issued - 0 shares at March 31, 2020 and December 31, 2019, respectively | — | — | ||||||||||||||||||||||||||||||||
| authorized - 5,000,000 shares, issued - 0 shares at June 30, 2020 and December 31, 2019, respectively | authorized - 5,000,000 shares, issued - 0 shares at June 30, 2020 and December 31, 2019, respectively | — | — | |||||||||||||||||||||||||||||||
| Common stock, $0.01 par value: | Common stock, $0.01 par value: | Common stock, $0.01 par value: | ||||||||||||||||||||||||||||||||
| authorized - 200,000,000 shares, issued - 52,098,062 and 51,969,203 shares at March 31, 2020 and December 31, 2019, respectively | 521 | 520 | ||||||||||||||||||||||||||||||||
| authorized - 200,000,000 shares, issued - 52,167,573 and 51,969,203 shares at June 30, 2020 and December 31, 2019, respectively | authorized - 200,000,000 shares, issued - 52,167,573 and 51,969,203 shares at June 30, 2020 and December 31, 2019, respectively | 521 | 520 | |||||||||||||||||||||||||||||||
| Additional paid-in capital | Additional paid-in capital | 520,134 | 519,870 | Additional paid-in capital | 521,133 | 519,870 | ||||||||||||||||||||||||||||
| Retained earnings | Retained earnings | 68,689 | 64,803 | Retained earnings | 61,344 | 64,803 | ||||||||||||||||||||||||||||
| Accumulated other comprehensive income | Accumulated other comprehensive income | 22,602 | 16,451 | Accumulated other comprehensive income | 25,094 | 16,451 | ||||||||||||||||||||||||||||
| Total stockholders’ equity | Total stockholders’ equity | 611,946 | 601,644 | Total stockholders’ equity | 608,092 | 601,644 | ||||||||||||||||||||||||||||
| Total liabilities and stockholders’ equity | Total liabilities and stockholders’ equity | $ | 5,067,407 | $ | 4,931,233 | Total liabilities and stockholders’ equity | $ | 5,462,254 | $ | 4,931,233 | ||||||||||||||||||||||||
| Three months ended | |||||||||||||||||||||||||||||
| March 31, | |||||||||||||||||||||||||||||
| 2020 | 2019 | ||||||||||||||||||||||||||||
| (Dollars in thousands except per share data) | |||||||||||||||||||||||||||||
| Interest Income | |||||||||||||||||||||||||||||
| Loans, including fees | $ | 48,339 | $ | 45,003 | |||||||||||||||||||||||||
| Available-for-sale securities - taxable | 1,774 | 2,320 | |||||||||||||||||||||||||||
| Available-for-sale securities - tax-exempt | 3,312 | 2,935 | |||||||||||||||||||||||||||
| Deposits with financial institutions | 491 | 806 | |||||||||||||||||||||||||||
| Dividends on bank stocks | 292 | 253 | |||||||||||||||||||||||||||
| Total interest income | 54,208 | 51,317 | |||||||||||||||||||||||||||
| Interest Expense | |||||||||||||||||||||||||||||
| Deposits | 14,272 | 15,921 | |||||||||||||||||||||||||||
| Fed funds purchased and repurchase agreements | 62 | 294 | |||||||||||||||||||||||||||
| Advances from Federal Home Loan Bank | 1,611 | 1,459 | |||||||||||||||||||||||||||
| Other borrowings | 35 | 38 | |||||||||||||||||||||||||||
| Total interest expense | 15,980 | 17,712 | |||||||||||||||||||||||||||
| Net Interest Income | 38,228 | 33,605 | |||||||||||||||||||||||||||
| Provision for Loan Losses | 13,950 | 2,850 | |||||||||||||||||||||||||||
| Net Interest Income after Provision for Loan Losses | 24,278 | 30,755 | |||||||||||||||||||||||||||
| Non-Interest Income | |||||||||||||||||||||||||||||
| Service charges and fees on customer accounts | 508 | 158 | |||||||||||||||||||||||||||
| Gain on sale of available-for-sale debt securities | 393 | 27 | |||||||||||||||||||||||||||
| Gain on sale of loans | — | 79 | |||||||||||||||||||||||||||
| Income from bank-owned life insurance | 456 | 467 | |||||||||||||||||||||||||||
| Swap fee income (loss), net | (9) | 377 | |||||||||||||||||||||||||||
| ATM and credit card interchange income | 485 | 377 | |||||||||||||||||||||||||||
| Other non-interest income | 262 | 160 | |||||||||||||||||||||||||||
| Total non-interest income | 2,095 | 1,645 | |||||||||||||||||||||||||||
| Non-Interest Expense | |||||||||||||||||||||||||||||
| Salaries and employee benefits | 14,390 | 14,590 | |||||||||||||||||||||||||||
| Occupancy | 2,085 | 2,159 | |||||||||||||||||||||||||||
| Professional fees | 671 | 782 | |||||||||||||||||||||||||||
| Deposit insurance premiums | 1,016 | 837 | |||||||||||||||||||||||||||
| Data processing | 692 | 594 | |||||||||||||||||||||||||||
| Advertising | 500 | 713 | |||||||||||||||||||||||||||
| Software and communication | 876 | 679 | |||||||||||||||||||||||||||
| Equipment costs, other asset depreciation, and amortization | 395 | 473 | |||||||||||||||||||||||||||
| Other non-interest expense | 1,598 | 1,804 | |||||||||||||||||||||||||||
| Total non-interest expense | 22,223 | 22,631 | |||||||||||||||||||||||||||
| Net Income Before Taxes | 4,150 | 9,769 | |||||||||||||||||||||||||||
| Income tax expense | 293 | 419 | |||||||||||||||||||||||||||
| Net Income | $ | 3,857 | $ | 9,350 | |||||||||||||||||||||||||
| Basic Earnings Per Share | $ | 0.07 | $ | 0.20 | |||||||||||||||||||||||||
| Diluted Earnings Per Share | $ | 0.07 | $ | 0.20 | |||||||||||||||||||||||||
| Three Months Ended | Six Months Ended | ||||||||||||||||||||||||||||||||||||||||
| June 30, | June 30, | ||||||||||||||||||||||||||||||||||||||||
| 2020 | 2019 | 2020 | 2019 | ||||||||||||||||||||||||||||||||||||||
| (Dollars in thousands except per share data) | |||||||||||||||||||||||||||||||||||||||||
| Interest Income | |||||||||||||||||||||||||||||||||||||||||
| Loans, including fees | $ | 46,323 | $ | 47,989 | $ | 94,662 | $ | 92,992 | |||||||||||||||||||||||||||||||||
| Available-for-sale securities - taxable | 1,358 | 2,335 | 3,132 | 4,655 | |||||||||||||||||||||||||||||||||||||
| Available-for-sale securities - tax-exempt | 3,260 | 2,916 | 6,572 | 5,851 | |||||||||||||||||||||||||||||||||||||
| Deposits with financial institutions | 45 | 676 | 536 | 1,482 | |||||||||||||||||||||||||||||||||||||
| Dividends on bank stocks | 268 | 276 | 560 | 529 | |||||||||||||||||||||||||||||||||||||
| Total interest income | 51,254 | 54,192 | 105,462 | 105,509 | |||||||||||||||||||||||||||||||||||||
| Interest Expense | |||||||||||||||||||||||||||||||||||||||||
| Deposits | 8,405 | 17,497 | 22,677 | 33,418 | |||||||||||||||||||||||||||||||||||||
| Fed funds purchased and repurchase agreements | 46 | 133 | 108 | 427 | |||||||||||||||||||||||||||||||||||||
| Federal Home Loan Bank Advances | 1,620 | 1,651 | 3,231 | 3,110 | |||||||||||||||||||||||||||||||||||||
| Other borrowings | 26 | 37 | 61 | 75 | |||||||||||||||||||||||||||||||||||||
| Total interest expense | 10,097 | 19,318 | 26,077 | 37,030 | |||||||||||||||||||||||||||||||||||||
| Net Interest Income | 41,157 | 34,874 | 79,385 | 68,479 | |||||||||||||||||||||||||||||||||||||
| Provision for Loan Losses | 21,000 | 2,850 | 34,950 | 5,700 | |||||||||||||||||||||||||||||||||||||
| Net Interest Income after Provision for Loan Losses | 20,157 | 32,024 | 44,435 | 62,779 | |||||||||||||||||||||||||||||||||||||
| Non-Interest Income | |||||||||||||||||||||||||||||||||||||||||
| Service charges and fees on customer accounts | 647 | 211 | 1,155 | 369 | |||||||||||||||||||||||||||||||||||||
| Gain on sale of available-for-sale debt securities | 320 | 406 | 713 | 433 | |||||||||||||||||||||||||||||||||||||
| Impairment of premises and equipment held for sale | — | (424) | — | (424) | |||||||||||||||||||||||||||||||||||||
| Gain on sale of loans | — | 79 | — | 158 | |||||||||||||||||||||||||||||||||||||
| Income from bank-owned life insurance | 453 | 473 | 909 | 940 | |||||||||||||||||||||||||||||||||||||
| Swap fee income (loss), net | (32) | 159 | (41) | 536 | |||||||||||||||||||||||||||||||||||||
| ATM and credit card interchange income | 896 | 459 | 1,381 | 836 | |||||||||||||||||||||||||||||||||||||
| Other non-interest income | 350 | 309 | 612 | 469 | |||||||||||||||||||||||||||||||||||||
| Total non-interest income | 2,634 | 1,672 | 4,729 | 3,317 | |||||||||||||||||||||||||||||||||||||
| Non-Interest Expense | |||||||||||||||||||||||||||||||||||||||||
| Salaries and employee benefits | 14,004 | 14,450 | 28,394 | 29,040 | |||||||||||||||||||||||||||||||||||||
| Occupancy | 2,045 | 2,062 | 4,130 | 4,221 | |||||||||||||||||||||||||||||||||||||
| Professional fees | 1,295 | 714 | 1,966 | 1,496 | |||||||||||||||||||||||||||||||||||||
| Deposit insurance premiums | 1,039 | 881 | 2,055 | 1,718 | |||||||||||||||||||||||||||||||||||||
| Data processing | 721 | 625 | 1,413 | 1,219 | |||||||||||||||||||||||||||||||||||||
| Advertising | 223 | 477 | 723 | 1,190 | |||||||||||||||||||||||||||||||||||||
| Software and communication | 937 | 828 | 1,813 | 1,507 | |||||||||||||||||||||||||||||||||||||
| Foreclosed assets, net | 1,135 | 19 | 1,154 | 25 | |||||||||||||||||||||||||||||||||||||
| Goodwill impairment | 7,397 | — | 7,397 | — | |||||||||||||||||||||||||||||||||||||
| Other non-interest expense | 2,214 | 1,904 | 4,188 | 4,175 | |||||||||||||||||||||||||||||||||||||
| Total non-interest expense | 31,010 | 21,960 | 53,233 | 44,591 | |||||||||||||||||||||||||||||||||||||
| Net Income (Loss) Before Taxes | (8,219) | 11,736 | (4,069) | 21,505 | |||||||||||||||||||||||||||||||||||||
| Income tax expense (benefit) | (863) | 2,297 | (570) | 2,716 | |||||||||||||||||||||||||||||||||||||
| Net Income (Loss) | $ | (7,356) | $ | 9,439 | $ | (3,499) | $ | 18,789 | |||||||||||||||||||||||||||||||||
| Basic Earnings (Loss) Per Share | $ | (0.14) | $ | 0.21 | $ | (0.07) | $ | 0.41 | |||||||||||||||||||||||||||||||||
| Diluted Earnings (Loss) Per Share | $ | (0.14) | $ | 0.20 | $ | (0.07) | $ | 0.40 | |||||||||||||||||||||||||||||||||
| Three months ended | Three Months Ended | Six Months Ended | ||||||||||||||||||||||||||||||||||||||||||||||||||||||||||||||||||||
| March 31, | June 30, | June 30, | ||||||||||||||||||||||||||||||||||||||||||||||||||||||||||||||||||||
| 2020 | 2019 | 2020 | 2019 | 2020 | 2019 | |||||||||||||||||||||||||||||||||||||||||||||||||||||||||||||||||
| (Dollars in thousands) | (Dollars in thousands) | |||||||||||||||||||||||||||||||||||||||||||||||||||||||||||||||||||||
| Net Income | $ | 3,857 | $ | 9,350 | ||||||||||||||||||||||||||||||||||||||||||||||||||||||||||||||||||
| Net Income (Loss) | Net Income (Loss) | $ | (7,356) | $ | 9,439 | $ | (3,499) | $ | 18,789 | |||||||||||||||||||||||||||||||||||||||||||||||||||||||||||||
| Other Comprehensive Income | Other Comprehensive Income | Other Comprehensive Income | ||||||||||||||||||||||||||||||||||||||||||||||||||||||||||||||||||||
| Unrealized gain on available-for-sale debt securities | Unrealized gain on available-for-sale debt securities | 8,532 | 12,394 | Unrealized gain on available-for-sale debt securities | 3,618 | 9,977 | 12,150 | 22,327 | ||||||||||||||||||||||||||||||||||||||||||||||||||||||||||||||
| Less: income tax | Less: income tax | 2,084 | 3,056 | Less: income tax | 884 | 2,449 | 2,968 | 5,480 | ||||||||||||||||||||||||||||||||||||||||||||||||||||||||||||||
| Unrealized gain on available-for-sale debt securities, net of income tax | Unrealized gain on available-for-sale debt securities, net of income tax | 6,448 | 9,338 | Unrealized gain on available-for-sale debt securities, net of income tax | 2,734 | 7,528 | 9,182 | 16,847 | ||||||||||||||||||||||||||||||||||||||||||||||||||||||||||||||
| Reclassification adjustment for realized gains included in income | Reclassification adjustment for realized gains included in income | 393 | 53 | Reclassification adjustment for realized gains included in income | 320 | 406 | 713 | 433 | ||||||||||||||||||||||||||||||||||||||||||||||||||||||||||||||
| Less: income tax | Less: income tax | 96 | 13 | Less: income tax | 78 | 100 | 174 | 107 | ||||||||||||||||||||||||||||||||||||||||||||||||||||||||||||||
| Less: reclassification adjustment for realized gains included in income, net of income tax | Less: reclassification adjustment for realized gains included in income, net of income tax | 297 | 40 | Less: reclassification adjustment for realized gains included in income, net of income tax | 242 | 306 | 539 | 326 | ||||||||||||||||||||||||||||||||||||||||||||||||||||||||||||||
| Other comprehensive income | Other comprehensive income | 6,151 | 9,298 | Other comprehensive income | 2,492 | 7,222 | 8,643 | 16,521 | ||||||||||||||||||||||||||||||||||||||||||||||||||||||||||||||
| Comprehensive Income | $ | 10,008 | $ | 18,648 | ||||||||||||||||||||||||||||||||||||||||||||||||||||||||||||||||||
| Comprehensive Income (Loss) | Comprehensive Income (Loss) | $ | (4,864) | $ | 16,661 | $ | 5,144 | $ | 35,310 | |||||||||||||||||||||||||||||||||||||||||||||||||||||||||||||
| Accumulated | Accumulated | |||||||||||||||||||||||||||||||||||||||||||||||||||||||||||||||||||||||||||||||||||||||||||||||||||||||||||||||||||||||||||||||||||||||||||||||||||||||||||||||||||||||||||||||||||||||||||||
| Additional | Other | Additional | Other | |||||||||||||||||||||||||||||||||||||||||||||||||||||||||||||||||||||||||||||||||||||||||||||||||||||||||||||||||||||||||||||||||||||||||||||||||||||||||||||||||||||||||||||||||||||||||||
| Preferred Stock | Common Stock | Paid in | Retained | Comprehensive | Preferred Stock | Common Stock | Paid in | Retained | Comprehensive | |||||||||||||||||||||||||||||||||||||||||||||||||||||||||||||||||||||||||||||||||||||||||||||||||||||||||||||||||||||||||||||||||||||||||||||||||||||||||||||||||||||||||||||||||||||
| Shares | Amount | Shares | Amount | Capital | Earnings | Income (Loss) | Total | Shares | Amount | Shares | Amount | Capital | Earnings | Income | Total | |||||||||||||||||||||||||||||||||||||||||||||||||||||||||||||||||||||||||||||||||||||||||||||||||||||||||||||||||||||||||||||||||||||||||||||||||||||||||||||||||||||||||||||||
| (Dollars in thousands) | (Dollars in thousands) | |||||||||||||||||||||||||||||||||||||||||||||||||||||||||||||||||||||||||||||||||||||||||||||||||||||||||||||||||||||||||||||||||||||||||||||||||||||||||||||||||||||||||||||||||||||||||||||
| Balance at December 31, 2018 | 1,200,000 | $ | 12 | 45,074,322 | $ | 451 | $ | 454,512 | $ | 38,371 | $ | (3,010) | $ | 490,336 | ||||||||||||||||||||||||||||||||||||||||||||||||||||||||||||||||||||||||||||||||||||||||||||||||||||||||||||||||||||||||||||||||||||||||||||||||||||||||||||||||||||||||||||||||
| Balance at March 31, 2019 | Balance at March 31, 2019 | — | $ | — | 45,202,370 | $ | 452 | $ | 428,412 | $ | 45,293 | $ | 6,357 | $ | 480,514 | |||||||||||||||||||||||||||||||||||||||||||||||||||||||||||||||||||||||||||||||||||||||||||||||||||||||||||||||||||||||||||||||||||||||||||||||||||||||||||||||||||||||||||||||
| Net income | Net income | — | — | — | — | — | 9,350 | — | 9,350 | Net income | — | — | — | — | — | 9,439 | — | 9,439 | ||||||||||||||||||||||||||||||||||||||||||||||||||||||||||||||||||||||||||||||||||||||||||||||||||||||||||||||||||||||||||||||||||||||||||||||||||||||||||||||||||||||||||||
| Change in unrealized appreciation on available-for-sale securities | Change in unrealized appreciation on available-for-sale securities | — | — | — | — | — | — | 9,298 | 9,298 | Change in unrealized appreciation on available-for-sale securities | — | — | — | — | — | — | 7,222 | 7,222 | ||||||||||||||||||||||||||||||||||||||||||||||||||||||||||||||||||||||||||||||||||||||||||||||||||||||||||||||||||||||||||||||||||||||||||||||||||||||||||||||||||||||||||||
| Issuance of shares | Issuance of shares | — | — | 101,203 | 1 | 826 | — | — | 827 | Issuance of shares | — | — | 149,765 | 1 | 889 | — | — | 890 | ||||||||||||||||||||||||||||||||||||||||||||||||||||||||||||||||||||||||||||||||||||||||||||||||||||||||||||||||||||||||||||||||||||||||||||||||||||||||||||||||||||||||||||
| Issuance of shares from equity-based awards | Issuance of shares from equity-based awards | — | — | 36,845 | — | (134) | — | — | (134) | Issuance of shares from equity-based awards | — | — | 15,506 | — | (102) | — | — | (102) | ||||||||||||||||||||||||||||||||||||||||||||||||||||||||||||||||||||||||||||||||||||||||||||||||||||||||||||||||||||||||||||||||||||||||||||||||||||||||||||||||||||||||||||
| Retired shares | (1,200,000) | (12) | (10,000) | — | (30,088) | (55) | — | (30,155) | ||||||||||||||||||||||||||||||||||||||||||||||||||||||||||||||||||||||||||||||||||||||||||||||||||||||||||||||||||||||||||||||||||||||||||||||||||||||||||||||||||||||||||||||||||||||
| Preferred dividends declared | — | — | — | — | — | (175) | — | (175) | ||||||||||||||||||||||||||||||||||||||||||||||||||||||||||||||||||||||||||||||||||||||||||||||||||||||||||||||||||||||||||||||||||||||||||||||||||||||||||||||||||||||||||||||||||||||
| Employee receivables from sale of stock | — | — | — | — | 2 | 30 | — | 32 | ||||||||||||||||||||||||||||||||||||||||||||||||||||||||||||||||||||||||||||||||||||||||||||||||||||||||||||||||||||||||||||||||||||||||||||||||||||||||||||||||||||||||||||||||||||||
| Share-based compensation | — | — | — | — | 1,098 | — | — | 1,098 | ||||||||||||||||||||||||||||||||||||||||||||||||||||||||||||||||||||||||||||||||||||||||||||||||||||||||||||||||||||||||||||||||||||||||||||||||||||||||||||||||||||||||||||||||||||||
| Employee stock purchase plan additions | — | — | — | — | 37 | — | — | 37 | ||||||||||||||||||||||||||||||||||||||||||||||||||||||||||||||||||||||||||||||||||||||||||||||||||||||||||||||||||||||||||||||||||||||||||||||||||||||||||||||||||||||||||||||||||||||
| Adoption of ASU 2016-01 | — | — | — | — | — | (69) | 69 | — | ||||||||||||||||||||||||||||||||||||||||||||||||||||||||||||||||||||||||||||||||||||||||||||||||||||||||||||||||||||||||||||||||||||||||||||||||||||||||||||||||||||||||||||||||||||||
| Adoption of ASU 2018-07 | — | — | — | — | 2,159 | (2,159) | — | — | ||||||||||||||||||||||||||||||||||||||||||||||||||||||||||||||||||||||||||||||||||||||||||||||||||||||||||||||||||||||||||||||||||||||||||||||||||||||||||||||||||||||||||||||||||||||
| Balance at March 31, 2019 | — | $ | — | 45,202,370 | $ | 452 | $ | 428,412 | $ | 45,293 | $ | 6,357 | $ | 480,514 | ||||||||||||||||||||||||||||||||||||||||||||||||||||||||||||||||||||||||||||||||||||||||||||||||||||||||||||||||||||||||||||||||||||||||||||||||||||||||||||||||||||||||||||||||
| Employee receivables from sale of stock | Employee receivables from sale of stock | — | — | — | — | 2 | 84 | — | 86 | |||||||||||||||||||||||||||||||||||||||||||||||||||||||||||||||||||||||||||||||||||||||||||||||||||||||||||||||||||||||||||||||||||||||||||||||||||||||||||||||||||||||||||||||||||||
| Stock-based compensation | Stock-based compensation | — | — | — | — | 1,147 | — | — | 1,147 | |||||||||||||||||||||||||||||||||||||||||||||||||||||||||||||||||||||||||||||||||||||||||||||||||||||||||||||||||||||||||||||||||||||||||||||||||||||||||||||||||||||||||||||||||||||
| Employee stock purchase plan additions | Employee stock purchase plan additions | — | — | — | — | (1) | — | — | (1) | |||||||||||||||||||||||||||||||||||||||||||||||||||||||||||||||||||||||||||||||||||||||||||||||||||||||||||||||||||||||||||||||||||||||||||||||||||||||||||||||||||||||||||||||||||||
| Balance at June 30, 2019 | Balance at June 30, 2019 | — | $ | — | 45,367,641 | $ | 453 | $ | 430,347 | $ | 54,816 | $ | 13,579 | $ | 499,195 | |||||||||||||||||||||||||||||||||||||||||||||||||||||||||||||||||||||||||||||||||||||||||||||||||||||||||||||||||||||||||||||||||||||||||||||||||||||||||||||||||||||||||||||||
| Accumulated | Accumulated | |||||||||||||||||||||||||||||||||||||||||||||||||||||||||||||||||||||||||||||||||||||||||||||||||||||||||||||||||||||||||||||||||||||||||||||||||||||||||||||||||||||||||||||||||||||||||||||
| Additional | Other | Additional | Other | |||||||||||||||||||||||||||||||||||||||||||||||||||||||||||||||||||||||||||||||||||||||||||||||||||||||||||||||||||||||||||||||||||||||||||||||||||||||||||||||||||||||||||||||||||||||||||
| Preferred Stock | Common Stock | Paid in | Retained | Comprehensive | Preferred Stock | Common Stock | Paid in | Retained | Comprehensive | |||||||||||||||||||||||||||||||||||||||||||||||||||||||||||||||||||||||||||||||||||||||||||||||||||||||||||||||||||||||||||||||||||||||||||||||||||||||||||||||||||||||||||||||||||||
| Shares | Amount | Shares | Amount | Capital | Earnings | Income | Total | Shares | Amount | Shares | Amount | Capital | Earnings | Income | Total | |||||||||||||||||||||||||||||||||||||||||||||||||||||||||||||||||||||||||||||||||||||||||||||||||||||||||||||||||||||||||||||||||||||||||||||||||||||||||||||||||||||||||||||||
| (Dollars in thousands) | (Dollars in thousands) | |||||||||||||||||||||||||||||||||||||||||||||||||||||||||||||||||||||||||||||||||||||||||||||||||||||||||||||||||||||||||||||||||||||||||||||||||||||||||||||||||||||||||||||||||||||||||||||
| Balance at December 31, 2019 | — | $ | — | 51,969,203 | $ | 520 | $ | 519,870 | $ | 64,803 | $ | 16,451 | $ | 601,644 | ||||||||||||||||||||||||||||||||||||||||||||||||||||||||||||||||||||||||||||||||||||||||||||||||||||||||||||||||||||||||||||||||||||||||||||||||||||||||||||||||||||||||||||||||
| Net income | — | — | — | — | — | 3,857 | — | 3,857 | ||||||||||||||||||||||||||||||||||||||||||||||||||||||||||||||||||||||||||||||||||||||||||||||||||||||||||||||||||||||||||||||||||||||||||||||||||||||||||||||||||||||||||||||||||||||
| Balance at March 31, 2020 | Balance at March 31, 2020 | — | $ | — | 52,098,062 | $ | 521 | $ | 520,134 | $ | 68,689 | $ | 22,602 | $ | 611,946 | |||||||||||||||||||||||||||||||||||||||||||||||||||||||||||||||||||||||||||||||||||||||||||||||||||||||||||||||||||||||||||||||||||||||||||||||||||||||||||||||||||||||||||||||
| Net loss | Net loss | — | — | — | — | — | (7,356) | — | (7,356) | |||||||||||||||||||||||||||||||||||||||||||||||||||||||||||||||||||||||||||||||||||||||||||||||||||||||||||||||||||||||||||||||||||||||||||||||||||||||||||||||||||||||||||||||||||||
| Change in unrealized appreciation on available-for-sale securities | Change in unrealized appreciation on available-for-sale securities | — | — | — | — | — | — | 6,151 | 6,151 | Change in unrealized appreciation on available-for-sale securities | — | — | — | — | — | — | 2,492 | 2,492 | ||||||||||||||||||||||||||||||||||||||||||||||||||||||||||||||||||||||||||||||||||||||||||||||||||||||||||||||||||||||||||||||||||||||||||||||||||||||||||||||||||||||||||||
| Issuance of shares from equity-based awards | Issuance of shares from equity-based awards | — | — | 128,859 | 1 | (671) | — | — | (670) | Issuance of shares from equity-based awards | — | — | 69,511 | — | (83) | — | — | (83) | ||||||||||||||||||||||||||||||||||||||||||||||||||||||||||||||||||||||||||||||||||||||||||||||||||||||||||||||||||||||||||||||||||||||||||||||||||||||||||||||||||||||||||||
| Employee receivables from sale of stock | Employee receivables from sale of stock | — | — | — | — | 1 | 29 | — | 30 | Employee receivables from sale of stock | — | — | — | — | — | 11 | — | 11 | ||||||||||||||||||||||||||||||||||||||||||||||||||||||||||||||||||||||||||||||||||||||||||||||||||||||||||||||||||||||||||||||||||||||||||||||||||||||||||||||||||||||||||||
| Share-based compensation | — | — | — | — | 934 | — | — | 934 | ||||||||||||||||||||||||||||||||||||||||||||||||||||||||||||||||||||||||||||||||||||||||||||||||||||||||||||||||||||||||||||||||||||||||||||||||||||||||||||||||||||||||||||||||||||||
| Stock-based compensation | Stock-based compensation | — | — | — | — | 1,082 | — | — | 1,082 | |||||||||||||||||||||||||||||||||||||||||||||||||||||||||||||||||||||||||||||||||||||||||||||||||||||||||||||||||||||||||||||||||||||||||||||||||||||||||||||||||||||||||||||||||||||
| Balance at March 31, 2020 | — | $ | — | 52,098,062 | $ | 521 | $ | 520,134 | $ | 68,689 | $ | 22,602 | $ | 611,946 | ||||||||||||||||||||||||||||||||||||||||||||||||||||||||||||||||||||||||||||||||||||||||||||||||||||||||||||||||||||||||||||||||||||||||||||||||||||||||||||||||||||||||||||||||
| Balance at June 30, 2020 | Balance at June 30, 2020 | — | $ | — | 52,167,573 | $ | 521 | $ | 521,133 | $ | 61,344 | $ | 25,094 | $ | 608,092 | |||||||||||||||||||||||||||||||||||||||||||||||||||||||||||||||||||||||||||||||||||||||||||||||||||||||||||||||||||||||||||||||||||||||||||||||||||||||||||||||||||||||||||||||
| Accumulated | |||||||||||||||||||||||||||||||||||||||||||||||||||||||||||||||||||||||||||||||||||||||||
| Additional | Other | ||||||||||||||||||||||||||||||||||||||||||||||||||||||||||||||||||||||||||||||||||||||||
| Preferred Stock | Common Stock | Paid in | Retained | Comprehensive | |||||||||||||||||||||||||||||||||||||||||||||||||||||||||||||||||||||||||||||||||||||
| Shares | Amount | Shares | Amount | Capital | Earnings | Income (Loss) | Total | ||||||||||||||||||||||||||||||||||||||||||||||||||||||||||||||||||||||||||||||||||
| (Dollars in thousands) | |||||||||||||||||||||||||||||||||||||||||||||||||||||||||||||||||||||||||||||||||||||||||
| Balance at December 31, 2018 | 1,200,000 | $ | 12 | 45,074,322 | $ | 451 | $ | 454,512 | $ | 38,371 | $ | (3,010) | $ | 490,336 | |||||||||||||||||||||||||||||||||||||||||||||||||||||||||||||||||||||||||||
| Net income | — | — | — | — | — | 18,789 | — | 18,789 | |||||||||||||||||||||||||||||||||||||||||||||||||||||||||||||||||||||||||||||||||
| Change in unrealized appreciation on available-for-sale securities | — | — | — | — | — | — | 16,521 | 16,521 | |||||||||||||||||||||||||||||||||||||||||||||||||||||||||||||||||||||||||||||||||
| Issuance of shares | — | — | 250,968 | 2 | 1,715 | — | — | 1,717 | |||||||||||||||||||||||||||||||||||||||||||||||||||||||||||||||||||||||||||||||||
| Issuance of shares from equity-based awards | — | — | 52,351 | — | (236) | — | — | (236) | |||||||||||||||||||||||||||||||||||||||||||||||||||||||||||||||||||||||||||||||||
| Retired shares | (1,200,000) | (12) | (10,000) | — | (30,088) | (55) | — | (30,155) | |||||||||||||||||||||||||||||||||||||||||||||||||||||||||||||||||||||||||||||||||
| Preferred dividends declared | — | — | — | — | — | (175) | — | (175) | |||||||||||||||||||||||||||||||||||||||||||||||||||||||||||||||||||||||||||||||||
| Employee receivables from sale of stock | — | — | — | — | 4 | 113 | — | 117 | |||||||||||||||||||||||||||||||||||||||||||||||||||||||||||||||||||||||||||||||||
| Stock-based compensation | — | — | — | — | 2,245 | — | — | 2,245 | |||||||||||||||||||||||||||||||||||||||||||||||||||||||||||||||||||||||||||||||||
| Employee stock purchase plan additions | — | — | — | — | 36 | — | — | 36 | |||||||||||||||||||||||||||||||||||||||||||||||||||||||||||||||||||||||||||||||||
| Adoption of ASU 2016-01 | — | — | — | — | — | (68) | 68 | — | |||||||||||||||||||||||||||||||||||||||||||||||||||||||||||||||||||||||||||||||||
| Adoption of ASU 2018-07 | — | — | — | — | 2,159 | (2,159) | — | — | |||||||||||||||||||||||||||||||||||||||||||||||||||||||||||||||||||||||||||||||||
| Balance at June 30, 2019 | — | $ | — | 45,367,641 | $ | 453 | $ | 430,347 | $ | 54,816 | $ | 13,579 | $ | 499,195 | |||||||||||||||||||||||||||||||||||||||||||||||||||||||||||||||||||||||||||
| Accumulated | |||||||||||||||||||||||||||||||||||||||||||||||||||||||||||||||||||||||||||||||||||||||||||||||
| Additional | Other | ||||||||||||||||||||||||||||||||||||||||||||||||||||||||||||||||||||||||||||||||||||||||||||||
| Preferred Stock | Common Stock | Paid in | Retained | Comprehensive | |||||||||||||||||||||||||||||||||||||||||||||||||||||||||||||||||||||||||||||||||||||||||||
| Shares | Amount | Shares | Amount | Capital | Earnings | Income | Total | ||||||||||||||||||||||||||||||||||||||||||||||||||||||||||||||||||||||||||||||||||||||||
| (Dollars in thousands) | |||||||||||||||||||||||||||||||||||||||||||||||||||||||||||||||||||||||||||||||||||||||||||||||
| Balance at December 31, 2019 | — | $ | — | 51,969,203 | $ | 520 | $ | 519,870 | $ | 64,803 | $ | 16,451 | $ | 601,644 | |||||||||||||||||||||||||||||||||||||||||||||||||||||||||||||||||||||||||||||||||
| Net loss | — | — | — | — | — | (3,499) | — | (3,499) | |||||||||||||||||||||||||||||||||||||||||||||||||||||||||||||||||||||||||||||||||||||||
| Change in unrealized appreciation on available-for-sale securities | — | — | — | — | — | — | 8,643 | 8,643 | |||||||||||||||||||||||||||||||||||||||||||||||||||||||||||||||||||||||||||||||||||||||
| Issuance of shares from equity-based awards | — | — | 198,370 | 1 | (754) | — | — | (753) | |||||||||||||||||||||||||||||||||||||||||||||||||||||||||||||||||||||||||||||||||||||||
| Employee receivables from sale of stock | — | — | — | — | 1 | 40 | — | 41 | |||||||||||||||||||||||||||||||||||||||||||||||||||||||||||||||||||||||||||||||||||||||
| Stock-based compensation | — | — | — | — | 2,016 | — | — | 2,016 | |||||||||||||||||||||||||||||||||||||||||||||||||||||||||||||||||||||||||||||||||||||||
| Balance at June 30, 2020 | — | $ | — | 52,167,573 | $ | 521 | $ | 521,133 | $ | 61,344 | $ | 25,094 | $ | 608,092 | |||||||||||||||||||||||||||||||||||||||||||||||||||||||||||||||||||||||||||||||||
| Three months ended | |||||||||||||||||
| March 31, | |||||||||||||||||
| 2020 | 2019 | ||||||||||||||||
| (Dollars in thousands) | |||||||||||||||||
| Operating Activities | |||||||||||||||||
| Net income | $ | 3,857 | $ | 9,350 | |||||||||||||
| Items not requiring (providing) cash | |||||||||||||||||
| Depreciation and amortization | 1,295 | 1,371 | |||||||||||||||
| Provision for loan losses | 13,950 | 2,850 | |||||||||||||||
| Accretion of discounts and amortization of premiums on securities | 1,473 | 1,212 | |||||||||||||||
| Equity based compensation | 934 | 1,135 | |||||||||||||||
| Loss on disposal of fixed assets | 10 | 64 | |||||||||||||||
| Gain on sale of loans | — | (79) | |||||||||||||||
| Deferred income taxes | 2,881 | 969 | |||||||||||||||
| Net increase in bank owned life insurance | (456) | (467) | |||||||||||||||
| Net recognized gains on available-for-sale equity securities | (34) | (26) | |||||||||||||||
| Net realized gains on available-for-sale debt securities | (393) | (27) | |||||||||||||||
| Dividends on FHLB stock | (291) | (251) | |||||||||||||||
| Stock dividends on CRA mutual fund | (11) | (12) | |||||||||||||||
| Changes in | |||||||||||||||||
| Interest receivable | (1,242) | (2,486) | |||||||||||||||
| Other assets | 65 | (428) | |||||||||||||||
| Other liabilities | (9,368) | (2,518) | |||||||||||||||
| Net cash provided by operating activities | 12,670 | 10,657 | |||||||||||||||
| Investing Activities | |||||||||||||||||
| Net change in loans | (169,595) | (219,804) | |||||||||||||||
| Purchases of available-for-sale securities | (11,861) | (46,555) | |||||||||||||||
| Proceeds from maturities of available-for-sale securities | 21,528 | 10,609 | |||||||||||||||
| Proceeds from sale of available-for-sale securities | 3,841 | 3,371 | |||||||||||||||
| Purchase of premises and equipment | (331) | (37) | |||||||||||||||
| Purchase of restricted equity securities | (970) | (400) | |||||||||||||||
| Proceeds from the sale of fixed assets | — | 341 | |||||||||||||||
| Proceeds from sale of restricted equity securities | — | 715 | |||||||||||||||
| Net cash used in investing activities | (157,388) | (251,760) | |||||||||||||||
| Financing Activities | |||||||||||||||||
| Net increase (decrease) in demand deposits, savings, NOW and money market accounts | 185,747 | (80,282) | |||||||||||||||
| Net increase (decrease) in time deposits | (136,684) | 272,084 | |||||||||||||||
| Net increase (decrease) in repurchase agreements and fed funds purchased | 24,025 | (19,735) | |||||||||||||||
| Proceeds from Federal Home Loan Bank advances | 70,000 | 10,000 | |||||||||||||||
| Repayment of Federal Home Loan Bank advances | (26,063) | (10,059) | |||||||||||||||
| Retirement of preferred stock | — | (30,000) | |||||||||||||||
| Issuance of common shares, net of issuance cost | 1 | 280 | |||||||||||||||
| Proceeds from employee stock purchase plan | — | 547 | |||||||||||||||
| Three months ended | Six Months Ended | |||||||||||||||||||||||||||||||||
| March 31, | June 30, | |||||||||||||||||||||||||||||||||
| 2020 | 2019 | 2020 | 2019 | |||||||||||||||||||||||||||||||
| (Dollars in thousands) | (Dollars in thousands) | |||||||||||||||||||||||||||||||||
| Common stock purchased and retired | — | (155) | ||||||||||||||||||||||||||||||||
| Operating Activities | Operating Activities | |||||||||||||||||||||||||||||||||
| Net income (loss) | Net income (loss) | $ | (3,499) | $ | 18,789 | |||||||||||||||||||||||||||||
| Items not requiring (providing) cash | Items not requiring (providing) cash | |||||||||||||||||||||||||||||||||
| Depreciation and amortization | Depreciation and amortization | 2,587 | 2,703 | |||||||||||||||||||||||||||||||
| Provision for loan losses | Provision for loan losses | 34,950 | 5,700 | |||||||||||||||||||||||||||||||
| Accretion of discounts and amortization of premiums on securities | Accretion of discounts and amortization of premiums on securities | 3,063 | 2,535 | |||||||||||||||||||||||||||||||
| Equity based compensation | Equity based compensation | 2,016 | 2,281 | |||||||||||||||||||||||||||||||
| Foreclosed asset impairment | Foreclosed asset impairment | 1,117 | — | |||||||||||||||||||||||||||||||
| Deferred income taxes | Deferred income taxes | (3,853) | 2,056 | |||||||||||||||||||||||||||||||
| Net realized gains on available-for-sale debt securities | Net realized gains on available-for-sale debt securities | (713) | (433) | |||||||||||||||||||||||||||||||
| Goodwill impairment | Goodwill impairment | 7,397 | — | |||||||||||||||||||||||||||||||
| Changes in | Changes in | |||||||||||||||||||||||||||||||||
| Interest receivable | Interest receivable | (3,683) | (2,611) | |||||||||||||||||||||||||||||||
| Other assets | Other assets | (1,284) | (6,172) | |||||||||||||||||||||||||||||||
| Other liabilities | Other liabilities | (2,130) | 5,195 | |||||||||||||||||||||||||||||||
| Net cash provided by operating activities | Net cash provided by operating activities | 35,968 | 30,043 | |||||||||||||||||||||||||||||||
| Investing Activities | Investing Activities | |||||||||||||||||||||||||||||||||
| Net change in loans | Net change in loans | (581,641) | (409,602) | |||||||||||||||||||||||||||||||
| Purchases of available-for-sale securities | Purchases of available-for-sale securities | (27,312) | (107,948) | |||||||||||||||||||||||||||||||
| Proceeds from maturities of available-for-sale securities | Proceeds from maturities of available-for-sale securities | 58,974 | 26,468 | |||||||||||||||||||||||||||||||
| Proceeds from sale of available-for-sale securities | Proceeds from sale of available-for-sale securities | 19,052 | 60,254 | |||||||||||||||||||||||||||||||
| Proceeds (purchase) of premises and equipment, net | Proceeds (purchase) of premises and equipment, net | (1,658) | 3,014 | |||||||||||||||||||||||||||||||
| Purchase of restricted equity securities, net | Purchase of restricted equity securities, net | (2,839) | (558) | |||||||||||||||||||||||||||||||
| Net cash used in investing activities | Net cash used in investing activities | (535,424) | (428,372) | |||||||||||||||||||||||||||||||
| Financing Activities | Financing Activities | |||||||||||||||||||||||||||||||||
| Net increase in demand deposits, savings, NOW and money market accounts | Net increase in demand deposits, savings, NOW and money market accounts | 459,589 | 84,269 | |||||||||||||||||||||||||||||||
| Net increase (decrease) in time deposits | Net increase (decrease) in time deposits | (79,205) | 291,770 | |||||||||||||||||||||||||||||||
| Net increase (decrease) in repurchase agreements and federal funds purchased | Net increase (decrease) in repurchase agreements and federal funds purchased | 34,960 | (49,025) | |||||||||||||||||||||||||||||||
| Proceeds from Federal Home Loan Bank advances | Proceeds from Federal Home Loan Bank advances | 118,000 | 45,000 | |||||||||||||||||||||||||||||||
| Repayment of Federal Home Loan Bank advances | Repayment of Federal Home Loan Bank advances | (26,126) | (20,120) | |||||||||||||||||||||||||||||||
| Retirement of preferred stock | Retirement of preferred stock | — | (30,000) | |||||||||||||||||||||||||||||||
| Issuance of common shares, net and change in employee receivables | Issuance of common shares, net and change in employee receivables | 43 | 1,677 | |||||||||||||||||||||||||||||||
| Acquisition of common stock for tax withholding obligations | Acquisition of common stock for tax withholding obligations | (671) | (133) | Acquisition of common stock for tax withholding obligations | (754) | (235) | ||||||||||||||||||||||||||||
| Net decrease in employee receivables | 30 | 32 | ||||||||||||||||||||||||||||||||
| Dividends paid on preferred stock | Dividends paid on preferred stock | — | (700) | Dividends paid on preferred stock | — | (175) | ||||||||||||||||||||||||||||
| Net cash provided by financing activities | Net cash provided by financing activities | 116,385 | 141,879 | Net cash provided by financing activities | 506,507 | 323,161 | ||||||||||||||||||||||||||||
| Decrease in Cash and Cash Equivalents | (28,333) | (99,224) | ||||||||||||||||||||||||||||||||
| Increase (Decrease) in Cash and Cash Equivalents | Increase (Decrease) in Cash and Cash Equivalents | 7,051 | (75,168) | |||||||||||||||||||||||||||||||
| Cash and Cash Equivalents, Beginning of Period | Cash and Cash Equivalents, Beginning of Period | 187,320 | 216,541 | Cash and Cash Equivalents, Beginning of Period | 187,320 | 216,541 | ||||||||||||||||||||||||||||
| Cash and Cash Equivalents, End of Period | Cash and Cash Equivalents, End of Period | $ | 158,987 | $ | 117,317 | Cash and Cash Equivalents, End of Period | $ | 194,371 | $ | 141,373 | ||||||||||||||||||||||||
| Supplemental Cash Flows Information | Supplemental Cash Flows Information | Supplemental Cash Flows Information | ||||||||||||||||||||||||||||||||
| Interest paid | Interest paid | $ | 17,199 | $ | 16,718 | Interest paid | $ | 27,818 | $ | 35,366 | ||||||||||||||||||||||||
| Income taxes paid | Income taxes paid | — | — | Income taxes paid | — | 775 | ||||||||||||||||||||||||||||
| Foreclosed assets in settlement of loans | Foreclosed assets in settlement of loans | $ | — | $ | 2,471 | Foreclosed assets in settlement of loans | $ | — | $ | 2,471 | ||||||||||||||||||||||||
| Notes to Consolidated Financial Statements (unaudited) | ||||||||
| Notes to Consolidated Financial Statements (unaudited) | ||||||||
| Notes to Consolidated Financial Statements (unaudited) | ||||||||
| Standard | Date of Adoption | Description | Effect on Financial Statements or Other Significant Matters | |||||||||||||||||
ASU 2020-04: Reference Rate Reform (Topic 848): Facilitation of the Effects of Reference Rate Reform on Financial Reporting | June 30, 2020 | The ASU provides optional expedients and exceptions to contracts, hedging relationships, and other transactions affected by reference rate reform if certain criteria are met. The ASU only applies to transactions that reference LIBOR or another reference rate expected to be discontinued because of reference rate reform. The expedients and exceptions provided by the amendments do not apply to contract modifications made and hedging relationships entered into or evaluated after December 31, 2022, except for hedging relationships existing as of December 31, 2022, that an entity has elected certain optional expedients for and that are retained through the end of the hedging relationship. The amendments include: (1) Optional expedients to contract modifications that allow the Company to adjust the effective interest rate of receivables and debt, account for lease modifications as a continuation of the existing lease, and remove the requirement to reassess its original conclusions for contract modifications about whether that contract contains an embedded derivative that is clearly and closely related to the economic characteristics and risks of the host contract under Subtopic 815-15, Derivatives and Hedging—Embedded Derivatives; (2) Exceptions to the guidance in Topic 815 related to changes in the critical terms of a hedging relationship due to reference rate reform; and (3) Optional expedients for cash flow and fair value hedges. | The Company had more than $1 billion in loans tied to LIBOR as of June 30, 2020. The Company does not believe the adoption will have a material accounting impact on the Company’s consolidated financial position or results of operations. Additionally, LIBOR fallback language has been included in key loan provisions of new and renewed loans in preparation for transition from LIBOR to the new benchmark rate when such transition occurs. This standard is expected to ease the administrative burden in accounting for the future effects of reference rate reform. The ASU allows the Company to recognize the modification related to LIBOR as a continuation of the old contract, rather than a cancellation of the old contract resulting in a write off of unamortized fees and creation of a new contract. | |||||||||||||||||
ASU 2019-12: Income Taxes (Topic 740): Simplifying the Accounting for Income Taxes | January 1, 2020 (Early Adoption) | The (1) Removes the exception to the incremental approach for intraperiod tax allocation when there is a loss from continuing operations and income or a gain from other items; (2) Removes the exception to the general methodology for calculating income taxes in an interim period when a year-to-date loss exceeds the (3) Requires an entity to recognize a franchise tax that is partially based on income as an income-based tax and account for any incremental amount incurred as a nonincome based tax; and (4) Requires an entity reflect the effect of an enacted change in tax laws or rates in the annual effective tax rate computation in the interim period that includes the enactment date. | The amendments in the ASU did not have a material impact on the Company’s tax methodology, processes, or the Company’s financial statements. | |||||||||||||||||
| Notes to Consolidated Financial Statements (unaudited) | ||||||||
| Standard | Date of Adoption | Description | Effect on Financial Statements or Other Significant Matters | |||||||||||||||||
ASU 2018-13: Fair Value Measurement (Topic 820): Disclosure Framework | January 1, 2020 | Improves the effectiveness of disclosures in the notes to financial statements by facilitating clear communication of the information. The amendments modify certain disclosure requirements Entities are no longer required to disclose transfers between Level 1 and Level 2 of the fair value hierarchy or qualitatively disclose the valuation process for Level 3 fair value measurements. The updated guidance requires disclosure of the changes in unrealized gains and losses for the period included in Other Comprehensive Income for recurring Level 3 fair value measurements. Entities are required to disclose the range and weighted average used to develop significant unobservable inputs for Level 3 fair value measurements. The additional provisions of the guidance should be adopted prospectively. The eliminated requirements should be adopted retrospectively. | The adoption did not have a material impact to the financial statements. No transfers between Level 1 and Level 2 occurred in 2019 or 2020 and the Company did not have any recurring Level 3 fair value measurements that created an unrealized gain or loss in Other Comprehensive Income. In addition, the Company previously disclosed the range and weighted average used to develop significant unobservable inputs for Level 3 fair value measurements. | |||||||||||||||||
ASU 2017-04: Intangibles—Goodwill and Other (Topic 350): Simplifying the Test for Goodwill Impairment | January 1, 2020 (Early Adoption) | Eliminates Step 2 from the goodwill impairment test which required entities to compute the implied fair value of goodwill. An entity should perform an annual, or interim, goodwill impairment test by comparing the fair value of a reporting unit with its carrying amount. An entity should recognize an impairment charge for the amount by which the carrying amount exceeds the reporting unit’s fair value; however, the loss recognized should not exceed the total amount of goodwill allocated to that reporting unit. | The Company’s process for evaluating goodwill impairment was modified to align with the elimination of Step 2. The Company believes the ASU is preferable since it will reduce the complexity to determine if a | |||||||||||||||||
| Notes to Consolidated Financial Statements (unaudited) | ||||||||
An entity may elect to apply the ASU by Topic or an Industry Subtopic within the Codification as of January 1, 2020, or prospectively from a date within an interim period that includes or is subsequent to March 12, 2020, up to the date that the financial statements are available to be issued. The Company has not determined a start date. Once elected for a Topic or Industry Subtopic, the amendments must be applied prospectively for all eligible contract modifications. | The amendments only apply to transactions that reference LIBOR or another reference rate expected to be discontinued because of reference rate reform. The expedients and exceptions provided by the amendments do not apply to contract modifications made and hedging relationships entered into or evaluated after December 31, 2022, except for hedging relationships existing as of December 31, 2022, that an entity has elected certain optional expedients for and that are retained through the end of the hedging relationship. The amendments include: (1) Optional expedients to contract modifications that allow the Company to adjust the effective interest rate of receivables and debt, account for lease modifications as a continuation of the existing lease, and remove the requirement to reassess its original conclusions for contract modifications about whether that contract contains an embedded derivative that is clearly and closely related to the economic characteristics and risks of the host contract under Subtopic 815-15, Derivatives and Hedging—Embedded Derivatives; (2) Exceptions to the guidance in Topic 815 related to changes in the critical terms of a hedging relationship due to reference rate reform related to changes to the critical terms of a hedging relationship due to reference rate reform; and (3) Optional expedients for cash flow and fair value hedges. | |||||||||||||||||||
| Standard | Anticipated Date of Adoption | Description | Effect on Financial Statements or Other Significant Matters | |||||||||||||||||
ASU 2016-13 Financial Instruments-Credit Losses | If we maintain our EGC status, the Company is not required to implement this standard until January 2023. The Company will continue to monitor its progress and the requirements related to adoption. | Requires an entity to utilize a new impairment model known as the current expected credit loss (“CECL”) model to estimate its lifetime expected credit loss and record an allowance that, when deducted from the amortized cost basis of the financial asset, presents the net amount expected to be collected on the financial asset. | The Company The Company implemented a third-party software solution and completed the software implementation phase of the transition. The software implementation phase included data capture and portfolio segmentation amongst other items. The Company At this time, an estimate of the impact cannot be established as the Company continues to evaluate the inputs into the model. The actual impact could be significantly affected by the composition, characteristics, and quality of the underlying loan portfolio at the time of adoption. | |||||||||||||||||
ASU 2016-02 Leases (Topic 842) | The Company expects to implement this standard in 2021 if EGC status is maintained. If the Company loses its EGC status in 2020, the Company would be required to implement the ASU as of the beginning of 2020. On April 8, 2020, the FASB proposed a one-year deferral on the ASU. If EGC status is maintained and the FASB issues the final amendment, the Company would be able to defer implementation until January 1, 2022. | Requires lessees and lessors to recognize lease assets and lease liabilities on the balance sheet and disclose key information about leasing arrangements. The update requires lessees and lessors to recognize and measure leases at the beginning of the earliest period presented using a modified retrospective approach with the option to elect certain practical expedients. The update will also increase disclosures around leases, including qualitative and specific quantitative measures. | The Company expects to apply the update as of the beginning of the period of adoption and the Company does not plan to restate comparative periods. The Company expects to elect certain optional practical expedients. The Company gathered all potential lease and embedded lease agreements during 2019 and 2020 and is evaluating the applicability and impact to the The Company’s current operating leases relate primarily to | |||||||||||||||||
| Notes to Consolidated Financial Statements (unaudited) | ||||||||
| Three Months Ended | |||||||||||||||||||||||||||||
| March 31, | |||||||||||||||||||||||||||||
| 2020 | 2019 | ||||||||||||||||||||||||||||
| (Dollars in thousands except per share data) | |||||||||||||||||||||||||||||
| Earnings per Share | |||||||||||||||||||||||||||||
| Net income | $ | 3,857 | $ | 9,350 | |||||||||||||||||||||||||
| Less: preferred stock dividends | — | 175 | |||||||||||||||||||||||||||
| Net income available to common stockholders | $ | 3,857 | $ | 9,175 | |||||||||||||||||||||||||
| Weighted average common shares | 52,071,484 | 45,093,442 | |||||||||||||||||||||||||||
| Earnings per share | $ | 0.07 | $ | 0.20 | |||||||||||||||||||||||||
| Dilutive Earnings Per Share | |||||||||||||||||||||||||||||
| Net income available to common stockholders | $ | 3,857 | $ | 9,175 | |||||||||||||||||||||||||
| Weighted average common shares | 52,071,484 | 45,093,442 | |||||||||||||||||||||||||||
| Effect of dilutive shares | 588,786 | 866,825 | |||||||||||||||||||||||||||
| Weighted average dilutive common shares | 52,660,270 | 45,960,267 | |||||||||||||||||||||||||||
| Diluted earnings per share | $ | 0.07 | $ | 0.20 | |||||||||||||||||||||||||
| Stock-based awards not included because to do so would be antidilutive | 905,406 | 487,346 | |||||||||||||||||||||||||||
| Three Months Ended | Six Months Ended | ||||||||||||||||||||||||||||||||||||||||
| June 30, | June 30, | ||||||||||||||||||||||||||||||||||||||||
| 2020 | 2019 | 2020 | 2019 | ||||||||||||||||||||||||||||||||||||||
| (Dollars in thousands except per share data) | |||||||||||||||||||||||||||||||||||||||||
| Earnings (Loss) per Share | |||||||||||||||||||||||||||||||||||||||||
| Net income (loss) | $ | (7,356) | $ | 9,439 | $ | (3,499) | $ | 18,789 | |||||||||||||||||||||||||||||||||
| Less: preferred stock dividends | — | — | — | 175 | |||||||||||||||||||||||||||||||||||||
| Net income (loss) available to common stockholders | $ | (7,356) | $ | 9,439 | $ | (3,499) | $ | 18,614 | |||||||||||||||||||||||||||||||||
| Weighted average common shares | 52,104,994 | 45,236,264 | 52,088,239 | 45,165,248 | |||||||||||||||||||||||||||||||||||||
| Earnings (loss) per share | $ | (0.14) | $ | 0.21 | $ | (0.07) | $ | 0.41 | |||||||||||||||||||||||||||||||||
| Dilutive Earnings (Loss) Per Share | |||||||||||||||||||||||||||||||||||||||||
| Net income (loss) available to common stockholders | $ | (7,356) | $ | 9,439 | $ | (3,499) | $ | 18,614 | |||||||||||||||||||||||||||||||||
| Weighted average common shares | 52,104,994 | 45,236,264 | 52,088,239 | 45,165,248 | |||||||||||||||||||||||||||||||||||||
| Effect of dilutive shares | — | 975,516 | — | 994,577 | |||||||||||||||||||||||||||||||||||||
| Weighted average dilutive common shares | 52,104,994 | 46,211,780 | 52,088,239 | 46,159,825 | |||||||||||||||||||||||||||||||||||||
| Diluted earnings (loss) per share | $ | (0.14) | $ | 0.20 | $ | (0.07) | $ | 0.40 | |||||||||||||||||||||||||||||||||
| Stock-based awards not included because to do so would be antidilutive | 2,417,205 | 403,722 | 2,417,205 | 424,972 | |||||||||||||||||||||||||||||||||||||
| March 31, 2020 | |||||||||||||||||||||||||||||||||||||||||
| Amortized Cost | Gross Unrealized Gains | Gross Unrealized Losses | Approximate Fair Value | ||||||||||||||||||||||||||||||||||||||
| (Dollars in thousands) | |||||||||||||||||||||||||||||||||||||||||
| Available-for-sale debt securities | |||||||||||||||||||||||||||||||||||||||||
| Mortgage-backed - GSE residential | $ | 144,175 | $ | 5,646 | $ | — | $ | 149,821 | |||||||||||||||||||||||||||||||||
| Collateralized mortgage obligations - GSE residential | 115,734 | 3,206 | 2 | 118,938 | |||||||||||||||||||||||||||||||||||||
| State and political subdivisions | 441,888 | 21,589 | 627 | 462,850 | |||||||||||||||||||||||||||||||||||||
| Corporate bonds | 1,298 | 117 | — | 1,415 | |||||||||||||||||||||||||||||||||||||
| Total available-for-sale debt securities | 703,095 | 30,558 | 629 | 733,024 | |||||||||||||||||||||||||||||||||||||
| Equity securities | |||||||||||||||||||||||||||||||||||||||||
| Mutual funds | 2,202 | 5 | — | 2,207 | |||||||||||||||||||||||||||||||||||||
| Total equity securities | 2,202 | 5 | — | 2,207 | |||||||||||||||||||||||||||||||||||||
| Total available-for-sale securities | $ | 705,297 | $ | 30,563 | $ | 629 | $ | 735,231 | |||||||||||||||||||||||||||||||||
| December 31, 2019 | |||||||||||||||||||||||||||||||||||||||||
| Amortized Cost | Gross Unrealized Gains | Gross Unrealized Losses | Approximate Fair Value | ||||||||||||||||||||||||||||||||||||||
| (Dollars in thousands) | |||||||||||||||||||||||||||||||||||||||||
| Available-for-sale debt securities | |||||||||||||||||||||||||||||||||||||||||
| Mortgage-backed - GSE residential | $ | 151,037 | $ | 1,668 | $ | 193 | $ | 152,512 | |||||||||||||||||||||||||||||||||
| Collateralized mortgage obligations - GSE residential | 128,876 | 625 | 289 | 129,212 | |||||||||||||||||||||||||||||||||||||
| State and political subdivisions | 436,448 | 19,996 | 104 | 456,340 | |||||||||||||||||||||||||||||||||||||
| Corporate bonds | 1,321 | 88 | — | 1,409 | |||||||||||||||||||||||||||||||||||||
| Total available-for-sale debt securities | 717,682 | 22,377 | 586 | 739,473 | |||||||||||||||||||||||||||||||||||||
| Equity securities | |||||||||||||||||||||||||||||||||||||||||
| Mutual funds | 2,190 | — | 29 | 2,161 | |||||||||||||||||||||||||||||||||||||
| Total equity securities | 2,190 | — | 29 | 2,161 | |||||||||||||||||||||||||||||||||||||
| Total available-for-sale securities | $ | 719,872 | $ | 22,377 | $ | 615 | $ | 741,634 | |||||||||||||||||||||||||||||||||
| June 30, 2020 | |||||||||||||||||||||||||||||||||||||||||
| Amortized Cost | Gross Unrealized Gains | Gross Unrealized Losses | Approximate Fair Value | ||||||||||||||||||||||||||||||||||||||
| (Dollars in thousands) | |||||||||||||||||||||||||||||||||||||||||
| Available-for-sale debt securities | |||||||||||||||||||||||||||||||||||||||||
| Mortgage-backed - GSE residential | $ | 139,615 | $ | 4,983 | $ | — | $ | 144,598 | |||||||||||||||||||||||||||||||||
| Collateralized mortgage obligations - GSE residential | 94,189 | 1,472 | 20 | 95,641 | |||||||||||||||||||||||||||||||||||||
| State and political subdivisions | 429,603 | 26,966 | 255 | 456,314 | |||||||||||||||||||||||||||||||||||||
| Corporate bonds | 1,212 | 86 | 4 | 1,294 | |||||||||||||||||||||||||||||||||||||
| Total available-for-sale debt securities | 664,619 | 33,507 | 279 | 697,847 | |||||||||||||||||||||||||||||||||||||
| Equity securities | |||||||||||||||||||||||||||||||||||||||||
| Mutual funds | 2,183 | 53 | — | 2,236 | |||||||||||||||||||||||||||||||||||||
| Total equity securities | 2,183 | 53 | — | 2,236 | |||||||||||||||||||||||||||||||||||||
| Total available-for-sale securities | $ | 666,802 | $ | 33,560 | $ | 279 | $ | 700,083 | |||||||||||||||||||||||||||||||||
| Notes to Consolidated Financial Statements (unaudited) | ||||||||
| December 31, 2019 | |||||||||||||||||||||||||||||||||||||||||
| Amortized Cost | Gross Unrealized Gains | Gross Unrealized Losses | Approximate Fair Value | ||||||||||||||||||||||||||||||||||||||
| (Dollars in thousands) | |||||||||||||||||||||||||||||||||||||||||
| Available-for-sale debt securities | |||||||||||||||||||||||||||||||||||||||||
| Mortgage-backed - GSE residential | $ | 151,037 | $ | 1,668 | $ | 193 | $ | 152,512 | |||||||||||||||||||||||||||||||||
| Collateralized mortgage obligations - GSE residential | 128,876 | 625 | 289 | 129,212 | |||||||||||||||||||||||||||||||||||||
| State and political subdivisions | 436,448 | 19,996 | 104 | 456,340 | |||||||||||||||||||||||||||||||||||||
| Corporate bonds | 1,321 | 88 | — | 1,409 | |||||||||||||||||||||||||||||||||||||
| Total available-for-sale debt securities | 717,682 | 22,377 | 586 | 739,473 | |||||||||||||||||||||||||||||||||||||
| Equity securities | |||||||||||||||||||||||||||||||||||||||||
| Mutual funds | 2,190 | — | 29 | 2,161 | |||||||||||||||||||||||||||||||||||||
| Total equity securities | 2,190 | — | 29 | 2,161 | |||||||||||||||||||||||||||||||||||||
| Total available-for-sale securities | $ | 719,872 | $ | 22,377 | $ | 615 | $ | 741,634 | |||||||||||||||||||||||||||||||||
| March 31, 2020 | |||||||||||||||||||||||||||||||||||||||||||||||||||||||||||
| Within | After One to | After Five to | After | ||||||||||||||||||||||||||||||||||||||||||||||||||||||||
| One Year | Five Years | Ten Years | Ten Years | Total | |||||||||||||||||||||||||||||||||||||||||||||||||||||||
| (Dollars in thousands) | |||||||||||||||||||||||||||||||||||||||||||||||||||||||||||
| Available-for-sale debt securities | |||||||||||||||||||||||||||||||||||||||||||||||||||||||||||
Mortgage-backed - GSE residential(1) | |||||||||||||||||||||||||||||||||||||||||||||||||||||||||||
| Amortized cost | $ | — | $ | — | $ | 289 | $ | 143,886 | $ | 144,175 | |||||||||||||||||||||||||||||||||||||||||||||||||
| Estimated fair value | $ | — | $ | — | $ | 304 | $ | 149,517 | $ | 149,821 | |||||||||||||||||||||||||||||||||||||||||||||||||
Weighted average yield(2) | — | % | — | % | 4.02 | % | 2.43 | % | 2.43 | % | |||||||||||||||||||||||||||||||||||||||||||||||||
Collateralized mortgage obligations - GSE residential(1) | |||||||||||||||||||||||||||||||||||||||||||||||||||||||||||
| Amortized cost | $ | — | $ | — | $ | 2,517 | $ | 113,217 | $ | 115,734 | |||||||||||||||||||||||||||||||||||||||||||||||||
| Estimated fair value | $ | — | $ | — | $ | 2,722 | $ | 116,216 | $ | 118,938 | |||||||||||||||||||||||||||||||||||||||||||||||||
Weighted average yield(2) | — | % | — | % | 2.76 | % | 1.40 | % | 1.43 | % | |||||||||||||||||||||||||||||||||||||||||||||||||
| State and political subdivisions | |||||||||||||||||||||||||||||||||||||||||||||||||||||||||||
| Amortized cost | $ | 655 | $ | 6,039 | $ | 61,072 | $ | 374,122 | $ | 441,888 | |||||||||||||||||||||||||||||||||||||||||||||||||
| Estimated fair value | $ | 655 | $ | 6,141 | $ | 64,922 | $ | 391,132 | $ | 462,850 | |||||||||||||||||||||||||||||||||||||||||||||||||
Weighted average yield(2) | 9.42 | % | 5.76 | % | 3.50 | % | 3.04 | % | 3.15 | % | |||||||||||||||||||||||||||||||||||||||||||||||||
| Corporate bonds | |||||||||||||||||||||||||||||||||||||||||||||||||||||||||||
| Amortized cost | $ | — | $ | 361 | $ | 937 | $ | — | $ | 1,298 | |||||||||||||||||||||||||||||||||||||||||||||||||
| Estimated fair value | $ | — | $ | 380 | $ | 1,035 | $ | — | $ | 1,415 | |||||||||||||||||||||||||||||||||||||||||||||||||
Weighted average yield(2) | — | % | 5.83 | % | 5.42 | % | — | % | 5.53 | % | |||||||||||||||||||||||||||||||||||||||||||||||||
| Total available-for-sale debt securities | |||||||||||||||||||||||||||||||||||||||||||||||||||||||||||
| Amortized cost | $ | 655 | $ | 6,400 | $ | 64,815 | $ | 631,225 | $ | 703,095 | |||||||||||||||||||||||||||||||||||||||||||||||||
| Estimated fair value | $ | 655 | $ | 6,521 | $ | 68,983 | $ | 656,865 | $ | 733,024 | |||||||||||||||||||||||||||||||||||||||||||||||||
Weighted average yield(2) | 9.42 | % | 5.76 | % | 3.46 | % | 2.61 | % | 2.72 | % | |||||||||||||||||||||||||||||||||||||||||||||||||
(1) Actual maturities may differ from contractual maturities because issuers may have the rights to call or prepay obligations with or without prepayment penalties. | |||||||||||||||||||||||||||||||||||||||||||||||||||||||||||
(2) Yields are calculated based on amortized cost. | |||||||||||||||||||||||||||||||||||||||||||||||||||||||||||
| June 30, 2020 | |||||||||||||||||||||||||||||||||||||||||||||||||||||||||||
| Within | After One to | After Five to | After | ||||||||||||||||||||||||||||||||||||||||||||||||||||||||
| One Year | Five Years | Ten Years | Ten Years | Total | |||||||||||||||||||||||||||||||||||||||||||||||||||||||
| (Dollars in thousands) | |||||||||||||||||||||||||||||||||||||||||||||||||||||||||||
| Available-for-sale debt securities | |||||||||||||||||||||||||||||||||||||||||||||||||||||||||||
Mortgage-backed - GSE residential(1) | |||||||||||||||||||||||||||||||||||||||||||||||||||||||||||
| Amortized cost | $ | — | $ | 56 | $ | 220 | $ | 139,339 | $ | 139,615 | |||||||||||||||||||||||||||||||||||||||||||||||||
| Estimated fair value | $ | — | $ | 57 | $ | 236 | $ | 144,305 | $ | 144,598 | |||||||||||||||||||||||||||||||||||||||||||||||||
Weighted average yield(2) | — | % | 4.55 | % | 3.91 | % | 2.04 | % | 2.04 | % | |||||||||||||||||||||||||||||||||||||||||||||||||
Collateralized mortgage obligations - GSE residential(1) | |||||||||||||||||||||||||||||||||||||||||||||||||||||||||||
| Amortized cost | $ | — | $ | — | $ | 2,507 | $ | 91,682 | $ | 94,189 | |||||||||||||||||||||||||||||||||||||||||||||||||
| Estimated fair value | $ | — | $ | — | $ | 2,755 | $ | 92,886 | $ | 95,641 | |||||||||||||||||||||||||||||||||||||||||||||||||
Weighted average yield(2) | — | % | — | % | 2.77 | % | 1.62 | % | 1.65 | % | |||||||||||||||||||||||||||||||||||||||||||||||||
| State and political subdivisions | |||||||||||||||||||||||||||||||||||||||||||||||||||||||||||
| Amortized cost | $ | 653 | $ | 7,234 | $ | 61,170 | $ | 360,546 | $ | 429,603 | |||||||||||||||||||||||||||||||||||||||||||||||||
| Estimated fair value | $ | 656 | $ | 7,419 | $ | 66,034 | $ | 382,205 | $ | 456,314 | |||||||||||||||||||||||||||||||||||||||||||||||||
Weighted average yield(2) | 8.24 | % | 5.33 | % | 3.58 | % | 3.10 | % | 3.22 | % | |||||||||||||||||||||||||||||||||||||||||||||||||
| Corporate bonds | |||||||||||||||||||||||||||||||||||||||||||||||||||||||||||
| Amortized cost | $ | — | $ | 345 | $ | 867 | $ | — | $ | 1,212 | |||||||||||||||||||||||||||||||||||||||||||||||||
| Estimated fair value | $ | — | $ | 358 | $ | 936 | $ | — | $ | 1,294 | |||||||||||||||||||||||||||||||||||||||||||||||||
Weighted average yield(2) | — | % | 5.89 | % | 5.68 | % | — | % | 5.74 | % | |||||||||||||||||||||||||||||||||||||||||||||||||
| Total available-for-sale debt securities | |||||||||||||||||||||||||||||||||||||||||||||||||||||||||||
| Amortized cost | $ | 653 | $ | 7,635 | $ | 64,764 | $ | 591,567 | $ | 664,619 | |||||||||||||||||||||||||||||||||||||||||||||||||
| Estimated fair value | $ | 656 | $ | 7,834 | $ | 69,961 | $ | 619,396 | $ | 697,847 | |||||||||||||||||||||||||||||||||||||||||||||||||
Weighted average yield(2) | 8.24 | % | 5.34 | % | 3.53 | % | 2.63 | % | 2.75 | % | |||||||||||||||||||||||||||||||||||||||||||||||||
(1) Actual maturities may differ from contractual maturities because issuers may have the rights to call or prepay obligations with or without prepayment penalties. | |||||||||||||||||||||||||||||||||||||||||||||||||||||||||||
(2) Yields are calculated based on amortized cost. | |||||||||||||||||||||||||||||||||||||||||||||||||||||||||||
| Notes to Consolidated Financial Statements (unaudited) | ||||||||
| March 31, 2020 | June 30, 2020 | |||||||||||||||||||||||||||||||||||||||||||||||||||||||||||||||||||||||||||||||||||||||||||||||||||||||||||||||||||||||||||||||||||||||||||||||||||||||||||||||||||||||||||||||||||||||||||||||||||||||||
| Less than 12 Months | 12 Months or More | Total | Less than 12 Months | 12 Months or More | Total | |||||||||||||||||||||||||||||||||||||||||||||||||||||||||||||||||||||||||||||||||||||||||||||||||||||||||||||||||||||||||||||||||||||||||||||||||||||||||||||||||||||||||||||||||||||||||||||||||||||
| Fair Value | Unrealized Losses | Number of Securities | Fair Value | Unrealized Losses | Number of Securities | Fair Value | Unrealized Losses | Number of Securities | Fair Value | Unrealized Losses | Number of Securities | Fair Value | Unrealized Losses | Number of Securities | Fair Value | Unrealized Losses | Number of Securities | |||||||||||||||||||||||||||||||||||||||||||||||||||||||||||||||||||||||||||||||||||||||||||||||||||||||||||||||||||||||||||||||||||||||||||||||||||||||||||||||||||||||||||||||||||||||||
| (Dollars in thousands) | (Dollars in thousands) | |||||||||||||||||||||||||||||||||||||||||||||||||||||||||||||||||||||||||||||||||||||||||||||||||||||||||||||||||||||||||||||||||||||||||||||||||||||||||||||||||||||||||||||||||||||||||||||||||||||||||
| Available-for-Sale Debt Securities | Available-for-Sale Debt Securities | Available-for-Sale Debt Securities | ||||||||||||||||||||||||||||||||||||||||||||||||||||||||||||||||||||||||||||||||||||||||||||||||||||||||||||||||||||||||||||||||||||||||||||||||||||||||||||||||||||||||||||||||||||||||||||||||||||||||
| Mortgage-backed - GSE residential | Mortgage-backed - GSE residential | $ | — | $ | — | — | $ | — | $ | — | — | $ | — | $ | — | — | Mortgage-backed - GSE residential | $ | — | $ | — | — | $ | — | $ | — | — | $ | — | $ | — | — | ||||||||||||||||||||||||||||||||||||||||||||||||||||||||||||||||||||||||||||||||||||||||||||||||||||||||||||||||||||||||||||||||||||||||||||||||||||||||||||||||||||||||||
| Collateralized mortgage obligations - GSE residential | Collateralized mortgage obligations - GSE residential | 17 | 2 | 1 | — | — | — | 17 | 2 | 1 | Collateralized mortgage obligations - GSE residential | 12,050 | 20 | 4 | — | — | — | 12,050 | 20 | 4 | ||||||||||||||||||||||||||||||||||||||||||||||||||||||||||||||||||||||||||||||||||||||||||||||||||||||||||||||||||||||||||||||||||||||||||||||||||||||||||||||||||||||||||||||||||||||
| State and political subdivisions | State and political subdivisions | 13,926 | 625 | 9 | 154 | 2 | 2 | 14,080 | 627 | 11 | State and political subdivisions | 11,471 | 255 | 11 | 27 | — | 1 | 11,498 | 255 | 12 | ||||||||||||||||||||||||||||||||||||||||||||||||||||||||||||||||||||||||||||||||||||||||||||||||||||||||||||||||||||||||||||||||||||||||||||||||||||||||||||||||||||||||||||||||||||||
| Corporate bonds | Corporate bonds | — | — | — | — | — | — | — | — | — | Corporate bonds | 456 | 4 | 1 | — | — | — | 456 | 4 | 1 | ||||||||||||||||||||||||||||||||||||||||||||||||||||||||||||||||||||||||||||||||||||||||||||||||||||||||||||||||||||||||||||||||||||||||||||||||||||||||||||||||||||||||||||||||||||||
| Total temporarily impaired debt securities | Total temporarily impaired debt securities | $ | 13,943 | $ | 627 | 10 | $ | 154 | $ | 2 | 2 | $ | 14,097 | $ | 629 | 12 | Total temporarily impaired debt securities | $ | 23,977 | $ | 279 | 16 | $ | 27 | $ | — | 1 | $ | 24,004 | $ | 279 | 17 | ||||||||||||||||||||||||||||||||||||||||||||||||||||||||||||||||||||||||||||||||||||||||||||||||||||||||||||||||||||||||||||||||||||||||||||||||||||||||||||||||||||||||||
| December 31, 2019 | |||||||||||||||||||||||||||||||||||||||||||||||||||||||||||||||||||||||||||||||||||||||||||||||||||||
| Less than 12 Months | 12 Months or More | Total | |||||||||||||||||||||||||||||||||||||||||||||||||||||||||||||||||||||||||||||||||||||||||||||||||||
| Fair Value | Unrealized Losses | Number of Securities | Fair Value | Unrealized Losses | Number of Securities | Fair Value | Unrealized Losses | Number of Securities | |||||||||||||||||||||||||||||||||||||||||||||||||||||||||||||||||||||||||||||||||||||||||||||
| (Dollars in thousands) | |||||||||||||||||||||||||||||||||||||||||||||||||||||||||||||||||||||||||||||||||||||||||||||||||||||
| Available-for-Sale Debt Securities | |||||||||||||||||||||||||||||||||||||||||||||||||||||||||||||||||||||||||||||||||||||||||||||||||||||
| Mortgage-backed - GSE residential | $ | 7,959 | $ | 38 | 2 | $ | 20,396 | $ | 155 | 4 | $ | 28,355 | $ | 193 | 6 | ||||||||||||||||||||||||||||||||||||||||||||||||||||||||||||||||||||||||||||||||||||||
| Collateralized mortgage obligations - GSE residential | 48,980 | 199 | 7 | 8,622 | 90 | 9 | 57,602 | 289 | 16 | ||||||||||||||||||||||||||||||||||||||||||||||||||||||||||||||||||||||||||||||||||||||||||||
| State and political subdivisions | 21,412 | 102 | 11 | 167 | 2 | 2 | 21,579 | 104 | 13 | ||||||||||||||||||||||||||||||||||||||||||||||||||||||||||||||||||||||||||||||||||||||||||||
| Corporate bonds | 530 | — | 1 | — | — | — | 530 | — | 1 | ||||||||||||||||||||||||||||||||||||||||||||||||||||||||||||||||||||||||||||||||||||||||||||
| Total temporarily impaired debt securities | $ | 78,881 | $ | 339 | 21 | $ | 29,185 | $ | 247 | 15 | $ | 108,066 | $ | 586 | 36 | ||||||||||||||||||||||||||||||||||||||||||||||||||||||||||||||||||||||||||||||||||||||
| Notes to Consolidated Financial Statements (unaudited) | ||||||||
| Three Months Ended | Three Months Ended | Six Months Ended | ||||||||||||||||||||||||||||||||||||||||||||||||||||||||||||||
| March 31, | June 30, | June 30, | ||||||||||||||||||||||||||||||||||||||||||||||||||||||||||||||
| 2020 | 2019 | 2020 | 2019 | 2020 | 2019 | |||||||||||||||||||||||||||||||||||||||||||||||||||||||||||
| (Dollars in thousands) | (Dollars in thousands) | |||||||||||||||||||||||||||||||||||||||||||||||||||||||||||||||
| Net gains recognized during the reporting period on equity securities | Net gains recognized during the reporting period on equity securities | $ | 34 | $ | 26 | Net gains recognized during the reporting period on equity securities | $ | 18 | $ | 30 | $ | 53 | $ | 56 | ||||||||||||||||||||||||||||||||||||||||||||||||||
| Less: net gains recognized during the reporting period on equity securities sold during the reporting period | Less: net gains recognized during the reporting period on equity securities sold during the reporting period | — | — | Less: net gains recognized during the reporting period on equity securities sold during the reporting period | — | — | — | — | ||||||||||||||||||||||||||||||||||||||||||||||||||||||||
| Unrealized gain recognized during the reporting period on equity securities still held at the reporting date | Unrealized gain recognized during the reporting period on equity securities still held at the reporting date | $ | 34 | $ | 26 | Unrealized gain recognized during the reporting period on equity securities still held at the reporting date | $ | 18 | $ | 30 | $ | 53 | $ | 56 | ||||||||||||||||||||||||||||||||||||||||||||||||||
| March 31, 2020 | December 31, 2019 | June 30, 2020 | December 31, 2019 | |||||||||||||||||||||||||||||||
| (Dollars in thousands) | (Dollars in thousands) | |||||||||||||||||||||||||||||||||
| Commercial | Commercial | $ | 1,355,723 | $ | 1,356,817 | Commercial | $ | 1,284,919 | $ | 1,356,817 | ||||||||||||||||||||||||
| Energy | Energy | 398,797 | 408,573 | Energy | 390,346 | 408,573 | ||||||||||||||||||||||||||||
| Commercial real estate | Commercial real estate | 1,084,684 | 1,024,041 | Commercial real estate | 1,141,277 | 1,024,041 | ||||||||||||||||||||||||||||
| Construction and land development | Construction and land development | 625,145 | 628,418 | Construction and land development | 661,691 | 628,418 | ||||||||||||||||||||||||||||
| Residential real estate | Residential real estate | 503,702 | 398,695 | Residential real estate | 536,270 | 398,695 | ||||||||||||||||||||||||||||
| Paycheck Protection Program (“PPP”) | Paycheck Protection Program (“PPP”) | 369,022 | — | |||||||||||||||||||||||||||||||
| Consumer | Consumer | 43,118 | 45,163 | Consumer | 45,716 | 45,163 | ||||||||||||||||||||||||||||
| Gross loans | Gross loans | 4,011,169 | 3,861,707 | Gross loans | 4,429,241 | 3,861,707 | ||||||||||||||||||||||||||||
| Less: Allowance for loan losses | Less: Allowance for loan losses | 51,458 | 56,896 | Less: Allowance for loan losses | 71,185 | 56,896 | ||||||||||||||||||||||||||||
| Less: Net deferred loan fees and costs | Less: Net deferred loan fees and costs | 8,718 | 9,463 | Less: Net deferred loan fees and costs | 16,017 | 9,463 | ||||||||||||||||||||||||||||
| Net loans | Net loans | $ | 3,950,993 | $ | 3,795,348 | Net loans | $ | 4,342,039 | $ | 3,795,348 | ||||||||||||||||||||||||
| Notes to Consolidated Financial Statements (unaudited) | ||||||||
| Commercial | Energy | Commercial Real Estate | Construction and Land Development | Residential Real Estate | Consumer | Total | Commercial | Energy | Commercial Real Estate | Construction and Land Development | Residential Real Estate | PPP | Consumer | Total | |||||||||||||||||||||||||||||||||||||||||||||||||||||||||||||||||||||||||||||||||||||||||||||||||||||||||||||||||||||||||||||||||||||||||||||||||||||||||||||||||||||||||||||||||||||||||||||||
| (Dollars in thousands) | (Dollars in thousands) | ||||||||||||||||||||||||||||||||||||||||||||||||||||||||||||||||||||||||||||||||||||||||||||||||||||||||||||||||||||||||||||||||||||||||||||||||||||||||||||||||||||||||||||||||||||||||||||||||||||||||||||
| Three months ended March 31, 2020 | |||||||||||||||||||||||||||||||||||||||||||||||||||||||||||||||||||||||||||||||||||||||||||||||||||||||||||||||||||||||||||||||||||||||||||||||||||||||||||||||||||||||||||||||||||||||||||||||||||||||||||||
| Three months ended June 30, 2020 | Three months ended June 30, 2020 | ||||||||||||||||||||||||||||||||||||||||||||||||||||||||||||||||||||||||||||||||||||||||||||||||||||||||||||||||||||||||||||||||||||||||||||||||||||||||||||||||||||||||||||||||||||||||||||||||||||||||||||
| Allowance for loan losses | Allowance for loan losses | Allowance for loan losses | |||||||||||||||||||||||||||||||||||||||||||||||||||||||||||||||||||||||||||||||||||||||||||||||||||||||||||||||||||||||||||||||||||||||||||||||||||||||||||||||||||||||||||||||||||||||||||||||||||||||||||
| Beginning balance | Beginning balance | $ | 35,864 | $ | 6,565 | $ | 8,085 | $ | 3,516 | $ | 2,546 | 320 | $ | 56,896 | Beginning balance | $ | 21,129 | $ | 7,599 | $ | 12,623 | $ | 5,021 | $ | 4,687 | $ | — | $ | 399 | $ | 51,458 | ||||||||||||||||||||||||||||||||||||||||||||||||||||||||||||||||||||||||||||||||||||||||||||||||||||||||||||||||||||||||||||||||||||||||||||||||||||||||||||||||||||||||||||||
| Provision charged to expense | Provision charged to expense | 3,271 | 2,313 | 4,538 | 1,505 | 2,141 | 182 | 13,950 | Provision charged to expense | 5,499 | 10,773 | 4,276 | (2) | 370 | — | 84 | 21,000 | ||||||||||||||||||||||||||||||||||||||||||||||||||||||||||||||||||||||||||||||||||||||||||||||||||||||||||||||||||||||||||||||||||||||||||||||||||||||||||||||||||||||||||||||||||||||||||||
| Charge-offs | Charge-offs | (18,077) | (1,279) | — | — | — | (104) | (19,460) | Charge-offs | (87) | (1,000) | — | — | (189) | — | — | (1,276) | ||||||||||||||||||||||||||||||||||||||||||||||||||||||||||||||||||||||||||||||||||||||||||||||||||||||||||||||||||||||||||||||||||||||||||||||||||||||||||||||||||||||||||||||||||||||||||||
| Recoveries | Recoveries | 71 | — | — | — | — | 1 | 72 | Recoveries | 2 | — | — | — | — | — | 1 | 3 | ||||||||||||||||||||||||||||||||||||||||||||||||||||||||||||||||||||||||||||||||||||||||||||||||||||||||||||||||||||||||||||||||||||||||||||||||||||||||||||||||||||||||||||||||||||||||||||
| Ending balance | Ending balance | $ | 21,129 | $ | 7,599 | $ | 12,623 | $ | 5,021 | $ | 4,687 | $ | 399 | $ | 51,458 | Ending balance | $ | 26,543 | $ | 17,372 | $ | 16,899 | $ | 5,019 | $ | 4,868 | $ | — | $ | 484 | $ | 71,185 | |||||||||||||||||||||||||||||||||||||||||||||||||||||||||||||||||||||||||||||||||||||||||||||||||||||||||||||||||||||||||||||||||||||||||||||||||||||||||||||||||||||||||||||
| Commercial | Energy | Commercial Real Estate | Construction and Land Development | Residential Real Estate | Consumer | Total | Commercial | Energy | Commercial Real Estate | Construction and Land Development | Residential Real Estate | PPP | Consumer | Total | ||||||||||||||||||||||||||||||||||||||||||||||||||||||||||||||||||||||||||||||||||||||||||||||||||||||||||||||||||||||||||||||||||||||||||||||||||||||||||||||||||||||||||||||||||||||||||||
| (Dollars in thousands) | (Dollars in thousands) | |||||||||||||||||||||||||||||||||||||||||||||||||||||||||||||||||||||||||||||||||||||||||||||||||||||||||||||||||||||||||||||||||||||||||||||||||||||||||||||||||||||||||||||||||||||||||||||||||||||||||
| Three months ended March 31, 2019 | ||||||||||||||||||||||||||||||||||||||||||||||||||||||||||||||||||||||||||||||||||||||||||||||||||||||||||||||||||||||||||||||||||||||||||||||||||||||||||||||||||||||||||||||||||||||||||||||||||||||||||
| Three months ended June 30, 2019 | Three months ended June 30, 2019 | |||||||||||||||||||||||||||||||||||||||||||||||||||||||||||||||||||||||||||||||||||||||||||||||||||||||||||||||||||||||||||||||||||||||||||||||||||||||||||||||||||||||||||||||||||||||||||||||||||||||||
| Allowance for loan losses | Allowance for loan losses | Allowance for loan losses | ||||||||||||||||||||||||||||||||||||||||||||||||||||||||||||||||||||||||||||||||||||||||||||||||||||||||||||||||||||||||||||||||||||||||||||||||||||||||||||||||||||||||||||||||||||||||||||||||||||||||
| Beginning balance | Beginning balance | $ | 16,584 | $ | 10,262 | $ | 6,755 | $ | 2,475 | $ | 1,464 | $ | 286 | $ | 37,826 | Beginning balance | $ | 20,506 | $ | 7,090 | $ | 7,471 | $ | 2,585 | $ | 2,047 | $ | — | $ | 302 | $ | 40,001 | ||||||||||||||||||||||||||||||||||||||||||||||||||||||||||||||||||||||||||||||||||||||||||||||||||||||||||||||||||||||||||||||||||||||||||||||||||||||||||||||||||||||||||
| Provision charged to expense | Provision charged to expense | 5,163 | (3,748) | 716 | 110 | 583 | 26 | 2,850 | Provision charged to expense | 2,468 | 210 | 62 | 17 | 91 | — | 2 | 2,850 | |||||||||||||||||||||||||||||||||||||||||||||||||||||||||||||||||||||||||||||||||||||||||||||||||||||||||||||||||||||||||||||||||||||||||||||||||||||||||||||||||||||||||||||||||||||||||
| Charge-offs | Charge-offs | (1,254) | — | — | — | — | (10) | (1,264) | Charge-offs | — | — | — | — | — | — | (1) | (1) | |||||||||||||||||||||||||||||||||||||||||||||||||||||||||||||||||||||||||||||||||||||||||||||||||||||||||||||||||||||||||||||||||||||||||||||||||||||||||||||||||||||||||||||||||||||||||
| Recoveries | Recoveries | 13 | 576 | — | — | — | — | 589 | Recoveries | 1 | — | — | — | — | — | 1 | 2 | |||||||||||||||||||||||||||||||||||||||||||||||||||||||||||||||||||||||||||||||||||||||||||||||||||||||||||||||||||||||||||||||||||||||||||||||||||||||||||||||||||||||||||||||||||||||||
| Ending balance | Ending balance | $ | 20,506 | $ | 7,090 | $ | 7,471 | $ | 2,585 | $ | 2,047 | $ | 302 | $ | 40,001 | Ending balance | $ | 22,975 | $ | 7,300 | $ | 7,533 | $ | 2,602 | $ | 2,138 | $ | — | $ | 304 | $ | 42,852 | ||||||||||||||||||||||||||||||||||||||||||||||||||||||||||||||||||||||||||||||||||||||||||||||||||||||||||||||||||||||||||||||||||||||||||||||||||||||||||||||||||||||||||
| Commercial | Energy | Commercial Real Estate | Construction and Land Development | Residential Real Estate | Consumer | Total | |||||||||||||||||||||||||||||||||||||||||||||||||||||||||||||||||||||||||||||||||||||||||
| (Dollars in thousands) | |||||||||||||||||||||||||||||||||||||||||||||||||||||||||||||||||||||||||||||||||||||||||||||||
| March 31, 2020 | |||||||||||||||||||||||||||||||||||||||||||||||||||||||||||||||||||||||||||||||||||||||||||||||
| Ending balance | |||||||||||||||||||||||||||||||||||||||||||||||||||||||||||||||||||||||||||||||||||||||||||||||
| Individually evaluated for impairment | $ | 3,228 | $ | 1,224 | $ | 1,449 | $ | — | $ | 189 | $ | — | $ | 6,090 | |||||||||||||||||||||||||||||||||||||||||||||||||||||||||||||||||||||||||||||||||
| Collectively evaluated for impairment | $ | 17,901 | $ | 6,375 | $ | 11,174 | $ | 5,021 | $ | 4,498 | $ | 399 | $ | 45,368 | |||||||||||||||||||||||||||||||||||||||||||||||||||||||||||||||||||||||||||||||||
| Allocated to loans: | |||||||||||||||||||||||||||||||||||||||||||||||||||||||||||||||||||||||||||||||||||||||||||||||
| Individually evaluated for impairment | $ | 71,983 | $ | 15,703 | $ | 14,840 | $ | — | $ | 5,654 | $ | 254 | $ | 108,434 | |||||||||||||||||||||||||||||||||||||||||||||||||||||||||||||||||||||||||||||||||
| Collectively evaluated for impairment | $ | 1,283,740 | $ | 383,094 | $ | 1,069,844 | $ | 625,145 | $ | 498,048 | $ | 42,864 | $ | 3,902,735 | |||||||||||||||||||||||||||||||||||||||||||||||||||||||||||||||||||||||||||||||||
| Ending balance | $ | 1,355,723 | $ | 398,797 | $ | 1,084,684 | $ | 625,145 | $ | 503,702 | $ | 43,118 | $ | 4,011,169 | |||||||||||||||||||||||||||||||||||||||||||||||||||||||||||||||||||||||||||||||||
| Notes to Consolidated Financial Statements (unaudited) | ||||||||
| Commercial | Energy | Commercial Real Estate | Construction and Land Development | Residential Real Estate | PPP | Consumer | Total | ||||||||||||||||||||||||||||||||||||||||||||||||||||||||||||||||||||||||||||||||||||||||
| (Dollars in thousands) | |||||||||||||||||||||||||||||||||||||||||||||||||||||||||||||||||||||||||||||||||||||||||||||||
| Six months ended June 30, 2020 | |||||||||||||||||||||||||||||||||||||||||||||||||||||||||||||||||||||||||||||||||||||||||||||||
| Allowance for loan losses | |||||||||||||||||||||||||||||||||||||||||||||||||||||||||||||||||||||||||||||||||||||||||||||||
| Beginning balance | $ | 35,864 | $ | 6,565 | $ | 8,085 | $ | 3,516 | $ | 2,546 | $ | — | $ | 320 | $ | 56,896 | |||||||||||||||||||||||||||||||||||||||||||||||||||||||||||||||||||||||||||||||
| Provision charged to expense | 8,771 | 13,085 | 8,814 | 1,503 | 2,511 | — | 266 | 34,950 | |||||||||||||||||||||||||||||||||||||||||||||||||||||||||||||||||||||||||||||||||||||||
| Charge-offs | (18,165) | (2,278) | — | — | (189) | — | (104) | (20,736) | |||||||||||||||||||||||||||||||||||||||||||||||||||||||||||||||||||||||||||||||||||||||
| Recoveries | 73 | — | — | — | — | — | 2 | 75 | |||||||||||||||||||||||||||||||||||||||||||||||||||||||||||||||||||||||||||||||||||||||
| Ending balance | $ | 26,543 | $ | 17,372 | $ | 16,899 | $ | 5,019 | $ | 4,868 | $ | — | $ | 484 | $ | 71,185 | |||||||||||||||||||||||||||||||||||||||||||||||||||||||||||||||||||||||||||||||
| Commercial | Energy | Commercial Real Estate | Construction and Land Development | Residential Real Estate | PPP | Consumer | Total | ||||||||||||||||||||||||||||||||||||||||||||||||||||||||||||||||||||||||||||||||||
| (Dollars in thousands) | |||||||||||||||||||||||||||||||||||||||||||||||||||||||||||||||||||||||||||||||||||||||||
| Six months ended June 30, 2019 | |||||||||||||||||||||||||||||||||||||||||||||||||||||||||||||||||||||||||||||||||||||||||
| Allowance for loan losses | |||||||||||||||||||||||||||||||||||||||||||||||||||||||||||||||||||||||||||||||||||||||||
| Beginning balance | $ | 16,584 | $ | 10,262 | $ | 6,755 | $ | 2,475 | $ | 1,464 | $ | — | $ | 286 | $ | 37,826 | |||||||||||||||||||||||||||||||||||||||||||||||||||||||||||||||||||||||||
| Provision charged to expense | 7,631 | (3,538) | 778 | 127 | 674 | — | $ | 28 | 5,700 | ||||||||||||||||||||||||||||||||||||||||||||||||||||||||||||||||||||||||||||||||
| Charge-offs | (1,254) | — | — | — | — | — | (11) | (1,265) | |||||||||||||||||||||||||||||||||||||||||||||||||||||||||||||||||||||||||||||||||
| Recoveries | 14 | 576 | — | — | — | — | 1 | 591 | |||||||||||||||||||||||||||||||||||||||||||||||||||||||||||||||||||||||||||||||||
| Ending balance | $ | 22,975 | $ | 7,300 | $ | 7,533 | $ | 2,602 | $ | 2,138 | $ | — | $ | 304 | $ | 42,852 | |||||||||||||||||||||||||||||||||||||||||||||||||||||||||||||||||||||||||
| Commercial | Energy | Commercial Real Estate | Construction and Land Development | Residential Real Estate | PPP | Consumer | Total | ||||||||||||||||||||||||||||||||||||||||||||||||||||||||||||||||||||||||||||||||||||||||||||||
| (Dollars in thousands) | |||||||||||||||||||||||||||||||||||||||||||||||||||||||||||||||||||||||||||||||||||||||||||||||||||||
| June 30, 2020 | |||||||||||||||||||||||||||||||||||||||||||||||||||||||||||||||||||||||||||||||||||||||||||||||||||||
| Period end allowance for loan losses allocated to: | |||||||||||||||||||||||||||||||||||||||||||||||||||||||||||||||||||||||||||||||||||||||||||||||||||||
| Individually evaluated for impairment | $ | 2,933 | $ | 1,942 | $ | 1,704 | $ | — | $ | 413 | $ | — | $ | — | $ | 6,992 | |||||||||||||||||||||||||||||||||||||||||||||||||||||||||||||||||||||||||||||||||||||
| Collectively evaluated for impairment | $ | 23,610 | $ | 15,430 | $ | 15,195 | $ | 5,019 | $ | 4,455 | $ | — | $ | 484 | $ | 64,193 | |||||||||||||||||||||||||||||||||||||||||||||||||||||||||||||||||||||||||||||||||||||
| Ending balance | $ | 26,543 | $ | 17,372 | $ | 16,899 | $ | 5,019 | $ | 4,868 | $ | — | $ | 484 | $ | 71,185 | |||||||||||||||||||||||||||||||||||||||||||||||||||||||||||||||||||||||||||||||||||||
| Allocated to loans: | |||||||||||||||||||||||||||||||||||||||||||||||||||||||||||||||||||||||||||||||||||||||||||||||||||||
| Individually evaluated for impairment | $ | 11,831 | $ | 15,532 | $ | 10,909 | $ | — | $ | 6,981 | $ | — | $ | 249 | $ | 45,502 | |||||||||||||||||||||||||||||||||||||||||||||||||||||||||||||||||||||||||||||||||||||
| Collectively evaluated for impairment | $ | 1,273,088 | $ | 374,814 | $ | 1,130,368 | $ | 661,691 | $ | 529,289 | $ | 369,022 | $ | 45,467 | $ | 4,383,739 | |||||||||||||||||||||||||||||||||||||||||||||||||||||||||||||||||||||||||||||||||||||
| Ending balance | $ | 1,284,919 | $ | 390,346 | $ | 1,141,277 | $ | 661,691 | $ | 536,270 | $ | 369,022 | $ | 45,716 | $ | 4,429,241 | |||||||||||||||||||||||||||||||||||||||||||||||||||||||||||||||||||||||||||||||||||||
| Notes to Consolidated Financial Statements (unaudited) | ||||||||
| Commercial | Energy | Commercial Real Estate | Construction and Land Development | Residential Real Estate | Consumer | Total | Commercial | Energy | Commercial Real Estate | Construction and Land Development | Residential Real Estate | PPP | Consumer | Total | ||||||||||||||||||||||||||||||||||||||||||||||||||||||||||||||||||||||||||||||||||||||||||||||||||||||||||||||||||||||||||||||||||||||||||||||||||||||||||||||||||||||||||||||||||||||
| (Dollars in thousands) | (Dollars in thousands) | |||||||||||||||||||||||||||||||||||||||||||||||||||||||||||||||||||||||||||||||||||||||||||||||||||||||||||||||||||||||||||||||||||||||||||||||||||||||||||||||||||||||||||||||||||||||||||||||||||
| December 31, 2019 | December 31, 2019 | December 31, 2019 | ||||||||||||||||||||||||||||||||||||||||||||||||||||||||||||||||||||||||||||||||||||||||||||||||||||||||||||||||||||||||||||||||||||||||||||||||||||||||||||||||||||||||||||||||||||||||||||||||||
| Ending balance | ||||||||||||||||||||||||||||||||||||||||||||||||||||||||||||||||||||||||||||||||||||||||||||||||||||||||||||||||||||||||||||||||||||||||||||||||||||||||||||||||||||||||||||||||||||||||||||||||||||
| Period end allowance for loan losses allocated to: | Period end allowance for loan losses allocated to: | |||||||||||||||||||||||||||||||||||||||||||||||||||||||||||||||||||||||||||||||||||||||||||||||||||||||||||||||||||||||||||||||||||||||||||||||||||||||||||||||||||||||||||||||||||||||||||||||||||
| Individually evaluated for impairment | Individually evaluated for impairment | $ | 19,942 | $ | 1,949 | $ | 210 | $ | — | $ | 197 | $ | — | $ | 22,298 | Individually evaluated for impairment | $ | 19,942 | $ | 1,949 | $ | 210 | $ | — | $ | 197 | $ | — | $ | — | $ | 22,298 | ||||||||||||||||||||||||||||||||||||||||||||||||||||||||||||||||||||||||||||||||||||||||||||||||||||||||||||||||||||||||||||||||||||||||||||||||||||||||||||||||||||
| Collectively evaluated for impairment | Collectively evaluated for impairment | $ | 15,922 | $ | 4,616 | $ | 7,875 | $ | 3,516 | $ | 2,349 | $ | 320 | $ | 34,598 | Collectively evaluated for impairment | $ | 15,922 | $ | 4,616 | $ | 7,875 | $ | 3,516 | $ | 2,349 | $ | — | $ | 320 | $ | 34,598 | ||||||||||||||||||||||||||||||||||||||||||||||||||||||||||||||||||||||||||||||||||||||||||||||||||||||||||||||||||||||||||||||||||||||||||||||||||||||||||||||||||||
| Ending balance | Ending balance | $ | 35,864 | $ | 6,565 | $ | 8,085 | $ | 3,516 | $ | 2,546 | $ | — | $ | 320 | $ | 56,896 | |||||||||||||||||||||||||||||||||||||||||||||||||||||||||||||||||||||||||||||||||||||||||||||||||||||||||||||||||||||||||||||||||||||||||||||||||||||||||||||||||||||||||||||||||||
| Allocated to loans: | Allocated to loans: | Allocated to loans: | ||||||||||||||||||||||||||||||||||||||||||||||||||||||||||||||||||||||||||||||||||||||||||||||||||||||||||||||||||||||||||||||||||||||||||||||||||||||||||||||||||||||||||||||||||||||||||||||||||
| Individually evaluated for impairment | Individually evaluated for impairment | $ | 70,876 | 9,744 | $ | 10,492 | $ | — | $ | 2,388 | $ | — | $ | 93,500 | Individually evaluated for impairment | $ | 70,876 | 9,744 | $ | 10,492 | $ | — | $ | 2,388 | $ | — | $ | — | $ | 93,500 | ||||||||||||||||||||||||||||||||||||||||||||||||||||||||||||||||||||||||||||||||||||||||||||||||||||||||||||||||||||||||||||||||||||||||||||||||||||||||||||||||||||||
| Collectively evaluated for impairment | Collectively evaluated for impairment | $ | 1,285,941 | $ | 398,829 | $ | 1,013,549 | $ | 628,418 | $ | 396,307 | $ | 45,163 | $ | 3,768,207 | Collectively evaluated for impairment | $ | 1,285,941 | $ | 398,829 | $ | 1,013,549 | $ | 628,418 | $ | 396,307 | $ | — | $ | 45,163 | $ | 3,768,207 | ||||||||||||||||||||||||||||||||||||||||||||||||||||||||||||||||||||||||||||||||||||||||||||||||||||||||||||||||||||||||||||||||||||||||||||||||||||||||||||||||||||
| Ending balance | Ending balance | $ | 1,356,817 | $ | 408,573 | $ | 1,024,041 | $ | 628,418 | $ | 398,695 | $ | 45,163 | $ | 3,861,707 | Ending balance | $ | 1,356,817 | $ | 408,573 | $ | 1,024,041 | $ | 628,418 | $ | 398,695 | $ | — | $ | 45,163 | $ | 3,861,707 | ||||||||||||||||||||||||||||||||||||||||||||||||||||||||||||||||||||||||||||||||||||||||||||||||||||||||||||||||||||||||||||||||||||||||||||||||||||||||||||||||||||
| Notes to Consolidated Financial Statements (unaudited) | ||||||||
| Pass & Watch | Special Mention | Substandard | Doubtful | Loss | Total | ||||||||||||||||||||||||||||||||||||||||||||||||||||||||||||||||||||||||||||||||||||||||||||||||||||||||||||||||||||||||||
| (Dollars in thousands) | Pass | Special Mention | Substandard Performing | Substandard Nonperforming | Doubtful | Loss | Total | ||||||||||||||||||||||||||||||||||||||||||||||||||||||||||||||||||||||||||||||||||||||||||||||||||||||||||||||||||||||||
| March 31, 2020 | |||||||||||||||||||||||||||||||||||||||||||||||||||||||||||||||||||||||||||||||||||||||||||||||||||||||||||||||||||||||||||||||
| (Dollars in thousands) | |||||||||||||||||||||||||||||||||||||||||||||||||||||||||||||||||||||||||||||||||||||||||||||||||||||||||||||||||||||||||||||||
| June 30, 2020 | June 30, 2020 | ||||||||||||||||||||||||||||||||||||||||||||||||||||||||||||||||||||||||||||||||||||||||||||||||||||||||||||||||||||||||||||||
| Commercial | Commercial | $ | 1,234,385 | $ | 49,459 | $ | 71,879 | $ | — | $ | — | $ | 1,355,723 | Commercial | $ | 1,143,316 | $ | 53,411 | $ | 77,226 | $ | 7,662 | $ | 3,304 | $ | — | $ | 1,284,919 | |||||||||||||||||||||||||||||||||||||||||||||||||||||||||||||||||||||||||||||||||||||||||||||||||||
| Energy | Energy | 370,614 | 12,628 | 12,294 | 3,261 | — | 398,797 | Energy | 210,557 | 71,837 | 92,568 | 10,997 | 4,387 | — | 390,346 | ||||||||||||||||||||||||||||||||||||||||||||||||||||||||||||||||||||||||||||||||||||||||||||||||||||||||||||||||
| Commercial real estate | Commercial real estate | 1,058,543 | 14,985 | 10,329 | 827 | — | 1,084,684 | Commercial real estate | 1,069,590 | 39,332 | 25,355 | 6,187 | 813 | — | 1,141,277 | ||||||||||||||||||||||||||||||||||||||||||||||||||||||||||||||||||||||||||||||||||||||||||||||||||||||||||||||||
| Construction and land development | Construction and land development | 625,145 | — | — | — | — | 625,145 | Construction and land development | 655,200 | 5,330 | 1,161 | — | — | — | 661,691 | ||||||||||||||||||||||||||||||||||||||||||||||||||||||||||||||||||||||||||||||||||||||||||||||||||||||||||||||||
| Residential real estate | Residential real estate | 496,236 | 1,791 | 5,675 | — | — | 503,702 | Residential real estate | 528,510 | 540 | 3,285 | 3,935 | — | — | 536,270 | ||||||||||||||||||||||||||||||||||||||||||||||||||||||||||||||||||||||||||||||||||||||||||||||||||||||||||||||||
| PPP | PPP | 369,022 | — | — | — | — | — | 369,022 | |||||||||||||||||||||||||||||||||||||||||||||||||||||||||||||||||||||||||||||||||||||||||||||||||||||||||||||||||||||||
| Consumer | Consumer | 42,864 | — | 254 | — | — | 43,118 | Consumer | 45,467 | — | — | 249 | — | — | 45,716 | ||||||||||||||||||||||||||||||||||||||||||||||||||||||||||||||||||||||||||||||||||||||||||||||||||||||||||||||||
| $ | 3,827,787 | $ | 78,863 | $ | 100,431 | $ | 4,088 | $ | — | $ | 4,011,169 | $ | 4,021,662 | $ | 170,450 | $ | 199,595 | $ | 29,030 | $ | 8,504 | $ | — | $ | 4,429,241 | ||||||||||||||||||||||||||||||||||||||||||||||||||||||||||||||||||||||||||||||||||||||||||||||||||||||
| Pass & Watch | Special Mention | Substandard | Doubtful | Loss | Total | ||||||||||||||||||||||||||||||||||||||||||||||||||||||||||||
| (Dollars in thousands) | |||||||||||||||||||||||||||||||||||||||||||||||||||||||||||||||||
| December 31, 2019 | |||||||||||||||||||||||||||||||||||||||||||||||||||||||||||||||||
| Commercial | $ | 1,258,952 | $ | 27,069 | $ | 70,796 | $ | — | $ | — | $ | 1,356,817 | |||||||||||||||||||||||||||||||||||||||||||||||||||||
| Energy | 392,233 | 9,460 | 2,340 | 4,540 | — | 408,573 | |||||||||||||||||||||||||||||||||||||||||||||||||||||||||||
| Commercial real estate | 1,007,921 | 9,311 | 5,866 | 943 | — | 1,024,041 | |||||||||||||||||||||||||||||||||||||||||||||||||||||||||||
| Construction and land development | 628,418 | — | — | — | — | 628,418 | |||||||||||||||||||||||||||||||||||||||||||||||||||||||||||
| Residential real estate | 394,495 | 1,789 | 2,411 | — | — | 398,695 | |||||||||||||||||||||||||||||||||||||||||||||||||||||||||||
| Consumer | 45,163 | — | — | — | — | 45,163 | |||||||||||||||||||||||||||||||||||||||||||||||||||||||||||
| $ | 3,727,182 | $ | 47,629 | $ | 81,413 | $ | 5,483 | $ | — | $ | 3,861,707 | ||||||||||||||||||||||||||||||||||||||||||||||||||||||
| Notes to Consolidated Financial Statements (unaudited) | ||||||||
| Pass | Special Mention | Substandard Performing | Substandard Nonperforming | Doubtful | Loss | Total | ||||||||||||||||||||||||||||||||||||||||||||||||||||||||||||||||||||||||||||||||
| (Dollars in thousands) | ||||||||||||||||||||||||||||||||||||||||||||||||||||||||||||||||||||||||||||||||||||||
| December 31, 2019 | ||||||||||||||||||||||||||||||||||||||||||||||||||||||||||||||||||||||||||||||||||||||
| Commercial | $ | 1,258,952 | $ | 27,069 | $ | 38,666 | $ | 32,130 | $ | — | $ | — | $ | 1,356,817 | ||||||||||||||||||||||||||||||||||||||||||||||||||||||||||||||||||||||||
| Energy | 392,233 | 9,460 | 2,340 | — | 4,540 | — | 408,573 | |||||||||||||||||||||||||||||||||||||||||||||||||||||||||||||||||||||||||||||||
| Commercial real estate | 1,007,921 | 9,311 | 5,746 | 120 | 943 | — | 1,024,041 | |||||||||||||||||||||||||||||||||||||||||||||||||||||||||||||||||||||||||||||||
| Construction and land development | 628,418 | — | — | — | — | — | 628,418 | |||||||||||||||||||||||||||||||||||||||||||||||||||||||||||||||||||||||||||||||
| Residential real estate | 394,495 | 1,789 | 469 | 1,942 | — | — | 398,695 | |||||||||||||||||||||||||||||||||||||||||||||||||||||||||||||||||||||||||||||||
| PPP | — | — | — | — | — | — | — | |||||||||||||||||||||||||||||||||||||||||||||||||||||||||||||||||||||||||||||||
| Consumer | 45,163 | — | — | — | — | — | 45,163 | |||||||||||||||||||||||||||||||||||||||||||||||||||||||||||||||||||||||||||||||
| $ | 3,727,182 | $ | 47,629 | $ | 47,221 | $ | 34,192 | $ | 5,483 | $ | — | $ | 3,861,707 | |||||||||||||||||||||||||||||||||||||||||||||||||||||||||||||||||||||||||
| 30-59 Days Past Due | 60-89 Days Past Due | 90 Days or More | Total Past Due | Current | Total Loans Receivable | Loans >= 90 Days and Accruing | |||||||||||||||||||||||||||||||||||||||||||||||||||||||||||||||||||||||||||||
| (Dollars in thousands) | |||||||||||||||||||||||||||||||||||||||||||||||||||||||||||||||||||||||||||||||||||
| June 30, 2020 | |||||||||||||||||||||||||||||||||||||||||||||||||||||||||||||||||||||||||||||||||||
| Commercial | $ | 4,645 | $ | 3,391 | $ | 7,315 | $ | 15,351 | $ | 1,269,568 | $ | 1,284,919 | $ | — | |||||||||||||||||||||||||||||||||||||||||||||||||||||||||||||||||||||
| Energy | — | 16,918 | 4,440 | 21,358 | 368,988 | 390,346 | — | ||||||||||||||||||||||||||||||||||||||||||||||||||||||||||||||||||||||||||||
| Commercial real estate | 8,009 | 230 | 4,481 | 12,720 | 1,128,557 | 1,141,277 | — | ||||||||||||||||||||||||||||||||||||||||||||||||||||||||||||||||||||||||||||
| Construction and land development | 194 | — | — | 194 | 661,497 | 661,691 | — | ||||||||||||||||||||||||||||||||||||||||||||||||||||||||||||||||||||||||||||
| Residential real estate | 1,357 | — | 3,915 | 5,272 | 530,998 | 536,270 | 220 | ||||||||||||||||||||||||||||||||||||||||||||||||||||||||||||||||||||||||||||
| PPP | — | — | — | — | 369,022 | 369,022 | — | ||||||||||||||||||||||||||||||||||||||||||||||||||||||||||||||||||||||||||||
| Consumer | — | 137 | — | 137 | 45,579 | 45,716 | — | ||||||||||||||||||||||||||||||||||||||||||||||||||||||||||||||||||||||||||||
| $ | 14,205 | $ | 20,676 | $ | 20,151 | $ | 55,032 | $ | 4,374,209 | $ | 4,429,241 | $ | 220 | ||||||||||||||||||||||||||||||||||||||||||||||||||||||||||||||||||||||
| 30-59 Days Past Due | 60-89 Days Past Due | 90 Days or More | Total Past Due | Current | Total Loans Receivable | Loans >= 90 Days and Accruing | |||||||||||||||||||||||||||||||||||||||||||||||||||||||||||||||||||||||
| (Dollars in thousands) | |||||||||||||||||||||||||||||||||||||||||||||||||||||||||||||||||||||||||||||
| December 31, 2019 | |||||||||||||||||||||||||||||||||||||||||||||||||||||||||||||||||||||||||||||
| Commercial | $ | 1,091 | $ | 276 | $ | 30,911 | $ | 32,278 | $ | 1,324,539 | $ | 1,356,817 | $ | 37 | |||||||||||||||||||||||||||||||||||||||||||||||||||||||||||||||
| Energy | 2,340 | — | 4,593 | 6,933 | 401,640 | 408,573 | 53 | ||||||||||||||||||||||||||||||||||||||||||||||||||||||||||||||||||||||
| Commercial real estate | 316 | — | 4,589 | 4,905 | 1,019,136 | 1,024,041 | 4,501 | ||||||||||||||||||||||||||||||||||||||||||||||||||||||||||||||||||||||
| Construction and land development | 196 | — | — | 196 | 628,222 | 628,418 | — | ||||||||||||||||||||||||||||||||||||||||||||||||||||||||||||||||||||||
| Residential real estate | 2,347 | — | 1,919 | 4,266 | 394,429 | 398,695 | — | ||||||||||||||||||||||||||||||||||||||||||||||||||||||||||||||||||||||
| PPP | — | — | — | — | — | — | — | ||||||||||||||||||||||||||||||||||||||||||||||||||||||||||||||||||||||
| Consumer | 2 | 254 | — | 256 | 44,907 | 45,163 | — | ||||||||||||||||||||||||||||||||||||||||||||||||||||||||||||||||||||||
| $ | 6,292 | $ | 530 | $ | 42,012 | $ | 48,834 | $ | 3,812,873 | $ | 3,861,707 | $ | 4,591 | ||||||||||||||||||||||||||||||||||||||||||||||||||||||||||||||||
| Notes to Consolidated Financial Statements (unaudited) | ||||||||
| 30-59 Days Past Due | 60-89 Days Past Due | 90 Days or More | Total Past Due | Current | Total Loans Receivable | Loans >= 90 Days and Accruing | |||||||||||||||||||||||||||||||||||||||||||||||||||||||||||||||||||||||||||||
| (Dollars in thousands) | |||||||||||||||||||||||||||||||||||||||||||||||||||||||||||||||||||||||||||||||||||
| March 31, 2020 | |||||||||||||||||||||||||||||||||||||||||||||||||||||||||||||||||||||||||||||||||||
| Commercial | $ | 5,135 | $ | 469 | $ | 10,062 | $ | 15,666 | $ | 1,340,057 | $ | 1,355,723 | $ | — | |||||||||||||||||||||||||||||||||||||||||||||||||||||||||||||||||||||
| Energy | — | 5,612 | 3,314 | 8,926 | 389,871 | 398,797 | — | ||||||||||||||||||||||||||||||||||||||||||||||||||||||||||||||||||||||||||||
| Commercial real estate | 4,092 | — | 4,586 | 8,678 | 1,076,006 | 1,084,684 | — | ||||||||||||||||||||||||||||||||||||||||||||||||||||||||||||||||||||||||||||
| Construction and land development | — | — | — | — | 625,145 | 625,145 | — | ||||||||||||||||||||||||||||||||||||||||||||||||||||||||||||||||||||||||||||
| Residential real estate | 3,707 | 269 | 1,920 | 5,896 | 497,806 | 503,702 | — | ||||||||||||||||||||||||||||||||||||||||||||||||||||||||||||||||||||||||||||
| Consumer | — | 254 | — | 254 | 42,864 | 43,118 | — | ||||||||||||||||||||||||||||||||||||||||||||||||||||||||||||||||||||||||||||
| $ | 12,934 | $ | 6,604 | $ | 19,882 | $ | 39,420 | $ | 3,971,749 | $ | 4,011,169 | $ | — | ||||||||||||||||||||||||||||||||||||||||||||||||||||||||||||||||||||||
| 30-59 Days Past Due | 60-89 Days Past Due | 90 Days or More | Total Past Due | Current | Total Loans Receivable | Loans >= 90 Days and Accruing | |||||||||||||||||||||||||||||||||||||||||||||||||||||||||||||||||||||||
| (Dollars in thousands) | |||||||||||||||||||||||||||||||||||||||||||||||||||||||||||||||||||||||||||||
| December 31, 2019 | |||||||||||||||||||||||||||||||||||||||||||||||||||||||||||||||||||||||||||||
| Commercial | $ | 1,091 | $ | 276 | $ | 30,911 | $ | 32,278 | $ | 1,324,539 | $ | 1,356,817 | $ | 37 | |||||||||||||||||||||||||||||||||||||||||||||||||||||||||||||||
| Energy | 2,340 | — | 4,593 | 6,933 | 401,640 | 408,573 | 53 | ||||||||||||||||||||||||||||||||||||||||||||||||||||||||||||||||||||||
| Commercial real estate | 316 | — | 4,589 | 4,905 | 1,019,136 | 1,024,041 | 4,501 | ||||||||||||||||||||||||||||||||||||||||||||||||||||||||||||||||||||||
| Construction and land development | 196 | — | — | 196 | 628,222 | 628,418 | — | ||||||||||||||||||||||||||||||||||||||||||||||||||||||||||||||||||||||
| Residential real estate | 2,347 | — | 1,919 | 4,266 | 394,429 | 398,695 | — | ||||||||||||||||||||||||||||||||||||||||||||||||||||||||||||||||||||||
| Consumer | 2 | 254 | — | 256 | 44,907 | 45,163 | — | ||||||||||||||||||||||||||||||||||||||||||||||||||||||||||||||||||||||
| $ | 6,292 | $ | 530 | $ | 42,012 | $ | 48,834 | $ | 3,812,873 | $ | 3,861,707 | $ | 4,591 | ||||||||||||||||||||||||||||||||||||||||||||||||||||||||||||||||
| Unpaid | Unpaid | |||||||||||||||||||||||||||||||||||||||||||||||||||||||||||||||||||||||||||||||||||||||
| Recorded Balance | Principal Balance | Specific Allowance | Recorded Balance | Principal Balance | Specific Allowance | |||||||||||||||||||||||||||||||||||||||||||||||||||||||||||||||||||||||||||||||||||
| (Dollars in thousands) | (Dollars in thousands) | |||||||||||||||||||||||||||||||||||||||||||||||||||||||||||||||||||||||||||||||||||||||
| March 31, 2020 | ||||||||||||||||||||||||||||||||||||||||||||||||||||||||||||||||||||||||||||||||||||||||
| June 30, 2020 | June 30, 2020 | |||||||||||||||||||||||||||||||||||||||||||||||||||||||||||||||||||||||||||||||||||||||
| Loans without a specific valuation | Loans without a specific valuation | Loans without a specific valuation | ||||||||||||||||||||||||||||||||||||||||||||||||||||||||||||||||||||||||||||||||||||||
| Commercial | Commercial | $ | 60,048 | $ | 60,077 | $ | — | Commercial | $ | 70 | $ | 70 | $ | — | ||||||||||||||||||||||||||||||||||||||||||||||||||||||||||||||||||||||||||
| Energy | Energy | 3,462 | 7,741 | — | Energy | — | — | — | ||||||||||||||||||||||||||||||||||||||||||||||||||||||||||||||||||||||||||||||||
| Commercial real estate | Commercial real estate | 8,492 | 8,622 | — | Commercial real estate | 763 | 854 | — | ||||||||||||||||||||||||||||||||||||||||||||||||||||||||||||||||||||||||||||||||
| Construction and land development | Construction and land development | — | — | — | Construction and land development | — | — | — | ||||||||||||||||||||||||||||||||||||||||||||||||||||||||||||||||||||||||||||||||
| Residential real estate | Residential real estate | 5,409 | 5,430 | — | Residential real estate | 5,404 | 5,404 | — | ||||||||||||||||||||||||||||||||||||||||||||||||||||||||||||||||||||||||||||||||
| PPP | PPP | — | — | — | ||||||||||||||||||||||||||||||||||||||||||||||||||||||||||||||||||||||||||||||||||||
| Consumer | Consumer | 254 | 254 | — | Consumer | 249 | 249 | — | ||||||||||||||||||||||||||||||||||||||||||||||||||||||||||||||||||||||||||||||||
| Loans with a specific valuation | Loans with a specific valuation | Loans with a specific valuation | ||||||||||||||||||||||||||||||||||||||||||||||||||||||||||||||||||||||||||||||||||||||
| Commercial | Commercial | 11,935 | 23,341 | 3,228 | Commercial | 11,761 | 29,710 | 2,933 | ||||||||||||||||||||||||||||||||||||||||||||||||||||||||||||||||||||||||||||||||
| Energy | Energy | 12,241 | 12,241 | 1,224 | Energy | 15,532 | 18,244 | 1,942 | ||||||||||||||||||||||||||||||||||||||||||||||||||||||||||||||||||||||||||||||||
| Commercial real estate | Commercial real estate | 6,348 | 6,474 | 1,449 | Commercial real estate | 10,146 | 10,146 | 1,704 | ||||||||||||||||||||||||||||||||||||||||||||||||||||||||||||||||||||||||||||||||
| Construction and land development | Construction and land development | — | — | — | Construction and land development | — | — | — | ||||||||||||||||||||||||||||||||||||||||||||||||||||||||||||||||||||||||||||||||
| Residential real estate | Residential real estate | 245 | 244 | 189 | Residential real estate | 1,577 | 1,577 | 413 | ||||||||||||||||||||||||||||||||||||||||||||||||||||||||||||||||||||||||||||||||
| PPP | PPP | — | — | — | ||||||||||||||||||||||||||||||||||||||||||||||||||||||||||||||||||||||||||||||||||||
| Consumer | Consumer | — | — | — | Consumer | — | — | — | ||||||||||||||||||||||||||||||||||||||||||||||||||||||||||||||||||||||||||||||||
| Total | Total | Total | ||||||||||||||||||||||||||||||||||||||||||||||||||||||||||||||||||||||||||||||||||||||
| Commercial | Commercial | 71,983 | 83,418 | 3,228 | Commercial | 11,831 | 29,780 | 2,933 | ||||||||||||||||||||||||||||||||||||||||||||||||||||||||||||||||||||||||||||||||
| Energy | Energy | 15,703 | 19,982 | 1,224 | Energy | 15,532 | 18,244 | 1,942 | ||||||||||||||||||||||||||||||||||||||||||||||||||||||||||||||||||||||||||||||||
| Commercial real estate | Commercial real estate | 14,840 | 15,096 | 1,449 | Commercial real estate | 10,909 | 11,000 | 1,704 | ||||||||||||||||||||||||||||||||||||||||||||||||||||||||||||||||||||||||||||||||
| Construction and land development | Construction and land development | — | — | — | Construction and land development | — | — | — | ||||||||||||||||||||||||||||||||||||||||||||||||||||||||||||||||||||||||||||||||
| Residential real estate | Residential real estate | 5,654 | 5,674 | 189 | Residential real estate | 6,981 | 6,981 | 413 | ||||||||||||||||||||||||||||||||||||||||||||||||||||||||||||||||||||||||||||||||
| PPP | PPP | — | — | — | ||||||||||||||||||||||||||||||||||||||||||||||||||||||||||||||||||||||||||||||||||||
| Consumer | Consumer | 254 | 254 | — | Consumer | 249 | 249 | — | ||||||||||||||||||||||||||||||||||||||||||||||||||||||||||||||||||||||||||||||||
| $ | 108,434 | $ | 124,424 | $ | 6,090 | $ | 45,502 | $ | 66,254 | $ | 6,992 | |||||||||||||||||||||||||||||||||||||||||||||||||||||||||||||||||||||||||||||
| Notes to Consolidated Financial Statements (unaudited) | ||||||||
| Unpaid | Unpaid | |||||||||||||||||||||||||||||||||||||||||||||||||||||||||||||||||||||||||||||||||
| Recorded Balance | Principal Balance | Specific Allowance | Recorded Balance | Principal Balance | Specific Allowance | |||||||||||||||||||||||||||||||||||||||||||||||||||||||||||||||||||||||||||||
| (Dollars in thousands) | (Dollars in thousands) | |||||||||||||||||||||||||||||||||||||||||||||||||||||||||||||||||||||||||||||||||
| December 31, 2019 | December 31, 2019 | December 31, 2019 | ||||||||||||||||||||||||||||||||||||||||||||||||||||||||||||||||||||||||||||||||
| Loans without a specific valuation | Loans without a specific valuation | Loans without a specific valuation | ||||||||||||||||||||||||||||||||||||||||||||||||||||||||||||||||||||||||||||||||
| Commercial | Commercial | $ | 35,846 | $ | 35,846 | $ | — | Commercial | $ | 35,846 | $ | 35,846 | $ | — | ||||||||||||||||||||||||||||||||||||||||||||||||||||||||||||||||||||
| Energy | Energy | 2,864 | 2,864 | — | Energy | 2,864 | 2,864 | — | ||||||||||||||||||||||||||||||||||||||||||||||||||||||||||||||||||||||||||
| Commercial real estate | Commercial real estate | 9,464 | 9,464 | — | Commercial real estate | 9,464 | 9,464 | — | ||||||||||||||||||||||||||||||||||||||||||||||||||||||||||||||||||||||||||
| Construction and land development | Construction and land development | — | — | — | Construction and land development | — | — | — | ||||||||||||||||||||||||||||||||||||||||||||||||||||||||||||||||||||||||||
| Residential real estate | Residential real estate | 2,139 | 2,139 | — | Residential real estate | 2,139 | 2,139 | — | ||||||||||||||||||||||||||||||||||||||||||||||||||||||||||||||||||||||||||
| PPP | PPP | — | — | — | ||||||||||||||||||||||||||||||||||||||||||||||||||||||||||||||||||||||||||||||
| Consumer | Consumer | — | — | — | Consumer | — | — | — | ||||||||||||||||||||||||||||||||||||||||||||||||||||||||||||||||||||||||||
| Loans with a specific valuation | Loans with a specific valuation | Loans with a specific valuation | ||||||||||||||||||||||||||||||||||||||||||||||||||||||||||||||||||||||||||||||||
| Commercial | Commercial | 35,030 | 40,030 | 19,942 | Commercial | 35,030 | 40,030 | 19,942 | ||||||||||||||||||||||||||||||||||||||||||||||||||||||||||||||||||||||||||
| Energy | Energy | 6,880 | 9,880 | 1,949 | Energy | 6,880 | 9,880 | 1,949 | ||||||||||||||||||||||||||||||||||||||||||||||||||||||||||||||||||||||||||
| Commercial real estate | Commercial real estate | 1,028 | 1,028 | 210 | Commercial real estate | 1,028 | 1,028 | 210 | ||||||||||||||||||||||||||||||||||||||||||||||||||||||||||||||||||||||||||
| Construction and land development | Construction and land development | — | — | — | Construction and land development | — | — | — | ||||||||||||||||||||||||||||||||||||||||||||||||||||||||||||||||||||||||||
| Residential real estate | Residential real estate | 249 | 249 | 197 | Residential real estate | 249 | 249 | 197 | ||||||||||||||||||||||||||||||||||||||||||||||||||||||||||||||||||||||||||
| PPP | PPP | — | — | — | ||||||||||||||||||||||||||||||||||||||||||||||||||||||||||||||||||||||||||||||
| Consumer | Consumer | — | — | — | Consumer | — | — | — | ||||||||||||||||||||||||||||||||||||||||||||||||||||||||||||||||||||||||||
| Total | Total | Total | ||||||||||||||||||||||||||||||||||||||||||||||||||||||||||||||||||||||||||||||||
| Commercial | Commercial | 70,876 | 75,876 | 19,942 | Commercial | 70,876 | 75,876 | 19,942 | ||||||||||||||||||||||||||||||||||||||||||||||||||||||||||||||||||||||||||
| Energy | Energy | 9,744 | 12,744 | 1,949 | Energy | 9,744 | 12,744 | 1,949 | ||||||||||||||||||||||||||||||||||||||||||||||||||||||||||||||||||||||||||
| Commercial real estate | Commercial real estate | 10,492 | 10,492 | 210 | Commercial real estate | 10,492 | 10,492 | 210 | ||||||||||||||||||||||||||||||||||||||||||||||||||||||||||||||||||||||||||
| Construction and land development | Construction and land development | — | — | — | Construction and land development | — | — | — | ||||||||||||||||||||||||||||||||||||||||||||||||||||||||||||||||||||||||||
| Residential real estate | Residential real estate | 2,388 | 2,388 | 197 | Residential real estate | 2,388 | 2,388 | 197 | ||||||||||||||||||||||||||||||||||||||||||||||||||||||||||||||||||||||||||
| PPP | PPP | — | — | — | ||||||||||||||||||||||||||||||||||||||||||||||||||||||||||||||||||||||||||||||
| Consumer | Consumer | — | — | — | Consumer | — | — | — | ||||||||||||||||||||||||||||||||||||||||||||||||||||||||||||||||||||||||||
| $ | 93,500 | $ | 101,500 | $ | 22,298 | $ | 93,500 | $ | 101,500 | $ | 22,298 | |||||||||||||||||||||||||||||||||||||||||||||||||||||||||||||||||||||||
| Three months ended | Three Months Ended | Six Months Ended | ||||||||||||||||||||||||||||||||||||||||||||||||||||||||||||||||||||||||||
| March 31, | June 30, | June 30, | ||||||||||||||||||||||||||||||||||||||||||||||||||||||||||||||||||||||||||
| 2020 | 2019 | 2020 | 2019 | 2020 | 2019 | |||||||||||||||||||||||||||||||||||||||||||||||||||||||||||||||||||||||
| (Dollars in thousands) | (Dollars in thousands) | |||||||||||||||||||||||||||||||||||||||||||||||||||||||||||||||||||||||||||
| Commercial | Commercial | $ | 910 | $ | 1,285 | Commercial | $ | 27 | $ | 781 | $ | 88 | $ | 1,564 | ||||||||||||||||||||||||||||||||||||||||||||||||||||||||||||||
| Energy | Energy | 122 | 152 | Energy | 46 | 53 | 210 | 109 | ||||||||||||||||||||||||||||||||||||||||||||||||||||||||||||||||||||
| Commercial real estate | Commercial real estate | 123 | 254 | Commercial real estate | 58 | 278 | 135 | 532 | ||||||||||||||||||||||||||||||||||||||||||||||||||||||||||||||||||||
| Construction and land development | Construction and land development | — | — | Construction and land development | — | — | — | 1 | ||||||||||||||||||||||||||||||||||||||||||||||||||||||||||||||||||||
| Residential real estate | Residential real estate | 40 | 11 | Residential real estate | 35 | 10 | 74 | 21 | ||||||||||||||||||||||||||||||||||||||||||||||||||||||||||||||||||||
| PPP | PPP | — | — | — | — | |||||||||||||||||||||||||||||||||||||||||||||||||||||||||||||||||||||||
| Consumer | Consumer | — | — | Consumer | — | — | — | — | ||||||||||||||||||||||||||||||||||||||||||||||||||||||||||||||||||||
| Total interest income recognized | Total interest income recognized | $ | 1,195 | $ | 1,702 | Total interest income recognized | $ | 166 | $ | 1,122 | $ | 507 | $ | 2,227 | ||||||||||||||||||||||||||||||||||||||||||||||||||||||||||||||
| Notes to Consolidated Financial Statements (unaudited) | ||||||||
| Three months ended | Three Months Ended | Six Months Ended | ||||||||||||||||||||||||||||||||||||||||||||||||||||||||||||||||||||||||||
| March 31, | June 30, | June 30, | ||||||||||||||||||||||||||||||||||||||||||||||||||||||||||||||||||||||||||
| 2020 | 2019 | 2020 | 2019 | 2020 | 2019 | |||||||||||||||||||||||||||||||||||||||||||||||||||||||||||||||||||||||
| (Dollars in thousands) | (Dollars in thousands) | |||||||||||||||||||||||||||||||||||||||||||||||||||||||||||||||||||||||||||
| Commercial | Commercial | $ | 86,626 | $ | 77,698 | Commercial | $ | 11,793 | $ | 50,732 | $ | 19,002 | $ | 74,259 | ||||||||||||||||||||||||||||||||||||||||||||||||||||||||||||||
| Energy | Energy | 16,976 | 15,986 | Energy | 16,798 | 12,534 | 17,527 | 13,850 | ||||||||||||||||||||||||||||||||||||||||||||||||||||||||||||||||||||
| Commercial real estate | Commercial real estate | 14,927 | 14,073 | Commercial real estate | 10,958 | 13,779 | 11,044 | 14,661 | ||||||||||||||||||||||||||||||||||||||||||||||||||||||||||||||||||||
| Construction and land development | Construction and land development | — | — | Construction and land development | — | 50 | — | 25 | ||||||||||||||||||||||||||||||||||||||||||||||||||||||||||||||||||||
| Residential real estate | Residential real estate | 5,230 | 2,157 | Residential real estate | 7,171 | 2,665 | 6,953 | 2,428 | ||||||||||||||||||||||||||||||||||||||||||||||||||||||||||||||||||||
| PPP | PPP | — | — | — | — | |||||||||||||||||||||||||||||||||||||||||||||||||||||||||||||||||||||||
| Consumer | Consumer | 254 | — | Consumer | 251 | — | 253 | — | ||||||||||||||||||||||||||||||||||||||||||||||||||||||||||||||||||||
| Total average impaired loans | Total average impaired loans | $ | 124,013 | $ | 109,914 | Total average impaired loans | $ | 46,971 | $ | 79,760 | $ | 54,779 | $ | 105,223 | ||||||||||||||||||||||||||||||||||||||||||||||||||||||||||||||
| March 31, 2020 | December 31, 2019 | June 30, 2020 | December 31, 2019 | |||||||||||||||||||||||||||||||
| (Dollars in thousands) | (Dollars in thousands) | |||||||||||||||||||||||||||||||||
| Commercial | Commercial | $ | 10,352 | $ | 32,130 | Commercial | $ | 10,966 | $ | 32,130 | ||||||||||||||||||||||||
| Energy | Energy | 8,265 | 4,540 | Energy | 15,384 | 4,540 | ||||||||||||||||||||||||||||
| Commercial real estate | Commercial real estate | 5,443 | 1,063 | Commercial real estate | 7,000 | 1,063 | ||||||||||||||||||||||||||||
| Construction and land development | Construction and land development | — | — | Construction and land development | — | — | ||||||||||||||||||||||||||||
| Residential real estate | Residential real estate | 1,941 | 1,942 | Residential real estate | 3,935 | 1,942 | ||||||||||||||||||||||||||||
| PPP | PPP | — | — | |||||||||||||||||||||||||||||||
| Consumer | Consumer | 254 | — | Consumer | 249 | — | ||||||||||||||||||||||||||||
| Total non-accrual loans | Total non-accrual loans | $ | 26,255 | $ | 39,675 | Total non-accrual loans | $ | 37,534 | $ | 39,675 | ||||||||||||||||||||||||
| Notes to Consolidated Financial Statements (unaudited) | ||||||||
| Three Months Ended | Six Months Ended | |||||||||||||||||||||||||||||||||||||||||||||||||||||||||||||||||||||
| Three Months Ended | June 30, | June 30, | June 30, | June 30, | ||||||||||||||||||||||||||||||||||||||||||||||||||||||||||||||||||
| March 31, 2020 | March 31, 2019 | 2020 | 2019 | 2020 | 2019 | |||||||||||||||||||||||||||||||||||||||||||||||||||||||||||||||||
| (Dollars in thousands) | (Dollars in thousands) | |||||||||||||||||||||||||||||||||||||||||||||||||||||||||||||||||||||
| Commercial | Commercial | Commercial | ||||||||||||||||||||||||||||||||||||||||||||||||||||||||||||||||||||
| - Interest rate reduction | - Interest rate reduction | $ | 3,171 | $ | — | - Interest rate reduction | $ | — | $ | — | $ | 3,171 | $ | — | ||||||||||||||||||||||||||||||||||||||||||||||||||||||||
| - Reduction of monthly payment | - Reduction of monthly payment | — | 4,761 | - Reduction of monthly payment | — | — | — | 994 | ||||||||||||||||||||||||||||||||||||||||||||||||||||||||||||||
| - Extension of maturity date | - Extension of maturity date | — | 30,005 | — | 30,005 | |||||||||||||||||||||||||||||||||||||||||||||||||||||||||||||||||
| Energy | Energy | Energy | ||||||||||||||||||||||||||||||||||||||||||||||||||||||||||||||||||||
| - Extension of maturity date | - Extension of maturity date | 2,340 | — | - Extension of maturity date | — | — | 2,340 | — | ||||||||||||||||||||||||||||||||||||||||||||||||||||||||||||||
| Commercial real estate | Commercial real estate | |||||||||||||||||||||||||||||||||||||||||||||||||||||||||||||||||||||
| - Reduction of monthly payment | - Reduction of monthly payment | — | — | — | 3,767 | |||||||||||||||||||||||||||||||||||||||||||||||||||||||||||||||||
| Residential real estate | Residential real estate | |||||||||||||||||||||||||||||||||||||||||||||||||||||||||||||||||||||
| - Payment deferral | - Payment deferral | 65 | — | 65 | — | |||||||||||||||||||||||||||||||||||||||||||||||||||||||||||||||||
| Total troubled debt restructurings | $ | 5,511 | $ | 4,761 | ||||||||||||||||||||||||||||||||||||||||||||||||||||||||||||||||||
| Total troubled debt restructurings during applicable period | Total troubled debt restructurings during applicable period | $ | 65 | $ | 30,005 | $ | 5,576 | $ | 34,766 | |||||||||||||||||||||||||||||||||||||||||||||||||||||||||||||
| March 31, 2020 | December 31, 2019 | June 30, 2020 | December 31, 2019 | |||||||||||||||||||||||||||||||||||||||||||||||||||||||||||||||||||||||||||||||||||||||||||||||||||||||||||||||||||||||||||||||||||||
| Number of Loans | Outstanding Balance | Balance 90 days past due at any time during previous 12 months(1) | Number of Loans | Outstanding Balance | Balance 90 days past due at any time during previous 12 months(1) | Number of Loans | Outstanding Balance | Balance 90 days past due at any time during previous 12 months(1) | Number of Loans | Outstanding Balance | Balance 90 days past due at any time during previous 12 months(1) | |||||||||||||||||||||||||||||||||||||||||||||||||||||||||||||||||||||||||||||||||||||||||||||||||||||||||||||||||||||||||||||
| (Dollars in thousands) | (Dollars in thousands) | |||||||||||||||||||||||||||||||||||||||||||||||||||||||||||||||||||||||||||||||||||||||||||||||||||||||||||||||||||||||||||||||||||||||
| Commercial | Commercial | 6 | $ | 9,966 | $ | 842 | 7 | $ | 31,770 | $ | 831 | Commercial | 6 | $ | 9,657 | $ | 842 | 7 | $ | 31,770 | $ | 831 | ||||||||||||||||||||||||||||||||||||||||||||||||||||||||||||||||||||||||||||||||||||||||||||||||||||||||||||||||||
| Energy | Energy | 3 | 5,100 | — | 2 | 2,864 | — | Energy | 3 | 4,032 | — | 2 | 2,864 | — | ||||||||||||||||||||||||||||||||||||||||||||||||||||||||||||||||||||||||||||||||||||||||||||||||||||||||||||||||||||||||||
| Commercial real estate | Commercial real estate | 3 | 4,772 | — | 3 | 4,909 | — | Commercial real estate | 3 | 4,749 | — | 3 | 4,909 | — | ||||||||||||||||||||||||||||||||||||||||||||||||||||||||||||||||||||||||||||||||||||||||||||||||||||||||||||||||||||||||||
| Construction and land development | Construction and land development | — | — | — | — | — | — | Construction and land development | — | — | — | — | — | — | ||||||||||||||||||||||||||||||||||||||||||||||||||||||||||||||||||||||||||||||||||||||||||||||||||||||||||||||||||||||||||
| Residential real estate | Residential real estate | 1 | 3,000 | — | — | — | — | Residential real estate | 2 | 3,065 | — | — | — | — | ||||||||||||||||||||||||||||||||||||||||||||||||||||||||||||||||||||||||||||||||||||||||||||||||||||||||||||||||||||||||||
| PPP | PPP | — | — | — | — | — | — | |||||||||||||||||||||||||||||||||||||||||||||||||||||||||||||||||||||||||||||||||||||||||||||||||||||||||||||||||||||||||||||||||
| Consumer | Consumer | — | — | — | — | — | — | Consumer | — | — | — | — | — | — | ||||||||||||||||||||||||||||||||||||||||||||||||||||||||||||||||||||||||||||||||||||||||||||||||||||||||||||||||||||||||||
| Total restructured loans | 13 | $ | 22,838 | $ | 842 | 12 | $ | 39,543 | $ | 831 | ||||||||||||||||||||||||||||||||||||||||||||||||||||||||||||||||||||||||||||||||||||||||||||||||||||||||||||||||||||||||||||||
| Total troubled debt restructured loans | Total troubled debt restructured loans | 14 | $ | 21,503 | $ | 842 | 12 | $ | 39,543 | $ | 831 | |||||||||||||||||||||||||||||||||||||||||||||||||||||||||||||||||||||||||||||||||||||||||||||||||||||||||||||||||||||||||||||
(1) Default is considered to mean 90 days or more past due as to interest or principal. | (1) Default is considered to mean 90 days or more past due as to interest or principal. | (1) Default is considered to mean 90 days or more past due as to interest or principal. | ||||||||||||||||||||||||||||||||||||||||||||||||||||||||||||||||||||||||||||||||||||||||||||||||||||||||||||||||||||||||||||||||||||||
| Notes to Consolidated Financial Statements (unaudited) | ||||||||
| March 31, 2020 | December 31, 2019 | June 30, 2020 | December 31, 2019 | |||||||||||||||||||||||||||||||||||||||||||||||||||||||||||||||||||||||||||||||
| Product | Product | Number of Instruments | Notional Amount | Number of Instruments | Notional Amount | Product | Number of Instruments | Notional Amount | Number of Instruments | Notional Amount | ||||||||||||||||||||||||||||||||||||||||||||||||||||||||||||||||||||||||
| (Dollars in thousands) | (Dollars in thousands) | |||||||||||||||||||||||||||||||||||||||||||||||||||||||||||||||||||||||||||||||||
| Back-to-back swaps | Back-to-back swaps | 58 | $ | 440,617 | 56 | $ | 380,050 | Back-to-back swaps | 58 | $ | 487,255 | 56 | $ | 380,050 | ||||||||||||||||||||||||||||||||||||||||||||||||||||||||||||||||||||
| Asset Derivatives | Liability Derivatives | Asset Derivatives | Liability Derivatives | |||||||||||||||||||||||||||||||||||||||||||||||||||||||||||||||||||||||||||||||||||||||||||||||||||||||||||||||||||||||||||||||
| Balance Sheet | March 31, | December 31, | Balance Sheet | March 31, | December 31, | Balance Sheet | June 30, | December 31, | Balance Sheet | June 30, | December 31, | |||||||||||||||||||||||||||||||||||||||||||||||||||||||||||||||||||||||||||||||||||||||||||||||||||||||||||||||||||||||
| Location | 2020 | 2019 | Location | 2020 | 2019 | Location | 2020 | 2019 | Location | 2020 | 2019 | |||||||||||||||||||||||||||||||||||||||||||||||||||||||||||||||||||||||||||||||||||||||||||||||||||||||||||||||||||||||
| (Dollars in thousands) | (Dollars in thousands) | |||||||||||||||||||||||||||||||||||||||||||||||||||||||||||||||||||||||||||||||||||||||||||||||||||||||||||||||||||||||||||||||||
| Derivatives not designated as hedging instruments | Derivatives not designated as hedging instruments | Derivatives not designated as hedging instruments | ||||||||||||||||||||||||||||||||||||||||||||||||||||||||||||||||||||||||||||||||||||||||||||||||||||||||||||||||||||||||||||||||
| Interest rate products | Interest rate products | Other assets | $ | 28,041 | $ | 9,838 | Other liabilities | $ | 28,139 | $ | 9,907 | Interest rate products | Other assets | $ | 29,302 | $ | 9,838 | Other liabilities | $ | 29,432 | $ | 9,907 | ||||||||||||||||||||||||||||||||||||||||||||||||||||||||||||||||||||||||||||||||||||||||||||||||||||||||||||
| March 31, 2020 | ||||||||||||||||||||||||||||||||||||||||||||||||||||||||||||||||||||||||||||||||||||||||||||||||||||||||||||||||||||||||||||||||||||||||
| June 30, 2020 | June 30, 2020 | |||||||||||||||||||||||||||||||||||||||||||||||||||||||||||||||||||||||||||||||||||||||||||||||||||||||||||||||||||||||||||||||||||||||
| (Dollars in thousands) | (Dollars in thousands) | (Dollars in thousands) | ||||||||||||||||||||||||||||||||||||||||||||||||||||||||||||||||||||||||||||||||||||||||||||||||||||||||||||||||||||||||||||||||||||||
| Gross Amounts Not Offset in the Statement of Financial Position | Gross Amounts Not Offset in the Statement of Financial Position | |||||||||||||||||||||||||||||||||||||||||||||||||||||||||||||||||||||||||||||||||||||||||||||||||||||||||||||||||||||||||||||||||||||||
| Gross Amounts of Recognized Assets and Liabilities | Gross Amounts Offset in the Statement of Financial Position | Net Amounts of Assets presented in the Statement of Financial Position | Financial Instruments | Cash Collateral Received | Net Amount | Gross Amounts of Recognized Assets and Liabilities | Gross Amounts Offset in the Statement of Financial Position | Net Amounts of Assets presented in the Statement of Financial Position | Financial Instruments | Cash Collateral Received | Net Amount | |||||||||||||||||||||||||||||||||||||||||||||||||||||||||||||||||||||||||||||||||||||||||||||||||||||||||||||||||||||||||||||
| Offsetting of derivative assets | Offsetting of derivative assets | Offsetting of derivative assets | ||||||||||||||||||||||||||||||||||||||||||||||||||||||||||||||||||||||||||||||||||||||||||||||||||||||||||||||||||||||||||||||||||||||
| Derivatives | Derivatives | $ | 28,041 | $ | — | $ | 28,041 | $ | 7 | $ | — | $ | 28,034 | Derivatives | $ | 29,302 | $ | — | $ | 29,302 | $ | 8 | $ | — | $ | 29,294 | ||||||||||||||||||||||||||||||||||||||||||||||||||||||||||||||||||||||||||||||||||||||||||||||||||||||||||||||
| Offsetting of derivative liabilities | Offsetting of derivative liabilities | Offsetting of derivative liabilities | ||||||||||||||||||||||||||||||||||||||||||||||||||||||||||||||||||||||||||||||||||||||||||||||||||||||||||||||||||||||||||||||||||||||
| Derivatives | Derivatives | $ | 28,139 | $ | — | $ | 28,139 | $ | 7 | $ | — | $ | 28,132 | Derivatives | $ | 29,432 | $ | — | $ | 29,432 | $ | 8 | $ | — | $ | 29,424 | ||||||||||||||||||||||||||||||||||||||||||||||||||||||||||||||||||||||||||||||||||||||||||||||||||||||||||||||
| December 31, 2019 | ||||||||||||||||||||||||||||||||||||||||||||||||||||||||||||||||||||
| (Dollars in thousands) | ||||||||||||||||||||||||||||||||||||||||||||||||||||||||||||||||||||
| Gross Amounts Not Offset in the Statement of Financial Position | ||||||||||||||||||||||||||||||||||||||||||||||||||||||||||||||||||||
| Gross Amounts of Recognized Assets and Liabilities | Gross Amounts Offset in the Statement of Financial Position | Net Amounts of Assets presented in the Statement of Financial Position | Financial Instruments | Cash Collateral Received | Net Amount | |||||||||||||||||||||||||||||||||||||||||||||||||||||||||||||||
| Offsetting of derivative assets | ||||||||||||||||||||||||||||||||||||||||||||||||||||||||||||||||||||
| Derivatives | $ | 9,838 | $ | — | $ | 9,838 | $ | 97 | $ | — | $ | 9,741 | ||||||||||||||||||||||||||||||||||||||||||||||||||||||||
| Offsetting of derivative liabilities | ||||||||||||||||||||||||||||||||||||||||||||||||||||||||||||||||||||
| Derivatives | $ | 9,907 | $ | — | $ | 9,907 | $ | 97 | $ | — | $ | 9,810 | ||||||||||||||||||||||||||||||||||||||||||||||||||||||||
| Notes to Consolidated Financial Statements (unaudited) | ||||||||
| December 31, 2019 | ||||||||||||||||||||||||||||||||||||||||||||||||||||||||||||||||||||
| (Dollars in thousands) | ||||||||||||||||||||||||||||||||||||||||||||||||||||||||||||||||||||
| Gross Amounts Not Offset in the Statement of Financial Position | ||||||||||||||||||||||||||||||||||||||||||||||||||||||||||||||||||||
| Gross Amounts of Recognized Assets and Liabilities | Gross Amounts Offset in the Statement of Financial Position | Net Amounts of Assets presented in the Statement of Financial Position | Financial Instruments | Cash Collateral Received | Net Amount | |||||||||||||||||||||||||||||||||||||||||||||||||||||||||||||||
| Offsetting of derivative assets | ||||||||||||||||||||||||||||||||||||||||||||||||||||||||||||||||||||
| Derivatives | $ | 9,838 | �� | $ | — | $ | 9,838 | $ | 97 | $ | — | $ | 9,741 | |||||||||||||||||||||||||||||||||||||||||||||||||||||||
| Offsetting of derivative liabilities | ||||||||||||||||||||||||||||||||||||||||||||||||||||||||||||||||||||
| Derivatives | $ | 9,907 | $ | — | $ | 9,907 | $ | 97 | $ | — | $ | 9,810 | ||||||||||||||||||||||||||||||||||||||||||||||||||||||||
| Goodwill | Core Deposit Intangible | Total Intangible Assets | ||||||||||||||||||||||||||||||
| (Dollars in thousands) | ||||||||||||||||||||||||||||||||
| Balance at December 31, 2019 | $ | 7,397 | $ | 297 | $ | 7,694 | ||||||||||||||||||||||||||
| Impairment | (7,397) | — | (7,397) | |||||||||||||||||||||||||||||
| Amortization | — | (50) | (50) | |||||||||||||||||||||||||||||
| Balance at June 30, 2020 | $ | — | $ | 247 | $ | 247 | ||||||||||||||||||||||||||
| March 31, 2020 | June 30, 2020 | |||||||||||||||||||||||||||||||||||||||||||||||||||||||||||||||||||||||||||||||||||||||||||||||||||||||||||||||||||||||||||||||||||||||||||||||||||||||||||||||
| Within One Year | One to Two Years | Two to Three Years | Three to Four Years | Four to Five Years | After Five Years | Total | Within One Year | One to Two Years | Two to Three Years | Three to Four Years | Four to Five Years | After Five Years | Total | |||||||||||||||||||||||||||||||||||||||||||||||||||||||||||||||||||||||||||||||||||||||||||||||||||||||||||||||||||||||||||||||||||||||||||||||||||
| (Dollars in thousands) | (Dollars in thousands) | |||||||||||||||||||||||||||||||||||||||||||||||||||||||||||||||||||||||||||||||||||||||||||||||||||||||||||||||||||||||||||||||||||||||||||||||||||||||||||||||
| Time deposits | Time deposits | $ | 830,347 | $ | 119,398 | $ | 105,246 | $ | 39,557 | $ | 8,394 | $ | 120 | $ | 1,103,062 | Time deposits | $ | 932,443 | $ | 97,992 | $ | 93,074 | $ | 36,085 | $ | 781 | $ | 166 | $ | 1,160,541 | ||||||||||||||||||||||||||||||||||||||||||||||||||||||||||||||||||||||||||||||||||||||||||||||||||||||||||||||||||||||||||||||||||
| Fed funds purchased & repurchase agreements | Fed funds purchased & repurchase agreements | 38,946 | — | — | — | — | — | 38,946 | Fed funds purchased & repurchase agreements | 49,881 | — | — | — | — | — | 49,881 | ||||||||||||||||||||||||||||||||||||||||||||||||||||||||||||||||||||||||||||||||||||||||||||||||||||||||||||||||||||||||||||||||||||||||||||||||
| FHLB borrowings | FHLB borrowings | 85,000 | 51,500 | 11,080 | 35,000 | — | 220,100 | 402,680 | FHLB borrowings | 163,000 | 21,500 | 46,017 | — | 5,100 | 215,000 | 450,617 | ||||||||||||||||||||||||||||||||||||||||||||||||||||||||||||||||||||||||||||||||||||||||||||||||||||||||||||||||||||||||||||||||||||||||||||||||
Trust preferred securities(1) | Trust preferred securities(1) | — | — | — | — | — | 931 | 931 | Trust preferred securities(1) | — | — | — | — | — | 942 | 942 | ||||||||||||||||||||||||||||||||||||||||||||||||||||||||||||||||||||||||||||||||||||||||||||||||||||||||||||||||||||||||||||||||||||||||||||||||
| $ | 954,293 | $ | 170,898 | $ | 116,326 | $ | 74,557 | $ | 8,394 | $ | 221,151 | $ | 1,545,619 | $ | 1,145,324 | $ | 119,492 | $ | 139,091 | $ | 36,085 | $ | 5,881 | $ | 216,108 | $ | 1,661,981 | |||||||||||||||||||||||||||||||||||||||||||||||||||||||||||||||||||||||||||||||||||||||||||||||||||||||||||||||||||||||||||||||||||||
| Three Months Ended | Three Months Ended | Six Months Ended | ||||||||||||||||||||||||||||||||||||||||||||||||||||||||||||||||||||||||||||||||
| March 31, | Affected Line Item in the | June 30, | June 30, | Affected Line Item in the | ||||||||||||||||||||||||||||||||||||||||||||||||||||||||||||||||||||||||||||||
| 2020 | 2019 | Statements of Income | 2020 | 2019 | 2020 | 2019 | Statements of Operations | |||||||||||||||||||||||||||||||||||||||||||||||||||||||||||||||||||||||||||
| (Dollars in thousands) | (Dollars in thousands) | |||||||||||||||||||||||||||||||||||||||||||||||||||||||||||||||||||||||||||||||||
| Unrealized gains on available-for-sale securities | Unrealized gains on available-for-sale securities | $ | 393 | $ | 53 | Gain on sale of available-for-sale securities | Unrealized gains on available-for-sale securities | $ | 320 | $ | 406 | $ | 713 | $ | 433 | Gain on sale of available-for-sale securities | ||||||||||||||||||||||||||||||||||||||||||||||||||||||||||||||||||
| Amount reclassified before tax | Amount reclassified before tax | 393 | 53 | Amount reclassified before tax | 320 | 406 | 713 | 433 | ||||||||||||||||||||||||||||||||||||||||||||||||||||||||||||||||||||||||||
| Less: tax effect | Less: tax effect | 96 | 13 | Income tax expense | Less: tax effect | 78 | 100 | 174 | 107 | Income tax expense | ||||||||||||||||||||||||||||||||||||||||||||||||||||||||||||||||||||||||
| Net reclassified amount | Net reclassified amount | $ | 297 | $ | 40 | Net reclassified amount | $ | 242 | $ | 306 | $ | 539 | $ | 326 | ||||||||||||||||||||||||||||||||||||||||||||||||||||||||||||||||||||
| Notes to Consolidated Financial Statements (unaudited) | ||||||||
| Actual | Minimum Capital Required - Basel III Fully Phased-In | Required to be Considered Well Capitalized | Actual | Minimum Capital Required - Basel III Fully Phased-In | Required to be Considered Well Capitalized | |||||||||||||||||||||||||||||||||||||||||||||||||||||||||||||||||||||||||||||||||||||||||||||||||||||||||||||||||||||||||||||||||||||||||||||||||||||
| Amount | Ratio | Amount | Ratio | Amount | Ratio | Amount | Ratio | Amount | Ratio | Amount | Ratio | |||||||||||||||||||||||||||||||||||||||||||||||||||||||||||||||||||||||||||||||||||||||||||||||||||||||||||||||||||||||||||||||||||||||||||||||
| (Dollars in thousands) | (Dollars in thousands) | |||||||||||||||||||||||||||||||||||||||||||||||||||||||||||||||||||||||||||||||||||||||||||||||||||||||||||||||||||||||||||||||||||||||||||||||||||||||||
| March 31, 2020 | ||||||||||||||||||||||||||||||||||||||||||||||||||||||||||||||||||||||||||||||||||||||||||||||||||||||||||||||||||||||||||||||||||||||||||||||||||||||||||
| June 30, 2020 | June 30, 2020 | |||||||||||||||||||||||||||||||||||||||||||||||||||||||||||||||||||||||||||||||||||||||||||||||||||||||||||||||||||||||||||||||||||||||||||||||||||||||||
| Total Capital to Risk-Weighted Assets | Total Capital to Risk-Weighted Assets | Total Capital to Risk-Weighted Assets | ||||||||||||||||||||||||||||||||||||||||||||||||||||||||||||||||||||||||||||||||||||||||||||||||||||||||||||||||||||||||||||||||||||||||||||||||||||||||
| Consolidated | Consolidated | $ | 634,335 | 13.2 | % | $ | 505,786 | 10.5 | % | N/A | N/A | Consolidated | $ | 642,345 | 13.3 | % | $ | 508,386 | 10.5 | % | N/A | N/A | ||||||||||||||||||||||||||||||||||||||||||||||||||||||||||||||||||||||||||||||||||||||||||||||||||||||||||||||||||||||||||||||||||||
| Bank | Bank | 580,631 | 12.1 | 505,649 | 10.5 | $ | 481,571 | 10.0 | % | Bank | 591,096 | 12.2 | 508,256 | 10.5 | $ | 484,053 | 10.0 | % | ||||||||||||||||||||||||||||||||||||||||||||||||||||||||||||||||||||||||||||||||||||||||||||||||||||||||||||||||||||||||||||||||||||||||
| Tier I Capital to Risk-Weighted Assets | Tier I Capital to Risk-Weighted Assets | Tier I Capital to Risk-Weighted Assets | ||||||||||||||||||||||||||||||||||||||||||||||||||||||||||||||||||||||||||||||||||||||||||||||||||||||||||||||||||||||||||||||||||||||||||||||||||||||||
| Consolidated | Consolidated | 582,877 | 12.1 | 409,446 | 8.5 | N/A | N/A | Consolidated | 581,634 | 12.0 | 411,551 | 8.5 | N/A | N/A | ||||||||||||||||||||||||||||||||||||||||||||||||||||||||||||||||||||||||||||||||||||||||||||||||||||||||||||||||||||||||||||||||||||||||||||
| Bank | Bank | 529,172 | 11.0 | 409,335 | 8.5 | 385,257 | 8.0 | Bank | 530,458 | 11.0 | 411,445 | 8.5 | 387,242 | 8.0 | ||||||||||||||||||||||||||||||||||||||||||||||||||||||||||||||||||||||||||||||||||||||||||||||||||||||||||||||||||||||||||||||||||||||||||||
| Common Equity Tier 1 to Risk-Weighted Assets | Common Equity Tier 1 to Risk-Weighted Assets | Common Equity Tier 1 to Risk-Weighted Assets | ||||||||||||||||||||||||||||||||||||||||||||||||||||||||||||||||||||||||||||||||||||||||||||||||||||||||||||||||||||||||||||||||||||||||||||||||||||||||
| Consolidated | Consolidated | 581,946 | 12.1 | 337,191 | 7.0 | N/A | N/A | Consolidated | 580,692 | 12.0 | 338,924 | 7.0 | N/A | N/A | ||||||||||||||||||||||||||||||||||||||||||||||||||||||||||||||||||||||||||||||||||||||||||||||||||||||||||||||||||||||||||||||||||||||||||||
| Bank | Bank | 529,172 | 11.0 | 337,100 | 7.0 | 313,021 | 6.5 | Bank | 530,458 | 11.0 | 338,837 | 7.0 | 314,634 | 6.5 | ||||||||||||||||||||||||||||||||||||||||||||||||||||||||||||||||||||||||||||||||||||||||||||||||||||||||||||||||||||||||||||||||||||||||||||
| Tier I Capital to Average Assets | Tier I Capital to Average Assets | Tier I Capital to Average Assets | ||||||||||||||||||||||||||||||||||||||||||||||||||||||||||||||||||||||||||||||||||||||||||||||||||||||||||||||||||||||||||||||||||||||||||||||||||||||||
| Consolidated | Consolidated | 582,877 | 11.8 | 197,473 | 4.0 | N/A | N/A | Consolidated | 581,634 | 10.7 | 216,445 | 4.0 | N/A | N/A | ||||||||||||||||||||||||||||||||||||||||||||||||||||||||||||||||||||||||||||||||||||||||||||||||||||||||||||||||||||||||||||||||||||||||||||
| Bank | Bank | $ | 529,172 | 10.7 | % | $ | 197,437 | 4.0 | % | $ | 246,796 | 5.0 | % | Bank | $ | 530,458 | 9.8 | % | $ | 216,457 | 4.0 | % | $ | 270,571 | 5.0 | % | ||||||||||||||||||||||||||||||||||||||||||||||||||||||||||||||||||||||||||||||||||||||||||||||||||||||||||||||||||||||||||||||||
| December 31, 2019 | December 31, 2019 | December 31, 2019 | ||||||||||||||||||||||||||||||||||||||||||||||||||||||||||||||||||||||||||||||||||||||||||||||||||||||||||||||||||||||||||||||||||||||||||||||||||||||||
| Total Capital to Risk-Weighted Assets | Total Capital to Risk-Weighted Assets | Total Capital to Risk-Weighted Assets | ||||||||||||||||||||||||||||||||||||||||||||||||||||||||||||||||||||||||||||||||||||||||||||||||||||||||||||||||||||||||||||||||||||||||||||||||||||||||
| Consolidated | Consolidated | $ | 633,228 | 13.4 | % | $ | 495,095 | 10.5 | % | N/A | N/A | Consolidated | $ | 633,228 | 13.4 | % | $ | 495,095 | 10.5 | % | N/A | N/A | ||||||||||||||||||||||||||||||||||||||||||||||||||||||||||||||||||||||||||||||||||||||||||||||||||||||||||||||||||||||||||||||||||||
| Bank | Bank | 581,600 | 12.3 | 494,954 | 10.5 | $ | 471,385 | 10.0 | % | Bank | 581,600 | 12.3 | 494,954 | 10.5 | $ | 471,385 | 10.0 | % | ||||||||||||||||||||||||||||||||||||||||||||||||||||||||||||||||||||||||||||||||||||||||||||||||||||||||||||||||||||||||||||||||||||||||
| Tier I Capital to Risk-Weighted Assets | Tier I Capital to Risk-Weighted Assets | Tier I Capital to Risk-Weighted Assets | ||||||||||||||||||||||||||||||||||||||||||||||||||||||||||||||||||||||||||||||||||||||||||||||||||||||||||||||||||||||||||||||||||||||||||||||||||||||||
| Consolidated | Consolidated | 576,332 | 12.2 | 400,791 | 8.5 | N/A | N/A | Consolidated | 576,332 | 12.2 | 400,791 | 8.5 | N/A | N/A | ||||||||||||||||||||||||||||||||||||||||||||||||||||||||||||||||||||||||||||||||||||||||||||||||||||||||||||||||||||||||||||||||||||||||||||
| Bank | Bank | 524,704 | 11.1 | 400,677 | 8.5 | 377,108 | 8.0 | Bank | 524,704 | 11.1 | 400,677 | 8.5 | 377,108 | 8.0 | ||||||||||||||||||||||||||||||||||||||||||||||||||||||||||||||||||||||||||||||||||||||||||||||||||||||||||||||||||||||||||||||||||||||||||||
| Common Equity Tier 1 to Risk-Weighted Assets | Common Equity Tier 1 to Risk-Weighted Assets | Common Equity Tier 1 to Risk-Weighted Assets | ||||||||||||||||||||||||||||||||||||||||||||||||||||||||||||||||||||||||||||||||||||||||||||||||||||||||||||||||||||||||||||||||||||||||||||||||||||||||
| Consolidated | Consolidated | 575,411 | 12.2 | 330,063 | 7.0 | N/A | N/A | Consolidated | 575,411 | 12.2 | 330,063 | 7.0 | N/A | N/A | ||||||||||||||||||||||||||||||||||||||||||||||||||||||||||||||||||||||||||||||||||||||||||||||||||||||||||||||||||||||||||||||||||||||||||||
| Bank | Bank | 524,704 | 11.1 | 329,970 | 7.0 | 306,400 | 6.5 | Bank | 524,704 | 11.1 | 329,970 | 7.0 | 306,400 | 6.5 | ||||||||||||||||||||||||||||||||||||||||||||||||||||||||||||||||||||||||||||||||||||||||||||||||||||||||||||||||||||||||||||||||||||||||||||
| Tier I Capital to Average Assets | Tier I Capital to Average Assets | Tier I Capital to Average Assets | ||||||||||||||||||||||||||||||||||||||||||||||||||||||||||||||||||||||||||||||||||||||||||||||||||||||||||||||||||||||||||||||||||||||||||||||||||||||||
| Consolidated | Consolidated | 576,332 | 12.1 | 191,099 | 4.0 | N/A | N/A | Consolidated | 576,332 | 12.1 | 191,099 | 4.0 | N/A | N/A | ||||||||||||||||||||||||||||||||||||||||||||||||||||||||||||||||||||||||||||||||||||||||||||||||||||||||||||||||||||||||||||||||||||||||||||
| Bank | Bank | $ | 524,704 | 11.0 | % | $ | 191,170 | 4.0 | % | $ | 238,963 | 5.0 | % | Bank | $ | 524,704 | 11.0 | % | $ | 191,170 | 4.0 | % | $ | 238,963 | 5.0 | % | ||||||||||||||||||||||||||||||||||||||||||||||||||||||||||||||||||||||||||||||||||||||||||||||||||||||||||||||||||||||||||||||||
| Notes to Consolidated Financial Statements (unaudited) | ||||||||
| Three Months Ended | Three Months Ended | Six Months Ended | ||||||||||||||||||||||||||||||||||||||||||||||||||||||||||||||||||||
| March 31, | June 30, | June 30, | ||||||||||||||||||||||||||||||||||||||||||||||||||||||||||||||||||||
| 2020 | 2019 | 2020 | 2019 | 2020 | 2019 | |||||||||||||||||||||||||||||||||||||||||||||||||||||||||||||||||
| (Dollars in thousands) | (Dollars in thousands) | |||||||||||||||||||||||||||||||||||||||||||||||||||||||||||||||||||||
| Stock appreciation rights | Stock appreciation rights | $ | 256 | $ | 259 | Stock appreciation rights | $ | 238 | $ | 271 | $ | 494 | $ | 530 | ||||||||||||||||||||||||||||||||||||||||||||||||||||||||
| Performance based stock awards | Performance based stock awards | 74 | 95 | Performance based stock awards | 22 | 155 | 96 | 250 | ||||||||||||||||||||||||||||||||||||||||||||||||||||||||||||||
| Restricted stock units and awards | Restricted stock units and awards | 604 | 744 | Restricted stock units and awards | 822 | 721 | 1,426 | 1,465 | ||||||||||||||||||||||||||||||||||||||||||||||||||||||||||||||
| Employee stock purchase plan | Employee stock purchase plan | — | 37 | Employee stock purchase plan | — | (1) | — | 36 | ||||||||||||||||||||||||||||||||||||||||||||||||||||||||||||||
| Total stock-based compensation | Total stock-based compensation | $ | 934 | $ | 1,135 | Total stock-based compensation | $ | 1,082 | $ | 1,146 | $ | 2,016 | $ | 2,281 | ||||||||||||||||||||||||||||||||||||||||||||||||||||||||
| Performance Based Stock Awards | Performance Based Stock Awards | |||||||||||||||||||||||||||||||||||||||
| Number of Shares | Weighted-Average Grant Date Fair Value | Number of Shares | Weighted-Average Grant Date Fair Value | |||||||||||||||||||||||||||||||||||||
| Nonvested, January 1, 2020 | 192,248 | $9.88 | ||||||||||||||||||||||||||||||||||||||
| Unvested, January 1, 2020 | Unvested, January 1, 2020 | 192,248 | $9.88 | |||||||||||||||||||||||||||||||||||||
| Granted | Granted | 41,283 | 13.55 | Granted | 41,283 | 13.55 | ||||||||||||||||||||||||||||||||||
| Vested | Vested | 0 | 0.00 | Vested | 0 | 0.00 | ||||||||||||||||||||||||||||||||||
| Forfeited | Forfeited | 0 | 0.00 | Forfeited | 0 | 0.00 | ||||||||||||||||||||||||||||||||||
| Nonvested, March 31, 2020 | 233,531 | $10.53 | ||||||||||||||||||||||||||||||||||||||
| Unvested, June 30, 2020 | Unvested, June 30, 2020 | 233,531 | $10.53 | |||||||||||||||||||||||||||||||||||||
| Restricted Stock Units and Awards | Restricted Stock Units and Awards | |||||||||||||||||||||||||||||||||||||||
| Number of Shares | Weighted-Average Grant Date Fair Value | Number of Shares | Weighted-Average Grant Date Fair Value | |||||||||||||||||||||||||||||||||||||
| Nonvested, January 1, 2020 | 340,780 | $15.35 | ||||||||||||||||||||||||||||||||||||||
| Unvested, January 1, 2020 | Unvested, January 1, 2020 | 340,780 | $15.35 | |||||||||||||||||||||||||||||||||||||
| Granted | Granted | 195,051 | 13.63 | Granted | 293,297 | 11.84 | ||||||||||||||||||||||||||||||||||
| Vested | Vested | (86,146) | 15.50 | Vested | (106,146) | 12.58 | ||||||||||||||||||||||||||||||||||
| Forfeited | Forfeited | 0 | 0.00 | Forfeited | (5,952) | 14.25 | ||||||||||||||||||||||||||||||||||
| Nonvested, March 31, 2020 | 449,685 | $14.58 | ||||||||||||||||||||||||||||||||||||||
| Unvested, June 30, 2020 | Unvested, June 30, 2020 | 521,979 | $13.41 | |||||||||||||||||||||||||||||||||||||
| Three months ended | |||||||||||||||||||||||||||||
| March 31, | |||||||||||||||||||||||||||||
| 2020 | 2019 | ||||||||||||||||||||||||||||
| (Dollars in thousands) | |||||||||||||||||||||||||||||
| Computed at the statutory rate (21%) | $ | 872 | $ | 2,051 | |||||||||||||||||||||||||
| Increase (decrease) resulting from | |||||||||||||||||||||||||||||
| Tax-exempt income | (790) | (713) | |||||||||||||||||||||||||||
| Nondeductible expenses | 64 | 73 | |||||||||||||||||||||||||||
| State tax credit | — | (1,361) | |||||||||||||||||||||||||||
| State income taxes | 142 | 441 | |||||||||||||||||||||||||||
| Equity based compensation | 26 | (55) | |||||||||||||||||||||||||||
| Other adjustments | (21) | (17) | |||||||||||||||||||||||||||
| Actual tax expense | $ | 293 | $ | 419 | |||||||||||||||||||||||||
| Notes to Consolidated Financial Statements (unaudited) | ||||||||
| Three Months Ended | Six Months Ended | ||||||||||||||||||||||||||||||||||||||||
| June 30, | June 30, | ||||||||||||||||||||||||||||||||||||||||
| 2020 | 2019 | 2020 | 2019 | ||||||||||||||||||||||||||||||||||||||
| (Dollars in thousands) | |||||||||||||||||||||||||||||||||||||||||
| Computed at the statutory rate (21%) | $ | (1,727) | $ | 2,465 | $ | (855) | $ | 4,516 | |||||||||||||||||||||||||||||||||
| Increase (decrease) resulting from | |||||||||||||||||||||||||||||||||||||||||
| Tax-exempt income | (779) | (712) | (1,569) | (1,425) | |||||||||||||||||||||||||||||||||||||
| Nondeductible expenses | 34 | 64 | 98 | 137 | |||||||||||||||||||||||||||||||||||||
| State tax credit | — | — | — | (1,361) | |||||||||||||||||||||||||||||||||||||
| State income taxes | 39 | 519 | 181 | 960 | |||||||||||||||||||||||||||||||||||||
| Equity based compensation | 13 | (6) | 39 | (61) | |||||||||||||||||||||||||||||||||||||
| Goodwill impairment | 1,553 | — | 1,553 | — | |||||||||||||||||||||||||||||||||||||
| Other adjustments | 4 | (33) | (17) | (50) | |||||||||||||||||||||||||||||||||||||
| Actual tax expense (benefit) | $ | (863) | $ | 2,297 | $ | (570) | $ | 2,716 | |||||||||||||||||||||||||||||||||
| March 31, 2020 | December 31, 2019 | June 30, 2020 | December 31, 2019 | |||||||||||||||||||||||||||||||
| (Dollars in thousands) | (Dollars in thousands) | |||||||||||||||||||||||||||||||||
| Deferred tax assets | Deferred tax assets | Deferred tax assets | ||||||||||||||||||||||||||||||||
| Allowance for loan losses | Allowance for loan losses | $ | 12,597 | $ | 13,928 | Allowance for loan losses | $ | 17,426 | $ | 13,928 | ||||||||||||||||||||||||
| Lease incentive | Lease incentive | 287 | 294 | Lease incentive | 279 | 294 | ||||||||||||||||||||||||||||
| Impairment of available-for-sale securities | Impairment of available-for-sale securities | — | 493 | Impairment of available-for-sale securities | — | 493 | ||||||||||||||||||||||||||||
| Valuation allowance on real estate | Valuation allowance on real estate | 273 | — | |||||||||||||||||||||||||||||||
| Loan fees | Loan fees | 2,134 | 2,317 | Loan fees | 3,921 | 2,317 | ||||||||||||||||||||||||||||
| Net operating loss carryover | Net operating loss carryover | 650 | 339 | Net operating loss carryover | 353 | 339 | ||||||||||||||||||||||||||||
| Accrued expenses | Accrued expenses | 801 | 2,131 | Accrued expenses | 1,016 | 2,131 | ||||||||||||||||||||||||||||
| Deferred compensation | Deferred compensation | 2,088 | 2,444 | Deferred compensation | 2,213 | 2,444 | ||||||||||||||||||||||||||||
| State tax credit | State tax credit | 3,288 | 3,287 | State tax credit | 2,842 | 3,287 | ||||||||||||||||||||||||||||
| Other | Other | 420 | 81 | Other | 431 | 81 | ||||||||||||||||||||||||||||
| Total deferred tax asset | Total deferred tax asset | 22,265 | 25,314 | Total deferred tax asset | 28,754 | 25,314 | ||||||||||||||||||||||||||||
| Deferred tax liability | Deferred tax liability | Deferred tax liability | ||||||||||||||||||||||||||||||||
| Fair market value adjustments - trust preferred securities | Fair market value adjustments - trust preferred securities | (346) | (348) | Fair market value adjustments - trust preferred securities | (344) | (348) | ||||||||||||||||||||||||||||
| Net unrealized gain on securities available-for-sale | Net unrealized gain on securities available-for-sale | (7,327) | (5,339) | Net unrealized gain on securities available-for-sale | (8,134) | (5,339) | ||||||||||||||||||||||||||||
| FHLB stock basis | FHLB stock basis | (1,068) | (996) | FHLB stock basis | (1,133) | (996) | ||||||||||||||||||||||||||||
| Premises and equipment | Premises and equipment | (3,462) | (3,620) | Premises and equipment | (3,303) | (3,620) | ||||||||||||||||||||||||||||
| Other | Other | (1,148) | (1,229) | Other | (999) | (1,229) | ||||||||||||||||||||||||||||
| Total deferred tax liability | Total deferred tax liability | (13,351) | (11,532) | Total deferred tax liability | (13,913) | (11,532) | ||||||||||||||||||||||||||||
| Net deferred tax asset | Net deferred tax asset | $ | 8,914 | $ | 13,782 | Net deferred tax asset | $ | 14,841 | $ | 13,782 | ||||||||||||||||||||||||
| Notes to Consolidated Financial Statements (unaudited) | ||||||||
| March 31, 2020 | |||||||||||||||||||||||||||||||||||||||||
| Fair Value Measurements Using | |||||||||||||||||||||||||||||||||||||||||
| Fair Value | Quoted Prices in Active Markets for Identical Assets (Level 1) | Significant Other Observable Inputs (Level 2) | Unobservable Inputs (Level 3) | ||||||||||||||||||||||||||||||||||||||
| (Dollars in thousands) | |||||||||||||||||||||||||||||||||||||||||
| Available-for-sale securities | |||||||||||||||||||||||||||||||||||||||||
| Mortgage-backed - GSE residential | $ | 149,821 | $ | — | $ | 149,821 | $ | — | |||||||||||||||||||||||||||||||||
| Collateralized mortgage obligations - GSE residential | 118,938 | — | 118,938 | — | |||||||||||||||||||||||||||||||||||||
| State and political subdivisions | 462,850 | — | 462,850 | — | |||||||||||||||||||||||||||||||||||||
| Corporate bonds | 1,415 | — | 1,415 | — | |||||||||||||||||||||||||||||||||||||
| Mutual funds | 2,207 | — | 2,207 | — | |||||||||||||||||||||||||||||||||||||
| Derivative assets | 28,041 | — | 28,041 | — | |||||||||||||||||||||||||||||||||||||
| Derivative liabilities | $ | 28,139 | $ | — | $ | 28,139 | $ | — | |||||||||||||||||||||||||||||||||
| Fair Value Description | Valuation Hierarchy Level | Where Fair Value Balance Can Be Found | |||||||||||||||
| Available-for-Sale Securities | Where quoted market prices are available in an active market, securities are classified within Level 1 of the valuation hierarchy. If quoted market prices are not available, then fair values are estimated by using quoted prices of securities with similar characteristics or independent asset pricing services and pricing models, the inputs of which are market-based or independently sourced market parameters, including, but not limited to, yield curves, interest rates, volatilities, prepayments, defaults, cumulative loss projections and cash flows. | Level 2 | |||||||||||||||
| Derivatives | Fair value of the interest rate swaps is obtained from independent pricing services based on quoted market prices for similar derivative contracts. | Level 2 | |||||||||||||||
| December 31, 2019 | |||||||||||||||||||||||||||||||||||||||||
| Fair Value Measurements Using | |||||||||||||||||||||||||||||||||||||||||
| Fair Value | Quoted Prices in Active Markets for Identical Assets (Level 1) | Significant Other Observable Inputs (Level 2) | Unobservable Inputs (Level 3) | ||||||||||||||||||||||||||||||||||||||
| (Dollars in thousands) | |||||||||||||||||||||||||||||||||||||||||
| Available-for-sale securities | |||||||||||||||||||||||||||||||||||||||||
| Mortgage-backed - GSE residential | $ | 152,512 | $ | — | $ | 152,512 | $ | — | |||||||||||||||||||||||||||||||||
| Collateralized mortgage obligations - GSE residential | 129,212 | — | 129,212 | — | |||||||||||||||||||||||||||||||||||||
| State and political subdivisions | 456,340 | — | 456,340 | — | |||||||||||||||||||||||||||||||||||||
| Corporate bonds | 1,409 | — | 1,409 | — | |||||||||||||||||||||||||||||||||||||
| Mutual funds | 2,161 | — | 2,161 | — | |||||||||||||||||||||||||||||||||||||
| Derivative assets | 9,838 | — | 9,838 | — | |||||||||||||||||||||||||||||||||||||
| Derivative liabilities | $ | 9,907 | $ | — | $ | 9,907 | $ | — | |||||||||||||||||||||||||||||||||
| June 30, 2020 | |||||||||||||||||||||||||||||||||||||||||
| Fair Value Measurements Using | |||||||||||||||||||||||||||||||||||||||||
| Fair Value | Quoted Prices in Active Markets for Identical Assets (Level 1) | Significant Other Observable Inputs (Level 2) | Unobservable Inputs (Level 3) | ||||||||||||||||||||||||||||||||||||||
| (Dollars in thousands) | |||||||||||||||||||||||||||||||||||||||||
| Collateral-dependent impaired loans | $ | 32,024 | $ | — | $ | — | $ | 32,024 | |||||||||||||||||||||||||||||||||
| Foreclosed assets held-for-sale | $ | 2,502 | $ | — | $ | — | $ | 2,502 | |||||||||||||||||||||||||||||||||
| Notes to Consolidated Financial Statements (unaudited) | ||||||||
| March 31, 2020 | |||||||||||||||||||||||||||||||||||||||||
| Fair Value Measurements Using | |||||||||||||||||||||||||||||||||||||||||
| Fair Value | Quoted Prices in Active Markets for Identical Assets (Level 1) | Significant Other Observable Inputs (Level 2) | Unobservable Inputs (Level 3) | ||||||||||||||||||||||||||||||||||||||
| (Dollars in thousands) | |||||||||||||||||||||||||||||||||||||||||
| Collateral-dependent impaired loans | $ | 24,679 | $ | — | $ | — | $ | 24,679 | |||||||||||||||||||||||||||||||||
| December 31, 2019 | |||||||||||||||||||||||||||||||||||||||||
| Fair Value Measurements Using | |||||||||||||||||||||||||||||||||||||||||
| Fair Value | Quoted Prices in Active Markets for Identical Assets (Level 1) | Significant Other Observable Inputs (Level 2) | Unobservable Inputs (Level 3) | ||||||||||||||||||||||||||||||||||||||
| (Dollars in thousands) | |||||||||||||||||||||||||||||||||||||||||
| Collateral-dependent impaired loans | $ | 20,889 | $ | — | $ | — | $ | 20,889 | |||||||||||||||||||||||||||||||||
| June 30, 2020 | |||||||||||||||||||||||||||||||||||||||||
| Fair Value | Valuation Techniques | Unobservable Inputs | Range (Weighted Average) | ||||||||||||||||||||||||||||||||||||||
| (Dollars in thousands) | |||||||||||||||||||||||||||||||||||||||||
| Collateral-dependent impaired loans | $ | 32,024 | Market comparable properties | Marketability discount | 10% - 15% (12%) | ||||||||||||||||||||||||||||||||||||
| Foreclosed assets held-for-sale | $ | 2,502 | Market comparable properties | Marketability discount | 10% | ||||||||||||||||||||||||||||||||||||
| December 31, 2019 | |||||||||||||||||||||||||||||||||||||||||
| Fair Value | Valuation Techniques | Unobservable Inputs | Range (Weighted Average) | ||||||||||||||||||||||||||||||||||||||
| (Dollars in thousands) | |||||||||||||||||||||||||||||||||||||||||
| Collateral-dependent impaired loans | $ | 20,889 | Market comparable properties | Marketability discount | 10% - 15% (12%) | ||||||||||||||||||||||||||||||||||||
| March 31, 2020 | |||||||||||||||||||||||||||||||||||||||||||||||||||||
| Carrying | Fair Value Measurements | ||||||||||||||||||||||||||||||||||||||||||||||||||||
| Amount | Level 1 | Level 2 | Level 3 | Total | |||||||||||||||||||||||||||||||||||||||||||||||||
| (Dollars in thousands) | |||||||||||||||||||||||||||||||||||||||||||||||||||||
| Financial Assets | |||||||||||||||||||||||||||||||||||||||||||||||||||||
| Cash and cash equivalents | $ | 158,987 | $ | 158,987 | $ | — | $ | — | $ | 158,987 | |||||||||||||||||||||||||||||||||||||||||||
| Available-for-sale securities | 735,231 | — | 735,231 | — | 735,231 | ||||||||||||||||||||||||||||||||||||||||||||||||
| Loans, net of allowance for loan losses | 3,950,993 | — | — | 3,946,203 | 3,946,203 | ||||||||||||||||||||||||||||||||||||||||||||||||
| Restricted equity securities | 18,539 | — | — | 18,539 | 18,539 | ||||||||||||||||||||||||||||||||||||||||||||||||
| Interest receivable | 16,958 | — | 16,958 | — | 16,958 | ||||||||||||||||||||||||||||||||||||||||||||||||
| Derivative assets | 28,041 | — | 28,041 | — | 28,041 | ||||||||||||||||||||||||||||||||||||||||||||||||
| $ | 4,908,749 | $ | 158,987 | $ | 780,230 | $ | 3,964,742 | $ | 4,903,959 | ||||||||||||||||||||||||||||||||||||||||||||
| Financial Liabilities | |||||||||||||||||||||||||||||||||||||||||||||||||||||
| Deposits | $ | 3,972,822 | $ | 567,215 | $ | — | $ | 3,428,178 | $ | 3,995,393 | |||||||||||||||||||||||||||||||||||||||||||
| Federal funds purchased and repurchase agreements | 38,946 | — | 38,946 | — | 38,946 | ||||||||||||||||||||||||||||||||||||||||||||||||
| Federal Home Loan Bank advances | 402,680 | — | 423,799 | — | 423,799 | ||||||||||||||||||||||||||||||||||||||||||||||||
| Other borrowings | 931 | — | 1,576 | — | 1,576 | ||||||||||||||||||||||||||||||||||||||||||||||||
| Interest payable | 3,365 | — | 3,365 | — | 3,365 | ||||||||||||||||||||||||||||||||||||||||||||||||
| Derivative liabilities | 28,139 | — | 28,139 | — | 28,139 | ||||||||||||||||||||||||||||||||||||||||||||||||
| $ | 4,446,883 | $ | 567,215 | $ | 495,825 | $ | 3,428,178 | $ | 4,491,218 | ||||||||||||||||||||||||||||||||||||||||||||
| Notes to Consolidated Financial Statements (unaudited) | ||||||||
| June 30, 2020 | |||||||||||||||||||||||||||||||||||||||||||||||||||||
| Carrying | Fair Value Measurements | ||||||||||||||||||||||||||||||||||||||||||||||||||||
| Amount | Level 1 | Level 2 | Level 3 | Total | |||||||||||||||||||||||||||||||||||||||||||||||||
| (Dollars in thousands) | |||||||||||||||||||||||||||||||||||||||||||||||||||||
| Financial Assets | |||||||||||||||||||||||||||||||||||||||||||||||||||||
| Cash and cash equivalents | $ | 194,371 | $ | 194,371 | $ | — | $ | — | $ | 194,371 | |||||||||||||||||||||||||||||||||||||||||||
| Available-for-sale securities | 700,083 | — | 700,083 | — | 700,083 | ||||||||||||||||||||||||||||||||||||||||||||||||
| Loans, net of allowance for loan losses | 4,342,039 | — | — | 4,334,224 | 4,334,224 | ||||||||||||||||||||||||||||||||||||||||||||||||
| Restricted equity securities | 20,675 | — | — | 20,675 | 20,675 | ||||||||||||||||||||||||||||||||||||||||||||||||
| Interest receivable | 19,399 | — | 19,399 | — | 19,399 | ||||||||||||||||||||||||||||||||||||||||||||||||
| Derivative assets | 29,302 | — | 29,302 | — | 29,302 | ||||||||||||||||||||||||||||||||||||||||||||||||
| $ | 5,305,869 | $ | 194,371 | $ | 748,784 | $ | 4,354,899 | $ | 5,298,054 | ||||||||||||||||||||||||||||||||||||||||||||
| Financial Liabilities | |||||||||||||||||||||||||||||||||||||||||||||||||||||
| Deposits | $ | 4,304,143 | $ | 750,333 | $ | — | $ | 3,599,237 | $ | 4,349,570 | |||||||||||||||||||||||||||||||||||||||||||
| Federal funds purchased and repurchase agreements | 49,881 | — | 49,881 | — | 49,881 | ||||||||||||||||||||||||||||||||||||||||||||||||
| Federal Home Loan Bank advances | 450,617 | — | 468,650 | — | 468,650 | ||||||||||||||||||||||||||||||||||||||||||||||||
| Other borrowings | 942 | — | 1,722 | — | 1,722 | ||||||||||||||||||||||||||||||||||||||||||||||||
| Interest payable | 2,843 | — | 2,843 | — | 2,843 | ||||||||||||||||||||||||||||||||||||||||||||||||
| Derivative liabilities | 29,432 | — | 29,432 | — | 29,432 | ||||||||||||||||||||||||||||||||||||||||||||||||
| $ | 4,837,858 | $ | 750,333 | $ | 552,528 | $ | 3,599,237 | $ | 4,902,098 | ||||||||||||||||||||||||||||||||||||||||||||
| December 31, 2019 | |||||||||||||||||||||||||||||||||||||||||||||||||||||
| Carrying | Fair Value Measurements | ||||||||||||||||||||||||||||||||||||||||||||||||||||
| Amount | Level 1 | Level 2 | Level 3 | Total | |||||||||||||||||||||||||||||||||||||||||||||||||
| (Dollars in thousands) | |||||||||||||||||||||||||||||||||||||||||||||||||||||
| Financial Assets | |||||||||||||||||||||||||||||||||||||||||||||||||||||
| Cash and cash equivalents | $ | 187,320 | $ | 187,320 | $ | — | $ | — | $ | 187,320 | |||||||||||||||||||||||||||||||||||||||||||
| Available-for-sale securities | 741,634 | — | 741,634 | — | 741,634 | ||||||||||||||||||||||||||||||||||||||||||||||||
| Loans, net of allowance for loan losses | 3,795,348 | — | — | 3,810,818 | 3,810,818 | ||||||||||||||||||||||||||||||||||||||||||||||||
| Restricted equity securities | 17,278 | — | — | 17,278 | 17,278 | ||||||||||||||||||||||||||||||||||||||||||||||||
| Interest receivable | 15,716 | — | 15,716 | — | 15,716 | ||||||||||||||||||||||||||||||||||||||||||||||||
| Derivative assets | 9,838 | — | 9,838 | — | 9,838 | ||||||||||||||||||||||||||||||||||||||||||||||||
| $ | 4,767,134 | $ | 187,320 | $ | 767,188 | $ | 3,828,096 | $ | 4,782,604 | ||||||||||||||||||||||||||||||||||||||||||||
| Financial Liabilities | |||||||||||||||||||||||||||||||||||||||||||||||||||||
| Deposits | $ | 3,923,759 | $ | 521,826 | $ | — | $ | 3,407,012 | $ | 3,928,838 | |||||||||||||||||||||||||||||||||||||||||||
| Federal funds purchased and repurchase agreements | 14,921 | — | 14,921 | — | 14,921 | ||||||||||||||||||||||||||||||||||||||||||||||||
| Federal Home Loan Bank advances | 358,743 | — | 357,859 | — | 357,859 | ||||||||||||||||||||||||||||||||||||||||||||||||
| Other borrowings | 921 | — | 2,147 | — | 2,147 | ||||||||||||||||||||||||||||||||||||||||||||||||
| Interest payable | 4,584 | — | 4,584 | — | 4,584 | ||||||||||||||||||||||||||||||||||||||||||||||||
| Derivative liabilities | 9,907 | — | 9,907 | — | 9,907 | ||||||||||||||||||||||||||||||||||||||||||||||||
| $ | 4,312,835 | $ | 521,826 | $ | 389,418 | $ | 3,407,012 | $ | 4,318,256 | ||||||||||||||||||||||||||||||||||||||||||||
| Notes to Consolidated Financial Statements (unaudited) | ||||||||
| March 31, 2020 | December 31, 2019 | ||||||||||||||||
| (Dollars in thousands) | |||||||||||||||||
| Commitments to originate loans | $ | 182,941 | $ | 134,652 | |||||||||||||
| Standby letters of credit | 34,828 | 39,035 | |||||||||||||||
| Lines of credit | 1,204,712 | 1,351,873 | |||||||||||||||
| Future lease commitments | 22,394 | 20,935 | |||||||||||||||
| Total | $ | 1,444,875 | $ | 1,546,495 | |||||||||||||
| June 30, 2020 | December 31, 2019 | ||||||||||||||||
| (Dollars in thousands) | |||||||||||||||||
| Commitments to originate loans | $ | 113,439 | $ | 134,652 | |||||||||||||
| Standby letters of credit | 38,342 | 39,035 | |||||||||||||||
| Lines of credit | 1,290,998 | 1,351,873 | |||||||||||||||
| Future lease commitments | 17,205 | 20,935 | |||||||||||||||
| Total | $ | 1,459,984 | $ | 1,546,495 | |||||||||||||
| As of or For the Period Ended June 30, 2020 | |||||||||||||||||||||||||||||||||||||||||||||||
| Outstanding Balance | Total Origination Fees | Earned Fees | Unearned Fees | ||||||||||||||||||||||||||||||||||||||||||||
| (Dollars in thousands) | |||||||||||||||||||||||||||||||||||||||||||||||
| PPP Loans | $ | 369,022 | $ | 9,930 | $ | 2,045 | $ | 7,885 | |||||||||||||||||||||||||||||||||||||||
| SBA/PPP Applications as of May 11, 2020 | ||||||||||||||||||||||||||||||||||||||||||||
| Approved | Existing Customers | New Customers | ||||||||||||||||||||||||||||||||||||||||||
| (Dollars in thousands) | ||||||||||||||||||||||||||||||||||||||||||||
| Number of Applications | 1,179 | 888 | 291 | |||||||||||||||||||||||||||||||||||||||||
| Loans Funded | $ | 411,750 | $ | 312,740 | $ | 99,010 | ||||||||||||||||||||||||||||||||||||||
| Loan Modifications Impacted by COVID-19 as of May 11, 2020 | |||||||||||||||||||||||||||||||||||||||||||||||||
| Loan Modifications by Category Impacted by the COVID-19 Pandemic as of June 30, 2020 | Loan Modifications by Category Impacted by the COVID-19 Pandemic as of June 30, 2020 | ||||||||||||||||||||||||||||||||||||||||||||||||
| Number of Loans | Value of Loans | Number of Loans | Value of Loans | Percent of Gross Loans in Category | |||||||||||||||||||||||||||||||||||||||||||||
| (Dollars in thousands) | (Dollars in thousands) | ||||||||||||||||||||||||||||||||||||||||||||||||
| Commercial | Commercial | 213 | $ | 388,295 | Commercial | 183 | $ | 275,917 | 21 | % | |||||||||||||||||||||||||||||||||||||||
| Energy | Energy | 2 | 648 | Energy | 9 | 30,212 | 8 | ||||||||||||||||||||||||||||||||||||||||||
| Commercial real estate | Commercial real estate | 123 | 396,867 | Commercial real estate | 112 | 356,611 | 31 | ||||||||||||||||||||||||||||||||||||||||||
| Construction and land development | Construction and land development | 10 | 32,088 | Construction and land development | 8 | 21,177 | 3 | ||||||||||||||||||||||||||||||||||||||||||
| Residential real estate | Residential real estate | 17 | 29,695 | Residential real estate | 14 | 25,526 | 5 | ||||||||||||||||||||||||||||||||||||||||||
| Consumer | Consumer | — | — | Consumer | — | — | — | ||||||||||||||||||||||||||||||||||||||||||
| Total | Total | 365 | $ | 847,593 | Total | 326 | $ | 709,443 | 16 | % | |||||||||||||||||||||||||||||||||||||||
| Loan Modifications by Type of Modification Impacted by the COVID-19 Pandemic as of June 30, 2020 | ||||||||||||||||||||
| Number of Loans | Value of Loans | |||||||||||||||||||
| (Dollars in thousands) | ||||||||||||||||||||
| Payment deferral | 116 | $ | 290,796 | |||||||||||||||||
| Interest-only payments | 176 | 306,210 | ||||||||||||||||||
| Other (multiple modifications, change in rate and/or payment) | 34 | 112,437 | ||||||||||||||||||
| Total | 326 | $ | 709,443 | |||||||||||||||||
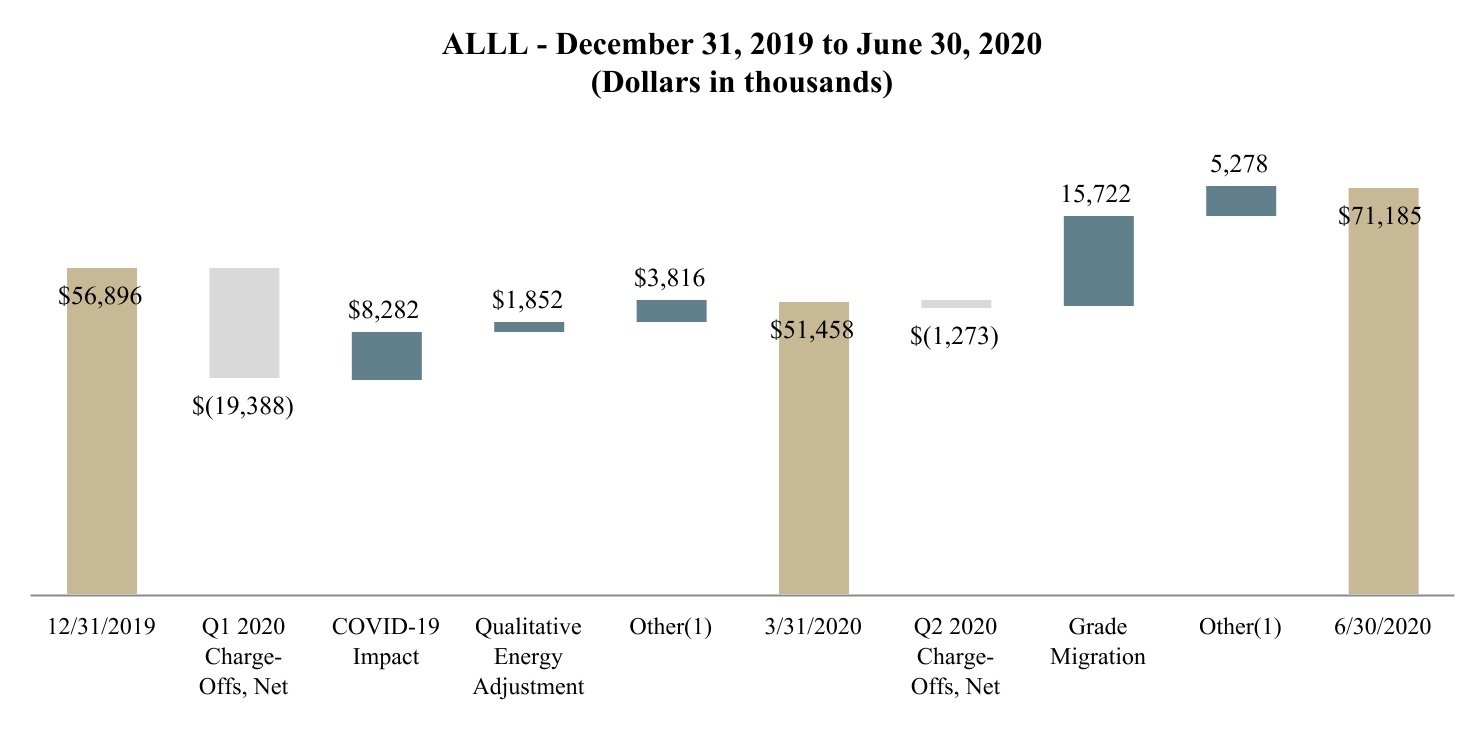
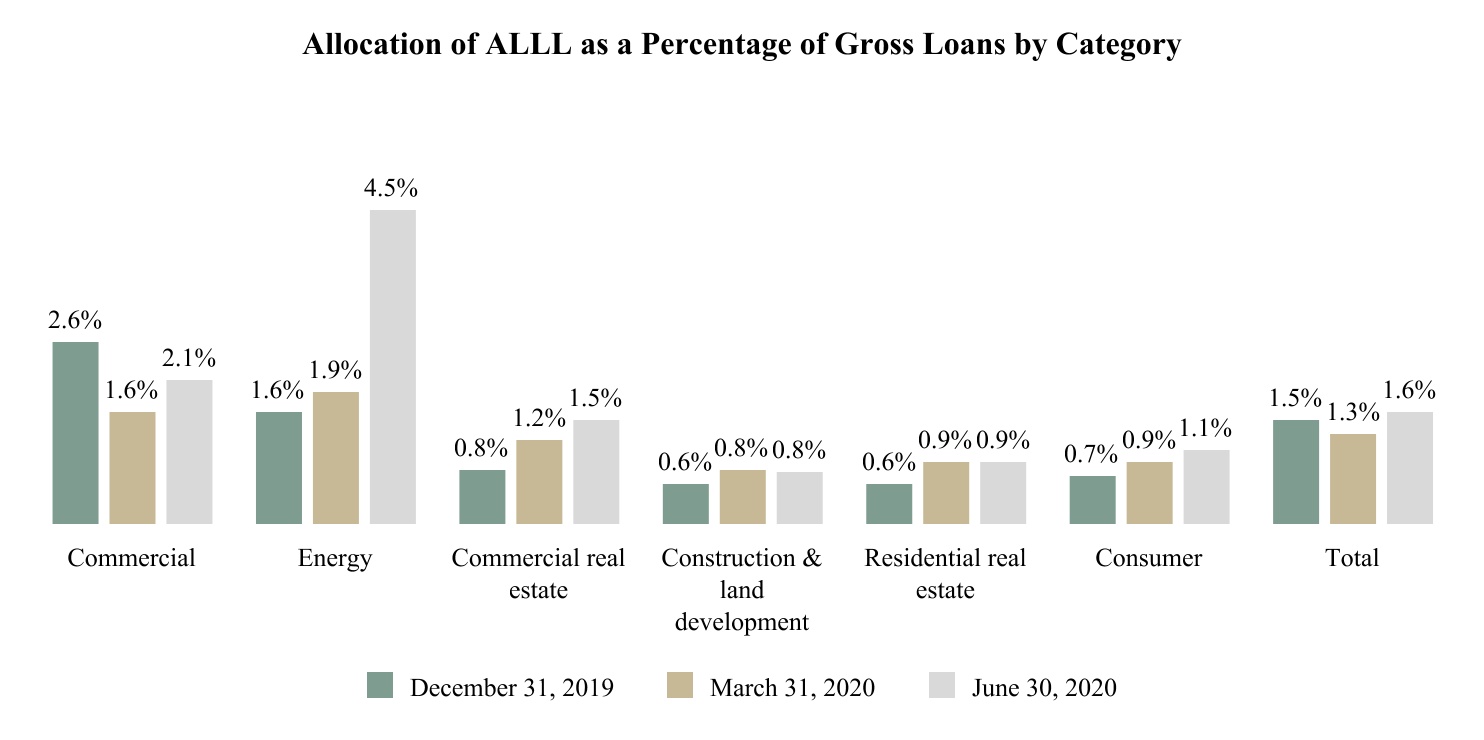
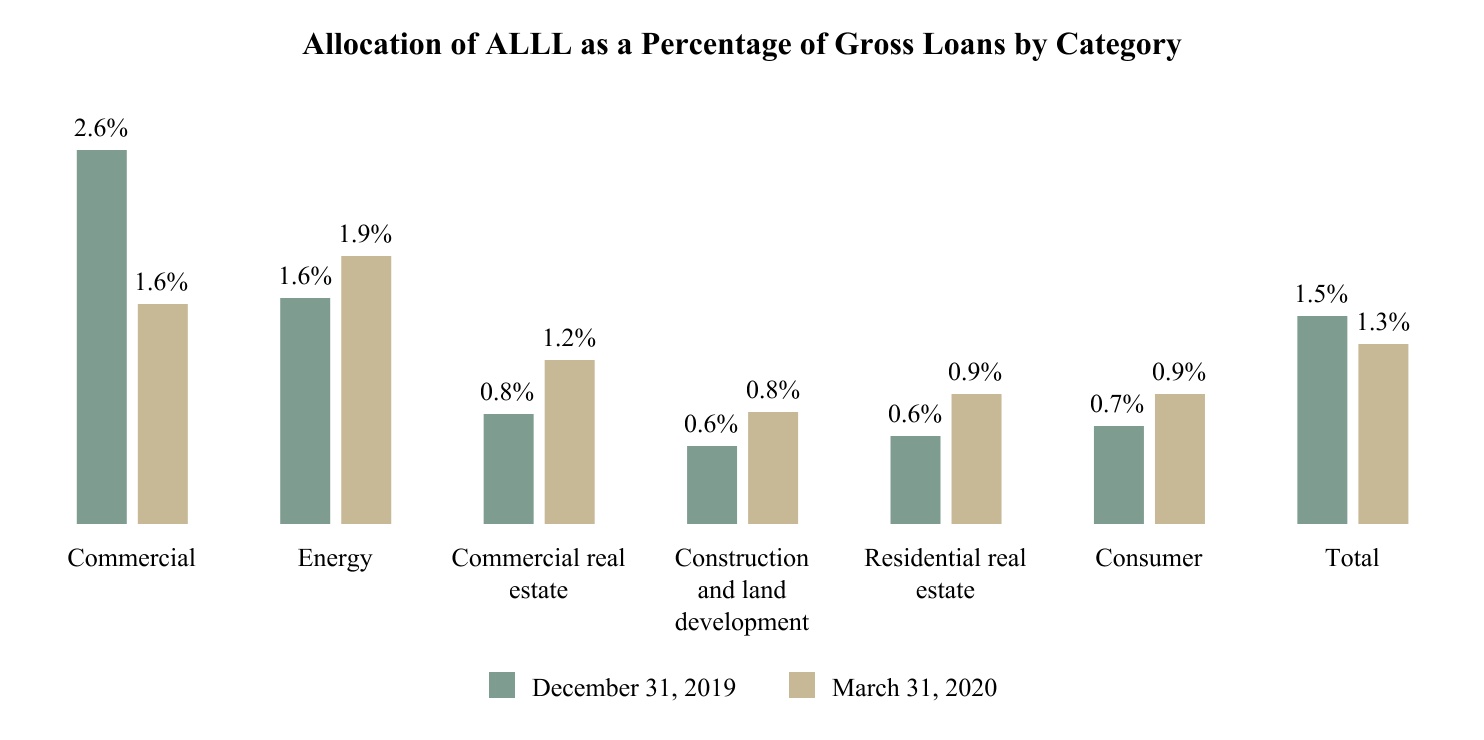
| Real Estate Industries with Increased Monitoring as of March 31, 2020 | ||||||||||||||||||||||||||||||||||||||||
| Real Estate Industries with Increased Monitoring as of June 30, 2020 | Real Estate Industries with Increased Monitoring as of June 30, 2020 | |||||||||||||||||||||||||||||||||||||||
| Industry | Industry | Outstanding Balance | Percent of Gross Loans | Industry | Outstanding Balance | Percent of Gross Loans | ||||||||||||||||||||||||||||||||||
| (Dollars in thousands) | (Dollars in thousands) | |||||||||||||||||||||||||||||||||||||||
| Retail | Retail | $ | 204,561 | 5.1 | % | Retail | $ | 197,755 | 4.5 | % | ||||||||||||||||||||||||||||||
| Hotel and Lodging | Hotel and Lodging | 163,947 | 4.1 | Hotel and Lodging | 167,079 | 3.8 | ||||||||||||||||||||||||||||||||||
| Medical | Medical | 51,131 | 1.3 | Medical | 56,536 | 1.3 | ||||||||||||||||||||||||||||||||||
| Senior Living | Senior Living | 81,879 | 2.0 | Senior Living | $ | 104,126 | 2.4 | % | ||||||||||||||||||||||||||||||||
| Restaurants | $ | 15,047 | 0.4 | % | ||||||||||||||||||||||||||||||||||||
| Commercial Industries with Increased Monitoring as of March 31, 2020 | ||||||||||||||||||||||||||||||||||||||||
| Commercial Industries with Increased Monitoring as of June 30, 2020 | Commercial Industries with Increased Monitoring as of June 30, 2020 | |||||||||||||||||||||||||||||||||||||||
| Industry | Industry | Outstanding Balance | Percent of Gross Loans | Industry | Outstanding Balance | Percent of Gross Loans | ||||||||||||||||||||||||||||||||||
| (Dollars in thousands) | (Dollars in thousands) | |||||||||||||||||||||||||||||||||||||||
| Recreation | Recreation | $ | 86,474 | 2.2 | % | Recreation | $ | 86,878 | 2.0 | % | ||||||||||||||||||||||||||||||
| Restaurants | Restaurants | 83,357 | 2.1 | Restaurants | 60,994 | 1.4 | ||||||||||||||||||||||||||||||||||
| Aircraft and Aviation | Aircraft and Aviation | 56,998 | 1.4 | Aircraft and Aviation | 52,379 | 1.2 | ||||||||||||||||||||||||||||||||||
| Consumer | Consumer | $ | 43,118 | 1.1 | % | Consumer | $ | 45,716 | 1.0 | % | ||||||||||||||||||||||||||||||
| As of or For the Three Months Ended | As of or For the Three Months Ended | As of or For the Six Months Ended | ||||||||||||||||||||||||||||||||||||||||||||||||||||||||||||||||||||||||||||||||||||||||||||||||||||||||||||||||||||||||||||||||||||||
| March | December | September | June | March | June | March | December | September | June | June | June | |||||||||||||||||||||||||||||||||||||||||||||||||||||||||||||||||||||||||||||||||||||||||||||||||||||||||||||||||||||||||||||
| 31, | 31, | 30, | 30, | 31, | 30, | 31, | 31, | 30, | 30, | 30, | 30, | |||||||||||||||||||||||||||||||||||||||||||||||||||||||||||||||||||||||||||||||||||||||||||||||||||||||||||||||||||||||||||||
| 2020 | 2019 | 2019 | 2019 | 2019 | 2020 | 2020 | 2019 | 2019 | 2019 | 2020 | 2019 | |||||||||||||||||||||||||||||||||||||||||||||||||||||||||||||||||||||||||||||||||||||||||||||||||||||||||||||||||||||||||||||
| Per Common Share Data | Per Common Share Data | Per Common Share Data | ||||||||||||||||||||||||||||||||||||||||||||||||||||||||||||||||||||||||||||||||||||||||||||||||||||||||||||||||||||||||||||||||||||||
| Basic earnings (loss) per share | Basic earnings (loss) per share | $ | 0.07 | $ | (0.01) | $ | 0.22 | $ | 0.21 | $ | 0.20 | Basic earnings (loss) per share | $ | (0.14) | $ | 0.07 | $ | (0.01) | $ | 0.22 | $ | 0.21 | $ | (0.07) | $ | 0.41 | ||||||||||||||||||||||||||||||||||||||||||||||||||||||||||||||||||||||||||||||||||||||||||||||||||||||||||||||
| Diluted earnings (loss) per share | Diluted earnings (loss) per share | 0.07 | (0.01) | 0.21 | 0.20 | 0.20 | Diluted earnings (loss) per share | (0.14) | 0.07 | (0.01) | 0.21 | 0.20 | (0.07) | 0.40 | ||||||||||||||||||||||||||||||||||||||||||||||||||||||||||||||||||||||||||||||||||||||||||||||||||||||||||||||||||||||||||
| Book value per share | Book value per share | 11.75 | 11.58 | 11.59 | 11.00 | 10.63 | Book value per share | 11.66 | 11.75 | 11.58 | 11.59 | 11.00 | 11.66 | 11.00 | ||||||||||||||||||||||||||||||||||||||||||||||||||||||||||||||||||||||||||||||||||||||||||||||||||||||||||||||||||||||||||
Tangible book value per share(1) | Tangible book value per share(1) | $ | 11.60 | $ | 11.43 | $ | 11.44 | $ | 10.83 | $ | 10.46 | Tangible book value per share(1) | $ | 11.65 | $ | 11.60 | $ | 11.43 | $ | 11.44 | $ | 10.83 | $ | 11.65 | $ | 10.83 | ||||||||||||||||||||||||||||||||||||||||||||||||||||||||||||||||||||||||||||||||||||||||||||||||||||||||||||||
| Selected Operating Ratios | Selected Operating Ratios | Selected Operating Ratios | ||||||||||||||||||||||||||||||||||||||||||||||||||||||||||||||||||||||||||||||||||||||||||||||||||||||||||||||||||||||||||||||||||||||
Yield on securities - tax equivalent(2) | Yield on securities - tax equivalent(2) | 3.21 | % | 3.22 | % | 3.19 | % | 3.42 | % | 3.59 | % | Yield on securities - tax equivalent(2) | 3.07 | % | 3.21 | % | 3.22 | % | 3.19 | % | 3.42 | % | 3.15 | % | 3.51 | % | ||||||||||||||||||||||||||||||||||||||||||||||||||||||||||||||||||||||||||||||||||||||||||||||||||||||||||||||
| Yield on loans | Yield on loans | 4.98 | 5.21 | 5.53 | 5.66 | 5.75 | Yield on loans | 4.28 | 4.98 | 5.21 | 5.53 | 5.66 | 4.61 | 5.70 | ||||||||||||||||||||||||||||||||||||||||||||||||||||||||||||||||||||||||||||||||||||||||||||||||||||||||||||||||||||||||||
Yield on interest-earning assets(2) | Yield on interest-earning assets(2) | 4.57 | 4.76 | 5.00 | 5.18 | 5.25 | Yield on interest-earning assets(2) | 3.96 | 4.57 | 4.76 | 5.00 | 5.18 | 4.25 | 5.21 | ||||||||||||||||||||||||||||||||||||||||||||||||||||||||||||||||||||||||||||||||||||||||||||||||||||||||||||||||||||||||||
| Cost of interest-bearing deposits | Cost of interest-bearing deposits | 1.69 | 1.97 | 2.26 | 2.33 | 2.30 | Cost of interest-bearing deposits | 0.95 | 1.69 | 1.97 | 2.26 | 2.33 | 1.31 | 2.31 | ||||||||||||||||||||||||||||||||||||||||||||||||||||||||||||||||||||||||||||||||||||||||||||||||||||||||||||||||||||||||||
| Cost of total deposits | Cost of total deposits | 1.46 | 1.70 | 1.94 | 1.99 | 1.96 | Cost of total deposits | 0.79 | 1.46 | 1.70 | 1.94 | 1.99 | 1.11 | 1.98 | ||||||||||||||||||||||||||||||||||||||||||||||||||||||||||||||||||||||||||||||||||||||||||||||||||||||||||||||||||||||||||
| Cost of funds | Cost of funds | 1.49 | 1.71 | 1.94 | 1.99 | 1.96 | Cost of funds | 0.85 | 1.49 | 1.71 | 1.94 | 1.99 | 1.15 | 1.97 | ||||||||||||||||||||||||||||||||||||||||||||||||||||||||||||||||||||||||||||||||||||||||||||||||||||||||||||||||||||||||||
Net interest margin(2) | Net interest margin(2) | 3.24 | 3.23 | 3.24 | 3.35 | 3.46 | Net interest margin(2) | 3.19 | 3.24 | 3.23 | 3.24 | 3.35 | 3.22 | 3.40 | ||||||||||||||||||||||||||||||||||||||||||||||||||||||||||||||||||||||||||||||||||||||||||||||||||||||||||||||||||||||||||
| Return on average assets | Return on average assets | 0.31 | (0.06) | 0.89 | 0.86 | 0.91 | Return on average assets | (0.54) | 0.31 | (0.06) | 0.89 | 0.86 | (0.14) | 0.88 | ||||||||||||||||||||||||||||||||||||||||||||||||||||||||||||||||||||||||||||||||||||||||||||||||||||||||||||||||||||||||||
Non-GAAP core operating return on average assets(3) | Non-GAAP core operating return on average assets(3) | 0.31 | (0.06) | 0.89 | 0.89 | 0.78 | Non-GAAP core operating return on average assets(3) | 0.00 | 0.31 | (0.06) | 0.89 | 0.89 | 0.15 | 0.83 | ||||||||||||||||||||||||||||||||||||||||||||||||||||||||||||||||||||||||||||||||||||||||||||||||||||||||||||||||||||||||||
| Return on average equity | 2.53 | (0.46) | 7.58 | 7.78 | 7.98 | |||||||||||||||||||||||||||||||||||||||||||||||||||||||||||||||||||||||||||||||||||||||||||||||||||||||||||||||||||||||||||||||||||
Non-GAAP core operating return on average equity(4) | 2.53 | (0.46) | 7.58 | 8.04 | 6.79 | |||||||||||||||||||||||||||||||||||||||||||||||||||||||||||||||||||||||||||||||||||||||||||||||||||||||||||||||||||||||||||||||||||
Non-interest expense to average assets(5) | 1.80 | 1.81 | 1.82 | 2.00 | 2.20 | |||||||||||||||||||||||||||||||||||||||||||||||||||||||||||||||||||||||||||||||||||||||||||||||||||||||||||||||||||||||||||||||||||
Efficiency ratio(6) | 55.11 | 55.60 | 54.29 | 60.09 | 64.20 | |||||||||||||||||||||||||||||||||||||||||||||||||||||||||||||||||||||||||||||||||||||||||||||||||||||||||||||||||||||||||||||||||||
Non-GAAP core operating efficiency ratio - tax equivalent(2)(7) | 54.18 | 54.66 | 53.43 | 58.43 | 63.10 | |||||||||||||||||||||||||||||||||||||||||||||||||||||||||||||||||||||||||||||||||||||||||||||||||||||||||||||||||||||||||||||||||||
| Non-interest-bearing deposits to total deposits | 14.28 | 13.30 | 14.05 | 14.28 | 14.36 | |||||||||||||||||||||||||||||||||||||||||||||||||||||||||||||||||||||||||||||||||||||||||||||||||||||||||||||||||||||||||||||||||||
| Loans to deposits | 100.75 | % | 98.18 | % | 99.23 | % | 96.74 | % | 96.40 | % | ||||||||||||||||||||||||||||||||||||||||||||||||||||||||||||||||||||||||||||||||||||||||||||||||||||||||||||||||||||||||||||||
| Credit Quality Ratios | ||||||||||||||||||||||||||||||||||||||||||||||||||||||||||||||||||||||||||||||||||||||||||||||||||||||||||||||||||||||||||||||||||||||||
| Allowance for loan losses to total loans | 1.29 | % | 1.48 | % | 1.18 | % | 1.24 | % | 1.22 | % | ||||||||||||||||||||||||||||||||||||||||||||||||||||||||||||||||||||||||||||||||||||||||||||||||||||||||||||||||||||||||||||||
| Nonperforming assets to total assets | 0.59 | 0.97 | 1.00 | 1.18 | 0.36 | |||||||||||||||||||||||||||||||||||||||||||||||||||||||||||||||||||||||||||||||||||||||||||||||||||||||||||||||||||||||||||||||||||
| Nonperforming loans to total loans | 0.66 | 1.15 | 1.22 | 1.45 | 0.40 | |||||||||||||||||||||||||||||||||||||||||||||||||||||||||||||||||||||||||||||||||||||||||||||||||||||||||||||||||||||||||||||||||||
| Allowance for loan losses to nonperforming loans | 195.99 | 128.54 | 97.12 | 85.20 | 307.27 | |||||||||||||||||||||||||||||||||||||||||||||||||||||||||||||||||||||||||||||||||||||||||||||||||||||||||||||||||||||||||||||||||||
Net charge-offs (recoveries) to average loans(5) | 2.00 | % | 0.58 | % | 0.53 | % | — | % | 0.09 | % | ||||||||||||||||||||||||||||||||||||||||||||||||||||||||||||||||||||||||||||||||||||||||||||||||||||||||||||||||||||||||||||||
| As of or For the Three Months Ended | As of or For the Three Months Ended | As of or For the Six Months Ended | ||||||||||||||||||||||||||||||||||||||||||||||||||||||||||||||||||||||||||||||||||||||||||||||||||||||||||||||||||||||||||||||||||||||||||||||||||
| March | December | September | June | March | June | March | December | September | June | June | June | |||||||||||||||||||||||||||||||||||||||||||||||||||||||||||||||||||||||||||||||||||||||||||||||||||||||||||||||||||||||||||||||||||||||||
| 31, | 31, | 30, | 30, | 31, | 30, | 31, | 31, | 30, | 30, | 30, | 30, | |||||||||||||||||||||||||||||||||||||||||||||||||||||||||||||||||||||||||||||||||||||||||||||||||||||||||||||||||||||||||||||||||||||||||
| 2020 | 2019 | 2019 | 2019 | 2019 | 2020 | 2020 | 2019 | 2019 | 2019 | 2020 | 2019 | |||||||||||||||||||||||||||||||||||||||||||||||||||||||||||||||||||||||||||||||||||||||||||||||||||||||||||||||||||||||||||||||||||||||||
| Return on average equity | Return on average equity | (4.84) | 2.53 | (0.46) | 7.58 | 7.78 | (1.15) | 7.87 | ||||||||||||||||||||||||||||||||||||||||||||||||||||||||||||||||||||||||||||||||||||||||||||||||||||||||||||||||||||||||||||||||||||||||||||
Non-GAAP core operating return on average common equity(4) | Non-GAAP core operating return on average common equity(4) | 0.03 | 2.53 | (0.46) | 7.58 | 8.04 | 1.28 | 7.43 | ||||||||||||||||||||||||||||||||||||||||||||||||||||||||||||||||||||||||||||||||||||||||||||||||||||||||||||||||||||||||||||||||||||||||||||
Non-interest expense to average assets(5) | Non-interest expense to average assets(5) | 2.21 | 1.80 | 1.81 | 1.82 | 2.00 | 2.01 | 2.10 | ||||||||||||||||||||||||||||||||||||||||||||||||||||||||||||||||||||||||||||||||||||||||||||||||||||||||||||||||||||||||||||||||||||||||||||
Efficiency ratio(6) | Efficiency ratio(6) | 70.81 | 55.11 | 55.60 | 54.29 | 60.09 | 63.29 | 62.11 | ||||||||||||||||||||||||||||||||||||||||||||||||||||||||||||||||||||||||||||||||||||||||||||||||||||||||||||||||||||||||||||||||||||||||||||
Non-GAAP core operating efficiency ratio - tax equivalent(2)(7) | Non-GAAP core operating efficiency ratio - tax equivalent(2)(7) | 53.09 | 54.18 | 54.66 | 53.43 | 58.43 | 53.61 | 60.71 | ||||||||||||||||||||||||||||||||||||||||||||||||||||||||||||||||||||||||||||||||||||||||||||||||||||||||||||||||||||||||||||||||||||||||||||
| Non-interest-bearing deposits to total deposits | Non-interest-bearing deposits to total deposits | 17.43 | 14.28 | 13.30 | 14.05 | 14.28 | 17.43 | 14.28 | ||||||||||||||||||||||||||||||||||||||||||||||||||||||||||||||||||||||||||||||||||||||||||||||||||||||||||||||||||||||||||||||||||||||||||||
| Loans to deposits | Loans to deposits | 102.53 | % | 100.75 | % | 98.18 | % | 99.23 | % | 96.74 | % | 102.53 | % | 96.74 | % | |||||||||||||||||||||||||||||||||||||||||||||||||||||||||||||||||||||||||||||||||||||||||||||||||||||||||||||||||||||||||||||||||||||
| Credit Quality Ratios | Credit Quality Ratios | |||||||||||||||||||||||||||||||||||||||||||||||||||||||||||||||||||||||||||||||||||||||||||||||||||||||||||||||||||||||||||||||||||||||||||||||||||
| Allowance for loan losses to total loans | Allowance for loan losses to total loans | 1.61 | % | 1.29 | % | 1.48 | % | 1.18 | % | 1.24 | % | 1.61 | % | 1.24 | % | |||||||||||||||||||||||||||||||||||||||||||||||||||||||||||||||||||||||||||||||||||||||||||||||||||||||||||||||||||||||||||||||||||||
| Nonperforming assets to total assets | Nonperforming assets to total assets | 0.74 | 0.59 | 0.97 | 1.00 | 1.18 | 0.74 | 1.18 | ||||||||||||||||||||||||||||||||||||||||||||||||||||||||||||||||||||||||||||||||||||||||||||||||||||||||||||||||||||||||||||||||||||||||||||
| Nonperforming loans to total loans | Nonperforming loans to total loans | 0.86 | 0.66 | 1.15 | 1.22 | 1.45 | 0.86 | 1.45 | ||||||||||||||||||||||||||||||||||||||||||||||||||||||||||||||||||||||||||||||||||||||||||||||||||||||||||||||||||||||||||||||||||||||||||||
| Allowance for loan losses to nonperforming loans | Allowance for loan losses to nonperforming loans | 188.55 | 195.99 | 128.54 | 97.12 | 85.22 | 188.55 | 85.22 | ||||||||||||||||||||||||||||||||||||||||||||||||||||||||||||||||||||||||||||||||||||||||||||||||||||||||||||||||||||||||||||||||||||||||||||
Net charge-offs (recoveries) to average loans(5) | Net charge-offs (recoveries) to average loans(5) | 0.12 | % | 2.00 | % | 0.58 | % | 0.53 | % | — | % | 1.01 | % | 0.04 | % | |||||||||||||||||||||||||||||||||||||||||||||||||||||||||||||||||||||||||||||||||||||||||||||||||||||||||||||||||||||||||||||||||||||
| Capital Ratios | Capital Ratios | Capital Ratios | ||||||||||||||||||||||||||||||||||||||||||||||||||||||||||||||||||||||||||||||||||||||||||||||||||||||||||||||||||||||||||||||||||||||||||||||||||
| Total stockholders’ equity to total assets | Total stockholders’ equity to total assets | 12.08 | % | 12.20 | % | 12.95 | % | 11.16 | % | 11.26 | % | Total stockholders’ equity to total assets | 11.13 | % | 12.08 | % | 12.20 | % | 12.95 | % | 11.16 | % | 11.13 | % | 11.16 | % | ||||||||||||||||||||||||||||||||||||||||||||||||||||||||||||||||||||||||||||||||||||||||||||||||||||||||||||||||||||||||||
| Tier 1 leverage ratio | Tier 1 leverage ratio | 11.81 | 12.06 | 12.57 | 10.87 | 11.15 | Tier 1 leverage ratio | 10.75 | 11.81 | 12.06 | 12.57 | 10.87 | 10.75 | 10.87 | ||||||||||||||||||||||||||||||||||||||||||||||||||||||||||||||||||||||||||||||||||||||||||||||||||||||||||||||||||||||||||||||||||||||
| Common equity tier 1 capital ratio | Common equity tier 1 capital ratio | 12.08 | 12.20 | 12.91 | 11.02 | 11.23 | Common equity tier 1 capital ratio | 11.99 | 12.08 | 12.20 | 12.91 | 11.02 | 11.99 | 11.02 | ||||||||||||||||||||||||||||||||||||||||||||||||||||||||||||||||||||||||||||||||||||||||||||||||||||||||||||||||||||||||||||||||||||||
| Tier 1 risk-based capital ratio | Tier 1 risk-based capital ratio | 12.10 | 12.22 | 12.93 | 11.04 | 11.23 | Tier 1 risk-based capital ratio | 12.01 | 12.10 | 12.22 | 12.93 | 11.04 | 12.01 | 11.04 | ||||||||||||||||||||||||||||||||||||||||||||||||||||||||||||||||||||||||||||||||||||||||||||||||||||||||||||||||||||||||||||||||||||||
| Total risk-based capital ratio | Total risk-based capital ratio | 13.17 | % | 13.43 | % | 13.90 | % | 12.04 | % | 12.20 | % | Total risk-based capital ratio | 13.27 | % | 13.17 | % | 13.43 | % | 13.90 | % | 12.04 | % | 13.27 | % | 12.04 | % | ||||||||||||||||||||||||||||||||||||||||||||||||||||||||||||||||||||||||||||||||||||||||||||||||||||||||||||||||||||||||||
(1) Tangible common stockholders’ equity and tangible book value per share are non-GAAP financial measures. The most directly comparable GAAP measure is stockholders’ equity and book value per share. See “GAAP Reconciliation and Management Explanation of Non-GAAP Financial Measures” for a reconciliation of this measure. | ||||||||||||||||||||||||||||||||||||||||||||||||||||||||||||||||||||||||||||||||||||||||||||||||||||||||||||||||||||||||||||||||||||||||||||||||||||
(1) Tangible common stockholders’ equity and tangible book value per share are non-GAAP financial measures. The most directly comparable GAAP measures are stockholders’ equity and book value per share. See “GAAP Reconciliation and Management Explanation of Non-GAAP Financial Measures” for a reconciliation of these measures. | (1) Tangible common stockholders’ equity and tangible book value per share are non-GAAP financial measures. The most directly comparable GAAP measures are stockholders’ equity and book value per share. See “GAAP Reconciliation and Management Explanation of Non-GAAP Financial Measures” for a reconciliation of these measures. | |||||||||||||||||||||||||||||||||||||||||||||||||||||||||||||||||||||||||||||||||||||||||||||||||||||||||||||||||||||||||||||||||||||||||||||||||||
(2) Tax exempt income (tax-free municipal securities) is calculated on a tax equivalent basis. The incremental tax rate used is 21.0%. | (2) Tax exempt income (tax-free municipal securities) is calculated on a tax equivalent basis. The incremental tax rate used is 21.0%. | (2) Tax exempt income (tax-free municipal securities) is calculated on a tax equivalent basis. The incremental tax rate used is 21.0%. | ||||||||||||||||||||||||||||||||||||||||||||||||||||||||||||||||||||||||||||||||||||||||||||||||||||||||||||||||||||||||||||||||||||||||||||||||||
(3) Non-GAAP core operating return on average assets is a non-GAAP financial measures. The most directly comparable measure under GAAP is return on average assets. See “GAAP Reconciliation and Management Explanation of Non-GAAP Financial Measures” for a reconciliation of this measure. | ||||||||||||||||||||||||||||||||||||||||||||||||||||||||||||||||||||||||||||||||||||||||||||||||||||||||||||||||||||||||||||||||||||||||||||||||||||
(3) Non-GAAP core operating return on average assets is a non-GAAP financial measure. The most directly comparable GAAP measure is return on average assets. See “GAAP Reconciliation and Management Explanation of Non-GAAP Financial Measures” for a reconciliation of this measure. | (3) Non-GAAP core operating return on average assets is a non-GAAP financial measure. The most directly comparable GAAP measure is return on average assets. See “GAAP Reconciliation and Management Explanation of Non-GAAP Financial Measures” for a reconciliation of this measure. | |||||||||||||||||||||||||||||||||||||||||||||||||||||||||||||||||||||||||||||||||||||||||||||||||||||||||||||||||||||||||||||||||||||||||||||||||||
(4) Non-GAAP core operating return on average equity is a non-GAAP financial measure. The most directly comparable GAAP financial measure is return on average equity. See “GAAP Reconciliation and Management Explanation of Non-GAAP Financial Measures” for a reconciliation of this measure. | (4) Non-GAAP core operating return on average equity is a non-GAAP financial measure. The most directly comparable GAAP financial measure is return on average equity. See “GAAP Reconciliation and Management Explanation of Non-GAAP Financial Measures” for a reconciliation of this measure. | (4) Non-GAAP core operating return on average equity is a non-GAAP financial measure. The most directly comparable GAAP financial measure is return on average equity. See “GAAP Reconciliation and Management Explanation of Non-GAAP Financial Measures” for a reconciliation of this measure. | ||||||||||||||||||||||||||||||||||||||||||||||||||||||||||||||||||||||||||||||||||||||||||||||||||||||||||||||||||||||||||||||||||||||||||||||||||
(5) Interim periods are annualized. | (5) Interim periods are annualized. | (5) Interim periods are annualized. | ||||||||||||||||||||||||||||||||||||||||||||||||||||||||||||||||||||||||||||||||||||||||||||||||||||||||||||||||||||||||||||||||||||||||||||||||||
(6) We calculate efficiency ratio as non-interest expense divided by the sum of net interest income and non-interest income. | (6) We calculate efficiency ratio as non-interest expense divided by the sum of net interest income and non-interest income. | (6) We calculate efficiency ratio as non-interest expense divided by the sum of net interest income and non-interest income. | ||||||||||||||||||||||||||||||||||||||||||||||||||||||||||||||||||||||||||||||||||||||||||||||||||||||||||||||||||||||||||||||||||||||||||||||||||
(7) Non-GAAP core operating efficiency ratio - tax equivalent is a non-GAAP financial measure. The most directly comparable GAAP financial measure is the efficiency ratio. See “GAAP Reconciliation and Management Explanation of Non-GAAP Financial Measures” for a reconciliation of this measure. | (7) Non-GAAP core operating efficiency ratio - tax equivalent is a non-GAAP financial measure. The most directly comparable GAAP financial measure is the efficiency ratio. See “GAAP Reconciliation and Management Explanation of Non-GAAP Financial Measures” for a reconciliation of this measure. | (7) Non-GAAP core operating efficiency ratio - tax equivalent is a non-GAAP financial measure. The most directly comparable GAAP financial measure is the efficiency ratio. See “GAAP Reconciliation and Management Explanation of Non-GAAP Financial Measures” for a reconciliation of this measure. | ||||||||||||||||||||||||||||||||||||||||||||||||||||||||||||||||||||||||||||||||||||||||||||||||||||||||||||||||||||||||||||||||||||||||||||||||||
| Three Months Ended | Six Months Ended | |||||||||||||||||||||||||||||||||||||||||||||||||||||||||||||||||||||||||||||||||||||||||||||||||||||||||||||||||||||||||||||||||||||||||||||||||||||||||
| Three Months Ended | June 30, | June 30, | ||||||||||||||||||||||||||||||||||||||||||||||||||||||||||||||||||||||||||||||||||||||||||||||||||||||||||||||||||||||||||||||||||||||||||||||||||||||||
| March 31, | Change | Change | ||||||||||||||||||||||||||||||||||||||||||||||||||||||||||||||||||||||||||||||||||||||||||||||||||||||||||||||||||||||||||||||||||||||||||||||||||||||||
| 2020 | 2019 | $ Change | % Change | 2020 | 2019 | $ | % | 2020 | 2019 | $ | % | |||||||||||||||||||||||||||||||||||||||||||||||||||||||||||||||||||||||||||||||||||||||||||||||||||||||||||||||||||||||||||||||||||||||||||||||
| (Dollars in thousands) | (Dollars in thousands) | |||||||||||||||||||||||||||||||||||||||||||||||||||||||||||||||||||||||||||||||||||||||||||||||||||||||||||||||||||||||||||||||||||||||||||||||||||||||||
| Net interest income | Net interest income | $ | 38,228 | $ | 33,605 | $ | 4,623 | 14 | % | Net interest income | $ | 41,157 | $ | 34,874 | $ | 6,283 | 18 | % | $ | 79,385 | $ | 68,479 | $ | 10,906 | 16 | % | ||||||||||||||||||||||||||||||||||||||||||||||||||||||||||||||||||||||||||||||||||||||||||||||||||||||||||||||||||||||||||||||||
| Provision for loan losses | Provision for loan losses | 13,950 | 2,850 | 11,100 | 389 | Provision for loan losses | 21,000 | 2,850 | 18,150 | 637 | 34,950 | 5,700 | 29,250 | 513 | ||||||||||||||||||||||||||||||||||||||||||||||||||||||||||||||||||||||||||||||||||||||||||||||||||||||||||||||||||||||||||||||||||||||||||||
| Non-interest income | Non-interest income | 2,095 | 1,645 | 450 | 27 | Non-interest income | 2,634 | 1,672 | 962 | 58 | 4,729 | 3,317 | 1,412 | 43 | ||||||||||||||||||||||||||||||||||||||||||||||||||||||||||||||||||||||||||||||||||||||||||||||||||||||||||||||||||||||||||||||||||||||||||||
| Non-interest expense | Non-interest expense | 22,223 | 22,631 | (408) | (2) | Non-interest expense | 31,010 | 21,960 | 9,050 | 41 | 53,233 | 44,591 | 8,642 | 19 | ||||||||||||||||||||||||||||||||||||||||||||||||||||||||||||||||||||||||||||||||||||||||||||||||||||||||||||||||||||||||||||||||||||||||||||
| Income taxes | 293 | 419 | (126) | (30) | ||||||||||||||||||||||||||||||||||||||||||||||||||||||||||||||||||||||||||||||||||||||||||||||||||||||||||||||||||||||||||||||||||||||||||||||||||||||
| Net income | $ | 3,857 | $ | 9,350 | $ | (5,493) | (59) | % | ||||||||||||||||||||||||||||||||||||||||||||||||||||||||||||||||||||||||||||||||||||||||||||||||||||||||||||||||||||||||||||||||||||||||||||||||||
| Income tax expense (benefit) | Income tax expense (benefit) | (863) | 2,297 | (3,160) | (138) | (570) | 2,716 | (3,286) | (121) | |||||||||||||||||||||||||||||||||||||||||||||||||||||||||||||||||||||||||||||||||||||||||||||||||||||||||||||||||||||||||||||||||||||||||||||||||
| Net income (loss) | Net income (loss) | $ | (7,356) | $ | 9,439 | $ | (16,795) | (178) | % | $ | (3,499) | $ | 18,789 | $ | (22,288) | (119) | % | |||||||||||||||||||||||||||||||||||||||||||||||||||||||||||||||||||||||||||||||||||||||||||||||||||||||||||||||||||||||||||||||||||||||||
| Preferred dividends | Preferred dividends | — | 175 | (175) | (100) | Preferred dividends | — | — | — | — | — | 175 | (175) | (100) | ||||||||||||||||||||||||||||||||||||||||||||||||||||||||||||||||||||||||||||||||||||||||||||||||||||||||||||||||||||||||||||||||||||||||||||
| Net income available to common shareholders | $ | 3,857 | $ | 9,175 | $ | (5,318) | (58) | % | ||||||||||||||||||||||||||||||||||||||||||||||||||||||||||||||||||||||||||||||||||||||||||||||||||||||||||||||||||||||||||||||||||||||||||||||||||
| Net income (loss) available to common shareholders | Net income (loss) available to common shareholders | $ | (7,356) | $ | 9,439 | $ | (16,795) | (178) | % | $ | (3,499) | $ | 18,614 | $ | (22,113) | (119) | % | |||||||||||||||||||||||||||||||||||||||||||||||||||||||||||||||||||||||||||||||||||||||||||||||||||||||||||||||||||||||||||||||||||||||||
Non-GAAP core operating income(1) | Non-GAAP core operating income(1) | $ | 3,857 | $ | 7,989 | $ | (4,132) | (52) | % | Non-GAAP core operating income(1) | $ | 41 | $ | 9,754 | $ | (9,713) | (100) | % | $ | 3,898 | $ | 17,743 | $ | (13,845) | (78) | % | ||||||||||||||||||||||||||||||||||||||||||||||||||||||||||||||||||||||||||||||||||||||||||||||||||||||||||||||||||||||||||||||||
(1) Non-GAAP core operating income is a non-GAAP financial measure. The most directly comparable measure under GAAP is net income. See “GAAP Reconciliation and Management Explanation of Non-GAAP Financial Measures” for a reconciliation of this measure. | (1) Non-GAAP core operating income is a non-GAAP financial measure. The most directly comparable measure under GAAP is net income. See “GAAP Reconciliation and Management Explanation of Non-GAAP Financial Measures” for a reconciliation of this measure. | (1) Non-GAAP core operating income is a non-GAAP financial measure. The most directly comparable measure under GAAP is net income. See “GAAP Reconciliation and Management Explanation of Non-GAAP Financial Measures” for a reconciliation of this measure. | ||||||||||||||||||||||||||||||||||||||||||||||||||||||||||||||||||||||||||||||||||||||||||||||||||||||||||||||||||||||||||||||||||||||||||||||||||||||||
| Three Months Ended | Three Months Ended | |||||||||||||||||||||||||||||||||||||||||||||||||||||||||||||||||||||||||||||||||||||||||||||||||||||||||||||||||||||||||||||||||||||||||||||
| March 31, | June 30, | |||||||||||||||||||||||||||||||||||||||||||||||||||||||||||||||||||||||||||||||||||||||||||||||||||||||||||||||||||||||||||||||||||||||||||||
| 2020 | 2019 | 2020 | 2019 | |||||||||||||||||||||||||||||||||||||||||||||||||||||||||||||||||||||||||||||||||||||||||||||||||||||||||||||||||||||||||||||||||||||||||||
| Average Balance | Interest Income / Expense | Average Yield / Rate(4) | Average Balance | Interest Income / Expense | Average Yield / Rate(4) | Average Balance | Interest Income / Expense | Average Yield / Rate(4) | Average Balance | Interest Income / Expense | Average Yield / Rate(4) | |||||||||||||||||||||||||||||||||||||||||||||||||||||||||||||||||||||||||||||||||||||||||||||||||||||||||||||||||||||||||||||||||||
| (Dollars in thousands) | (Dollars in thousands) | |||||||||||||||||||||||||||||||||||||||||||||||||||||||||||||||||||||||||||||||||||||||||||||||||||||||||||||||||||||||||||||||||||||||||||||
| Interest-earning assets: | Interest-earning assets: | Interest-earning assets: | ||||||||||||||||||||||||||||||||||||||||||||||||||||||||||||||||||||||||||||||||||||||||||||||||||||||||||||||||||||||||||||||||||||||||||||
| Securities - taxable | Securities - taxable | $ | 308,671 | $ | 2,066 | 2.69 | % | $ | 322,630 | $ | 2,573 | 3.23 | % | Securities - taxable | $ | 290,342 | $ | 1,626 | 2.25 | % | $ | 345,005 | $ | 2,611 | 3.04 | % | ||||||||||||||||||||||||||||||||||||||||||||||||||||||||||||||||||||||||||||||||||||||||||||||||||||||||||||||||||||
Securities - tax-exempt(1) | Securities - tax-exempt(1) | 451,443 | 4,007 | 3.57 | 368,291 | 3,551 | 3.91 | Securities - tax-exempt(1) | 438,525 | 3,945 | 3.62 | 374,750 | 3,529 | 3.78 | ||||||||||||||||||||||||||||||||||||||||||||||||||||||||||||||||||||||||||||||||||||||||||||||||||||||||||||||||||||||||||||||||
| Federal funds sold | Federal funds sold | 4,136 | 18 | 1.74 | 24,756 | 159 | 2.61 | Federal funds sold | — | — | — | 15,165 | 96 | 2.55 | ||||||||||||||||||||||||||||||||||||||||||||||||||||||||||||||||||||||||||||||||||||||||||||||||||||||||||||||||||||||||||||||||
| Interest-bearing deposits in other banks | Interest-bearing deposits in other banks | 158,044 | 473 | 1.20 | 121,945 | 647 | 2.15 | Interest-bearing deposits in other banks | 186,388 | 45 | 0.10 | 110,460 | 580 | 2.10 | ||||||||||||||||||||||||||||||||||||||||||||||||||||||||||||||||||||||||||||||||||||||||||||||||||||||||||||||||||||||||||||||||
Gross loans, net of unearned income(2)(3) | Gross loans, net of unearned income(2)(3) | 3,905,005 | 48,339 | 4.98 | 3,176,346 | 45,003 | 5.75 | Gross loans, net of unearned income(2)(3) | 4,357,055 | 46,323 | 4.28 | 3,398,297 | 47,989 | 5.66 | ||||||||||||||||||||||||||||||||||||||||||||||||||||||||||||||||||||||||||||||||||||||||||||||||||||||||||||||||||||||||||||||||
Total interest-earning assets(1) | Total interest-earning assets(1) | 4,827,299 | $ | 54,903 | 4.57 | % | 4,013,968 | $ | 51,933 | 5.25 | % | Total interest-earning assets(1) | 5,272,310 | $ | 51,939 | 3.96 | % | 4,243,677 | $ | 54,805 | 5.18 | % | ||||||||||||||||||||||||||||||||||||||||||||||||||||||||||||||||||||||||||||||||||||||||||||||||||||||||||||||||||||||||
| Allowance for loan losses | Allowance for loan losses | (57,627) | (39,340) | Allowance for loan losses | (60,889) | (41,277) | ||||||||||||||||||||||||||||||||||||||||||||||||||||||||||||||||||||||||||||||||||||||||||||||||||||||||||||||||||||||||||||||||||||||||
| Other non-interest-earning assets | Other non-interest-earning assets | 205,859 | 193,615 | Other non-interest-earning assets | 230,092 | 199,602 | ||||||||||||||||||||||||||||||||||||||||||||||||||||||||||||||||||||||||||||||||||||||||||||||||||||||||||||||||||||||||||||||||||||||||
| Total assets | Total assets | $ | 4,975,531 | $ | 4,168,243 | Total assets | $ | 5,441,513 | $ | 4,402,002 | ||||||||||||||||||||||||||||||||||||||||||||||||||||||||||||||||||||||||||||||||||||||||||||||||||||||||||||||||||||||||||||||||||||
| Interest-bearing liabilities | Interest-bearing liabilities | Interest-bearing liabilities | ||||||||||||||||||||||||||||||||||||||||||||||||||||||||||||||||||||||||||||||||||||||||||||||||||||||||||||||||||||||||||||||||||||||||||||
| Transaction deposits | Transaction deposits | $ | 341,497 | $ | 865 | 1.02 | % | $ | 104,008 | $ | 276 | 1.08 | % | Transaction deposits | $ | 413,870 | $ | 266 | 0.26 | % | $ | 144,020 | $ | 477 | 1.33 | % | ||||||||||||||||||||||||||||||||||||||||||||||||||||||||||||||||||||||||||||||||||||||||||||||||||||||||||||||||||||
| Savings and money market deposits | Savings and money market deposits | 1,886,785 | 6,735 | 1.44 | 1,543,925 | 8,818 | 2.32 | Savings and money market deposits | 1,932,723 | 2,653 | 0.55 | 1,559,979 | 8,955 | 2.30 | ||||||||||||||||||||||||||||||||||||||||||||||||||||||||||||||||||||||||||||||||||||||||||||||||||||||||||||||||||||||||||||||||
| Time deposits | Time deposits | 1,165,800 | 6,672 | 2.30 | 1,164,613 | 6,827 | 2.38 | Time deposits | 1,195,445 | 5,486 | 1.85 | 1,305,244 | 8,065 | 2.48 | ||||||||||||||||||||||||||||||||||||||||||||||||||||||||||||||||||||||||||||||||||||||||||||||||||||||||||||||||||||||||||||||||
| Total interest-bearing deposits | Total interest-bearing deposits | 3,394,082 | 14,272 | 1.69 | 2,812,546 | 15,921 | 2.30 | Total interest-bearing deposits | 3,542,038 | 8,405 | 0.95 | 3,009,243 | 17,497 | 2.33 | ||||||||||||||||||||||||||||||||||||||||||||||||||||||||||||||||||||||||||||||||||||||||||||||||||||||||||||||||||||||||||||||||
| FHLB and short-term borrowings | FHLB and short-term borrowings | 391,143 | 1,673 | 1.72 | 383,114 | 1,753 | 1.86 | FHLB and short-term borrowings | 496,556 | 1,668 | 1.35 | 371,624 | 1,784 | 1.93 | ||||||||||||||||||||||||||||||||||||||||||||||||||||||||||||||||||||||||||||||||||||||||||||||||||||||||||||||||||||||||||||||||
| Trust preferred securities, net of fair value adjustments | Trust preferred securities, net of fair value adjustments | 923 | 35 | 14.69 | 885 | 38 | 17.41 | Trust preferred securities, net of fair value adjustments | 933 | 24 | 10.61 | 895 | 37 | 16.79 | ||||||||||||||||||||||||||||||||||||||||||||||||||||||||||||||||||||||||||||||||||||||||||||||||||||||||||||||||||||||||||||||||
| Non-interest-bearing deposits | Non-interest-bearing deposits | 540,318 | — | — | 477,236 | — | — | Non-interest-bearing deposits | 745,864 | — | — | 513,320 | — | — | ||||||||||||||||||||||||||||||||||||||||||||||||||||||||||||||||||||||||||||||||||||||||||||||||||||||||||||||||||||||||||||||||
| Cost of funds | Cost of funds | 4,326,466 | $ | 15,980 | 1.49 | % | 3,673,781 | $ | 17,712 | 1.96 | % | Cost of funds | 4,785,391 | $ | 10,097 | 0.85 | % | 3,895,082 | $ | 19,318 | 1.99 | % | ||||||||||||||||||||||||||||||||||||||||||||||||||||||||||||||||||||||||||||||||||||||||||||||||||||||||||||||||||||||||
| Other liabilities | Other liabilities | 36,106 | 18,289 | Other liabilities | 44,656 | 20,040 | ||||||||||||||||||||||||||||||||||||||||||||||||||||||||||||||||||||||||||||||||||||||||||||||||||||||||||||||||||||||||||||||||||||||||
| Stockholders’ equity | Stockholders’ equity | 612,959 | 476,173 | Stockholders’ equity | 611,466 | 486,880 | ||||||||||||||||||||||||||||||||||||||||||||||||||||||||||||||||||||||||||||||||||||||||||||||||||||||||||||||||||||||||||||||||||||||||
| Total liabilities and stockholders’ equity | Total liabilities and stockholders’ equity | $ | 4,975,531 | $ | 4,168,243 | Total liabilities and stockholders’ equity | $ | 5,441,513 | $ | 4,402,002 | ||||||||||||||||||||||||||||||||||||||||||||||||||||||||||||||||||||||||||||||||||||||||||||||||||||||||||||||||||||||||||||||||||||
Net interest income(1) | Net interest income(1) | $ | 38,923 | $ | 34,221 | Net interest income(1) | $ | 41,842 | $ | 35,487 | ||||||||||||||||||||||||||||||||||||||||||||||||||||||||||||||||||||||||||||||||||||||||||||||||||||||||||||||||||||||||||||||||||||
Net interest spread(1) | Net interest spread(1) | 3.08 | % | 3.29 | % | Net interest spread(1) | 3.11 | % | 3.19 | % | ||||||||||||||||||||||||||||||||||||||||||||||||||||||||||||||||||||||||||||||||||||||||||||||||||||||||||||||||||||||||||||||||||||
Net interest margin(1) | Net interest margin(1) | 3.24 | % | 3.46 | % | Net interest margin(1) | 3.19 | % | 3.35 | % | ||||||||||||||||||||||||||||||||||||||||||||||||||||||||||||||||||||||||||||||||||||||||||||||||||||||||||||||||||||||||||||||||||||
(1) Tax exempt income is calculated on a tax equivalent basis. Tax-free municipal securities are exempt from Federal taxes. The incremental tax rate used is 21.0%. | (1) Tax exempt income is calculated on a tax equivalent basis. Tax-free municipal securities are exempt from Federal taxes. The incremental tax rate used is 21.0%. | (1) Tax exempt income is calculated on a tax equivalent basis. Tax-free municipal securities are exempt from Federal taxes. The incremental tax rate used is 21.0%. | ||||||||||||||||||||||||||||||||||||||||||||||||||||||||||||||||||||||||||||||||||||||||||||||||||||||||||||||||||||||||||||||||||||||||||||
(2) Loans, net of unearned income includes non-accrual loans of $26 million and $13 million as of March 31, 2020 and 2019, respectively. | ||||||||||||||||||||||||||||||||||||||||||||||||||||||||||||||||||||||||||||||||||||||||||||||||||||||||||||||||||||||||||||||||||||||||||||||
(3) Loan interest income includes loan fees of $2 million and $2 million for the three months ended March 31, 2020 and 2019, respectively. | ||||||||||||||||||||||||||||||||||||||||||||||||||||||||||||||||||||||||||||||||||||||||||||||||||||||||||||||||||||||||||||||||||||||||||||||
(2) Loans, net of unearned income includes non-accrual loans of $38 million and $50 million as of June 30, 2020 and 2019, respectively. | (2) Loans, net of unearned income includes non-accrual loans of $38 million and $50 million as of June 30, 2020 and 2019, respectively. | |||||||||||||||||||||||||||||||||||||||||||||||||||||||||||||||||||||||||||||||||||||||||||||||||||||||||||||||||||||||||||||||||||||||||||||
(3) Loan interest income includes loan fees of $4 million and $2 million for the three months ended June 30, 2020 and 2019, respectively. | (3) Loan interest income includes loan fees of $4 million and $2 million for the three months ended June 30, 2020 and 2019, respectively. | |||||||||||||||||||||||||||||||||||||||||||||||||||||||||||||||||||||||||||||||||||||||||||||||||||||||||||||||||||||||||||||||||||||||||||||
(4) Actual unrounded values are used to calculate the reported yield or rate disclosed. Accordingly, recalculations using the amounts in thousands as disclosed in this report may not produce the same amounts. | (4) Actual unrounded values are used to calculate the reported yield or rate disclosed. Accordingly, recalculations using the amounts in thousands as disclosed in this report may not produce the same amounts. | (4) Actual unrounded values are used to calculate the reported yield or rate disclosed. Accordingly, recalculations using the amounts in thousands as disclosed in this report may not produce the same amounts. | ||||||||||||||||||||||||||||||||||||||||||||||||||||||||||||||||||||||||||||||||||||||||||||||||||||||||||||||||||||||||||||||||||||||||||||
| Six Months Ended | |||||||||||||||||||||||||||||||||||||||||||||||||||||||||||||||||||||||
| June 30, | |||||||||||||||||||||||||||||||||||||||||||||||||||||||||||||||||||||||
| 2020 | 2019 | ||||||||||||||||||||||||||||||||||||||||||||||||||||||||||||||||||||||
| Average Balance | Interest Income / Expense | Average Yield / Rate(4) | Average Balance | Interest Income / Expense | Average Yield / Rate(4) | ||||||||||||||||||||||||||||||||||||||||||||||||||||||||||||||||||
| (Dollars in thousands) | |||||||||||||||||||||||||||||||||||||||||||||||||||||||||||||||||||||||
| Interest-earning assets: | |||||||||||||||||||||||||||||||||||||||||||||||||||||||||||||||||||||||
| Securities - taxable | $ | 299,456 | $ | 3,692 | 2.48 | % | $ | 333,879 | $ | 5,184 | 3.13 | % | |||||||||||||||||||||||||||||||||||||||||||||||||||||||||||
Securities - tax-exempt(1) | 444,948 | 7,952 | 3.59 | 371,538 | 7,080 | 3.84 | |||||||||||||||||||||||||||||||||||||||||||||||||||||||||||||||||
| Federal funds sold | 2,057 | 18 | 1.74 | 19,934 | 256 | 2.59 | |||||||||||||||||||||||||||||||||||||||||||||||||||||||||||||||||
| Interest-bearing deposits in other banks | 172,294 | 518 | 0.60 | 116,171 | 1,226 | 2.13 | |||||||||||||||||||||||||||||||||||||||||||||||||||||||||||||||||
Gross loans, net of unearned income(2)(3) | 4,132,279 | 94,662 | 4.61 | 3,287,935 | 92,992 | 5.70 | |||||||||||||||||||||||||||||||||||||||||||||||||||||||||||||||||
Total interest-earning assets(1) | 5,051,034 | $ | 106,842 | 4.25 | % | 4,129,457 | $ | 106,738 | 5.21 | % | |||||||||||||||||||||||||||||||||||||||||||||||||||||||||||||
| Allowance for loan losses | (59,267) | (40,314) | |||||||||||||||||||||||||||||||||||||||||||||||||||||||||||||||||||||
| Other non-interest-earning assets | 218,043 | 196,625 | |||||||||||||||||||||||||||||||||||||||||||||||||||||||||||||||||||||
| Total assets | $ | 5,209,810 | $ | 4,285,768 | |||||||||||||||||||||||||||||||||||||||||||||||||||||||||||||||||||
| Interest-bearing liabilities | |||||||||||||||||||||||||||||||||||||||||||||||||||||||||||||||||||||||
| Transaction deposits | $ | 377,883 | $ | 1,131 | 0.60 | % | $ | 124,125 | $ | 753 | 1.22 | % | |||||||||||||||||||||||||||||||||||||||||||||||||||||||||||
| Savings and money market deposits | 1,909,881 | 9,388 | 0.99 | 1,551,996 | 17,773 | 2.31 | |||||||||||||||||||||||||||||||||||||||||||||||||||||||||||||||||
| Time deposits | 1,180,704 | 12,158 | 2.07 | 1,235,317 | 14,892 | 2.43 | |||||||||||||||||||||||||||||||||||||||||||||||||||||||||||||||||
| Total interest-bearing deposits | 3,468,468 | 22,677 | 1.31 | 2,911,438 | 33,418 | 2.31 | |||||||||||||||||||||||||||||||||||||||||||||||||||||||||||||||||
| FHLB and short-term borrowings | 444,141 | 3,342 | 1.51 | 377,338 | 3,537 | 1.89 | |||||||||||||||||||||||||||||||||||||||||||||||||||||||||||||||||
| Trust preferred securities, net of fair value adjustments | 928 | 58 | 12.64 | 890 | 75 | 17.10 | |||||||||||||||||||||||||||||||||||||||||||||||||||||||||||||||||
| Non-interest-bearing deposits | 643,659 | — | — | 495,377 | — | — | |||||||||||||||||||||||||||||||||||||||||||||||||||||||||||||||||
| Cost of funds | 4,557,196 | $ | 26,077 | 1.15 | % | 3,785,043 | $ | 37,030 | 1.97 | % | |||||||||||||||||||||||||||||||||||||||||||||||||||||||||||||
| Other liabilities | 40,406 | 19,169 | |||||||||||||||||||||||||||||||||||||||||||||||||||||||||||||||||||||
| Stockholders’ equity | 612,208 | 481,556 | |||||||||||||||||||||||||||||||||||||||||||||||||||||||||||||||||||||
| Total liabilities and stockholders’ equity | $ | 5,209,810 | $ | 4,285,768 | |||||||||||||||||||||||||||||||||||||||||||||||||||||||||||||||||||
Net interest income(1) | $ | 80,765 | $ | 69,708 | |||||||||||||||||||||||||||||||||||||||||||||||||||||||||||||||||||
Net interest spread(1) | 3.10 | % | 3.24 | % | |||||||||||||||||||||||||||||||||||||||||||||||||||||||||||||||||||
Net interest margin(1) | 3.22 | % | 3.40 | % | |||||||||||||||||||||||||||||||||||||||||||||||||||||||||||||||||||
(1) Tax exempt income is calculated on a tax equivalent basis. Tax-free municipal securities are exempt from Federal taxes. The incremental tax rate used is 21.0%. | |||||||||||||||||||||||||||||||||||||||||||||||||||||||||||||||||||||||
(2) Loans, net of unearned income includes non-accrual loans of $38 million and $50 million as of June 30, 2020 and 2019, respectively. | |||||||||||||||||||||||||||||||||||||||||||||||||||||||||||||||||||||||
(3) Loan interest income includes loan fees of $6 million and $4 million for the six months ended June 30, 2020 and 2019, respectively. | |||||||||||||||||||||||||||||||||||||||||||||||||||||||||||||||||||||||
(4) Actual unrounded values are used to calculate the reported yield or rate disclosed. Accordingly, recalculations using the amounts in thousands as disclosed in this report may not produce the same amounts. | |||||||||||||||||||||||||||||||||||||||||||||||||||||||||||||||||||||||
| Three Months Ended | Three Months Ended | Six Months Ended | ||||||||||||||||||||||||||||||||||||||||||||||||||||||||||||||||||||||||||||||||||||||||||||||||||||||||||||||||||||||||||||||||
| March 31, 2020 over 2019 | June 30, 2020 over 2019 | June 30, 2020 over 2019 | ||||||||||||||||||||||||||||||||||||||||||||||||||||||||||||||||||||||||||||||||||||||||||||||||||||||||||||||||||||||||||||||||
| Average Volume | Yield/Rate | Net Change(2) | Average Volume | Yield/Rate | Net Change(2) | Average Volume | Yield/Rate | Net Change(2) | ||||||||||||||||||||||||||||||||||||||||||||||||||||||||||||||||||||||||||||||||||||||||||||||||||||||||||||||||||||||||||
| (Dollars in thousands) | (Dollars in thousands) | |||||||||||||||||||||||||||||||||||||||||||||||||||||||||||||||||||||||||||||||||||||||||||||||||||||||||||||||||||||||||||||||||
| Interest Income | Interest Income | Interest Income | ||||||||||||||||||||||||||||||||||||||||||||||||||||||||||||||||||||||||||||||||||||||||||||||||||||||||||||||||||||||||||||||||
| Securities - taxable | Securities - taxable | $ | (104) | $ | (403) | $ | (507) | Securities - taxable | $ | (373) | $ | (612) | $ | (985) | $ | (495) | $ | (997) | $ | (1,492) | ||||||||||||||||||||||||||||||||||||||||||||||||||||||||||||||||||||||||||||||||||||||||||||||||||||||||||||||
Securities - tax-exempt(1) | Securities - tax-exempt(1) | 779 | (323) | 456 | Securities - tax-exempt(1) | 572 | (156) | 416 | 1,351 | (479) | 872 | |||||||||||||||||||||||||||||||||||||||||||||||||||||||||||||||||||||||||||||||||||||||||||||||||||||||||||||||||||||||
| Federal funds sold | Federal funds sold | (101) | (40) | (141) | Federal funds sold | (48) | (48) | (96) | (174) | (64) | (238) | |||||||||||||||||||||||||||||||||||||||||||||||||||||||||||||||||||||||||||||||||||||||||||||||||||||||||||||||||||||||
| Interest-bearing deposits in other banks | Interest-bearing deposits in other banks | 161 | (335) | (174) | Interest-bearing deposits in other banks | 236 | (771) | (535) | 426 | (1,134) | (708) | |||||||||||||||||||||||||||||||||||||||||||||||||||||||||||||||||||||||||||||||||||||||||||||||||||||||||||||||||||||||
| Gross loans, net of unearned income | Gross loans, net of unearned income | 9,785 | (6,449) | 3,336 | Gross loans, net of unearned income | 11,615 | (13,281) | (1,666) | 21,387 | (19,717) | 1,670 | |||||||||||||||||||||||||||||||||||||||||||||||||||||||||||||||||||||||||||||||||||||||||||||||||||||||||||||||||||||||
Total interest income(1) | Total interest income(1) | 10,520 | (7,550) | 2,970 | Total interest income(1) | 12,002 | (14,868) | (2,866) | 22,495 | (22,391) | 104 | |||||||||||||||||||||||||||||||||||||||||||||||||||||||||||||||||||||||||||||||||||||||||||||||||||||||||||||||||||||||
| Interest Expense | Interest Expense | Interest Expense | ||||||||||||||||||||||||||||||||||||||||||||||||||||||||||||||||||||||||||||||||||||||||||||||||||||||||||||||||||||||||||||||||
| Transaction deposits | Transaction deposits | 605 | (16) | 589 | Transaction deposits | 389 | (600) | (211) | 916 | (538) | 378 | |||||||||||||||||||||||||||||||||||||||||||||||||||||||||||||||||||||||||||||||||||||||||||||||||||||||||||||||||||||||
| Savings and money market deposits | Savings and money market deposits | 1,726 | (3,809) | (2,083) | Savings and money market deposits | 1,738 | (8,040) | (6,302) | 3,447 | (11,832) | (8,385) | |||||||||||||||||||||||||||||||||||||||||||||||||||||||||||||||||||||||||||||||||||||||||||||||||||||||||||||||||||||||
| Time deposits | Time deposits | 9 | (164) | (155) | Time deposits | (641) | (1,938) | (2,579) | (628) | (2,106) | (2,734) | |||||||||||||||||||||||||||||||||||||||||||||||||||||||||||||||||||||||||||||||||||||||||||||||||||||||||||||||||||||||
| Total interest-bearing deposits | Total interest-bearing deposits | 2,340 | (3,989) | (1,649) | Total interest-bearing deposits | 1,486 | (10,578) | (9,092) | 3,735 | (14,476) | (10,741) | |||||||||||||||||||||||||||||||||||||||||||||||||||||||||||||||||||||||||||||||||||||||||||||||||||||||||||||||||||||||
| FHLB and short-term borrowings | FHLB and short-term borrowings | 41 | (121) | (80) | FHLB and short-term borrowings | 505 | (621) | (116) | 576 | (771) | (195) | |||||||||||||||||||||||||||||||||||||||||||||||||||||||||||||||||||||||||||||||||||||||||||||||||||||||||||||||||||||||
| Trust preferred securities, net of fair value adjustments | Trust preferred securities, net of fair value adjustments | 2 | (5) | (3) | Trust preferred securities, net of fair value adjustments | 1 | (14) | (13) | 3 | (20) | (17) | |||||||||||||||||||||||||||||||||||||||||||||||||||||||||||||||||||||||||||||||||||||||||||||||||||||||||||||||||||||||
| Total interest expense | Total interest expense | 2,383 | (4,115) | (1,732) | Total interest expense | 1,992 | (11,213) | (9,221) | 4,314 | (15,267) | (10,953) | |||||||||||||||||||||||||||||||||||||||||||||||||||||||||||||||||||||||||||||||||||||||||||||||||||||||||||||||||||||||
Net interest income(1) | Net interest income(1) | $ | 8,137 | $ | (3,435) | $ | 4,702 | Net interest income(1) | $ | 10,010 | $ | (3,655) | $ | 6,355 | $ | 18,181 | $ | (7,124) | $ | 11,057 | ||||||||||||||||||||||||||||||||||||||||||||||||||||||||||||||||||||||||||||||||||||||||||||||||||||||||||||||
(1) Tax exempt income is calculated on a tax equivalent basis. Tax-free municipal securities are exempt from Federal taxes. The incremental tax rate used is 21.0%. | (1) Tax exempt income is calculated on a tax equivalent basis. Tax-free municipal securities are exempt from Federal taxes. The incremental tax rate used is 21.0%. | (1) Tax exempt income is calculated on a tax equivalent basis. Tax-free municipal securities are exempt from Federal taxes. The incremental tax rate used is 21.0%. | ||||||||||||||||||||||||||||||||||||||||||||||||||||||||||||||||||||||||||||||||||||||||||||||||||||||||||||||||||||||||||||||||
(2) The change in interest not due solely to volume or rate has been allocated in proportion to the respective absolute dollar amounts of the change in volume or rate. | (2) The change in interest not due solely to volume or rate has been allocated in proportion to the respective absolute dollar amounts of the change in volume or rate. | (2) The change in interest not due solely to volume or rate has been allocated in proportion to the respective absolute dollar amounts of the change in volume or rate. | ||||||||||||||||||||||||||||||||||||||||||||||||||||||||||||||||||||||||||||||||||||||||||||||||||||||||||||||||||||||||||||||||
| Three Months Ended | |||||||||||||||||||||||||||||||||||||||||||||||||||||||||||||||||
| March 31, | |||||||||||||||||||||||||||||||||||||||||||||||||||||||||||||||||
| Change | |||||||||||||||||||||||||||||||||||||||||||||||||||||||||||||||||
| 2020 | 2019 | $ | % | ||||||||||||||||||||||||||||||||||||||||||||||||||||||||||||||
| (Dollars in thousands) | |||||||||||||||||||||||||||||||||||||||||||||||||||||||||||||||||
| Provision for loan losses | $ | 13,950 | $ | 2,850 | $ | 11,100 | 389 | % | |||||||||||||||||||||||||||||||||||||||||||||||||||||||||
| Three Months Ended | Six Months Ended | ||||||||||||||||||||||||||||||||||||||||||||||||||||||||||||||||||||||||||||||||||||||||
| June 30, | June 30, | ||||||||||||||||||||||||||||||||||||||||||||||||||||||||||||||||||||||||||||||||||||||||
| Change | Change | ||||||||||||||||||||||||||||||||||||||||||||||||||||||||||||||||||||||||||||||||||||||||
| 2020 | 2019 | $ | % | 2020 | 2019 | $ | % | ||||||||||||||||||||||||||||||||||||||||||||||||||||||||||||||||||||||||||||||||||
| (Dollars in thousands) | |||||||||||||||||||||||||||||||||||||||||||||||||||||||||||||||||||||||||||||||||||||||||
| Provision for loan losses | $ | 21,000 | $ | 2,850 | $ | 18,150 | 637 | % | $ | 34,950 | $ | 5,700 | $ | 29,250 | 513 | % | |||||||||||||||||||||||||||||||||||||||||||||||||||||||||||||||||||||||||
| Three Months Ended | Three Months Ended | Six Months Ended | ||||||||||||||||||||||||||||||||||||||||||||||||||||||||||||||||||||||||||||||||||||||||||||||||||||||||||||||||||||||||||||||||||||||||||||||||||||||||
| March 31, | June 30, | June 30, | ||||||||||||||||||||||||||||||||||||||||||||||||||||||||||||||||||||||||||||||||||||||||||||||||||||||||||||||||||||||||||||||||||||||||||||||||||||||||
| Change | Change | Change | ||||||||||||||||||||||||||||||||||||||||||||||||||||||||||||||||||||||||||||||||||||||||||||||||||||||||||||||||||||||||||||||||||||||||||||||||||||||||
| 2020 | 2019 | $ | % | 2020 | 2019 | $ | % | 2020 | 2019 | $ | % | |||||||||||||||||||||||||||||||||||||||||||||||||||||||||||||||||||||||||||||||||||||||||||||||||||||||||||||||||||||||||||||||||||||||||||||||
| (Dollars in thousands) | (Dollars in thousands) | |||||||||||||||||||||||||||||||||||||||||||||||||||||||||||||||||||||||||||||||||||||||||||||||||||||||||||||||||||||||||||||||||||||||||||||||||||||||||
| Service charges and fees on customer accounts | Service charges and fees on customer accounts | $ | 508 | $ | 158 | $ | 350 | 222 | % | Service charges and fees on customer accounts | $ | 647 | $ | 211 | $ | 436 | 207 | % | $ | 1,155 | $ | 369 | $ | 786 | 213 | % | ||||||||||||||||||||||||||||||||||||||||||||||||||||||||||||||||||||||||||||||||||||||||||||||||||||||||||||||||||||||||||||||||
| Gain on sale of available-for-sale securities | 393 | 27 | 366 | 1,356 | ||||||||||||||||||||||||||||||||||||||||||||||||||||||||||||||||||||||||||||||||||||||||||||||||||||||||||||||||||||||||||||||||||||||||||||||||||||||
| Gain on sale of available-for-sale debt securities | Gain on sale of available-for-sale debt securities | 320 | 406 | (86) | (21) | 713 | 433 | 280 | 65 | |||||||||||||||||||||||||||||||||||||||||||||||||||||||||||||||||||||||||||||||||||||||||||||||||||||||||||||||||||||||||||||||||||||||||||||||||
| Impairment of premises and equipment held-for-sale | Impairment of premises and equipment held-for-sale | — | (424) | 424 | (100) | — | (424) | 424 | (100) | |||||||||||||||||||||||||||||||||||||||||||||||||||||||||||||||||||||||||||||||||||||||||||||||||||||||||||||||||||||||||||||||||||||||||||||||||
| Gain on sale of loans | Gain on sale of loans | — | 79 | (79) | (100) | Gain on sale of loans | — | 79 | (79) | (100) | — | 158 | (158) | (100) | ||||||||||||||||||||||||||||||||||||||||||||||||||||||||||||||||||||||||||||||||||||||||||||||||||||||||||||||||||||||||||||||||||||||||||||
| Income from bank-owned life insurance | Income from bank-owned life insurance | 456 | 467 | (11) | (2) | Income from bank-owned life insurance | 453 | 473 | (20) | (4) | 909 | 940 | (31) | (3) | ||||||||||||||||||||||||||||||||||||||||||||||||||||||||||||||||||||||||||||||||||||||||||||||||||||||||||||||||||||||||||||||||||||||||||||
| Swap fee income (loss), net | Swap fee income (loss), net | (9) | 377 | (386) | (102) | Swap fee income (loss), net | (32) | 159 | (191) | (120) | (41) | 536 | (577) | (108) | ||||||||||||||||||||||||||||||||||||||||||||||||||||||||||||||||||||||||||||||||||||||||||||||||||||||||||||||||||||||||||||||||||||||||||||
| ATM and credit card interchange income | ATM and credit card interchange income | 485 | 377 | 108 | 29 | ATM and credit card interchange income | 896 | 459 | 437 | 95 | 1,381 | 836 | 545 | 65 | ||||||||||||||||||||||||||||||||||||||||||||||||||||||||||||||||||||||||||||||||||||||||||||||||||||||||||||||||||||||||||||||||||||||||||||
| Other non-interest income | Other non-interest income | 262 | 160 | 102 | 64 | Other non-interest income | 350 | 309 | 41 | 13 | 612 | 469 | 143 | 30 | ||||||||||||||||||||||||||||||||||||||||||||||||||||||||||||||||||||||||||||||||||||||||||||||||||||||||||||||||||||||||||||||||||||||||||||
| Total non-interest income | Total non-interest income | $ | 2,095 | $ | 1,645 | $ | 450 | 27 | % | Total non-interest income | $ | 2,634 | $ | 1,672 | $ | 962 | 58 | % | $ | 4,729 | $ | 3,317 | $ | 1,412 | 43 | % | ||||||||||||||||||||||||||||||||||||||||||||||||||||||||||||||||||||||||||||||||||||||||||||||||||||||||||||||||||||||||||||||||
| Three Months Ended | Three Months Ended | Six Months Ended | ||||||||||||||||||||||||||||||||||||||||||||||||||||||||||||||||||||||||||||||||||||||||||||||||||||||||||||||||||||||||||||||||||||||||||||||||||||||||
| March 31, | June 30, | June 30, | ||||||||||||||||||||||||||||||||||||||||||||||||||||||||||||||||||||||||||||||||||||||||||||||||||||||||||||||||||||||||||||||||||||||||||||||||||||||||
| Change | Change | Change | ||||||||||||||||||||||||||||||||||||||||||||||||||||||||||||||||||||||||||||||||||||||||||||||||||||||||||||||||||||||||||||||||||||||||||||||||||||||||
| 2020 | 2019 | $ | % | 2020 | 2019 | $ | % | 2020 | 2019 | $ | % | |||||||||||||||||||||||||||||||||||||||||||||||||||||||||||||||||||||||||||||||||||||||||||||||||||||||||||||||||||||||||||||||||||||||||||||||
| (Dollars in thousands) | (Dollars in thousands) | |||||||||||||||||||||||||||||||||||||||||||||||||||||||||||||||||||||||||||||||||||||||||||||||||||||||||||||||||||||||||||||||||||||||||||||||||||||||||
| Salary and employee benefits | Salary and employee benefits | $ | 14,390 | $ | 14,590 | $ | (200) | (1) | % | Salary and employee benefits | $ | 14,004 | $ | 14,450 | $ | (446) | (3) | % | $ | 28,394 | $ | 29,040 | (646) | (2) | % | |||||||||||||||||||||||||||||||||||||||||||||||||||||||||||||||||||||||||||||||||||||||||||||||||||||||||||||||||||||||||||||||||
| Occupancy | Occupancy | 2,085 | 2,159 | (74) | (3) | Occupancy | 2,045 | 2,062 | (17) | (1) | 4,130 | 4,221 | (91) | (2) | ||||||||||||||||||||||||||||||||||||||||||||||||||||||||||||||||||||||||||||||||||||||||||||||||||||||||||||||||||||||||||||||||||||||||||||
| Professional fees | Professional fees | 671 | 782 | (111) | (14) | Professional fees | 1,295 | 714 | 581 | 81 | 1,966 | 1,496 | 470 | 31 | ||||||||||||||||||||||||||||||||||||||||||||||||||||||||||||||||||||||||||||||||||||||||||||||||||||||||||||||||||||||||||||||||||||||||||||
| Deposit insurance premiums | Deposit insurance premiums | 1,016 | 837 | 179 | 21 | Deposit insurance premiums | 1,039 | 881 | 158 | 18 | 2,055 | 1,718 | 337 | 20 | ||||||||||||||||||||||||||||||||||||||||||||||||||||||||||||||||||||||||||||||||||||||||||||||||||||||||||||||||||||||||||||||||||||||||||||
| Data processing | Data processing | 692 | 594 | 98 | 16 | Data processing | 721 | 625 | 96 | 15 | 1,413 | 1,219 | 194 | 16 | ||||||||||||||||||||||||||||||||||||||||||||||||||||||||||||||||||||||||||||||||||||||||||||||||||||||||||||||||||||||||||||||||||||||||||||
| Advertising | Advertising | 500 | 713 | (213) | (30) | Advertising | 223 | 477 | (254) | (53) | 723 | 1,190 | (467) | (39) | ||||||||||||||||||||||||||||||||||||||||||||||||||||||||||||||||||||||||||||||||||||||||||||||||||||||||||||||||||||||||||||||||||||||||||||
| Software and communication | Software and communication | 876 | 679 | 197 | 29 | Software and communication | 937 | 828 | 109 | 13 | 1,813 | 1,507 | 306 | 20 | ||||||||||||||||||||||||||||||||||||||||||||||||||||||||||||||||||||||||||||||||||||||||||||||||||||||||||||||||||||||||||||||||||||||||||||
| Depreciation and amortization | 395 | 473 | (78) | (16) | ||||||||||||||||||||||||||||||||||||||||||||||||||||||||||||||||||||||||||||||||||||||||||||||||||||||||||||||||||||||||||||||||||||||||||||||||||||||
| Foreclosed assets, net | Foreclosed assets, net | 1,135 | 19 | 1,116 | 5,874 | 1,154 | 25 | 1,129 | 4,516 | |||||||||||||||||||||||||||||||||||||||||||||||||||||||||||||||||||||||||||||||||||||||||||||||||||||||||||||||||||||||||||||||||||||||||||||||||
| Goodwill impairment | Goodwill impairment | 7,397 | — | 7,397 | — | 7,397 | — | 7,397 | — | |||||||||||||||||||||||||||||||||||||||||||||||||||||||||||||||||||||||||||||||||||||||||||||||||||||||||||||||||||||||||||||||||||||||||||||||||
| Other non-interest expense | Other non-interest expense | 1,598 | 1,804 | (206) | (11) | Other non-interest expense | 2,214 | 1,904 | 310 | 16 | 4,188 | 4,175 | 13 | — | ||||||||||||||||||||||||||||||||||||||||||||||||||||||||||||||||||||||||||||||||||||||||||||||||||||||||||||||||||||||||||||||||||||||||||||
| Total non-interest expense | Total non-interest expense | $ | 22,223 | $ | 22,631 | $ | (408) | (2) | % | Total non-interest expense | $ | 31,010 | $ | 21,960 | $ | 9,050 | 41 | % | $ | 53,233 | $ | 44,591 | $ | 8,642 | 19 | % | ||||||||||||||||||||||||||||||||||||||||||||||||||||||||||||||||||||||||||||||||||||||||||||||||||||||||||||||||||||||||||||||||
| Three Months Ended | Three Months Ended | Six Months Ended | ||||||||||||||||||||||||||||||||||||||||||||||||||||||||||||||||||||||||||||||||||||||||||||||||||||||||||||||||||||||||||||||||||||||||||||||||||||||||
| March 31, | June 30, | June 30, | ||||||||||||||||||||||||||||||||||||||||||||||||||||||||||||||||||||||||||||||||||||||||||||||||||||||||||||||||||||||||||||||||||||||||||||||||||||||||
| Change | Change | Change | ||||||||||||||||||||||||||||||||||||||||||||||||||||||||||||||||||||||||||||||||||||||||||||||||||||||||||||||||||||||||||||||||||||||||||||||||||||||||
| 2020 | 2019 | $ | % | 2020 | 2019 | $ | % | 2020 | 2019 | $ | % | |||||||||||||||||||||||||||||||||||||||||||||||||||||||||||||||||||||||||||||||||||||||||||||||||||||||||||||||||||||||||||||||||||||||||||||||
| (Dollars in thousands) | (Dollars in thousands) | |||||||||||||||||||||||||||||||||||||||||||||||||||||||||||||||||||||||||||||||||||||||||||||||||||||||||||||||||||||||||||||||||||||||||||||||||||||||||
| Income tax expense | $ | 293 | $ | 419 | $ | (126) | (30) | % | ||||||||||||||||||||||||||||||||||||||||||||||||||||||||||||||||||||||||||||||||||||||||||||||||||||||||||||||||||||||||||||||||||||||||||||||||||
| Income tax expense (benefit) | Income tax expense (benefit) | $ | (863) | $ | 2,297 | $ | (3,160) | (138) | % | $ | (570) | $ | 2,716 | $ | (3,286) | (121) | % | |||||||||||||||||||||||||||||||||||||||||||||||||||||||||||||||||||||||||||||||||||||||||||||||||||||||||||||||||||||||||||||||||||||||||
| Effective tax rate | Effective tax rate | 7.1 | % | 4.3 | % | Effective tax rate | 10.5 | % | 19.6 | % | 14.0 | % | 12.6 | % | ||||||||||||||||||||||||||||||||||||||||||||||||||||||||||||||||||||||||||||||||||||||||||||||||||||||||||||||||||||||||||||||||||||||||||||
| As of | Change | As of | Change | |||||||||||||||||||||||||||||||||||||||||||||||||||||||||||||||||||||||||||||||
| March 31, 2020 | December 31, 2019 | $ | % | June 30, 2020 | December 31, 2019 | $ | % | |||||||||||||||||||||||||||||||||||||||||||||||||||||||||||||||||||||||||||
| (Dollars in thousands) | (Dollars in thousands) | |||||||||||||||||||||||||||||||||||||||||||||||||||||||||||||||||||||||||||||||||
| Total assets | Total assets | $ | 5,067,407 | $ | 4,931,233 | $ | 136,174 | 3 | % | Total assets | $ | 5,462,254 | $ | 4,931,233 | $ | 531,021 | 11 | % | ||||||||||||||||||||||||||||||||||||||||||||||||||||||||||||||||
| Cash and cash equivalents | Cash and cash equivalents | 158,987 | 187,320 | (28,333) | (15) | Cash and cash equivalents | 194,371 | 187,320 | 7,051 | 4 | ||||||||||||||||||||||||||||||||||||||||||||||||||||||||||||||||||||||||
| Available-for-sale securities | Available-for-sale securities | 735,231 | 741,634 | (6,403) | (1) | Available-for-sale securities | 700,083 | 741,634 | (41,551) | (6) | ||||||||||||||||||||||||||||||||||||||||||||||||||||||||||||||||||||||||
| Gross loans, net of unearned income | Gross loans, net of unearned income | 4,002,451 | 3,852,244 | 150,207 | 4 | Gross loans, net of unearned income | 4,413,224 | 3,852,244 | 560,980 | 15 | ||||||||||||||||||||||||||||||||||||||||||||||||||||||||||||||||||||||||
| Total deposits | Total deposits | 3,972,822 | 3,923,759 | 49,063 | 1 | Total deposits | 4,304,143 | 3,923,759 | 380,384 | 10 | ||||||||||||||||||||||||||||||||||||||||||||||||||||||||||||||||||||||||
| Federal funds purchased and repurchase agreements | Federal funds purchased and repurchase agreements | 38,946 | 14,921 | 24,025 | 161 | Federal funds purchased and repurchase agreements | 49,881 | 14,921 | 34,960 | 234 | ||||||||||||||||||||||||||||||||||||||||||||||||||||||||||||||||||||||||
| Federal Home Loan Bank advances | Federal Home Loan Bank advances | 402,680 | 358,743 | 43,937 | 12 | Federal Home Loan Bank advances | 450,617 | 358,743 | 91,874 | 26 | ||||||||||||||||||||||||||||||||||||||||||||||||||||||||||||||||||||||||
| Total stockholders’ equity | Total stockholders’ equity | $ | 611,946 | $ | 601,644 | $ | 10,302 | 2 | % | Total stockholders’ equity | $ | 608,092 | $ | 601,644 | $ | 6,448 | 1 | % | ||||||||||||||||||||||||||||||||||||||||||||||||||||||||||||||||
| March 31, 2020 | December 31, 2019 | March 31, 2020 vs. December 31, 2019 | June 30, 2020 | December 31, 2019 | June 30, 2020 vs. December 31, 2019 | |||||||||||||||||||||||||||||||||||||||||||||||||||||||||||||||||||||||||||||||||||||||||||||||||||||||||||||||||||||||||||||
| Amount | % of Gross Loans | Amount | % of Gross Loans | $ Increase (Decrease) | % Increase (Decrease) | Amount | % of Gross Loans | Amount | % of Gross Loans | $ Increase (Decrease) | % Increase (Decrease) | |||||||||||||||||||||||||||||||||||||||||||||||||||||||||||||||||||||||||||||||||||||||||||||||||||||||||||||||||||||||
| (Dollars in thousands) | (Dollars in thousands) | |||||||||||||||||||||||||||||||||||||||||||||||||||||||||||||||||||||||||||||||||||||||||||||||||||||||||||||||||||||||||||||||||
| Commercial | Commercial | $ | 1,355,723 | 34 | % | 1,356,817 | 35 | % | $ | (1,094) | — | % | Commercial | $ | 1,284,919 | 29 | % | $ | 1,356,817 | 35 | % | $ | (71,898) | (5) | % | |||||||||||||||||||||||||||||||||||||||||||||||||||||||||||||||||||||||||||||||||||||||||||||||||||||||||
| Energy | Energy | 398,797 | 10 | 408,573 | 11 | (9,776) | (2) | Energy | 390,346 | 9 | 408,573 | 11 | (18,227) | (4) | ||||||||||||||||||||||||||||||||||||||||||||||||||||||||||||||||||||||||||||||||||||||||||||||||||||||||||||||||||||
| Commercial real estate | Commercial real estate | 1,084,684 | 27 | 1,024,041 | 27 | 60,643 | 6 | Commercial real estate | 1,141,277 | 26 | 1,024,041 | 27 | 117,236 | 11 | ||||||||||||||||||||||||||||||||||||||||||||||||||||||||||||||||||||||||||||||||||||||||||||||||||||||||||||||||||||
| Construction and land development | Construction and land development | 625,145 | 16 | 628,418 | 16 | (3,273) | (1) | Construction and land development | 661,691 | 15 | 628,418 | 16 | 33,273 | 5 | ||||||||||||||||||||||||||||||||||||||||||||||||||||||||||||||||||||||||||||||||||||||||||||||||||||||||||||||||||||
| Residential real estate | Residential real estate | 503,702 | 12 | 398,695 | 10 | 105,007 | 26 | Residential real estate | 536,270 | 12 | 398,695 | 10 | 137,575 | 35 | ||||||||||||||||||||||||||||||||||||||||||||||||||||||||||||||||||||||||||||||||||||||||||||||||||||||||||||||||||||
| PPP | PPP | 369,022 | 8 | — | — | 369,022 | — | |||||||||||||||||||||||||||||||||||||||||||||||||||||||||||||||||||||||||||||||||||||||||||||||||||||||||||||||||||||||||||
| Consumer | Consumer | 43,118 | 1 | 45,163 | 1 | (2,045) | (5) | Consumer | 45,716 | 1 | 45,163 | 1 | 553 | 1 | ||||||||||||||||||||||||||||||||||||||||||||||||||||||||||||||||||||||||||||||||||||||||||||||||||||||||||||||||||||
| Gross loans | Gross loans | 4,011,169 | 100 | % | 3,861,707 | 100 | % | 149,462 | 4 | Gross loans | 4,429,241 | 100 | % | 3,861,707 | 100 | % | 567,534 | 15 | ||||||||||||||||||||||||||||||||||||||||||||||||||||||||||||||||||||||||||||||||||||||||||||||||||||||||||||||||
| Less: Allowance for loan losses | Less: Allowance for loan losses | 51,458 | 56,896 | (5,438) | (10) | Less: Allowance for loan losses | 71,185 | 56,896 | 14,289 | 25 | ||||||||||||||||||||||||||||||||||||||||||||||||||||||||||||||||||||||||||||||||||||||||||||||||||||||||||||||||||||||||
| Less: Net deferred loan fees and costs | Less: Net deferred loan fees and costs | 8,718 | 9,463 | (745) | (8) | Less: Net deferred loan fees and costs | 16,017 | 9,463 | 6,554 | 69 | ||||||||||||||||||||||||||||||||||||||||||||||||||||||||||||||||||||||||||||||||||||||||||||||||||||||||||||||||||||||||
| Net loans | Net loans | $ | 3,950,993 | $ | 3,795,348 | $ | 155,645 | 4 | % | Net loans | $ | 4,342,039 | $ | 3,795,348 | $ | 546,691 | 14 | % | ||||||||||||||||||||||||||||||||||||||||||||||||||||||||||||||||||||||||||||||||||||||||||||||||||||||||||||||||
| March 31, 2020 | December 31, 2019 | June 30, 2020 | December 31, 2019 | |||||||||||||||||||||||||||||||||||||||||||||||||||||||||||||||||||||||||||||||
| Amount | Percent of Allowance to Total Allowance | Amount | Percent of Allowance to Total Allowance | Amount | Percent of Allowance to Total Allowance | Amount | Percent of Allowance to Total Allowance | |||||||||||||||||||||||||||||||||||||||||||||||||||||||||||||||||||||||||||
| (Dollars in thousands) | (Dollars in thousands) | |||||||||||||||||||||||||||||||||||||||||||||||||||||||||||||||||||||||||||||||||
| Commercial | Commercial | $ | 21,129 | 41 | % | 35,864 | 63 | % | Commercial | $ | 26,543 | 37 | % | $ | 35,864 | 63 | % | |||||||||||||||||||||||||||||||||||||||||||||||||||||||||||||||||
| Energy | Energy | 7,599 | 15 | 6,565 | 12 | Energy | 17,372 | 24 | 6,565 | 12 | ||||||||||||||||||||||||||||||||||||||||||||||||||||||||||||||||||||||||
| Commercial real estate | Commercial real estate | 12,623 | 24 | 8,085 | 14 | Commercial real estate | 16,899 | 24 | 8,085 | 14 | ||||||||||||||||||||||||||||||||||||||||||||||||||||||||||||||||||||||||
| Construction and land development | Construction and land development | 5,021 | 10 | 3,516 | 6 | Construction and land development | 5,019 | 7 | 3,516 | 6 | ||||||||||||||||||||||||||||||||||||||||||||||||||||||||||||||||||||||||
| Residential real estate | Residential real estate | 4,687 | 9 | 2,546 | 4 | Residential real estate | 4,868 | 7 | 2,546 | 4 | ||||||||||||||||||||||||||||||||||||||||||||||||||||||||||||||||||||||||
| PPP | PPP | — | — | — | — | |||||||||||||||||||||||||||||||||||||||||||||||||||||||||||||||||||||||||||||
| Consumer | Consumer | 399 | 1 | 320 | 1 | Consumer | 484 | 1 | 320 | 1 | ||||||||||||||||||||||||||||||||||||||||||||||||||||||||||||||||||||||||
| Gross loans | Gross loans | $ | 51,458 | 100 | % | 56,896 | 100 | % | Gross loans | $ | 71,185 | 100 | % | $ | 56,896 | 100 | % | |||||||||||||||||||||||||||||||||||||||||||||||||||||||||||||||||
| Three Months Ended | |||||||||||||||||||||||||||||||||||
| March 31, | |||||||||||||||||||||||||||||||||||
| 2020 | 2019 | ||||||||||||||||||||||||||||||||||
| (Dollars in thousands) | |||||||||||||||||||||||||||||||||||
| Allowance for loan losses: | |||||||||||||||||||||||||||||||||||
| Balance at beginning of period | $ | 56,896 | $ | 37,826 | |||||||||||||||||||||||||||||||
| Provision for loan losses | 13,950 | 2,850 | |||||||||||||||||||||||||||||||||
| Charge-offs: | |||||||||||||||||||||||||||||||||||
| Commercial | (18,077) | (1,254) | |||||||||||||||||||||||||||||||||
| Energy | (1,279) | — | |||||||||||||||||||||||||||||||||
| Commercial real estate | — | — | |||||||||||||||||||||||||||||||||
| Construction and land development | — | — | |||||||||||||||||||||||||||||||||
| Residential real estate | — | — | |||||||||||||||||||||||||||||||||
| Consumer | (104) | (10) | |||||||||||||||||||||||||||||||||
| Total charge-offs | (19,460) | (1,264) | |||||||||||||||||||||||||||||||||
| Recoveries: | |||||||||||||||||||||||||||||||||||
| Commercial | 71 | 13 | |||||||||||||||||||||||||||||||||
| Energy | — | 576 | |||||||||||||||||||||||||||||||||
| Commercial real estate | — | — | |||||||||||||||||||||||||||||||||
| Construction and land development | — | — | |||||||||||||||||||||||||||||||||
| Residential real estate | — | — | |||||||||||||||||||||||||||||||||
| Consumer | 1 | — | |||||||||||||||||||||||||||||||||
| Total recoveries | 72 | 589 | |||||||||||||||||||||||||||||||||
| Net charge-offs | (19,388) | (675) | |||||||||||||||||||||||||||||||||
| Balance at end of period | $ | 51,458 | $ | 40,001 | |||||||||||||||||||||||||||||||
| Allowance for loan losses to total loans | 1.29 | % | 1.22 | % | |||||||||||||||||||||||||||||||
| Allowance for loan losses to nonperforming loans | 195.99 | 307.27 | |||||||||||||||||||||||||||||||||
Net charge-offs to average loans(1) | 2.00 | % | 0.09 | % | |||||||||||||||||||||||||||||||
(1) Interim periods annualized | |||||||||||||||||||||||||||||||||||
| Three Months Ended | Six Months Ended | ||||||||||||||||||||||||||||||||||||||||||||||
| June 30, | June 30, | ||||||||||||||||||||||||||||||||||||||||||||||
| 2020 | 2019 | 2020 | 2019 | ||||||||||||||||||||||||||||||||||||||||||||
| (Dollars in thousands) | |||||||||||||||||||||||||||||||||||||||||||||||
| Allowance for loan losses: | |||||||||||||||||||||||||||||||||||||||||||||||
| Balance at beginning of period | $ | 51,458 | $ | 40,001 | $ | 56,896 | $ | 37,826 | |||||||||||||||||||||||||||||||||||||||
| Provision for loan losses | 21,000 | 2,850 | 34,950 | 5,700 | |||||||||||||||||||||||||||||||||||||||||||
| Charge-offs: | |||||||||||||||||||||||||||||||||||||||||||||||
| Commercial | (87) | — | (18,165) | (1,254) | |||||||||||||||||||||||||||||||||||||||||||
| Energy | (1,000) | — | (2,278) | — | |||||||||||||||||||||||||||||||||||||||||||
| Commercial real estate | — | — | — | — | |||||||||||||||||||||||||||||||||||||||||||
| Construction and land development | — | — | — | — | |||||||||||||||||||||||||||||||||||||||||||
| Residential real estate | (189) | — | (189) | — | |||||||||||||||||||||||||||||||||||||||||||
| PPP | — | — | — | — | |||||||||||||||||||||||||||||||||||||||||||
| Consumer | — | (1) | (104) | (11) | |||||||||||||||||||||||||||||||||||||||||||
| Total charge-offs | (1,276) | (1) | (20,736) | (1,265) | |||||||||||||||||||||||||||||||||||||||||||
| Recoveries: | |||||||||||||||||||||||||||||||||||||||||||||||
| Commercial | 2 | 1 | 73 | 14 | |||||||||||||||||||||||||||||||||||||||||||
| Energy | — | — | — | 576 | |||||||||||||||||||||||||||||||||||||||||||
| Commercial real estate | — | — | — | — | |||||||||||||||||||||||||||||||||||||||||||
| Construction and land development | — | — | — | — | |||||||||||||||||||||||||||||||||||||||||||
| Residential real estate | — | — | — | — | |||||||||||||||||||||||||||||||||||||||||||
| PPP | — | — | — | — | |||||||||||||||||||||||||||||||||||||||||||
| Consumer | 1 | 1 | 2 | 1 | |||||||||||||||||||||||||||||||||||||||||||
| Total recoveries | 3 | 2 | 75 | 591 | |||||||||||||||||||||||||||||||||||||||||||
| Net (charge-offs) recoveries | (1,273) | 1 | (20,661) | (674) | |||||||||||||||||||||||||||||||||||||||||||
| Balance at end of period | $ | 71,185 | $ | 42,852 | $ | 71,185 | $ | 42,852 | |||||||||||||||||||||||||||||||||||||||
| Allowance for loan losses to total loans | 1.61 | % | 1.24 | % | 1.61 | % | 1.24 | % | |||||||||||||||||||||||||||||||||||||||
| Allowance for loan losses to nonperforming loans | 188.6 | 85.2 | 188.6 | 85.2 | |||||||||||||||||||||||||||||||||||||||||||
Net charge-offs to average loans(1) | 0.12 | % | — | % | 1.01 | % | 0.04 | % | |||||||||||||||||||||||||||||||||||||||
(1) Interim periods annualized | |||||||||||||||||||||||||||||||||||||||||||||||
| March 31, 2020 | December 31, 2019 | September 30, 2019 | June 30, 2019 | March 31, 2019 | June 30, 2020 | March 31, 2020 | December 31, 2019 | September 30, 2019 | June 30, 2019 | |||||||||||||||||||||||||||||||||||||||||||||||||||||||||||||||||||||||||||||||||||||||||||||||||
| (Dollars in thousands) | (Dollars in thousands) | |||||||||||||||||||||||||||||||||||||||||||||||||||||||||||||||||||||||||||||||||||||||||||||||||||||||||
| Non-accrual loans | $ | 26,255 | $ | 39,675 | $ | 43,626 | $ | 50,044 | $ | 13,018 | ||||||||||||||||||||||||||||||||||||||||||||||||||||||||||||||||||||||||||||||||||||||||||||||||
| Nonaccrual loans | Nonaccrual loans | $ | 37,534 | $ | 26,255 | $ | 39,675 | $ | 43,626 | $ | 50,044 | |||||||||||||||||||||||||||||||||||||||||||||||||||||||||||||||||||||||||||||||||||||||||||||||
| Loans past due 90 days or more and still accruing | Loans past due 90 days or more and still accruing | — | 4,591 | 642 | 238 | — | Loans past due 90 days or more and still accruing | 220 | — | 4,591 | 642 | 238 | ||||||||||||||||||||||||||||||||||||||||||||||||||||||||||||||||||||||||||||||||||||||||||||||
| Total nonperforming loans | Total nonperforming loans | 26,255 | 44,266 | 44,268 | 50,282 | 13,018 | Total nonperforming loans | 37,754 | 26,255 | 44,266 | 44,268 | 50,282 | ||||||||||||||||||||||||||||||||||||||||||||||||||||||||||||||||||||||||||||||||||||||||||||||
| Foreclosed assets held for sale | Foreclosed assets held for sale | 3,619 | 3,619 | 2,471 | 2,471 | 2,471 | Foreclosed assets held for sale | 2,502 | 3,619 | 3,619 | 2,471 | 2,471 | ||||||||||||||||||||||||||||||||||||||||||||||||||||||||||||||||||||||||||||||||||||||||||||||
| Total nonperforming assets | Total nonperforming assets | $ | 29,874 | $ | 47,885 | $ | 46,739 | $ | 52,753 | $ | 15,489 | Total nonperforming assets | $ | 40,256 | $ | 29,874 | $ | 47,885 | $ | 46,739 | $ | 52,753 | ||||||||||||||||||||||||||||||||||||||||||||||||||||||||||||||||||||||||||||||||||||
| Nonperforming assets to total assets | Nonperforming assets to total assets | 0.59 | % | 0.97 | % | 1.00 | % | 1.18 | % | 0.36 | % | Nonperforming assets to total assets | 0.74 | % | 0.59 | % | 0.97 | % | 1.00 | % | 1.18 | % | ||||||||||||||||||||||||||||||||||||||||||||||||||||||||||||||||||||||||||||||||||||
| Nonperforming loans to total loans | Nonperforming loans to total loans | 0.66 | % | 1.15 | % | 1.22 | % | 1.45 | % | 0.40 | % | Nonperforming loans to total loans | 0.86 | % | 0.66 | % | 1.15 | % | 1.22 | % | 1.45 | % | ||||||||||||||||||||||||||||||||||||||||||||||||||||||||||||||||||||||||||||||||||||
| March 31, 2020 | December 31, 2019 | September 30, 2019 | December 31, 2019 | March 31, 2019 | June 30, 2020 | March 31, 2020 | December 31, 2019 | September 30, 2019 | June 30, 2019 | |||||||||||||||||||||||||||||||||||||||||||||||||||||||||||||||||||||||||||||||||||||||||||||||||
| (Dollars in thousands) | (Dollars in thousands) | |||||||||||||||||||||||||||||||||||||||||||||||||||||||||||||||||||||||||||||||||||||||||||||||||||||||||
| Loan Past Due Detail | Loan Past Due Detail | Loan Past Due Detail | ||||||||||||||||||||||||||||||||||||||||||||||||||||||||||||||||||||||||||||||||||||||||||||||||||||||||
| 30 - 59 days past due | 30 - 59 days past due | $ | 12,934 | $ | 6,292 | $ | 61,941 | $ | 15,967 | $ | 30,450 | 30 - 59 days past due | $ | 14,205 | $ | 12,934 | $ | 6,292 | $ | 61,941 | $ | 15,967 | ||||||||||||||||||||||||||||||||||||||||||||||||||||||||||||||||||||||||||||||||||||
| 60 - 89 days past due | 60 - 89 days past due | 6,604 | 530 | 2,785 | 7,640 | 616 | 60 - 89 days past due | 20,676 | 6,604 | 530 | 2,785 | 7,640 | ||||||||||||||||||||||||||||||||||||||||||||||||||||||||||||||||||||||||||||||||||||||||||||||
| Total 30 - 89 days past due | Total 30 - 89 days past due | $ | 19,538 | $ | 6,822 | $ | 64,726 | $ | 23,607 | $ | 31,066 | Total 30 - 89 days past due | $ | 34,881 | $ | 19,538 | $ | 6,822 | $ | 64,726 | $ | 23,607 | ||||||||||||||||||||||||||||||||||||||||||||||||||||||||||||||||||||||||||||||||||||
| Loans 30 - 89 days past due / gross loans | Loans 30 - 89 days past due / gross loans | 0.49 | % | 0.18 | % | 1.78 | % | 0.68 | % | 0.95 | % | Loans 30 - 89 days past due / gross loans | 0.79 | % | 0.49 | % | 0.18 | % | 1.78 | % | 0.68 | % | ||||||||||||||||||||||||||||||||||||||||||||||||||||||||||||||||||||||||||||||||||||
| Classified Loans | Classified Loans | Classified Loans | ||||||||||||||||||||||||||||||||||||||||||||||||||||||||||||||||||||||||||||||||||||||||||||||||||||||||
| Substandard | $ | 100,431 | $ | 81,413 | $ | 79,536 | $ | 79,190 | $ | 92,450 | ||||||||||||||||||||||||||||||||||||||||||||||||||||||||||||||||||||||||||||||||||||||||||||||||
| Substandard - performing | Substandard - performing | $ | 199,595 | $ | 80,876 | $ | 47,221 | $ | 41,546 | $ | 38,260 | |||||||||||||||||||||||||||||||||||||||||||||||||||||||||||||||||||||||||||||||||||||||||||||||
| Substandard - nonperforming | Substandard - nonperforming | 29,030 | 19,555 | 34,192 | 37,990 | 40,930 | ||||||||||||||||||||||||||||||||||||||||||||||||||||||||||||||||||||||||||||||||||||||||||||||||||||
| Doubtful | Doubtful | 4,088 | 5,483 | 5,637 | 9,115 | 5,083 | Doubtful | 8,504 | 4,088 | 5,483 | 5,637 | 9,115 | ||||||||||||||||||||||||||||||||||||||||||||||||||||||||||||||||||||||||||||||||||||||||||||||
| Loss | Loss | — | — | — | — | — | Loss | — | — | — | — | — | ||||||||||||||||||||||||||||||||||||||||||||||||||||||||||||||||||||||||||||||||||||||||||||||
| Total classified loans | Total classified loans | 104,519 | 86,896 | 85,173 | 88,305 | 97,533 | Total classified loans | 237,129 | 104,519 | 86,896 | 85,173 | 88,305 | ||||||||||||||||||||||||||||||||||||||||||||||||||||||||||||||||||||||||||||||||||||||||||||||
| Foreclosed assets held for sale | Foreclosed assets held for sale | 3,619 | 3,619 | 2,471 | 2,471 | 2,471 | Foreclosed assets held for sale | 2,502 | 3,619 | 3,619 | 2,471 | 2,471 | ||||||||||||||||||||||||||||||||||||||||||||||||||||||||||||||||||||||||||||||||||||||||||||||
| Total classified assets | Total classified assets | $ | 108,138 | $ | 90,515 | $ | 87,644 | $ | 90,776 | $ | 100,004 | Total classified assets | $ | 239,631 | $ | 108,138 | $ | 90,515 | $ | 87,644 | $ | 90,776 | ||||||||||||||||||||||||||||||||||||||||||||||||||||||||||||||||||||||||||||||||||||
| Classified loans / (total capital + ALLL) | Classified loans / (total capital + ALLL) | 15.8 | % | 13.2 | % | 13.2 | % | 16.3 | % | 18.7 | % | Classified loans / (total capital + ALLL) | 34.9 | % | 15.8 | % | 13.2 | % | 13.2 | % | 16.3 | % | ||||||||||||||||||||||||||||||||||||||||||||||||||||||||||||||||||||||||||||||||||||
| Classified assets / (total capital + ALLL) | Classified assets / (total capital + ALLL) | 16.3 | % | 13.7 | % | 13.6 | % | 16.7 | % | 19.2 | % | Classified assets / (total capital + ALLL) | 35.3 | % | 16.3 | % | 13.7 | % | 13.6 | % | 16.7 | % | ||||||||||||||||||||||||||||||||||||||||||||||||||||||||||||||||||||||||||||||||||||
| March 31, 2020 | December 31, 2019 | June 30, 2020 | December 31, 2019 | |||||||||||||||||||||||||||||||
| (Dollars in thousands) | (Dollars in thousands) | |||||||||||||||||||||||||||||||||
| Total on-balance sheet liquidity | Total on-balance sheet liquidity | $ | 845,601 | $ | 888,080 | Total on-balance sheet liquidity | $ | 839,821 | $ | 888,080 | ||||||||||||||||||||||||
| Total off-balance sheet liquidity | Total off-balance sheet liquidity | 475,401 | 524,332 | Total off-balance sheet liquidity | 571,252 | 524,332 | ||||||||||||||||||||||||||||
| Total liquidity | Total liquidity | $ | 1,321,002 | $ | 1,412,412 | Total liquidity | $ | 1,411,073 | $ | 1,412,412 | ||||||||||||||||||||||||
| On-balance sheet liquidity as a percent of assets | On-balance sheet liquidity as a percent of assets | 17 | % | 18 | % | On-balance sheet liquidity as a percent of assets | 15 | % | 18 | % | ||||||||||||||||||||||||
| Total liquidity as a percent of assets | Total liquidity as a percent of assets | 26 | % | 29 | % | Total liquidity as a percent of assets | 26 | % | 29 | % | ||||||||||||||||||||||||
| March 31, 2020 | June 30, 2020 | |||||||||||||||||||||||||||||||||||||||||||||||||||||||||||||||||||||||||||||||||||||||||||||||||||||||||||||||||||||
| Payments Due by Period | Payments Due by Period | |||||||||||||||||||||||||||||||||||||||||||||||||||||||||||||||||||||||||||||||||||||||||||||||||||||||||||||||||||||
| Less than 1 Year | 1 to 2 Years | 2 to 5 Years | More than 5 Years | Total | Less than 1 Year | 1 to 2 Years | 2 to 5 Years | More than 5 Years | Total | |||||||||||||||||||||||||||||||||||||||||||||||||||||||||||||||||||||||||||||||||||||||||||||||||||||||||||||
| (Dollars in thousands) | (Dollars in thousands) | |||||||||||||||||||||||||||||||||||||||||||||||||||||||||||||||||||||||||||||||||||||||||||||||||||||||||||||||||||||
| Time deposits | Time deposits | $ | 830,347 | $ | 119,398 | $ | 153,197 | $ | 120 | $ | 1,103,062 | Time deposits | $ | 932,443 | $ | 97,992 | $ | 129,940 | $ | 166 | $ | 1,160,541 | ||||||||||||||||||||||||||||||||||||||||||||||||||||||||||||||||||||||||||||||||||||||||||||||||
| Fed funds purchased & repurchase agreements | Fed funds purchased & repurchase agreements | 38,946 | — | — | — | 38,946 | Fed funds purchased & repurchase agreements | 49,881 | — | — | — | 49,881 | ||||||||||||||||||||||||||||||||||||||||||||||||||||||||||||||||||||||||||||||||||||||||||||||||||||||||||
| FHLB borrowings and line of credit | 85,000 | 51,500 | 46,080 | 220,100 | 402,680 | |||||||||||||||||||||||||||||||||||||||||||||||||||||||||||||||||||||||||||||||||||||||||||||||||||||||||||||||||
| FHLB advances and line of credit | FHLB advances and line of credit | 163,000 | 21,500 | 51,117 | 215,000 | 450,617 | ||||||||||||||||||||||||||||||||||||||||||||||||||||||||||||||||||||||||||||||||||||||||||||||||||||||||||||||||
| Trust preferred security | Trust preferred security | — | — | — | 2,500 | 2,500 | Trust preferred security | — | — | — | 2,500 | 2,500 | ||||||||||||||||||||||||||||||||||||||||||||||||||||||||||||||||||||||||||||||||||||||||||||||||||||||||||
| Operating leases | Operating leases | 1,711 | 1,580 | 4,449 | 5,845 | 13,585 | Operating leases | 1,638 | 1,588 | 4,370 | 5,525 | 13,121 | ||||||||||||||||||||||||||||||||||||||||||||||||||||||||||||||||||||||||||||||||||||||||||||||||||||||||||
| Total | Total | $ | 956,004 | $ | 172,478 | $ | 203,726 | $ | 228,565 | $ | 1,560,773 | Total | $ | 1,146,962 | $ | 121,080 | $ | 185,427 | $ | 223,191 | $ | 1,676,660 | ||||||||||||||||||||||||||||||||||||||||||||||||||||||||||||||||||||||||||||||||||||||||||||||||
| December 31, 2019 | December 31, 2019 | |||||||||||||||||||||||||||||||||||||||||||||||||||||||||||||||||||||||||||||||||||||||||||||||||||||||||||||||||||||
| Payments Due by Period | Payments Due by Period | |||||||||||||||||||||||||||||||||||||||||||||||||||||||||||||||||||||||||||||||||||||||||||||||||||||||||||||||||||||
| Less than 1 Year | 1 to 2 Years | 2 to 5 Years | More than 5 Years | Total | Less than 1 Year | 1 to 2 Years | 2 to 5 Years | More than 5 Years | Total | |||||||||||||||||||||||||||||||||||||||||||||||||||||||||||||||||||||||||||||||||||||||||||||||||||||||||||||
| (Dollars in thousands) | (Dollars in thousands) | |||||||||||||||||||||||||||||||||||||||||||||||||||||||||||||||||||||||||||||||||||||||||||||||||||||||||||||||||||||
| Time deposits | Time deposits | $ | 925,239 | $ | 152,979 | $ | 161,528 | $ | — | $ | 1,239,746 | Time deposits | $ | 925,239 | $ | 152,979 | $ | 161,528 | $ | — | $ | 1,239,746 | ||||||||||||||||||||||||||||||||||||||||||||||||||||||||||||||||||||||||||||||||||||||||||||||||
| Fed funds purchased & repurchase agreements | Fed funds purchased & repurchase agreements | 14,921 | — | — | — | 14,921 | Fed funds purchased & repurchase agreements | 14,921 | — | — | — | 14,921 | ||||||||||||||||||||||||||||||||||||||||||||||||||||||||||||||||||||||||||||||||||||||||||||||||||||||||||
| FHLB borrowings and line of credit | 45,000 | 51,500 | 56,143 | 206,100 | 358,743 | |||||||||||||||||||||||||||||||||||||||||||||||||||||||||||||||||||||||||||||||||||||||||||||||||||||||||||||||||
| FHLB advances and line of credit | FHLB advances and line of credit | 45,000 | 51,500 | 56,143 | 206,100 | 358,743 | ||||||||||||||||||||||||||||||||||||||||||||||||||||||||||||||||||||||||||||||||||||||||||||||||||||||||||||||||
| Trust preferred security | Trust preferred security | — | — | — | 2,500 | 2,500 | Trust preferred security | — | — | — | 2,500 | 2,500 | ||||||||||||||||||||||||||||||||||||||||||||||||||||||||||||||||||||||||||||||||||||||||||||||||||||||||||
| Operating leases | Operating leases | 1,796 | 1,572 | 4,528 | 6,162 | 14,058 | Operating leases | 1,796 | 1,572 | 4,528 | 6,162 | 14,058 | ||||||||||||||||||||||||||||||||||||||||||||||||||||||||||||||||||||||||||||||||||||||||||||||||||||||||||
| Total | Total | $ | 986,956 | $ | 206,051 | $ | 222,199 | $ | 214,762 | $ | 1,629,968 | Total | $ | 986,956 | $ | 206,051 | $ | 222,199 | $ | 214,762 | $ | 1,629,968 | ||||||||||||||||||||||||||||||||||||||||||||||||||||||||||||||||||||||||||||||||||||||||||||||||
| March 31, 2020 | December 31, 2019 | June 30, 2020 | December 31, 2019 | |||||||||||||||||||||||||||||||||||||
| (Dollars in thousands) | (Dollars in thousands) | |||||||||||||||||||||||||||||||||||||||
| Commitments to fund commercial loans | Commitments to fund commercial loans | $ | 554,243 | $ | 602,456 | Commitments to fund commercial loans | $ | 592,051 | $ | 602,456 | ||||||||||||||||||||||||||||||
| Other loan commitments | Other loan commitments | 833,410 | 884,069 | Other loan commitments | 812,386 | 884,069 | ||||||||||||||||||||||||||||||||||
| Standby letters of credit | Standby letters of credit | 34,828 | 39,035 | Standby letters of credit | 38,342 | 39,035 | ||||||||||||||||||||||||||||||||||
| Lease agreements | Lease agreements | 22,394 | 20,935 | Lease agreements | 17,205 | 20,935 | ||||||||||||||||||||||||||||||||||
| Total | Total | $ | 1,444,875 | $ | 1,546,495 | Total | $ | 1,459,984 | $ | 1,546,495 | ||||||||||||||||||||||||||||||
| Three Months Ended | Three Months Ended | Six Months Ended | ||||||||||||||||||||||||||||||||||||||||||||||||||||||||||||||||||||||||||||||||||||||||||||||||||||||||||||||||||||||||||||||||||||||||||||||||||
| March | December | September | June | March | June | March | December | September | June | June | June | |||||||||||||||||||||||||||||||||||||||||||||||||||||||||||||||||||||||||||||||||||||||||||||||||||||||||||||||||||||||||||||||||||||||||
| 31, | 31, | 30, | 30, | 31, | 30, | 31, | 31, | 30, | 30, | 30, | 30, | |||||||||||||||||||||||||||||||||||||||||||||||||||||||||||||||||||||||||||||||||||||||||||||||||||||||||||||||||||||||||||||||||||||||||
| 2020 | 2019 | 2019 | 2019 | 2019 | 2020 | 2020 | 2019 | 2019 | 2019 | 2020 | 2019 | |||||||||||||||||||||||||||||||||||||||||||||||||||||||||||||||||||||||||||||||||||||||||||||||||||||||||||||||||||||||||||||||||||||||||
| (Dollars in thousands) | (Dollars in thousands) | |||||||||||||||||||||||||||||||||||||||||||||||||||||||||||||||||||||||||||||||||||||||||||||||||||||||||||||||||||||||||||||||||||||||||||||||||||
| Non-GAAP core operating income: | ||||||||||||||||||||||||||||||||||||||||||||||||||||||||||||||||||||||||||||||||||||||||||||||||||||||||||||||||||||||||||||||||||||||||||||||||||||
| Non-GAAP core operating income (loss): | Non-GAAP core operating income (loss): | |||||||||||||||||||||||||||||||||||||||||||||||||||||||||||||||||||||||||||||||||||||||||||||||||||||||||||||||||||||||||||||||||||||||||||||||||||
| Net income (loss) | Net income (loss) | $ | 3,857 | (700) | 10,384 | 9,439 | 9,350 | Net income (loss) | $ | (7,356) | 3,857 | (700) | 10,384 | 9,439 | $ | (3,499) | $ | 18,789 | ||||||||||||||||||||||||||||||||||||||||||||||||||||||||||||||||||||||||||||||||||||||||||||||||||||||||||||||||||||||||||||||||||
| Add: fixed asset impairments | Add: fixed asset impairments | — | — | — | 424 | — | Add: fixed asset impairments | — | — | — | — | 424 | — | 424 | ||||||||||||||||||||||||||||||||||||||||||||||||||||||||||||||||||||||||||||||||||||||||||||||||||||||||||||||||||||||||||||||||||||||
Less: tax effect(1) | Less: tax effect(1) | — | — | — | 109 | — | Less: tax effect(1) | — | — | — | — | 109 | — | 109 | ||||||||||||||||||||||||||||||||||||||||||||||||||||||||||||||||||||||||||||||||||||||||||||||||||||||||||||||||||||||||||||||||||||||
| Fixed asset impairments, net of tax | Fixed asset impairments, net of tax | — | — | — | 315 | — | Fixed asset impairments, net of tax | — | — | — | — | 315 | — | 315 | ||||||||||||||||||||||||||||||||||||||||||||||||||||||||||||||||||||||||||||||||||||||||||||||||||||||||||||||||||||||||||||||||||||||
Add: Goodwill impairment(2) | Add: Goodwill impairment(2) | 7,397 | — | — | — | — | 7,397 | — | ||||||||||||||||||||||||||||||||||||||||||||||||||||||||||||||||||||||||||||||||||||||||||||||||||||||||||||||||||||||||||||||||||||||||||||
Add: state tax credit(2) | Add: state tax credit(2) | — | — | — | — | (1,361) | Add: state tax credit(2) | — | — | — | — | — | — | (1,361) | ||||||||||||||||||||||||||||||||||||||||||||||||||||||||||||||||||||||||||||||||||||||||||||||||||||||||||||||||||||||||||||||||||||||
| Non-GAAP core operating income | $ | 3,857 | $ | (700) | $ | 10,384 | $ | 9,754 | $ | 7,989 | ||||||||||||||||||||||||||||||||||||||||||||||||||||||||||||||||||||||||||||||||||||||||||||||||||||||||||||||||||||||||||||||||||||||||||
| Non-GAAP core operating income (loss) | Non-GAAP core operating income (loss) | $ | 41 | $ | 3,857 | $ | (700) | $ | 10,384 | $ | 9,754 | $ | 3,898 | $ | 17,743 | |||||||||||||||||||||||||||||||||||||||||||||||||||||||||||||||||||||||||||||||||||||||||||||||||||||||||||||||||||||||||||||||||||||
(1) Represents the tax impact of the adjustments above at a tax rate of 25.73%. | (1) Represents the tax impact of the adjustments above at a tax rate of 25.73%. | (1) Represents the tax impact of the adjustments above at a tax rate of 25.73%. | ||||||||||||||||||||||||||||||||||||||||||||||||||||||||||||||||||||||||||||||||||||||||||||||||||||||||||||||||||||||||||||||||||||||||||||||||||
(2) No tax effect. | (2) No tax effect. | (2) No tax effect. | ||||||||||||||||||||||||||||||||||||||||||||||||||||||||||||||||||||||||||||||||||||||||||||||||||||||||||||||||||||||||||||||||||||||||||||||||||
| Three Months Ended | Three Months Ended | Six Months Ended | ||||||||||||||||||||||||||||||||||||||||||||||||||||||||||||||||||||||||||||||||||||||||||||||||||||||||||||||||||||||||||||||||||||||||||||
| March | December | September | June | March | June | March | December | September | June | |||||||||||||||||||||||||||||||||||||||||||||||||||||||||||||||||||||||||||||||||||||||||||||||||||||||||||||||||||||||||||||||||||||
| 31, | 31, | 30, | 30, | 31, | 30, | 31, | 31, | 30, | 30, | June 30, | ||||||||||||||||||||||||||||||||||||||||||||||||||||||||||||||||||||||||||||||||||||||||||||||||||||||||||||||||||||||||||||||||||||
| 2020 | 2019 | 2019 | 2019 | 2019 | 2020 | 2020 | 2019 | 2019 | 2019 | 2020 | 2019 | |||||||||||||||||||||||||||||||||||||||||||||||||||||||||||||||||||||||||||||||||||||||||||||||||||||||||||||||||||||||||||||||||||
| (Dollars in thousands) | (Dollars in thousands) | |||||||||||||||||||||||||||||||||||||||||||||||||||||||||||||||||||||||||||||||||||||||||||||||||||||||||||||||||||||||||||||||||||||||||||||
| Non-GAAP core operating return on average assets: | Non-GAAP core operating return on average assets: | Non-GAAP core operating return on average assets: | ||||||||||||||||||||||||||||||||||||||||||||||||||||||||||||||||||||||||||||||||||||||||||||||||||||||||||||||||||||||||||||||||||||||||||||
| Net income (loss) | Net income (loss) | $ | 3,857 | $ | (700) | $ | 10,384 | $ | 9,439 | $ | 9,350 | Net income (loss) | $ | (7,356) | $ | 3,857 | $ | (700) | $ | 10,384 | $ | 9,439 | $ | (3,499) | $ | 18,789 | ||||||||||||||||||||||||||||||||||||||||||||||||||||||||||||||||||||||||||||||||||||||||||||||||||||||||||||||||||||
| Non-GAAP core operating income | Non-GAAP core operating income | 3,857 | (700) | 10,384 | 9,754 | 7,989 | Non-GAAP core operating income | 41 | 3,857 | (700) | 10,384 | 9,754 | 3,898 | 17,743 | ||||||||||||||||||||||||||||||||||||||||||||||||||||||||||||||||||||||||||||||||||||||||||||||||||||||||||||||||||||||||||||||||
| Average assets | Average assets | $ | 4,975,531 | $ | 4,809,579 | $ | 4,610,958 | $ | 4,402,002 | $ | 4,168,243 | Average assets | $ | 5,441,513 | $ | 4,975,531 | $ | 4,809,579 | $ | 4,610,958 | $ | 4,402,002 | $ | 5,209,810 | $ | 4,285,768 | ||||||||||||||||||||||||||||||||||||||||||||||||||||||||||||||||||||||||||||||||||||||||||||||||||||||||||||||||||||
| Return on average assets | Return on average assets | 0.31 | % | (0.06) | % | 0.89 | % | 0.86 | % | 0.91 | % | Return on average assets | (0.54) | % | 0.31 | % | (0.06) | % | 0.89 | % | 0.86 | % | (0.14) | % | 0.88 | % | ||||||||||||||||||||||||||||||||||||||||||||||||||||||||||||||||||||||||||||||||||||||||||||||||||||||||||||||||||||
| Non-GAAP core operating return on average assets | Non-GAAP core operating return on average assets | 0.31 | % | (0.06) | % | 0.89 | % | 0.89 | % | 0.78 | % | Non-GAAP core operating return on average assets | 0.00 | % | 0.31 | % | (0.06) | % | 0.89 | % | 0.89 | % | 0.15 | % | 0.83 | % | ||||||||||||||||||||||||||||||||||||||||||||||||||||||||||||||||||||||||||||||||||||||||||||||||||||||||||||||||||||
| Non-GAAP core operating return on average equity: | ||||||||||||||||||||||||||||||||||||||||||||||||||||||||||||||||||||||||||||||||||||||||||||||||||||||||||||||||||||||||||||||||||||||||||||||
| Non-GAAP core operating return on average common equity: | Non-GAAP core operating return on average common equity: | |||||||||||||||||||||||||||||||||||||||||||||||||||||||||||||||||||||||||||||||||||||||||||||||||||||||||||||||||||||||||||||||||||||||||||||
| Net income (loss) | Net income (loss) | $ | 3,857 | $ | (700) | $ | 10,384 | $ | 9,439 | $ | 9,350 | Net income (loss) | $ | (7,356) | $ | 3,857 | $ | (700) | $ | 10,384 | $ | 9,439 | $ | (3,499) | $ | 18,789 | ||||||||||||||||||||||||||||||||||||||||||||||||||||||||||||||||||||||||||||||||||||||||||||||||||||||||||||||||||||
| Non-GAAP core operating income | Non-GAAP core operating income | 3,857 | (700) | 10,384 | 9,754 | 7,989 | Non-GAAP core operating income | 41 | 3,857 | (700) | 10,384 | 9,754 | $ | 3,898 | $ | 17,743 | ||||||||||||||||||||||||||||||||||||||||||||||||||||||||||||||||||||||||||||||||||||||||||||||||||||||||||||||||||||||||||||||
| Less: preferred dividends | Less: preferred dividends | — | — | — | — | 175 | Less: preferred dividends | — | — | — | — | — | — | 175 | ||||||||||||||||||||||||||||||||||||||||||||||||||||||||||||||||||||||||||||||||||||||||||||||||||||||||||||||||||||||||||||||||
| Net income (loss) available to common stockholders | Net income (loss) available to common stockholders | 3,857 | (700) | 10,384 | 9,439 | 9,175 | Net income (loss) available to common stockholders | (7,356) | 3,857 | (700) | 10,384 | 9,439 | (3,499) | 18,614 | ||||||||||||||||||||||||||||||||||||||||||||||||||||||||||||||||||||||||||||||||||||||||||||||||||||||||||||||||||||||||||||||||
| Non-GAAP core operating income available to common stockholders | Non-GAAP core operating income available to common stockholders | 3,857 | (700) | 10,384 | 9,754 | 7,814 | Non-GAAP core operating income available to common stockholders | 41 | 3,857 | (700) | 10,384 | 9,754 | 3,898 | 17,568 | ||||||||||||||||||||||||||||||||||||||||||||||||||||||||||||||||||||||||||||||||||||||||||||||||||||||||||||||||||||||||||||||||
| Average common equity | Average common equity | $ | 612,959 | $ | 605,960 | $ | 543,827 | $ | 486,880 | $ | 466,506 | Average common equity | $ | 611,466 | $ | 612,959 | $ | 605,960 | $ | 543,827 | $ | 486,880 | $ | 612,208 | $ | 476,749 | ||||||||||||||||||||||||||||||||||||||||||||||||||||||||||||||||||||||||||||||||||||||||||||||||||||||||||||||||||||
| Return on average equity | Return on average equity | 2.53 | % | (0.46) | % | 7.58 | % | 7.78 | % | 7.98 | % | Return on average equity | (4.84) | % | 2.53 | % | (0.46) | % | 7.58 | % | 7.78 | % | (1.15) | % | 7.87 | % | ||||||||||||||||||||||||||||||||||||||||||||||||||||||||||||||||||||||||||||||||||||||||||||||||||||||||||||||||||||
| Non-GAAP core operating return on average equity | 2.53 | % | (0.46) | % | 7.58 | % | 8.04 | % | 6.79 | % | ||||||||||||||||||||||||||||||||||||||||||||||||||||||||||||||||||||||||||||||||||||||||||||||||||||||||||||||||||||||||||||||||||||
| Non-GAAP core operating return on average common equity | Non-GAAP core operating return on average common equity | 0.03 | % | 2.53 | % | (0.46) | % | 7.58 | % | 8.04 | % | 1.28 | % | 7.43 | % | |||||||||||||||||||||||||||||||||||||||||||||||||||||||||||||||||||||||||||||||||||||||||||||||||||||||||||||||||||||||||||||||
| Three Months Ended | Three Months Ended | Six Months Ended | ||||||||||||||||||||||||||||||||||||||||||||||||||||||||||||||||||||||||||||||||||||||||||||||||||||||||||||||||||||||||||||||||||||||||||||||||||
| March | December | September | June | March | June | March | December | September | June | |||||||||||||||||||||||||||||||||||||||||||||||||||||||||||||||||||||||||||||||||||||||||||||||||||||||||||||||||||||||||||||||||||||||||||
| 31, | 31, | 30, | 30, | 31, | 30, | 31, | 31, | 30, | 30, | June 30, | ||||||||||||||||||||||||||||||||||||||||||||||||||||||||||||||||||||||||||||||||||||||||||||||||||||||||||||||||||||||||||||||||||||||||||
| 2020 | 2019 | 2019 | 2019 | 2019 | 2020 | 2020 | 2019 | 2019 | 2019 | 2020 | 2019 | |||||||||||||||||||||||||||||||||||||||||||||||||||||||||||||||||||||||||||||||||||||||||||||||||||||||||||||||||||||||||||||||||||||||||
| (Dollars in thousands) | (Dollars in thousands) | |||||||||||||||||||||||||||||||||||||||||||||||||||||||||||||||||||||||||||||||||||||||||||||||||||||||||||||||||||||||||||||||||||||||||||||||||||
| Non-GAAP core operating efficiency ratio - tax equivalent | ||||||||||||||||||||||||||||||||||||||||||||||||||||||||||||||||||||||||||||||||||||||||||||||||||||||||||||||||||||||||||||||||||||||||||||||||||||
| Non-interest expense (numerator) | $ | 22,223 | $ | 21,885 | $ | 21,172 | $ | 21,960 | $ | 22,631 | ||||||||||||||||||||||||||||||||||||||||||||||||||||||||||||||||||||||||||||||||||||||||||||||||||||||||||||||||||||||||||||||||||||||||||
| Non-GAAP core operating efficiency ratio - fully tax equivalent | Non-GAAP core operating efficiency ratio - fully tax equivalent | |||||||||||||||||||||||||||||||||||||||||||||||||||||||||||||||||||||||||||||||||||||||||||||||||||||||||||||||||||||||||||||||||||||||||||||||||||
| Non-interest expense | Non-interest expense | $ | 31,010 | $ | 22,223 | $ | 21,885 | $ | 21,172 | $ | 21,960 | $ | 53,233 | $ | 44,591 | |||||||||||||||||||||||||||||||||||||||||||||||||||||||||||||||||||||||||||||||||||||||||||||||||||||||||||||||||||||||||||||||||||||
| Less: goodwill impairment | Less: goodwill impairment | 7,397 | — | — | — | — | 7,397 | — | ||||||||||||||||||||||||||||||||||||||||||||||||||||||||||||||||||||||||||||||||||||||||||||||||||||||||||||||||||||||||||||||||||||||||||||
| Adjusted Non-interest expense (numerator) | Adjusted Non-interest expense (numerator) | 23,613 | 22,223 | 21,885 | 21,172 | 21,960 | 45,836 | 44,591 | ||||||||||||||||||||||||||||||||||||||||||||||||||||||||||||||||||||||||||||||||||||||||||||||||||||||||||||||||||||||||||||||||||||||||||||
| Net interest income | Net interest income | 38,228 | 37,179 | 35,786 | 34,874 | 33,605 | Net interest income | 41,157 | 38,228 | 37,179 | 35,786 | 34,874 | 79,385 | 68,479 | ||||||||||||||||||||||||||||||||||||||||||||||||||||||||||||||||||||||||||||||||||||||||||||||||||||||||||||||||||||||||||||||||||||||
| Tax-equivalent interest income | 695 | 670 | 624 | 612 | 616 | |||||||||||||||||||||||||||||||||||||||||||||||||||||||||||||||||||||||||||||||||||||||||||||||||||||||||||||||||||||||||||||||||||||||||||||||
Tax-equivalent interest income(1) | Tax-equivalent interest income(1) | 685 | 695 | 670 | 624 | 613 | 1,380 | 1,229 | ||||||||||||||||||||||||||||||||||||||||||||||||||||||||||||||||||||||||||||||||||||||||||||||||||||||||||||||||||||||||||||||||||||||||||||
| Non-interest income | Non-interest income | 2,095 | 2,186 | 3,212 | 1,672 | 1,645 | Non-interest income | 2,634 | 2,095 | 2,186 | 3,212 | 1,672 | 4,729 | 3,317 | ||||||||||||||||||||||||||||||||||||||||||||||||||||||||||||||||||||||||||||||||||||||||||||||||||||||||||||||||||||||||||||||||||||||
| Add: fixed asset impairments | Add: fixed asset impairments | — | — | — | 424 | — | Add: fixed asset impairments | — | — | — | — | 424 | — | 424 | ||||||||||||||||||||||||||||||||||||||||||||||||||||||||||||||||||||||||||||||||||||||||||||||||||||||||||||||||||||||||||||||||||||||
| Non-GAAP operating revenue (denominator) | Non-GAAP operating revenue (denominator) | $ | 41,018 | $ | 40,035 | $ | 39,622 | $ | 37,582 | $ | 35,866 | Non-GAAP operating revenue (denominator) | $ | 44,476 | $ | 41,018 | $ | 40,035 | $ | 39,622 | $ | 37,583 | $ | 85,494 | $ | 73,449 | ||||||||||||||||||||||||||||||||||||||||||||||||||||||||||||||||||||||||||||||||||||||||||||||||||||||||||||||||||||||||||
| Efficiency ratio | Efficiency ratio | 55.11 | % | 55.60 | % | 54.29 | % | 60.09 | % | 64.20 | % | Efficiency ratio | 70.81 | % | 55.11 | % | 55.60 | % | 54.29 | % | 60.09 | % | 63.29 | % | 62.11 | % | ||||||||||||||||||||||||||||||||||||||||||||||||||||||||||||||||||||||||||||||||||||||||||||||||||||||||||||||||||||||||||
| Non-GAAP core operating efficiency ratio - tax equivalent | 54.18 | % | 54.66 | % | 53.43 | % | 58.43 | % | 63.10 | % | ||||||||||||||||||||||||||||||||||||||||||||||||||||||||||||||||||||||||||||||||||||||||||||||||||||||||||||||||||||||||||||||||||||||||||
| Non-GAAP core operating efficiency ratio - fully tax equivalent | Non-GAAP core operating efficiency ratio - fully tax equivalent | 53.09 | % | 54.18 | % | 54.66 | % | 53.43 | % | 58.43 | % | 53.61 | % | 60.71 | % | |||||||||||||||||||||||||||||||||||||||||||||||||||||||||||||||||||||||||||||||||||||||||||||||||||||||||||||||||||||||||||||||||||||
(1) Tax exempt income (tax-free municipal securities) is calculated on a tax equivalent basis. The incremental tax rate used is 21.0%. | (1) Tax exempt income (tax-free municipal securities) is calculated on a tax equivalent basis. The incremental tax rate used is 21.0%. | (1) Tax exempt income (tax-free municipal securities) is calculated on a tax equivalent basis. The incremental tax rate used is 21.0%. | ||||||||||||||||||||||||||||||||||||||||||||||||||||||||||||||||||||||||||||||||||||||||||||||||||||||||||||||||||||||||||||||||||||||||||||||||||
| Period Ended | Period Ended | |||||||||||||||||||||||||||||||||||||||||||||||||||||||||||||||||||||||||||||||||||||||||||||||||||||||||
| March | December | September | June | March | June | March | December | September | June | |||||||||||||||||||||||||||||||||||||||||||||||||||||||||||||||||||||||||||||||||||||||||||||||||
| 31, | 31, | 30, | 30, | 31, | 30, | 31, | 31, | 30, | 30, | |||||||||||||||||||||||||||||||||||||||||||||||||||||||||||||||||||||||||||||||||||||||||||||||||
| 2020 | 2019 | 2019 | 2019 | 2019 | 2020 | 2020 | 2019 | 2019 | 2019 | |||||||||||||||||||||||||||||||||||||||||||||||||||||||||||||||||||||||||||||||||||||||||||||||||
| (Dollars in thousands except per share data) | (Dollars in thousands except per share data) | |||||||||||||||||||||||||||||||||||||||||||||||||||||||||||||||||||||||||||||||||||||||||||||||||||||||||
| Tangible common stockholders’ equity: | Tangible common stockholders’ equity: | Tangible common stockholders’ equity: | ||||||||||||||||||||||||||||||||||||||||||||||||||||||||||||||||||||||||||||||||||||||||||||||||||||||||
| Stockholders’ equity | Stockholders’ equity | $ | 611,946 | $ | 601,644 | $ | 602,435 | $ | 499,195 | $ | 480,514 | Stockholders’ equity | $ | 608,092 | $ | 611,946 | $ | 601,644 | $ | 602,435 | $ | 499,195 | ||||||||||||||||||||||||||||||||||||||||||||||||||||||||||||||||||||||||||||||||||||
| Less: goodwill and other intangible assets | Less: goodwill and other intangible assets | 7,669 | 7,694 | 7,720 | 7,745 | 7,770 | Less: goodwill and other intangible assets | 247 | 7,669 | 7,694 | 7,720 | 7,745 | ||||||||||||||||||||||||||||||||||||||||||||||||||||||||||||||||||||||||||||||||||||||||||||||
| Tangible common stockholders’ equity | Tangible common stockholders’ equity | $ | 604,277 | $ | 593,950 | $ | 594,715 | $ | 491,450 | $ | 472,744 | Tangible common stockholders’ equity | $ | 607,845 | $ | 604,277 | $ | 593,950 | $ | 594,715 | $ | 491,450 | ||||||||||||||||||||||||||||||||||||||||||||||||||||||||||||||||||||||||||||||||||||
| Tangible book value per share: | Tangible book value per share: | Tangible book value per share: | ||||||||||||||||||||||||||||||||||||||||||||||||||||||||||||||||||||||||||||||||||||||||||||||||||||||||
| Tangible common stockholders’ equity | Tangible common stockholders’ equity | $ | 604,277 | $ | 593,950 | $ | 594,715 | $ | 491,450 | $ | 472,744 | Tangible common stockholders’ equity | $ | 607,845 | $ | 604,277 | $ | 593,950 | $ | 594,715 | $ | 491,450 | ||||||||||||||||||||||||||||||||||||||||||||||||||||||||||||||||||||||||||||||||||||
| Shares outstanding at end of period | Shares outstanding at end of period | 52,098,062 | 51,969,203 | 51,969,203 | 45,367,641 | 45,202,370 | Shares outstanding at end of period | 52,167,573 | 52,098,062 | 51,969,203 | 51,969,203 | 45,367,641 | ||||||||||||||||||||||||||||||||||||||||||||||||||||||||||||||||||||||||||||||||||||||||||||||
| Book value per share | Book value per share | $ | 11.75 | $ | 11.58 | $ | 11.59 | $ | 11.00 | $ | 10.63 | Book value per share | $ | 11.66 | $ | 11.75 | $ | 11.58 | $ | 11.59 | $ | 11.00 | ||||||||||||||||||||||||||||||||||||||||||||||||||||||||||||||||||||||||||||||||||||
| Tangible book value per share | Tangible book value per share | $ | 11.60 | $ | 11.43 | $ | 11.44 | $ | 10.83 | $ | 10.46 | Tangible book value per share | $ | 11.65 | $ | 11.60 | $ | 11.43 | $ | 11.44 | $ | 10.83 | ||||||||||||||||||||||||||||||||||||||||||||||||||||||||||||||||||||||||||||||||||||
| Hypothetical Change in Interest Rate - Rate Shock | Hypothetical Change in Interest Rate - Rate Shock | Hypothetical Change in Interest Rate - Rate Shock | ||||||||||||||||||||||||||||||||||||||||||||||||||||||||||||||||||||||||||||||||||||||
| March 31, 2020 | March 31, 2019 | June 30, 2020 | June 30, 2019 | |||||||||||||||||||||||||||||||||||||||||||||||||||||||||||||||||||||||||||||||||||||
| Change in Interest Rate (Basis Points) | Change in Interest Rate (Basis Points) | Percent change in net interest income | Percent change in fair value of equity | Percent change in net interest income | Percent change in fair value of equity | Change in Interest Rate (Basis Points) | Percent change in net interest income | Percent change in fair value of equity | Percent change in net interest income | Percent change in fair value of equity | ||||||||||||||||||||||||||||||||||||||||||||||||||||||||||||||||||||||||||||||
| +300 | +300 | 8.1 | % | (4.5) | % | 10.3 | % | (8.3) | % | +300 | 2.9 | % | (7.5) | % | 13.4 | % | (3.7) | % | ||||||||||||||||||||||||||||||||||||||||||||||||||||||||||||||||||||||
| +200 | +200 | 5.7 | (0.7) | 7.1 | (4.6) | +200 | 2.2 | (3.1) | 9.5 | (0.1) | ||||||||||||||||||||||||||||||||||||||||||||||||||||||||||||||||||||||||||||||
| +100 | +100 | 2.9 | 1.2 | 3.8 | (0.8) | +100 | 1.1 | (0.6) | 5.3 | 1.2 | ||||||||||||||||||||||||||||||||||||||||||||||||||||||||||||||||||||||||||||||
| Base | Base | — | % | — | % | — | — | Base | — | % | — | % | — | — | ||||||||||||||||||||||||||||||||||||||||||||||||||||||||||||||||||||||||||
| -100 | -100 | NA(1) | NA(1) | (4.2) | (1.1) | -100 | NA(1) | NA(1) | (5.9) | (1.0) | ||||||||||||||||||||||||||||||||||||||||||||||||||||||||||||||||||||||||||||||
| -200 | -200 | NA(1) | NA(1) | (6.2) | % | 0.3 | % | -200 | NA(1) | NA(1) | (11.0) | % | 0.9 | % | ||||||||||||||||||||||||||||||||||||||||||||||||||||||||||||||||||||||||||
(1) Due to the current interest rate environment and rate floors placed on the loan portfolio, a down rate environment was considered unlikely. As a result, the Company decided to exclude the down rate environment from its analysis for the period ended March 31, 2020. | ||||||||||||||||||||||||||||||||||||||||||||||||||||||||||||||||||||||||||||||||||||||||
(1) The Company decided to exclude the down rate environment from its analysis for the period ended June 30, 2020 due to the already low interest rate environment. | (1) The Company decided to exclude the down rate environment from its analysis for the period ended June 30, 2020 due to the already low interest rate environment. | |||||||||||||||||||||||||||||||||||||||||||||||||||||||||||||||||||||||||||||||||||||||
| Hypothetical Change in Interest Rate - Rate Ramp | Hypothetical Change in Interest Rate - Rate Ramp | Hypothetical Change in Interest Rate - Rate Ramp | ||||||||||||||||||||||||||||||||||||||||||||||||||||||||||||||
| March 31, 2020 | March 31, 2019 | June 30, 2020 | June 30, 2019 | |||||||||||||||||||||||||||||||||||||||||||||||||||||||||||||
| Change in Interest Rate (Basis Points) | Change in Interest Rate (Basis Points) | Percent change in net interest income | Percent change in net interest income | Change in Interest Rate (Basis Points) | Percent change in net interest income | Percent change in net interest income | ||||||||||||||||||||||||||||||||||||||||||||||||||||||||||
| +300 | +300 | 4.8 | % | 4.9 | % | +300 | 1.7 | % | 7.5 | % | ||||||||||||||||||||||||||||||||||||||||||||||||||||||
| +200 | +200 | 3.2 | 3.4 | +200 | 1.1 | 5.2 | ||||||||||||||||||||||||||||||||||||||||||||||||||||||||||
| +100 | +100 | 1.6 | 1.7 | +100 | 0.6 | 2.7 | ||||||||||||||||||||||||||||||||||||||||||||||||||||||||||
| Base | Base | — | — | Base | — | — | ||||||||||||||||||||||||||||||||||||||||||||||||||||||||||
| -100 | -100 | NA(1) | (1.8) | -100 | NA(1) | (3.0) | ||||||||||||||||||||||||||||||||||||||||||||||||||||||||||
| -200 | -200 | NA(1) | (3.6) | % | -200 | NA(1) | (5.8) | % | ||||||||||||||||||||||||||||||||||||||||||||||||||||||||
(1) Due to the current interest rate environment and rate floors placed on the loan portfolio, a down rate environment was considered unlikely. As a result, the Company decided to exclude the down rate environment from its analysis for the period ended March 31, 2020. | ||||||||||||||||||||||||||||||||||||||||||||||||||||||||||||||||
(1) The Company decided to exclude the down rate environment from its analysis for the period ended June 30, 2020 due to the already low interest rate environment. | (1) The Company decided to exclude the down rate environment from its analysis for the period ended June 30, 2020 due to the already low interest rate environment. | |||||||||||||||||||||||||||||||||||||||||||||||||||||||||||||||
| Name | For | Against | ||||||||||||
| Rod K. Brenneman | 20,200,759 | 1,109,032 | ||||||||||||
| George C. Bruce | 20,390,831 | 1,110,598 | ||||||||||||
| Jennifer Grigsby | 13,132,041 | 3,212,457 | ||||||||||||
| Lance Humphreys | 20,394,797 | 1,089,532 | ||||||||||||
| Mason King | 20,283,458 | 1,241,401 | ||||||||||||
| James Kuykendall | 20,486,541 | 1,038,318 | ||||||||||||
| For | Against | Abstain | ||||||||||||
| 31,228,825 | 463,279 | 2,027 | ||||||||||||
| Exhibit Number | Exhibit Description | |||||||||||||||||||||||||
| 101.INS* | XBRL Instance Document - the instance document does not appear in the Interactive Data File because its XBRL tags are embedded within the Inline XBRL document | |||||||||||||||||||||||||
| 101.SCH* | XBRL Taxonomy Extension Schema Document | |||||||||||||||||||||||||
| 101.CAL* | XBRL Taxonomy Extension Calculation Linkbase Document | |||||||||||||||||||||||||
| 101.DEF* | XBRL Taxonomy Extension Definition Linkbase Document | |||||||||||||||||||||||||
| 101.LAB* | XBRL Taxonomy Extension Label Linkbase Document | |||||||||||||||||||||||||
| 101.PRE* | XBRL Taxonomy Extension Presentation Linkbase Document | |||||||||||||||||||||||||
| 104* | Cover Page Interactive Data File (formation in Inline XBRL and contained in Exhibit 101) | |||||||||||||||||||||||||
| CrossFirst Bankshares Inc. | |||||||||||||||||||||||||||||
| /s/ David L. O’Toole | |||||||||||||||||||||||||||||
| David L. O’Toole | |||||||||||||||||||||||||||||
| Chief Financial Officer | |||||||||||||||||||||||||||||
| (Principal Financial Officer and Principal Accounting Officer) | |||||||||||||||||||||||||||||