UNITED STATES
SECURITIES AND EXCHANGE COMMISSION
WASHINGTON, DC 20549
FORM 10-Q
☒ QUARTERLY REPORT PURSUANT TO SECTION 13 OR 15(d) OF THE SECURITIES EXCHANGE ACT OF 1934
For the quarterly period ended June 30, 2020March 31, 2021
or
☐ TRANSITION REPORT PURSUANT TO SECTION 13 OR 15(d) OF THE SECURITIES EXCHANGE ACT OF 1934
For the transition period from ______ to ______
Commission file number 001-39028
CROSSFIRST BANKSHARES, INC.
(Exact Name of Registrant as Specified in its Charter)
| | | | | | | | | | | | | | |
| Kansas | | | | 26-3212879 |
| (State or other jurisdiction of incorporation or organization) | | | | (I.R.S. Employer Identification No.) |
| | | | |
| 11440 Tomahawk Creek Parkway | | | | |
| Leawood, | | KS | | 66211 |
| (Address of principal executive offices) | | | | (Zip Code) |
| | | | |
| | | |
|
| | | | |
| | | | |
| | | | |
| | | | |
(913) 312-6822
(Registrant’s telephone number, including area code)
N/A
(Former name, former address and former fiscal year, if changed since last report)
Securities registered pursuant to Section 12(b) of the Act:
| | | | | | | | | | | | | | |
| Title of each class | | Trading Symbol | | Name of each exchange on which registered |
| Common Stock, par value $0.01 per share | | CFB | | The Nasdaq Stock Market LLC |
| | | | |
Indicate by check mark whether the registrant (1) has filed all reports required to be filed by Section 13 or 15(d) of the Securities Exchange Act of 1934 during the preceding 12 months (or for such shorter period that the registrant was required to file such reports), and (2) has been subject to such filing requirements for the past 90 days.
Yes ☒ No ☐
Indicate by check mark whether the registrant has submitted electronically every Interactive Data File required to be submitted pursuant to Rule 405 of Regulation S-T (Section 232.405 of this chapter) during the preceding 12 months (or for such shorter period that the registrant was required to submit such files). Yes ☒ No ☐
Indicate by check mark whether the registrant is a large accelerated filer, an accelerated filer, a non-accelerated filer, a smaller reporting company, or an emerging growth company. See the definitions of “large accelerated filer,” “accelerated filer,” “smaller reporting company,” and “emerging growth company” in Rule 12b-2 of the Exchange Act.
| | | | | | | | | | | | | | | | | | | | |
| Large accelerated filer | | ☐ | | Accelerated filer | | ☐☒ |
| Non-accelerated filer | | ☒☐ | | Smaller reporting company | | ☐ |
| Emerging growth company | | ☒ | | | | |
If an emerging growth company, indicate by check mark if the registrant has elected not to use the extended transition period for complying with any new or revised financial accounting standards provided pursuant to Section 13(a) of the Exchange Act. ☐
Indicate by check mark whether the registrant is a shell company (as defined in Rule 12b-2 of the Exchange Act). Yes ☐ No ☒
As of August 10, 2020,May 5, 2021, the registrant had 52,188,70851,580,761 shares of common stock, par value $0.01, outstanding.
CrossFirst Bankshares, Inc.
Form 10-Q
for the Quarter Ended June 30, 2020March 31, 2021
Index
| | | | | |
| Part I. Financial Information | |
| Item 1. Financial Statements | |
| |
| |
| |
| |
| |
| |
| |
| Notes to Consolidated Financial Statements (unaudited) | |
| |
| |
| |
| |
| |
| |
| |
| |
| |
| |
| |
| |
| |
| |
| |
| |
| |
| |
| |
| |
| |
| |
| Item 2. Management’s Discussion and Analysis of Financial Condition and Results of Operations | |
| |
| |
| |
| |
| |
| |
| |
| |
| |
| |
| |
| |
| |
| |
| |
| |
| |
| |
| |
| | | | | |
| |
| |
| |
| |
| |
| |
| |
| |
| Part II. Other Information | |
| |
| |
| |
| |
| |
| |
| |
| |
| Signatures | |
Forward-Looking Information
This report may contain forward-looking statements that reflect our current views with respect to, among other things, future events and our financial performance. These statements are often, but not always, made through the use of words or phrases such as “may,” “might,” “should,” “could,” “predict,” “potential,” “believe,” “expect,” “continue,” “will,” “anticipate,” “seek,” “estimate,” “intend,” “plan,” “strive,” “projection,” “goal,” “target,” “outlook,” “aim,” “would,” “annualized” and “outlook,” or the negative version of those words or other comparable words or phrases of a future or forward-looking nature.
These forward-looking statements are not historical facts, and are based on current expectations, estimates and projections about our industry, management’s beliefs and certain assumptions made by management, many of which, by their nature, are inherently uncertain and beyond our control. Accordingly, we caution you that any such forward-looking statements are not guarantees of future performance and are subject to risks, assumptions, estimates and uncertainties that are difficult to predict. Although we believe that the expectations reflected in these forward-looking statements are reasonable as of the date made, actual results may prove to be materially different from the results expressed or implied by the forward-looking statements. Such possible events or factors include: risks associated with the current outbreak of the novel coronavirus, or the COVID-19 pandemic, changes in economic conditions in the Company’s market area, changes in policies by regulatory agencies, governmental legislation and regulation, fluctuations in interest rates, changes in liquidity requirements, demand for loans in the Company’s market area, changes in accounting and tax principles, estimates made on income taxes, competition with other entities that offer financial services, cybersecurity threats, and such other factors as discussed in our Annual Report on Form 10-K for the fiscal year ended December 31, 2019,2020, filed with the Securities and Exchange Commission (“SEC”) on March 10, 2020, in our Quarterly ReportFebruary 26, 2021, any subsequent quarterly report on Form 10-Q for the quarter ended March 31, 2020 filed with the SEC on May 14, 2020, andas well as in our other filings with the SEC.
We undertake no obligation to revise or publicly release the results of any revision to these forward-looking statements, except as required by law. Given these risks and uncertainties, readers are cautioned not to place undue reliance on such forward-looking statements.
PART I - FINANCIAL INFORMATION
ITEM 1. FINANCIAL STATEMENTS
CROSSFIRST BANKSHARES, INC.
CONSOLIDATED BALANCE SHEETS
| | | June 30, 2020 | | December 31, 2019 | | March 31, 2021 | | December 31, 2020 |
| | | (Unaudited) | | | | (Unaudited) | | |
| | (Dollars in thousands) | | | (Dollars in thousands) |
| Assets | Assets | | Assets | |
| | Cash and cash equivalents | Cash and cash equivalents | $ | 194,371 | | | $ | 187,320 | | Cash and cash equivalents | $ | 630,787 | | | $ | 408,810 | |
| Available-for-sale securities - taxable | Available-for-sale securities - taxable | 256,121 | | | 298,208 | | Available-for-sale securities - taxable | 192,031 | | | 177,238 | |
| Available-for-sale securities - tax-exempt | Available-for-sale securities - tax-exempt | 443,962 | | | 443,426 | | Available-for-sale securities - tax-exempt | 493,423 | | | 477,350 | |
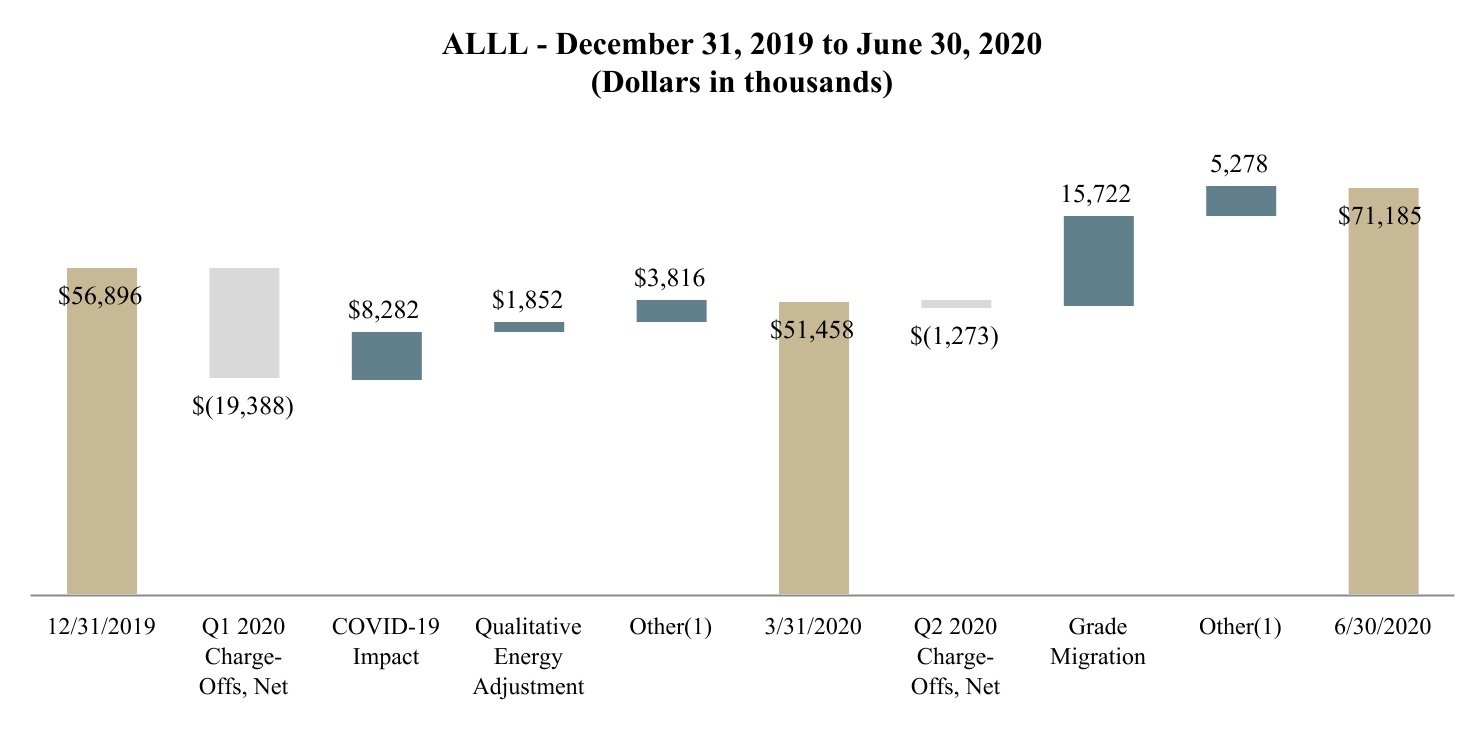
| | Loans, net of allowance for loan losses of $71,185 and $56,896 at June 30, 2020 and December 31, 2019, respectively | 4,342,039 | | | 3,795,348 | | |
| Loans, net of allowance for loan losses of $74,551 and $75,295 at March 31, 2021 and December 31, 2020, respectively | | Loans, net of allowance for loan losses of $74,551 and $75,295 at March 31, 2021 and December 31, 2020, respectively | 4,434,049 | | | 4,366,602 | |
| Premises and equipment, net | Premises and equipment, net | 68,889 | | | 70,210 | | Premises and equipment, net | 69,270 | | | 70,509 | |
| Restricted equity securities | Restricted equity securities | 20,675 | | | 17,278 | | Restricted equity securities | 14,080 | | | 15,543 | |
| Interest receivable | Interest receivable | 19,399 | | | 15,716 | | Interest receivable | 17,987 | | | 17,236 | |
| Foreclosed assets held for sale | Foreclosed assets held for sale | 2,502 | | | 3,619 | | Foreclosed assets held for sale | 2,347 | | | 2,347 | |
| Deferred tax asset | 14,841 | | | 13,782 | | |
| Goodwill and other intangible assets, net | 247 | | | 7,694 | | |
| | Bank-owned life insurance | Bank-owned life insurance | 66,598 | | | 65,689 | | Bank-owned life insurance | 67,914 | | | 67,498 | |
| Other | Other | 32,610 | | | 12,943 | | Other | 76,186 | | | 56,170 | |
| Total assets | Total assets | $ | 5,462,254 | | | $ | 4,931,233 | | Total assets | $ | 5,998,074 | | | $ | 5,659,303 | |
| Liabilities and stockholders’ equity | Liabilities and stockholders’ equity | | | | Liabilities and stockholders’ equity | | | |
| Deposits | Deposits | | Deposits | |
| Non-interest bearing | $ | 750,333 | | | $ | 521,826 | | |
| Noninterest-bearing | | Noninterest-bearing | $ | 794,559 | | | $ | 718,459 | |
| Savings, NOW and money market | Savings, NOW and money market | 2,393,269 | | | 2,162,187 | | Savings, NOW and money market | 3,325,220 | | | 2,932,799 | |
| Time | Time | 1,160,541 | | | 1,239,746 | | Time | 931,791 | | | 1,043,482 | |
| Total deposits | Total deposits | 4,304,143 | | | 3,923,759 | | Total deposits | 5,051,570 | | | 4,694,740 | |
| Federal funds purchased and repurchase agreements | Federal funds purchased and repurchase agreements | 49,881 | | | 14,921 | | Federal funds purchased and repurchase agreements | 3,294 | | | 2,306 | |
| Federal Home Loan Bank advances | Federal Home Loan Bank advances | 450,617 | | | 358,743 | | Federal Home Loan Bank advances | 283,100 | | | 293,100 | |
| | Other borrowings | Other borrowings | 942 | | | 921 | | Other borrowings | 974 | | | 963 | |
| Interest payable and other liabilities | Interest payable and other liabilities | 48,579 | | | 31,245 | | Interest payable and other liabilities | 30,302 | | | 43,766 | |
| Total liabilities | Total liabilities | 4,854,162 | | | 4,329,589 | | Total liabilities | 5,369,240 | | | 5,034,875 | |
| Stockholders’ equity | Stockholders’ equity | | | | Stockholders’ equity | | | |
| Redeemable preferred stock, $0.01 par value, $25.00 liquidation value: | | |
| | authorized - 5,000,000 shares, issued - 0 shares at June 30, 2020 and December 31, 2019, respectively | — | | | — | | |
| | Common stock, $0.01 par value: | Common stock, $0.01 par value: | | Common stock, $0.01 par value: | |
| | authorized - 200,000,000 shares, issued - 52,167,573 and 51,969,203 shares at June 30, 2020 and December 31, 2019, respectively | 521 | | | 520 | | |
| authorized - 200,000,000 shares, issued - 52,376,779 and 52,289,129 shares at March 31, 2021 and December 31, 2020, respectively | | authorized - 200,000,000 shares, issued - 52,376,779 and 52,289,129 shares at March 31, 2021 and December 31, 2020, respectively | 523 | | | 523 | |
| Treasury stock, at cost: | | Treasury stock, at cost: | |
| 698,110 and 609,613 shares held at March 31, 2021 and December 31, 2020, respectively | | 698,110 and 609,613 shares held at March 31, 2021 and December 31, 2020, respectively | (7,113) | | | (6,061) | |
| Additional paid-in capital | Additional paid-in capital | 521,133 | | | 519,870 | | Additional paid-in capital | 523,156 | | | 522,911 | |
| Retained earnings | Retained earnings | 61,344 | | | 64,803 | | Retained earnings | 89,722 | | | 77,652 | |
| | Accumulated other comprehensive income | Accumulated other comprehensive income | 25,094 | | | 16,451 | | Accumulated other comprehensive income | 22,546 | | | 29,403 | |
| Total stockholders’ equity | Total stockholders’ equity | 608,092 | | | 601,644 | | Total stockholders’ equity | 628,834 | | | 624,428 | |
| Total liabilities and stockholders’ equity | Total liabilities and stockholders’ equity | $ | 5,462,254 | | | $ | 4,931,233 | | Total liabilities and stockholders’ equity | $ | 5,998,074 | | | $ | 5,659,303 | |
See Notes to Consolidated Financial Statements (unaudited)
4
CROSSFIRST BANKSHARES, INC.
CONSOLIDATED STATEMENTS OF INCOME - UNAUDITED
| | | | | | | | | | | | | | | |
| Three Months Ended | | |
| March 31, | | |
| 2021 | | 2020 | | | | |
| (Dollars in thousands except per share data) |
| Interest Income | | | | | | | |
| Loans, including fees | $ | 43,758 | | | $ | 48,339 | | | | | |
| | | | | | | |
| Available-for-sale securities - taxable | 751 | | | 1,774 | | | | | |
| Available-for-sale securities - tax-exempt | 3,351 | | | 3,312 | | | | | |
| Deposits with financial institutions | 128 | | | 491 | | | | | |
| Dividends on bank stocks | 165 | | | 292 | | | | | |
| | | | | | | |
| Total interest income | 48,153 | | | 54,208 | | | | | |
| Interest Expense | | | | | | | |
| Deposits | 5,728 | | | 14,272 | | | | | |
| Fed funds purchased and repurchase agreements | 1 | | | 62 | | | | | |
| Federal Home Loan Bank Advances | 1,283 | | | 1,611 | | | | | |
| Other borrowings | 24 | | | 35 | | | | | |
| Total interest expense | 7,036 | | | 15,980 | | | | | |
| Net Interest Income | 41,117 | | | 38,228 | | | | | |
| Provision for Loan Losses | 7,500 | | | 13,950 | | | | | |
| Net Interest Income after Provision for Loan Losses | 33,617 | | | 24,278 | | | | | |
| Non-Interest Income | | | | | | | |
| Service charges and fees on customer accounts | 957 | | | 508 | | | | | |
| Realized gains on available-for-sale securities | 10 | | | 393 | | | | | |
| | | | | | | |
| | | | | | | |
| | | | | | | |
| Income from bank-owned life insurance | 416 | | | 456 | | | | | |
| Swap fees and credit valuation adjustments, net | 155 | | | (9) | | | | | |
| ATM and credit card interchange income | 2,328 | | | 485 | | | | | |
| Other non-interest income | 278 | | | 254 | | | | | |
| Total non-interest income | 4,144 | | | 2,087 | | | | | |
| Non-Interest Expense | | | | | | | |
| Salaries and employee benefits | 13,553 | | | 14,390 | | | | | |
| Occupancy | 2,494 | | | 2,085 | | | | | |
| Professional fees | 782 | | | 671 | | | | | |
| Deposit insurance premiums | 1,151 | | | 1,016 | | | | | |
| Data processing | 716 | | | 692 | | | | | |
| Advertising | 303 | | | 500 | | | | | |
| Software and communication | 1,065 | | | 876 | | | | | |
| | | | | | | |
| Foreclosed assets, net | 50 | | | 10 | | | | | |
| | | | | | | |
| Other non-interest expense | 2,704 | | | 1,975 | | | | | |
| Total non-interest expense | 22,818 | | | 22,215 | | | | | |
| Net Income Before Taxes | 14,943 | | | 4,150 | | | | | |
| Income tax expense | 2,908 | | | 293 | | | | | |
| Net Income | $ | 12,035 | | | $ | 3,857 | | | | | |
| Basic Earnings Per Share | $ | 0.23 | | | $ | 0.07 | | | | | |
| Diluted Earnings Per Share | $ | 0.23 | | | $ | 0.07 | | | | | |
See Notes to Consolidated Financial Statements (unaudited)
5
CROSSFIRST BANKSHARES, INC.
CONSOLIDATED STATEMENTS OF OPERATIONSCOMPREHENSIVE INCOME - UNAUDITED
| | | | | | | | | | | | | | | | | | | | | | | |
| Three Months Ended | | | | Six Months Ended | | |
| June 30, | | | | June 30, | | |
| 2020 | | 2019 | | 2020 | | 2019 |
| (Dollars in thousands except per share data) | | | | | | |
| Interest Income | | | | | | | |
| Loans, including fees | $ | 46,323 | | | $ | 47,989 | | | $ | 94,662 | | | $ | 92,992 | |
| | | | | | | |
| Available-for-sale securities - taxable | 1,358 | | | 2,335 | | | 3,132 | | | 4,655 | |
| Available-for-sale securities - tax-exempt | 3,260 | | | 2,916 | | | 6,572 | | | 5,851 | |
| Deposits with financial institutions | 45 | | | 676 | | | 536 | | | 1,482 | |
| Dividends on bank stocks | 268 | | | 276 | | | 560 | | | 529 | |
| | | | | | | |
| Total interest income | 51,254 | | | 54,192 | | | 105,462 | | | 105,509 | |
| Interest Expense | | | | | | | |
| Deposits | 8,405 | | | 17,497 | | | 22,677 | | | 33,418 | |
| Fed funds purchased and repurchase agreements | 46 | | | 133 | | | 108 | | | 427 | |
| Federal Home Loan Bank Advances | 1,620 | | | 1,651 | | | 3,231 | | | 3,110 | |
| Other borrowings | 26 | | | 37 | | | 61 | | | 75 | |
| Total interest expense | 10,097 | | | 19,318 | | | 26,077 | | | 37,030 | |
| Net Interest Income | 41,157 | | | 34,874 | | | 79,385 | | | 68,479 | |
| Provision for Loan Losses | 21,000 | | | 2,850 | | | 34,950 | | | 5,700 | |
| Net Interest Income after Provision for Loan Losses | 20,157 | | | 32,024 | | | 44,435 | | | 62,779 | |
| Non-Interest Income | | | | | | | |
| Service charges and fees on customer accounts | 647 | | | 211 | | | 1,155 | | | 369 | |
| Gain on sale of available-for-sale debt securities | 320 | | | 406 | | | 713 | | | 433 | |
| | | | | | | |
| Impairment of premises and equipment held for sale | — | | | (424) | | | — | | | (424) | |
| Gain on sale of loans | — | | | 79 | | | — | | | 158 | |
| Income from bank-owned life insurance | 453 | | | 473 | | | 909 | | | 940 | |
| Swap fee income (loss), net | (32) | | | 159 | | | (41) | | | 536 | |
| ATM and credit card interchange income | 896 | | | 459 | | | 1,381 | | | 836 | |
| Other non-interest income | 350 | | | 309 | | | 612 | | | 469 | |
| Total non-interest income | 2,634 | | | 1,672 | | | 4,729 | | | 3,317 | |
| Non-Interest Expense | | | | | | | |
| Salaries and employee benefits | 14,004 | | | 14,450 | | | 28,394 | | | 29,040 | |
| Occupancy | 2,045 | | | 2,062 | | | 4,130 | | | 4,221 | |
| Professional fees | 1,295 | | | 714 | | | 1,966 | | | 1,496 | |
| Deposit insurance premiums | 1,039 | | | 881 | | | 2,055 | | | 1,718 | |
| Data processing | 721 | | | 625 | | | 1,413 | | | 1,219 | |
| Advertising | 223 | | | 477 | | | 723 | | | 1,190 | |
| Software and communication | 937 | | | 828 | | | 1,813 | | | 1,507 | |
| | | | | | | |
| Foreclosed assets, net | 1,135 | | | 19 | | | 1,154 | | | 25 | |
| Goodwill impairment | 7,397 | | | — | | | 7,397 | | | — | |
| Other non-interest expense | 2,214 | | | 1,904 | | | 4,188 | | | 4,175 | |
| Total non-interest expense | 31,010 | | | 21,960 | | | 53,233 | | | 44,591 | |
| Net Income (Loss) Before Taxes | (8,219) | | | 11,736 | | | (4,069) | | | 21,505 | |
| Income tax expense (benefit) | (863) | | | 2,297 | | | (570) | | | 2,716 | |
| Net Income (Loss) | $ | (7,356) | | | $ | 9,439 | | | $ | (3,499) | | | $ | 18,789 | |
| Basic Earnings (Loss) Per Share | $ | (0.14) | | | $ | 0.21 | | | $ | (0.07) | | | $ | 0.41 | |
| Diluted Earnings (Loss) Per Share | $ | (0.14) | | | $ | 0.20 | | | $ | (0.07) | | | $ | 0.40 | |
| | | | | | | | | | | | | | | |
| Three Months Ended | | |
| March 31, | | |
| 2021 | | 2020 | | | | |
| (Dollars in thousands) |
| Net Income | $ | 12,035 | | | $ | 3,857 | | | | | |
| Other Comprehensive Income (Loss) | | | | | | | |
| Unrealized gain (loss) on available-for-sale securities | (9,070) | | | 8,532 | | | | | |
| Less: income tax expense (benefit) | (2,221) | | | 2,084 | | | | | |
| Unrealized gain (loss) on available-for-sale securities, net of income tax | (6,849) | | | 6,448 | | | | | |
| Reclassification adjustment for realized gains included in income | 10 | | | 393 | | | | | |
| Less: income tax | 2 | | | 96 | | | | | |
| Less: reclassification adjustment for realized gains included in income, net of income tax | 8 | | | 297 | | | | | |
| Other comprehensive income (loss) | (6,857) | | | 6,151 | | | | | |
| Comprehensive Income | $ | 5,178 | | | $ | 10,008 | | | | | |
See Notes to Consolidated Financial Statements (unaudited)
6
CROSSFIRST BANKSHARES, INC.
CONSOLIDATED STATEMENTS OF OTHER COMPREHENSIVE INCOME (LOSS)STOCKHOLDERS’ EQUITY - UNAUDITED
| | | | | | | | | | | | | | | | | | | | | | | |
| Three Months Ended | | | | Six Months Ended | | |
| June 30, | | | | June 30, | | |
| 2020 | | 2019 | | 2020 | | 2019 |
| (Dollars in thousands) | | | | | | |
| Net Income (Loss) | $ | (7,356) | | | $ | 9,439 | | | $ | (3,499) | | | $ | 18,789 | |
| Other Comprehensive Income | | | | | | | |
| Unrealized gain on available-for-sale debt securities | 3,618 | | | 9,977 | | | 12,150 | | | 22,327 | |
| Less: income tax | 884 | | | 2,449 | | | 2,968 | | | 5,480 | |
| Unrealized gain on available-for-sale debt securities, net of income tax | 2,734 | | | 7,528 | | | 9,182 | | | 16,847 | |
| Reclassification adjustment for realized gains included in income | 320 | | | 406 | | | 713 | | | 433 | |
| Less: income tax | 78 | | | 100 | | | 174 | | | 107 | |
| Less: reclassification adjustment for realized gains included in income, net of income tax | 242 | | | 306 | | | 539 | | | 326 | |
| Other comprehensive income | 2,492 | | | 7,222 | | | 8,643 | | | 16,521 | |
| Comprehensive Income (Loss) | $ | (4,864) | | | $ | 16,661 | | | $ | 5,144 | | | $ | 35,310 | |
| | | | | | | | | | | | | | | | | | | | | | | | | | | | | | | | | | | | | | | | | | | | | | | |
| | | | | | | | | | | | | | | | | | | |
| | | Common Stock | | Additional Paid-in Capital | | Retained Earnings | | | | Accumulated Other Comprehensive Income | | Treasury Stock | | Total |
| | | | | Shares | | Amount | | | | | | | |
| | | | | (Dollars in thousands) |
| Balance at December 31, 2019 | | | | | 51,969,203 | | | $ | 520 | | | $ | 519,870 | | | $ | 64,803 | | | | | $ | 16,451 | | | $ | 0 | | | $ | 601,644 | |
| Net income | | | | | — | | | — | | | — | | | 3,857 | | | | | — | | | — | | | 3,857 | |
| Change in unrealized appreciation on available-for-sale securities | | | | | — | | | — | | | — | | | — | | | | | 6,151 | | | — | | | 6,151 | |
| | | | | | | | | | | | | | | | | | | |
| Issuance of shares from equity-based awards | | | | | 128,859 | | | 1 | | | (671) | | | — | | | | | — | | | — | | | (670) | |
| | | | | | | | | | | | | | | | | | | |
| | | | | | | | | | | | | | | | | | | |
| Employee receivables from sale of stock | | | | | — | | | — | | | 1 | | | 29 | | | | | — | | | — | | | 30 | |
| Stock-based compensation | | | | | — | | | — | | | 934 | | | — | | | | | — | | | — | | | 934 | |
| | | | | | | | | | | | | | | | | | | |
| | | | | | | | | | | | | | | | | | | |
| | | | | | | | | | | | | | | | | | | |
| Balance at March 31, 2020 | | | | | 52,098,062 | | | $ | 521 | | | $ | 520,134 | | | $ | 68,689 | | | | | $ | 22,602 | | | $ | 0 | | | $ | 611,946 | |
| | | | | | | | | | | | | | | | | | | |
|
| | | | | | | | | | | | | | | | | | | | | | | | | | | | | | | | | | | | | | | | | | | | | | | |
| | | Common Stock | | Additional Paid-in Capital | | Retained Earnings | | | | Accumulated Other Comprehensive Income | | Treasury Stock | | Total |
| | | | | Shares | | Amount | | | | | | | |
| | | | | (Dollars in thousands) |
| Balance at December 31, 2020 | | | | | 51,679,516 | | | $ | 523 | | | $ | 522,911 | | | $ | 77,652 | | | | | $ | 29,403 | | | $ | (6,061) | | | $ | 624,428 | |
| Net income | | | | | — | | | — | | | — | | | 12,035 | | | | | — | | | — | | | 12,035 | |
| | | | | | | | | | | | | | | | | | | |
| Change in unrealized depreciation on available-for-sale securities | | | | | — | | | — | | | — | | | — | | | | | (6,857) | | | — | | | (6,857) | |
| | | | | | | | | | | | | | | | | | | |
| Issuance of shares from equity-based awards | | | | | 87,650 | | | — | | | (404) | | | — | | | | | — | | | — | | | (404) | |
| Open market common share repurchases | | | | | (88,497) | | | — | | | — | | | — | | | | | — | | | (1,052) | | | (1,052) | |
| | | | | | | | | | | | | | | | | | | |
| Employee receivables from sale of stock | | | | | — | | | — | | | — | | | 35 | | | | | — | | | — | | | 35 | |
| Stock-based compensation | | | | | — | | | — | | | 649 | | | — | | | | | — | | | — | | | 649 | |
| | | | | | | | | | | | | | | | | | | |
| | | | | | | | | | | | | | | | | | | |
| | | | | | | | | | | | | | | | | | | |
| Balance at March 31, 2021 | | | | | 51,678,669 | | | $ | 523 | | | $ | 523,156 | | | $ | 89,722 | | | | | $ | 22,546 | | | $ | (7,113) | | | $ | 628,834 | |
| | | | | | | | | | | | | | | | | | | |
See Notes to Consolidated Financial Statements (unaudited)
7
CROSSFIRST BANKSHARES, INC.
CONSOLIDATED STATEMENTS OF STOCKHOLDERS’ EQUITYCASH FLOWS - UNAUDITED
| | | | | | | | | | | | | | | | | | | | | | | | | | | | | | | | | | | | | | | | | | | | | | | | | |
| | | | | | | | | | | | | | | | | |
| | | | | | | | | | | | | | | Accumulated | | |
| | | | | | | | | Additional | | | | | | Other | | |
| Preferred Stock | | | | Common Stock | | | | Paid in | | Retained | | | | Comprehensive | | |
| Shares | | Amount | | Shares | | Amount | | Capital | | Earnings | | | | Income | | Total |
| (Dollars in thousands) | | | | | | | | | | | | | | | | |
| Balance at March 31, 2019 | — | | | $ | — | | | 45,202,370 | | | $ | 452 | | | $ | 428,412 | | | $ | 45,293 | | | | | $ | 6,357 | | | $ | 480,514 | |
| Net income | — | | | — | | | — | | | — | | | — | | | 9,439 | | | | | — | | | 9,439 | |
| Change in unrealized appreciation on available-for-sale securities | — | | | — | | | — | | | — | | | — | | | — | | | | | 7,222 | | | 7,222 | |
| Issuance of shares | — | | | — | | | 149,765 | | | 1 | | | 889 | | | — | | | | | — | | | 890 | |
| Issuance of shares from equity-based awards | — | | | — | | | 15,506 | | | — | | | (102) | | | — | | | | | — | | | (102) | |
| | | | | | | | | | | | | | | | | |
| | | | | | | | | | | | | | | | | |
| Employee receivables from sale of stock | — | | | — | | | — | | | — | | | 2 | | | 84 | | | | | — | | | 86 | |
| Stock-based compensation | — | | | — | | | — | | | — | | | 1,147 | | | — | | | | | — | | | 1,147 | |
| Employee stock purchase plan additions | — | | | — | | | — | | | — | | | (1) | | | — | | | | | — | | | (1) | |
| | | | | | | | | | | | | | | | | |
| | | | | | | | | | | | | | | | | |
| Balance at June 30, 2019 | — | | | $ | — | | | 45,367,641 | | | $ | 453 | | | $ | 430,347 | | | $ | 54,816 | | | | | $ | 13,579 | | | $ | 499,195 | |
| | | | | | | | | | | | | | | | | |
| | | | | | | | | | | | | | | | | |
| | | | | | | | | | | | | | | | | | | | | | | | | | | | | | | | | | | | | | | | | | | | | | | | | |
| | | | | | | | | | | | | | | Accumulated | | |
| | | | | | | | | Additional | | | | | | Other | | |
| Preferred Stock | | | | Common Stock | | | | Paid in | | Retained | | | | Comprehensive | | |
| Shares | | Amount | | Shares | | Amount | | Capital | | Earnings | | | | Income | | Total |
| (Dollars in thousands) | | | | | | | | | | | | | | | | |
| Balance at March 31, 2020 | — | | | $ | — | | | 52,098,062 | | | $ | 521 | | | $ | 520,134 | | | $ | 68,689 | | | | | $ | 22,602 | | | $ | 611,946 | |
| Net loss | — | | | — | | | — | | | — | | | — | | | (7,356) | | | | | — | | | (7,356) | |
| | | | | | | | | | | | | | | | | |
| Change in unrealized appreciation on available-for-sale securities | — | | | — | | | — | | | — | | | — | | | — | | | | | 2,492 | | | 2,492 | |
| | | | | | | | | | | | | | | | | |
| Issuance of shares from equity-based awards | — | | | — | | | 69,511 | | | — | | | (83) | | | — | | | | | — | | | (83) | |
| | | | | | | | | | | | | | | | | |
| | | | | | | | | | | | | | | | | |
| Employee receivables from sale of stock | — | | | — | | | — | | | — | | | — | | | 11 | | | | | — | | | 11 | |
| Stock-based compensation | — | | | — | | | — | | | — | | | 1,082 | | | — | | | | | — | | | 1,082 | |
| | | | | | | | | | | | | | | | | |
| | | | | | | | | | | | | | | | | |
| | | | | | | | | | | | | | | | | |
| Balance at June 30, 2020 | — | | | $ | — | | | 52,167,573 | | | $ | 521 | | | $ | 521,133 | | | $ | 61,344 | | | | | $ | 25,094 | | | $ | 608,092 | |
| | | | | | | | | | | | | | | | | |
| | | | | | | | | | | |
| Three Months Ended |
| March 31, |
| 2021 | | 2020 |
| (Dollars in thousands) |
| Operating Activities | | | |
| Net income | $ | 12,035 | | | $ | 3,857 | |
| Items not requiring (providing) cash | | | |
| Depreciation and amortization | 1,375 | | | 1,295 | |
| Provision for loan losses | 7,500 | | | 13,950 | |
| | | |
| Accretion of discounts and amortization of premiums on securities | 1,310 | | | 1,473 | |
| Equity based compensation | 649 | | | 934 | |
| | | |
| | | |
| | | |
| Deferred income taxes | 1,824 | | | 2,881 | |
| | | |
| | | |
| Net realized gains on available-for-sale securities | (10) | | | (393) | |
| | | |
| | | |
| | | |
| | | |
| | | |
| Changes in | | | |
| | | |
| | | |
| Interest receivable | (751) | | | (1,242) | |
| Other assets | (28,730) | | | (717) | |
| Other liabilities | (4,937) | | | (9,368) | |
| Net cash provided by (used in) operating activities | (9,735) | | | 12,670 | |
| Investing Activities | | | |
| Net change in loans | (74,947) | | | (169,595) | |
| Purchases of available-for-sale securities | (74,575) | | | (11,861) | |
| Proceeds from maturities of available-for-sale securities | 33,329 | | | 21,528 | |
| Proceeds from sale of available-for-sale securities | 0 | | | 3,841 | |
| | | |
| Purchase of premises and equipment | (118) | | | (331) | |
| | | |
| Purchase of restricted equity securities | 0 | | | (970) | |
| | | |
| Proceeds from sale of restricted equity securities | 1,626 | | | 0 | |
| | | |
| Net cash used in investing activities | (114,685) | | | (157,388) | |
| | | |
| |
| | | |
| | | |
| Financing Activities | | | |
| | | |
| Net increase in demand deposits, savings, NOW and money market accounts | 468,521 | | | 185,747 | |
| Net decrease in time deposits | (111,691) | | | (136,684) | |
| | | |
| Net increase in fed funds purchased and repurchase agreements | 988 | | | 24,025 | |
| | | |
| | | |
| | | |
| | | |
| | | |
| Proceeds from Federal Home Loan Bank advances | 0 | | | 70,000 | |
| Repayment of Federal Home Loan Bank advances | (10,000) | | | (26,063) | |
| | | |
| | | |
| | | |
| | | |
| Issuance of common shares, net of issuance cost | 0 | | | 1 | |
| | | |
| | | |
| Repurchase of common stock | (1,052) | | | 0 | |
| Acquisition of common stock for tax withholding obligations | (404) | | | (671) | |
| Net decrease in employee receivables | 35 | | | 30 | |
| | | |
| Net cash provided by financing activities | 346,397 | | | 116,385 | |
| Increase (Decrease) in Cash and Cash Equivalents | 221,977 | | | (28,333) | |
| Cash and Cash Equivalents, Beginning of Period | 408,810 | | | 187,320 | |
| Cash and Cash Equivalents, End of Period | $ | 630,787 | | | $ | 158,987 | |
| | | |
| Supplemental Cash Flows Information | | | |
| Interest paid | $ | 7,287 | | | $ | 17,199 | |
| Income taxes paid | $ | 130 | | | $ | 0 | |
| | | |
| | | |
| | | |
See Notes to Consolidated Financial Statements (unaudited)
8
| | | | | | | | | | | | | | | | | | | | | | | | | | | | | | | | | | | | | | | | | | | | | | | |
| | | | | | | | | | | | | Accumulated | | |
| | | | | | | | | Additional | | | | Other | | |
| Preferred Stock | | | | Common Stock | | | | Paid in | | Retained | | Comprehensive | | |
| Shares | | Amount | | Shares | | Amount | | Capital | | Earnings | | Income (Loss) | | Total |
| (Dollars in thousands) | | | | | | | | | | | | | | |
| Balance at December 31, 2018 | 1,200,000 | | | $ | 12 | | | 45,074,322 | | | $ | 451 | | | $ | 454,512 | | | $ | 38,371 | | | $ | (3,010) | | | $ | 490,336 | |
| Net income | — | | | — | | | — | | | — | | | — | | | 18,789 | | | — | | | 18,789 | |
| Change in unrealized appreciation on available-for-sale securities | — | | | — | | | — | | | — | | | — | | | — | | | 16,521 | | | 16,521 | |
| Issuance of shares | — | | | — | | | 250,968 | | | 2 | | | 1,715 | | | — | | | — | | | 1,717 | |
| Issuance of shares from equity-based awards | — | | | — | | | 52,351 | | | — | | | (236) | | | — | | | — | | | (236) | |
| Retired shares | (1,200,000) | | | (12) | | | (10,000) | | | — | | | (30,088) | | | (55) | | | — | | | (30,155) | |
| Preferred dividends declared | — | | | — | | | — | | | — | | | — | | | (175) | | | — | | | (175) | |
| Employee receivables from sale of stock | — | | | — | | | — | | | — | | | 4 | | | 113 | | | — | | | 117 | |
| Stock-based compensation | — | | | — | | | — | | | — | | | 2,245 | | | — | | | — | | | 2,245 | |
| Employee stock purchase plan additions | — | | | — | | | — | | | — | | | 36 | | | — | | | — | | | 36 | |
| Adoption of ASU 2016-01 | — | | | — | | | — | | | — | | | — | | | (68) | | | 68 | | | — | |
| Adoption of ASU 2018-07 | — | | | — | | | — | | | — | | | 2,159 | | | (2,159) | | | — | | | — | |
| Balance at June 30, 2019 | — | | | $ | — | | | 45,367,641 | | | $ | 453 | | | $ | 430,347 | | | $ | 54,816 | | | $ | 13,579 | | | $ | 499,195 | |
| | | | | | | | | | | | | | | |
| | | | | | | | | | | | | | | | | | | | | | | | | | | | | | | | | | | | | | | | | | | | | | | | | |
| | | | | | | | | | | | | | | Accumulated | | |
| | | | | | | | | Additional | | | | | | Other | | |
| Preferred Stock | | | | Common Stock | | | | Paid in | | Retained | | | | Comprehensive | | |
| Shares | | Amount | | Shares | | Amount | | Capital | | Earnings | | | | Income | | Total |
| (Dollars in thousands) | | | | | | | | | | | | | | | | |
| Balance at December 31, 2019 | — | | | $ | — | | | 51,969,203 | | | $ | 520 | | | $ | 519,870 | | | $ | 64,803 | | | | | $ | 16,451 | | | $ | 601,644 | |
| Net loss | — | | | — | | | — | | | — | | | — | | | (3,499) | | | | | — | | | (3,499) | |
| | | | | | | | | | | | | | | | | |
| Change in unrealized appreciation on available-for-sale securities | — | | | — | | | — | | | — | | | — | | | — | | | | | 8,643 | | | 8,643 | |
| | | | | | | | | | | | | | | | | |
| Issuance of shares from equity-based awards | — | | | — | | | 198,370 | | | 1 | | | (754) | | | — | | | | | — | | | (753) | |
| | | | | | | | | | | | | | | | | |
| | | | | | | | | | | | | | | | | |
| Employee receivables from sale of stock | — | | | — | | | — | | | — | | | 1 | | | 40 | | | | | — | | | 41 | |
| Stock-based compensation | — | | | — | | | — | | | — | | | 2,016 | | | — | | | | | — | | | 2,016 | |
| | | | | | | | | | | | | | | | | |
| Balance at June 30, 2020 | — | | | $ | — | | | 52,167,573 | | | $ | 521 | | | $ | 521,133 | | | $ | 61,344 | | | | | $ | 25,094 | | | $ | 608,092 | |
| | | | | | | | | | | | | | | | | |
See Notes to Consolidated Financial Statements (unaudited)
9
CROSSFIRST BANKSHARES, INC.
CONSOLIDATED STATEMENTS OF CASH FLOWS - UNAUDITED
| | | | | | | | | | | |
| Six Months Ended | | |
| June 30, | | |
| 2020 | | 2019 |
| (Dollars in thousands) | | |
| Operating Activities | | | |
| Net income (loss) | $ | (3,499) | | | $ | 18,789 | |
| Items not requiring (providing) cash | | | |
| Depreciation and amortization | 2,587 | | | 2,703 | |
| Provision for loan losses | 34,950 | | | 5,700 | |
| | | |
| Accretion of discounts and amortization of premiums on securities | 3,063 | | | 2,535 | |
| Equity based compensation | 2,016 | | | 2,281 | |
| | | |
| Foreclosed asset impairment | 1,117 | | | — | |
| | | |
| Deferred income taxes | (3,853) | | | 2,056 | |
| | | |
| | | |
| Net realized gains on available-for-sale debt securities | (713) | | | (433) | |
| Goodwill impairment | 7,397 | | | — | |
| | | |
| | | |
| | | |
| | | |
| Changes in | | | |
| | | |
| | | |
| Interest receivable | (3,683) | | | (2,611) | |
| Other assets | (1,284) | | | (6,172) | |
| Other liabilities | (2,130) | | | 5,195 | |
| Net cash provided by operating activities | 35,968 | | | 30,043 | |
| Investing Activities | | | |
| Net change in loans | (581,641) | | | (409,602) | |
| Purchases of available-for-sale securities | (27,312) | | | (107,948) | |
| Proceeds from maturities of available-for-sale securities | 58,974 | | | 26,468 | |
| Proceeds from sale of available-for-sale securities | 19,052 | | | 60,254 | |
| | | |
| Proceeds (purchase) of premises and equipment, net | (1,658) | | | 3,014 | |
| Purchase of restricted equity securities, net | (2,839) | | | (558) | |
| | | |
| | | |
| | | |
| Net cash used in investing activities | (535,424) | | | (428,372) | |
| | | |
| | | |
| | | |
| Financing Activities | | | |
| | | |
| Net increase in demand deposits, savings, NOW and money market accounts | 459,589 | | | 84,269 | |
| Net increase (decrease) in time deposits | (79,205) | | | 291,770 | |
| | | |
| Net increase (decrease) in repurchase agreements and federal funds purchased | 34,960 | | | (49,025) | |
| | | |
| | | |
| | | |
| | | |
| | | |
| Proceeds from Federal Home Loan Bank advances | 118,000 | | | 45,000 | |
| Repayment of Federal Home Loan Bank advances | (26,126) | | | (20,120) | |
| | | |
| | | |
| | | |
| Retirement of preferred stock | — | | | (30,000) | |
| Issuance of common shares, net and change in employee receivables | 43 | | | 1,677 | |
| | | |
| | | |
| Acquisition of common stock for tax withholding obligations | (754) | | | (235) | |
| | | |
| Dividends paid on preferred stock | — | | | (175) | |
| Net cash provided by financing activities | 506,507 | | | 323,161 | |
| Increase (Decrease) in Cash and Cash Equivalents | 7,051 | | | (75,168) | |
| Cash and Cash Equivalents, Beginning of Period | 187,320 | | | 216,541 | |
| Cash and Cash Equivalents, End of Period | $ | 194,371 | | | $ | 141,373 | |
| | | |
| Supplemental Cash Flows Information | | | |
| Interest paid | $ | 27,818 | | | $ | 35,366 | |
| Income taxes paid | — | | | 775 | |
| Foreclosed assets in settlement of loans | $ | — | | | $ | 2,471 | |
| | | |
| | | |
See Notes to Consolidated Financial Statements (unaudited)
10
| | | | | | | | |
| Notes to Consolidated Financial Statements (unaudited) | |
Note 1:Nature of Operations and Summary of Significant Accounting Policies
Organization and Nature of Operations
CrossFirst Bankshares, Inc. (the “Company”), a Kansas corporation, was incorporated in December 2017. Prior to incorporation, the Company was registered as a limited liability company under the name CrossFirst Holdings, LLC. The Company is a bank holding company whose principal activities are the ownership and management of its wholly-owned subsidiaries,subsidiary, CrossFirst Bank (the “Bank”) and CFSA, LLC (“CFSA”), which holds cash.. In addition, the Bank has three subsidiaries including CrossFirst Investments, Inc. (“CFI”) is a wholly-owned subsidiary of the Bank, whichthat holds investments in marketable securities.securities, CFBSA I, LLC that holds foreclosed assets and CFBSA II, LLC that holds foreclosed assets.
Basis of Presentation
The Company’s accounting and reporting policies conform to accounting principles generally accepted in the United States (“GAAP”). The consolidated financial statements include the accounts of the Company, the Bank, CFI, CFBSA I, LLC and CFSA.CFBSA II, LLC. All significant intercompany accounts and transactions have been eliminated in consolidation.
The consolidated interim financial statements are unaudited and certain information and footnote disclosures presented in accordance with GAAP have been condensed or omitted and should be read in conjunction with the Company’s consolidated financial statements and notesfootnotes included in the Company’s Annual Report on Form 10-K for the year ended December 31, 20192020 (the “2019“2020 Form 10-K”), filed with the Securities and Exchange Commission (the “SEC”) on March 10, 2020.February 26, 2021.
In the opinion of management, the interim financial statements include all adjustments which are of a normal, recurring nature necessary for the fair presentation of the financial position, results of operations, and cash flows of the Company and the disclosures made are adequate to make the interim financial information not misleading. The consolidated financial statements have been prepared in accordance with GAAP for interim financial information and the instructions to Form 10-Q adopted by the SEC.
Except for the accounting changes mentioned under “Coronavirus Aid, Relief, and Economic Security Act” and “Change in Accounting Principle” section below, no otherNo significant changes in the accounting policies of the Company occurred since December 31, 2019,2020, the most recent date financial statements were provided within the Company’s 20192020 Form 10-K. The information contained in the financial statements and footnotes for the period ended December 31, 2019 included in the Company’s 2019 Form 10-K should be referred to in connection with these unaudited interim consolidated financial statements.
Operating results for the interim periods disclosed herein are not necessarily indicative of the results that may be expected for a full year or any future period.
Use of Estimates
The Company has identified accounting policies and estimates that, due to the difficult, subjective or complex judgments and assumptions inherent in those policies and estimates and the potential sensitivity of the Company’s financial statements to those judgments and assumptions, are critical to an understanding of the Company’s financial condition and results of operations. Actual results could differ from those estimates. In particular, the novel coronavirus (“COVID-19”) pandemic and resulting impacts to economic conditions, as well as adverse impacts to the Company’s operations, may impact future estimates. The Allowanceallowance for Loanloan losses, deferred tax asset, and Lease Losses, Deferred Tax Asset, and Fair Valuefair value of Financial Instrumentsfinancial instruments are particularly susceptible to significant change.
Cash Equivalents
The Company had $126$541 million of cash and cash equivalents at the Federal Reserve Bank of Kansas City as of June 30, 2020.March 31, 2021. The reserve required at June 30, 2020March 31, 2021 was $0. In addition, the Company is at times required to place cash collateral with a third party as part of its back-to-back swap agreements. At June 30, 2020, approximately $31 million was required as cash collateral.
Coronavirus Aid, Relief, and Economic Security Act (“CARES Act”)
The CARES Act allowsgave financial institutions the right to elect not to consider whethersuspend GAAP principles and regulatory determinations for loan modifications relating to the COVID-19 pandemic that they make betweenwould otherwise be categorized as TDRs from March 1, 2020, and the earlier ofthrough December 31, 2020. On December 27, 2020, the Consolidated Appropriations Act, 2021 was signed into law, which extended the period during which the Company may suspend GAAP principles and regulatory determinations for loan modifications relating to COVID-19 that would otherwise be categorized as TDRs through January 1, 2022 or 60 days after the date when the national emergency related to theconcerning COVID-19 pandemic ends are troubled debt restructurings (“TDRs”), which require additional disclosures. The relief can be applied to modifications of loans to borrowers that were not more than 30 days past due as of December 31, 2019.
terminates. The Company elected to apply the guidance duringstarting in the first quarter of 2020.
Changes Affecting Comparability
Beginning with the quarter ended March 31, 2021, the Company consolidated the “Goodwill and other intangible assets, net” into “other assets” within the Consolidated Balance Sheets. The review of loans that meetconsolidation was due to the criteria is overseen by the Officeimmateriality of the Chief Credit Officer and his team.remaining intangible assets. The change had no impact on net income.
| | | | | | | | |
| Notes to Consolidated Financial Statements (unaudited) | |
Loans Individually Evaluated for Impairment
Prior to the quarter ended June 30, 2020, loans risk rated substandard or lower were considered impaired and evaluated on an individual basis. As of June 30, 2020, loans risk rated substandard and on accrual were evaluated collectively. The new approach provided a better estimate of potential losses inherent in the substandard portfolio.
A loan is considered impaired when, based on current information and events, it is probable that the Company will be unable to collect the scheduled payments of principal and interest when due according to the contractual terms of the loan agreement. The Company’s definition of a substandard credit was unchanged. Substandard loans exhibit a well-defined weakness or weaknesses that jeopardize repayment. A distinct possibility exists that the Company will sustain some loss if deficiencies are not corrected.
Loss potential, while existing in the aggregate amount of substandard loans, does not have to exist in individual loans classified substandard. As a result, the Company revised its allowance methodology to evaluate substandard, performing loans collectively for impairment as opposed to evaluating these loans individually for impairment. As of June 30, 2020, the change in methodology impacted $200 million of performing, substandard loans that were reviewed on a collective basis.
Change in Accounting Principle
On January 1, 2020, the Company adopted the Financial Accounting Standards Board (“FASB”) Accounting Standard Update (“ASU”) 2017-04, Intangibles—Goodwill and Other (Topic 350): Simplifying the Test for Goodwill Impairment, which was applied on a prospective basis. A description of the nature and reason for the change in accounting principle is provided below in the recent accounting pronouncements section.
On January 1, 2020, the Company adopted FASB ASU 2019-12, Simplifying the Accounting for Income Taxes, which was applied as of the adoption date. A description of the nature and reason for the change in accounting principle is provided below in the recent accounting pronouncements section.
Changes Affecting Comparability
During the quarter ended June 30, 2020, the Company changed loans individually evaluated for impairment. A discussion regarding this change is provided above under “Loans Individually Evaluated for Impairment” and in Note 4: Loans and Allowance for Loan Losses within the Notes to the Unaudited Consolidated Financial Statements. The Company separated substandard loans into performing and nonperforming categories that were previously consolidated within the loan footnote disclosures. The change in disclosure did not impact the Company's net income during the three or six-months ended June 30, 2019, Balance Sheet at December 31, 2019, Statement of Stockholders’ Equity at December 31, 2019, or the impaired loan information at December 31, 2019 as presented in Note 4: Loans and Allowance for Loan Losses within the Notes to the Unaudited Consolidated Financial Statements.
Beginning withFor the quarter ended March 31, 2020,2021, the Company consolidated the “Other” line item previously included in stockholders’ equity“equipment costs, other asset depreciation and amortization” into retained earnings“other noninterest expense” within the Consolidated Balance Sheets and the Consolidated Statements of Stockholders’ Equity. The consolidationIncome. In addition, the Company broke out “foreclosed assets, net” that was previously consolidated. As a result, changes within the Consolidated Statements of Income in the prior periods were made dueto conform to the immateriality ofcurrent period presentation. The changes: (i) consolidate lower balance line items or (ii) provide additional detail about the “Other” line item.Company’s operations. The changechanges had no impact on net income or total stockholders’ equity.income.
Initial Public OfferingEmerging Growth Company (“EGC”)
On August 19, 2019, the Company completed its initial public offering (“IPO”) of common stock. The Company issued and sold 5,750,000 shares of common stock at a public offering price of $14.50 per share. After deducting the underwriting discounts and offering expenses, the Company received total net proceeds of $76 million from the IPO. Certain selling stockholders participated in the offering and soldis currently an aggregate of 1,261,589 shares of common stock at a public offering price of $14.50 per share. The Company did not receive any proceeds from the sales of shares by the selling stockholders.
On September 17, 2019, the underwriters partially exercised their option to purchase additional shares. The Company issued and sold 844,362 shares of common stock at a public offering price of $14.50 per share of common stock. After deducting the underwriting discounts and offering expenses, the Company received total net proceeds of $11 million.
As of June 30, 2020, the Company qualified as an emerging growth company (“EGC”) under the Jumpstart Our Business Startups Act of 2012 (the “JOBS Act”).EGC. An EGC may take advantage of reduced reporting requirements and is relieved of certain other significant requirements that are otherwise generally applicable to public companies. Among the reductions and reliefs, the Company elected to extend the transition period for complying with new or revised accounting standards affecting public companies. This means that the financial statements the Company files or furnishes, will not be subject to all new or revised accounting standards generally applicable to public companies for the transition period for so long as the Company remains an EGC or until the Company affirmatively and irrevocably opts out of the extended transition period under the JOBS Act.
| | | | | | | | |
| Notes to Consolidated Financial Statements (unaudited) | |
Recent Accounting Pronouncements
The following table provides information about Accounting Standard Updates (“ASUs”) the Company has implemented the following ASUs during 2020:
| | | | | | | | | | | | | | | | | | | | |
Standard | | Date of Adoption | | Description | | Effect on Financial Statements or Other Significant Matters |
| | | | | | |
ASU 2020-04:
Reference Rate Reform (Topic 848): Facilitation of the Effects of Reference Rate Reform on Financial Reporting
| | June 30, 2020 | | The ASU provides optional expedients and exceptions to contracts, hedging relationships, and other transactions affected by reference rate reform if certain criteria are met.
The ASU only applies to transactions that reference LIBOR or another reference rate expected to be discontinued because of reference rate reform. The expedients and exceptions provided by the amendments do not apply to contract modifications made and hedging relationships entered into or evaluated after December 31, 2022, except for hedging relationships existing as of December 31, 2022, that an entity has elected certain optional expedients for and that are retained through the end of the hedging relationship. The amendments include:
(1) Optional expedients to contract modifications that allow the Company to adjust the effective interest rate of receivables and debt, account for lease modifications as a continuation of the existing lease, and remove the requirement to reassess its original conclusions for contract modifications about whether that contract contains an embedded derivative that is clearly and closely related to the economic characteristics and risks of the host contract under Subtopic 815-15, Derivatives and Hedging—Embedded Derivatives;
(2) Exceptions to the guidance in Topic 815 related to changes in the critical terms of a hedging relationship due to reference rate reform; and
(3) Optional expedients for cash flow and fair value hedges. | | The Company had more than $1 billion in loans tied to LIBOR as of June 30, 2020.
The Company does not believe the adoption will have a material accounting impact on the Company’s consolidated financial position or results of operations. Additionally, LIBOR fallback language has been included in key loan provisions of new and renewed loans in preparation for transition from LIBOR to the new benchmark rate when such transition occurs. This standard is expected to ease the administrative burden in accounting for the future effects of reference rate reform.
The ASU allows the Company to recognize the modification related to LIBOR as a continuation of the old contract, rather than a cancellation of the old contract resulting in a write off of unamortized fees and creation of a new contract.
|
ASU 2019-12:
Income Taxes (Topic 740): Simplifying the Accounting for Income Taxes
| | January 1, 2020
(Early Adoption) | | The ASU simplifies the accounting for income taxes. Among other changes, the ASU:
(1) Removes the exception to the incremental approach for intraperiod tax allocation when there is a loss from continuing operations and income or a gain from other items;
(2) Removes the exception to the general methodology for calculating income taxes in an interim period when a year-to-date loss exceeds the anticipated loss for the year;
(3) Requires an entity to recognize a franchise tax that is partially based on income as an income-based tax and account for any incremental amount incurred as a nonincome based tax; and
(4) Requires an entity reflect the effect of an enacted change in tax laws or rates in the annual effective tax rate computation in the interim period that includes the enactment date. | | The amendments in the ASU did not have a material impact on the Company’s tax methodology, processes, or the Company’s financial statements. |
| | | | | | | | |
| Notes to Consolidated Financial Statements (unaudited) | |
| | | | | | | | | | | | | | | | | | | | |
Standard | | Date of Adoption | | Description | | Effect on Financial Statements or Other Significant Matters |
ASU 2018-13:
Fair Value Measurement (Topic 820): Disclosure Framework
| | January 1, 2020 | | Improves the effectiveness of disclosures in the notes to financial statements by facilitating clear communication of the information. The amendments modify certain disclosure requirements of fair value measurements in Topic 820, Fair Value Measurement.
Entities are no longer required to disclose transfers between Level 1 and Level 2 of the fair value hierarchy or qualitatively disclose the valuation process for Level 3 fair value measurements. The updated guidance requires disclosure of the changes in unrealized gains and losses for the period included in Other Comprehensive Income for recurring Level 3 fair value measurements. Entities are required to disclose the range and weighted average used to develop significant unobservable inputs for Level 3 fair value measurements.
The additional provisions of the guidance should be adopted prospectively. The eliminated requirements should be adopted retrospectively. | | The adoption did not have a material impact to the financial statements.
No transfers between Level 1 and Level 2 occurred in 2019 or 2020 and the Company did not have any recurring Level 3 fair value measurements that created an unrealized gain or loss in Other Comprehensive Income. In addition, the Company previously disclosed the range and weighted average used to develop significant unobservable inputs for Level 3 fair value measurements. |
| | | | | | |
ASU 2017-04:
Intangibles—Goodwill and Other (Topic 350): Simplifying the Test for Goodwill Impairment
| | January 1, 2020
(Early Adoption) | | Eliminates Step 2 from the goodwill impairment test which required entities to compute the implied fair value of goodwill. An entity should perform an annual, or interim, goodwill impairment test by comparing the fair value of a reporting unit with its carrying amount. An entity should recognize an impairment charge for the amount by which the carrying amount exceeds the reporting unit’s fair value; however, the loss recognized should not exceed the total amount of goodwill allocated to that reporting unit. | | On the date of adoption there was no impact to the financial statements.
The Company’s process for evaluating goodwill impairment was modified to align with the elimination of Step 2. In the second quarter of 2020, the Company performed a Step 0 analysis then a Step 1 analysis and determined that goodwill was fully impaired. |
| | | | | | |
| | | | | | |
| | | | | | | | |
| Notes to Consolidated Financial Statements (unaudited) | |
The Company has provided updatesanticipates to the following ASUs that have not yet been adopted. A complete list of recent, applicable accounting pronouncements was providedadopt in the Company’s 2019 Form 10-K:future:
| | | | | | | | | | | | | | | | | | | | |
| Standard | | Anticipated Date of Adoption | | Description | | Effect on Financial Statements or Other Significant Matters |
ASU 2016-13
Financial Instruments-Credit Losses | | If we maintain ourthe Company maintains its EGC status, the Company is not required to implement this standard until January 2023. The Company will continue to monitor its progress and the requirements related to adoption.anticipates an adoption date of January 2022. | | Requires an entity to utilize a new impairment model known as the current expected credit loss (“CECL”) model to estimate its lifetime expected credit loss and record an allowance that, when deducted from the amortized cost basis of the financial asset, presents the net amount expected to be collected on the financial asset. | | The Company established a committee of individuals from applicable departments to oversee the implementation process.
implemented a third-party software solution and completed the third-party software implementation phase of the transition. The software implementation phasethat included data capture and portfolio segmentation amongst other items.
The Company completed an initial parallel run using 2019 data and completed a second parallel run during the fourth quarter ofruns in 2019. During the first half ofperiod ended December 31, 2020, the Company continued to perform parallel runs using 2020 data and continuescontinued to recalibrate inputs as necessary.
platform.platform and third-party testing is anticipated later in 2021.
At this time, an estimate of the impact cannot be established as the Company continues to evaluate the inputs into the model. The actual impact could be significantly affected by the composition, characteristics, and quality of the underlying loan portfolio at the time of adoption. |
ASU 2016-02
Leases (Topic 842) | | The Company expects to implement this standard in 2021 if EGC status is maintained. Ifon January 1, 2022, unless the Company loses its EGC status in 2020,during 2021. If EGC status changes, the Company would therefore be required to implement the ASU as of the beginning of 2020.
On April 8, 2020, the FASB proposed a one-year deferral on the ASU. If EGC status is maintained and the FASB issues the final amendment, the Company would be able to defer implementation until January 1, 2022.2021. | | Requires lessees and lessors to recognize lease assets and lease liabilities on the balance sheet and disclose key information about leasing arrangements.
The update requires lessees and lessors to recognize and measure leases at the beginning of the earliest period presented using a modified retrospective approach with the option to elect certain practical expedients.
The update will also increase disclosures around leases, including qualitative and specific quantitative measures. | | The Company expects to apply the update as of the beginning of the period of adoption and the Company does not plan to restate comparative periods. The Company expects to elect certain optional practical expedients.
The Company gathered all potential lease and embedded lease agreements during 2019 and 2020 and is evaluating the applicability and impact to the financial statements.
The Company’s current operating leases relate primarily to four branch locations, as well as one future lease obligation.locations. Based on the current leases, the Company anticipates recognizing a lease liability and related right-to-use asset on its balance sheet, with an immaterial impact to its income statement compared to the current lease accounting model. However, the ultimate impact of the standard will depend on the Company's lease portfolio as of the adoption date. |
| | | | | | | | |
| Notes to Consolidated Financial Statements (unaudited) | |
Note 2:Earnings (Loss) Per Share
The following table presents the computation of basic and diluted earnings (loss) per share:
| | | | | | | | | | | | | | | | | | | | | | | |
| Three Months Ended | | | | Six Months Ended | | |
| June 30, | | | | June 30, | | |
| 2020 | | 2019 | | 2020 | | 2019 |
| (Dollars in thousands except per share data) | | | | | | |
| Earnings (Loss) per Share | | | | | | | |
| Net income (loss) | $ | (7,356) | | | $ | 9,439 | | | $ | (3,499) | | | $ | 18,789 | |
| Less: preferred stock dividends | — | | | — | | | — | | | 175 | |
| Net income (loss) available to common stockholders | $ | (7,356) | | | $ | 9,439 | | | $ | (3,499) | | | $ | 18,614 | |
| Weighted average common shares | 52,104,994 | | | 45,236,264 | | | 52,088,239 | | | 45,165,248 | |
| Earnings (loss) per share | $ | (0.14) | | | $ | 0.21 | | | $ | (0.07) | | | $ | 0.41 | |
| Dilutive Earnings (Loss) Per Share | | | | | | | |
| | | | | | | |
| | | | | | | |
| Net income (loss) available to common stockholders | $ | (7,356) | | | $ | 9,439 | | | $ | (3,499) | | | $ | 18,614 | |
| Weighted average common shares | 52,104,994 | | | 45,236,264 | | | 52,088,239 | | | 45,165,248 | |
| Effect of dilutive shares | — | | | 975,516 | | | — | | | 994,577 | |
| Weighted average dilutive common shares | 52,104,994 | | | 46,211,780 | | | 52,088,239 | | | 46,159,825 | |
| Diluted earnings (loss) per share | $ | (0.14) | | | $ | 0.20 | | | $ | (0.07) | | | $ | 0.40 | |
| | | | | | | |
| Stock-based awards not included because to do so would be antidilutive | 2,417,205 | | | 403,722 | | | 2,417,205 | | | 424,972 | |
| | | | | | | | | | | | | | | |
| Three Months Ended | | |
| March 31, | | |
| 2021 | | 2020 | | | | |
| (Dollars in thousands except per share data) |
| Earnings per Share | | | | | | | |
| | | | | | | |
| | | | | | | |
| Net income available to common stockholders | $ | 12,035 | | | $ | 3,857 | | | | | |
| Weighted average common shares | 51,657,204 | | | 52,071,484 | | | | | |
| Earnings per share | $ | 0.23 | | | $ | 0.07 | | | | | |
| Dilutive Earnings Per Share | | | | | | | |
| | | | | | | |
| | | | | | | |
| Net income available to common stockholders | $ | 12,035 | | | $ | 3,857 | | | | | |
| Weighted average common shares | 51,657,204 | | | 52,071,484 | | | | | |
| Effect of dilutive shares | 724,270 | | | 588,786 | | | | | |
| Weighted average dilutive common shares | 52,381,474 | | | 52,660,270 | | | | | |
| Diluted earnings per share | $ | 0.23 | | | $ | 0.07 | | | | | |
| | | | | | | |
| Stock-based awards not included because to do so would be antidilutive | 669,112 | | | 905,406 | | | | | |
| | | | | | | | |
| Notes to Consolidated Financial Statements (unaudited) | |
Note 3:Securities
Available-for-Sale Debt and Equity Securities
The amortized cost and approximate fair values, together with gross unrealized gains and losses, of period end available-for-sale debt and equity securities consisted of the following:
| | | June 30, 2020 | | | March 31, 2021 |
| | Amortized Cost | | Gross Unrealized Gains | | Gross Unrealized Losses | | Approximate Fair Value | | Amortized Cost | | Gross Unrealized Gains | | Gross Unrealized Losses | | Approximate Fair Value |
| | (Dollars in thousands) | | | (Dollars in thousands) |
| Available-for-sale debt securities | | |
| Available-for-sale securities | | Available-for-sale securities | |
| Mortgage-backed - GSE residential | Mortgage-backed - GSE residential | $ | 139,615 | | | $ | 4,983 | | | $ | — | | | $ | 144,598 | | Mortgage-backed - GSE residential | $ | 138,231 | | | $ | 2,912 | | | $ | 1,464 | | | $ | 139,679 | |
| Collateralized mortgage obligations - GSE residential | Collateralized mortgage obligations - GSE residential | 94,189 | | | 1,472 | | | 20 | | | 95,641 | | Collateralized mortgage obligations - GSE residential | 38,206 | | | 785 | | | 26 | | | 38,965 | |
| State and political subdivisions | State and political subdivisions | 429,603 | | | 26,966 | | | 255 | | | 456,314 | | State and political subdivisions | 474,912 | | | 28,517 | | | 862 | | | 502,567 | |
| Corporate bonds | Corporate bonds | 1,212 | | | 86 | | | 4 | | | 1,294 | | Corporate bonds | 4,251 | | | 74 | | | 82 | | | 4,243 | |
| Total available-for-sale debt securities | 664,619 | | | 33,507 | | | 279 | | | 697,847 | | |
| Equity securities | | |
| Mutual funds | 2,183 | | | 53 | | | — | | | 2,236 | | |
| Total equity securities | 2,183 | | | 53 | | | — | | | 2,236 | | |
| Total available-for-sale securities | Total available-for-sale securities | $ | 666,802 | | | $ | 33,560 | | | $ | 279 | | | $ | 700,083 | | Total available-for-sale securities | $ | 655,600 | | | $ | 32,288 | | | $ | 2,434 | | | $ | 685,454 | |
| |
| | | | | | | | | | | | | | | | | | | | | | | |
| December 31, 2020 |
| Amortized Cost | | Gross Unrealized Gains | | Gross Unrealized Losses | | Approximate Fair Value |
| (Dollars in thousands) |
| Available-for-sale securities | | | | | | | |
| Mortgage-backed - GSE residential | $ | 104,839 | | | $ | 4,277 | | | $ | 0 | | | $ | 109,116 | |
| Collateralized mortgage obligations - GSE residential | 52,070 | | | 984 | | | 42 | | | 53,012 | |
| State and political subdivisions | 454,486 | | | 33,642 | | | 31 | | | 488,097 | |
| Corporate bonds | 4,259 | | | 104 | | | 0 | | | 4,363 | |
| Total available-for-sale securities | $ | 615,654 | | | $ | 39,007 | | | $ | 73 | | | $ | 654,588 | |
| | | | | | | |
| | | | | | | |
| | | | | | | |
| | | | | | | |
| | | | | | | |
| | | | | | | |
| | | | | | | |
| | | | | | | | |
| Notes to Consolidated Financial Statements (unaudited) | |
| | | | | | | | | | | | | | | | | | | | | | | |
| December 31, 2019 | | | | | | |
| Amortized Cost | | Gross Unrealized Gains | | Gross Unrealized Losses | | Approximate Fair Value |
| (Dollars in thousands) | | | | | | |
| Available-for-sale debt securities | | | | | | | |
| Mortgage-backed - GSE residential | $ | 151,037 | | | $ | 1,668 | | | $ | 193 | | | $ | 152,512 | |
| Collateralized mortgage obligations - GSE residential | 128,876 | | | 625 | | | 289 | | | 129,212 | |
| State and political subdivisions | 436,448 | | | 19,996 | | | 104 | | | 456,340 | |
| Corporate bonds | 1,321 | | | 88 | | | — | | | 1,409 | |
| Total available-for-sale debt securities | 717,682 | | | 22,377 | | | 586 | | | 739,473 | |
| Equity securities | | | | | | | |
| Mutual funds | 2,190 | | | — | | | 29 | | | 2,161 | |
| Total equity securities | 2,190 | | | — | | | 29 | | | 2,161 | |
| Total available-for-sale securities | $ | 719,872 | | | $ | 22,377 | | | $ | 615 | | | $ | 741,634 | |
| | | | | | | |
| | | | | | | |
| | | | | | | |
The carrying value of securities pledged as collateral was $56 million and $41 million at June 30, 2020 and December 31, 2019, respectively.
The amortized cost and fair value of available-for-sale debt securities at June 30, 2020,March 31, 2021, by contractual maturity, are shown below:
| | | June 30, 2020 | | | March 31, 2021 | |
| | Within | | After One to | | After Five to | | After | | | | Within | | After One to | | After Five to | | After | | |
| | One Year | | Five Years | | Ten Years | | Ten Years | | Total | | | One Year | | Five Years | | Ten Years | | Ten Years | | Total | |
| | (Dollars in thousands) | | | (Dollars in thousands) | |
| Available-for-sale debt securities | | | |
| Available-for-sale securities | | Available-for-sale securities | | |
Mortgage-backed - GSE residential(1) | Mortgage-backed - GSE residential(1) | | | Mortgage-backed - GSE residential(1) | | |
| Amortized cost | Amortized cost | $ | — | | | $ | 56 | | | $ | 220 | | | $ | 139,339 | | | $ | 139,615 | | | Amortized cost | $ | 0 | | | $ | 48 | | | $ | 181 | | | $ | 138,002 | | | $ | 138,231 | | |
| Estimated fair value | Estimated fair value | $ | — | | | $ | 57 | | | $ | 236 | | | $ | 144,305 | | | $ | 144,598 | | | Estimated fair value | $ | 0 | | | $ | 50 | | | $ | 193 | | | $ | 139,436 | | | $ | 139,679 | | |
Weighted average yield(2) | Weighted average yield(2) | — | % | | 4.55 | % | | 3.91 | % | | 2.04 | % | | 2.04 | % | | Weighted average yield(2) | 0 | % | | 4.60 | % | | 3.91 | % | | 1.72 | % | | 1.72 | % | |
Collateralized mortgage obligations - GSE residential(1) | Collateralized mortgage obligations - GSE residential(1) | | | Collateralized mortgage obligations - GSE residential(1) | | |
| Amortized cost | Amortized cost | $ | — | | | $ | — | | | $ | 2,507 | | | $ | 91,682 | | | $ | 94,189 | | | Amortized cost | $ | 0 | | | $ | 0 | | | $ | 2,469 | | | $ | 35,737 | | | $ | 38,206 | | |
| Estimated fair value | Estimated fair value | $ | — | | | $ | — | | | $ | 2,755 | | | $ | 92,886 | | | $ | 95,641 | | | Estimated fair value | $ | 0 | | | $ | 0 | | | $ | 2,645 | | | $ | 36,320 | | | $ | 38,965 | | |
Weighted average yield(2) | Weighted average yield(2) | — | % | | — | % | | 2.77 | % | | 1.62 | % | | 1.65 | % | | Weighted average yield(2) | 0 | % | | 0 | % | | 2.75 | % | | 1.59 | % | | 1.66 | % | |
| State and political subdivisions | State and political subdivisions | | | State and political subdivisions | | |
| Amortized cost | Amortized cost | $ | 653 | | | $ | 7,234 | | | $ | 61,170 | | | $ | 360,546 | | | $ | 429,603 | | | Amortized cost | $ | 652 | | | $ | 5,947 | | | $ | 65,518 | | | $ | 402,795 | | | $ | 474,912 | | |
| Estimated fair value | Estimated fair value | $ | 656 | | | $ | 7,419 | | | $ | 66,034 | | | $ | 382,205 | | | $ | 456,314 | | | Estimated fair value | $ | 654 | | | $ | 6,024 | | | $ | 70,889 | | | $ | 425,000 | | | $ | 502,567 | | |
Weighted average yield(2) | Weighted average yield(2) | 8.24 | % | | 5.33 | % | | 3.58 | % | | 3.10 | % | | 3.22 | % | | Weighted average yield(2) | 3.54 | % | | 3.86 | % | | 3.32 | % | | 2.82 | % | | 2.90 | % | |
| Corporate bonds | Corporate bonds | | | Corporate bonds | | |
| Amortized cost | Amortized cost | $ | — | | | $ | 345 | | | $ | 867 | | | $ | — | | | $ | 1,212 | | | Amortized cost | $ | 0 | | | $ | 357 | | | $ | 3,894 | | | $ | 0 | | | $ | 4,251 | | |
| Estimated fair value | Estimated fair value | $ | — | | | $ | 358 | | | $ | 936 | | | $ | — | | | $ | 1,294 | | | Estimated fair value | $ | 0 | | | $ | 366 | | | $ | 3,877 | | | $ | 0 | | | $ | 4,243 | | |
Weighted average yield(2) | Weighted average yield(2) | — | % | | 5.89 | % | | 5.68 | % | | — | % | | 5.74 | % | | Weighted average yield(2) | 0 | % | | 4.10 | % | | 4.54 | % | | 0 | % | | 4.51 | % | |
| Total available-for-sale debt securities | | | |
| Total available-for-sale securities | | Total available-for-sale securities | | |
| Amortized cost | Amortized cost | $ | 653 | | | $ | 7,635 | | | $ | 64,764 | | | $ | 591,567 | | | $ | 664,619 | | | Amortized cost | $ | 652 | | | $ | 6,352 | | | $ | 72,062 | | | $ | 576,534 | | | $ | 655,600 | | |
| Estimated fair value | Estimated fair value | $ | 656 | | | $ | 7,834 | | | $ | 69,961 | | | $ | 619,396 | | | $ | 697,847 | | | Estimated fair value | $ | 654 | | | $ | 6,440 | | | $ | 77,604 | | | $ | 600,756 | | | $ | 685,454 | | |
Weighted average yield(2) | Weighted average yield(2) | 8.24 | % | | 5.34 | % | | 3.53 | % | | 2.63 | % | | 2.75 | % | | Weighted average yield(2) | 3.54 | % | | 3.88 | % | | 3.37 | % | | 2.48 | % | | 2.59 | % | |
(1) Actual maturities may differ from contractual maturities because issuers may have the rights to call or prepay obligations with or without prepayment penalties. | (1) Actual maturities may differ from contractual maturities because issuers may have the rights to call or prepay obligations with or without prepayment penalties. | | (1) Actual maturities may differ from contractual maturities because issuers may have the rights to call or prepay obligations with or without prepayment penalties. | |
(2) Yields are calculated based on amortized cost. | (2) Yields are calculated based on amortized cost. | | (2) Yields are calculated based on amortized cost. | |
| | | | | | | | |
| Notes to Consolidated Financial Statements (unaudited) | |
The following tables show gross unrealized losses, the number of securities, that are in an unrealized loss, position, and fair value of the Company’s investments with unrealized losses that are not deemed to be other-than-temporarily impaired (“OTTI”), aggregated by investment class and length of time that individual securities have been in a continuous unrealized loss position at June 30, 2020March 31, 2021 and December 31, 2019:2020:
| | | | | | | | | | | | | | | | | | | | | | | | | | | | | | | | | | | | | | | | | | | | | | | | | | | | | |
| March 31, 2021 |
| Less than 12 Months | | 12 Months or More | | Total |
| Fair Value | | Unrealized Losses | | Number of Securities | | Fair Value | | Unrealized Losses | | Number of Securities | | Fair Value | | Unrealized Losses | | Number of Securities |
| (Dollars in thousands) |
| Available-for-sale securities | | | | | | | | | | | | |
| Mortgage-backed - GSE residential | $ | 55,185 | | | $ | 1,464 | | | 8 | | $ | 0 | | | $ | 0 | | | 0 | | $ | 55,185 | | | $ | 1,464 | | | 8 |
| Collateralized mortgage obligations - GSE residential | 7,591 | | | 26 | | | 6 | | 0 | | | 0 | | | 0 | | 7,591 | | | 26 | | | 6 |
| State and political subdivisions | 44,008 | | | 861 | | | 32 | | 24 | | | 1 | | | 1 | | 44,032 | | | 862 | | | 33 |
| Corporate bonds | 3,418 | | | 82 | | | 1 | | 0 | | | 0 | | | 0 | | 3,418 | | | 82 | | | 1 |
| Total temporarily impaired securities | $ | 110,202 | | | $ | 2,433 | | | 47 | | $ | 24 | | | $ | 1 | | | 1 | | $ | 110,226 | | | $ | 2,434 | | | 48 |
| | | June 30, 2020 | | | December 31, 2020 |
| | Less than 12 Months | | | 12 Months or More | | | Total | | | Less than 12 Months | | 12 Months or More | | Total |
| | Fair Value | | Unrealized Losses | | Number of Securities | | Fair Value | | Unrealized Losses | | Number of Securities | | Fair Value | | Unrealized Losses | | Number of Securities | | Fair Value | | Unrealized Losses | | Number of Securities | | Fair Value | | Unrealized Losses | | Number of Securities | | Fair Value | | Unrealized Losses | | Number of Securities |
| | (Dollars in thousands) | | | (Dollars in thousands) |
| Available-for-Sale Debt Securities | | | |
| Available-for-sale securities | | Available-for-sale securities | |
| Mortgage-backed - GSE residential | Mortgage-backed - GSE residential | $ | — | | | $ | — | | | — | | $ | — | | | $ | — | | | — | | $ | — | | | $ | — | | | — | Mortgage-backed - GSE residential | $ | 0 | | | $ | 0 | | | 0 | | $ | 0 | | | $ | 0 | | | 0 | | $ | 0 | | | $ | 0 | | | 0 |
| Collateralized mortgage obligations - GSE residential | Collateralized mortgage obligations - GSE residential | 12,050 | | | 20 | | | 4 | | — | | | — | | | — | | 12,050 | | | 20 | | | 4 | Collateralized mortgage obligations - GSE residential | 9,933 | | | 42 | | | 5 | | 0 | | | 0 | | | 0 | | 9,933 | | | 42 | | | 5 |
| State and political subdivisions | State and political subdivisions | 11,471 | | | 255 | | | 11 | | 27 | | | — | | | 1 | | 11,498 | | | 255 | | | 12 | State and political subdivisions | 8,525 | | | 31 | | | 8 | | 25 | | | 0 | | | 1 | | 8,550 | | | 31 | | | 9 |
| Corporate bonds | Corporate bonds | 456 | | | 4 | | | 1 | | — | | | — | | | — | | 456 | | | 4 | | | 1 | Corporate bonds | 0 | | | 0 | | | 0 | | 0 | | | 0 | | | 0 | | 0 | | | 0 | | | 0 |
| Total temporarily impaired debt securities | $ | 23,977 | | | $ | 279 | | | 16 | | $ | 27 | | | $ | — | | | 1 | | $ | 24,004 | | | $ | 279 | | | 17 | |
| Total temporarily impaired securities | | Total temporarily impaired securities | $ | 18,458 | | | $ | 73 | | | 13 | | $ | 25 | | | $ | 0 | | | 1 | | $ | 18,483 | | | $ | 73 | | | 14 |
| | | | | | | | | | | | | | | | | | | | | | | | | | | | | | | | | | | | | | | | | | | | | | | | | | | | | |
| December 31, 2019 | | | | | | | | | | | | | | | | |
| Less than 12 Months | | | | | | 12 Months or More | | | | | | Total | | | | |
| Fair Value | | Unrealized Losses | | Number of Securities | | Fair Value | | Unrealized Losses | | Number of Securities | | Fair Value | | Unrealized Losses | | Number of Securities |
| (Dollars in thousands) | | | | | | | | | | | | | | | | |
| Available-for-Sale Debt Securities | | | | | | | | | | | | | | | | | |
| Mortgage-backed - GSE residential | $ | 7,959 | | | $ | 38 | | | 2 | | $ | 20,396 | | | $ | 155 | | | 4 | | $ | 28,355 | | | $ | 193 | | | 6 |
| Collateralized mortgage obligations - GSE residential | 48,980 | | | 199 | | | 7 | | 8,622 | | | 90 | | | 9 | | 57,602 | | | 289 | | | 16 |
| State and political subdivisions | 21,412 | | | 102 | | | 11 | | 167 | | | 2 | | | 2 | | 21,579 | | | 104 | | | 13 |
| Corporate bonds | 530 | | | — | | | 1 | | — | | | — | | | — | | 530 | | | — | | | 1 |
| Total temporarily impaired debt securities | $ | 78,881 | | | $ | 339 | | | 21 | | $ | 29,185 | | | $ | 247 | | | 15 | | $ | 108,066 | | | $ | 586 | | | 36 |
As of June 30, 2020, the unrealized losses on investments in state and political subdivisions were caused by interest rate changes and adjustments in credit ratings. The contractual terms of those investments do not permit the issuer to settle the securities at a price less than the amortized cost basis of the investments. The unrealized losses on the Company’s investments in collateralized mortgage-backed securities and other obligations were caused by interest rate changes and market assumptions about prepayment speeds.
As of December 31, 2019, the unrealized losses on the Company’s investments in state and political subdivisions were caused by interest rate changes and adjustments in credit ratings. The contractual terms of those investments do not permit the issuer to settle the securities at a price less than the amortized cost basis of the investments. The unrealized losses on the Company’s investments in
| | | | | | | | |
| Notes to Consolidated Financial Statements (unaudited) | |
collateralized mortgage-backed securities and obligations were caused by interest rate changes and market assumptions about prepayment speeds.
The Company expects to recover the amortized cost basis over the term of the securities. Because theThe Company does not intend to sell the investments and it is not more likely than not the Company will be required to sell the investments before recovery of their amortized cost basis, which may be maturity, the Company does not consider those investments to be OTTI at June 30, 2020.maturity.
Gains and losses on the sale of debt securities are recorded on the trade date and are determined using the specific identification method. Gross gains of $761$21 thousand and $453$402 thousand and gross losses of $47$11 thousand and $20$9 thousand resulting from sales of available-for-sale securities were realized for the sixthree months ended June 30,March 31, 2021 and 2020, and 2019, respectively. The gross gains as of June 30,March 31, 2020, included $75 thousand related to a previously disclosed OTTI municipal security that was settled in 2020.
| | | | | | | | |
| Notes to Consolidated Financial Statements (unaudited) | |
Equity Securities
Equity securities consist of a $2 million investment in a Community Reinvestment Act (“CRA”) mutual funds. fund and an $11 million privately-held security acquired in the fourth quarter of 2020 as part of a debt restructuring. Equity securities are included in “other assets” on the Consolidated Balance Sheets.
The privately-held security was acquired in partial satisfaction of debts previously contracted. The Company elected a measurement alternative that allows the security to remain at cost until an impairment is identified or an observable price change for an identical or similar investment of the same issuer occurs. Impairment is recorded when there is evidence that the expected fair value of the equity securities was $2 million at both June 30, 2020 and December 31, 2019. investment has declined to below the recorded cost. No changes to the cost basis occurred during the first quarter of 2021. The Company is required to make good faith efforts to dispose of the security. The shares may be held for a maximum of five years, subject to a five-year extension that would result in a change to Tier 1 capital.
The following is a summary of the recorded fair value and the unrealized and realized gains and losses recognized in net income on available-for-sale equity securities:
| | | | | | | | | | | | | | | | | | | | | | | |
| Three Months Ended | | | | Six Months Ended | | |
| June 30, | | | | June 30, | | |
| 2020 | | 2019 | | 2020 | | 2019 |
| (Dollars in thousands) | | | | | | |
| Net gains recognized during the reporting period on equity securities | $ | 18 | | | $ | 30 | | | $ | 53 | | | $ | 56 | |
| Less: net gains recognized during the reporting period on equity securities sold during the reporting period | — | | | — | | | — | | | — | |
| Unrealized gain recognized during the reporting period on equity securities still held at the reporting date | $ | 18 | | | $ | 30 | | | $ | 53 | | | $ | 56 | |
| | | | | | | | | | | | | | | |
| Three Months Ended | | |
| March 31, | | |
| 2021 | | 2020 | | | | |
| (Dollars in thousands) |
| Net gains (losses) recognized during the reporting period on equity securities | $ | (39) | | | $ | 34 | | | | | |
| Less: net gains recognized during the reporting period on equity securities sold during the reporting period | 0 | | | 0 | | | | | |
| Unrealized gain (losses) recognized during the reporting period on equity securities still held at the reporting date | $ | (39) | | | $ | 34 | | | | | |
Note 4:Loans and Allowance for Loan Losses (“ALLL”)
Categories of loans at June 30, 2020March 31, 2021 and December 31, 20192020 include:
| | | June 30, 2020 | | December 31, 2019 | | March 31, 2021 | | December 31, 2020 |
| | | (Dollars in thousands) | | | (Dollars in thousands) |
| Commercial | Commercial | $ | 1,284,919 | | | $ | 1,356,817 | | Commercial | $ | 1,284,047 | | | $ | 1,338,757 | |
| Energy | Energy | 390,346 | | | 408,573 | | Energy | 342,899 | | | 345,233 | |
| Commercial real estate | Commercial real estate | 1,141,277 | | | 1,024,041 | | Commercial real estate | 1,191,634 | | | 1,179,534 | |
| Construction and land development | Construction and land development | 661,691 | | | 628,418 | | Construction and land development | 617,200 | | | 563,144 | |
| Residential real estate | 536,270 | | | 398,695 | | |
| Residential and multifamily real estate | | Residential and multifamily real estate | 687,893 | | | 680,932 | |
| Paycheck Protection Program (“PPP”) | Paycheck Protection Program (“PPP”) | 369,022 | | | — | | Paycheck Protection Program (“PPP”) | 336,355 | | | 292,230 | |
| | Consumer | Consumer | 45,716 | | | 45,163 | | Consumer | 62,917 | | | 55,270 | |
| Gross loans | Gross loans | 4,429,241 | | | 3,861,707 | | Gross loans | 4,522,945 | | | 4,455,100 | |
| Less: Allowance for loan losses | Less: Allowance for loan losses | 71,185 | | | 56,896 | | Less: Allowance for loan losses | 74,551 | | | 75,295 | |
| Less: Net deferred loan fees and costs | Less: Net deferred loan fees and costs | 16,017 | | | 9,463 | | Less: Net deferred loan fees and costs | 14,345 | | | 13,203 | |
| Net loans | Net loans | $ | 4,342,039 | | | $ | 3,795,348 | | Net loans | $ | 4,434,049 | | | $ | 4,366,602 | |
|
Allowance for Loan Losses
The allowance for loan lossesALLL is established as losses are estimated to have occurred through a provision for loan losses charged to income. Loan losses are charged against the allowance when management believes the loan balance is not collectible. Subsequent recoveries, if any, are credited to the allowance.
The allowance for loan lossesALLL is evaluated on a regular basis by management and is based upon management’s periodic review of its ability to collect the loans in light of historical experience, the nature and volume of the loan portfolio, adverse situations that may
| | | | | | | | |
| Notes to Consolidated Financial Statements (unaudited) | |
affect the borrower’s ability to repay, estimated value of any underlying collateral and prevailing economic conditions. This evaluation is inherently subjective as it requires estimates that are susceptible to significant revision as more information becomes available.
The allowanceALLL consists of allocated and general components. The allocated component relates to loans that are classified as impaired. For those loans that are classified as impaired, an allowance is established when the discounted cash flows (or collateral value or observable market price) of the impaired loan is lower than the carrying value of that loan. The general component covers all loans on
| | | | | | | | |
| Notes to Consolidated Financial Statements (unaudited) | |
accrual and is based on historical charge-off experience and expected loss given default derived from the Company’s internal risk rating process and loan categories. Other adjustments may be made to the allowance for pools of loans after an assessment of internal or external influences on credit quality that are not fully reflected in the historical loss or risk rating data.
The Company evaluates the loan risk grading system definitions, portfolio segment definitions and allowance for loan lossALLL methodology on an ongoing basis. During the quarter ended June 30, 2020, the Company distinguished between performing and nonperforming substandard loans, as previously discussed in Note 1: Nature of Operations and Summary of Significant Accounting Policies. In addition, the Company separated out PPP loans that are 100% guaranteed by the Small Business Administration (“SBA”). No additional changes to loan definitions, segmentation, and Allowance for Loan Losses (“ALLL”)ALLL methodology occurred during the secondfirst quarter of 2020.
2021.
The following tables summarize the activity in the allowance for loan lossesALLL by portfolio segment and disaggregated based on the Company’s impairment methodology. The allocation in one portfolio segment does not preclude its availability to absorb losses in other segments:
| | | | | | | | | | | | | | | | | | | | | | | | | | | | | | | | | | | | | | | | | | | | | | | | | | | | | |
| Commercial | | Energy | | Commercial Real Estate | | Construction and Land Development | | Residential Real Estate | | PPP | | | | | | Consumer | | Total | | |
| (Dollars in thousands) | | | | | | | | | | | | | | | | | | | | |
| Three months ended June 30, 2020 | | | | | | | | | | | | | | | | | | | | | |
| Allowance for loan losses | | | | | | | | | | | | | | | | | | | | | |
| Beginning balance | $ | 21,129 | | | $ | 7,599 | | | $ | 12,623 | | | $ | 5,021 | | | $ | 4,687 | | | $ | — | | | | | | | $ | 399 | | | $ | 51,458 | | | |
| Provision charged to expense | 5,499 | | | 10,773 | | | 4,276 | | | (2) | | | 370 | | | — | | | | | | | 84 | | | 21,000 | | | |
| Charge-offs | (87) | | | (1,000) | | | — | | | — | | | (189) | | | — | | | | | | | — | | | (1,276) | | | |
| Recoveries | 2 | | | — | | | — | | | — | | | — | | | — | | | | | | | 1 | | | 3 | | | |
| Ending balance | $ | 26,543 | | | $ | 17,372 | | | $ | 16,899 | | | $ | 5,019 | | | $ | 4,868 | | | $ | — | | | | | | | $ | 484 | | | $ | 71,185 | | | |
| | | | | | | | | | | | | | | | | | | | | |
| | | Commercial | | Energy | | Commercial Real Estate | | Construction and Land Development | | Residential Real Estate | | PPP | | | Consumer | | Total | | | Commercial | | Energy | | Commercial Real Estate | | Construction and Land Development | | Residential and Multifamily Real Estate | | PPP | | | Consumer | | Total | |
| | (Dollars in thousands) | | | (Dollars in thousands) | |
| Three months ended June 30, 2019 | | | | | | |
| Three months ended March 31, 2021 | | Three months ended March 31, 2021 | | | | |
| Allowance for loan losses | Allowance for loan losses | | | | | | Allowance for loan losses | | | | |
| Beginning balance | Beginning balance | $ | 20,506 | | | $ | 7,090 | | | $ | 7,471 | | | $ | 2,585 | | | $ | 2,047 | | | $ | — | | | | $ | 302 | | | $ | 40,001 | | | Beginning balance | $ | 24,693 | | | $ | 18,341 | | | $ | 22,354 | | | $ | 3,612 | | | $ | 5,842 | | | $ | 0 | | | | $ | 453 | | | $ | 75,295 | | |
| Provision charged to expense | Provision charged to expense | 2,468 | | | 210 | | | 62 | | | 17 | | | 91 | | | — | | | | 2 | | | 2,850 | | | Provision charged to expense | 7,015 | | | 1,951 | | | (1,745) | | | 225 | | | 214 | | | 0 | | | | (160) | | | 7,500 | | |
| Charge-offs | Charge-offs | — | | | — | | | — | | | — | | | — | | | — | | | | (1) | | | (1) | | | Charge-offs | (8,266) | | | 0 | | | 0 | | | 0 | | | 0 | | | 0 | | | | 0 | | | (8,266) | | |
| Recoveries | Recoveries | 1 | | | — | | | — | | | — | | | — | | | — | | | | 1 | | | 2 | | | Recoveries | 22 | | | 0 | | | 0 | | | 0 | | | 0 | | | 0 | | | | 0 | | | 22 | | |
| Ending balance | Ending balance | $ | 22,975 | | | $ | 7,300 | | | $ | 7,533 | | | $ | 2,602 | | | $ | 2,138 | | | $ | — | | | | $ | 304 | | | $ | 42,852 | | | Ending balance | $ | 23,464 | | | $ | 20,292 | | | $ | 20,609 | | | $ | 3,837 | | | $ | 6,056 | | | $ | 0 | | | | $ | 293 | | | $ | 74,551 | | |
|
| | | | | | | | | | | | | | | | | | | | | | | | | | | | | | | | | | | | | | | | | | | | | | | | | | | | |
| Commercial | | Energy | | Commercial Real Estate | | Construction and Land Development | | Residential and Multifamily Real Estate | | PPP | | | | | | Consumer | | Total | |
| (Dollars in thousands) | |
| Three months ended March 31, 2020 | | | | | | | | | | | | | | | | | |
| Allowance for loan losses | | | | | | | | | | | | | | | | | | | |
| Beginning balance | $ | 35,864 | | | $ | 6,565 | | | $ | 8,085 | | | $ | 3,516 | | | $ | 2,546 | | | $ | 0 | | | | | | | $ | 320 | | | $ | 56,896 | | |
| Provision charged to expense | 3,271 | | | 2,313 | | | 4,538 | | | 1,505 | | | 2,141 | | | 0 | | | | | | | 182 | | | 13,950 | | |
| Charge-offs | (18,077) | | | (1,279) | | | 0 | | | 0 | | | 0 | | | 0 | | | | | | | (104) | | | (19,460) | | |
| Recoveries | 71 | | | 0 | | | 0 | | | 0 | | | 0 | | | 0 | | | | | | | 1 | | | 72 | | |
| Ending balance | $ | 21,129 | | | $ | 7,599 | | | $ | 12,623 | | | $ | 5,021 | | | $ | 4,687 | | | $ | 0 | | | | | | | $ | 399 | | | $ | 51,458 | | |
| | | | | | | | | | | | | | | | | | | | |
| | | | | | | | |
| Notes to Consolidated Financial Statements (unaudited) | |
| | | | | | | | | | | | | | | | | | | | | | | | | | | | | | | | | | | | | | | | | | | | | | | | | |
| Commercial | | Energy | | Commercial Real Estate | | Construction and Land Development | | Residential Real Estate | | PPP | | Consumer | | Total | | |
| (Dollars in thousands) | | | | | | | | | | | | | | | | |
| Six months ended June 30, 2020 | | | | | | | | | | | | | | | | | |
| Allowance for loan losses | | | | | | | | | | | | | | | | | |
| Beginning balance | $ | 35,864 | | | $ | 6,565 | | | $ | 8,085 | | | $ | 3,516 | | | $ | 2,546 | | | $ | — | | | $ | 320 | | | $ | 56,896 | | | |
| Provision charged to expense | 8,771 | | | 13,085 | | | 8,814 | | | 1,503 | | | 2,511 | | | — | | | 266 | | | 34,950 | | | |
| Charge-offs | (18,165) | | | (2,278) | | | — | | | — | | | (189) | | | — | | | (104) | | | (20,736) | | | |
| Recoveries | 73 | | | — | | | — | | | — | | | — | | | — | | | 2 | | | 75 | | | |
| Ending balance | $ | 26,543 | | | $ | 17,372 | | | $ | 16,899 | | | $ | 5,019 | | | $ | 4,868 | | | $ | — | | | $ | 484 | | | $ | 71,185 | | | |
| | | | | | | | | | | | | | | | | |
| | | | | | | | | | | | | | | | | |
| | | | | | | | | | | | | | | | | |
| | | | | | | | | | | | | | | | | | | | | | | | | | | | | | | | | | | | | | | | | | | | | | | |
| Commercial | | Energy | | Commercial Real Estate | | Construction and Land Development | | Residential Real Estate | | PPP | | Consumer | | Total |
| (Dollars in thousands) | | | | | | | | | | | | | | |
| Six months ended June 30, 2019 | | | | | | | | | | | | | | | |
| Allowance for loan losses | | | | | | | | | | | | | | | |
| Beginning balance | $ | 16,584 | | | $ | 10,262 | | | $ | 6,755 | | | $ | 2,475 | | | $ | 1,464 | | | $ | — | | | $ | 286 | | | $ | 37,826 | |
| Provision charged to expense | 7,631 | | | (3,538) | | | 778 | | | 127 | | | 674 | | | — | | | $ | 28 | | | 5,700 | |
| Charge-offs | (1,254) | | | — | | | — | | | — | | | — | | | — | | | (11) | | | (1,265) | |
| Recoveries | 14 | | | 576 | | | — | | | — | | | — | | | — | | | 1 | | | 591 | |
| Ending balance | $ | 22,975 | | | $ | 7,300 | | | $ | 7,533 | | | $ | 2,602 | | | $ | 2,138 | | | $ | — | | | $ | 304 | | | $ | 42,852 | |
| | | | | | | | | | | | | | | | | | | | | | | | | | | | | | | | | | | | | | | | | | | | | | | | | | | |
| Commercial | | Energy | | Commercial Real Estate | | Construction and Land Development | | Residential and Multifamily Real Estate | | PPP | | | | | | Consumer | | Total |
| (Dollars in thousands) |
| March 31, 2021 | | | | | | | | | | | | | | | | | | | |
| Period end allowance for loan losses allocated to: | | | | | | | | | | | | | | |
| Individually evaluated for impairment | $ | 832 | | | $ | 4,938 | | | $ | 2,990 | | | $ | 0 | | | $ | 0 | | | $ | 0 | | | | | | | $ | 0 | | | $ | 8,760 | |
| Collectively evaluated for impairment | $ | 22,632 | | | $ | 15,354 | | | $ | 17,619 | | | $ | 3,837 | | | $ | 6,056 | | | $ | 0 | | | | | | | $ | 293 | | | $ | 65,791 | |
| Ending balance | $ | 23,464 | | | $ | 20,292 | | | $ | 20,609 | | | $ | 3,837 | | | $ | 6,056 | | | $ | 0 | | | | | | | $ | 293 | | | $ | 74,551 | |
| | | | | | | | | | | | | | | | | | | |
| Allocated to loans: | | | | | | | | | | | | | | | | | | | |
| Individually evaluated for impairment | $ | 39,287 | | | $ | 27,215 | | | $ | 36,028 | | | $ | 0 | | | $ | 6,302 | | | $ | 0 | | | | | | | $ | 241 | | | $ | 109,073 | |
| Collectively evaluated for impairment | $ | 1,244,760 | | | $ | 315,684 | | | $ | 1,155,606 | | | $ | 617,200 | | | $ | 681,591 | | | $ | 336,355 | | | | | | | $ | 62,676 | | | $ | 4,413,872 | |
| Ending balance | $ | 1,284,047 | | | $ | 342,899 | | | $ | 1,191,634 | | | $ | 617,200 | | | $ | 687,893 | | | $ | 336,355 | | | | | | | $ | 62,917 | | | $ | 4,522,945 | |
| | | | | | | | | | | | | | | | | | | |
| | | Commercial | | Energy | | Commercial Real Estate | | Construction and Land Development | | Residential Real Estate | | PPP | | | Consumer | | Total | | Commercial | | Energy | | Commercial Real Estate | | Construction and Land Development | | Residential and Multifamily Real Estate | | PPP | | | Consumer | | Total |
| | (Dollars in thousands) | | | (Dollars in thousands) |
| June 30, 2020 | | | | |
| December 31, 2020 | | December 31, 2020 | | | |
| Period end allowance for loan losses allocated to: | Period end allowance for loan losses allocated to: | | | | | Period end allowance for loan losses allocated to: | | | |
| Individually evaluated for impairment | Individually evaluated for impairment | $ | 2,933 | | | $ | 1,942 | | | $ | 1,704 | | | $ | — | | | $ | 413 | | | $ | — | | | | $ | — | | | $ | 6,992 | | Individually evaluated for impairment | $ | 1,115 | | | $ | 3,370 | | | $ | 5,048 | | | $ | 0 | | | $ | 0 | | | $ | 0 | | | | $ | 0 | | | $ | 9,533 | |
| Collectively evaluated for impairment | Collectively evaluated for impairment | $ | 23,610 | | | $ | 15,430 | | | $ | 15,195 | | | $ | 5,019 | | | $ | 4,455 | | | $ | — | | | | $ | 484 | | | $ | 64,193 | | Collectively evaluated for impairment | $ | 23,578 | | | $ | 14,971 | | | $ | 17,306 | | | $ | 3,612 | | | $ | 5,842 | | | $ | 0 | | | | $ | 453 | | | $ | 65,762 | |
| Ending balance | Ending balance | $ | 26,543 | | | $ | 17,372 | | | $ | 16,899 | | | $ | 5,019 | | | $ | 4,868 | | | $ | — | | | | $ | 484 | | | $ | 71,185 | | Ending balance | $ | 24,693 | | | $ | 18,341 | | | $ | 22,354 | | | $ | 3,612 | | | $ | 5,842 | | | $ | 0 | | | | $ | 453 | | | $ | 75,295 | |
| | Allocated to loans: | Allocated to loans: | | | | | | | | | | | | | | | | | Allocated to loans: | | | | | | | | | | | | | | | | |
| Individually evaluated for impairment | Individually evaluated for impairment | $ | 11,831 | | | $ | 15,532 | | | $ | 10,909 | | | $ | — | | | $ | 6,981 | | | $ | — | | | | $ | 249 | | | $ | 45,502 | | Individually evaluated for impairment | $ | 44,678 | | | 26,045 | | | $ | 44,318 | | | $ | 0 | | | $ | 6,329 | | | $ | 0 | | | | $ | 244 | | | $ | 121,614 | |
| Collectively evaluated for impairment | Collectively evaluated for impairment | $ | 1,273,088 | | | $ | 374,814 | | | $ | 1,130,368 | | | $ | 661,691 | | | $ | 529,289 | | | $ | 369,022 | | | | $ | 45,467 | | | $ | 4,383,739 | | Collectively evaluated for impairment | $ | 1,294,079 | | | $ | 319,188 | | | $ | 1,135,216 | | | $ | 563,144 | | | $ | 674,603 | | | $ | 292,230 | | | | $ | 55,026 | | | $ | 4,333,486 | |
| Ending balance | Ending balance | $ | 1,284,919 | | | $ | 390,346 | | | $ | 1,141,277 | | | $ | 661,691 | | | $ | 536,270 | | | $ | 369,022 | | | | $ | 45,716 | | | $ | 4,429,241 | | Ending balance | $ | 1,338,757 | | | $ | 345,233 | | | $ | 1,179,534 | | | $ | 563,144 | | | $ | 680,932 | | | $ | 292,230 | | | | $ | 55,270 | | | $ | 4,455,100 | |
|
| | | | | | | | |
| Notes to Consolidated Financial Statements (unaudited) | |
| | | | | | | | | | | | | | | | | | | | | | | | | | | | | | | | | | | | | | | | | | | | | | | | | | | |
| Commercial | | Energy | | Commercial Real Estate | | Construction and Land Development | | Residential Real Estate | | PPP | | | | | | Consumer | | Total |
| (Dollars in thousands) | | | | | | | | | | | | | | | | | | |
| December 31, 2019 | | | | | | | | | | | | | | | | | | | |
| Period end allowance for loan losses allocated to: | | | | | | | | | | | | | | | | | | | |
| Individually evaluated for impairment | $ | 19,942 | | | $ | 1,949 | | | $ | 210 | | | $ | — | | | $ | 197 | | | $ | — | | | | | | | $ | — | | | $ | 22,298 | |
| Collectively evaluated for impairment | $ | 15,922 | | | $ | 4,616 | | | $ | 7,875 | | | $ | 3,516 | | | $ | 2,349 | | | $ | — | | | | | | | $ | 320 | | | $ | 34,598 | |
| Ending balance | $ | 35,864 | | | $ | 6,565 | | | $ | 8,085 | | | $ | 3,516 | | | $ | 2,546 | | | $ | — | | | | | | | $ | 320 | | | $ | 56,896 | |
| Allocated to loans: | | | | | | | | | | | | | | | | | | | |
| Individually evaluated for impairment | $ | 70,876 | | | 9,744 | | | $ | 10,492 | | | $ | — | | | $ | 2,388 | | | $ | — | | | | | | | $ | — | | | $ | 93,500 | |
| Collectively evaluated for impairment | $ | 1,285,941 | | | $ | 398,829 | | | $ | 1,013,549 | | | $ | 628,418 | | | $ | 396,307 | | | $ | — | | | | | | | $ | 45,163 | | | $ | 3,768,207 | |
| Ending balance | $ | 1,356,817 | | | $ | 408,573 | | | $ | 1,024,041 | | | $ | 628,418 | | | $ | 398,695 | | | $ | — | | | | | | | $ | 45,163 | | | $ | 3,861,707 | |
Credit Risk Profile
The Company analyzes its loan portfolio based on internal rating categories (grades 1 - 8), portfolio segmentation and payment activity. These categories are utilized to develop the associated allowance for loan losses.ALLL. A description of the loan grades and segments follows:
Loan Grades
•Pass (risk rating 1-4) - ConsideredThe category includes loans that are considered satisfactory. IncludesThe category includes borrowers that generally maintain good liquidity and financial condition or the credit is currently protected with sales trends remaining flat or declining. Most ratios compare favorably with industry norms and Company policies. Debt is programmed and timely repayment is expected.
•Special Mention (risk rating 5) - BorrowersThe category includes borrowers that generally exhibit adverse trends in operations or an imbalanced position in their balance sheet that has not reached a point where repayment is jeopardized. Credits are currently protected but, if left uncorrected, the potential weaknesses may result in deterioration of the repayment prospects for the credit or in the Company’s credit or lien position at a future date. These credits are not adversely classified and do not expose the Company to enough risk to warrant adverse classification.
•Substandard (risk rating 6) - CreditsThe category includes borrowers that generally exhibit well-defined weakness(es) that jeopardize repayment. Credits are inadequately protected by the current worth and paying capacity of the obligor or of the collateral pledged. A distinct possibility exists that the Company will sustain some loss if deficiencies are not corrected. Loss potential, while existing in the aggregate amount of substandard assets, does not have to exist in individual assets classified substandard. Substandard loans include both performing and nonperforming loans and are broken out in the table below.
•Doubtful (risk rating 7) - Credits whichThe category includes borrowers that exhibit weaknesses inherent in a substandard credit with the added characteristicand characteristics that these weaknesses make collection or liquidation in full highly questionable andor improbable based on existing facts, conditions and values. Because of reasonably specific pending factors, which may work to the advantage and strengthening of the assets, classification as a loss is deferred until its more exact status may be determined.
•Loss (risk rating 8) - Credits which are considered uncollectible or of such little value that their continuance as a bankable asset is not warranted.
Loan Portfolio Segments
•Commercial - IncludesThe category includes loans to commercial customers for use in financing working capital, needs, equipment purchases and expansions. Repayment is primarily from the cash flow of a borrower’s principal business operation. Credit risk is driven by creditworthiness of a borrower and the economic conditions that impact the cash flow stability from business operations.
| | | | | | | | |
| Notes to Consolidated Financial Statements (unaudited) | |
•Energy - IncludesThe category includes loans to oil and natural gas customers for use in financing working capital needs, exploration and production activities, and acquisitions. The loans are repaid primarily from the conversion of crude oil and natural gas to cash. Credit risk is driven by creditworthiness of a borrower and the economic conditions that impact the cash flow stability from business operations. Energy loans are typically collateralized with the underlying oil and gas reserves.
•Commercial Real Estate - LoansThe category includes loans that typically involve larger principal amounts and repayment of these loans is generally dependent on the successful operations of the property securing the loan or the business conducted on the property securing the loan. These are viewed primarily as cash flow loans and secondarily as loans secured by real estate. Credit risk may be impacted by the creditworthiness of a borrower, property values and the local economies in the borrower’s market areas.
•Construction and Land Development - LoansThe category includes loans that are usually based upon estimates of costs and estimated value of the completed project and include independent appraisal reviews and a financial analysis of the developers and property owners. Sources of repayment include permanent loans, sales of developed property or an interim loan commitment from the Company until permanent financing is obtained. These loans are higher risk than other real estate loans due to their ultimate repayment being sensitive to interest rate changes, general economic conditions and the availability of long-term financing. Credit risk may be impacted by the creditworthiness of a borrower, property values and the local economies in the borrower’s market areas.
•Residential and Multifamily Real Estate - The category includes loans that are generally secured by owner-occupied 1-4 family residences or multifamily properties. Repayment of these loans is primarily dependent on the personal income and credit rating of the borrowers or underlying tenants. Credit risk in these loans can be impacted by economic
| | | | | | | | |
| Notes to Consolidated Financial Statements (unaudited) | |
conditions within or outside the borrower’s market areas that might impact either property values, a borrower’s personal income, or residents’ income.
•PPP - The category includes loans that were established by the CARES Act which authorized forgivable loans to small businesses to pay their employees during the COVID-19 pandemic. The program requires all loan terms to be the same for everyone. The loans are 100 percent guaranteed by the SBA and repayment is primarily dependent on the borrower’s cash flow or SBA repayment approval.
•Consumer - The loan portfolio consists ofcategory includes revolving lines of credit and various term loans such as automobile loans and loans for other personal purposes. Repayment is primarily dependent on the personal income and credit rating of the borrowers. Credit risk is driven by consumer economic factors (such as unemployment and general economic conditions in the borrower’s market area) and the creditworthiness of a borrower.
The following tables present the credit risk profile of the Company’s loan portfolio based on an internal rating categories (grades 1 - 8), portfolio segmentation, and payment activity:
| | | | | Pass | | Special Mention | | Substandard
Performing | | Substandard
Nonperforming | | Doubtful | | Loss | | Total | | | | Pass | | Special Mention | | Substandard
Performing | | Substandard
Nonperforming | | Doubtful | | Loss | | Total | |
| | | (Dollars in thousands) | | | | (Dollars in thousands) | |
| June 30, 2020 | | | | |
| March 31, 2021 | | March 31, 2021 | | | |
| Commercial | Commercial | | $ | 1,143,316 | | | $ | 53,411 | | | $ | 77,226 | | | $ | 7,662 | | | $ | 3,304 | | | $ | — | | | $ | 1,284,919 | | | Commercial | | $ | 1,171,818 | | | $ | 43,247 | | | $ | 46,912 | | | $ | 20,409 | | | $ | 1,661 | | | $ | 0 | | | $ | 1,284,047 | | |
| Energy | Energy | | 210,557 | | | 71,837 | | | 92,568 | | | 10,997 | | | 4,387 | | | — | | | 390,346 | | | Energy | | 141,441 | | | 82,314 | | | 92,032 | | | 23,421 | | | 3,691 | | | 0 | | | 342,899 | | |
| Commercial real estate | Commercial real estate | | 1,069,590 | | | 39,332 | | | 25,355 | | | 6,187 | | | 813 | | | — | | | 1,141,277 | | | Commercial real estate | | 1,054,675 | | | 66,101 | | | 60,037 | | | 10,821 | | | 0 | | | 0 | | | 1,191,634 | | |
| Construction and land development | Construction and land development | | 655,200 | | | 5,330 | | | 1,161 | | | — | | | — | | | — | | | 661,691 | | | Construction and land development | | 616,061 | | | 0 | | | 1,139 | | | 0 | | | 0 | | | 0 | | | 617,200 | | |
| Residential real estate | | 528,510 | | | 540 | | | 3,285 | | | 3,935 | | | — | | | — | | | 536,270 | | | |
| Residential and multifamily real estate | | Residential and multifamily real estate | | 679,335 | | | 43 | | | 5,440 | | | 3,075 | | | 0 | | | 0 | | | 687,893 | | |
| PPP | PPP | | 369,022 | | | — | | | — | | | — | | | — | | | — | | | 369,022 | | | PPP | | 336,355 | | | 0 | | | 0 | | | 0 | | | 0 | | | 0 | | | 336,355 | | |
| | Consumer | Consumer | | 45,467 | | | — | | | — | | | 249 | | | — | | | — | | | 45,716 | | | Consumer | | 62,676 | | | 0 | | | 0 | | | 241 | | | 0 | | | 0 | | | 62,917 | | |
| | | $ | 4,021,662 | | | $ | 170,450 | | | $ | 199,595 | | | $ | 29,030 | | | $ | 8,504 | | | $ | — | | | $ | 4,429,241 | | | | | $ | 4,062,361 | | | $ | 191,705 | | | $ | 205,560 | | | $ | 57,967 | | | $ | 5,352 | | | $ | 0 | | | $ | 4,522,945 | | |
| | | | | | | | | | | | | | | | | | | | | | | | | | | | | | | | | | | | | | | | | | | | |
| | | | | | | | |
| | | | Pass | | Special Mention | | Substandard
Performing | | Substandard
Nonperforming | | Doubtful | | Loss | | Total |
| | | | (Dollars in thousands) |
| December 31, 2020 | | | | | | | | | | | | | | | | |
| Commercial | | | | $ | 1,182,519 | | | $ | 66,142 | | | $ | 63,407 | | | $ | 26,124 | | | $ | 565 | | | $ | 0 | | | $ | 1,338,757 | |
| Energy | | | | 145,598 | | | 90,134 | | | 83,574 | | | 22,177 | | | 3,750 | | | 0 | | | 345,233 | |
| Commercial real estate | | | | 1,035,056 | | | 67,710 | | | 57,680 | | | 19,088 | | | 0 | | | 0 | | | 1,179,534 | |
| Construction and land development | | | | 561,871 | | | 125 | | | 1,148 | | | 0 | | | 0 | | | 0 | | | 563,144 | |
| Residential and multifamily real estate | | | | 672,327 | | | 305 | | | 5,199 | | | 3,101 | | | 0 | | | 0 | | | 680,932 | |
| PPP | | | | 292,230 | | | 0 | | | 0 | | | 0 | | | 0 | | | 0 | | | 292,230 | |
| | | | | | | | | | | | | | | | |
| | | | | | | | | | | | | | | | |
| Consumer | | | | 55,026 | | | 0 | | | 0 | | | 244 | | | 0 | | | 0 | | | 55,270 | |
| | | | $ | 3,944,627 | | | $ | 224,416 | | | $ | 211,008 | | | $ | 70,734 | | | $ | 4,315 | | | $ | 0 | | | $ | 4,455,100 | |
| | | | | | | | |
| Notes to Consolidated Financial Statements (unaudited) | |
| | | | | | | | | | | | | | | | | | | | | | | | | | | | | | | | | | | | | | | | | | | | |
| | | | | | | | | | | | | | | | |
| | | | Pass | | Special Mention | | Substandard
Performing | | Substandard
Nonperforming | | Doubtful | | Loss | | Total |
| | | | (Dollars in thousands) | | | | | | | | | | | | |
| December 31, 2019 | | | | | | | | | | | | | | | | |
| Commercial | | | | $ | 1,258,952 | | | $ | 27,069 | | | $ | 38,666 | | | $ | 32,130 | | | $ | — | | | $ | — | | | $ | 1,356,817 | |
| Energy | | | | 392,233 | | | 9,460 | | | 2,340 | | | — | | | 4,540 | | | — | | | 408,573 | |
| Commercial real estate | | | | 1,007,921 | | | 9,311 | | | 5,746 | | | 120 | | | 943 | | | — | | | 1,024,041 | |
| Construction and land development | | | | 628,418 | | | — | | | — | | | — | | | — | | | — | | | 628,418 | |
| Residential real estate | | | | 394,495 | | | 1,789 | | | 469 | | | 1,942 | | | — | | | — | | | 398,695 | |
| PPP | | | | — | | | — | | | — | | | — | | | — | | | — | | | — | |
| | | | | | | | | | | | | | | | |
| | | | | | | | | | | | | | | | |
| Consumer | | | | 45,163 | | | — | | | — | | | — | | | — | | | — | | | 45,163 | |
| | | | $ | 3,727,182 | | | $ | 47,629 | | | $ | 47,221 | | | $ | 34,192 | | | $ | 5,483 | | | $ | — | | | $ | 3,861,707 | |
Loan Portfolio Aging Analysis
The following tables present the Company’s loan portfolio aging analysis of the recorded investment in loans as of June 30, 2020March 31, 2021 and December 31, 2019:2020:
| | | 30-59 Days Past Due | | 60-89 Days Past Due | | 90 Days or More | | Total Past Due | | Current | | Total Loans Receivable | | | Loans >= 90 Days and Accruing | | | 30-59 Days Past Due | | 60-89 Days Past Due | | 90 Days or More | | Total Past Due | | Current | | Total Loans Receivable | | | Loans >= 90 Days and Accruing | |
| | (Dollars in thousands) | | | (Dollars in thousands) | |
| June 30, 2020 | | | | | |
| March 31, 2021 | | March 31, 2021 | | | | |
| Commercial | Commercial | $ | 4,645 | | | $ | 3,391 | | | $ | 7,315 | | | $ | 15,351 | | | $ | 1,269,568 | | | $ | 1,284,919 | | | | $ | — | | | Commercial | $ | 7,813 | | | $ | 403 | | | $ | 15,709 | | | $ | 23,925 | | | $ | 1,260,122 | | | $ | 1,284,047 | | | | $ | 0 | | |
| Energy | Energy | — | | | 16,918 | | | 4,440 | | | 21,358 | | | 368,988 | | | 390,346 | | | | — | | | Energy | 748 | | | 0 | | | 6,741 | | | 7,489 | | | 335,410 | | | 342,899 | | | | 0 | | |
| Commercial real estate | Commercial real estate | 8,009 | | | 230 | | | 4,481 | | | 12,720 | | | 1,128,557 | | | 1,141,277 | | | | — | | | Commercial real estate | 0 | | | 0 | | | 4,097 | | | 4,097 | | | 1,187,537 | | | 1,191,634 | | | | 0 | | |
| Construction and land development | Construction and land development | 194 | | | — | | | — | | | 194 | | | 661,497 | | | 661,691 | | | | — | | | Construction and land development | 862 | | | 0 | | | 0 | | | 862 | | | 616,338 | | | 617,200 | | | | 0 | | |
| Residential real estate | 1,357 | | | — | | | 3,915 | | | 5,272 | | | 530,998 | | | 536,270 | | | | 220 | | | |
| Residential and multifamily real estate | | Residential and multifamily real estate | 1,160 | | | 0 | | | 6,028 | | | 7,188 | | | 680,705 | | | 687,893 | | | | 3,183 | | |
| PPP | PPP | — | | | — | | | — | | | — | | | 369,022 | | | 369,022 | | | | — | | | PPP | 0 | | | 0 | | | 0 | | | 0 | | | 336,355 | | | 336,355 | | | | 0 | | |
| | Consumer | Consumer | — | | | 137 | | | — | | | 137 | | | 45,579 | | | 45,716 | | | | — | | | Consumer | 0 | | | 0 | | | 0 | | | 0 | | | 62,917 | | | 62,917 | | | | 0 | | |
| | $ | 14,205 | | | $ | 20,676 | | | $ | 20,151 | | | $ | 55,032 | | | $ | 4,374,209 | | | $ | 4,429,241 | | | | $ | 220 | | | | $ | 10,583 | | | $ | 403 | | | $ | 32,575 | | | $ | 43,561 | | | $ | 4,479,384 | | | $ | 4,522,945 | | | | $ | 3,183 | | |
| | | 30-59 Days Past Due | | 60-89 Days Past Due | | 90 Days or More | | Total Past Due | | Current | | Total Loans Receivable | | Loans >= 90 Days and Accruing | | 30-59 Days Past Due | | 60-89 Days Past Due | | 90 Days or More | | Total Past Due | | Current | | Total Loans Receivable | | Loans >= 90 Days and Accruing |
| | (Dollars in thousands) | | | (Dollars in thousands) |
| December 31, 2019 | | |
| December 31, 2020 | | December 31, 2020 | |
| Commercial | Commercial | $ | 1,091 | | | $ | 276 | | | $ | 30,911 | | | $ | 32,278 | | | $ | 1,324,539 | | | $ | 1,356,817 | | | $ | 37 | | Commercial | $ | 8,497 | | | $ | 264 | | | $ | 11,236 | | | $ | 19,997 | | | $ | 1,318,760 | | | $ | 1,338,757 | | | $ | 0 | |
| Energy | Energy | 2,340 | | | — | | | 4,593 | | | 6,933 | | | 401,640 | | | 408,573 | | | 53 | | Energy | 0 | | | 0 | | | 7,173 | | | 7,173 | | | 338,060 | | | 345,233 | | | 372 | |
| Commercial real estate | Commercial real estate | 316 | | | — | | | 4,589 | | | 4,905 | | | 1,019,136 | | | 1,024,041 | | | 4,501 | | Commercial real estate | 63 | | | 7,677 | | | 4,825 | | | 12,565 | | | 1,166,969 | | | 1,179,534 | | | 0 | |
| Construction and land development | Construction and land development | 196 | | | — | | | — | | | 196 | | | 628,222 | | | 628,418 | | | — | | Construction and land development | 0 | | | 0 | | | 0 | | | 0 | | | 563,144 | | | 563,144 | | | 0 | |
| Residential real estate | 2,347 | | | — | | | 1,919 | | | 4,266 | | | 394,429 | | | 398,695 | | | — | | |
| Residential and multifamily real estate | | Residential and multifamily real estate | 1,577 | | | 0 | | | 3,520 | | | 5,097 | | | 675,835 | | | 680,932 | | | 652 | |
| PPP | PPP | — | | | — | | | — | | | — | | | — | | | — | | | — | | PPP | 0 | | | 0 | | | 0 | | | — | | | 292,230 | | | 292,230 | | | 0 | |
| Consumer | Consumer | 2 | | | 254 | | | — | | | 256 | | | 44,907 | | | 45,163 | | | — | | Consumer | 0 | | | 0 | | | 0 | | | 0 | | | 55,270 | | | 55,270 | | | 0 | |
| | $ | 6,292 | | | $ | 530 | | | $ | 42,012 | | | $ | 48,834 | | | $ | 3,812,873 | | | $ | 3,861,707 | | | $ | 4,591 | | | $ | 10,137 | | | $ | 7,941 | | | $ | 26,754 | | | $ | 44,832 | | | $ | 4,410,268 | | | $ | 4,455,100 | | | $ | 1,024 | |
| | | | | | | | |
| Notes to Consolidated Financial Statements (unaudited) | |
Impaired Loans
A loan is considered impaired, in accordance with the impairment accounting guidance (ASC 310-10-35-16), when based on current information and events, it is probable the Company will be unable to collect all amounts due from the borrower in accordance with the contractual terms of the loan. Impaired loans include nonperforming loans but also include loans modified in troubled debt restructurings where concessions have been granted to borrowers experiencing financial difficulties. The intent of concessions is to maximize collection.
Groups of loans with similar risk characteristics are collectively evaluated for impairment based on the group’s historical loss experience adjusted for changes in trends, conditions and other relevant factors that affect repayment of the loans.
The following tables present loans individually evaluated for impairment, including all restructured and formerly restructured loans, for the periods ended June 30, 2020March 31, 2021 and December 31, 2019:2020:
| | | | | Unpaid | | | | | | Unpaid | | |
| | Recorded Balance | | | Principal Balance | | Specific Allowance | | | Recorded Balance | | | Principal Balance | | Specific Allowance | |
| | (Dollars in thousands) | | | (Dollars in thousands) |
| June 30, 2020 | | | | | |
| March 31, 2021 | | March 31, 2021 | | | | |
| Loans without a specific valuation | Loans without a specific valuation | | | | | Loans without a specific valuation | | | | |
| Commercial | Commercial | $ | 70 | | | | $ | 70 | | | $ | — | | | Commercial | $ | 36,174 | | | | $ | 38,124 | | | $ | — | | |
| Energy | Energy | — | | | | — | | | — | | | Energy | 103 | | | | 103 | | | — | | |
| Commercial real estate | Commercial real estate | 763 | | | | 854 | | | — | | | Commercial real estate | 10,553 | | | | 12,138 | | | — | | |
| Construction and land development | Construction and land development | — | | | | — | | | — | | | Construction and land development | 0 | | | | 0 | | | — | | |
| Residential real estate | 5,404 | | | | 5,404 | | | — | | | |
| Residential and multifamily real estate | | Residential and multifamily real estate | 6,302 | | | | 6,558 | | | — | | |
| PPP | PPP | — | | | | — | | | — | | | PPP | 0 | | | | 0 | | | — | | |
| | Consumer | Consumer | 249 | | | | 249 | | | — | | | Consumer | 241 | | | | 241 | | | — | | |
| Loans with a specific valuation | Loans with a specific valuation | | | | | Loans with a specific valuation | | | | |
| Commercial | Commercial | 11,761 | | | | 29,710 | | | 2,933 | | | Commercial | 3,113 | | | | 15,297 | | | 832 | | |
| Energy | Energy | 15,532 | | | | 18,244 | | | 1,942 | | | Energy | 27,112 | | | | 35,204 | | | 4,938 | | |
| Commercial real estate | Commercial real estate | 10,146 | | | | 10,146 | | | 1,704 | | | Commercial real estate | 25,475 | | | | 25,475 | | | 2,990 | | |
| Construction and land development | Construction and land development | — | | | | — | | | — | | | Construction and land development | 0 | | | | 0 | | | 0 | | |
| Residential real estate | 1,577 | | | | 1,577 | | | 413 | | | |
| Residential and multifamily real estate | | Residential and multifamily real estate | 0 | | | | 0 | | | 0 | | |
| PPP | PPP | — | | | | — | | | — | | | PPP | 0 | | | | 0 | | | 0 | | |
| | Consumer | Consumer | — | | | | — | | | — | | | Consumer | 0 | | | | 0 | | | 0 | | |
| | Total | Total | | | | | Total | | | | |
| Commercial | Commercial | 11,831 | | | | 29,780 | | | 2,933 | | | Commercial | 39,287 | | | | 53,421 | | | 832 | | |
| Energy | Energy | 15,532 | | | | 18,244 | | | 1,942 | | | Energy | 27,215 | | | | 35,307 | | | 4,938 | | |
| Commercial real estate | Commercial real estate | 10,909 | | | | 11,000 | | | 1,704 | | | Commercial real estate | 36,028 | | | | 37,613 | | | 2,990 | | |
| Construction and land development | Construction and land development | — | | | | — | | | — | | | Construction and land development | 0 | | | | 0 | | | 0 | | |
| Residential real estate | 6,981 | | | | 6,981 | | | 413 | | | |
| Residential and multifamily real estate | | Residential and multifamily real estate | 6,302 | | | | 6,558 | | | 0 | | |
| PPP | PPP | — | | | | — | | | — | | | PPP | 0 | | | | 0 | | | 0 | | |
| | Consumer | Consumer | 249 | | | | 249 | | | — | | | Consumer | 241 | | | | 241 | | | 0 | | |
| | $ | 45,502 | | | | $ | 66,254 | | | $ | 6,992 | | | | $ | 109,073 | | | | $ | 133,140 | | | $ | 8,760 | | |
| | | | | | | | |
| Notes to Consolidated Financial Statements (unaudited) | |
| | | | | Unpaid | | | | | Unpaid | | |
| | Recorded Balance | | Principal Balance | | Specific Allowance | | | Recorded Balance | | Principal Balance | | Specific Allowance | |
| | (Dollars in thousands) | | | (Dollars in thousands) |
| December 31, 2019 | | | |
| December 31, 2020 | | December 31, 2020 | | |
| Loans without a specific valuation | Loans without a specific valuation | | | Loans without a specific valuation | | |
| Commercial | Commercial | $ | 35,846 | | | $ | 35,846 | | | $ | — | | | Commercial | $ | 36,111 | | | $ | 50,245 | | | $ | — | | |
| Energy | Energy | 2,864 | | | 2,864 | | | — | | | Energy | 3,864 | | | 6,677 | | | — | | |
| Commercial real estate | Commercial real estate | 9,464 | | | 9,464 | | | — | | | Commercial real estate | 10,079 | | | 11,663 | | | — | | |
| Construction and land development | Construction and land development | — | | | — | | | — | | | Construction and land development | 0 | | | 0 | | | — | | |
| Residential real estate | 2,139 | | | 2,139 | | | — | | | |
| Residential and multifamily real estate | | Residential and multifamily real estate | 6,329 | | | 6,585 | | | — | | |
| PPP | PPP | — | | | — | | | — | | | PPP | 0 | | | 0 | | | — | | |
| Consumer | Consumer | — | | | — | | | — | | | Consumer | 244 | | | 244 | | | — | | |
| Loans with a specific valuation | Loans with a specific valuation | | | Loans with a specific valuation | | |
| Commercial | Commercial | 35,030 | | | 40,030 | | | 19,942 | | | Commercial | 8,567 | | | 8,567 | | | 1,115 | | |
| Energy | Energy | 6,880 | | | 9,880 | | | 1,949 | | | Energy | 22,181 | | | 27,460 | | | 3,370 | | |
| Commercial real estate | Commercial real estate | 1,028 | | | 1,028 | | | 210 | | | Commercial real estate | 34,239 | | | 34,239 | | | 5,048 | | |
| Construction and land development | Construction and land development | — | | | — | | | — | | | Construction and land development | 0 | | | 0 | | | 0 | | |
| Residential real estate | 249 | | | 249 | | | 197 | | | |
| Residential and multifamily real estate | | Residential and multifamily real estate | 0 | | | 0 | | | 0 | | |
| PPP | PPP | — | | | — | | | — | | | PPP | 0 | | | 0 | | | 0 | | |
| Consumer | Consumer | — | | | — | | | — | | | Consumer | 0 | | | 0 | | | 0 | | |
| | Total | Total | | | Total | | |
| Commercial | Commercial | 70,876 | | | 75,876 | | | 19,942 | | | Commercial | 44,678 | | | 58,812 | | | 1,115 | | |
| Energy | Energy | 9,744 | | | 12,744 | | | 1,949 | | | Energy | 26,045 | | | 34,137 | | | 3,370 | | |
| Commercial real estate | Commercial real estate | 10,492 | | | 10,492 | | | 210 | | | Commercial real estate | 44,318 | | | 45,902 | | | 5,048 | | |
| Construction and land development | Construction and land development | — | | | — | | | — | | | Construction and land development | 0 | | | 0 | | | 0 | | |
| Residential real estate | 2,388 | | | 2,388 | | | 197 | | | |
| Residential and multifamily real estate | | Residential and multifamily real estate | 6,329 | | | 6,585 | | | 0 | | |
| PPP | PPP | — | | | — | | | — | | | PPP | 0 | | | 0 | | | 0 | | |
| Consumer | Consumer | — | | | — | | | — | | | Consumer | 244 | | | 244 | | | 0 | | |
| | $ | 93,500 | | | $ | 101,500 | | | $ | 22,298 | | | | $ | 121,614 | | | $ | 145,680 | | | $ | 9,533 | | |
The table below shows interest income recognized during the three and six month periods ended June 30,March 31, 2021 and 2020 and 2019 for impaired loans, including all restructured and formerly restructured loans, held at the end of each period:
| | | Three Months Ended | | | Six Months Ended | | | Three Months Ended | |
| | June 30, | | | June 30, | | | March 31, | |
| | 2020 | | 2019 | | 2020 | | | 2019 | | 2021 | | 2020 | |
| | (Dollars in thousands) | | | (Dollars in thousands) |
| Commercial | Commercial | $ | 27 | | | $ | 781 | | | $ | 88 | | | | $ | 1,564 | | Commercial | $ | 303 | | | $ | 910 | | |
| Energy | Energy | 46 | | | 53 | | | 210 | | | | 109 | | Energy | 16 | | | 122 | | |
| Commercial real estate | Commercial real estate | 58 | | | 278 | | | 135 | | | | 532 | | Commercial real estate | 287 | | | 123 | | |
| Construction and land development | Construction and land development | — | | | — | | | — | | | | 1 | | Construction and land development | 0 | | | 0 | | |
| Residential real estate | 35 | | | 10 | | | 74 | | | | 21 | | |
| Residential and multifamily real estate | | Residential and multifamily real estate | 36 | | | 40 | | |
| PPP | PPP | — | | | — | | | — | | | | — | | PPP | 0 | | | 0 | | |
| | Consumer | Consumer | — | | | — | | | — | | | | — | | Consumer | 0 | | | 0 | | |
| Total interest income recognized | Total interest income recognized | $ | 166 | | | $ | 1,122 | | | $ | 507 | | | | $ | 2,227 | | Total interest income recognized | $ | 642 | | | $ | 1,195 | | |
| | | | | | | | |
| Notes to Consolidated Financial Statements (unaudited) | |
The table below shows the three and six month average balance of impaired loans as of June 30,for the periods ended March 31, 2021 and 2020 and 2019 by loan category for impaired loans, including all restructured and formerly restructured loans, held at the end of each period:
| | | Three Months Ended | | | Six Months Ended | | | Three Months Ended | |
| | June 30, | | | June 30, | | | March 31, | |
| | 2020 | | 2019 | | 2020 | | 2019 | | | 2021 | | 2020 | |
| | (Dollars in thousands) | | | (Dollars in thousands) | |
| Commercial | Commercial | $ | 11,793 | | | $ | 50,732 | | | $ | 19,002 | | | $ | 74,259 | | | Commercial | $ | 41,919 | | | $ | 86,626 | | |
| Energy | Energy | 16,798 | | | 12,534 | | | 17,527 | | | 13,850 | | | Energy | 27,431 | | | 16,976 | | |
| Commercial real estate | Commercial real estate | 10,958 | | | 13,779 | | | 11,044 | | | 14,661 | | | Commercial real estate | 36,215 | | | 14,927 | | |
| Construction and land development | Construction and land development | — | | | 50 | | | — | | | 25 | | | Construction and land development | 0 | | | 0 | | |
| Residential real estate | 7,171 | | | 2,665 | | | 6,953 | | | 2,428 | | | |
| Residential and multifamily real estate | | Residential and multifamily real estate | 6,316 | | | 5,230 | | |
| PPP | PPP | — | | | — | | | — | | | — | | | PPP | 0 | | | 0 | | |
| Consumer | Consumer | 251 | | | — | | | 253 | | | — | | | Consumer | 243 | | | 254 | | |
| Total average impaired loans | Total average impaired loans | $ | 46,971 | | | $ | 79,760 | | | $ | 54,779 | | | $ | 105,223 | | | Total average impaired loans | $ | 112,124 | | | $ | 124,013 | | |
Non-accrual Loans
NonperformingNon-accrual loans are loans for which the Company does not record interest income. The accrual of interest on loans is discontinued at the time the loan is 90 days past due unless the credit is well secured and in process of collection. Past due status is based on contractual terms of the loan. In all cases, loans are placed on non-accrual or charged off at an earlier date, if collection of principal or interest is considered doubtful.
All interest accrued but not collected for loans that are placed on non-accrual or charged off are reversed against interest income. The interest on these loans is accounted for on the cash basis or cost-recovery method, until qualifying for return to accrual. Loans are returned to accrual status when all the principal and interest amounts contractually due are brought current and future payments are reasonably assured. The following table presents the Company’s non-accrual loans by loan category at June 30, 2020March 31, 2021 and December 31, 2019:2020:
| | | | June 30, 2020 | | December 31, 2019 | |
| | (Dollars in thousands) | | | March 31, 2021 | | December 31, 2020 |
| | | (Dollars in thousands) |
| Commercial | Commercial | $ | 10,966 | | | $ | 32,130 | | Commercial | $ | 22,070 | | | $ | 26,691 | |
| Energy | Energy | 15,384 | | | 4,540 | | Energy | 27,112 | | | 25,927 | |
| Commercial real estate | Commercial real estate | 7,000 | | | 1,063 | | Commercial real estate | 10,821 | | | 19,088 | |
| Construction and land development | Construction and land development | — | | | — | | Construction and land development | 0 | | | 0 | |
| Residential real estate | 3,935 | | | 1,942 | | |
| Residential and multifamily real estate | | Residential and multifamily real estate | 3,075 | | | 3,101 | |
| PPP | PPP | — | | | — | | PPP | 0 | | | 0 | |
| Consumer | Consumer | 249 | | | — | | Consumer | 241 | | | 244 | |
| Total non-accrual loans | Total non-accrual loans | $ | 37,534 | | | $ | 39,675 | | Total non-accrual loans | $ | 63,319 | | | $ | 75,051 | |
Troubled Debt Restructurings
Restructured loans are those extended to borrowers who are experiencing financial difficulty and who have been granted a concession, excluding loan modifications as a result of the COVID-19 pandemic. The modification of terms typically includes the extension of maturity, reduction or deferment of monthly payment, or reduction of the stated interest rate.
For the three month periods ended March 31, 2021 and 2020, the modifications related to the TDRs below did not impact the ALLL because the loans were previously impaired and evaluated on an individual basis or enough collateral was obtained.
| | | | | | | | |
| Notes to Consolidated Financial Statements (unaudited) | |
The table below presents loans restructured, excluding loans restructured as a result of the COVID-19 pandemic, during the three and six months ended June 30,March 31, 2021 and 2020, and 2019, including the post-modification outstanding balance and the type of concession made:
| | | | | | | | | | | | | | | | | | | | | | | |
| Three Months Ended | | | | Six Months Ended | | |
| June 30, | | June 30, | | June 30, | | June 30, |
| 2020 | | 2019 | | 2020 | | 2019 |
| (Dollars in thousands) | | | | | | |
| Commercial | | | | | | | |
| - Interest rate reduction | $ | — | | | $ | — | | | $ | 3,171 | | | $ | — | |
| - Reduction of monthly payment | — | | | — | | | — | | | 994 | |
| - Extension of maturity date | — | | | 30,005 | | | — | | | 30,005 | |
| Energy | | | | | | | |
| - Extension of maturity date | — | | | — | | | 2,340 | | | — | |
| Commercial real estate | | | | | | | |
| | | | | | | |
| - Reduction of monthly payment | — | | | — | | | — | | | 3,767 | |
| | | | | | | |
| | | | | | | |
| Residential real estate | | | | | | | |
| - Payment deferral | 65 | | | — | | | 65 | | | — | |
| | | | | | | |
| | | | | | | |
| | | | | | | |
| Total troubled debt restructurings during applicable period | $ | 65 | | | $ | 30,005 | | | $ | 5,576 | | | $ | 34,766 | |
As of June 30, 2020 and December 31, 2019, the Company had $749 thousand and $934 thousand, respectively, in unfunded commitments to borrowers whose terms have been modified in TDRs. For the three and six-month periods ended June 30, 2020, the modifications related to the TDRs above did not impact the allowance for loan losses because the loans were previously impaired and evaluated on an individual basis or enough collateral was obtained to provide an additional commitment. | | | | | | | | | | | | | | | |
| Three Months Ended | | |
| March 31, | | March 31, | | | | |
| 2021 | | 2020 | | | | |
| (Dollars in thousands) |
| Commercial | | | | | | | |
| - Interest rate reduction | $ | 0 | | | $ | 3,171 | | | | | |
| | | | | | | |
| | | | | | | |
| Energy | | | | | | | |
| - Extension of maturity date | 0 | | | 2,340 | | | | | |
| | | | | | | |
| | | | | | | |
| | | | | | | |
| | | | | | | |
| | | | | | | |
| | | | | | | |
| | | | | | | |
| | | | | | | |
| | | | | | | |
| | | | | | | |
| Total troubled debt restructurings | $ | 0 | | | $ | 5,511 | | | | | |
The balance of restructured loans, excluding loans restructured as a result of the COVID-19 pandemic, is provided below as of June 30, 2020March 31, 2021 and December 31, 2019.2020. In addition, the balance of those loans that are in default at any time during the past twelve months at June 30, 2020March 31, 2021 and December 31, 20192020 is provided below:
| | | | June 30, 2020 | | | December 31, 2019 | | | March 31, 2021 | | December 31, 2020 |
| | Number of Loans | | Outstanding Balance | | Balance 90 days past due at any time during previous 12 months(1) | | Number of Loans | | Outstanding Balance | | Balance 90 days past due at any time during previous 12 months(1) | | Number of Loans | | Outstanding Balance | | Balance 90 days past due at any time during previous 12 months(1) | | Number of Loans | | Outstanding Balance | | Balance 90 days past due at any time during previous 12 months(1) |
| | (Dollars in thousands) | | | (Dollars in thousands) |
| Commercial | Commercial | 6 | | $ | 9,657 | | | $ | 842 | | | 7 | | $ | 31,770 | | | $ | 831 | | Commercial | 6 | | $ | 21,631 | | | $ | 4,115 | | | 7 | | $ | 22,759 | | | $ | 2,776 | |
| Energy | Energy | 3 | | 4,032 | | | — | | | 2 | | 2,864 | | | — | | Energy | 4 | | 10,850 | | | 2,619 | | | 4 | | 11,053 | | | 2,713 | |
| Commercial real estate | Commercial real estate | 3 | | 4,749 | | | — | | | 3 | | 4,909 | | | — | | Commercial real estate | 4 | | 25,990 | | | 0 | | | 4 | | 26,038 | | | 0 | |
| Construction and land development | Construction and land development | — | | — | | | — | | | — | | — | | | — | | Construction and land development | 0 | | 0 | | | 0 | | | 0 | | 0 | | | 0 | |
| Residential real estate | 2 | | 3,065 | | | — | | | — | | — | | | — | | |
| Residential and multifamily real estate | | Residential and multifamily real estate | 2 | | 3,244 | | | 0 | | | 2 | | 3,245 | | | 0 | |
| PPP | PPP | — | | — | | | — | | | — | | — | | | — | | PPP | 0 | | 0 | | | 0 | | | 0 | | 0 | | | 0 | |
| Consumer | Consumer | — | | — | | | — | | | — | | — | | | — | | Consumer | 0 | | 0 | | | 0 | | | 0 | | 0 | | | 0 | |
| Total troubled debt restructured loans | Total troubled debt restructured loans | 14 | | $ | 21,503 | | | $ | 842 | | | 12 | | $ | 39,543 | | | $ | 831 | | Total troubled debt restructured loans | 16 | | $ | 61,715 | | | $ | 6,734 | | | 17 | | $ | 63,095 | | | $ | 5,489 | |
(1) Default is considered to mean 90 days or more past due as to interest or principal. | (1) Default is considered to mean 90 days or more past due as to interest or principal. | | (1) Default is considered to mean 90 days or more past due as to interest or principal. |
|
The TDRs above had an allowance of $3$5 million and $18$4 million as of June 30, 2020March 31, 2021 and December 31, 2019,2020, respectively.
Note 5:Derivatives and Hedging
Derivatives not designated as hedges are not speculative and result from a service the Company provides to clients. The Company executes interest rate swaps with customers to facilitate their respective risk management strategies. Those interest rate swaps are simultaneously hedged by offsetting derivatives that the Company executes with a third party, such that the Company minimizes its
| | | | | | | | |
| Notes to Consolidated Financial Statements (unaudited) | |
net risk exposure resulting from such transactions. As the interest rate derivatives associated with this program do not meet the strict hedge accounting requirements, changes in the fair value of both the customer derivatives and the offsetting derivatives are recognized directly in earnings. The gains and losses are included in “other assets” on the Statement of Cash Flows.
During 2019, the Company changed an input associated with the fair market value related to derivatives not designated as hedges. The model utilized to calculate the non-performance risk, also known as the credit valuation adjustment, or CVA, was adjusted from a more conservative default methodology to a review of the historical defaults recognized by the Company. Management believes this change better aligns with the Company’s credit methodology and underwriting standards.
As of June 30, 2020March 31, 2021 and December 31, 2019,2020, the Company had the following outstanding derivatives that were not designated as hedges in qualifying hedging relationships:
| | | | | | | | | | | | | | | | | | | | | | | |
| | | | | | | |
| June 30, 2020 | | | | December 31, 2019 | | |
| Product | Number of Instruments | | Notional Amount | | Number of Instruments | | Notional Amount |
| (Dollars in thousands) | | | | | | |
| Back-to-back swaps | 58 | | $ | 487,255 | | | 56 | | $ | 380,050 | |
The table below presents the fair value of the Company’s derivative financial instruments and their classification on the Balance Sheet as of June 30, 2020 and December 31, 2019:
| | | | | | | | | | | | | | | | | | | | | | | | | | | | | | | | | | | |
| Asset Derivatives | | | | | | Liability Derivatives | | | | |
| Balance Sheet | | June 30, | | December 31, | | Balance Sheet | | June 30, | | December 31, |
| Location | | 2020 | | 2019 | | Location | | 2020 | | 2019 |
| (Dollars in thousands) | | | | | | | | | | |
| Derivatives not designated as hedging instruments | | | | | | | | | | | |
| Interest rate products | Other assets | | $ | 29,302 | | | $ | 9,838 | | | Other liabilities | | $ | 29,432 | | | $ | 9,907 | |
The effect of the Company’s derivative financial instruments that are not designated as hedging instruments are reported on the Consolidated Statements of Operations as swap fee income, net. The effect of the Company’s derivative financial instruments gain and loss are reported on the Consolidated Statements of Cash Flows within other assets and other liabilities.
The tables below show a gross presentation, the effects of offsetting, and a net presentation of the Company’s derivatives as of June 30, 2020 and December 31, 2019:
| | | | | | | | | | | | | | | | | | | | | | | | | | | | | | | | | | | |
| June 30, 2020 | | | | | | | | | | | |
| (Dollars in thousands) | | | | | | | | | | | |
| | | | | | | Gross Amounts Not Offset in the Statement of Financial Position | | | | |
| Gross Amounts of Recognized Assets and Liabilities | | Gross Amounts Offset in the Statement of Financial Position | | Net Amounts of Assets presented in the Statement of Financial Position | | Financial Instruments | | Cash Collateral Received | | Net Amount |
| Offsetting of derivative assets | | | | | | | | | | | |
| Derivatives | $ | 29,302 | | | $ | — | | | $ | 29,302 | | | $ | 8 | | | $ | — | | | $ | 29,294 | |
| Offsetting of derivative liabilities | | | | | | | | | | | |
| Derivatives | $ | 29,432 | | | $ | — | | | $ | 29,432 | | | $ | 8 | | | $ | — | | | $ | 29,424 | |
| | | | | | | | | | | | | | | | | | | | | | | |
| |
| March 31, 2021 | | December 31, 2020 |
| Product | Number of Instruments | | Notional Amount | | Number of Instruments | | Notional Amount |
| (Dollars in thousands) |
| Back-to-back swaps | 56 | | $ | 546,947 | | | 56 | | $ | 515,567 | |
| | | | | | | | |
| Notes to Consolidated Financial Statements (unaudited) | |
| | | | | | | | | | | | | | | | | | | | | | | | | | | | | | | | | | | |
| December 31, 2019 | | | | | | | | | | | |
| (Dollars in thousands) | | | | | | | | | | | |
| | | | | | | Gross Amounts Not Offset in the Statement of Financial Position | | | | |
| Gross Amounts of Recognized Assets and Liabilities | | Gross Amounts Offset in the Statement of Financial Position | | Net Amounts of Assets presented in the Statement of Financial Position | | Financial Instruments | | Cash Collateral Received | | Net Amount |
| Offsetting of derivative assets | | | | | | | | | | | |
| Derivatives | $ | 9,838 | �� | | $ | — | | | $ | 9,838 | | | $ | 97 | | | $ | — | | | $ | 9,741 | |
| Offsetting of derivative liabilities | | | | | | | | | | | |
| Derivatives | $ | 9,907 | | | $ | — | | | $ | 9,907 | | | $ | 97 | | | $ | — | | | $ | 9,810 | |
The net presentation above can be reconciled to the tabular disclosure of fair value.
The Company has agreements with some of its derivative counterparties that contain a provision where if the Company fails to maintain its status as a well capitalized institution, then the Company could be considered in default. As of June 30, 2020, the Company had minimum collateral posting thresholds with certain of its derivative counterparties and had posted collateral of $31 million. If the Company had breached any of the underlying provisions at June 30, 2020, it could have been required to settle its obligations under the agreements at their termination value of $30 million.
Note 6: Goodwill and Other Intangible Assets
In accordance with GAAP, the Company performs annual tests to identify impairment of goodwill. The tests are required to be performed annually and more frequently if events or circumstances indicate a potential impairment may exist. The Company comparestable below presents the fair value of the reporting unit with its carrying amount, including goodwill. IfCompany’s derivative financial instruments and their classification on the carrying amountBalance Sheet as of March 31, 2021 and December 31, 2020:
| | | | | | | | | | | | | | | | | | | | | | | | | | | | | | | | | | | |
| Asset Derivatives | | Liability Derivatives |
| Balance Sheet | | March 31, | | December 31, | | Balance Sheet | | March 31, | | December 31, |
| Location | | 2021 | | 2020 | | Location | | 2021 | | 2020 |
| (Dollars in thousands) |
| Derivatives not designated as hedging instruments | | | | | | | | |
| Interest rate products | Other assets | | $ | 15,561 | | | $ | 24,094 | | | Other liabilities | | $ | 15,766 | | | $ | 24,454 | |
The effect of the Company’s derivative financial instruments that are not designated as hedging instruments are reported on the Consolidated Statements of Income as swap fee income, net, which includes swap fees earned upon origination and credit valuation adjustments that represents the risk of a reporting unit exceeds its fair value, an impairment loss is recognized in an amount equal to that excess.counterparty’s default. The Tulsa, Oklahoma market represented the reporting unit and included all goodwill previously recorded.
As a resulteffect of the recent economic conditions resulting fromCompany’s derivative financial instruments gain (loss) are reported on the COVID-19 pandemicConsolidated Statements of Cash Flows within “other assets” and oil market volatility, the Company conducted a June 30, 2020 interim goodwill impairment test. The interim test required a goodwill impairment charge of $7 million, representing full impairment of goodwill. The primary causes of the goodwill impairment were economic conditions, volatility in the market capitalization of the Company, increased loan provision in light of the COVID-19 pandemic, and other changes in key variables driven by the uncertain macro-environment that when combined, resulted in the fair value of the reporting unit being less than the carrying value.
The fair value of the reporting unit was determined using a combination of: (i) the capitalization of earnings method, an income approach, and (ii) the public company method, a market approach. The income approach estimated fair value by determining the cash flow in a single period, adjusted for growth that is adjusted by a capitalization rate. The market approach estimated fair value by averaging the price-to-book multiples from peer, public banks and adding a control premium.
The Company conducted an interim impairment test of its core deposit intangible (“CDI”) as of June 30, 2020. The Company used an income approach to calculate a CDI fair market value. The results indicated the CDI was not impaired as of June 30, 2020.
Fair value determinations require considerable judgment and are sensitive to changes in underlying assumptions, estimates, and market factors. Estimating the fair value of individual reporting units requires management to make assumptions and estimates regarding the Company’s future plans, as well as industry, economic, and regulatory conditions. These assumptions and estimates include estimated future cash flows, income tax rates, discount rates, growth rates, and other market factors.
The following table summarizes the change in the Company’s goodwill and CDI for the six-months ended June 30, 2020:
| | | | | | | | | | | | | | | | | | |
| Goodwill | | Core Deposit Intangible | | Total Intangible Assets | |
| (Dollars in thousands) | | | | | |
| Balance at December 31, 2019 | $ | 7,397 | | | $ | 297 | | | $ | 7,694 | | |
| Impairment | (7,397) | | | — | | | (7,397) | | |
| Amortization | — | | | (50) | | | (50) | | |
| Balance at June 30, 2020 | $ | — | | | $ | 247 | | | $ | 247 | | |
Note 7:6:Time Deposits and Borrowings
The scheduled maturities, excluding interest, of the Company’s borrowings at June 30, 2020March 31, 2021 were as follows:
| | | June 30, 2020 | | | March 31, 2021 | |
| | Within One Year | | One to Two Years | | Two to Three Years | | Three to Four Years | | Four to Five Years | | After Five Years | | Total | | | Within One Year | | One to Two Years | | Two to Three Years | | Three to Four Years | | Four to Five Years | | After Five Years | | Total | |
| | (Dollars in thousands) | | | (Dollars in thousands) | |
| Time deposits | Time deposits | $ | 932,443 | | | $ | 97,992 | | | $ | 93,074 | | | $ | 36,085 | | | $ | 781 | | | $ | 166 | | | $ | 1,160,541 | | | Time deposits | $ | 763,848 | | | $ | 115,321 | | | $ | 42,981 | | | $ | 8,193 | | | $ | 1,411 | | | $ | 37 | | | $ | 931,791 | | |
| Fed funds purchased & repurchase agreements | Fed funds purchased & repurchase agreements | 49,881 | | | — | | | — | | | — | | | — | | | — | | | 49,881 | | | Fed funds purchased & repurchase agreements | 3,294 | | | — | | | — | | | — | | | — | | | — | | | 3,294 | | |
| FHLB borrowings | FHLB borrowings | 163,000 | | | 21,500 | | | 46,017 | | | — | | | 5,100 | | | 215,000 | | | 450,617 | | | FHLB borrowings | 16,500 | | | 11,500 | | | 35,000 | | | 0 | | | 5,100 | | | 215,000 | | | 283,100 | | |
| Trust preferred securities(1) | Trust preferred securities(1) | — | | | — | | | — | | | — | | | — | | | 942 | | | 942 | | | Trust preferred securities(1) | 0 | | | 0 | | | 0 | | | 0 | | | 0 | | | 974 | | | 974 | | |
| | $ | 1,145,324 | | | $ | 119,492 | | | $ | 139,091 | | | $ | 36,085 | | | $ | 5,881 | | | $ | 216,108 | | | $ | 1,661,981 | | | | $ | 783,642 | | | $ | 126,821 | | | $ | 77,981 | | | $ | 8,193 | | | $ | 6,511 | | | $ | 216,011 | | | $ | 1,219,159 | | |
(1) The contract value of the trust preferred securities is $2.6 million and is currently being accreted to the maturity date of 2035.
Note 8:7:Change in Accumulated Other Comprehensive Income (“AOCI”)
Amounts reclassified from AOCI and the affected line items in the consolidatedConsolidated Statements of OperationsIncome during the three and six months ended June 30,March 31, 2021 and 2020, and 2019, were as follows:
| | | | Three Months Ended | | | Six Months Ended | | | | Three Months Ended | | |
| | June 30, | | | June 30, | | | Affected Line Item in the | | March 31, | | | Affected Line Item in the |
| | 2020 | | 2019 | | 2020 | | 2019 | | Statements of Operations | | 2021 | | 2020 | | | Statements of Income |
| | (Dollars in thousands) | | | | | (Dollars in thousands) | | |
| Unrealized gains on available-for-sale securities | Unrealized gains on available-for-sale securities | $ | 320 | | | $ | 406 | | | $ | 713 | | | $ | 433 | | | Gain on sale of available-for-sale securities | Unrealized gains on available-for-sale securities | $ | 10 | | | $ | 393 | | | | Gain on sale of available-for-sale debt securities |
| Amount reclassified before tax | 320 | | | 406 | | | 713 | | | 433 | | | |
| | Less: tax effect | Less: tax effect | 78 | | | 100 | | | 174 | | | 107 | | | Income tax expense | Less: tax effect | 2 | | | 96 | | | | Income tax expense |
| Net reclassified amount | Net reclassified amount | $ | 242 | | | $ | 306 | | | $ | 539 | | | $ | 326 | | | Net reclassified amount | $ | 8 | | | $ | 297 | | | |
Note 9:8:Regulatory Matters
The Company and the Bank are subject to various regulatory capital requirements administered by the federal banking agencies. Failure to meet minimum capital requirements can initiate certain mandatory and possibly additional discretionary actions by regulators that, if undertaken, could have a direct material effect on the Company’s consolidated financial statements. Management believes that, as of June 30, 2020,March 31, 2021, the Company and the Bank met all capital adequacy requirements to which they are subject.
The capital rules require usthe Company to maintain a 2.5% capital conservation buffer with respect to Common Equity Tier I capital, Tier I capital to risk-weighted assets, and total capital to risk-weighted assets, which is included in the column “Minimum Capital Required - Basel III Fully Phased-In”III” within the table below. A financial institution with a conservation buffer of less than the required amount is subject to limitations on capital distributions, including dividend payments and stock repurchases, as well as certain discretionary bonus payments to executive officers.
| | | | | | | | |
| Notes to Consolidated Financial Statements (unaudited) | |
subject to limitations on capital distributions, including dividend payments and stock repurchases, as well as certain discretionary bonus payments to executive officers.
The Company’s and the Bank’s actual capital amounts and ratios as of June 30, 2020March 31, 2021 and December 31, 20192020 are presented in the following table:
| | | Actual | | | | Minimum Capital Required - Basel III Fully Phased-In | | | Required to be Considered Well Capitalized | | | Actual | | | Minimum Capital Required - Basel III | | Required to be Considered Well Capitalized |
| | Amount | | Ratio | | | Amount | | Ratio | | Amount | | Ratio | | Amount | | Ratio | | | Amount | | Ratio | | Amount | | Ratio |
| | (Dollars in thousands) | | | (Dollars in thousands) |
| June 30, 2020 | | | | |
| March 31, 2021 | | March 31, 2021 | | | |
| Total Capital to Risk-Weighted Assets | Total Capital to Risk-Weighted Assets | | | | | Total Capital to Risk-Weighted Assets | | | |
| Consolidated | Consolidated | $ | 642,345 | | | 13.3 | % | | | $ | 508,386 | | | 10.5 | % | | N/A | | N/A | Consolidated | $ | 668,393 | | | 13.3 | % | | | $ | 528,882 | | | 10.5 | % | | N/A | | N/A |
| Bank | Bank | 591,096 | | | 12.2 | | | | 508,256 | | | 10.5 | | | $ | 484,053 | | | 10.0 | % | Bank | 624,240 | | | 12.4 | | | | 528,704 | | | 10.5 | | | $ | 503,528 | | | 10.0 | % |
| Tier I Capital to Risk-Weighted Assets | Tier I Capital to Risk-Weighted Assets | | | | | Tier I Capital to Risk-Weighted Assets | | | |
| Consolidated | Consolidated | 581,634 | | | 12.0 | | | | 411,551 | | | 8.5 | | | N/A | | N/A | Consolidated | 605,281 | | | 12.0 | | | | 428,143 | | | 8.5 | | | N/A | | N/A |
| Bank | Bank | 530,458 | | | 11.0 | | | | 411,445 | | | 8.5 | | | 387,242 | | | 8.0 | | Bank | 561,155 | | | 11.1 | | | | 427,999 | | | 8.5 | | | 402,822 | | | 8.0 | |
| Common Equity Tier 1 to Risk-Weighted Assets | Common Equity Tier 1 to Risk-Weighted Assets | | | | | Common Equity Tier 1 to Risk-Weighted Assets | | | |
| Consolidated | Consolidated | 580,692 | | | 12.0 | | | | 338,924 | | | 7.0 | | | N/A | | N/A | Consolidated | 604,307 | | | 12.0 | | | | 352,588 | | | 7.0 | | | N/A | | N/A |
| Bank | Bank | 530,458 | | | 11.0 | | | | 338,837 | | | 7.0 | | | 314,634 | | | 6.5 | | Bank | 561,155 | | | 11.1 | | | | 352,470 | | | 7.0 | | | 327,293 | | | 6.5 | |
| Tier I Capital to Average Assets | Tier I Capital to Average Assets | | | | | Tier I Capital to Average Assets | | | |
| Consolidated | Consolidated | 581,634 | | | 10.7 | | | | 216,445 | | | 4.0 | | | N/A | | N/A | Consolidated | 605,281 | | | 10.5 | | | | 230,468 | | | 4.0 | | | N/A | | N/A |
| Bank | Bank | $ | 530,458 | | | 9.8 | % | | | $ | 216,457 | | | 4.0 | % | | $ | 270,571 | | | 5.0 | % | Bank | $ | 561,155 | | | 9.7 | % | | | $ | 230,354 | | | 4.0 | % | | $ | 287,942 | | | 5.0 | % |
| December 31, 2019 | | | | |
| December 31, 2020 | | December 31, 2020 | | | |
| Total Capital to Risk-Weighted Assets | Total Capital to Risk-Weighted Assets | | | | | Total Capital to Risk-Weighted Assets | | | |
| Consolidated | Consolidated | $ | 633,228 | | | 13.4 | % | | | $ | 495,095 | | | 10.5 | % | | N/A | | N/A | Consolidated | $ | 656,806 | | | 13.1 | % | | | $ | 527,486 | | | 10.5 | % | | N/A | | N/A |
| Bank | Bank | 581,600 | | | 12.3 | | | | 494,954 | | | 10.5 | | | $ | 471,385 | | | 10.0 | % | Bank | 611,533 | | | 12.2 | | | | 527,217 | | | 10.5 | | | $ | 502,111 | | | 10.0 | % |
| Tier I Capital to Risk-Weighted Assets | Tier I Capital to Risk-Weighted Assets | | | | | Tier I Capital to Risk-Weighted Assets | | | |
| Consolidated | Consolidated | 576,332 | | | 12.2 | | | | 400,791 | | | 8.5 | | | N/A | | N/A | Consolidated | 593,865 | | | 11.8 | | | | 427,012 | | | 8.5 | | | N/A | | N/A |
| Bank | Bank | 524,704 | | | 11.1 | | | | 400,677 | | | 8.5 | | | 377,108 | | | 8.0 | | Bank | 548,615 | | | 10.9 | | | | 426,794 | | | 8.5 | | | 401,689 | | | 8.0 | |
| Common Equity Tier 1 to Risk-Weighted Assets | Common Equity Tier 1 to Risk-Weighted Assets | | | | | Common Equity Tier 1 to Risk-Weighted Assets | | | |
| Consolidated | Consolidated | 575,411 | | | 12.2 | | | | 330,063 | | | 7.0 | | | N/A | | N/A | Consolidated | 592,902 | | | 11.8 | | | | 351,657 | | | 7.0 | | | N/A | | N/A |
| Bank | Bank | 524,704 | | | 11.1 | | | | 329,970 | | | 7.0 | | | 306,400 | | | 6.5 | | Bank | 548,615 | | | 10.9 | | | | 351,478 | | | 7.0 | | | 326,372 | | | 6.5 | |
| Tier I Capital to Average Assets | Tier I Capital to Average Assets | | | | | Tier I Capital to Average Assets | | | |
| Consolidated | Consolidated | 576,332 | | | 12.1 | | | | 191,099 | | | 4.0 | | | N/A | | N/A | Consolidated | 593,865 | | | 10.8 | | | | 219,550 | | | 4.0 | | | N/A | | N/A |
| Bank | Bank | $ | 524,704 | | | 11.0 | % | | | $ | 191,170 | | | 4.0 | % | | $ | 238,963 | | | 5.0 | % | Bank | $ | 548,615 | | | 10.0 | % | | | $ | 219,441 | | | 4.0 | % | | $ | 274,302 | | | 5.0 | % |
Note 10:9:Stock-Based Compensation
The Company issues stock-based compensation in the form of nonvested restricted stock and stock appreciation rights under the 2018 Omnibus Equity Incentive Plan (“Omnibus Plan”). The Omnibus Plan will expire on the tenth anniversary of its effective date. In addition, the Company has an Employee Stock Purchase Plan that was suspended effective April 1, 2019 and was subsequently reinstated during the third quarter of 2020. The aggregate number of shares authorized for future issuance under the Omnibus Plan is 1,956,6341,831,858 shares as of June 30, 2020.March 31, 2021.
The table below summarizes the stock-based compensation for the three months ended March 31, 2021 and 2020:
| | | | | | | | |
| Notes to Consolidated Financial Statements (unaudited) | |
The table below summarizes the stock-based compensation for the three and six months ended June 30, 2020 and 2019: | | | | | | | | | | | | | | | |
| Three Months Ended | | |
| March 31, | | |
| 2021 | | 2020 | | | | |
| (Dollars in thousands) |
| Stock appreciation rights | $ | 236 | | | $ | 256 | | | | | |
| Performance-based stock awards | (266) | | | 74 | | | | | |
| Restricted stock units and awards | 665 | | | 604 | | | | | |
| Employee stock purchase plan | 14 | | | 0 | | | | | |
| Total stock-based compensation | $ | 649 | | | $ | 934 | | | | | |
| | | | | | | | | | | | | | | | | | | | | | | |
| Three Months Ended | | | | Six Months Ended | | |
| June 30, | | | | June 30, | | |
| 2020 | | 2019 | | 2020 | | 2019 |
| (Dollars in thousands) | | | | | | |
| Stock appreciation rights | $ | 238 | | | $ | 271 | | | $ | 494 | | | $ | 530 | |
| Performance based stock awards | 22 | | | 155 | | | 96 | | | 250 | |
| Restricted stock units and awards | 822 | | | 721 | | | 1,426 | | | 1,465 | |
| Employee stock purchase plan | — | | | (1) | | | — | | | 36 | |
| Total stock-based compensation | $ | 1,082 | | | $ | 1,146 | | | $ | 2,016 | | | $ | 2,281 | |
Performance BasedPerformance-Based Stock Awards (“PBSAs”)
The Company awards PBSAs to key officers of the Company. The stock settled awards are typically granted annually as determined by the Compensation Committee. The performance basedperformance-based shares typically cliff-vest at the end of three years based on attainment of certain performance metrics developed by the Compensation Committee. The ultimate number of shares issuable under each performance award is the product of the award target and the award payout percentage given the level of achievement. The award payout percentages by level of achievement range between 0% of target and 150% of target.
During the sixthree months ended June 30, 2020,March 31, 2021, the Company granted 41,28363,631 PBSAs. The performance metrics include three year cumulative, net incomeadjusted earnings per share and return on average assets.relative total shareholder return.
The following table summarizes the status of and changes in the performance-based awards:
| | | Performance Based Stock Awards | | | Performance Based Stock Awards |
| | Number of Shares | | Weighted-Average Grant Date Fair Value | | Number of Shares | | Weighted-Average Grant Date Fair Value |
| Unvested, January 1, 2020 | | 192,248 | | $9.88 | |
| Unvested, January 1, 2021 | | Unvested, January 1, 2021 | | 231,631 | | $10.51 |
| Granted | Granted | | 41,283 | | 13.55 | Granted | | 63,631 | | 12.89 |
| Vested | Vested | | 0 | | 0.00 | Vested | | 0 | | 0.00 |
| Forfeited | Forfeited | | 0 | | 0.00 | Forfeited | | 0 | | 0.00 |
| Unvested, June 30, 2020 | | 233,531 | | $10.53 | |
| Unvested, March 31, 2021 | | Unvested, March 31, 2021 | | 295,262 | | $11.02 |
Unrecognized stock-based compensation related to the performance awards issued through June 30, 2020March 31, 2021 was $622$968 thousand and is expected to be recognized over 2.32.7 years.
Restricted Stock Units (“RSUs”) and Restricted Stock Awards (“RSAs”)
The Company issues RSUs and RSAs to provide additional incentives to key officers, employees, and nonemployee directors. Awards are typically granted annually as determined by the Compensation Committee. The service basedservice-based RSUs typically cliff-vest at the end of three years for awards issued prior to 2019 and vest in equal amounts over three years for all other RSUs.years. The service basedservice-based RSAs typically cliff-vest after one year.
The following table summarizes the status of and changes in the RSUs and RSAs:
| | | Restricted Stock Units and Awards | | | Restricted Stock Units and Awards |
| | Number of Shares | | Weighted-Average Grant Date Fair Value | | Number of Shares | | Weighted-Average Grant Date Fair Value |
| Unvested, January 1, 2020 | | 340,780 | | $15.35 | |
| Unvested, January 1, 2021 | | Unvested, January 1, 2021 | | 369,217 | | $12.61 |
| Granted | Granted | | 293,297 | | 11.84 | Granted | | 194,211 | | 12.87 |
| Vested | Vested | | (106,146) | | 12.58 | Vested | | (109,770) | | 14.28 |
| Forfeited | Forfeited | | (5,952) | | 14.25 | Forfeited | | 0 | | 0.00 |
| Unvested, June 30, 2020 | | 521,979 | | $13.41 | |
| Unvested, March 31, 2021 | | Unvested, March 31, 2021 | | 453,658 | | $12.32 |
Unrecognized stock-based compensation related to the RSUs and RSAs issued through June 30, 2020March 31, 2021 was $5$4 million and is expected to be recognized over 1.82.3 years.
| | | | | | | | |
| Notes to Consolidated Financial Statements (unaudited) | |
Note 11:10:Income Tax
An income tax expense (benefit) reconciliation at the statutory rate to the Company’s actual income tax expense (benefit) is shown below:
| | | Three Months Ended | | | Six Months Ended | | | Three Months Ended | |
| | June 30, | | | June 30, | | | March 31, | |
| | 2020 | | 2019 | | 2020 | | 2019 | | 2021 | | 2020 | |
| | (Dollars in thousands) | | | (Dollars in thousands) |
| Computed at the statutory rate (21%) | Computed at the statutory rate (21%) | $ | (1,727) | | | $ | 2,465 | | | $ | (855) | | | $ | 4,516 | | Computed at the statutory rate (21%) | $ | 3,138 | | | $ | 872 | | |
| Increase (decrease) resulting from | Increase (decrease) resulting from | | Increase (decrease) resulting from | | |
| Tax-exempt income | Tax-exempt income | (779) | | | (712) | | | (1,569) | | | (1,425) | | Tax-exempt income | (790) | | | (790) | | |
| Nondeductible expenses | Nondeductible expenses | 34 | | | 64 | | | 98 | | | 137 | | Nondeductible expenses | 50 | | | 64 | | |
| State tax credit | — | | | — | | | — | | | (1,361) | | |
| | State income taxes | State income taxes | 39 | | | 519 | | | 181 | | | 960 | | State income taxes | 496 | | | 142 | | |
| Equity based compensation | Equity based compensation | 13 | | | (6) | | | 39 | | | (61) | | Equity based compensation | 14 | | | 26 | | |
| Goodwill impairment | 1,553 | | | — | | | 1,553 | | | — | | |
| | Other adjustments | Other adjustments | 4 | | | (33) | | | (17) | | | (50) | | Other adjustments | 0 | | | (21) | | |
| Actual tax expense (benefit) | $ | (863) | | | $ | 2,297 | | | $ | (570) | | | $ | 2,716 | | |
| Actual tax expense | | Actual tax expense | $ | 2,908 | | | $ | 293 | | |
|
The tax effects of temporary differences related to deferred taxes shown on the consolidatedConsolidated Balance Sheets are presented below:
| | | | | | | | | | | |
| | | |
| June 30, 2020 | | December 31, 2019 |
| (Dollars in thousands) | | |
| Deferred tax assets | | | |
| | | |
| Allowance for loan losses | $ | 17,426 | | | $ | 13,928 | |
| Lease incentive | 279 | | | 294 | |
| Impairment of available-for-sale securities | — | | | 493 | |
| Valuation allowance on real estate | 273 | | | — | |
| Loan fees | 3,921 | | | 2,317 | |
| Net operating loss carryover | 353 | | | 339 | |
| Accrued expenses | 1,016 | | | 2,131 | |
| Deferred compensation | 2,213 | | | 2,444 | |
| | | |
| State tax credit | 2,842 | | | 3,287 | |
| Other | 431 | | | 81 | |
| Total deferred tax asset | 28,754 | | | 25,314 | |
| Deferred tax liability | | | |
| Fair market value adjustments - trust preferred securities | (344) | | | (348) | |
| Net unrealized gain on securities available-for-sale | (8,134) | | | (5,339) | |
| FHLB stock basis | (1,133) | | | (996) | |
| Premises and equipment | (3,303) | | | (3,620) | |
| Other | (999) | | | (1,229) | |
| Total deferred tax liability | (13,913) | | | (11,532) | |
| Net deferred tax asset | $ | 14,841 | | | $ | 13,782 | |
| | | |
| | | |
CARES Act
The CARES Act, which was enacted on March 27, 2020 in the U.S., includes many measures to assist companies, including temporary changes to income and non-income-based tax laws. Some of the key tax-related provisions of the bill include:
•Allowing NOLs originating in 2018, 2019 or 2020 to be carried back five years; and
| | | | | | | | |
| Notes to Consolidated Financial Statements (unaudited) | |
•Increasing the net interest expense deduction limit to 50% of adjusted taxable income from 30% for tax years beginning January 1, 2019 and 2020.
•The Company would be able to carry back a portion of a net operating loss if incurred during 2020 to offset income from the prior year.
•The Company continues to analyze the potential impact of this legislation on its financial position and results of operations. | | | | | | | | | | | |
| | | |
| March 31, 2021 | | December 31, 2020 |
| (Dollars in thousands) |
| Deferred tax assets | | | |
| | | |
| Allowance for loan losses | $ | 17,944 | | | $ | 18,124 | |
| Lease incentive | 550 | | | 564 | |
| | | |
| | | |
| Loan fees | 3,453 | | | 3,178 | |
| | | |
| Accrued expenses | 874 | | | 2,128 | |
| Deferred compensation | 2,197 | | | 2,474 | |
| | | |
| State tax credit | 2,447 | | | 2,621 | |
| Other | 452 | | | 946 | |
| Total deferred tax asset | 27,917 | | | 30,035 | |
| Deferred tax liability | | | |
| | | |
| Net unrealized gain on securities available-for-sale | (7,308) | | | (9,531) | |
| FHLB stock basis | (1,248) | | | (1,209) | |
| Premises and equipment | (2,703) | | | (2,881) | |
| Other | (1,446) | | | (1,601) | |
| Total deferred tax liability | (12,705) | | | (15,222) | |
| Net deferred tax asset | $ | 15,212 | | | $ | 14,813 | |
| | | |
| | | |
Note 12:11:Disclosures about Fair Value of Financial Instruments
Fair value is the price that would be received to sell an asset or paid to transfer a liability in an orderly transaction between market participants at the measurement date. Fair value measurements must maximize the use of observable inputs and minimize the use of unobservable inputs. There is a hierarchy of three levels of inputs that may be used to measure fair value:
Level 1 Quoted prices in active markets for identical assets or liabilities.
Level 2 Observable inputs other than Level 1 prices, such as quoted prices for similar assets or liabilities; quoted prices in markets that are not active; or other inputs that are observable or can be corroborated by observable market data for substantially the full term of the assets or liabilities.
Level 3 Unobservable inputs supported by little or no market activity and significant to the fair value of the assets or liabilities.
| | | | | | | | |
| Notes to Consolidated Financial Statements (unaudited) | |
Recurring Measurements
The following list presents the assets and liabilities recognized in the accompanying consolidatedConsolidated Balance Sheets measured at fair value on a recurring basis and the level within the fair value hierarchy in which the fair value measurements fall at June 30, 2020March 31, 2021 and December 31, 2019:2020:
| | | | | | | | | | | | | | | | | |
| Fair Value Description | | Valuation Hierarchy Level | | Where Fair Value Balance Can Be Found |
| Available-for-Sale Securities | Where quoted market prices are available in an active market, securities are classified within Level 1 of the valuation hierarchy. If quoted market prices are not available, then fair values are estimated by using quoted prices of securities with similar characteristics or independent asset pricing services and pricing models, the inputs of which are market-based or independently sourced market parameters, including, but not limited to, yield curves, interest rates, volatilities, prepayments, defaults, cumulative loss projections and cash flows. | | Level 2 | | |
| Derivatives | Fair value of the interest rate swaps is obtained from independent pricing services based on quoted market prices for similar derivative contracts. | | Level 2 | | |
Nonrecurring Measurements
The following tables present assets measured at fair value on a nonrecurring basis and the level within the fair value hierarchy in which the fair value measurements fall at June 30, 2020March 31, 2021 and December 31, 2019:2020:
| | | | | | | | | | | | | | | | | | | | | | | |
| | | June 30, 2020 | | | | |
| | | Fair Value Measurements Using | | | | |
| Fair Value | | Quoted Prices in Active Markets for Identical Assets
(Level 1) | | Significant Other Observable Inputs
(Level 2) | |
Unobservable Inputs
(Level 3) |
| (Dollars in thousands) | | | | | | |
| Collateral-dependent impaired loans | $ | 32,024 | | | $ | — | | | $ | — | | | $ | 32,024 | |
| | | | | | | |
| | | | | | | |
| Foreclosed assets held-for-sale | $ | 2,502 | | | $ | — | | | $ | — | | | $ | 2,502 | |
| | | | | | | | | | | | | | | | | | | | | | | |
| | | March 31, 2021 |
| | | Fair Value Measurements Using |
| Fair Value | | Quoted Prices in Active Markets for Identical Assets
(Level 1) | | Significant Other Observable Inputs
(Level 2) | |
Unobservable Inputs
(Level 3) |
| (Dollars in thousands) |
| Collateral-dependent impaired loans | $ | 46,940 | | | $ | 0 | | | $ | 0 | | | $ | 46,940 | |
| | | | | | | |
| | | | | | | |
| | | | | | | |
| | | | | | | | |
| Notes to Consolidated Financial Statements (unaudited) | |
| | | | | | | | | | | | | | | | | | | | | | | |
| | | December 31, 2019 | | | | |
| | | Fair Value Measurements Using | | | | |
| Fair Value | | Quoted Prices in Active Markets for Identical Assets
(Level 1) | | Significant Other Observable Inputs
(Level 2) | |
Unobservable Inputs
(Level 3) |
| (Dollars in thousands) | | | | | | |
| Collateral-dependent impaired loans | $ | 20,889 | | | $ | — | | | $ | — | | | $ | 20,889 | |
| | | | | | | |
| | | | | | | |
| | | | | | | | | | | | | | | | | | | | | | | |
| | | December 31, 2020 |
| | | Fair Value Measurements Using |
| Fair Value | | Quoted Prices in Active Markets for Identical Assets
(Level 1) | | Significant Other Observable Inputs
(Level 2) | |
Unobservable Inputs
(Level 3) |
| (Dollars in thousands) |
| Collateral-dependent impaired loans | $ | 55,454 | | | $ | 0 | | | $ | 0 | | | $ | 55,454 | |
| | | | | | | |
| Foreclosed assets held-for-sale | $ | 2,347 | | | $ | 0 | | | $ | 0 | | | $ | 2,347 | |
Following is a description of the valuation methodologies and inputs used for assets measured at fair value on a nonrecurring basis and recognized in the accompanying consolidatedConsolidated Balance Sheets.
Collateral-dependent Impaired Loans, Net of ALLL
The estimated fair value of collateral-dependent impaired loans is based on the appraised fair value of the collateral, less estimated cost to sell. Collateral-dependent impaired loans are classified within Level 3 of the fair value hierarchy.
The Company considers the appraisal or evaluation as the starting point for determining fair value and then considers other factors and events in the environment that may affect the fair value. Appraisals of the collateral underlying collateral-dependent loans are obtained when the loan is determined to be collateral-dependent and subsequently as deemed necessary by the Office of the Chief Credit Officer.
| | | | | | | | |
| Notes to Consolidated Financial Statements (unaudited) | |
Appraisals are reviewed for accuracy and consistency by the Office of the Chief Credit Officer. Appraisers are selected from the list of approved appraisers maintained by management. The appraised values are reduced by discounts to consider lack of marketability and estimated cost to sell if repayment or satisfaction of the loan is dependent on the sale of the collateral. These discounts and estimates are developed by the Office of the Chief Credit Officer by comparison to historical results.
Foreclosed Assets Held-for-Sale
The estimated fair value of foreclosed assets held-for-saleassets-held-for-sale is based on the appraised fair value of the collateral, less estimated cost to sell and are classified within Level 3 of the fair value hierarchy. The Company considers the appraisal or evaluation as the starting point for determining fair value and then considers other factors and events in the environment that may affect the fair value.sell.
Unobservable (Level 3) Inputs
The following tables present quantitative information about unobservable inputs used in nonrecurring Level 3 fair value measurements at June 30, 2020March 31, 2021 and December 31, 2019:2020:
| | | | | | | | | | | | | | | | | | | | | | | |
| June 30, 2020 | | | | | | |
| Fair Value | | Valuation Techniques | | Unobservable Inputs | | Range
(Weighted Average) |
| (Dollars in thousands) | | | | | | |
| Collateral-dependent impaired loans | $ | 32,024 | | | Market comparable properties | | Marketability discount | | 10% - 15% (12%) |
| Foreclosed assets held-for-sale | $ | 2,502 | | | Market comparable properties | | Marketability discount | | 10% |
| | | | | | | | | | | | | | | | | | | | | | | |
| March 31, 2021 |
| Fair Value | | Valuation Techniques | | Unobservable Inputs | | Range
(Weighted Average) |
| (Dollars in thousands) |
| Collateral-dependent impaired loans | $ | 46,940 | | | Market comparable properties | | Marketability discount | | 10% - 98% (27%) |
| | | | | | | |
| | | | | | | | | | | | | | | | | | | | | | | |
| December 31, 20192020 | | | | | | |
| Fair Value | | Valuation Techniques | | Unobservable Inputs | | Range
(Weighted Average) |
| (Dollars in thousands) | | | | | | |
| Collateral-dependent impaired loans | $ | 20,88955,454 | | | Market comparable properties | | Marketability discount | | 10%1% - 15%98%
(12%(24%)
|
| | | | | | | |
| Foreclosed assets held-for-sale | $ | 2,347 | | | Market comparable properties | | Marketability discount | | 7% - 10% (9%) |
| | | | | | | | |
| Notes to Consolidated Financial Statements (unaudited) | |
The following tables present the estimated fair values of the Company’s financial instruments at June 30, 2020March 31, 2021 and December 31, 2019:2020:
| | | | | | | | | | | | | | | | | | | | | | | | | | | | | |
| June 30, 2020 | | | | | | | | |
| Carrying | | Fair Value Measurements | | | | | | |
| Amount | | Level 1 | | Level 2 | | Level 3 | | Total |
| (Dollars in thousands) | | | | | | | | |
| Financial Assets | | | | | | | | | |
| Cash and cash equivalents | $ | 194,371 | | | $ | 194,371 | | | $ | — | | | $ | — | | | $ | 194,371 | |
| Available-for-sale securities | 700,083 | | | — | | | 700,083 | | | — | | | 700,083 | |
| Loans, net of allowance for loan losses | 4,342,039 | | | — | | | — | | | 4,334,224 | | | 4,334,224 | |
| Restricted equity securities | 20,675 | | | — | | | — | | | 20,675 | | | 20,675 | |
| Interest receivable | 19,399 | | | — | | | 19,399 | | | — | | | 19,399 | |
| Derivative assets | 29,302 | | | — | | | 29,302 | | | — | | | 29,302 | |
| $ | 5,305,869 | | | $ | 194,371 | | | $ | 748,784 | | | $ | 4,354,899 | | | $ | 5,298,054 | |
| Financial Liabilities | | | | | | | | | |
| Deposits | $ | 4,304,143 | | | $ | 750,333 | | | $ | — | | | $ | 3,599,237 | | | $ | 4,349,570 | |
| Federal funds purchased and repurchase agreements | 49,881 | | | — | | | 49,881 | | | — | | | 49,881 | |
| Federal Home Loan Bank advances | 450,617 | | | — | | | 468,650 | | | — | | | 468,650 | |
| Other borrowings | 942 | | | — | | | 1,722 | | | — | | | 1,722 | |
| Interest payable | 2,843 | | | — | | | 2,843 | | | — | | | 2,843 | |
| Derivative liabilities | 29,432 | | | — | | | 29,432 | | | — | | | 29,432 | |
| $ | 4,837,858 | | | $ | 750,333 | | | $ | 552,528 | | | $ | 3,599,237 | | | $ | 4,902,098 | |
| | | December 31, 2019 | | | March 31, 2021 |
| | Carrying | | Fair Value Measurements | | | Carrying | | Fair Value Measurements |
| | Amount | | Level 1 | | Level 2 | | Level 3 | | Total | | Amount | | Level 1 | | Level 2 | | Level 3 | | Total |
| | (Dollars in thousands) | | | (Dollars in thousands) |
| Financial Assets | Financial Assets | | Financial Assets | |
| Cash and cash equivalents | Cash and cash equivalents | $ | 187,320 | | | $ | 187,320 | | | $ | — | | | $ | — | | | $ | 187,320 | | Cash and cash equivalents | $ | 630,787 | | | $ | 630,787 | | | $ | 0 | | | $ | 0 | | | $ | 630,787 | |
| Available-for-sale securities | Available-for-sale securities | 741,634 | | | — | | | 741,634 | | | — | | | 741,634 | | Available-for-sale securities | 685,454 | | | 0 | | | 685,454 | | | 0 | | | 685,454 | |
| Loans, net of allowance for loan losses | Loans, net of allowance for loan losses | 3,795,348 | | | — | | | — | | | 3,810,818 | | | 3,810,818 | | Loans, net of allowance for loan losses | 4,434,049 | | | 0 | | | 0 | | | 4,419,714 | | | 4,419,714 | |
| Restricted equity securities | Restricted equity securities | 17,278 | | | — | | | — | | | 17,278 | | | 17,278 | | Restricted equity securities | 14,080 | | | 0 | | | 0 | | | 14,080 | | | 14,080 | |
| Interest receivable | Interest receivable | 15,716 | | | — | | | 15,716 | | | — | | | 15,716 | | Interest receivable | 17,987 | | | 0 | | | 17,987 | | | 0 | | | 17,987 | |
| Equity securities | | Equity securities | 13,405 | | | 0 | | | 2,216 | | | 11,189 | | | 13,405 | |
| Derivative assets | Derivative assets | 9,838 | | | — | | | 9,838 | | | — | | | 9,838 | | Derivative assets | 15,561 | | | 0 | | | 15,561 | | | 0 | | | 15,561 | |
| | $ | 4,767,134 | | | $ | 187,320 | | | $ | 767,188 | | | $ | 3,828,096 | | | $ | 4,782,604 | | | $ | 5,811,323 | | | $ | 630,787 | | | $ | 721,218 | | | $ | 4,444,983 | | | $ | 5,796,988 | |
| Financial Liabilities | Financial Liabilities | | | | | | | | | | Financial Liabilities | | | | | | | | | |
| Deposits | Deposits | $ | 3,923,759 | | | $ | 521,826 | | | $ | — | | | $ | 3,407,012 | | | $ | 3,928,838 | | Deposits | $ | 5,051,570 | | | $ | 794,559 | | | $ | 0 | | | $ | 4,289,169 | | | $ | 5,083,728 | |
| Federal funds purchased and repurchase agreements | Federal funds purchased and repurchase agreements | 14,921 | | | — | | | 14,921 | | | — | | | 14,921 | | Federal funds purchased and repurchase agreements | 3,294 | | | 0 | | | 3,294 | | | 0 | | | 3,294 | |
| Federal Home Loan Bank advances | Federal Home Loan Bank advances | 358,743 | | | — | | | 357,859 | | | — | | | 357,859 | | Federal Home Loan Bank advances | 283,100 | | | 0 | | | 292,667 | | | 0 | | | 292,667 | |
| Other borrowings | Other borrowings | 921 | | | — | | | 2,147 | | | — | | | 2,147 | | Other borrowings | 974 | | | 0 | | | 2,235 | | | 0 | | | 2,235 | |
| Interest payable | Interest payable | 4,584 | | | — | | | 4,584 | | | — | | | 4,584 | | Interest payable | 1,911 | | | 0 | | | 1,911 | | | 0 | | | 1,911 | |
| Derivative liabilities | Derivative liabilities | 9,907 | | | — | | | 9,907 | | | — | | | 9,907 | | Derivative liabilities | 15,766 | | | 0 | | | 15,766 | | | 0 | | | 15,766 | |
| | $ | 4,312,835 | | | $ | 521,826 | | | $ | 389,418 | | | $ | 3,407,012 | | | $ | 4,318,256 | | | $ | 5,356,615 | | | $ | 794,559 | | | $ | 315,873 | | | $ | 4,289,169 | | | $ | 5,399,601 | |
| | | | | | | | |
| Notes to Consolidated Financial Statements (unaudited) | |
| | | | | | | | | | | | | | | | | | | | | | | | | | | | | |
| December 31, 2020 |
| Carrying | | Fair Value Measurements |
| Amount | | Level 1 | | Level 2 | | Level 3 | | Total |
| (Dollars in thousands) |
| Financial Assets | | | | | | | | | |
| Cash and cash equivalents | $ | 408,810 | | | $ | 408,810 | | | $ | 0 | | | $ | 0 | | | $ | 408,810 | |
| Available-for-sale securities | 654,588 | | | 0 | | | 654,588 | | | 0 | | | 654,588 | |
| Loans, net of allowance for loan losses | 4,366,602 | | | 0 | | | 0 | | | 4,351,970 | | | 4,351,970 | |
| Restricted equity securities | 15,543 | | | 0 | | | 0 | | | 15,543 | | | 15,543 | |
| Interest receivable | 17,236 | | | 0 | | | 17,236 | | | 0 | | | 17,236 | |
| Equity securities | 13,436 | | | 0 | | | 2,247 | | | 11,189 | | | 13,436 | |
| Derivative assets | 24,094 | | | 0 | | | 24,094 | | | 0 | | | 24,094 | |
| $ | 5,500,309 | | | $ | 408,810 | | | $ | 698,165 | | | $ | 4,378,702 | | | $ | 5,485,677 | |
| Financial Liabilities | | | | | | | | | |
| Deposits | $ | 4,694,740 | | | $ | 718,459 | | | $ | 0 | | | $ | 4,015,792 | | | $ | 4,734,251 | |
| Federal funds purchased and repurchase agreements | 2,306 | | | 0 | | | 2,306 | | | 0 | | | 2,306 | |
| Federal Home Loan Bank advances | 293,100 | | | 0 | | | 309,020 | | | 0 | | | 309,020 | |
| Other borrowings | 963 | | | 0 | | | 2,024 | | | 0 | | | 2,024 | |
| Interest payable | 2,163 | | | 0 | | | 2,163 | | | 0 | | | 2,163 | |
| Derivative liabilities | 24,454 | | | 0 | | | 24,454 | | | 0 | | | 24,454 | |
| $ | 5,017,726 | | | $ | 718,459 | | | $ | 339,967 | | | $ | 4,015,792 | | | $ | 5,074,218 | |
Note 13:12:Commitments and Credit Risk
Commitments
The Company had the following commitments at June 30, 2020March 31, 2021 and December 31, 2019:2020:
| | | June 30, 2020 | | December 31, 2019 | | March 31, 2021 | | December 31, 2020 |
| | (Dollars in thousands) | | | (Dollars in thousands) |
| Commitments to originate loans | Commitments to originate loans | $ | 113,439 | | | $ | 134,652 | | Commitments to originate loans | $ | 112,738 | | | $ | 99,596 | |
| Standby letters of credit | Standby letters of credit | 38,342 | | | 39,035 | | Standby letters of credit | 41,256 | | | 48,607 | |
| Lines of credit | Lines of credit | 1,290,998 | | | 1,351,873 | | Lines of credit | 1,401,710 | | | 1,423,038 | |
| Future lease commitments | 17,205 | | | 20,935 | | |
| | Total | Total | $ | 1,459,984 | | | $ | 1,546,495 | | Total | $ | 1,555,704 | | | $ | 1,571,241 | |
Note 14:13:Legal and Regulatory Proceedings
General Litigation
The Company is subject to claims and lawsuits that arise primarily in the ordinary course of business. It is the opinion of management the disposition or ultimate resolution of such claims and lawsuits will not have a material adverse effect on the consolidated financial position, results of operations and cash flows of the Company.
Note 15:Subsequent Events
Subsequent to June 30, 2020, the Company reinstated its Employee Stock Purchase Plan. The first offering period is between July 1, 2020 and December 31, 2020.
ITEM 2. MANAGEMENT’S DISCUSSION AND ANALYSIS OF FINANCIAL CONDITION AND RESULTS OF OPERATIONS
The following discussion and analysis should be read in conjunction with the consolidated financial statements and related notes and with the statistical information and financial data appearing in this report as well as in the Company’s Annual Report on Form 10-K for the fiscal year ended December 31, 20192020 filed with the Securities and Exchange Commission (“SEC”) on March 10, 2020February 26, 2021 (the “2019“2020 Form 10-K”). Results of operations for the three and six month periodsperiod ended June 30, 2020March 31, 2021 are not necessarily indicative of results to be attained for any other period. Certain statements in this report contain forward-looking statements regarding our future plans, objectives, beliefs, expectations, representations and projections. See "Forward-Looking Information" which is incorporated herein by reference. Actual results could differ materially from the anticipated results and other expectations expressed in our forward-looking statements as a result of a number of factors, including but not limited to those discussed in Item 1A – "Risk Factors" in the 20192020 Form 10-K, as supplemented by Item 1A – "Risk Factors" in this report.10-K.
Unless we state otherwise or the context otherwise requires, references in the below section to “we,” “our,” “us,” “ourselves,” “our company,” and the “Company” refer to CrossFirst Bankshares, Inc., a Kansas corporation, its predecessors and its consolidated subsidiaries. References to “CrossFirst Bank” and the “Bank” refer to CrossFirst Bank, a Kansas chartered bank and our wholly-owned consolidated bank subsidiary.
SecondFirst Quarter 20202021 Highlights
During the secondfirst quarter ended June 30, 2020,March 31, 2021, we accomplished the following:
•Increased total$6 billion of assets, $395an increase of $339 million or 8% during the quarter to $5.5 billion,6% from December 31, 2020 driven by a $418 million or 10% increase in gross loans;
•Increased deposits by $331 million from the previous quarter and $720 million or 20% over the last twelve months.
•Successfully executed our succession plan pursuant to which Michael J. Maddox was named as the Company’s Chief Executive Officer effective June 1, 2020, to succeed George F. Jones, Jr., who was appointed as Vice Chairman.deposit growth;
•Efficiency ratio of 71%50.4% for the secondfirst quarter of 2020 compared to 60% during the second quarter of 2019. The second quarter 2020 efficiency ratio was impacted by a $7 million non-cash goodwill impairment charge;2020;
•Non-GAAP core operating efficiency ratio$68 million of 53% forloan growth from the secondprevious quarter and $512 million or 13% over the last twelve months driven by PPP loan funding;
•$357 millionof 2020 compared to 58% duringdeposit growth from the secondprevious quarter of 2019;and $1 billion or 27% over the last twelve months;
•Book value per share of $11.66$12.17 at June 30, 2020March 31, 2021 compared to $11.58$11.75 at DecemberMarch 31, 20192020;
•Hired Jana Merfen as our chief technology officer. Jana brings 16 years of financial services industry experience with a focus on evaluating investments in and $11.00 at June 30, 2019.benefits from technology. She will oversee customer-facing technology to better serve and respond to customer needs.
Update on the COVID-19 Global Pandemic (“COVID-19”) Impact
On March 11, 2020, the World Health Organization declared a global pandemic related to the COVID-19 pandemic and, on March 13, 2020, the U.S. government declared a national emergency with respect to the outbreak. Governmental authorities, including those in states in which we operate, responded to the outbreak by issuing stay at home orders, enacting travel restrictions, closing businesses and schools, and undertaking additional measures to contain the outbreak, some of which are continuing or may be reinstated. Most industries and individuals have been and are expected to continue to be impacted as a result of the COVID-19 pandemic and measures taken in response thereto. Many Americans have been furloughed or lost their jobs as many businesses closed or experienced a reduction in business activity. The COVID-19 pandemic has caused, and is expected tomay continue to cause, economic uncertainty and a disruption to the financial markets, the duration and extent of which is not currently known.
The U.S. government enacted several new pieces of legislation to assist businesses and individuals negatively impacted by the pandemic. The Families First Coronavirus Response Act was signed into law on March 18, 2020 and provides for, among other things, emergency paid sick leave and family medical leave to employees, expanded unemployment benefits, and tax credits to businesses to offset the costs of providing the leave benefits under the act. The Coronavirus Aid, Relief and Economic Security Act (the "CARES Act") was signed into law on March 27, 2020 and was the largest-ever economic stimulus package in U.S. history. The CARES Act provides for, among other things, expanded unemployment insurance payments, the establishment of the Paycheck Protection Program ("PPP"), the establishment of the Main Street Lending Program and recovery rebates for individual taxpayers.
A discussion of the impact of the COVID-19 pandemic on the Company and its operations and measures undertaken by the Company in response thereto is provided below.
Bank Operations
The Company implemented its business continuity procedures in March 2020 as a result of the COVID-19 pandemic. At June 30, 2020, 90% of ourIn April 2021, substantially all employees performed their duties on a rotation schedule that allowed team membersreturned to on-premise work inand the office as needed while limiting exposure riskCompany is evaluating hybrid working opportunities. In addition, the bank lobbies were re-opened to our employees and customers.the public. No material interruptions to our business occurred. Loan and deposit services continuedoperations have occurred to function as normal using alternative procedures. No significant changes to underlying processes were identified.
We complied with federal, state, and local ordinances enacted as a result of the COVID-19 pandemic. These included: (i) restrictions on gatherings, (ii) physical distancing, (iii) travel restrictions, and (iv) face coverings. We met with customers by appointment and our drive-thru locations operated during normal hours. Our lenders and branch network provided extraordinary service to our customers through use of technology, including mobile, online, and over the phone.date.
Paycheck Protection Program (“PPP”) Lending Facility and Loans
The PPP was established by the Coronavirus Aid, Relief, and Economic Security Act (“CARES ActAct”) in March 2020 and authorized forgivable loans to small businesses to pay their employees and certain other expenses during the COVID-19 pandemic.businesses. The program requires all loan terms to be the same for everyone. The Bank an existing, preferred Small Business Administration (“SBA”) lender, provided approximately $369 million inPPP loans to support current customers and foster relationships with new customers. The Company’s organizational structure and infrastructure absorbed the increased demand in PPP funding.
The loans earn interest at 1% and included, include fees between 1% and 5% depending on the size of the loan. The majority of the PPP loans willand typically mature in two years. The following table summarizes the impact of the PPP loans on our financials:
| | | | | | | | | | | | | | | | | | | | | | | | | |
| As of or For the Period Ended June 30, 2020 | | | | | | | | |
| Outstanding Balance | | Total Origination Fees | | Earned Fees | | Unearned Fees | | |
| (Dollars in thousands) | | | | | | | | |
| PPP Loans | $ | 369,022 | | | $ | 9,930 | | | $ | 2,045 | | | $ | 7,885 | | | |
The loans originated under the PPP received a zero percent0% risk weight under the regulatory capital rules which resulted in increased Common Equity Tier 1, Tier 1, and Tier 2 capital ratios, but the PPP loans are included in the calculation of our Leverage ratio.
Management ReviewThe Consolidated Appropriations Act of 2021 allocated an additional $284 billion in PPP funding. On January 11, 2021, the Small Business Administration (“SBA”) reopened PPP funds for Impairment
As a resultfirst draw borrowers and on January 13, 2021, opened PPP funds for second draw borrowers. The second round of current economic conditions in our markets, the Company reviewed the following areas for potential impairment:
•Goodwill - Goodwill was reviewed for impairment during the second quarter of 2020 and resulted in a $7 million impairment, representing the total value of goodwill previously reported. See Note 6: Goodwill and Core Deposit Intangible within the Unaudited NotesPPP loans have similar terms to the Financial Statements andfirst round of PPP loans mentioned above, but typically mature in five years. The PPP loans were available through May 5, 2021. The SBA will continue to fund outstanding, approved PPP applications.
The following table summarizes the Non-Interest Expense section within Management’s Discussion and Analysis for more information.
•Core Deposit Intangible (“CDI”) - A significant adverse change inimpact of the business climate resulted in a quantitative impairment analysisPPP loans on our CDI as of June 30, 2020. The analysis was performed on the Tulsa branch’s deposits with an origination date before August 2013, the date of acquisition. The Company estimated the present value of future cash flows expected to be received over the estimated remaining life. The Company determined the CDI was not impaired as of June 30, 2020.financials:
•Available-for-Sale Investment Securities - The Company reviewed the securities portfolio for indications of impairment. Management did not identify any impaired securities as of June 30, 2020. | | | | | | | | | | | |
| |
| As of or for the Period Ended March 31, |
| 2021 | | 2020 |
| (Dollars in thousands) |
| PPP Loan Activity | | | |
| Outstanding loan balance, beginning | $ | 292,230 | | | $ | — | |
| Loan originations | 110,962 | | | — | |
| Loan payoffs | (66,837) | | | — | |
| Outstanding loan balance, end | $ | 336,355 | | | $ | — | |
| | | |
| PPP Loan Fee Activity | | | |
| Unearned fee balance, beginning | $ | 4,189 | | | $ | — | |
| Unearned fees added | 4,105 | | | — | |
| Earned fees recognized | (2,415) | | | — | |
| Unearned fee balance, end | $ | 5,879 | | | $ | — | |
Loan Modifications Credit Quality, and Allowance for Loan Losses (“ALLL”)
The CARES Act allowsallowed financial institutions to elect to suspend GAAP principles and regulatory determinations for loan modifications relating to the COVID-19 pandemic that would otherwise be categorizedrequire evaluation as TDRs from March 1,troubled debt restructurings (“TDR”). On December 27, 2020, the Consolidated Appropriations Act of 2021 was signed into law, which extended the period during which the Company may elect not to the earlier of December 31, 2020 or 60 days after the national emergency relatedconsider whether loan modifications relating to the COVID-19 pandemic ends as long as the loan was not more than 30 days past due as of December 31, 2019.
are TDRs through January 2, 2022. The Company elected to apply the above guidance for accountingguidance.
As of March 31, 2021, the Company had approximately $96 million of loans modified and regulatory purposes.not considered TDRs. The Company established a process, headed by the Officeexpects most of the Chief Credit Officer, to evaluate loan modifications related to the COVID-19 pandemic. Thethese modified loans typically received a 3- to 6-month payment deferral, change in rate, or modified principal and interest payments to interest-only payments. Afterrecover from the deferral period, the modified loan terms either require all accrued interest to be paid or capitalized and amortized over the original loan term. The Company may provide an additional deferral period to customers on an as needed basis.
Deferred loan interest continues to accrue until determined that it is more likely than not that we will be unable to collect the accrued interest balance. Informationpandemic, but uncertainty regarding the loan modifications outstanding at June 30, 2020 is provided below:
| | | | | | | | | | | | | | | | | | |
| Loan Modifications by Category Impacted by the COVID-19 Pandemic as of June 30, 2020 | | | | | | |
| Number of Loans | | Value of Loans | | Percent of Gross Loans in Category | |
| (Dollars in thousands) | | | | | |
| Commercial | 183 | | | $ | 275,917 | | | 21 | % | |
| Energy | 9 | | | 30,212 | | | 8 | | |
| Commercial real estate | 112 | | | 356,611 | | | 31 | | |
| Construction and land development | 8 | | | 21,177 | | | 3 | | |
| Residential real estate | 14 | | | 25,526 | | | 5 | | |
| | | | | | |
| Consumer | — | | | — | | | — | | |
| Total | 326 | | | $ | 709,443 | | | 16 | % | |
| | | | | | | | | | | |
| Loan Modifications by Type of Modification Impacted by the COVID-19 Pandemic as of June 30, 2020 | | | |
| Number of Loans | | Value of Loans |
| (Dollars in thousands) | | |
| Payment deferral | 116 | | $ | 290,796 | |
| Interest-only payments | 176 | | 306,210 | |
| Other (multiple modifications, change in rate and/or payment) | 34 | | 112,437 | |
| Total | 326 | | $ | 709,443 | |
The Company’s second quarter 2020 credit quality metrics provided in the selected financial datashort-term and discussed in detail within the ALLL and Nonperforming Assets sections below were primarily driven by the economic environment as a result of the COVID-19 pandemic. The Company is working with borrowers to understand the long-term effects of the COVID-19 pandemic remain that may require the Company to (i) downgrade modified loans which may increase our Allowance for Loan Losses (“ALLL”), (ii) reverse interest income previously recognized but not received, and its impact on future credit quality metrics. At this time, the extent(iii) charge-off modified loans.
Loan Portfolio and duration of the impact of theCredit Quality
The COVID-19 pandemic are unknowncontinues to impact our borrowers and therefore the Company is unable to quantifyCompany’s credit metrics remain elevated. However, the ultimate impact.
DuringCompany’s key credit metrics improved during the first quarter of 2020, the Company did not identify any specific borrowers that were directly impacted by the COVID-19 pandemic. As a result, the Company used qualitative factor adjustments to the ALLL model to account for the unknown impact of the COVID-19 pandemic on the loan portfolio. During the second quarter of 2020, the Company was able to identify certain borrowers impacted by the COVID-19 pandemic. Approximately $731 million of loans, or 17% of the portfolio, were downgraded. In addition, the Company distinguished between performing and nonperforming substandard loans. Refer to Note 1: Nature of Operations and Summary of Significant Accounting Policies and Note 4: Loans and Allowance for Loan Losses within the Notes to the Unaudited Financial Statements and the Allowance for Loan Losses discussion in Management’s Discussion and Analysis for more information.
Additional discussion regarding changes during the second quarter of 2020 to the ALLL is provided in the allowance for loan loss section below. A waterfall graph showing the changes in our ALLL between December 31, 2019 and June 30, 2020 is provided below:
(1) Includes change in impaired loans, loan growth, and other adjustments.
Management allocated the ALLL to our loan portfolio for the periods below as follows:
Portfolio Stress Testing
2021. The Company aggressively stress-tested our credit and capital using Fed-defined and other more stressful COVID-19 pandemic recessionary scenarios. We modeled an immediate absorption to our capital of 13 quarters of losses utilizing historical loss factors provided by the Federal Reserve for banks between $1 billion and $10 billion. The second quarter common equity tier 1 ratio stress test results showedremains cautiously optimistic that the Company is well-capitalized and can comfortably accommodate stressful pandemic scenarios.economic outlook will continue to improve, which could continue to improve the Company’s credit metrics.
Loan Portfolio
As a resultForty four percent of the COVID-19 pandemic, the Company plans to do the following:
•Slow overall loan growth to focus on current customers;
•Implement floors on loans; and
•Monitor unfunded credit lines.
Energy Loans
As of June 30, 2020, energy loans totaled $390 million or 9% of our total loan portfolio. Energyclassified loans were comprised of 64% predominately oil backed loans and 36% predominately natural gas backed loans. Our customer base has significant experience in thewithin our energy sector and the Company has an experienced group of energy lenders and credit officers that are proactively monitoring the portfolio.
During the second quarter of 2020, $239 millionportfolio at March 31, 2021. A portion of energy loans representing 61% of the energy portfolio, had a risk rating downgrade as a result of the impact of low oil and gas prices and COVID-19 pandemic. The impact to the ALLL from the risk rating downgrades were partially offset by a decrease in qualitative factors.
While we believe our reserve against the energy portfolio at June 30, 2020 is adequate, the dramatic decrease in demand for oil and natural gas created by the COVID-19 pandemic and other economic conditions have caused considerable pricing volatility and uncertaintywill receive updated borrowing base redeterminations in the market. Depressednext two quarters. The Company anticipates that higher, stabilized energy prices will improve the borrowers’ first quarter results and related collateral that may strain our customers’ cash flows, lower their liquidity, and decrease property values that could continuelead to create negativesignificant, positive grade migration over the next several quarters. The length of the COVID-19 pandemic disruption and the pace of economic recovery will determine the severity of the grade migration and potential loss impact within the energy loan portfolio.
Real Estate Loans
Our real estate loans are comprised of construction and development loans, 1-4 family loans and commercial real estate loans. There is significant uncertainty regarding the impact of the COVID-19 pandemic on our real estate loan portfolio, but we continue to monitor the following industries:
| | | | | | | | | | | | | | |
| Real Estate Industries with Increased Monitoring as of June 30, 2020 | | | | |
| Industry | | Outstanding Balance | | Percent of Gross Loans |
| | (Dollars in thousands) | | |
| Retail | | $ | 197,755 | | | 4.5 | % |
| Hotel and Lodging | | 167,079 | | | 3.8 | |
| Medical | | 56,536 | | | 1.3 | |
| Senior Living | | $ | 104,126 | | | 2.4 | % |
| | | | |
| | | | |
These industries were identified based on the following changed economic conditions:
•Implementation of travel restrictions;
•Cancellation of events and large gatherings;
•Reduction in demand for senior living housing; and
•Furlough of workers and increase in unemployment numbers.
During the second and third quarter of 2020,2021.
Investment in Technology
In April 2021, the Bank worked with business ownersCompany became a limited partner in these industriesa $150 million venture capital investment fund designed to help accelerate technology adoption at community banks. The Company committed to a total investment of $3 million. The investment fund will help community banks find solutions that make them more competitive and cost-efficient by deferring loan paymentsidentifying and funding of PPP loans.investing in companies that solve problems the community banks face.
Commercial Loans
The Company provides a mix of variable-rate and fixed-rate commercial loans across various industries. We extend commercial loans on an unsecured and secured basis. There is significant uncertainty regarding the impact the COVID-19 pandemic will have on our commercial loan portfolio as well, but we identified the following industries that received an increase in monitoring:
| | | | | | | | | | | | | | |
| Commercial Industries with Increased Monitoring as of June 30, 2020 | | | | |
| Industry | | Outstanding Balance | | Percent of Gross Loans |
| | (Dollars in thousands) | | |
| Recreation | | $ | 86,878 | | | 2.0 | % |
| Restaurants | | 60,994 | | | 1.4 | |
| Aircraft and Aviation | | 52,379 | | | 1.2 | |
| Consumer | | $ | 45,716 | | | 1.0 | % |
| | | | |
These industries were identified based on the following changed economic conditions:
•Implementation of travel, entertainment, and restaurant restrictions;
•Cancellation of events and large gatherings;
•Business closures for those deemed “nonessential” by the government; and
•Furlough of workers and increase in unemployment numbers
The Bank worked with business owners in these industries by deferring loan payments and funding PPP loans.
Tax Implications Related to the CARES Act
The Company does not anticipate significant changes in its tax position as a result of the CARES Act.
Selected Financial Data (unaudited)
Selected financial data for and as of our previous five quarters and the six months ended June 30, 2020 and 2019 is presented below:
| | | | | | | | | | | | | | | | | | | | | | | | | | | | | | | | | | | | | | | | | |
| As of or For the Three Months Ended | | | | | | | | | | As of or For the Six Months Ended | | |
| June | | March | | December | | September | | June | | June | | June |
| 30, | | 31, | | 31, | | 30, | | 30, | | 30, | | 30, |
| 2020 | | 2020 | | 2019 | | 2019 | | 2019 | | 2020 | | 2019 |
| Per Common Share Data | | | | | | | | | | | | | |
| Basic earnings (loss) per share | $ | (0.14) | | | $ | 0.07 | | | $ | (0.01) | | | $ | 0.22 | | | $ | 0.21 | | | $ | (0.07) | | | $ | 0.41 | |
| Diluted earnings (loss) per share | (0.14) | | | 0.07 | | | (0.01) | | | 0.21 | | | 0.20 | | | (0.07) | | | 0.40 | |
| Book value per share | 11.66 | | | 11.75 | | | 11.58 | | | 11.59 | | | 11.00 | | | 11.66 | | | 11.00 | |
Tangible book value per share(1) | $ | 11.65 | | | $ | 11.60 | | | $ | 11.43 | | | $ | 11.44 | | | $ | 10.83 | | | $ | 11.65 | | | $ | 10.83 | |
| | | | | | | | | | | | | |
| Selected Operating Ratios | | | | | | | | | | | | | |
Yield on securities - tax equivalent(2) | 3.07 | % | | 3.21 | % | | 3.22 | % | | 3.19 | % | | 3.42 | % | | 3.15 | % | | 3.51 | % |
| Yield on loans | 4.28 | | | 4.98 | | | 5.21 | | | 5.53 | | | 5.66 | | | 4.61 | | | 5.70 | |
Yield on interest-earning assets(2) | 3.96 | | | 4.57 | | | 4.76 | | | 5.00 | | | 5.18 | | | 4.25 | | | 5.21 | |
| Cost of interest-bearing deposits | 0.95 | | | 1.69 | | | 1.97 | | | 2.26 | | | 2.33 | | | 1.31 | | | 2.31 | |
| Cost of total deposits | 0.79 | | | 1.46 | | | 1.70 | | | 1.94 | | | 1.99 | | | 1.11 | | | 1.98 | |
| Cost of funds | 0.85 | | | 1.49 | | | 1.71 | | | 1.94 | | | 1.99 | | | 1.15 | | | 1.97 | |
Net interest margin(2) | 3.19 | | | 3.24 | | | 3.23 | | | 3.24 | | | 3.35 | | | 3.22 | | | 3.40 | |
| Return on average assets | (0.54) | | | 0.31 | | | (0.06) | | | 0.89 | | | 0.86 | | | (0.14) | | | 0.88 | |
Non-GAAP core operating return on average assets(3) | 0.00 | | | 0.31 | | | (0.06) | | | 0.89 | | | 0.89 | | | 0.15 | | | 0.83 | |
| | | | | | | | | | | | | | | | | | | | | | | | | | | | | | | | | | | | | | | | | |
| As of or For the Three Months Ended | | | | | | | | | | As of or For the Six Months Ended | | |
| June | | March | | December | | September | | June | | June | | June |
| 30, | | 31, | | 31, | | 30, | | 30, | | 30, | | 30, |
| 2020 | | 2020 | | 2019 | | 2019 | | 2019 | | 2020 | | 2019 |
| Return on average equity | (4.84) | | | 2.53 | | | (0.46) | | | 7.58 | | | 7.78 | | | (1.15) | | | 7.87 | |
Non-GAAP core operating return on average common equity(4) | 0.03 | | | 2.53 | | | (0.46) | | | 7.58 | | | 8.04 | | | 1.28 | | | 7.43 | |
Non-interest expense to average assets(5) | 2.21 | | | 1.80 | | | 1.81 | | | 1.82 | | | 2.00 | | | 2.01 | | | 2.10 | |
Efficiency ratio(6) | 70.81 | | | 55.11 | | | 55.60 | | | 54.29 | | | 60.09 | | | 63.29 | | | 62.11 | |
Non-GAAP core operating efficiency ratio - tax equivalent(2)(7) | 53.09 | | | 54.18 | | | 54.66 | | | 53.43 | | | 58.43 | | | 53.61 | | | 60.71 | |
| Non-interest-bearing deposits to total deposits | 17.43 | | | 14.28 | | | 13.30 | | | 14.05 | | | 14.28 | | | 17.43 | | | 14.28 | |
| Loans to deposits | 102.53 | % | | 100.75 | % | | 98.18 | % | | 99.23 | % | | 96.74 | % | | 102.53 | % | | 96.74 | % |
| Credit Quality Ratios | | | | | | | | | | | | | |
| Allowance for loan losses to total loans | 1.61 | % | | 1.29 | % | | 1.48 | % | | 1.18 | % | | 1.24 | % | | 1.61 | % | | 1.24 | % |
| Nonperforming assets to total assets | 0.74 | | | 0.59 | | | 0.97 | | | 1.00 | | | 1.18 | | | 0.74 | | | 1.18 | |
| Nonperforming loans to total loans | 0.86 | | | 0.66 | | | 1.15 | | | 1.22 | | | 1.45 | | | 0.86 | | | 1.45 | |
| Allowance for loan losses to nonperforming loans | 188.55 | | | 195.99 | | | 128.54 | | | 97.12 | | | 85.22 | | | 188.55 | | | 85.22 | |
Net charge-offs (recoveries) to average loans(5) | 0.12 | % | | 2.00 | % | | 0.58 | % | | 0.53 | % | | — | % | | 1.01 | % | | 0.04 | % |
| Capital Ratios | | | | | | | | | | | | | |
| Total stockholders’ equity to total assets | 11.13 | % | | 12.08 | % | | 12.20 | % | | 12.95 | % | | 11.16 | % | | 11.13 | % | | 11.16 | % |
| Tier 1 leverage ratio | 10.75 | | | 11.81 | | | 12.06 | | | 12.57 | | | 10.87 | | | 10.75 | | | 10.87 | |
| Common equity tier 1 capital ratio | 11.99 | | | 12.08 | | | 12.20 | | | 12.91 | | | 11.02 | | | 11.99 | | | 11.02 | |
| Tier 1 risk-based capital ratio | 12.01 | | | 12.10 | | | 12.22 | | | 12.93 | | | 11.04 | | | 12.01 | | | 11.04 | |
| Total risk-based capital ratio | 13.27 | % | | 13.17 | % | | 13.43 | % | | 13.90 | % | | 12.04 | % | | 13.27 | % | | 12.04 | % |
| | | | | | | | | | | | | |
| | | | | | | | | | | | | |
(1) Tangible common stockholders’ equity and tangible book value per share are non-GAAP financial measures. The most directly comparable GAAP measures are stockholders’ equity and book value per share. See “GAAP Reconciliation and Management Explanation of Non-GAAP Financial Measures” for a reconciliation of these measures. | | | | | | | | | | | | | |
(2) Tax exempt income (tax-free municipal securities) is calculated on a tax equivalent basis. The incremental tax rate used is 21.0%. | | | | | | | | | | | | | |
(3) Non-GAAP core operating return on average assets is a non-GAAP financial measure. The most directly comparable GAAP measure is return on average assets. See “GAAP Reconciliation and Management Explanation of Non-GAAP Financial Measures” for a reconciliation of this measure. | | | | | | | | | | | | | |
(4) Non-GAAP core operating return on average equity is a non-GAAP financial measure. The most directly comparable GAAP financial measure is return on average equity. See “GAAP Reconciliation and Management Explanation of Non-GAAP Financial Measures” for a reconciliation of this measure. | | | | | | | | | | | | | |
(5) Interim periods are annualized. | | | | | | | | | | | | | |
(6) We calculate efficiency ratio as non-interest expense divided by the sum of net interest income and non-interest income. | | | | | | | | | | | | | |
(7) Non-GAAP core operating efficiency ratio - tax equivalent is a non-GAAP financial measure. The most directly comparable GAAP financial measure is the efficiency ratio. See “GAAP Reconciliation and Management Explanation of Non-GAAP Financial Measures” for a reconciliation of this measure. | | | | | | | | | | | | | |
| | | | | | | | | | | | | |
| | | | | | | | | | | | | |
Performance Measures
| | | | | | | | | | | | | | | | | | | | | | | | | | | | | |
| As of or For the Quarter Ended |
| March 31,
2021 | | December 31,
2020 | | September 30,
2020 | | June 30,
2020 | | March 31,
2020 |
| (Dollars in thousands, except per share data) |
Return on average assets(1) | 0.84 | % | | 0.58 | % | | 0.58 | % | | (0.54) | % | | 0.31 | % |
Return on average equity(1) | 7.80 | % | | 5.19 | % | | 5.19 | % | | (4.84) | % | | 2.53 | % |
| Earnings (loss) per share | $ | 0.23 | | | $ | 0.16 | | | $ | 0.15 | | | $ | (0.14) | | | $ | 0.07 | |
| Diluted earnings (loss) per share | $ | 0.23 | | | $ | 0.15 | | | $ | 0.15 | | | $ | (0.14) | | | $ | 0.07 | |
Efficiency(2) | 50.41 | % | | 53.35 | % | | 53.03 | % | | 70.81 | % | | 55.10 | % |
| Equity to assets | 10.48 | % | | 11.03 | % | | 11.22 | % | | 11.13 | % | | 12.08 | % |
(1) Interim periods annualized |
(2) We calculate efficiency ratio as noninterest expense divided by the sum of net interest income and noninterest income. |
Results of Operations
Summary
The components of the Company’s results of operations were as follows for the periods shown:
| | | | | | | | | | | | | | | | | | | | | | | | | | | | | | | | | | | | | | | | | | | | | | | |
| Three Months Ended | | | | | | | | Six Months Ended | | | | | | |
| June 30, | | | | | | | | June 30, | | | | | | |
| | | | | Change | | | | | | | | Change | | |
| 2020 | | 2019 | | $ | | % | | 2020 | | 2019 | | $ | | % |
| (Dollars in thousands) | | | | | | | | | | | | | | |
| Net interest income | $ | 41,157 | | | $ | 34,874 | | | $ | 6,283 | | | 18 | % | | $ | 79,385 | | | $ | 68,479 | | | $ | 10,906 | | | 16 | % |
| Provision for loan losses | 21,000 | | | 2,850 | | | 18,150 | | | 637 | | | 34,950 | | | 5,700 | | | 29,250 | | | 513 | |
| Non-interest income | 2,634 | | | 1,672 | | | 962 | | | 58 | | | 4,729 | | | 3,317 | | | 1,412 | | | 43 | |
| Non-interest expense | 31,010 | | | 21,960 | | | 9,050 | | | 41 | | | 53,233 | | | 44,591 | | | 8,642 | | | 19 | |
| Income tax expense (benefit) | (863) | | | 2,297 | | | (3,160) | | | (138) | | | (570) | | | 2,716 | | | (3,286) | | | (121) | |
| Net income (loss) | $ | (7,356) | | | $ | 9,439 | | | $ | (16,795) | | | (178) | % | | $ | (3,499) | | | $ | 18,789 | | | $ | (22,288) | | | (119) | % |
| Preferred dividends | — | | | — | | | — | | | — | | | — | | | 175 | | | (175) | | | (100) | |
| Net income (loss) available to common shareholders | $ | (7,356) | | | $ | 9,439 | | | $ | (16,795) | | | (178) | % | | $ | (3,499) | | | $ | 18,614 | | | $ | (22,113) | | | (119) | % |
Non-GAAP core operating income(1) | $ | 41 | | | $ | 9,754 | | | $ | (9,713) | | | (100) | % | | $ | 3,898 | | | $ | 17,743 | | | $ | (13,845) | | | (78) | % |
| | | | | | | | | | | | | | | |
(1) Non-GAAP core operating income is a non-GAAP financial measure. The most directly comparable measure under GAAP is net income. See “GAAP Reconciliation and Management Explanation of Non-GAAP Financial Measures” for a reconciliation of this measure. | | | | | | | | | | | | | | | |
Net Interest Income
We present and discuss netNet interest income is presented on a tax-equivalent basis below. A tax-equivalent basis makes all income taxable at the same rate. For example, $100 of tax-exempt income would be presented as $126.58, an amount that, if taxed at the statutory federal income tax rate of 21% would yield $100. We believe a tax-equivalent basis provides for improved comparability between the various earning assets.
| | | | | | | | | | | | | | | | | | | | | | | | | | | | | |
| For the Quarter Ended |
| March 31,
2021 | | December 31,
2020 | | September 30,
2020 | | June 30,
2020 | | March 31,
2020 |
Yield on securities - tax equivalent(1) | 2.89 | % | | 2.96 | % | | 2.93 | % | | 3.07 | % | | 3.21 | % |
| Yield on loans | 3.94 | | | 4.00 | | | 3.90 | | | 4.28 | | | 4.98 | |
Yield on earning assets - tax equivalent(1) | 3.50 | | | 3.71 | | | 3.66 | | | 3.96 | | | 4.57 | |
| Cost of interest-bearing deposits | 0.57 | | | 0.69 | | | 0.80 | | | 0.95 | | | 1.69 | |
| Cost of total deposits | 0.48 | | | 0.58 | | | 0.67 | | | 0.79 | | | 1.46 | |
| Cost of FHLB and short-term borrowings | 1.79 | | | 1.78 | | | 1.50 | | | 1.35 | | | 1.72 | |
| Cost of funds | 0.56 | | | 0.65 | | | 0.75 | | | 0.85 | | | 1.49 | |
Net interest margin - tax equivalent(1) | 3.00 | % | | 3.12 | % | | 2.98 | % | | 3.19 | % | | 3.24 | % |
(1) Tax-exempt income is calculated on a tax-equivalent basis. Tax-free municipal securities are exempt from Federal income taxes. The incremental tax rate used is 21%. |
The following table presents,tables present, for the periods indicated, average balance sheet information, interest income, interest expense and the corresponding average yield and rates paid:
| | | | | | | | | | | | | | | | | | | | | | | | | | | | | | | | | | | | |
| Three Months Ended | | | | | | | | | | | |
| June 30, | | | | | | | | | | | |
| 2020 | | | | | | 2019 | | | | | |
| Average Balance | | Interest Income / Expense | | Average Yield / Rate(4) | | Average Balance | | Interest Income / Expense | | Average Yield / Rate(4) | |
| (Dollars in thousands) | | | | | | | | | | | |
| Interest-earning assets: | | | | | | | | | | | | |
| Securities - taxable | $ | 290,342 | | | $ | 1,626 | | | 2.25 | % | | $ | 345,005 | | | $ | 2,611 | | | 3.04 | % | |
Securities - tax-exempt(1) | 438,525 | | | 3,945 | | | 3.62 | | | 374,750 | | | 3,529 | | | 3.78 | | |
| Federal funds sold | — | | | — | | | — | | | 15,165 | | | 96 | | | 2.55 | | |
| Interest-bearing deposits in other banks | 186,388 | | | 45 | | | 0.10 | | | 110,460 | | | 580 | | | 2.10 | | |
Gross loans, net of unearned income(2)(3) | 4,357,055 | | | 46,323 | | | 4.28 | | | 3,398,297 | | | 47,989 | | | 5.66 | | |
Total interest-earning assets(1) | 5,272,310 | | | $ | 51,939 | | | 3.96 | % | | 4,243,677 | | | $ | 54,805 | | | 5.18 | % | |
| Allowance for loan losses | (60,889) | | | | | | | (41,277) | | | | | | |
| Other non-interest-earning assets | 230,092 | | | | | | | 199,602 | | | | | | |
| Total assets | $ | 5,441,513 | | | | | | | $ | 4,402,002 | | | | | | |
| Interest-bearing liabilities | | | | | | | | | | | | |
| Transaction deposits | $ | 413,870 | | | $ | 266 | | | 0.26 | % | | $ | 144,020 | | | $ | 477 | | | 1.33 | % | |
| Savings and money market deposits | 1,932,723 | | | 2,653 | | | 0.55 | | | 1,559,979 | | | 8,955 | | | 2.30 | | |
| Time deposits | 1,195,445 | | | 5,486 | | | 1.85 | | | 1,305,244 | | | 8,065 | | | 2.48 | | |
| Total interest-bearing deposits | 3,542,038 | | | 8,405 | | | 0.95 | | | 3,009,243 | | | 17,497 | | | 2.33 | | |
| FHLB and short-term borrowings | 496,556 | | | 1,668 | | | 1.35 | | | 371,624 | | | 1,784 | | | 1.93 | | |
| Trust preferred securities, net of fair value adjustments | 933 | | | 24 | | | 10.61 | | | 895 | | | 37 | | | 16.79 | | |
| Non-interest-bearing deposits | 745,864 | | | — | | | — | | | 513,320 | | | — | | | — | | |
| Cost of funds | 4,785,391 | | | $ | 10,097 | | | 0.85 | % | | 3,895,082 | | | $ | 19,318 | | | 1.99 | % | |
| Other liabilities | 44,656 | | | | | | | 20,040 | | | | | | |
| Stockholders’ equity | 611,466 | | | | | | | 486,880 | | | | | | |
| Total liabilities and stockholders’ equity | $ | 5,441,513 | | | | | | | $ | 4,402,002 | | | | | | |
Net interest income(1) | | | $ | 41,842 | | | | | | | $ | 35,487 | | | | |
Net interest spread(1) | | | | | 3.11 | % | | | | | | 3.19 | % | |
Net interest margin(1) | | | | | 3.19 | % | | | | | | 3.35 | % | |
| | | | | | | | | | | | |
(1) Tax exempt income is calculated on a tax equivalent basis. Tax-free municipal securities are exempt from Federal taxes. The incremental tax rate used is 21.0%. | | | | | | | | | | | | |
(2) Loans, net of unearned income includes non-accrual loans of $38 million and $50 million as of June 30, 2020 and 2019, respectively. | | | | | | | | | | | | |
(3) Loan interest income includes loan fees of $4 million and $2 million for the three months ended June 30, 2020 and 2019, respectively. | | | | | | | | | | | | |
(4) Actual unrounded values are used to calculate the reported yield or rate disclosed. Accordingly, recalculations using the amounts in thousands as disclosed in this report may not produce the same amounts. | | | | | | | | | | | | |
| | | | | | | | | | | | | | | | | | | | | | | | | | | | | | | | | | | | |
| Three Months Ended | |
| March 31, | |
| 2021 | | 2020 | |
| Average Balance | | Interest Income / Expense | | Average Yield / Rate(4) | | Average Balance | | Interest Income / Expense | | Average Yield / Rate(4) | |
| (Dollars in thousands) | |
| Interest-earning assets: | | | | | | | | | | | | |
| Securities - taxable | $ | 217,231 | | | $ | 916 | | | 1.71 | % | | $ | 308,671 | | | $ | 2,066 | | | 2.69 | % | |
Securities - tax-exempt(1) | 479,953 | | | 4,055 | | | 3.43 | | | 451,443 | | | 4,007 | | | 3.57 | | |
| Federal funds sold | — | | | — | | | — | | | 4,136 | | | 18 | | | 1.74 | | |
| Interest-bearing deposits in other banks | 452,305 | | | 128 | | | 0.11 | | | 158,044 | | | 473 | | | 1.20 | | |
Gross loans, net of unearned income(2)(3) | 4,506,843 | | | 43,758 | | | 3.94 | | | 3,905,005 | | | 48,339 | | | 4.98 | | |
Total interest-earning assets(1) | 5,656,332 | | | $ | 48,857 | | | 3.50 | % | | 4,827,299 | | | $ | 54,903 | | | 4.57 | % | |
| Allowance for loan losses | (78,371) | | | | | | | (57,627) | | | | | | |
| Other non-interest-earning assets | 220,206 | | | | | | | 205,859 | | | | | | |
| Total assets | $ | 5,798,167 | | | | | | | $ | 4,975,531 | | | | | | |
| Interest-bearing liabilities | | | | | | | | | | | | |
| Transaction deposits | $ | 716,763 | | | $ | 364 | | | 0.21 | % | | $ | 341,497 | | | $ | 865 | | | 1.02 | % | |
| Savings and money market deposits | 2,421,765 | | | 2,388 | | | 0.40 | | | 1,886,785 | | | 6,735 | | | 1.44 | | |
| Time deposits | 972,006 | | | 2,976 | | | 1.24 | | | 1,165,800 | | | 6,672 | | | 2.30 | | |
| Total interest-bearing deposits | 4,110,534 | | | 5,728 | | | 0.57 | | | 3,394,082 | | | 14,272 | | | 1.69 | | |
| FHLB and short-term borrowings | 290,187 | | | 1,284 | | | 1.79 | | | 391,143 | | | 1,673 | | | 1.72 | | |
| Trust preferred securities, net of fair value adjustments | 965 | | | 24 | | | 9.96 | | | 923 | | | 35 | | | 14.69 | | |
| Non-interest-bearing deposits | 731,472 | | | — | | | — | | | 540,318 | | | — | | | — | | |
| Cost of funds | 5,133,158 | | | $ | 7,036 | | | 0.56 | % | | 4,326,466 | | | $ | 15,980 | | | 1.49 | % | |
| Other liabilities | 39,134 | | | | | | | 36,106 | | | | | | |
| Stockholders’ equity | 625,875 | | | | | | | 612,959 | | | | | | |
| Total liabilities and stockholders’ equity | $ | 5,798,167 | | | | | | | $ | 4,975,531 | | | | | | |
Net interest income(1) | | | $ | 41,821 | | | | | | | $ | 38,923 | | | | |
Net interest spread(1) | | | | | 2.94 | % | | | | | | 3.08 | % | |
Net interest margin(1) | | | | | 3.00 | % | | | | | | 3.24 | % | |
(1) Tax exempt income is calculated on a tax equivalent basis. Tax-free municipal securities are exempt from Federal income taxes. The incremental tax rate used is 21.0%. | |
(2) Loans, net of unearned income includes non-accrual loans of $63 million and $26 million as of March 31, 2021 and 2020, respectively. | |
(3) Loan interest income includes loan fees of $4 million and $2 million for the three months ended March 31, 2021 and 2020, respectively. | |
(4) Actual unrounded values are used to calculate the reported yield or rate disclosed. Accordingly, recalculations using the amounts in thousands as disclosed in this report may not produce the same amounts. | |
| | | | | | | | | | | | | | | | | | | | | | | | | | | | | | | | | | | | |
| Six Months Ended | | | | | | | | | | | |
| June 30, | | | | | | | | | | | |
| 2020 | | | | | | 2019 | | | | | |
| Average Balance | | Interest Income / Expense | | Average Yield / Rate(4) | | Average Balance | | Interest Income / Expense | | Average Yield / Rate(4) | |
| (Dollars in thousands) | | | | | | | | | | | |
| Interest-earning assets: | | | | | | | | | | | | |
| Securities - taxable | $ | 299,456 | | | $ | 3,692 | | | 2.48 | % | | $ | 333,879 | | | $ | 5,184 | | | 3.13 | % | |
Securities - tax-exempt(1) | 444,948 | | | 7,952 | | | 3.59 | | | 371,538 | | | 7,080 | | | 3.84 | | |
| Federal funds sold | 2,057 | | | 18 | | | 1.74 | | | 19,934 | | | 256 | | | 2.59 | | |
| Interest-bearing deposits in other banks | 172,294 | | | 518 | | | 0.60 | | | 116,171 | | | 1,226 | | | 2.13 | | |
Gross loans, net of unearned income(2)(3) | 4,132,279 | | | 94,662 | | | 4.61 | | | 3,287,935 | | | 92,992 | | | 5.70 | | |
Total interest-earning assets(1) | 5,051,034 | | | $ | 106,842 | | | 4.25 | % | | 4,129,457 | | | $ | 106,738 | | | 5.21 | % | |
| Allowance for loan losses | (59,267) | | | | | | | (40,314) | | | | | | |
| Other non-interest-earning assets | 218,043 | | | | | | | 196,625 | | | | | | |
| Total assets | $ | 5,209,810 | | | | | | | $ | 4,285,768 | | | | | | |
| Interest-bearing liabilities | | | | | | | | | | | | |
| Transaction deposits | $ | 377,883 | | | $ | 1,131 | | | 0.60 | % | | $ | 124,125 | | | $ | 753 | | | 1.22 | % | |
| Savings and money market deposits | 1,909,881 | | | 9,388 | | | 0.99 | | | 1,551,996 | | | 17,773 | | | 2.31 | | |
| Time deposits | 1,180,704 | | | 12,158 | | | 2.07 | | | 1,235,317 | | | 14,892 | | | 2.43 | | |
| Total interest-bearing deposits | 3,468,468 | | | 22,677 | | | 1.31 | | | 2,911,438 | | | 33,418 | | | 2.31 | | |
| FHLB and short-term borrowings | 444,141 | | | 3,342 | | | 1.51 | | | 377,338 | | | 3,537 | | | 1.89 | | |
| Trust preferred securities, net of fair value adjustments | 928 | | | 58 | | | 12.64 | | | 890 | | | 75 | | | 17.10 | | |
| Non-interest-bearing deposits | 643,659 | | | — | | | — | | | 495,377 | | | — | | | — | | |
| Cost of funds | 4,557,196 | | | $ | 26,077 | | | 1.15 | % | | 3,785,043 | | | $ | 37,030 | | | 1.97 | % | |
| Other liabilities | 40,406 | | | | | | | 19,169 | | | | | | |
| Stockholders’ equity | 612,208 | | | | | | | 481,556 | | | | | | |
| Total liabilities and stockholders’ equity | $ | 5,209,810 | | | | | | | $ | 4,285,768 | | | | | | |
Net interest income(1) | | | $ | 80,765 | | | | | | | $ | 69,708 | | | | |
Net interest spread(1) | | | | | 3.10 | % | | | | | | 3.24 | % | |
Net interest margin(1) | | | | | 3.22 | % | | | | | | 3.40 | % | |
(1) Tax exempt income is calculated on a tax equivalent basis. Tax-free municipal securities are exempt from Federal taxes. The incremental tax rate used is 21.0%. | | | | | | | | | | | | |
(2) Loans, net of unearned income includes non-accrual loans of $38 million and $50 million as of June 30, 2020 and 2019, respectively. | | | | | | | | | | | | |
(3) Loan interest income includes loan fees of $6 million and $4 million for the six months ended June 30, 2020 and 2019, respectively. | | | | | | | | | | | | |
(4) Actual unrounded values are used to calculate the reported yield or rate disclosed. Accordingly, recalculations using the amounts in thousands as disclosed in this report may not produce the same amounts. | | | | | | | | | | | | |
Changes in interest income and interest expense result from changes in average balances (volume) of interest earning assets and interest-bearing liabilities, as well as changes in average interest rates. The following table sets forth the effects of changing rates and volumes on our net interest income during the periods shown. Information is provided with respect to: (i) changes in volume (change in volume times old rate); (ii) changes in rates (change in rate times old volume); and (iii) changes in rate/volume (change in rate times the change in volume).
| | | Three Months Ended | | | Six Months Ended | | | Three Months Ended | |
| | June 30, 2020 over 2019 | | | June 30, 2020 over 2019 | | | March 31, 2021 over 2020 | |
| | Average Volume | | Yield/Rate | | Net Change(2) | | | Average Volume | | Yield/Rate | | Net Change(2) | | | Average Volume | | Yield/Rate | | Net Change(2) | |
| | (Dollars in thousands) | | | (Dollars in thousands) | |
| Interest Income | Interest Income | | | | | Interest Income | | |
| Securities - taxable | Securities - taxable | $ | (373) | | | $ | (612) | | | $ | (985) | | | | $ | (495) | | | $ | (997) | | | $ | (1,492) | | | Securities - taxable | $ | (511) | | | $ | (639) | | | $ | (1,150) | | |
Securities - tax-exempt(1) | Securities - tax-exempt(1) | 572 | | | (156) | | | 416 | | | | 1,351 | | | (479) | | | 872 | | | Securities - tax-exempt(1) | 246 | | | (198) | | | 48 | | |
| Federal funds sold | Federal funds sold | (48) | | | (48) | | | (96) | | | | (174) | | | (64) | | | (238) | | | Federal funds sold | (18) | | | — | | | (18) | | |
| Interest-bearing deposits in other banks | Interest-bearing deposits in other banks | 236 | | | (771) | | | (535) | | | | 426 | | | (1,134) | | | (708) | | | Interest-bearing deposits in other banks | 344 | | | (689) | | | (345) | | |
| Gross loans, net of unearned income | Gross loans, net of unearned income | 11,615 | | | (13,281) | | | (1,666) | | | | 21,387 | | | (19,717) | | | 1,670 | | | Gross loans, net of unearned income | 6,781 | | | (11,362) | | | (4,581) | | |
Total interest income(1) | Total interest income(1) | 12,002 | | | (14,868) | | | (2,866) | | | | 22,495 | | | (22,391) | | | 104 | | | Total interest income(1) | 6,842 | | | (12,888) | | | (6,046) | | |
| Interest Expense | Interest Expense | | | | | Interest Expense | | |
| Transaction deposits | Transaction deposits | 389 | | | (600) | | | (211) | | | | 916 | | | (538) | | | 378 | | | Transaction deposits | 510 | | | (1,011) | | | (501) | | |
| Savings and money market deposits | Savings and money market deposits | 1,738 | | | (8,040) | | | (6,302) | | | | 3,447 | | | (11,832) | | | (8,385) | | | Savings and money market deposits | 1,520 | | | (5,867) | | | (4,347) | | |
| Time deposits | Time deposits | (641) | | | (1,938) | | | (2,579) | | | | (628) | | | (2,106) | | | (2,734) | | | Time deposits | (973) | | | (2,723) | | | (3,696) | | |
| Total interest-bearing deposits | Total interest-bearing deposits | 1,486 | | | (10,578) | | | (9,092) | | | | 3,735 | | | (14,476) | | | (10,741) | | | Total interest-bearing deposits | 1,057 | | | (9,601) | | | (8,544) | | |
| FHLB and short-term borrowings | FHLB and short-term borrowings | 505 | | | (621) | | | (116) | | | | 576 | | | (771) | | | (195) | | | FHLB and short-term borrowings | (444) | | | 55 | | | (389) | | |
| Trust preferred securities, net of fair value adjustments | Trust preferred securities, net of fair value adjustments | 1 | | | (14) | | | (13) | | | | 3 | | | (20) | | | (17) | | | Trust preferred securities, net of fair value adjustments | 1 | | | (12) | | | (11) | | |
| Total interest expense | Total interest expense | 1,992 | | | (11,213) | | | (9,221) | | | | 4,314 | | | (15,267) | | | (10,953) | | | Total interest expense | 614 | | | (9,558) | | | (8,944) | | |
Net interest income(1) | Net interest income(1) | $ | 10,010 | | | $ | (3,655) | | | $ | 6,355 | | | | $ | 18,181 | | | $ | (7,124) | | | $ | 11,057 | | | Net interest income(1) | $ | 6,228 | | | $ | (3,330) | | | $ | 2,898 | | |
| (1) Tax exempt income is calculated on a tax equivalent basis. Tax-free municipal securities are exempt from Federal taxes. The incremental tax rate used is 21.0%. | | |
(1) Tax exempt income is calculated on a tax equivalent basis. Tax-free municipal securities are exempt from Federal income taxes. The incremental tax rate used is 21.0%. | | (1) Tax exempt income is calculated on a tax equivalent basis. Tax-free municipal securities are exempt from Federal income taxes. The incremental tax rate used is 21.0%. | |
(2) The change in interest not due solely to volume or rate has been allocated in proportion to the respective absolute dollar amounts of the change in volume or rate. | (2) The change in interest not due solely to volume or rate has been allocated in proportion to the respective absolute dollar amounts of the change in volume or rate. | | (2) The change in interest not due solely to volume or rate has been allocated in proportion to the respective absolute dollar amounts of the change in volume or rate. | |
Three months ended June 30, 2020 over 2019
For the three months ended June 30, 2020, net interestInterest income increased $6 million or 18% from the same period in the prior year. Net interest- Interest income improved as a result of a $1 billion or 24% increase in average interest-earning assets partially offset by a 16 basis point decline in our net interest margin (“NIM”).
For the three months ended June 30, 2020, NIM was 3.19% compared to 3.35% for the same period in 2019. The lower margin was attributable to a declining interest rate environment. Over the last 12-months, Federal Open Market Committee (“FOMC”) reduced the federal funds rate and resulted in NIM compression as interest-bearing deposits repriced slower than our loan portfolio. The gross loans margin decreased 138 basis points from 5.66%declined for the three months ended June 30, 2019 to 4.28% for the same period in 2020 while the Company’s cost of funds declined 114 basis points from 1.99% for the three months ended June 30, 2019 to 0.85% for the same period in 2020. During the three months ended June 30, 2020, the Company shortened the duration of FHLB borrowings and adjusted variable rate deposit accounts to help offset declining variable rates on loans. Changes in the yield and rate of interest-earning assets and interest-bearing liabilities decreased net interest income for the three months ended June 30, 2020 by $4 million from the same period in 2019.
Average volume for the three months ended June 30, 2020March 31, 2021 compared to the same period in 2019 improved net2020. Lower yields on earning assets were driven by a decline in the interest incomerate environment. The decline in asset yields was partially offset by $10 million. The increaseyear-over-year loan growth and PPP loan income. We anticipate PPP loan fees to positively impact our yield going forward in average interest-earning assets2021 as loans are forgiven and we accelerate the recognition of the unearned loan fees.
Interest expense - Interest expense declined for the three months ended June 30, 2020 were driven by a $959 million or 28% increase in average loansMarch 31, 2021 compared to the same period in 2019.2020. The growthcost of interest-bearing deposits continued to decline due to strategic rate changes in loansour deposit products driven by the declining interest rate environment. The decline in rates was offset by an increase in average volume due to increased liquidity in the market. The cost of FHLB and other borrowings remained relatively flat compared to 2020 as the Company’s increase in cash offset the need to renew or increase these borrowings. We currently anticipate our cost of funds to decline slightly throughout 2021 as we continue to reduce rates on deposits and longer term borrowings.
Net interest income - Net interest income increased slightly for the three months ended June 30, 2020 was primarily supported by a $533 million or 18% increase in interest-bearing deposits and a $233 million or 45% increase in non-interest-
bearing depositsMarch 31, 2021 compared to the same period in 2019. The Company anticipates NIM to decline slightly during the last two quarters of 2020 as rate reductions for interest-bearing deposits partially offset continued rate declines in the loan and investment portfolio.
Six months ended June 30, 2020 over 2019
For the six months ended June 30, 2020, net interest income increased $11 million or 16% from the same period in 2019. Net interest income improved as a result of a $922 million or 22% increasedriven by growth in average interest-earningearning assets, offset by an 18 basis point reductioncompression in NIM duenet interest margin as earning assets repriced quicker than interest-bearing liabilities. We currently expect the net interest margin to the decliningremain flat in 2021 as earning assets continue to reprice, offset by maturities in borrowed funds that have higher interest rate environment that repriced our interest-earning assets faster than liabilities.
For the six months ended June 30, 2020, NIM was 3.22% comparedrates. Our expected margin may continue to 3.40% for the same period in 2019. The loan yield for the six months ended June 30, 2019 declined 109 basis points compared to the same period in 2019, which was drivenbe impacted by the federal funds rate declineCOVID-19 pandemic, placing loans on non-accrual status, including loans with deferred payments, and market competition that decreased interest income by $22 million between these periods. To offset the declinechanges in loan yields, the Company focused on reducing its cost of funds, which decreased 82 basis points for the six months ended June 30, 2020 compared to the same period in 2019. The cost of funds improved primarily from declines in money market and saving account rates, which adjust quicker than time deposit rates for the six months ended June 30, 2020 benefited from a $148 million increase in average non-interest bearing deposits compared to the same period in 2019. Overall, the cost of funds reduced interest expense by $15 million.
The year-to-date increase in average loans improved interest income by $21 million, while the offsetting increase in deposits and other borrowings increased interest expense by $4 million. The declining rate environment negatively impacted our net interest income by $7 million as loan repricing declined at a faster pace than the funding sources.competition.
Impact of Transition Away from LIBOR
The Company has loans, derivative contracts, and other financial instruments that directly or indirectly depend on LIBOR to establish an interest rate and/or value. This includedhad more than $1than $1.5 billion in loans tied to LIBOR as of June 30, 2020. LIBOR is expected to cease on Decemberat March 31, 2021. The impactCompany is replacing/adding loan document language to account for the transition away from LIBOR as loans renew or originate. The Company adopted Accounting Standards Update (“ASU”) 2020-04 “Reference Rate Reform (Topic 848): Facilitation of alternativesthe Effects of Reference Rate Reform on Financial Reporting” in 2020. The ASU allows the Company to recognize the modification related to LIBOR on the valuations, pricing and operation of our financial instruments is not yet known; however, loans, securities, and derivatives indexed to LIBOR that mature after December 31, 2021 may be impacted. As a result, the Company established an internal committee to evaluate potential substitutions and the related financial impact to the Company.
Provision for Loan Losses
The provision for loan losses was as follows for the periods shown:
| | | | | | | | | | | | | | | | | | | | | | | | | | | | | | | | | | | | | | | | | | | | | | | |
| Three Months Ended | | | | | | | | Six Months Ended | | | | | | |
| June 30, | | | | | | | | June 30, | | | | | | |
| | | | | Change | | | | | | | | Change | | |
| 2020 | | 2019 | | $ | | % | | 2020 | | 2019 | | $ | | % |
| (Dollars in thousands) | | | | | | | | | | | | | | |
| Provision for loan losses | $ | 21,000 | | | $ | 2,850 | | | $ | 18,150 | | | 637 | % | | $ | 34,950 | | | $ | 5,700 | | | $ | 29,250 | | | 513 | % |
| | | | | | | | | | | | | | | |
The allowance for loan losses as of June 30, 2020 was $71 million compared to $43 million as of June 30, 2019. The increase of $28 million or 66% was primarily due to grade migration in the first half of 2020, a $584 million increase in gross loans, excluding PPP loans, from June 30, 2019 to June 30, 2020, and adjustments to the qualitative and quantitative factors used in the ALLL. The allowance as a percentagecontinuation of loans was 1.61% at June 30, 2020 compared to 1.24% at June 30, 2019. For additional detail regarding the change toold contract, rather than a cancellation of the ALLL, refer to the Allowance for Loan Losses section below.
Non-Interest Income
| | | | | | | | | | | | | | | | | | | | | | | | | | | | | |
| For the Quarter Ended |
| March 31,
2021 | | December 31,
2020 | | September 30,
2020 | | June 30,
2020 | | March 31,
2020 |
| (Dollars in thousands) |
| Total non-interest income | $ | 4,144 | | | $ | 2,949 | | | $ | 4,063 | | | $ | 2,634 | | | $ | 2,087 | |
Non-interest income to average assets(1) | 0.29 | % | | 0.21 | % | | 0.29 | % | | 0.19 | % | | 0.17 | % |
(1) Interim periods annualized. |
The components of non-interest income were as follows for the periods shown:
| | | Three Months Ended | | | Six Months Ended | | | Three Months Ended | |
| | June 30, | | | June 30, | | | March 31, | |
| | | Change | | | | Change | | | | Change | |
| | 2020 | | 2019 | | $ | | % | | 2020 | | 2019 | | $ | | % | | 2021 | | 2020 | | $ | | % | |
| | (Dollars in thousands) | | | (Dollars in thousands) |
| Service charges and fees on customer accounts | Service charges and fees on customer accounts | $ | 647 | | | $ | 211 | | | $ | 436 | | | 207 | % | | $ | 1,155 | | | $ | 369 | | | $ | 786 | | | 213 | % | Service charges and fees on customer accounts | $ | 957 | | | $ | 508 | | | $ | 449 | | | 88 | % | |
| Gain on sale of available-for-sale debt securities | 320 | | | 406 | | | (86) | | | (21) | | | 713 | | | 433 | | | 280 | | | 65 | | |
| Impairment of premises and equipment held-for-sale | — | | | (424) | | | 424 | | | (100) | | | — | | | (424) | | | 424 | | | (100) | | |
| Gain on sale of loans | — | | | 79 | | | (79) | | | (100) | | | — | | | 158 | | | (158) | | | (100) | | |
| Realized gains on available-for-sale securities | | Realized gains on available-for-sale securities | 10 | | | 393 | | | (383) | | | (97) | | |
| | Income from bank-owned life insurance | Income from bank-owned life insurance | 453 | | | 473 | | | (20) | | | (4) | | | 909 | | | 940 | | | (31) | | | (3) | | Income from bank-owned life insurance | 416 | | | 456 | | | (40) | | | (9) | | |
| Swap fee income (loss), net | (32) | | | 159 | | | (191) | | | (120) | | | (41) | | | 536 | | | (577) | | | (108) | | |
| Swap fees and credit valuation adjustments, net | | Swap fees and credit valuation adjustments, net | 155 | | | (9) | | | 164 | | | 1,822 | | |
| ATM and credit card interchange income | ATM and credit card interchange income | 896 | | | 459 | | | 437 | | | 95 | | | 1,381 | | | 836 | | | 545 | | | 65 | | ATM and credit card interchange income | 2,328 | | | 485 | | | 1,843 | | | 380 | | |
| Other non-interest income | Other non-interest income | 350 | | | 309 | | | 41 | | | 13 | | | 612 | | | 469 | | | 143 | | | 30 | | Other non-interest income | 278 | | | 254 | | | 24 | | | 9 | | |
| Total non-interest income | Total non-interest income | $ | 2,634 | | | $ | 1,672 | | | $ | 962 | | | 58 | % | | $ | 4,729 | | | $ | 3,317 | | | $ | 1,412 | | | 43 | % | Total non-interest income | $ | 4,144 | | | $ | 2,087 | | | $ | 2,057 | | | 99 | % | |
|
The changes in non-interest income were driven by the following:
Service Charges and Fees on Customer Accounts
- This category includes a rebate program that attracted additional funding for the Bank and account analysis fees that continue to grow with ouroffset by a customer base, including their outstanding balances.rebate program. The increase for both the three and six month periodsquarter ended June 30, 2020March 31, 2021 compared to the same corresponding periodsperiod in 20192020 was driven by customer growth that resultedby a decline in increased analysis feescosts associated with our rebate program, including a reduction in the funded balance and reduction in the costs associated with the rebate program.rates used. In addition, customer growth and an increase in outstanding balances improved account analysis fees.
GainRealized Gains on Sale of Available-for-Sale Securities
- The Company sold $19 million and $60 million of securitiesdecrease for the six-month periodsquarter ended June 30, 2020 and 2019, respectively. The $280 thousand increase in the gainMarch 31, 2021 was primarily due to the declining rate environment, which increased the value and volume of the Company’s securities sold in 2020 compared toin the same period in 2019.declining rate environment. The 2020 sales were a strategic decision by management to capitalize on attractive market conditions and improve credit quality. For the three-months ended June 30, 2020, gains on sales of securities were lower than in the same period in 2019 primarily from the sale of $15 million in securities during the three-months ended June 30, 2020 compared to $57 million during the same period in 2019.
Impairment of Premises and Equipment Held-for-Sale:
The Company sold a support building during the second quarter of 2019 as our service and support members moved to our new corporate headquarters.
Swap Fee Income,and Credit Valuation Adjustments, Net
Swap fee income, net - This category includes both swap fees from the execution of new swaps and the credit valuation adjustment (“CVA”). The decline in swap fee income for bothSwap fees on new swaps depend on the threesize and six month periods ended June 30, 2020term of the underlying asset. During the first quarter of 2021, no new swaps were executed compared to two new swaps for the same corresponding periodsperiod in 20192020. The low volume of new swaps was driven by management’sdue to management's loan and pricing strategy and lower loan originations, excluding PPP loans,strategy. Increased rates as of March 31, 2021 played a result ofsignificant role in the COVID-19 pandemic.year-over-year increase.
ATM and Credit Card Interchange Income
- The increase in ATM and credit card interchange income for the three and six month periodsquarter ended June 30, 2020March 31, 2021 compared to the same corresponding periodsperiod in 20192020 was primarily the result of customers that mobilized their workforce as a result ofdirectly impacted by the COVID-19 pandemic. The Company anticipates the credit card activity and related income will decline slightly in connection with a decline in COVID-19 cases.cases and the related vaccine rollout.
Non-Interest Expense
| | | | | | | | | | | | | | | | | | | | | | | | | | | | | |
| For the Quarter Ended |
| March 31,
2021 | | December 31,
2020 | | September 30,
2020 | | June 30, 2020(1) | | March 31,
2020 |
| (Dollars in thousands) |
| Total non-interest expense | $ | 22,818 | | | $ | 23,732 | | | $ | 23,011 | | | $ | 31,010 | | | $ | 22,215 | |
Non-interest expense to average assets(2) | 1.60 | % | | 1.71 | % | | 1.67 | % | | 2.21 | % | | 1.80 | % |
(1) Total non-interest expense includes $7 million related to goodwill impairment. |
(2) Interim periods annualized. |
The components of non-interest expense were as follows for the periods indicated:
| | | Three Months Ended | | | Six Months Ended | | | Three Months Ended | |
| | June 30, | | | June 30, | | | March 31, | |
| | | Change | | | | Change | | | | Change | |
| | 2020 | | 2019 | | $ | | % | | 2020 | | 2019 | | $ | | % | | 2021 | | 2020 | | $ | | % | |
| | (Dollars in thousands) | | | (Dollars in thousands) |
| Salary and employee benefits | Salary and employee benefits | $ | 14,004 | | | $ | 14,450 | | | $ | (446) | | | (3) | % | | $ | 28,394 | | | $ | 29,040 | | | (646) | | | (2) | % | Salary and employee benefits | $ | 13,553 | | | $ | 14,390 | | | $ | (837) | | | (6) | % | |
| Occupancy | Occupancy | 2,045 | | | 2,062 | | | (17) | | | (1) | | | 4,130 | | | 4,221 | | | (91) | | | (2) | | Occupancy | 2,494 | | | 2,085 | | | 409 | | | 20 | | |
| Professional fees | Professional fees | 1,295 | | | 714 | | | 581 | | | 81 | | | 1,966 | | | 1,496 | | | 470 | | | 31 | | Professional fees | 782 | | | 671 | | | 111 | | | 17 | | |
| Deposit insurance premiums | Deposit insurance premiums | 1,039 | | | 881 | | | 158 | | | 18 | | | 2,055 | | | 1,718 | | | 337 | | | 20 | | Deposit insurance premiums | 1,151 | | | 1,016 | | | 135 | | | 13 | | |
| Data processing | Data processing | 721 | | | 625 | | | 96 | | | 15 | | | 1,413 | | | 1,219 | | | 194 | | | 16 | | Data processing | 716 | | | 692 | | | 24 | | | 3 | | |
| Advertising | Advertising | 223 | | | 477 | | | (254) | | | (53) | | | 723 | | | 1,190 | | | (467) | | | (39) | | Advertising | 303 | | | 500 | | | (197) | | | (39) | | |
| Software and communication | Software and communication | 937 | | | 828 | | | 109 | | | 13 | | | 1,813 | | | 1,507 | | | 306 | | | 20 | | Software and communication | 1,065 | | | 876 | | | 189 | | | 22 | | |
| | Foreclosed assets, net | Foreclosed assets, net | 1,135 | | | 19 | | | 1,116 | | | 5,874 | | | 1,154 | | | 25 | | | 1,129 | | | 4,516 | | Foreclosed assets, net | 50 | | | 10 | | | 40 | | | 400 | | |
| Goodwill impairment | 7,397 | | | — | | | 7,397 | | | — | | | 7,397 | | | — | | | 7,397 | | | — | | |
| | Other non-interest expense | Other non-interest expense | 2,214 | | | 1,904 | | | 310 | | | 16 | | | 4,188 | | | 4,175 | | | 13 | | | — | | Other non-interest expense | 2,704 | | | 1,975 | | | 729 | | | 37 | | |
| Total non-interest expense | Total non-interest expense | $ | 31,010 | | | $ | 21,960 | | | $ | 9,050 | | | 41 | % | | $ | 53,233 | | | $ | 44,591 | | | $ | 8,642 | | | 19 | % | Total non-interest expense | $ | 22,818 | | | $ | 22,215 | | | $ | 603 | | | 3 | % | |
|
The changes in non-interest expensesnoninterest expense were driven by the following:
Salary and Employee Benefits
- Salary and employee benefit costs declineddecreased for both the three and six month periodsquarter ended June 30, 2020March 31, 2021 compared to the same corresponding periodsperiod in 20192020 primarily due to lower incentive compensation expenses, as a result of lower earningschanges in staffing levels. During the first half of 2020. The reduction in incentive compensation was partially offset in both periodsquarter of 2020, by a slightthe Company anticipated loan and deposit growth that required an increase in employees.
headcount and resulted in increased compensation costs. As a result of the COVID-19 pandemic, the Company suspended hiringoptimized staffing levels during the second half of 2020 and savings began to materialize in 2021.
Occupancy - Occupancy costs increased for the majority of available positions duringquarter ended March 31, 2021 compared to the three months ended June 30, 2020. As a result,same period in 2020 primarily due to our new locations in the Company anticipates salary costs will remain relatively flat duringrapidly growing Frisco, Texas market and our more prominent location on the third quarter.Country Club Plaza, in Kansas City, Missouri.
Professional Fees
- Professional fees increased for both the three and six-month periodsquarter ended June 30, 2020March 31, 2021 compared to the same corresponding periodsperiod in 20192020 primarily from an increase in legal fees as a result of PPP loans and loan workouts. In addition, the Company incurred fees related to the CEO transition that increased the expense for the three and six-months ended June 30, 2020. The Company’s accounting and third-party consulting fees increased in 2020 comparedcontinue to 2019increase due to asset growth and the transition from private tooperation as a public company.
Deposit Insurance Premiums
- The FDIC uses a risk-based premium system to calculate the quarterly fee.fees. Our premiumspremium costs increased for both the three and six-month periodsquarter ended June 30, 2020March 31, 2021 compared to the same corresponding periodsperiod in 20192020 as a result of strong asset growth, changes in asset quality and changes in capital ratios.
Advertising - The decline in advertising costs was driven by the COVID-19 pandemic that reduced in-person events.
Software and Communication - Software and communication costs increased for the quarter ended March 31, 2021 primarily due to our continued strategy to invest in technologies that allow us to cover beginning-to-end loan originations, provide customers with a suite of online tools and allow us to analyze reporting trends. In addition to the growing number of technologies implemented, a portion of costs increased as a result of our strong asset growth, changes to our loan mix, and capital ratios, allgrowth.
Other Non-interest Expense- Other non-interest expense increased our quarterly fee.
Advertising
The decline in advertising costs for the three and six-month periodsquarter ended June 30, 2020 primarily resulted from the COVID-19 pandemic. In addition, the year-to-date decline resulted from the Company’s rebranding campaign to update the Bank’s image that increased the 2019 expense by approximately $184 thousand.
Foreclosed Assets, Net
The increase in foreclosed assets, net for both the three and six month periods ended June 30, 2020March 31, 2021 compared to the same corresponding periodsperiod in 20192020 primarily resulteddue to a $623 thousand increase in commercial card costs as a result of our growing customer base and increased use as a result of the COVID-19 pandemic. In addition, insured cash sweep (“ICS”) deposits increased in 2021 from new appraisals on2020, which drove related fees higher by $125 thousand. These changes were partly offset by the foreclosed assets resultingCompany continuing to realize benefits in 2021 from reduced travel, entertainment and other discretionary spending as a $1 million valuation adjustment duringresult of the quarter ended June 30, 2020.COVID-19 pandemic.
Goodwill Impairment
The Company performed an interim review for goodwill impairment at June 30, 2020. A quantitative review was performed on the Tulsa market, reporting unit, using a combination of income and market based approaches. The capitalization of earnings, an income approach, used a single period of cash flows, adjusted for growth and a capitalization rate. The market approach used price-to-book multiples of peer banks and included a control premium. The reporting unit’s fair value was less than its book value and resulted in a $7 million impairment.
Income Taxes
Income tax expense (benefit) was as follows: | | | | | | | | | | | | | | | | | | | | | | | | | | | | | |
| For the Quarter Ended |
| March 31,
2021 | | December 31,
2020 | | September 30,
2020 | | June 30,
2020 | | March 31,
2020 |
| (Dollars in thousands) |
| Income tax expense (benefit) | $ | 2,908 | | | $ | 1,785 | | | $ | 1,498 | | | $ | (863) | | | $ | 293 | |
| Income (loss) before income taxes | $ | 14,943 | | | $ | 9,879 | | | $ | 9,504 | | | $ | (8,219) | | | $ | 4,150 | |
| Effective tax rate | 19 | % | | 18 | % | | 16 | % | | 10 | % | | 7 | % |
| | | | | | | | | | | | | | | | | | | | | | | | | | | | | | | | | | | | | | | | | | | | | | | |
| Three Months Ended | | | | | | | | Six Months Ended | | | | | | |
| June 30, | | | | | | | | June 30, | | | | | | |
| | | | | Change | | | | | | | | Change | | |
| 2020 | | 2019 | | $ | | % | | 2020 | | 2019 | | $ | | % |
| (Dollars in thousands) | | | | | | | | | | | | | | |
| Income tax expense (benefit) | $ | (863) | | | $ | 2,297 | | | $ | (3,160) | | | (138) | % | | $ | (570) | | | $ | 2,716 | | | $ | (3,286) | | | (121) | % |
| Effective tax rate | 10.5 | % | | 19.6 | % | | | | | | 14.0 | % | | 12.6 | % | | | | |
Our income tax expense (benefit) differs from the amount that would be calculated using the federal statutory tax rate, primarily from investments in tax advantaged assets, including bank-owned life insurance, and tax-exempt municipal securities;securities and tax credit bonds; state tax credits; and permanent tax differences from goodwill impairment and equity-based compensation.
The $3 million decrease in income tax expense between Refer to “Note 10: Income Tax” within the six months ended June 30, 2019 comparedNotes to the same period in 2020 primarily relates to a $26 million decrease in income before income taxes during 2020, which reduced taxes at the 21% statutory rate by $5 million; offset by a non-deductible goodwill impairment in 2020 and a $1 million state tax credit recorded in the first quarter of 2019. The state tax credit related to our purchase and improvement of our corporate headquarters.
The decrease in income tax expense during the three months ended June 30, 2020 compared to the same period in 2019 was primarily impacted by a $20 million decrease in income before income taxes that reduced taxes at the statutory rate by $4 million during the 2020 period; partially offset by a non-deductible goodwill impairment during the 2020 period. For both comparable periods, the Company continued to benefit from the tax-exempt municipal bond portfolio and bank-owned life insurance.Unaudited Financial Statements for more information.
Analysis of Financial Condition
Balance Sheet Summary
The following table summarizes select components of the Company’s Balance Sheet:
| | | | | | | | | | | | | | | | | | | | | | | |
| As of | | | | Change | | |
| June 30, 2020 | | December 31, 2019 | | $ | | % |
| (Dollars in thousands) | | | | | | |
| Total assets | $ | 5,462,254 | | | $ | 4,931,233 | | | $ | 531,021 | | | 11 | % |
| Cash and cash equivalents | 194,371 | | | 187,320 | | | 7,051 | | | 4 | |
| Available-for-sale securities | 700,083 | | | 741,634 | | | (41,551) | | | (6) | |
| | | | | | | |
| | | | | | | |
| Gross loans, net of unearned income | 4,413,224 | | | 3,852,244 | | | 560,980 | | | 15 | |
| Total deposits | 4,304,143 | | | 3,923,759 | | | 380,384 | | | 10 | |
| Federal funds purchased and repurchase agreements | 49,881 | | | 14,921 | | | 34,960 | | | 234 | |
| Federal Home Loan Bank advances | 450,617 | | | 358,743 | | | 91,874 | | | 26 | |
| Total stockholders’ equity | $ | 608,092 | | | $ | 601,644 | | | $ | 6,448 | | | 1 | % |
Asset growth in the first half of 2020 was driven by increases in the loan portfolio, primarily from the Paycheck Protection Program, commercial real estate and residential real estate loan funding. For additional information about the loan portfolio refer to the loan portfolio segment below.
The increase in loans was funded primarily from an increase in FHLB advances and total deposits that raised the loan to deposit ratio from 98% at December 31, 2019 to 103% at June 30, 2020. The increase in total deposits was driven by a $229 million increase in non-interest bearing deposits primarily from the funding of $369 million of PPP loans, a $140 million increase in transaction deposits and a $91 million increase in money market and savings deposits, partially offset by a $79 million decrease in time deposits. For additional information regarding deposits refer to the deposits and other borrowings segment below.
Securities Portfolio
The investment portfolio is governed by the Company’s investment policy that sets objectives, limits, and liquidity requirements among other items. The investment strategy is generally updated annually in coordination with an independent investment advisor. Thesecurities portfolio is maintained to serve as a contingent, on-balance sheet source of liquidity. The objective of the investment portfolio is to optimize earnings, manage credit and interest rate risk, ensure adequate liquidity, and meet pledging and regulatory capital requirements. The investment portfolio is comprised of government sponsored entity securities and U.S. state and political subdivision securities; limits are set on all securities.
As of June 30, 2020,March 31, 2021, available-for-sale investments totaled $700$685 million, a $42an increase of $31 million decrease from December 31, 2019. The investment decline related to faster prepayments and low reinvestment yield options.2020. For additional information, see “Note 3 -3: Securities” in the Notes to the Unaudited Consolidated Financial Statements.
Loan Portfolio
Refer to “Note 4: Loans consistedand Allowance for Loan Losses (“ALLL”)” within the Notes to the Unaudited Consolidated Financial Statements for additional information regarding the Company’s loan portfolio. As of the following as of the dates indicated:
| | | | | | | | | | | | | | | | | | | | | | | | | | | | | | | | | | | |
| June 30, 2020 | | | | December 31, 2019 | | | | June 30, 2020 vs. December 31, 2019 | | |
| Amount | | % of Gross Loans | | Amount | | % of Gross Loans | | $
Increase (Decrease) | | %
Increase (Decrease) |
| (Dollars in thousands) | | | | | | | | | | |
| Commercial | $ | 1,284,919 | | | 29 | % | | $ | 1,356,817 | | | 35 | % | | $ | (71,898) | | | (5) | % |
| Energy | 390,346 | | | 9 | | | 408,573 | | | 11 | | | (18,227) | | | (4) | |
| Commercial real estate | 1,141,277 | | | 26 | | | 1,024,041 | | | 27 | | | 117,236 | | | 11 | |
| Construction and land development | 661,691 | | | 15 | | | 628,418 | | | 16 | | | 33,273 | | | 5 | |
| Residential real estate | 536,270 | | | 12 | | | 398,695 | | | 10 | | | 137,575 | | | 35 | |
| PPP | 369,022 | | | 8 | | | — | | | — | | | 369,022 | | | — | |
| Consumer | 45,716 | | | 1 | | | 45,163 | | | 1 | | | 553 | | | 1 | |
| Gross loans | 4,429,241 | | | 100 | % | | 3,861,707 | | | 100 | % | | 567,534 | | | 15 | |
| Less: Allowance for loan losses | 71,185 | | | | | 56,896 | | | | | 14,289 | | | 25 | |
| Less: Net deferred loan fees and costs | 16,017 | | | | | 9,463 | | | | | 6,554 | | | 69 | |
| Net loans | $ | 4,342,039 | | | | | $ | 3,795,348 | | | | | $ | 546,691 | | | 14 | % |
| | | | | | | | | | | |
PPP
The Company funded PPPMarch 31, 2021, gross loans in the second quarter of 2020 as a result of the COVID-19 pandemic, representing 65% of the net loan growthincreased $68 million or 2% from December 31, 2019.2020 and was driven by the following:
PPP - PPP loans increased $44 million or 15% from December 31, 2020 to March 31, 2021. PPP loan activity is detailed in the “First Quarter 2021 Highlights” section within Management’s Discussion and Analysis. The loans are guaranteed by the SBA, earn interest at 1.00%, and include a fee. The PPP loans will decline as the SBA forgives the loans and provides repayment to the Bank. Residential Real Estate
Growth was from developing relationships with key residentialConstruction and multifamily real estate developers in our markets.Land Development - The increase included new loan funding of approximately $63$54 million with the remaining growth coming from existing loan relationships.
Commercial Real Estate
Growthor 10% increase was driven by activitycustomer drawdowns on lines of credit primarily for commercial projects.
Energy - Our energy portfolio declined $2 million from December 31, 2020 to March 31, 2021. Customers remain impacted by lower oil and natural gas prices that has strained operating cash flow and ability to pay down their lines of credit. The Company expects the energy portfolio to decline further as part of management’s strategy to lower our oil and gas loan concentrations.
Commercial - The $55 million decline in our Dallas and Kansas City markets. Approximately 76% of the portfolio is in Kansas, Missouri, Oklahoma, and Texas. Texas, our largest state concentration, represented approximately 29% of the portfolio as of June 30, 2020. The portfolio remains well diversified with growthcommercial loans was driven by charge-offs taken in the office space, industrial,first quarter of 2021, an increase in pay downs and senior living sectors, among others.$28 million of loans sold to a third-party. The loans sold were written down to the sales price prior to the sale.
Energy
Our energy portfolio declined in amount and as a percentageThe following table shows the contractual maturities of our loan portfolio from 11% at December 31, 2019gross loans and sensitivity to 9% at June 30, 2020. The Company expects to see less activity in the energy market due to ongoing uncertainty in the sector and a desire to lower our energy concentration.interest rate changes:
Commercial
Declines were the result of increased payoffs that were driven by declines in individual business loans, engineering and construction, vehicle financing, and professional and technical services. | | | | | | | | | | | | | | | | | | | | | | | | | | | | | | | | | | | | | | | | | | | | | | | | | | | | | |
| As of March 31, 2021 |
| Due in One Year or Less | | Due after One Year through Five Years | | Due after Five Years through Fifteen Years | | Due after Fifteen Years | | |
| Fixed Rate | | Adjustable Rate | | Fixed Rate | | Adjustable Rate | | Fixed Rate | | Adjustable Rate | | Fixed Rate | | Adjustable Rate | | Total |
| (Dollars in thousands) |
| Commercial | $ | 63,678 | | | $ | 329,338 | | | $ | 283,206 | | | $ | 513,545 | | | $ | 20,939 | | | $ | 73,341 | | | $ | — | | | $ | — | | | $ | 1,284,047 | |
| Energy | 52 | | | 193,485 | | | 451 | | | 148,911 | | | — | | | — | | | — | | | — | | | 342,899 | |
| Commercial real estate | 103,513 | | | 139,707 | | | 346,489 | | | 295,986 | | | 47,092 | | | 251,547 | | | — | | | 7,300 | | | 1,191,634 | |
| Construction and land development | 4,411 | | | 75,857 | | | 33,557 | | | 444,016 | | | — | | | 29,768 | | | 6,860 | | | 22,731 | | | 617,200 | |
| Residential and multifamily real estate | 20,344 | | | 112,806 | | | 69,230 | | | 143,924 | | | 110,117 | | | 8,675 | | | 176 | | | 222,621 | | | 687,893 | |
| PPP | — | | | — | | | 336,355 | | | — | | | — | | | — | | | — | | | — | | | 336,355 | |
| Consumer | 16,799 | | | 11,212 | | | 4,767 | | | 12,534 | | | — | | | 15,332 | | | — | | | 2,273 | | | 62,917 | |
| Gross loans | $ | 208,797 | | | $ | 862,405 | | | $ | 1,074,055 | | | $ | 1,558,916 | | | $ | 178,148 | | | $ | 378,663 | | | $ | 7,036 | | | $ | 254,925 | | | $ | 4,522,945 | |
Provision and Allowance for Loan Losses (“ALLL”)
The | | | | | | | | | | | | | | | | | | | | | | | | | | | | | |
| For the Quarter Ended |
| March 31,
2021 | | December 31,
2020 | | September 30,
2020 | | June 30,
2020 | | March 31,
2020 |
| (Dollars in thousands) |
| Provision for loan losses | $ | 7,500 | | | $ | 10,875 | | | $ | 10,875 | | | $ | 21,000 | | | $ | 13,950 | |
| Allowance for loan losses | 74,551 | | | 75,295 | | | 76,035 | | | 71,185 | | | 51,458 | |
| Net charge-offs | $ | 8,244 | | | $ | 11,615 | | | $ | 6,025 | | | $ | 1,273 | | | $ | 19,388 | |
Refer to “Note 4: Loans and Allowance for Loan Losses (“ALLL”)” within the Notes to the Unaudited Consolidated Financial Statements for information regarding the Company’s ALLL is an amount required to cover net loan charge-offs plus the amount considered necessary by the Bank’s management to maintain the balance in the allowance at a level adequate to absorb expected loan losses in the existing loan portfolio. The ALLL is evaluated on at least a quarterly basis. We use a loan grading system and portfolio segmentation to group the portfolio. Each group is evaluated and adjusted for changes in historical trends that may impact the segment.process. The ALLL at June 30, 2020,March 31, 2021 represents our best estimate of the incurred credit losses inherent in the loan portfolio at that date.
COVID-19 Pandemic Uncertainties
There are significant uncertainties about what the effects of the COVID-19 pandemic will ultimately be. Depending upon the extent and duration of the future impact of the COVID-19 pandemic, we may need to make additional increases to our provision for loan losses in future periods. The future impact of the pandemic is highly uncertain and cannot be predicted. The extent of the impact on our customers and, in turn, on our business and operations, will depend on future developments, including actions taken to contain the pandemic. To the extent the pandemic continues to cause a recession or decrease economic activity for an extended time period, we expect our business and operations will be negatively impacted. Customers may seek additional loan modifications or restructuring, or we may experience adverse movement in risk classifications, any of which could potentially result in the need to increase provisions and impact the allowance for loan losses.
The allocation in one portfolio segment does not preclude its availability to absorb losses in other segments. The table below presents the allocation of the allowance for loan losses as of the dates indicated:
| | | June 30, 2020 | | | December 31, 2019 | | | March 31, 2021 | | December 31, 2020 |
| | Amount | | Percent of Allowance to Total Allowance | | Amount | | Percent of Allowance to Total Allowance | | Amount | | Percent of Allowance to Total Allowance | | Amount | | Percent of Allowance to Total Allowance |
| | (Dollars in thousands) | | | (Dollars in thousands) |
| Commercial | Commercial | $ | 26,543 | | | 37 | % | | $ | 35,864 | | | 63 | % | Commercial | $ | 23,464 | | | 32 | % | | $ | 24,693 | | | 33 | % |
| Energy | Energy | 17,372 | | | 24 | | | 6,565 | | | 12 | | Energy | 20,292 | | | 27 | | | 18,341 | | | 24 | |
| Commercial real estate | Commercial real estate | 16,899 | | | 24 | | | 8,085 | | | 14 | | Commercial real estate | 20,609 | | | 28 | | | 22,354 | | | 29 | |
| Construction and land development | Construction and land development | 5,019 | | | 7 | | | 3,516 | | | 6 | | Construction and land development | 3,837 | | | 5 | | | 3,612 | | | 5 | |
| Residential real estate | 4,868 | | | 7 | | | 2,546 | | | 4 | | |
| Residential and multifamily real estate | | Residential and multifamily real estate | 6,056 | | | 8 | | | 5,842 | | | 8 | |
| PPP | PPP | — | | | — | | | — | | | — | | PPP | — | | | — | | | — | | | — | |
| Consumer | Consumer | 484 | | | 1 | | | 320 | | | 1 | | Consumer | 293 | | | — | | | 453 | | | 1 | |
| Gross loans | Gross loans | $ | 71,185 | | | 100 | % | | $ | 56,896 | | | 100 | % | Gross loans | $ | 74,551 | | | 100 | % | | $ | 75,295 | | | 100 | % |
The $9 million or 26% decline in the commercial loan portfolio ALLL allocation was primarily from an $18 million charge-off in the first quarter
The $11 million or 165% increase in the energy ALLL allocation was impacted by grade migration and modified criteria for impaired loans. The $9 million or 109% increase in the commercial real estate loan portfolio ALLL allocation was driven by grade migration and modified criteria for impaired loans that are discussed below.
Activity in the allowance for loan losses is presented in the following table:
| | | | | | | | | | | | | | | | |
| Three Months Ended | | | |
| March 31, | | | |
| 2021 | | 2020 | | | | | |
| (Dollars in thousands) |
| Allowance for loan losses: | | | | | | | | |
| Balance at beginning of period | $ | 75,295 | | | $ | 56,896 | | | | | | |
| Provision for loan losses | 7,500 | | | 13,950 | | | | | | |
| Charge-offs: | | | | | | | | |
| Commercial | (8,266) | | | (18,077) | | | | | | |
| Energy | — | | | (1,279) | | | | | | |
| Commercial real estate | — | | | — | | | | | | |
| Construction and land development | — | | | — | | | | | | |
| Residential and multifamily real estate | — | | | — | | | | | | |
| | | | | | | | |
| Consumer | — | | | (104) | | | | | | |
| Total charge-offs | (8,266) | | | (19,460) | | | | | | |
| Recoveries: | | | | | | | | |
| Commercial | 22 | | | 71 | | | | | | |
| Energy | — | | | — | | | | | | |
| Commercial real estate | — | | | — | | | | | | |
| Construction and land development | — | | | — | | | | | | |
| Residential and multifamily real estate | — | | | — | | | | | | |
| | | | | | | | |
| Consumer | — | | | 1 | | | | | | |
| Total recoveries | 22 | | | 72 | | | | | | |
| Net charge-offs | (8,244) | | | (19,388) | | | | | | |
| Balance at end of period | $ | 74,551 | | | $ | 51,458 | | | | | | |
| | | | | | | | |
| | | | | | | | |
| | | | | | | | |
| | | | | | | | |
| | | | | | | | |
| | | | | | | | |
| | | | | | | | |
|
| | | | | | | | | | | | | | | | | | | | | | | | |
| Three Months Ended | | | | | Six Months Ended | | |
| June 30, | | | | | June 30, | | |
| 2020 | | 2019 | | | 2020 | | 2019 |
| (Dollars in thousands) | | | | | | | |
| Allowance for loan losses: | | | | | | | | |
| Balance at beginning of period | $ | 51,458 | | | $ | 40,001 | | | | $ | 56,896 | | | $ | 37,826 | |
| Provision for loan losses | 21,000 | | | 2,850 | | | | 34,950 | | | 5,700 | |
| Charge-offs: | | | | | | | | |
| Commercial | (87) | | | — | | | | (18,165) | | | (1,254) | |
| Energy | (1,000) | | | — | | | | (2,278) | | | — | |
| Commercial real estate | — | | | — | | | | — | | | — | |
| Construction and land development | — | | | — | | | | — | | | — | |
| Residential real estate | (189) | | | — | | | | (189) | | | — | |
| PPP | — | | | — | | | | — | | | — | |
| Consumer | — | | | (1) | | | | (104) | | | (11) | |
| Total charge-offs | (1,276) | | | (1) | | | | (20,736) | | | (1,265) | |
| Recoveries: | | | | | | | | |
| Commercial | 2 | | | 1 | | | | 73 | | | 14 | |
| Energy | — | | | — | | | | — | | | 576 | |
| Commercial real estate | — | | | — | | | | — | | | — | |
| Construction and land development | — | | | — | | | | — | | | — | |
| Residential real estate | — | | | — | | | | — | | | — | |
| PPP | — | | | — | | | | — | | | — | |
| Consumer | 1 | | | 1 | | | | 2 | | | 1 | |
| Total recoveries | 3 | | | 2 | | | | 75 | | | 591 | |
| Net (charge-offs) recoveries | (1,273) | | | 1 | | | | (20,661) | | | (674) | |
| Balance at end of period | $ | 71,185 | | | $ | 42,852 | | | | $ | 71,185 | | | $ | 42,852 | |
| Allowance for loan losses to total loans | 1.61 | % | | 1.24 | % | | | 1.61 | % | | 1.24 | % |
| | | | | | | | |
| | | | | | | | |
| Allowance for loan losses to nonperforming loans | 188.6 | | | 85.2 | | | | 188.6 | | | 85.2 | |
Net charge-offs to average loans(1) | 0.12 | % | | — | % | | | 1.01 | % | | 0.04 | % |
| | | | | | | | |
| | | | | | | | |
(1) Interim periods annualized | | | | | | | | |
Our ALLL as of June 30, 2020 increased $28 million or 66% from June 30, 2019 and increased $14 million or 25% from December 31, 2019. A breakdowndiscussion of the reasons for the changechanges in the ALLL is provided below:
Charge-offs and Recoveries:
ForDuring the three-months ended March 31, 2021, charge-offs primarily related to two commercial borrowers that were unable to support their debt obligations. The $8 million charged-off was greater than the reserved balance in the ALLL at December 31, 2020 resulting in a $5 million increase in the provision during the quarter ended June 30, 2020, the Company charged-off one energy loan that was classified for several years and accounted for the majority of net charge-offs. DuringMarch 31, 2021.
For the quarter ended March 31, 2020, net charge-offs included an $18 million charge-off related to a previously disclosed non-performing, commercial loan. The commercial loan had a specific reserve associated with it as of December 31, 2019, resulting in a limited impact to the first quarter 2020 provision. In addition, the Company charged off $1 million related to one oil exploration and production credit.
For the six-months ended June 30, 2019, net charge-offs primarily related to one commercial loan relationship.
Substandard, Accruing Loans:
Prior to the quarter ended June 30, 2020, loans risk rated substandard or lower were considered impaired and evaluated on an individual basis. As of June 30, 2020, loans risk rated substandard and on accrual were evaluated collectively. The new approach provided a better estimate of potential losses inherent in the substandard portfolio. Substandard, accruing loans totaled $200 million at June 30, 2020.
Grade Migration:The below table provides the ratio of net charge-offs (recoveries) during the period to average loans outstanding based on our loan categories:
The Company downgraded $777 | | | | | | | | | | | | | | | | | | | | | | | | | | | | | |
| For the Quarter Ended(1) |
| March 31,
2021 | | December 31,
2020 | | September 30,
2020 | | June 30,
2020 | | March 31,
2020 |
| Commercial | 2.47 | % | | 2.07 | % | | 1.72 | % | | 0.03 | % | | 5.37 | % |
| Energy | — | | | 3.16 | | | — | | | 1.04 | | | 1.27 | |
| Commercial real estate | — | | | 0.53 | | | — | | | — | | | — | |
| Construction and land development | — | | | — | | | — | | | — | | | — | |
| Residential and multifamily real estate | — | | | (0.02) | | | 0.18 | | | 0.15 | | | — | |
| PPP | — | | | — | | | — | | | — | | | — | |
| Consumer | — | | | — | | | (0.09) | | | (0.01) | | | 0.93 | |
| Total net charge-offs to average loans | 0.74 | % | | 1.03 | % | | 0.54 | % | | 0.12 | % | | 2.00 | % |
(1) Interim periods annualized. |
Impact of Risk Rating and Loss Ratio Changes:
Loans risk rated “special mention” and “accruing, substandard” that are not TDRs declined $38 million of loans between December 31, 20192020 and June 30, 2020, including $731March 31, 2021 resulting in a $2 million indecrease to the second quarter of 2020, representing 17% of the loan portfolio. Downgrades primarily resulted from the COVID-19 pandemic, lower economic activity, and lower oil and gas prices. Loan categories significantly impactedrequired reserve. The decline was driven by downgrades aretwo commercial loans partially charged-off, discussed below.
Energy:
The increaseabove, totaling $28 million that were sold in supply realized during the first quarter and decreaseof 2021. In addition, several loan upgrades were made due to an improving economy.
The commercial loan portfolio saw increased charge-offs over the past several quarters. The charge-offs impacted the commercial loan historical loss factor that resulted in demand for oil and natural gas created byan $860 thousand increase to the COVID-19 pandemic placed considerable pricing volatility and uncertainty in the marketrequired reserve during the first quarter of 2020. As a result, a qualitative adjustment was made on the energy portfolio that increased the ALLL by $2 million from December 31, 2019 to March 31, 2020. The Company monitored borrowers’ reactions to the lower oil and gas prices during the second quarter of 2020. As a result, $239 million of energy loans were downgraded, including $85 million downgraded to substandard and accruing in the second quarter of 2020. The downgrades increased the ALLL by approximately $9 million during the second quarter of 2020. The downgrades were partially offset by removing energy’s qualitative factor added in the first quarter of 2020.
Depressed prices may continue to strain our customers’ cash flows, lower their liquidity, and decrease property values that could continue to create negative grade migration over the next several quarters. The length of the COVID-19 pandemic disruption and the pace of economic recovery will determine the severity of the grade migration and potential loss within the energy portfolio.
Commercial Real Estate (“CRE”):
The decline in economic activity in the first half of 2020 impacted our CRE borrowers. During the second quarter of 2020, the Company downgraded $300 million of commercial real estate loans, including $240 million downgraded to watch, within our pass rated loan category, and $22 million downgraded to substandard and accruing. The downgrades increased the ALLL by approximately $4 million during the second quarter of 2020. The remaining increase in the ALLL during the second quarter of 2020 was primarily the result of changes in impaired loan reserves and increases in quantitative and qualitative factors on pass-rated loans.
Commercial:
The decline in economic activity in the first half of 2020 significantly impacted supply and demand for products and services in the commercial portfolio. As a result, $35 million of commercial loans were downgraded in the first quarter of 2020. $170 million of loans were downgraded in the second quarter of 2020, including $41 million of loans listed as substandard and accruing. The downgrades increased the ALLL by approximately $3 million from December 31, 2019 to June 30, 2020. In addition, substandard, accruing loans evaluated on an individual basis at March 31, 2020 that were evaluated collectively at June 30, 2020, increased the ALLL by $3 million.2021.
Impaired Loans and Other Factors:
For the six months ended June 30,Impaired loans declined $13 million between December 31, 2020 the impairedand March 31, 2021, driven by an $8 million loan portfolio increasedupgraded due to an increase in capital that reduced the ALLL by $2$1 million after taking out the impactand a $5 million decline as a result of the charge-offs mentioned above. For the six months ended June 30, 2020, changes in qualitative and quantitative rates on pass rated loans increasedpayments made by several borrowers that reduced the ALLL by $5$1 million. The reduction in the ALLL was offset by an increase of $2 million due to declinesas a result of changes in economic activity and the COVID-19 pandemic.underlying collateral values.
Nonperforming Assets and Other Asset Quality Metrics
Nonperforming assets include:
i.Nonperforming (i) nonperforming loans - includes non-accrual loans, loans past due 90 days or more and still accruing interest, and loans modified under troubled debt restructurings (“TDRs”) that are not performing in accordance with their modified terms;
ii.Foreclosed (ii) foreclosed assets held for sale;
iii.Repossessed (iii) repossessed assets; and (iv) impaired securities.
iv.Impaired securities.Nonaccrual loans declined $12 million during the quarter ended March 31, 2021 primarily due to one commercial real estate loan that recapitalized its balance sheet and was placed back on accrual. In addition, several commercial borrowers were able to pay down a portion of the outstanding loan balance during the quarter ended March 31, 2021. Nonaccrual energy loans increased slightly between December 31, 2020 and March 31, 2021 as oil and natural gas borrowers struggled from the effects of low oil and gas prices over the past year. We anticipate improving credit metrics over the next quarter as the economy rebounds.
During 2020, nonaccrual loans increased primarily from energy loans that did not meet the criteria to be modified under the CARES Act and several loans impacted by the COVID-19 pandemic.
The table below summarizes our nonperforming assets and related ratios as of the dates indicated:
| | | | | | | | | | | | | | | | | | | | | | | | | | | | | |
| June 30,
2020 | | March 31,
2020 | | December 31,
2019 | | September 30,
2019 | | June 30,
2019 |
| (Dollars in thousands) | | | | | | | | |
| | | | | | | | | |
| | | | | | | | | |
| | | | | | | | | |
| | | | | | | | | |
| | | | | | | | | |
| | | | | | | | | |
| | | | | | | | | |
| | | | | | | | | |
| | | | | | | | | |
| Nonaccrual loans | $ | 37,534 | | | $ | 26,255 | | | $ | 39,675 | | | $ | 43,626 | | | $ | 50,044 | |
| | | | | | | | | |
| | | | | | | | | |
| | | | | | | | | |
| | | | | | | | | |
| | | | | | | | | |
| | | | | | | | | |
| | | | | | | | | |
| | | | | | | | | |
| | | | | | | | | |
| Loans past due 90 days or more and still accruing | 220 | | | — | | | 4,591 | | | 642 | | | 238 | |
| | | | | | | | | |
| | | | | | | | | |
| | | | | | | | | |
| | | | | | | | | |
| | | | | | | | | |
| | | | | | | | | |
| | | | | | | | | |
| | | | | | | | | |
| | | | | | | | | |
| | | | | | | | | |
| Total nonperforming loans | 37,754 | | | 26,255 | | | 44,266 | | | 44,268 | | | 50,282 | |
| Foreclosed assets held for sale | 2,502 | | | 3,619 | | | 3,619 | | | 2,471 | | | 2,471 | |
| | | | | | | | | |
| | | | | | | | | |
| Total nonperforming assets | $ | 40,256 | | | $ | 29,874 | | | $ | 47,885 | | | $ | 46,739 | | | $ | 52,753 | |
| Nonperforming assets to total assets | 0.74 | % | | 0.59 | % | | 0.97 | % | | 1.00 | % | | 1.18 | % |
| Nonperforming loans to total loans | 0.86 | % | | 0.66 | % | | 1.15 | % | | 1.22 | % | | 1.45 | % |
| | | | | | | | | |
| | | | | | | | | |
| | | | | | | | | |
| | | | | | | | | |
| | | | | | | | | |
| | | | | | | | | |
| | | | | | | | | |
Our nonaccrual loans increased $11 million during the second quarter of 2020 primarily from energy loans that did not meet the criteria to be modified under the CARES Act. Our nonperforming assets at June 30, 2020 decreased by $12 million, as compared to June 30, 2019 primarily related to an $18 million charge-off on a commercial loan that occurred in the first quarter of 2020. | | | | | | | | | | | | | | | | | | | | | | | | | | | | | |
| For the Quarter Ended |
| March 31,
2021 | | December 31,
2020 | | September 30,
2020 | | June 30,
2020 | | March 31,
2020 |
| (Dollars in thousands) |
| | | | | | | | | |
| | | | | | | | | |
| | | | | | | | | |
| | | | | | | | | |
| | | | | | | | | |
| | | | | | | | | |
| | | | | | | | | |
| | | | | | | | | |
| | | | | | | | | |
| Nonaccrual loans | $ | 63,319 | | | $ | 75,051 | | | $ | 75,560 | | | $ | 37,534 | | | $ | 26,255 | |
| | | | | | | | | |
| | | | | | | | | |
| | | | | | | | | |
| | | | | | | | | |
| | | | | | | | | |
| | | | | | | | | |
| | | | | | | | | |
| | | | | | | | | |
| | | | | | | | | |
| Loans past due 90 days or more and still accruing | 3,183 | | | 1,024 | | | 4,324 | | | 220 | | | — | |
| | | | | | | | | |
| | | | | | | | | |
| | | | | | | | | |
| | | | | | | | | |
| | | | | | | | | |
| | | | | | | | | |
| | | | | | | | | |
| | | | | | | | | |
| | | | | | | | | |
| | | | | | | | | |
| Total nonperforming loans | 66,502 | | | 76,075 | | | 79,884 | | | 37,754 | | | 26,255 | |
| Foreclosed assets held for sale | 2,347 | | | 2,347 | | | 2,349 | | | 2,502 | | | 3,619 | |
| | | | | | | | | |
| | | | | | | | | |
| Total nonperforming assets | $ | 68,849 | | | $ | 78,422 | | | $ | 82,233 | | | $ | 40,256 | | | $ | 29,874 | |
| ALLL to total loans | 1.65 | % | | 1.70 | % | | 1.70 | % | | 1.61 | % | | 1.29 | % |
| ALLL to nonaccrual loans | 117.74 | | | 100.33 | | | 100.63 | | | 189.66 | | | 195.99 | |
| ALLL to nonperforming loans | 112.10 | | | 98.98 | | | 95.18 | | | 188.55 | | | 195.99 | |
| Nonaccrual loans to total loans | 1.40 | | | 1.69 | | | 1.68 | | | 0.85 | | | 0.66 | |
| Nonperforming loans to total loans | 1.48 | | | 1.71 | | | 1.78 | | | 0.86 | | | 0.66 | |
| Nonperforming assets to total assets | 1.15 | % | | 1.39 | % | | 1.49 | % | | 0.74 | % | | 0.59 | % |
| | | | | | | | | |
| | | | | | | | | |
| | | | | | | | | |
| | | | | | | | | |
| | | | | | | | | |
| | | | | | | | | |
| | | | | | | | | |
| | | | | | | | | |
| | | | | | | | | |
Other asset quality metrics management reviews include loans past due 30 - 89 days and classified loans. The Company defines classified loans as loans categorized as substandard - performing, substandard - nonperforming, doubtful, or loss. The definitions of substandard, doubtful and loss are provided in “Note 4 - Loans and Allowance for Loan Losses” in the Notes to the Unaudited Consolidated Financial Statements. The following table summarizes our loans past due 30 - 89 days, classified assets and related ratios as of the dates indicated:
| | | June 30,
2020 | | March 31,
2020 | | December 31,
2019 | | September 30,
2019 | | June 30,
2019 | | March 31,
2021 | | December 31,
2020 | | September 30,
2020 | | June 30,
2020 | | March 31,
2020 |
| | (Dollars in thousands) | | | (Dollars in thousands) |
| Loan Past Due Detail | Loan Past Due Detail | | Loan Past Due Detail | |
| 30 - 59 days past due | 30 - 59 days past due | $ | 14,205 | | | $ | 12,934 | | | $ | 6,292 | | | $ | 61,941 | | | $ | 15,967 | | 30 - 59 days past due | $ | 10,583 | | | $ | 10,137 | | | $ | 15,324 | | | $ | 14,205 | | | $ | 12,934 | |
| 60 - 89 days past due | 60 - 89 days past due | 20,676 | | | 6,604 | | | 530 | | | 2,785 | | | 7,640 | | 60 - 89 days past due | 403 | | | 7,941 | | | 30,027 | | | 20,676 | | | 6,604 | |
| Total 30 - 89 days past due | Total 30 - 89 days past due | $ | 34,881 | | | $ | 19,538 | | | $ | 6,822 | | | $ | 64,726 | | | $ | 23,607 | | Total 30 - 89 days past due | $ | 10,986 | | | $ | 18,078 | | | $ | 45,351 | | | $ | 34,881 | | | $ | 19,538 | |
| Loans 30 - 89 days past due / gross loans | Loans 30 - 89 days past due / gross loans | 0.79 | % | | 0.49 | % | | 0.18 | % | | 1.78 | % | | 0.68 | % | Loans 30 - 89 days past due / gross loans | 0.24 | % | | 0.41 | % | | 1.01 | % | | 0.79 | % | | 0.49 | % |
| | Classified Loans | Classified Loans | | Classified Loans | |
| Substandard - performing | Substandard - performing | $ | 199,595 | | | $ | 80,876 | | | $ | 47,221 | | | $ | 41,546 | | | $ | 38,260 | | Substandard - performing | $ | 205,560 | | | $ | 211,008 | | | $ | 224,352 | | | $ | 199,595 | | | $ | 80,876 | |
| Substandard - nonperforming | Substandard - nonperforming | 29,030 | | | 19,555 | | | 34,192 | | | 37,990 | | | 40,930 | | Substandard - nonperforming | 57,967 | | | 70,734 | | | 67,765 | | | 29,030 | | | 19,555 | |
| Doubtful | Doubtful | 8,504 | | | 4,088 | | | 5,483 | | | 5,637 | | | 9,115 | | Doubtful | 5,352 | | | 4,315 | | | 7,794 | | | 8,504 | | | 4,088 | |
| Loss | Loss | — | | | — | | | — | | | — | | | — | | Loss | — | | | — | | | — | | | — | | | — | |
| Total classified loans | Total classified loans | 237,129 | | | 104,519 | | | 86,896 | | | 85,173 | | | 88,305 | | Total classified loans | 268,879 | | | 286,057 | | | 299,911 | | | 237,129 | | | 104,519 | |
| Foreclosed assets held for sale | Foreclosed assets held for sale | 2,502 | | | 3,619 | | | 3,619 | | | 2,471 | | | 2,471 | | Foreclosed assets held for sale | 2,347 | | | 2,347 | | | 2,349 | | | 2,502 | | | 3,619 | |
| Total classified assets | Total classified assets | $ | 239,631 | | | $ | 108,138 | | | $ | 90,515 | | | $ | 87,644 | | | $ | 90,776 | | Total classified assets | $ | 271,226 | | | $ | 288,404 | | | $ | 302,260 | | | $ | 239,631 | | | $ | 108,138 | |
| Classified loans / (total capital + ALLL) | Classified loans / (total capital + ALLL) | 34.9 | % | | 15.8 | % | | 13.2 | % | | 13.2 | % | | 16.3 | % | Classified loans / (total capital + ALLL) | 38.2 | % | | 40.9 | % | | 43.2 | % | | 34.9 | % | | 15.8 | % |
| Classified assets / (total capital + ALLL) | Classified assets / (total capital + ALLL) | 35.3 | % | | 16.3 | % | | 13.7 | % | | 13.6 | % | | 16.7 | % | Classified assets / (total capital + ALLL) | 38.6 | % | | 41.2 | % | | 43.6 | % | | 35.3 | % | | 16.3 | % |
| | |
During the quarter ended June 30, 2020,March 31, 2021, past due loans between 30 to 89 days increased $15 milliondeclined primarily driven by energy loans that were impacted by lower oil and gas prices during the first half of 2020. During the quarter ended March 31, 2020 the Company experienceddue to a $13 million increase in loans past due 30 to 89 days. The increase was primarily driven by two energy loans totaling $6 million that were impacted by lower oil and gas prices and a $3 million commercial real estate loan.loan that was recapitalized, which allowed the borrower to pay all past due amounts. Loans past due between 30 and 89 days at March 31, 2021 included a $6 million commercial loan and several smaller loans.
The Company's classified assets as of June 30, 2020 increased $149March 31, 2021 decreased $17 million or 165% since December 31, 2019.2020. The increasedecline was driven by $30 million of commercial and commercial real estate loans upgraded due to current economic conditions, including lower oilimprovements in the borrowers’ capital structure and gas prices that led to a $101$8 million in pay downs from classified loans, offset by an increase of approximately $21 million in substandarddowngraded loans, primarily from our energy loans and reduced economic activity that increased commercial substandard loans by $14 million.loan portfolio.
Potential problem loans consist of loans that are performing in accordance with contractual terms, but for which we have concerns about the borrower’s ability to comply with repayment terms and may result in disclosure as an impaired loan next quarter. At June 30, 2020, the Company had approximately $56 million of potential problem loans that were either criticized or a performing, substandard loan, The Company monitors these loans through communication with the borrower(s) and regular performance reviews. Although these loans are generally identified as potential problem loans, they may never become nonperforming.
Deposits and Other Borrowings
Deposits and other borrowings are used to support our asset growth. Our asset growth requires us to place a greater emphasis on both interest and non-interest-bearing deposits. Other borrowings supplement our core deposit strategy.The following table sets forth the maturity of time deposits as of March 31, 2021:
| | | | | | | | | | | | | | | | | | | | | | | | | | | | | |
| As of March 31, 2021 |
| Three Months or Less | | Three to Six Months | | Six to Twelve Months | | After Twelve Months | | Total |
| (Dollars in thousands) |
| Time deposits in excess of FDIC insurance limit | $ | 111,656 | | | $ | 103,081 | | | $ | 63,493 | | | $ | 44,464 | | | $ | 322,694 | |
| Time deposits below FDIC insurance limit | 198,577 | | | 141,545 | | | 145,496 | | | 123,479 | | | 609,097 | |
| Total | $ | 310,233 | | | $ | 244,626 | | | $ | 208,989 | | | $ | 167,943 | | | $ | 931,791 | |
At June 30, 2020,March 31, 2021, our deposits totaled $4$5 billion, an increase of $380$357 million or 10%8% from December 31, 2019.2020. Of this increase, $229$76 million came in the form ofwere noninterest-bearing deposits driven by $369and $392 million of PPP loans issued during the second quarter of 2020. In addition, customers transitioned from time deposits to savings and interest checking deposits due to the declining interest rate environment that resulted in a $79 million decline in time deposits and a $231 million increase inwere money market, NOW and savings deposits. Deposit increases were driven by a customer relationship that mobilized their workforce directly impacted by the COVID-19 pandemic. The increases were offset by a $112 million decrease in time deposits between December 31, 2020 to March 31, 2021 as a result of maturities and the current interest rate environment.
Other borrowings include repurchase agreements, fed funds purchased, FHLB advances, and our trust preferred security. At June 30, 2020,March 31, 2021, other borrowings totaled $501$287 million, a $127$9 million or 34% increase3% decrease from December 31, 20192020. The decline was driven by borrowings that matured and were not replaced during the quarter due to increased Company liquidity.
As of March 31, 2021, the Company had approximately $3 billion of uninsured deposits, which is an estimated amount based on the same methodologies and assumptions used for the bank’s regulatory requirements. The Company believes that its current capital ratios and liquidity are sufficient to mitigate the risks of uninsured deposits.
As of March 31, 2021, the Company had approximately $600 million of deposits with one customer relationship. The Company evaluated the deposit concentration and determined that a $136 million increase from June 30, 2019. The increase wassignificant reduction to these deposits would not adversely impact the result of asset growthCompany as sufficient liquidity is accessible and attractive short-term rates on FHLB advances.at favorable rates.
Liquidity
The Company’s liquidity strategy is to maintain adequate, but not excessive, liquidity to meet the daily cash flow needs of its clients while attempting to achieve adequate earnings for its stockholders. The liquidity position is monitored continuously by the Company’s finance department.
Liquidity resources can be derived from two sources: (i) on-balance sheet liquidity resources, which represent funds currently on the balance sheet and (ii) off-balance sheet liquidity resources, which represent funds available from third partythird-party sources. Our on-balance sheet and off-balance sheet liquidity resources consisted of the following:following as of the dates indicated:
| | | June 30, 2020 | | December 31, 2019 | | March 31, 2021 | | December 31, 2020 |
| | (Dollars in thousands) | | | (Dollars in thousands) |
| | Total on-balance sheet liquidity | Total on-balance sheet liquidity | $ | 839,821 | | | $ | 888,080 | | Total on-balance sheet liquidity | $ | 1,304,002 | | | $ | 1,046,110 | |
| | Total off-balance sheet liquidity | Total off-balance sheet liquidity | 571,252 | | | 524,332 | | Total off-balance sheet liquidity | 748,177 | | | 756,325 | |
| Total liquidity | Total liquidity | $ | 1,411,073 | | | $ | 1,412,412 | | Total liquidity | $ | 2,052,179 | | | $ | 1,802,435 | |
| On-balance sheet liquidity as a percent of assets | On-balance sheet liquidity as a percent of assets | 15 | % | | 18 | % | On-balance sheet liquidity as a percent of assets | 22 | % | | 19 | % |
| Total liquidity as a percent of assets | Total liquidity as a percent of assets | 26 | % | | 29 | % | Total liquidity as a percent of assets | 34 | % | | 32 | % |
The Company believes that its current liquidity will be sufficient to meet anticipated cash requirements for the next 12 months.
Contractual Obligations
In the first quarter of 2021, the Company entered into an agreement with a third-party, venture capital firm. The Company will invest up to $3 million into the venture capital fund. The fund was designed to invest in companies that solve problems for community banks and help accelerate technology adoption for community banks.
Contractual Obligations
The following table presentsRefer to “Note 6: Time Deposits and Borrowings” within the Notes to the Unaudited Consolidated Financial Statements for our significant contractual cash obligations to third parties, debt andparties. In addition, the Company has various lease agreements with approximately $30 million of future minimum lease payments at March 31, 2021.
Contractual obligations may be satisfied through our on-balance sheet and service obligations as of June 30, 2020 and December 31, 2019:
| | | | | | | | | | | | | | | | | | | | | | | | | | | | | | | |
| | | June 30, 2020 | | | | | | | | |
| | | Payments Due by Period | | | | | | | | |
| | | Less than
1 Year | | 1 to 2
Years | | 2 to 5
Years | | More than
5 Years | | Total |
| | | (Dollars in thousands) | | | | | | | | |
| Time deposits | | | $ | 932,443 | | | $ | 97,992 | | | $ | 129,940 | | | $ | 166 | | | $ | 1,160,541 | |
| | | | | | | | | | | |
| | | | | | | | | | | |
| Fed funds purchased & repurchase agreements | | | 49,881 | | | — | | | — | | | — | | | 49,881 | |
| FHLB advances and line of credit | | | 163,000 | | | 21,500 | | | 51,117 | | | 215,000 | | | 450,617 | |
| | | | | | | | | | | |
| Trust preferred security | | | — | | | — | | | — | | | 2,500 | | | 2,500 | |
| Operating leases | | | 1,638 | | | 1,588 | | | 4,370 | | | 5,525 | | | 13,121 | |
| Total | | | $ | 1,146,962 | | | $ | 121,080 | | | $ | 185,427 | | | $ | 223,191 | | | $ | 1,676,660 | |
| | | | | | | | | | | | | | | | | | | | | | | | | | | | | | | |
| | | December 31, 2019 | | | | | | | | |
| | | Payments Due by Period | | | | | | | | |
| | | Less than
1 Year | | 1 to 2
Years | | 2 to 5
Years | | More than
5 Years | | Total |
| | | (Dollars in thousands) | | | | | | | | |
| Time deposits | | | $ | 925,239 | | | $ | 152,979 | | | $ | 161,528 | | | $ | — | | | $ | 1,239,746 | |
| | | | | | | | | | | |
| | | | | | | | | | | |
| Fed funds purchased & repurchase agreements | | | 14,921 | | | — | | | — | | | — | | | 14,921 | |
| FHLB advances and line of credit | | | 45,000 | | | 51,500 | | | 56,143 | | | 206,100 | | | 358,743 | |
| | | | | | | | | | | |
| Trust preferred security | | | — | | | — | | | — | | | 2,500 | | | 2,500 | |
| Operating leases | | | 1,796 | | | 1,572 | | | 4,528 | | | 6,162 | | | 14,058 | |
| Total | | | $ | 986,956 | | | $ | 206,051 | | | $ | 222,199 | | | $ | 214,762 | | | $ | 1,629,968 | |
Capital Resources and Off-Balance Sheet Arrangements
The Company and the Bank are subject to various regulatory capital requirements administered by the federal banking agencies. The regulatory capital requirements involve quantitative measures of the Company’s assets, liabilities, select off-balance sheet items and equity. Failure to meet minimum capital requirements can initiate certain mandatory and possibly additional discretionary actions by regulators that, if undertaken, could have a direct material effect on the Company’s consolidated financial statements. Refer to “Note 8: Regulatory Matters” in the Notes to the Unaudited Consolidated Financial Statements for additional information. Management believes that as of June 30, 2020,March 31, 2021, the Company and the Bankbank met all capital adequacy requirements to which they are subject. For additional information, see “Note 9 - Regulatory Matters” in the notes to unaudited consolidated financial statements.
The Company is subject to off-balance sheet risk in the normal course of business to meet the needs of its clients that have, or are reasonably likely to have, a current or future effect on our financial condition, changes in financial condition, revenues or expenses, results of operations, liquidity, capital expenditures or capital resources. These off-balance sheet arrangements include commitmentsRefer to fund loans, standby letters of credit,“Note 12: Commitments and previously disclosed future lease obligationsCredit Risk” in Kansas City, Missouri and Frisco, Texas.
The following isthe Notes to Unaudited Consolidated Financial Statements for a summarybreakout of our off-balance sheet commitments asarrangements. As of March 31, 2021, the dates presented:
| | | | | | | | | | | | | | |
| | June 30, 2020 | | December 31, 2019 |
| | (Dollars in thousands) | | |
| Commitments to fund commercial loans | | $ | 592,051 | | | $ | 602,456 | |
| Other loan commitments | | 812,386 | | | 884,069 | |
| Standby letters of credit | | 38,342 | | | 39,035 | |
| Lease agreements | | 17,205 | | | 20,935 | |
| Total | | $ | 1,459,984 | | | $ | 1,546,495 | |
| | | | |
| | | | |
Critical Accounting Policies and Estimates
The Company identified several accounting policies that are critical to an understanding of our financial condition and results of operations. In addition, theseThese policies require difficult, subjective or complex judgments and assumptions that create potential sensitivity of our financial statements to those judgments and assumptions. These policies relate to the allowance for loan and lease losses, investment securities impairment, deferred tax assets, and the fair value of financial instruments. A discussion of these policies can be found in the section captioned “Critical Accounting Policies and Estimates” in Management’s Discussion and Analysis of Financial Condition and Results of Operations included in the 20192020 Form 10-K.
During the first quarter of 2020, the Company adopted ASU 2017-04: Intangibles—Goodwill and Other (Topic 350): Simplifying the Test for Goodwill Impairment. The ASU simplified the methodology to calculate goodwill impairment by removing a second step required under the old method to determine if goodwill was impaired. The Company believed the updated methodology significantly reduced the complexity to calculate goodwill impairment during the second quarter of 2020 when goodwill was fully impaired.
The CARES Act allows financial institutions to elect not to consider whether loan modifications relating to the COVID-19 pandemic that they make between March 1, 2020 and the earlier of December 31, 2020 or 60 days after the national emergency related to the COVID-19 pandemic ends are TDRs that would require additional disclosures. The relief can be applied to modifications of loans to borrowers that were not more than 30 days past due as of December 31, 2019. The Company elected to apply the guidance during the first quarter of 2020. The review of loans that meet the criteria is overseen by the Office of the Chief Credit Officer.
Besides the accounting policy changes mentioned above, thereThere have been no additional changes in the Company’s application of critical accounting policies since December 31, 2019.2020.
Recent Accounting Pronouncements
The Company provided the following updatesRefer to recent accounting pronouncements since December 31, 2019. For additional information on accounting pronouncements, see Note 1 -“Note 1: Nature of Operations and Summary of Significant Accounting Policies. A complete list of recent, applicable accounting pronouncements was providedPolicies” included in the Company’s 2019 form 10-K.
ASU 2016-13, Financial Instruments - Credit Losses - The Company established a committee of individuals from applicable departments to oversee the implementation process. The committee chose a third-party software solution and in the third quarter of 2019, the Company completed the software implementation phase of the transition. The software implementation phase included data capture and portfolio segmentation amongst other items. During the first quarter of 2020, the Company adjusted the underlying assumptions in the model. The Company continued quarterly parallel runs to determine the appropriateness of the factors used and the potential impact on the ALLL. At this time an estimate of the impactNotes to the Company’s financial statements is not known, but the impact could be significantly affected by the composition, characteristics and quality of the underlying loan portfolio at the time of adoption.
ASU 2016-02, Leases (Topic 842) - The Company plans to apply the update as of the beginning of the period of adoption and is not planning to restate comparative periods. The Company expects to elect certain optional practical expedients. The Company gathered all potential lease and embedded lease agreements and is evaluating the applicability and impact to the financial statements. Current operating leases relate primarily to four branch locations and one future lease obligation. Based on these current leases, the Company anticipates recognizing a lease liability and related right-to-use asset on our balance sheet, with an immaterial impact on the income statement compared to the current lease accounting model. However, the ultimate impact of the standard will depend on the Company’s lease portfolio as of the adoption date.
GAAP Reconciliation and Management Explanation of Non-GAAPUnaudited Consolidated Financial Measures
Non-GAAP financial measures are used by management to evaluate our performance. The non-GAAP financial measures that we discuss should not be consideredStatements included elsewhere in isolation or as a substitute for the most directly comparable financial measures calculated in accordance with GAAP. Moreover, the way we calculate these non-GAAP financial measures may differ from that of other companies reporting measures with similar names.
Non-GAAP Core Operating Income (Loss):
We calculate “non-GAAP core operating income (loss)” as net income (loss) adjusted to remove non-recurring or non-core income and expense items related to:
•Impairment charges associated with two buildings that were held-for-sale - We acquired a larger corporate headquarters to accommodate our business needs that eliminated the need for two smaller support buildings. The two smaller support buildings had been acquired recently and were extensively remodeled, which resulted in a difference between book and market value for those assets. We sold one of the buildings in 2018 and the other in the second quarter of 2019.
•State tax credits - As a result of the purchase and improvement of our new corporate headquarters we received state tax credits.
•Goodwill impairment - We performed an interim review of goodwill as of June 30, 2020. The book value of goodwill exceeded its fair market value and resulted in a full $7 million impairment.
The most directly comparable GAAP financial measure for non-GAAP core operating income (loss) is net income.
Non-GAAP Core Operating Return on Average Assets:
We calculate “non-GAAP core operating return on average assets” as non-GAAP core operating income (as defined above) divided by average assets. The most directly comparable GAAP financial measure is return on average assets, which is calculated as net income divided by average assets.
Non-GAAP Core Operating Return on Average Common Equity:
We calculate “non-GAAP core operating return on average common equity” as non-GAAP core operating income (loss) (defined above) less preferred dividends divided by average common equity. The most directly comparable GAAP financial measure is return on average common equity, which is calculated as net income (loss) less preferred dividends divided by average common equity.
Non-GAAP Core Operating Efficiency Ratio - Fully Tax Equivalent:
We calculate “non-GAAP core operating efficiency ratio - fully tax equivalent” as non-interest expense adjusted to remove non-recurring non-interest expenses as defined under non-GAAP core operating income (loss) divided by net interest income on a fully tax-equivalent basis plus non-interest income adjusted to remove non-recurring non-interest income or expense items as defined under non-GAAP core operating income (loss). The most directly comparable GAAP financial measure is the efficiency ratio.
Management believes that non-GAAP core operating income (loss), non-GAAP core operating return on average assets, non-GAAP core operating return on average common equity and non-GAAP core operating efficiency ratio -fully tax equivalent remove events that are not recurring or not part of core business activities and are useful analytical tools for investors to compare periods excluding these non-recurring or non-core income and charges.
The following table reconciles, as of the dates set forth below, net income to non-GAAP core operating income, non-GAAP core operating return on average assets, non-GAAP core operating return on average equity and non-GAAP core operating efficiency ratio:
| | | | | | | | | | | | | | | | | | | | | | | | | | | | | | | | | | | | | | | | | |
| Three Months Ended | | | | | | | | | | Six Months Ended | | |
| June | | March | | December | | September | | June | | June | | June |
| 30, | | 31, | | 31, | | 30, | | 30, | | 30, | | 30, |
| 2020 | | 2020 | | 2019 | | 2019 | | 2019 | | 2020 | | 2019 |
| (Dollars in thousands) | | | | | | | | | | | | |
| Non-GAAP core operating income (loss): | | | | | | | | | | | | | |
| Net income (loss) | $ | (7,356) | | | 3,857 | | | (700) | | | 10,384 | | | 9,439 | | | $ | (3,499) | | | $ | 18,789 | |
| | | | | | | | | | | | | |
| | | | | | | | | | | | | |
| | | | | | | | | | | | | |
| Add: fixed asset impairments | — | | | — | | | — | | | — | | | 424 | | | — | | | 424 | |
Less: tax effect(1) | — | | | — | | | — | | | — | | | 109 | | | — | | | 109 | |
| Fixed asset impairments, net of tax | — | | | — | | | — | | | — | | | 315 | | | — | | | 315 | |
Add: Goodwill impairment(2) | 7,397 | | | — | | | — | | | — | | | — | | | 7,397 | | | — | |
Add: state tax credit(2) | — | | | — | | | — | | | — | | | — | | | — | | | (1,361) | |
| Non-GAAP core operating income (loss) | $ | 41 | | | $ | 3,857 | | | $ | (700) | | | $ | 10,384 | | | $ | 9,754 | | | $ | 3,898 | | | $ | 17,743 | |
(1) Represents the tax impact of the adjustments above at a tax rate of 25.73%. | | | | | | | | | | | | | |
(2) No tax effect. | | | | | | | | | | | | | |
| | | | | | | | | | | | | |
| | | | | | | | | | | | | |
| | | | | | | | | | | | | |
| | | | | | | | | | | | | |
| | | | | | | | | | | | | |
| | | | | | | | | | | | | |
| | | | | | | | | | | | | |
| | | | | | | | | | | | | |
| | | | | | | | | | | | | |
| | | | | | | | | | | | | |
| | | | | | | | | | | | | |
| | | | | | | | | | | | | |
| | | | | | | | | | | | | |
| | | | | | | | | | | | | | | | | | | | | | | | | | | | | | | | | | | | | | | | | |
| Three Months Ended | | | | | | | | | | Six Months Ended | | |
| June | | March | | December | | September | | June | | | | |
| 30, | | 31, | | 31, | | 30, | | 30, | | June 30, | | |
| 2020 | | 2020 | | 2019 | | 2019 | | 2019 | | 2020 | | 2019 |
| (Dollars in thousands) | | | | | | | | | | | | |
| Non-GAAP core operating return on average assets: | | | | | | | | | | | | | |
| Net income (loss) | $ | (7,356) | | | $ | 3,857 | | | $ | (700) | | | $ | 10,384 | | | $ | 9,439 | | | $ | (3,499) | | | $ | 18,789 | |
| Non-GAAP core operating income | 41 | | | 3,857 | | | (700) | | | 10,384 | | | 9,754 | | | 3,898 | | | 17,743 | |
| Average assets | $ | 5,441,513 | | | $ | 4,975,531 | | | $ | 4,809,579 | | | $ | 4,610,958 | | | $ | 4,402,002 | | | $ | 5,209,810 | | | $ | 4,285,768 | |
| Return on average assets | (0.54) | % | | 0.31 | % | | (0.06) | % | | 0.89 | % | | 0.86 | % | | (0.14) | % | | 0.88 | % |
| Non-GAAP core operating return on average assets | 0.00 | % | | 0.31 | % | | (0.06) | % | | 0.89 | % | | 0.89 | % | | 0.15 | % | | 0.83 | % |
| | | | | | | | | | | | | |
| Non-GAAP core operating return on average common equity: | | | | | | | | | | | | | |
| Net income (loss) | $ | (7,356) | | | $ | 3,857 | | | $ | (700) | | | $ | 10,384 | | | $ | 9,439 | | | $ | (3,499) | | | $ | 18,789 | |
| Non-GAAP core operating income | 41 | | | 3,857 | | | (700) | | | 10,384 | | | 9,754 | | | $ | 3,898 | | | $ | 17,743 | |
| Less: preferred dividends | — | | | — | | | — | | | — | | | — | | | — | | | 175 | |
| Net income (loss) available to common stockholders | (7,356) | | | 3,857 | | | (700) | | | 10,384 | | | 9,439 | | | (3,499) | | | 18,614 | |
| Non-GAAP core operating income available to common stockholders | 41 | | | 3,857 | | | (700) | | | 10,384 | | | 9,754 | | | 3,898 | | | 17,568 | |
| Average common equity | $ | 611,466 | | | $ | 612,959 | | | $ | 605,960 | | | $ | 543,827 | | | $ | 486,880 | | | $ | 612,208 | | | $ | 476,749 | |
| Return on average equity | (4.84) | % | | 2.53 | % | | (0.46) | % | | 7.58 | % | | 7.78 | % | | (1.15) | % | | 7.87 | % |
| Non-GAAP core operating return on average common equity | 0.03 | % | | 2.53 | % | | (0.46) | % | | 7.58 | % | | 8.04 | % | | 1.28 | % | | 7.43 | % |
| | | | | | | | | | | | | | | | | | | | | | | | | | | | | | | | | | | | | | | | | |
| Three Months Ended | | | | | | | | | | Six Months Ended | | |
| June | | March | | December | | September | | June | | | | |
| 30, | | 31, | | 31, | | 30, | | 30, | | June 30, | | |
| 2020 | | 2020 | | 2019 | | 2019 | | 2019 | | 2020 | | 2019 |
| (Dollars in thousands) | | | | | | | | | | | | |
| Non-GAAP core operating efficiency ratio - fully tax equivalent | | | | | | | | | | | | | |
| Non-interest expense | $ | 31,010 | | | $ | 22,223 | | | $ | 21,885 | | | $ | 21,172 | | | $ | 21,960 | | | $ | 53,233 | | | $ | 44,591 | |
| Less: goodwill impairment | 7,397 | | | — | | | — | | | — | | | — | | | 7,397 | | | — | |
| Adjusted Non-interest expense (numerator) | 23,613 | | | 22,223 | | | 21,885 | | | 21,172 | | | 21,960 | | | 45,836 | | | 44,591 | |
| Net interest income | 41,157 | | | 38,228 | | | 37,179 | | | 35,786 | | | 34,874 | | | 79,385 | | | 68,479 | |
Tax-equivalent interest income(1) | 685 | | | 695 | | | 670 | | | 624 | | | 613 | | | 1,380 | | | 1,229 | |
| | | | | | | | | | | | | |
| | | | | | | | | | | | | |
| Non-interest income | 2,634 | | | 2,095 | | | 2,186 | | | 3,212 | | | 1,672 | | | 4,729 | | | 3,317 | |
| Add: fixed asset impairments | — | | | — | | | — | | | — | | | 424 | | | — | | | 424 | |
| Non-GAAP operating revenue (denominator) | $ | 44,476 | | | $ | 41,018 | | | $ | 40,035 | | | $ | 39,622 | | | $ | 37,583 | | | $ | 85,494 | | | $ | 73,449 | |
| Efficiency ratio | 70.81 | % | | 55.11 | % | | 55.60 | % | | 54.29 | % | | 60.09 | % | | 63.29 | % | | 62.11 | % |
| Non-GAAP core operating efficiency ratio - fully tax equivalent | 53.09 | % | | 54.18 | % | | 54.66 | % | | 53.43 | % | | 58.43 | % | | 53.61 | % | | 60.71 | % |
(1) Tax exempt income (tax-free municipal securities) is calculated on a tax equivalent basis. The incremental tax rate used is 21.0%. | | | | | | | | | | | | | |
| | | | | | | | | | | | | |
| | | | | | | | | | | | | |
| | | | | | | | | | | | | |
Tangible Common Stockholders’ Equity:
We calculate “tangible common stockholders’ equity” as total stockholders’ equity less goodwill and other intangible assets and preferred stock. The most directly comparable GAAP financial measure is total stockholders’ equity.
We calculate “tangible book value per share” as tangible common stockholders’ equity divided by the number of shares of our common stock outstanding at the end of the relevant period. The most directly comparable GAAP financial measure is book value per share.
Management believes that tangible stockholders’ equity and tangible book value per share are important to many investors in the marketplace who are interested in changes from period to period in our stockholders’ equity, exclusive of changes in intangible assets.
The following table reconciles, as of the dates set forth below, total stockholders’ equity to tangible stockholders’ equity and presents tangible book value per share compared to book value per share:
| | | | | | | | | | | | | | | | | | | | | | | | | | | | | |
| Period Ended | | | | | | | | |
| June | | March | | December | | September | | June |
| 30, | | 31, | | 31, | | 30, | | 30, |
| 2020 | | 2020 | | 2019 | | 2019 | | 2019 |
| (Dollars in thousands except per share data) | | | | | | | | |
| Tangible common stockholders’ equity: | | | | | | | | | |
| Stockholders’ equity | $ | 608,092 | | | $ | 611,946 | | | $ | 601,644 | | | $ | 602,435 | | | $ | 499,195 | |
| Less: goodwill and other intangible assets | 247 | | | 7,669 | | | 7,694 | | | 7,720 | | | 7,745 | |
| | | | | | | | | |
| Tangible common stockholders’ equity | $ | 607,845 | | | $ | 604,277 | | | $ | 593,950 | | | $ | 594,715 | | | $ | 491,450 | |
| Tangible book value per share: | | | | | | | | | |
| Tangible common stockholders’ equity | $ | 607,845 | | | $ | 604,277 | | | $ | 593,950 | | | $ | 594,715 | | | $ | 491,450 | |
| Shares outstanding at end of period | 52,167,573 | | | 52,098,062 | | | 51,969,203 | | | 51,969,203 | | | 45,367,641 | |
| Book value per share | $ | 11.66 | | | $ | 11.75 | | | $ | 11.58 | | | $ | 11.59 | | | $ | 11.00 | |
| Tangible book value per share | $ | 11.65 | | | $ | 11.60 | | | $ | 11.43 | | | $ | 11.44 | | | $ | 10.83 | |
ITEM 3. QUANTITATIVE AND QUALITATIVE DISCLOSURES ABOUT MARKET RISK
Interest Rate Risk
A primary component of market risk is interest rate volatility. Managing interestInterest rate risk management is a key element of the Company’s balance sheet management. Interest rate risk is the risk that net interest marginNIM will erode over time due to changing market conditions. Many factors can cause margins to erode: (i) lower loan demand; (ii) increased competition for funds; (iii) weak pricing policies; (iv) balance sheet mismatchesmismatches; and (v) changing liquidity demands. The objective is to maximize income while minimizing interest rate risk. The Company manages its sensitivity position using its interest rate risk policy. The management of interest rate risk is a three-step process and involves: (i) measuring the interest rate risk position; (ii) policy constraints; and (iii) strategic review and implementation.
Our exposure to interest rate risk is managed by the Funds Management Committee (“FMC”) of the Bank’s board of directors in accordance with its policies.. The FMC uses a combination of three systems to measure the balance sheet’s interest rate risk position. Because each system serves a different purpose and provides a different perspective, theThe three systems in combination are expected to provide a better overall result than a single system alone. The three systems include: (i) gap reports; (ii) earnings simulation; and (iii) economic value of equity. The FMC’s primary tools to change the interest rate risk position are: (i) investment portfolio duration; (ii) deposit and borrowing mix; and (iii) on balance sheet derivatives.
The FMC evaluates interest rate risk using a rate shock method and rate ramp method. In a rate shock analysis, rates change immediately and the change is sustained over the time horizon. In a rate ramp analysis, rate changes occur gradually over time. The following tables summarize the simulated changes in net interest income and fair value of equity over a 12-month horizon using a rate shock and rate ramp method as of the dates indicated:
| | | | | | | | | | | | | | | | | | | | | | | |
| Hypothetical Change in Interest Rate - Rate Shock | | | | | | | |
| June 30, 2020 | | | | June 30, 2019 | | |
Change in Interest Rate
(Basis Points) | Percent change in net interest income | | Percent change in fair value of equity | | Percent change in net interest income | | Percent change in fair value of equity |
| +300 | 2.9 | % | | (7.5) | % | | 13.4 | % | | (3.7) | % |
| +200 | 2.2 | | | (3.1) | | | 9.5 | | | (0.1) | |
| +100 | 1.1 | | | (0.6) | | | 5.3 | | | 1.2 | |
| Base | — | % | | — | % | | — | | | — | |
| -100 | NA(1) | | NA(1) | | (5.9) | | | (1.0) | |
| -200 | NA(1) | | NA(1) | | (11.0) | % | | 0.9 | % |
(1) The Company decided to exclude the down rate environment from its analysis for the period ended June 30, 2020 due to the already low interest rate environment. | | | | | | | |
| | | | | | | | | | | | | | | | | | | | | | | |
| Hypothetical Change in Interest Rate - Rate Shock |
| March 31, 2021 | | March 31, 2020 |
Change in Interest Rate
(Basis Points) | Percent change in net interest income | | Percent change in fair value of equity | | Percent change in net interest income | | Percent change in fair value of equity |
| +300 | 0.7 | % | | (12.2) | % | | 8.1 | % | | (4.5) | % |
| +200 | (0.1) | | | (7.5) | | | 5.7 | | | (0.7) | |
| +100 | (0.6) | | | (3.6) | | | 2.9 | | | 1.2 | |
| Base | — | % | | — | % | | — | % | | — | % |
| -100 | NA(1) | | NA(1) | | NA(1) | | NA(1) |
| -200 | NA(1) | | NA(1) | | NA(1) | | NA(1) |
(1) The Company decided to exclude the down rate environment from its analysis due to the already low interest rate environment. |
| | Hypothetical Change in Interest Rate - Rate Ramp | Hypothetical Change in Interest Rate - Rate Ramp | | Hypothetical Change in Interest Rate - Rate Ramp | |
| | June 30, 2020 | | | June 30, 2019 | | | March 31, 2021 | | | March 31, 2020 | |
Change in Interest Rate
(Basis Points) | Change in Interest Rate
(Basis Points) | Percent change in net interest income | | | Percent change in net interest income | | Change in Interest Rate
(Basis Points) | Percent change in net interest income | | | Percent change in net interest income | |
| +300 | +300 | 1.7 | % | | | 7.5 | % | | +300 | 0.3 | % | | | 4.8 | % | |
| +200 | +200 | 1.1 | | | | 5.2 | | | +200 | (0.2) | | | | 3.2 | | |
| +100 | +100 | 0.6 | | | | 2.7 | | | +100 | (0.4) | | | | 1.6 | | |
| Base | Base | — | | | | — | | | Base | — | | | | — | | |
| -100 | -100 | NA(1) | | | (3.0) | | | -100 | NA(1) | | | NA(1) | |
| -200 | -200 | NA(1) | | | (5.8) | % | | -200 | NA(1) | | | NA(1) | |
(1) The Company decided to exclude the down rate environment from its analysis for the period ended June 30, 2020 due to the already low interest rate environment. | | |
(1) The Company decided to exclude the down rate environment from its analysis due to the already low interest rate environment. | | (1) The Company decided to exclude the down rate environment from its analysis due to the already low interest rate environment. |
The Company’s position is relatively neutral as of March 31, 2021. The hypothetical change in net interest income as of June 30, 2020March 31, 2021 in an up 100 and 200 basis point shock is mainly due to approximately 67%floors on variable rate loans that limit interest income growth as rates start to rise and the number of fixed-rate PPP loans outstanding. In addition, the Company reduced wholesale deposits and time deposits to lower interest rate sensitivity in the current low rate environment. As a result, our interest-bearing liabilities reprice faster than our earning assets repricing or maturing over the next 12 months. Loans remain the largest portion of our adjustable earning assets, as the mix of adjustable loans or loans maturing in one year or less to total loans was 70%.an up 100 and 200 basis point rate environment. The amount of adjustable loans causes the Company to seeFMC has several options available, including an increase in fixed-rate deposits and using on balance sheet derivatives, that could reduce the short-term, negative impact of a rising interest rate environment. The Company expects that forgiveness of our PPP loans over the near term may improve net interest income in a rising rate environment.if rates were to increase. Approximately 67% of the Company’s earning assets reprice or mature over the new 12 months.
The models the Company uses include assumptions regarding interest rates while balances remain unchanged. These assumptions are inherently uncertain and, as a result, the model cannot precisely estimate net interest income or precisely predict the impact of higher or lower interest rates on net interest income. Actual results will differ from simulated results due to timing, magnitude and frequency of interest rate changes as well as changes in market conditions, customer behavior and management strategies, among other factors.
ITEM 4. CONTROLS AND PROCEDURES
Evaluation of Disclosure Controls and Procedures
The Company’s management, with the participation of the Company’s Chief Executive Officer and Chief Financial Officer, has evaluated the effectiveness of the Company’s disclosure controls and procedures (as defined in Rule 13a-15(e) under the Securities Exchange Act of 1934 (“Exchange Act”)) as of June 30, 2020.March 31, 2021. Based on that evaluation, the Company’s Chief Executive Officer and Chief Financial Officer concluded that the Company’s disclosure controls and procedures were effective as of June 30, 2020.
Changes in Internal Control over Financial Reporting
There was no change in the Company’s internal control over financial reporting (as such term is defined in Rule 13a-15(f) under the Exchange Act) that occurred during the secondfirst quarter of 20202021 that has materially affected, or is reasonably likely to materially affect, the Company’s internal control over financial reporting.
PART II - OTHER INFORMATION
ITEM 1. LEGAL PROCEEDINGS
In the normal course of business, we are named or threatened to be named as a defendant in various lawsuits. Management, following consultation with legal counsel, does not expect the ultimate disposition of any or a combination of these matters to have a material adverse effect on our business, financial condition, results of operations, cash flows or growth prospects. However, given the nature, scope and complexity of the extensive legal and regulatory landscape applicable to our business (including laws and regulations governing consumer protection, fair lending, fair labor, privacy, information security and anti-money laundering and anti-terrorism laws), we, like all banking organizations, are subject to heightened legal and regulatory compliance and litigation risk.
ITEM 1A. RISK FACTORS
In addition to the other information set forth in this report, you should carefully consider the factors discussed in Part I, "Item 1A. Risk Factors" in our 2020 Form 10-K, which could materially affect our business, financial condition or results of operations in future periods. There have beenwere no material changes tofrom the risk factors associated with our business previously disclosed in Item 1A - “Risk Factor” in our Quarterly Report onthe 2020 Form 10-Q for the fiscal quarter ended March 31, 2020 filed with the SEC on May 14, 2020.10-K.
ITEM 2. UNREGISTERED SALES OF EQUITY SECURITIES AND USE OF PROCEEDS
NoneShare Repurchase Program
| | | | | | | | | | | | | | | | | | | | | | | | | | |
| Calendar Month | | Total Number of Shares Repurchased | | Average Price Paid per Share | | Total Number of Shares Purchased as Part of Publicly Announced Plans or Programs | | Approximate Dollar Value of Shares that may yet be Purchased as Part of Publicly Announced Plans or Programs |
| January 1 - 31 | | 52,855 | | | $ | 10.84 | | | 52,855 | | | $ | 13,382,774 | |
| February 1 - 28 | | — | | | $ | — | | | — | | | $ | 13,382,774 | |
| March 1 - 31 | | 35,642 | | | $ | 13.38 | | | 35,642 | | | $ | 12,905,314 | |
| Total | | 88,497 | | | $ | 11.87 | | | 88,497 | | | |
ITEM 3. DEFAULTS UPON SENIOR SECURITIES
None.
ITEM 4. MINE SAFETY DISCLOSURES
Not applicable.
ITEM 5. OTHER INFORMATION
NoneOn October 20, 2020, the Company announced that its Board of Directors approved a share repurchase program under which the Company may repurchase up to $20 million of its common stock. Repurchases under the program may be made in open market or privately negotiated transactions in compliance with SEC Rule 10b-18, subject to market conditions, applicable legal requirements and other relevant factors. The program does not obligate the Company to acquire any particular amount of common stock, and it may be suspended at any time at the Company's discretion. No time limit has been set for completion of the program.
ITEM 6. EXHIBITS
| | | | | | | | | | | | | | |
| | | | | | | | |
| Exhibit Number | | Exhibit Description | | | | | | |
| | | | | | | | |
| | | | | | | | |
| | | | | | | | |
| | | | | | | | |
| | | | | | | | |
| | | | | | | | |
| | | | | | | | |
| | | | | | | | |
| | | | | | | | |
| | | | | | | | |
| 101.INS* | | XBRL Instance Document - the instance document does not appear in the Interactive Data File because its XBRL tags are embedded within the Inline XBRL document | | | | | | |
| 101.SCH* | | XBRL Taxonomy Extension Schema Document | | | | | | |
| 101.CAL* | | XBRL Taxonomy Extension Calculation Linkbase Document | | | | | | |
| 101.DEF* | | XBRL Taxonomy Extension Definition Linkbase Document | | | | | | |
| 101.LAB* | | XBRL Taxonomy Extension Label Linkbase Document | | | | | | |
| 101.PRE* | | XBRL Taxonomy Extension Presentation Linkbase Document | | | | | | |
| 104* | | Cover Page Interactive Data File (formation in Inline XBRL and contained in Exhibit 101) | | | | | | |
* Filed Herewith
** Furnished Herewith
† Indicates a compensatory Plan
SIGNATURE
Pursuant to the requirements of the Securities Exchange Act of 1934, the Registrant has duly caused this report to be signed on its behalf by the undersigned thereunto duly authorized.
| | | | | | | | | | | | | | | | | | | | |
| | | | | | | | CrossFirst Bankshares Inc. |
| | | | | | | | |
August 12, 2020May 6, 2021 | | | | | | | | /s/ David L. O’Toole |
| | | | | | | | | David L. O’Toole |
| | | | | | | | | Chief Financial Officer |
| | | | | | | | | (Principal Financial Officer and Principal Accounting Officer) |
| | | | | | | | | |