UNITED STATES SECURITIES AND EXCHANGE COMMISSION
Washington, D.C. 20549
FORM 10-Q
(Mark One)
þ QUARTERLY REPORT PURSUANT TO SECTION 13 OR 15(d) OF THE SECURITIES EXCHANGE ACT OF 1934
For the quarterly period ended September 30, 2018March 31, 2019
OR
¨ TRANSITION REPORT PURSUANT TO SECTION 13 OR 15(d) OF THE SECURITIES EXCHANGE ACT OF 1934
For the transition period from to
Commission file number 000-54691
PHILLIPS EDISON & COMPANY, INC.
(Exact Name of Registrant as Specified in Its Charter)
|
| |
| Maryland | 27-1106076 |
(State or Other Jurisdiction of Incorporation or Organization) | (I.R.S. Employer Identification No.) |
|
| |
11501 Northlake Drive Cincinnati, Ohio | 45249 |
| (Address of Principal Executive Offices) | (Zip Code) |
(513) 554-1110
(Registrant’s Telephone Number, Including Area Code)
Indicate by check mark whether the Registrant: (1) has filed all reports required to be filed by Section 13 or 15(d) of the Securities Exchange Act of 1934 during the preceding 12 months (or for such shorter period that the Registrant was required to file such reports), and (2) has been subject to such filing requirements for the past 90 days. Yes þ No ¨
Indicate by check mark whether the Registrant has submitted electronically every Interactive Data File required to be submitted, pursuant to Rule 405 of Regulation S-T (§232.405 of this chapter) during the preceding 12 months (or for such shorter period that the Registrant was required to submit such files). Yes þ No ¨
Indicate by check mark whether the Registrant is a large accelerated filer, an accelerated filer, a non-accelerated filer, a smaller reporting company, or an emerging growth company. See the definitions of “large accelerated filer,” “accelerated filer,” “smaller reporting company,” and “emerging growth company” in Rule 12b-2 of the Securities Exchange Act of 1934, as amended (the “Exchange Act”). (Check one):Act.
|
| | | |
Large Accelerated Fileraccelerated filer | ¨ | Accelerated Filerfiler | ¨ |
| | | | |
Non-Accelerated FilerNon-accelerated filer | þ | Smaller reporting company | ¨ |
| | | | |
| | Emerging growth company | ¨ | | |
If an emerging growth company, indicate by check mark if the Registrant has elected not to use the extended transition period for complying with any new or revised financial accounting standards provided pursuant to Section 13(a) of the Exchange Act. ¨
Indicate by check mark whether the Registrant is a shell company (as defined in Rule 12b-2 of the Exchange Act). Yes ¨ No þ
Securities registered pursuant to Section 12(b) of the Act:
|
| | | | |
| Title of each class | | Trading Symbol | | Name of each exchange on which registered |
| None | | None | | None |
As of October 31, 2018,May 1, 2019, there were 184.0282.9 million outstanding shares of common stock of the Registrant.
INDEX TO CONSOLIDATED FINANCIAL STATEMENTSPHILLIPS EDISON & COMPANY, INC.
FORM 10-Q
TABLE OF CONTENTS
|
|
w PART I FINANCIAL INFORMATION |
ITEM 1. FINANCIAL STATEMENTS
PHILLIPS EDISON & COMPANY, INC.
CONSOLIDATED BALANCE SHEETS
AS OF SEPTEMBER 30, 2018MARCH 31, 2019 AND DECEMBER 31, 20172018
(Unaudited)
(In thousands, except per share amounts)
| | | | September 30, 2018 | | December 31, 2017 | March 31,
2019 | | December 31,
2018 |
| ASSETS | | | | | | |
| Investment in real estate: | | | | | | |
|
| Land and improvements | $ | 1,115,232 |
| | $ | 1,121,590 |
| $ | 1,592,232 |
| | $ | 1,598,063 |
|
| Building and improvements | 2,253,804 |
| | 2,263,381 |
| 3,234,798 |
| | 3,250,420 |
|
| Acquired in-place lease assets | 308,575 |
| | 313,432 |
| |
| Acquired above-market lease assets | 53,161 |
| | 53,524 |
| |
| In-place lease assets | | 461,805 |
| | 464,721 |
|
| Above-market lease assets | | 66,747 |
| | 67,140 |
|
| Total investment in real estate assets | 3,730,772 |
| | 3,751,927 |
| 5,355,582 |
| | 5,380,344 |
|
| Accumulated depreciation and amortization | (576,976 | ) | | (462,025 | ) | (619,874 | ) | | (565,507 | ) |
| Net investment in real estate assets | | 4,735,708 |
| | 4,814,837 |
|
| Investment in unconsolidated joint ventures | | 43,998 |
| | 45,651 |
|
| Total investment in real estate assets, net | 3,153,796 |
| | 3,289,902 |
| 4,779,706 |
| | 4,860,488 |
|
| Cash and cash equivalents | 6,111 |
| | 5,716 |
| 12,684 |
| | 16,791 |
|
| Restricted cash | 27,828 |
| | 21,729 |
| 74,074 |
| | 67,513 |
|
| Accounts receivable – affiliates | 6,365 |
| | 6,102 |
| 5,958 |
| | 5,125 |
|
| Corporate intangible assets, net | 46,400 |
| | 55,100 |
| 13,116 |
| | 14,054 |
|
| Goodwill | 29,066 |
| | 29,085 |
| 29,066 |
| | 29,066 |
|
| Other assets, net | 148,443 |
| | 118,448 |
| 136,680 |
| | 153,076 |
|
| Real estate investment and other assets held for sale | | 5,764 |
| | 17,364 |
|
| Total assets | $ | 3,418,009 |
| | $ | 3,526,082 |
| $ | 5,057,048 |
| | $ | 5,163,477 |
|
| | | | | | | |
| LIABILITIES AND EQUITY | |
| | |
| |
| | |
|
| Liabilities: | |
| | |
| |
| | |
|
| Debt obligations, net | $ | 1,842,947 |
| | $ | 1,806,998 |
| $ | 2,415,762 |
| | $ | 2,438,826 |
|
| Acquired below-market lease liabilities, net of accumulated amortization of $33,976 and | | | | |
| $27,388, respectively | 82,235 |
| | 90,624 |
| |
| Accounts payable – affiliates | 1,014 |
| | 1,359 |
| |
| Below-market lease liabilities, net | | 127,988 |
| | 131,559 |
|
| Earn-out liability | | 32,000 |
| | 39,500 |
|
| Deferred income | | 12,096 |
| | 14,025 |
|
| Accounts payable and other liabilities | 152,464 |
| | 148,419 |
| 119,742 |
| | 126,074 |
|
| Liabilities of real estate investment held for sale | | 275 |
| | 596 |
|
| Total liabilities | 2,078,660 |
| | 2,047,400 |
| 2,707,863 |
| | 2,750,580 |
|
| Commitments and contingencies (Note 9) | — |
| | — |
| |
| Commitments and contingencies (Note 10) | | — |
| | — |
|
| Equity: | |
| | |
| |
| | |
|
| Preferred stock, $0.01 par value per share, 10,000 shares authorized, zero shares issued | | | | | | |
| and outstanding at September 30, 2018 and December 31, 2017, respectively | — |
| | — |
| |
| Common stock, $0.01 par value per share, 1,000,000 shares authorized, 183,694 and 185,233 | | | | |
| shares issued and outstanding at September 30, 2018 and December 31, 2017, respectively | 1,837 |
| | 1,852 |
| |
| and outstanding at March 31, 2019 and December 31, 2018, respectively | | — |
| | — |
|
| Common stock, $0.01 par value per share, 1,000,000 shares authorized, 281,549 and 279,803 | | | | |
| shares issued and outstanding at March 31, 2019 and December 31, 2018, respectively | | 2,815 |
| | 2,798 |
|
| Additional paid-in capital | 1,613,375 |
| | 1,629,130 |
| 2,693,946 |
| | 2,674,871 |
|
| Accumulated other comprehensive income (“AOCI”) | 33,602 |
| | 16,496 |
| |
| Accumulated other comprehensive (loss) income (“AOCI”) | | (61 | ) | | 12,362 |
|
| Accumulated deficit | (721,017 | ) | | (601,238 | ) | (745,740 | ) | | (692,045 | ) |
| Total stockholders’ equity | 927,797 |
| | 1,046,240 |
| 1,950,960 |
| | 1,997,986 |
|
| Noncontrolling interests | 411,552 |
| | 432,442 |
| 398,225 |
| | 414,911 |
|
| Total equity | 1,339,349 |
| | 1,478,682 |
| 2,349,185 |
| | 2,412,897 |
|
| Total liabilities and equity | $ | 3,418,009 |
| | $ | 3,526,082 |
| $ | 5,057,048 |
| | $ | 5,163,477 |
|
See notes to consolidated financial statements.
PHILLIPS EDISON & COMPANY, INC.
CONSOLIDATED STATEMENTS OF OPERATIONS AND COMPREHENSIVE LOSS(LOSS) INCOME
FOR THE THREE AND NINE MONTHS ENDED SEPTEMBER 30,MARCH 31, 2019 AND 2018 AND 2017
(Unaudited)
(In thousands, except per share amounts)
| | | | Three Months Ended September 30, | | Nine Months Ended September 30, | Three Months Ended March 31, |
| | 2018 | | 2017 | | 2018 | | 2017 | 2019 | | 2018 |
| Revenues: | | | | | | | | | | |
| Rental income | $ | 71,770 |
| | $ | 53,165 |
| | $ | 216,072 |
| | $ | 157,425 |
| $ | 128,860 |
| | $ | 93,886 |
|
| Tenant recovery income | 23,884 |
| | 17,052 |
| | 67,878 |
| | 50,442 |
| |
| Fees and management income | 8,974 |
| | — |
| | 26,823 |
| | — |
| 3,261 |
| | 8,712 |
|
| Other property income | 271 |
| | 407 |
| | 1,498 |
| | 911 |
| 648 |
| | 601 |
|
| Total revenues | 104,899 |
| | 70,624 |
| | 312,271 |
| | 208,778 |
| 132,769 |
| | 103,199 |
|
| Expenses: | |
| | |
| | | | | | | |
| Property operating | 19,276 |
| | 10,882 |
| | 54,292 |
| | 32,611 |
| 22,866 |
| | 18,115 |
|
| Real estate taxes | 12,873 |
| | 10,723 |
| | 39,346 |
| | 31,136 |
| 17,348 |
| | 13,147 |
|
| General and administrative | 13,579 |
| | 8,914 |
| | 37,490 |
| | 25,904 |
| 13,285 |
| | 10,461 |
|
| Termination of affiliate arrangements | — |
| | 5,454 |
| | — |
| | 5,454 |
| |
| Depreciation and amortization | 45,692 |
| | 28,650 |
| | 138,504 |
| | 84,481 |
| 60,989 |
| | 46,427 |
|
| Impairment of real estate assets | 16,757 |
|
| — |
|
| 27,696 |
|
| — |
| 13,717 |
|
| — |
|
| Total expenses | 108,177 |
| | 64,623 |
| | 297,328 |
| | 179,586 |
| 128,205 |
| | 88,150 |
|
| Other: | |
| | |
| | | | | | | |
| Interest expense, net | (17,336 | ) | | (10,646 | ) | | (51,166 | ) | | (28,537 | ) | (25,009 | ) | | (16,779 | ) |
| Transaction expenses | — |
| | (3,737 | ) | | — |
| | (9,760 | ) | |
| Gain on sale of property, net | 4,571 |
| | — |
| | 5,556 |
| | — |
| |
| Other (expense) income, net | (224 | ) | | 6 |
| | (1,513 | ) | | 642 |
| |
| Gain on disposal of property, net | | 7,121 |
| | — |
|
| Other income (expense), net | | 7,536 |
| | (107 | ) |
| Net loss | (16,267 | ) |
| (8,376 | ) |
| (32,180 | ) |
| (8,463 | ) | (5,788 | ) |
| (1,837 | ) |
| Net loss attributable to noncontrolling interests | 3,039 |
| | 144 |
| | 6,001 |
| | 144 |
| 593 |
| | 237 |
|
| Net loss attributable to stockholders | $ | (13,228 | ) |
| $ | (8,232 | ) |
| $ | (26,179 | ) |
| $ | (8,319 | ) | $ | (5,195 | ) |
| $ | (1,600 | ) |
| Earnings per common share: | |
| | |
| | | | | | | |
| Net loss per share - basic and diluted | $ | (0.07 | ) | | $ | (0.04 | ) | | $ | (0.14 | ) | | $ | (0.05 | ) | |
| Weighted-average common shares outstanding: | | | | | | | | |
| Basic | 183,699 |
| | 183,843 |
| | 184,676 |
| | 183,402 |
| |
| Diluted | 228,152 |
| | 186,492 |
| | 229,129 |
| | 186,141 |
| |
| Net loss per share attributable to stockholders - basic and diluted (See Note 13) | | $ | (0.02 | ) | | $ | (0.01 | ) |
| | | | | | | | | | | |
| Comprehensive loss: | |
| | |
| | | | | |
| Comprehensive (loss) income: | | | | |
| Net loss | $ | (16,267 | ) | | $ | (8,376 | ) | | $ | (32,180 | ) | | $ | (8,463 | ) | $ | (5,788 | ) | | $ | (1,837 | ) |
| Other comprehensive loss: | |
| | |
| | | | | |
| Change in unrealized gain (loss) on interest rate swaps | 2,869 |
| | 49 |
| | 21,212 |
| | (741 | ) | |
| Comprehensive loss | (13,398 | ) | | (8,327 | ) | | (10,968 | ) | | (9,204 | ) | |
| Other comprehensive (loss) income: | | | | |
| Change in unrealized value on interest rate swaps | | (14,361 | ) | | 13,488 |
|
| Comprehensive (loss) income | | (20,149 | ) | | 11,651 |
|
| Net loss attributable to noncontrolling interests | 3,039 |
| | 144 |
| | 6,001 |
| | 144 |
| 593 |
| | 237 |
|
| Other comprehensive loss attributable to noncontrolling interests | (517 | ) | | — |
| | (1,101 | ) | | — |
| |
| Comprehensive loss attributable to stockholders | $ | (10,876 | ) | | $ | (8,183 | ) | | $ | (6,068 | ) | | $ | (9,060 | ) | |
| Comprehensive loss (income) attributable to noncontrolling interests | | 1,938 |
| | (2,603 | ) |
| Comprehensive (loss) income attributable to stockholders | | $ | (17,618 | ) | | $ | 9,285 |
|
See notes to consolidated financial statements.
PHILLIPS EDISON & COMPANY, INC.
CONSOLIDATED STATEMENTS OF EQUITY
FOR THE NINETHREE MONTHS ENDED SEPTEMBER 30,MARCH 31, 2019 AND 2018 AND 2017
(Unaudited)
(In thousands, except per share amounts)
| | | | Common Stock | | Additional Paid-In Capital | | AOCI | | Accumulated Deficit | | Total Stockholders’ Equity | | Noncontrolling Interest | | Total Equity | Common Stock | | Additional Paid-In Capital | | AOCI | | Accumulated Deficit | | Total Stockholders’ Equity | | Noncontrolling Interest | | Total Equity |
| | Shares | | Amount | | Shares | | Amount | |
| Balance at January 1, 2017 | 185,062 |
| | $ | 1,851 |
| | $ | 1,627,098 |
| | $ | 11,916 |
| | $ | (439,484 | ) | | $ | 1,201,381 |
| | $ | 23,406 |
| | $ | 1,224,787 |
| |
| Balance at January 1, 2018 | | 185,233 |
| | $ | 1,852 |
| | $ | 1,629,130 |
| | $ | 16,496 |
| | $ | (601,238 | ) | | $ | 1,046,240 |
| | $ | 432,442 |
| | $ | 1,478,682 |
|
| Share repurchases | (4,471 | ) | | (45 | ) | | (45,557 | ) | | — |
| | — |
| | (45,602 | ) | | — |
| | (45,602 | ) | (366 | ) | | (4 | ) | | (4,011 | ) | | — |
| | — |
| | (4,015 | ) | | — |
| | (4,015 | ) |
| Dividend reinvestment plan (“DRIP”) | 3,546 |
| | 35 |
| | 36,136 |
| | — |
| | — |
| | 36,171 |
| | — |
| | 36,171 |
| 1,160 |
| | 12 |
| | 12,752 |
| | — |
| | — |
| | 12,764 |
| | — |
| | 12,764 |
|
Change in unrealized loss on interest rate swaps | — |
| | — |
| | — |
| | (741 | ) | | — |
| | (741 | ) | | — |
| | (741 | ) | |
Common distributions declared, $0.50 per share | — |
| | — |
| | — |
| | — |
| | (92,037 | ) | | (92,037 | ) | | — |
| | (92,037 | ) | |
Change in unrealized value on interest rate swaps | | — |
| | — |
| | — |
| | 10,885 |
| | — |
| | 10,885 |
| | 2,603 |
| | 13,488 |
|
Common distributions declared, $0.17 per share | | — |
| | — |
| | — |
| | — |
| | (31,326 | ) | | (31,326 | ) | | — |
| | (31,326 | ) |
| Distributions to noncontrolling interests | — |
| | — |
| | — |
| | — |
| | — |
| | — |
| | (1,384 | ) | | (1,384 | ) | — |
| | — |
| | — |
| | — |
| | — |
| | — |
| | (6,789 | ) | | (6,789 | ) |
| Share-based compensation | 3 |
| | — |
| | 40 |
| | — |
| | — |
| | 40 |
| | — |
| | 40 |
| |
| Redemption of noncontrolling interest | — |
| | — |
| | — |
| | — |
| | — |
| | — |
| | (4,179 | ) | | (4,179 | ) | |
| Share-based compensation expense | | — |
| | — |
| | 318 |
| | — |
| | — |
| | 318 |
| | — |
| | 318 |
|
| Other | | — |
| | — |
| | (13 | ) | | — |
| | — |
| | (13 | ) | | — |
| | (13 | ) |
| Net loss | — |
| | — |
| | — |
| | — |
| | (8,319 | ) | | (8,319 | ) | | (144 | ) | | (8,463 | ) | — |
| | — |
| | — |
| | — |
| | (1,600 | ) | | (1,600 | ) | | (237 | ) | | (1,837 | ) |
| Balance at September 30, 2017 | 184,140 |
| | $ | 1,841 |
| | $ | 1,617,717 |
| | $ | 11,175 |
| | $ | (539,840 | ) | | $ | 1,090,893 |
| | $ | 17,699 |
| | $ | 1,108,592 |
| |
| Balance at March 31, 2018 | | 186,027 |
| | $ | 1,860 |
| | $ | 1,638,176 |
| | $ | 27,381 |
| | $ | (634,164 | ) | | $ | 1,033,253 |
| | $ | 428,019 |
| | $ | 1,461,272 |
|
| | | | | | | | | | | | | | | | | | | | | | | | | | | | | | | |
| Balance at January 1, 2018 | 185,233 |
| | $ | 1,852 |
| | $ | 1,629,130 |
| | $ | 16,496 |
| | $ | (601,238 | ) | | $ | 1,046,240 |
| | $ | 432,442 |
| | $ | 1,478,682 |
| |
| Balance at December 31, 2018 | | 279,803 |
| | $ | 2,798 |
| | $ | 2,674,871 |
| | $ | 12,362 |
| | $ | (692,045 | ) | | $ | 1,997,986 |
| | $ | 414,911 |
| | $ | 2,412,897 |
|
Adoption of new accounting pronouncement (see Note 3) | | — |
| | — |
| | — |
| | — |
| | (528 | ) | | (528 | ) | | — |
| | (528 | ) |
| Balance at January 1, 2019 | | 279,803 |
| | $ | 2,798 |
| | $ | 2,674,871 |
| | $ | 12,362 |
| | $ | (692,573 | ) | | $ | 1,997,458 |
| | $ | 414,911 |
| | $ | 2,412,369 |
|
| Share repurchases | (4,511 | ) | | (45 | ) | | (49,589 | ) | | — |
| | — |
| | (49,634 | ) | | — |
| | (49,634 | ) | (605 | ) | | (6 | ) | | (6,674 | ) | | — |
| | — |
| | (6,680 | ) | | — |
| | (6,680 | ) |
| DRIP | 2,967 |
| | 30 |
| | 32,661 |
| | — |
| | — |
| | 32,691 |
| | — |
| | 32,691 |
| 1,603 |
| | 16 |
| | 17,702 |
| | — |
| | — |
| | 17,718 |
| | — |
| | 17,718 |
|
Change in unrealized gain on interest
rate swaps | — |
| | — |
| | — |
| | 17,106 |
| | — |
| | 17,106 |
| | 4,106 |
| | 21,212 |
| |
Common distributions declared, $0.50 per share | — |
| | — |
| | — |
| | — |
| | (93,600 | ) | | (93,600 | ) | | — |
| | (93,600 | ) | |
Change in unrealized value on interest
rate swaps | | — |
| | — |
| | — |
| | (12,423 | ) | | — |
| | (12,423 | ) | | (1,938 | ) | | (14,361 | ) |
Common distributions declared, $0.17 per share | | — |
| | — |
| | — |
| | — |
| | (47,972 | ) | | (47,972 | ) | | — |
| | (47,972 | ) |
| Distributions to noncontrolling interests | — |
| | — |
| | — |
| | — |
| | — |
| | — |
| | (21,379 | ) | | (21,379 | ) | — |
| | — |
| | — |
| | — |
| | — |
| | — |
| | (7,167 | ) | | (7,167 | ) |
| Share-based compensation | 5 |
| | — |
| | 1,329 |
| | — |
| | — |
| | 1,329 |
| | 2,384 |
| | 3,713 |
| |
| Other | — |
| | — |
| | (156 | ) | | — |
| | — |
| | (156 | ) | | — |
| | (156 | ) | |
| Share-based compensation expense | | — |
| | — |
| | 433 |
| | — |
| | — |
| | 433 |
| | 839 |
| | 1,272 |
|
| Share-based awards vesting | | 58 |
| | — |
| | — |
| | — |
| | — |
| | — |
| | — |
| | — |
|
| Share-based awards retained for taxes | | (18 | ) | | — |
| | (206 | ) | | — |
| | — |
| | (206 | ) | | — |
| | (206 | ) |
| Conversion of noncontrolling interests | | 708 |
| | 7 |
| | 7,820 |
| | — |
| | — |
| | 7,827 |
| | (7,827 | ) | | — |
|
| Net loss | — |
| | — |
| | — |
| | — |
| | (26,179 | ) | | (26,179 | ) | | (6,001 | ) | | (32,180 | ) | — |
| | — |
| | — |
| | — |
| | (5,195 | ) | | (5,195 | ) | | (593 | ) | | (5,788 | ) |
| Balance at September 30, 2018 | 183,694 |
| | $ | 1,837 |
| | $ | 1,613,375 |
| | $ | 33,602 |
| | $ | (721,017 | ) | | $ | 927,797 |
| | $ | 411,552 |
| | $ | 1,339,349 |
| |
| Balance at March 31, 2019 | | 281,549 |
| | $ | 2,815 |
| | $ | 2,693,946 |
| | $ | (61 | ) | | $ | (745,740 | ) | | $ | 1,950,960 |
| | $ | 398,225 |
| | $ | 2,349,185 |
|
See notes to consolidated financial statements.
PHILLIPS EDISON & COMPANY, INC.
CONSOLIDATED STATEMENTS OF CASH FLOWS
FOR THE NINETHREE MONTHS ENDED SEPTEMBER 30,MARCH 31, 2019 AND 2018 AND 2017
(Unaudited)
| | | | | | | Three Months Ended March 31, |
| | 2018 | | 2017 | 2019 | | 2018 |
| CASH FLOWS FROM OPERATING ACTIVITIES: | | | | | | |
| Net loss | $ | (32,180 | ) | | $ | (8,463 | ) | $ | (5,788 | ) | | $ | (1,837 | ) |
| Adjustments to reconcile net loss to net cash provided by operating activities: | |
| | |
| |
| | |
|
| Depreciation and amortization | 125,990 |
| | 83,200 |
| |
| Depreciation and amortization of real estate assets | | 59,342 |
| | 42,040 |
|
| Impairment of real estate assets | 27,696 |
| | — |
| 13,717 |
| | — |
|
| Depreciation and amortization of corporate assets | 11,137 |
| | — |
| 1,647 |
| | 4,128 |
|
| Amortization of deferred financing expense | 3,615 |
| | 3,572 |
| |
| Amortization of deferred financing expenses | | 1,297 |
| | 1,226 |
|
| Net amortization of above- and below-market leases | (2,967 | ) | | (972 | ) | (1,133 | ) | | (1,007 | ) |
| Gain on sale of property, net | (5,556 | ) | | — |
| |
| Change in fair value of contingent liability | 1,500 |
| | — |
| |
| Gain on disposal of property, net | | (7,121 | ) | | — |
|
| Change in fair value of earn-out liability | | (7,500 | ) | | — |
|
| Straight-line rent | (3,544 | ) | | (2,913 | ) | (1,713 | ) | | (1,057 | ) |
| Share-based compensation | 3,713 |
| | — |
| |
| Share-based compensation expense | | 1,272 |
| | 318 |
|
| Equity in net loss of unconsolidated joint ventures | | 456 |
| | — |
|
| Other | 846 |
| | (927 | ) | 2,766 |
| | 1 |
|
| Changes in operating assets and liabilities: | |
| | |
| |
| | |
|
| Other assets | (10,468 | ) | | (12,193 | ) | |
| Accounts receivable and payable – affiliates | (608 | ) | | 1 |
| |
| Other assets, net | | 1,923 |
| | (4,389 | ) |
| Accounts payable and other liabilities | 2,862 |
| | 6,217 |
| (17,921 | ) | | (15,913 | ) |
| Net cash provided by operating activities | 122,036 |
|
| 67,522 |
| 41,244 |
|
| 23,510 |
|
| CASH FLOWS FROM INVESTING ACTIVITIES: | |
| | |
| |
| | |
|
| Real estate acquisitions | (31,252 | ) | | (111,740 | ) | — |
| | (8,374 | ) |
| Capital expenditures | (29,341 | ) | | (22,505 | ) | (8,574 | ) | | (8,593 | ) |
| Proceeds from sale of real estate | 44,338 |
| | 1,137 |
| 35,755 |
| | 39 |
|
| Net cash used in investing activities | (16,255 | ) | | (133,108 | ) | |
| Return of investment in unconsolidated joint ventures | | 1,197 |
| | — |
|
| Net cash provided by (used in) investing activities | | 28,378 |
| | (16,928 | ) |
| CASH FLOWS FROM FINANCING ACTIVITIES: | |
| | |
| |
| | |
|
| Net change in credit facility | (6,000 | ) | | 202,000 |
| (22,000 | ) | | (36,000 | ) |
| Proceeds from mortgages and loans payable | 65,000 |
| | — |
| — |
| | 65,000 |
|
| Payments on mortgages and loans payable | (24,751 | ) | | (64,287 | ) | (2,428 | ) | | (2,646 | ) |
| Payments of deferred financing expenses | (782 | ) | | (2,510 | ) | |
| Distributions paid, net of DRIP | (61,125 | ) | | (56,226 | ) | (30,132 | ) | | (18,710 | ) |
| Distributions to noncontrolling interests | (21,377 | ) | | (1,262 | ) | (6,958 | ) | | (6,827 | ) |
| Repurchases of common stock | (50,252 | ) | | (44,682 | ) | (5,444 | ) | | (2,875 | ) |
| Redemption of noncontrolling interests | — |
| | (4,179 | ) | |
| Net cash (used in) provided by financing activities | (99,287 | ) | | 28,854 |
| |
| NET INCREASE (DECREASE) IN CASH, CASH EQUIVALENTS, AND RESTRICTED CASH | 6,494 |
| | (36,732 | ) | |
| Other | | (206 | ) | | — |
|
| Net cash used in financing activities | | (67,168 | ) | | (2,058 | ) |
| NET INCREASE IN CASH, CASH EQUIVALENTS, AND RESTRICTED CASH | | 2,454 |
| | 4,524 |
|
| CASH, CASH EQUIVALENTS, AND RESTRICTED CASH: | |
| | |
| |
| | |
|
| Beginning of period | 27,445 |
| | 49,946 |
| 84,304 |
| | 27,445 |
|
| End of period | $ | 33,939 |
| | $ | 13,214 |
| $ | 86,758 |
| | $ | 31,969 |
|
| | | | | | | |
| RECONCILIATION TO CONSOLIDATED BALANCE SHEETS | | | | | | |
| Cash and cash equivalents | $ | 6,111 |
| | $ | 7,189 |
| $ | 12,684 |
| | $ | 14,690 |
|
| Restricted cash | 27,828 |
| | 6,025 |
| 74,074 |
| | 17,279 |
|
| Cash, cash equivalents, and restricted cash at end of period | $ | 33,939 |
| | $ | 13,214 |
| $ | 86,758 |
| | $ | 31,969 |
|
| | | | 2018 | | 2017 | 2019 | | 2018 |
| SUPPLEMENTAL CASH FLOW DISCLOSURE, INCLUDING NON-CASH INVESTING AND FINANCING ACTIVITIES: | SUPPLEMENTAL CASH FLOW DISCLOSURE, INCLUDING NON-CASH INVESTING AND FINANCING ACTIVITIES: | | | SUPPLEMENTAL CASH FLOW DISCLOSURE, INCLUDING NON-CASH INVESTING AND FINANCING ACTIVITIES: | | |
| Cash paid for interest | $ | 49,157 |
| | $ | 26,461 |
| $ | 21,679 |
| | $ | 15,792 |
|
| Fair value of assumed debt | — |
| | 30,832 |
| |
| Capital leases | 739 |
| | — |
| |
| Accrued capital expenditures | 2,881 |
| | 3,560 |
| 2,095 |
| | 2,252 |
|
| Change in distributions payable | (216 | ) | | (360 | ) | 122 |
| | — |
|
| Change in distributions payable - noncontrolling interests | | 209 |
| | — |
|
| Change in accrued share repurchase obligation | (618 | ) | | 920 |
| 1,236 |
| | 1,140 |
|
| Distributions reinvested | 32,691 |
| | 36,171 |
| 17,718 |
| | 12,764 |
|
See notes to consolidated financial statements.
Phillips Edison & Company, Inc.
Notes to Consolidated Financial Statements
(Unaudited)
Phillips Edison & Company, Inc. (“we,” the “Company,” “our,” or “us”) was formed as a Maryland corporation in October 2009. Substantially all of our business is conducted through Phillips Edison Grocery Center Operating Partnership I, L.P., (the “Operating Partnership”), a Delaware limited partnership formed in December 2009. We are a limited partner of the Operating Partnership, and our wholly owned subsidiary, Phillips Edison Grocery Center OP GP I LLC, is the sole general partner of the Operating Partnership.
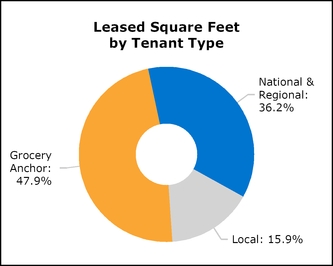
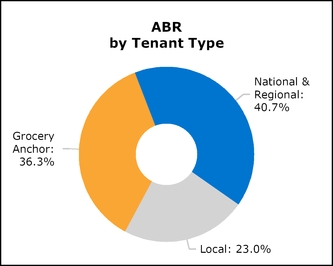
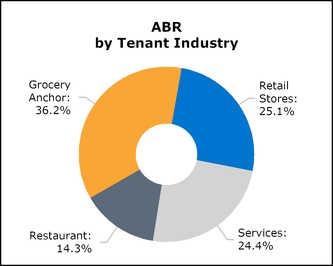
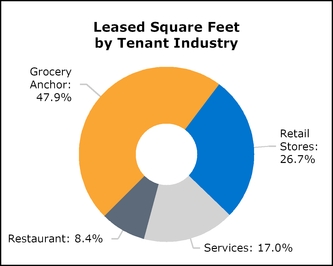
We invest primarily in well-occupied, grocery-anchored, neighborhood and community shopping centers that have a mix of creditworthy national, regional, and regionallocal retailers that sell necessity-based goods and services in strong demographic markets throughout the United States. In addition to managing our own shopping centers,properties, our third-party investment management business provides comprehensive real estate and asset management services to certain(i) Phillips Edison Grocery Center REIT III, Inc. (“PECO III”), a non-traded publicly registered real estate investment trusts (“REITs”)REIT; (ii) three institutional joint ventures; and (iii) one private funds (“Managedfund (collectively, the “Managed Funds”). The Managed Funds include
In November 2018, we completed a merger (the “Merger”) with Phillips Edison Grocery Center REIT II, Inc. (“REIT II”), Phillips Edison Grocery Centera
public non-traded REIT III, Inc. (“PECO III”), Phillips Edison Limited Partnership (“PELP”),that was advised and managed by us, in a 100% stock-for-stock transaction valued at approximately
$1.9 billion. As a result of the Merger, we acquired 86 properties and a 20% equity interest in Necessity Retail Partners (“NRP” or the “NRP joint venture”).
As of September 30, 2018, we, a joint venture that owned fee simple interests in 233 real estate13 properties.
In July 2018 we entered into an Agreement and Plan of Merger (“Merger Agreement”) pursuant to which, subject to the satisfaction or waiver of certain conditions, we will merge with REIT II, and we will continue as the surviving corporation (“Merger”). To complete the proposed Merger, we will issue 2.04 shares of our common stock in exchange for each issued and outstanding share of REIT II common stock, subject to closing adjustments. For a more detailed discussion, see Note 3.4.
In November 2018, through our direct or indirect subsidiaries, we entered into a joint venture with The Northwestern
Mutual Life Insurance Company (“Northwestern Mutual”) and we contributed or sold 17 grocery-anchored shopping centers
with a fair value of approximately $359 million at formation to the new joint venture, Grocery Retail Partners I LLC (“GRP I” or the “GRP I joint venture”), in exchange for a 15% ownership interest in GRP I. For a more detailed discussion, see Note 6.
As of March 31, 2019, we wholly-owned fee simple interests in 300 real estate properties. In addition, we owned a 20% equity interest in NRP and a 15% interest in GRP I, as described previously.
|
|
| 2. SUMMARY OF SIGNIFICANT ACCOUNTING POLICIES |
Certain of our accounting estimates are particularly important for an understanding of our financial position and results of operations and require the application of significant judgment by management. For example, significant estimates and assumptions have been made with respect to the useful lives of assets, recoverable amounts of receivables, and other fair value measurement assessments required for the preparation of the consolidated financial statements. As a result, these estimates are subject to a degree of uncertainty.
Other than those noted below, there have been no changes to our significant accounting policies during the ninethree months ended September 30, 2018.March 31, 2019. For a full summary of our accounting policies, refer to our 20172018 Annual Report on Form 10-K filed with the SEC on March 30, 2018.13, 2019.
Basis of Presentation and Principles of Consolidation—The accompanying consolidated financial statements have been prepared in accordance with accounting principles generally accepted in the United States of America (“GAAP”) for interim financial information and with instructions to Form 10-Q and Article 10 of Regulation S-X. Accordingly, they do not include all of the information and footnotes required by GAAP for complete financial statements. Readers of this Quarterly Report on Form 10-Q should refer to our audited consolidated financial statements for the year ended December 31, 2017,2018, which are included in our 20172018 Annual Report on Form 10-K. In the opinion of management, all normal and recurring adjustments necessary for the fair presentation of the unaudited consolidated financial statements for the periods presented have been included in this Quarterly Report. Our results of operations for the three and nine months ended September 30, 2018,March 31, 2019, are not necessarily indicative of the operating results expected for the full year.
The accompanying consolidated financial statements include our accounts and those of our majority-owned subsidiaries. All intercompany balances and transactions are eliminated upon consolidation.
Leases—We are party to a number of lease agreements, both as a lessor as well as a lessee of various types of assets.
Lessor—The majority of our revenue is lease revenue derived from our real estate assets, which is accounted for under Accounting Standards Codification (“ASC”) Topic 842, Leases (“ASC 842”). We adopted the accounting guidance contained within ASC 842 on January 1, 2019, the effective date of the standard for public companies. We record lease and lease-related revenue as Rental Income on the consolidated statements of operations and comprehensive (loss) income, also referred to herein as our “consolidated statements of operations”, in accordance with ASC 842.
We enter into leases primarily as a lessor as part of our real estate operations, and leases represent the majority of our revenue. We lease space in our properties generally in the form of operating leases. Our leases typically provide for reimbursements from tenants for common area maintenance, insurance, and real estate tax expenses. Common area maintenance reimbursements can be fixed, with revenue earned on a straight-line basis over the term of the lease, or variable, with revenue recognized as services are performed for which we will be reimbursed.
The terms and expirations of our operating leases with our tenants are generally similar. The majority of leases for inline (non-anchor) tenants have terms that range from 2 to 10 years, and the majority of leases for anchor tenants range from 3 to 13 years. In both cases, the full term of the lease prior to our acquisition or assumption of the lease will generally be longer, however, we are measuring the commencement date for these purposes as being the date that we acquired or assumed the lease, excluding option periods.
The lease agreements frequently contain fixed-price renewal options to extend the terms of leases and other terms and conditions as negotiated. In calculating the term of our leases, we consider whether these options are reasonably certain to be exercised. Our determination involves a combination of contract-, asset-, entity-, and market-based factors and involves considerable judgment. We retain substantially all of the risks and benefits of ownership of the real estate assets leased to tenants. Currently, our tenants have no options to purchase at the end of the lease term, although in a small number of leases, a tenant, usually the anchor tenant, may have the right of first refusal to purchase one of our properties if we elect to sell the center.
Beginning January 1, 2019, we evaluate whether a lease is an operating, sales-type, or direct financing lease using the criteria established in ASC 842. Leases will be considered either sales-type or direct financing leases if any of the following criteria are met:
if the lease transfers ownership of the underlying asset to the lessee by the end of the term;
if the lease grants the lessee an option to purchase the underlying asset that is reasonably certain to be exercised;
if the lease term is for the major part of the remaining economic life of the underlying asset; or
if the present value of the sum of the lease payments and any residual value guaranteed by the lessee equals or exceeds substantially all of the fair value of the underlying asset.
We utilize substantial judgment in determining the fair value of the leased asset, the economic life of the leased asset, and the relevant borrowing rate in performing our lease classification analysis. If none of the criteria listed above are met, the lease is classified as an operating lease. Currently all of our leases are classified as operating leases, and we expect that the majority, if not all, of our leases will continue to be classified as operating leases based upon our typical lease terms.
We commence revenue recognition on our leases based on a number of factors. In most cases, revenue recognition under a lease begins when the lessee takes possession of or controls the physical use of the leased asset. The determination of when revenue recognition under a lease begins, as well as the nature of the leased asset, is dependent upon our assessment of who is the owner, for accounting purposes, of any related tenant improvements. If we are the owner, for accounting purposes, of the tenant improvements, then the leased asset is the finished space, and revenue recognition begins when the lessee takes possession of the finished space, typically when the improvements are substantially complete.
If we conclude that we are not the owner, for accounting purposes, of the tenant improvements (i.e. the lessee is the owner), then the leased asset is the unimproved space and any tenant allowances funded under the lease are treated as lease incentives, which reduce revenue recognized over the term of the lease. In these circumstances, we begin revenue recognition when the lessee takes possession of the unimproved space to construct their own improvements. We consider a number of different factors in evaluating whether the lessee or we are the owner of the tenant improvements for accounting purposes. These factors include:
whether the lease stipulates how and on what a tenant improvement allowance may be spent;
whether the tenant or landlord retains legal title to the improvements;
the uniqueness of the improvements;
the expected economic life of the tenant improvements relative to the length of the lease; and
who constructs or directs the construction of the improvements.
The majority of our leases provide for fixed rental escalations, and we recognize rental income on a straight-line basis over the term of each lease in such instances. The difference between rental income earned on a straight-line basis and the cash rent due under the provisions of the lease agreements is recorded as deferred rent receivable and is included as a component of Other Assets, Net. Due to the impact of the straight-line adjustments, rental income generally will be greater than the cash collected in the early years and will be less than the cash collected in the later years of a lease.
Reimbursements from tenants for recoverable real estate taxes and operating expenses that are fixed per the terms of the applicable lease agreements are recorded on a straight-line basis, as described above. The majority of our lease agreements with tenants, however, provide for tenant reimbursements that are variable depending upon the applicable expenses incurred. These reimbursements are accrued as revenue in the period in which the applicable expenses are incurred. We make certain assumptions and judgments in estimating the reimbursements at the end of each reporting period. We do not expect the actual results to materially differ from the estimated reimbursements. Both fixed and variable tenant reimbursements are recorded as Rental Income in the consolidated statements of operations. In certain cases, the lease agreement may stipulate that a tenant make a direct payment for real estate taxes to the relevant taxing authorities. In these cases, beginning on January 1, 2019, we no longer record any revenue or expense related to these tenant expenditures. Although we expect such cases to be rare, in the event that a direct-paying tenant failed to make their required payment to the taxing authorities, we would potentially be liable for such amounts, although they are not recorded as a liability in our consolidated balance sheets per the requirements of ASC 842. We have made a policy election to exclude amounts collected from customers for all sales tax and other similar taxes from the transaction price in our recognition of lease revenue.
Additionally, we record an immaterial amount of variable revenue in the form of percentage rental income. Our policy for percentage rental income is to defer recognition of contingent rental income until the specified target (i.e. breakpoint) that triggers the contingent rental income is achieved.
In some instances, as part of our negotiations, we may offer lease incentives to our tenants. These incentives usually take the form of payments made to or on behalf of the tenant, and such incentives will be deducted from the lease payment and recorded on a straight-line basis over the term of the new lease.
We record lease termination income if there is a signed termination agreement, all of the conditions of the agreement have been met, collectability is reasonably assured and the tenant is no longer occupying the property. Upon early lease termination, we provide for losses related to unrecovered tenant-specific intangibles and other assets. We record lease termination income as rental income in the consolidated statements of operations.
Historically, we periodically reviewed the collectability of outstanding receivables. Following the adoption of ASC 842, as of January 1, 2019, lease receivables are reviewed continually to determine whether or not it is likely that we will realize all amounts receivable for each of our tenants (i.e. whether a tenant is deemed to be a credit risk). If we determine that the tenant is not a credit risk, no reserve or reduction of revenue is recorded, except in the case of disputed charges. If we determine that the tenant is a credit risk, revenue for that tenant is recorded on a cash basis, including any amounts relating to straight-line rent receivables and/or receivables for recoverable expenses. Under ASC 842, the aforementioned adjustments as well as any reserve for disputed charges are recorded as a reduction of Rental Income rather than in Property Operating, where our reserves were previously recorded, on the consolidated statements of operations.
Lessee—We enter into leases as a lessee as part of our real estate operations in the form of ground leases of land, and as part of our corporate operations in the form of office space and office equipment leases. Ground leases typically have initial terms of 15-40 years with one or more options to renew for additional terms of 3-5 years, and may include options that grant us as the lessee the right to terminate the lease, without penalty, in advance of the full lease term. Our office space leases generally have terms of less than ten years with no renewal options. Office equipment leases typically have terms ranging from 3-5 years with options to extend the term for a year or less, but contain minimal termination rights. In calculating the term of our leases, we consider whether we are reasonably certain to exercise renewal and/or termination options. Our determination involves a combination of contract-, asset-, entity-, and market-based factors and involves considerable judgment.
Currently, neither our operating leases nor our finance leases have residual value guarantees or other restrictions or covenants, but a small number may contain nonlease components which have been deemed not material. Beginning January 1, 2019, we evaluate whether a lease is a finance or operating lease using the criteria established in ASC 842. The criteria we use to determine whether a lease is a finance lease are the same as those we use to determine whether a lease is sales-type lease as a lessor. If none of the finance lease criteria is met, we classify the lease as an operating lease.
We record right-of-use (“ROU”) assets and liabilities in the consolidated balance sheets based upon the terms and conditions of the applicable lease agreement. We use discount rates to calculate the present value of lease payments when determining lease classification and measuring our lease liability. We use the rate implicit in the lease as our discount rate unless that rate cannot be readily determined, in which case we consider various factors to select an appropriate discount rate. This requires the application of judgment, and we consider the length of the lease as well as the length and securitization of our outstanding debt agreements in selecting an appropriate rate.
Revenue Recognition—In addition to our lease-related revenue, we also earn fee revenues by providing services to the Managed Funds. These fees are accounted for within the scope of ASC Topic 606, Revenue from Contracts with Customers (“ASC 606”), and are recorded as Fees and Management Income on the consolidated statements of operations. We provide services to the Managed Funds, all of which are considered related parties. These services primarily include asset acquisition and disposition services, asset management, operating and leasing of properties, construction management, and other general and administrative responsibilities. These services are currently provided under various combinations of advisory agreements, property management agreements, and other service agreements (the “Management Agreements”). The wide variety of duties within the Management Agreements makes determining the performance obligations within the contracts a matter of judgment. We have concluded that each of the separately disclosed fee types in the below table represents a separate performance obligation within the Management Agreements.
The table below shows the most significant of these fee types in the Management Agreements: |
| | | | | | |
| Fee | | Performance Obligation Satisfied | | Timing of Payment | | Description |
| Asset Management | | Over time | | Monthly, in cash and/or ownership units | | Because each increment of service is distinct, although substantially the same, revenue is recognized at the end of each reporting period based upon asset base and the applicable rate. |
| Property Management | | Over time | | In cash, monthly | | Because each increment of service is distinct, although substantially the same, revenue is recognized at the end of each month based on a percentage of the properties’ cash receipts. |
| Leasing Commissions | | Point in time (upon close of a transaction) | | In cash, upon completion | | Revenue is recognized in an amount equal to the fees charged by unaffiliated persons rendering comparable services in the same geographic location. |
| Construction Management | | Point in time (upon close of a project) | | In cash, upon completion | | Revenue is recognized in an amount equal to the fees charged by unaffiliated persons rendering comparable services in the same geographic location. |
| Acquisition | | Point in time (upon close of a transaction) | | In cash, upon close of the transaction | | Revenue is recognized based on a percentage of the purchase price of the property acquired. |
| Disposition | | Point in time (upon close of a transaction) | | In cash, upon close of the transaction | | Revenue is recognized based on a percentage of the disposition price of the property sold. |
Due to the nature of the services being provided under our Management Agreements, each performance obligation has a variable component. Therefore, when we determine the transaction price for the contracts, we are required to constrain our estimate to an amount that is not probable of significant revenue reversal. For most of these fee types, such as acquisition fees and leasing commissions, compensation only occurs if a transaction takes place and the amount of compensation is dependent upon the terms of the transaction. For our property and asset management fees, due to the large number and broad range of possible consideration amounts, we calculate the amount earned at the end of each month.
In addition to the fees listed above, certain of our Management Agreements include the potential for additional revenues if certain market conditions are in place or certain events take place. We have not recognized revenue related to these fees, nor will we until it is no longer highly probable that there would be a material reversal of revenue.
Additionally, effective January 1, 2018, sales or transfers to non-customers of non-financial assets or in substance non-financial assets that do not meet the definition of a business are accounted for within the scope of ASC Topic 610-20, Other Income—Gains and Losses from the Derecognition of Nonfinancial Assets (“ASC 610-20”). Generally, our sales of real estate would be considered a sale of a non-financial asset as defined by ASC 610-20. Under ASC 610-20, if we determine we do not have a controlling financial interest in the entity that holds the asset and the arrangement meets the criteria to be accounted for as a contract, we would de-recognize the asset and recognize a gain or loss on the sale of the real estate when control of the underlying asset transfers to the buyer. Further, we may defer a tax gain through an Internal Revenue Code (the “Code”) Section 1031 like-kind exchange by purchasing another property within a specified time period. For additional information regarding gain on sale of assets, refer to Note 5.
Income Taxes—Our consolidated financial statements include the operations of one wholly owned subsidiarysubsidiaries that hashave jointly elected to be treated as a Taxable REIT SubsidiarySubsidiaries (“TRS”) and isare subject to U.S. federal, state, and local income taxes at regular corporate tax rates. As of September 30, 2018 and December 31, 2017, a full valuation allowance was recorded for the entire amount of the net deferred tax asset. During the three and nine months ended September 30,March 31, 2019 and 2018, no income tax expense or benefit was reported as we recorded a full valuation allowance for our net deferred tax asset.
Recently Issued and Newly Adopted and Recently Issued Accounting Pronouncements—The following table provides a brief description of newly adopted accounting pronouncements and their effect on our consolidated financial statements: |
| | | | | | |
Standard | | Description | | Date of Adoption | | Effect on the Financial Statements or Other Significant Matters |
ASU 2017-09, Compensation - Stock Compensation (Topic 718): Scope of Modification Accounting | | This update clarifies guidance about which changes to the terms or conditions of a share-based payment award require an entity to apply modification accounting. | | January 1, 2018 | | The adoption of this standard did not have a material impact on our consolidated financial statements. We will apply the guidance to any future modifications of share-based compensation awards.
|
ASU 2017-05, Other Income - Gains and Losses from the Derecognition of Nonfinancial Assets (Subtopic 610-20) | | This update amends existing guidance in order to provide consistency in accounting for the derecognition of a nonfinancial asset. | | January 1, 2018 | | We did not record any cumulative adjustment in connection with the adoption of the new pronouncement. We determined that these changes did not have any impact on our consolidated financial statements. |
ASU 2017-04, Intangibles - Goodwill and Other: Simplifying the Test for Goodwill Impairment (Topic 350) | | This update amends existing guidance in order to simplify impairment testing for goodwill. It is effective for annual reporting periods beginning after January 1, 2021, but early adoption is permitted. | | January 1, 2018 | | We elected to adopt this standard as of January 1, 2018. The adoption of this standard did not have any impact on our consolidated financial statements. |
ASU 2016-15, Statement of Cash Flows (Topic 230);
ASU 2016-18, Statement of Cash Flows (Topic 230)
| | These updates address the presentation of eight specific cash receipts and cash payments on the statement of cash flows, as well as clarify the classification and presentation of restricted cash on the statement of cash flows. | | January 1, 2018 | | We adopted these ASUs by applying a retrospective transition method which requires a restatement of our consolidated statement of cash flows for all periods presented. |
ASU 2014-09, Revenue from Contracts with Customers (Topic 606) | | This update outlines a comprehensive model for entities to use in accounting for revenue arising from contracts with customers. ASU 2014-09 states that “an entity recognizes revenue to depict the transfer of promised goods or services to customers in an amount that reflects the consideration to which the entity expects to be entitled in exchange for those goods or services.” While ASU 2014-09 specifically references contracts with customers, it also applies to certain other transactions such as the sale of real estate or equipment. Expanded quantitative and qualitative disclosures are also required for contracts subject to ASU 2014-09. | | January 1, 2018 | | Our revenue-producing contracts are primarily leases that are not within the scope of this standard. As a result, the adoption of this standard did not have a material impact on our rental or reimbursement revenue. However, the standard does apply to a majority of our fees and management income. We have evaluated the impact of this standard on our fees and management income; it did not have a material impact on our revenue recognition, but we have provided additional disclosures around fees and management revenue. We adopted this guidance on a modified retrospective basis. |
The following table provides a brief description of recent accounting pronouncements that could have a material effect on our consolidated financial statements: |
| | | | | | |
| Standard | | Description | | Date of Adoption | | Effect on the Financial Statements or Other Significant Matters |
ASU 2018-13, Fair Value Measurement (Topic 820) | | This ASU eliminates, adds and modifies certain disclosure requirements for fair value measurements as part of the FASB’s disclosure framework project. Early adoption is permitted.
| | January 1, 2020 | | We are currently evaluating the impact the adoption of these standards will have on our consolidated financial statements. |
ASU 2018-07, Compensation - Stock Compensation (Topic 718): Improvements to Non-employee Share-Based Payment Accounting | | The amendments in this update expand the scope of Topic 718: Compensation—Stock Compensation to include share-based payment transactions for acquiring goods and services from non-employees, except for specific guidance on inputs to an option pricing model and the attribution of cost (that is, the period of time over which share-based payment awards vest and the pattern of cost recognition over that period). This update is effective for public business entities for fiscal years beginning after December 15, 2018. Early adoption is permitted. | | January 1, 2019 | | We are currently evaluating the impact the adoption of this standard will have on our consolidated financial statements. |
ASU Standards Update (“ASU”) 2016-13, Financial Instruments - Credit Losses (Topic 326):Measurement of Credit Losses on Financial Instruments
ASU 2018-19, Financial Instruments - Credit Losses (Topic 326): Codification Improvements
| | The amendments in this update replace the incurred loss impairment methodology in current GAAP with a methodology that reflects expected credit losses and requires consideration of a broader range of reasonable and supportable information to inform credit loss estimates. It clarifies that receivables arising from operating leases are not within the scope of Topic 326. Instead, impairment of receivables arising from operating leases should be accounted for in accordance with Topic 842. This update is effective for public entities in fiscal years beginning after December 15, 2019, and interim periods within those fiscal years. Early adoption is permitted after December 15, 2018. | | January 1, 2020 | | We are currently evaluating the impact the adoption of this standard will have on our consolidated financial statements. |
| ASU 2018-13, Fair Value Measurement (Topic 820) | | This ASU eliminates, adds and modifies certain disclosure requirements for fair value measurements as part of the Financial Accounting Standards Board’s disclosure framework project. It is effective for annual and interim reporting beginning after December 15, 2019, but early adoption is accepted. | | January 1, 2020 | | We are currently evaluating the impact the adoption of this standard will have on our consolidated financial statements. |
| ASU 2018-17, Consolidation (Topic 810): Targeted Improvements to Related Party Guidance for Variable Interest Entities | | This Update amends two aspects of the related-party guidance in ASC 810: (1) adds an elective private-company scope exception to the variable interest entity guidance for entities under common control and (2) indirect interests held through related parties in common control arrangements should be considered on a proportional basis for determining whether fees paid to decision makers and service providers are variable interests. For entities other than private companies, the amendments in this update are effective for fiscal years beginning after December 15, 2019, and interim periods within those fiscal years. All entities are required to apply the amendments in this update retrospectively with a cumulative effect adjustment to retained earnings at the beginning of the earliest period presented. Early adoption is permitted. | | January 1, 2020 | | We are currently evaluating the impact the adoption of this standard will have on our consolidated financial statements. |
The following table provides a brief description of newly adopted accounting pronouncements and their effect on our consolidated financial statements: |
| | | | | | |
| Standard | | Description | | Date of Adoption | | Effect on the Financial Statements or Other Significant Matters |
ASU 2016-02, Leases (Topic 842);
ASU 2018-01, Leases (Topic 842): Land Easement Practical Expedient for Transition to Topic 842;
842
ASU 2018-10, Codification Improvements to Topic 842, Leases; and
Leases
ASU 2018-11, Leases (Topic 842): Targeted Improvements
ASU 2018-20, Leases (Topic 842): Narrow-Scope Improvements for Lessors
ASU 2019-01, Lease (Topic 842): Codification Improvements | | These updates amendamended existing guidance by recognizing lease assets and lease liabilities on the balance sheet and disclosing key information about leasing arrangements. Early adoption is permitted as of the original effective date.
| | January 1, 2019 | | We are currently evaluating the impactadopted this standard on January 1, 2019 and a modified retrospective transition approach was required. We determined that the adoption of these standards will havehad a material impact on our consolidated financial statements. We have identified areas within our accounting policies we believe could be impacted by the new standard. This standard impacts the lessor’s abilitystatements; please refer to capitalize certain costs related to leasing, which will result in a reduction in the amount of execution costs currently being capitalized in connection with leasing activities and an increase to our Property Operating expenses. The standard will also require new disclosures within the accompanying notes to the consolidated financial statements.Note 3 for additional details.
We expectelected to adoptutilize the following optional practical expedients available for implementation under the standard. By adopting theseupon adoption: - Package of practical expedients which permits us not to reassess our prior conclusions about lease identification, lease classification, and initial direct costs. - Practical expedient permitting us not to assess whether existing, expired, or current land easements either are or contain a lease. - Practical expedient which permits us as a lessor not to separate non-lease components, such as common area maintenance reimbursements, from the associated lease component, provided that the timing and pattern of transfer of the services are substantially the same. Because of our decision to elect this practical expedient, we will no longer present our Rental Income and Tenant Recovery Income amounts separately on our statements of income, and have reclassified Tenant Recovery Income amounts to Rental Income for all periods presented on the consolidated statements of operations and comprehensive income (loss). - Practical expedient which permits us not be required to reassess (i) whether an expiredrecord a right of use asset or existing contract meets the definitionlease liability related to leases of a lease; (ii) the lease classification at the adoption date for existing leases; and (iii) whether the costs previously capitalized as initial direct costs would continue to be amortized. Thistwelve months or fewer, but instead allows us to continuerecord expense related to accountany such leases as it is incurred.
|
ASU 2018-07, Compensation - Stock Compensation (Topic 718): Improvements to Non-employee Share-Based Payment Accounting | | The amendments in this update expanded the scope of Topic 718: Compensation - Stock Compensation to include share-base payment transactions for our leases where we areacquiring goods and services from non-employees, except for specific guidance on inputs to an option pricing model and the lessee as operating leases, however, any new or renewed leases may be classified as financing leases. We currently have fewer than 50 leasesattribution of cost (that is, the period of time over which share-based payment awards vest and the pattern of cost recognition over that period). | | January 1, 2019 | | The adoption of this type. We also expect to recognize right of use assets and lease liability on our consolidated balance sheets related to certain leases where we are the lessee.
In July 2018, the FASB issued ASU 2018-11. The update allows lessors to use a practical expedient to account for non-lease components and related lease components as a single lease component instead of accounting for them separately, if certain conditions are met. We expect to utilize this practical expedient.
We will continue to evaluate the effect the adoption of these ASUs will have on our consolidated financial statements. However, we currently believe that the adoption willstandard did not have a material impact on our consolidated financial statements.
|
ASU 2018-16, Derivatives and Hedging (Topic 815): Inclusion of the Secured Overnight Financing Rate (SOFR) Overnight Index Swap (OIS) Rate as a Benchmark Interest Rate for operating leases where we areHedge Accounting Purposes | | This update permitted use of the OIS rate based on the SOFR as a lessorUS benchmark interest rate for hedge accounting purposes under Topic 815. The purpose of this was to facilitate the LIBOR to SOFR transition and will continueprovide sufficient lead time for entities to record revenues from rental propertiesprepare for changes to interest rate risk hedging strategies for both risk management and hedge accounting purposes. | | January 1, 2019 | | The adoption of this standard did not have a material impact on our operating leases on a straight-line basis. We are still evaluating the impact for leases where we are the lessee.consolidated financial statements.
|
Reclassifications—The following line itemsitem on our consolidated statements of operations and comprehensive income (loss) for the three and nine months ended September 30, 2017, were reclassified:March 31, 2018, was reclassified to conform to current year presentation:
Unrealized (Loss) Gain on Derivatives and Reclassification of Derivative Loss to Interest Expense wereTenant Recovery was combined to Change in Unrealized Gain (Loss) on Interest Rate Swaps.
Acquisition Expenses were combined to General and Administrative.with Rental Income.
The following line items on our consolidated statements of cash flows for the ninethree months ended September 30, 2017March 31, 2018, were reclassified:reclassified to conform to current year presentation:
Net Loss (Gain) on Write-off of Unamortized Capitalized Leasing Commissions, Market Debt Adjustments, and Deferred FinancingAccounts Receivable - Affiliates was combined with Other Assets;
Share-based Compensation Expense was reclassified from Other; and
Accounts Payable - Affiliates was combined with Accounts Payable and Other Liabilities.
Standard Adoption—Effective January 1, 2019, we adopted ASU 2016-02, Leases. This standard was adopted in conjunction with the related updates, ASU 2018-01, Leases (Topic 842): Land Easement Practical Expedient for Transition to Other.Topic 842; ASU 2018-10, Codification Improvements to Topic 842, Leases; ASU 2018-11, Leases (Topic 842): Targeted Improvements; and ASU 2018-20, Leases (Topic 842): Narrow-Scope Improvements for Lessors, collectively “ASC 842,” using a modified-retrospective approach, as required. Consequently, financial information will not be updated and the disclosures required under the new standard will not be provided for dates and periods before January 1, 2019.
The adoption of ASC 842 resulted in a $0.5 million adjustment to the current year’s opening balance in Accumulated Deficit on the consolidated balance sheets as a result of recognizing ROU assets and lease liabilities as well as adjustments to our collectability reserve. Beginning in January 1, 2019, due to the new standard’s narrowed definition of initial direct costs, we now expense as incurred significant lease origination costs which were previously capitalized as initial direct costs and amortized to expense over the lease term. We capitalized $6.2 million of internal costs for the year ended December 31, 2018, some of which we will continue to capitalize in accordance with the standard. During the three months ended March 31, 2019, the amounts capitalized were $0.7 million, compared to $1.1 million during the three months ended March 31, 2018. Amounts that were capitalized prior to the adoption of ASC 842 will continue to be amortized over their remaining lives.
Additionally, ASC 842 requires that lessors exclude from variable payments all costs paid by a lessee directly to a third party. For the year ended December 31, 2018, $8.0 million in real estate tax payments made by tenants directly to third parties was recorded by us as both Tenant Recovery Income and Real Estate Taxes. This amount was approximately $1.4 million for the three months ended March 31, 2018. Beginning January 1, 2019, such amounts are no longer recognized by us. As the recorded expense was completely offset by the related payments made directly by the tenants to the taxing authorities, this has no net impact to earnings.
Beginning January 1, 2019, operating lease receivables are accounted for under ASC 842, which requires us to recognize changes in the collectability assessment for an operating lease as an adjustment to lease income. For the year ended December 31, 2018, $2.9 million of expense was recorded as Property Operating on our consolidated statements of operations, which would have been recorded as a reduction to Rental Income under the new standard. For the three months ended March 31, 2019, the total amount recorded as a reduction to Rental Income as a result of collectability reserves was $0.5 million.
Lessor—The majority of our leases are largely similar in that the leased asset is retail space within our properties, and the lease agreements generally contain similar provisions and features, without substantial variations. All of our leases are currently classified as operating leases.
Approximate future fixed contractual lease payments to be received under non-cancelable operating leases in effect as of March 31, 2019, assuming no new or renegotiated leases or option extensions on lease agreements, are as follows (in thousands): |
| | | |
| Year | Operating |
| Remaining 2019 | $ | 281,819 |
|
| 2020 | 349,800 |
|
| 2021 | 304,000 |
|
| 2022 | 259,800 |
|
| 2023 | 209,120 |
|
| 2024 and thereafter | 591,618 |
|
| Total | $ | 1,996,157 |
|
No single tenant comprised 10% or more of our aggregate annualized base rent (“ABR”) as of March 31, 2019. As of March 31, 2019, our real estate investments in Florida and California represented 12.2% and 10.2% of our ABR, respectively. As a result, the geographic concentration of our portfolio makes it particularly susceptible to adverse economic or weather developments in the Florida and California real estate markets.
Lessee—As a lessee, we recognized additional operating liabilities of $6.2 million with corresponding ROU assets of $6.0 million, and the difference between them was recorded as an adjustment to Accumulated Deficit on the consolidated balance sheets. These asset and liability amounts represent the present value of the remaining minimum rental payments under current leasing standards for existing leases, adjusted as appropriate for amounts written off in transition to the new guidance. The initial measurement of a ROU asset may differ from the initial measurement of the corresponding lease liability due to initial direct costs, prepaid lease payments, and lease incentives.
Below are the amounts recorded in our consolidated statements of operations and cash flows related to our ROU assets and lease liabilities by lease type (dollars in thousands): |
| | | |
| | Three Months Ended |
| | March 31, 2019 |
| Statements of operations information: | |
| Finance lease cost: | |
| Amortization of ROU assets | $ | 64 |
|
| Interest on lease liabilities | 5 |
|
| Operating lease costs | 348 |
|
| Short term lease expense | 391 |
|
| | |
| Statements of cash flows information: | |
| Operating cash flows used for operating leases | $ | (362 | ) |
| Financing cash flows used for finance leases | (60 | ) |
| ROU assets obtained in exchange for new lease liabilities | 36 |
|
Lease assets, grouped by balance sheet line where they are recorded, consisted of the following as of March 31, 2019 (in thousands): |
| | | |
| | March 31, 2019 |
| Assets | |
| Investment in Real Estate: | |
| ROU asset - operating leases | $ | 4,707 |
|
| Less: accumulated amortization | (85 | ) |
| Total in Investment in Real Estate | 4,622 |
|
| Other Assets: | |
| ROU asset - operating leases | 1,340 |
|
| ROU asset - finance leases | 575 |
|
| Less: accumulated amortization | (314 | ) |
| Total in Other Assets | 1,601 |
|
Total ROU lease assets(1) | $ | 6,223 |
|
| | |
| Liabilities | |
| Accounts Payable and Other Liabilities: | |
| Operating lease liability | $ | 5,886 |
|
| Debt Obligations, Net: | |
| Finance lease liability | 512 |
|
Total lease liabilities(1) | $ | 6,398 |
|
| |
(1) | As of March 31, 2019, the weighted average remaining lease term was approximately 2.0 years for finance leases and 20.5 years for operating leases. The weighted average discount rate was 3.55% for finance leases and 4.16% for operating leases. |
Future undiscounted payments for fixed lease charges by lease type as of March 31, 2019, are as follows (in thousands): |
| | | | | | | |
| | Undiscounted |
| | Operating | | Finance |
| Remaining 2019 | $ | 1,026 |
| | $ | 198 |
|
| 2020 | 927 |
| | 263 |
|
| 2021 | 446 |
| | 66 |
|
| 2022 | 392 |
| | — |
|
| 2023 | 238 |
| | — |
|
| Thereafter | 6,248 |
| | — |
|
| Total undiscounted cash flows from leases | 9,277 |
| | 527 |
|
| Total lease liabilities recorded at present value | 5,886 |
| | 512 |
|
| Difference between undiscounted cash flows and present value of lease liabilities | $ | 3,391 |
| | $ | 15 |
|
|
|
3. PROPOSED4. MERGER WITH REIT II |
In JulyDuring November 2018, we entered intoacquired 86 properties as part of the Merger Agreement, pursuant to which we will merge with REIT II. Under the terms of the Merger, at the time of closing, the following consideration was given in exchange for REIT II in a 100%common stock transaction valued at approximately $1.9 billion. This proposed Merger will create a portfolio of approximately 320 grocery-anchored shopping centers encompassing more than 36 million square feet in established trade areas across 33 states.(in thousands): |
| | | |
| | Amount |
Fair value of PECO common stock issued(1) | $ | 1,054,745 |
|
| Fair value of REIT II debt: | |
| Corporate debt | 719,181 |
|
| Mortgages and notes payable | 102,727 |
|
Derecognition of REIT II management contracts, net(2) | 30,428 |
|
| Transaction costs | 11,587 |
|
| Total consideration and debt activity | 1,918,668 |
|
| Less: debt assumed | 464,462 |
|
| Total consideration | $ | 1,454,206 |
|
| |
(1) | The total number of shares of common stock issued was 95.5 million. |
| |
(2) | Previously a component of Other Assets, Net. |
To complete the proposed Merger, we will issueissued 2.04 shares of our common stock in exchange for each issued and outstanding share of REIT II common stock, which iswas equivalent to $22.54 based on our most recent estimated net asset value per share (“EVPS”), as of the date of the transaction, of $11.05. The exchange ratio iswas based on a thorough review of the relative valuation of each entity, including factoring in our growing investment management business as well as each company’s transaction costs. REIT II’s outstanding debt of approximately $800 million is expected to be refinanced or assumed by us at closing under the terms of the Merger Agreement.
The Merger Agreement provides certain termination rights for REIT II and us. In connection with the termination of the Merger Agreement, under certain specified circumstances, REIT II may be required to pay us a termination fee of $31.7 million and we may be required to pay REIT II a termination fee of $75.6 million. The Merger Agreement provided REIT II with a 30-day go-shop period pursuant to which they could solicit, receive, evaluate, and enter into negotiations with respect to alternative proposals from third-parties. The go-shop period ended during the third quarter.
On a pro forma basis, uponUpon completion of the Merger, we estimate that our continuing stockholders will ownowned approximately 71% of the issued and outstanding shares of the combined companyCompany on a fully diluted basis (determined as if each Operating Partnership unit (“OP unit”) were exchanged for one share of our common stock), and former REIT II stockholders will ownowned approximately 29% of the issued and outstanding shares of the combined companyCompany on a fully diluted basis (determined as if each OP unit were exchanged for one share of our common stock).
Assets Acquired and Liabilities Assumed—After consideration of all applicable factors pursuant to the business combination accounting rules under ASC 805, Business Combinations(“ASC 805”), including the application of a screen test to evaluate if substantially all the fair value of the acquired properties is concentrated in a single asset or group of similar assets, we have concluded that the Merger will be treatedqualified as an asset acquisition.
Additionally, prior to the close of the Merger, all of REIT II’s real properties were managed and leased by us, under the terms of various management agreements. As we had contractual relationships with REIT II, we considered the provisions of ASC 805 regarding the settlement of pre-existing relationships. This guidance provides that a transaction that in effect settles pre-existing relationships between the acquirer and acquiree should be evaluated under the guidance set forth in ASC 805 for possible gain/loss recognition.
In applying the relevant guidance to the settlement of our contractual relationships with REIT II, we noted that the provisions of the various agreements provided both parties to each of the agreements with substantial termination rights. The agreements permitted either party to terminate without cause or penalty upon prior written notice within a specified number of days’ notice. Therefore, we determined that the termination of the agreements did not result in a settlement gain or loss under the relevant guidance, and thus no gain or loss was recorded in the consolidated financial statements.
Prior to the consummation of the Merger, we did, however, have an existing intangible asset related to our acquisition under GAAP. of certain REIT II management contracts. Because this relationship was internalized as part of the Merger, we derecognized the carrying value of these intangible assets upon completion of the Merger and have included the derecognized contract value of $30.4 million in our calculation of total consideration in the table above.
As of September 30,December 31, 2018, we have deferred for capitalization $2.8capitalized approximately $11.6 million in costs related to the merger.
On October 4, 2017, we completed a transaction to acquire certain real estate assets,Merger. The following table summarizes the third-party investment management business, and the captive insurance company of PELP in a stock and cash transaction (“PELP transaction”). Under the terms of this transaction, the following consideration was given in exchange for the contribution of PELP’s ownership interests in 76 shopping centers, its third-party investment management business, and its captive insurance company (in thousands): |
| | | |
| | Amount |
| Fair value of OP units issued | $ | 401,630 |
|
| Debt assumed: | |
| Corporate debt | 432,091 |
|
| Mortgages and notes payable | 72,649 |
|
| Cash payments | 30,420 |
|
| Fair value of earn-out | 38,000 |
|
| Total consideration | 974,790 |
|
| PELP debt repaid by the Company on the transaction date | (432,091 | ) |
| Net consideration | $ | 542,699 |
|
We issued 39.4 million OP units with an estimated fair value per unit of $10.20 at the time of the transaction. Certain of our executive officers who received OP units as part of the PELP transaction entered into an agreement which provides that they will not transfer their OP units for either two or three years following the closing. The remaining holders of the OP units are subject to the terms of exchange for shares of common stock outlined in the Operating Partnership’s Third Amended and Restated Agreement of Limited Partnership (“Partnership Agreement”) (see Note 10). The terms of the PELP transaction included an earn-out structure with an opportunity for up to an additional 12.5 million OP units to be issued. For more detail regarding this earn-out, see Note 14.
Immediately following the closing of the PELP transaction, our stockholders owned approximately 80.6% and former PELP stockholders owned approximately 19.4% of the combined company.
Assets Acquired and Liabilities Assumed—The PELP transaction was accounted for using the acquisition method of accounting under ASC 805, Business Combinations, which requires, among other things, the assets acquired and liabilities assumed to be recognized at their fair values as of the acquisition date. The preliminary fair market value of the assets acquired and liabilities assumed wasfinal purchase price allocation based on a valuation report prepared by a third-party valuation specialist that was subject to management’s review and approval. The following table summarizes the purchase price allocation based on that reportapproval (in thousands): | | | | Amount | Amount |
| Assets: | | |
| Land and improvements | $ | 269,140 |
| $ | 561,100 |
|
| Building and improvements | 574,173 |
| 1,198,884 |
|
| Intangible lease assets | 93,506 |
| 197,384 |
|
| Cash | 5,930 |
| |
| Fair value of unconsolidated joint venture | | 16,470 |
|
| Cash and cash equivalents | | 354 |
|
| Restricted cash | | 5,159 |
|
| Accounts receivable and other assets | 42,426 |
| 33,045 |
|
| Management contracts | 58,000 |
| |
| Goodwill | 29,066 |
| |
| Total assets acquired | 1,072,241 |
| 2,012,396 |
|
| Liabilities: | | |
| Debt assumed | | 464,462 |
|
| Intangible lease liabilities | | 60,421 |
|
| Accounts payable and other liabilities | 48,342 |
| 33,307 |
|
| Acquired below-market leases | 49,109 |
| |
| Total liabilities acquired | 97,451 |
| |
| Total liabilities assumed | | 558,190 |
|
| Net assets acquired | $ | 974,790 |
| $ | 1,454,206 |
|
The allocation of the purchase price wasis based on management’s assessment, which may change in the future as more information becomes available and could have an impact on the unaudited pro forma financial information presented below. Subsequent adjustments made to the purchase price allocation upon the completion of our fair value assessment process will not exceed one year from the acquisition date. The allocation of the purchase price above requiredrequires a significant amount of judgment and representedrepresents management’s best estimate of the fair value as of the acquisition date.
Intangible Assets and Liabilities—The fair value and weighted-average amortization periods for the intangible assets and liabilities acquired in the PELP transaction as of the transaction date were as follows (dollars in thousands, useful life in years): |
| | | | |
| | Fair Value | Weighted-Average Useful Life |
| Management contracts | $ | 58,000 |
| 5 |
| Acquired in-place leases | 83,305 |
| 9 |
| Acquired above-market leases | 10,201 |
| 7 |
| Acquired below-market leases | (49,109 | ) | 13 |
Goodwill—In connection with the PELP transaction, we recorded goodwill of $29.1 million as a result of the consideration exceeding the fair value of the net assets acquired. Goodwill represents the estimated future benefits arising from other assets acquired that could not be individually identified and separately recognized. We do not expect that the goodwill will be deductible for tax purposes. The goodwill recorded represents our management structure and its ability to generate additional opportunities for revenue and raise additional funds, and therefore the full amount of goodwill was allocated to the Investment Management segment, which comprises one reporting unit. For more information about each of our reporting segments, see Note 15.
Results of Operations—The consolidated net assets and results of operations of PELP’s contributions were included in the consolidated financial statements from the transaction date going forward and resulted in the following impact to Revenue and Net Loss for the three and nine months ended September 30, 2018 (in thousands): |
| | | | | | | |
| | Three Months Ended September 30, 2018 | | Nine Months Ended September 30, 2018 |
| Revenue | $ | 20,943 |
| | $ | 63,894 |
|
| Net loss | (16,464 | ) | | (24,999 | ) |
Acquisition Costs—We incurred approximately $17.0 million of costs related to the PELP transaction, $9.8 million of which was incurred during the nine months ended September 30, 2017, and was recorded as Transaction Expenses on the consolidated statements of operations. No costs related to the PELP transaction were recorded in 2018.
Pro Forma Results (Unaudited)—The following unaudited pro forma information summarizes selected financial information from our combined results of operations, as if the PELP transaction had occurred on January 1, 2016. These results contain certain nonrecurring adjustments, such as the elimination of transaction expenses incurred related to the PELP transaction and the elimination of intercompany activity related to creating an internalized management structure. This pro forma information is presented for informational purposes only, and may not be indicative of what actual results of operations would have been had the PELP transaction occurred at the beginning of the period, nor does it purport to represent the results of future operations. |
| | | | | | | |
| (in thousands) | Three Months Ended September 30, 2017 | | Nine Months Ended September 30, 2017 |
| Pro forma revenues | $ | 98,679 |
| | $ | 300,133 |
|
| Pro forma net income attributable to stockholders | 799 |
| | 2,063 |
|
Acquisitions—During the ninethree months ended September 30,March 31, 2019, we did not acquire any properties.
During the three months ended March 31, 2018, we acquired two grocery-anchored shopping centers. The first quarter acquisition closed out the Internal Revenue Code (“IRC”) Section 1031 like-kind exchange outstanding at December 31, 2017. We also acquired one land parcel adjacent to a property we currently own for $0.7 million. During the nine months ended September 30, 2017, we acquired six grocery-anchored shopping centers. All of the 2017 and 2018 acquisitions wereapproximately $8.4 million which was classified as an asset acquisitions. As such, most acquisition-related costs were capitalized and are included in the total purchase prices shown below. Our real estate assets acquired during the nine months ended September 30, 2018, were as follows (dollars in thousands): |
| | | | | | | | | | | | | |
| Property Name | | Location | | Anchor Tenant | | Acquisition Date | | Purchase Price | | Leased % of Rentable Square Feet at Acquisition |
| Shoppes of Lake Village | | Leesburg, FL | | Publix | | 2/26/2018 | | $ | 8,423 |
| | 71.3 | % |
| Sierra Vista Plaza | | Murrieta, CA | | Stater Brothers(1) | | 9/28/2018 | | 22,151 |
| | 81.0 | % |
| |
(1)
| Stater Brothers is in a portion of the shopping center that we do not own. |
During the nine months ended September 30, 2017, we acquired the following real estate assets (dollars in thousands): |
| | | | | | | | | | | | | |
| Property Name | | Location | | Anchor Tenant | | Acquisition Date | | Purchase Price | | Leased % of Rentable Square Feet at Acquisition |
| Atwater Marketplace | | Atwater, CA | | Save Mart | | 2/10/2017 | | $ | 15,041 |
| | 94.6 | % |
| Rocky Ridge Station | | Roseville, CA | | Sprouts | | 4/18/2017 | | 37,271 |
| (1) | 96.3 | % |
| Greentree Station | | Racine, WI | | Pick ‘n Save | | 5/5/2017 | | 12,309 |
| | 90.3 | % |
| Titusville Station | | Titusville, FL | | Publix | | 6/15/2017 | | 13,817 |
| | 71.7 | % |
| Sierra Station | | Corona, CA | | Ralph’s | | 6/20/2017 | | 29,137 |
| (1) | 94.0 | % |
| Hoffman Village Station | | Hoffman Estates, IL | | Mariano’s | | 9/5/2017 | | 34,910 |
| | 93.1 | % |
| |
(1)
| The purchase price includes the fair value of debt assumed as part of the acquisition. |
acquisition. The fair value at acquisition and weighted-average useful life at acquisition for in-place, above-market, and below-market lease intangibles acquired as part of the above transactions during the nine months ended September 30, 2018 and 2017,this acquisition are as follows (dollars in thousands, weighted-average useful life in years): |
| | | | | | | | | | | |
| | 2018 | | 2017 |
| | Fair Value | | Weighted-Average Useful Life | | Fair Value | | Weighted-Average Useful Life |
| Acquired in-place leases | $ | 2,319 |
| | 6 | | $ | 13,647 |
| | 13 |
| Acquired above-market leases | 200 |
| | 5 | | 1,012 |
| | 7 |
| Acquired below-market leases | (1,299 | ) | | 14 | | (3,703 | ) | | 19 |
|
| | | | | |
| | Three Months Ended |
| | March 31, 2018 |
| | Fair Value | | Weighted-Average Useful Life |
| In-place lease assets | $ | 946 |
| | 6 |
| Above-market lease assets | 74 |
| | 3 |
| Below-market lease liabilities | (457 | ) | | 16 |
DispositionsProperty Sales—During the nine months ended September 30, 2018, we sold five grocery-anchored shopping centers for $45.6 million resulting in a gain of $5.6 million.The following table summarizes our property sales activity. We had no dispositionsproperty sales during the ninethree months ended September 30, 2017.March 31, 2018 (dollars in thousands):
|
| | | |
| | Three Months Ended |
| | March 31, 2019 |
| Number of properties sold | 3 |
|
| Proceeds from sale of real estate | $ | 35,755 |
|
Gain on sale of properties, net(1) | 7,399 |
|
| |
(1) | The gain on sale of properties, net does not include miscellaneous write-off activity, which is also recorded in Gain on Disposal of Property, Net on the consolidated statements of operations. |
Property Held for Sale—As of March 31, 2019, one property was classified as held for sale. The property was sold subsequent to March 31, 2019. As of December 31, 2018, we had two properties that were classified as held for sale, and both were sold during the three months ended March 31, 2019. Properties classified as held for sale as of March 31, 2019 and December 31, 2018, were under contract to sell, with no substantive contingencies, and the prospective buyers had significant funds at risk as of the respective reporting date. A summary of assets and liabilities for the properties held for sale as of March 31, 2019 and December 31, 2018, is below (in thousands): |
| | | | | | | |
| | March 31, 2019 | | December 31, 2018 |
| ASSETS | | | |
| Total investment in real estate assets, net | $ | 5,630 |
| | $ | 16,889 |
|
| Other assets, net | 134 |
| | 475 |
|
| Total assets | $ | 5,764 |
| | $ | 17,364 |
|
| LIABILITIES | | | |
| Below-market lease liabilities, net | $ | 223 |
| | $ | 208 |
|
| Accounts payable and other liabilities | 52 |
| | 388 |
|
| Total liabilities | $ | 275 |
| | $ | 596 |
|
Impairment of Real Estate Assets—During the three and nine months ended September 30, 2018,March 31, 2019, we recognized impairment charges totaling $16.8 million and $27.7 million, respectively.$13.7 million. The impairments were associated with certain anticipated property dispositions where the net book value exceeded the estimated fair value, as well as certain properties that we determined to be impaired following the identification of potential operational impairment indicators.value. Our estimated fair value was based upon the contracted price to sell or the marketed price for disposition, or comparable market assets when neither of the first two inputs were available.less costs to sell. We have applied reasonable estimates and judgments in determining the levelamount of impairmentsimpairment recognized. We did not recognize any impairments in 2017.impairment charges during the three months ended March 31, 2018.
|
|
| 6. INVESTMENTS IN UNCONSOLIDATED JOINT VENTURES |
We co-invest with third parties in joint ventures that own multiple properties. As a result of the Merger in November 2018, we acquired a 20% interest in the NRP joint venture. In November 2018, we also entered into an agreement (the “Joint Venture Agreement”) with Northwestern Mutual to create the GRP I joint venture. Under the terms of the Joint Venture Agreement, we contributed or sold all of our ownership interests in 17 grocery-anchored shopping centers to the GRP I joint venture.
The following table details our investment balances in these unconsolidated joint ventures, which are accounted for using the equity method of accounting and are considered to be related parties to us as of March 31, 2019 and December 31, 2018 (dollars in thousands): |
| | | | | | | | | | | | | | | |
| | March 31, 2019 | | December 31, 2018 |
| | NRP | | GRP I | | NRP | | GRP I |
| Ownership percentage | 20 | % | | 15 | % | | 20 | % |
| 15 | % |
| Number of properties | 13 |
| | 17 |
| | 13 |
|
| 17 |
|
| Investment balance | $ | 15,473 |
| | $ | 28,525 |
| | $ | 16,198 |
| | $ | 29,453 |
|
Unamortized basis adjustments(1) | 5,671 |
| | — |
| | 6,026 |
| | — |
|
| |
(1) | Our investment in NRP differs from our proportionate share of the entity’s underlying net assets due to basis differences initially recorded at $6.2 million arising from the Merger and recording the investment at fair value. |
The following table summarizes the operating information of the unconsolidated joint ventures and their impact on our consolidated statements of operations and consolidated statements of equity. We did not have any investments in unconsolidated joint ventures during the three months ended March 31, 2018 (dollars in thousands): |
| | | | | | | |
| | Three Months Ended |
| | March 31, 2019 |
| | NRP | | GRP I |
| Loss from unconsolidated joint ventures, net | $ | 88 |
| | $ | 13 |
|
Amortization of basis adjustments(1) | 355 |
| | — |
|
| Distributions after formation or assumption | 282 |
| | 915 |
|
| |
(1) | These amounts are amortized starting at the date of the Merger and recorded as an offset to earnings from the NRP joint venture in Other Income (Expense), Net on our consolidated statements of operations. |
The following is a summary of Other Assets, Net outstanding as of September 30, 2018March 31, 2019 and December 31, 20172018, excluding amounts related to assets classified as held for sale (in thousands): | | | | September 30, 2018 | | December 31, 2017 | March 31, 2019 | | December 31, 2018 |
| Other assets, net: | | | | | | |
| Deferred leasing commissions and costs | $ | 33,491 |
| | $ | 29,055 |
| $ | 33,981 |
| | $ | 32,957 |
|
| Deferred financing costs | 13,971 |
| | 13,971 |
| |
| Office equipment, including capital lease assets, and other | 13,117 |
| | 10,308 |
| |
| Deferred financing expenses | | 13,971 |
| | 13,971 |
|
| Office equipment, ROU assets, and other | | 16,177 |
| | 14,315 |
|
| Total depreciable and amortizable assets | 60,579 |
| | 53,334 |
| 64,129 |
| | 61,243 |
|
| Accumulated depreciation and amortization | (23,678 | ) | | (17,121 | ) | (26,583 | ) | | (24,382 | ) |
| Net depreciable and amortizable assets | 36,901 |
| | 36,213 |
| 37,546 |
| | 36,861 |
|
| Accounts receivable, net | 37,025 |
| | 41,211 |
| 43,903 |
| | 56,104 |
|
| Deferred rent receivable, net | 21,594 |
| | 18,201 |
| 22,912 |
| | 21,261 |
|
| Derivative asset | 37,708 |
| | 16,496 |
| 16,154 |
| | 29,708 |
|
| Prepaid expenses | 8,015 |
| | 4,232 |
| |
| Investment in affiliates | 903 |
| | 902 |
| 700 |
| | 700 |
|
| Other | 6,297 |
| | 1,193 |
| |
| Prepaids and other | | 15,465 |
| | 8,442 |
|
| Total other assets, net | $ | 148,443 |
| | $ | 118,448 |
| $ | 136,680 |
| | $ | 153,076 |
|
The following is a summary of the outstanding principal balances and interest rates, which include the effect of derivative financial instruments, on our debt obligations as of September 30, 2018March 31, 2019 and December 31, 20172018 (dollars in thousands): |
| | | | | | | | | |
| | Interest Rate | | September 30, 2018 | | December 31, 2017 |
Revolving credit facility(1) | LIBOR + 1.40% | | $ | 55,568 |
| | $ | 61,569 |
|
Term loans(2) | 2.51% - 3.93% | | 1,205,000 |
| | 1,140,000 |
|
| Secured loan facility due 2026 | 3.55% | | 175,000 |
| | 175,000 |
|
| Secured loan facility due 2027 | 3.52% | | 195,000 |
| | 195,000 |
|
Mortgages and other(3) | 3.75% - 7.91% | | 222,205 |
| | 246,217 |
|
Assumed market debt adjustments, net(4) | | | 4,211 |
| | 5,254 |
|
Deferred financing costs(5) | | | (14,037 | ) | | (16,042 | ) |
| Total | | | $ | 1,842,947 |
| | $ | 1,806,998 |
|
|
| | | | | | | | | |
| | Interest Rate(1) | | March 31, 2019 | | December 31, 2018 |
Revolving credit facility(2) | LIBOR + 1.40% | | $ | 51,359 |
| | $ | 73,359 |
|
| Term loans | 2.06%-4.59% | | 1,858,410 |
| | 1,858,410 |
|
| Secured portfolio loan facility | 3.52% | | 195,000 |
| | 195,000 |
|
| Mortgages | 3.45%-7.91% | | 331,749 |
| | 334,117 |
|
| Finance lease liability | | | 512 |
| | 552 |
|
| Assumed market debt adjustments, net | | | (4,209 | ) | | (4,571 | ) |
| Deferred financing expenses, net | | | (17,059 | ) | | (18,041 | ) |
| Total | | | $ | 2,415,762 |
| | $ | 2,438,826 |
|
| |
(1) | Interest rates are as of March 31, 2019. |
| |
(2) | The gross borrowings and payments under our revolving credit facility were $219.064.0 million and $225.086.0 million, respectively, during the ninethree months ended September 30, 2018March 31, 2019. The revolving credit facility has a capacity of $500 milliongross borrowings and matures in October 2021, with additional options to extend the maturity to October 2022. |
| |
(2)
| We have six term loans with maturities ranging from 2019 to 2024. The $100 million term loan due in 2019 has options to extend the maturity to 2021. We will consider options for refinancing the loan or exercising the option upon maturity. As of September 30, 2018, the availability onpayments under our revolving credit facility exceeded the balance on the loan. Thewere $175 million term loan due in 2020 has options to extend its maturity to 2021. We executed a $65 million delayed draw in January 2018 on one of our term loans that originated in October 2017.
|
| |
(3)
| Due to the non-recourse nature of our fixed-rate mortgages, the assets and liabilities of the properties securing such mortgages are neither available to pay the debts of the consolidated property-holding limited liability companies, nor do they constitute obligations of such consolidated limited liability companies as of September 30, 2018 and December 31, 2017.
|
| |
(4)
| Net of accumulated amortization of $4.055.0 million and $3.791.0 million as of, respectively, during the September 30,three months endedMarch 31, 2018 and December 31, 2017, respectively.
|
| |
(5)
| Net of accumulated amortization of $7.9 million and $5.4 million as of September 30, 2018 and December 31, 2017, respectively..
|
As of September 30, 2018March 31, 2019 and December 31, 2017,2018, the weighted-average interest rate, including the effect of derivative financial instruments, for all of our debt obligations was 3.5% and 3.4%, respectively.
.
The allocation of total debt between fixed-fixed-rate and variable-rate as well as between secured and unsecured, excluding market debt adjustments and deferred financing costs,expenses, net, as of September 30, 2018March 31, 2019 and December 31, 2017,2018, is summarized below (in thousands): | | | | September 30, 2018 | | December 31, 2017 | March 31, 2019 | | December 31, 2018 |
As to interest rate:(1) | | | | | | |
| Fixed-rate debt | $ | 1,584,205 |
| | $ | 1,608,217 |
| $ | 2,114,261 |
| | $ | 2,216,669 |
|
| Variable-rate debt | 268,568 |
| | 209,569 |
| 322,769 |
| | 244,769 |
|
| Total | $ | 1,852,773 |
| | $ | 1,817,786 |
| $ | 2,437,030 |
| | $ | 2,461,438 |
|
| As to collateralization: | | | | | | |
| Unsecured debt | $ | 1,261,180 |
| | $ | 1,202,476 |
| $ | 1,909,769 |
| | $ | 1,931,769 |
|
| Secured debt | 591,593 |
| | 615,310 |
| 527,261 |
| | 529,669 |
|
| Total | $ | 1,852,773 |
| | $ | 1,817,786 |
| $ | 2,437,030 |
| | $ | 2,461,438 |
|
| |
(1) | Includes the effects of derivative financial instruments (see Notes 89 and 1415). |
|
|
8.9. DERIVATIVES AND HEDGING ACTIVITIES |
Risk Management Objective of Using Derivatives—We are exposed to certain risks arising from both our business operations and economic conditions. We principally manage our exposure to a wide variety of business and operational risks through management of our core business activities. We manage economic risks, including interest rate, liquidity, and credit risk, primarily by managing the amount, sources, and duration of our debt funding, and through the use of derivative financial instruments. Specifically, we enter into interest rate swaps to manage exposures that arise from business activities that result in the receipt or payment of future known and uncertain cash amounts, the value of which are determined by interest rates. Our derivative financial instruments are used to manage differences in the amount, timing, and duration of our known or expected cash receipts and our known or expected cash payments principally related to our investments and borrowings.
Cash Flow Hedges of Interest Rate Risk—Interest rate swaps designated as cash flow hedges involve the receipt of variable amounts from a counterparty in exchange for our making fixed-rate payments over the life of the agreements without exchange of the underlying notional amount.
The changechanges in the fair value of derivatives designated, and that qualify, as cash flow hedges isare recorded in AOCI and isare subsequently reclassified into earnings in the period that the hedged forecasted transaction affects earnings. During the ninethree months ended September 30,March 31, 2019 and 2018, and 2017, such derivatives were used to hedge the variable cash flows associated with certain variable-rate debt. The ineffectiveness previously reported in earnings for the period ended September 30, 2017, was adjusted to reflect application of the provisions of ASU 2017-12, Derivatives and Hedging (Topic 815), as of the beginning of 2017. This adjustment was not material.
Amounts reported in AOCI related to these derivatives will be reclassified to Interest Expense, Net as interest payments are made on the variable-rate debt. During the next twelve months, we estimate that an additional $8.8$3.7 million will be reclassified from Other Comprehensive Income (“OCI”)AOCI as a decrease to Interest Expense, Net.
The following is a summary of our interest rate swaps that were designated as cash flow hedges of interest rate risk as of September 30, 2018March 31, 2019 and December 31, 20172018 (notional amountamounts in thousands): | | | | | | | March 31, 2019 | | December 31, 2018 |
| Count | Fixed LIBOR | Maturity Date | Notional Amount | 11 |
| | 12 |
|
| 6 | 1.2% - 2.2% | 2019-2024 | $ | 992,000 |
| |
| Notional amount | | $ | 1,587,000 |
| | $ | 1,687,000 |
|
| Fixed LIBOR | | 0.7% - 2.9% |
| | 0.7% - 2.9% |
|
| Maturity date | | 2019 - 2025 |
| | 2019 - 2025 |
|
The table below details the locationnature of the gain or loss recognized on interest rate derivatives designated as cash flow hedges in the consolidated statements of operations and comprehensive income (loss) for the three and nine months ended September 30, 2018 and 2017 (in thousands): |
| | | | | | | | | | | | | | | |
| | Three Months Ended September 30, | | Nine Months Ended September 30, |
| | 2018 | | 2017 | | 2018 | | 2017 |
Amount of gain (loss) recognized in OCI on derivative(1) | $ | 4,061 |
| | $ | (179 | ) | | $ | 23,107 |
| | $ | (1,944 | ) |
Amount of (gain) loss reclassified from AOCI into interest expense(1) | (1,192 | ) | | 228 |
| | (1,895 | ) | | 1,203 |
|
|
| | | | | | | |
| | Three Months Ended |
| | March 31, |
| | 2019 | | 2018 |
Amount of (loss) gain recognized in other comprehensive income on derivatives(1) | $ | (12,857 | ) | | $ | 13,440 |
|
Amount of (gain) loss reclassified from AOCI into interest expense(1) | (1,504 | ) | | 48 |
|
| |
(1) | IncreasesChanges in gainsvalue are solely driven from changes in LIBOR and LIBOR futures.futures as a result of various economic factors. |
Credit-risk-related Contingent Features—We have agreements with our derivative counterparties that contain provisions where, if we default, or are capable of being declared in default, on any of our indebtedness, we could also be declared to be in default on our derivative obligations. As of March 31, 2019, the fair value of our derivatives in a net liability position, which included accrued interest but excluded any adjustment for nonperformance risk related to these agreements, was approximately $6.3 million. As of March 31, 2019, we had not posted any collateral related to these agreements and were not in breach of any agreement provisions. If we had breached any of these provisions, we could have been required to settle our obligations under the agreements at their termination value of $6.3 million.
|
|
9.10. COMMITMENTS AND CONTINGENCIES |
Litigation—We are involved in various claims and litigation matters arising in the ordinary course of business, some of which involve claims for damages. Many of these matters are covered by insurance, although they may nevertheless be subject to deductibles or retentions. Although the ultimate liability for these matters cannot be determined, based upon information currently available, we believe the resolution of such claims and litigation will not have a material adverse effect on our consolidated financial statements.
Environmental Matters—In connection with the ownership and operation of real estate, we may potentially be liable for costs and damages related to environmental matters. In addition, we may own or acquire certain properties that are subject to environmental remediation. Generally,Depending on the nature of the environmental matter, the seller of the property, thea tenant of the property, and/or another third party ismay be responsible for environmental remediation costs related to a property. Additionally, in connection with the purchase of certain properties, the respective sellers and/or tenants may agree to indemnify us against future remediation costs. We also carry environmental liability insurance on our properties that provides limited coverage for any remediation liability and/or pollution liability for third-party bodily injury and/or property damage claims for which we may be liable. We are not aware of any environmental matters which we believe are reasonably likely to have a material effect on our consolidated financial statements.
On May 9, 2018,General— The holders of common stock are entitled to one vote per share on all matters voted on by stockholders, including one vote per nominee in the election of our board of directors (“Board”). Our charter does not provide for cumulative voting in the election of directors.
On May 8, 2019, our Board increased the EVPS of our common stock to $11.05$11.10 based substantially on the estimated market value of our portfolio of real estate properties and our third-party investment management business as of March 31, 2018.2019. We engaged a third-party valuation firm to provide a calculation of the range in EVPS of our common stock as of March 31, 2018,2019, which reflected certain balance sheet assets and liabilities as of that date. Previously, on November 8, 2017,May 9, 2018, our Board increased the EVPS of our common stock to $11.00$11.05 from $10.20$11.00 based substantially on the estimated market value of our portfolio of real estate properties and our third-party investment management business as of October 5, 2017, the first full business day after the closing of the PELP transaction.March 31, 2018.
Shares of our common stock are issued under the Dividend Reinvestment Plan (the “DRIP”)DRIP and redeemed under the Share Repurchase Program (“SRP”), as discussed below, at the same price as the EVPS in effect at the time of issuance or redemption.
Dividend Reinvestment Plan—The DRIP allows stockholders to invest distributions in additional shares of our common stock. stock, subject to certain limits. Stockholders who elect to participate in the DRIP may choose to invest all or a portion of their cash distributions in shares of our common stock at a price equal to our most recent estimated value per share.
Stockholders who elect to participate in the DRIP, and who are subject to U.S. federal income taxation laws, will incur a tax liability on an amount equal to the fair value on the relevant distribution date of the shares of our common stock purchased with reinvested distributions, even though such stockholders have elected not to receive the distributions in cash. In connection with the proposed Merger (see Note 3), the DRIP was temporarily suspended for the month of July 2018; therefore, all DRIP participants received their July 2018 distribution in cash rather than in stock. The DRIP plan resumed in August 2018, with the distribution paid in September 2018.
Share Repurchase Program—Our SRP provides an opportunity for stockholders to have shares of common stock repurchased, subject to certain restrictions and limitations.limitations, at a price equal to our most recent EVPS. The Board reserves the right, in its sole discretion, at any time and from time to time, to reject any request for repurchase. Further, the cash available for repurchases on any particular date, of which we may use all or any portion, will generally be limited to the proceeds from the DRIP during the preceding four fiscal quarters, less amounts already used for repurchases since the beginning of that period. In connection with the Merger, the SRP was also temporarily suspended for the month of July 2018 and resumed in August 2018.
During the ninethree months ended September 30, 2018,March 31, 2019, repurchase requests surpassed the funding limits under the SRP. Approximately 4.50.6 million shares of our common stock were repurchased under the SRP during the ninethree months ended September 30, 2018.March 31, 2019. Repurchase requests in connection with a stockholder’s death, “qualifying disability,” or “determination of incompetence” were completed in full. The remaining repurchase requests that were in good order were fulfilled on a pro rata basis. Due to the program's funding limits, no funds will be available for the remainder of 2018. However, weWe will continue to fulfill repurchases sought upon a stockholder's death, “qualifying disability,” or “determination of incompetence” in accordance with the terms of the SRP.
In connection with the proposed Merger, the combined company will be required to reset its share repurchase queue. As a result, all SRP requests currently on file will be canceled on the date the Merger closes. All stockholders wishing to participate in the SRP after the Merger must submit a new SRP form to the transfer agent, DST, after the Merger to be included in the next standard repurchase of the combined company. All standard repurchase requests must be on file and in good order to be included for next standard repurchase of the combined company, which is expected to be in July 2019. At that time, should the demand for standard redemptions exceed the funding available for repurchases, the combined company is expected to make pro-rata redemptions. Following that standard repurchase, standard repurchase requests that are on file with the combined company and in good order that have not been fully executed (due to pro-rata redemptions), will remain on file for future redemptions.
Convertible Noncontrolling Interests—As part of the PELP transaction, we issued 39.4 million OP units that are classified as Noncontrolling Interests. Prior to the PELP transaction, the Operating Partnership also issued limited partnership units that were designated as Class B units for asset management services provided by our former advisor. Upon closing of the PELP transaction, all outstanding Class B units vested and were converted to OP units.
Under the terms of the Partnership Agreement, OP unit holders may elect to exchange OP units. The Operating Partnership controls the form of the redemption, and may elect to exchange OP units for shares of our common stock, provided that the
OP units have been outstanding for at least one year. As the form of redemption for OP units is within our control, the OP units outstanding as of September 30, 2018March 31, 2019 and December 31, 2017,2018, are classified as Noncontrolling Interests within permanent equity on our consolidated balance sheets. The cumulative distributions that have been paid on OP units are included in Distributions to Noncontrolling Interests on the consolidated statements of equity. During the three months ended March 31, 2019, 0.7 million OP units were converted into shares of our common stock at a 1:1 ratio. There were approximately 43.9 million and 44.5 million OP units outstanding as of September 30, 2018March 31, 2019 and December 31, 2017.2018, respectively.
Nonconvertible Noncontrolling Interests—In addition to partnership units of the Operating Partnership, Noncontrolling Interests also includes a 25% ownership share of one of our subsidiaries who provides advisory services, which was not significant to our results.
Awards to employees under our Amended and Restated 2010 Long-Term Incentive Plan are typically granted and vest during the first quarter of each year. We also grant restricted stock to our independent directors under our Amended and Restated 2010 Independent Director Stock Plan, which vest based upon the completion of a service period. Certain of our executives have made the election to receive OP units in lieu of shares of common stock upon vesting of their award grants. All share-based compensation awards, regardless of the form of payout upon vesting, are presented in the following table, which summarizes our stock-based award activity (number of units in thousands): |
| | | | | | | | | | | | |
| | Three Months Ended |
| | March 31, 2019 |
| | Restricted Stock Awards | | Performance Stock Awards(1) | | Phantom Stock Units | | Weighted-Average Grant-Date Fair Value(2) |
| Nonvested at December 31, 2018 | 808 |
| | 199 |
| | 998 |
| | $ | 10.60 |
|
| Granted | 464 |
| | 1,275 |
| | — |
| | 11.05 |
|
| Vested | (172 | ) | | — |
| | — |
| | 11.00 |
|
| Forfeited | (1 | ) | | — |
| | (1 | ) | | 10.58 |
|
| Nonvested at March 31, 2019 | 1,099 |
| | 1,474 |
| | 997 |
| | $ | 10.80 |
|
| |
(1) | Certain performance-based awards granted during the period contain terms which dictate that the number of award units to be issued will vary based upon actual performance compared to target performance. The number of shares deemed to be issued per this table reflect our probability-weighted estimate of the number of shares that will vest based upon current and expected company performance. The maximum number of award units to be issued under all outstanding grants, excluding phantom stock units as they are settled in cash, was 4.0 million and 1.2 million as of March 31, 2019 and December 31, 2018, respectively. |
| |
(2) | On an annual basis, we engage an independent third-party valuation advisory consulting firm to estimate the EVPS of our common stock. |
On March 12, 2019, the Compensation Committee of the Company’s Board of Directors (the “Committee”) approved a new form of award agreement under the Company’s Amended and Restated 2010 Long-Term Incentive Plan for performance-based long term incentive units (“Performance LTIP Units”) and made one-time grants of Performance LTIP Units to certain of our executives. Any amounts earned under the Performance LTIP Unit award agreements will be issued in the form of LTIP Units, which represent OP units that are structured as a profits interest in the Operating Partnership. Dividends will accrue on the Performance LTIP Units until the measurement date, subject to a quarterly distribution of 10% of the regular quarterly distributions.
The expense for all stock-based awards, including phantom stock units, during the three months ended March 31, 2019 and 2018 was $2.0 million and $1.6 million, respectively. We had $26.3 million of unrecognized compensation costs related to these awards that we expect to recognize over a weighted average period of approximately 4.3 years. The fair value at the vesting date for stock-based awards that vested during the period ended March 31, 2019 was $1.9 million.
|
|
11.13. EARNINGS PER SHARE |
We use the two-class method of computing earnings per share (“EPS”), which is an earnings allocation formula that determines EPS for common stock and any participating securities according to dividends declared (whether paid or unpaid). Under the two-class method, basic EPS is computed by dividing Net Loss Attributable to Stockholders by the weighted-average number of shares of common stock outstanding for the period. Diluted EPS reflects the potential dilution that could occur from share equivalent activity.
OP units held by limited partners other than us are considered to be participating securities because they contain non-forfeitable rights to dividends or dividend equivalents, and have the potential to be exchanged for an equal number of shares of our common stock in accordance with the terms of the Fourth Amended and Restated Agreement of Limited Partnership Agreement.of the Operating Partnership. Phantom stock units are not considered to be participating securities, as they are not convertible into common stock.
The impact of OP units on basic and diluted EPS has been calculated using the two-class method whereby earnings are allocated to the OP units based on dividends declared and the OP units’ participation rights in undistributed earnings. The effects of the two-class method on basic and diluted EPS were immaterial to the consolidated financial statements as of September 30, 2018March 31, 2019 and 2017.2018.
The following table provides a reconciliation of the numerator and denominator of the earnings per share calculations for the three and nine months ended September 30, 2018 and 2017 (in thousands, except per share amounts):
| | | | | | | | | | | | Three Months Ended |
| | Three Months Ended September 30, | | Nine Months Ended September 30, | March 31, |
| | 2018 | | 2017 | | 2018 | | 2017 | 2019 | | 2018 |
| Numerator: | | | | | | | | | | |
| Net loss attributable to stockholders - basic | $ | (13,228 | ) | | $ | (8,232 | ) | | $ | (26,179 | ) | | $ | (8,319 | ) | $ | (5,195 | ) | | $ | (1,600 | ) |
Net loss attributable to convertible OP units(1) | (3,180 | ) | | (144 | ) | | (6,270 | ) | | (144 | ) | |
| Net loss attributable to stockholders and convertible noncontrolling interests - diluted | $ | (16,408 | ) | | $ | (8,376 | ) | | $ | (32,449 | ) | | $ | (8,463 | ) | |
Net income (loss) attributable to convertible OP units(1) | | (783 | ) | | (334 | ) |
| Net loss - diluted | | $ | (5,978 | ) | | $ | (1,934 | ) |
| Denominator: | | | | | | | | | | |
| Weighted-average shares - basic | 183,699 |
| | 183,843 |
| | 184,676 |
| | 183,402 |
| 281,263 |
| | 185,899 |
|
OP units(1) | 44,453 |
|
| 2,649 |
| | 44,453 |
| | 2,739 |
| 43,996 |
|
| 44,453 |
|
| Adjusted weighted-average shares - diluted | 228,152 |
| | 186,492 |
| | 229,129 |
| | 186,141 |
| 325,259 |
| | 230,352 |
|
| Earnings per common share: | | | | | | | | | | |
Net loss attributable to stockholders - basic and diluted | $ | (0.07 | ) | | $ | (0.04 | ) | | $ | (0.14 | ) | | $ | (0.05 | ) | |
| Basic and diluted | | $ | (0.02 | ) | | $ | (0.01 | ) |
(1) OP units include units previously issued for asset management services provided under our former advisory agreement (see Note 13), as well as units issued as part of the PELP transaction (Note 4), all of whichthat are convertible into common stock.stock or cash, at the Operating Partnership’s option. The Operating Partnership lossincome (loss) attributable to these OP units, which is included as a component of Net IncomeLoss Attributable to Noncontrolling Interests on the consolidated statements of operations, has been added back in the numerator as these OP units were included in the denominator for all years presented.
As of September 30,March 31, 2019 and 2018, approximately 2.6 million and 1.0 million, respectively, unvested restricted stock awards granted to employees and directors were outstanding. These securities were anti-dilutive, and, as a result, weretheir impact was excluded from the weighted-average common shares used to calculate diluted EPS. The unvested restricted stock awards outstanding at September 30, 2017, were immaterial. There were 2.7 million unvested Class B units outstanding as of September 30, 2017. As these units were unvested, they were not included in the diluted earnings per share calculation. We had no unvested Class B units outstanding as of September 30, 2018.
|
|
12.14. REVENUE RECOGNITION AND RELATED PARTY REVENUETRANSACTIONS |
Effective January 1, 2018, we adopted ASU 2014-09, RevenueRevenue from Contracts with Customers, using the modified retrospective approach. The majority of our revenue is lease revenue derived from our Owned Real Estate segment (see Note 15). We record these—Summarized below are amounts as Rental Income and Tenant Recovery Income on the consolidated statements of operations. These revenue amounts are excluded from the scope of ASU 2014-09, as they are accounted for under Topic 840, Leases.
included in Fee revenues from our Investment Management segment are earned by providing services to the Managed Funds. These fees are within the scope of ASU 2014-09 and are recorded as Fees and Management Income on the consolidated statements of operations. Additional immaterial revenue is recorded as Other Property Income on the consolidated statements of operations. The adoption of ASU 2014-09 did not result in any retrospective adjustments to prior periods as our previous revenue recognition policies aligned with the updated guidance.
The Investment Management segment provides services to Managed Funds that are considered related parties. These services primarily include asset acquisition and disposition services, asset management, operating and leasing of properties, construction management, and other general and administrative responsibilities. These services are currently provided under two types of contracts: advisory agreements and property management agreements. Advisory agreements have a duration of one year and are renewed annually at the discretion of the respective boards, but can be terminated upon notice by either party. Property management agreements include both property management agreements and master services agreements, which we have determined should be evaluated as a single agreement for revenue recognition under GAAP. Property management agreements have no defined term, but can be canceled by either party upon 30 days’ notice.
Summarized below is all fee and management revenue for the Investment Management segment.Income. The revenue includes the fees and reimbursements earned by us from the Managed Funds, for the three and nine months ended September 30, 2018, and other revenues that are not in the scope of ASC 606Revenue from Contracts with Customers, but are included in this table for the purpose of disclosing all related party revenues (in thousands): |
| | | | | | | | | | | | | | | | | | | | | | | |
| | Three Months Ended
September 30, 2018 | | Nine Months Ended September 30, 2018 |
| | REIT II | | Other Parties | | Total | | REIT II | | Other Parties | | Total |
| Advisory revenue: | | | | | | | | | | | |
| Acquisition fees | $ | — |
| | $ | 379 |
| | $ | 379 |
| | $ | 162 |
| | $ | 635 |
| | $ | 797 |
|
| Asset management fees | 3,084 |
| | 342 |
| | 3,426 |
| | 9,212 |
| | 917 |
| | 10,129 |
|
| Other advisory fees and reimbursements | 143 |
| | 146 |
| | 289 |
| | 796 |
| | 305 |
| | 1,101 |
|
| Total advisory revenue | 3,227 |
| | 867 |
| | 4,094 |
| | 10,170 |
| | 1,857 |
| | 12,027 |
|
| | | | | | | | | | | | |
| Property Management and Services revenue: | | | | | | | | | | | |
| Property management fees | 1,977 |
| | 345 |
| | 2,322 |
| | 6,181 |
| | 1,061 |
| | 7,242 |
|
| Leasing commissions | 1,192 |
| | 245 |
| | 1,437 |
| | 3,703 |
| | 659 |
| | 4,362 |
|
| Construction management fees | 308 |
| | 42 |
| | 350 |
| | 511 |
| | 175 |
| | 686 |
|
Other property management fees and reimbursements | 155 |
| | 88 |
| | 243 |
| | 577 |
| | 331 |
| | 908 |
|
| Total property management and services revenue | 3,632 |
| | 720 |
| | 4,352 |
| | 10,972 |
| | 2,226 |
| | 13,198 |
|
| | | | | | | | | | | | |
| Other revenue: | | | | | | | | | | | |
Insurance premiums(1) | 90 |
| | 437 |
| | 527 |
| | 277 |
| | 1,320 |
| | 1,597 |
|
| Non-operating property revenue | — |
| | 138 |
| | 138 |
| | — |
| | 408 |
| | 408 |
|
| Total fees and management income | $ | 6,949 |
| | $ | 2,162 |
| | $ | 9,111 |
| | $ | 21,419 |
| | $ | 5,811 |
| | $ | 27,230 |
|
|
| | | | | | | | | | | | | | | |
| | Three Months Ended |
| | March 31, 2019 |
| | PECO III | | Joint Ventures | | Other Parties(1) | | Total |
Recurring fees(2) | $ | 194 |
| | $ | 1,329 |
| | $ | 59 |
| | $ | 1,582 |
|
Transactional revenue and reimbursements(3) | 812 |
| | 405 |
| | 5 |
| | 1,222 |
|
| Insurance premiums | 3 |
| | — |
| | 454 |
| | 457 |
|
| Total fees and management income | $ | 1,009 |
| | $ | 1,734 |
| | $ | 518 |
| | $ | 3,261 |
|
| |
(1) | Insurance premium income from other parties wasincludes amounts from third parties not affiliated with us.us in the amount of $0.5 million for the three months ended March 31, 2019. |
Because the PELP transaction occurred in October 2017, no fee and management income was earned during the nine months ended September 30, 2017.
Advisory Agreements—Under our advisory agreements, we earn revenue for managing day-to-day activities and implementing the investment strategy for the Managed Funds. The wide variety of duties as the advisor within these contracts makes determining the performance obligations within the contracts a matter of judgment. We have concluded that each of the separately disclosed fee types in the below table represents a separate performance obligation within the contract.
Due to the nature of the services being provided under the Advisory Agreements, each performance obligation within the contract has a variable component. Therefore when we determine the transaction price for the contract we are required to constrain our estimate to an amount that is not probable of significant revenue reversal. For the acquisition and disposition services, compensation only occurs if the transaction takes place, and the amount of compensation is dependent upon the contract price for the transaction. Property acquisition and disposition fees are recognized when we satisfy a performance obligation by acquiring a property or transferring control of a property. These fees are billed subsequent to the acquisition or sale of the property and payment is due thereafter.
The following table summarizes the fee structure for our advisory agreements: |
| | | | | | |
Fee Type(2) | Recurring fees include asset management fees and property management fees. |
| Performance Obligation Satisfied | | Timing of Payment | | Revenue Recognition |
Acquisition Fee(3) | Transaction revenue includes items such as leasing commissions, construction management fees, and acquisition fees. |
|
| | | | | | | | | | | | | | | | | | | |
| | Three Months Ended |
| | March 31, 2018 |
| | REIT II(1) | | PECO III | | Joint Ventures | | Other Parties(2) | | Total |
| Recurring fees | $ | 5,144 |
| | $ | 181 |
| | $ | 376 |
| | $ | 76 |
| | $ | 5,777 |
|
| Transactional revenue and reimbursements | 1,711 |
| | 322 |
| | 320 |
| | 58 |
| | 2,411 |
|
| Other revenue | 80 |
| | — |
| | — |
| | 444 |
| | 524 |
|
| Total fees and management income | $ | 6,935 |
| | $ | 503 |
| | $ | 696 |
| | $ | 578 |
| | $ | 8,712 |
|
| Point in time (upon |
(1) | All amounts earned from REIT II were earned prior to the close of transaction)the Merger in November 2018, and ceased upon its acquisition by us. |
| | In cash upon close of transaction | | Revenue is recognized based on a percentage of the contract purchase price, including acquisition expenses and any debt. |
Disposition Fee(2) | | PointRecurring fees and other revenue from other parties includes amounts from third parties not affiliated with us in time (upon closethe amount of transaction) | | In cash upon completion | | Revenue is recognized based on a percentage of$0.4 million for the contract sales price. |
Asset Management Fee and Subordinated Participation | | Over time | | Monthly, in cash and/or ownership units | | Because each increment of service is distinct, although substantially the same, revenue is recognized at the end of each reporting period based on a percentage of the cost of assets under management or the applicable NAV.three months ended March 31, 2018. |
In addition to the fees listed above, our management company contracts include the potential for additional revenues if certain market conditions are in place or certain events take place. We have not recognized revenue related to these fees, nor will we until it is no longer highly probable that there would be a material reversal of revenue.
Property Management Agreements—Under our property management agreements, we earn revenue for managing day-to-day activities at the properties of the Managed Funds, for which we receive a distinct fee based on a set percentage of gross cash receipts each month. Under the property management agreements, we also serve as a leasing agent to the Managed Funds. For each new lease, lease renewal, and expansion we receive a distinct fee in the form of a leasing commission.
Leasing commissions are recognized at lease execution and are dependent on the terms of the lease. Additionally, we assist in overseeing the construction of various improvements for Managed Funds, for which we receive a distinct fee based on a set percentage of total project cost calculated upon completion of construction. Because both parties in these contracts can cancel upon 30 days’ notice without penalties, their term is considered month-to-month.
The wide variety of duties as the property manager within these contracts makes determining the performance obligations within the contracts a matter of judgment. We have concluded that each of the separately disclosed fee types in the contracts, property management, leasing, and construction management, represents a separate performance obligation within the contract.
Due to the nature of the services being provided under the property management agreements, each performance obligation within the contract has a variable consideration component. However, due to the month-to-month term of these contracts, any uncertainty regarding the amounts to be earned over the contract term is resolved by the end of that month. As a result, we can reliably calculate the amount of the consideration to be recognized with regards to each performance obligation each month.
All property management agreements have terms as follows: |
| | | | | | |
Fee | | Performance Obligation Satisfied | | Timing of Payment | | Revenue Recognition |
Property Management | | Over time | | In cash, monthly | | Revenue is recognized based on a percentage of monthly cash receipts at each property. |
Leasing Commissions | | Point in time | | In cash upon completion | | Revenue is recognized based on a percentage of the contractual payments to be received per the terms of the lease and occurs when the lease is executed. |
Construction Management | | Point in time | | In cash upon completion | | Revenue is recognized based on a percentage of the cost of the construction project. Revenue recognition occurs upon completion of the contract (in the case of a normal capital improvement) or upon the tenant taking possession (in the case of a tenant improvement). |
Both the advisory agreements and property management agreements have an original duration of one year or less, and we utilize the practical expedient applicable to such contracts and have not disclosed the transaction price for the remaining performance obligations as of the end of each reporting period nor when we expect to recognize this revenue. Due to the duration of the contracts, we have also utilized the practical expedient and made no adjustment to contract consideration for the effects of financing components.
Related Party Receivables—Summarized below is the detail of our outstanding receivable balance from related parties as of September 30, 2018 and December 31, 2017, respectively (in thousands): |
| | | | | | | | | | | | | | | |
| | September 30, 2018 | | December 31, 2017 |
| | REIT II | | Other Parties | | REIT II | | Other Parties |
| Contract receivables: | | | | | | | |
| Advisory | $ | 109 |
| | $ | 171 |
| | $ | 256 |
| | $ | 51 |
|
| Property management and services | 1,178 |
| | 188 |
| | 1,264 |
| | 128 |
|
| Total contract receivables | 1,287 |
| | 359 |
| | 1,520 |
| | 179 |
|
| Other | 119 |
| | 4,473 |
| | 72 |
| | 4,331 |
|
| Total | $ | 1,406 |
| | $ | 4,832 |
| | $ | 1,592 |
| | $ | 4,510 |
|
OrganizationalOrganization and Offering Costs—Under the terms of the advisory agreement,one of our Management Agreements, we have incurred organizationalorganization and offering costs related to PECO III allsince 2017. As of March 31, 2019, we have incurred organization and offering costs related to PECO III’s private placement and public offering, which currently arewere approximately $2.3 million and $2.4 million, respectively, and were recorded in Accounts Receivable - Affiliates on the consolidated balance sheets. We have charged PECO III organizational and offering costs related to both its private placement and public offering, whichThe amounts recognized in Accounts Receivable-Affiliates were approximately $4.2$4.7 million and $2.0$4.5 million as of September 30, 2018March 31, 2019 and December 31, 2017,2018, respectively.
During the public offering period for PECO III, we will receive a contingent advisor payment of 2.15% of the contract purchase price of each property or other real estate investment it acquires. This reimbursement is intended to allow us to recoup a portion of the dealer manager fees and organizationalorganization and offering expensescosts advanced by PECO III’s advisor, in which we have a 75% interest. Therefore, this reimbursement shall not exceed the amount of organizationalorganization and offering expensescosts and dealer manager fees outstanding at the time of closing for the acquired property.
The initial $4.5 million we may incur to fund organizationalorganization and offering expensescosts related to the PECO III public offering shall be retained by PECO III until the termination of its public offering, at which time such amount shall be paid.
|
|
13. RELATED PARTY EXPENSE |
Economic Dependency—PriorIn addition to the completion of the PELP transaction,organization and offering costs, we were dependent on Phillips Edison NTR LLC (“PE-NTR”), Phillips Edison & Company Ltd. (the “Property Manager”), and their respective affiliates for certain services that were essential to us, including asset acquisition and disposition decisions, asset management, operating and leasing of our properties, and other general and administrative responsibilities. Upon closing of the transaction in October 2017, our management structure became internalized and our relationship with PE-NTR and the Property Manager was acquired. As a result, we no longer pay the fees listed below and had no outstanding unpaid amountshave receivables related to those feesManagement Agreements from related parties of $1.3 million and $0.6 million as of September 30, 2018 orMarch 31, 2019 and December 31, 2017.
Advisory Agreement—PE-NTR and a previous advisor were entitled to specified fees and expenditure reimbursements for certain services, including managing our day-to-day activities and implementing our investment strategy under advisory agreements, as follows:
Asset management and subordinated participation fee paid out monthly2018, respectively. This amount was recorded in cash and/or Class B units;
Acquisition fee basedAccounts Receivable - Affiliates on the cost of investments acquired/originated;
Acquisition expenses reimbursed related to selecting, evaluating, and acquiring assets; and
Disposition fee paid for substantial assistance in connection with the sale of a property.
Summarized below are the fees earned by and the expenses reimbursable for the three and nine months ended September 30, 2017 (in thousands): |
| | | | | | | |
| | Three Months Ended September 30, 2017 | | Nine Months Ended September 30, 2017 |
Acquisition fees(1) | $ | 294 |
| | $ | 1,344 |
|
Due diligence fees(1) | 370 |
| | 583 |
|
Asset management fees(2) | 5,071 |
| | 15,388 |
|
OP unit distributions(3) | 448 |
| | 1,373 |
|
Class B unit distributions(4) | 482 |
| | 1,393 |
|
| Disposition fees | — |
| | 19 |
|
| Total | $ | 6,665 |
| | $ | 20,100 |
|
| |
(1)
| The majority of acquisition and due diligence fees are capitalized and allocated to the related investment in real estate assets on the consolidated balance sheets based on the acquisition-date fair values of the respective assets and liabilities acquired. |
| |
(2)
| Asset management fees are presented in General and Administrative on the consolidated statements of operations. |
| |
(3)
| Distributions are presented as Distributions to Noncontrolling Interests on the consolidated statements of equity. |
| |
(4)
| The distributions paid to holders of unvested Class B units are presented in General and Administrative on the consolidated statements of operations. |
Property Management Agreement—Prior to the completion of the PELP transaction in October 2017, all of our real properties were managed and leased by the Property Manager, which was wholly-owned by PELP. The Property Manager was entitled to the following specified fees and expenditure reimbursements:
Property management fee based on monthly gross cash receipts from the properties managed;
Leasing commissions paid for leasing services rendered with respect to a particular property;
Construction management costs paid for construction management services rendered with respect to a particular property; and
Other expenses and reimbursement incurred by the Property Manager on our behalf.
Summarized below are the fees earned by and the expenses reimbursable to the Property Manager for the three and nine months ended September 30, 2017 (in thousands): |
| | | | | | | |
| | Three Months Ended September 30, 2017 | | Nine Months Ended September 30, 2017 |
Property management fees(1) | $ | 2,717 |
| | $ | 7,986 |
|
Leasing commissions(2) | 1,677 |
| | 6,077 |
|
Construction management fees(2) | 683 |
| | 1,367 |
|
Other fees and reimbursements(3) | 2,409 |
| | 6,030 |
|
| Total | $ | 7,486 |
| | $ | 21,460 |
|
| |
(1)
| The property management fees are included in Property Operating on the consolidated statements of operations. |
| |
(2)
| Leasing commissions paid for leases with terms less than one year were expensed immediately and included in Depreciation and Amortization on the consolidated statements of operations. Leasing commissions paid for leases with terms greater than one year, and construction management fees, were capitalized and amortized over the life of the related leases or assets. |
| |
(3)
| Other fees and reimbursements are included in Property Operating and General and Administrative on the consolidated statements of operations based on the nature of the expense. |
consolidated balance sheets.
Other Related Party Matters—Under the termsA portion of the advisory agreement, we have incurred organizationalorganization and offering costs related to PECO III. A portion of those costs werewas incurred by Griffin Capital CorporationCompany, LLC (“Griffin sponsor”), a co-sponsor of PECO III. The Griffin sponsor owns a 25% interest, and we own a 75% interest, in the PECO III’sIII advisor. As such, $1.0 million of the receivable we have from PECO III, is$1.3 million and $1.2 million were reimbursable to the Griffin sponsor as of March 31, 2019 and December 31, 2018, respectively, and is recorded in Accounts Payable - Affiliatesand Other Liabilities on the consolidated balance sheets.
Upon completionPECO Air L.L.C. (“PECO Air”), an entity in which Mr. Edison, our Chairman, Chief Executive Officer, and President, owns a 50% interest, owns an airplane that we use for business purposes in the course of our operations. We paid approximately $0.3 million and $0.2 million to PECO Air for use of its airplane for the PELP transaction, we assumed PELP’s obligation asthree months ended March 31, 2019 and 2018, respectively.
We are the limited guarantor for up to $200 million, capped at $50 million in most instances, of NRP’s debt.debt for our NRP joint venture. Our guarantee is limited to being the non-recourse carveout guarantor and the environmental indemnitor. Additionally, as a part of the GRP I joint venture, GRP I assumed from us a $175 million mortgage loan for which we assumed the obligation of limited guarantor. Our guarantee is limited to being the non-recourse carveout guarantor and the environmental indemnitor. We entered into a separate agreement with Northwestern Mutual in which we agree to apportion any potential liability under this guaranty between us and them based on our respective ownership percentages.
|
|
14.15. FAIR VALUE MEASUREMENTS |
The following describes the methods we use to estimate the fair value of our financial and nonfinancial assets and liabilities:
Cash and Cash Equivalents, Restricted Cash, Accounts Receivable, and Accounts Payable—We consider the carrying values of these financial instruments to approximate fair value because of the short period of time between origination of the instruments and their expected realization.
Real Estate Investments—The purchase prices of the investment properties, including related lease intangible assets and liabilities, were allocated at estimated fair value based on Level 3 inputs, such as discount rates, capitalization rates, comparable sales, replacement costs, income and expense growth rates, and current market rents and allowances as determined by management.
Debt Obligations—We estimate the fair value of our debt by discounting the future cash flows of each instrument at rates currently offered for similar debt instruments of comparable maturities by our lenders using Level 3 inputs. The discount rates used approximate current lending rates for loans or groups of loans with similar maturities and credit quality, assuming the debt is outstanding through maturity and considering the debt’s collateral (if applicable). We have utilized market information, as available, or present value techniques to estimate the amounts required to be disclosed.
The following is a summary of borrowings as of September 30, 2018March 31, 2019 and December 31, 20172018 (in thousands): | | | | | September 30, 2018 | | December 31, 2017 | March 31, 2019 | | December 31, 2018 |
| Fair value | | $ | 1,812,086 |
| | $ | 1,765,151 |
| $ | 2,434,064 |
| | $ | 2,467,317 |
|
Recorded value(1) | | 1,856,984 |
| | 1,823,040 |
| 2,432,821 |
| | 2,456,867 |
|
| |
(1) | Recorded value does not include net deferred financing costsexpenses of $14.017.1 million and $16.018.0 million as of September 30, 2018March 31, 2019 and December 31, 20172018, respectively. |
Recurring and Nonrecurring Fair Value Measurements—Our earn-out liability and interest rate swaps are measured and recognized at fair value on a recurring basis.basis, while certain real estate assets and liabilities are measured and recognized at fair value as needed. The fair value measurements of those assets and liabilitiesthat occurred as of September 30, 2018March 31, 2019 and December 31, 2017,2018, were as follows (in thousands): |
| | | | | | | | | | | | | | | | | | | |
| | September 30, 2018 | | December 31, 2017 |
| | Level 1 | Level 2 | Level 3 | | Level 1 | Level 2 | Level 3 |
Interest rate swaps-term loans(1) | $ | — |
| $ | 37,708 |
| $ | — |
| | $ | — |
| $ | 16,496 |
| $ | — |
|
Interest rate swap-mortgage note(1) | — |
| — |
| — |
| | — |
| (61 | ) | — |
|
Earn-out liability(2) | — |
| — |
| (39,500 | ) | | — |
| — |
| (38,000 | ) |
|
| | | | | | | | | | | | | | | | | | | |
| | March 31, 2019 | | December 31, 2018 |
| | Level 1 | Level 2 | Level 3 | | Level 1 | Level 2 | Level 3 |
| Recurring | | | | | | | |
Derivative assets(1) | $ | — |
| $ | 16,154 |
| $ | — |
| | $ | — |
| $ | 29,708 |
| $ | — |
|
Derivative liability(1) | — |
| (6,305 | ) | — |
| | — |
| (3,633 | ) | — |
|
| Earn-out liability | — |
| — |
| (32,000 | ) | | — |
| — |
| (39,500 | ) |
| Nonrecurring | | | | | | | |
| Impaired real estate assets | — |
| 27,473 |
| — |
| | — |
| 71,991 |
| — |
|
| |
(1) | We record derivative assets in Other Assets, Net and derivative liabilities in Accounts Payable and Other Liabilities on our consolidated balance sheets. |
| |
(2)
| The estimated fair value of the earn-out is presented in Accounts Payable and Other Liabilities on the consolidated balance sheets. We will continue to estimate the fair value of this earn-out liability at each reporting date during the contingency period and record any changes on our consolidated statements of operations. |
Earn-out—The terms of the PELP transaction include an earn-out structure with an opportunity for up to an additional 12.5 million OP units to be issued to PELP as additional consideration if certain milestones are achieved. The milestones are related to a liquidity event for our stockholders and fundraising targets in PECO III, of which PELP was a co-sponsor.
We estimate the fair value of this liability using weighted-average probabilities of likely outcomes. These estimates require us to make various assumptions about future share prices, timing of liquidity events, equity raise projections, and other items that are unobservable and are considered Level 3 inputs in the fair value hierarchy. In calculating the fair value of this liability, we have determined that the most likely range of potential outcomes includes a possibility of no additional OP units issued as well as up to 6 million out of the maximum 12.5 million units being issued.
Derivative Instruments—As of September 30, 2018March 31, 2019 and December 31, 2017,2018, we had interest rate swaps that fixed LIBOR on portions of our unsecured term loan facilities. For a more detailed discussion of these cash flow hedges, see Note 8.
All interest rate swap agreements are measured at fair value on a recurring basis. The valuation of these instruments is determined using widely accepted valuation techniques, including discounted cash flow analysis on the expected cash flows of each derivative. This analysis reflects the contractual terms of the derivatives, including the period to maturity, and uses observable market-based inputs, including interest rate curves and implied volatilities. The fair values of interest rate swaps are determined using the market standard methodology of netting the discounted future fixed cash receipts (or payments)
and the discounted expected variable cash payments (or receipts). The variable cash payments (or receipts) are based on an expectation of future interest rates (forward curves) derived from observable market interest rate curves.
To comply with the provisions of ASC Topic 820, Fair Value Measurement, we incorporate credit valuation adjustments to appropriately reflect both our own nonperformance risk and the respective counterparty’s nonperformance risk in the fair value measurements. In adjusting the fair value of our derivative contracts for the effect of nonperformance risk, we have considered the impact of netting and any applicable credit enhancements, such as collateral postings, thresholds, mutual puts, and guarantees.
Although we determined that the significant inputs used to value our derivatives fell within Level 2 of the fair value hierarchy, the credit valuation adjustments associated with our counterparties and our own credit risk utilize Level 3 inputs, such as estimates of current credit spreads, to evaluate the likelihood of default by us and our counterparties. However, as of September 30, 2018March 31, 2019 and December 31, 2017,2018, we have assessed the significance of the impact of the credit valuation adjustments on the overall valuation of our derivative positions and have determined that the credit valuation adjustments are not significant to the overall valuation of our derivatives. As a result, we have determined that our derivative valuations in their entirety are classified in Level 2 of the fair value hierarchy.
Nonrecurring Fair Value MeasurementsEarn-out—In connection with the PELP transaction, the Company entered into a contribution agreement (the “Contribution Agreement”), dated as of May 18, 2017, with the Operating Partnership and the contributors listed therein. The Contribution Agreement established an earn-out structure by which PELP was given the opportunity to earn a maximum of 12.5 million additional OP units if certain milestones related to (i) fundraising in the investment management business, and (ii) the timing and valuation related to a liquidity event for PECO, were achieved by certain dates. The liquidity event earn-out provisions provided, in relevant part, that the contributors would have the right to receive a minimum of 3 million and a maximum of 5 million OP units as contingent consideration if a “liquidity event” (as defined in the Contribution Agreement) was successfully achieved by the Company by December 31, 2019. On March 12, 2019, the Company entered into an amendment to the Contribution Agreement (“Amendment”). Pursuant to the terms of the Amendment, the initial liquidity earn-out term has been extended by two years through December 31, 2021 and the threshold for the maximum payout of 5 million OP units has been raised to $11.20 per share from $10.20 per share.
We estimate the fair value of this liability using weighted-average probabilities of likely outcomes. These estimates require us to make various assumptions about future share prices, timing of liquidity events, equity raise projections, and other items that are unobservable and are considered Level 3 inputs in the fair value hierarchy. In calculating the fair value of this liability, we have determined that the most likely range of potential outcomes includes a possibility of no additional OP units issued as well as up to 5.0 million out of the maximum 12.5 million units being issued.
The following table presents a reconciliation of the change in the earn-out liability measured at fair value on a recurring basis using Level 3 inputs (in thousands): |
| | | |
| | Earn-Out Liability |
| Balance at December 31, 2018 | $ | 39,500 |
|
| Change in fair value recognized in Other Income (Expense), Net | (7,500 | ) |
| Balance at March 31, 2019 | $ | 32,000 |
|
Real Estate Asset Impairment—Our real estate assets are measured and recognized at fair value on a nonrecurring basis dependent upon when we determine an impairment has occurred. In 2018During the three months ended March 31, 2019, we impaired real estatefour assets that were under contract beingor actively marketed for sale at a disposition price that was less than carrying value, or had other operational impairment indicators. The valuation technique used for the fair value of all impaired real estate assets was the expected net sales proceeds. We determined that these valuationsvaluation to fall under Level 2 of the fair value hierarchy. One real estate asset impaired during
We recorded the second quarterfollowing expense as a result of 2018 was sold in the third quarter. The fair value measurement was based on the contractual sales price, which was determined to be $5.3 million. We did not have any impaired real estate assets as of December 31, 2017.
The fair value measurement of our impaired real estate assets recorded as of September 30, 2018, was as follows (in thousands): |
| | | | | | | | | |
| | September 30, 2018 |
| | Level 1 | Level 2 | Level 3 |
| Impaired real estate assets | $ | — |
| $ | 37,575 |
| $ | — |
|
As of September 30, 2018, we operated through two business segments: Owned Real Estate and Investment Management. Prior to the completion of the PELP transaction in October 2017, we only operated through the Owned Real Estate segment. As a result, we did not report any segment disclosures for the three and nine months ended September 30, 2017. We generate revenues and Segment Profit as follows:
Owned Real Estate: Our business objective is to own and operate well-occupied grocery-anchored shopping centers that generate cash flows to support distributions to our shareholders with the potential for capital appreciation. We typically invest in neighborhood shopping centers (generally containing less than 125,000 leasable square feet) located in attractive demographic markets throughout the United States where our management believes our fully integrated operating platform can add value. Through this segment, we own a diversified portfolio of shopping centers subject to long-term net leases with creditworthy tenants in the grocery, retail, restaurant, and service industries. As of September 30, 2018, we owned 233 properties.
Investment Management: Through this segment, we are responsible for managing the day-to-day affairs of the Managed Funds, identifying and making acquisitions and investments on their behalf, maintaining and operating their real properties, and recommending an approach for providing investors of the Managed Funds with liquidity. We generate revenues by providing asset management and property management services, such as revenues from leasing, acquisition, construction, and disposition services (see Note 12).
Our chief operating decision makers rely primarily on Segment Profit and similar measures to make decisions regarding allocating resources and assessing segment performance. We allocate certain operating expenses, such as employee-related costs and benefits, to our segments. Items not directly attributable to our Owned Real Estate or Investment Management segments are allocated to corporate general and administrative expenses, which is a reconciling item. The table below compares Segment Profit for each of our operating segments and reconciles total Segment Profit to Net Loss for the three and nine months ended September 30, 2018 (in thousands): |
| | | | | | | | | | | | | | | | | | | | | | | |
| | Three Months Ended September 30, 2018 | | Nine Months Ended September 30, 2018 |
| | Owned Real Estate | | Investment Management | | Total | | Owned Real Estate | | Investment Management | | Total |
| Total revenues | $ | 95,788 |
| | $ | 9,111 |
| | $ | 104,899 |
| | $ | 285,041 |
| | $ | 27,230 |
| | $ | 312,271 |
|
| Property operating expenses | (15,940 | ) | | (3,336 | ) | | (19,276 | ) | | (45,442 | ) | | (8,850 | ) | | (54,292 | ) |
| Real estate tax expenses | (12,698 | ) | | (175 | ) | | (12,873 | ) | | (38,737 | ) | | (609 | ) | | (39,346 | ) |
| General and administrative expenses | (588 | ) | | (3,540 | ) | | (4,128 | ) | | (1,817 | ) | | (9,599 | ) | | (11,416 | ) |
| Segment profit | $ | 66,562 |
| | $ | 2,060 |
| | 68,622 |
| | $ | 199,045 |
| | $ | 8,172 |
| | 207,217 |
|
Corporate general and administrative expenses | | | | | (9,451 | ) | | | | | | (26,074 | ) |
| Depreciation and amortization | | | | | (45,692 | ) | | | | | | (138,504 | ) |
| Impairment of real estate assets | | | | | (16,757 | ) | | | | | | (27,696 | ) |
| Interest expense, net | | | | | (17,336 | ) | | | | | | (51,166 | ) |
| Gain on sale of property, net | | | | | 4,571 |
| | | | | | 5,556 |
|
| Other loss, net | | | | | (224 | ) | | | | | | (1,513 | ) |
| Net loss | | | | | (16,267 | ) | | | | | | (32,180 | ) |
|
| | | | | | | |
| | Three Months Ended |
| | March 31, |
| | 2019 | | 2018 |
| Impairment of real estate assets | $ | 13,717 |
| | $ | — |
|
Distributions—Distributions paid to stockholders and OP unit holders of record subsequent to September 30, 2018,March 31, 2019, were as follows (in thousands, except distribution rate): |
| | | | | | | | | | | | | | | | | |
| Month | Date of Record | | Distribution Rate | | Date Distribution Paid | | Gross Amount of Distribution Paid | | Distribution Reinvested through the DRIP | | Net Cash Distribution |
| September | 9/17/2018 | | $0.05583344 | | 10/1/2018 | | $ | 12,691 |
| | $ | 3,817 |
| | $ | 8,874 |
|
| October | 10/15/2018 | | $0.05583344 | | 11/1/2018 | | 12,701 |
| | 3,787 |
| | 8,914 |
|
|
| | | | | | | | | | | | | | | | | |
| Month | Date of Record | | Distribution Rate | | Date Distribution Paid | | Gross Amount of Distribution Paid | | Distribution Reinvested through the DRIP | | Net Cash Distribution |
| March | 3/15/2019 | | $0.05583344 | | 4/1/2019 | | $ | 18,036 |
| | $ | 5,816 |
| | $ | 12,220 |
|
| April | 4/15/2019 | | $0.05583344 | | 5/1/2019 | | 18,054 |
| | 5,747 |
| | 12,307 |
|
In November 2018,May 2019 our board of directorsBoard authorized distributions for December 2018, as well as JanuaryJune, July, and FebruaryAugust 2019 to the stockholders of record at the close of business on DecemberJune 17, 2018, January2019, July 15, 2019, and FebruaryAugust 15, 2019, respectively, equal to a monthly amount of $0.05583344$0.05583344 per share of common stock.The distributions for May 2019 were previously authorized by our Board and are expected to be paid on June 3, 2019. OP unit holders will receive distributions at the same rate as common stockholders. We pay distributions to stockholders and OP unit holders based on monthly record dates. We expect to pay these distributions on the first business day after the end of each month.
Acquisitions—Subsequent to September 30, 2018,March 31, 2019, we acquired the following property (dollars in thousands): | | | Property Name | | Location | | Anchor Tenant | | Acquisition Date | | Contractual Purchase Price | | Square Footage | | Leased % of Rentable Square Feet at Acquisition | | Location | | Anchor Tenant | | Square Footage | | Purchase Date | | Contractual Purchase Price |
| Wheat Ridge Marketplace | | Wheat Ridge, CO | | Safeway | | 10/3/2018 | | $ 18,750(1) | | 103,438 |
| | 90.5 | % | |
| Naperville Crossings | | | Naperville, IL | | ALDI | | 146,591 | | 4/26/2019 | | $ | 49,850 |
|
| |
(1)
| The purchase price includes debt assumed as part of the acquisition. |
Joint Ventures with Northwestern MutualProperty Sales—On November 2, 2018, PECO (through our direct and indirect subsidiaries) and The Northwestern Mutual Life Insurance Company (“Northwestern Mutual”) entered into a definitive agreement pursuantSubsequent to March 31, 2019, we sold the following real estate property, which we will contribute or sell our ownership interests in 17 grocery-anchored shopping centers, valued at approximately $368 million, to a new joint venture. Northwestern Mutual will acquire an 85% interest in the joint venture and we will retain a 15% interest and will continue to provide asset and property management services to the joint venture. We expect to use the proceeds received from this transaction to pay down outstanding debt, fund redevelopment projects, and further expand our portfolio of grocery-anchored shopping centers. As a part of this transaction, the joint venture will also assume our $175 million loan facility due in 2026.was classified as held for
On November 2, 2018, PECO III and Northwestern Mutual entered into a similar definitive agreement to a new joint venture. We will continue to provide asset and property management services to this PECO III joint venture. sale as of March 31, 2019 (dollars in thousands):
We expect to close both joint venture transactions during the fourth quarter of 2018. |
| | | | | | | | | | | | |
| Property Name | | Location | | Anchor Tenant | | Square Footage | | Disposition Date | | Sale Price |
| White Oaks Plaza | | Spindale, NC | | Save-A-Lot | | 183,040 | | 4/10/2019 | | $ | 5,760 |
|
ITEM 2. MANAGEMENT’S DISCUSSION AND ANALYSIS OF FINANCIAL CONDITION AND RESULTS OF OPERATIONS
All references to “Notes” throughout this document refer to the footnotes to the consolidated financial statements in Part I, Item 1. Financial Statements.
Cautionary Note Regarding Forward-Looking Statements
Certain statements contained in this Quarterly Report on Form 10-Q of Phillips Edison & Company, Inc. (“we,” the “Company,” “our,” or “us”) other than historical facts may be considered forward-looking statements within the meaning of Section 27A of the Securities Act of 1933, as amended (the “Securities Act”), and Section 21E of the Securities Exchange Act of 1934, as amended (the “Exchange Act”). We intend for all such forward-looking statements to be covered by the applicable safe harbor provisions for forward-looking statements contained in those acts. Such forward-looking statements can generally be identified by our use of forward-looking terminology such as “may,” “will,” “expect,” “intend,” “anticipate,” “estimate,” “believe,” “continue,” “seek,” “objective,” “goal,” “strategy,” “plan,” “should,” “could,” or other similar words. Readers are cautioned not to place undue reliance on these forward-looking statements, which speak only as of the date this report is filed with the U.S. Securities and Exchange Commission (“SEC”). Such statements include, in particular, statements about our plans, strategies, and prospects, and are subject to certain risks and uncertainties, including known and unknown risks, which could cause actual results to differ materially from those projected or anticipated. These risks include, without limitation, (i) changes in national, regional, or local economic climates; (ii) local market conditions, including an oversupply of space in, or a
reduction in demand for, properties similar to those in our portfolio; (iii) vacancies, changes in market rental rates, and the need to periodically repair, renovate, and re-let space; (iv) changes in interest rates and the availability of permanent mortgage financing; (v) competition from other available properties and the attractiveness of properties in our portfolio to our tenants; (vi) the financial stability of tenants, including the ability of tenants to pay rent; (vii) changes in tax, real estate, environmental, and zoning laws; (viii) the concentration of our portfolio in a limited number of industries, geographies, or investments; (ix) risks associated with our ability to consummate the Merger and the timing and closing of the Merger; and (x)(ix) any of the other risks included in this Quarterly Report on Form 10-Q. Therefore, such statements are not intended to be a guarantee of our performance in future periods.
Any such forward-looking statements are subject to risks, uncertainties, and other factors and are based on a number of assumptions involving judgments with respect to, among other things, future economic, competitive, and market conditions, all of which are difficult or impossible to predict accurately. To the extent that our assumptions differ from actual conditions, our ability to accurately anticipate results expressed in such forward-looking statements, including our ability to generate positive cash flows from operations, make distributions to stockholders, and maintain the value of our real estate properties, may be significantly hindered.
See Part II, Item 1A. Risk Factors of this Form 10-Q and Part I, Item 1A. Risk Factors of our 20172018 Annual Report on Form 10-K, filed with the SEC on March 30, 2018,13, 2019, for a discussion of some of the risks and uncertainties, although not all of the risks and uncertainties, that could cause actual results to differ materially from those presented in our forward-looking statements. Except as required by law, we do not undertake any obligation to update or revise any forward-looking statements contained in this Form 10-Q. Important factors that could cause actual results to differ materially from the forward-looking statements are disclosed in Part II, Item 1A. Risk Factors and Part I, Item 2. Management’s Discussion and Analysis of Financial Condition and Results of Operations of this Form 10-Q.
All references to “Notes” throughout this document refer to the footnotes to the consolidated financial statements in Part I, Item 1. Financial Statements.
Overview
We were formed as a Maryland corporation in 2009,are an internally-managed real estate investment trust (“REIT”) and elected to be taxed as a REIT for U.S. federal income tax purposes commencing with the taxable year ended December 31, 2010. We are one of the nation’s largest owners and operators of market-leading, grocery-anchored shopping centers. The majority of our revenues are lease revenues derived from our owned real estate investments. Additionally, we operate a third-partyan investment management business thatproviding property management and advisory services to approximately $743 million of third-party assets. This business provides comprehensive real estate and asset management services to (i) Phillips Edison Grocery Center REIT III, Inc. (“PECO III”), a non-traded publicly registered REIT currently raising up to $1.5 billion in equity; (ii) three institutional joint ventures; and (iii) one private fund (collectively, the Managed Funds.“Managed Funds”).
Proposed REIT II Merger—In JulyNovember 2018, through our direct or indirect subsidiaries, we entered into a Merger Agreement, pursuantjoint venture with Northwestern Mutual, and contributed or sold 17 grocery-anchored shopping centers with a fair value of approximately $359 million at formation to whichthe new joint venture, GRP I, in exchange for a 15% ownership interest in GRP I. For a more detailed discussion, see Note 6.
In November 2018, we will mergecompleted the Merger with REIT II, a public non-traded REIT that was advised and we will continue as the surviving corporation,managed by us, in a 100% stockstock-for-stock transaction valued at approximately $1.9 billion. To complete the proposed Merger, we will issue 2.04 shares of our common stock in exchange for each issued and outstanding share of REIT II common stock, which is equivalent to $22.54 per share based on our most recent EVPS of $11.05. The exchange ratio is based onAs a thorough review of the relative valuation of each entity, including factoring in our growing investment management business as well as each company’s transaction costs. REIT II’s outstanding debt of approximately $800.0 million is expected to be refinanced or assumed by us at closing under the termsresult of the Merger, Agreement.
We expect the Merger to create meaningful operationalwe acquired 86 properties and financial benefits, including:
Materially Improve Portfolio while Maintaining Exclusive Grocery Focus -The Merger will resulta 20% equity interest in NRP, a portfolio comprising approximately 320 grocery-anchored shopping centers withjoint venture that owned 13 properties. For a more than 36 million square feet located in 33 states with an emphasis on necessity-based retailers, which have proven to be internet resistant and recession resilient. This institutional-quality portfolio has higher occupancy rates, higher annualized base rent (“ABR”) per square foot, and improved demographics on a pro forma basis.
Increase Size, Scale, and Market Prominence -Given our enhanced size, scale, and portfolio demographics, the combined company will have improved access to the capital markets, which can be used to support strategic investments to drive future growth opportunities.
Actively Position Us for Liquidity -This Merger is an important step towards a full cycle liquidity event for shareholders.
Improve Earnings Quality and Maintain Distribution Coverage - We expect the Merger to increase the percentage of earnings from real estate. Real estate earnings are more highly valued in the public equity markets than management fee income, given the long-term, recurring nature of owning and operating real estate. We estimate that pro forma Funds from Operations (“FFO”) for the combined company will exceed pro forma distributions.
Maintain Healthy Leverage Ratio and Strong Balance Sheet - The combined company’s leverage ratio is expected to improve on a net debt/total enterprise value basis. Our fixed-rate percentage of debt remains stable on a pro forma basis compared to prior to the Merger.
Accelerate Strategy to Simplify Business Model - We expect to realize the synergies of operating a combined enterprise that remains focused on driving shareholder value and expect a seamless integration process as our management company has overseen REIT II since inception.
detailed discussion, see Note 4.Portfolio and Leasing Statistics—Below are statistical highlights of our portfolio: |
| | | | | |
| | Total Portfolio as of September 30, 2018 | | Property Acquisitions During the Nine Months Ended September 30, 2018 |
| Number of properties | 233 |
| | 2 |
|
| Number of states | 32 |
| | 2 |
|
| Total square feet (in thousands) | 25,881 |
| | 216 |
|
| Leased % of rentable square feet | 93.9 | % | | 74.9 | % |
Average remaining lease term (in years)(1) | 4.4 |
| | 3.7 |
|
|
| | |
| Total Portfolio as of March 31, 2019 |
| Number of properties | 300 |
|
| Number of states | 32 |
|
| Total square feet (in thousands) | 34,121 |
|
| Leased % of rentable square feet | 93.0 | % |
Average remaining lease term (in years)(1) | 4.9 |
|
| |
(1) | The average remaining lease term in years excludes future options to extend the term of the lease. |
The following table summarizes the portfolio information of the joint ventures and our ownership percentage as of March 31, 2019 (dollars and square feet in thousands): |
| | | | | | | | | | | |
| | | March 31, 2019 |
| Joint Venture | | Ownership Percentage | | Number of Properties | | ABR(1) | | GLA(2) |
| Necessity Retail Partners | | 20% | | 13 | | $ | 18,213 |
| | 1,391 |
|
| Grocery Retail Partners I | | 15% | | 17 | | 24,373 |
| | 1,908 |
|
| |
(1) | We calculate annualized base rent (“ABR”) as monthly contractual rent as of March 31, 2019, multiplied by 12 months. |
| |
(2) | Gross leasable area (“GLA”) is defined as the portion of the total square feet of a building that is available for tenant leasing. |
Lease Expirations—The following chart shows, on an aggregate basis, all of the scheduled lease expirations after September 30, 2018,March 31, 2019, for each of the next ten years and thereafter for our 233 shopping centers.300 properties and the prorated portion of those owned through our joint ventures. The chart shows the leased square feet and ABR represented by the applicable lease expiration year:
SubsequentAdditionally, subsequent to September 30, 2018,March 31, 2019, we renewed approximately 154,0000.1 million total square feet and $2.2 million of total ABR of the expiring leases, expiring.inclusive of our pro rata share related to our joint ventures.
Based on current market base rental rates, we continue to believe we will achieve an overall positive increase in our average ABR for expiring leases. However, changes in base rental income associated with individual signed leases on comparable spaces may be positive or negative, and we can provide no assurance that the base rents on new leases will continue to increase from current levels.
See Item 2. Management’s Discussion and Analysis of Financial Condition and Results of Operations - Results of Operations -
Leasing Activity, for further discussion of leasing activity.
Portfolio Tenancy—Prior to the acquisition of a property, we assess the suitability of the grocery-anchor tenant and other tenants in light of our investment objectives, namely, preserving capital and providing stable cash flows for distributions. Generally, we assess the strength of the tenant by consideration of company factors, such as its financial strength and market share in the geographic area of the property, as well as location-specific factors, such as the store’s sales, local competition, and demographics. When assessing the tenancy of the non-anchor space at the property, we consider the tenant mix at each property in light of our portfolio, the proportion of national and national-franchise tenants, the creditworthiness of specific tenants, and the timing of lease expirations. When evaluating non-national tenancy, we attempt to obtain credit enhancements to leases, which typically come in the form of deposits and/or guarantees from one or more individuals.
We define national tenants as those tenants that operate in at least three states. Regional tenants are defined as those tenants that have at least three locations. The following charts present the composition of our portfolio, including our wholly-owned properties and the prorated portion of those owned through our joint ventures, by tenant type as of September 30, 2018:March 31, 2019:
The following charts present the composition of our portfolio by tenant industry as of September 30, 2018:March 31, 2019:
The following table presents our top tentwenty tenants, including our wholly-owned properties and the prorated portion of those owned through our joint ventures, grouped according to parent company, by ABR, as of September 30, 2018March 31, 2019 (dollars and square feet in thousands): | | | | | | | | | | | | | | March 31, 2019 |
| Tenant | | ABR | | % of ABR | | Leased Square Feet | | % of Leased Square Feet | | Number of Locations(1) | | ABR | | % of ABR | | Leased Square Feet | | % of Leased Square Feet | | Number of Locations(1) |
| Kroger | | $ | 25,834 |
| | 9.1 | % | | 3,138 |
| | 12.9 | % | | 55 |
| | $ | 27,221 |
| | 6.9 | % | | 3,549 |
| | 11.0 | % | | 69 |
|
| Publix Super Markets | | 17,258 |
| | 6.1 | % | | 1,714 |
| | 7.1 | % | | 37 |
| |
| Publix | | | 21,979 |
| | 5.6 | % | | 2,231 |
| | 6.9 | % | | 58 |
|
| Albertsons-Safeway | | | 16,948 |
| | 4.3 | % | | 1,680 |
| | 5.2 | % | | 32 |
|
| Ahold Delhaize | | 10,233 |
| | 3.6 | % | | 854 |
| | 3.5 | % | | 19 |
| | 16,733 |
| | 4.3 | % | | 1,262 |
| | 3.9 | % | | 25 |
|
| Albertsons Companies | | 9,461 |
| | 3.3 | % | | 924 |
| | 3.8 | % | | 17 |
| |
| Walmart | | | 10,451 |
| | 2.7 | % | | 1,956 |
| | 6.1 | % | | 16 |
|
| Giant Eagle | | 6,764 |
| | 2.4 | % | | 700 |
| | 2.9 | % | | 9 |
| | 9,121 |
| | 2.3 | % | | 900 |
| | 2.8 | % | | 13 |
|
| Walmart | | 5,337 |
| | 1.9 | % | | 1,181 |
| | 4.9 | % | | 10 |
| |
| Sprouts Farmers Market | | | 4,311 |
| | 1.1 | % | | 304 |
| | 0.9 | % | | 10 |
|
| Dollar Tree | | | 4,280 |
| | 1.1 | % | | 480 |
| | 1.5 | % | | 48 |
|
| Raley's | | 3,547 |
| | 1.3 | % | | 193 |
| | 0.8 | % | | 3 |
| | 3,788 |
| | 1.0 | % | | 253 |
| | 0.8 | % | | 4 |
|
| Dollar Tree | | 3,434 |
| | 1.2 | % | | 398 |
| | 1.6 | % | | 40 |
| |
| SUPERVALU | | 2,884 |
| | 1.0 | % | | 371 |
| | 1.5 | % | | 9 |
| | 3,610 |
| | 0.9 | % | | 428 |
| | 1.3 | % | | 10 |
|
Southeastern Grocers (2) | | 2,674 |
| | 0.9 | % | | 311 |
| | 1.3 | % | | 8 |
| |
| Subway | | | 3,120 |
| | 0.8 | % | | 132 |
| | 0.4 | % | | 98 |
|
| Schnuck's | | | 2,953 |
| | 0.8 | % | | 328 |
| | 1.0 | % | | 5 |
|
| Save Mart | | | 2,868 |
| | 0.7 | % | | 359 |
| | 1.1 | % | | 7 |
|
| Southeastern Grocers | | | 2,799 |
| | 0.7 | % | | 331 |
| | 1.0 | % | | 8 |
|
| Anytime Fitness | | | 2,584 |
| | 0.7 | % | | 177 |
| | 0.5 | % | | 38 |
|
| Lowe's | | | 2,407 |
| | 0.6 | % | | 371 |
| | 1.1 | % | | 4 |
|
| Kohl's | | | 2,215 |
| | 0.6 | % | | 365 |
| | 1.1 | % | | 4 |
|
| Food 4 Less (PAQ) | | | 2,124 |
| | 0.5 | % | | 118 |
| | 0.4 | % | | 2 |
|
| Petco | | | 2,085 |
| | 0.5 | % | | 127 |
| | 0.4 | % | | 11 |
|
| H&R Block | | | 2,079 |
| | 0.5 | % | | 116 |
| | 0.4 | % | | 65 |
|
| | | $ | 87,426 |
| | 30.8 | % | | 9,784 |
| | 40.3 | % | | 207 |
| | $ | 143,676 |
| | 36.6 | % | | 15,467 |
| | 47.8 | % | | 527 |
|
| |
(1) | Number of locations excludes auxiliary leases with grocery anchors such as fuel stations, pharmacies, and liquor stores. |
| |
(2)
| In March 2018, Southeastern Grocers, the parent company of Winn Dixie and Bi-Lo, filed a petition for relief under Chapter 11 of the United States Bankruptcy Code. Since that time, Southeastern Grocers has emerged from bankruptcy and all of our leases with them have been assumed and remain in full force and effect. |
Results of Operations
Segment information—As partDue to the timing of the PELP transaction we acquired PELP’s third-party investment management business. Prior to the completionclosing of the transaction, we were externally-managed, and our only reportable segment wasMerger with REIT II, there is no financial data included related to the aggregated operatingacquired properties in our results of our owned real estate. Therefore, there is no data availableoperations prior to October 4, 2017, for the Investment Management segment for comparative purposes. For more detail regarding our segments, see Note 15.
Segment Profit, which is a non-GAAP financial measure, represents revenues less property operating, real estate tax, and general and administrative expenses thatits closing on November 16, 2018. The variances to 2018 are attributable to our reportable segments. We use Segment Profit to evaluate the results of our segments and believe that this measure provides a useful comparison of our revenues based on the source of those revenues and the expenses that are directly related to them. However, Segment Profit should not be viewed as an alternative to results prepared in accordance with GAAP.
Summary of Operating Activities for the Three Months Ended September 30, 2018 and 2017
Reconciliation of Segment Profit to Net Loss Attributable to Stockholders
|
| | | | | | | | | | | | | | |
| | Three Months Ended September 30, | | Favorable (Unfavorable) Change |
| (dollars in thousands) | 2018 | | 2017 | | $ | | % |
| Segment Profit: | | | | | | | |
| Owned Real Estate | $ | 66,562 |
| | $ | 47,965 |
| | $ | 18,597 |
| | 38.8 | % |
| Investment Management | 2,060 |
| | — |
| | 2,060 |
| | NM |
|
| Total segment profit | 68,622 |
| | 47,965 |
| | 20,657 |
| | 43.1 | % |
| Corporate general and administrative expenses | (9,451 | ) | | (7,860 | ) | | (1,591 | ) | | (20.2 | )% |
| Termination of affiliate arrangements | — |
| | (5,454 | ) | | 5,454 |
| | NM |
|
| Depreciation and amortization | (45,692 | ) | | (28,650 | ) | | (17,042 | ) | | (59.5 | )% |
| Impairment of real estate assets | (16,757 | ) | | — |
| | (16,757 | ) | | NM |
|
| Interest expense, net | (17,336 | ) | | (10,646 | ) | | (6,690 | ) | | (62.8 | )% |
| Transaction expenses | — |
| | (3,737 | ) | | 3,737 |
| | NM |
|
| Gain on sale of property, net | 4,571 |
| | — |
| | 4,571 |
| | NM |
|
| Other (expense) income, net | (224 | ) | | 6 |
| | (230 | ) | | NM |
|
| Net loss | (16,267 | ) | | (8,376 | ) | | (7,891 | ) | | (94.2 | )% |
| Net loss attributable to noncontrolling interests | 3,039 |
| | 144 |
| | 2,895 |
| | NM |
|
| Net loss attributable to stockholders | $ | (13,228 | ) | | $ | (8,232 | ) | | $ | (4,996 | ) | | (60.7 | )% |
Owned Real Estate - Segment Profit |
| | | | | | | | | | | | | | |
| | Three Months Ended September 30, | | Favorable (Unfavorable) Change |
| (dollars in thousands) | 2018 | | 2017 | | $ | | % |
| Total revenues | $ | 95,788 |
| | $ | 70,624 |
| | $ | 25,164 |
| | 35.6 | % |
Property operating expenses(1) | (15,940 | ) | | (10,882 | ) | | (5,058 | ) | | (46.5 | )% |
| Real estate tax expenses | (12,698 | ) | | (10,723 | ) | | (1,975 | ) | | (18.4 | )% |
General and administrative expenses(2) | (588 | ) | | (1,054 | ) | | 466 |
| | 44.2 | % |
| Segment profit | $ | 66,562 |
| | $ | 47,965 |
| | $ | 18,597 |
| | 38.8 | % |
| |
(1)
| Property operating expenses include (i) operating and maintenance expense, consisting of property-related costs such as repairs, general maintenance, landscaping, snow removal, utilities, property insurance, security, and various other property-related expenses; (ii) bad debt expense; and (iii) allocated property management costs subsequent to the PELP transaction and property management costs prior to the transaction. |
| |
(2)
| General and administrative expenses were primarily attributed to the costs of managing the administration of the properties, including support for leasing activities and legal costs. |
Of our $25.2 million increase in revenues, $23.2 million was related to the acquisition of properties from PELP, as well as other asset acquisitions since January 1, 2017. The remaining $2.0 million increase from revenues on properties acquired before January 1, 2017, exclusive of the PELP transaction, was driven by a $0.27 increase in minimum rent per square foot.
Significant changes in Owned Real Estate expenses between the three months ended September 30, 2018 and 2017, were as follows:
|
| | | | |
| Change related to the 76 properties and management company acquired from PELP | | | Change related to our properties acquired before January 1, 2017 |
| | |
| Change related to properties acquired after December 31, 2016, exclusive of the PELP transaction, net of properties disposed | | | |
| | |
Investment Management - Segment Profit |
| | | |
| (dollars in thousands) | Three Months Ended September 30, 2018 |
| Total revenues | $ | 9,111 |
|
| Operating expenses | (3,336 | ) |
| Corporate real estate tax expenses | (175 | ) |
| General and administrative expenses | (3,540 | ) |
| Segment profit | $ | 2,060 |
|
Total revenues were primarily compromised of the following:
| |
– | $4.1 million was attributed to advisory agreements, including acquisition, disposition, and asset management fees, between us and the Managed Funds.
|
| |
– | $4.4 million was attributed to property management agreements, including property management fees, leasing commissions, and construction management fees, between us and the Managed Funds.
|
| |
– | For additional detail regarding our fees and management income, see Note 12.
|
The $3.3 million in operating expenses was primarily related to employee compensation costs to manage the daily property operations of the Managed Funds, as well as insurance costs related to our captive insurance company.
General and administrative expenses were primarily attributed to operational costs, as well as employee compensation costs for managing the day-to-day affairs of the Managed Funds, identifying and making acquisitions and investments on their behalf, communicating with the respective boards of directors and investors of the Managed Funds, and costs focused on raising institutional equity to further grow our business.
The following explanations are in reference to the unallocated corporate expenses included in the preceding Reconciliation of Segment Profit to Net Loss Attributable to Stockholders for the three months ended September 30, 2018.
Corporate General and Administrative Expenses
The $1.6 million increase in corporate general and administrative expenses was related to personnel costs and expenses related to our corporate headquarters following the PELP transaction, offset by the elimination of the asset management fee.
Termination of Affiliate Arrangements
The $5.5 million decrease in termination of affiliate arrangements was related to the prior year redemption of unvested Class B units, at the EVPS on the date of termination, that had been earned by our former advisor for historical asset management services.
Depreciation and Amortization
The $17.0 million increase in depreciation and amortization was related to the 76 properties, corporate headquarters, management contracts, and corporate assets acquired in the PELP transaction.
The increase also included a $0.9 million increase related to properties acquired after December 31, 2016, excluding properties acquired in the PELP transaction.
The increase in depreciation and amortization was offset by a $0.9 million decrease primarily attributed to certain intangible lease assets becoming fully amortized.
Impairment of Real Estate Assets
During the three months ended September 30, 2018, we recognized impairment charges totaling $16.8 million associated with certain anticipated property dispositions where the net book value exceeded the estimated fair value, as well as certain properties that we determined to be impaired following the identification of potential operational impairment indicators. See Notes 5 and 14 for more details.
Interest Expense, Net
•Interest expense, net was comprised of the following for the three months ended September 30, 2018 and 2017 (dollars in thousands): |
| | | | | | | |
| | Three Months Ended September 30, |
| | 2018 | | 2017 |
| Interest on revolving credit facility | $ | 733 |
| | $ | 2,109 |
|
| Interest on term loans, net | 9,732 |
| | 4,591 |
|
| Interest on mortgages | 6,060 |
| | 3,073 |
|
| Capitalized interest | (105 | ) | | — |
|
Amortization of deferred financing costs and assumed market debt adjustments | 916 |
| | 873 |
|
| Interest expense, net | $ | 17,336 |
| | $ | 10,646 |
|
| | | | |
| Weighted-average interest rate as of end of period | 3.5 | % | | 3.1 | % |
| Weighted-average term (in years) as of end of period | 4.7 |
| | 3.0 |
|
Transaction Expenses
The $3.7 million decrease in transaction expenses was due to costs associated with the PELP transaction in 2017.
Gain on Sale of Property, net
The $4.6 million increase in gain on sale of property, net was primarily related to the sale of three properties during the three months ended September 30, 2018 (see Note 5).
Merger unless otherwise stated.
Summary of Operating Activities for the Nine Months Ended September 30, 2018 and 2017
Reconciliation of Segment Profit to Net Loss Attributable to Stockholders
|
| | | | | | | | | | | | | | |
| | Nine Months Ended September 30, | | Favorable (Unfavorable) Change |
| (dollars in thousands) | 2018 | | 2017 | | $ | | % |
| Segment Profit: | | | | | | | |
| Owned Real Estate | $ | 199,045 |
| | $ | 142,379 |
| | $ | 56,666 |
| | 39.8 | % |
| Investment Management | 8,172 |
| | — |
| | 8,172 |
| | NM |
|
| Total segment profit | 207,217 |
| | 142,379 |
| | 64,838 |
| | 45.5 | % |
| Corporate general and administrative expenses | (26,074 | ) | | (23,252 | ) | | (2,822 | ) | | (12.1 | )% |
| Termination of affiliate arrangements | — |
| | (5,454 | ) | | 5,454 |
| | NM |
|
| Depreciation and amortization | (138,504 | ) | | (84,481 | ) | | (54,023 | ) | | (63.9 | )% |
| Impairment of real estate assets | (27,696 | ) | | — |
| | (27,696 | ) | | NM |
|
| Interest expense, net | (51,166 | ) | | (28,537 | ) | | (22,629 | ) | | (79.3 | )% |
| Transaction expenses | — |
| | (9,760 | ) | | 9,760 |
| | NM |
|
| Gain on sale of property, net | 5,556 |
| | — |
| | 5,556 |
| | NM |
|
| Other (expense) income, net | (1,513 | ) | | 642 |
| | (2,155 | ) | | NM |
|
| Net loss | (32,180 | ) | | (8,463 | ) | | (23,717 | ) | | NM |
|
| Net loss attributable to noncontrolling interests | 6,001 |
| | 144 |
| | 5,857 |
| | NM |
|
| Net loss attributable to stockholders | $ | (26,179 | ) | | $ | (8,319 | ) | | $ | (17,860 | ) | | NM |
|
|
| | | | | | | | | | | | | | | |
| | | Three Months Ended | | Favorable (Unfavorable) |
| | | March 31, | | Change |
| (Dollars in thousands) | | 2019 | | 2018 | | $ | | % |
| Operating Data: | | | | | | | | |
| Total revenues | | $ | 132,769 |
| | $ | 103,199 |
| | $ | 29,570 |
| | 28.7 | % |
| Property operating expenses | | (22,866 | ) | | (18,115 | ) | | (4,751 | ) | | (26.2 | )% |
| Real estate tax expenses | | (17,348 | ) | | (13,147 | ) | | (4,201 | ) | | (32.0 | )% |
| General and administrative expenses | | (13,285 | ) | | (10,461 | ) | | (2,824 | ) | | (27.0 | )% |
| Depreciation and amortization | | (60,989 | ) | | (46,427 | ) | | (14,562 | ) | | (31.4 | )% |
| Impairment of real estate assets | | (13,717 | ) | | — |
| | (13,717 | ) | | NM |
|
| Interest expense, net | | (25,009 | ) | | (16,779 | ) | | (8,230 | ) | | (49.0 | )% |
| Gain on disposal of property, net | | 7,121 |
| | — |
| | 7,121 |
| | NM |
|
| Other income (expense), net | | 7,536 |
| | (107 | ) | | 7,643 |
| | NM |
|
| Net loss | | (5,788 | ) | | (1,837 | ) | | (3,951 | ) | | NM |
|
| Net loss attributable to noncontrolling interests | | 593 |
| | 237 |
| | 356 |
| | NM |
|
| Net loss attributable to stockholders | | $ | (5,195 | ) | | $ | (1,600 | ) | | $ | (3,595 | ) | | NM |
|
Below are explanations of the significant fluctuations in our results of operations for the three months ended March 31, 2019 and 2018:
Owned Real Estate - Segment ProfitTotal Revenues increased $29.6 million as follows: |
| | | | | | | | | | | | | | |
| | Nine Months Ended September 30, | | Favorable (Unfavorable) Change |
| (dollars in thousands) | 2018 | | 2017 | | $ | | % |
| Total revenues | $ | 285,041 |
| | $ | 208,778 |
| | $ | 76,263 |
| | 36.5 | % |
Property operating expenses(1) | (45,442 | ) | | (32,611 | ) | | (12,831 | ) | | (39.3 | )% |
| Real estate tax expenses | (38,737 | ) | | (31,136 | ) | | (7,601 | ) | | (24.4 | )% |
General and administrative expenses(2) | (1,817 | ) | | (2,652 | ) | | 835 |
| | 31.5 | % |
| Segment profit | $ | 199,045 |
| | $ | 142,379 |
| | $ | 56,666 |
| | 39.8 | % |
| |
(1)
| Property operating expenses include (i) operating and maintenance expense, consisting of property-related costs such as repairs, general maintenance, landscaping, snow removal, utilities, property insurance, security, and various other property-related expenses; (ii) bad debt expense; and (iii) allocated property management costs subsequent to the PELP transaction and property management costs prior to the transaction. |
| |
(2)
| General and administrative expenses were primarily attributed to the costs of managing the administration of the properties, including support for leasing activities and legal costs. |
Of our $76.3$37.6 million increase in revenues, $73.2 million was related to the acquisitionMerger with REIT II including $44.5 million from the 86 properties acquired, partially offset by a reduction of properties$6.9 million in management fee revenue previously received from PELP,the acquired properties.
$1.5 million increase primarily related to fee and management income received from the recently created joint ventures included as well as other asset acquisitions since January 1, 2017. The remaining $3.1Managed Funds.
$0.8 million increase is from revenues onrelated to properties acquired before January 1, 2017, exclusive2018, outside of the PELP transaction, and wasMerger, primarily driven by a $0.27$0.19 increase in average minimum rent per square foot.
Significant changes in Owned Real Estate expenses between the nine months ended September 30,foot as compared to March 31, 2018 and 2017, were as follows:
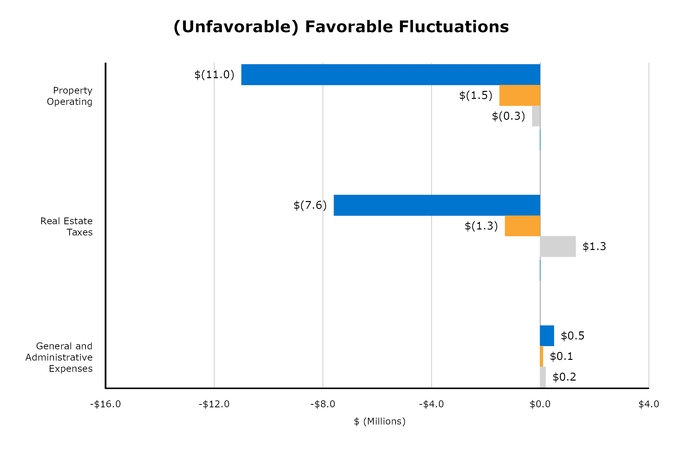
.
|
| | | | |
| Change related to the 76 properties and management company acquired from PELP | | | Change related to our properties acquired before January 1, 2017 |
| | |
| Change related to properties acquired after December 31, 2016, exclusive of the PELP transaction, net of properties disposed of | | | |
| | |
Investment Management - Segment Profit |
| | | |
| (dollars in thousands) | Nine Months Ended September 30, 2018 |
| Total revenues | $ | 27,230 |
|
| Operating expenses | (8,850 | ) |
| Corporate real estate tax expenses | (609 | ) |
| General and administrative expenses | (9,599 | ) |
| Segment profit | $ | 8,172 |
|
Total revenues were primarily compromised of the following:
| |
– | $12.0 million was attributed to advisory agreements, including acquisition, disposition, and asset management fees, between us and the Managed Funds.
|
| |
– | $13.2 million was attributed to property management agreements, including property management fees, leasing commissions, and construction management fees, between us and the Managed Funds.
|
The $8.98.3 million of operating expenses was primarily related to employee compensation costs to manage the daily property operations of the Managed Funds, as well as insurance costsdecrease related to our captive insurance company.net disposition of properties since January 1, 2018, outside of the Merger with REIT II. This includes 17 properties sold or contributed to GRP I, eleven properties sold to third parties, and five properties acquired.
General and administrative expenses were primarily attributed$1.4 million decrease related to operationalthe change in presentation of real estate tax payments paid directly by tenants. The adoption of ASC 842, which requires lessors to exclude from variable payments all costs paid by a lessee directly to a third party, precludes our recognition of real estate tax payments made by tenants directly to third parties as wellrecoverable revenues. As such, we recognized no applicable real estate tax revenue for these direct payments during the three months ended March 31, 2019. As the recorded revenue in prior periods was completely offset by the recorded expense, this has no net impact to earnings.
$0.6 million decrease related to the change in presentation of our assessment of lease collectability. The adoption of ASC 842 requires us to recognize changes in the collectability assessment for our leases in which we are the lessor as employee compensation costsan adjustment to rental income. As such, the change in our collectability assessment for managing the day-to-day affairsthree months ended March 31, 2019 was recorded as a decrease to rental revenues. No similar adjustment was made to revenue in 2018.
Property Operating increased $4.8 million as follows:
$5.5 million increase related to the properties acquired in the Merger with REIT II.
$0.6 million decrease related to the change in presentation of lease collectability due to the adoption of ASC 842.
Real Estate Taxes increased $4.2 million as follows:
$6.4 million increase related to the properties acquired in the Merger with REIT II.
$0.4 million increase related to our same-center portfolio.
$1.2 million decrease related to our net disposition of properties since January 1, 2018, outside of the Managed Funds, identifying and making acquisitions and investments on their behalf, communicatingMerger with the respective boards of directors and investors of the Managed Funds, and costs focused on raising institutional equity to further grow our business.REIT II.
The following explanations are in reference$1.4 million decrease related to the unallocated corporate expenses includedchange in presentation of real estate tax payments paid directly by tenants due to the preceding Reconciliationadoption of Segment Profit to Net Loss Attributable to Stockholders for the nine months ended September 30, 2018.ASC 842.
Corporate General and Administrative Expenses
The $2.8 million increase in corporate general and administrative expenses wasis primarily due to higher compensation and overhead costs, including third party costs, such as accounting and consulting fees, and investor relations costs.
Depreciation and Amortization increased $14.6 million as follows:
$20.5 million increase related to personnel costs and expensesthe total base value of the properties acquired in the Merger.
$3.5 million decrease related to our corporate headquarters following the PELP transaction, offset by the elimination of the asset management fee.net disposal activity.
Termination of Affiliate Arrangements
The $5.52.5 million decrease in termination of affiliate arrangements was related to the prior year redemption of unvested Class B units at the EVPS on the date of termination, that had been earned by our former advisor for historical asset management services.
Depreciation and Amortization
The $54.0 million increase in depreciation and amortization included a $51.7 million increase related to the 76 properties, management contracts, andof corporate assets, acquired inlargely as a result of the PELP transaction.
The increase also included a $4.3 million increase related to properties acquired after December 31, 2016, excluding properties acquired in the PELP transaction.
The increase in depreciation and amortization was offset by a $1.9 million decrease primarily attributed toderecognition of certain intangible lease assets becoming fully amortized.upon completion of the Merger.
Impairment of Real Estate Assets
During the ninethree months ended September 30, 2018,March 31, 2019, we recognized impairment charges totaling $27.713.7 million associated with certain anticipated property dispositions wherefour assets that were under contract or actively marketed for sale at a disposition price that was less than the net book value exceeded the estimated fair value, as well as certain properties that we determined to be impaired following the identification of potential operational impairment indicators. See Notes 5 and 14 for more details.carrying value.
Interest Expense, Net
•The $8.2 million increase was largely due to $464.5 million of debt assumed and new debt entered into in connection with the Merger. Interest expense, net was comprised of the following for the nine months endedSeptember 30, 2018 and 2017(dollars in thousands): |
| | | | | | | |
| | Nine Months Ended September 30, |
| | 2018 | | 2017 |
| Interest on revolving credit facility | $ | 1,815 |
| | $ | 5,072 |
|
| Interest on term loans, net | 28,605 |
| | 13,238 |
|
| Interest on mortgages | 18,397 |
| | 8,060 |
|
| Capitalized interest | (376 | ) | | — |
|
Amortization and write-off of deferred financing costs and assumed market debt adjustments | 2,725 |
| | 2,167 |
|
| Interest expense, net | $ | 51,166 |
| | $ | 28,537 |
|
| | | | |
| Weighted-average interest rate as of end of period | 3.5 | % | | 3.1 | % |
| Weighted-average term (in years) as of end of period | 4.7 |
| | 3.0 |
|
Transaction Expenses
The $9.8 million decrease in transaction expenses was due to costs associated with the PELP transaction in 2017.
|
| | | | | | | |
| | Three Months Ended |
| | March 31, |
| | 2019 | | 2018 |
| Interest on revolving credit facility | $ | 855 |
| | $ | 267 |
|
| Interest on term loans, net | 14,853 |
| | 9,294 |
|
| Interest on secured debt | 5,771 |
| | 6,263 |
|
| Amortization of deferred financing expenses, assumed market debt and derivative adjustments, net | 3,525 |
| | 955 |
|
| Interest on finance leases | 5 |
| | — |
|
| Interest expense, net | $ | 25,009 |
| | $ | 16,779 |
|
| | | | |
| Weighted-average interest rate as of end of period | 3.5 | % | | 3.4 | % |
| Weighted-average term (in years) as of end of period | 4.8 |
| | 5.2 |
|
Gain on SaleDisposal of Property, Net
The $5.67.1 million increase in gain on sale of property, net was primarily duerelated to the sale of fivethree properties during the three months ended March 31, 2019(see noteNote 5). We did not sell any properties during the three months ended March 31, 2018.
Other Income (Expense) Income,, Net
The $2.27.6 million change was primarily due to a $7.5 million decrease in other income was primarily due to $1.5 million expense to increase the fair value of our earn-out liability in 2018during the three months ended March 31, 2019 (see Note 1415), as well as outparcel sales in 2017..
Leasing Activity—The average rent per square foot and cost of executing leases fluctuates based on the tenant mix, size of the space, and lease term. Leases with national and regional tenants generally require a higher cost per square foot than those with local tenants. However, such tenants will also pay for a longer term. As we continue to attract more of these national and regional tenants, our costs to lease may increase.
Below is a summary of leasing activity for our wholly-owned properties for the three months ended September 30, 2018March 31, 2019 and 2017:2018: | | | | | Total Deals | | Inline Deals(1) | | Total Deals(1) | | Inline Deals(1)(2) |
| | | 2018 | | 2017(2) | | 2018 | | 2017(2) | | 2019 | | 2018(3) | | 2019 | | 2018(3) |
| New leases: | | | | | | | | | | | | | | | | |
| Number of leases | | 50 |
| | 35 |
| | 48 |
| | 34 |
| | 107 |
| | 74 |
| | 103 |
| | 71 |
|
| Square footage (in thousands) | | 144 |
| | 91 |
| | 108 |
| | 70 |
| | 323 |
| | 245 |
| | 252 |
| | 170 |
|
| First-year base rental revenue (in thousands) | | $ | 2,346 |
| | $ | 1,380 |
| | $ | 1,931 |
| | $ | 1,186 |
| | $ | 4,878 |
| | $ | 3,235 |
| | $ | 4,167 |
| | $ | 2,761 |
|
| Average rent per square foot (“PSF”) | | $ | 16.28 |
| | $ | 15.24 |
| | $ | 17.95 |
| | $ | 16.92 |
| | $ | 15.08 |
| | $ | 13.23 |
| | $ | 16.54 |
| | $ | 16.22 |
|
Average cost PSF of executing new leases(3)(4) | | $ | 31.49 |
| | $ | 21.31 |
| | $ | 25.20 |
| | $ | 19.01 |
| | $ | 27.61 |
| | $ | 22.80 |
| | $ | 27.95 |
| | $ | 23.31 |
|
Number of comparable leases(4)(5) | | 18 |
| | 12 |
| | 18 |
| | 12 |
| | 40 |
| | 21 |
| | 38 |
| | 20 |
|
Comparable rent spread(5)(6) | | 13.5 | % | | 6.8 | % | | 13.5 | % | | 6.8 | % | | 17.2 | % | | 20.3 | % | | 14.9 | % | | 14.0 | % |
| Weighted average lease term (in years) | | 8.0 |
| | 6.9 |
| | 7.4 |
| | 5.9 |
| | 7.1 |
| | 7.2 |
| | 6.5 |
| | 7.3 |
|
| Renewals and options: | | | | | | | | | | | | | | | | |
| Number of leases | | 115 |
| | 84 |
| | 100 |
| | 79 |
| | 163 |
| | 118 |
| | 152 |
| | 106 |
|
| Square footage (in thousands) | | 743 |
| | 482 |
| | 241 |
| | 138 |
| | 688 |
| | 576 |
| | 326 |
| | 201 |
|
| First-year base rental revenue (in thousands) | | $ | 8,282 |
| | $ | 5,285 |
| | $ | 4,522 |
| | $ | 2,959 |
| | $ | 10,550 |
| | $ | 7,636 |
| | $ | 7,106 |
| | $ | 4,053 |
|
Average rent PSF | | $ | 11.15 |
| | $ | 10.96 |
| | $ | 18.78 |
| | $ | 21.42 |
| | $ | 15.34 |
| | $ | 13.25 |
| | $ | 21.80 |
| | $ | 20.13 |
|
| Average rent PSF prior to renewals | | $ | 10.50 |
| | $ | 10.24 |
| | $ | 17.41 |
| | $ | 19.24 |
| | $ | 14.15 |
| | $ | 12.14 |
| | $ | 19.32 |
| | $ | 18.01 |
|
| Percentage increase in average rent PSF | | 6.1 | % | | 7.0 | % | | 7.6 | % | | 11.3 | % | | 8.4 | % | | 9.1 | % | | 12.8 | % | | 11.8 | % |
Average cost PSF of executing renewals and options(3) | | $ | 3.04 |
| | $ | 2.11 |
| | $ | 5.05 |
| | $ | 4.66 |
| | $ | 3.25 |
| | $ | 3.11 |
| | $ | 5.05 |
| | $ | 4.56 |
|
Number of comparable leases(4) | | 80 |
| | 58 |
| | 75 |
| | 57 |
| | 130 |
| | 87 |
| | 127 |
| | 82 |
|
Comparable rent spread(5) | | 6.4 | % | | 12.4 | % | | 6.7 | % | | 12.6 | % | | 12.3 | % | | 10.7 | % | | 13.6 | % | | 13.6 | % |
| Weighted average lease term (in years) | | 4.7 |
| | 5.3 |
| | 5.1 |
| | 5.4 |
| | 4.8 |
| | 4.9 |
| | 4.7 |
| | 4.9 |
|
Portfolio retention rate(6)(7) | | 89.5 | % | | 91.9 | % | | 77.4 | % | | 87.2 | % | | 84.4 | % | | 91.2 | % | | 80.8 | % | | 79.8 | % |
| |
(1) | Per square foot amounts may not recalculate exactly based on other amounts presented within the table due to rounding. |
| |
(2) | We consider an inline deal to be a lease for less than 10,000 square feet of gross leasable area (“GLA”). |
| |
(2)
| Leasing activity in 2017 does not reflect activity for the PELP properties acquired on October 4, 2017.GLA. |
| |
(3) | Leasing activity in 2018 does not include activity for the REIT II properties, as they were acquired in the Merger on November 16, 2018. |
| |
(4) | The cost of executing new leases, renewals, and options includes leasing commissions, tenant improvement costs, landlord work, and tenant concessions. The costs associated with landlord improvements are excludedwork for repositioning and redevelopment projects are excluded, if any. |
| |
(4)(5)
| A comparable lease is a lease that is executed for the exact same space (location and square feet) in which a tenant was previously located. For a lease to be considered comparable, it must have been executed within 365 days from the earlier of legal possession or the day the prior tenant physically vacated the space. |
| |
(5)(6)
| The comparable rent spread compares the first year ABRpercentage increase (or decrease) of a new lease overor renewal leases (excluding options) to the last year ABR of the priorexpiring lease of a unit that was occupied within the past twelve12 months. |
| |
(6)(7)
| The portfolio retention rate is calculated by dividing (a) total square feet of retained tenants with current period lease expirations by (b) the square feet of leases expiring during the period. |
Below is a summary of leasing activity for the nine months ended September 30, 2018 and 2017(1):
|
| | | | | | | | | | | | | | | | |
| | | Total Deals | | Inline Deals |
| | | 2018 | | 2017 | | 2018 | | 2017 |
| New leases: | | | | | | | | |
| Number of leases | | 168 |
| | 127 |
| | 161 |
| | 123 |
|
| Square footage (in thousands) | | 508 |
| | 329 |
| | 371 |
| | 267 |
|
| First-year base rental revenue (in thousands) | | $ | 7,487 |
| | $ | 5,563 |
| | $ | 6,372 |
| | $ | 5,040 |
|
| Average rent PSF | | $ | 14.75 |
| | $ | 16.90 |
| | $ | 17.16 |
| | $ | 18.90 |
|
| Average cost PSF of executing new leases | | $ | 26.47 |
| | $ | 28.90 |
| | $ | 24.87 |
| | $ | 30.29 |
|
| Number of comparable leases | | 51 |
| | 44 |
| | 49 |
| | 43 |
|
| Comparable rent spread | | 16.7 | % | | 20.3 | % | | 11.3 | % | | 17.2 | % |
| Weighted average lease term (in years) | | 7.2 |
| | 7.8 |
| | 6.9 |
| | 7.2 |
|
| Renewals and options: | | | | | | | | |
| Number of leases | | 366 |
| | 254 |
| | 329 |
| | 236 |
|
| Square footage (in thousands) | | 1,967 |
| | 1,288 |
| | 730 |
| | 465 |
|
| First-year base rental revenue (in thousands) | | $ | 24,111 |
| | $ | 17,751 |
| | $ | 13,546 |
| | $ | 10,621 |
|
Average rent PSF | | $ | 12.26 |
| | $ | 13.78 |
| | $ | 18.55 |
| | $ | 22.86 |
|
| Average rent PSF prior to renewals | | $ | 11.40 |
| | $ | 12.73 |
| | $ | 16.90 |
| | $ | 20.44 |
|
| Percentage increase in average rent PSF | | 7.4 | % | | 8.2 | % | | 9.6 | % | | 11.8 | % |
| Average cost PSF of executing renewals and options | | $ | 2.87 |
| | $ | 2.68 |
| | $ | 4.36 |
| | $ | 5.03 |
|
| Number of comparable leases | | 265 |
| | 186 |
| | 252 |
| | 182 |
|
| Comparable rent spread | | 8.4 | % | | 13.6 | % | | 9.9 | % | | 14.3 | % |
| Weighted average lease term (in years) | | 4.8 |
| | 5.1 |
| | 4.9 |
| | 5.3 |
|
| Portfolio retention rate | | 90.1 | % | | 92.9 | % | | 78.9 | % | | 88.1 | % |
| |
(1)
| See the footnotes to the summary of leasing activity table for the three months ended September 30, 2018, for more detail regarding certain items throughout this table. |
Non-GAAP Measures
Pro Forma Same-Center Net Operating Income (“NOI”)—Same-Center NOI represents the NOI for the properties that were owned and operational for the entire portion of both comparable reporting periods. For purposes of evaluating Same-Center NOI on a comparative basis, and in light of the PELP transaction, we are presenting Pro Forma Same-Center NOI, which is Same-Center NOI on a pro forma basis as if the transactionMerger had occurred on January 1, 2017.2018. This perspective allows us to evaluate Same-Center NOI growth over a comparable period. As of September 30, 2018,March 31, 2019, we had 221294 same-center properties, including 7285 same-center properties acquired in the PELP transaction.Merger. Pro Forma Same-Center NOI is not necessarily indicative of what actual Same-Center NOI and growth would have been if the PELP transactionMerger had occurred on January 1, 2017,2018, nor does it purport to represent Same-Center NOI and growth for future periods.
Pro Forma Same-Center NOI highlights operating trends such as occupancy rates, rental rates, and operating costs on properties that were operational for both comparable periods. Other REITs may use different methodologies for calculating Same-Center NOI, and accordingly, our Pro Forma Same-Center NOI may not be comparable to other REITs.
Pro Forma Same-Center NOI should not be viewed as an alternative measure of our financial performance since it does not reflect the operations of our entire portfolio, nor does it reflect the impact of general and administrative expenses, acquisition expenses, depreciation and amortization, interest expense, other income, or the level of capital expenditures and leasing costs necessary to maintain the operating performance of our properties that could materially impact our results from operations.
The table below compares Pro Forma Same-Center NOI for the three and nine months ended September 30, 2018 and 2017 (dollars in thousands): | | | | | | | | | | | | | | | | | | | | Three Months Ended | | Favorable |
| | Three Months Ended September 30, | | Favorable (Unfavorable) | | Nine Months Ended September 30, | | Favorable (Unfavorable) | March 31, | | (Unfavorable) |
| | 2018 | | 2017 | | $ Change | | % Change | | 2018 | | 2017 | | $ Change | | % Change | 2019 | | 2018(1) | | $ Change | | % Change |
| Revenues: | | | | | | | | | | | | | | | | | | | | | | |
Rental income(1) | $ | 65,154 |
| | $ | 64,151 |
| | $ | 1,003 |
| | | | $ | 195,007 |
| | $ | 191,703 |
| | $ | 3,304 |
| | | |
Rental income(2) | | $ | 92,270 |
| | $ | 91,451 |
| | $ | 819 |
| | |
| Tenant recovery income | 21,930 |
| | 20,510 |
| | 1,420 |
| | | | 63,157 |
| | 61,555 |
| | 1,602 |
| | | 29,980 |
| | 31,737 |
| | (1,757 | ) | | |
| Other property income | 265 |
| | 572 |
| | (307 | ) | | | | 1,420 |
| | 1,432 |
| | (12 | ) | | | 620 |
| | 689 |
| | (69 | ) | | |
| Total revenues | 87,349 |
| | 85,233 |
| | 2,116 |
| | 2.5 | % | | 259,584 |
| | 254,690 |
| | 4,894 |
| | 1.9 | % | 122,870 |
| | 123,877 |
| | (1,007 | ) | | (0.8 | )% |
| Operating expenses: | | | | | | | | | | | | | | | | | | | | | | |
| Property operating expenses | 12,916 |
|
| 13,671 |
| | 755 |
| | | | 38,487 |
| | 41,463 |
| | 2,976 |
| | | 18,840 |
| | 20,376 |
| | 1,536 |
| | |
| Real estate taxes | 12,028 |
|
| 12,720 |
| | 692 |
| | | | 36,723 |
| | 37,851 |
| | 1,128 |
| | | 16,780 |
| | 18,355 |
| | 1,575 |
| | |
| Total operating expenses | 24,944 |
| | 26,391 |
| | 1,447 |
| | 5.5 | % | | 75,210 |
| | 79,314 |
| | 4,104 |
| | 5.2 | % | 35,620 |
| | 38,731 |
| | 3,111 |
| | 8.0 | % |
| Total Pro Forma Same-Center NOI | $ | 62,405 |
| | $ | 58,842 |
| | $ | 3,563 |
| | 6.1 | % | | $ | 184,374 |
| | $ | 175,376 |
| | $ | 8,998 |
| | 5.1 | % | $ | 87,250 |
| | $ | 85,146 |
| | $ | 2,104 |
| | 2.5 | % |
| |
(1) | Adjusted for the same-center operating results of the Merger prior to the transaction for these periods. For additional information and details about the operating results of the Merger included herein, refer to the REIT II Same-Center NOI table below. |
| |
(2) | Excludes straight-line rental income, net amortization of above- and below-market leases, and lease buyout income. In accordance with ASC 842, revenue amounts deemed uncollectible are included in rental income for 2019 and property operating expense in 2018. |
Pro Forma Same-Center Net Operating Income Reconciliation—Below is a reconciliation of Net Loss to Owned Real Estate NOI for owned real estate investments and Pro Forma Same-Center NOI for the three and nine months ended September 30, 2018 and 2017 (in thousands): | | | | | | | | | | | | | | Three Months Ended |
| | Three Months Ended September 30, | | Nine Months Ended September 30, | March 31, |
| 2018 | | 2017 | | 2018 | | 2017 | 2019 | | 2018 |
| Net loss | $ | (16,267 | ) | | $ | (8,376 | ) | | $ | (32,180 | ) |
| $ | (8,463 | ) | $ | (5,788 | ) |
| $ | (1,837 | ) |
| Adjusted to exclude: | | | | |
|
|
|
|
|
|
|
|
|
|
| Fees and management income | (8,974 | ) | | — |
| | (26,823 | ) |
| — |
| (3,261 | ) |
| (8,712 | ) |
| Straight-line rental income | (1,090 | ) | | (970 | ) | | (3,579 | ) |
| (2,913 | ) | (1,713 | ) |
| (1,080 | ) |
| Net amortization of above- and below-market leases | (977 | ) | | (286 | ) | | (2,967 | ) |
| (972 | ) | (1,133 | ) |
| (1,007 | ) |
| Lease buyout income | (49 | ) | | (9 | ) | | (115 | ) |
| (1,120 | ) | (232 | ) |
| (23 | ) |
| General and administrative expenses | 13,579 |
| | 8,914 |
| | 37,490 |
|
| 25,904 |
| 13,285 |
|
| 10,461 |
|
| Termination of affiliate arrangements | — |
| | 5,454 |
| | — |
| | 5,454 |
| |
| Depreciation and amortization | 45,692 |
| | 28,650 |
| | 138,504 |
|
| 84,481 |
| 60,989 |
|
| 46,427 |
|
| Impairment of real estate assets | 16,757 |
| | — |
| | 27,696 |
| | — |
| 13,717 |
| | — |
|
| Interest expense, net | 17,336 |
| | 10,646 |
| | 51,166 |
| | 28,537 |
| 25,009 |
| | 16,779 |
|
| Transaction expenses | — |
|
| 3,737 |
| — |
| — |
|
| 9,760 |
| |
| Gain on sale of property, net | (4,571 | ) | | — |
| | (5,556 | ) | | — |
| |
| Gain on disposal of property, net | | (7,121 | ) | | — |
|
| Change in fair value of earn-out liability | | (7,500 | ) | | — |
|
| Other | 139 |
|
| (6 | ) |
|
| 1,238 |
|
| (642 | ) | (36 | ) |
| 201 |
|
Property management allocations to third-party
assets under management(1) | 5,432 |
| | — |
| | 13,223 |
|
| — |
| |
Owned Real Estate NOI(2) | 67,007 |
| | 47,754 |
| | 198,097 |
| | 140,026 |
| |
Property management expense allocations to third-party
assets under management | | 3,262 |
| | 3,602 |
|
| NOI for real estate investments | | 89,478 |
| | 64,811 |
|
| Less: NOI from centers excluded from same-center | (4,602 | ) | | (2,397 | ) | | (13,723 | ) | | (4,673 | ) | (2,228 | ) | | (7,996 | ) |
NOI prior to October 4, 2017, from same-center properties acquired in the PELP transaction(3) | — |
| | 13,485 |
| | — |
| | 40,023 |
| |
| NOI from same-center properties acquired in the Merger, prior to acquisition | | — |
| | 28,331 |
|
| Total Pro Forma Same-Center NOI | $ | 62,405 |
| | $ | 58,842 |
| | $ | 184,374 |
| | $ | 175,376 |
| $ | 87,250 |
| | $ | 85,146 |
|
Pro Forma Same-Center Properties—Below is a breakdown of our property count, including same-center properties by origin as well as non-same-center properties: |
| |
(1)
| This represents property management expenses allocated to third-partyThree Months Ended |
| March 31, |
| 2019 |
| Same-center properties owned since January 1, 2018 | 209 |
Same-center properties based on the property management fee that is provided foracquired in the individual management agreements under which our investment management business provides services. |
| Merger | 85 |
(2)
Properties acquired after January 1, 2018 | Segment Profit, presented in Results of Operations, differs from NOI primarily because of revenue exclusions made when calculating NOI, including straight-line rental income, net amortization of above- and below market leases, and lease buyout income. |
| 6 |
(3)
Total properties | See calculation on the following page.300 |
REIT II Same-Center Net Operating Income—NOI from the PELPREIT II properties acquired prior to the PELP transactionMerger was obtained from the accounting records of PELPREIT II without adjustment. The accounting records were subject to internal review by us. The table below provides Same-Center NOI detail for the non-ownership period of PELP, which was the three and nine months ended September 30, 2017REIT II (in thousands): | | | | Three Months Ended |
| | | | | | March 31, |
| | Three Months Ended September 30, 2017 | | Nine Months Ended September 30, 2017 | 2018 |
| Revenues: | | | | |
Rental income(1) | $ | 4,176 |
| | $ | 12,697 |
| $ | 30,573 |
|
| Tenant recovery income | 577 |
| | 1,215 |
| 11,876 |
|
| Other property income | 14,565 |
| | 43,669 |
| 271 |
|
| Total revenues | 19,318 |
| | 57,581 |
| 42,720 |
|
| Operating expenses: | | | | |
| Property operating expenses | 5,616 |
| | 16,850 |
| 7,452 |
|
| Real estate taxes | 217 |
| | 708 |
| 6,937 |
|
| Total operating expenses | 5,833 |
| | 17,558 |
| 14,389 |
|
| Total Same-Center NOI | $ | 13,485 |
| | $ | 40,023 |
| $ | 28,331 |
|
| |
(1) | Excludes straight-line rental income, net amortization of above- and below-market leases, and lease buyout income. |
Funds from Operations (“FFO”) and Modified Funds from Operations (“MFFO”)—FFO is a non-GAAP performance financial measure that is widely recognized as a measure of REIT operating performance. The National Association of Real Estate Investment Trusts (“NAREIT”) defines FFO as net income (loss) attributable to common stockholders computed in accordance with GAAP, excluding gains (or losses) from sales of property and gains (or losses) from change in control, plus depreciation and amortization, and after adjustments for impairment losses on depreciable real estate and impairments of in-substance real estate investments in investees that are driven by measurable decreases in the fair value of the depreciable real estate held by the unconsolidated partnerships and joint ventures. Adjustments for unconsolidated partnerships and joint ventures are calculated to reflect funds from operationsFFO on the same basis. We calculate FFO Attributable to Stockholders and Convertible Noncontrolling Interests in a manner consistent with the NAREIT definition, with an additional adjustment made for noncontrolling interests that are not convertible into common stock.
MFFO is an additional performance financial measure used by us as FFO includes certain non-comparable items that affect our performance over time. MFFO excludes the following items:
acquisition and transaction expenses;
straight-line rent amounts, both income and expense;
amortization of above- or below-market intangible lease assets and liabilities;
amortization of discounts and premiums on debt investments;
gains or losses from the early extinguishment of debt;
gains or losses on the extinguishment of derivatives, except where the trading of such instruments is a fundamental attribute of our operations;
gains or losses related to fair value adjustments for derivatives not qualifying for hedge accounting;
gains or losses related to fair value adjustments for our earn-out liability;
certain other one-time costs; and
adjustments related to the above items for joint ventures and noncontrolling interests and unconsolidated entities in the application of equity accounting.
We believe that MFFO is helpful in assisting management and investors with the assessment of the sustainability of operating performance in future periods. We believe it is more reflective of our core operating performance and provides an additional measure to compare our performance across reporting periods on a consistent basis by excluding items that may cause short-term fluctuations in net income (loss) but have no impact on cash flows.
FFO, FFO Attributable to Stockholders and Convertible Noncontrolling Interests, and MFFO should not be considered alternatives to net income (loss) or income (loss) from continuing operations under GAAP, as an indication of our liquidity, nor as an indication of funds available to cover our cash needs, including our ability to fund distributions. MFFO may not be a useful measure of the impact of long-term operating performance on value if we do not continue to operate our business plan in the manner currently contemplated.
Accordingly, FFO, FFO Attributable to Stockholders and Convertible Noncontrolling Interests, and MFFO should be reviewed in connection with other GAAP measurements, and should not be viewed as more prominent measures of performance than net income (loss) or cash flows from operations prepared in accordance with GAAP. Our FFO, FFO Attributable to Stockholders and Convertible Noncontrolling Interests, and MFFO, as presented, may not be comparable to amounts calculated by other REITs.
The following table presents our calculation of FFO, FFO Attributable to Stockholders and Convertible Noncontrolling Interests, and MFFO and provides additional information related to our operations for the three and nine months ended September 30, 2018 and 2017 (in thousands)thousands, except per share amounts): | | | | | | | | | | | | Three Months Ended |
| | Three Months Ended September 30, | | Nine Months Ended September 30, | March 31, |
| | 2018 | | 2017 | | 2018 |
| 2017(1) | 2019 |
| 2018 |
Calculation of FFO Attributable to Stockholders and
Convertible Noncontrolling Interests | | | | | |
| | |
| |
| Net loss | $ | (16,267 | ) | | $ | (8,376 | ) | | $ | (32,180 | ) |
| $ | (8,463 | ) | $ | (5,788 | ) |
| $ | (1,837 | ) |
| Adjustments: | | | | |
|
|
|
|
|
|
|
|
|
|
| Depreciation and amortization of real estate assets | 42,227 |
| | 28,650 |
| | 127,367 |
|
| 84,481 |
| 59,342 |
|
| 42,299 |
|
| Impairment of real estate assets | 16,757 |
| | — |
| | 27,696 |
| | — |
| 13,717 |
| | — |
|
| Gain on sale of property, net | (4,571 | ) | | — |
| | (5,556 | ) |
| — |
| |
| Gain on disposal of property, net | | (7,121 | ) |
| — |
|
| Adjustments related to unconsolidated joint ventures | | 1,055 |
| | — |
|
| FFO attributable to the Company | 38,146 |
| | 20,274 |
| | 117,327 |
|
| 76,018 |
| 61,205 |
|
| 40,462 |
|
Adjustments attributable to noncontrolling interests not
convertible into common stock | (141 | ) | | — |
| | (269 | ) |
| — |
| (190 | ) |
| (97 | ) |
FFO attributable to stockholders and convertible
noncontrolling interests | $ | 38,005 |
| | $ | 20,274 |
| | $ | 117,058 |
|
| $ | 76,018 |
| $ | 61,015 |
|
| $ | 40,365 |
|
| Calculation of MFFO | |
| | |
| | |
|
| |
| |
|
| |
|
FFO attributable to stockholders and convertible
noncontrolling interests | $ | 38,005 |
| | $ | 20,274 |
| | $ | 117,058 |
|
| $ | 76,018 |
| $ | 61,015 |
|
| $ | 40,365 |
|
| Adjustments: | |
| | |
| | |
|
| |
| |
|
| |
|
| Net amortization of above- and below-market leases | (977 | ) | | (286 | ) | | (2,967 | ) |
| (972 | ) | (1,133 | ) |
| (1,007 | ) |
| Depreciation and amortization of corporate assets | 3,465 |
| | — |
| | 11,137 |
|
| — |
| 1,647 |
|
| 4,128 |
|
| (Gain) loss on extinguishment of debt, net | (43 | ) | | (43 | ) | | 103 |
|
| (567 | ) | |
| Straight-line rent | (1,073 | ) | | (970 | ) | | (3,544 | ) |
| (2,913 | ) | (1,713 | ) |
| (1,057 | ) |
| Amortization of market debt adjustment | (255 | ) | | (267 | ) | | (992 | ) |
| (838 | ) | |
| Amortization of market debt adjustment and derivatives | | 2,227 |
|
| (272 | ) |
| Change in fair value of earn-out liability | — |
| | — |
| | 1,500 |
| | — |
| (7,500 | ) | | — |
|
| Transaction expenses | — |
| | 3,737 |
| | — |
|
| 9,760 |
| |
| Termination of affiliate arrangements | — |
| | 5,454 |
| | — |
| | 5,454 |
| |
| Adjustments related to unconsolidated joint ventures | | 344 |
| | — |
|
| Other | 298 |
| | 172 |
| | 258 |
|
| 313 |
| 88 |
|
| 31 |
|
| MFFO | $ | 39,420 |
| | $ | 28,071 |
| | $ | 122,553 |
|
| $ | 86,255 |
| $ | 54,975 |
|
| $ | 42,188 |
|
| | | | | | | | | | | |
FFO Attributable to Stockholders and Convertible
Noncontrolling Interests/MFFO per share | | | | | | | | | | |
Weighted-average common shares outstanding - diluted(2)(1) | 228,356 |
|
| 186,502 |
|
| 229,266 |
| | 186,150 |
| 325,922 |
| | 230,360 |
|
FFO attributable to stockholders and convertible noncontrolling interests per share - diluted(2) | $ | 0.17 |
| | $ | 0.11 |
| | $ | 0.51 |
|
| $ | 0.41 |
| |
FFO attributable to stockholders and convertible noncontrolling interests
per share - diluted(1) | | $ | 0.19 |
|
| $ | 0.18 |
|
MFFO per share - diluted (2)(1) | $ | 0.17 |
| | $ | 0.15 |
| | $ | 0.53 |
|
| $ | 0.46 |
| $ | 0.17 |
|
| $ | 0.18 |
|
| |
(1) | Certain prior period amounts have been restated to conform with current year presentation. |
| |
(2)
| Restricted stock awards were dilutive to FFO Attributable to Stockholders and Convertible Noncontrolling Interests and MFFO for the three and nine months ended September 30, 2018March 31, 2019 and 20172018, and, accordingly, weretheir impact was included in the weighted-average common shares used to calculate diluted FFO Attributable to Stockholders and Convertible Noncontrolling Interests and MFFO per share. |
Liquidity and Capital Resources
General—Aside from standard operating expenses, we expect our principal cash demands to be for:
investments in real estate, including the anticipated Merger with REIT II;cash distributions to stockholders;
repurchases of common stock;
capital expenditures and leasing costs;
repurchases of common stock;investments in real estate;
cash distributions to stockholders;redevelopment and repositioning projects; and
principal and interest payments on our outstanding indebtedness.
We expect our primary sources of liquidity to be:
operating cash flows;
available, unrestricted cash and cash equivalents;proceeds received from dispositions of properties;
reinvested distributions, which are used for share repurchases;distributions;
proceeds from debt financings, including borrowings under our unsecured credit facility;
distributions received from joint ventures; and
proceeds from real estate dispositions.
available, unrestricted cash and cash equivalents.
We believe our sources of cash will provide adequate liquidity to fund our obligations.
Debt—The following table summarizes information about our debt as of September 30, 2018March 31, 2019 and December 31, 20172018 (dollars in thousands): | | | | September 30, 2018 | | December 31, 2017 | March 31, 2019 | | December 31, 2018 |
| Total debt obligations, gross | $ | 1,852,773 |
| | $ | 1,817,786 |
| $ | 2,437,030 |
| | $ | 2,461,438 |
|
| Weighted average interest rate | 3.5 | % | | 3.4 | % | 3.5 | % | | 3.5 | % |
| Weighted average maturity | 4.7 |
| | 5.5 |
| 4.8 |
| | 4.9 |
|
| | | | | | | |
| Revolving credit facility capacity | $ | 500,000 |
| | $ | 500,000 |
| $ | 500,000 |
| | $ | 500,000 |
|
Revolving credit facility availability(1) | 443,973 |
| | 437,972 |
| 439,715 |
| | 426,182 |
|
Revolving credit facility maturity(2) | October 2021 |
| | October 2021 |
| October 2021 |
| | October 2021 |
|
| |
(1) | Net of outstanding letters of credit. |
| |
(2) | The revolving credit facility has additional options to extend the maturity to October 2022. |
Our debt is subject to certain covenants and, as of March 31, 2019, we were in compliance with the restrictive covenants of our outstanding debt obligations. We expect to continue to meet the requirements of our debt covenants over the short- and long-term. Our debt to total enterprise value and debt covenant compliance as of March 31, 2019, allow us access to future borrowings as needed.
The following table presents our calculation of net debt to total enterprise value, inclusive of our prorated portion of net debt owned through our joint ventures, as of March 31, 2019 and December 31, 2018 (dollars in thousands): |
| | | | | | | |
| | March 31, 2019 | | December 31, 2018 |
| Net debt: | | | |
Total debt, excluding below-market adjustments and deferred financing expenses | $ | 2,498,024 |
| | $ | 2,522,432 |
|
| Less: Cash and cash equivalents | 13,753 |
| | 18,186 |
|
| Total net debt | $ | 2,484,271 |
| | $ | 2,504,246 |
|
| Enterprise value: | | | |
| Total net debt | $ | 2,484,271 |
| | $ | 2,504,246 |
|
Total equity value(1) | 3,603,085 |
| | 3,583,029 |
|
| Total enterprise value | $ | 6,087,356 |
| | $ | 6,087,275 |
|
| | | | |
| Net debt to total enterprise value | 40.8 | % | | 41.1 | % |
| |
(1) | Total equity value is calculated as the product of the number of diluted shares outstanding and the estimated net asset value per share at the end of the period. There were 326.1 million and 324.6 million diluted shares outstanding as of March 31, 2019 and December 31, 2018, respectively. |
As of September 30, 2018,March 31, 2019, we had cash and cash equivalents and restricted cash of $33.9$86.8 million, a net increase of $6.5$2.5 million during the ninethree months ended September 30, 2018.March 31, 2019.
Below is a summary of our cash flow activity for the nine months ended September 30, 2018 and 2017 (dollars in thousands): |
| | | | | | | | | | | | | | |
| | 2018 | | 2017 | | $ Change | | % Change |
| Net cash provided by operating activities | $ | 122,036 |
| | $ | 67,522 |
| | $ | 54,514 |
| | 80.7 | % |
| Net cash used in investing activities | (16,255 | ) | | (133,108 | ) | | 116,853 |
| | 87.8 | % |
| Net cash (used in) provided by financing activities | (99,287 | ) | | 28,854 |
| | (128,141 | ) | | NM |
|
|
| | | | | | | | | | | | | | |
| | Three Months Ended | | | | |
| | March 31, | | | | |
| | 2019 | | 2018 | | $ Change | | % Change |
| Net cash provided by operating activities | $ | 41,244 |
| | $ | 23,510 |
| | $ | 17,734 |
| | 75.4 | % |
| Net cash provided by (used in) investing activities | 28,378 |
| | (16,928 | ) | | 45,306 |
| | NM |
|
| Net cash used in financing activities | (67,168 | ) | | (2,058 | ) | | (65,110 | ) | | NM |
|
Operating Activities—Our net cash provided by operating activities was primarily impacted by the following:
Property operations—Most of our operating cash comes from rental and tenant recovery income and is offset by property operating expenses, real estate taxes, and property-specific general and administrative costs. Our change in cash flows from property operations primarily results from owning a larger portfolio year-over-year as well as a 5.1% increase in Pro Forma Same-Center NOI.
result of the Merger with REIT II.Fee and management income—Following the completion of the PELP transaction, weWe also generate operating cash from our third-party investment management business, offset bypursuant to various management and advisory agreements between us and the operational costs of the business.Managed Funds. Our fee and management income increased bywas $26.83.3 million for the ninethree months ended September 30, March 31, 2019, a decrease of $5.5 million as compared to the same period in 2018., primarily due to the reduction of fee and management income no longer received from the properties acquired in the Merger with REIT II, offset by increased fee and management income as a result of recently-created joint ventures.
Cash paid for interest—During the ninethree months ended September 30, 2018March 31, 2019, we paid $49.2$21.7 million for interest, an increase of $22.7$5.9 million over the same period in 20172018. This increase was largely due to $464.5 million of debt assumed and new debt entered into in connection with the Merger with REIT II.
Working capital—During the ninethree months ended September 30, 2018March 31, 2019, aside fromthe increase in cash provided by working capital was primarily driven by the timing differences, theof payments for real estate taxes and employee compensation, as well as a net decrease in prepaid expenses.
Accounting for lease costs—The adoption of ASC 842 has caused us to expense as incurred significant lease origination costs which were previously capitalized. Such origination costs are now included as operating expenses and are therefore included as a reduction of our cash flows related to 2017 prepaid PELP acquisitionfrom operations rather than classified as capital expenditures on the statements of cash flows in the current period. As a result of the adoption, we recognized an additional $1.1 million of lease origination costs not incurred in 2018, partially offset by deferred costs anticipated to be capitalized relatedas operating cash outflows during the three months ended March 31, 2019, as compared to the Mergersame period in 2018.2018.
Investing Activities—Our net cash usedprovided by (used) in investing activities was primarily impacted by the following:
Real estate acquisitions and dispositions—During the ninethree months ended September 30, 2018March 31, 2019, we acquireddid not have any property acquisitions, as compared to twoone shopping centersproperty acquisition during the same period in 2018 for a total cash outlay of $31.3 million. During the same period in 2017, we acquired six shopping centers for a total cash outlay of $111.78.4 million. During the ninethree months ended September 30, 2018March 31, 2019, we disposed of fivethree properties for a totalnet cash inflow of $44.335.8 million. We did not have any property dispositions during the same period in 20172018.
Capital expenditures—We invest capital into leasing our properties and maintaining or improving the condition of our properties. During the ninethree months ended September 30, 2018March 31, 2019, cash used for capital expenditures increased by $6.8 million overremained consistent with the same period in 20172018. This is in part due to the impact of the adoption of ASC 842 as a result ofdescribed above, which reduces our larger portfolio.cash outflows for capital expenditures in the current period.
Financing Activities—Net cash (used in) provided byused in financing activities werewas primarily impacted by the following:
Debt borrowings and payments—Cash from financing activities is primarily affected by inflows from borrowings and outflows from payments on debt. As our debt obligations mature, we intend to refinance the remaining balance, if possible, or pay off the balances at maturity using proceeds from operations and/or corporate-level debt. In January 2018, we executed a $65 million delayed draw on one of our term loans that originated in October 2017 and used the proceeds to increase availability on our revolving credit facility. During the ninethree months ended September 30, 2018March 31, 2019, our net borrowings decreased by $103.550.8 million as a result of higher cash flows from operations and fewer acquisitions than the same period in 2017.timing of acquisition and disposition activity for the comparative periods.
Distributions to stockholders and OP unit holders—There was a large increase in distributions paid to OP unit holders in 2018 as a result of issuing 39.4 million OP units in the PELP transaction. Cash used for distributions to common stockholders additionallyand OP unit holders increased$11.6 million for the three months ended March 31, 2019, as compared to the same period in 2018 primarily due to the temporary suspensionincrease in common stockholders as a result of the DRIP for the month of July 2018 in connection with the proposed Merger; therefore all DRIP participants received their July 2018 distribution in cash rather than stock. The DRIP resumed in August 2018.Merger.
Share repurchases—Our SRP provides an opportunity for stockholders to have shares of common stock repurchased, subject to certain restrictions and limitations (see Note 1011). Cash outflows for share repurchases increased by $5.62.6 million.
Distributions—Activity related to distributions to our common stockholders and OP unit holders for the ninethree months ended September 30,March 31, 2019 and 2018, and 2017, was as follows (in thousands):
|
| | | | |
| | Cash distributions to OP unit holders | | | Net cash provided by operating activities |
| | | | | |
| | Cash distributions to common stockholders | | | FFO attributable to stockholders and nonconvertible noncontrolling interests(1) |
| | | |
| | Distributions reinvested through the DRIP | | | |
| |
(1) | See Item 2. Management’s Discussion and Analysis of Financial Condition and Results of Operations - Non-GAAP Measures - Funds from Operations and Modified Funds from Operations for the definition of FFO, for information regarding why we present FFO, as well as for a reconciliation of this non-GAAP financial measure to Net Loss. |
We paid distributions monthly and expect to continue paying distributions monthly (subject to Board authorization) unless our results of operations, our general financial condition, general economic conditions, or other factors, as determined by our Board, make it imprudent to do so. The timing and amount of distributions is determined by our Board and is influenced in part by our intention to comply with REIT requirements of the Internal Revenue Code.
To maintain our qualification as a REIT, we must make aggregate annual distributions to our stockholders of at least 90% of our REIT taxable income (which is computed without regard to the dividends paid deduction or net capital gain, and which does not necessarily equal net income (loss) as calculated in accordance with GAAP). We generally will not be subject to U.S. federal income tax on the income that we distribute to our stockholders each year due to meeting the REIT qualification requirements. However, we may be subject to certain state and local taxes on our income, property, or net worth and to federal income and excise taxes on our undistributed income.
We have not established a minimum distribution level, and our charter does not require that we make distributions to our stockholders.
Debt—
Critical Accounting Policies
Our debt is subject2018 Annual Report on Form 10-K contains a description of our critical accounting policies, including those relating to certain covenantsreal estate assets, revenue recognition, and the valuation of real estate, investments, and related intangible assets. For the three months ended March 31, 2019, there were no significant changes to these policies except for the policies related to the accounting for leases as a result of the adoption of ASC 842 as of September 30, 2018, we wereJanuary 1, 2019, as described in compliance withNote 2 and Note 3 in the restrictive covenantsaccompanying condensed consolidated financial statements.
Impact of our outstanding debt obligations. We expectRecently Issued Accounting Pronouncements
Refer to continue to meet the requirements of our debt covenants over the short- and long-term. Our debt to total enterprise value and debt covenant compliance as of September 30, 2018, allow us access to future borrowings as needed.
The following table presents our calculation of net debt to total enterprise value as of September 30, 2018 and December 31, 2017 (dollars in thousands): |
| | | | | | | |
| | 2018 | | 2017 |
| Net debt: | | | |
| Total debt, excluding below-market adjustments and deferred financing costs | $ | 1,852,773 |
| | $ | 1,817,786 |
|
| Less: Cash and cash equivalents | 6,111 |
| | 5,716 |
|
| Total net debt | $ | 1,846,662 |
| | $ | 1,812,070 |
|
| Enterprise Value: | | | |
| Total net debt | $ | 1,846,662 |
| | $ | 1,812,070 |
|
Total equity value(1) | 2,523,290 |
| | 2,526,557 |
|
| Total enterprise value | $ | 4,369,952 |
| | $ | 4,338,627 |
|
| | | | |
| Net debt to total enterprise value | 42.3 | % | | 41.8 | % |
(1) Total equity value is calculated as the productNote 2 for discussion of the numberimpact of diluted shares outstanding and the estimated net asset value per share at the end of the period. There were 228.1 million and 229.7 million diluted shares outstanding as of September 30, 2018 and December 31, 2017, respectively.recently issued accounting pronouncements.
ITEM 3. QUANTITATIVE AND QUALITATIVE DISCLOSURES ABOUT MARKET RISK
There have been no material changes from the quantitative and qualitative disclosures about market risk disclosed in Part II, Item 7A of our 20172018 Annual Report on Form 10-K filed with the SEC on March 30, 2018.13, 2019.
ITEM 4. CONTROLS AND PROCEDURES
Evaluation of Disclosure Controls and Procedures
Our management, with the participation of our Principal Executive Officer and Principal Financial Officer, has evaluated the effectiveness of our disclosure controls and procedures (as defined in Rule 13a-15(e) under the Exchange Act) as of September 30, 2018.March 31, 2019. Based on that evaluation, our Principal Executive Officer and Principal Financial Officer concluded that our disclosure controls and procedures (as defined in Rule 13a-15(e) under the Exchange Act) were effective as of September 30, 2018.March 31, 2019.
Changes in Internal Control Changesover Financial Reporting
During the quarter ended September 30, 2018,March 31, 2019, there were no changes in our internal control over financial reporting (as defined in Rule 13a-15(f) under the Exchange Act) that have materially affected, or are reasonably likely to materially affect, our internal control over financial reporting.
|
|
w PART II OTHER INFORMATION |
ITEM 1. LEGAL PROCEEDINGS
From time to time, we are party to legal proceedings, which arise in the ordinary course of our business. We are not currently involved in any legal proceedings for which we are not covered by our liability insurance or the outcome is reasonably likely to have a material impact on our results of operations or financial condition, nor are we aware of any such legal proceedings contemplated by governmental authorities.
ITEM 1A. RISK FACTORS
For a listing of risk factors associated with investing in us, please see Item 1A. Risk Factors in Part I of our 2017 Annual Report on Form 10-K filed with the SEC on March 30, 2018, and in Item 1A. Risk Factors in Part II of our Quarterly Report on Form 10-Q for the quarter ended June 30, 2018.
ITEM 2. UNREGISTERED SALES OF EQUITY SECURITIES AND USE OF PROCEEDS
Share Repurchases
During the three months ended September 30, 2018,March 31, 2019, we repurchased shares as follows (shares in thousands): |
| | | | | | | | | | | |
| Period | Total Number of Shares Redeemed | | Average Price Paid per Share | | Total Number of Shares Purchased as Part of a Publicly Announced Plan or Program(1) | | Approximate Dollar Value of Shares Available That May Yet Be Repurchased Under the Program |
July 2018(2) | — |
| | $ | — |
| | — |
| | (3) |
| August 2018 | 172 |
| | 11.05 |
| | 172 |
| | (3) |
| September 2018 | 143 |
| | 11.05 |
| | 143 |
| | (3) |
|
| | | | | | | | | | | |
| Period | Total Number of Shares Redeemed | | Average Price Paid per Share | | Total Number of Shares Purchased as Part of a Publicly Announced Plan or Program(1) | | Approximate Dollar Value of Shares Available That May Yet Be Repurchased Under the Program |
| January 2019 | 194 |
| | $ | 11.05 |
| | 194 |
| | (2) |
| February 2019 | 188 |
| | 11.05 |
| | 188 |
| | (2) |
| March 2019 | 223 |
| | 11.05 |
| | 223 |
| | (2) |
| |
(1) | We announced the commencement of the Share Repurchase Program (“SRP”) on August 12, 2010, and it was subsequently amended on September 29, 2011, and on April 14, 2016. All of the shares we purchased in the three months ended September 30, 2018 were pursuant to the SRP. |
| |
(2) | In connection with the Merger Agreement, the SRP was temporarily suspended for the month of July 2018 and resumed in August 2018. Please see Notes 3 and 10 to the consolidated financial statements for more detail.
|
| |
(3)
| We currently limit the dollar value and number of shares that may yet be repurchased under the SRP, as described below. |
Our SRP may provideprovides a limited opportunity for stockholders to have shares of common stock repurchased, subject to certain restrictions and limitations that are discussed below:
During any calendar year, we may repurchase no more than 5% of the weighted-average number of shares outstanding during the prior calendar year.
We have no obligation to repurchase shares if the repurchase would violate the restrictions on distributions under Maryland law, which prohibits distributions that would cause a corporation to fail to meet statutory tests of solvency.
The cash available for repurchases, of which we may use all or a portion, on any particular date will generally be limited to the proceeds from the DRIPdividend reinvestment plan (“DRIP”) during the preceding four fiscal quarters, less any cash already used for repurchases since the beginning of the same period; however, subject to the limitations described above, we may use other sources of cash at the discretion of the Board. The availability of DRIP proceeds is not a minimum repurchase requirement and we may use all or no portion. The limitations described above do not apply to shares repurchased due to a stockholder’s death, “qualifying disability,” or “determination of incompetence.”
Only those stockholders who purchased their shares from us or received their shares from us (directly or indirectly) through one or more non-cash transactions may be able to participate in the SRP. In other words, once our shares are transferred for value by a stockholder, the transferee and all subsequent holders of the shares are not eligible to participate in the SRP.
The Board reserves the right, in its sole discretion, at any time and from time to time, to reject any request for repurchase.
The repurchase price per share under the SRP for all stockholders is equal to the estimated value per share on the date of the repurchase.(“EVPS”). Repurchases of shares of common stock willmay be made monthly upon written notice received by us at least five days prior to the end of the applicable month, assuming no limitations, as noted above, exist. Stockholders may withdraw their repurchase request at any time up to five business days prior to the repurchase date. Unfulfilled repurchase requests are treated as requests for repurchase during future months until satisfied or withdrawn.
Our BoardWe may amend, suspend, or terminate the program upon 30 days’ notice. We may provide notice by including such information (a) in a current report on Form 8-K or in our annual or quarterly reports, all publicly filed with the SEC, or (b) in a separate mailing to the stockholders.
During the ninethree months ended September 30, 2018, repurchase requests surpassed the funding limits under the SRP. Approximately 4.5March 31, 2019, we repurchased approximately 0.6 million shares of our common stock were repurchased under the SRP during the nine months ended September 30, 2018. Repurchase requests in connection with a stockholder’s death, “qualifying disability,” or “determination of incompetence”incompetence,” which requests were completed in full. The remaining repurchase requests that were in good order were fulfilled on a pro rata basis. Due to the program'sprogram’s funding limits, no funds will bewere available for standard repurchases during the remainderfirst quarter of 2018.2019. Our next standard repurchase is expected to be in July 2019. At that time, demand for standard repurchases is expected to exceed the funding we make available for repurchases. As a result, we expect to make standard repurchases on a pro-rata basis. However, we will continue to fulfill repurchases sought upon a stockholder's death, “qualifying disability,” or “determination of incompetence” in accordance with the terms of the SRP.
In connection withUnregistered Sales of Equity Securities
During the proposed Merger,three months ended March 31, 2019, we issued an aggregate of 0.7 million shares of common stock in redemption of 0.7 million Operating Partnership units (“OP units”). These shares of common stock were issued in reliance on an exemption from registration under Section 4(a)(2) of the combined company will be required to reset its share repurchase queue. As a result, all SRP requests currently on file will be canceledSecurities Act of 1933, as amended. We relied on the dateexemption under Section 4(a)(2) based upon factual representations received from the Merger closes. All stockholders wishing to participate inlimited partner who received the SRP after the Merger must submit a new SRP form to the transfer agent, DST, after the Merger to be included in the next standard repurchaseshares of the combined company. All standard repurchase requests must be on file and in good order to be included for next standard repurchase of the combined company, which is expected to be in July 2019. At that time, should the demand for standard redemptions exceed the funding available for repurchases, the combined company is expected to make pro-rata redemptions. Following that standard repurchase, standard repurchase requests that are on file with the combined company and in good order that have not been fully executed (due to pro-rata redemptions), will remain on file for future redemptions.common stock.
ITEM 5. OTHER INFORMATION
2019 Annual Meeting of Stockholders; Date for Submission of Stockholder Proposals
We anticipate that we will hold our 2019 annual meeting of stockholders on or about Wednesday,On May 8, 2019, (the “2019 Annual Meeting”the independent directors of our Board increased the EVPS of our common stock to $11.10. The valuation was based substantially on the estimated “as is” market value of our portfolio of real estate properties in various geographic locations in the United States (“Portfolio”) and the estimated value of in-place contracts of our third-party asset management business as of March 31, 2019.
We provided the EVPS to assist broker-dealers that participated in our public offering in meeting their customer account statement reporting obligations under National Association of Securities Dealers Conduct Rule 2340 as required by the Financial Industry Regulatory Authority (“FINRA”). This valuation was performed in accordance with the provisions of Practice
Guideline 2013-01, Valuations of Publicly Registered Non-Listed REITs, issued by the Institute for Portfolio Alternatives (“IPA”) in April 2013 (“IPA Valuation Guidelines”).
We engaged Duff & Phelps, LLC (“Duff & Phelps”), an independent valuation expert which has expertise in appraising commercial real estate assets, to provide a calculation of the range in EVPS of our common stock as of March 31, 2019. Duff & Phelps prepared a valuation report (“Valuation Report”) that provided this range based substantially on its estimate of the “as is” market value of the Portfolio and the estimated value of in-place contracts of the third-party asset management business. Duff & Phelps made adjustments to the aggregate estimated value of our Portfolio to reflect balance sheet assets and liabilities provided by our management as of March 31, 2019, before calculating a range of estimated values based on the number of outstanding shares of our common stock as of March 31, 2019. These calculations produced an EVPS in the range of $10.07 to $11.48 as of March 31, 2019. The Independent Directors ultimately increased the EVPS of our common stock to $11.10 on May 8, 2019. We previously established an EVPS on May 9, 2018 of $11.05 based substantially on the estimated “as is” market value of our Portfolio and the estimated value of in-place contracts of our third-party asset management business as of March 31, 2018. Prior to that, we established an EVPS on November 8, 2017, of $11.00 based substantially on the estimated market value of our Portfolio and our third-party asset management business as of October 5, 2017. We expect to review the EVPS at least annually.
The following table summarizes the material components of the EVPS of our common stock as of March 31, 2019 (in thousands, except per share amounts): |
| | | | | | | |
| | March 31, 2019 |
| | Low | | High |
| Investment in Real Estate Assets: | | | |
| Phillips Edison real estate valuation | $ | 5,559,360 |
| | $ | 6,008,660 |
|
| Management company | 25,000 |
| | 25,000 |
|
Joint venture properties(1) | 104,005 |
| | 112,430 |
|
| Total market value | 5,688,365 |
| | 6,146,090 |
|
| | | | |
| Other Assets: | | | |
| Cash and cash equivalents | 9,013 |
| | 9,013 |
|
| Restricted cash | 73,642 |
| | 73,642 |
|
| Accounts receivable | 48,905 |
| | 48,905 |
|
| Derivative assets, net | 9,849 |
| | 9,849 |
|
| Prepaid expenses and other assets | 12,512 |
| | 12,512 |
|
| Total other assets | 153,921 |
| | 153,921 |
|
| | | | |
| Liabilities: | | | |
| Notes payable and credit facility | 2,436,518 |
| | 2,436,518 |
|
| Mark to market - debt | (3,188 | ) | | (3,188 | ) |
Joint venture net liabilities, including debt(1) | 58,992 |
| | 58,992 |
|
| Accounts payable and accrued expenses | 71,485 |
| | 71,485 |
|
| Total liabilities | 2,563,807 |
| | 2,563,807 |
|
| | | | |
| Net Asset Value | $ | 3,278,479 |
| | $ | 3,736,204 |
|
| | | | |
| Common stock and OP units outstanding | 325,408 |
| | 325,408 |
|
| Net Asset Value Per Share | $ | 10.07 |
| | $ | 11.48 |
|
| |
(1) | Represents our pro rata share of the properties owned by our joint ventures. |
Our goal is to provide an estimate of the market value of our shares. However, the majority of our assets will consist of commercial real estate and, as with any valuation methodology, the methodologies used were based upon a number of assumptions and estimates that may not have been accurate or complete. Different parties with different assumptions and estimates could have derived a different EVPS, and those differences could have been significant. These limitations are discussed further under “Limitations of Estimated Value per Share” below.
Valuation Methodologies—Our goal in calculating an EVPS was to arrive at a value that was reasonable and based off of what we deemed to be appropriate valuation and appraisal methodologies and assumptions and a process that was in accordance with the IPA Valuation Guidelines. The following is a summary of the valuation methodologies and components used to calculate the EVPS.
Independent Valuation Firm—Duff & Phelps was retained by us on February 28, 2019, as authorized by the independent directors of the Board, to provide independent valuation services. Duff & Phelps, who is not affiliated with us, is a leading global valuation advisor with expertise in complex valuation work. Duff & Phelps had previously provided services to us pertaining to the allocation of acquisition purchase prices for financial reporting purposes in connection with the Portfolio, for which it received usual and customary compensation. Duff & Phelps may be engaged to provide professional services to us in the future. The Duff & Phelps personnel who prepared the valuation had no present or prospective interest in the Portfolio and no personal interest with us.
Duff & Phelps’ engagement for its valuation services was not contingent upon developing or reporting predetermined results. In addition, Duff & Phelps’ compensation for completing the valuation services was not contingent upon the development or reporting of a predetermined value or direction in value that favors the cause of us, the amount of the value opinion, the attainment of a stipulated result, or the occurrence of a subsequent event directly related to the intended use of its Valuation Report. We agreed to indemnify Duff & Phelps against certain liabilities arising out of this engagement.
Duff & Phelps’ analyses, opinions, or conclusions were developed, and the Valuation Report was prepared, in conformity with the Uniform Standards of Professional Appraisal Practice. The Valuation Report was reviewed, approved and signed by individuals with the professional designation of MAI (Member of the Appraisal Institute). The exact time and locationuse of the Valuation Report is subject to the requirements of the Appraisal Institute relating to review by its duly authorized representatives. Duff & Phelps did not inspect the properties that formed the Portfolio.
In preparing the Valuation Report, Duff & Phelps relied on information provided by us regarding the Portfolio. For example, we provided information regarding building size, year of construction, land size and other physical, financial, and economic characteristics. We also provided lease information, such as current rent amounts, rent commencement and expiration dates, and rent increase amounts and dates.
Duff & Phelps did not investigate the legal description or legal matters relating to the Portfolio, including title or encumbrances, and title to the properties was assumed to be good and marketable. The Portfolio was also assumed to be free and clear of liens, easements, encroachments and other encumbrances, and to be in full compliance with zoning, use, occupancy, environmental and similar laws unless otherwise stated by us. The Valuation Report contains other assumptions, qualifications and limitations that qualify the analysis, opinions and conclusions set forth therein. Furthermore, the prices at which our real estate properties may actually be sold could differ from their appraised values.
The foregoing is a summary of the standard assumptions, qualifications and limitations that generally apply to the Valuation Report.
Real Estate Portfolio Valuation—Duff & Phelps estimated the “as is” market values of the Portfolio as of March 31, 2019, Annual Meeting willusing various methodologies. Generally accepted valuation practice suggests assets may be specified in our proxy statementvalued using a range of methodologies. Duff & Phelps utilized the income capitalization approach with support from the sales comparison approach for each property. The income approach was the primary indicator of value, with secondary consideration given to the sales approach. Duff & Phelps performed a study of each market to measure current market conditions, supply and demand factors, growth patterns, and their effect on each of the subject properties.
The income capitalization approach simulates the reasoning of an investor who views the cash flows that would result from the anticipated revenue and expense on a property throughout its lifetime. Under the income capitalization approach, Duff & Phelps used an estimated net operating income (“NOI”) for each property, and then converted it to a value indication using a discounted cash flow analysis. The discounted cash flow analysis focuses on the operating cash flows expected from a property and the anticipated proceeds of a hypothetical sale at the end of an assumed holding period, with these amounts then being discounted to their present value. The discounted cash flow method is appropriate for the 2019 Annual Meeting. Becauseanalysis of investment properties with multiple leases, particularly leases with cancellation clauses or renewal options, and especially in volatile markets.
The sales comparison approach estimates value based on what other purchasers and sellers in the market have agreed to as a price for comparable improved properties. This approach is based upon the principle of substitution, which states that the limits of prices, rents and rates tend to be set by the prevailing prices, rents and rates of equally desirable substitutes. Duff & Phelps gathered comparable sales data throughout various markets as secondary support for its valuation estimate.
The following summarizes the range of capitalization rates that were used to arrive at the estimated market values of our Portfolio: |
| |
| Range in Values |
| Overall Capitalization Rate | 6.41% - 6.93% |
| Terminal Capitalization Rate | 6.88% - 7.38% |
| Discount Rate | 7.48% - 7.98% |
Management Company Valuation—Duff & Phelps estimated the aggregate market value associated with our third-party asset management business using various methodologies. Duff & Phelps considered various applications of the income approach, market approach, and underlying assets approach, with the income approach determined to be the most reliable method for purposes of the analysis. The income approach analysis considered the projected fee income earned for services provided pursuant to various management and advisory agreements over the expected dateduration of that contract, assuming normal and customary renewal provisions. Such services include property management services performed for the properties in the Portfolio, as well as property and asset management services for certain unaffiliated real estate investment portfolios. In performing this analysis, solely fee income related to properties owned as of March 31, 2019, was considered. The income approach also considered a reasonable level of expenses to support such activities, as well as other adjustments, and a discount rate that accounted for the time value of money and the risk of achieving the projected cash flows. The result of the 2019 Annual Meeting representsincome approach analysis was the aggregate market value of the third-party asset management business, from which an estimated market value of net tangible assets (liabilities) was subtracted (added), to result in the aggregate intangible value
of the management company.
Sensitivity Analysis—While we believe that Duff & Phelps’ assumptions and inputs were reasonable, a change in these assumptions would have impacted the calculations of the estimated value of the Portfolio, the estimated value of our third-party asset management business, and our EVPS. The table below illustrates the impact on Duff & Phelps’ range in EVPS if the terminal capitalization rates or discount rates were adjusted by 25 basis points and assumes all other factors remain unchanged. Additionally, the table illustrates the impact if only one change in assumptions was made, with all other factors held constant. Further, each of these assumptions could change by more than 30 calendar days from25 basis points or 5%.
|
| | | | | | | |
| Resulting Range in Estimated Value Per Share |
| Increase of 25 basis points | | Decrease of 25 basis points | | Increase of 5% | | Decrease of 5% |
| Terminal Capitalization Rate | $11.27 - $12.71 | | $11.97 - $13.57 | | $11.14 - $12.59 | | $12.13 - $13.71 |
| Discount Rate | $11.25 - $12.73 | | $11.97 - $13.53 | | $11.06 - $12.56 | | $12.18 - $13.71 |
Other Assets and Other Liabilities—Duff & Phelps made adjustments to the dateaggregate estimated values of our investments to reflect our other assets and other liabilities based on balance sheet information provided by us as of March 31, 2019.
Role of the anniversaryIndependent Directors—The independent directors received a copy of the Valuation Report and discussed the report with representatives of Duff & Phelps. The independent directors also discussed the Valuation Report, the Portfolio, the third-party asset management business, our other assets and liabilities, and other matters with management. Management recommended to the independent directors that $11.10 per share be approved as the EVPS of our 2018 annual meeting of stockholders, we are affirmingcommon stock. The independent directors discussed the deadlinerationale for this value with management.
Following the independent directors’ receipt of stockholder proposals submitted pursuant to Rule 14a-8and review of the Securities Exchange ActValuation Report and the recommendation of 1934, as amended (the “Rule 14a-8”), for inclusionmanagement, and in our proxy materials for the 2019 Annual Meeting.
Any stockholder proposal pursuant to Rule 14a-8, to be considered for inclusion in our proxy materials for the 2019 Annual Meeting, must be received at our principal executive offices, Attn: Corporate Secretary, 11501 Northlake Drive, Cincinnati, Ohio 45249, no later than 5:00 p.m. Eastern Time on January 8, 2019. In addition, any stockholder who wishes to propose a nominee to the Company’s Board or propose anylight of other business to befactors considered by the stockholders (other than independent directors, the independent directors concluded that the range in EVPS of $10.07 to $11.48 was appropriate. The independent directors agreed to accept the recommendation of management and approved $11.10 as the EVPS of our common stock as of March 31, 2019, which determination was ultimately and solely the responsibility of the independent directors.
Limitations of Estimated Value per Share—We provided this EVPS to assist broker-dealers that participated in our public offering in meeting our customer account statement reporting obligations. This valuation was performed in accordance with the provisions of the IPA Valuation Guidelines. As with any valuation methodology, the methodologies used were based upon a number of estimates and assumptions that may not have been accurate or complete. Different parties with different assumptions and estimates could have derived a different EVPS, and this difference could have been significant. The EVPS is not audited and does not represent a determination of the fair value of our assets or liabilities based on GAAP, nor does it represent a liquidation value of our assets and liabilities or the amount at which our shares of common stock would trade on a national securities exchange.
Accordingly, with respect to the EVPS, we can give no assurance that:
a stockholder proposal included inwould be able to resell his or her shares at the EVPS;
a stockholder would ultimately realize distributions per share equal to our proxy materials pursuant to Rule 14a-8) must comply with the advance notice provisions and other requirements of Section 2.12EVPS upon liquidation of our Bylaws. These notice provisions require,assets and settlement of our liabilities or a sale of us;
our shares of common stock would trade at the EVPS on a national securities exchange;
a third party would offer the EVPS in an arm’s-length transaction to purchase all or substantially all of our shares of common stock;
another independent third-party appraiser or third-party valuation firm would agree with our EVPS; or
the methodologies used to calculate our EVPS would be acceptable to FINRA or for compliance with ERISA reporting requirements.
Further, we have not made any adjustments to the valuation of our EVPS for the impact of other transactions occurring subsequent to March 31, 2019, including, but not limited to: (i) acquisitions or dispositions of assets; (ii) the issuance of common stock under the DRIP; (iii) NOI earned and dividends declared; (iv) the repurchase of shares; and (v) changes in leases, tenancy or other business or operational changes. The value of our shares of common stock will fluctuate over time in response to developments related to individual real estate assets, the management of those assets, and changes in the real estate and finance markets. Because of, among other things, that nominationsfactors, the high concentration of individuals for election to the Company’s Boardour total assets in real estate and the proposalnumber of business toshares of our common stock outstanding, changes in the value of individual real estate assets or changes in valuation assumptions could have a very significant impact on the value of our shares of common stock. The EVPS does not take into account any disposition costs or fees for real estate properties, debt prepayment penalties that could apply upon the prepayment of certain of our debt obligations, or the impact of restrictions on the assumption of debt. Accordingly, the EVPS of our common stock may or may not be considered by the stockholders for the 2019 Annual Meeting must be received no earlier than December 9, 2018 and no later than 5:00 p.m. Eastern Time on January 8, 2019. All proposals should be submitted to the attentionan accurate reflection of the fair market value of our corporate secretary atstockholders’ investments and will not likely represent the amount of net proceeds that would result from an immediate sale of our principal executive offices atassets.
Dividend Reinvestment Plan
On May 8, 2019, the address above. All proposals must beBoard authorized an increase in writingthe number of shares of Common Stock issuable under the DRIP to 60 million, as reflected in the Second Amended and Restated Dividend Reinvestment Plan included as Exhibit 4.1 to this Quarterly Report on Form 10-Q. The terms of the plan otherwise in compliance with applicable SEC requirements and our bylaws.remain unchanged.
ITEM 6. EXHIBITS
|
| |
| Ex. | Description |
| Agreement and Plan of Merger, dated as of July 18, 2018, by and among Phillips Edison & Company, Inc., Phillips Edison Grocery Center Operating Partnership I, L.P., REIT Merger Sub, LLC, OP Merger Sub, LLC, OP Merger Sub 2, LLC, Phillips Edison Grocery Center REIT II, Inc., and Phillips Edison Grocery Center Operating Partnership II, L.P. (incorporated by reference to Exhibit 2.1 to the Company’s Current Report on Form 8-K filed July 18, 2018) |
| |
| |
| |
| |
| |
| |
| 101.1 | The following information from the Company’s Quarterly Report on Form 10-Q for the quarter ended September 30, 2018,March 31, 2019, formatted in XBRL (eXtensible Business Reporting Language): (i) Consolidated Balance Sheets; (ii) Consolidated Statements of Operations and Comprehensive (Loss) Income; (iii) Consolidated Statements of Equity; and (iv) Consolidated Statements of Cash Flows* |
*Filed herewith.
SIGNATURES
Pursuant to the requirements of the Securities Exchange Act of 1934, the Registrant has duly caused this report to be signed on its behalf by the undersigned thereunto duly authorized.
|
| | |
| | PHILLIPS EDISON & COMPANY, INC. |
| | | |
Date: November 5, 2018May 9, 2019 | By: | /s/ Jeffrey S. Edison |
| | | Jeffrey S. Edison |
| | | Chairman of the Board, and Chief Executive Officer, |
| | (Principal and President (Principal Executive Officer) |
| | | |
Date: November 5, 2018May 9, 2019 | By: | /s/ Devin I. Murphy |
| | | Devin I. Murphy |
| | | Chief Financial Officer |
| | (Principal and Treasurer (Principal Financial Officer) |