UNITED STATES
SECURITIES AND EXCHANGE COMMISSION
Washington, D.C. 20549
FORM 10-Q
(Mark One)
☒ | QUARTERLY REPORT PURSUANT TO SECTION 13 OR 15(d) OF THE SECURITIES EXCHANGE ACT OF 1934 |
For the quarterly period ended June 30, 20222023
Or
☐ | TRANSITION REPORT PURSUANT TO SECTION 13 OR |
For the transition period from _____________________ to _____________________
Commission File Number: 000-53500
CREATIVE MEDICAL TECHNOLOGY HOLDINGS, INC. |
(Exact name of |
Nevada |
| 87-0622284 |
(State or other jurisdiction of
|
| (I.R.S. Employer Identification No.) |
211 E Osborn Road, Phoenix, AZ |
| 85012 |
(Address of principal executive offices) |
| (Zip Code) |
(480) 399-2822
(Registrant’s telephone number, including area code)code: (480) 399-2822
Securities registered pursuant to Section 12(b) of the Act:
Title of each class |
| Trading Symbol(s) |
| Name of each exchange on which registered |
Common Stock, par value $0.001 per share |
| CELZ |
| The |
Indicate by check mark whether the registrant (1) has filed all reports required to be filed by Sectionsection 13 or 15(d) of the Securities Exchange Act of 1934 during the preceding 12 months (or for such shorter period that the registrant was required to file such reports). Yes ☒ No ☐
Indicate by check mark whether the registrant, and (2) has been subject to such filing requirements for the past 90 days. Yes ☒ No ☐
Indicate by check mark whether the registrant has submitted electronically, every Interactive Data File required to be submitted pursuant to Rule 405 of Regulation S-T (§232.405 of this chapter) during the preceding 12 months (or for such shorter period that the registrant was required to submit such files). Yes ☒ No ☐
Indicate by check mark whether the registrant is a large accelerated filer, an accelerated filer, a non-accelerated filer, a smaller reporting company, or an emerging growth company. See the definitions of “large accelerated filer,” “accelerated filer,” “smaller reporting company,” and “emerging growth company” in Rule 12b-2 of the Exchange Act.
Large accelerated filer | ☐ | Accelerated filer | ☐ |
Non-accelerated Filer | ☒ | Smaller reporting company | ☒ |
|
| Emerging growth company | ☐ |
If an emerging growth company, indicate by check mark if the registrant has elected not to use the extended transition period for complying with any new or revised financial accounting standards provided pursuant to Section 13(a) of the Exchange Act.Act ☐
Indicate by check mark whether the registrant is a shell company (as defined in Rule 12b-2 of the Exchange Act). Yes ☐ No ☒
The numberAs of August 11, 2023, there were 1,430,530 shares outstanding of the registrant’s common stock on August 12, 2022, was 14,070,279.outstanding.
|
| Page Number | ||
PART I – FINANCIAL INFORMATION |
|
| ||
|
|
|
| |
Item 1. | Financial Statements |
|
| |
|
|
|
|
|
|
| 3 |
| |
|
|
|
|
|
|
| 4 |
| |
|
|
|
|
|
|
| 5 |
| |
|
|
|
|
|
| Unaudited Condensed Consolidated Statements of Stockholder’ |
| 6 |
|
|
|
|
|
|
| Notes to Unaudited Condensed Consolidated Financial Statements |
|
|
|
|
|
|
|
|
Management’s Discussion and Analysis of Financial Condition and Results of Operations |
|
|
| |
|
|
|
|
|
|
|
| ||
|
|
|
|
|
|
|
| ||
|
|
|
| |
|
| |||
|
|
|
| |
|
| |||
|
| |||
|
|
|
|
|
|
|
| ||
| 2 |
| Table of Contents |
CREATIVE MEDICAL TECHNOLOGY HOLDINGS, INC.
UNAUDITED CONDENSED CONSOLIDATED BALANCE SHEETS
|
| June 30, 2022 |
|
| December 31, 2021 |
| ||
ASSETS |
|
|
|
|
|
| ||
CURRENT ASSETS |
|
|
|
|
|
| ||
Cash |
| $ | 22,863,661 |
|
| $ | 10,723,870 |
|
Accounts receivable |
|
| 0 |
|
|
| 2,485 |
|
Inventory |
|
| 20,625 |
|
|
| 10,866 |
|
Prepaids and other current assets |
|
| 64,960 |
|
|
| 0 |
|
Total Current Assets |
|
| 22,949,246 |
|
|
| 10,737,221 |
|
|
|
|
|
|
|
|
|
|
OTHER ASSETS |
|
|
|
|
|
|
|
|
Other assets |
|
| 3,281 |
|
|
| 3,281 |
|
Licenses, net of amortization |
|
| 481,637 |
|
|
| 527,679 |
|
TOTAL ASSETS |
| $ | 23,434,164 |
|
| $ | 11,268,181 |
|
|
|
|
|
|
|
|
|
|
LIABILITIES AND STOCKHOLDERS’ EQUITY (DEFICIT) |
|
|
|
|
|
|
|
|
|
|
|
|
|
|
|
|
|
CURRENT LIABILITIES |
|
|
|
|
|
|
|
|
Accounts payable |
| $ | 310,681 |
|
| $ | 761,862 |
|
Accrued expenses |
|
| 64,920 |
|
|
| 24,385 |
|
Management fee and patent liabilities - related parties |
|
| 0 |
|
|
| 250,000 |
|
Advances from related party |
|
| 14,194 |
|
|
| 14,194 |
|
Total Current Liabilities |
|
| 389,795 |
|
|
| 1,050,441 |
|
|
|
|
|
|
|
|
|
|
Commitments and contingencies |
|
|
|
|
|
|
|
|
|
|
|
|
|
|
|
|
|
STOCKHOLDERS’ EQUITY (DEFICIT) |
|
|
|
|
|
|
|
|
Common stock, $0.001 par value, 50,000,000 authorized; 13,956,246 and 6,338,872 issued and 13,956,238 and 6,338,864 outstanding at June 30, 2022 and December 31, 2021, respectively |
|
| 13,957 |
|
|
| 6,339 |
|
Additional paid-in capital |
|
| 69,644,239 |
|
|
| 53,879,215 |
|
Accumulated deficit |
|
| (46,613,827 | ) |
|
| (43,667,814 | ) |
TOTAL STOCKHOLDERS’ EQUITY (DEFICIT) |
|
| 23,044,369 |
|
|
| 10,217,740 |
|
|
|
|
|
|
|
|
|
|
TOTAL LIABILITIES AND STOCKHOLDERS’ EQUITY (DEFICIT) |
| $ | 23,434,164 |
|
| $ | 11,268,181 |
|
The accompanying notes are an integral part of these condensed consolidated financial statements
CREATIVE MEDICAL TECHNOLOGY HOLDINGS, INC. | ||||||||
UNAUDITED CONDENSED CONSOLIDATED BALANCE SHEETS | ||||||||
|
| June 30, 2023 |
|
| December 31, 2022 |
| ||
ASSETS |
|
|
|
|
|
| ||
CURRENT ASSETS |
|
|
|
|
|
| ||
Cash |
| $ | 3,989,550 |
|
| $ | 8,320,519 |
|
Certificates of deposit |
|
| 9,581,207 |
|
|
| 10,078,617 |
|
Inventory |
|
| 10,194 |
|
|
| 10,194 |
|
Prepaids and other current assets |
|
| 153,692 |
|
|
| 338,120 |
|
Total Current Assets |
|
| 13,734,643 |
|
|
| 18,747,450 |
|
|
|
|
|
|
|
|
|
|
OTHER ASSETS |
|
|
|
|
|
|
|
|
Other assets |
|
| 3,281 |
|
|
| 3,281 |
|
Licenses, net of amortization |
|
| 389,553 |
|
|
| 435,595 |
|
TOTAL ASSETS |
| $ | 14,127,477 |
|
| $ | 19,186,326 |
|
|
|
|
|
|
|
|
|
|
LIABILITIES AND STOCKHOLDERS' EQUITY |
|
|
|
|
|
|
|
|
|
|
|
|
|
|
|
|
|
CURRENT LIABILITIES |
|
|
|
|
|
|
|
|
Accounts payable |
| $ | 344,413 |
|
| $ | 3,267,538 |
|
Accrued expenses |
|
| 39,920 |
|
|
| 39,920 |
|
Advances from related party |
|
| 14,194 |
|
|
| 14,194 |
|
Total Current Liabilities |
|
| 398,527 |
|
|
| 3,321,652 |
|
|
|
|
|
|
|
|
|
|
TOTAL LIABILITIES |
|
| 398,527 |
|
|
| 3,321,652 |
|
|
|
|
|
|
|
|
|
|
Commitments and contingencies |
|
|
|
|
|
|
|
|
|
|
|
|
|
|
|
|
|
STOCKHOLDERS' EQUITY |
|
|
|
|
|
|
|
|
Common stock, $0.001 par value, 5,000,000 and 50,000,000 shares authorized; 1,431,127 and 1,407,625 issued and 1,431,126 and 1,407,624 outstanding at June 30, 2023 and December 31, 2022, respectively |
|
| 1,431 |
|
|
| 1,408 |
|
Additional paid-in capital |
|
| 69,693,425 |
|
|
| 69,675,124 |
|
Accumulated deficit |
|
| (55,965,906 | ) |
|
| (53,811,858 | ) |
TOTAL STOCKHOLDERS' EQUITY |
|
| 13,728,950 |
|
|
| 15,864,674 |
|
TOTAL LIABILITIES AND STOCKHOLDERS' EQUITY |
|
|
|
|
|
|
|
|
|
| $ | 14,127,477 |
|
| $ | 19,186,326 |
|
|
|
|
|
|
|
|
|
|
The Accompanying notes are an integral part of these condensed consolidated financial statements | ||||||||
| 3 |
| Table of Contents |
CREATIVE MEDICAL TECHNOLOGY HOLDINGS, INC.
UNAUDITED CONDENSED CONSOLIDATED STATEMENTS OF OPERATIONS
|
| For the Three Months Ended June 30, 2022 |
|
| For the Three Months Ended June 30, 2021 |
|
| For the Six Months Ended June 30, 2022 |
|
| For the Six Months Ended June 30, 2021 |
| ||||
|
|
|
|
|
|
|
|
|
|
|
|
| ||||
Revenues |
| $ | 0 |
|
| $ | 10,000 |
|
| $ | 15,000 |
|
| $ | 10,000 |
|
|
|
|
|
|
|
|
|
|
|
|
|
|
|
|
|
|
Cost of revenues |
|
| 0 |
|
|
| 4,500 |
|
|
| 6,791 |
|
|
| 4,500 |
|
|
|
|
|
|
|
|
|
|
|
|
|
|
|
|
|
|
Gross profit |
|
| 0 |
|
|
| 5,500 |
|
|
| 8,209 |
|
|
| 5,500 |
|
|
|
|
|
|
|
|
|
|
|
|
|
|
|
|
|
|
OPERATING EXPENSES |
|
|
|
|
|
|
|
|
|
|
|
|
|
|
|
|
Research and development |
|
| 659,695 |
|
|
| 0 |
|
|
| 669,695 |
|
|
| 0 |
|
Selling, general and administrative |
|
| 1,108,428 |
|
|
| 498,321 |
|
|
| 2,238,485 |
|
|
| 779,244 |
|
Amortization of patent costs |
|
| 23,021 |
|
|
| 23,021 |
|
|
| 46,042 |
|
|
| 46,042 |
|
TOTAL EXPENSES |
|
| 1,791,144 |
|
|
| 521,342 |
|
|
| 2,954,222 |
|
|
| 825,286 |
|
|
|
|
|
|
|
|
|
|
|
|
|
|
|
|
|
|
Operating loss |
|
| (1,791,144 | ) |
|
| (515,842 | ) |
|
| (2,946,013 | ) |
|
| (819,786 | ) |
|
|
|
|
|
|
|
|
|
|
|
|
|
|
|
|
|
OTHER INCOME/(EXPENSE) |
|
|
|
|
|
|
|
|
|
|
|
|
|
|
|
|
Interest expense |
|
| 0 |
|
|
| (234,338 | ) |
|
| 0 |
|
|
| (570,414 | ) |
Gain on extinguishment of convertible notes |
|
| 0 |
|
|
| 96,444 |
|
|
| 0 |
|
|
| 96,444 |
|
Change in fair value of derivatives liabilities |
|
| 0 |
|
|
| (2,251,446 | ) |
|
| 0 |
|
|
| 26,224,593 |
|
Total other income (expense) |
|
| 0 |
|
|
| (2,389,340 | ) |
|
| 0 |
|
|
| 25,750,623 |
|
|
|
|
|
|
|
|
|
|
|
|
|
|
|
|
|
|
INCOME (LOSS) BEFORE PROVISION FOR INCOME TAXES |
|
| (1,791,144 | ) |
|
| (2,905,182 | ) |
|
| (2,946,013 | ) |
|
| 24,930,837 |
|
|
|
|
|
|
|
|
|
|
|
|
|
|
|
|
|
|
Provision for income taxes |
|
| 0 |
|
|
| 0 |
|
|
| 0 |
|
|
| 0 |
|
|
|
|
|
|
|
|
|
|
|
|
|
|
|
|
|
|
NET INCOME (LOSS) |
| $ | (1,791,144 | ) |
| $ | (2,905,182 | ) |
| $ | (2,946,013 | ) |
| $ | 24,930,837 |
|
|
|
|
|
|
|
|
|
|
|
|
|
|
|
|
|
|
BASIC NET INCOME (LOSS) PER SHARE |
| $ | (0.20 | ) |
| $ | (1.25 | ) |
| $ | (0.38 | ) |
| $ | 11.12 |
|
|
|
|
|
|
|
|
|
|
|
|
|
|
|
|
|
|
DILUTED NET INCOME (LOSS) PER SHARE |
| $ | (0.20 | ) |
| $ | (1.25 | ) |
| $ | (0.38 | ) |
| $ | 10.76 |
|
|
|
|
|
|
|
|
|
|
|
|
|
|
|
|
|
|
WEIGHTED AVERAGE NUMBER OF SHARES OUTSTANDING - BASIC |
|
| 9,011,248 |
|
|
| 2,320,084 |
|
|
| 7,739,696 |
|
|
| 2,242,318 |
|
|
|
|
|
|
|
|
|
|
|
|
|
|
|
|
|
|
WEIGHTED AVERAGE NUMBER OF SHARES OUTSTANDING - DILUTED |
|
| 9,011,248 |
|
|
| 2,320,084 |
|
|
| 7,739,696 |
|
|
| 2,328,927 |
|
The accompanying notes are an integral part of these condensed consolidated financial statements
CREATIVE MEDICAL TECHNOLOGY HOLDINGS, INC. | ||||||||||||||||
UNAUDITED CONDENSED CONSOLIDATED STATEMENTS OF OPERATIONS | ||||||||||||||||
| ||||||||||||||||
|
| For the Three Months Ended June 30, 2023 |
|
| For the Three Months Ended June 30, 2022 |
|
| For the Six Months Ended June 30, 2023 |
|
| For the Six Months Ended June 30, 2022 |
| ||||
|
|
|
|
|
|
|
|
|
|
|
|
| ||||
Revenues |
| $ | - |
|
| $ | - |
|
| $ | - |
|
| $ | 15,000 |
|
|
|
|
|
|
|
|
|
|
|
|
|
|
|
|
|
|
Cost of revenues |
|
| - |
|
|
| - |
|
|
| - |
|
|
| 6,791 |
|
|
|
|
|
|
|
|
|
|
|
|
|
|
|
|
|
|
Gross profit |
|
| - |
|
|
| - |
|
|
| - |
|
|
| 8,209 |
|
|
|
|
|
|
|
|
|
|
|
|
|
|
|
|
|
|
OPERATING EXPENSES |
|
|
|
|
|
|
|
|
|
|
|
|
|
|
|
|
Research and development |
|
| 309,480 |
|
|
| 659,695 |
|
|
| 628,509 |
|
|
| 669,695 |
|
Selling, general and administrative |
|
| 859,537 |
|
|
| 1,108,428 |
|
|
| 1,630,557 |
|
|
| 2,238,485 |
|
Amortization of patent costs |
|
| 23,021 |
|
|
| 23,021 |
|
|
| 46,042 |
|
|
| 46,042 |
|
TOTAL EXPENSES |
|
| 1,192,038 |
|
|
| 1,791,144 |
|
|
| 2,305,108 |
|
|
| 2,954,222 |
|
|
|
|
|
|
|
|
|
|
|
|
|
|
|
|
|
|
Operating loss |
|
| (1,192,038 | ) |
|
| (1,791,144 | ) |
|
| (2,305,108 | ) |
|
| (2,946,013 | ) |
|
|
|
|
|
|
|
|
|
|
|
|
|
|
|
|
|
OTHER INCOME/(EXPENSE) |
|
|
|
|
|
|
|
|
|
|
|
|
|
|
|
|
Interest income |
|
| 89,913 |
|
|
| - |
|
|
| 151,060 |
|
|
| - |
|
Total other income (expense) |
|
| 89,913 |
|
|
| - |
|
|
| 151,060 |
|
|
| - |
|
|
|
|
|
|
|
|
|
|
|
|
|
|
|
|
|
|
LOSS BEFORE PROVISION FOR INCOME TAXES |
|
| (1,102,125 | ) |
|
| (1,791,144 | ) |
|
| (2,154,048 | ) |
|
| (2,946,013 | ) |
|
|
|
|
|
|
|
|
|
|
|
|
|
|
|
|
|
Provision for income taxes |
|
| - |
|
|
| - |
|
|
| - |
|
|
| - |
|
|
|
|
|
|
|
|
|
|
|
|
|
|
|
|
|
|
NET LOSS |
| $ | (1,102,125 | ) |
| $ | (1,791,144 | ) |
| $ | (2,154,048 | ) |
| $ | (2,946,013 | ) |
|
|
|
|
|
|
|
|
|
|
|
|
|
|
|
|
|
NET LOSS PER SHARE - BASIC AND DILUTED |
| $ | (0.78 | ) |
| $ | (1.99 | ) |
| $ | (1.53 | ) |
| $ | (3.81 | ) |
|
|
|
|
|
|
|
|
|
|
|
|
|
|
|
|
|
WEIGHTED AVERAGE NUMBER OF SHARES OUTSTANDING - BASIC AND DILUTED |
|
| 1,409,948 |
|
|
| 901,125 |
|
|
| 1,408,793 |
|
|
| 773,970 |
|
|
|
|
|
|
|
|
|
|
|
|
|
|
|
|
|
|
The Accompanying notes are an integral part of these condensed consolidated financial statements | ||||||||||||||||
| 4 |
| Table of Contents |
CREATIVE MEDICAL TECHNOLOGY HOLDINGS, INC.
UNAUDITED CONDENSED CONSOLIDATED CASH FLOWS
CREATIVE MEDICAL TECHNOLOGY HOLDINGS, INC. | CREATIVE MEDICAL TECHNOLOGY HOLDINGS, INC. | |||||||||||||||
UNAUDITED CONDENSED CONSOLIDATED STATEMENTS OF CASH FLOWS | UNAUDITED CONDENSED CONSOLIDATED STATEMENTS OF CASH FLOWS | |||||||||||||||
|
|
|
| |||||||||||||
|
| For the Six Months Ended June 30, 2022 |
|
| For the Six Months Ended June 30, 2021 |
|
| For the Six Months Ended June 30, 2023 |
|
| For the Six Months Ended June 30, 2022 |
| ||||
|
|
|
|
|
|
|
|
|
|
| ||||||
CASH FLOWS FROM OPERATING ACTIVITIES: |
|
|
|
|
|
|
|
|
|
| ||||||
Net income (loss) |
| $ | (2,946,013 | ) |
| $ | 24,930,837 |
| ||||||||
Adjustments to reconcile net income (loss) to |
|
|
|
|
| |||||||||||
net cash from operating activities: |
|
|
|
|
| |||||||||||
Net loss |
| $ | (2,154,048 | ) |
| $ | (2,946,013 | ) | ||||||||
Adjustments to reconcile net loss to |
|
|
|
|
| |||||||||||
net cash used in operating activities: |
|
|
|
|
| |||||||||||
Stock-based compensation |
| 50,422 |
| 211,768 |
|
| 18,324 |
| 50,422 |
| ||||||
Amortization |
| 46,042 |
| 46,042 |
|
| 46,042 |
| 46,042 |
| ||||||
Amortization of debt discounts |
| 0 |
| 451,614 |
| |||||||||||
Change in fair value of derivatives liabilities |
| 0 |
| (26,224,593 | ) | |||||||||||
Increase in principal and accrued interest balances due to penalty provision |
| 0 |
| 93,821 |
| |||||||||||
Gain on extinguishment of convertible notes |
| 0 |
| (96,444 | ) | |||||||||||
Changes in assets and liabilities: |
|
|
|
|
|
|
|
|
|
| ||||||
Accounts receivable |
| 2,485 |
| 0 |
|
| - |
| 2,485 |
| ||||||
Inventory |
| (9,759 | ) |
| 0 |
|
| - |
| (9,759 | ) | |||||
Prepaids and other current assets |
| (64,960 | ) |
| 0 |
|
| 184,428 |
| (64,960 | ) | |||||
Accounts payable |
| (451,181 | ) |
| 14,143 |
|
| (2,923,125 | ) |
| (451,181 | ) | ||||
Accrued expenses |
| 40,535 |
| 25,355 |
|
|
| - |
|
|
| 40,535 |
| |||
Management fee payable |
|
| 0 |
|
|
| (116,200 | ) | ||||||||
Net cash used in operating activities |
|
| (3,332,429 | ) |
|
| (663,657 | ) |
|
| (4,828,379 | ) |
|
| (3,332,429 | ) |
|
|
|
|
|
|
|
|
|
|
| ||||||
CASH FLOWS FROM INVESTING ACTIVITIES: |
|
|
|
|
|
|
|
|
|
|
|
|
| |||
Net cash used in investing activities |
|
| 0 |
|
|
| 0 |
| ||||||||
Investments in certificates of deposit |
| (4,551,049 | ) |
| - |
| ||||||||||
Redemptions of certificates of deposit |
|
| 5,048,459 |
|
|
| - |
| ||||||||
Net cash provided by investing activities |
|
| 497,410 |
|
|
| - |
| ||||||||
|
|
|
|
|
|
|
|
|
|
| ||||||
CASH FLOWS FROM FINANCING ACTIVITIES: |
|
|
|
|
|
|
|
|
|
| ||||||
Proceeds from sale of common stock and warrants, net of issuance costs |
| 15,471,775 |
| 0 |
|
| - |
| 15,471,775 |
| ||||||
Proceeds from exercise of warrants |
| 445 |
| 0 |
|
|
| - |
|
|
| 445 |
| |||
Proceeds from note payable |
| 0 |
| 100,000 |
| |||||||||||
Proceeds from convertible notes payable |
| 0 |
| 134,640 |
| |||||||||||
Proceeds from sale of preferred stock |
| 0 |
| 462,000 |
| |||||||||||
Related party advances |
| 0 |
| 226,500 |
| |||||||||||
Payments to settle convertible notes payable and warrants |
|
| 0 |
|
|
| (198,907 | ) | ||||||||
Net cash provided by financing activities |
|
| 15,472,220 |
|
|
| 724,233 |
|
|
| - |
|
|
| 15,472,220 |
|
|
|
|
|
|
|
|
|
|
|
| ||||||
NET INCREASE IN CASH |
| 12,139,791 |
| 60,576 |
| |||||||||||
NET INCREASE (DECREASE) IN CASH |
| (4,330,969 | ) |
| 12,139,791 |
| ||||||||||
BEGINNING CASH BALANCE |
|
| 10,723,870 |
|
|
| 98,012 |
|
|
| 8,320,519 |
|
|
| 10,723,870 |
|
ENDING CASH BALANCE |
| $ | 22,863,661 |
|
| $ | 158,588 |
|
| $ | 3,989,550 |
|
| $ | 22,863,661 |
|
|
|
|
|
|
|
|
|
|
|
| ||||||
SUPPLEMENTAL CASH FLOW INFORMATION: |
|
|
|
|
| |||||||||||
Cash payments for interest |
| $ | - |
|
| $ | 9,186 |
| ||||||||
Cash payments for income taxes |
| $ | - |
|
| $ | - |
| ||||||||
|
|
|
|
|
| |||||||||||
NON-CASH INVESTING AND FINANCING ACTIVITIES: |
|
|
|
|
|
|
|
|
|
| ||||||
Conversion of notes payable, accrued interest and derivative liabilities into common stock |
| $ | 0 |
|
| $ | 13,454,704 |
| ||||||||
Conversion of management fees and patent liability into common stock |
| $ | 250,000 |
|
| $ | 50,000 |
|
| $ | - |
|
| $ | 250,000 |
|
Discounts on convertible notes payable due to derivative liabilities |
| $ | 0 |
|
| $ | 134,640 |
| ||||||||
The accompanyingAccompanying notes are an integral part of these condensed consolidated financial statements.statements
| 5 |
| Table of Contents |
CREATIVE MEDICAL TECHNOLOGY HOLDINGS, INC.
UNAUDITED CONDENSED CONSOLIDATED STATEMENT OF STOCKHOLDERS’ EQUITY (DEFICIT)
CREATIVE MEDICAL TECHNOLOGY HOLDINGS, INC. | ||||||||||||||||||||||||||||||||||||||||||||
UNAUDITED CONDENSED CONSOLIDATED STATEMENTS OF STOCKHOLDERS' EQUITY (DEFICIT) | ||||||||||||||||||||||||||||||||||||||||||||
|
|
|
|
|
|
|
|
|
|
|
|
|
|
|
|
|
|
|
|
|
|
|
|
|
|
|
|
|
|
|
|
|
| |||||||||||
|
| Series A Preferred Stock |
|
| Series B Preferred Stock |
|
| Series C Preferred Stock |
|
| Common Stock |
|
| Additional Paid-in |
|
| Accumulated |
|
| Total Stockholders' |
| |||||||||||||||||||||||
|
| Shares |
|
| Amount |
|
| Shares |
|
| Amount |
|
| Shares |
|
| Amount |
|
| Shares |
|
| Amount |
|
| Capital |
|
| Deficit |
|
| Equity |
| |||||||||||
December 31, 2022 |
|
| - |
|
| $ | - |
|
|
| - |
|
| $ | - |
|
|
| - |
|
| $ | - |
|
|
| 1,407,624 |
|
| $ | 1,408 |
|
| $ | 69,675,124 |
|
| $ | (53,811,858 | ) |
| $ | 15,864,674 |
|
|
|
|
|
|
|
|
|
|
|
|
|
|
|
|
|
|
|
|
|
|
|
|
|
|
|
|
|
|
|
|
|
|
|
|
|
|
|
|
|
|
|
|
|
|
Round-up shares issued in reverse stock split |
|
| - |
|
|
| - |
|
|
| - |
|
|
| - |
|
|
| - |
|
|
| - |
|
|
| 23,502 |
|
|
| 23 |
|
|
| (23 | ) |
|
| - |
|
|
| - |
|
Stock-based compensation |
|
| - |
|
|
| - |
|
|
| - |
|
|
| - |
|
|
| - |
|
|
| - |
|
|
| - |
|
|
| - |
|
|
| 18,324 |
|
|
| - |
|
|
| 18,324 |
|
Net loss |
|
| - |
|
|
| - |
|
|
| - |
|
|
| - |
|
|
| - |
|
|
| - |
|
|
| - |
|
|
| - |
|
|
| - |
|
|
| (2,154,048 | ) |
|
| (2,154,048 | ) |
|
|
|
|
|
|
|
|
|
|
|
|
|
|
|
|
|
|
|
|
|
|
|
|
|
|
|
|
|
|
|
|
|
|
|
|
|
|
|
|
|
|
|
|
|
June 30, 2023 |
|
| - |
|
| $ | - |
|
|
| - |
|
| $ | - |
|
|
| - |
|
| $ | - |
|
|
| 1,431,126 |
|
| $ | 1,431 |
|
| $ | 69,693,425 |
|
| $ | (55,965,906 | ) |
| $ | 13,728,950 |
|
|
| Series A Preferred Stock |
|
| Series B Preferred Stock |
|
| Series C Preferred Stock |
|
| Common Stock |
|
|
|
|
|
|
|
|
|
| |||||||||||||||||||||||
|
| Shares |
|
| Amount |
|
| Shares |
|
| Amount |
|
| Shares |
|
| Amount |
|
| Shares |
|
| Amount |
|
| Additional Paid-in Capital |
|
| Accumulated Deficit |
|
| Total Stockholders’ Equity |
| |||||||||||
December 31, 2021 |
|
| - |
|
| $ | - |
|
|
| - |
|
| $ | 0 |
|
|
| - |
|
| $ | 0 |
|
|
| 6,338,864 |
|
| $ | 6,339 |
|
| $ | 53,879,215 |
|
| $ | (43,667,814 | ) |
| $ | 10,217,740 |
|
|
|
|
|
|
|
|
|
|
|
|
|
|
|
|
|
|
|
|
|
|
|
|
|
|
|
|
|
|
|
|
|
|
|
|
|
|
|
|
|
|
|
|
|
|
Issuance of common stock and accompanying warrants, net of issuance costs |
|
| - |
|
|
| 0 |
|
|
| - |
|
|
| 0 |
|
|
| - |
|
|
| 0 |
|
|
| 2,991,669 |
|
|
| 2,992 |
|
|
| 15,468,783 |
|
|
| 0 |
|
|
| 15,471,775 |
|
|
|
|
|
|
|
|
|
|
|
|
|
|
|
|
|
|
|
|
|
|
|
|
|
|
|
|
|
|
|
|
|
|
|
|
|
|
|
|
|
|
|
|
|
|
Common stock issued for related party patent liabilities |
|
| - |
|
|
| 0 |
|
|
| - |
|
|
| 0 |
|
|
| - |
|
|
| 0 |
|
|
| 181,818 |
|
|
| 182 |
|
|
| 249,818 |
|
|
| 0 |
|
|
| 250,000 |
|
|
|
|
|
|
|
|
|
|
|
|
|
|
|
|
|
|
|
|
|
|
|
|
|
|
|
|
|
|
|
|
|
|
|
|
|
|
|
|
|
|
|
|
|
|
Common stock issued for warrant exercise |
|
| - |
|
|
| 0 |
|
|
| - |
|
|
| 0 |
|
|
| - |
|
|
| 0 |
|
|
| 4,443,887 |
|
|
| 4,444 |
|
|
| (3,999 | ) |
|
| 0 |
|
|
| 445 |
|
|
|
|
|
|
|
|
|
|
|
|
|
|
|
|
|
|
|
|
|
|
|
|
|
|
|
|
|
|
|
|
|
|
|
|
|
|
|
|
|
|
|
|
|
|
Stock-based compensation |
|
| - |
|
|
| 0 |
|
|
| - |
|
|
| 0 |
|
|
| - |
|
|
| 0 |
|
|
| - |
|
|
| 0 |
|
|
| 50,422 |
|
|
| 0 |
|
|
| 50,422 |
|
|
|
|
|
|
|
|
|
|
|
|
|
|
|
|
|
|
|
|
|
|
|
|
|
|
|
|
|
|
|
|
|
|
|
|
|
|
|
|
|
|
|
|
|
|
Net loss |
|
| - |
|
|
| 0 |
|
|
| - |
|
|
| 0 |
|
|
| - |
|
|
| 0 |
|
|
| - |
|
|
| 0 |
|
|
| 0 |
|
|
| (2,946,013 | ) |
|
| (2,946,013 | ) |
|
|
|
|
|
|
|
|
|
|
|
|
|
|
|
|
|
|
|
|
|
|
|
|
|
|
|
|
|
|
|
|
|
|
|
|
|
|
|
|
|
|
|
|
|
June 30, 2022 |
|
| - |
|
| $ | 0 |
|
|
| - |
|
| $ | 0 |
|
|
| - |
|
| $ | 0 |
|
|
| 13,956,238 |
|
| $ | 13,957 |
|
| $ | 69,644,239 |
|
| $ | (46,613,827 | ) |
| $ | 23,044,369 |
|
|
| Series A Preferred Stock |
|
| Series B Preferred Stock |
|
| Series C Preferred Stock |
|
| Common Stock |
|
| Additional Paid-in |
|
| Accumulated |
|
| Total Stockholders' |
| |||||||||||||||||||||||
|
| Shares |
|
| Amount |
|
| Shares |
|
| Amount |
|
| Shares |
|
| Amount |
|
| Shares |
|
| Amount |
|
| Capital |
|
| Deficit |
|
| Equity |
| |||||||||||
March 31, 2023 |
|
| - |
|
| $ | - |
|
|
| - |
|
| $ | - |
|
|
| - |
|
| $ | - |
|
|
| 1,407,624 |
|
| $ | 1,408 |
|
| $ | 69,684,286 |
|
| $ | (54,863,781 | ) |
| $ | 14,821,913 |
|
|
|
|
|
|
|
|
|
|
|
|
|
|
|
|
|
|
|
|
|
|
|
|
|
|
|
|
|
|
|
|
|
|
|
|
|
|
|
|
|
|
|
|
|
|
Round-up shares issued in reverse stock split |
|
| - |
|
|
| - |
|
|
| - |
|
|
| - |
|
|
| - |
|
|
| - |
|
|
| 23,502 |
|
|
| 23 |
|
|
| (23 | ) |
|
| - |
|
|
| - |
|
Stock-based compensation |
|
| - |
|
|
| - |
|
|
| - |
|
|
| - |
|
|
| - |
|
|
| - |
|
|
| - |
|
|
| - |
|
|
| 9,162 |
|
|
| - |
|
|
| 9,162 |
|
Net loss |
|
| - |
|
|
| - |
|
|
| - |
|
|
| - |
|
|
| - |
|
|
| - |
|
|
| - |
|
|
| - |
|
|
| - |
|
|
| (1,102,125 | ) |
|
| (1,102,125 | ) |
|
|
|
|
|
|
|
|
|
|
|
|
|
|
|
|
|
|
|
|
|
|
|
|
|
|
|
|
|
|
|
|
|
|
|
|
|
|
|
|
|
|
|
|
|
June 30, 2023 |
|
| - |
|
| $ | - |
|
|
| - |
|
| $ | - |
|
|
| - |
|
| $ | - |
|
|
| 1,431,126 |
|
| $ | 1,431 |
|
| $ | 69,693,425 |
|
| $ | (55,965,906 | ) |
| $ | 13,728,950 |
|
|
| Series A Preferred Stock |
|
| Series B Preferred Stock |
|
| Series C Preferred Stock |
|
| Common Stock |
|
|
|
|
|
|
|
|
|
| Series A Preferred Stock |
| Series B Preferred Stock |
| Series C Preferred Stock |
| Common Stock |
| Additional Paid-in |
| Accumulated |
| Total Stockholders' |
| |||||||||||||||||||||||||||||||||||||||||||||||||||||
|
| Shares |
|
| Amount |
|
| Shares |
|
| Amount |
|
| Shares |
|
| Amount |
|
| Shares |
|
| Amount |
|
| Additional Paid-in Capital |
| Accumulated Deficit |
| Total Stockholders’ Equity |
|
| Shares |
|
| Amount |
|
| Shares |
|
| Amount |
|
| Shares |
|
| Amount |
|
| Shares |
|
| Amount |
|
| Capital |
|
| Deficit |
|
| Equity |
| ||||||||||||||||||||||||
March 31, 2022 |
| - |
| $ | 0 |
| - |
| $ | 0 |
| - |
| $ | 0 |
| 6,520,682 |
| $ | 6,521 |
| $ | 54,170,393 |
| $ | (44,822,683 | ) |
| $ | 9,354,231 |
| |||||||||||||||||||||||||||||||||||||||||||||||||||||||||
December 31, 2021 |
| - |
| $ | - |
| - |
| $ | - |
| - |
| $ | - |
| 633,886 |
| $ | 634 |
| $ | 53,884,920 |
| $ | (43,667,814 | ) |
| $ | 10,217,740 |
| |||||||||||||||||||||||||||||||||||||||||||||||||||||||||
|
|
|
|
|
|
|
|
|
|
|
|
|
|
|
|
|
|
|
|
|
|
|
|
|
|
|
|
|
|
|
|
|
|
|
|
|
|
|
|
|
|
|
|
|
|
| ||||||||||||||||||||||||||||||||||||||||||
Issuance of common stock and accompanying warrants, net of issuance costs |
| - |
| 0 |
| - |
| 0 |
| - |
| 0 |
| 2,991,669 |
| 2,992 |
| 15,468,783 |
| 0 |
| 15,471,775 |
|
| - |
| - |
| - |
| - | �� |
| - |
| - |
| 299,167 |
| 299 |
| 15,471,476 |
| - |
| 15,471,775 |
| |||||||||||||||||||||||||||||||||||||||||
|
|
|
|
|
|
|
|
|
|
|
|
|
|
|
|
|
|
|
|
|
|
|
| |||||||||||||||||||||||||||||||||||||||||||||||||||||||||||||||||
Common stock issued for related party patent liabilities |
| - |
| - |
| - |
| - |
| - |
| - |
| 18,182 |
| 18 |
| 249,982 |
| - |
| 250,000 |
| |||||||||||||||||||||||||||||||||||||||||||||||||||||||||||||||||
Common stock issued for warrant exercise |
| - |
| 0 |
| - |
| 0 |
| - |
| 0 |
| 4,443,887 |
| 4,444 |
| (3,999 | ) |
| 0 |
| 445 |
|
| - |
| - |
| - |
| - |
| - |
| - |
| 444,389 |
| 444 |
| 1 |
| - |
| 445 |
| |||||||||||||||||||||||||||||||||||||||||
|
|
|
|
|
|
|
|
|
|
|
|
|
|
|
|
|
|
|
|
|
|
|
| |||||||||||||||||||||||||||||||||||||||||||||||||||||||||||||||||
Stock-based compensation |
| - |
| 0 |
| - |
| 0 |
| - |
| 0 |
| - |
| 0 |
| 9,062 |
| 0 |
| 9,062 |
|
| - |
| - |
| - |
| - |
| - |
| - |
| - |
| - |
| 50,422 |
| - |
| 50,422 |
| ||||||||||||||||||||||||||||||||||||||||||
|
|
|
|
|
|
|
|
|
|
|
|
|
|
|
|
|
|
|
|
|
|
|
| |||||||||||||||||||||||||||||||||||||||||||||||||||||||||||||||||
Net loss |
| - |
| 0 |
| - |
| 0 |
| - |
| 0 |
| - |
| 0 |
| 0 |
| (1,791,144 | ) |
| (1,791,144 | ) |
| - |
| - |
| - |
| - |
| - |
| - |
| - |
| - |
| - |
| (2,946,013 | ) |
| (2,946,013 | ) | ||||||||||||||||||||||||||||||||||||||||
|
|
|
|
|
|
|
|
|
|
|
|
|
|
|
|
|
|
|
|
|
|
|
|
|
|
|
|
|
|
|
|
|
|
|
|
|
|
|
|
|
|
|
|
|
|
|
|
|
|
|
|
|
|
|
|
|
|
|
|
|
|
|
|
|
|
|
|
|
|
|
|
|
|
|
|
|
|
|
|
|
|
|
|
|
|
|
|
|
June 30, 2022 |
|
| - |
|
| $ | 0 |
|
|
| - |
|
| $ | 0 |
|
|
| - |
|
| $ | 0 |
|
|
| 13,956,238 |
|
| $ | 13,957 |
|
| $ | 69,644,239 |
|
| $ | (46,613,827 | ) |
| $ | 23,044,369 |
|
|
| - |
|
| $ | - |
|
|
| - |
|
| $ | - |
|
|
| - |
|
| $ | - |
|
|
| 1,395,624 |
|
| $ | 1,395 |
|
| $ | 69,656,801 |
|
| $ | (46,613,827 | ) |
| $ | 23,044,369 |
|
|
| Series A Preferred Stock |
|
| Series B Preferred Stock |
|
| Series C Preferred Stock |
|
| Common Stock |
|
| Additional Paid-in |
|
| Accumulated |
|
| Total Stockholders' |
| |||||||||||||||||||||||
|
| Shares |
|
| Amount |
|
| Shares |
|
| Amount |
|
| Shares |
|
| Amount |
|
| Shares |
|
| Amount |
|
| Capital |
|
| Deficit |
|
| Equity |
| |||||||||||
March 31, 2022 |
|
| - |
|
| $ | - |
|
|
| - |
|
| $ | - |
|
|
| - |
|
| $ | - |
|
|
| 652,068 |
|
| $ | 652 |
|
| $ | 54,176,262 |
|
| $ | (44,822,683 | ) |
| $ | 9,354,231 |
|
|
|
|
|
|
|
|
|
|
|
|
|
|
|
|
|
|
|
|
|
|
|
|
|
|
|
|
|
|
|
|
|
|
|
|
|
|
|
|
|
|
|
|
|
|
Issuance of common stock and accompanying warrants, net of issuance costs |
|
| - |
|
|
| - |
|
|
| - |
|
|
| - |
|
|
| - |
|
|
| - |
|
|
| 299,167 |
|
|
| 299 |
|
|
| 15,471,476 |
|
|
| - |
|
|
| 15,471,775 |
|
Common stock issued for warrant exercise |
|
| - |
|
|
| - |
|
|
| - |
|
|
| - |
|
|
| - |
|
|
| - |
|
|
| 444,389 |
|
|
| 444 |
|
|
| 1 |
|
|
| - |
|
|
| 445 |
|
Stock-based compensation |
|
| - |
|
|
| - |
|
|
| - |
|
|
| - |
|
|
| - |
|
|
| - |
|
|
| - |
|
|
| - |
|
|
| 9,062 |
|
|
| - |
|
|
| 9,062 |
|
Net loss |
|
| - |
|
|
| - |
|
|
| - |
|
|
| - |
|
|
| - |
|
|
| - |
|
|
| - |
|
|
| - |
|
|
| - |
|
|
| (1,791,144 | ) |
|
| (1,791,144 | ) |
|
|
|
|
|
|
|
|
|
|
|
|
|
|
|
|
|
|
|
|
|
|
|
|
|
|
|
|
|
|
|
|
|
|
|
|
|
|
|
|
|
|
|
|
|
June 30, 2022 |
|
| - |
|
| $ | - |
|
|
| - |
|
| $ | - |
|
|
| - |
|
| $ | - |
|
|
| 1,395,624 |
|
| $ | 1,395 |
|
| $ | 69,656,801 |
|
| $ | (46,613,827 | ) |
| $ | 23,044,369 |
|
|
|
|
|
|
|
|
|
|
|
|
|
|
|
|
|
|
|
|
|
|
|
|
|
|
|
|
|
|
|
|
|
|
|
|
|
|
|
|
|
|
|
|
|
|
The Accompanying notes are an integral part of these condensed consolidated financial statements | ||||||||||||||||||||||||||||||||||||||||||||
| 6 |
| Table of Contents |
|
| Series A Preferred Stock |
|
| Series B Preferred Stock |
|
| Series C Preferred Stock |
|
| Common Stock |
|
|
|
|
|
|
|
| |||||||||||||||||||||||||
|
| Shares |
|
| Amount |
|
| Shares |
|
| Amount |
|
| Shares |
|
| Amount |
|
| Shares |
|
| Amount |
|
| Additional Paid-in Capital |
|
| Accumulated Deficit |
|
| Total Stockholders’ Deficit |
| |||||||||||
December 31, 2020 |
|
| 3,000,000 |
|
| $ | 3,000 |
|
|
| - |
|
| $ | 0 |
|
|
| - |
|
| $ | 0 |
|
|
| 1,537,073 |
|
| $ | 1,537 |
|
| $ | 22,082,689 |
|
| $ | (61,890,236 | ) |
| $ | (39,803,010 | ) |
|
|
|
|
|
|
|
|
|
|
|
|
|
|
|
|
|
|
|
|
|
|
|
|
|
|
|
|
|
|
|
|
|
|
|
|
|
|
|
|
|
|
|
|
|
Proceeds from sales of preferred stock |
|
| - |
|
|
| 0 |
|
|
| 350 |
|
|
| 321,000 |
|
|
| 150 |
|
|
| 141,000 |
|
|
| 4,286 |
|
|
| 4 |
|
|
| (4 | ) |
|
| 0 |
|
|
| 462,000 |
|
|
|
|
|
|
|
|
|
|
|
|
|
|
|
|
|
|
|
|
|
|
|
|
|
|
|
|
|
|
|
|
|
|
|
|
|
|
|
|
|
|
|
|
|
|
Common stock issued for related party management liabilities |
|
| - |
|
|
| 0 |
|
|
| - |
|
|
| 0 |
|
|
| - |
|
|
| 0 |
|
|
| 89,286 |
|
|
| 89 |
|
|
| 49,911 |
|
|
| 0 |
|
|
| 50,000 |
|
|
|
|
|
|
|
|
|
|
|
|
|
|
|
|
|
|
|
|
|
|
|
|
|
|
|
|
|
|
|
|
|
|
|
|
|
|
|
|
|
|
|
|
|
|
Common stock issued for conversion of convertible notes, accrued interest and derivative liabilities |
|
| - |
|
|
| 0 |
|
|
| - |
|
|
| 0 |
|
|
| - |
|
|
| 0 |
|
|
| 772,099 |
|
|
| 772 |
|
|
| 1,228,579 |
|
|
| 0 |
|
|
| 1,229,351 |
|
|
|
|
|
|
|
|
|
|
|
|
|
|
|
|
|
|
|
|
|
|
|
|
|
|
|
|
|
|
|
|
|
|
|
|
|
|
|
|
|
|
|
|
|
|
Relief of derivative liabilities |
|
| - |
|
|
| 0 |
|
|
| - |
|
|
| 0 |
|
|
| - |
|
|
| 0 |
|
|
| - |
|
|
| - |
|
|
| 12,225,353 |
|
|
| 0 |
|
|
| 12,225,353 |
|
|
|
|
|
|
|
|
|
|
|
|
|
|
|
|
|
|
|
|
|
|
|
|
|
|
|
|
|
|
|
|
|
|
|
|
|
|
|
|
|
|
|
|
|
|
Dividends on preferred stock |
|
| - |
|
|
| 0 |
|
|
| - |
|
|
| 0 |
|
|
| - |
|
|
| 0 |
|
|
| - |
|
|
| 0 |
|
|
| (20,752 | ) |
|
| 0 |
|
|
| (20,752 | ) |
|
|
|
|
|
|
|
|
|
|
|
|
|
|
|
|
|
|
|
|
|
|
|
|
|
|
|
|
|
|
|
|
|
|
|
|
|
|
|
|
|
|
|
|
|
Cashless exercise of warrants |
|
| - |
|
|
| 0 |
|
|
| - |
|
|
| 0 |
|
|
| - |
|
|
| 0 |
|
|
| 37,870 |
|
|
| 38 |
|
|
| (38 | ) |
|
| 0 |
|
|
| 0 |
|
|
|
|
|
|
|
|
|
|
|
|
|
|
|
|
|
|
|
|
|
|
|
|
|
|
|
|
|
|
|
|
|
|
|
|
|
|
|
|
|
|
|
|
|
|
Stock-based compensation |
|
| - |
|
|
| 0 |
|
|
| - |
|
|
| 0 |
|
|
| - |
|
|
| 0 |
|
|
| - |
|
|
| 0 |
|
|
| 211,768 |
|
|
| 0 |
|
|
| 211,768 |
|
|
|
|
|
|
|
|
|
|
|
|
|
|
|
|
|
|
|
|
|
|
|
|
|
|
|
|
|
|
|
|
|
|
|
|
|
|
|
|
|
|
|
|
|
|
Net income |
|
| - |
|
|
| 0 |
|
|
| - |
|
|
| 0 |
|
|
| - |
|
|
| 0 |
|
|
| - |
|
|
| 0 |
|
|
| 0 |
|
|
| 24,930,837 |
|
|
| 24,930,837 |
|
|
|
|
|
|
|
|
|
|
|
|
|
|
|
|
|
|
|
|
|
|
|
|
|
|
|
|
|
|
|
|
|
|
|
|
|
|
|
|
|
|
|
|
|
|
June 30, 2021 |
|
| 3,000,000 |
|
| $ | 3,000 |
|
|
| 350 |
|
| $ | 321,000 |
|
|
| 150 |
|
| $ | 141,000 |
|
|
| 2,440,614 |
|
| $ | 2,440 |
|
| $ | 35,777,506 |
|
| $ | (36,959,399 | ) |
| $ | (714,453 | ) |
|
| Series A Preferred Stock |
|
| Series B Preferred Stock |
|
| Series C Preferred Stock |
|
| Common Stock |
|
|
|
|
|
|
|
|
|
| |||||||||||||||||||||||
|
| Shares |
|
| Amount |
|
| Shares |
|
| Amount |
|
| Shares |
|
| Amount |
|
| Shares |
|
| Amount |
|
| Additional Paid-in Capital |
|
| Accumulated Deficit |
|
| Total Stockholders’ Deficit |
| |||||||||||
March 31, 2021 |
|
| 3,000,000 |
|
| $ | 3,000 |
|
|
| 350 |
|
| $ | 326,600 |
|
|
| 150 |
|
| $ | 141,049 |
|
|
| 2,280,160 |
|
|
| 2,280 |
|
| $ | 31,138,715 |
|
| $ | (34,054,217 | ) |
| $ | (2,442,573 | ) |
|
|
|
|
|
|
|
|
|
|
|
|
|
|
|
|
|
|
|
|
|
|
|
|
|
|
|
|
|
|
|
|
|
|
|
|
|
|
|
|
|
|
|
|
|
Common stock issued for related party management liabilities |
|
| - |
|
|
| - |
|
|
| - |
|
|
| 0 |
|
|
| - |
|
|
| 0 |
|
|
| - |
|
|
| 0 |
|
|
| 0 |
|
|
| 0 |
|
|
| 0 |
|
|
|
|
|
|
|
|
|
|
|
|
|
|
|
|
|
|
|
|
|
|
|
|
|
|
|
|
|
|
|
|
|
|
|
|
|
|
|
|
|
|
|
|
|
|
Common stock issued for conversion of convertible notes, accrued interest and derivative liabilities |
|
| - |
|
|
| 0 |
|
|
| - |
|
|
| 0 |
|
|
| - |
|
|
| 0 |
|
|
| 142,695 |
|
|
| 142 |
|
|
| 341,646 |
|
|
| 0 |
|
|
| 341,788 |
|
|
|
|
|
|
|
|
|
|
|
|
|
|
|
|
|
|
|
|
|
|
|
|
|
|
|
|
|
|
|
|
|
|
|
|
|
|
|
|
|
|
|
|
|
|
Relief of derivative liabilities |
|
| - |
|
|
| 0 |
|
|
| - |
|
|
| 0 |
|
|
| - |
|
|
| 0 |
|
|
| - |
|
|
| 0 |
|
|
| 4,100,498 |
|
|
| 0 |
|
|
| 4,100,498 |
|
|
|
|
|
|
|
|
|
|
|
|
|
|
|
|
|
|
|
|
|
|
|
|
|
|
|
|
|
|
|
|
|
|
|
|
|
|
|
|
|
|
|
|
|
|
Dividends on preferred stock |
|
| - |
|
|
| 0 |
|
|
| - |
|
|
| (5,600 | ) |
|
| - |
|
|
| (49 | ) |
|
| - |
|
|
| 0 |
|
|
| (15,103 | ) |
|
| 0 |
|
|
| (20,752 | ) |
|
|
|
|
|
|
|
|
|
|
|
|
|
|
|
|
|
|
|
|
|
|
|
|
|
|
|
|
|
|
|
|
|
|
|
|
|
|
|
|
|
|
|
|
|
Cashless exercise of warrants |
|
| - |
|
|
| 0 |
|
|
| - |
|
|
| 0 |
|
|
| - |
|
|
| 0 |
|
|
| 17,759 |
|
|
| 18 |
|
|
| (18 | ) |
|
| 0 |
|
|
| 0 |
|
|
|
|
|
|
|
|
|
|
|
|
|
|
|
|
|
|
|
|
|
|
|
|
|
|
|
|
|
|
|
|
|
|
|
|
|
|
|
|
|
|
|
|
|
|
Stock-based compensation |
|
| - |
|
|
| 0 |
|
|
| - |
|
|
| 0 |
|
|
| - |
|
|
| 0 |
|
|
| - |
|
|
| 0 |
|
|
| 211,768 |
|
|
| 0 |
|
|
| 211,768 |
|
|
|
|
|
|
|
|
|
|
|
|
|
|
|
|
|
|
|
|
|
|
|
|
|
|
|
|
|
|
|
|
|
|
|
|
|
|
|
|
|
|
|
|
|
|
Net loss |
|
| - |
|
|
| 0 |
|
|
| - |
|
|
| 0 |
|
|
| - |
|
|
| 0 |
|
|
| - |
|
|
| 0 |
|
|
| 0 |
|
|
| (2,905,182 | ) |
|
| (2,905,182 | ) |
|
|
|
|
|
|
|
|
|
|
|
|
|
|
|
|
|
|
|
|
|
|
|
|
|
|
|
|
|
|
|
|
|
|
|
|
|
|
|
|
|
|
|
|
|
June 30, 2021 |
|
| 3,000,000 |
|
| $ | 3,000 |
|
|
| 350 |
|
| $ | 321,000 |
|
|
| 150 |
|
| $ | 141,000 |
|
|
| 2,440,614 |
|
| $ | 2,440 |
|
| $ | 35,777,506 |
|
| $ | (36,959,399 | ) |
| $ | (714,453 | ) |
The accompanying notes are an integral part of these consolidated financial statements.
CREATIVE MEDICAL TECHNOLOGY HOLDINGS, INCINC.
NOTES TO UNAUDITED CONDENSED CONSOLIDATED FINANCIAL STATEMENTS
JUNE 30, 20222023
NOTE 1 – ORGANIZATION AND SUMMARY OF SIGNIFICANT ACCOUNTING POLICIES
Organization – - Creative Medical Technologies Holdings, Inc. (the “Company”) is a commercial stage biotechnology company focused on immunology,dedicated to the advancement of identifying and translating novel biological therapeutics in the fields of immunotherapy, endocrinology, urology, orthopedicsneurology and neurology using adult stem cell treatments.orthopedics. The Company was incorporated on December 3, 1998, in the State of Nevada under the name Jolley Marketing, Inc. On May 18, 2016, the Company closed a transaction which was accounted for as a recapitalization, reverse merger, under which Creative Medical Technologies, Inc., a Nevada corporation (“CMT”) became the Company’s wholly-ownedwholly owned subsidiary, and Creative Medical Health, Inc. (“CMH”), which was CMT’s sole stockholder prior to the merger, became the Company’s principal stockholder. In connection with this merger, the Company changed its name to Creative Medical Technologies Holdings, Inc. to reflect its current business.
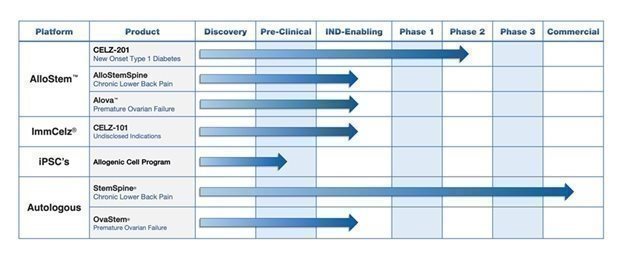
CMT was originally created on December 30, 2015 (“Inception”), as the urological arm of CMH to monetize a patent and related intellectual property related to the treatment of erectile dysfunction (“ED”), which it acquired from CMH in February 2016. Subsequently, the Company has expanded its development and acquisition of intellectual property beyond urology to include therapeutic treatments utilizing “re-programmed” stem cells, and the treatment of neurologic disorders, lower back pain, type I diabetes, and heart, liver, kidney, and other diseases using various types of stem cells through our ImmCelz, Inc., StemSpine, Inc. and AmnioStemAlloCelz LLC subsidiaries. However, neither ImmCelz Inc., StemSpine Inc. nor AmnioStemAlloCelz LLC have commenced commercial activities.
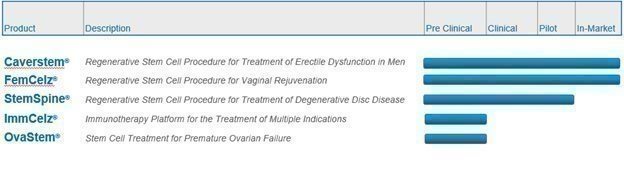
The Company currently conducts substantially all of its commercial operations through CMT, which markets and sells the Company’s CaverStem®CaverStem® and FemCelz® FemCelz® disposable kits utilized by physicians to perform autologous procedures that treat erectile dysfunction and female sexual dysfunction, respectively. In addition to its CaverStem® and FemCelz® products, the Company is currently in the process of recruiting clinical sites for its StemSpine® Regenerative Stem Cell Procedure for the Treatment of Degenerative Disc Disease, an autologous procedure that utilizes a patient’s own stem cells to treat lower back pain.
In 2020, through the Company’s ImmCelz Inc. subsidiary, the Company began exploring the development ofdeveloping treatments that utilize a patient’s own extracted immune cells that are then “reprogrammed” by culturing them outside the patient’s body with optimized stem cells. The immune cells are then re-injected into the patient from whom they were extracted. The Company believes this process endows the immune cells with regenerative properties that may be suitable for the treatment of stroke victims, among othermultiple indications. In contrast to other stem cell-based approaches, the immune cells are significantly smaller in size than stem cells and are believed to more effectively penetrate areas of the damaged tissues and induce regeneration.
Use of Estimates – – The preparation of the condensed consolidated financial statements in conformity with accounting principles generally accepted in the U.S. requires management to make estimates and assumptions that affect the reported amounts of assets and liabilities and disclosure of contingent assets and liabilities at the date of the balance sheet and the reported amounts of revenues and expenses during the reporting period. Actual results could differ from those estimates.
Basis of Presentation -– The consolidated financial statements and accompanying notes have been prepared in accordance with U.S. generally accepted accounting principles (“U.S. GAAP”GAAP”). The consolidated financial statements include the accounts of the Company and its wholly-ownedwholly owned subsidiaries. All intercompany balances and transactions have been eliminated in consolidation. In the opinion of the Company’s management, the consolidated financial statements include all adjustments, which include only normal recurring adjustments, necessary for the fair presentation of the Company’s financial position for the periods presented. The operations for the six-month period ended June 30, 2022, are not necessarily indicative of the operating results for the full year.
Risks and Uncertainties - The Company has a limited operating history and has only recently started to generategenerated minimal revenues from its planned principal operations.
| Table of Contents |
On January 30, 2020, the World Health Organization declared the COVID-19 outbreak a “Public Health Emergency of International Concern” and on March 10, 2020, declared it to be a pandemic. Actions taken around the world to help mitigate the spread of the COVID-19 include restrictions on travel, and quarantines in certain areas, and forced closures for certain types of public places and businesses. The COVID-19 and actions taken to mitigate it have had and are expected to continue to have an adverse impact on the economies and financial markets of many countries, including the geographical area in which the Company operates. While it is unknown how long these conditions will last and what the complete financial effect will be to the company, to-date, the Company has experienced a reduction in revenues due to the COVID-19 outbreak.
The Company’s business and operations are sensitive to general business and economic conditions in the U.S. and worldwide. These conditions include short-term and long-term interest rates, inflation, fluctuations in debt and equity capital markets and the general condition of the U.S. and world economy. A host of factors beyond the Company’s control could cause fluctuations in these conditions, including the political environment and acts or threats of war or terrorism. Adverse developments in these general business and economic conditions, including through recession, downturn or otherwise, could have a material adverse effect on the Company’s financial condition and the results of its operations.
The Company has only recently started to generate sales and we have limited marketing and/or distribution capabilities. The Company has limited experience in developing, training, or managing a sales force and will incur substantial additional expenses if it decides to market any of its current and future products and services with an internal sales organization. Developing a marketing and sales force is also time consumingtime-consuming and could delay the launch of its future products and services. In addition, the Company will compete with many companies that currently have extensive and well-funded marketing and sales operations. The Company’s marketing and sales efforts may be unable to compete successfully against these companies. In addition, the Company has limited capital to devote to sales and marketing.
The Company’s industry is characterized by rapid changes in technology and customer demands. As a result, the Company’s products and services may quickly become obsolete and unmarketable. The Company’s future success will depend on its ability to adapt to technological advances, anticipate customer demands, develop new products and services, and enhance the Company’s current products and services on a timely and cost-effective basis. Further, the Company’s products and services must remain competitive with those of other companies with substantially greater resources. The Company may experience technical or other difficulties that could delay or prevent the development, introduction or marketing of new products and services or enhanced versions of existing products and services. Also, the Company may not be able to adapt new or enhanced products and services to emerging industry standards, and the Company’s new products and services may not be favorably received. In addition, the Company may not have the capital resources to further the development of existing and/or new ones.
On July 8, 2022, the Company received a letter from The Nasdaq Stock Market LLC advising us that we were not in compliance with Nasdaq Listing Rule 5550(a)(2) because the closing bid price of our common stock was below $1.00 per share for 30 consecutive business days. Pursuant to Nasdaq’s Listing Rules, the Company hashad a 180 day180-day grace period, until January 4, 2023, during which the Company may regaincould have regained compliance if the bid price of our common stock closesclosed at $1.00 per share or more for a minimum of ten consecutive business days. In addition,Subsequent to January 4, 2023, the Company may be eligible forhas been granted an additional 180-day grace period if we meet Nasdaq’s initial listing standards (other than with respect to minimum bid price) for The Nasdaq Capital Market. The Company intends to actively monitorperiod. On June 12, 2023, the company effected a 10-to-1 reverse common stock split. Following the reverse stock split, the closing bid price forof our common stock between now and January 4, 2023, and will consider available optionswas above $1.00 per share for ten consecutive business days from June 12, 2020 to regainJune 26, 2023. Pursuant to Nasdaq’s Listing Rules, the company was in compliance with Nasdaq’sNasdaq Listing Rule 5550(a)(2). On June 27, 2023 the Company received written notice from the Nasdaq Stock Market notifying the Company that is had regained compliance with the minimum bid price requirements. However, there can be no assurance that the Company will be able to regain compliance with Nasdaq’s Listing Rules and maintain our Nasdaq listing. The delisting of our shares of common stock from Nasdaq may have a material negative impact on the liquidity of our securities, as well as a material negative impact on our ability to raise capital in the future.requirement.
Regarding the war between Russia and Ukraine, we have no direct exposure to those geographies. We cannot predict how global supply chain activities, or the economy at large may be impacted by a prolonged war in Ukraine or sanctions imposed in response to the war, or whether future conflicts, if any, may adversely affect our results of operations.
Revenue - The Company recognizes revenues in accordance with Accounting Standards Codification (“ASC”) 606, “Revenue from contracts with customers”. Revenues are recognized when control of the promised goods or services is transferred to our customers, in an amount that reflects the consideration we expect to be entitled to in exchange for those goods or services. Deferred revenue represents amounts which still have yet to be earned.
The Company generates revenue from the sale of disposable stem cell concentration kits. Revenues are recognized when control of the promised goods or services are transferred to the customer, in an amount that reflects the consideration we expect to be entitled to in exchange for those goods or services, which is generally on delivery to the customer.
| 8 |
| Table of Contents |
Payments received for which the earnings process is not yet complete are deferred. As of June 30, 2022,2023, the Company had $40,000 in deferred revenue. There was no deferred revenue.revenue as of June 30, 2022.
Concentration Risks -– The Federal Deposit Insurance Corporation insures cash deposits in most general bank accounts for up to $250,000 per institution. The Company maintains its cash balances at twofour financial institutions. As of June 30, 2022,2023, the Company’s balance exceeded the limit at bothtwo institutions.
Fair Value of Financial Instrument - – The Company’s financial instruments consist of cash and cash equivalents, and payables. The carrying amount of cash and cash equivalents and payables approximates fair value because of the short-term nature of these items.
Fair value is an exit price, representing the amount that would be received from the sale of an asset or paid to transfer a liability in an orderly transaction between market participants. As such, fair value is a market-based measurement that should be determined based on assumptions that market participants would use in pricing an asset or liability. Fair value measurements are required to be disclosed by level within the following fair value hierarchy:
Level 1 – Inputs are unadjusted, quoted prices in active markets for identical assets or liabilities at the measurement date.
Level 2 – Inputs (other than quoted prices included in Level 1) are either directly or indirectly observable for the asset or liability through correlation with market data at the measurement date and for the duration of the instrument’s anticipated life.
Level 3 – Inputs lack observable market data to corroborate management’s estimate of what market participants would use in pricing the asset or liability at the measurement date. Consideration is given to the risk inherent in the valuation technique and the risk inherent in the inputs to the model.
When determining fair value, whenever possible the Company uses observable market data, and relies on unobservable inputs only when observable market data is not available. As of June 30, 2023, and 2022, the Company hashad no outstanding derivative liabilities.
Basic and Diluted LossIncome (Loss) Per Share – The Company follows Financial Accounting Standards Board (“FASB”) ASC 260 Earnings per Share to account for earnings per share. Basic earnings per share (“EPS”) calculations are determined by dividing net loss by the weighted average number of shares of common stock outstanding during the year. Diluted earnings per share calculations are determined by dividing net income by the weighted average number of common shares and dilutive common share equivalents outstanding. Dilutive common share equivalents include the dilutive effect of in-the-money share equivalents, which are calculated, based on the average share price for each period using the treasury stock method. Under the treasury stock method, the exercise price of an award, if any, the amount of compensation cost, if any, for future service that the Company has not yet recognized, and the estimated tax benefits that would be recorded in paid-in capital, if any, when an award is settled are assumed to be used to repurchase shares in the current period. During loss periods when common stock equivalents, if any, are anti-dilutive they are not considered in the computation. During the six-months ended June 30, 2023 and 2022, the Company had options to purchase 11,183 shares of common stock and warrants to purchase 2,284,932 shares of common stock; however, the effects were anti-dilutive due to the net loss.
Following the approval of the Company’s Board of Directors, on June 12, 2023, the Company effected a 1-for-10 reverse split of the Company’s outstanding shares of common stock by filing a Certificate of Change Pursuant to NRS 78.209 with the Secretary of State of the State of Nevada. The filing of the Certificate of Change also reduced the authorized number of shares of the Company’s Common Stock from 50 million to five million. All share references in this filing have been restated to reflect the reverse split to the earliest period presented. No fractional shares were issued, and no cash or other consideration were paid in connection with the Reverse Stock Split. Instead, the Company issued one whole share of the post-Reverse Stock Split Common Stock to any stockholder who otherwise would have received a fractional share as a result of the Reverse Stock Split. As a result, the Company issued an additional 23,502 shares.
Cash Equivalents – The Company classifies its highly liquid investments with maturities of three-months or less at the date of purchase as cash equivalents. Management determines the appropriate classification of its investments at the time of purchase and reevaluates the designations of each investment as of the balance sheet date for each reporting period. The Company classifies its investments as either short-term or long-term based on each instrument’s underlying contractual maturity date. Investments with maturities of less than 12 months are classified as short-term and those with maturities greater than 12 months are classified as long-term. The cost of investments sold is based upon the specific identification method.
Inventories – Inventories are valued on a cost basis. The cost of inventories is determined on a first-in, first-out basis.
| Table of Contents |
The following is a summary of outstanding securities which have been included in the calculation of diluted net income per share and reconciliation of net income to net income available to common stockholders for the six-months ended June 30, 2021.
|
| For the Six-months Ended June 30, 2021 |
| |
Weighted average common shares outstanding used in calculating basic earnings per share |
|
| 2,242,318 |
|
Effect of Series B and C preferred stock |
|
| 24,000 |
|
Effect of warrants |
|
| 35,873 |
|
Effect of convertible notes payable |
|
| 22,115 |
|
Effect of convertible related party management fee and patent liabilities |
|
| 4,623 |
|
Weighted average common shares outstanding used in calculating diluted earnings per share |
|
| 2,328,929 |
|
|
|
|
|
|
Net income as reported |
| $ | 24,930,837 |
|
Add - Interest on convertible notes payable |
|
| 117,649 |
|
Net income available to common stockholders |
| $ | 25,048,486 |
|
The Company excluded 7 options and 18 warrants from the computation of diluted net income per share for the six-months ended June 30, 2021 as their exercise prices were in excess of the average closing market price of the Company’s common stock during that period.
During the six-months ended June 30, 2022, the Company had 111,824 options and 22,969,265 warrants to purchase shares of common stock which have been excluded from the dilutive net loss per share calculation as their effects are anti-dilutive.
Recent Accounting Pronouncements – The Company has reviewed all recently issued, but not yet adopted, accounting standards in order to determine their effects, if any, on its results of operation, financial position or cash flows. Based on that review, the Company believes that none of these pronouncements will have a significant effect on its financial statements.
NOTE 2 – LICENSING AGREEMENTS
ED Patent– The Company acquired a patent from CMH, a related company on February 2, 2016, in exchange for 431,11143,112 shares of CMTH restricted common stock valued at $100,000. The patent expires in 2025 and the Company has elected to amortize the patent over a ten-year period on a straight-line basis. Amortization expense of $4,986 was recorded for the six-months ended June 30, 20222023, and 2021.2022. As of June 30, 2022,2023, the carrying value of the patent was $36,000.$26,030. The Company expects to amortize $9,972 annually through 2026 related to the patent costs.
Multipotent Amniotic Fetal Stem Cells License Agreement - On August 25, 2016, CMT entered into a License Agreement dated August 25, 2016, with a University.university. This license agreement grants to CMT the exclusive right to all products derived from a patent for use of multipotent amniotic fetal stem cells composition of matter throughout the world during the period ending on the expiration date of the longest-lived patent rights under the patent. The license agreement also permits CMT to grant sublicenses. Under the terms of the license agreement, CMT is required to diligently develop, manufacture, and sell any products licensed under the agreement. CMT paid the University an initial license fee within 30 days of entering into the agreement. CMT is also required to pay annual license maintenance fees on each anniversary date of the agreement, which maintenance fees would be credited toward any earned royalties for any given period. The License Agreement provides for payment of various milestone payments and earned royalties on the net sales of licensed products by CMT or any sub licensee. CMT is also required to reimburse the University for any future costs associated with maintaining the patent. CMT may terminate the license agreement for any reason upon 90 days’ written notice and the University may terminate the agreement in the event CMT fails to meet its obligations set forth therein, unless the breach is cured within 30 days of the notice from the University specifying the breach. CMT is also obligated to indemnify the University against claims arising due to the exercise of the license by CMT or any sub licensee. As of June 30, 2022,2023, no amounts are currently due to the University.
Lower Back Patent– The Company, through its subsidiary StemSpine, LLC, acquired a patent from CMH, a related company, on May 17, 2017, covering the use of various stem cells for the treatment of lower back pain from pursuant to a Patent Purchase Agreement, which was amended in November 2017. As amended, the agreement provides the following:
| · | The Company is required to pay CMH $100,000 within 30 days of demand as an initial payment. |
| · | In the event the Company determines to pursue the technology via use of autologous cells, the Company will pay CMH: |
| o | $100,000 upon the signing agreement with a university for the initiation of an IRB clinical trial. |
| o | $200,000, upon completion of the IRB clinical trial. |
| o | $300,000 in the event we commercialize the technology via use of autologous cells by a physician without a clinical trial. |
| · | In the event the Company determines to pursue the technology via use of allogenic cells, the Company will pay CMH: |
| 10 |
| Table of Contents |
| o | $100,000 upon filing an IND with the FDA. |
| o | $200,000 upon dosing of the first patient in a Phase 1-2 clinical trial. |
| o | $400,000 upon dosing the first patient in a Phase 3 clinical trial. |
| · | Payment may be made in cash or shares of our common at a discount of 30% to the lowest closing price within 20 business days prior to the conversion date. |
| · | In the event the Company’s shares of common stock trade below $0.01 per share for two or more consecutive trading days, the number of any shares issuable as payment doubles. |
| · | For a period of five years from the date of the first sale of any product derived from the patent, the Company is required to make royalty payments of 5% from gross sales of products, and 50% of sale price or ongoing payments from third parties for licenses granted under the patent to third parties. |
The Company paid CMH the $100,000 obligation of the initial payment due under this agreement, by a $50,000 cash payment and the issuance of 6,667667 shares of common stock on December 12, 2019.2020. On January 8, 2021,December 31, 2020, following the Company’s announcement with respect to the clinical commercialization of the StemSpine technology, the Company paid CMH $50,000 of the $300,000 obligation due under this agreement through the issuance of 13314 shares of common stock. On September 30, 2020,2021, the Company paid CMH an additional $40,000 of the $300,000 obligation due under this agreement through the issuance of 84,6568,466 shares of common stock, and in January 2021 the Company paid CMH an additional $50,000 of the $300,000 obligation due under this agreement through the issuance of 89,2868,929 shares of common stock. The remaining portion of the $300,000 obligation was paid in cash in 2021.2020.
The patent expires on May 19, 2027, and the Company has elected to amortize the patent over a ten-year period on a straight-line basis. Amortization expense of $5,000 was recorded for the six-month periodssix-months ended June 30, 20222023, and 2021.2022. As of June 30, 2022,2023, the carrying value of the initial patent license was $50,000.$40,000. The Company expects to amortize approximately $10,000 annually through 2027 related to the patent costs.
The Company has elected to amortize the increased obligation fromadditional $300,000 associated with the election to commercialize the StemSpine technologypatent over a ten-year period on a straight-line basis. Amortization expense of $22,970 was recorded for the six-month periodssix-months ended June 30, 20222023, and 2021.2022. As of June 30, 2022,2023, the carrying value of the patent was $179,344.$133,404. The Company expects to amortize approximately $46,000 annually through 20272026 related to the patent costs.
ImmCelz™ - On December 28, 2020, ImmCelz, Inc. (“ImmCelz”), a newly formed Nevada corporation and wholly owned subsidiary of the Company, entered into a Patent License Agreement dated December 28, 2020 (the “Agreement”), with Jadi Cell, LLC. (“Jadi”), a company controlled by Dr. Amit Patel, a former director of the Company. The Agreement grants to ImmCelz™ the patent rights under U.S. Patent# 9,803,176 B2, “Methods and compositions for the clinical derivation of an allogenic cell and therapeutic uses”. The contract grants ImmCelz™ access to proprietary process of expanding the master cell bank of Jadi Cell LLC, as currently practiced by Licensor, and as documented in standard operating procedures (SOPs) and other written documentation.documentation to augment autologous cells. The terms of the agreement are as follows:
| · | Licensee shall pay Licensor a license fee of $250,000 (the “Upfront Royalty”), which can also be paid in CELZ stock at a discount of 25% of the closing price of $0.0037, which is based on the date of this agreement |
| · | Within thirty (30) days of the end of each calendar quarter during the term of this Agreement, Licensee will pay Licensor five percent (5%) of the Net Income of ImmCelz™. during such calendar quarter (the “Continuing Royalty”) |
| · | in one or a series of related transactions, of all or substantially all of the business or assets of Licensee ImmCelz, Inc. (“Sale of Assets”) will result in a one-time ten-percent allocation to the licensor, the Continuing Royalty will be calculated at five percent (5%) of the Net Income of Licensee in any calendar quarter in which the Net Income in such calendar quarter reflects the receipt of any consideration from such Sale of Assets. |
To date, the Company has not made any payments to Jadi Cell under this agreement, other than the $250,000 initial license fee, which was paid by the issuance of 180,18018,018 shares of common stock to Jadi Cell in February 2022.
| 11 |
| Table of Contents |
The Company has elected to amortize the patent over a ten-year period on a straight-line basis. Amortization expenseexpenses of $12,500 were recorded for the six-month periodssix-months ended June 30, 20222023, and 2021.2022. As of June 30, 2022,2023, the carrying value of the patent was $212,500.$187,500. The Company expects to amortize approximately $25,000 annually through 2030 related to the patent costs.
The following is a roll-forwardrollforward of the Company’s licensing agreements for the six-months endedsix months-ended June 30, 2022.2023.
|
| Assets |
|
| Accumulated Amortization |
|
| Assets |
|
| Accumulated Amortization |
| ||||
|
|
|
|
|
|
|
|
|
|
| ||||||
Balances at December 31, 2021 |
| $ | 760,000 |
| $ | (232,321 | ) | |||||||||
Balances at December 31, 2022 |
| $ | 760,000 |
| $ | (324,405 | ) | |||||||||
Addition of new assets |
|
|
| 0 |
|
|
|
| - |
| ||||||
Amortization |
|
| 0 |
|
|
| (46,042 | ) |
|
| - |
|
|
| (46,042 | ) |
Balances at June 30, 2022 |
| $ | 760,000 |
|
| $ | (278,363 | ) | ||||||||
Balances at June 30, 2023 |
| $ | 760,000 |
|
| $ | (370,447 | ) | ||||||||
NOTE 3 – RELATED PARTY TRANSACTIONS
Management Reimbursement Agreement
On November 17, 2017, the Company entered into a Management Reimbursement Agreement with CMH, a related party whose directors and executive officers include the Company’s officers and directors. Pursuant to this agreement, during 2019 and 2020, and until September 16, 2021, the Company reimbursed CMH an aggregate of $45,000 per month for the services of management and consultants employed by CMH (including the Company’s Chief Executive Officer and Chief Financial Officer, and the Company’s former directors Dr. Patel and Dr. Ichim). The agreement provided that at the option of CMH, the reimbursable amounts may be paid from time to time in shares of common stock of the Company at a price equal to a 30% discount to the lowest closing price during the 20 trading days prior to time the notice is given. This agreement was terminated effective September 15, 2021. At June 30, 2022, no amounts were owed CMH under this agreement. At June 30, 2021, the Company owed CMH $52,582.
Debt Settlement Agreement
On January 12, 2018, the Company entered into a Debt Settlement Agreement with Timothy Warbington, the Company’s Chief Executive Officer, under which the Company issued 3,000,000 shares of super-voting Series A Preferred Stock to Mr. Warbington in exchange for the cancellation of $150,000 of debt owed by the Company to CMH, which CMH in turn was obligated to pay Mr. Warbington. The Series A Preferred Stock previously provided Mr. Warbington with substantial control over all matters subject to a vote of the Company’s shareholders. Mr. Warbington surrendered the Series A Preferred Stock to the Company in December 2021 immediately prior to the closing of the Company’s public offering in exchange for $150,000 plus 8% interest on such amount from January 2018 until the date of surrender.
Jadi Cell License Agreement
On December 28, 2020, the Company entered into a patent license agreement with Jadi Cell, LLC, a company owned and controlled by Dr. Amit Patel, a former director of the Company. The agreement provides Company with an exclusive, worldwide license to U.S. Patent No. 9,803,176 “Methods and compositions for the clinical derivation of an allogenic cell and therapeutic uses” and the proprietary process of expanding the master cell bank of Jadi Cell LLC, in the field of enhancing autologous cells. The agreement is described in detail in Note 2 above. To date, the Company has not made any payments to Jadi Cell under this agreement, other than the $250,000 initial license fee, which was paid by the issuance of 181,81818,018 shares of common stock to Jadi Cell in February 2022.
StemSpine Patent Purchase
The Company acquired U.S. Patent No. 9,598,673 covering the use of various stem cells for the treatment of lower back pain from its affiliate CMH pursuant to a Patent Purchase Agreement dated May 17, 2017, which was amended in November 2017. The inventors of the patent were Thomas Ichim, PhD and Amit Patel, MD, former directors of the Company, and Annette Marleau, PhD. The Patent Purchase Agreement is described in detail in Note 2 above. Pursuant to the Patent Purchase Agreement, the Company paid CMH the $100,000 obligation of the initial payment due under this agreement, by a $50,000 cash payment and the issuance of 6,667667 shares of common stock on December 12, 2020. On January 8, 2021,December 31, 2020, following the Company’s announcement with respect to the clinical commercialization of the StemSpine technology, the Company paid CMH $50,000 of the $300,000 obligation due under this agreement through the issuance of 13314 shares of common stock. On September 30, 2020,2021 the Company paid CMH an additional $40,000 of the $300,000 obligation due under this agreement through the issuance of 84,6568,466 shares of common stock, and in January 2021 the Company paid CMH an additional $50,000 of the $300,000 obligation due under this agreement through the issuance of 89,2868,929 shares of common stock. The remaining portion of the $300,000 obligation has been paid in cash.
Insider Loans
On May 28, 2021, Timothy Warbington, who is our CEO and Chairman; and Dr. Amit Patel, who was formerly a director of ours, advanced the Company $50,000 and $150,000 respectively. The two notes were repaid during the quarter ended September 30, 2021, did not have any conversion features, and bore interest at the rate of 5% per annum.
NOTE 4 – DEBT
As-of June 30, 2022, the Company had no outstanding loans and there was no loan activity during the six-months ended June 30, 2022.
During the six-months ended June 30, 2021, we issued $157,150 in convertible notes to accredited investors with net proceeds of $134,640. The notes matured during February of2023 and 2022 and bore interest at rate of 8%. The notesthere were convertible into shares of the Company’s common stock at conversion prices ranging from 60% to 71% of the average of the two lowest traded prices or the lowest trade price of the Company’s common stock during the previous 15 trading days preceding the conversion date. The Company was amortizing the discount due to derivative liabilities and on-issuance discount totaling $157,150 to interest expense using the straight-line method over the original terms of the loans.
On May 28, 2021, our CEO, Mr. Timothy Warbington, and Board Member, Dr. Amit Patel, advanced the company $50,000 and $150,000 respectively. The two notes mature on August, 28 2021, and were repaid in full with an interest rate of 5%.no debt issuances.
During the six-months ended June 30, 2021, the Company amortized $451,614 to interest expense. As of June 30, 2021, total discounts of $120,185 remained for which were planned to be expensed through February 2022.
During the six-months ended June 30, 2021,2023, and 2022, the Company issued an aggregate of 772,099 shares upon the conversion of 1,229,351 ofhad no outstanding principal, interest and fees on existing, outstanding notes and 37,870 shares upon the cashless exercise of 43,167 warrants.
During the six-months ended June 30, 2021, the Company extinguished $118,000 of principal or interest.loans.
NOTE 5 – DERIVATIVE LIABILITIES
Derivative Liabilities
As-of June 30, 2023 and 2022, the Company had no outstanding derivative liabilities and there was no derivative activity during the six-months ended June 30, 2023 and 2022.
| 12 |
|
| Table of Contents |
NOTE 6 – STOCK-BASED COMPENSATION
On September 6, 2021, the Company’s Board of Directors, and holders of a majority of the voting power of the Company’s stockholders approved the Company’s 2021 Equity Incentive Plan (the “2021 Plan”), and reserved 600,00060,000 shares of common stock for the issuance of awards thereunder. The 2021 Plan provides for the granting to our employees, officers, directors, consultants, and advisors of performance awards payable in shares of common stock, stock options (non-statutory and incentive), restricted stock awards, stock appreciation rights (“SARs”), restricted share units (“RSUs”) and other stock-based awards. The purpose of the 2021 Plan is to secure for the Company and its stockholders the benefits arising from capital stock ownership by eligible participants who are expected to contribute to the Company’s future growth and success.
During the six-months ended June 30, 2022, Messrs. Warbington and Dickerson received 10-year options to purchase an aggregate of 111,18711,182 shares of common stock with an exercise price of $1.69.$16.90. The options vested immediately as to 25% of the shares subject to the option, and will vest in three equal installments of 25% of the shares subject to the option on each of the next three annual anniversary dates of the grant date. As of June 30, 2023, future estimated stock-based compensation expected to be recorded was estimated to be $58,455. The value of the options was determined to be $145,525 based upon the Black-Scholes method, see variables used below.
|
| Inputs Used |
|
| Inputs Used |
| ||
|
|
|
|
|
|
| ||
Annual dividend yield |
| $ | 0 |
|
| $ | - |
|
Expected life (years) |
| 10.0 |
|
| 10.0 |
| ||
Risk-free interest rate |
| 0.81 | % |
| 0.81 | % | ||
Expected volatility |
| 92.95 | % |
| 92.95 | % | ||
Common stock price |
| $ | 1.69 |
|
| $ | 16.90 |
|
During the six-months ended June 30, 2021,2023 and 2022, the fair market value of the options was insignificant to the financial statements.
Since the expected life of the options was greater than the Company’s historical stock information available, the Company determined the expected volatility based on price fluctuations of comparable public companies.
There were no options issued during the six-months ended June 30, 2021.2023, and 11,183 options issued during the six-months ended June 30, 2022.
Option activity for the six-months ended June 30, 20222023, consists of the following:
|
| Stock Options |
|
| Weighted Average Exercise Price |
|
| Weighted Average Life Remaining |
|
| Stock Options |
|
| Weighted Average Exercise Price |
|
| Weighted Average Life Remaining |
| ||||||
Outstanding, December 31, 2021 |
|
| 7 |
|
| $ | 7,500 |
|
|
| 4.64 |
| ||||||||||||
Outstanding, December 31, 2022 |
|
| 11,183 |
|
| $ | 83.96 |
|
|
| 9.11 |
| ||||||||||||
Issued |
| 111,817 |
|
|
| - |
|
| - |
| - |
| - |
| ||||||||||
Exercised |
| - |
| 0 |
| - |
|
| - |
| - |
| - |
| ||||||||||
Expired |
|
| - |
|
|
| 0 |
|
|
| - |
|
|
| - |
|
|
| - |
|
|
| - |
|
Outstanding, June 30, 2022 |
|
| 111,824 |
|
| $ | 2.16 |
|
|
| 9.62 |
| ||||||||||||
Vested, June, 30, 2022 |
|
| 27,961 |
|
| $ | 3.57 |
|
|
| 9.62 |
| ||||||||||||
Outstanding, June 30, 2023 |
|
| 11,183 |
|
| $ | 83.96 |
|
|
| 8.61 |
| ||||||||||||
Vested, June 30, 2023 |
|
| 7,456 |
|
| $ | 117.47 |
|
|
| 8.62 |
| ||||||||||||
See Note 2 for discussion related to the issuance of common stock in connection with licensing agreements.
See Note 7 for warrant rollforward.
| 13 |
| Table of Contents |
NOTE 7 – STOCKHOLDERS’ EQUITY
May 2022 Private Offering
On May 3, 2022, the “Company”Company completed the sale of (i)2,991,669 299,167 shares of common stock, and pre-funded warrants to purchase 4,563,887456,389 shares of common stock (the “Pre-Funded Warrants”), and (ii) accompanying warrants to purchase 15,111,1121,511,112 shares of common stock (the “Common Warrants”), at a combined offering price of $2.25$22.50 per share of common stock/Pre-Funded Warrant and related Common Warrant, to a group of institutional investors (the “Purchasers”), pursuant to a Securities Purchase Agreement between the Company and the Purchasers dated as of April 28, 2022 (the “Purchase Agreement”), resulting in gross proceeds to the Company of approximately $17,000,000. The transaction was effected pursuant to Section 4(a)(2) of the Securities Act of 1933, as amended and Rule 506(b) promulgated thereunder.
The Common Warrants have a five-year term, and an exercise price of $2.00$20.00 per share. The Pre-Funded Warrants dodid not expire,have an expiration date and havehad an exercise price of $0.0001$0.001 per share. As of June 30, 2023, all of the Pre-Funded Warrants had been exercised.
The Pre-Funded Warrants arewere classified as a component of permanent equity because they are freestanding financial instruments that are legally detachable and separately exercisable from the shares of common stock with which they were issued, are immediately exercisable, dodid not embody an obligation for the Company to repurchase its shares, and permitpermitted the holders to receive a fixed number of shares of common stock upon exercise. In addition, the Pre-Funded Warrants dodid not provide any guarantee of value or return.
Roth Capital Partners (“Roth”), acted as sole placement agent for the offering. The Company paid Roth a placement agent fee in the amount of $1,360,000 and issued Roth a warrant to purchase 1,133,333113,334 shares of Common Stock with the same terms as the Common Warrants issued to the Purchasers.
On June 12, 2023 the Company announced that its Board of Directors has approved a share repurchase program. The issuancesprogram authorizes the Company to repurchase up to $2 million of its shares of common stock, in the open market or through privately negotiated transactions, in accordance with applicable securities laws and exercises duringother restrictions. The manner, timing and amount of any purchase will be based on an evaluation of market conditions, the Company's stock price and other factors. The program has no termination date, may be suspended or discontinued at any time, and does not obligate the Company to acquire any particular number of shares of common stock. As-of June 30, 2023 no shares had been purchased under this program.
Warrants
In connection with our May 2022 private offering, we issued pre-funded warrants to purchase 456,389 shares of common stock and accompanying warrants to purchase 1,624,446 shares of common stock at a price of $20.00 per share.
Assumptions used in calculating the fair value of the warrants issued in 2022 were as follows:
|
| Range of Inputs Used |
| |
Annual dividend yield |
| $ | - |
|
Expected life (years) |
|
| 5.0 |
|
Risk-free interest rate |
|
| 0.81 | % |
Expected volatility |
|
| 92.95 | % |
Common stock price |
| $ | 18.30 |
|
As of June 30, 2023, and 2022, warrants to purchase 2,284,932 and 2,296,927 shares of common stock were outstanding respectively.
Warrant activity for the six-months ended June 30, 2022, are as follows:2023 consists of the following:
Outstanding at December 31, 2021 |
|
| 6,604,820 |
|
Issuances |
|
| 20,808,332 |
|
Exercises |
|
| (4,443,887 | ) |
Outstanding at June 30, 2022 |
|
| 22,969,265 |
|
Weighted Average Price at June 30, 2022 |
| $ | 2.64 |
|
NOTE 8 – SUBSEQUENT EVENTS
In accordance with ASC 855, management reviewed all material events through May 15, 2022, for these financial statements and there are no material subsequent events to report.
|
| Warrants |
|
| Weighted Average Exercise Price |
|
| Weighted Average Life Remaining |
| |||
Outstanding, December 31, 2022 |
|
| 2,284,932 |
|
| $ | 26.59 |
|
|
| 4.22 |
|
Issuances |
|
| - |
|
|
| - |
|
|
| - |
|
Exercises |
|
| - |
|
|
| - |
|
|
| - |
|
Outstanding, June 30, 2023 |
|
| 2,284,932 |
|
| $ | 26.59 |
|
|
| 3.72 |
|
| Table of Contents |
NOTE 8 – SIGNIFICANT RESEARCH AND DEVELOPMENT PURCHASE
On December 15, 2022, the Company purchased a set of components referred to as “research tools” for $5,000,000 from Narkeshyo LLC, an entity a former director and current consultant of the Company is affiliated with, pursuant to the terms of an Asset Purchase Agreement between the Company and Narkeshyo. Some of the acquired research tools were originally developed by the former director and current consultant. Under the terms of the agreement, the Company made an initial payment to Narkeshyo in the amount of $2,000,000 upon execution of the agreement, with the remaining amounts to be paid at various times through March 15, 2023, which were made as scheduled. Upon execution of the agreement, the Company recorded $5,000,000 as research and development expenses.
The vision and pipeline of the Company is based on robust and thorough development of its biological platforms, therapies and products. This acquisition of the research tools aligned with the Company’s priority of advancing and augmenting its suite of cGMP (Current Good Manufacturing Practices) cellular therapy products. The Company believes that the acquired research tools will allow it to protect its intellectual property while complying with regulatory requirements, and accelerate product development. The information contained in the research tools will not only be used to support and fast-track the Company’s regulatory filings (such as IND, NDA, ANDA and export applications), but also, provide clinical and regulatory support to potential partners and collaborators without having to divulge trade secrets and know-how.
A third-party analysis of this acquisition concluded it would accelerate development time by 3-5 years and result in a substantial reduction in the Company’s research and development expenses over the long term.
The purchased tools included (but were not limited to):
· | Toxicology | |
· | Screening | |
· | Preclinical Testing | |
· | Assays | |
· | Authorization | |
· | Tools of Biological Transaction | |
· | Tools of Intellectual Property |
NOTE 9 – SUBSEQUENT EVENTS
There were no material subsequent events during this period.
| 15 |
| Table of Contents |
Item 2. Management’s Discussion and Analysis of Financial Condition and Results of Operations
Management’s Discussion and Analysis of Financial Condition and Results of Operations analyzes the major elements of our balance sheets and statements of operations. This section should be read in conjunction with our Annual Report on Form 10-K for the year ended December 31, 2021, and our interim financial statements2022, and accompanying notes to these financial statements included in this report. All amounts are in U.S. dollars.
Forward-Looking Statement Notice
This quarterly report on Form 10-Q contains forward-looking statements about our expectations, beliefs or intentions regarding, among other things, our product development efforts, business, financial condition, results of operations, strategies or prospects. In addition, from time to time, we or our representatives have made or may make forward-looking statements, orally or in writing. Forward-looking statements can be identified by the use of forward-looking words such as “believe,” “expect,” “intend,” “plan,” “may,” “should” or “anticipate” or their negatives or other variations of these words or other comparable words or by the fact that these statements do not relate strictly to historical or current matters. These forward-looking statements may be included in, but are not limited to, various filings made by us with the SEC, press releases or oral statements made by or with the approval of one of our authorized executive officers. Forward-looking statements relate to anticipated or expected events, activities, trends or results as of the date they are made. Because forward-looking statements relate to matters that have not yet occurred, these statements are inherently subject to risks and uncertainties that could cause our actual results to differ materially from any future results expressed or implied by the forward-looking statements. Many factors could cause our actual activities or results to differ materially from the activities and results anticipated in forward-looking statements, including, but not limited to, those set forth in our most recent annual report referenced below.
This report identifies important factors which could cause our actual results to differ materially from those indicated by the forward-looking statements.
All forward-looking statements attributable to us or persons acting on our behalf speak only as of the date of this report and are expressly qualified in their entirety by the cautionary statements included in this report. We undertake no obligations to update or revise forward-looking statements to reflect events or circumstances that arise after the date made or to reflect the occurrence of unanticipated events. In evaluating forward-looking statements, you should consider these risks and uncertainties.
Overview
We are a commercial stage biotechnology company focused on immunology,dedicated to the advancement of identifying and translating novel biological therapeutics in the fields of immunotherapy, endocrinology, urology, neurology and orthopedics using adult stem cell treatments and interrelated regenerative technologies for the treatment of multiple indications.orthopedics. Our existing and pipeline ofplatforms, therapies and products include of the following:
Our subsidiary, Creative Medical Technologies, Inc. (“CMT”), was originally created to monetize U.S. Patent No. 8,372,797 and related intellectual property related to the treatment of erectile dysfunction (“ED”), which it acquired in FebruaryMay 2016. Subsequently, we have expanded our development and acquisition of intellectual property beyond urology to include therapeutic treatments utilizing “re-programmed” stem cells, and the treatment of neurologic disorders, lower back pain, type IType-1 diabetes, and heart, liver, kidney, and other diseases using various types of stem cells through our ImmCelz, Inc., StemSpine, Inc. and AmnioStemAlloCelz LLC subsidiaries. However, neither ImmCelz Inc., StemSpine Inc. nor AmnioStemAlloCelz LLC have commenced commercial activities.
We currently conduct substantially all of our commercial operations through CMT, which markets and sells our CaverStem® and FemCelz® disposable kits utilized by physicians to perform autologous procedures that treat erectile dysfunction and female sexual dysfunction, respectively. Our CaverStem® and FemCelz® kits are currently available through physicians at eight locations in the United States.
| 16 |
|
| Table of Contents |
In 2020, through our ImmCelz Inc. subsidiary, we began exploring the development ofdeveloping treatments that utilize a patient’s own extracted immune cells that are then “reprogrammed”“reprogrammed/supercharged” by culturing them outside the patient’s body with optimized stem cells.cell-free factors. The immune cells are then re-injected into the patient from whom they were extracted. We believe this process endows the immune cells with regenerative properties that may be suitable for the treatment of multiple indications, among other indications. In contrast to other stem cell-based approaches, the immune cells are significantly smaller in size than stem cells and are believed to more effectively penetrate areas of the damaged tissues and induce regeneration.
In June 2022, we signed an agreement with Greenstone Biosciences Inc. for the development of a human induced pluripotent stem cell (iPSC) pipeline for our ImmCelz® platform. This project was identified as iPScelz™. The efforts by Greenstone Biosciences Inc. are expected to complement and expand our current work on novel therapeutic cell lines.
In October 2022, we announced the development of our AlloStem™ Clinical Cell Line, a proprietary allogenic cell line which includes a Master Cell Bank and a Drug Master File. We believe we will able to use this cell line for many of our programs, including our ImmCelz® immunotherapy platform for multiple diseases, OvaStem® for Premature Ovarian Failure, CELZ-201 for Type 1 diabetes, StemSpine® for lower back pain, and IPScelz ™ inducible pluripotent stem cell program in ongoing development with Greenstone Biosciences.
In November 2022, we announced that the FDA had cleared the Company’s CELZ-201 Investigational New Drug (IND) application for the treatment of Type 1 Diabetes, which will allow us to begin a Phase I/II clinical trial. The primary objective of the study will be to evaluate CELZ-201 in patients with newly diagnosed Type 1 Diabetes. Patient recruitment is expected to begin in 2023.
In February 2023, the Company reported positive three-year follow-up data for its StemSpine® pilot study. The three-year data demonstrates continued efficacy of the StemSpine® procedure for treating chronic lower back pain without any serious adverse effects reported.
In March 2023, the Company announced that it filed an application with the FDA to receive Orphan Drug Designation for the treatment of Brittle Type 1 Diabetes using its ImmCelz®(CELZ-100) platform, and in April 2023, the Company reported positive one-year follow-up data and significant efficacy using CELZ-001 to treat patients with Type 2 Diabetes without any serious adverse effects reported
In addition to our clinical research efforts, we are currently primarily focused on expandingseeking to expand the commercial sale and use of our CaverStem®CaverStem® and FemCelz®FemCelz® products by physicians in the United States and further developing our StemSpine® treatment for lower back pain and OvaStem® treatment for Premature Ovarian Failure programs, including but not limited to disclosed Pilot Studies.. We also recently filed an Investigational New Drug (IND) application with the FDA to treat stroke utilizing our ImmCelzTM technology. We continue to further develop additional therapeutic products that utilize our proprietary intellectual property, including the collaboration with GreenStone Biosciences for the development of an Inducible Pluripotent Stem Cell (IPSC) line.States.
Results of Operations – For the Three-month Periods Ended June 30, 20222023, and 20212022
Gross Revenue.Revenue. We generated no revenue for the three-month periodthree-months ended June 30, 2022, in comparison with $10,000 for the comparable quarter a year ago.2023 and 2022.
Cost of Goods Sold. We generated no cost of goods sold for the three-month periodthree-months ended June 30, 2022, in comparison with $4,500 cost of goods sold for the comparable quarter a year ago.2023 and 2022.
Gross Profit/(Loss). We generated no gross profit for the three-month periodthree-months ended June 30, 2022, in comparison with $5,500 for the comparable quarter a year ago.2023 and 2022.
Selling, General and Administrative Expenses. Expenses. General and administrative expenses for the three-month periodthree-months ended June 30, 2022,2023, totaled $1,108,428$859,537, in comparison with $498,321,$1,108,428 for the comparable quarterperiod a year ago. The increasedecrease of $610,107$248,891, or 122%23% is primarily due to approximately $130,000 in director and officer insurance premiums that began in September 2021, an increasea decrease of approximately $180,000 in salary expenses from terminating the management service agreement in September 2021 and entering into direct employment arrangements with our CEO, CFO and other key leaders of the management team, an increase of approximately $164,000$90,194 in marketing, $38,152 in travel, $76,000 in timing-related Board of Director expenses as we ramp-up our commercial activity, and an increase of $98,000$37,887 in outside consulting expenses focused on moving key elements of our programs forward.D&O.
Amortization Expenses. Amortization expenses for the three-month periods ended June 30, 20222023 and 2021,2022, totaled $23,021.
Research and Development Expenses. Expenses. Research and development expenses for the three-month periodthree-months ended June 30, 2023, totaled $309,480 in comparison to $659,695 for the comparable period a year ago. The decrease of $350,215, or 53% was primarily due to trial-related start-up expenses of $410,000 incurred in 2022 totaled $659,695associated with our CELZ-201 Phase I/II diabetes trial.
Operating Loss. For the reasons stated above, our operating loss for the three-months ended June 30, 2023, was $1,192,038 in comparison with no expenses,$1,791,144 for the comparable quarterperiod a year ago.
| 17 |
| Table of Contents |
Other Income. Other income for the three-months ended June 30, 2023, totaled $89,913 in comparison with $0 for the comparable period a year ago. The increased research and development expenses reflects investments in in regulatory, research, laboratory and manufacturing resources required to move our programs forward.
Other Income/Expense. There was no other income or expense for the three-month period ended June 30, 2022, in comparison with $2,389,340 expense, for the comparable quarter a year ago. The decreased expense of $2,389,340,$89,913 is primarily due to lossincreased interest income associated with $9,581,207 in the fair valueshort-term certificates of derivative liabilities of $2,251,446, zero interest expense versus $234,338, offset by a $96,444 gain on extinguishment of convertible notes for the comparable quarter a year ago.deposit.
Net Income/Loss.Loss. For the reasons stated above, our net loss for the three-month periodthree-months ended June 30, 2022, totaled $1,791,1442023, was $1,102,125 in comparison towith a net loss of $2,905,182,$1,791,144 for the comparable quarterperiod a year ago.
Results of Operations – For the Six-month Periods Ended June 30, 20222023, and 20212022
Gross Revenue.Revenue. We generated $15,000 inno revenue for the six-month periodsix-months ended June 30, 2022,2023, in comparison with $10,000 in revenue$15,000 for the comparable period a year ago. The pause in sales reflects the Company’s re-evaluation of marketing and distribution options to generate improved sales of the Caverstem and FemCelz procedures.
Cost of Goods Sold. We generated $6,791 of goods sold for the six-month period ended June 30, 2022, in comparison with $4,500no cost of goods sold for the six-months ended June 30, 2023, in comparison with $6,791 for the comparable period a year ago. The decrease is due to the reduction in sales.
Gross Profit/(Loss). We generated a$0 in gross profit of $8,209 for the six-month periodsix-months ended June 30, 2022,2023, in comparison with $5,500$8,209 in gross profit for the comparable period a year ago.
Selling, General and Administrative Expenses. Expenses. General and administrative expenses for the six-month periodsix-months ended June 30, 2022,2023, totaled $2,238,485$1,630,557, in comparison with $779,244,$2,238,845 for the comparable period a year ago. The increasedecrease of $1,459,241$607,928, or 187%27% is primarily due to approximately $305,000decreases of $194,000 in director and officerconsulting expenses, $131,136 in marketing expenses, $121,309 in D&O insurance, premiums that began in September 2021, an increase of approximately $378,000 in net salary expenses offset by the termination of the management service agreement in September 2021 and entering into direct employment arrangements with our CEO, CFO and other key leaders of the management team, $226,000$76,000 in Board of Director expenses as a result of bringing on independent board members, an increase of approximately $279,000Directors payment timing, $49,490 in marketing expenses,accounting fees, $44,672 in travel, and an increase of $235,000$32,098 in outside consulting expenses focused on moving key elements of our programs forward.stock-based compensation.
Amortization Expenses. Amortization expenses for the six-month periods ended June 30, 20222023 and 2021,2022, totaled $46,042.
Research and Development Expenses. Expenses. Research and development expenses for the six-month periodsix-months ended June 30, 2023, totaled $628,500 in comparison to $669,695 for the comparable period a year ago. The decrease of $41,186, or 6% was primarily due to of trial-related start-up expenses in 2022 totaled $669,694associated with our CELZ-201 Phase I/II diabetes trial.
Operating Loss. For the reasons stated above, our operating loss for the six-months ended June 30, 2023, was $2,305,108 in comparison with no expenses,$2,946,013 for the comparable period a year ago.
Other Income. Other income for the six-months ended June 30, 2023, totaled $151,060 in comparison with $0 for the comparable period a year ago. The increased research and development expenses reflects investments in regulatory, research, laboratory and manufacturing resources required to move our programs forward.
Other Income/Expense. There was no other income or expense for the six-month period ended June 30, 2022, in comparison with $25,750,623 income, for the comparable period a year ago. The decreased income of $25,750,623,$151,060 is primarily due to a gaininterest income associated with $9,581,207 in the fair valueshort-term certificates of derivative liabilities of $26,224,593, offset by interest expense of $570,414 for the comparable period a year ago.deposit.
Net Income/Loss.Loss. For the reasons stated above, our net loss for the six-month periodsix-months ended June 30, 2022, totaled $2,946,0132023, was $2,154,048 in comparison towith a net incomeloss of $24,930,837,$2,946,013 for the comparable period a year ago.
Liquidity and Capital Resources
As of June 30, 2023, we had $13,570,757 of available cash and certificates of deposit and positive working capital of approximately $13,336,116. In comparison, as of December 31, 2022, we had $22,863,661$18,399,136 of available cash and positive working capital of approximately $22,559,451. In comparison, as of December 31, 2021, we had approximately $10,723,870 of available cash and positive working capital of approximately $9,686,780.$15,425,798.
On December 7, 2021,May 3, 2022 we soldreceived gross proceeds of $17,000,000, before deducting placement agent fees and expenses, upon the closing of an aggregateunregistered sale of 3,875,000equity securities of (i) 299,167 shares of our common stock and pre-funded warrants to purchase 456,389 shares of common stock (the “Pre-Funded Warrants”), and (ii) accompanying warrants to purchase 3,875,0001,511,112 shares of common stock at an exercise price of $4.13$20.00 per share at a combined public offering price to the public of $4.13 per share of common stock and related Warrant, pursuant to an Underwriting Agreement we entered into with Roth Capital Partners, LLC. We received gross proceeds of $16,003,750, before deducting underwriting discounts and commissions of seven percent (7%(“Warrants”) of the gross proceeds and offering expenses. We used a portion of the proceeds from the offering to (i) redeem our Bridge Notes described below, in the aggregate outstanding amount of $5,146,176, and (ii) repurchase the Company’s Series A Preferred Stock from the Company’s Chief Executive Officer for an aggregate purchase price of approximately $195,000.
In addition, on May 3, 2022 we completed the sale of (i) 2,991,669 shares of common stock and pre-funded warrants to purchase 4,563,887 shares of common stock, and (ii) accompanying warrants to purchase 15,111,112 shares of common stock,, at a combined offering price of $2.25$22.50 per share of common stock/Pre-Funded Warrant and related Common Warrant to a group of institutional investors resulting(the “Purchasers”). The Warrants have a five-year term, and an exercise price of $20.00 per share. The Pre-Funded Warrants do not expire and had an exercise price of $0.001 per share. Roth Capital Partners acted as sole placement agent for the offering. We paid Roth a placement agent fee in gross proceedsthe amount of $1,360,000 and issued Roth a warrant to purchase 113,334 shares of common stock with the same terms as the common warrants issued to the purchasers. Pursuant to the Purchase Agreement, the Company and the Purchasers entered into a Registration Rights Agreement, pursuant to which the Company agreed to file a registration statement with the Securities and Exchange Commission to register the resale of approximately $17,000,000. the shares of Common Stock issued in the offering and the shares of Common Stock underlying the Warrants and Pre-Funded Warrants. On May 10, 2022, we filed a Form S-3 registration statement to register the shares, Warrants and Pre-Funded Warrants for resale. The registration went effective on May 19, 2022, fulfilling our contractual obligation. From June through July 2022, all of the Pre-Funded Warrants were exercised for shares of common stock.
| 18 |
| Table of Contents |
Cash Flows
Net Cash used in Operating Activities. We used cash in our operating activities due to our losses from operations. Net cash used in operating activities was $3,332,429$4,828,379 for the six-month period endedsix months-ended June 30, 20222023, in comparison to $663,657$3,332,429 for the comparable period a year ago, an increase of $2,668,772$1,495,950 or 402%45%. The increase in cash used in operations was primarily related to $3,000,000 in cash payments related to the increased expenses mentioned above.purchase of research tools referenced in Note 8 offset by reductions in general and administrative expenses.
Net Cash Received in Investing Activities. Cash received in investing activities was $497,410 for the six-months ended June 30, 2023, related to net redemptions of $497,410 in certificates of deposit in comparison to $0 for the six-months ended June 30, 2022.
Net Cash used in Investing Activitiesfrom Financing Activities..
There waswere no cash used in investingproceeds or expenditures from financing activities induring the six-month periodsix-months ended June 30, 2022 and June 30, 2021, respectively.
Net Cash From Financing Activities. We raised2023 compared to $15,472,220 duringfor the six-month periodsix-months ended June 30, 2022. The $15,472,220 is related to the May, 2022 through the issuance of common stock and pre-paid warrants, net of offering costs. We raised $724,233 through the issuance of convertible debt, preferred stock and a related party advancefinancing referenced in the six-month period ended June 30, 2021.Note 7.
Critical Accounting Policies and Estimates
Our consolidated financial statements are prepared in accordance with generally accepted accounting principles accepted in the United States. In connection with the preparation of our financial statements, we are required to make assumptions and estimates about future events and apply judgments that affect the reported amounts of assets, liabilities, revenue, expenses, and the related disclosures. We base our assumptions, estimates and judgments on historical experience, current trends, and other factors that management believes to be relevant at the time our consolidated financial statements are prepared. On a regular basis, we review the accounting policies, assumptions, estimates and judgments to ensure that our financial statements are presented fairly and in accordance with GAAP. However, because future events and their effects cannot be determined with certainty, actual results could differ from our assumptions and estimates, and such differences could be material.
Item 3. Quantitative and Qualitative Disclosures About Market Risk
As a smaller reporting company, we have elected not to provide the disclosure required by this item.
Item 4. Controls and Procedures
Evaluation of disclosure controls and procedures
As required by Rule 13a-15 under the Exchange Act, our management evaluated the effectiveness of the design and operation of our disclosure controls and procedures as of June 30, 2022.
Our management, with the participation of our Chief Executive Officer and Chief Financial Officer, evaluated the effectiveness of our disclosure controls and procedures (as defined in Rule 15(d)-15(e) of the Securities Exchange Act of 1934, as amended (the “Exchange Act”)) as of the end of the period covered by this report. Based on that evaluation, our Chief Executive Officer and Chief Financial Officer concluded that our disclosure controls and procedures as of the end of the period covered by this report were not effective in ensuring that information required to be disclosed by us in reports that we file or submit under the Exchange Act (i) is recorded, processed, summarized and reported within the time periods specified in the Securities and Exchange Commission’s rules and forms, and (ii) is accumulated and communicated to our management, including our principal executive and principal financial officers, or persons performing similar functions, as appropriate to allow timely decisions regarding required disclosure.
Description of Material Weaknesses
A material weakness is a deficiency, or a combination of deficiencies, in internal control over financial reporting, such that there is a reasonable possibility that a material misstatement of a company’s annual or interim financial statements will not be prevented or detected on a timely basis. A significant deficiency is a deficiency, or a combination of deficiencies, in internal control over financial reporting that is less severe than a material weakness, yet important enough to merit attention by those responsible for oversight of a company’s financial reporting. In connection with the preparation and audit of the Company’s financial statements for the year ended the December 31, 2022, management identified the following deficiencies that alone or in combination, represent material weaknesses in internal control over financial reporting, the material weaknesses are still present for the six months ended June 30, 2023 and are as follows:
· | Previously, we failed to adequately disclose the transaction in which we purchased research tools for $5,000,000 from Narkeshyo LLC, an entity a former director and current consultant of the Company is affiliated with. |
· | During the year ended December 31, 2022, we did not sufficiently segregate the duties of our officers. |
We intend to remediate the deficiencies described above, and take such other action as we deem appropriate to further strengthen our internal control over financial reporting. We are currently in the process of establishing additional review and procedure controls. For instance, subsequent to quarter end we have implemented a policy whereby disbursements over a certain dollar threshold require dual authorization for processing and payment. The Company expects to remediate the deficiencies and obtain operating effectiveness over the next few quarters. However, because of its inherent limitations, internal control over financial reporting may not prevent or detect misstatements. Also, projections of any evaluation of effectiveness to future periods are subject to the risk that controls may become inadequate because of changes in conditions, or that the degree of compliance with the policies or procedures may deteriorate.
Changes in internal control over financial reporting
There were no changes in our internal control over financial reporting that occurred during the period covered by this Quarterly Report on Form 10-Q that have materially affected, or are reasonably likely to materially affect, our internal control over financial reporting.
| Table of Contents |
PART II – OTHER INFORMATION
Item 1. Legal Proceedings
From time to time, we may become involved in various lawsuits and legal proceedings, which arise in the ordinary course of business. However, litigation is subject to inherent uncertainties, and an adverse result in these or other matters may arise from time to time that may harm our business. As of June 30, 2022 we were not involved in any legal proceedings.
Item 2. Unregistered Sales of Equity Securities and Use of Proceeds.
In FebruaryOctober 2022, we paidterminated an employee for cause. Subsequent to the initial Jadi Cell obligationtermination, in December 2022, the employee brought claims against us for breach of $250,000 throughcontract, wrongful termination and related claims in the issuanceSuperior Court of 181,818 shares of common stock.the State California (Orange County). The parties have submitted the action for arbitration before JAMS, where it is now pending.
Item 6. Exhibits
|
| |
|
| |
| ||
| ||
| ||
| ||
| ||
| ||
| ||
| ||
| ||
| ||
| Rule 13a-14(a)/15d-14a(a) Certification | |
| Rule 13a-14(a)/15d-14a(a) Certification | |
| ||
| ||
101.INS |
| Inline XBRL Instance Document |
101.SCH |
| Inline XBRL Taxonomy Extension Schema Document |
101.CAL |
| Inline XBRL Taxonomy Extension Calculation Linkbase Document |
101.DEF |
| Inline XBRL Taxonomy Extension Definition Linkbase Document |
101.LAB |
| Inline XBRL Taxonomy Extension Label Linkbase Document |
101.PRE |
| Inline XBRL Taxonomy Extension Presentation Linkbase Document |
________
† Management contract or compensatory plan or arrangement.
| Table of Contents |
SIGNATURES
Pursuant to the requirements of the Securities Exchange Act of 1934, the registrant has duly caused this report to be signed on its behalf by the undersigned thereunto duly authorized.
| Creative Medical Technology Holdings, Inc. |
| |
|
|
|
|
Date: August | By | /s/ Timothy Warbington |
|
|
| Timothy Warbington, Chief Executive Officer |
|
|
| (Principal Executive Officer) |
|
|
|
|
|
Date: August | By | /s/ Donald Dickerson |
|
|
| Donald Dickerson, Chief Financial Officer |
|
|
| (Principal Financial Officer) |
|
|