UNITED STATES
SECURITIES AND EXCHANGE COMMISSION
Washington, D.C. 20549
FORM 10-Q
☒QUARTERLY REPORT PURSUANT TO SECTION 13 OR 15(d) OF THE SECURITIES EXCHANGE ACT OF 1934 |
|
| |
|
|
|
For the quarterly period ended: September 30, 2023
☐TRANSITION REPORT PURSUANT TO SECTION 13 OR 15(d) OF THE SECURITIES EXCHANGE ACT OF 1934
For the transition period from ____________ to _____________
001-41450
WETRADE GROUP INC |
(Exact name of small business issuer as specified in its charter) |
Wyoming | 00-0000000 | |
(State or other jurisdiction of incorporation or organization) | (I.R.S. Tax. I.D. No.) |
Room 101, Level 1 Building 8,519, 05/F Block T3
No.18 Kechuang 10th Street,Qianhai Premier Finance Centre Unit 2
Beijing Economic and Technological Development ZoneGuiwan Area, Nanshan District, Shenzhen CN100020
Beijing City, People Republic of China
(Address of Principal Executive Offices)
(86) 18350283270(852) 52208810
(Registrant’s Telephone Number, Including Area Code)
Indicate by check mark whether the registrant (1) has filed all reports required to be filed by Section 13 or 15(d) of the Securities Exchange Act of 1934 during the preceding 12 months (or for such shorter period that the registrant was required to file such reports), and (2) has been subject to such filing requirements for the past 90 days. Yes ☐☒ No ☒☐
Indicate by check mark whether the registrant has submitted electronically every Interactive Data File required to be submitted pursuant to Rule 405 of Regulation S-T (§232.405 of this chapter) during the preceding 12 months (or for such shorter period that the registrant was required to submit such files). Yes ☐☒ No ☒☐
Indicate by check mark whether the registrant is a large accelerated filer, an accelerated filer, a non-accelerated filer, smaller reporting company, or an emerging growth company. See definition of “large accelerated filer,” accelerated filer” “smaller reporting company,” and “emerging growth company” in Rule 12b-2 of the Exchange Act:
Large accelerated filer | ☐ | Accelerated filer | ☐ |
Non-accelerated Filer | ☐ | Smaller Reporting Company | ☒ |
Emerging growth company |
If an emerging growth company, indicate by check mark if the registrant has elected not to use the extended transition period for complying with any new or revised financial accounting standards provided pursuant to Section 13(a) of the Exchange Act. ☐
Indicate by check mark whether the registrant is a shell company (as defined in Rule 12b-2 of the Exchange Act). Yes ☐No☒
As of November 22, 2022,20, 2023, there were 195,057,503 shares of common stock outstanding.
TABLE OF CONTENTS
TABLE OF CONTENTS
| 26 | ||
CAUTIONARY NOTE REGARDING FORWARD-LOOKING STATEMENTS
This report contains forward-looking statements within the meaning of Section 27A of the Securities Act of 1933, as amended, (the “Securities Act”) and Section 21E of the Securities Exchange Act of 1934, as amended, (the “Exchange Act”). These forward-looking statements are generally located in the material set forth under the heading “Management’s Discussion and Analysis of Financial Condition and Results of Operations” but may be found in other locations as well. These forward-looking statements are subject to risks and uncertainties and other factors that may cause our actual results, performance or achievements to be materially different from the results, performance or achievements expressed or implied by the forward-looking statements. You should not unduly rely on these statements.
We identify forward-looking statements by use of terms such as “may,” “will,” “expect,” “anticipate,” “estimate,” “hope,” “plan,” “believe,” “predict,” “envision,” “intend,” “will,” “continue,” “potential,” “should,” “confident,” “could” and similar words and expressions, although some forward-looking statements may be expressed differently. You should be aware that our actual results could differ materially from those contained in the forward-looking statements.
Forward-looking statements are based on information available at the time the statements are made and involve known and unknown risks, uncertainties and other factors that may cause our results, levels of activity, performance or achievements to be materially different from the information expressed or implied by the forward-looking statements in this report. These factors include, among others:
| our ability to execute on our growth strategies; | |
| our ability to find manufacturing partners on favorable terms; | |
| declines in general economic conditions in the markets where we may compete; | |
| our anticipated needs for working capital; and |
Where we express an expectation or belief as to future events or results, such expectation or belief is expressed in good faith and believed to have a reasonable basis.
Forward-looking statements speak only as of the date of this report or the date of any document incorporated by reference in this report. Except to the extent required by applicable law or regulation, we do not undertake any obligation to update forward-looking statements to reflect events or circumstances after the date of this report or to reflect the occurrence of unanticipated events.
PART I – FINANCIAL INFORMATION
Item 1. Financial Statements
WETRADE GROUP INC
CONDENSED CONSOLIDATED BALANCE SHEETS
(UNAUDITED)
(All amounts shown in U.S. Dollars) |
| September 30, 2022 |
|
| December 31, 2021 |
| ||
|
| (Unaudited) |
|
|
| |||
ASSETS |
|
|
|
|
|
| ||
Current assets: |
|
|
|
|
|
| ||
Cash and cash equivalents |
| $ | 20,261,881 |
|
| $ | 616,593 |
|
Accounts receivables |
|
| 4,473,310 |
|
|
| 5,627,463 |
|
Account receivable- related party |
|
| 379,455 |
|
|
| 3,603,402 |
|
Note receivable |
|
| 1,858,310 |
|
|
| 3,798,130 |
|
Other receivables |
|
| 137,945 |
|
|
| 30,147 |
|
Prepayments |
|
| 15,000,711 |
|
|
| 2,760,658 |
|
Prepayment- related parties |
|
| 2,575,535 |
|
|
| - |
|
Total current assets |
|
| 44,687,147 |
|
|
| 16,436,393 |
|
Non current assets: |
|
|
|
|
|
|
|
|
Property and equipment, net |
|
| 1,135,286 |
|
|
| 395,353 |
|
Right of use assets |
|
| - |
|
|
| 2,328,950 |
|
Intangible asset, net |
|
| 28,653 |
|
|
| 37,765 |
|
Rental deposit |
|
| 243,006 |
|
|
| 272,063 |
|
Total non-current assets |
|
| 1,406,945 |
|
|
| 3,034,131 |
|
Total assets: |
|
| 46,094,092 |
|
|
| 19,470,524 |
|
|
|
|
|
|
|
|
|
|
LIABILITIES AND STOCKHOLDERS’ EQUITY |
|
|
|
|
|
|
|
|
Current liabilities: |
|
|
|
|
|
|
|
|
Account payables |
|
| 2,082,082 |
|
|
| 7,710 |
|
Account payables- related party |
|
| 174,428 |
|
|
| 54,436 |
|
Accrued expenses |
|
| 126,260 |
|
|
| 217,073 |
|
Tax payables |
|
| 178,855 |
|
|
| 711,841 |
|
Amount due to related parties |
|
| 1,217,297 |
|
|
| 1,105,532 |
|
Lease liabilities, current |
|
| - |
|
|
| 596,098 |
|
Other payables |
|
| 265,189 |
|
|
| 306,270 |
|
|
|
|
|
|
|
|
|
|
Total current liabilities |
|
| 4,044,111 |
|
|
| 2,998,960 |
|
|
|
|
|
|
|
|
|
|
Lease liabilities, non-current |
|
| - |
|
|
| 1,942,242 |
|
Total liabilities |
|
| 4,044,111 |
|
|
| 4,941,202 |
|
|
|
|
|
|
|
|
|
|
Stockholders’ equity: |
|
|
|
|
|
|
|
|
Common stock; $0.00 per share par value; 195,057,503 issued and outstanding at September 30, 2022 and 305,451,498 issued and outstanding at December 31, 2021 respectively |
|
| - |
|
|
| - |
|
Additional paid in capital |
|
| 43,732,196 |
|
|
| 6,197,520 |
|
Accumulated other comprehensive income |
|
| (576,646 | ) |
|
| 898,497 |
|
Accumulated (loss)/ earnings |
|
| (1,105,569 | ) |
|
| 7,433,305 |
|
Total Stockholders’ equity |
|
| 42,049,981 |
|
|
| 14,529,322 |
|
|
|
|
|
|
|
|
|
|
Total Liabilities and stockholders’ equity |
| $ | 46,094,092 |
|
| $ | 19,470,524 |
|
| (All amounts shown in U.S. Dollars) | As of September 30, 2023 | As of December 31, | ||||||
| ASSETS | ||||||||
| Current assets: | ||||||||
| Cash and cash equivalents | $ | 1,416,885 | $ | 24,232 | ||||
| Digital assets | 22,398,510 | — | ||||||
| Accounts receivable- non related parties, net | 129,765 | — | ||||||
| Other receivables-related parties | 5,805,500 | 5,805,500 | ||||||
| Prepayments | 12,125,500 | 50,000 | ||||||
| Assets related to discontinued operation | — | 37,181,074 | ||||||
| Total current assets | 41,876,160 | 43,060,806 | ||||||
| Total assets: | 41,876,160 | $ | 43,060,806 | |||||
| LIABILITIES AND STOCKHOLDERS’ EQUITY | ||||||||
| Current liabilities: | ||||||||
| Account payables | 123,273 | — | ||||||
| Accrued expenses | 270,864 | — | ||||||
| Amount due to related parties | 1,673,683 | 1,291,296 | ||||||
| Other payables | 50,517 | 50,000 | ||||||
| Total current liabilities | 2,118,337 | 1,341,296 | ||||||
| Total liabilities | 2,118,337 | 1,341,296 | ||||||
| Stockholders’ equity: | ||||||||
| Common stock; par value; and issued and outstanding at September 30, 2023 and December 31, 2022 respectively | — | — | ||||||
| Additional paid in capital | 56,348,650 | 43,732,196 | ||||||
| Accumulated other comprehensive income | (175 | ) | (298,576 | ) | ||||
| Accumulated deficits | (16,590,652 | ) | (1,714,110 | ) | ||||
| Total stockholders’ equity | 39,757,823 | 41,719,510 | ||||||
| Total liabilities and stockholders’ equity | $ | 41,876,160 | $ | 43,060,806 | ||||
The accompanying notes are an integral part of these unaudited condensed consolidated financial statements.
WETRADE GROUP INC
CONDENSED CONSOLIDATED STATEMENTS OF OPERATIONS
(Unaudited)(UNAUDITED)
|
| For the Three Months Ended September 30, 2022 |
|
| For the Three Months Ended September 30, 2021 |
|
| For the Nine Months Ended September 30, 2022 |
|
| For the Nine Months Ended September 30, 2021 |
| ||||||||||||||||||||
|
| (unaudited) |
| (unaudited) |
| (unaudited) |
| (unaudited) |
| For the Three Months Ended September 30, 2023 | For the Three Months Ended September 30, 2022 | For the Nine Months Ended September 30, 2023 | For the Nine Months Ended September 30, 2022 | |||||||||||||||||||
Revenue: |
|
|
|
|
|
|
|
|
| |||||||||||||||||||||||
Service revenue, related party |
| $ | 400,702 |
| $ | 1,743,299 |
| $ | 689,039 |
| $ | 3,415,090 |
| $ | — | $ | 400,702 | $ | 36,096 | $ | 689,039 | |||||||||||
Service revenue |
|
| 4,952,046 |
|
|
| 2,855,376 |
|
|
| 8,508,642 |
|
|
| 7,847,401 |
| 1,633,836 | 5,206,568 | 2,193,903 | 8,508,642 | ||||||||||||
Total service revenue |
| 5,352,748 |
| 4,598,675 |
| 9,197,681 |
| 11,262,491 |
| 1,633,836 | 5,607,270 | 2,229,999 | 9,197,681 | |||||||||||||||||||
Cost of revenue |
|
| (6,790,998 | ) |
|
| (2,105,116 | ) |
|
| (7,670,837 | ) |
|
| (2,441,883 | ) | (398,537 | ) | (6,902,250 | ) | (1,391,665 | ) | (7,670,836 | ) | ||||||||
Gross profit (loss) |
| (1,438,250 | ) |
| 2,493,559 |
| 1,526,844 |
| 8,820,608 |
| ||||||||||||||||||||||
| Gross Profit/ (Loss) | 1,235,299 | (1,294,980 | ) | 838,334 | 1,526,845 | |||||||||||||||||||||||||||
|
|
|
|
|
|
|
|
|
| |||||||||||||||||||||||
Operating expenses |
|
|
|
|
|
|
|
|
| |||||||||||||||||||||||
General and administrative expense |
| $ | 7,632,083 |
|
| $ | 1,039,081 |
|
| $ | 10,419,873 |
|
| $ | 4,695,727 |
| $ | 13,622,149 | $ | 7,799,979 | $ | 15,128,916 | $ | 10,419,873 | ||||||||
Total operating expenses |
|
| (7,632,083 | ) |
|
| (1,039,081 | ) |
|
| (10,419,873 | ) |
|
| (4,695,727 | ) | (13,622,149 | ) | (7,799,979 | ) | (15,128,916 | ) | (10,419,873 | ) | ||||||||
|
|
|
|
|
|
|
|
|
| |||||||||||||||||||||||
Profit/ (loss) from operations |
|
| (9,070,333 | ) |
|
| 1,454,478 |
|
|
| (8,893,029 | ) |
|
| 4,124,881 |
| ||||||||||||||||
| Loss from operations | (12,386,850 | ) | (9,094,959 | ) | (14,290,582 | ) | (8,893,028 | ) | ||||||||||||||||||||||||
Other income |
| 232,752 |
| 59,902 |
| 308,360 |
| 258,501 |
| 9,255,824 | 235,418 | 9,222,557 | 308,360 | |||||||||||||||||||
| Other expenses | (5,365,900 | ) | — | (4,355,420 | ) | — | ||||||||||||||||||||||||||
| Loss before income taxes | (8,496,926 | ) | (8,859,541 | ) | (9,423,445 | ) | (8,584,668 | ) | ||||||||||||||||||||||||
| Income tax income/(expenses) | 383 | 202,450 | (31,859 | ) | 45,795 | |||||||||||||||||||||||||||
|
|
|
|
|
|
|
|
|
| |||||||||||||||||||||||
Profit/ (loss) before provision for income taxes |
| (8,837,581 | ) |
| 1,541,380 |
| (8,584,669 | ) |
| 4,383,382 |
| |||||||||||||||||||||
Income tax (expense)/ benefit |
|
| 180,489 |
|
|
| (104,109 | ) |
|
| 45,795 |
|
|
| (478,997 | ) | ||||||||||||||||
| Net loss from continuing operation | $ | (8,496,543 | ) | $ | (8,657,091 | ) | $ | (9,455,304 | ) | $ | (8,538,873 | ) | ||||||||||||||||||||
|
|
|
|
|
|
|
|
|
| |||||||||||||||||||||||
Net income/ (loss) |
| $ | (8,657,092 | ) |
| $ | 1,410,271 |
|
| $ | (8,538,874 | ) |
| $ | 3,904,385 |
| ||||||||||||||||
| Discontinued Operations: | ||||||||||||||||||||||||||||||||
| Loss from discontinued operation | (4,177,004 | ) | (4,936,613 | ) | (5,421,237 | ) | (6,418,752 | ) | ||||||||||||||||||||||||
|
|
|
|
|
|
|
|
|
| |||||||||||||||||||||||
Comprehensive income |
|
|
|
|
|
|
|
|
| |||||||||||||||||||||||
Net income/ (loss) |
| $ | (8,657,092 | ) |
| $ | 1,410,271 |
| $ | (8,538,874 | ) |
| $ | 3,904,385 |
| |||||||||||||||||
| Net loss | $ | (12,673,547 | ) | $ | (13,593,704 | ) | $ | (14,876,541 | ) | $ | (14,957,625 | ) | ||||||||||||||||||||
Other comprehensive income |
|
|
|
|
|
|
|
|
| |||||||||||||||||||||||
Foreign currency translation adjustment |
|
| (764,034 | ) |
|
| 9,828 |
|
|
| (1,475,143 | ) |
|
| 129,993 |
| (175 | ) | — | (175 | ) | — | ||||||||||
|
|
|
|
|
|
|
|
|
| |||||||||||||||||||||||
Total comprehensive income/ (loss) |
| $ | (9,421,126 | ) |
| $ | 1,420,099 |
|
| $ | (10,014,017 | ) |
| $ | 4,034,378 |
| ||||||||||||||||
| Total comprehensive loss | $ | (12,673,722 | ) | $ | (13,593,704 | ) | $ | (14,876,716 | ) | $ | (14,957,625 | ) | ||||||||||||||||||||
|
|
|
|
|
|
|
|
|
| |||||||||||||||||||||||
Earning per share, basic and diluted |
| $ | (0.05 | ) |
| $ | 0.01 |
| $ | (0.04 | ) |
| $ | 0.01 |
| |||||||||||||||||
| Loss per share, basic and diluted | $ | ) | $ | ) | $ | ) | $ | ) | ||||||||||||||||||||||||
|
|
|
|
|
|
|
|
|
| |||||||||||||||||||||||
Weighted-average shares outstanding, basic and diluted |
|
| 192,768,916 |
|
|
| 305,451,498 |
|
|
| 233,072,453 |
|
|
| 305,451,498 |
| ||||||||||||||||
| *Weighted-average shares outstanding, basic and diluted | ||||||||||||||||||||||||||||||||
| * | Share and per share amounts have been retroactively adjusted to reflect the decreased number of shares resulting from a reverse stock split and issuance of new shares. |
The accompanying notes are an integral part of these unaudited condensed consolidated financial statements.
WETRADE GROUP INC
CONDENSED CONSOLIDATED STATEMENT OF CHANGES IN STOCKHOLDERS’ EQUITY
(UNAUDITED)
Three months ended September 30, 2023
| Common Stock | Additional Paid in | Accumulated | Accumulated Other Comprehensive | Total Shareholder | ||||||||||||||||||||
| Shares | Amount | Capital | Deficits | Income | Equity | |||||||||||||||||||
| Balance as of June 30, 2023 | 195,057,503 | $ | — | $ | 43,732,196 | $ | (3,917,104 | ) | $ | (935,527 | ) | $ | 38,879,565 | |||||||||||
| Reverse shares split | (194,002,973 | ) | — | — | — | — | — | |||||||||||||||||
| Stock issued during the period | 1,570,600 | — | 12,616,454 | — | — | 12,616,454 | ||||||||||||||||||
| Foreign currency translation adjustment | — | — | — | — | 935,352 | 935,352 | ||||||||||||||||||
| Disposition of discontinued operations | — | — | — | (5,305,607 | ) | — | (5,305,607 | ) | ||||||||||||||||
| Net gain from discontinued operation | — | — | — | 1,128,602 | — | 1,128,602 | ||||||||||||||||||
| Net profit for the period | — | — | — | $ | (8,496,543 | ) | — | $ | (8,496,543 | ) | ||||||||||||||
| Balance as of September 30, 2023 | 2,625,130 | $ | — | $ | 56,348,650 | $ | (16,590,652 | ) | $ | (175 | ) | $ | 39,757,823 | |||||||||||
Nine months ended September 30, 2023
| Common Stock | Additional Paid in | Accumulated | Accumulated Other Comprehensive | Total Shareholder | ||||||||||||||||||||
| Shares | Amount | Capital | Deficits | Income | Equity | |||||||||||||||||||
| Balance as of December 31, 2022 | 195,057,503 | $ | — | $ | 43,732,196 | $ | (1,714,110 | ) | $ | (298,576 | ) | $ | 41,719,510 | |||||||||||
| Reverse shares split | (194,002,973 | ) | — | — | — | — | — | |||||||||||||||||
| Stock issued during the period | 1,570,600 | 12,616,454 | — | — | 12,616,454 | |||||||||||||||||||
| Foreign currency translation adjustment | — | — | — | — | 298,401 | 298,401 | ||||||||||||||||||
| Disposition of discontinued operations | — | — | — | (6,545,912 | ) | — | (6,545,912 | ) | ||||||||||||||||
| Net loss from discontinued operation | — | — | — | 1,124,674 | — | 1,124,674 | ||||||||||||||||||
| Net loss for the period | — | — | — | $ | (9,455,304 | ) | — | $ | (9,455,304 | ) | ||||||||||||||
| Balance as of September 30, 2023 | 2,625,130 | $ | — | $ | 56,348,650 | $ | (16,590,652 | ) | $ | (175 | ) | $ | 39,757,823 | |||||||||||
| 3 |
Three months ended September 30, 2022
| Common Stock | Additional Paid in | Retained | Accumulated Other Comprehensive | Total Shareholder | ||||||||||||||||||||
| Shares | Amount | Capital | Earnings | Income | Equity | |||||||||||||||||||
| Balance as of June 30, 2022 | 305,451,498 | $ | — | $ | 6,197,520 | $ | 7,551,523 | $ | 187,388 | $ | 13,936,431 | |||||||||||||
| Share cancellation | (120,418,995 | ) | — | — | — | — | — | |||||||||||||||||
| Stock issued during the period | 10,000,000 | — | 37,057,176 | — | — | 37,057,176 | ||||||||||||||||||
| Stock compensation | 25,000 | — | 477,500 | — | — | 477,500 | ||||||||||||||||||
| Foreign currency translation adjustment | — | — | — | — | (187,388 | ) | (187,388 | ) | ||||||||||||||||
| Disposition of discontinued operation | — | — | — | (8,733,966 | ) | — | (8,733,966 | ) | ||||||||||||||||
| Net gain from discontinued operations | 1,738,568 | 1,738,568 | ||||||||||||||||||||||
| Net profit for the period | — | — | — | $ | (8,657,091 | ) | — | $ | (8,657,091 | ) | ||||||||||||||
| Balance as of September 30, 2022 | 195,057,503 | $ | — | $ | 43,732,196 | $ | (8,100,966 | ) | $ | — | $ | 35,631,230 | ||||||||||||
Nine months ended September 30, 2022
| Common Stock | Additional Paid in | Retained | Accumulated Other Comprehensive | Total Shareholder | ||||||||||||||||||||
| Shares | Amount | Capital | Earnings | Income | Equity | |||||||||||||||||||
| Balance as of December 31, 2021 | 305,451,498 | $ | — | $ | 6,197,520 | $ | 7,433,305 | $ | 898,497 | $ | 14,529,322 | |||||||||||||
| Share cancellation | (120,418,995 | ) | — | — | — | — | — | |||||||||||||||||
| Stock issued during the period | 10,000,000 | — | 37,057,176 | — | — | 37,057,176 | ||||||||||||||||||
| Stock compensation | 25,000 | — | 477,500 | — | — | 477,500 | ||||||||||||||||||
| Foreign currency translation adjustment | — | — | — | — | (898,497 | ) | (898,497 | ) | ||||||||||||||||
| Disposition of discontinued operations | — | — | — | (8,733,966 | ) | — | (8,733,966 | ) | ||||||||||||||||
| Net gain from discontinued operations | 1,738,568 | 1,738,568 | ||||||||||||||||||||||
| Net loss for the period | — | — | — | $ | (8,538,873 | ) | — | $ | (8,538,873 | ) | ||||||||||||||
| Balance as of September 30, 2022 | 195,057,503 | $ | — | $ | 43,732,196 | $ | (8,100,966 | ) | $ | — | $ | 35,631,230 | ||||||||||||
The accompanying notes are an integral part of these unaudited condensed consolidated financial statements.
| 4 |
WETRADE GROUP INC
CONDENSED CONSOLIDATED STATEMENTS OF CASH FLOWS
(UNAUDITED)
|
| For the Nine months |
| From the Nine months |
| |||||||||||
|
| September 30, 2022 |
|
| September 30, 2021 |
| For the Nine months Ended | For the Nine months Ended | ||||||||
|
| (unaudited) |
| (unaudited) |
| September 30, 2023 | September 30, 2022 | |||||||||
Cash flows from operating activities: |
|
|
|
|
| |||||||||||
Net income (loss) |
| (8,538,874 | ) |
| 3,904,385 |
| ||||||||||
| Net loss | $ | (9,455,304 | ) | $ | (8,538,873 | ) | ||||||||||
| Gain from discontinued operation | 1,124,675 | — | ||||||||||||||
| Loss from disposal operation | (6,545,912 | ) | (6,418,752 | ) | ||||||||||||
| Digital assets impairment loss | 2,591,489 | |||||||||||||||
Amortization of intangible asset |
| 4,633 |
| 7,807 |
| — | 4,633 | |||||||||
Depreciation |
| 36,641 |
| - |
| — | 36,641 | |||||||||
Stock compensation |
| 477,500 |
| - |
| |||||||||||
Changes in operating assets and liabilities: |
|
|
|
|
| |||||||||||
Accounts receivables |
| 592,924 |
| (1,722,680 | ) | 6,044,289 | 592,924 | |||||||||
Account receivable- related party |
| 3,043,409 |
| (2,309,117 | ) | |||||||||||
| Account receivable- related parties | 549,606 | 3,043,409 | ||||||||||||||
| Other receivables-related parties | (5,805,500 | ) | — | |||||||||||||
Other receivables |
| (118,958 | ) |
| 766,002 |
| 288,143 | (118,958 | ) | |||||||
Prepayments |
| (12,936,012 | ) |
| (2,750,419 | ) | ||||||||||
Prepayments- related companies |
| (2,312,339 | ) |
| - |
| ||||||||||
Accounts payables |
| 2,161,958 |
| 218,232 |
| |||||||||||
Accounts payable- related party |
| (74,027 | ) |
| - |
| ||||||||||
| Prepaid expenses | 287,715 | (12,936,012 | ) | |||||||||||||
| Prepaid expenses- related parties | 1,914,515 | (2,312,339 | ) | |||||||||||||
| Account payables | (20,644 | ) | 2,161,958 | |||||||||||||
| Account payable- related parties | (86,956 | ) | (74,027 | ) | ||||||||||||
Accrued expenses |
| (102,753 | ) |
| 56,445 |
| (27,730 | ) | (102,753 | ) | ||||||
Right of use assets |
| 2,580,579 |
| 411,515 |
| — | 2,580,579 | |||||||||
Lease liabilities |
| (2,789,981 | ) |
| (422,999 | ) | — | (2,789,981 | ) | |||||||
| Tax payables | (130,200 | ) | (489,844 | ) | ||||||||||||
Other payables |
|
| (471,962 | ) |
|
| (610,232 | ) | (2,276,992 | ) | 17,882 | |||||
Net cash flows used in operating activities: |
|
| (18,447,262 | ) |
|
| (2,451,061 | ) | ||||||||
| Assets related to discontinued operations | 3,018,129 | 6,418,752 | ||||||||||||||
| Net cash flows provided by operating activities: | (8,530,677 | ) | (18,924,761 | ) | ||||||||||||
|
|
|
|
|
| |||||||||||
Cash flow from investing activities: |
|
|
|
|
| |||||||||||
Leasehold improvements |
|
| (816,340 | ) |
|
| (138,124 | ) | ||||||||
| Digital assets | (24,990,000 | ) | — | |||||||||||||
| Loan receivables | 1,614,841 | 1,662,363 | ||||||||||||||
| Amortised expenses | — | (816,340 | ) | |||||||||||||
Net cash used in investing activities: |
| (816,340 | ) |
| (138,124 | ) | (23,375,159 | ) | 846,023 | |||||||
|
|
|
|
|
| |||||||||||
Cash flow from financing activities: |
|
|
|
|
| |||||||||||
Proceeds from/ (repayment) of note receivable |
| 1,662,363 |
| (609,770 | ) | |||||||||||
Proceeds from sale of common stock, net of fees |
| 37,057,176 |
| - |
| |||||||||||
Proceeds from related parties loan |
|
| 330,832 |
|
|
| 252,000 |
| ||||||||
Net cash flows provided by/ (used in) financing activities: |
| 39,050,371 |
| (357,770 | ) | |||||||||||
| Proceed from issuance of common stock | 12,616,454 | 37,534,676 | ||||||||||||||
| Shareholders loan | 382,387 | 330,832 | ||||||||||||||
| Net cash flows provided by financing activities: | 12,998,841 | 37,865,508 | ||||||||||||||
|
|
|
|
|
| |||||||||||
Effect of exchange rate changes on cash |
| (141,481 | ) |
| (298,623 | ) | 298,400 | (141,482 | ) | |||||||
|
|
|
|
|
| |||||||||||
Change in cash and cash equivalents: |
| 19,645,288 |
| (3,245,578 | ) | (18,608,595 | ) | 19,645,288 | ||||||||
|
|
|
|
|
| |||||||||||
Cash and cash equivalents, beginning of period |
|
| 616,593 |
|
|
| 4,640,603 |
| $ | 20,025,480 | $ | 616,594 | ||||
|
|
|
|
|
| |||||||||||
Cash and cash equivalents, end of period |
|
| 20,261,881 |
|
|
| 1,395,025 |
| $ | 1,416,885 | $ | 20,261,882 | ||||
|
|
|
|
|
| |||||||||||
Supplemental cash flow information: |
|
|
|
|
| |||||||||||
Cash paid for interest |
| - |
| - |
| $ | — | $ | — | |||||||
Cash paid for taxes |
| - |
| 1,078,125 |
| $ | — | $ | — | |||||||
The accompanying notes are an integral part of these unaudited condensed consolidated financial statements.
WETRADE GROUP INC AND SUBSIDIARY
Condensed Consolidated Statement of Changes in Stockholders’ Equity (unaudited)NOTES TO CONSOLIDATED FINANCIAL STATEMENTS
(UNAUDITED)
Three months ended September 30, 2022 (Unaudited)
|
| Common Stock |
|
| Additional Paid in |
|
| Retained Earnings (Accumulated |
|
| Accumulated Other comprehensive |
|
| Total Shareholder |
| |||||||||
|
| Shares |
|
| Amount |
|
| Capital |
|
| Deficit) |
|
| income (loss) |
|
| Equity |
| ||||||
Balance as of June 30, 2022 |
|
| 185,032,503 |
|
| $ | - |
|
| $ | 6,197,520 |
|
| $ | 7,551,523 |
|
| $ | 187,388 |
|
| $ | 13,936,431 |
|
Sale of common stock, net of fees |
|
| 10,000,000 |
|
|
| - |
|
|
| 37,057,176 |
|
|
| - |
|
|
| - |
|
|
| 37,057,176 |
|
Stock compensation |
|
| 25,000 |
|
|
| - |
|
|
| 477,500 |
|
|
| - |
|
|
| - |
|
|
| 477,500 |
|
Foreign currency translation adjustment |
|
| - |
|
|
| - |
|
|
| - |
|
|
| - |
|
|
| (764,034 | ) |
|
| (764,034 | ) |
Net loss for the period |
|
| - |
|
|
| - |
|
|
| - |
|
|
| (8,657,092 | ) |
|
| - |
|
|
| (8,657,092 | ) |
Balance as of September 30, 2022 |
|
| 195,057,503 |
|
| $ | - |
|
| $ | 43,732,196 |
|
| $ | (1,105,569 | ) |
| $ | (576,646 | ) |
| $ | 42,049,981 |
|
Nine months ended September 30, 2022 (Unaudited)
|
| Common Stock |
|
| Additional Paid in |
|
| Retained Earnings (Accumulated |
|
| Accumulated Other comprehensive |
|
| Total Shareholder |
| |||||||||
|
| Shares |
|
| Amount |
|
| Capital |
|
| Deficit) |
|
| income (loss) |
|
| Equity |
| ||||||
Balance as of December 31, 2021 |
|
| 305,451,498 |
|
| $ | - |
|
| $ | 6,197,520 |
|
| $ | 7,433,305 |
|
| $ | 898,497 |
|
| $ | 14,529,322 |
|
Share cancellation |
|
| (120,418,995 | ) |
|
| - |
|
|
| - |
|
|
| - |
|
|
| - |
|
|
| - |
|
Sale of common stock, net of fees |
|
| 10,000,000 |
|
|
| - |
|
|
| 37,057,176 |
|
|
| - |
|
|
| - |
|
|
| 37,057,176 |
|
Stock compensation |
|
| 25,000 |
|
|
| - |
|
|
| 477,500 |
|
|
| - |
|
|
| - |
|
|
| 477,500 |
|
Foreign currency translation adjustment |
|
| - |
|
|
| - |
|
|
| - |
|
|
| - |
|
|
| (1,475,143 | ) |
|
| (1,475,143 | ) |
Net loss for the period |
|
| - |
|
|
| - |
|
|
|
|
|
| (8,538,874 | ) |
|
| - |
|
| (8,538,874 | ) | ||
Balance as of September 30, 2022 |
|
| 195,057,503 |
|
| $ | - |
|
| $ | 43,732,196 |
|
| $ | (1,105,569 | ) |
| $ | (576,646 | ) |
| $ | 42,049,981 |
|
Three months ended September 30, 2021 (Unaudited)
|
| Common Stock |
|
| Additional Paid in |
|
| Retained Earnings (Accumulated |
|
| Accumulated Other comprehensive |
|
| Total Shareholder |
| |||||||||
|
| Shares |
|
| Amount |
|
| Capital |
|
| Deficit) |
|
| income (loss) |
|
| Equity |
| ||||||
Balance as of June 30, 2021 |
|
| 305,451,998 |
|
| $ | - |
|
| $ | 6,057,520 |
|
| $ | 4,751,744 |
|
| $ | 698,900 |
|
| $ | 11,508,164 |
|
Foreign currency translation adjustment |
|
|
|
|
|
|
|
|
|
| - |
|
|
|
|
|
|
| 9,828 |
|
|
| 9,828 |
|
Net income for the period |
|
|
|
|
|
|
|
|
|
|
|
|
|
| 1,410,271 |
|
|
| - |
|
|
| 1,410,271 |
|
Balance as of September 30, 2021 |
|
| 305,451,998 |
|
| $ | - |
|
| $ | 6,057,520 |
|
| $ | 6,162,015 |
|
| $ | 708,728 |
|
| $ | 12,928,263 |
|
Nine months ended September 30, 2021 (Unaudited)
|
| Common Stock |
|
| Additional Paid in |
|
| Retained Earnings (Accumulated |
|
| Accumulated Other comprehensive |
|
| Total Shareholder |
| |||||||||
|
| Shares |
|
| Amount |
|
| Capital |
|
| Deficit) |
|
| income (loss) |
|
| Equity |
| ||||||
Balance as of December 31, 2020 |
|
| 305,451,498 |
|
| $ | - |
|
| $ | 6,057,520 |
|
| $ | 2,257,630 |
|
| $ | 578,735 |
|
| $ | 8,893,885 |
|
Foreign currency translation adjustment |
|
| - |
|
|
| - |
|
|
| - |
|
|
| - |
|
|
| 129,993 |
|
|
| 129,993 |
|
Net income for the period |
|
| - |
|
|
| - |
|
|
| - |
|
| 3,904,385 |
|
|
| - |
|
| 3,904,385 |
| ||
Balance as of September 30, 2021 |
|
| 305,451,998 |
|
| $ | - |
|
| $ | 6,057,520 |
|
| $ | 6,162,015 |
|
| $ | 708,728 |
|
| $ | 12,928,263 |
|
The accompanying notes are an integral part of theseunaudited condensed consolidated financial statements.
Wetrade Group Inc
Notes to Condensed Consolidated Financial Statements
For the Nine Months Ended September 30, 2022
(Unaudited)NOTE 1 – NATURE OF BUSINESS
NOTE 1 – NATURE OF BUSINESS
OrganizationBusiness
WeTrade Group, Inc was incorporated in the State of Wyoming on March 28, 2019 and2019. We currently pursue two corporate strategies. One business strategy is in the business ofto continue providing technicalsoftware development services, and solutions via its social e-commerce platform. We are committed to providing an international cloud-based intelligence system and independently developed a micro-business cloud intelligence system called the “YCloud.” Our goalother strategy is to provide technicalacquire and auto-billing management services to micro-business online stores in China through big data analytics, machine learning mechanisms, social network recommendations, and multi-channel data analysis.hold bitcoin.
Software development
We provide technologyAI-enabled software development services to both individual and corporate users. We provide access to “YCloud” to our customers, which are Beijing Weijiafu Technology Co. Ltd (“Weijiafu”), a PRC technology company, which then provide “YCloud” services to individualincluded developing, designing, and corporate micro-business owners, Changtongfu Technology (Hainan) Co Limited (“Changtongfu”), a PRC technology company, which then provide “YCloud” services to individualimplementing various SAAS software solutions for businesses of all types, including industrial and corporate business owners in the hotel and travel industries.other businesses.
The market individual micro-business owners represents a potential of 330 million users by the year of 2023. (Source: iResrarch. http://xueqiu.com/8455183447/172404679?sharetime=2,2/22/2021). YCloud serves corporate users in multiple industries, including Yuetao Group, Zhiding, Lvyue, Yuebei, Yuedian, Coke GO, and Zhongyanshangyue. We conduct business operations in mainland China and have established trial operations in Hong Kong. We expect to utilize the YCloud system to establish a global strategic cooperation with various social media platforms. Bitcoin Acquisition Strategy
The main functionsOur bitcoin acquisition strategy generally involves acquiring bitcoin with our liquid assets that exceed working capital requirements, and from time to time, subject to market conditions, issuing debt or equity securities or engaging in other capital raising transactions with the objective of using the YCloud system areproceeds to manage users’ marketing relationships, CPS commission profit management, multi-channel data statistics, AI fission and management, and improved supply chain systems.
Currently, YCloud serves the micro business industry. We expect to expand the application of YCloud to tourism, hospitality, livestreaming and short video, medical beauty and traditional retail industries.
Recent Business Developments
By the third Quarter of 2022, the Company has entered YCloud system service agreements with three new customers as follows:
Beijing Yidong Linglong Cultural Media Co., Ltd. (“Beijing Yidong”), a PRC media and internet company that provides comprehensive high-quality digital contents, cultural and arts exchange activities for users.
Beijing Maitu International Travel Agency Co., Ltd (“Maitu International”), a PRC company that has been engaged in outbound tourism business since May 2008. Maitu is also a leading tourism company in South Korea, Japan and China.
Beijing Youth Travel Service Co., Ltd (“Beijing Youth Travel”) is an international travel agency approved by the National Tourism Administration and subordinate to the Beijing Municipal Tourism Administration. Beijing Youth Travel is a cross-regional comprehensive tourism enterprise group with more than 70 chain stores, and it integrates services in outbound tourism, inbound tourism, domestic tourism, tourism fleet, taxi, real estate, catering, consulting services, advertising, culture and entertainment.
Our Businesspurchase bitcoin.
We have utilized digitalization, electronic management, electronic data exchange, big data analysis, AI fission technology, revenue managementview our bitcoin holdings as long-term holdings and other technologiesexpect to build a strong coordination effect. We believe that our cloud technology enables uscontinue to develop a highly functional platform for micro-business users in China.accumulate bitcoin. We have optimizednot set any specific target for the amount of bitcoin we seek to hold, and we will continue to monitor market conditions in determining whether to engage in additional financings to purchase additional bitcoin.
This overall strategy also contemplates that we may (i) periodically sell bitcoin for general corporate purposes, including to generate cash for treasury management or in connection with strategies that generate tax benefits in accordance with applicable law, (ii) enter into additional capital raising transactions that are collateralized by our productbitcoin holdings, and (iii) consider pursuing additional strategies to create income streams or otherwise generate funds using the tools and platforms best suited to serve our customers and developed YCloud.bitcoin holdings.
We believe that, YCloud is the first global micro-business cloud intelligent internationalization system. It conducts multi-channel data analysis through the learning of big data and social recommendation relationships. It also provides users with AI fission and management systems and supply chain systems in order to reach a wider range of user groups. YCloud has four main functions and competitive advantages as follows:
Multiple integrated payment methods and payment analytics: the YCloud system provides micro-businesses and hotel owners with multiple payment methods such as Alipay, WeChat, and UnionPay. The total order amount is directly entered into the platform to collect funds in separate accounts. Using YCloud’s technology support, the micro-business owners offer multiple channels of payments to their customers, including Alipay, WeChat, and UnionPay. Meanwhile, YCloud assigns a bar code to merchandises that purchasers can then scan to pay, allowing purchasers to make payments both online and offline. This proprietary payment technology allows our customers to reduce labor costs and error rates, thus significantly improving data analysis.
|
| |
|
|
During the year 2020, due to its limited supply, bitcoin offers the impact ofopportunity for appreciation in value if its adoption increases and has the COVID-19 outbreak, many companies, including businesses traditionally operating offline, frompotential to serve as a wide range of industries, such as tourism, catering, entertainment or retail, have opted for a micro-business model to build sales channels through online social platforms and expand business opportunities. As a result ofhedge against inflation in the COVID-19 outbreak, consumer demand shifted, which forced business owners to expand to new markets and be present on multiple social platforms. Through continuous research on the micro-business industry, and its understanding of the relationship between people and social relationships on social platforms, YCloud develops new technology designed to meet the ever changing demand of micro-business owners across all industrieslong-term.
Team management: the YCloud system utilizes user marketing relationship tracking and CPS commission revenue management tools.
AI fission and management: using intelligent robots to analyze user behavior, data sharing, purchase history, and other data, the YCloud system provides tailored recommendations and displays. For example, the YCloud system connects users’ behavior across multiple apps and platforms and makes automatic recommendations based on its analysis.
Supply chain system integration: the YCloud system applies cross-platform resource integration technology. The integration allows the multi-channel output of high-quality products and creates a seamless connection between suppliers and customers. The YCloud provides a complete supply chain system integrating supply, sales, finance, and service.
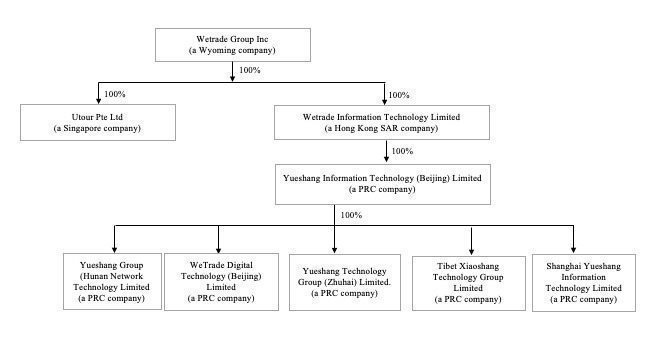
The following diagram sets forthtable presents a roll-forward of our bitcoin holdings, including additional information related to our bitcoin purchases, and digital asset impairment losses during the structure of the Company as of the date of this Quarterly Report:period:
| Schedule of digital asset impairment losses | |||||
| Source of capital used to purchase Bitcoin | Digital asset original cost basis | Digital asset impairment losses | Digital asset carrying amount | Approximate number of Bitcoin held | |
| Balance at December 31, 2022 | - | - | - | - | - |
| Digital asset purchase | (a) | 24,990,000 | - | 24,990,000 | 833 |
| Digital asset impairment loss | - | (2,591,490) | - | - | |
| Balance at September 30, 2023 | 24,990,000 | (2,591,490) | 22,398,510 | 833 |
Our business and corporate address in the United States is 1621 Central Ave, Cheyenne, WY 82001 Our telephone number is +86-13795206876 and our registered agent for service of process is Wyoming Registered Agent, 1621 Central Ave, Cheyenne, WY 82001. Our fiscal year end is December 31. Our Chinese business and corporate address is No. 18, Kechuang 10th Street, Beijing Economic and Technological Development Zone, Beijing, People Republic of China. The Chinese address is where our management is located.
NOTE 2 – SUMMARY OF SIGNIFICANT ACCOUNTING POLICIES
Cautionary Statement
This Form 10-Q has not undergone external audit review. The information presented herein is the responsibility of the Company’s management and has not been verified for accuracy by independent auditors. On completion of the review of auditors, the company will file an amended 10-Q/A upon the completion of audit review.
Basis of preparationPreparation of financial statementsFinancial Statements
The condensed consolidated financial statements have been prepared in accordance with generally accepted accounting principles in the United States of America (“GAAP”). The condensed consolidated financial statements include the financial statements of the Company and its subsidiaries. All significant inter-company transactions and balances have been eliminated in consolidation.
The condensed consolidated financial statements of the Company as of and for the nine months ended September 30, 20222023 and 20212022 are unaudited. In the opinion of management, all adjustments (including normal recurring adjustments) that have been made are necessary to fairly present the financial position of the Company as of September 30, 2022,2023, the results of its operations for the nine months ended September 30, 20222023 and 2021,2022, and its cash flows for the nine months ended September 30, 20222023 and 2021.2022. Operating results for the quarterly periods presented are not necessarily indicative of the results to be expected for a full fiscal year. Certain prior period amounts in the consolidated financial statements and accompanying notes have been reclassified to conform to the current period’s presentation. The balance sheet as of December 31, 2021 has been derived from the Company’s audited financial statements included in the Form 10-K for the year ended December 31, 2021.
The statements and related notes have been prepared pursuant to the rules and regulations of the Securities and Exchange Commission (the “SEC”). Accordingly, certain information and footnote disclosures normally included in financial statements prepared in accordance with U.S. GAAP have been omitted pursuant to such rules and regulations. These financial statements should be read in conjunction with the financial statements and other information included in the Company’s Annual Report on Form 10-K as filed with the SEC for the fiscal year ended December 31, 2021.2022.
As of September 30, 2022, the details of the consolidating subsidiaries are as follows:
| 7 |
|
| |||||
|
|
| ||||
|
| |||||
|
| |||||
|
| |||||
|
| |||||
|
| |||||
|
| |||||
|
| |||||
|
| |||||
Nature of Operations
WeTrade Group Inc. (the “Company” or “We’ or “Us”) is a Wyoming corporation incorporated on March 28, 2019. The Company is an investment holding company that formed as a Wyoming corporation to use as a vehicle for raising equity outside the US.
As of September 30, 2022, the nature operation of its subsidiaries are as follows:
|
| ||||
|
|
| |||
|
|
| |||
|
|
| |||
|
|
| |||
|
|
| |||
|
|
| |||
|
|
| |||
|
|
| |||
|
|
|
COVID-19 outbreak
In March 2020 the World Health Organization declared coronavirus COVID-19 a global pandemic. The COVID-19 pandemic has negatively impacted the global economy, workforces, customers, and created significant volatility and disruption of financial markets. It has also disrupted the normal operations of many businesses, including ours. This outbreak could decrease spending, adversely affect demand for our services and harm our business and results of operations. It is not possible for us to predict the duration or magnitude of the adverse results of the outbreak and its effects on our business or results of operations at this time.
Revenue Recognitionrecognition
The Company follows the guidance of Accounting Standards Codification (ASC) 606, Revenue from Contracts. ASC 606 creates a five-step model that requires entities to exercise judgment when considering the terms of contracts, which includes (1) identifying the contracts or agreements with a customer, (2) identifying our performance obligations in the contract or agreement, (3) determining the transaction price, (4) allocating the transaction price to the separate performance obligations, and (5) recognizing revenue as each performance obligation is satisfied. The Company only applies the five-step model to contracts when it is probable that the Company will collect the consideration it is entitled to in exchange for the services it transfers to its clients.
Digital Assets
The Company accounts for its digital assets, which are comprised solely of bitcoin, as indefinite-lived intangible assets in accordance with Accounting Standards Codification (“ASC”) 350, Intangibles—Goodwill and Other. The Company’s digital assets are initially recorded at cost. Subsequently, they are measured at cost, net of any impairment losses incurred since acquisition. Impairment losses are recognized as “Digital asset impairment losses” in the Company’s Consolidated Statement of Operations in the period in which the impairment occurs. Gains (if any) are not recorded until realized upon sale, at which point they are presented net of any impairment losses in the Company’s Consolidated Statements of Operations. In determining the gain to be recognized upon sale, the Company calculates the difference between the sales price and carrying value of the specific bitcoins sold immediately prior to sale.
The following table summarizes the Company’s digital asset holdings as of:
| Schedule of digital asset holdings | ||||||||
| September 30, 2023 | December 31, 2022 | |||||||
| Approximate number of bitcoins held | 833.19 | — | ||||||
| Digital assets carrying value | $ | 22,398,510 | $ | — | ||||
| Cumulative asset impairment losses | $ | 2,591,490 | $ | — | ||||
As of September 30, 2023, approximately 833.19 of the bitcoins held by the Company, which had a carrying value of approximately $22.4 22,398,510 million on the Company’s Consolidated Balance Sheet as of September 30, 2023.
| 8 |
Cash and Cash Equivalents
The Company considers all highly liquid debt instruments purchased with a maturity period of three months or less to be cash or cash equivalents. The carrying amounts reported in the accompanying unaudited condensed consolidated balance sheets for cash and cash equivalents approximate their fair value. All of the Company’s cash that is held in bank accounts in Vanuatu, Singapore, Hong Kong and PRC isare not protected by Federal Deposit Insurance Corporation (“FDIC”) insurance or any other similar insurance in Vanuatu, PRC, or Singapore.insurance.
Foreign Currency
The Company’s principal country of operations is the PRC. The accompanying condensed consolidated financial statements are presented in US$. The functional currency of the Company is US$, and the functional currency of the Company’s subsidiaries is RMB. The condensed consolidated financial statements are translated into US$ from RMB at year-end exchange rates as to assets and liabilities and average exchange rates as to revenues and expenses. Capital accounts are translated at their historical exchange rates when the capital transactions occurred. The resulting translation adjustments are recorded as a component of shareholders’ equity included in other comprehensive income. Gains and losses from foreign currency transactions are included in profit or loss. There were no gains and losses from foreign currency transactions from the inception to September 30, 2022.2023.
|
| September 30, 2022 |
|
| December 31, 2021 |
| ||
RMB: US$ exchange rate |
|
| 7.12 |
|
|
| 6.36 |
|
| Schedule of exchange rate | ||||||||
| September 30, 2023 | December 31, 2022 | |||||||
| RMB: US$ exchange rate | 7.27 | 0 | ||||||
The balance sheet amounts, with the exception of equity, September 30, 20222023 and December 31, 20212022 were translated at 7.12 RMB and 6.36 RMB to $1.00,US$1.00, respectively. The equity accounts were stated at their historical rates. The average translation rates applied to statements of operations and comprehensive income accounts for the period ended September 30, 20222023 and year ended December 31, 20212022 were 6.64 RMB and 6.44 RMB to $1.00,US$1.00, respectively. Cash flows were also translated at average translation rates for the year and, therefore, amounts reported on the statement of cash flows would not necessarily agree with changes in the corresponding balances on the condensed consolidated balance sheet. The transactions dominated in SGD are immaterial.
Consolidation
The Company’s condensed consolidated financial statements include the financial statements of the Group and subsidiaries. All transactions and balances among the Group and its subsidiaries have been eliminated upon consolidation.
Use of EstimateEstimates
The preparation of financial statements in conformity with US GAAP requires management to make judgement estimates and assumptions that affect the amounts reported amounts of assetsin the condensed consolidated financial statements and liabilities and disclosure of contingent assets and liabilities ataccompanying notes. Management believes that the date ofestimates used in preparing the financial statements are reasonable and the reported amounts of expenses during the reporting periods. Actualprudent; however, actual results could differ from thosethese estimates.
Property and Equipment
Property and equipment are stated at Significant accounting estimates include the historical cost, less accumulated depreciation. Depreciation on property and equipment is provided using the straight-line method over the estimatedallowance for doubtful accounts, useful lives of theintangible asset, valuation of deferred tax assets, for both financial and income tax reporting purposescertain accrued liabilities such as follows:
|
| |
|
|
Upon sale or disposal of an asset, the historical cost and related accumulated depreciation or amortization of such asset were removed from their respective accounts and any gain or loss is recorded in the statements of income.contingent liabilities.
The Company reviews the carrying value of property, plant, and equipment for impairment whenever events and circumstances indicate that the carrying value of an asset may not be recoverable from the estimated future cash flows expected to result from its use and eventual disposition. In cases where undiscounted expected future cash flows are less than the carrying value, an impairment loss is recognized equal to an amount by which the carrying value exceeds the fair value of assets. The factors considered by management in performing this assessment include current operating results, trends and prospects, the manner in which the property is used, and the effects of obsolescence, demand, competition and other economic factors. Based on this assessment, no impairment expenses for property, plant, and equipment were recorded in operating expenses during the nine months ended September 30, 2022 and 2021.
| 9 |
Concentration of Risk
Financial instruments that potentially subject the Company to concentrations of credit risk consist principally of cash. Cash on hand amounted to $20,261,881as of September 30, 2022.
Accounts Receivable
Accounts receivables are presented net of allowance for doubtful accounts. The Company uses specific identification in providing for bad debts when facts and circumstances indicate that collection is doubtful and based on factors listed in the following paragraph. If the financial conditions of its customers were to deteriorate, resulting in an impairment of their ability to make payments, additional allowance may be required.
The Company maintains an allowance for doubtful accounts which reflects its best estimate of amounts that potentially will not be collected. The Company determines the allowance for doubtful accounts on general basis taking into consideration various factors including but not limited to historical collection experience and credit-worthiness of the customers as well as the age of the individual receivables balance. Additionally, the Company makes specific bad debt provisions based on any specific knowledge the Company has acquired that might indicate that an account is uncollectible. The facts and circumstances of each account may require the Company to use substantial judgment in assessing its collectability.
Intangible Asset
| 10 |
Intangible asset is software development cost incurred by the Company, it will be amortized on a straight line basis over the estimated useful life of 5 years.
Leases
The Company adopted Accounting Standards Update No. 2016-02, Leases (Topic 842) (ASU 2016-02), as amended, which supersedes the lease accounting guidance under Topic 840, and generally requires lessees to recognize operating and financing lease liabilities and corresponding right-of-use (ROU) assets on the balance sheet and to provide enhanced disclosures surrounding the amount, timing and uncertainty of cash flows arising from leasing arrangements.
Operating leases are included in operating lease right-of-use (“ROU”) assets and short-term and long-term lease liabilities in our condensed consolidated balance sheets. Finance leases are included in property and equipment, other current liabilities, and other long-term liabilities in our condensed consolidated balance sheets.
ROU assets represent the Company’s right to use an underlying asset for the lease term and lease liabilities represent the Company’s obligation to make lease payments arising from the lease. Operating lease ROU assets and liabilities are recognized at commencement date based on the present value of lease payments over the lease term. As most of the leases do not provide an implicit rate, we use the industry incremental borrowing rate based on the information available at commencement date in determining the present value of lease payments. We use the implicit rate when readily determinable. The operating lease ROU asset also includes any lease payments made and excludes lease incentives. The lease terms may include options to extend or terminate the lease when it is reasonably certain that we will exercise that option. Lease expense for lease payments is recognized on a straight-line basis over the lease term.
Under ASC 840, leases were classified as either capital or operating, and the classification significantly impacted the effect the contract had on the company’s financial statements. Capital lease classification resulted in a liability that was recorded on a company’s balance sheet, whereas operating leases did not impact the balance sheet.
ASU 2016-02 requires that public companies use a secured incremental browning rate for the present value of lease payments when the rate implicit in the contract is not readily determinable. We determine a secured rate on a quarterly basis and update the weighted average discount rate accordingly.
Software Development Costs
We apply ASC 985-20, Software—Costs of Software to Be Sold, Leased, or Marketed, in analyzing our software development costs. ASC 985-20 requires the capitalization of certain software development costs subsequent to the establishment of technological feasibility for a software product in development. Research and development costs associated with establishing technological feasibility are expensed as incurred. Based on our software development process, technological feasibility is established upon the completion of a working model. In addition, we apply this to our review of development projects related to software used exclusively for our SaaS subscription offerings. In these reviews, all costs incurred during the preliminary project stages are expensed as incurred. Once the projects have been committed to and it is probable that the projects will meet functional requirements, costs are capitalized.
| 11 |
Income Tax
Income taxes are determined in accordance with the provisions of ASC Topic 740, “Income Taxes” (“ASC Topic 740”). Under this method, deferred tax assets and liabilities are recognized for the future tax consequences attributable to differences between the financial statement carrying amounts of existing assets and liabilities and their respective tax basis. Deferred tax assets and liabilities are measured using enacted income tax rates expected to apply to taxable income in the periods in which those temporary differences are expected to be recovered or settled. Any effect on deferred tax assets and liabilities of a change in tax rates is recognized in income in the period that includes the enactment date.
ASC 740 prescribes a comprehensive model for how companies should recognize, measure, present, and disclose in their financial statements uncertain tax positions taken or expected to be taken on a tax return. Under ASC 740, tax positions must initially be recognized in the financial statements when it is more likely than not the position will be sustained upon examination by the tax authorities. Such tax positions must initially and subsequently be measured as the largest amount of tax benefit that has a greater than 50% likelihood of being realized upon ultimate settlement with the tax authority assuming full knowledge of the position and relevant facts.
The Company has a subsidiarysubsidiaries in Singapore and PRC. The Company is subject to tax in Singapore and PRC jurisdictions. As a result of its future business activities, the Company will be required to file tax returns that are subject to examination by the Inland Revenue Authority of Singapore and Tax Department of PRC.
Basic net income per share of common stock attributable to common stockholders is calculated by dividing net income attributable to common stockholders by the weighted-average shares of common stock outstanding for the period. Potentially dilutive shares, which are based on the weighted-average shares of common stock underlying outstanding stock-based awards, warrants, options, or convertible debt using the treasury stock method or the if-converted method, as applicable, are included when calculating diluted net income (loss) per share of common stock attributable to common stockholders when their effect is dilutive.
Potential dilutive securities are excluded from the calculation of diluted EPS in profit periods as their effect would be anti-dilutive.
As of September 30, 2022,2023, there were no potentially dilutive shares.
| Schedule of potentially diluted shares | ||||||||||||||||
|
| For the nine months ended September 30, 2022 |
|
| For the nine months ended September 30, 2021 |
| For the period September 30, 2023 | For the period September 30, 2022 | ||||||||
Statement of Operations Summary Information: |
|
|
|
|
| |||||||||||
Net (Loss)/ Profit |
| $ | (8,538,874 | ) |
|
| 3,904,385 |
| ||||||||
| Net Loss | $ | (9,455,304 | ) | $ | (8,496,543 | ) | ||||||||||
Weighted-average common shares outstanding - basic and diluted |
|
| 233,072,453 |
|
|
| 305,451,498 |
| ||||||||
Net (loss)/ profit per share, basic and diluted |
| $ | (0.04 | ) |
|
| 0.01 |
| ||||||||
| Net loss per share, basic and diluted | $ | ) | $ | ) | ||||||||||||
Common Stock Issued for Services
Our accounting policy for equity instruments issued to employees, consultants and vendors follows the provisions of ASC 718, Compensation- Stock compensation. The measurement date for the fair value of the equity instruments issued is determined at the earlier of (i) the date at which a commitment for performance by the consultant or vendor is reached or (ii) the date at which the consultant or vendor's performance is complete. In the case of equity instruments issued to consultants, the fair value of the equity instrument is recognized over the term of the consulting agreement at various performance completion dates, and for unvested instruments, at each reporting date. Compensation expense, once recorded, may not be reversed.
| 12 |
Fair Value Measurements
The Company follows guidance for accounting for fair value measurements of financial assets and financial liabilities and for fair value measurements of nonfinancial items that are recognized or disclosed at fair value in the financial statements on a recurring basis. Additionally, the Company adopted guidance for fair value measurement related to nonfinancialnon-financial items that are recognized and disclosed at fair value in the financial statements on a nonrecurringnon-recurring basis. The guidance establishes a fair value hierarchy that prioritizes the inputs to valuation techniques used to measure fair value.
The hierarchy gives the highest priority to unadjusted quoted prices in active markets for identical assets or liabilities (Level 1 measurements) and the lowest priority to measurements involving significant unobservable inputs (Level 3 measurements). The three levels of the fair value hierarchy are as follows:
Level 1 inputs are quoted prices (unadjusted) in active markets for identical assets or liabilities that the Company has the ability to access at the measurement date.
Level 2 inputs are inputs other than quoted prices included within Level 1 that are observable for the asset or liability, either directly or indirectly.
Level 3 inputs are unobservable inputs for the asset or liability. The carrying amounts of financial assets such as cash approximate their fair values because of the short maturity of these instruments.
NOTE 3 – RECENT ACCOUNTING PRONOUNCEMENTS
Recent accounting pronouncements issued by the FASB (including its Emerging Issues Task Force) and the United States Securities and Exchange Commission did not or are not believed by management to have a material impact on the Company’s present or future financial statements.
NOTE 4 – REVENUE
InWe are in the business of providing an international cloud-based intelligence system, namely “YCloud” system. We aim to provide technicalAI-enabled software development services for industrial and auto-billing management system services to micro-business online stores in China through big data analytics, machine learning mechanisms, social network recommendations, and multi-channel data analysis. Weijiafu and Changtongfu are our customers to take charge of the YCloud users’ profiles. Meanwhile, all YCloud users’ information is retained within YCloud system.other customers.
We derive our revenue from system service fees charged for transactions conducted through YCloud. We receive 2%-3.5% of the total Gross Merchandise Volume generated in the platform as a system service fee from YCloud users through service agreement with our customers (such as Weijiafu, Changtongfu, Beijing Yidong, Maitu International and Beijing Youth ), depending on the type of service and industry. Gross Merchandise Volume, or GMV, is a term used in online retailing to indicate a total sales monetary-value for merchandise sold through a particular marketplace over a certain time frame. We generally receive the system service fee from customers within the first ten days of each calendar month. With effect from October 2021, YCloud system service fee will be settled within the first ten days of each quarter due to high volume of transaction amounts conducted through YCloud from end users. As of reporting date, all the service fee receivable has been fully settled and received.
The system services fees are collected from five customers of YCloud system based on the GMV as follow:
Gross Merchandise Volume (“GMV”) |
| September 30, 2022 |
|
| September 30, 2021 |
| ||
|
| US$ |
|
| US$ |
| ||
Non-related parties: |
|
|
|
|
|
| ||
Weijiafu |
|
| 103,494,844 |
|
|
| 235,556,440 |
|
Beijing Yidong |
|
| 58,671,875 |
|
|
| - |
|
Maidu International |
|
| 42,276,493 |
|
|
| - |
|
Beijing Youth |
|
| 53,247,096 |
|
|
| - |
|
|
|
| 257,690,308 |
|
|
| 235,556,440 |
|
Related party: |
|
|
|
|
|
|
|
|
Changtongfu |
|
| 20,868,043 |
|
|
| 102,528,696 |
|
Total GMV: |
|
| 278,558,351 |
|
|
| 333,085,136 |
|
As of and for the period ended September 30, 2022,2023, we generated revenues from the four third parties customers amounting $8,508,642 and related party- Changtongfu amounting $689,039.$2,229,009 2,229,999 as follow:
| Schedule of revenue | ||||||||
| September 30, 2023 | September 30, 2022 | |||||||
| Ycloud-SAAS business | $ | 596,163 | $ | 9,197,681 | ||||
| Software development and industrial SAAS business | 1,633,836 | — | ||||||
| $ | 2,229,999 | $ | 9,197,681 | |||||
| 13 |
NOTE 5 – CASH AT BANKAND CASH EQUIVALENTS
As of September 30, 2022,2023, the Company held cash in bank in the amount of $20,261,881,$1,416,885, which consist of the following:
|
| September 30, 2022 |
|
| December 31, 2021 |
| ||
Bank Deposits-USA |
| $ | 33,757 |
|
|
| - |
|
Bank Deposits-Singapore |
|
| 6,531 |
|
|
| 313,528 |
|
Bank Deposits- Hong Kong |
|
| 26,619 |
|
|
| - |
|
Bank Deposits- China |
|
| 194,974 |
|
|
| 303,065 |
|
Bank Deposits- Vanuatu |
|
| 20,000,000 |
|
|
| - |
|
|
|
| 20,261,881 |
|
|
| 616,593 |
|
| Schedule of held cash in bank in the amount | ||||||||
| September 30, 2023 | December 31, 2022 | |||||||
| Bank Deposits-USA | $ | — | $ | 22,926 | ||||
| Bank Deposits- Outside USA | 1,416,885 | — | ||||||
| $ | 1,416,885 | $ | 22,926 | |||||
NOTE 6 – INTANGIBLE ASSET
Intangible asset is software development cost incurred by company, it will be amortized on a straight line basis over the estimated useful life of 5 years as follow:
September 30, 2022 | ||||||||||||||||
|
| Gross Carrying Amount |
|
| Accumulated Amortization |
|
| Net Carrying Amount |
|
| Weighted Average Useful Life (Years) |
| ||||
|
|
|
|
|
|
|
|
|
|
|
|
| ||||
Intangible assets: |
|
|
|
|
|
|
|
|
|
|
|
| ||||
Software development |
| $ | 57,143 |
|
| $ | (33,693 | ) |
| $ | 23,450 |
|
|
| 5 |
|
Foreign currency translation adjustment |
|
| - |
|
|
| - |
|
|
| 5,203 |
|
|
|
|
|
Intangible assets, net |
| $ | 57,143 |
|
| $ | (33,693 | ) |
| $ | 28,653 |
|
|
|
|
|
Amortization expense for intangible assets was $4,633 and $7,807 for the nine months period ended September 30, 2022 and 2021.
Expected future intangible asset amortization as of September 30, 2022 was as follows:
Fiscal years: |
|
|
| |
Remaining 2022 |
| $ | 15,956 |
|
2023 |
|
| 12,697 |
|
NOTE 7 – PROPERTY AND EQUIPMENTDIGITAL ASSETS
As of September 30, 2022, property and equipment consists of the following:2023, digital assets holdings are as follow:
September 30, 2022 | ||||||||||||||||
|
| Gross Carrying Amount |
|
| Accumulated Depreciation |
|
| Net Carrying Amount |
|
| Weighted Average Useful Life (Years) |
| ||||
|
|
|
|
|
|
|
|
|
|
|
|
| ||||
Property and equipment: |
|
|
|
|
|
|
|
|
|
|
|
| ||||
Office equipment |
| $ | 150,915 |
|
| $ | (71,159 | ) |
| $ | 79,756 |
|
|
| 3 |
|
Leasehold improvement |
|
| 1,055,529 |
|
|
| - |
|
|
| 1,055,529 |
|
|
| 5 |
|
Property and equipment, net |
| $ | 1,206,444 |
|
| $ | (71,159 | ) |
| $ | 1,135,285 |
|
|
|
|
|
| Schedule of digital assets holdings | ||||||||
| September 30, 2023 | December 31, 2022 | |||||||
| Opening balance | $ | — | $ | — | ||||
| Purchase of BTC | 24,990,000 | — | ||||||
| Impairment losses of digital assets | (2,591,490 | ) | — | |||||
| Ending balance | $ | 22,398,510 | $ | — | ||||
Depreciation expensesAs of office equipment were $36,641 and nil forSeptember 30, 2023, the periodCompany has purchase approximately 833 BTC at the total cost of $24,990,00022,398,510. For the nine months ended September 30, 2022 and year 2021 respectively as2023, the computer and office equipment were acquiredCompany recognized impairment loss of $2,591,490 on June 29, 2021.digital assets.
Amortization expenses of leasehold improvement is $nil for the year ended September 30, 2022 and the leasehold improvement was completed in the end of September 2022.
NOTE 87 – ACCOUNT RECEIVABLES, NET
As of September 30, 2022, account receivables is2023, accounts receivable are related to the services fee receivables from customers as follow:
|
| September 30, 2022 |
|
| December 31, 2021 |
| ||
Account receivables |
| $ | 4,473,310 |
|
| $ | 5,627,463 |
|
Account receivables- related parties |
|
| 379,455 |
|
|
| 3,603,402 |
|
|
| $ | 4,852,765 |
|
| $ | 9,230,865 |
|
| Schedule of account receivable | ||||||||
| September 30, 2023 | December 31, 2022 | |||||||
| Accounts Receivables | $ | 129,765 | $ | — | ||||
We generally receive the system service fee from customers within the first ten days of each quarter due to high volume of transaction amounts conducted through YCloud from end users.
The Company’s financial instruments that are exposed to concentrations of credit risk consist primarily of accounts receivable. The Company does not require collateral for accounts receivables.receivable. The Company maintains an allowance for its doubtful accounts receivable due to estimated credit losses. The Company records the allowance against bad debt expense through the condensed consolidated statements of operations, included in general and administrative expense, up to the amount of revenues recognized to date. Receivables are written off and charged against the recorded allowance when the Company has exhausted collection efforts without success. As of September 30, 2022, account receivable from non-related customers amounted to $4,473,310 (December 31, 2021: $5,627,463) and related parties- Changtongfu are amounted to $379,455 (December 31, 2021: $3,603,402). As of the reporting date, all the services fee receivables have been fully settled from 4 main non-related customers and 1 related party customer- Changtongfu.
| 14 |
NOTE 98 – PREPAYMENTS
As of September 30, 2022,2023, prepayments consist of the following:
|
| September 30, 2022 |
|
| December 31, 2021 |
| ||
Office furniture and renovation |
| $ | 702,247 |
|
| $ | 1,895,591 |
|
Office rental |
|
| - |
|
|
| 173,611 |
|
Block-chain and promotion services |
|
| 4,126,955 |
|
|
| - |
|
WT Pay system development |
|
| 10,000,000 |
|
|
| - |
|
Others |
|
| 171,509 |
|
|
| 691,456 |
|
|
| $ | 15,000,711 |
|
| $ | 2,760,658 |
|
| Schedule of prepayments | ||||||||
| September 30, 2023 | December 31, 2022 | |||||||
| Digital assets | $ | 12,125,500 | $ | — | ||||
| Others | — | 50,000 | ||||||
| $ | 12,125,500 | $ | 50,000 | |||||
As of September 30, 2022,2023, there is aare prepayment of approximate $14.1 million in relation toapproximately $12,125,500 for the system development40% prepayment of WT Pay, block chain software development under YCloud system,1000 BTC, which areis expected to be completeddelivered by midend of 2023.November 2023 with the lock up price of $30,000 per BTC.
As of September 30, 2022, prepayments- related parties consist of the following:
|
| September 30, 2022 |
|
| December 31, 2021 |
| ||
YCloud system upgrade |
| $ | 2,575,535 |
|
| $ | - |
|
|
| $ | 2,575,535 |
|
| $ | - |
|
As of September 30, 2022, there is a prepayment of approximate $2.6 million in relation to the YCloud system upgrade and data storage improvement, which expected to complete in 2023.
NOTE 109 – NOTE RECEIVABLES
As of September 30, 2022, Note receivables consist of the following:
|
| September 30, 2022 |
|
| December 31, 2021 |
| ||
Note receivables |
| $ | 1,858,310 |
|
|
| 3,798,130 |
|
|
|
| 1,858,310 |
|
|
| 3,798,130 |
|
Note receivable is related to the prior short-term loan of RMB 23 million to a third party with annual interest of 5%, which will be matured on January 31, 2023.
NOTE 11 – OTHER RECEIVABLES
As of September 30, 2022, other receivables consist of advances to staff for petty cash and staff loans as follow:
|
| September 30, 2022 |
|
| December 31, 2021 |
| ||
Advance to staff for petty cash |
| $ | 48,335 |
|
|
| 19,302 |
|
Employee advances |
|
| 89,610 |
|
|
| 10,845 |
|
|
|
| 137,945 |
|
|
| 30,147 |
|
NOTE 12 – RENTAL DEPOSIT
As of September 30, 2022 and December 31, 2021, rental deposit of $243,006 and $272,063 is the office lease deposit. The office tenancy period is 5 years and it will be refundable after the end of tenancy.
With effect from July 1, 2022, the office tenancy has been transferred to a related company- Zhiding Network Technology (Beijing) Co Limited (“ZNTB”), in which the remaining office rental will be paid by ZNTB under the remaining tenancy period. On July 1, 2022, the difference between the carrying amounts of the right-of-use asset and the lease liability amounted $209,402 were recognized as other income.
NOTE 13 – AMOUNT DUE TO RELATED PARTIES
| Schedule of due to related parties | ||||||||||||||||
|
| As of September 30, 2022 |
|
| As of December 31, 2021 |
| September 30, 2023 | December 31, 2022 | ||||||||
|
|
|
|
|
| |||||||||||
Related parties payable |
| $ | 541,297 |
| $ | 745,532 |
| $ | 719,683 | $ | 521,296 | |||||
Director fee payable |
|
| 676,000 |
|
|
| 360,000 |
| 954,000 | 770,000 | ||||||
|
| $ | 1,217,297 |
|
| $ | 1,105,532 |
| $ | 1,673,683 | $ | 1,291,296 | ||||
As of September 30, 2022, theThe related party balance of $541,297$719,683 represented advances and professional expenses paid on behalf by Director,Shareholders, which consistsconsist of $300,062 advance from Dai Zheng, $42,000 advance from Li Zhuo, $10,000 from Che Kean Tataudit fees, lawyers’ fee and $189,235 office rental advance from Liu Pijun through Zhiding Network Technology (Beijing) Co Limited (“ZNTB”). It is unsecured, interest-free with no fixed payment term and imputed interest is consider to be immaterial.other professional expenses.
As of September 30, 2022,2023, the director fee payable of $676,000$954,000 represented the accruedaccrual of director fees from the appointment date to September 30, 2022.2023.
NOTE 1410 – RELATED PARTY TRANSACTIONS
The following is the list of the related parties to which the Company has transactions with:
|
| |
|
| |
|
|
Related parties transactions consisted of the following as of the dates indicated.
Name of related party |
| Nature of transaction |
| For the Nine months ended September 30, 2022 |
|
| For the Nine months ended September 30, 2021 |
| ||
ZNTB |
| Office rental paid on behalf for the Group |
| $ | 375,949 |
|
| $ | - |
|
BXDT |
| System and software service fee |
| $ | 1,344,544 |
|
| $ | 485,190 |
|
HZTC |
| System and software fee |
| $ | 1,125,249 |
|
| $ | 739,016 |
|
Name of related party |
| Nature of transaction |
| For the Nine months ended September 30, 2022 |
|
| For the year ended December 31, 2021 |
| ||
ZNTB |
| Office rental payable |
| $ | 174,428 |
|
|
| 54,436 |
|
NOTE 15 – ACCOUNT PAYABLES
Account payables of $2,080,651 consists of the payables of YCloud system service fee and office sundry expenses as follow:
|
| September 30, 2022 |
|
| December 31, 2021 |
| ||
System service fee |
| $ | 2,037,947 |
|
| $ | - |
|
Office sundry expenses |
|
| 44,135 |
|
|
| 7,710 |
|
|
| $ | 2,082,082 |
|
| $ | 7,710 |
|
NOTE 16 – ACCRUED EXPENSES
Accrued expenses of $126,260 consists of the accrued payroll, Central Provident Fund and social welfare as follow:
|
| September 30, 2022 |
|
| December 31, 2021 |
| ||
Accrued payroll |
| $ | 126,260 |
|
| $ | 217,073 |
|
|
| $ | 126,260 |
|
| $ | 217,073 |
|
NOTE 17 – TAX PAYABLES
As of September 30, 2022, tax payable of $178,855 (December 31, 2021: $711,841) is consist of PRC corporate income tax rate ranged from 9% to 25%, Value-added Tax of 6% and PRC Urban construction tax and levies.
NOTE 18 – OTHER PAYABLES
Other payables of $265,1892023, accrued expenses consists of the payablesoutsourcing expenses of securities account set up fee and related documentation expensessoftware developments as follow:
|
| September 30, 2022 |
|
| December 31, 2021 |
| ||
Security account set up fee-Staff |
| $ | 265,189 |
|
|
| 306,270 |
|
|
| $ | 265,189 |
|
| $ | 306,270 |
|
| Schedule of accrued expenses | ||||||||
| September 30, 2023 | December 31, 2022 | |||||||
| Software development fee for outsource staffs | $ | 270,864 | $ | — | ||||
| 15 |
NOTE 1911 – DISCONTINUED OPERATIONS
On September 29, 2023, the Company’s Board of Directors passed a resolution to dissolve the operation of WeTrade Information System Limited and its wholly owned subsidiaries, resulting in a gain on disposal of $1,124,675. Loss from discontinued operations for the period ended September 30, 2023 and 2022 was as follows:
| Schedule of discontinued operations | ||||||||
| Nine Months ended September 30 2023 | Nine Months ended September 30 2022 | |||||||
| Revenue: | ||||||||
| Service revenue | $ | 596,162 | $ | — | ||||
| Cost of revenue | (993,127 | ) | — | |||||
| Gross loss | (396,965 | ) | — | |||||
| Operating expenses: | ||||||||
| General and Administrative | 11,998,681 | — | ||||||
| Operations Loss | (11,998,681 | ) | — | |||||
| Other (expenses)/ revenue | 11,302,830 | — | ||||||
| Loss from discontinued operations before income tax | (1,092,816 | ) | — | |||||
| Income tax expense | (31,860 | ) | — | |||||
| Gain from discontinued operation after tax | 1,124,676 | — | ||||||
| Loss on disposal of discontinued operation | (6,545,912 | ) | (6,418,752 | ) | ||||
| LOSS FROM DISCONTINUED OPERATION | $ | (5,421,236 | ) | $ | (6,418,752 | ) | ||
The major components of assets and liabilities related to discontinued operations are summarized below:
| Schedule of assets and liabilities related to discontinued operations | ||||||||
| September 30, 2023 | December 31, 2022 | |||||||
| ASSETS | ||||||||
| Current assets: | ||||||||
| Cash and cash equivalents | $ | 938 | $ | 13 | ||||
| Accounts receivables | — | 654,139 | ||||||
| Loan receivables | 7,246,164 | |||||||
| Prepayments | 3,394,583 | 747,717 | ||||||
| Property and equipment, net | 736,995 | 70,493 | ||||||
| Intangible asset | 18,365 | 230 | ||||||
| Other receivables | 708,702 | 2,899 | ||||||
| Total assets related to discontinued operations | 12,105,747 | 1,475,491 | ||||||
| Account payables | $ | 212,173 | $ | 194,179 | ||||
| Other payables | 7,460,121 | 38,881 | ||||||
| Total liabilities related to discontinued operations | $ | 7,672,294 | $ | 233,060 | ||||
| 16 |
NOTE 12 – SHAREHOLDERS’ EQUITY
The companyCompany has an unlimited number of ordinary shares authorized, and has issued 195,057,503 shares with no par value as of September 30, 2022.2023.
On March 29, 2019, the companyCompany has issued shares with no par value to thirty-three founders. On September 3, 2019, the companyCompany has issued a total shares at $3$ each to 5 non-US shareholders. The total outstanding shares has increased to shares as of December 31, 2019.
In February 2020, there are shares were issued at $3$ per share to new shareholders. On July 10, 2020, the companyCompany issued another shares at $3$ per share to new shareholders and the total outstanding shares has increased to shares.
On September 15, 2020, the Wyoming Secretary of State approved the Company’s certificate of amendment to amend its Articles of Incorporation to effectuate a effect 3 for 1 forward stock split.split. The total issued and outstanding shares of the Company’s common stock has been increased from 101,766,666 to 305,299,998 shares, with the par value unchanged at zero.
On September 21, 2020, there are shares issued at $5$ per share to new shareholders, the Company’s common stock issued has been increased to 305,451,498 shares as of December 31, 2020.
On April 13, 2022, the Company and 15 Shareholdersshareholders entered into that certain Share Exchange Agreement (the “Share Exchange Agreement”), pursuant to which Company and the 15 Shareholders have cancelled shares of Common Stock (“Cancellation Shares”). Upon completion of the transaction, the outstanding shares of the Company’s Common Stock has been decreased from shares to shares as of June 30, 2022.
On July 21, 2022, the Company has uplistedcompleted uplisting of its common stock to the Nasdaq Capital Market, and the closing of its public offering of shares of common stock with the gross proceedproceeds of $40,000,000$40,000,000 and net proceedproceeds of $37,057,176$37,057,176 after deducting the total offering cost of $2,942,824.$2,942,824. The shares were priced at $4.00$ per share, and the offering was conducted on a firm commitment basis. The shares continue to trade under the stock symbol “WETG.” The Company’s total issued and outstanding common stock has been increased to shares after the offering.
On July 22, 2022, the Company issued shares of common stock to certain service providers for services in connection with the public offering, the fair value of the share was $477,500.$477,500. The Company’s total issued and outstanding common stock has been increased to shares in 2022.
On June 9, 2023, the Wyoming Secretary of State approved the Company’s certificate of amendment to amend its Articles of Incorporation to effect 1 for 185 reverse stock split (“Reverse Stock Split”). The total issued and outstanding shares of the Company’s common stock decreased from to shares, with the par value unchanged at zero 0.
In September, 2023, there are shares issued with the total amount of $12,616,454, the Company’s common stock issued has been increased to shares as of September 30, 2022. 2023.
NOTE 13 – INCOME TAXES
The Company is subject to U.S. Federal tax laws. The Company has not recognized an income tax benefit for its operating losses in the United States because the Company does not expect to commence active operations in the United States.
UTour Pte Ltd (“UTour”) was incorporated in Singapore and is subject to Singapore profits tax at a tax rate of 17%. Since UTour had no taxable income during the reporting period, it has not paid Singapore profits taxes. UTour has not recognized an income tax benefit for its operating losses in Singapore because it does not expect to commence active operations in Singapore.
WeTrade Bit Technology Limited (“WBIT”) was incorporated in Hong Kong and is subject to Hong Kong profits tax at a tax rate of 16.5%. Since WBIT had no taxable income during the reporting period, it has not paid Hong Kong profits taxes. WITL has not recognized an income tax benefit for its operating losses in Hong Kong because the Company does not expect to commence active operations in Hong Kong.
The Company is currently conducting its major operations in the PRC through its subsidiaries, which are subject to tax from 15% to 25%.
NOTE 14- SUBSEQUENT EVENTS
In accordance with FASB ASC 855-10 Subsequent Events, the Company has analyzed its operations subsequent to September 30, 2023, to the date these unaudited condensed consolidated financial statements were issued and has determined that it does not have any material subsequent events to disclose in these consolidated financial
ITEM 2. MANAGEMENT’S DISCUSSION AND ANALYSIS OF FINANCIAL CONDITION AND RESULTS OF OPERATIONS
The following discussion and analysis of financial condition and results of operations should be read in conjunction with our financial statements and related notes included elsewhere in this report. This discussion contains forward-looking statements that involve risks, uncertainties and assumptions. See “Cautionary Note Regarding Forward-Looking Statements.” Our actual results could differ materially from those anticipated in the forward-looking statements as a result of certain factors discussed elsewhere in this report.
OverviewBusiness
WeTrade Group, Inc was incorporated in the State of Wyoming on March 28, 2019 and2019. We currently pursue two corporate strategies. One business strategy is in the business ofto continue providing technicalsoftware development services, and solutions via its social e-commerce platform. We are committed to providing an international cloud-based intelligence system and independently developed a micro-business cloud intelligence system called the “YCloud.” Our goalother strategy is to provide technicalacquire and auto-billing management services to micro-business online stores in China through big data analytics, machine learning mechanisms, social network recommendations, and multi-channel data analysis.hold bitcoin.
Software development
We provide technologyAI-enabled software development services to both individualour customers, which included developing, designing, and implementing various SAAS software solutions for businesses of all types, including industrial and other businesses.
| 18 |
Bitcoin Acquisition Strategy
Our bitcoin acquisition strategy generally involves acquiring bitcoin with our liquid assets that exceed working capital requirements, and from time to time, subject to market conditions, issuing debt or equity securities or engaging in other capital raising transactions with the objective of using the proceeds to purchase bitcoin.
We view our bitcoin holdings as long-term holdings and expect to continue to accumulate bitcoin. We have not set any specific target for the amount of bitcoin we seek to hold, and we will continue to monitor market conditions in determining whether to engage in additional financings to purchase additional bitcoin.
This overall strategy also contemplates that we may (i) periodically sell bitcoin for general corporate users. which then provide “YCloud” servicespurposes, including to individualgenerate cash for treasury management or in connection with strategies that generate tax benefits in accordance with applicable law, (ii) enter into additional capital raising transactions that are collateralized by our bitcoin holdings, and corporate micro-business owners(iii) consider pursuing additional strategies to create income streams or otherwise generate funds using our bitcoin holdings.
We believe that, due to its limited supply, bitcoin offers the opportunity for appreciation in value if its adoption increases and has the potential to serve as a hedge against inflation in the hotel, hospitality, livestreaming and travel industries.long-term.
The market individual micro-business owners represent a potential of 330 million users by the year of 2023. (Source: iResrarch. http://xueqiu.com/8455183447/172404679?sharetime=2,2/22/2021). YCloud serves corporate users in multiple industries, including Yuetao Group, Zhiding, Lvyue, Yuebei, Yuedian, Coke GO, and Zhongyanshangyue. We conduct business operations in mainland China and have established trial operations in Hong Kong. We expect to utilize the YCloud system to establish a global strategic cooperation with various social media platforms.
| 19 |
The main functions
Results of the YCloud system are to manage users’ marketing relationships, CPS commission profit management, multi-channel data statistics, AI fission and management, and improved supply chain systems.Operations
Currently, YCloud serves the micro business industry. We will further expand the application of YCloud to tourism, hospitality, livestreaming and short video, medical beauty and traditional retail industries.
Results of Operations
Results of Operations for the nineNine months period endedEnded September 30, 20222023 and 20212022
The following tables provide a comparison of a summary of our results of operations for the nine months period ended September 30, 20222023 and 2021.2022.
|
| For the nine months ended September 30, |
| |||||
|
| 2022 |
|
| 2021 |
| ||
Revenue: |
|
|
|
|
|
| ||
Service revenue- related party |
| $ | 689,039 |
|
| $ | 3,415,090 |
|
Service revenue- non related party |
|
| 8,508,642 |
|
|
| 7,487,401 |
|
|
|
| 9,197,681 |
|
|
| 11,262,491 |
|
Cost of Sales |
|
| (7,670,837 | ) |
|
| (2,441,883 | ) |
Gross Profit |
|
| 1,526,844 |
|
|
| 8,820,608 |
|
Operating Expenses: |
|
|
|
|
|
|
|
|
General and Administrative |
|
| (10,419,873 | ) |
|
| (4,695,727 | ) |
Operations Profit/ (loss) |
|
| (8,893,029 | ) |
|
| 4,124,881 |
|
Other revenue |
|
| 308,360 |
|
|
| 258,501 |
|
Net Profit/ (loss) before income tax |
|
| (8,584,669 | ) |
|
| 4,383,382 |
|
Income tax income/ (expense) |
|
| 45,795 |
|
|
| (478,997 | ) |
Net income |
|
| (8,538,874 | ) |
|
| 3,904,385 |
|
| For the period September 30, 2023 | From the period September 30, 2022 | |||||||
| Revenue: | ||||||||
| Service revenue- related parties | $ | 36,096 | $ | 689,039 | ||||
| Service revenue- non related parties | 2,193,903 | 8,508,642 | ||||||
| 2,238,029 | 9,197,681 | |||||||
| Cost of Revenue | (1,391,665 | ) | (7,670,836 | ) | ||||
| Gross profit | 838,334 | 1,526,845 | ||||||
| Operating Expenses: | ||||||||
| Impairment losses on digital assets | 2,591,490 | — | ||||||
| General and Administrative | 12,537,426 | (10,419,873 | ) | |||||
| Operation loss | (15,128,916 | ) | (8,893,028 | |||||
| Other (expenses) /income | 4,867,137 | 308,360 | ||||||
| Net loss before income tax | (9,423,445 | ) | (8,584,668 | ) | ||||
| Income tax expense | (31,859 | ) | 45,795 | |||||
| Net loss | (9,455,304 | ) | (8,538,873 | ) | ||||
Revenue from Operations
For the nine-month period ended September 30, 20222023 and 2021,2022, total revenue was $9,197,681$2,238,029 and $11,262,491$9,197,681 respectively, the decrease was mainly due to the decrease in Gross Merchandise Volume (“GMV”) in YCloud system as a result of Covid-19 lockdownthe adjusting of Company business plan in several major cities in PRC since March 2022. The system services fees are collected2023. There were no income generated from five customers of YCloud system based onin Q2 2023 and Q3 2023, however the GMV as follows:decrease is offset by the increase in revenue of AI SAAS business $1.6 million in Q3 2023.
Gross Merchandise Volume (“GMV”) |
| September 30, 2022 |
|
| September 30, 2021 |
| ||
|
| US$ |
|
| US$ |
| ||
Non-related parties: |
|
|
|
|
|
| ||
Customer I |
|
| 103,494,844 |
|
|
| 235,556,440 |
|
Customer II |
|
| 58,671,875 |
|
|
| - |
|
Customer III |
|
| 42,276,493 |
|
|
| - |
|
Customer IV |
|
| 53,247,096 |
|
|
| - |
|
|
|
| 257,690,308 |
|
|
| 235,556,440 |
|
Related party: |
|
|
|
|
|
|
|
|
Customer V |
|
| 20,868,043 |
|
|
| 102,528,696 |
|
Total GMV: |
|
| 278,558,351 |
|
|
| 338,085,136 |
|
| 20 |
Cost of revenue
Cost of revenue is mainly consistingconsists of staff payroll, PRC central provident fund (“CPF”), staff benefits, system development costs and YCloudoutsourcing staff cost for system relateddevelopment, the decrease is in line with the decrease in revenue during the period.
General and Administrative Expenses
For the nine months period ended September 30, 2023 and 2022, general and administrative expenses thewere $15,128,916 and $10,419,873 respectively. The increase is mainly due to more technical services cost were incurred for theincrease in system developments for the new customer and more YCloud system relateddevelopment expenses were incurred during the period.
General and Administrative Expenses
For the nine month period ended September 30, 2022 and 2021, general and administrative expenses were $10,419,873 and $4,695,727 respectively, the increase is mainly due to professional fee, fund raising costs, financial PR and underwriting fees were incurred for the Nasdaq up-listing during the period.
Net Income/ (loss)Loss
As a result of the factors described above, there was a net loss of $8,538,874$9,455,304 and net income of $3,904,385$8,538,873 for the period ended September 30, 2023 and 2022, and 2021, respectively, therespectively. The increase in net loss is mainly due to increase generaldecrease in Gross Merchandise Volume (“GMV”) as a result of the adjusting of Company business plan in 2023 and administrative expenses of approximate $5.7 million, whichno income were mainly incurred for the professional fee, fund raising costs, financial PRgenerated from Y-Cloud system in Q2 2023 and underwriting fees in relation to the Nasdaq up-listing during the period.Q3 2023 respectively.
Results of Operations for the three months period endedEnded September 30, 20222023 and 20212022
The following tables provide a comparison of a summary of our results of operations for the three months period ended September 30, 20222023 and 2021.2022.
|
| For the three months ended September 30, |
| |||||
|
| 2022 |
|
| 2021 |
| ||
Revenue: |
|
|
|
|
|
| ||
Service revenue- related party |
| $ | 400,702 |
|
| $ | 1.743.299 |
|
Service revenue- non related party |
|
| 4,952,046 |
|
|
| 2,855,376 |
|
|
|
| 5,352,748 |
|
|
| 4,598,675 |
|
Cost of revenue |
|
| (6,790,998 | ) |
|
| (2,105,116 | ) |
Gross Profit (loss) |
|
| (1,438,250 | ) |
|
| 2,493,559 |
|
Operating Expenses: |
|
|
|
|
|
|
|
|
General and Administrative |
|
| (7,632,083 | ) |
|
| (1,039,081 | ) |
Operations Profit/ (Loss) |
|
| (9,070,333 | ) |
|
| 1,454,478 |
|
Other revenue |
|
| 232,752 |
|
|
| 59,902 |
|
Net Profit before income tax |
|
| (8,837,581 | ) |
|
| 1,541,380 |
|
Income tax (expense) benefit |
|
| 180,489 |
|
|
| (104,109 | ) |
Net income/ (loss) |
|
| (8,657,092 | ) |
|
| 1,410,271 |
|
| For the period September 30, 2023 | From the period September 30, 2022 | |||||||
| Revenue: | ||||||||
| Service revenue- related parties | $ | — | $ | 400,702 | ||||
| Service revenue- non related parties | 1,633,836 | 5,206,568 | ||||||
| 1,633,836 | 5,607,270 | |||||||
| Cost of Revenue | (398,537 | ) | (6,902,250 | ) | ||||
| Gross Profit/ (Loss) | 1,235,299 | (1,294,980 | ) | |||||
| Operating Expenses: | ||||||||
| Impairment losses on digital assets | 2,591,489 | — | ||||||
| General and Administrative | 11,030,660 | 7,799,979 | ||||||
| Operation Loss | (13,622,149 | ) | (7,799,979 | ) | ||||
| Other income | 3,889,924 | 235,418 | ||||||
| Net Loss before income tax | (8,496,926 | ) | (8,859,541 | ) | ||||
| Income tax expense | 383 | 202,450 | ||||||
| Net Loss | (8,496,543 | ) | (8,657,091 | ) | ||||
Revenue from Operations
For the three-month period ended September 30, 20222023 and 2021,2022, total revenue was $5,352,748$1,633,836 and $4,598,675$5,607,270 respectively, the increasedecrease was mainly due to the Company has changed its business strategy and intends to shift its SAAS services from PRC to overseas market. There were no revenue were generated from Y-Cloud system in Q2 2023 and Q3 2023. The decrease is mitigated by the increase in Gross Merchandise Volume (“GMV”) in YCloud system as a resultrevenue of certain cities in PRC has been recovered from the Covid-19 lockdownour new AI-enabled SAAS business in Q3 2022.2023.
Cost of revenue
Cost of revenueIt is mainly consistingconsists of staff payroll, PRC central provident fund (“CPF”), staff benefits, system development costs and YCloudoutsourcing staff cost for system relateddevelopment, the decrease is in line with the decrease in revenue during the period.
General and Administrative Expenses
For the three months period ended September 30, 2023 and 2022, general and administrative expenses thewere $11,030,660 and $7,799,979 respectively. The increase is mainly due to increase in system maintenance and its relateddevelopment expenses were incurred during the period.
| 21 |
General and Administrative Expenses
For the three-months period ended September 30, 2022 and 2021, general and administrative expenses were $7,632,083 and $1,039,081 respectively, the increase is mainly due to more professional fee, fund raising costs, financial PR and underwriting fees were incurred for the Nasdaq up-listing during the period.
Net Income/ (loss)Loss
As a result of the factors described above, there was a net loss of $8,657,092$8,496,926 and net income of $1,410,271$8,859,541 for the period ended September 30, 2023 and 2022, and 2021, respectively, therespectively. The increase in net loss is mainly due to decrease in Gross Merchandise Volume (“GMV”) as a result of the adjusting of Company business plan in 2023. There were no income were generated from Y-Cloud system in Q2 2023 and Q3 2023 respectively. The decrease in losses were mitigated by the increase general and administrative expensesin revenue of approximate $6.6our new AI-enabled SAAS business of $1.6 million which were mainly incurred for the professional fee, fund raising costs, financial PR and underwriting fees in relation to the Nasdaq up-listing during the period.Q3 2023.
Liquidity and Capital Resources
As of September 30, 2022,2023, we had cash on hand of $20,261,881 as compared to $1,395,025 in prior period.$1,419,807. The increasedecrease is mainly due to issuance of 10,000,000 shares in NASDAQ with the net proceed of $37,057,176company is strategy to acquire and hold BTC during the period. However,There were 833 BTC were acquired for approximately $25 million in cash, at a locked-in price of $30,000 per bitcoin. We view our bitcoin holdings as long-term holdings and expect to continue to accumulate bitcoin. The Company has option to purchase 6000 bitcoin over 12 months at the increase was mitigated by the prepaymentlock-in price of WT Pay system development fee and payment of professional fees in relation to the NASDAQ up-listing. $30,000 per bitcoin.
Operating activities
As of September 30, 2022,2023, our cash used inflow provided by operating activities is $18,447,262$8,530,677 for the period ended September 30, 20222023 as compared to the cash flow provided by operating activities of $18,924,761 in prior period, which decreased by approximately of $10.4 million. The decrease was mainly due to decrease in revenue and decrease in Y-cloud SAAS services fee received from the customers during the period.
Investing activities
As of September 30, 2023, cash used in investing activities is $23,375,159 for the period ended September 30, 2023 as compared to the cash flow used in operatinginvesting activities of $2,451,061 in prior period, which was increased by approximately of $16.1 million. The increase was mainly due to prepayment of WT Pay system and payment of professional fees in relation to the NASDAQ up-listing during the period.
Investing activities
As of September 30, 2022, cash used in investing activities is $816,340 for the period ended September 30, 2022 as compared to the $138,124$846,023 in prior period. The increase was mainly due to additionacquire of leasehold improvement of approximate of $0.65833 BTC for the approximately $25 million in cash during the period.
Financing activities
Cash provided by our financing activities was $39,050,371$12,998,841 for the period ended September 30, 20222023 as compared to cash used inprovided by financing activities of $357,770. The increase is mainly due$37,865,508. There were only share placement of approximately $12.6 million as compare to the 10,000,000 share issuance with the net proceeds from salesplacement of common stock$37.5 million in the amount of $37,057,176 during theprior period.
Inflation
Inflation does not materially affect our business or the results of our operations.
Off-Balance Sheet Arrangements
We do not have any off-balance sheet arrangements.
Critical Accounting Policies
We prepare our financial statements in accordance with generally accepted accounting principles of the United States (“GAAP”). GAAP represents a comprehensive set of accounting and disclosure rules and requirements. The preparation of our financial statements requires management to make estimates and assumptions that affect the reported amounts of assets and liabilities, the disclosure of contingent assets and liabilities at the date of the financial statements, and the reported amounts of revenues and expenses during the reporting period. Our actual results could differ from those estimates. We use historical data to assist in the forecast of our future results. Deviations from our projections are addressed when our financials are reviewed on a monthly basis. This allows us to be proactive in our approach to managing our business. It also allows us to rely on proven data rather than having to make assumptions regarding our estimates.
Recent Accounting Pronouncements
We have reviewed all the recently issued, but not yet effective, accounting pronouncements and we do not believe any of these pronouncements will have a material impact on the Company financial statements.
ITEM 3. QUANTITATIVE AND QUALITATIVE DISCLOSURES ABOUT MARKET RISK
We are a “smaller reporting company” as defined by Item 10(f)(1) of Regulation S-K, and as such are not required to provide the information contained in this item pursuant to Item 305 of Regulation S-K.
ITEM 4. CONTROLS AND PROCEDURES
Disclosure Controls and ProceduresProcedures.
The management of the Company is responsible for establishing and maintaining adequate internal control over financial reporting. The Company’s internal control over financial reporting is a process designed under the supervision of the Company’s Chief Executive Officer and Chief Financial Officer to provide reasonable assurance regarding the reliability of financial reporting and the preparation of the Company’s financial statements for external purposes in accordance with U.S. generally accepted accounting principles.
With respect to the period ended September 30, 2022,2023, under the supervision and with the participation of our management, we conducted an evaluation of the effectiveness of the design and operations of our disclosure controls and procedures, as defined in Rules 13a-15(e) and 15d-15(e) promulgated under the Securities Exchange Act of 1934.
Based upon our evaluation regarding the period ended September 30, 2022,2023, the Company’s management, including its Principal Executive Officer, has concluded that its disclosure controls and procedures were not effective due to the Company’s limited internal resources and lack of ability to have multiple levels of transaction review. Material weaknesses noted are lack of an audit committee, lack of a majority of outside directors on the board of directors, resulting in ineffective oversight in the establishment and monitoring of required internal controls and procedures; and management is dominated by two individuals, without adequate compensating controls. However, management believes the financial statements and other information presented herewith are materially correct.
Our management assessed the effectiveness of our internal control over financial reporting as of September 30, 2022.2023. In making this assessment, our management used the criteria set forth by the Committee of Sponsoring Organizations of the Treadway Commission (“COSO”) in Internal Control - Integrated Framework - Guidance for Smaller Public Companies (the COSO criteria). Based on our assessment, management identified material weaknesses related to: (i) our internal audit functions; (ii) a lack of segregation of duties within accounting functions; and the lack of multiple levels of review of our accounting data. Based on this evaluation, our management concluded that as of September 30, 2022,2023, we did not maintain effective internal control over financial reporting.
Because of its inherent limitations, internal control over financial reporting may not prevent or detect misstatements. Projections of any evaluation of effectiveness to future periods are subject to the risk that controls may become inadequate because of changes in conditions, or that the degree of compliance with any policies and procedures may deteriorate. Due to our size and nature, segregation of all conflicting duties may not always be possible and may not be economically feasible. To the extent possible, we will implement procedures to assure that the initiation of transactions, the custody of assets and the recording of transactions will be performed by separate individuals. With proper funding we plan on remediating the significant deficiencies identified above, and we will continue to monitor the effectiveness of these steps and make any changes that our management deems appropriate.
A material weakness is a control deficiency (within the meaning of Public Company Accounting Oversight Board Auditing Standard No. 5) or combination of control deficiencies, that results in a reasonable possibility that a material misstatement of the annual or interim financial statements will not be prevented or detected on a timely basis.
Changes in Internal Control over Financial Reporting
There were no changes in our internal control over financial reporting that occurred during our most recently completed fiscal quarter that has materially affected, or are reasonably likely to materially affect, our internal control over financial reporting.
PART II – OTHER INFORMATION
ITEM 1. LEGAL PROCEEDINGS
None.
ITEM 1A. RISK FACTORS
We are a “smaller reporting company” as defined by Item 10(f)(1) of Regulation S-K, and as such are not required to provide the information contained in this item.
ITEM 2. UNREGISTERED SALES OF EQUITY SECURITIES AND USE OF PROCEEDS
On July 22, 2022, the Company issued 25,000 shares of its common stock to certain service providers for services in connection with the public offering. The fair value of the share was $477,500. The issuance was exempt from registration in reliance on Section 4(a)(2) under the Securities Act of 1933, as amended (the “Securities Act”). None.
ITEM 3. DEFAULTS UPON SENIOR SECURITIES
No senior securities were issued and outstanding during the threenine months ended September 30, 2022.2023.
ITEM 4. MINE SAFETY DISCLOSURES
Not applicable to our Company.
ITEM 5. OTHER INFORMATION
None.On June 9, 2023, the Wyoming Secretary of State approved the Company’s certificate of amendment to amend its Articles of Incorporation to effect 1 for 185 Reverse Stock Split. The total issued and outstanding shares of the Company’s common stock decreased from 195,057,503 to 1,054,364 shares, with the par value unchanged at zero.
The Reverse Stock Split is intended to more expediently enable the Company to regain compliance to achieve a minimum bid price of $1.00 per share for continued listing on Nasdaq, as set forth in Nasdaq Listing Rule 5550(a)(2) (the “Minimum Bid Requirement”). As a result of the Reverse Stock Split, every one-for-one hundred and eighty-five (185) shares of the Company’s Common Stock then issued and outstanding will automatically, and without any action of the Company or any holder thereof, be combined, converted, and changed into one (1) validly issued and non-assessable share of Common Stock. No fractional shares will be issued to any shareholder, and in lieu of issuing any such fractional shares, the fractional shares resulting from the Reverse Stock Split will be rounded up to the nearest whole share of Common Stock.
In September, 2023, there are 1,570,600 shares issued with the total amount of $12,616,454, the Company’s common stock issued has been increased to 2,625,130 shares as of September 30, 2023.
| 24 |
ITEM 6. EXHIBITS
| Exhibit No. | Description | |
ITEM 6. EXHIBITS
|
| |
101 | Financial statements from the quarterly report on Form 10-Q of Wetrade Group Inc for the fiscal quarter ended September 30, |
| 25 |
SIGNATURES
Pursuant to the requirements of the Securities Exchange Act of 1934, the registrant has duly caused this report to be signed on its behalf by the undersigned, thereunto duly authorized.
WETRADE GROUP INC | |||
|
|
| |
| |||
| |||
| |||
| |||
|
| By: | /s/ Wei Hechun | |
| Wei HeChun | ||
| Chief Executive Officer |
| /s/ Annie Huang | ||
| Annie Huang | ||
| Chief Financial Officer |
| 26 |