| September 30, 2019 | December 31, 2018 | ||||||||||||||||||||||
| Asset Category | Gross Carrying Value | Accumulated Amortization | Net Carrying Value | Gross Carrying Value | Accumulated Amortization | Net Carrying Value | |||||||||||||||||
| Customer relationships | $ | 16,200 | $ | 15,750 | $ | 450 | $ | 16,200 | $ | 11,700 | $ | 4,500 | |||||||||||
| Merchant relationships | 20,913 | 7,047 | 13,866 | 21,554 | 4,105 | 17,449 | |||||||||||||||||
| Trade names | 9,394 | 7,199 | 2,195 | 9,476 | 6,799 | 2,677 | |||||||||||||||||
| Developed technology | 14,882 | 13,659 | 1,223 | 13,825 | 13,485 | 340 | |||||||||||||||||
| Patents | 22,383 | 17,690 | 4,693 | 20,508 | 16,451 | 4,057 | |||||||||||||||||
| Other intangible assets | 26,072 | 12,002 | 14,070 | 26,007 | 9,629 | 16,378 | |||||||||||||||||
| Total | $ | 109,844 | $ | 73,347 | $ | 36,497 | $ | 107,570 | $ | 62,169 | $ | 45,401 | |||||||||||
13
GROUPON, INC.
NOTES TO CONDENSED CONSOLIDATED FINANCIAL STATEMENTS (Continued)
(unaudited)
The assets that we deemed impaired were written down to fair value based on the discounted cash flow method that uses Level 3 inputs. The significant estimates used in the discounted cash flow models are the risk-adjusted discount rates; forecasted revenue, cost of revenue and operating expenses; forecasted capital expenditures and working capital needs; weighted average cost of capital; rates of long-term growth; and income tax rates.
Impairment charges are presented within the following line items of the condensed consolidated statements of operations for the three and nine months ended September 30, 2020 (in thousands):
| Three Months Ended September 30, 2020 | Nine Months Ended September 30, 2020 | ||||||||||
| Long-lived asset impairment | $ | 0 | $ | 22,351 | |||||||
| Restructuring and related charges | 3,296 | 17,199 | |||||||||
| Total impairment | $ | 3,296 | $ | 39,550 | |||||||
The following table summarizes impairment for long-lived assets and restructuring and related charges by asset type through September 30, 2020 (in thousands):
| Long-Lived Asset Category | Impairment | ||||
| Property, equipment and software, net | |||||
| Furniture and fixtures | $ | 413 | |||
Leasehold improvements (1) | 7,749 | ||||
| Office equipment | 198 | ||||
| Purchased software | 14 | ||||
| Computer hardware | 2,842 | ||||
| Right-of-use assets - finance leases, net | 1,388 | ||||
| Capitalized software | 304 | ||||
| Internally-developed software | 2,988 | ||||
| Total Property, equipment and software, net | $ | 15,896 | |||
Right-of-use assets - operating leases, net (2) | 22,680 | ||||
| Intangible assets, net | 103 | ||||
| Other non-current assets | 871 | ||||
| Total long-lived assets | $ | 39,550 | |||
(1)Includes long-lived asset impairment of $5.0 million presented within Restructuring and related charges during the nine months ended September 30, 2020. See Note 9, Restructuring and Related Charges, for more information.
(2)Includes right-of-use asset impairment of $12.2 million during the nine months ended September 30, 2020. See Note 9, Restructuring and Related Charges, for more information.
The following table summarizes intangible assets as of September 30, 2020 and December 31, 2019 (in thousands):
| September 30, 2020 | December 31, 2019 | ||||||||||||||||||||||||||||||||||
| Intangible Asset Category | Gross Carrying Value | Accumulated Amortization | Net Carrying Value | Gross Carrying Value | Accumulated Amortization | Net Carrying Value | |||||||||||||||||||||||||||||
| Customer relationships | $ | 16,200 | $ | 16,200 | $ | 0 | $ | 16,200 | $ | 16,200 | $ | 0 | |||||||||||||||||||||||
| Merchant relationships | 21,668 | 10,557 | 11,111 | 22,193 | 8,268 | 13,925 | |||||||||||||||||||||||||||||
| Trade names | 9,491 | 7,771 | 1,720 | 9,558 | 7,369 | 2,189 | |||||||||||||||||||||||||||||
| Developed technology | 2,319 | 1,906 | 413 | 3,651 | 2,685 | 966 | |||||||||||||||||||||||||||||
| Patents | 25,809 | 19,850 | 5,959 | 23,021 | 18,167 | 4,854 | |||||||||||||||||||||||||||||
| Other intangible assets | 26,736 | 14,974 | 11,762 | 26,115 | 12,757 | 13,358 | |||||||||||||||||||||||||||||
| Total | $ | 102,223 | $ | 71,258 | $ | 30,965 | $ | 100,738 | $ | 65,446 | $ | 35,292 | |||||||||||||||||||||||
14
GROUPON, INC.
NOTES TO CONDENSED CONSOLIDATED FINANCIAL STATEMENTS (Continued)
(unaudited)
Amortization of intangible assets is computed using the straight-line method over their estimated useful lives, which range from 1 to 10 years. Amortization expense related to intangible assets was $3.7$2.5 million and $3.9$3.7 million for the three months ended September 30, 2020 and 2019 and 2018,$7.4 million and $11.4 million and $10.3 million for the nine months ended September 30, 20192020 and 2018.2019. As of September 30, 2019,2020, estimated future amortization expense related to intangible assets is as follows (in thousands):
| Remaining amounts in 2019 | $ | 2,843 | |
| 2020 | 8,445 | ||
| 2021 | 7,336 | ||
| 2022 | 6,750 | ||
| 2023 | 5,613 | ||
| Thereafter | 5,510 | ||
| Total | $ | 36,497 | |
| Remaining amounts in 2020 | $ | 2,312 | |||
| 2021 | 8,173 | ||||
| 2022 | 7,577 | ||||
| 2023 | 6,426 | ||||
| 2024 | 2,840 | ||||
| Thereafter | 3,637 | ||||
| Total | $ | 30,965 | |||
3. INVESTMENTS
The following table summarizes investments as of September 30, 20192020 and December 31, 20182019 (dollars in thousands):
| September 30, 2019 | Percent Ownership of Voting Stock | December 31, 2018 | Percent Ownership of Voting Stock | ||||||||||||
| Available-for-sale securities - redeemable preferred shares | $ | 10,138 | 19% | to | 25% | $ | 10,340 | 19% | to | 25% | |||||
| Fair value option investments | 4,931 | 10% | to | 19% | 73,902 | 10% | to | 19% | |||||||
| Other equity investments | 23,055 | 1% | to | 19% | 24,273 | 1% | to | 19% | |||||||
| Total investments | $ | 38,124 | $ | 108,515 | |||||||||||
| September 30, 2019 | December 31, 2018 | ||||||
| Amortized cost | $ | 9,961 | $ | 9,961 | |||
| Gross unrealized gain (loss) | 177 | 379 | |||||
| Fair value | $ | 10,138 | $ | 10,340 | |||
| September 30, 2020 | Percent Ownership of Voting Stock | December 31, 2019 | Percent Ownership of Voting Stock | ||||||||||||||||||||||||||||||||
| Available-for-sale securities - redeemable preferred shares | $ | 0 | 19% | to | 25% | $ | 0 | 19% | to | 25% | |||||||||||||||||||||||||
| Fair value option investments | 0 | 10% | to | 19% | 1,405 | 10% | to | 19% | |||||||||||||||||||||||||||
| Other equity investments | 35,911 | 1% | to | 19% | 75,171 | 1% | to | 19% | |||||||||||||||||||||||||||
| Total investments | $ | 35,911 | $ | 76,576 | |||||||||||||||||||||||||||||||
Fair Value Option Investments
In connection with the dispositions of controlling stakes in TMON Inc. ("TMON"), an entity based in the Republic of Korea in May 2015 and Groupon India in August 2015,prior periods, we obtained minority investments in Monster Holdings LP ("Monster LP") and in Nearbuy Pte Ltd. ("Nearbuy"), respectively.. We have made an irrevocable election to account for both of those investments at fair value with changes in fair value reported in earnings. We elected to apply fair value accounting to those investments because we believe that fair value is the most relevant measurement attribute for those investments, andas well as to reduce operational and accounting complexity. Our election to apply fair value accounting to those investments has and may continue to cause fluctuations in our earnings from period to period.
| Nine Months Ended September 30, | |||||||||||
| 2020 | 2019 | ||||||||||
| Monster LP | $ | 0 | $ | (69,408) | |||||||
| Nearbuy | (1,405) | 437 | |||||||||
| Total | $ | (1,405) | $ | (68,971) | |||||||
We determined that the fair value of our investment in Nearbuy was $0.0 million as of September 30, 2020 and $1.4 million as of December 31, 2019. During the first quarter 2020, we recognized a $1.4 million loss from changes in the fair value of our investment in Nearbuy due to revised cash flow projections and an increase in the discount rate applied to those forecasts, which increased to 30% as of March 31, 2020, as compared with 20% as of December 31, 2019. The revisions to the financial projections and the increase in the discount rate applied as of March 31, 2020 were due to the deterioration in the financial condition of Nearbuy as a result of COVID-19, which resulted in underperformance as compared with prior projections and an increase to financial projection risk.
| Three Months Ended September 30, | Nine Months Ended September 30, | ||||||||||||||
| 2019 | 2018 | 2019 | 2018 | ||||||||||||
| Monster LP | $ | — | $ | (474 | ) | $ | (69,408 | ) | $ | (8,759 | ) | ||||
| Nearbuy | 14 | 230 | 437 | 447 | |||||||||||
| Total | $ | 14 | $ | (244 | ) | $ | (68,971 | ) | $ | (8,312 | ) | ||||
15
GROUPON, INC.
NOTES TO CONDENSED CONSOLIDATED FINANCIAL STATEMENTS (Continued)
(unaudited)
We determined that the fair value of our investment in Monster LP was $0.0 million as of September 30, 2020 and December 31, 2019. During the first quarter 2019, we recognized a $41.5 million loss from changes in the fair value of our investment in Monster LP due to the revised cash flow projections provided by TMON in March 2019 and an increase in the discount rate applied to those forecasts, which increased to 26.0% as of March 31, 2019, as compared with 21.0% as of December 31, 2018. The increase in the discount rate applied as of March 31, 2019 was due to the deterioration in the financial condition of TMON and the competitive environment in the Korean e-commerce industry, which resulted in an increase to financial projection risk. During the second quarter 2019, we recognized an additional loss of $27.9 million from changes in the fair value of our investment in Monster LP due to revised financial projections provided by TMON in June 2019. The revisions to the financial projections were made as a result of TMON’s continued underperformance as compared with prior projections along with adjustments to their business model.
| Three Months Ended September 30, | Nine Months Ended September 30, | ||||||||||||||
| 2019 | 2018 | 2019 | 2018 | ||||||||||||
| Revenue | $ | 131,188 | $ | 93,625 | $ | 383,204 | $ | 265,009 | |||||||
| Gross profit | 9,854 | 6,344 | 27,261 | 20,155 | |||||||||||
| Loss before income taxes | (28,980 | ) | (32,162 | ) | (89,304 | ) | (101,029 | ) | |||||||
| Net loss | (28,980 | ) | (32,162 | ) | (89,304 | ) | (101,029 | ) | |||||||
Other Equity Investments
Other equity investments representsrepresent equity investments without readily determinable fair values. We have elected to record equity investments without readily determinable fair values recorded at cost adjusted for observable price changes and impairments. WeDuring the first quarter 2020, we sold 50% of our shares in an other equity investment for total cash consideration of $34.0 million, which approximated cost adjusted for observable price changes as of December 31, 2019.
In addition, we recorded $4.7a $6.7 million of impairments ofimpairment during the first quarter 2020 to an other equity method investments forinvestment as a result of revised cash flow projections and a deterioration in financial condition due to COVID-19. We did not recognize any other impairments during the nine months ended September 30, 2018. Those impairments are classified within Other income (expense), net on the condensed consolidated statements of operations. There were no other adjustments for observable price changes related to these investments since our adoption of ASU 2016-01, Financial Instruments (Topic 825-10) - Recognition and Measurement of Financial Assets and Financial Liabilities, on January 1, 2018.2020.
4. SUPPLEMENTAL CONDENSED CONSOLIDATED BALANCE SHEETS AND STATEMENTS OF OPERATIONS INFORMATION
The following table summarizes other income (expense), net for the three and nine months ended September 30, 20192020 and 20182019 (in thousands):
| Three Months Ended September 30, | Nine Months Ended September 30, | ||||||||||||||
| 2019 | 2018 | 2019 | 2018 | ||||||||||||
| Interest income | $ | 1,959 | $ | 1,513 | $ | 5,810 | $ | 4,858 | |||||||
| Interest expense | (6,029 | ) | (5,713 | ) | (17,162 | ) | (16,434 | ) | |||||||
| Changes in fair value of investments | 14 | (244 | ) | (68,971 | ) | (8,312 | ) | ||||||||
| Foreign currency gains (losses), net | (12,785 | ) | (1,033 | ) | (11,855 | ) | (12,168 | ) | |||||||
| Impairments of investments | — | (112 | ) | — | (10,156 | ) | |||||||||
| Other | (412 | ) | 729 | (424 | ) | 2,380 | |||||||||
| Other income (expense), net | $ | (17,253 | ) | $ | (4,860 | ) | $ | (92,602 | ) | $ | (39,832 | ) | |||
| Three Months Ended September 30, | Nine Months Ended September 30, | ||||||||||||||||||||||
| 2020 | 2019 | 2020 | 2019 | ||||||||||||||||||||
| Interest income | $ | 1,268 | $ | 1,959 | $ | 5,254 | $ | 5,810 | |||||||||||||||
| Interest expense | (9,408) | (6,029) | (24,375) | (17,162) | |||||||||||||||||||
| Changes in fair value of investments | 0 | 14 | (1,405) | (68,971) | |||||||||||||||||||
| Foreign currency gains (losses), net | 7,273 | (13,197) | 5,661 | (12,279) | |||||||||||||||||||
| Impairment of investment | 0 | 0 | (6,684) | 0 | |||||||||||||||||||
| Other income (expense), net | $ | (867) | $ | (17,253) | $ | (21,549) | $ | (92,602) | |||||||||||||||
The following table summarizes prepaid expenses and other current assets as of September 30, 20192020 and December 31, 20182019 (in thousands):
| September 30, 2020 | December 31, 2019 | ||||||||||
| Merchandise inventories | $ | 4,944 | $ | 25,426 | |||||||
| Prepaid expenses | 16,069 | 27,077 | |||||||||
| Income taxes receivable | 13,585 | 4,791 | |||||||||
| Other | 17,360 | 24,779 | |||||||||
| Total prepaid expenses and other current assets | $ | 51,958 | $ | 82,073 | |||||||
| September 30, 2019 | December 31, 2018 | ||||||
| Merchandise inventories | $ | 27,422 | $ | 33,739 | |||
| Prepaid expenses | 31,865 | 28,209 | |||||
| Income taxes receivable | 6,875 | 6,717 | |||||
| Other | 15,505 | 19,450 | |||||
| Total prepaid expenses and other current assets | $ | 81,667 | $ | 88,115 | |||
16
| September 30, 2019 | December 31, 2018 | ||||||
| Accrued merchant payables | $ | 308,269 | $ | 371,279 | |||
Accrued supplier payables (1) | 119,908 | 280,502 | |||||
| Total accrued merchant and supplier payables | $ | 428,177 | $ | 651,781 | |||
GROUPON, INC.
NOTES TO CONDENSED CONSOLIDATED FINANCIAL STATEMENTS (Continued)
(unaudited)
| September 30, 2020 | December 31, 2019 | ||||||||||
| Deferred income tax | $ | 4,932 | $ | 4,829 | |||||||
| Debt issue costs, net | 2,342 | 2,156 | |||||||||
| Deferred commissions expense | 4,856 | 10,133 | |||||||||
| Deferred cloud implementation costs | 10,175 | 7,372 | |||||||||
| Other | 3,756 | 4,115 | |||||||||
| Total other non-current assets | $ | 26,061 | $ | 28,605 | |||||||
The following table summarizes accrued merchant and supplier payables as of September 30, 2020 and December 31, 2019 (in thousands):
| September 30, 2020 | December 31, 2019 | ||||||||||
| Accrued merchant payables | $ | 297,018 | $ | 366,573 | |||||||
Accrued supplier payables (1) | 84,838 | 174,367 | |||||||||
| Total accrued merchant and supplier payables | $ | 381,856 | $ | 540,940 | |||||||
(1)Amounts include payables to suppliers of inventories and providers of shipping and fulfillment services.
The following table summarizes accrued expenses and other current liabilities as of September 30, 20192020 and December 31, 20182019 (in thousands):
| September 30, 2020 | December 31, 2019 | |||||||||||||||||
| September 30, 2019 | December 31, 2018 | |||||||||||||||||
| Refunds reserve | $ | 18,083 | $ | 27,957 | ||||||||||||||
| Refund reserve | Refund reserve | $ | 29,566 | $ | 22,002 | |||||||||||||
| Compensation and benefits | 62,664 | 56,173 | Compensation and benefits | 37,711 | 49,009 | |||||||||||||
| Accrued marketing | 22,450 | 39,094 | Accrued marketing | 10,256 | 41,110 | |||||||||||||
| Restructuring-related liabilities | Restructuring-related liabilities | 19,753 | 0 | |||||||||||||||
| Customer credits | 16,362 | 15,118 | Customer credits | 50,830 | 13,764 | |||||||||||||
| Income taxes payable | 4,337 | 8,987 | Income taxes payable | 1,221 | 5,044 | |||||||||||||
| Deferred revenue | 15,993 | 25,452 | Deferred revenue | 10,635 | 17,951 | |||||||||||||
Current portion of lease obligations (1) | 40,399 | 17,207 | ||||||||||||||||
| Operating and finance lease obligations | Operating and finance lease obligations | 38,055 | 40,768 | |||||||||||||||
| Deferred cloud computing contract incentive | Deferred cloud computing contract incentive | 3,000 | 0 | |||||||||||||||
| Other | 58,816 | 77,046 | Other | 56,271 | 70,544 | |||||||||||||
| Total accrued expenses and other current liabilities | $ | 239,104 | $ | 267,034 | Total accrued expenses and other current liabilities | $ | 257,298 | $ | 260,192 | |||||||||
The following table summarizes other non-current liabilities as of September 30, 20192020 and December 31, 20182019 (in thousands):
| September 30, 2020 | December 31, 2019 | ||||||||||
| Contingent income tax liabilities | $ | 28,725 | $ | 30,121 | |||||||
| Finance lease obligations | 1,126 | 5,831 | |||||||||
| Restructuring-related liabilities | 714 | 0 | |||||||||
| Deferred income taxes | 3,832 | 3,903 | |||||||||
Deferred payroll taxes (1) | 5,024 | 0 | |||||||||
| Deferred cloud computing contract incentive | 5,000 | 0 | |||||||||
| Other | 5,675 | 5,132 | |||||||||
| Total other non-current liabilities | $ | 50,096 | $ | 44,987 | |||||||
| September 30, 2019 | December 31, 2018 | ||||||
| Contingent income tax liabilities | $ | 32,440 | $ | 39,858 | |||
Deferred rent (1) | — | 32,186 | |||||
| Deferred income taxes | 4,403 | 6,619 | |||||
| Other | 14,118 | 22,025 | |||||
| Total other non-current liabilities | $ | 50,961 | $ | 100,688 | |||
17
GROUPON, INC.
NOTES TO CONDENSED CONSOLIDATED FINANCIAL STATEMENTS (Continued)
(unaudited)
5. FINANCING ARRANGEMENTS
Convertible Senior Notes
On April 4, 2016, we issued $250.0 million in aggregate principal amount of convertible senior notes (the "Notes") in a private placement to A-G Holdings, L.P. ("AGH"). Michael Angelakis, the chairman and chief executive officer of Atairos Group, Inc. ("Atairos"), joined our Board of Directors (the "Board") in connection with the issuance of the Notes. Atairos controls the voting power of AGH. The net proceeds from this offering were $243.2 million after deducting issuance costs. The Notes bear interest at a rate of 3.25% per annum, payable annually in arrears on April 1 of each year, beginning on April 1, 2017. The Notes will mature on April 1, 2022, subject to earlier conversion or redemption.
Each $1,000 of principal amount of the Notes initially is convertible into 185.18529.25926 shares of common stock, which is equivalent to an initial conversion price of $5.40$108.00 per share, subject to adjustment upon the occurrence of specified events. Upon conversion, we can elect to settle the conversion value in cash, shares of our common stock, or any combination of cash and shares of our common stock. Holders of the Notes may convert their Notes at their option at any time until the close of business on the scheduled trading day immediately preceding the maturity date. In addition, if specified corporate events occur prior to the maturity date, we may be required to increase the conversion rate for holders who elect to convert based on the effective date of such event and the applicable stock price attributable to the event, as set forth in a table contained in the indenture governing the Notes (the "Indenture"). Based on the closing price of the common stock of $2.66$20.40 as of September 30, 2019,2020, the if-converted value of the Notes was less than the principal amount.
With certain exceptions, upon a fundamental change (as defined in the Indenture), the holders of the Notes may require us to repurchase all or a portion of their Notes for cash at a purchase price equal to the principal amount plus accrued and unpaid interest. In addition, we may redeem the Notes, at our option, at a purchase price equal to the principal amount plus accrued and unpaid interest on or after April 1, 2020, if the closing sale price of the common stock exceeds 150% of the then-current conversion price for 20 or more trading days in the 30 consecutive trading-day period preceding the exercise of this redemption right.
The Notes are senior unsecured obligations that rank equal in right of payment to all senior unsecured indebtedness and rank senior in right of payment to any indebtedness that is contractually subordinated to the Notes.
The Indenture includes customary events of default. If an event of default, as defined in the Indenture, occurs and is continuing, the principal amount of the Notes and any accrued and unpaid interest may be declared immediately due and payable. In the case of bankruptcy or insolvency, the principal amount of the Notes and any accrued and unpaid interest would automatically become immediately due and payable.
We have separated the Notes into their liability and equity components in the accompanying condensed consolidated balance sheets. The carrying amount of the liability component was calculated by measuring the fair value of a similar liability that does not have an associated conversion feature. The carrying amount of the equity component, representing the conversion option, was determined by deducting the fair value of the liability component from the principal amount of the Notes. The difference between the principal amount of the Notes and the liability component (the "debt discount") is amortized to interest expense at an effective interest rate of 9.75% over the term of the Notes. The equity component of the Notes is included in additional paid-in capital in the condensed consolidated balance sheets and is not remeasured as long as it continues to meet the conditions for equity classification.
We incurred transaction costs of approximately $6.8 million related to the issuance of the Notes. Those transaction costs were allocated to the liability and equity components in the same manner as the allocation of the proceeds from the Notes. Transaction costs attributable to the liability component of $4.8 million were recorded as a debt discount in the condensed consolidated balance sheet and are being amortized to interest expense over the term of the Notes. Transaction costs attributable to the equity component of $2.0 million were recorded in stockholders' equity as a reduction of the equity component.
The carrying amount of the Notes consisted of the following as of September 30, 20192020 and December 31, 20182019 (in thousands):
| September 30, 2019 | December 31, 2018 | ||||||
| Liability component: | |||||||
| Principal amount | $ | 250,000 | $ | 250,000 | |||
| Less: debt discount | (38,559 | ) | (48,331 | ) | |||
| Net carrying amount of liability component | $ | 211,441 | $ | 201,669 | |||
| Net carrying amount of equity component | $ | 67,014 | $ | 67,014 | |||
| September 30, 2020 | December 31, 2019 | ||||||||||
| Liability component: | |||||||||||
| Principal amount | $ | 250,000 | $ | 250,000 | |||||||
| Less: debt discount | (24,307) | (35,131) | |||||||||
| Net carrying amount of liability component | $ | 225,693 | $ | 214,869 | |||||||
| Net carrying amount of equity component | $ | 67,014 | $ | 67,014 | |||||||
The estimated fair value of the Notes as of September 30, 20192020 and December 31, 20182019 was $259.0$251.8 million and $257.1$262.7 million, and was determined using a lattice model. We classified the fair value of the Notes as a Level 3 measurement due to the lack of observable market data over fair value inputs such as our stock price volatility over the term of the Notes and our cost of debt.
As of September 30, 2019,2020, the remaining term of the Notes is approximately 21 years and 6 months. During the three and nine months ended September 30, 20192020 and 2018,2019, we recognized interest costs on the Notes as follows (in thousands):
| Three Months Ended September 30, | Nine Months Ended September 30, | ||||||||||||||
| 2019 | 2018 | 2019 | 2018 | ||||||||||||
| Contractual interest (3.25% of the principal amount per annum) | $ | 2,032 | $ | 2,032 | $ | 6,096 | $ | 6,096 | |||||||
| Amortization of debt discount | 3,341 | 3,016 | 9,772 | 8,822 | |||||||||||
| Total | $ | 5,373 | $ | 5,048 | $ | 15,868 | $ | 14,918 | |||||||
| Three Months Ended September 30, | Nine Months Ended September 30, | ||||||||||||||||||||||
| 2020 | 2019 | 2020 | 2019 | ||||||||||||||||||||
| Contractual interest (3.25% of the principal amount per annum) | $ | 2,032 | $ | 2,032 | $ | 6,096 | $ | 6,096 | |||||||||||||||
| Amortization of debt discount | 3,701 | 3,341 | 10,824 | 9,772 | |||||||||||||||||||
| Total | $ | 5,733 | $ | 5,373 | $ | 16,920 | $ | 15,868 | |||||||||||||||
Note Hedges and Warrants
In May 2016, we purchased convertible note hedges with respect to our common stock for a cost of $59.1 million from certain bank counterparties. The convertible note hedges provide us with the right to purchase up to 46.32.3 million shares of our common stock at an initial strike price of $5.40$108.00 per share, which corresponds to the initial conversion price of the Notes, and are exercisable upon conversion of the Notes. The convertible note hedges are intended to reduce the potential economic dilution upon conversion of the Notes. The convertible note hedges are separate transactions and are not part of the terms of the Notes. Holders of the Notes do not have any rights with respect to the convertible note hedges.
In May 2016, we also sold warrants for total cash proceeds of $35.5 million to certain bank counterparties. The warrants provide the counterparties with the right to purchase up to 46.32.3 million shares of our common stock at a strike price of $8.50$170.00 per share. The warrants expire on various dates between July 1, 2022 and August 26, 2022 and are exercisable on their expiration dates. The warrants are separate transactions and are not part of the terms of the Notes or convertible note hedges. Holders of the Notes and convertible note hedges do not have any rights with respect to the warrants.
The amounts paid and received for the convertible note hedges and warrants were recorded in additional paid-in capital in the condensed consolidated balance sheets as of September 30, 20192020 and December 31, 2018.2019. The convertible note hedges and warrants are not remeasured as long as they continue to meet the conditions for equity classification. The amounts paid for the convertible note hedges are tax deductible over the term of the Notes, while the proceeds received from the warrants are not taxable.
Under the if-converted method, the shares of common stock underlying the conversion option in the Notes are included in the diluted earnings per share denominator and the interest expense on the Notes, net of tax, is added to the numerator. However, upon conversion, there will be no economic dilution from the Notes, as exercise of the convertible note hedges eliminates any dilution from the Notes that would have otherwise occurred when the price of our common stock exceeds the conversion price. Taken together, the purchase of the
convertible note hedges and sale of warrants are intended to offset any actual dilution from the conversion of the Notes and to effectively increase the overall conversion price from $5.40$108.00 to $8.50$170.00 per share.
Revolving Credit Agreement
In May 2019, we entered into a second amended and restated senior secured revolving credit agreement (the "2019 Credit Agreement") which providesprovided for aggregate principal borrowings of up to $400.0 million (prior to the Amendment described below) and matures in May 2024. The 2019 Credit Agreement replaced our previous $250.0 million amended and restated
On July 17, 2020, we entered into an amendment to the revolving credit agreement (the "2016"Amendment" and the revolving credit agreement as amended, the "Amended Credit Agreement"). in order to provide us with operational flexibility and covenant relief through the end of the first quarter of 2021 (the "Suspension Period") in light of the ongoing impacts of COVID-19 on our business. In addition to the covenant relief described below, the Amendment permanently reduces borrowing capacity under our senior secured revolving credit facility from $400.0 million to $225.0 million.
We deferred debt issuance costs of $2.4$3.2 million related toas a result of entering into the 2019Amended Credit Agreement. Those deferredDeferred debt issuance costs are included within Other non-current assets on the condensed consolidated balance sheet as of September 30, 20192020 and will beare amortized to interest expense over the term of the respective agreement.
In addition, under the Amended Credit Agreement, bearwe are subject to various covenants, including customary restrictive covenants that limit our ability to, among other things: incur additional indebtedness; make dividend and other restricted payments, including limiting the amount of our share repurchases; enter into sale and leaseback transactions; make investments, loans or advances; grant or incur liens on assets; sell assets; engage in mergers, consolidations, liquidations or dissolutions; and engage in transactions with related parties and other affiliates. The Amendment further restricts certain of these negative covenants during the Suspension Period, including our ability to make share repurchases, acquisitions, investments and to incur additional indebtedness and liens.
Non-compliance with the covenants under the Amended Credit Agreement may result in termination of the commitments thereunder and any then outstanding borrowings may be declared due and payable immediately. We have the right to terminate the Amended Credit Agreement or reduce the available commitments at any time.
The Amendment also increases interest at our option,rates through the end of the first quarter of 2021, raising the alternative base rate and Canadian prime spreads to 1.50%, the fixed rate spreads to 2.50% and the commitment fee to 0.4% on the daily amount of the unused commitments under the Amended Credit Agreement. Following the Suspension Period, the applicable spread and commitment fee will revert to pre-Amendment levels, which provides for (a) interest at a rate per annum equal to (a)(i) an adjusted LIBO rate or (b)(ii) a customary base rate (with loans denominated in certain currencies bearing interest at rates specific to such currencies) plus an additional margin ranging between 0.50% and 2.00%. We are required to pay quarterly and (b) commitment fees ranging from 0.25% to 0.35% per annum ofon the average daily amount of unused commitments available under the 2019 Credit Agreement.commitments. The 2019Amended Credit Agreement also provides for the issuance of up to $75.0 million in letters of credit, provided that the sum of outstanding borrowings and letters of credit do not exceed the maximum funding commitment of $400.0$225.0 million.
The 2019Amended Credit Agreement is secured by substantially all of our tangible and intangible assets, including a pledge of 100% of the outstanding capital stock of substantially all of our direct and indirect domestic
subsidiaries and 65% of the shares or equity interests of first-tier foreign subsidiaries and each U.S. entity whose assets substantially consist of capital stock and/or intercompany debt of one or more foreign subsidiaries, subject to certain exceptions. Certain of our domestic and foreign subsidiaries are guarantors under the 2019Amended Credit Agreement.
| September 30, 2019 | |||
| Right-of-use assets - operating leases | $ | 130,757 | |
Right-of-use assets - finance leases (1) | 31,255 | ||
| Total right-of-use assets, gross | 162,012 | ||
| Less: accumulated depreciation and amortization | (29,964 | ) | |
| Right-of-use assets, net | $ | 132,048 | |
| Three Months Ended September 30, 2019 | Nine Months Ended September 30, 2019 | ||||||
| Financing lease cost: | |||||||
| Amortization of right-of-use assets | $ | 3,492 | $ | 16,247 | |||
| Interest on lease liabilities | 243 | 816 | |||||
| Total finance lease cost | 3,735 | 17,063 | |||||
| Operating lease cost | 8,573 | 25,784 | |||||
| Variable lease cost | 2,410 | 6,319 | |||||
| Short-term lease cost | 52 | 262 | |||||
| Sublease income, gross | (1,248 | ) | (3,872 | ) | |||
| Total lease cost | $ | 13,522 | $ | 45,556 | |||
| Finance Leases | Operating Leases | ||||||
| Remaining in 2019 | $ | 2,056 | $ | 10,003 | |||
| 2020 | 9,611 | 36,609 | |||||
| 2021 | 5,261 | 34,416 | |||||
| 2022 | 715 | 33,579 | |||||
| 2023 | 12 | 25,130 | |||||
| Thereafter | — | 33,103 | |||||
| Total minimum lease payments | 17,655 | 172,840 | |||||
| Less: Amount representing interest | (863 | ) | (22,972 | ) | |||
| Present value of net minimum lease payments | 16,792 | 149,868 | |||||
| Less: Current portion of lease obligations | (8,939 | ) | (31,460 | ) | |||
| Total long-term lease obligations | $ | 7,853 | $ | 118,408 | |||
| Subleases | |||
| Remaining in 2019 | $ | 1,246 | |
| 2020 | 5,027 | ||
| 2021 | 5,065 | ||
| 2022 | 5,103 | ||
| 2023 | 4,385 | ||
| Thereafter | 4,891 | ||
| Total future sublease income | $ | 25,717 | |
| Nine Months Ended September 30, 2019 | |||
| Cash paid for amounts included in the measurement of lease liabilities: | |||
| Operating cash flows from finance leases | $ | (816 | ) |
| Operating cash flows from operating leases | (25,121 | ) | |
| Financing cash flows from finance leases | (16,868 | ) | |
| Right-of-use assets obtained in exchange for lease liabilities: | |||
| Finance leases | 3,865 | ||
| Operating leases | 23,123 | ||
Our contractual obligations and commitments and future operating income under our operating subleases as of September 30, 20192020 and through the date of this report, did not materially change from the amounts set forth in our 20182019 Annual Report on Form 10-K, except as disclosed below.
Purchase Obligations
During the nine months ended September 30, 2020, we entered into non-cancellable arrangements for cloud computing services and software. Future payments under these new contractual obligations are as follows (in thousands):
| 2020 | $ | 5,810 | |||
| 2021 | 17,672 | ||||
| 2022 | 17,118 | ||||
2023 (1) | 22,753 | ||||
| Total | $ | 63,353 | |||
(1)Includes $8.0 million in Note 6, Leases.cloud computing arrangement costs for which the timing of settlement is based on usage. We expect to incur those costs over the three-year contract period ending in 2023.
Legal Matters and Other Contingencies
From time to time, we are party to various legal proceedings incident to the operation of our business. For example, we currently are involved in proceedings brought by former employeesmerchants, employment and merchants,related matters, intellectual property infringement suits, customer lawsuits, stockholder claims relating to U.S. securities law, consumer class actions and suits alleging, among other things, violations of state consumer protection or privacy laws.
On April 28, 2020, an individual plaintiff filed a securities fraud class action complaint in the United States District Court for the Northern District of Illinois, and in July 2020, another individual was appointed as lead plaintiff. The lawsuit covers the time period from July 30, 2019 through February 18, 2020. The lead plaintiff alleges that Groupon and certain of its officers made materially false and/or misleading statements or omissions regarding its business, operations and prospects, specifically as it relates to reiterating its full year guidance on November 4, 2019 and the Groupon Select program. We intend to vigorously defend against these allegations, which we believe to be without merit.
In addition, third parties have from time to time claimed, and others may claim in the future, that we have infringed their intellectual property rights. We are subject to intellectual property disputes, including patent infringement claims, and expect that we will continue to be subject to intellectual property infringement claims as our services expand in scope and complexity. In the past, we have litigated such claims, and we are presently involved in several patent infringement and other intellectual property-related claims, including pending litigation or trademark disputes relating to, for example, our Goods category, some of which could involve potentially substantial claims for damages or injunctive relief. We may also become more vulnerable to third-party claims as laws such as the Digital Millennium Copyright Act are interpreted by the courts, and we become subject to laws in jurisdictions where the underlying laws with respect to the potential liability of online intermediaries are either
unclear or less favorable. We believe that additional lawsuits alleging that we have violated patent, copyright or trademark laws willmay be filed against us. Intellectual property claims, whether meritorious or not, are time consuming and often costly to resolve, could require expensive changes in our methods of doing business or the goods we sell, or could require us to enter into costly royalty or licensing agreements.
We also are subject to consumer claims or lawsuits relating to alleged violations of consumer protection or privacy rights and statutes, some of which could involve potentially substantial claims for damages, including statutory or punitive damages. Consumer and privacy related claims or lawsuits, whether meritorious or not, could be time consuming, result in costly litigation, damage awards, fines and penalties, injunctive relief or increased costs of doing business through adverse judgment or settlement, or require us to change our business practices, sometimes in expensive ways.
We are also subject to, or in the future may become subject to, a variety of regulatory inquiries, audits, and investigations across the jurisdictions where we conduct our business, including, for example, inquiries related to consumer protection, employment matters and/or hiring practices, marketing practices, tax, unclaimed property and privacy rules and regulations. Any regulatory actions against us, whether meritorious or not, could be time consuming, result in costly litigation, damage awards, fines and penalties, injunctive relief or increased costs of doing business through adverse judgment or settlement, require us to change our business practices in expensive ways, require significant amounts of management time, result in the diversion of significant operational resources, materially damage our brand or reputation, or otherwise harm our business.
We establish an accrued liability for loss contingencies related to legal and regulatory matters when the loss is both probable and reasonably estimable. Those accruals represent management's best estimate of probable losses and, in such cases, there may be an exposure to loss in excess of the amounts accrued. For certain of the matters described above, there are inherent and significant uncertainties based on, among other factors, the stage of the proceedings, developments in the applicable facts of law, or the lack of a specific damage claim. However, we believe that the amount of reasonably possible losses in excess of the amounts accrued for those matters would not have a material adverse effect on our business, condensed consolidated financial position, results of operations or cash flows. Our accrued liabilities for loss contingencies related to legal and regulatory matters may change in the future as a result of new developments, including, but not limited to, the occurrence of new legal matters, changes in the law or regulatory environment, adverse or favorable rulings, newly discovered facts relevant to the matter, or changes in the strategy for the matter. Regardless of the outcome, litigation and other regulatory matters can have an adverse impact on us because of defense and settlement costs, diversion of management resources and other factors.
Indemnifications
In connection with the disposition of our operations in Latin America in the first quarter of 2017, we recorded $5.4 million in indemnification liabilities for certain tax and other matters upon the closing of the transactions as an adjustment to the net loss on the dispositions within discontinued operations at their fair value. We estimated the indemnification liabilities using a probability-weighted expected cash flow approach. During the first quarter of 2019,2020, we decreased our indemnification liabilities due to the expiration of certain indemnification obligations. The resulting benefit of $2.2$0.4 million is recorded within Income (loss) from discontinued operations on the condensed consolidated statement of operations for the nine months ended September 30, 2019.2020. Our remaining indemnification liabilities were $3.2$2.8 million as of September 30, 2019.2020. We estimate that the total amount of obligations that are reasonably possible to arise under the indemnifications in excess of amounts accrued as of September 30, 20192020 is approximately $13.3$11.7 million.
In the normal course of business to facilitate transactions related to our operations, we indemnify certain parties, including employees, lessors, service providers, merchants, and counterparties to investment agreements and asset and stock purchase agreements with respect to various matters. We have agreed to hold certain parties harmless against losses arising from a breach of representations or covenants, or other claims made against those parties. These agreements may limit the time within which an indemnification claim can be made and the amount of the claim. We are also subject to increased exposure to various claims as a result of our divestitures and acquisitions, particularly in cases where we are entering into new businesses in connection with such acquisitions. We may also become more vulnerable to claims as we expand the range and scope of our services
and are subject to laws in jurisdictions where the underlying laws with respect to potential liability are either unclear or less favorable. In addition, we have entered into indemnification agreements with our officers, directors and underwriters, and our bylaws contain similar indemnification obligations that cover officers, directors, employees and other agents.
Except as noted above, it is not possible to determine the maximum potential amount under these indemnification agreements due to the limited history of prior indemnification claims and the unique facts and circumstances involved in each particular agreement. Historically, any payments that we have made under these agreements have not had a material impact on theour operating results, financial position or cash flows.
Reverse Stock Split
On June 9, 2020, our stockholders approved amendments to our Restated Certificate of Incorporation to effect a reverse stock split of our shares of common stock, and our Board approved a final reverse stock split ratio of 1-for-20 and a corresponding reduction in the number of authorized shares of our common stock. The reverse stock split became effective on June 10, 2020. On the effective date, every 20 shares of issued and outstanding common stock were combined and converted into one issued and outstanding share of common stock. The number of authorized shares of Common Stock was reduced proportionately. Fractional shares were cancelled and stockholders received cash in lieu thereof and the par value per share of common stock remains unchanged. A proportionate adjustment was also made to the maximum number of shares of common stock issuable under the Groupon, Inc. Stock Plans (the "Plans"), and the Groupon, Inc. 2012 Employee Stock Purchase Plan, as amended ("ESPP").
As a result, the number of shares and income (loss) per share disclosed throughout this Quarterly Report on Form 10-Q have been retrospectively adjusted to reflect the reverse stock split.
Common Stock
Pursuant to our restated certificate of incorporation, as of September 30, 2020, the Board hashad the authority to issue up to a total of 2,010,000,000100,500,000 shares of common stock. Each holder of common stock is entitled to one vote per share on any matter that is submitted to a vote of stockholders. In addition, holders of our common stock will vote as a single class of stock on any matter that is submitted to a vote of stockholders.
Share Repurchase Program
In May 2018, the Board authorized us to repurchase up to $300.0 million of our common stock under our share repurchase program. During the three and nine months ended September 30, 2019,2020, we repurchased 5,391,084 and 14,027,227did not purchase any shares for an aggregate purchase price of $15.1 million and $45.2 million (including fees and commissions) under our repurchasethe program. As of September 30, 2019,2020, up to $245.0 million of common stock remained available for purchase under our program. The timing and amount of share repurchases, if any, will be determined based on market conditions, limitations under the 2019Amended Credit Agreement, share price, available cash and other factors, and the share repurchase program may be terminated at any time.
Groupon, Inc. Stock Plans
18
GROUPON, INC.
NOTES TO CONDENSED CONSOLIDATED FINANCIAL STATEMENTS (Continued)
(unaudited)
The stock-based compensation expense related to stock awards issued under the Plans and acquisition-related awards are presented within the following line items of the condensed consolidated statements of operations for the three and nine months ended September 30, 20192020 and 20182019 (in thousands):
| Three Months Ended September 30, | Nine Months Ended September 30, | Three Months Ended September 30, | Nine Months Ended September 30, | |||||||||||||||||||||||||||||||||||
| 2019 | 2018 | 2019 | 2018 | 2020 | 2019 | 2020 | 2019 | |||||||||||||||||||||||||||||||
| Cost of revenue | $ | 405 | $ | 419 | $ | 1,163 | $ | 1,103 | Cost of revenue | $ | 156 | $ | 405 | $ | 496 | $ | 1,163 | |||||||||||||||||||||
| Marketing | 1,671 | 1,854 | 4,586 | 5,411 | Marketing | 377 | 1,671 | 1,218 | 4,586 | |||||||||||||||||||||||||||||
| Selling, general and administrative | 17,467 | 12,753 | 56,768 | 44,056 | Selling, general and administrative | 7,846 | 17,467 | 29,223 | 56,768 | |||||||||||||||||||||||||||||
| Other income (expense), net | — | — | — | 100 | ||||||||||||||||||||||||||||||||||
| Restructuring and related charges | Restructuring and related charges | 311 | 0 | 1,735 | 0 | |||||||||||||||||||||||||||||||||
| Total stock-based compensation expense | $ | 19,543 | $ | 15,026 | $ | 62,517 | $ | 50,670 | Total stock-based compensation expense | $ | 8,690 | $ | 19,543 | $ | 32,672 | $ | 62,517 | |||||||||||||||||||||
We capitalized $2.0$1.1 million and $2.0 million of stock-based compensation for the three months ended September 30, 2020 and 2019, and 2018,$3.4 million and $5.5 million and $5.7$5.5 million for the nine months ended September 30, 20192020 and 20182019 in connection with internally-developed software and cloud computing arrangements.
Employee Stock Purchase Plan
The Groupon, Inc. 2012 Employee Stock Purchase Plan, as amended ("ESPP"),ESPP authorizes us to grant up to 20,000,0001,000,000 shares of common stock under that plan.plan as of September 30, 2020. For the nine months ended September 30, 2020 and 2019, 69,371 and 2018, 1,486,006 and 1,621,06174,300 shares of common stock were issued under the ESPP.
Restricted Stock Units
The restricted stock units granted under the Plans generally have vesting periods between one and four years and are amortized on a straight-line basis over their requisite service period. Additionally, we are required to issue restricted stock units to settle amounts that exceed targeted bonus amounts under our primary bonus plans. We account for those obligations, if any, as liability-classified awards with performance conditions.
The table below summarizes restricted stock unit activity under the Plans for the nine months ended September 30, 2019:2020:
| Restricted Stock Units | Weighted-Average Grant Date Fair Value (per unit) | |||||
| Unvested at December 31, 2018 | 26,623,432 | $ | 4.47 | |||
| Granted | 25,446,060 | 3.52 | ||||
| Vested | (9,773,156 | ) | 4.37 | |||
| Forfeited | (9,511,750 | ) | 4.17 | |||
| Unvested at September 30, 2019 | 32,784,586 | 3.84 | ||||
| Restricted Stock Units | Weighted-Average Grant Date Fair Value (per unit) | ||||||||||
| Unvested at December 31, 2019 | 1,527,014 | $ | 74.80 | ||||||||
| Granted | 1,744,782 | 24.59 | |||||||||
| Vested | (596,183) | 74.86 | |||||||||
| Forfeited | (720,949) | 65.70 | |||||||||
| Unvested at September 30, 2020 | 1,954,664 | 33.41 | |||||||||
As of September 30, 2019, $96.62020, $49.7 million of unrecognized compensation costs related to unvested restricted stock units are expected to be recognized over a remaining weighted-average period of 1.621.09 years.
Performance Share Units
We grant performance share units under the Plans that vest in shares of our common stock upon the achievement of financial and operational targets specified in the respective award agreement ("Performance Share Units"). During the nine months ended September 30, 2019, we also granted performance share units thatsubject to a market condition ("Market-based Performance Share Units").
19
GROUPON, INC.
NOTES TO CONDENSED CONSOLIDATED FINANCIAL STATEMENTS (Continued)
(unaudited)
The Market-based Performance Share Units will vest if our average daily closing stock price is equal to or greater than $6.00$120.00 per share over a period of 30 consecutive trading days prior to December 31, 2022 or if a change in control occurs during the performance period at the specified stock price (and on a proportional basis for a change in control price between the grant date price and the specified stock price) ("Market-based Performance Share Units"). We determined these awards are subject to a market condition, and therefore we used a Monte Carlo simulation to calculate the grant date fair value of the awards and the related derived service period over which we will recognizerecognized the expense. The key inputs used in the Monte Carlo simulation were the risk-free rate, our volatility of 49.8% and our cost of equity of 12.8%. We did 0t recognize any compensation costs related to our Market-based Performance Share Units during the three months ended September 30, 2020 as the derived service period ended during the first quarter 2020, at which time these awards were fully expensed.
The table below summarizes Performance Share Unit activity under the Plans for the nine months ended September 30, 2019:2020:
| Performance Share Units | Weighted-Average Grant Date Fair Value (per unit) | Market-based Performance Share Units | Weighted-Average Grant Date Fair Value (per unit) | ||||||||||
| Unvested at December 31, 2018 | 3,431,918 | $ | 4.90 | — | $ | — | |||||||
| Granted | 4,640,467 | 3.89 | 8,486,708 | 3.03 | |||||||||
| Vested | (777,573 | ) | 4.88 | — | — | ||||||||
| Forfeited | (3,124,591 | ) | 4.64 | (1,666,667 | ) | 3.03 | |||||||
| Unvested at September 30, 2019 | 4,170,221 | 3.98 | 6,820,041 | 3.03 | |||||||||
| Maximum shares issuable upon vesting at September 30, 2019 | 7,980,870 | 6,820,041 | |||||||||||
| Performance Share Units | Weighted-Average Grant Date Fair Value (per unit) | Market-based Performance Share Units | Weighted-Average Grant Date Fair Value (per unit) | ||||||||||||||||||||
| Unvested at December 31, 2019 | 203,853 | $ | 79.76 | 341,002 | $ | 60.60 | |||||||||||||||||
| Granted | 96,598 | 15.44 | 0 | 0 | |||||||||||||||||||
| Vested | (104,441) | 80.77 | 0 | 0 | |||||||||||||||||||
| Forfeited | (71,128) | 79.94 | (91,668) | 60.60 | |||||||||||||||||||
| Unvested at September 30, 2020 | 124,882 | 29.78 | 249,334 | 60.60 | |||||||||||||||||||
| Maximum shares issuable upon vesting at September 30, 2020 | 173,181 | 249,334 | |||||||||||||||||||||
As of September 30, 2019, $8.92020, $1.5 million of unrecognized compensation costs related to unvested performance share unitsPerformance Share Units are expected to be recognized over a remaining weighted-average period of 1.94 years and $8.1 million of unrecognized1.44 years. We have recognized all compensation costs related to our unvested market-based performance share units are expected to be recognized over a remaining weighted-average period of 0.41 years.Market-Based Performance Share Units.
| Options | Weighted-Average Exercise Price | Weighted-Average Remaining Contractual Term (in years) | Aggregate Intrinsic Value (in thousands) (1) | |||||||||
| Outstanding and exercisable at December 31, 2018 | 212,787 | $ | 1.80 | 1.37 | $ | 298 | ||||||
| Exercised | (42,500 | ) | 0.96 | |||||||||
| Forfeited | (2,050 | ) | 1.68 | |||||||||
| Outstanding and exercisable at September 30, 2019 | 168,237 | $ | 1.95 | 0.67 | $ | 119 | ||||||
Refer to Note 13, Segment Information, for revenue summarized by reportable segment and category for the three and nine months ended September 30, 20192020 and 2018.2019.
Contract Balances
A substantial majority of our deferred revenue relates to product sales for which revenue will be recognized as the products are delivered to customers, generally within one week following the balance sheet date. Our deferred revenue was $16.0 million and $25.5$10.6 million as of September 30, 2019 and2020. As of December 31, 2018. The amount2019, our deferred revenue was $18.0 million, all of revenuewhich was recognized forduring the nine months ended September 30, 20192020.
Customer Credits
We issue credits to customers that was included in the deferred revenue balance at the beginning of the period was $25.0 million.
20
GROUPON, INC.
NOTES TO CONDENSED CONSOLIDATED FINANCIAL STATEMENTS (Continued)
(unaudited)
relationship purposes. The following table summarizes the activity in the liability for customer credits for the nine months ended September 30, 20192020 (in thousands):
| Customer Credits | |||
| Balance as of December 31, 2018 | $ | 15,118 | |
| Credits issued | 85,053 | ||
Credits redeemed (1) | (74,974 | ) | |
| Breakage revenue recognized | (8,617 | ) | |
| Foreign currency translation | (218 | ) | |
| Balance as of September 30, 2019 | $ | 16,362 | |
| Customer | |||||
| Balance as of December 31, 2019 | $ | 13,764 | |||
| Credits issued | 153,638 | ||||
Credits redeemed | (102,373) | ||||
| Breakage revenue | (15,055) | ||||
| Foreign currency translation | 856 | ||||
| Balance as | $ | 50,830 | |||
(1)Customer credits can be redeemed through our online marketplaces for goods or services provided by a third-party merchant or for merchandise inventory sold by us. When customer credits are redeemed for goods or services provided by a third-party merchant, service revenue is recognized on a net basis as the difference between the carrying amount of the customer credit liability derecognized and the amount due to the merchant for the related transaction. When customer credits are redeemed for merchandise inventory sold by us, product revenue is recognized on a gross basis equal to the amount of the customer credit liability derecognized. Customer credits are primarily used within one year of issuance.
Costs of Obtaining Contracts
Incremental costs to obtain contracts with third-party merchants, such as sales commissions, are deferred and recognized over the expected period of the merchant arrangement, generally from 12 to 18 months. Deferred contract acquisition costs are presented within the following line items of the condensed consolidated balance sheets as of September 30, 20192020 and December 31, 20182019 (in thousands):
| September 30, 2019 | December 31, 2018 | ||||||
| Prepaid expenses and other current assets | $ | 2,185 | $ | 2,923 | |||
| Other non-current assets | 10,449 | 11,285 | |||||
| September 30, 2020 | December 31, 2019 | ||||||||||
| Prepaid expenses and other current assets | $ | 1,132 | $ | 2,501 | |||||||
| Other non-current assets | 4,856 | 10,133 | |||||||||
The amortization of deferred contract acquisition costs is classified within Selling, general and administrative expense in the condensed consolidated statements of operations. We amortized $3.6 million and $5.0 million of deferred contract acquisition costs during the three months ended September 30, 2020 and 2019, and $12.3 million and $15.5 million during the nine months ended September 30, 2020 and 2019. We did not recognize any impairment lossesimpairments in relation to the deferred costs. Duringcontract acquisition costs during the three and nine months ended September 30, 20192020 and 2018, amortization expense related to deferred contract acquisition costs is as follows2019.
Allowance for Expected Credit Losses on Accounts Receivable
We establish an allowance for expected credit losses on accounts receivables based on identifying the following customer risk characteristics: size, type of customer, and payment terms offered in the normal course of business. Receivables with similar risk characteristics are grouped into pools. For each pool, we consider the historical credit loss experience, current economic conditions, bankruptcy filings, published or estimated credit default rates, age of the receivable and any recoveries in assessing the lifetime expected credit losses.
The following table summarizes the activity in the allowance for expected credit losses on accounts receivables for the nine months ended September 30, 2020 (in thousands):
| Allowance for Expected Credit Losses | |||||
| Balance as of January 1, 2020 | $ | 3,693 | |||
| Change in Provision | 8,683 | ||||
| Write-offs | (2,330) | ||||
| Foreign currency translation | 187 | ||||
| Balance as of September 30, 2020 | $ | 10,233 | |||
| Three Months Ended September 30, | Nine Months Ended September 30, | ||||||||||||||
| 2019 | 2018 | 2019 | 2018 | ||||||||||||
| Amortization of deferred contract acquisition costs | $ | 5,010 | $ | 6,151 | $ | 15,549 | $ | 19,450 | |||||||
21
GROUPON, INC.
NOTES TO CONDENSED CONSOLIDATED FINANCIAL STATEMENTS (Continued)
(unaudited)
Variable Consideration for Unredeemed Vouchers
22
GROUPON, INC.
NOTES TO CONDENSED CONSOLIDATED FINANCIAL STATEMENTS (Continued)
(unaudited)
In April 2020, the Board approved a multi-phase restructuring plan of up to $105.0 million of total pretax charges related to our previously announced strategic shift and as part of the cost cutting measures implemented in response to the impact of COVID-19 on our business. We expect to incur total pretax charges of $75.0 million to $105.0 million in connection with the multi-phase restructuring actions through the end of 2021. The first phase of the restructuring actions includes an overall reduction of approximately 1,300 positions globally and the exit or discontinuation of the use of certain leases and other assets by the end of 2020. The majority of the first phase of workforce reductions and impairments of our right-of-use and other long-lived assets occurred during the second quarter 2020. In the third quarter 2020, we initiated the second phase of our restructuring plan, which included additional workforce reductions and the exit of our operations in New Zealand and Japan. The majority of our restructuring charges are expected to be paid in cash and primarily relate to employee severance and benefits expenses, facilities-related costs and impairment charges and professional advisory fees. We will continue to evaluate our cost structure, including additional workforce reductions, as part of our restructuring plan. Costs incurred related to the restructuring plan are classified as Restructuring and related charges on the condensed consolidated statements of operations.
The following table summarizes costs incurred by segment related to the restructuring plans for both the three and nine months ended September 30, 2020 (in thousands):
| Three Months Ended September 30, 2020 | ||||||||||||||||||||||||||||||||
Employee Severance and Benefit Costs (1) | Legal and Advisory Costs | Property, Equipment and Software Impairments | Right-of-Use Asset Impairments and Lease-related Charges (Credits) | Total Restructuring Charges (Credits) | ||||||||||||||||||||||||||||
| North America | $ | 1,489 | $ | 435 | $ | 70 | $ | 736 | $ | 2,730 | ||||||||||||||||||||||
| International | 14,400 | 18 | 195 | 3,216 | 17,829 | |||||||||||||||||||||||||||
| Consolidated | $ | 15,889 | $ | 453 | $ | 265 | $ | 3,952 | $ | 20,559 | ||||||||||||||||||||||
(1)The employee severance and benefits costs for the three months ended September 30, 2020 are related to the termination of and planned termination of approximately 500 employees. Additional severance and benefits costs may be incurred in future periods. Substantially all of the remaining cash payments for the costs accrued as of September 30, 2020 are expected to be disbursed by the end of 2020.
| Nine Months Ended September 30, 2020 | ||||||||||||||||||||||||||||||||
Employee Severance and Benefit Costs (1) | Legal and Advisory Costs | Property, Equipment and Software Impairments | Right-of-Use Asset Impairments and Lease-related Charges (Credits) | Total Restructuring Charges (Credits) | ||||||||||||||||||||||||||||
| North America | $ | 17,548 | $ | 443 | $ | 4,790 | $ | 10,047 | $ | 32,828 | ||||||||||||||||||||||
| International | 23,041 | 759 | 227 | 4,182 | 28,209 | |||||||||||||||||||||||||||
| Consolidated | $ | 40,589 | $ | 1,202 | $ | 5,017 | $ | 14,229 | $ | 61,037 | ||||||||||||||||||||||
(1)The employee severance and benefits costs for the nine months ended September 30, 2020 are related to the termination and planned termination of approximately 1,200 employees. Additional severance and benefits costs may be incurred in future periods. Substantially all of the remaining cash payments for the costs accrued as of September 30, 2020 are expected to be disbursed by the end of 2020.
As a part of our restructuring plan, we vacated several of our leased facilities, and many of those facilities are being actively marketed for sublease or we are in negotiations with the landlord to potentially terminate or modify those leases. During the nine months ended September 30, 2020, we recognized $17.2 million in restructuring charges related to the impairment of right-of-use assets and leasehold improvements related to those leases as we reduced the carrying value of the those assets to their respective fair value. See Note 2, Goodwill and Long-Lived Assets for more information. Rent expense, including amortization of the right-of-use asset and accretion of the operating lease liability, sublease income and other variable lease costs related to the leased facilities vacated as part of our restructuring plan are presented within Restructuring and related charges in the condensed consolidated statements of operations. The current and non-current liabilities associated with these leases continue to be presented within Other current liabilities and Operating lease obligations in the condensed consolidated balance sheets.
23
GROUPON, INC.
NOTES TO CONDENSED CONSOLIDATED FINANCIAL STATEMENTS (Continued)
(unaudited)
The following table summarizes restructuring liability activity for the nine months ended September 30, 2020 (in thousands):
| Employee Severance and Benefit Costs | Legal and Advisory Costs | Total | |||||||||||||||
Balance as of December 31, 2019 (1) | $ | 699 | $ | 0 | $ | 699 | |||||||||||
Charges payable in cash (2) | 38,854 | 1,202 | 40,056 | ||||||||||||||
| Cash payments | (20,319) | (753) | (21,072) | ||||||||||||||
| Foreign currency translation | 722 | 62 | 784 | ||||||||||||||
| Balance as of September 30, 2020 | $ | 19,956 | $ | 511 | $ | 20,467 | |||||||||||
(1)Amounts included in the beginning balance are related to prior restructuring plans and the liabilities under those plans have been substantially settled.
(2)Excludes stock-based compensation of $1.7 million related to accelerated vesting of stock-based compensation awards for certain employees terminated as a result of our restructuring activities during the nine months ended September 30, 2020.
24
GROUPON, INC.
NOTES TO CONDENSED CONSOLIDATED FINANCIAL STATEMENTS (Continued)
(unaudited)
10. INCOME TAXES
Our income tax provision for interim periods is determined using an estimate of our annual effective tax rate, adjusted for discrete items.
Provision (benefit) for income taxes and income (loss) from continuing operations before provision (benefit) for income taxes for the three and nine months ended September 30, 20192020 and 20182019 was as follows (in thousands):
| Three Months Ended September 30, | Nine Months Ended September 30, | ||||||||||||||
| 2019 | 2018 | 2019 | 2018 | ||||||||||||
| Provision (benefit) for income taxes | $ | 2,069 | $ | 988 | $ | 591 | $ | 205 | |||||||
| Income (loss) from continuing operations before provision (benefit) for income taxes | (12,616 | ) | 48,163 | (92,909 | ) | (47,669 | ) | ||||||||
| Three Months Ended September 30, | Nine Months Ended September 30, | ||||||||||||||||||||||
| 2020 | 2019 | 2020 | 2019 | ||||||||||||||||||||
| Provision (benefit) for income taxes | $ | (486) | $ | 2,069 | $ | (7,170) | $ | 591 | |||||||||||||||
| Income (loss) from continuing operations before provision (benefit) for income taxes | (17,047) | (12,616) | (307,703) | (92,909) | |||||||||||||||||||
Our U.S. Federal income tax rate is 21%. The primary factorfactors impacting the effective tax rate for the three and nine months ended September 30, 2020 and 2019 and 2018 waswere the pretax losses incurred in jurisdictions that have valuation allowances against their net deferred tax assets. The nine months ended September 30, 2020 and 2019 were impacted by the reversals of reserves for uncertain tax positions due to the closure of tax audits. The nine months ended September 30, 2020 were also impacted by the carryback of federal net operating losses due to the income tax relief provided by the CARES Act. We expect that our consolidated effective tax rate in future periods will continue to differ significantly from the U.S. federal income tax rate as a result of our tax obligations in jurisdictions with profits and valuation allowances in jurisdictions with losses. The effective tax rate for the nine months ended September 30, 2019 also reflected the reversal of reserves for uncertain tax positions due to the closure of a tax audit. The effective tax rate for the nine months ended September 30, 2018 also reflected a $6.4 million income tax benefit resulting from the impact of Accounting Standards Codification Topic 606, Revenue from Contracts with Customers ("Topic 606") on intercompany activity in certain foreign jurisdictions.
We are currently undergoing income tax audits in multiple jurisdictions. It is likely that the examination phase of some of those audits will conclude in the next 12 months. There are many factors, including factors outside of our control, which influence the progress and completion of those audits. We are subject to claims for tax assessments by foreign jurisdictions, including a proposed assessment for $105.6 million.$119.1 million, inclusive of estimated incremental interest from the original assessment. We believe that the assessment, which primarily relates to transfer pricing on transactions occurring in 2011, is without merit and we intend to vigorously defend ourselves in that matter. In addition to any potential increases in our liabilities for uncertain tax positions from the ultimate resolution of that assessment, we believe that it is reasonably possible that reductions of up to $21.0$5.8 million in unrecognized tax benefits may occur within the 12 months following September 30, 20192020 upon closing of income tax audits or the expiration of applicable statutes of limitations.
In general, it is our practice and intention to reinvest the earnings of our non-U.S. subsidiaries in those operations. Additionally, while we did not incur the deemed repatriation tax, an actual repatriation from our non-U.S. subsidiaries could be subject to foreign and U.S. state income taxes. Aside from limited exceptions for which the related deferred tax liabilities recognized as of September 30, 20192020 and December 31, 20182019 are immaterial, we do not intend to distribute earnings of foreign subsidiaries for which we have an excess of the financial reporting basis over the tax basis of our investments and therefore have not recorded any deferred taxes related to such amounts. The actual tax cost resulting from a distribution would depend on income tax laws and circumstances at the time of distribution. Determination of the amount of unrecognized deferred tax liability related to the excess of the financial reporting basis over the tax basis of our foreign subsidiaries is not practical due to the complexities associated with the calculation.
Groupon uses a cost-sharing arrangement under which controlled members agree to share the costs and risks of developing intangible properties in accordance with their reasonably anticipated share of benefits from the intangibles. On July 24, 2018,In 2019, the Ninth Circuit Court of Appeals issued an opinionentered a decision in Altera Corp. v. Commissioner requiring related parties in an intercompany cost-sharing arrangement to share expenses related to stock-based compensation. This opinion reversed an earlier decision ofAltera then petitioned the United States Tax Court. On August 7, 2018,Supreme Court to review the Ninth CircuitCircuit's decision. In June 2020, the Supreme Court of Appeals withdrew its July 24, 2018 opinion. On June 7, 2019, the United States Court of Appeals fordenied this petition, and accordingly, the Ninth Circuit reversed the Tax CourtCircuit's Altera decision and ruled that stock-based compensation must be included in the shared pool of expenses. We dostands. The Altera decision did not expect that the ruling will have a material impact on our provision for income taxes for the year endingended December 31, 2019, dueand is not expected to have an impact for the valuation allowances against our net deferred tax assets in the related jurisdictions.
25
GROUPON, INC.
NOTES TO CONDENSED CONSOLIDATED FINANCIAL STATEMENTS (Continued)
(unaudited)
11. FAIR VALUE MEASUREMENTS
Fair value is defined under U.S. GAAP as the price that would be received to sell an asset or paid to transfer a liability in an orderly transaction between market participants at the measurement date. Fair value is a market-based measurement that is determined based on assumptions that market participants would use in pricing an asset or a liability.
To increase the comparability of fair value measures, the following hierarchy prioritizes the inputs in valuation methodologies used to measure fair value:
Level 1 - Measurements that reflect quoted prices (unadjusted) for identical assets or liabilities in active markets.
Level 2 - Measurements that include other inputs that are directly or indirectly observable in the marketplace.
Level 3 - Measurements derived from valuation techniques in which one or more significant inputs or significant value drivers are unobservable. These fair value measurements require significant judgment.
In determining fair value, we use various valuation approaches within the fair value measurement framework. The valuation methodologies used for our assets and liabilities measured at fair value and their classification in the valuation hierarchy are summarized below:
Fair value option investments and available-for-sale securities.To determine the fair value of our fair value option investments each period, we first estimate the fair value of each entity in its entirety. We primarily use the discounted cash flow method, which is an income approach, to estimate the fair value of the entities.investees. The key inputs to determining fair values under that approach are cash flow forecasts and discount rates. We also use a market approach valuation technique, which is based on market multiples of guideline companies, to determine the fair value of each entity. The discounted cash flow and market multiple valuations are then evaluated and weighted to determine the amount that is most representative of the fair value of each entity. Once we determine the fair value of each entity, we then determine the fair value of our specific investments in those entities. The entities have complex capital structures, so we apply an option-pricing model that considers the liquidation preferences of each entity's respective classes of ownership interests to determine the fair value of our investment in each entity.
We also have investments in redeemable preferred shares and had investments in convertible debt securities issued by nonpublic entities.shares. We measure the fair value of those available-for-sale securities using the discounted cash flow method.
We have classified our fair value option investments and our investments in available-for-sale securities as Level 3 due to the lack of observable market data over fair value inputs such as cash flow projections and discount rates. Increases in projected cash flows and decreases in discount rates contribute to increases in the estimated fair values of the fair value option investments and available-for-sale securities, whereas decreases in projected cash flows and increases in discount rates contribute to decreases in their fair values. Our fair value option investments were $0.0 million and $1.4 million as of September 30, 2020 and December 31, 2019.
Contingent consideration. We are subject to a contingent consideration arrangement to transfer a maximum payout in cash of $2.5 million to the former owners of a business acquired on April 30, 2018.
Liabilities for contingent consideration are measured at fair value each reporting period, with the acquisition-date fair value included as part of the consideration transferred in the related business combination and subsequent changes in fair value recorded in earnings within Selling, general and administrative expense on the condensed consolidated statements of operations.
We use an income approach to value contingent consideration obligations based on the present value of probability-weighted future cash flows. We classify the contingent consideration liabilities as Level 3 due to the lack of relevant observable market data over fair value inputs such as probability-weighting of payment outcomes.
26
GROUPON, INC.
NOTES TO CONDENSED CONSOLIDATED FINANCIAL STATEMENTS (Continued)
(unaudited)
| Fair Value Measurement at Reporting Date Using | |||||||||||||||
| September 30, 2019 | Quoted Prices in Active Markets for Identical Assets (Level 1) | Significant Other Observable Inputs (Level 2) | Significant Unobservable Inputs (Level 3) | ||||||||||||
| Assets: | |||||||||||||||
| Fair value option investments | $ | 4,931 | $ | — | $ | — | $ | 4,931 | |||||||
| Available-for-sale securities - redeemable preferred shares | 10,138 | — | — | 10,138 | |||||||||||
| Liabilities: | |||||||||||||||
| Contingent consideration | 1,207 | — | — | 1,207 | |||||||||||
| Fair Value Measurement at Reporting Date Using | |||||||||||||||
| December 31, 2018 | Quoted Prices in Active Markets for Identical Assets (Level 1) | Significant Other Observable Inputs (Level 2) | Significant Unobservable Inputs (Level 3) | ||||||||||||
| Assets: | |||||||||||||||
| Fair value option investments | $ | 73,902 | $ | — | $ | — | $ | 73,902 | |||||||
| Available-for-sale securities - redeemable preferred shares | 10,340 | — | — | 10,340 | |||||||||||
| Liabilities: | |||||||||||||||
| Contingent consideration | 1,529 | — | — | 1,529 | |||||||||||
The following table provides a rollforwardroll forward of the fair value of recurring Level 3 fair value measurements for the three and nine months ended September 30, 20192020 and 20182019 (in thousands):
| Three Months Ended September 30, | Nine Months Ended September 30, | ||||||||||||||||||||||
| 2020 | 2019 | 2020 | 2019 | ||||||||||||||||||||
| Assets | |||||||||||||||||||||||
| Fair value option investments: | |||||||||||||||||||||||
| Beginning Balance | $ | 0 | $ | 4,917 | $ | 1,405 | $ | 73,902 | |||||||||||||||
| Total gains (losses) included in earnings | 0 | 14 | (1,405) | (68,971) | |||||||||||||||||||
| Ending Balance | $ | 0 | $ | 4,931 | $ | 0 | $ | 4,931 | |||||||||||||||
Unrealized gains (losses) still held (1) | $ | 0 | $ | 14 | $ | (1,405) | $ | (68,971) | |||||||||||||||
| Available-for-sale securities - Redeemable preferred shares: | |||||||||||||||||||||||
| Beginning Balance | $ | 0 | $ | 10,201 | $ | 0 | $ | 10,340 | |||||||||||||||
| Total gains (losses) included in other comprehensive income (loss) | 0 | (63) | 0 | (202) | |||||||||||||||||||
| Ending Balance | $ | 0 | $ | 10,138 | $ | 0 | $ | 10,138 | |||||||||||||||
Unrealized gains (losses) still held (1) | $ | 0 | $ | (63) | $ | 0 | $ | (202) | |||||||||||||||
| Liabilities | |||||||||||||||||||||||
| Contingent Consideration: | |||||||||||||||||||||||
| Beginning Balance | $ | 278 | $ | 1,239 | $ | 1,298 | $ | 1,529 | |||||||||||||||
| Settlements of contingent consideration liabilities | 0 | 0 | (908) | (312) | |||||||||||||||||||
| Total losses (gains) included in earnings | 0 | 6 | 6 | 33 | |||||||||||||||||||
| Foreign currency translation | 13 | (38) | (105) | (43) | |||||||||||||||||||
| Ending Balance | $ | 291 | $ | 1,207 | $ | 291 | $ | 1,207 | |||||||||||||||
Unrealized gains (losses) still held (1) | $ | 0 | $ | 6 | $ | 6 | $ | 33 | |||||||||||||||
| Three Months Ended September 30, | Nine Months Ended September 30, | ||||||||||||||
| 2019 | 2018 | 2019 | 2018 | ||||||||||||
| Assets | |||||||||||||||
| Fair value option investments: | |||||||||||||||
| Beginning Balance | $ | 4,917 | $ | 74,898 | $ | 73,902 | $ | 82,966 | |||||||
| Total gains (losses) included in earnings | 14 | (244 | ) | (68,971 | ) | (8,312 | ) | ||||||||
| Ending Balance | $ | 4,931 | $ | 74,654 | $ | 4,931 | $ | 74,654 | |||||||
Unrealized gains (losses) still held (1) | $ | 14 | $ | (244 | ) | $ | (68,971 | ) | $ | (8,312 | ) | ||||
| Available-for-sale securities | |||||||||||||||
| Convertible debt securities: | |||||||||||||||
| Beginning Balance | $ | — | $ | 10,236 | $ | — | $ | 11,354 | |||||||
| Proceeds from sale of convertible debt security | — | (8,594 | ) | — | (8,594 | ) | |||||||||
| Transfer to other equity investment upon conversion of convertible debt security | — | (1,500 | ) | — | (4,008 | ) | |||||||||
| Total gains (losses) included in other comprehensive income (loss) | — | (106 | ) | — | (1,148 | ) | |||||||||
Total gains (losses) included in earnings (2) | — | (36 | ) | — | 2,396 | ||||||||||
| Ending Balance | $ | — | $ | — | $ | — | $ | — | |||||||
Unrealized gains (losses) still held (1) | $ | — | $ | — | $ | — | $ | — | |||||||
| Redeemable preferred shares: | |||||||||||||||
| Beginning Balance | $ | 10,201 | $ | 9,961 | $ | 10,340 | $ | 15,431 | |||||||
| Total gains (losses) included in other comprehensive income (loss) | (63 | ) | 246 | (202 | ) | 246 | |||||||||
| Impairments included in earnings | — | — | — | (5,470 | ) | ||||||||||
| Ending Balance | $ | 10,138 | $ | 10,207 | $ | 10,138 | $ | 10,207 | |||||||
Unrealized gains (losses) still held (1) | $ | (63 | ) | $ | 246 | $ | (202 | ) | $ | (5,224 | ) | ||||
| Liabilities | |||||||||||||||
| Contingent Consideration: | |||||||||||||||
| Beginning Balance | $ | 1,239 | $ | 1,542 | $ | 1,529 | $ | — | |||||||
| Issuance of contingent consideration in connection with acquisition | — | — | — | 1,589 | |||||||||||
| Settlements of contingent consideration liabilities | — | — | (312 | ) | — | ||||||||||
| Total losses (gains) included in earnings | 6 | 21 | 33 | 35 | |||||||||||
| Foreign currency translation | (38 | ) | (20 | ) | (43 | ) | (81 | ) | |||||||
| Ending Balance | $ | 1,207 | $ | 1,543 | $ | 1,207 | $ | 1,543 | |||||||
Unrealized gains (losses) still held (1) | $ | 6 | $ | 21 | $ | 33 | $ | 35 | |||||||
Assets and Liabilities Measured at Fair Value on a Nonrecurring Basis
Certain assets and liabilities are measured at fair value on a nonrecurring basis, including assets that are written down to fair value as a result of an impairment. impairment or increased due to an observable price change in an orderly transaction.
We recognized $109.5 million in non-cash impairment charges related to goodwill and $39.6 million in non-cash impairment charges related to long-lived assets during the nine months ended September 30, 2020, of which $17.2 million is included in Restructuring and related charges on our condensed consolidated statement of operations. See Note 2, Goodwill and Long-Lived Assets, and Note 9, Restructuring and Related Charges, for additional information.
We recognized $6.7 million in impairment charges related to an other equity method investment during the nine months ended September 30, 2020. See Note 3, Investments, for additional information.
We did not record any other significant nonrecurring fair value measurements after initial recognition for the three and nine months ended September 30, 2019. We recorded $4.7 million of impairments of other equity investments for the nine months ended September 30, 2018. To determine the fair value of the investment, we considered the financial condition of the investee2020 and applied a market approach. We classified the fair value measurement of that other equity investment as Level 3 because it involves significant
Estimated Fair Value of Financial Assets and Liabilities Not Measured at Fair Value
Our financial instruments not carried at fair value consist primarily of accounts receivable, restricted cash, short-term borrowings, accounts payable, accrued merchant and supplier payables and accrued expenses. The carrying values of those assets and liabilities approximate their respective fair values as of September 30, 20192020 and December 31, 20182019 due to their short-term nature.
GROUPON, INC.
NOTES TO CONDENSED CONSOLIDATED FINANCIAL STATEMENTS (Continued)
(unaudited)
12. INCOME (LOSS) PER SHARE
Basic net income (loss) per share is computed using the weighted-average number of common shares outstanding during the period. Diluted net income (loss) per share is computed using the weighted-average number of common shares and the effect of potentially dilutive securities outstanding during the period. Potentially dilutive securities include stock options, restricted stock units, performance share units, performance bonus awards, ESPP shares, warrants and convertible senior notes. If dilutive, those potentially dilutive securities are reflected in diluted net income (loss) per share by application ofusing the treasury stock method, except for the convertible senior notes, which are subject to the if-converted method.
The following table sets forth the computation of basic and diluted net income (loss) per share of common stock for the three and nine months ended September 30, 20192020 and 20182019 (in thousands, except share amounts and per share amounts):
| Three Months Ended September 30, | Nine Months Ended September 30, | ||||||||||||||
| 2019 | 2018 | 2019 | 2018 | ||||||||||||
| Basic and diluted net income (loss) per share: | |||||||||||||||
| Numerator | |||||||||||||||
| Net income (loss) - continuing operations | $ | (14,685 | ) | $ | 47,175 | $ | (93,500 | ) | $ | (47,874 | ) | ||||
| Less: Net income (loss) attributable to noncontrolling interests | 2,000 | 2,560 | 8,080 | 9,433 | |||||||||||
| Net income (loss) attributable to common stockholders - continuing operations | (16,685 | ) | 44,615 | (101,580 | ) | (57,307 | ) | ||||||||
| Net income (loss) attributable to common stockholders - discontinued operations | — | — | 2,162 | — | |||||||||||
| Net income (loss) attributable to common stockholders | $ | (16,685 | ) | $ | 44,615 | $ | (99,418 | ) | $ | (57,307 | ) | ||||
| Denominator | |||||||||||||||
| Shares used in computation of basic net income (loss) per share | 566,971,238 | 568,634,988 | 568,339,335 | 565,227,625 | |||||||||||
| Weighted-average effect of dilutive securities: | |||||||||||||||
| Stock options | — | 171,662 | — | — | |||||||||||
| Restricted stock units | — | 7,344,425 | — | — | |||||||||||
| Employee stock purchase plan | — | 228,346 | — | — | |||||||||||
| Shares used in computation of diluted net income (loss) per share | 566,971,238 | 576,379,421 | 568,339,335 | 565,227,625 | |||||||||||
| Basic and diluted net income (loss) per share: | |||||||||||||||
| Continuing operations | $ | (0.03 | ) | $ | 0.08 | $ | (0.18 | ) | $ | (0.10 | ) | ||||
| Discontinued operations | — | — | 0.01 | — | |||||||||||
| Basic and diluted net income (loss) per share | $ | (0.03 | ) | $ | 0.08 | $ | (0.17 | ) | $ | (0.10 | ) | ||||
| Three Months Ended September 30, | Nine Months Ended September 30, | ||||||||||||||||||||||
| 2020 | 2019 | 2020 | 2019 | ||||||||||||||||||||
| Basic and diluted net income (loss) per share: | |||||||||||||||||||||||
| Numerator | |||||||||||||||||||||||
| Net income (loss) - continuing operations | $ | (16,561) | $ | (14,685) | $ | (300,533) | $ | (93,500) | |||||||||||||||
| Less: Net income (loss) attributable to noncontrolling interests | (291) | 2,000 | 1,758 | 8,080 | |||||||||||||||||||
| Net income (loss) attributable to common stockholders - continuing operations | (16,270) | (16,685) | (302,291) | (101,580) | |||||||||||||||||||
| Net income (loss) attributable to common stockholders - discontinued operations | 0 | 0 | 382 | 2,162 | |||||||||||||||||||
| Net income (loss) attributable to common stockholders | $ | (16,270) | $ | (16,685) | $ | (301,909) | $ | (99,418) | |||||||||||||||
| Denominator | |||||||||||||||||||||||
| Weighted-average common shares outstanding | 28,751,520 | 28,348,561 | 28,535,393 | 28,416,966 | |||||||||||||||||||
| Basic and diluted net income (loss) per share: | |||||||||||||||||||||||
| Continuing operations | $ | (0.57) | $ | (0.59) | $ | (10.59) | $ | (3.57) | |||||||||||||||
| Discontinued operations | 0 | 0 | 0.01 | 0.08 | |||||||||||||||||||
| Basic and diluted net income (loss) per share | $ | (0.57) | $ | (0.59) | $ | (10.58) | $ | (3.49) | |||||||||||||||
The following weighted-average potentially dilutive instruments are not included in the diluted net income (loss) per share calculations above because they would have had an antidilutive effect on the net income (loss) per share from continuing operations:
| Three Months Ended September 30, | Nine Months Ended September 30, | ||||||||||
| 2019 | 2018 | 2019 | 2018 | ||||||||
| Restricted stock units | 35,378,166 | 12,462,410 | 33,148,939 | 31,072,428 | |||||||
| Other stock-based compensation awards | 1,561,105 | 16,000 | 1,630,902 | 2,073,802 | |||||||
| Convertible senior notes | 46,296,300 | 46,296,300 | 46,296,300 | 46,296,300 | |||||||
| Warrants | 46,296,300 | 46,296,300 | 46,296,300 | 46,296,300 | |||||||
| Total | 129,531,871 | 105,071,010 | 127,372,441 | 125,738,830 | |||||||
| Three Months Ended September 30, | Nine Months Ended September 30, | ||||||||||||||||||||||
| 2020 | 2019 | 2020 | 2019 | ||||||||||||||||||||
| Restricted stock units | 1,907,396 | 1,768,908 | 1,879,752 | 1,657,446 | |||||||||||||||||||
| Performance share units and other stock-based compensation awards | 151,110 | 78,055 | 199,849 | 81,545 | |||||||||||||||||||
| Convertible senior notes | 2,314,815 | 2,314,815 | 2,314,815 | 2,314,815 | |||||||||||||||||||
| Warrants | 2,314,815 | 2,314,815 | 2,314,815 | 2,314,815 | |||||||||||||||||||
| Total | 6,688,136 | 6,476,593 | 6,709,231 | 6,368,621 | |||||||||||||||||||
We had outstanding performance share units as of September 30, 20192020 and 20182019 that were eligible to vest into shares of common stock subject to the achievement of specified performance or market conditions. Contingently issuable shares are excluded from the computation of diluted earnings per share if, based on current period results, the shares would not be issuable if the end of the reporting period were the end of the contingency period. ThereAs of September 30, 2020, there were up to 14,441,345 and 5,326,725268,654 shares of common stock issuable upon vesting of outstanding performance share units as of September 30, 2019 and 2018 that were excluded from the table above as the performance or market conditions were not satisfied as of the end of the respective periods.
28
GROUPON, INC.
NOTES TO CONDENSED CONSOLIDATED FINANCIAL STATEMENTS (Continued)
(unaudited)
13. SEGMENT INFORMATION
The segment information reported in the tables below reflects the operating results that are regularly reviewed by our chief operating decision maker to assess performance and make resource allocation decisions. Our operations are organized into two2 segments: North America and International. During the third quarter 2020, we changed our measure of segment profitability from operating income (loss) to contribution profit, defined as gross profit less marketing expense, which is consistent with how management reviews the operating results of the segments. Contribution profit measures the amount of marketing investment needed to generate gross profit. Other operating expenses are excluded from contribution profit as management does not review those expenses by segment. Prior period segment information has been retrospectively adjusted to reflect the change.
The following table summarizes revenue by reportable segment and category for the three and nine months ended September 30, 20192020 and 20182019 (in thousands):
| Three Months Ended September 30, | Nine Months Ended September 30, | ||||||||||||||||||||||
| 2020 | 2019 | 2020 | 2019 | ||||||||||||||||||||
| North America | |||||||||||||||||||||||
| Service revenue: | |||||||||||||||||||||||
| Local | $ | 98,561 | $ | 175,140 | $ | 322,945 | $ | 532,599 | |||||||||||||||
| Goods | 8,787 | 3,000 | 18,401 | 9,841 | |||||||||||||||||||
| Travel | 4,748 | 13,680 | 13,722 | 48,746 | |||||||||||||||||||
| Total service revenue | 112,096 | 191,820 | 355,068 | 591,186 | |||||||||||||||||||
| Product revenue - Goods | 68,215 | 111,776 | 293,729 | 394,235 | |||||||||||||||||||
Total North America revenue (1) | 180,311 | 303,596 | 648,797 | 985,421 | |||||||||||||||||||
| International | |||||||||||||||||||||||
| Service revenue: | |||||||||||||||||||||||
| Local | 36,528 | 65,440 | 103,221 | 208,625 | |||||||||||||||||||
| Goods | 3,309 | 2,817 | 8,821 | 6,882 | |||||||||||||||||||
| Travel | 3,140 | 8,003 | 7,368 | 24,817 | |||||||||||||||||||
| Total service revenue | 42,977 | 76,260 | 119,410 | 240,324 | |||||||||||||||||||
| Product revenue - Goods | 80,731 | 115,756 | 305,608 | 380,854 | |||||||||||||||||||
Total International revenue (1) | $ | 123,708 | $ | 192,016 | $ | 425,018 | $ | 621,178 | |||||||||||||||
| Three Months Ended September 30, | Nine Months Ended September 30, | ||||||||||||||
| 2019 | 2018 | 2019 | 2018 | ||||||||||||
| North America | |||||||||||||||
| Service revenue: | |||||||||||||||
| Local | $ | 175,140 | $ | 180,059 | $ | 532,599 | $ | 553,340 | |||||||
| Goods | 3,000 | 4,021 | 9,841 | 12,691 | |||||||||||
| Travel | 13,680 | 17,217 | 48,746 | 57,189 | |||||||||||
| Total service revenue | 191,820 | 201,297 | 591,186 | 623,220 | |||||||||||
| Product revenue - Goods | 111,776 | 159,854 | 394,235 | 511,451 | |||||||||||
Total North America revenue (1) | 303,596 | 361,151 | 985,421 | 1,134,671 | |||||||||||
| International | |||||||||||||||
| Service revenue: | |||||||||||||||
| Local | 65,440 | 75,946 | 208,625 | 221,949 | |||||||||||
| Goods | 2,817 | 2,584 | 6,882 | 10,965 | |||||||||||
| Travel | 8,003 | 9,387 | 24,817 | 30,529 | |||||||||||
| Total service revenue | 76,260 | 87,917 | 240,324 | 263,443 | |||||||||||
| Product revenue - Goods | 115,756 | 143,815 | 380,854 | 438,705 | |||||||||||
Total International revenue (1) | $ | 192,016 | $ | 231,732 | $ | 621,178 | $ | 702,148 | |||||||
29
GROUPON, INC.
NOTES TO CONDENSED CONSOLIDATED FINANCIAL STATEMENTS (Continued)
(unaudited)
The following table summarizes gross profit by reportable segment and category for the three and nine months ended September 30, 20192020 and 20182019 (in thousands):
| Three Months Ended September 30, | Nine Months Ended September 30, | ||||||||||||||||||||||
| 2020 | 2019 | 2020 | 2019 | ||||||||||||||||||||
| North America | |||||||||||||||||||||||
| Service gross profit: | |||||||||||||||||||||||
| Local | $ | 87,507 | $ | 155,032 | $ | 283,004 | $ | 473,787 | |||||||||||||||
| Goods | 7,440 | 2,280 | 14,851 | 7,838 | |||||||||||||||||||
| Travel | 3,874 | 10,717 | 9,726 | 38,791 | |||||||||||||||||||
| Total service gross profit | 98,821 | 168,029 | 307,581 | 520,416 | |||||||||||||||||||
| Product gross profit - Goods | 10,896 | 24,046 | 47,599 | 80,045 | |||||||||||||||||||
| Total North America gross profit | 109,717 | 192,075 | 355,180 | 600,461 | |||||||||||||||||||
| International | |||||||||||||||||||||||
| Service gross profit: | |||||||||||||||||||||||
| Local | 33,687 | 61,183 | 93,054 | 195,941 | |||||||||||||||||||
| Goods | 2,849 | 2,589 | 7,422 | 6,241 | |||||||||||||||||||
| Travel | 2,711 | 7,332 | 6,259 | 22,743 | |||||||||||||||||||
| Total service gross profit | 39,247 | 71,104 | 106,735 | 224,925 | |||||||||||||||||||
| Product gross profit - Goods | 11,058 | 14,761 | 36,580 | 50,702 | |||||||||||||||||||
| Total International gross profit | $ | 50,305 | $ | 85,865 | $ | 143,315 | $ | 275,627 | |||||||||||||||
| Three Months Ended September 30, | Nine Months Ended September 30, | ||||||||||||||
| 2019 | 2018 | 2019 | 2018 | ||||||||||||
| North America | |||||||||||||||
| Service gross profit: | |||||||||||||||
| Local | $ | 155,032 | $ | 159,379 | $ | 473,787 | $ | 491,420 | |||||||
| Goods | 2,280 | 3,634 | 7,838 | 10,565 | |||||||||||
| Travel | 10,717 | 13,801 | 38,791 | 46,106 | |||||||||||
| Total service gross profit | 168,029 | 176,814 | 520,416 | 548,091 | |||||||||||
| Product gross profit - Goods | 24,046 | 27,234 | 80,045 | 95,008 | |||||||||||
| Total North America gross profit | 192,075 | 204,048 | 600,461 | 643,099 | |||||||||||
| International | |||||||||||||||
| Service gross profit: | |||||||||||||||
| Local | 61,183 | 71,639 | 195,941 | 209,214 | |||||||||||
| Goods | 2,589 | 2,320 | 6,241 | 9,972 | |||||||||||
| Travel | 7,332 | 8,649 | 22,743 | 28,219 | |||||||||||
| Total service gross profit | 71,104 | 82,608 | 224,925 | 247,405 | |||||||||||
| Product gross profit - Goods | 14,761 | 19,333 | 50,702 | 64,028 | |||||||||||
| Total International gross profit | $ | 85,865 | $ | 101,941 | $ | 275,627 | $ | 311,433 | |||||||
30
| Three Months Ended September 30, | Nine Months Ended September 30, | ||||||||||||||
| 2019 | 2018 | 2019 | 2018 | ||||||||||||
Income (loss) from operations (1) (2) (3): | |||||||||||||||
North America | $ | 15,691 | $ | 51,004 | $ | 20,655 | $ | (19,380 | ) | ||||||
| International | (11,054 | ) | 2,019 | (20,962 | ) | 11,543 | |||||||||
| Total income (loss) from operations | $ | 4,637 | $ | 53,023 | $ | (307 | ) | $ | (7,837 | ) | |||||
GROUPON, INC.
NOTES TO CONDENSED CONSOLIDATED FINANCIAL STATEMENTS (Continued)
(unaudited)
| Three Months Ended September 30, | Nine Months Ended September 30, | ||||||||||||||||||||||
| 2020 | 2019 | 2020 | 2019 | ||||||||||||||||||||
| North America | |||||||||||||||||||||||
| Gross profit | $ | 109,717 | $ | 192,075 | $ | 355,180 | $ | 600,461 | |||||||||||||||
| Marketing | 19,718 | 45,223 | 73,203 | 162,132 | |||||||||||||||||||
| Contribution profit | 89,999 | 146,852 | 281,977 | 438,329 | |||||||||||||||||||
| International | |||||||||||||||||||||||
| Gross profit | 50,305 | 85,865 | 143,315 | 275,627 | |||||||||||||||||||
| Marketing | 11,668 | 29,753 | 43,555 | 95,164 | |||||||||||||||||||
| Contribution profit | 38,637 | 56,112 | 99,760 | 180,463 | |||||||||||||||||||
| Consolidated | |||||||||||||||||||||||
| Gross profit | 160,022 | 277,940 | 498,495 | 876,088 | |||||||||||||||||||
| Marketing | 31,386 | 74,976 | 116,758 | 257,296 | |||||||||||||||||||
| Contribution profit | 128,636 | 202,964 | 381,737 | 618,792 | |||||||||||||||||||
| Selling, general and administrative | 124,257 | 198,388 | 475,017 | 619,274 | |||||||||||||||||||
| Goodwill impairment | 0 | 0 | 109,486 | 0 | |||||||||||||||||||
| Long-lived asset impairment | 0 | 0 | 22,351 | 0 | |||||||||||||||||||
| Restructuring and related charges | 20,559 | (61) | 61,037 | (175) | |||||||||||||||||||
| Income (loss) from operations | $ | (16,180) | $ | 4,637 | $ | (286,154) | $ | (307) | |||||||||||||||
The following table summarizes total assets by reportable segment as of September 30, 20192020 and December 31, 20182019 (in thousands):
| September 30, 2020 | December 31, 2019 | ||||||||||
| Total assets: | |||||||||||
North America (1) | $ | 1,071,325 | $ | 1,045,500 | |||||||
International (1) | 278,493 | 541,243 | |||||||||
| Consolidated total assets | $ | 1,349,818 | $ | 1,586,743 | |||||||
(1)North America contains assets from the United States of $1,047.9 million and $1,020.0 million as of September 30, 2020 and December 31, 2019. International contains assets from Switzerland of $128.5 million and $175.2 million as of September 30, 2020 and December 31, 2019. There were no other individual countries that represented more than 10% of consolidated total assets as of September 30, 2020 and December 31, 2019.
31
| September 30, 2019 | December 31, 2018 | ||||||
| Total assets: | |||||||
North America (1) | $ | 883,200 | $ | 958,412 | |||
International (1) | 487,502 | 683,730 | |||||
| Consolidated total assets | $ | 1,370,702 | $ | 1,642,142 | |||
ITEM 2. MANAGEMENT'S DISCUSSION AND ANALYSIS OF FINANCIAL CONDITION AND RESULTS OF OPERATIONS
The following discussion and analysis of our financial condition and results of operations should be read together with our condensed consolidated financial statements and related notes included under Part I, Item 1 of this Quarterly Report on Form 10-Q. This discussion contains forward-looking statements about our business and operations. Our actual results may differ materially from those we currently anticipate as a result of many factors, including those we describe under Item 1A, Risk Factors and elsewhere in this Quarterly Report. See Part I, Financial Information, Forward-Looking Statements, for additional information.
Overview
Groupon operates online local commerce marketplaces in 15 countriesis a global scaled two-sided marketplace that connect merchantsconnects consumers to consumers by offering goods and services, generally at a discount.merchants. Consumers access those marketplacesour marketplace through our mobile applications and our websites, primarily localized groupon.com sites in many countries, and our mobile applications. Traditionally, local merchants have tried to reach consumers and generate sales through a variety of methods, including online advertising, paid telephone directories, direct mail, newspaper, radio, television and other promotions. By bringing the brick and mortar world of local commerce onto the Internet, Groupon is helping local merchants to attract customers and sell goods and services.countries. We provide consumers with savings and help them discover what to do, eat, see, buy and where to travel.
We generate both product and service revenue from our current business operations. Our product revenue from transactions in which we sell merchandise inventory in our Goods category is the purchase price received from the customer. OurWe earn service revenue from transactions in which we earn commissions by selling goods or services in our Local, Travel and Goods Categories on behalf of third-party merchantsmerchants. Service revenue from those transactions is reported on a net basis and equals the purchase price collectedreceived from the customer for the offering less thean agreed upon portion of the purchase price paid to the merchant. Service revenue also includes commissions that we earn when customers make purchases with retailers using digital coupons accessed through our digital properties. We earn product revenue from direct sales of merchandise inventory through our Goods category. Our product revenue from those direct sales transactions is the purchase price received from the customer.
In February 2020 we announced a strategic plan to focus is on driving long-term gross profit growth by enhancingour local experiences marketplace, which included exiting our Goods category. However, since March 2020, the customer experience, establishing GrouponCOVID-19 pandemic has led to significant disruption in our business as an open platform, continuing to realizea result of the preventative or protective actions, such as consumer restrictions and merchant closures that governments, our international potential and maintaining a culture of operational efficiency. We have developed and are testing a number of product enhancements intended to make our offerings easier to use for both customers and merchants and consumers have implemented in response to improve purchase frequency,the pandemic. The negative impact of COVID-19 on our business is expected to continue at least as long as our performance is impacted by market conditions as we rely on customers' purchases of vouchers for local experiences, including cash back offers linkedevents and activities, beauty and wellness, travel and dining. Recovery from the COVID-19 pandemic could be volatile given the unprecedented and continuously evolving nature of the situation. We continue to customer credit cards, booking capabilitiesmonitor the impact of COVID-19 on our business, including increases in government restrictions and the potential for colder weather in certain North America and International markets to further exacerbate negative trends.
In light of COVID-19, we continued to sell Goods on our platform instead of quickly exiting the category. We are shifting to a paid membership programthird-party marketplace in the Goods category and expect this transition to be substantially completed in North America Groupon Select, which offers greater discountsby the end of 2020 and on a global basis in 2021. In a third-party marketplace model, merchants assume the responsibility for fulfillment and returns. Following this transition, we will primarily generate service revenue from our offeringsGoods category, and other benefits. We have also entered into commercial agreements with third parties that enable us to feature additional merchant offerings through our marketplaces and for our inventoryGoods revenue is expected to be distributed through other marketplaces. We maintainpresented on a long-term focus on driving Internationalnet basis consistent with the Local and Travel categories. The change in presentation of revenue to achievea net basis does not impact gross profit thator income generated from operations.
In August 2020, we announced our updated strategy and plan to prioritize expanding our Local inventory and modernizing our marketplace by improving the merchant and customer experiences. While both of these are important to building a successful marketplace, we believe the most critical of these is more comparableexpanding Local inventory, and in the near term, we intend to thatdedicate a majority of North America. Our initiativesour efforts and resources to grow International include leveraging enhanced marketing analytics, investing more technology resources toward expanding product and service offerings and growing our inventory of deal offerings. While we expect to invest in our key initiatives,growth. As COVID-19 evolves, we will continue to do so as disciplined operatorsadjust accordingly, if needed.
Restructuring and seek opportunitiesCost Reduction
During the nine months ended September 30, 2020 we took significant actions to improve our efficiency.cash position and materially reduce our cost structure. In April 2020, the Board approved a multi-phase restructuring plan related to our previously announced strategic shift and as part of the cost cutting measures implemented in response to the impact of COVID-19 on our business.
The first phase of our restructuring actions included an overall reduction of approximately 1,300 positions globally and the exit or discontinuation of the use of certain leases and other assets by the end of 2020. The majority of the first phase of workforce reductions and impairments of our right-of-use and other long-lived assets occurred during the second quarter 2020. In the third quarter 2020, we initiated the second phase of our restructuring plan, which included additional workforce reductions and the exit of our operations in New Zealand and Japan. We expect to incur total pre-tax charges of $75.0 million to $105.0 million in connection with our multi-phase restructuring plan through the end of 2021. Once fully implemented, we expect our multi-phase restructuring plan to result in $225.0 million in annualized cost savings. During the three and nine months ended September 30, 2020, we recorded $20.6 million and $61.0 million in pre-tax charges in connection with our restructuring actions. See Note 9, Restructuring and Related Charges, for more information.
In addition to the actions described above, we have taken several steps to reduce costs, preserve cash in the near-term and improve liquidity, including, but not limited to: furloughing staff; continuing to sell Goods on our platform instead of quickly exiting the category; reducing marketing expense by significantly shortening payback thresholds and delaying brand marketing investments; transitioning merchants to redemption payment terms, instead of fixed payment terms; implementing a hiring freeze; eliminating broad-based merit increases for employees; replacing cash compensation with equity compensation in 2020 for Board members; and amending our Credit Agreement to, among other things, provide covenant relief through the first quarter of 2021.
How We Measure Our Business
We use several financialoperating and operatingfinancial metrics to assess the progress of our business and make decisions on where to allocate capital, time and technology investments. Certain of the financial metrics are reported in accordance with U.S. GAAP and certain of those metrics are considered non-GAAP financial measures. As our business evolves, we may make changes to the key financial and operating metrics that we use to measure our business. For further information and reconciliations to the most applicable financial measures under U.S. GAAP, refer to our discussion under Non-GAAP Financial Measures in the Results of Operations section.
| Three Months Ended September 30, | Nine Months Ended September 30, | ||||||||||||||
| 2019 | 2018 | 2019 | 2018 | ||||||||||||
| Revenue | $ | 495,612 | $ | 592,883 | $ | 1,606,599 | $ | 1,836,819 | |||||||
| Gross profit | 277,940 | 305,989 | 876,088 | 954,532 | |||||||||||
| Adjusted EBITDA | 49,997 | 56,369 | 143,473 | 165,207 | |||||||||||
| Free cash flow | 891 | (73,483 | ) | (181,972 | ) | (186,572 | ) | ||||||||
Operating Metrics
•Gross billings is the total dollar value of customer purchases of goods and services. Gross billings is presented net of customer refunds, order discounts and sales and related taxes. The substantial majority of our service revenue transactions are comprised of sales of vouchers and similar transactions in which we collect the transaction price from the customer and remit a portion of the transaction price to the third-party merchant who will provide the related goods or services. For these transactions, gross billings differs from revenue reported in our condensed consolidated statements of operations, which is presented net of the merchant's share of the transaction price. For product revenue transactions, gross billings are equivalent to product revenue reported in our condensed consolidated statements of operations. Gross billings is an indicator of our growth and business performance as it measures the dollar volume of transactions generated through our marketplaces. Tracking gross billings on service revenue transactions also allows us to monitor the percentage of gross billings that we are able to retain after payments to merchants. However, we are focused on achieving long-term gross profit and Adjusted EBITDA growth. •Active customers are unique user accounts that have made a purchase during the trailing twelve months ("TTM") either through one of our online marketplaces or directly with a merchant for which we earned a commission. We consider this metric to be an important indicator of our business performance as it helps us |
to understand how the number of customers actively purchasing our offerings is trending. Some customers could establish and make purchases from more than one account, so it is possible that our active customer metric may count certain customers more than once in a given period. For entities that we have acquired in a business combination, this metric includes active customers of the acquired entity,
32
including customers who made purchases prior to the acquisition. We do not include consumers who solely make purchases with retailers using digital coupons accessed through our websites and mobile applications in our active customer metric, nor do we include consumers who solely make purchases of our inventory through third-party marketplaces with which we partner.
•Gross billings per unit are the gross billings generated per unit. We use this metric to evaluate trends in 2019units and in the average contribution to some extent, into 2020 due to ongoing traffic declines.
Our totalgross billings, units sold declined by 9.4% and 11.1%gross billings per unit for the three and nine months ended September 30, 2019 as compared with the prior year, primarily reflecting unit declines in our North America segment. The decline in total units sold in the current year was primarily attributable to fewer customers2020 and lower customer traffic, including traffic from email and SEO. We expect sequential improvement in year-over-year unit trends in the remainder of 2019.
| Three Months Ended September 30, | Nine Months Ended September 30, | Three Months Ended September 30, | Nine Months Ended September 30, | |||||||||||||||||||||||||||||||||||
| 2019 | 2018 | 2019 | 2018 | 2020 | 2019 | 2020 | 2019 | |||||||||||||||||||||||||||||||
| Gross billings | $ | 1,093,378 | $ | 1,216,229 | $ | 3,390,331 | $ | 3,773,756 | Gross billings | $ | 597,123 | $ | 1,093,378 | $ | 1,986,245 | $ | 3,390,331 | |||||||||||||||||||||
| Units | 35,754 | 39,450 | 108,270 | 121,824 | Units | 21,410 | 35,754 | 74,208 | 108,270 | |||||||||||||||||||||||||||||
| Gross billings per unit | $ | 30.58 | $ | 30.83 | $ | 31.31 | $ | 30.98 | Gross billings per unit | $ | 27.89 | $ | 30.58 | $ | 26.77 | $ | 31.31 | |||||||||||||||||||||
Our active customers gross billings per active customer and gross profit per active customer for the TTM period ended September 30, 2020 and 2019 and 2018 were as follows:
| Trailing Twelve Months Ended September 30, | |||||||
| 2019 | 2018 | ||||||
| TTM Active customers (in thousands) | 45,258 | 48,769 | |||||
| TTM Gross billings per active customer | $ | 106.49 | $ | 109.82 | |||
| TTM Gross profit per active customer | $ | 27.45 | $ | 27.51 | |||
| Three Months Ended September 30, | ||||||||||||||
| 2019 | 2018 | $ Change | % Change | |||||||||||
| North America | ||||||||||||||
| Service gross billings: | ||||||||||||||
| Local | $ | 511,173 | $ | 534,246 | $ | (23,073 | ) | (4.3 | )% | |||||
| Goods | 21,300 | 24,503 | (3,203 | ) | (13.1 | ) | ||||||||
| Travel | 71,144 | 83,991 | (12,847 | ) | (15.3 | ) | ||||||||
| Total service gross billings | 603,617 | 642,740 | (39,123 | ) | (6.1 | ) | ||||||||
| Product gross billings - Goods | 111,776 | 159,854 | (48,078 | ) | (30.1 | ) | ||||||||
| Total North America gross billings | 715,393 | 802,594 | (87,201 | ) | (10.9 | ) | ||||||||
| International | ||||||||||||||
| Service gross billings: | ||||||||||||||
| Local | 204,823 | 209,623 | (4,800 | ) | (2.3 | ) | ||||||||
| Goods | 13,308 | 14,041 | (733 | ) | (5.2 | ) | ||||||||
| Travel | 44,098 | 46,156 | (2,058 | ) | (4.5 | ) | ||||||||
| Total service gross billings | 262,229 | 269,820 | (7,591 | ) | (2.8 | ) | ||||||||
| Product gross billings - Goods | 115,756 | 143,815 | (28,059 | ) | (19.5 | ) | ||||||||
| Total International gross billings | 377,985 | 413,635 | (35,650 | ) | (8.6 | ) | ||||||||
| Total gross billings | $ | 1,093,378 | $ | 1,216,229 | $ | (122,851 | ) | (10.1 | ) | |||||
| Trailing Twelve Months Ended September 30, | ||||||||||||||
| 2020 | 2019 | |||||||||||||
| TTM Active Customers (in thousands) | 34,154 | 45,258 | ||||||||||||
| Three Months Ended September 30, 2019 | |||||||||||
At Avg. Q3 2018 Rates (1) | Exchange Rate Effect (2) | As Reported | |||||||||
| Gross billings | $ | 1,110,431 | $ | (17,053 | ) | $ | 1,093,378 | ||||
| Nine Months Ended September 30, | ||||||||||||||
| 2019 | 2018 | $ Change | % Change | |||||||||||
| North America | ||||||||||||||
| Service gross billings: | ||||||||||||||
| Local | $ | 1,517,312 | $ | 1,625,323 | $ | (108,011 | ) | (6.6 | )% | |||||
| Goods | 60,833 | 78,883 | (18,050 | ) | (22.9 | ) | ||||||||
| Travel | 247,256 | 280,299 | (33,043 | ) | (11.8 | ) | ||||||||
| Total service gross billings | 1,825,401 | 1,984,505 | (159,104 | ) | (8.0 | ) | ||||||||
| Product gross billings - Goods | 394,235 | 511,451 | (117,216 | ) | (22.9 | ) | ||||||||
| Total North America gross billings | 2,219,636 | 2,495,956 | (276,320 | ) | (11.1 | ) | ||||||||
| International | ||||||||||||||
| Service gross billings: | ||||||||||||||
| Local | 615,669 | 630,178 | (14,509 | ) | (2.3 | ) | ||||||||
| Goods | 34,787 | 56,473 | (21,686 | ) | (38.4 | ) | ||||||||
| Travel | 139,385 | 152,444 | (13,059 | ) | (8.6 | ) | ||||||||
| Total service gross billings | 789,841 | 839,095 | (49,254 | ) | (5.9 | ) | ||||||||
| Product gross billings - Goods | 380,854 | 438,705 | (57,851 | ) | (13.2 | ) | ||||||||
| Total International gross billings | 1,170,695 | 1,277,800 | (107,105 | ) | (8.4 | ) | ||||||||
| Total gross billings | $ | 3,390,331 | $ | 3,773,756 | $ | (383,425 | ) | (10.2 | ) | |||||
| Nine Months Ended September 30, 2019 | |||||||||||
At Avg. Q3 2018 YTD Rates (1) | Exchange Rate Effect (2) | As Reported | |||||||||
| Gross billings | $ | 3,462,952 | $ | (72,621 | ) | $ | 3,390,331 | ||||
| Three Months Ended September 30, | ||||||||||||||
| 2019 | 2018 | $ Change | % Change | |||||||||||
| North America | ||||||||||||||
| Service revenue: | ||||||||||||||
| Local | $ | 175,140 | $ | 180,059 | $ | (4,919 | ) | (2.7 | )% | |||||
| Goods | 3,000 | 4,021 | (1,021 | ) | (25.4 | ) | ||||||||
| Travel | 13,680 | 17,217 | (3,537 | ) | (20.5 | ) | ||||||||
| Total service revenue | 191,820 | 201,297 | (9,477 | ) | (4.7 | ) | ||||||||
| Product revenue - Goods | 111,776 | 159,854 | (48,078 | ) | (30.1 | ) | ||||||||
| Total North America revenue | 303,596 | 361,151 | (57,555 | ) | (15.9 | ) | ||||||||
| International | ||||||||||||||
| Service revenue: | ||||||||||||||
| Local | 65,440 | 75,946 | (10,506 | ) | (13.8 | ) | ||||||||
| Goods | 2,817 | 2,584 | 233 | 9.0 | ||||||||||
| Travel | 8,003 | 9,387 | (1,384 | ) | (14.7 | ) | ||||||||
| Total service revenue | 76,260 | 87,917 | (11,657 | ) | (13.3 | ) | ||||||||
| Product revenue - Goods | 115,756 | 143,815 | (28,059 | ) | (19.5 | ) | ||||||||
| Total International revenue | 192,016 | 231,732 | (39,716 | ) | (17.1 | ) | ||||||||
| Total revenue | $ | 495,612 | $ | 592,883 | $ | (97,271 | ) | (16.4 | ) | |||||
| Three Months Ended September 30, 2019 | |||||||||||
At Avg. Q3 2018 Rates (1) | Exchange Rate Effect (2) | As Reported | |||||||||
| Revenue | $ | 504,315 | $ | (8,703 | ) | $ | 495,612 | ||||
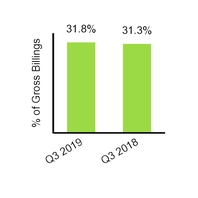
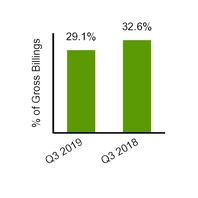
| Nine Months Ended September 30, | ||||||||||||||
| 2019 | 2018 | $ Change | % Change | |||||||||||
| North America | ||||||||||||||
| Service revenue: | ||||||||||||||
| Local | $ | 532,599 | $ | 553,340 | $ | (20,741 | ) | (3.7 | )% | |||||
| Goods | 9,841 | 12,691 | (2,850 | ) | (22.5 | ) | ||||||||
| Travel | 48,746 | 57,189 | (8,443 | ) | (14.8 | ) | ||||||||
| Total service revenue | 591,186 | 623,220 | (32,034 | ) | (5.1 | ) | ||||||||
| Product revenue - Goods | 394,235 | 511,451 | (117,216 | ) | (22.9 | ) | ||||||||
| Total North America revenue | 985,421 | 1,134,671 | (149,250 | ) | (13.2 | ) | ||||||||
| International | ||||||||||||||
| Service revenue: | ||||||||||||||
| Local | 208,625 | 221,949 | (13,324 | ) | (6.0 | ) | ||||||||
| Goods | 6,882 | 10,965 | (4,083 | ) | (37.2 | ) | ||||||||
| Travel | 24,817 | 30,529 | (5,712 | ) | (18.7 | ) | ||||||||
| Total service revenue | 240,324 | 263,443 | (23,119 | ) | (8.8 | ) | ||||||||
| Product revenue - Goods | 380,854 | 438,705 | (57,851 | ) | (13.2 | ) | ||||||||
| Total International revenue | 621,178 | 702,148 | (80,970 | ) | (11.5 | ) | ||||||||
| Total revenue | $ | 1,606,599 | $ | 1,836,819 | $ | (230,220 | ) | (12.5 | ) | |||||
| Nine Months Ended September 30, 2019 | |||||||||||
At Avg. Q3 2018 YTD Rates (1) | Exchange Rate Effect (2) | As Reported | |||||||||
| Revenue | $ | 1,645,767 | $ | (39,168 | ) | $ | 1,606,599 | ||||
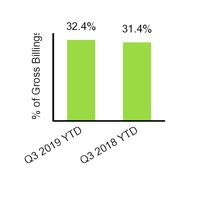
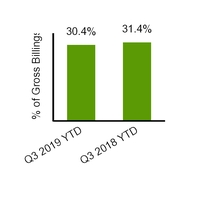
•Gross profit reflects the net basis.
| Three Months Ended September 30, | ||||||||||||||
| 2019 | 2018 | $ Change | % Change | |||||||||||
| North America | ||||||||||||||
| Service cost of revenue: | ||||||||||||||
| Local | $ | 20,108 | $ | 20,680 | $ | (572 | ) | (2.8 | )% | |||||
| Goods | 720 | 387 | 333 | 86.0 | ||||||||||
| Travel | 2,963 | 3,416 | (453 | ) | (13.3 | ) | ||||||||
| Total service cost of revenue | 23,791 | 24,483 | (692 | ) | (2.8 | ) | ||||||||
| Product cost of revenue - Goods | 87,730 | 132,620 | (44,890 | ) | (33.8 | ) | ||||||||
| Total North America cost of revenue | 111,521 | 157,103 | (45,582 | ) | (29.0 | ) | ||||||||
| International | ||||||||||||||
| Service cost of revenue: | ||||||||||||||
| Local | 4,257 | 4,307 | (50 | ) | (1.2 | ) | ||||||||
| Goods | 228 | 264 | (36 | ) | (13.6 | ) | ||||||||
| Travel | 671 | 738 | (67 | ) | (9.1 | ) | ||||||||
| Total service cost of revenue | 5,156 | 5,309 | (153 | ) | (2.9 | ) | ||||||||
| Product cost of revenue - Goods | 100,995 | 124,482 | (23,487 | ) | (18.9 | ) | ||||||||
| Total International cost of revenue | 106,151 | 129,791 | (23,640 | ) | (18.2 | ) | ||||||||
| Total cost of revenue | $ | 217,672 | $ | 286,894 | $ | (69,222 | ) | (24.1 | ) | |||||
| Three Months Ended September 30, 2019 | |||||||||||
At Avg. Q3 2018 Rates (1) | Exchange Rate Effect (2) | As Reported | |||||||||
| Cost of revenue | $ | 222,461 | $ | (4,789 | ) | $ | 217,672 | ||||
•Adjusted EBITDA is a non-GAAP financial measure that we define as net income (loss) from continuing operations excluding income taxes, interest and other non-operating items, depreciation and amortization, stock-based compensation, acquisition-related expense (benefit), net and other special charges and credits, including items that are unusual in nature or infrequently occurring. For further information and a reconciliation to net income (loss) from continuing operations, refer to our discussion under Non-GAAP Financial Measures in the $4.8 millionResults of Operations section.
•Free cash flow is a non-GAAP financial measure that comprises net cash provided by (used in) operating activities from continuing operations less purchases of property and equipment and capitalized software.
33
For further information and a reconciliation to Net cash provided by (used in) operating activities from continuing operations, refer to our discussion in the Liquidity favorableand impact from year-over-year changes in foreign exchange rates.Capital Resources section.
| Nine Months Ended September 30, | ||||||||||||||
| 2019 | 2018 | $ Change | % Change | |||||||||||
| North America | ||||||||||||||
| Service cost of revenue: | ||||||||||||||
| Local | $ | 58,812 | $ | 61,920 | $ | (3,108 | ) | (5.0 | )% | |||||
| Goods | 2,003 | 2,126 | (123 | ) | (5.8 | ) | ||||||||
| Travel | 9,955 | 11,083 | (1,128 | ) | (10.2 | ) | ||||||||
| Total service cost of revenue | 70,770 | 75,129 | (4,359 | ) | (5.8 | ) | ||||||||
| Product cost of revenue - Goods | 314,190 | 416,443 | (102,253 | ) | (24.6 | ) | ||||||||
| Total North America cost of revenue | 384,960 | 491,572 | (106,612 | ) | (21.7 | ) | ||||||||
| International | ||||||||||||||
| Service cost of revenue: | ||||||||||||||
| Local | 12,684 | 12,735 | (51 | ) | (0.4 | ) | ||||||||
| Goods | 641 | 993 | (352 | ) | (35.4 | ) | ||||||||
| Travel | 2,074 | 2,310 | (236 | ) | (10.2 | ) | ||||||||
| Total service cost of revenue | 15,399 | 16,038 | (639 | ) | (4.0 | ) | ||||||||
| Product cost of revenue - Goods | 330,152 | 374,677 | (44,525 | ) | (11.9 | ) | ||||||||
| Total International cost of revenue | 345,551 | 390,715 | (45,164 | ) | (11.6 | ) | ||||||||
| Total cost of revenue | $ | 730,511 | $ | 882,287 | $ | (151,776 | ) | (17.2 | ) | |||||
| Three Months Ended September 30, | Nine Months Ended September 30, | ||||||||||||||||||||||
| 2020 | 2019 | 2020 | 2019 | ||||||||||||||||||||
| Revenue | $ | 304,019 | $ | 495,612 | $ | 1,073,815 | 1,606,599 | ||||||||||||||||
| Gross profit | 160,022 | 277,940 | 498,495 | 876,088 | |||||||||||||||||||
| Adjusted EBITDA | 30,781 | 49,997 | 9,655 | 143,473 | |||||||||||||||||||
| Free cash flow | (6,953) | 891 | (181,166) | (181,972) | |||||||||||||||||||
| Nine Months Ended September 30, 2019 | |||||||||||
At Avg. Q3 2018 YTD Rates (1) | Exchange Rate Effect (2) | As Reported | |||||||||
| Cost of revenue | $ | 752,521 | $ | (22,010 | ) | $ | 730,511 | ||||
| Three Months Ended September 30, | ||||||||||||||
| 2019 | 2018 | $ Change | % Change | |||||||||||
| North America | ||||||||||||||
| Service gross profit: | ||||||||||||||
| Local | $ | 155,032 | $ | 159,379 | $ | (4,347 | ) | (2.7 | )% | |||||
| Goods | 2,280 | 3,634 | (1,354 | ) | (37.3 | ) | ||||||||
| Travel | 10,717 | 13,801 | (3,084 | ) | (22.3 | ) | ||||||||
| Total service gross profit | 168,029 | 176,814 | (8,785 | ) | (5.0 | ) | ||||||||
| Product gross profit - Goods | 24,046 | 27,234 | (3,188 | ) | (11.7 | ) | ||||||||
| Total North America gross profit | 192,075 | 204,048 | (11,973 | ) | (5.9 | ) | ||||||||
| International | ||||||||||||||
| Service gross profit: | ||||||||||||||
| Local | 61,183 | 71,639 | (10,456 | ) | (14.6 | ) | ||||||||
| Goods | 2,589 | 2,320 | 269 | 11.6 | ||||||||||
| Travel | 7,332 | 8,649 | (1,317 | ) | (15.2 | ) | ||||||||
| Total service gross profit | 71,104 | 82,608 | (11,504 | ) | (13.9 | ) | ||||||||
| Product gross profit - Goods | 14,761 | 19,333 | (4,572 | ) | (23.6 | ) | ||||||||
| Total International gross profit | 85,865 | 101,941 | (16,076 | ) | (15.8 | ) | ||||||||
| Total gross profit | $ | 277,940 | $ | 305,989 | $ | (28,049 | ) | (9.2 | ) | |||||
| Three Months Ended September 30, 2019 | |||||||||||
At Avg. Q3 2018 Rates (1) | Exchange Rate Effect (2) | As Reported | |||||||||
| Gross profit | $ | 281,854 | $ | (3,914 | ) | $ | 277,940 | ||||
| Nine Months Ended September 30, | ||||||||||||||
| 2019 | 2018 | $ Change | % Change | |||||||||||
| North America | ||||||||||||||
| Service gross profit: | ||||||||||||||
| Local | $ | 473,787 | $ | 491,420 | $ | (17,633 | ) | (3.6 | )% | |||||
| Goods | 7,838 | 10,565 | (2,727 | ) | (25.8 | ) | ||||||||
| Travel | 38,791 | 46,106 | (7,315 | ) | (15.9 | ) | ||||||||
| Total service gross profit | 520,416 | 548,091 | (27,675 | ) | (5.0 | ) | ||||||||
| Product gross profit - Goods | 80,045 | 95,008 | (14,963 | ) | (15.7 | ) | ||||||||
| Total North America gross profit | 600,461 | 643,099 | (42,638 | ) | (6.6 | ) | ||||||||
| International | ||||||||||||||
| Service gross profit: | ||||||||||||||
| Local | 195,941 | 209,214 | (13,273 | ) | (6.3 | ) | ||||||||
| Goods | 6,241 | 9,972 | (3,731 | ) | (37.4 | ) | ||||||||
| Travel | 22,743 | 28,219 | (5,476 | ) | (19.4 | ) | ||||||||
| Total service gross profit | 224,925 | 247,405 | (22,480 | ) | (9.1 | ) | ||||||||
| Product gross profit - Goods | 50,702 | 64,028 | (13,326 | ) | (20.8 | ) | ||||||||
| Total International gross profit | 275,627 | 311,433 | (35,806 | ) | (11.5 | ) | ||||||||
| Total gross profit | $ | 876,088 | $ | 954,532 | $ | (78,444 | ) | (8.2 | ) | |||||
| Nine Months Ended September 30, 2019 | |||||||||||
At Avg. Q3 2018 YTD Rates (1) | Exchange Rate Effect (2) | As Reported | |||||||||
| Gross profit | $ | 893,246 | $ | (17,158 | ) | $ | 876,088 | ||||
| Three Months Ended September 30, | ||||||||||||||||||||
| 2019 | % of Gross Profit | 2018 | % of Gross Profit | $ Change | % Change | |||||||||||||||
| Marketing: | ||||||||||||||||||||
| North America | $ | 45,223 | 23.5 | % | $ | 60,296 | 29.5 | % | $ | (15,073 | ) | (25.0 | )% | |||||||
| International | 29,753 | 34.7 | 32,421 | 31.8 | (2,668 | ) | (8.2 | ) | ||||||||||||
| Total marketing | $ | 74,976 | 27.0 | $ | 92,717 | 30.3 | $ | (17,741 | ) | (19.1 | ) | |||||||||
| Nine Months Ended September 30, | ||||||||||||||||||||
| 2019 | % of Gross Profit | 2018 | % of Gross Profit | $ Change | % Change | |||||||||||||||
| Marketing: | ||||||||||||||||||||
| North America | $ | 162,132 | 27.0 | % | $ | 198,149 | 30.8 | % | $ | (36,017 | ) | (18.2 | )% | |||||||
| International | 95,164 | 34.5 | 87,902 | 28.2 | 7,262 | 8.3 | ||||||||||||||
| Total marketing | $ | 257,296 | 29.4 | $ | 286,051 | 30.0 | $ | (28,755 | ) | (10.1 | ) | |||||||||
Factors Affecting Our Performance
Attracting and retaining local merchants. As we focus on our local experiences marketplace, we depend on our ability to attract and retain merchants who are willing to offer their experiences on our platform. Merchants can generally withdraw their offerings from our marketplace at any time, and their willingness to continue offering services through our marketplace depends on the effectiveness of our marketing and promotional services. Since the widespread economic impacts of COVID-19 began in March 2020, we are prioritizing opportunities to help drive demand for our merchants and highlighting offers that customers can enjoy right now. In addition to offerings that we can highlight during COVID-19, we have been able to drive demand to certain local merchants that are staying open. As we continue to navigate through the volatility of the COVID-19 recovery period, we intend to take a market by market approach to attracting and retaining local merchants.
Driving purchase frequency and retaining customers. In light of significant declines in consumer demand for local and travel services due to COVID-19, we must highlight offers that customers can enjoy right now in order to drive purchase frequency and retain customers. This includes surfacing the relevant Local inventory in each market depending on the government restrictions currently in place and continuing to leverage our Goods category in the near-term. We must also continue to improve the customer experience on our websites and
34
Increasing traffic to our websites and mobile applications. The traffic to our websites and mobile applications, including from consumers responding to our emails and search engine optimization ("SEO"), has declined in recent years, and we have experienced further declines in traffic due to the impacts of COVID-19. As such, we must focus on improving the effectiveness of our emails, as well as developing sources of traffic in addition to email and SEO and optimizing the efficiency of our marketing spending, which historically was guided by return on investment thresholds based on expected months-to-payback targets ranging from 12 to 18 months. In light of COVID-19, we significantly shortened our payback thresholds.
35
Results of Operations
North America
Operating Metrics
North America segment gross billings and units for the three and nine months ended September 30, 2020 and 2019 were as follows (in thousands, except percentages and gross billings per unit):
| Three Months Ended September 30, | Nine Months Ended September 30, | ||||||||||||||||||||||||||||||||||
| 2020 | 2019 | % Change | 2020 | 2019 | % Change | ||||||||||||||||||||||||||||||
| Gross billings | |||||||||||||||||||||||||||||||||||
| Service gross billings: | |||||||||||||||||||||||||||||||||||
| Local | $ | 230,422 | $ | 511,173 | (54.9) | % | 790,486 | $ | 1,517,312 | (47.9) | % | ||||||||||||||||||||||||
| Goods | 40,299 | 21,300 | 89.2 | 88,713 | 60,833 | 45.8 | |||||||||||||||||||||||||||||
| Travel | 23,373 | 71,144 | (67.1) | 68,557 | 247,256 | (72.3) | |||||||||||||||||||||||||||||
| Total service gross billings | 294,094 | 603,617 | (51.3) | 947,756 | 1,825,401 | (48.1) | |||||||||||||||||||||||||||||
| Product gross billings - Goods | 68,215 | 111,776 | (39.0) | 293,729 | 394,235 | (25.5) | |||||||||||||||||||||||||||||
| Total gross billings | $ | 362,309 | $ | 715,393 | (49.4) | 1,241,485 | $ | 2,219,636 | (44.1) | ||||||||||||||||||||||||||
| Units | |||||||||||||||||||||||||||||||||||
| Local | 8,148 | 16,332 | (50.1) | % | 28,151 | 48,773 | (42.3) | % | |||||||||||||||||||||||||||
| Goods | 4,428 | 5,080 | (12.8) | 15,166 | 16,847 | (10.0) | |||||||||||||||||||||||||||||
| Travel | 151 | 355 | (57.5) | 542 | 1,187 | (54.3) | |||||||||||||||||||||||||||||
| Total units | 12,727 | 21,767 | (41.5) | 43,859 | 66,807 | (34.3) | |||||||||||||||||||||||||||||
| Gross billings per unit | $28.47 | $32.87 | (13.4) | % | $28.31 | $33.22 | (14.8) | % | |||||||||||||||||||||||||||
North America TTM active customers for the trailing twelve months ended September 30, 2020 were as follows (in thousands):
| Trailing Twelve Months Ended September 30, | ||||||||||||||||||||
| 2020 | 2019 | % Change | ||||||||||||||||||
| TTM Active customers | 20,246 | 27,747 | (27) | % | ||||||||||||||||
Comparison of the Three Months Ended September 30, 2020 and 2019:
North America gross billings and units declined by $353.1 million and 9.0 million for the three months ended September 30, 2020. TTM active customers declined by 7.5 million for the three months ended September 30, 2020. These declines were primarily due to the significant decrease in consumer demand as governmental measures were in place to control the spread of COVID-19, including quarantines, travel restrictions, as well as business restrictions and shutdowns. Gross billings per unit were adversely impacted by an increase in Local customer refunds.
Comparison of the Nine Months Ended September 30, 2020 and 2019:
North America gross billings and units declined by $978.2 million and 22.9 million for the nine months ended September 30, 2020. These declines were primarily due to the significant decrease in consumer demand as governmental measures were implemented to control the spread of COVID-19, including quarantines, travel restrictions, as well as business restrictions and shutdowns. Gross billings per unit were adversely impacted by a shift in mix of offerings sold and increase in Local customer refunds.
36
Financial Metrics
North America segment revenue, cost of revenue and gross profit for the three and nine months ended September 30, 2020 and 2019 were as follows (dollars in thousands):
| Three Months Ended September 30, | Nine Months Ended September 30, | ||||||||||||||||||||||||||||||||||
| 2020 | 2019 | % Change | 2020 | 2019 | % Change | ||||||||||||||||||||||||||||||
| Revenue | |||||||||||||||||||||||||||||||||||
| Service revenue | |||||||||||||||||||||||||||||||||||
| Local | $ | 98,561 | $ | 175,140 | (43.7) | % | $ | 322,945 | $ | 532,599 | (39.4) | % | |||||||||||||||||||||||
| Goods | 8,787 | 3,000 | 192.9 | 18,401 | 9,841 | 87.0 | |||||||||||||||||||||||||||||
| Travel | 4,748 | 13,680 | (65.3) | 13,722 | 48,746 | (71.8) | |||||||||||||||||||||||||||||
| Total service revenue | 112,096 | 191,820 | (41.6) | 355,068 | 591,186 | (39.9) | |||||||||||||||||||||||||||||
| Product revenue - Goods | 68,215 | 111,776 | (39.0) | 293,729 | 394,235 | (25.5) | |||||||||||||||||||||||||||||
| Total revenue | $ | 180,311 | $ | 303,596 | (40.6) | $ | 648,797 | $ | 985,421 | (34.2) | |||||||||||||||||||||||||
| Cost of revenue | |||||||||||||||||||||||||||||||||||
| Service cost of revenue | |||||||||||||||||||||||||||||||||||
| Local | $ | 11,054 | $ | 20,108 | (45.0) | % | $ | 39,941 | $ | 58,812 | (32.1) | % | |||||||||||||||||||||||
| Goods | 1,347 | 720 | 87.1 | 3,550 | 2,003 | 77.2 | |||||||||||||||||||||||||||||
| Travel | 874 | 2,963 | (70.5) | 3,996 | 9,955 | (59.9) | |||||||||||||||||||||||||||||
| Total service cost of revenue | 13,275 | 23,791 | (44.2) | 47,487 | 70,770 | (32.9) | |||||||||||||||||||||||||||||
| Product cost of revenue - Goods | 57,319 | 87,730 | (34.7) | 246,130 | 314,190 | (21.7) | |||||||||||||||||||||||||||||
| Total cost of revenue | $ | 70,594 | $ | 111,521 | (36.7) | $ | 293,617 | $ | 384,960 | (23.7) | |||||||||||||||||||||||||
| Gross profit | |||||||||||||||||||||||||||||||||||
| Service gross profit | |||||||||||||||||||||||||||||||||||
| Local | $ | 87,507 | $ | 155,032 | (43.6) | % | $ | 283,004 | $ | 473,787 | (40.3) | % | |||||||||||||||||||||||
| Goods | 7,440 | 2,280 | 226.3 | 14,851 | 7,838 | 89.5 | |||||||||||||||||||||||||||||
| Travel | 3,874 | 10,717 | (63.9) | 9,726 | 38,791 | (74.9) | |||||||||||||||||||||||||||||
| Total service gross profit | 98,821 | 168,029 | (41.2) | 307,581 | 520,416 | (40.9) | |||||||||||||||||||||||||||||
| Product gross profit - Goods | 10,896 | 24,046 | (54.7) | 47,599 | 80,045 | (40.5) | |||||||||||||||||||||||||||||
| Total gross profit | $ | 109,717 | $ | 192,075 | (42.9) | $ | 355,180 | $ | 600,461 | (40.8) | |||||||||||||||||||||||||
Service margin (1) | 38.1 | % | 31.8 | % | 37.5 | % | 32.4 | % | |||||||||||||||||||||||||||
| % of Consolidated revenue | 59.3 | % | 61.3 | % | 60.4 | % | 61.3 | % | |||||||||||||||||||||||||||
| % of Consolidated cost of revenue | 49.0 | 51.2 | 51.0 | 52.7 | |||||||||||||||||||||||||||||||
| % of Consolidated gross profit | 68.6 | 69.1 | 71.3 | 68.5 | |||||||||||||||||||||||||||||||
(1) Represents the percentage service gross billings that we retained after deducting the merchant's share from revenue.
Comparison of the Three Months Ended September 30, 2020 and 2018:2019:
Cost of revenue decreased by $40.9 million for the three months ended September 30, 2020 primarily due to the decrease in transaction volume and gross billings and the impacts of the ongoing transition of Goods to a third party marketplace model.
37
Comparison of the Nine Months Ended September 30, 2020 and 2019:
North America revenue and gross profit decreased by $336.6 million and $245.3 million for the nine months ended September 30, 2020. Those decreases were primarily driven by a decline in gross billings and transaction volume due to the impacts of COVID-19. The increase in service margin was due to a shift in mix of offerings sold and higher variable consideration from unredeemed vouchers due to our shift towards payment on redemption terms in North America. Revenue also declined due to the ongoing transition of Goods to a third party marketplace model. In a third party marketplace model, we generate service revenue which is presented on a net basis.
Cost of revenue decreased by $91.3 million for the nine months ended September 30, 2020 primarily due to the decrease in transaction volume and gross billings and the impacts of the ongoing transition of Goods to a third party marketplace model.
38
Marketing and Contribution Profit
We define contribution profit as gross profit less marketing expense. North America contribution profit for the three and nine months ended September 30, 2020 and 2019 was as follows (dollars in thousands):
| Three Months Ended September 30, | Nine Months Ended September 30, | ||||||||||||||||||||||||||||||||||
| 2020 | 2019 | % Change | 2020 | 2019 | % Change | ||||||||||||||||||||||||||||||
| Marketing | $ | 19,718 | $ | 45,223 | (56.4) | % | $ | 73,203 | $ | 162,132 | (54.8) | % | |||||||||||||||||||||||
| % of Gross profit: | 18.0 | % | 23.5 | % | 20.6 | % | 27.0 | % | |||||||||||||||||||||||||||
| Contribution profit | $ | 89,999 | $ | 146,852 | (38.7)% | $ | 281,977 | $ | 438,329 | (35.7)% | |||||||||||||||||||||||||
Comparison of the Three Months Ended September 30, 2020 and 2019:
North America marketing expense and marketing expense as a percentage of gross profit declined for the three months ended September 30, 2020 due to accelerated traffic declines, significantly shortened payback thresholds and lower investment in our offline marketing and brand spend in light of COVID-19.
The decline in our North America contribution profit for the three months ended September 30, 2019 and 2018 was as follows (dollars in thousands):
| Three Months Ended September 30, | ||||||||||||||||||||
| 2019 | % of Gross Profit | 2018 | % of Gross Profit | $ Change | % Change | |||||||||||||||
| Selling, general and administrative | $ | 198,327 | 71.4 | % | $ | 160,249 | 52.4 | % | $ | 38,078 | 23.8 | % | ||||||||
Comparison of the following:
Nine Months Ended September 30, 20192020 and 2018:2019:
The decline in our North America contribution profit for the nine months ended September 30, 2020 was primarily attributable to a $245.3 million decrease in gross profit, as discussed above, partially offset by a $88.9 million decrease in marketing.
International
Operating Metrics
International segment gross billings and units for the three and nine months ended September 30, 2020 and 2019 were as follows (in thousands, except percentages and 2018gross billings per unit):
| Three Months Ended September 30, | Nine Months Ended September 30, | ||||||||||||||||||||||||||||||||||
| 2020 | 2019 | % Change | 2020 | 2019 | % Change | ||||||||||||||||||||||||||||||
| Gross billings | |||||||||||||||||||||||||||||||||||
| Service gross billings: | |||||||||||||||||||||||||||||||||||
| Local | $ | 113,105 | $ | 204,823 | (44.8) | % | $ | 332,403 | $ | 615,669 | (46.0) | % | |||||||||||||||||||||||
| Goods | 15,151 | 13,308 | 13.8 | 45,322 | 34,787 | 30.3 | |||||||||||||||||||||||||||||
| Travel | 25,827 | 44,098 | (41.4) | 61,427 | 139,385 | (55.9) | |||||||||||||||||||||||||||||
| Total service gross billings | 154,083 | 262,229 | (41.2) | 439,152 | 789,841 | (44.4) | |||||||||||||||||||||||||||||
| Product gross billings - Goods | 80,731 | 115,756 | (30.3) | 305,608 | 380,854 | (19.8) | |||||||||||||||||||||||||||||
| Total gross billings | $ | 234,814 | $ | 377,985 | (37.9) | $ | 744,760 | $ | 1,170,695 | (36.4) | |||||||||||||||||||||||||
| Units | |||||||||||||||||||||||||||||||||||
| Local | 4,171 | 8,241 | (49.4) | % | 13,217 | 23,814 | (44.5) | % | |||||||||||||||||||||||||||
| Goods | 4,320 | 5,415 | (20.2) | 16,627 | 16,616 | 0.1 | |||||||||||||||||||||||||||||
| Travel | 192 | 331 | (42.0) | 505 | 1,033 | (51.1) | |||||||||||||||||||||||||||||
| Total units | 8,683 | 13,987 | (37.9) | 30,349 | 41,463 | (26.8) | |||||||||||||||||||||||||||||
| Gross billings per unit | $27.04 | $27.02 | 0.1 | % | $24.54 | $28.23 | (13.1) | % | |||||||||||||||||||||||||||
39
International TTM active customers for the trailing twelve months ended September 30, 2020 were as followings (in thousands):
| Trailing Twelve Months Ended September 30, | |||||||||||||||||
| 2020 | 2019 | % Change | |||||||||||||||
| TTM Active customers | 13,908 | 17,511 | (20.6) | % | |||||||||||||
Comparison of the Three Months Ended September 30, 2020 and 2019:
International gross billings and units decreased by $143.2 million and 5.3 million for the three months ended September 30, 2020. TTM active customers declined by 3.6 million for the three months ended September 30, 2020. These declines were primarily due to the significant decrease in consumer demand as governmental measures were implemented to control the spread of COVID-19, including quarantines, travel restrictions, as well as business restrictions and shutdowns. The decline in gross billings was partially offset by a $13.2 million favorable impact from year-over-year changes in foreign currency exchange rates.
Comparison of the Nine Months Ended September 30, 2020 and 2019:
International gross billings and units decreased by $425.9 million and 11.1 million for the nine months ended September 30, 2020. These declines were primarily due to the significant decrease in consumer demand as governmental measures were implemented to control the spread of COVID-19, including quarantines, travel restrictions, as well as business restrictions and shutdowns, and a decline in gross billings per unit due to a shift in mix of offerings sold and an increase in Local customer refunds. The decline in gross billings was partially offset by an $11.2 million favorable impact from year-over-year changes in foreign currency exchange rates.
40
Financial Metrics
International segment revenue, cost of revenue and gross profit for the three and nine months ended September 30, 2020 and 2019 were as follows (dollars in thousands):
| Three Months Ended September 30, | Nine Months Ended September 30, | ||||||||||||||||||||||||||||||||||
| 2020 | 2019 | % Change | 2020 | 2019 | % Change | ||||||||||||||||||||||||||||||
| Revenue | |||||||||||||||||||||||||||||||||||
| Service revenue: | |||||||||||||||||||||||||||||||||||
| Local | $ | 36,528 | $ | 65,440 | (44.2) | % | $ | 103,221 | $ | 208,625 | (50.5) | % | |||||||||||||||||||||||
| Goods | 3,309 | 2,817 | 17.5 | 8,821 | 6,882 | 28.2 | |||||||||||||||||||||||||||||
| Travel | 3,140 | 8,003 | (60.8) | 7,368 | 24,817 | (70.3) | |||||||||||||||||||||||||||||
| Total service revenue | 42,977 | 76,260 | (43.6) | 119,410 | 240,324 | (50.3) | |||||||||||||||||||||||||||||
| Product revenue - Goods | 80,731 | 115,756 | (30.3) | 305,608 | 380,854 | (19.8) | |||||||||||||||||||||||||||||
| Total revenue | $ | 123,708 | $ | 192,016 | (35.6) | $ | 425,018 | $ | 621,178 | (31.6) | |||||||||||||||||||||||||
| Cost of revenue | |||||||||||||||||||||||||||||||||||
| Service cost of revenue: | |||||||||||||||||||||||||||||||||||
| Local | $ | 2,841 | $ | 4,257 | (33.3) | % | $ | 10,167 | $ | 12,684 | (19.8) | % | |||||||||||||||||||||||
| Goods | 460 | 228 | 101.8 | 1,399 | 641 | 118.3 | |||||||||||||||||||||||||||||
| Travel | 429 | 671 | (36.1) | 1,109 | 2,074 | (46.5) | |||||||||||||||||||||||||||||
| Total service revenue | 3,730 | 5,156 | (27.7) | 12,675 | 15,399 | (17.7) | |||||||||||||||||||||||||||||
| Product cost of revenue - Goods | 69,673 | 100,995 | (31.0) | 269,028 | 330,152 | (18.5) | |||||||||||||||||||||||||||||
| Total cost of revenue | $ | 73,403 | $ | 106,151 | (30.9) | $ | 281,703 | $ | 345,551 | (18.5) | |||||||||||||||||||||||||
| Gross profit | |||||||||||||||||||||||||||||||||||
| Service gross profit: | |||||||||||||||||||||||||||||||||||
| Local | $ | 33,687 | $ | 61,183 | (44.9) | % | $ | 93,054 | $ | 195,941 | (52.5) | % | |||||||||||||||||||||||
| Goods | 2,849 | 2,589 | 10.0 | 7,422 | 6,241 | 18.9 | |||||||||||||||||||||||||||||
| Travel | 2,711 | 7,332 | (63.0) | 6,259 | 22,743 | (72.5) | |||||||||||||||||||||||||||||
| Total service gross profit | 39,247 | 71,104 | (44.8) | 106,735 | 224,925 | (52.5) | |||||||||||||||||||||||||||||
| Product gross profit - Goods | 11,058 | 14,761 | (25.1) | 36,580 | 50,702 | (27.9) | |||||||||||||||||||||||||||||
| Total gross profit | $ | 50,305 | $ | 85,865 | (41.4) | $ | 143,315 | $ | 275,627 | (48.0) | |||||||||||||||||||||||||
Service margin (1) | 27.9 | % | 29.1 | % | 27.2 | % | 30.4 | % | |||||||||||||||||||||||||||
| % of Consolidated revenue | 40.7 | % | 38.7 | % | 39.6 | % | 38.7 | % | |||||||||||||||||||||||||||
| % of Consolidated cost of revenue | 51.0 | 48.8 | 49.0 | 47.3 | |||||||||||||||||||||||||||||||
| % of Consolidated gross profit | 31.4 | 30.9 | 28.7 | 31.5 | |||||||||||||||||||||||||||||||
(1) Represents the percentage of service gross billings that we retained after deducting the merchant's share from revenue.
Comparison of the Three Months Ended September 30, 2020 and 2019
International revenue and gross profit decreased by $68.3 million and $35.6 million for the three months ended September 30, 2020. Those decreases were primarily driven by a decline in gross billings due to the impacts of COVID-19 as discussed above and the decline in International revenue was also impacted by a decline in Goods product revenue, which is presented on a gross basis. The decreases in revenue and gross profit were partially offset by favorable impacts of $7.0 million and $2.8 million from year-over-year changes in foreign currency exchange rates.
Cost of revenue decreased by $32.7 million for the three months ended September 30, 2020 primarily due to the decrease in transaction volume and gross billings, partially offset by a $4.2 million unfavorable impact from year-over-year changes in foreign currency exchange rates.
41
Comparison of the Nine Months Ended September 30, 2020 and 2019:
International revenue and gross profit decreased by $196.2 million and $132.3 million for the nine months ended September 30, 2020. Those decreases were primarily driven by a decline in gross billings due to the impacts of COVID-19 as discussed above and the decline in International revenue was also impacted by a decline in Goods product revenue, which is presented on a gross basis. The decreases in revenue and gross profit were partially offset by favorable impacts of $5.8 million and $2.6 million from year-over-year changes in foreign currency exchange rates.
Cost of revenue decreased by $63.8 million for the nine months ended September 30, 2020 primarily due to the decrease in transaction volume and gross billings, partially offset by a $3.2 million unfavorable impact from year-over-year changes in foreign currency exchange rates.
Marketing and Contribution Profit
International marketing and contribution profit for the three and nine months ended September 30, 2020 and 2019 was as follows (dollars in thousands):
| Three Months Ended September 30, | Nine Months Ended September 30, | ||||||||||||||||||||||||||||||||||
| 2020 | 2019 | % Change | 2020 | 2019 | % Change | ||||||||||||||||||||||||||||||
| Marketing | $ | 11,668 | $ | 29,753 | (60.8) | % | $ | 43,555 | $ | 95,164 | (54.2) | % | |||||||||||||||||||||||
| % of Gross profit: | 23.2 | % | 34.7 | % | 30.4 | % | 34.5 | % | |||||||||||||||||||||||||||
| Contribution profit | $ | 38,637 | $ | 56,112 | (31.1) | % | $ | 99,760 | $ | 180,463 | (44.7) | % | |||||||||||||||||||||||
| Nine Months Ended September 30, | ||||||||||||||||||||
| 2019 | % of Gross Profit | 2018 | % of Gross Profit | $ Change | % Change | |||||||||||||||
| Selling, general and administrative | $ | 619,099 | 70.7 | % | $ | 676,318 | 70.9 | % | $ | (57,219 | ) | (8.5 | )% | |||||||
Three Months Ended September 30, 20192020 and 2018:2019:
| Three Months Ended September 30, | ||||||||||||||
| 2019 | 2018 | $ Change | % Change | |||||||||||
| Income (loss) from operations | ||||||||||||||
| North America | $ | 15,691 | $ | 51,004 | $ | (35,313 | ) | (69.2 | )% | |||||
| International | (11,054 | ) | 2,019 | (13,073 | ) | (647.5 | ) | |||||||
| Total income (loss) from operations | $ | 4,637 | $ | 53,023 | $ | (48,386 | ) | (91.3 | ) | |||||
The decrease in our income from operationsInternational contribution profit for the three months ended September 30, 2020 was primarily attributable to a $38.4$35.6 millionincrease in SG&A and a $12.0 million decrease in gross profit, partially offset by a $15.1$18.1 milliondecrease in marketing expense.marketing.
International
The decrease in International contribution profit for the nine months ended September 30, 2020 was primarily attributable to a $16.1$132.3 million decrease in gross profit, partially offset by a $51.6 million decrease in marketing.
42
Operating Expenses
Operating expenses for the three and nine months ended September 30, 2020 and 2019 were as follows (dollars in thousands):
| Three Months Ended September 30, | Nine Months Ended September 30, | ||||||||||||||||||||||||||||||||||
| 2020 | 2019 | % Change | 2020 | 2019 | % Change | ||||||||||||||||||||||||||||||
| Marketing | $ | 31,386 | $ | 74,976 | (58.1) | % | $ | 116,758 | $ | 257,296 | (54.6) | % | |||||||||||||||||||||||
| Selling, general and administrative | 124,257 | 198,388 | (37.4) | 475,017 | 619,274 | (23.3) | |||||||||||||||||||||||||||||
| Goodwill impairment | — | — | — | 109,486 | — | — | |||||||||||||||||||||||||||||
| Long-lived asset impairment | — | — | — | 22,351 | — | — | |||||||||||||||||||||||||||||
| Restructuring and related charges | 20,559 | (61) | NM | 61,037 | (175) | NM | |||||||||||||||||||||||||||||
| Total Operating expenses | $ | 176,202 | $ | 273,303 | (35.5) | % | $ | 784,649 | $ | 876,395 | (10.5) | % | |||||||||||||||||||||||
| % of Gross profit: | |||||||||||||||||||||||||||||||||||
| Marketing | 19.6 | % | 27.0 | % | 23.4 | % | 29.4 | % | |||||||||||||||||||||||||||
| Selling, general and administrative | 77.6 | % | 71.4 | % | 95.3 | % | 70.7 | % | |||||||||||||||||||||||||||
Comparison of the Three Months Ended September 30, 2020 and 2019:
Marketing expense and marketing expense as a percentage of gross profit declined for the three months ended September 30, 2020 due to accelerated traffic declines, significantly shortened payback thresholds and lower investment in our offline marketing and brand spend in light of COVID-19, partially offset by a $0.6 million unfavorable impact from year-over-year change in foreign currency exchange rates.
SG&A decreased for the three months ended September 30, 2020 primarily due to lower payroll-related expenses due to furloughs and restructuring actions, partially offset by a $2.2 million unfavorable impact from year-over-year changes in foreign currency exchange rates. SG&A as a percentage of gross profit increased for the three months ended September 30, 2020 due to the decline in demand and traffic as a result of COVID-19.
Restructuring and related charges for the three months ended September 30, 2020 represent severance and benefit costs for workforce reductions, impairments of long-lived assets and lease terminations and other exit costs resulting from our restructuring activities. See Note 9, $0.3 millionRestructuring and Related Chargesdecrease in SG&A., for more information.
Comparison of the Nine Months Ended September 30, 20192020 and 2018:2019:
| Nine Months Ended September 30, | ||||||||||||||
| 2019 | 2018 | $ Change | % Change | |||||||||||
| Income (loss) from operations | ||||||||||||||
| North America | $ | 20,655 | $ | (19,380 | ) | $ | 40,035 | 206.6 | % | |||||
| International | (20,962 | ) | 11,543 | (32,505 | ) | (281.6 | ) | |||||||
| Total income (loss) from operations | $ | (307 | ) | $ | (7,837 | ) | $ | 7,530 | 96.1 | |||||
During the first quarter 2020, we performed an interim quantitative assessment of goodwill and long-lived assets as a result of significant deterioration in our financial performance due to the impact of COVID-19. As a result, we recognized goodwill impairment of $109.5 million, that represented the excess of the EMEA reporting unit's carrying value over its fair value, and long-lived asset impairment of $22.4 million for the nine months ended September 30, 2020. See Note 2, $10.6 millionGoodwill and Long-Lived Assets, decrease in SG&A.for additional information about goodwill and long-lived asset impairments.
Restructuring and related charges for the nine months ended September 30, 2020 represent severance and benefit costs for workforce reductions, impairments of long-lived assets and lease terminations and other exit costs resulting from our restructuring activities. See Note 9, Restructuring and Related Charges, for more information.
43
Other Income (Expense), Net
Other income (expense), net includes interest income, interest expense, gains and losses on fair value option investments, adjustments for observable price changes of investments, impairments of investments and foreign currency gains and losses, primarily resulting from intercompany balances with our subsidiaries that are denominated in foreign currencies.
Other income (expense), net for the three and nine months ended September 30, 2020 and 2019 was as follows (dollars in thousands):
| Three Months Ended September 30, | Nine Months Ended September 30, | ||||||||||||||||||||||
| 2020 | 2019 | 2020 | 2019 | ||||||||||||||||||||
| Interest income | $ | 1,268 | $ | 1,959 | $ | 5,254 | $ | 5,810 | |||||||||||||||
| Interest expense | (9,408) | (6,029) | (24,375) | (17,162) | |||||||||||||||||||
| Changes in fair value of investments | — | 14 | (1,405) | (68,971) | |||||||||||||||||||
| Foreign currency gains (losses), net | 7,273 | (13,197) | 5,661 | (12,279) | |||||||||||||||||||
| Impairment of investment | — | — | (6,684) | — | |||||||||||||||||||
| Other income (expense), net | $ | (867) | $ | (17,253) | $ | (21,549) | $ | (92,602) | |||||||||||||||
Comparison of the Three Months Ended September 30, 20192020 and 2018:2019:
The change in Other income (expense), net for the three months ended September 30, 20192020 as compared with the prior year period is primarily related to a change in foreign currency gains and 2018 was as follows (dollars in thousands):
| Three Months Ended September 30, | ||||||||||||||
| 2019 | 2018 | $ Change | % Change | |||||||||||
| Other income (expense), net | $ | (17,253 | ) | $ | (4,860 | ) | $ | (12,393 | ) | (255.0 | )% | |||
Nine Months Ended September 30, 20192020 and 2018:2019:
The change in Other income (expense), net for the nine months ended September 30, 20192020 as compared with the prior year period is primarily related to a $67.6 million decrease in losses from changes in our fair value of investments and 2018 was as follows (dollarsa change in thousands):
| Nine Months Ended September 30, | ||||||||||||||
| 2019 | 2018 | $ Change | % Change | |||||||||||
| Other income (expense), net | $ | (92,602 | ) | $ | (39,832 | ) | $ | (52,770 | ) | (132.5 | )% | |||
Provision (Benefit) for Income Taxes
Provision (benefit) for income taxes for the three and nine months ended September 30, 20192020 and 20182019 was as follows (dollars in thousands):
| Three Months Ended September 30, | Nine Months Ended September 30, | ||||||||||||||||||||||||||||||||||
| 2020 | 2019 | % Change | 2020 | 2019 | % Change | ||||||||||||||||||||||||||||||
| Provision (benefit) for income taxes | $ | (486) | $ | 2,069 | (123.5) | % | $ | (7,170) | $ | 591 | (1,313.2) | % | |||||||||||||||||||||||
| Effective tax rate | 2.9 | % | (16.4) | % | 2.3 | % | (0.6) | % | |||||||||||||||||||||||||||
| Three Months Ended September 30, | ||||||||||||||
| 2019 | 2018 | $ Change | % Change | |||||||||||
| Provision (benefit) for income taxes | $ | 2,069 | $ | 988 | $ | 1,081 | 109.4 | % | ||||||
| Effective tax rate | (16.4 | )% | 2.1 | % | ||||||||||
Our U.S. federal income tax rate is 21%. The primary factorfactors impacting the effective tax rate for the three months ended September 30, 2020 and 2019 and 2018 waswere the pretax losses incurred in jurisdictions that have valuation allowances against their net deferred tax assets. We expect that our consolidated effective tax rate in future periods will continue to differ significantly from the U.S. federal income tax rate as a result of our tax obligations in jurisdictions with profits and valuation allowances in jurisdictions with losses. See Item 1, Note 10, Income Taxes, for additional information relating to tax audits and assessments and regulatory and legal developments that may impact our business and results of operations in the future.
Comparison of the Nine Months Ended September 30, 20192020 and 2018:2019:
| Nine Months Ended September 30, | ||||||||||||||
| 2019 | 2018 | $ Change | % Change | |||||||||||
| Provision (benefit) for income taxes | $ | 591 | $ | 205 | $ | 386 | 188.3 | % | ||||||
| Effective tax rate | (0.6 | )% | (0.4 | )% | ||||||||||
44
income tax benefit resulting fromrelief provided by the impact of Topic 606 on intercompany activity in certain foreign jurisdictions.Coronavirus Aid, Relief, and Economic Security Act ("CARES Act"). We expect that our consolidated effective tax rate in future periods will continue to differ significantly from the U.S. federal income tax raterates as a result of our tax obligations in jurisdictions with profits and valuation allowances in jurisdictions with losses. See Item 1, Note 10, Income Taxes, for additional information relating to tax audits and assessments and regulatory and legal developments that may impact our business and resultsresult of operations in the future.future.
Non-GAAP Financial Measures
In addition to financial results reported in accordance with U.S. GAAP, we have provided the following non-GAAP financial measures: Adjusted EBITDA, free cash flow and foreign currency exchange rate neutral operating results. Those non-GAAP financial measures, which are presented on a continuing operations basis, are intended to aid investors in better understanding our current financial performance and prospects for the future as seen through the eyes of management. We believe that those non-GAAP financial measures facilitate comparisons with our historical results and with the results of peer companies who present similar measures (although other companies may define non-GAAP measures differently than we define them, even when similar terms are used to identify such measures). However, those non-GAAP financial measures are not intended to be a substitute for those reported in accordance with U.S. GAAP.
Adjusted EBITDA. Adjusted EBITDA is a non-GAAP performance measure that we define as net income (loss) from continuing operations excluding income taxes, interest and other non-operating items, depreciation and amortization, stock-based compensation, acquisition-related expense (benefit), net and other special charges and credits, including items that are unusual in nature or infrequently occurring. Our definition of Adjusted EBITDA may differ from similar measures used by other companies, even when similar terms are used to identify such measures. Adjusted EBITDA is a key measure used by our management and Board of Directors to evaluate operating performance, generate future operating plans and make strategic decisions for the allocation of capital. Accordingly, we believe that Adjusted EBITDA provides useful information to investors and others in understanding and evaluating our operating results in the same manner as our management and Board of Directors. However, Adjusted EBITDA is not intended to be a substitute for income (loss) from continuing operations.
We exclude stock-based compensation expense and depreciation and amortization because they are primarily non-cash in nature and we believe that non-GAAP financial measures excluding those items provide meaningful supplemental information about our operating performance and liquidity. Acquisition-related expense (benefit), net is comprised of the change in the fair value of contingent consideration arrangements and external transaction costs related to business combinations, primarily consisting of legal and advisory fees. The composition of our contingent consideration arrangements and the impact of those arrangements on our operating results vary over time based on a number of factors, including the terms of our business combinations and the timing of those transactions. For the three and nine months ended September 30, 20192020 and 2018,2019, special charges and credits included charges related to our restructuring plan. For the threeplan, goodwill and nine months ended September 30, 2018, special chargeslong-lived asset impairments, and credits also included a $40.4 million credit and a $34.6 million charge related to our patent litigation with IBM.strategic advisor costs. We exclude special charges and credits from Adjusted EBITDA because we believe that excluding those items provides meaningful supplemental information about our core operating performance and facilitates comparisons with our historical results.
46
The following is a reconciliation of Adjusted EBITDA to the most comparable U.S. GAAP financial measure, Income (loss) from continuing operations for the three and nine months ended September 30, 20192020 and 20182019 (in thousands):
| Three Months Ended September 30, | Nine Months Ended September 30, | ||||||||||||||
| 2019 | 2018 | 2019 | 2018 | ||||||||||||
| Income (loss) from continuing operations | $ | (14,685 | ) | $ | 47,175 | $ | (93,500 | ) | $ | (47,874 | ) | ||||
| Adjustments: | |||||||||||||||
Stock-based compensation (1) | 19,543 | 15,026 | 62,517 | 50,570 | |||||||||||
| Depreciation and amortization | 25,873 | 28,685 | 81,405 | 87,300 | |||||||||||
| Acquisition-related expense (benefit), net | 5 | — | 33 | 655 | |||||||||||
| Restructuring charges | (61 | ) | 35 | (175 | ) | (81 | ) | ||||||||
| IBM patent litigation | — | (40,400 | ) | — | 34,600 | ||||||||||
| Other (income) expense, net | 17,253 | 4,860 | 92,602 | 39,832 | |||||||||||
| Provision (benefit) for income taxes | 2,069 | 988 | 591 | 205 | |||||||||||
| Total adjustments | 64,682 | 9,194 | 236,973 | 213,081 | |||||||||||
| Adjusted EBITDA | $ | 49,997 | $ | 56,369 | $ | 143,473 | $ | 165,207 | |||||||
| Three Months Ended September 30, | Nine Months Ended September 30, | ||||||||||||||||||||||
| 2020 | 2019 | 2020 | 2019 | ||||||||||||||||||||
| Income (loss) from continuing operations | $ | (16,561) | $ | (14,685) | $ | (300,533) | $ | (93,500) | |||||||||||||||
| Adjustments: | |||||||||||||||||||||||
| Stock-based compensation | 8,379 | 19,543 | 30,937 | 62,517 | |||||||||||||||||||
| Depreciation and amortization | 18,023 | 25,873 | 68,366 | 81,405 | |||||||||||||||||||
| Acquisition-related expense (benefit), net | — | 5 | 6 | 33 | |||||||||||||||||||
Restructuring and related charges (1) | 20,559 | (61) | 61,037 | (175) | |||||||||||||||||||
| Goodwill impairment | — | — | 109,486 | — | |||||||||||||||||||
| Long-lived asset impairment | — | — | 22,351 | — | |||||||||||||||||||
| Strategic advisor costs | — | — | 3,626 | — | |||||||||||||||||||
| Other (income) expense, net | 867 | 17,253 | 21,549 | 92,602 | |||||||||||||||||||
| Provision (benefit) for income taxes | (486) | 2,069 | (7,170) | 591 | |||||||||||||||||||
| Total adjustments | 47,342 | 64,682 | 310,188 | 236,973 | |||||||||||||||||||
| Adjusted EBITDA | $ | 30,781 | $ | 49,997 | $ | 9,655 | $ | 143,473 | |||||||||||||||
Free cash flow. Free cash flow is a non-GAAP liquidity measure that comprises net cash provided by operating activities from continuing operations less purchases of property and equipment and capitalized software. We use free cash flow to conduct and evaluate our business because, although it is similar to cash flow from continuing operations, we believe that it typically represents a more useful measure of cash flows because purchases of fixed assets, software developed for internal use and website development costs are necessary components of our ongoing operations. Free cash flow is not intended to represent the total increase or decrease in our cash balance for the applicable period.
Free cash flow has limitations due to the fact that it does not represent the residual cash flow available for discretionary expenditures. For example, free cash flow does not include cash payments for business acquisitions. In addition, free cash flow reflects the impact of the timing difference between when we are paid by customers and when we pay merchants and suppliers. Therefore, we believe it is important to view free cash flow as a complement to our entire condensed consolidated statements of cash flows. For a reconciliation of free cash flow to the most comparable U.S. GAAP financial measure, see Liquidity and Capital Resources below.
Foreign currency exchange rate neutral operating results. Foreign currency exchange rate neutral operating results show current period operating results as if foreign currency exchange rates had remained the same as those in effect in the prior year period. Those measures are intended to facilitate comparisons to our historical performance. For a reconciliation
47
The following table represents the effect on our condensed consolidated statements of foreign currencyoperations from changes in exchange rate neutral operating results torates versus the most comparable U.S. GAAP financial measures, see dollar for the three and nine months ended September 30, 2020 (in thousands):
| Three Months Ended September 30, 2020 | |||||||||||||||||
At Avg. Q3 2019 Rates (1) | Exchange Rate Effect (2) | As Reported | |||||||||||||||
| Gross billings | $ | 583,887 | $ | 13,236 | $ | 597,123 | |||||||||||
| Revenue | 296,982 | 7,037 | 304,019 | ||||||||||||||
| Cost of revenue | 139,811 | 4,186 | 143,997 | ||||||||||||||
| Gross profit | 157,171 | 2,851 | 160,022 | ||||||||||||||
| Marketing | 30,767 | 619 | 31,386 | ||||||||||||||
| Selling, general and administrative | 122,017 | 2,240 | 124,257 | ||||||||||||||
| Income (loss) from operations | (15,317) | (863) | (16,180) | ||||||||||||||
| Nine Months Ended September 30, 2020 | |||||||||||||||||
At Avg. Q3 2019 Rates (1) | Exchange Rate Effect (2) | As Reported | |||||||||||||||
| Gross billings | $ | 1,975,069 | $ | 11,176 | $ | 1,986,245 | |||||||||||
| Revenue | 1,068,009 | 5,806 | 1,073,815 | ||||||||||||||
| Cost of revenue | 572,083 | 3,237 | 575,320 | ||||||||||||||
| Gross profit | 495,926 | 2,569 | 498,495 | ||||||||||||||
| Marketing | 116,319 | 439 | 116,758 | ||||||||||||||
| Selling, general and administrative | 473,860 | 1,157 | 475,017 | ||||||||||||||
| Income (loss) from operations | (288,989) | 2,835 | (286,154) | ||||||||||||||
(1) Represents the financial statement balances that would have resulted had exchange rates in the reporting period been the same as those in effect in the prior year period.
(2) Represents the increase or decrease in the reported amount resulting from changes in exchange rates from those in effect in the prior year period.
Liquidity and Capital Resources
Our principal sources of liquidity are cash flows from operations and cash balances, which totaled $567.3 million asprimarily consisted of bank deposits and government money market funds. As of September 30, 2019, and available borrowing capacity2020, cash balances, including outstanding borrowings under our 2019the Credit Agreement.Agreement, were $779.0 million.
Our net cash flows from operating, investing and financing activities from continuing operations for the three and nine months ended September 30, 20192020 and 20182019 were as follows (in thousands):
| Three Months Ended September 30, | Nine Months Ended September 30, | ||||||||||||||||||||||
| 2020 | 2019 | 2020 | 2019 | ||||||||||||||||||||
| Cash provided by (used in): | |||||||||||||||||||||||
| Operating activities | $ | 4,792 | $ | 18,584 | $ | (144,504) | $ | (130,118) | |||||||||||||||
| Investing activities | (12,469) | (19,541) | (8,473) | (54,891) | |||||||||||||||||||
| Financing activities | (3,617) | (22,595) | 180,557 | (81,953) | |||||||||||||||||||
48
| Three Months Ended September 30, | Nine Months Ended September 30, | ||||||||||||||
| 2019 | 2018 | 2019 | 2018 | ||||||||||||
| Cash provided by (used in): | |||||||||||||||
| Operating activities | $ | 18,584 | $ | (57,389 | ) | $ | (130,118 | ) | $ | (132,961 | ) | ||||
| Investing activities | (19,541 | ) | (22,389 | ) | (54,891 | ) | (118,485 | ) | |||||||
| Financing activities | (22,595 | ) | (9,720 | ) | (81,953 | ) | (49,348 | ) | |||||||
Our free cash flow for the three and nine months ended September 30, 2020 and 2019 and 2018 and reconciliationsa reconciliation to the most comparable U.S. GAAP financial measure, Net cash provided by (used in) operating activities from continuing operations, for those periods are as follows (in thousands):
| Three Months Ended September 30, | Nine Months Ended September 30, | Three Months Ended September 30, | Nine Months Ended September 30, | |||||||||||||||||||||||||||||||||||
| 2019 | 2018 | 2019 | 2018 | 2020 | 2019 | 2020 | 2019 | |||||||||||||||||||||||||||||||
| Net cash provided by (used in) operating activities from continuing operations | $ | 18,584 | $ | (57,389 | ) | $ | (130,118 | ) | $ | (132,961 | ) | Net cash provided by (used in) operating activities from continuing operations | $ | 4,792 | $ | 18,584 | $ | (144,504) | $ | (130,118) | ||||||||||||||||||
| Purchases of property and equipment and capitalized software from continuing operations | (17,693 | ) | (16,094 | ) | (51,854 | ) | (53,611 | ) | Purchases of property and equipment and capitalized software from continuing operations | (11,745) | (17,693) | (36,662) | (51,854) | |||||||||||||||||||||||||
| Free cash flow | $ | 891 | $ | (73,483 | ) | $ | (181,972 | ) | $ | (186,572 | ) | Free cash flow | $ | (6,953) | $ | 891 | $ | (181,166) | $ | (181,972) | ||||||||||||||||||
Our revenue-generating transactions are primarily structured such that we collect cash up-front from customers and pay third-party merchants at a later date, either based on a fixed payment schedule or upon the customer's redemption of the related voucher. For merchants on fixed payment terms, we remit payments on an ongoing basis, generally bi-weekly, throughout the term of the merchant's offering. For purchases of merchandise inventory, our supplier payment terms generally range from net 30 to net 60 days. We have historically primarily paid merchants on fixed payment terms in North America and upon voucher redemption internationally. In 2017,prior periods, we began to increase our use of redemption payment terms with our North America merchants, and in the third quarter 2020, we expect that trendaccelerated these efforts and largely completed the transition to continue.redemption payment terms.
Our cash balances fluctuate significantly throughout the year based on many variables, including gross billings growth rates, the timing of payments to merchants and suppliers, seasonality and the mix of transactions between Goods and Local. For example, we typically generatehave historically generated strong cash inflows during the fourth quarter holiday season,
For the nine months ended September 30, 2020, our net cash used in operating activities from continuing operations was $144.5 million, as compared with a $300.5 million net loss from continuing operations. That difference is primarily due to $267.3 million of non-cash items, including $109.5 million of goodwill impairment, $22.4 million of long-lived asset impairments, $17.2 million of restructuring-related impairments, depreciation and testing voucherless offerings that typically resultamortization and stock-based compensation, partially offset by a $111.2 million net decrease from changes in cash back on customers' credit card statements for qualifying purchases. For many of those offerings, we fund the cash back to the customer within two weeks of purchaseworking capital and collect our commissionother assets and reimbursement for the customer's cash back incentive from our merchants on a monthly basis.liabilities. The working capital impact was related to the seasonal timing of card-linked offerings with this merchant payment structure is less favorablepayments to us than voucher transactions, for which we collect payment from customers atinventory suppliers and the timeimpact of sale and remit payment to merchants at a later date.COVID-19.
For the nine months ended September 30, 2019, our net cash used in operating activities from continuing operations was $130.1 million, as compared with a $93.5 million net loss from continuing operations. That difference was primarily due to $223.5 million of non-cash items, including depreciation and amortization, stock-based compensation and a $69.4 million loss from changes in fair value of our investment in Monster LP, partially offset by a $260.1 million decrease from changes in working capital and other assets and liabilities. The working capital impact was primarily related to the seasonal timing of payments to inventory suppliers and to a lesser extent a reduction in gross billings.
For the nine months ended September 30, 2018,2020, our net cash used in operating activities from continuing operations was $133.0 million, as compared with a $47.9 million net loss from continuing operations. That difference was primarily due to a $243.8 million net decrease from changes in working capital and other assets and liabilities. The working capital impact was primarily related to the seasonal timing of payments to inventory suppliers and also includes $42.1 million of the payment to IBM related to the settlement of patent litigation. The difference between our net cash provided by operating activities and our net income from continuing operations due to changes in working capital was partially offset by $158.7 million of non-cash items, including depreciation and amortization and stock-based compensation.
For the nine months ended September 30, 2019, our net cash used in investing activities from continuing operations was $54.9 million. Our net cash used in investing activities included purchases of property and 2018. equipment and capitalized software of $51.9 million.
For the nine months ended September 30, 2018,2020, our net cash used in investingprovided by financing activities also includedwas $180.6 million. Our net cash paidprovided by financing activities included $200.0 million of $57.8borrowings under our revolving credit facility, partially offset by $8.8 million in taxes paid related to net share settlements of stock-based compensation awards, $7.4 million in payments of finance lease obligations and $3.0 million of distributions to noncontrolling interest holders.
49
For the acquisition of Cloud Savings and net cash paid of $17.1 million for acquisitions of intangible assets, including $15.4 million related to the settlement ofnine months ended September 30, 2019, our IBM patent litigation.
We believe that our cash balances, excluding borrowings under the Amended Credit Agreement, and cash generated from operations will be sufficient to meet our working capital requirements and capital expenditures for at least the next 12 months. However, we expect a net loss and negative operating cash flows for the year ended December 31, 2020. We plan to continue to actively manage and optimize our cash balances and liquidity, working capital and operating expenses, although there can be no assurances that we will be able to do so. We have taken several steps to reduce costs and preserve cash in the near-term as described above in Overview.
As of September 30, 2019,2020, we had $196.4$112.2 million in cash held by our international subsidiaries, which is primarily denominated in Euros, British Pounds Sterling, Canadian dollars, and, to a lesser extent, Australian dollars and Japanese yen. In general, it is our practice and intention to re-invest the earnings of our non-U.S. subsidiaries in those operations. We have not, nor do we anticipate the need to, repatriate funds to the United States to satisfy domestic liquidity needs arising in the ordinary course of business.
In May 2018, the Board authorized us to repurchase up to $300.0 million of our common stock under our share repurchase program. During the three and nine months ended September 30, 2019, we repurchased 5,391,084 and 14,027,227 shares for an aggregate purchase price of $15.1 million and $45.2 million (including fees and commissions) under our repurchase program. As of September 30, 2019,2020, up to $245.0 million of common stock remained available for purchase under our program. The timing and amount of share repurchases, if any, will be determined based on market conditions, limitations under the 2019Amended Credit Agreement, share price, available cash and other factors, and the share repurchase program may be terminated at any time. Repurchases will be made in compliance with SEC rules and other legal
requirements and may be made, in part, under a Rule 10b5-1 plan, which permits share repurchases when we might otherwise be precluded from doing so.
Contractual Obligations and Commitments
Our contractual obligations and commitments as of September 30, 20192020 did not materially change from the amounts set forth in our 20182019 Annual Report on Form 10-K, except as disclosed in Item 1, Note 6, Leases.Commitments and Contingencies.
Off-Balance Sheet Arrangements
We did not have any off-balance sheet arrangements as of September 30, 2019.2020.
Critical Accounting Policies and Estimates
The preparation of condensed consolidated financial statements requires management to make estimates and assumptions that affect the reported amounts and classifications of assets and liabilities, revenue and expenses, and related disclosure of contingent liabilities. Management bases its estimates on historical experience and on various other assumptions that are believed to be reasonable under the circumstances, the results of which form the basis for making judgments about the carrying values of assets and liabilities that are not readily apparent from other sources. Actual results may differ from these estimates under different assumptions or conditions.estimates.
Management's Discussion and Analysis of Financial Condition and Results of Operations is based upon our condensed consolidated financial statements, which have been prepared in accordance with U.S. GAAP. Our significant accounting policies are discussed in Item 2, Note 2, Summary of Significant Accounting Policies, and in the notes to the consolidated financial statements included in our Annual Report on Form 10-K for the year ended December 31, 2018.2019. In addition, refer to the critical accounting policies and estimates under Part II, Item 7, Management's Discussion and Analysis of Financial Condition and Results of Operations in our Annual Report on Form 10-K for the year ended December 31, 2018.2019.
51
Recently Issued Accounting Standards
In June 2016,December 2019, the FASB issued ASU 2016-13,2019-12, Financial InstrumentsIncome Taxes (Topic 740) - Credit Losses (Topic 326) - Measurement of Credit Losses of Financial InstrumentsSimplifying the Accounting for Income Taxes.. This ASU requires entitiessimplifies the accounting for income taxes by removing certain exceptions to measure credit losses for financial assets measured at amortized cost based on expected losses rather than incurred losses. For available-for-sale debt securities with unrealized losses, entities will be requiredthe general principles in Topic 740 and also clarifies and amends existing guidance to recognize credit losses through an allowance for credit losses.improve consistent application. The ASU will be effective for annual reporting periods beginning after December 15, 20192020 and interim periods within those annual periods. Although we are still assessing the impact of ASU 2016-13, we believe theperiods and early adoption of this guidance will not have a material impact on our condensed consolidated financial statements.
In August 2018,March 2020, the FASB issued ASU 2018-13,2020-03, Fair Value Measurement (Topic 820) - Disclosure Framework - ChangesCodification Improvements to the Disclosure Requirements for Fair Value MeasurementFinancial Instruments. This ASU modifiesamends a wide variety of Topics in the disclosure requirements in Topic 820, Codification, including Fair Value Measurement, by removing, modifying, or adding certain disclosures.Option measurement and disclosures, revolving-debt arrangements and allowance for credit losses related to leases. The ASU will be effective for annual reporting periods beginning after December 15, 20192020 and interim periods within those annual periods. Earlyperiods and early adoption is permitted, and entities are permitted to early adopt any removed or modified disclosures and delay adoption of the additional disclosures until the effective date.permitted. We are still assessing the impact of ASU 2018-132020-03 on our condensed consolidated financial statements.
In August 2020, the FASB issued ASU 2020-06, Debt—Debt with Conversion and Other Options (Subtopic 470-20) and Derivatives and Hedging—Contracts in Entity’s Own Equity (Subtopic 815-40): Accounting for Convertible Instruments and Contracts in an Entity’s Own Equity. This ASU amends the guidance on convertible instruments and the derivatives scope exception for contracts in an entity's own equity, and also improves and amends the related EPS guidance for both Subtopics. The ASU will be effective for annual reporting periods after December 15, 2021 and interim periods within those annual periods and early adoption is permitted. We are still assessing the impact of ASU 2020-06 on our condensed consolidated financial statements.
There are no other accounting standards that have been issued but not yet adopted that are expected to have a material impact on our condensed consolidated financial position or results of operations.
52
ITEM 3. QUANTITATIVE AND QUALITATIVE DISCLOSURES ABOUT MARKET RISK
We have operations both within the United States and internationally, and we are exposed to market risks in the ordinary course of our business, including the effect of foreign currency fluctuations, interest rate changes and inflation. Information relating to quantitative and qualitative disclosures about thosethese market risks is set forth below.
Foreign Currency Exchange Risk
We transact business in various foreign currencies other than the U.S. dollar, principally the euro, British pound sterling, Canadian dollar and Australian dollar, which exposes us to foreign currency risk. For both the three and nine months ended September 30, 2019,2020, we derived approximately 38.7%40.7% and 39.6% of our revenue from our International segment. Revenue and related expenses generated from our international operations are generally denominated in the local currencies of the corresponding countries. The functional currencies of our subsidiaries that either operate or support thosethese markets are generally the same as the corresponding local currencies. However, the results of operations of, and certain of our intercompany balances associated with, our international operations are exposed to foreign currency exchange rate fluctuations. Upon consolidation, as exchange rates vary, our revenue and other operating results may differ materially from expectations, and we may record significant gains or losses on the re-measurement of intercompany balances.
We assess our foreign currency exchange risk based on hypothetical changes in rates utilizing a sensitivity analysis that measures the potential impact on working capital based on a 10% change (increase and decrease) in currency rates. We use a current market pricing model to assess the changes in the value of the U.S. dollar on foreign currency denominated monetary assets and liabilities. The primary assumption used in this model is a hypothetical 10% weakening or strengthening of the U.S. dollar against those currency exposures as of September 30, 20192020 and December 31, 2018.2019.
As of September 30, 2019,2020, our net working capital deficit (defined as current assets less current liabilities) from subsidiaries that are subject to foreign currency translation risk was $3.6 million.$104.9 million. The potential decreaseincrease in this working capital deficit from a hypothetical 10% adverse change in quoted foreign currency exchange rates would be $0.4 million.$10.5 million. This compares with a $20.8$69.2 million working capital surplusdeficit subject to foreign currency exposure as of December 31, 2018,2019, for which a 10% adverse change would have resulted in a potential increase in this working capital surplusdeficit of $2.1$6.9 million.
Interest Rate Risk
Our cash balance as of September 30, 20192020 consists of bank deposits and government money market funds, so exposure to market risk for changes in interest rates is limited. In April 2016, we issued convertible notes with an aggregate principal amount of $250.0 million (see Item 1, Note 5, Financing Arrangements). The convertible notes bear interest at a fixed rate, so we have no financial statement impact from changes in interest rates. However, changes in market interest rates impact the fair value of the convertible notes along with other variables such as our credit spreads and the market price and volatility of our common stock. In May 2019,June 2020, we entered into the 2019Amended Credit Agreement which provides for aggregate principal borrowings of up to $400.0$225.0 million. As of September 30, 2019,2020, we had no$200.0 million of borrowings outstanding and $20.6 million of outstanding letters of credit under the 2019Amended Credit Agreement. See Item 2, Liquidity and Capital Resources for additional information. Because borrowings under the 2019Amended Credit Agreement bearsbear interest at a variable rate, we are exposed to market risk relating to changes in interest rates if we borrow under the 2019Amended Credit Agreement. We also have $166.7had $133.3 million of lease obligations as of September 30, 2019.2020. Interest rates on existing leases typically do not change unless there is a modification to a lease agreement and as such, we do not believe that the interest rate risk on the lease obligations is significant.
Impact of Inflation
We believe that our results of operations are not materially impacted by moderate changes in the inflation rate. Inflation and changing prices did not have a material effect on our business, financial condition or results of operations for the three and nine months ended September 30, 2019.
53
ITEM 4. CONTROLS AND PROCEDURES
Evaluation of Disclosure Controls and Procedures
Our management, with the participation of our Chief Executive Officer and our Chief Financial Officer, has evaluated the effectiveness of the design and operation of our disclosure controls and procedures pursuant to Rule 13a-15(e) and 15d-15(e) under the Securities Exchange Act of 1934, as amended (the Exchange Act), as of the end of the period covered by this Quarterly Report on Form 10-Q.
Based on this evaluation, our management concluded that, as of September 30, 2019,2020, our disclosure controls and procedures are effective to provide reasonable assurance that information we are required to disclose in reports that we file or submit under the Exchange Act is recorded, processed, summarized and reported within the time periods specified in the Securities and Exchange Commission's rules and forms, and that such information is accumulated and communicated to our management, including our Chief Executive Officer and Chief Financial Officer, as appropriate, to allow timely decisions regarding required disclosure.
Changes in Internal Control over Financial Reporting
There were no changes in our internal control over financial reporting identified in connection with the evaluation required by Rule 13a-15(d) and 15d-15(d) of the Exchange Act that occurred during the period covered by this Quarterly Report on Form 10-Q that have materially affected, or are reasonably likely to materially affect, our internal control over financial reporting. We have not experienced any material impact to our internal controls over financial reporting as a result of COVID-19 and related restrictions. We are continually monitoring and assessing the impact COVID-19 pandemic and related restrictions has on our internal controls to minimize the effect on their design and operating effectiveness.
Limitations on Effectiveness of Controls and Procedures
In designing and evaluating the disclosure controls and procedures, management recognizes that any controls and procedures, no matter how well designed and operated, can provide only reasonable assurance of achieving the desired control objectives. In addition, the design of disclosure controls and procedures must reflect the fact that there are resource constraints and that management is required to apply its judgment in evaluating the benefits of possible controls and procedures relative to their costs.
PART II. OTHER INFORMATION
ITEM 1. LEGAL PROCEEDINGS
For a description of our material pending legal proceedings, please see Item 1, Note 7,6, Commitments and Contingencies, to our condensed consolidated financial statements included in Part I, Item 1 of this Quarterly Report on Form 10-Q.
ITEM 1A. RISK FACTORS
There have been no material changes from the risk factors previously disclosed in Part I, Item 1A, Risk Factors of our Annual Report on Form 10-K for the year ended December 31, 2018,2019, and Quarterly ReportReports on Form 10-Q for the quarterquarters ended March 31, 2019.2020 and June 30, 2020.
56
ITEM 2. UNREGISTERED SALES OF EQUITY SECURITIES AND USE OF PROCEEDS
Recent Sales of Unregistered Securities
During the three months ended September 30, 2019,2020, we did not issue any unregistered equity securities.
Issuer Purchases of Equity Securities
On May 7, 2018, the Board authorized us to repurchase up to $300.0 million of our common stock under our share repurchase program. During the three and nine months ended September 30, 2019, we repurchased 5,391,084 and 14,027,227 shares for an aggregate purchase price of $15.1 million and $45.2 million (including fees and commissions) under our repurchase program. As of September 30, 2019,2020, up to $245.0 million of common stock remained available for purchase under our program. The timing and amount of share repurchases, if any, will be determined based on market conditions, limitations under the 2019Amended Credit Agreement, share price, available cash and other factors, and the share repurchase program may be terminated at any time. We will fund the repurchases, if any, through cash on hand, future cash flows and borrowings under our credit facility. Repurchases will be made in compliance with SEC rules and other legal requirements and may be made in part under a Rule 10b5-1 plan, which permits stockshare repurchases when we might otherwise be precluded from doing so.
| Date | Total Number of Shares Purchased | Average Price Paid Per Share | Total Number of Shares Purchased as Part of Publicly Announced Program | Maximum Number (or Approximate Dollar Value) of Shares that May Yet Be Purchased Under Program | ||||||||||
| July 1-31, 2019 | — | $ | — | — | $ | 260,000,005 | ||||||||
| August 1-31, 2019 | — | — | — | 260,000,005 | ||||||||||
| September 1-30, 2019 | 5,391,084 | 2.79 | 5,391,084 | 245,000,007 | ||||||||||
| Total | 5,391,084 | $ | 2.79 | 5,391,084 | $ | 245,000,007 | ||||||||
The following table provides information about purchases of shares of our common stock during the three months ended September 30, 20192020 related to shares withheld upon vesting of restricted stock units for minimum tax withholding obligations:
| Date | Total Number of Shares Purchased (1) | Average Price Paid Per Share | Total Number of Shares Purchased as Part of Publicly Announced Program | Maximum Number (or Approximate Dollar Value) of Shares that May Yet Be Purchased Under Program | |||||||||
| July 1-31, 2019 | 158,105 | $ | 2.99 | — | — | ||||||||
| August 1-31, 2019 | 78,698 | 2.41 | — | — | |||||||||
| September 1-30, 2019 | 496,458 | 2.79 | — | — | |||||||||
| Total | 733,261 | $ | 2.79 | — | — | ||||||||
| Date | Total Number of Shares Purchased (1) | Average Price Paid Per Share | Total Number of Shares Purchased as Part of Publicly Announced Program | Maximum Number (or Approximate Dollar Value) of Shares that May Yet Be Purchased Under Program | ||||||||||||||||||||||
| July 1-31, 2020 | 4,533 | $ | 16.99 | — | — | |||||||||||||||||||||
| August 1-31, 2020 | 16,235 | 23.59 | — | — | ||||||||||||||||||||||
| September 1-30, 2020 | 17,518 | 31.74 | — | — | ||||||||||||||||||||||
| Total | 38,286 | $ | 26.54 | — | — | |||||||||||||||||||||
ITEM 5. OTHER INFORMATION
ITEM 6. EXHIBITS
Exhibit Number | Description | |||||||||||
| 4.1 | ||||||||||||
| 31.1 | ||||||||||||
| 31.2 | ||||||||||||
| 32.1 | ||||||||||||
| 101.INS ** | XBRL Instance Document | |||||||||||
| 101.SCH | XBRL Taxonomy Extension Schema Document | |||||||||||
| 101.CAL | XBRL Taxonomy Extension Calculation Linkbase Document | |||||||||||
| 101.DEF | XBRL Taxonomy Extension Definition Linkbase Document | |||||||||||
| 101.LAB | XBRL Taxonomy Extension Label Linkbase Document | |||||||||||
| 101.PRE | XBRL Taxonomy Extension Presentation Linkbase Document | |||||||||||
| 104 ** | Cover Page Interactive Data File | |||||||||||
SIGNATURES
Pursuant to the requirements of Section 13 or 15(d) of the Securities Exchange Act of 1934, the registrant has duly caused this report to be signed on its behalf by the undersigned, thereunto duly authorized on this 4th5th day of November 2019.
2020.
| GROUPON, INC. | |||||||||||
| By: | /s/ Melissa Thomas | ||||||||||
| Name: | Melissa Thomas | ||||||||||
| Title: | |||||||||||
59