UNITED STATES
SECURITIES AND EXCHANGE COMMISSION
Washington, D.C. 20549
FORM 10-Q
| [X] | QUARTERLY REPORT PURSUANT TO SECTION 13 OR 15(d) OF THE SECURITIES EXCHANGE ACT OF 1934 |
For the Quarterly Period Ended SeptemberJune 30, 20172019
| [ ] | TRANSITION REPORT PURSUANT TO SECTION 13 OR 15(d) OF THE SECURITIES EXCHANGE ACT OF 1934 |
For the Transition Period from ____________ to ____________
Commission File Number: 000-33167
KIWA BIO-TECH PRODUCTS GROUP CORPORATION
(Exact name of registrant as specified in its charter)
| Nevada | 77-0632186 | |
(State or other jurisdiction of incorporation or organization) | (I.R.S. Employer Identification No.) | |
3200 Guasti Road, Suite #100, Ontario, California | 91761 | |
| (Address of principal executive offices) | (Zip Code) |
(909) 456-8828
(Registrant’s telephone number, including area code)
3200 Guasti Road, Suite #100 Ontario, CA 91761 (Former address)
| ||
Indicate by check mark whether the registrant (1) has filed all reports required to be filed by Section 13 or 15(d) of the Securities Exchange Act of 1934 during the preceding 12 months (or for such shorter period that the registrant was required to file such reports), and (2) has been subject to such filing requirements for the past 90 days. Yes [X] No [ ]
Indicate by check mark whether the registrant has submitted electronically and posted on its corporate Web site, if any, every Interactive Data File required to be submitted and posted pursuant to Rule 405 of Regulation S-T (§ 232.405 of this chapter) during the preceding 12 months (or for such shorter period that the registrant was required to submit and post such files). Yes [X] No [ ]
Indicate by check mark whether the registrant is a large accelerated filer, an accelerated filer, a non-accelerated filer, or a smaller reporting company. See the definitions of “large accelerated filer,” “accelerated filer” and “smaller reporting company” in Rule 12b-2 of the Exchange Act.
| Large accelerated filer [ ] | Accelerated filer [ ] |
Non-accelerated filer [ ] | Smaller reporting company [X] |
| (Do not check if a smaller reporting company) |
Emerging growth company [ ] |
Indicate by check mark whether the registrant is a shell company (as defined in Rule 12b-2 of the Exchange Act). Yes [ ] No [X]
As of December 22, 2017,August 19, 2019, the Company had 12,557,870shares19,484,375 shares of common stock, $0.001 par value, issued and outstanding.
Table of contents
| 2 |
KIWA BIO-TECH PRODUCTS GROUP CORPORATION AND SUBSIDIARIES
CONDENSED CONSOLIDATED BALANCE SHEETS
| September 30, 2017 | December 31, 2016 | |||||||
| (Unaudited) | ||||||||
| ASSETS | ||||||||
| Current assets | ||||||||
| Cash and cash equivalents | $ | 23,275 | $ | 13,469 | ||||
| Accounts receivable, net | 15,245,255 | 1,122,754 | ||||||
| Prepaid expenses | 1,214,261 | 1,417,554 | ||||||
| Rent deposit and other receivable | 127,419 | 38,897 | ||||||
| Advance to suppliers | 2,979,664 | 1,880,044 | ||||||
| Due from related party- non-trade | 963,846 | - | ||||||
| Inventory | 10,826 | - | ||||||
| Deferred cost of goods sold | 10,274,930 | - | ||||||
| Total current assets | 30,839,476 | 4,472,718 | ||||||
| OTHER ASSETS | ||||||||
| Property, plant and equipment, net | 84,453 | 55,319 | ||||||
| Rent deposit – non-current | 38,003 | 34,519 | ||||||
| Due from related party- non-trade | - | 1,522,434 | ||||||
| Deposit for Long-Term investment | 751,050 | - | ||||||
| Deferred tax asset | 246,872 | - | ||||||
| Total non-current assets | 1,120,378 | 1,612,272 | ||||||
| Total assets | $ | 31,959,854 | $ | 6,084,990 | ||||
| LIABILITIES AND SHAREHOLDERS’ EQUITY(DEFICIENCY) | ||||||||
| Current liabilities | ||||||||
| Accounts payable | $ | 8,869,452 | $ | 1,073,094 | ||||
| Advances from customers | 32,686 | - | ||||||
| Due to related parties | 130,199 | 261,259 | ||||||
| Convertible notes payable, net of discount of $13,466 at September 30, 2017 | 286,992 | 150,250 | ||||||
| Derivative liabilities | 370,733 | - | ||||||
| Notes payable | 360,000 | 360,000 | ||||||
| Salary payable | 1,315,413 | 1,154,921 | ||||||
| Taxes payable | - | 414,970 | ||||||
| Interest payable | 1,733,544 | 1,524,988 | ||||||
| Other payables and accruals | 1,640,889 | 924,875 | ||||||
| Deferred revenue | 14,996,057 | - | ||||||
| Current liabilities of discontinued operation | - | 4,464,685 | ||||||
| Total current liabilities | 29,735,965 | 10,329,042 | ||||||
| Convertible note payable – non-current, net of discount of $ 455,827 at September 30, 2017 | 370,321 | - | ||||||
| Total Liabilities | 30,106,286 | 10,329,042 | ||||||
| Shareholder’s equity (deficiency) | ||||||||
| Preferred stock - $0.001 par value, Authorized 20,000,000 shares. Issued and outstanding 500,000 and 500,000 shares at September 30, 2017 and December 31, 2016, respectively. | 500 | 500 | ||||||
| Common stock - $0.001 per value. Authorized 100,000,000 shares. Issued and outstanding 11,167,719 and 8,728,981 shares at September 30, 2017 and December 31, 2016, respectively | 11,168 | 8,729 | ||||||
| Additional paid-in capital | 18,733,056 | 15,234,878 | ||||||
| Statutory Reserve | 127,473 | 127,473 | ||||||
| Accumulated deficit | (17,072,416 | ) | (19,561,255 | ) | ||||
| Accumulated other comprehensive gain (loss) | 53,787 | (54,377 | ) | |||||
| Total shareholders’ equity (deficiency) | 1,853,568 | (4,244,052 | ) | |||||
| Total liabilities and shareholder’s equity | $ | 31,959,854 | $ | 6,084,990 | ||||
| June 30, 2019 | December 31, 2018 | |||||||
| (Unaudited) | ||||||||
| ASSETS | ||||||||
| Current assets | ||||||||
| Cash and cash equivalents | $ | 10,099 | $ | 7,859 | ||||
| Accounts receivable, net | 3,523,166 | 6,751,113 | ||||||
| Prepaid expenses | 1,839,940 | 2,259,565 | ||||||
| Rent deposits and other receivables | 366,460 | 323,362 | ||||||
| Advance to suppliers | 23,007,464 | 15,763,198 | ||||||
| Due from related parties - non-trade | 18,244 | 12,108 | ||||||
| Inventories | 114,618 | 1,643,033 | ||||||
| Deferred cost of goods sold | 2,517,777 | 4,929,855 | ||||||
| Total current assets | 31,397,768 | 31,690,093 | ||||||
| Property, plant and equipment, net | 117,785 | 93,181 | ||||||
| Rent deposits-non current | - | 613 | ||||||
| Deposit for long-term investment | 728,268 | 727,155 | ||||||
| Total non-current assets | 846,053 | 820,949 | ||||||
| Total assets | $ | 32,243,821 | $ | 32,511,042 | ||||
| LIABILITIES AND stockholders’ EQUITY | ||||||||
| Current liabilities | ||||||||
| Accounts payable | $ | 2,551,161 | $ | 1,611,273 | ||||
| Advances from customers | 476,902 | 580,720 | ||||||
| Due to related parties | 291,311 | 570,921 | ||||||
| Convertible notes payable, net of discount of $631,050 and $99,907 of June 30, 2019 and December 31, 2018, respectively | 1,811,718 | 971,086 | ||||||
| Derivative liabilities | 68,591 | 6,621 | ||||||
| Notes payable | 138,000 | 360,000 | ||||||
| Salary payable | 1,259,675 | 1,024,959 | ||||||
| Income taxes payable | 4,170,911 | 2,946,926 | ||||||
| Interest payable | 2,158,422 | 2,020,821 | ||||||
| Other payables and accruals | 2,840,484 | 2,940,088 | ||||||
| Deferred revenue | 3,373,486 | 6,751,113 | ||||||
| Total current liabilities | 19,140,661 | 19,784,528 | ||||||
| Total liabilities | 19,140,661 | 19,784,528 | ||||||
| STOCKHOLDERS’ EQUITY | ||||||||
| Preferred stock - $0.001 par value, Authorized 20,000,000 shares. Series A - Issued and outstanding 500,000 and 500,000 shares (liquidation preference in $1,000,000) at June 30, 2019 and December 31, 2018, respectively; Series B - Issued and outstanding 811,148 and 811,148 shares (liquidation preference in $1,054,492) at June 30, 2019 and December 31, 2018, respectively. | 1,311 | 1,311 | ||||||
| Common stock - $0.001 per value. Authorized 100,000,000 shares. Issued and outstanding 19,484,375 and 16,885,860 shares at June 30, 2019 and December 31, 2018, respectively. | 19,485 | 16,886 | ||||||
| Additional paid-in capital | 29,283,029 | 27,047,457 | ||||||
| Statutory Reserve | 1,022,605 | 1,022,605 | ||||||
| Accumulated deficit | (16,658,597 | ) | (14,803,530 | ) | ||||
| Accumulated other comprehensive loss | (564,673 | ) | (558,215 | ) | ||||
| Total stockholders’ equity | 13,103,160 | 12,726,514 | ||||||
| Total liabilities and stockholders’ equity | $ | 32,243,821 | $ | 32,511,042 | ||||
The accompanying notes are an integral part of these unaudited condensed consolidated financial statements.
| 3 |
KIWA BIO-TECH PRODUCTS GROUP CORPORATION AND SUBSIDIARIES
CONDENSED CONSOLIDATED STATEMENTS OF OPERATIONS AND COMPREHENSIVE INCOME (LOSS)
(LOSS)
(Unaudited)
| Three Months Ended June 30, | Six Months Ended June 30, | |||||||||||||||
| 2019 | 2018 | 2019 | 2018 | |||||||||||||
| Revenue | $ | 10,924,978 | $ | 5,334,830 | $ | 20,467,976 | $ | 14,086,221 | ||||||||
| Cost of goods sold | (7,752,728 | ) | (3,873,502 | ) | (15,119,315 | ) | (10,180,066 | ) | ||||||||
| Gross Profit | 3,172,250 | 1,461,328 | 5,348,661 | 3,906,155 | ||||||||||||
| Operating expenses | ||||||||||||||||
| Provision for deferred cost of goods sold | 2,448,764 | - | 2,448,764 | |||||||||||||
| Selling expenses | 63,501 | 161,256 | 101,307 | 345,567 | ||||||||||||
| Research and development expenses | - | 39,230 | - | 78,543 | ||||||||||||
| General and administrative expenses | 1,403,172 | 1,514,298 | 2,362,766 | 3,079,028 | ||||||||||||
| Total operating expenses | 3,915,437 | 1,714,784 | 4,912,837 | 3,503,138 | ||||||||||||
| Operating income (loss) | (743,187 | ) | (253,456 | ) | 435,824 | 403,017 | ||||||||||
| Other income/(expenses), net | ||||||||||||||||
| Change in fair value of derivative liabilities | 27,943 | 72,433 | 33,174 | 202,371 | ||||||||||||
| Interest expense | (835,545 | ) | (152,564 | ) | (1,139,513 | ) | (307,927 | ) | ||||||||
| Other income/(expenses) | (2,920 | ) | - | 51,768 | (905 | ) | ||||||||||
| Exchange gain (loss) | 22,021 | 56,285 | (1,410 | ) | 18,253 | |||||||||||
| Total other income/(expenses), net | (788,501 | ) | (23,846 | ) | (1,055,981 | ) | (88,208 | ) | ||||||||
| Income (loss) from operations before income taxes | (1,531,688 | ) | (277,302 | ) | (620,157 | ) | 314,809 | |||||||||
| (Provision) benefit for income taxes | ||||||||||||||||
| Current | (714,002 | ) | (358,066 | ) | (1,234,910 | ) | (897,209 | ) | ||||||||
| Deferred | - | - | - | - | ||||||||||||
| Total provision for income taxes | (714,002 | ) | (358,066 | ) | (1,234,910 | ) | (897,209 | ) | ||||||||
| Net loss | (2,245,690 | ) | (635,368 | ) | (1,855,067 | ) | (582,400 | ) | ||||||||
| Other comprehensive loss | ||||||||||||||||
| Foreign currency translation adjustment | (418,670 | ) | (781,013 | ) | (6,458 | ) | (281,707 | ) | ||||||||
| Total comprehensive loss | $ | (2,664,360 | ) | $ | (1,416,381 | ) | $ | (1,861,525 | ) | $ | (864,107 | ) | ||||
| Earnings per share: | ||||||||||||||||
| Basic | $ | (0.12 | ) | $ | (0.04 | ) | $ | (0.10 | ) | $ | (0.04 | ) | ||||
| Diluted | (0.12 | ) | (0.04 | ) | (0.10 | ) | (0.04 | ) | ||||||||
| Weighted average number of common shares outstanding – basic and diluted | 19,343,881 | 16,479,316 | 18,272,950 | 16,201,020 | ||||||||||||
(Unaudited)The accompanying notes are an integral part of these condensed consolidated financial statements.
| 4 |
| Three Months Ended September 30, | Nine Months Ended September 30, | |||||||||||||||
| 2017 | 2016 | 2017 | 2016 | |||||||||||||
| Revenue | $ | 31,025 | $ | 1,185,309 | $ | 30,411 | $ | 1,185,310 | ||||||||
| Cost of goods sold | (19,697 | ) | (770,451 | ) | (19,308 | ) | (770,451 | ) | ||||||||
| Gross Profit | 11,328 | 414,858 | 11,103 | 414,859 | ||||||||||||
| Operating expenses | ||||||||||||||||
| Research and development expenses | 37,469 | 37,303 | 110,194 | 112,580 | ||||||||||||
| Selling expenses | 147,782 | - | 236,252 | - | ||||||||||||
| General and administrative expenses | 1,068,446 | 181,333 | 2,073,035 | 375,915 | ||||||||||||
| Total operating expenses | 1,253,697 | 218,636 | 2,419,481 | 488,495 | ||||||||||||
| Operating Income (Loss) | (1,242,369 | ) | 196,222 | (2,408,378 | ) | (73,636 | ) | |||||||||
| Other income/(expense), net | ||||||||||||||||
| Trademark license income-related party | - | 76,235 | - | 786,329 | ||||||||||||
| Change in fair value of derivative liabilities | 205,612 | - | 199,051 | - | ||||||||||||
| Interest expense | (168,573 | ) | (47,745 | ) | (356,256 | ) | (142,296 | ) | ||||||||
| Other income | 372,711 | - | 373,512 | - | ||||||||||||
| Foreign exchange loss | (18,257 | ) | - | (35,342 | ) | - | ||||||||||
| Total other income/(expense), net | 391,493 | 28,490 | 180,965 | 644,033 | ||||||||||||
| Income (loss) from continuing operations before income taxes | (850,876 | ) | 224,712 | (2,227,413 | ) | 570,397 | ||||||||||
| Provision (benefit) for income taxes | ||||||||||||||||
| Current | - | 78,945 | - | 78,945 | ||||||||||||
| Deferred | (123,068 | ) | - | (220,860 | ) | - | ||||||||||
| Total provision (benefit) for income taxes | (123,068 | ) | 78,945 | (220,860 | ) | 78,945 | ||||||||||
| Income (loss) from continuing operations | (727,808 | ) | 145,767 | (2,006,553 | ) | 491,452 | ||||||||||
| Discontinued operations: | ||||||||||||||||
| Loss from discontinued operations, net of taxes | - | (52,166 | ) | (16,790 | ) | (159,745 | ) | |||||||||
| Gain on disposal of discontinued operations, net of taxes | - | - | 4,512,182 | - | ||||||||||||
| Income (loss) from discontinued operations, net of taxes | - | (52,166 | ) | 4,495,392 | (159,745 | ) | ||||||||||
| Net Income (loss) | (727,808 | ) | 93,601 | 2,488,839 | 331,707 | |||||||||||
| Other comprehensive income (loss) | ||||||||||||||||
| Foreign currency translation adjustment | 39,845 | 9,765 | 108,164 | 103,870 | ||||||||||||
| Total comprehensive income (loss) | $ | (687,963 | ) | $ | 103,366 | $ | 2,597,003 | $ | 435,577 | |||||||
| Earnings per share – Basis: | ||||||||||||||||
| Income (loss) from continuing operations | (0.07 | ) | 0.03 | (0.20 | ) | 0.12 | ||||||||||
| Discontinued operations | - | (0.01 | ) | 0.46 | (0.04 | ) | ||||||||||
| Net Income (loss) | (0.07 | ) | 0.02 | 0.26 | 0.08 | |||||||||||
| Earnings per share – Diluted: | ||||||||||||||||
| Income (loss) from continuing operations | (0.07 | ) | 0.03 | (0.15 | ) | 0.06 | ||||||||||
| Discontinued operations | - | (0.01 | ) | 0.38 | (0.02 | ) | ||||||||||
| Net Income (loss) | (0.07 | ) | 0.02 | 0.23 | 0.04 | |||||||||||
| Weighted average number of common shares outstanding - basic | 10,640,453 | 5,447,326 | 9,846,791 | 4,133,119 | ||||||||||||
| Weighted average number of common shares outstanding - diluted | 11,581,789 | 6,442,528 | 11,891,678 | 9,555,574 | ||||||||||||
KIWA BIO-TECH PRODUCTS GROUP CORPORATION AND SUBSIDIARIES
CONSOLIDATED STATEMENTS OF CHANGES IN STOCKHODERS’ EQUITY
| Six-Month Period Ended June 30, 2018 | ||||||||||||||||||||||||||||||||||||
| Preferred Stock | Common Stock | Additional Paid-in | Statutory | Accumulated | Accumulated Other Comprehensive | Total Stockholders’ | ||||||||||||||||||||||||||||||
| Shares | Amount | Shares | Amount | Capital | Reserve | Deficit | Gain/(Loss) | Equity | ||||||||||||||||||||||||||||
| Balance, January 1, 2018 | 1,311,148 | 1,311 | 15,202,965 | 15,203 | 24,455,291 | 458,334 | (14,583,080 | ) | 323,776 | 10,670,835 | ||||||||||||||||||||||||||
| Issuance of common shares for consulting service | - | - | 917,500 | 918 | 1,759,082 | - | - | - | 1,760,000 | |||||||||||||||||||||||||||
| Net income | 52,968 | 52,968 | ||||||||||||||||||||||||||||||||||
| Foreign currency translation adjustments | - | - | - | - | - | - | - | 499,306 | 499,306 | |||||||||||||||||||||||||||
| Balance, March 31, 2018 | 1,311,148 | 1,311 | 16,120,465 | 16121 | 26,214,373 | 458,334 | (14,530,112 | ) | 823,082 | 12,983,109 | ||||||||||||||||||||||||||
| Issuance of common shares for Cash | 187,700 | 188 | 235,412 | 235,600 | ||||||||||||||||||||||||||||||||
| Issuance of common shares for consulting service | - | - | 136,300 | 136 | 181,914 | - | - | - | 182,050 | |||||||||||||||||||||||||||
| Issuance of common shares to employee | 6,507 | 7 | 7,802 | 7,809 | ||||||||||||||||||||||||||||||||
| Conversion of convertible note | 126,045 | 126 | 78,273 | 78,399 | ||||||||||||||||||||||||||||||||
| Net loss | (635,368 | ) | (635,368 | ) | ||||||||||||||||||||||||||||||||
| Foreign currency translation adjustments | - | - | - | - | - | - | - | (781,013 | ) | (781,013 | ) | |||||||||||||||||||||||||
| Balance, June 30, 2018 | 1,311,148 | 1,311 | 16,577,017 | 16,578 | 26,717,774 | 458,334 | (15,165,480 | ) | 42,069 | 12,070,586 | ||||||||||||||||||||||||||
| Six-Month Period Ended June 30, 2019 | ||||||||||||||||||||||||||||||||||||
| Accumulated | ||||||||||||||||||||||||||||||||||||
| Additional | Other | Total | ||||||||||||||||||||||||||||||||||
| Preferred Stock | Common Stock | Paid-in | Statutory | Accumulated | Comprehensive | Stockholders’ | ||||||||||||||||||||||||||||||
| Shares | Amount | Shares | Amount | Capital | Reserve | Deficit | Gain/(Loss) | Equity | ||||||||||||||||||||||||||||
| Balance, January 1, 2019 | 1,311,148 | 1,311 | 16,885,260 | 16,886 | 27,047,457 | 1,022,605 | (14,803,530 | ) | (558,215 | ) | 12,726,514 | |||||||||||||||||||||||||
| Issuance of common shares as convertible note issuance costs | - | - | 57,500 | 58 | 46,917 | - | - | - | 46,975 | |||||||||||||||||||||||||||
| Issuance of common shares for Liabilities settlement | - | - | 300,000 | 300 | 221,700 | - | - | - | 222,000 | |||||||||||||||||||||||||||
| Issuance of common shares for convertible notes | - | - | 1,040,000 | 1,040 | (1,040 | ) | - | - | - | |||||||||||||||||||||||||||
| Issuance of common shares for consulting service | - | - | 180,000 | 180 | 161,820 | - | - | - | 162,000 | |||||||||||||||||||||||||||
| Issuance of common shares to employee | - | - | 10,078 | 10 | 8,859 | - | - | - | 8,869 | |||||||||||||||||||||||||||
| Fair value of beneficial conversion feature of convertible note | - | - | - | - | 1,200,281 | - | - | - | 1,200,281 | |||||||||||||||||||||||||||
| Conversion of convertible note | - | - | 395,959 | 396 | 78,004 | - | - | - | 78,400 | |||||||||||||||||||||||||||
| Net income | 390,623 | 390,623 | ||||||||||||||||||||||||||||||||||
| Foreign currency translation adjustments | - | - | - | - | - | - | - | 412,212 | 412,212 | |||||||||||||||||||||||||||
| Balance, March 31, 2019 | 1,311,148 | 1,311 | 18,868,797 | 18,870 | 28,763,998 | 1,022,605 | (14,412,907 | ) | (146,003 | ) | 15,247,874 | |||||||||||||||||||||||||
| Issuance of common shares for consulting service | - | - | 604,999 | 605 | 510,244 | - | - | - | 510,849 | |||||||||||||||||||||||||||
| Issuance of common shares to employee | 10,579 | 10 | 8,787 | 8,797 | ||||||||||||||||||||||||||||||||
| Net loss | (2,245,690 | ) | (2,245,690 | ) | ||||||||||||||||||||||||||||||||
| Foreign currency translation adjustments | - | - | - | - | - | - | - | (418,670 | ) | (418,670 | ) | |||||||||||||||||||||||||
| Balance, June 30, 2019 | 1,311,148 | 1,311 | 19,484,375 | 19,485 | 29,283,029 | 1,022,605 | (16,658,597 | ) | (564,673 | ) | 13,103,160 | |||||||||||||||||||||||||
The accompanying notes are an integral part of these unaudited condensed consolidated financial statements.
KIWA BIO-TECH PRODUCTS GROUP CORPORATION AND SUBSIDIARIES
CONDENSED CONSOLIDATED STATEMENTS OF CASH FLOWS
(Unaudited)
| Nine Months Ended September 30, | ||||||||
| 2017 | 2016 | |||||||
| Cash flows from continuing operating activities: | ||||||||
| Net income | $ | 2,488,839 | $ | 331,707 | ||||
| (Income) loss from discontinued operations, net of taxes | (4,495,392 | ) | 159,745 | |||||
| Net Income (loss) from continuing operations | (2,006,553 | ) | 491,452 | |||||
| Adjustments to reconcile net income to net cash used in continuing operating activities: | ||||||||
| Bad debt | 237,998 | - | ||||||
| Depreciation | 29,527 | 13,039 | ||||||
| Accrued interest | 356,256 | 142,296 | ||||||
| Stock compensation for consulting fee | 474,301 | 57,717 | ||||||
| Gain on derivative liabilities | (199,051 | ) | - | |||||
| Deferred income tax | (241,452 | ) | - | |||||
| Changes in continuing operating assets and liabilities: | ||||||||
| Accounts receivable | (14,002,636 | ) | (1,240,550 | ) | ||||
| Prepaid expenses | 47,169 | (7,500 | ) | |||||
| Rent deposit and other receivable | (86,938 | ) | (37,809 | ) | ||||
| Advance to suppliers | (1,071,968 | ) | (1,700,605 | ) | ||||
| Due from related party – non-trade | 611,155 | - | ||||||
| Inventory | (10,588 | ) | - | |||||
| Deferred cost of goods sold | (10,049,349 | ) | ||||||
| Accounts payable | 7,579,497 | 794,868 | ||||||
| Advance from customers | 31,968 | - | ||||||
| Due to related parties | 110,690 | 150,411 | ||||||
| Salary payable | 157,968 | 93,993 | ||||||
| Taxes payable | (409,408 | ) | 78,945 | |||||
| Other payables and accruals | 407,319 | 425,985 | ||||||
| Deferred revenue | 14,666,825 | |||||||
| Net cash used in continuing operating activities | (3,367,270 | ) | (737,758 | ) | ||||
| Net cash used by discontinued operations | - | - | ||||||
| Net cash used in operating activities | (3,367,270 | ) | (737,758 | ) | ||||
| Cash flows from investing activities: | ||||||||
| Payment of deposit for Long-Term investment | (734,561 | ) | - | |||||
| Purchase of property, plant and equipment | (58,427 | ) | (79,604 | ) | ||||
| Net cash used in investing activities | (792,988 | ) | (79,604 | ) | ||||
| Cash flows from financing activities: | ||||||||
| Working capital borrowed from related parties, net of payments to related parties | 30,346 | 51,500 | ||||||
| Proceeds from sale of common stock | 3,221,127 | 766,281 | ||||||
| Proceeds from convertible notes | 976,356 | - | ||||||
| Net cash provided by financing activities | 4,227,829 | 817,781 | ||||||
| Effect of exchange rate change | (57,765 | ) | (595 | ) | ||||
| Cash and cash equivalents: | ||||||||
| Net increase | 9,806 | (176 | ) | |||||
| Balance at beginning of period | 13,469 | 721 | ||||||
| Balance at end of period | $ | 23,275 | $ | 545 | ||||
| Non-cash financing activities: | ||||||||
| Issuance of common stock for debt settlements | $ | - | $ | 3,191,974 | ||||
| Issuance of common stock for consulting services | $ | 234,396 | $ | - | ||||
| Issuance of common stock for financing services | $ | 1,022,156 | $ | - | ||||
| Supplemental Disclosures of Cash flow Information: | ||||||||
| Cash paid for interest | $ | - | $ | - | ||||
| Cash paid for income taxes | $ | 457,564 | $ | - | ||||
| Six Months Ended June 30, | ||||||||
| 2019 | 2018 | |||||||
| Cash flows from continuing operating activities: | ||||||||
| Net loss | $ | (1,855,067 | ) | $ | (582,400 | ) | ||
| Adjustments to reconcile net loss to net cash used in operating activities: | ||||||||
| Depreciation | 10,588 | 20,451 | ||||||
| Bad debt expense | 365,188 | |||||||
| Provision for deferred cost of goods sold | 2,448,764 | |||||||
| Accrued interest | 137,601 | 307,927 | ||||||
| Stock compensation expense | 1,122,712 | 1,276,269 | ||||||
| Gain on derivative liabilities | (33,174 | ) | (202,371 | ) | ||||
| Changes in continuing operating assets and liabilities: | ||||||||
| Accounts receivable | (151,482 | ) | (7,241,877 | ) | ||||
| Prepaid expenses | 419,569 | 36,793 | ||||||
| Rent deposit and other receivables | (184,778 | ) | (431,569 | ) | ||||
| Advance to suppliers | (7,535,571 | ) | 6,608,056 | |||||
| Due from related party – non-trade | (33,462 | ) | (4,957 | ) | ||||
| Inventory | 1,549,368 | 1,034,641 | ||||||
| Deferred cost of goods sold | - | (5,294,537 | ) | |||||
| Accounts payable | 948,712 | (926,055 | ) | |||||
| Salary payable | 235,244 | 203,670 | ||||||
| Taxes payable | 1,234,161 | 877,180 | ||||||
| Advances from customers | (105,969 | ) | 64,943 | |||||
| Other payables and accruals | (103,367 | ) | 770,480 | |||||
| Deferred revenue | - | 7,241,877 | ||||||
| Net cash provided by (used in) operating activities | (1,530,963 | ) | 3,758,521 | |||||
| Cash flows from investing activities: | ||||||||
| Purchase of property, plant and equipment | (38,890 | ) | (3,488 | ) | ||||
| Payment of deposit for long-term investment | - | - | ||||||
| Net cash used in investing activities | (38,890 | ) | (3,488 | ) | ||||
| Cash flows from financing activities: | ||||||||
| Borrowings from related parties, net | (252,733 | ) | 209,111 | |||||
| Proceeds from sale of common stock | - | 235,600 | ||||||
| Proceeds from convertible notes | 1,247,256 | - | ||||||
| Net cash provided by financing activities | 994,523 | 444,711 | ||||||
| Effect of exchange rate change | 577,570 | (201,693 | ) | |||||
| Cash and cash equivalents: | ||||||||
| Net increase | 2,240 | 3,998,051 | ||||||
| Balance at beginning of period | 7,859 | 1,083,539 | ||||||
| Balance at end of period | $ | 10,099 | $ | 5,081,590 | ||||
| Non-cash financing activities: | ||||||||
| Issuance of common stock for consulting services | $ | 672,849 | $ | 1,942,050 | ||||
| Issuance of common stock for financing related services | $ | 46,975 | $ | - | ||||
| Issuance of common stock for debts settlement | $ | 222,000 | ||||||
| Conversion of convertible note | $ | 78,400 | ||||||
| Supplemental Disclosures of Cash Flow Information: | ||||||||
| Cash paid for interest | $ | - | $ | - | ||||
| Cash paid for income taxes | $ | 3,803 | $ | - | ||||
The accompanying notes are an integral part of these unaudited condensed consolidated financial statements.
KIWA BIO-TECH PRODUCTS GROUP CORPORATION AND SUBSIDIARIES
NOTES TO CONDENSED CONSOLIDATED FINANCIAL STATEMENTS
(UNAUDITED)
1.Description of Business and Organization
Organization
Kiwa Bio-Tech Products Group Corporation (“the Company”) is the result of a share exchange transaction accomplished on March 12, 2004 between the shareholders of Kiwa Bio-Tech Products Group Ltd. (“Kiwa BVI”), a company originally organized under the laws of the British Virgin Islands on June 5, 2002 and Tintic Gold Mining Company (“Tintic”), a corporation originally incorporated in the state of Utah on June 14, 1933 to perform mining operations in Utah. The share exchange resulted in a change of control of Tintic, with former Kiwa BVI stockholders owning approximately 89% of Tintic on a fully diluted basis and Kiwa BVI surviving as a wholly-owned subsidiary of Tintic. Subsequent to the share exchange transaction, Tintic changed its name to Kiwa Bio-Tech Products Group Corporation. On July 21, 2004, the Company completed its reincorporation in the State of Delaware. On March 8, 2017, wethe Company completed ourits reincorporation in the State of Nevada.
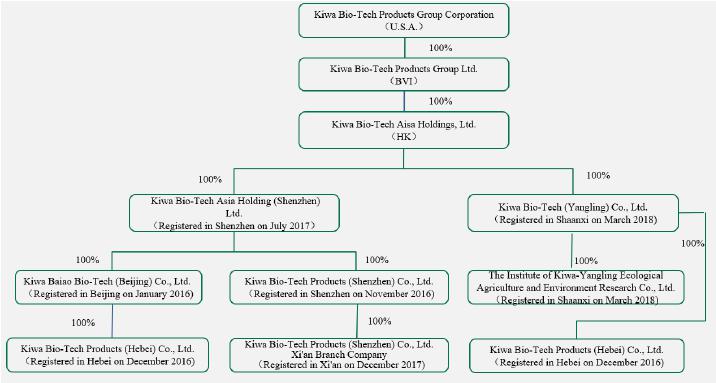
The Company operates through a series of subsidiaries in the Peoples Republic of China as detailed in the following Organizational Chart. The Company had previously operated its business through its subsidiaries Kiwa Bio-Tech Products (Shandong) Co., Ltd. (“Kiwa Shandong”) and Tianjin Kiwa Feed Co., Ltd. (“Kiwa Tianjin”). Kiwa Tianjin has been dissolved since July, 11, 2012. On February 11, 2017, the Company entered an Equity Transfer Agreement with Dian Shi Cheng Jing (Beijing) Technology Co. (“Transferee”) to transfer all of shareholders’ right, title and interest in Kiwa Shandong to the Transferee for RMB1.00. On April 12, 2017, the government processing of transfer has been completed. Currently, the Companycurrently mainly operates its business through its subsidiaries Kiwa Baiao Bio-Tech (Beijing) Co., Ltd. (“Kiwa Beijing”), which was incorporated in China in January 2016, Kiwa Bio-Tech Products (Shenzhen) Co., Ltd. (“Kiwa Shenzhen”), which was incorporated in China in November 2016, and Kiwa Bio-Tech Products (Hebei) Co., Ltd. (“Kiwa Hebei”), which was incorporated in China in December 2016.2016, Kiwa Beijing was acquired from a group of unrelated third parties in January 2016 together with its holding company HK Baina Group Holding Company for approximately $34,000 (RMB 220,000) and renamed to Kiwa Baiao Bio-Tech (Beijing)Products (Shenzhen) Co., Ltd. from Oriental BainaXian Branch Company, (“Kiwa Xian”), which was incorporated in China in December 2017, Kiwa Bio-Tech (Yangling) Co., Ltd. (“Kiwa Yangling”), which incorporated in February 2016. HK Baina Group Holding CompanyMarch 2018, and Oriental BainaThe Institute of Kiwa-Yangling Ecological Agriculture and Environment Research Co., Ltd. have no operations prior to the acquisition and the purchase price was initially recorded as goodwill and fully impaired at the year end of 2016.(“Kiwa Institute”), which incorporated in March 2018. In July 2017, the Company established Kiwa Bio-Tech Asia Holding (Shenzhen) Ltd. (“Kiwa Asia”) to be the direct holding company of Kiwa Beijing, Kiwa Shenzhen, Kiwa Xian, Kiwa Institue and Kiwa Hebei. The Company established Inner Mongolia Jing Nong Investment & Management, Ltd. (“Kiwa Jing Nong”) in August 2017.

Business
The Company develops, manufactures, distributes and markets innovative, cost-effective and environmentally safe bio-technological products for agricultural use. OurThe Company’s products are designed to enhance the quality of human life by increasing the value, quality and productivity of crops and decreasing the negative environmental impact of chemicals and other wastes.
Prior to August 2016,2.Going concern
The Company’s unaudited condensed consolidated financial statements have been prepared assuming that the Company did not have any license to sell its bio-technological fertilizer productswill continue as a going concern, which contemplates the realization of assets and the satisfaction of liabilities in Chinathe normal course of business.
As of June 30, 2019, and could not generate direct sales on its own. InsteadDecember 31, 2018, the Company had been licensing its trademark to Kangtan Gerui (Beijing) Bio-Tech Co., Ltd. (“Gerui”), a related party (see Note 10), in China to sell fertilizers. Thean accumulated deficit of $16,658,597 and $14,803,530, respectively, and the Company charged Gerui 10%incurred net loss of net sales$1,855,067 and $582,400 for the six months ended June 30, 2019 and 2018, respectively, and had negative operating cash flow of fertilizers bearing$1,530,963 for the six months ended June 30, 2019. These circumstances, among others, raise substantial doubt about the Company’s trademark.ability to continue as a going concern. The trademark license income was recorded in the captioned “Trademark license income-related party” in the accompanying unaudited condensed consolidated financial statements do not include any adjustments that might result from the outcome of this uncertainty. The unaudited condensed financial statements also do not include any adjustments relating to the recoverability and classification of recorded asset amounts, or amounts and classifications of liabilities that might be necessary should the Company be unable to continue as a going concern.
The Company has assessed its ability to continue as a going concern for a period of one year from the date of the issuance of these unaudited condensed financial statements. In assessing the Company’s liquidity, the Company monitors and analyzes its cash on-hand and its operating and capital expenditure commitments. The Company’s liquidity needs are to meet its working capital requirements, operating expenses and capital expenditure obligations. As of June 30, 2019, Kiwa Hebei is committed to pay a RMB10, 000,000 based on the payment milestone in an equity purchase agreement.
The Company engages in the business for organically bio-fertilizer and its customers are mainly agricultural cooperative company and distributors who then resell its products to individual farmers. Because the crop growing cycle usually takes approximately 3 to 9 months in the agricultural industry, it will take approximately similar time frame of 3 to 9 months for farmers to harvest crops and to realize profits to repay the Company’s distributors. The Company’s current payment terms on these customers are ranging from 60 days to 9 months after receipts of the goods depending on the creditworthiness of these customers. As a result, the Company’s accounts receivable turnover ratio is normally low due to the nature of the Company’s business. In addition, the Company’s business is capital intensive as the Company needs to make advance payment to its suppliers to secure timely delivery and current market price of raw materials. Debt financing in the form of notes payable and loans from related parties have been utilized to finance the working capital requirements of the Company.
The Company sold Convertible Promissory Notes (“Notes”) in the aggregate principal amount of $1,665,000 in February and March 2019. As of June 30, 2019, the Company’s working capital was approximately $12.3 million and the Company had only cash of approximately $10,000, with remaining current assets mainly composed of advance to suppliers, accounts receivable, prepaid expenses, and deferred cost of goods sold.
Although the Company believes that it can realize its current assets in the normal course of business, the Company’s ability to repay its current obligations will depend on the future realization of its current assets and the future operating revenues generated from its products. Because the Chinese Government is continuously to promote green environment and implement quality standards and environmentally sensitive policies in the Agricultural industry, the Company expects its revenues from its innovated and highly effective products, Compound Microbial Fertilizer and Bio-Water Soluble Fertilizer, will continue to grow in its business. In addition, the Company’s marketing team is expanding to the Western areas of China and Hainan province and it expects its revenues will continue to grow in 2019. Meanwhile, the Company expects to continue to gain market shares in its existing sales channel bases in the Northern and the Southern areas of China due to the good quality of the products and better reputation in the industry.
| 8 |
Management has considered its historical experience, the economic environment, trends in the Agricultural industry, the realization of the accounts receivables and advance to suppliers as of June 30, 2019. The Company expects to realize the balance of its current assets within the normal operating cycle of a twelve-month period. If the Company is unable to realize its current assets within the normal operating cycle of a twelve-month period, the Company may have to consider supplementing its available sources of funds through the following sources:
| ● | the Company will continuously seek additional equity financing to support its working capital; |
| ● | other available sources of financing from PRC banks and other financial institutions; |
| ● | financial support and credit guarantee commitments from the Company’s major shareholder. |
Based on the above considerations, management is of the opinion that it does not have sufficient funds to meet its working capital requirements and debt obligations as they become due one year from the date of this report. If the Company can’t raise enough funds, it might be unable to fund its future cash requirement on a timely basis and under acceptable terms and conditions and may not have sufficient liquidity to maintain operations and comprehensive income. In August 2016,repay its liabilities for the Company obtained a fertilizer sales permit from the Chinese government.next twelve months. As a result, the Company ceasedmay be unable to implement its cooperation with Gerui and begancurrent plans for expansion, repay its debt obligations or respond to sell products directly to customerscompetitive pressures, any of which would have a material adverse effect on its own.business, prospects, financial condition and results of operations.
2.3. Summaries of Significant Accounting Policies
BasicBasis of presentation
The accompanying unaudited condensed consolidated financial statements have been prepared in accordance with accounting principles generally accepted in the United States of America (“U.S. GAAP”) for information pursuant to the rules and regulations of the Securities Exchange Commission (“SEC”).
In the opinion of management, all adjustments, consisting only of normal recurring adjustments, considered necessary to give a fair presentation have been included. Interim results are not necessarily indicative of results of a full year. The information in this Form 10-Q should be read in conjunction with information included in the annual report for the fiscal year ended December 31, 20162018 on Form 10-K/A10-K filed with the SEC on November 22, 2017.April 12, 2019.
Principle of Consolidation
These consolidated unaudited condensed financial statements include the financial statements of the Company and its wholly-owned subsidiaries, Kiwa BVI, Hong Kong Baina Group HoldingKiwa Asia Holdings Company, Kiwa Beijing, Kiwa Shandong, Kiwa Shenzhen, Kiwa Hebei, Kiwa Asia, Kiwa Yangling, and Kiwa Jing Nong.Institute. All significant inter-company balances or transactions are eliminated on consolidation.
Use of Estimates
The preparation of financial statements in conformity with US GAAP requires management to make estimates and assumptions that affect the reported amounts of assets and liabilities, disclosure of contingent assets and liabilities at the date of the consolidated financial statements, and the reported amounts of revenues and expenses during the reporting period. Actual results could differ from those estimates. Significant accounting estimates include the valuation of securities issued, derivative liabilities, deferred tax assets and related valuation allowance.
Certain of ourthe Company’s estimates, including evaluating the collectability of accounts receivable and the fair market value of long-lived assets, could be affected by external conditions, including those unique to ourthe Company’s industry, and general economic conditions. It is possible that these external factors could have an effect on ourthe Company’s estimates that could cause actual results to differ from ourits estimates. We re-evaluateThe Company re-evaluates all of ourthe Company’s accounting estimates annually based on these conditions and record adjustments when necessary.
| 9 |
Cash and Cash Equivalents
Cash and cash equivalents consist of all cash balances and highly liquid investments with an original maturity of three months or less. Because of the short maturity of these investments, the carrying amounts approximate their fair value. Restricted cash is excluded from cash and cash equivalents.
Accounts receivable and allowance for doubtful accounts
Accounts receivable represent customer accounts receivables. The Company provides an allowance for doubtful accounts equal to the estimated uncollectible amounts. The Company’s estimate is based on historical collection experience, the economic environment, trends in the microbial fertilizer industry, and a review of the current status of trade accounts receivable. Management reviews its accounts receivable each reporting period to determine if the allowance for doubtful accounts is adequate. Such allowances, if any, would be recorded in the period the impairment is identified. It is reasonably possible that the Company’s estimate of the allowance for doubtful accounts will change. Uncollectible accounts receivable are charged against the allowance for doubtful accounts when all reasonable efforts to collect the amounts due have been exhausted.
Inventory
Inventories are stated at the lower of cost, determined on the weighted average method, and net realizable value. Work in progress and finished goods are composed of direct materials, direct labor and a portion of manufacturing overhead. Net realizable value is the estimated based on selling price in the ordinary course of business, less estimated costs to complete and dispose.
Property, plant and equipment
Property, plant and equipment are stated at cost less accumulated depreciation and accumulated impairment losses, if any. Gains or losses on disposals are reflected as gain or loss in the year of disposal. The cost of improvements that extend the life of property, plant and equipment are capitalized. These capitalized costs may include structural improvements, equipment and fixtures. All ordinary repair and maintenance costs are expensed as incurred. Depreciation for financial reporting purposes is provided using the straight-line method over the estimated useful lives of the assets as follows:
| Useful Life | ||||
| (In years) | ||||
| Buildings | 30 - 35 | |||
| Machinery and equipment | 5 - 10 | |||
| Automobiles | 8 | |||
| Office equipment | 2 - 5 | |||
| Computer software | 3 | |||
| Leasehold improvement | The shorter of the lease term and useful life |
Lease
The Company adopted ASU 2016-02 on January 1, 2019 and determined that the effect of recognizing additional right of use (“ROU”) assets and operating liabilities under current leasing standards for existing operating leases with a term longer than 12 months are immaterial to its consolidated financial statements for the period beginning January 1, 2019. As a result, no such recognition ROU and operating labilities has been made on January 1, 2019.
As of June 30, 2019, future lease payments are summarized below:
| Twelve months ending June 30, 2020 | $ | 18,556 | ||
| Twelve months ending June 30, 2021 | 23,891 | |||
| Twelve months ending June 30, 2022 | 18,582 | |||
| Thereafter | - | |||
| Total minimum lease payment | $ | 61,029 |
Impairment of Long-Lived Assets
The Company’s long-lived assets consist of property, plant and equipment. The Company evaluates its investment in long-lived assets, including property and equipment, for recoverability whenever events or changes in circumstances indicate the net carrying amount may not be recoverable. It is possible that these assets could become impaired as a result of legal factors, market conditions, operational performance indicators, technological or other industry changes. If circumstances require a long-lived asset or asset group to be tested for possible impairment, the Company first compares undiscounted cash flows expected to be generated by that asset or asset group to its carrying value. If the carrying value of the long-lived asset or asset group is not recoverable on an undiscounted cash flow basis, an impairment is recognized to the extent that the carrying value exceeds its fair value. Fair value is determined through various valuation techniques, including discounted cash flow models, quoted market values and third-party independent appraisals, as considered necessary.
Financial Instruments
The Company analyzes all financial instruments with features of both liabilities and equity under FASB Accounting Standards Codification (“ASC”) Topic 480 “Distinguishing Liabilities from Equity” and FASB ASC Topic 815 “Derivatives and Hedging”.
Embedded conversion features of convertible debentures not considered to be derivative instruments
The embedded conversion features of convertible debentures not considered to be derivative instruments provide for a rate of conversion that is below market value. Such feature is normally characterized as a “beneficial conversion feature” (“BCF”). The relative fair values of the BCF were recorded as discounts from the face amount of the respective debt instrument. The Company amortized the discount using the straight-line method which approximates the effective interest method through maturity of such instruments.
Embedded conversion features of convertible debentures that are classified as derivative liabilities
The embedded conversion features of convertible debentures that are classified as derivative liabilities are recorded at fair value as a discount from the face amount of the respective debt instrument. The discount is being amortized to interest expense over the life of the note using the straight-line method, which approximates the effective interest method. These instruments are accounted for as derivative liabilities and marked-to-market each reporting period. The change in the value of the derivative liabilities is charged against or credited to income in the captioned “change in fair value of derivative liabilities” in the accompanying unaudited condensed consolidated statements of operations and comprehensive income.
Fair Value of Financial Instruments
The Company follows paragraph 825-10-50-10 of the FASB Accounting Standards Codification for disclosures about fair value of its financial instruments and paragraph 820- 10-35-37820-10-35-37 of the FASB Accounting Standards Codification (“Paragraph 820-10-35-37”) to measure the fair value of its financial instruments. Paragraph 820-10-35-37 establishes a framework for measuring fair value with U.S. GAAP and expands disclosures about fair value measurements.
| 11 |
To increase consistency and comparability in fair value measurements and related disclosures, Paragraph 820-10-35-37 establishes a fair value hierarchy which prioritizes the inputs to valuation techniques used to measure fair value into three (3) broad levels. The fair value hierarchy gives the highest priority to quoted prices (unadjusted) in active markets for identical assets or liabilities and the lowest priority to unobservable inputs. The three (3) levels of fair value hierarchy defined by Paragraph 820-10-35-37 are described below:
| ● | Level 1: quoted market prices available in active markets for identical assets or liabilities as of the reporting date. | |
| ● | Level 2: pricing inputs other than quoted prices in active markets included in Level 1, which are either directly or indirectly observable as of the reporting date. | |
| ● | Level 3: Pricing inputs that are generally observable inputs and not corroborated by market data. |
Financial assets are considered Level 3 when their fair values are determined using pricing models, discounted cash flow methodologies or similar techniques and at least one significant model assumption or input is unobservable.
The fair value hierarchy gives the highest priority to quoted prices (unadjusted) in active markets for identical assets or liabilities and the lowest priority to unobservable inputs. If the inputs used to measure the financial assets and liabilities fall within more than one level described above, the categorization is based on the lowest level input that is significant to the fair value measurement of the instrument.
The carrying amount of the Company’s financial assets and liabilities, such as cash and cash equivalent, prepaid expenses, accounts payable and accrued expenses, approximate their fair value because of the short maturity of those instruments. Derivative instruments are carried at fair value, estimated using the Black Scholes Merton model.
Transactions involving related parties cannot be presumed to be carried out on an arm’s-length basis, as the requisite conditions of competitive, free-market dealings may not exist. Representations about transactions with related parties, if made, shall not imply that the related party transactions were consummated on terms equivalent to those that prevail in arm’s-length transactions unless such representations can be substantiated.
It is not however practical to determine the fair value of advances from stockholders, if any, due to their related party nature.
Revenue Recognition
The Company applies paragraph 605-10-S99-1 of the FASBOn January 1, 2018 we adopted Accounting Standards CodificationUpdate (“ASU”) 2014-09 Revenue from Contracts with Customers (FASB ASC Topic 606) using the modified retrospective method for revenue recognition. The Company recognizes revenue when it is realized or realizable and earned. The Company considers revenue realized or realizable and earned when allcontracts that were not completed as of the following criteria are met: (i) persuasive evidence ofJanuary 1, 2018. This did not result in an arrangement exists, (ii) the product has been shipped or the services have been renderedadjustment to the customer, (iii)retained earnings upon adoption of this new guidance as the sales price is fixed or determinable, and (iv) collectability is reasonably assured.Company’s revenue was recognized based on the amount of consideration we expect to receive in exchange for satisfying the performance obligations.
The core principle underlying the revenue recognition ASU is that the Company will recognize revenue to represent the transfer of goods and services to customers in an amount that reflects the consideration to which the Company expects to be entitled in such exchange. This will require the Company to identify contractual performance obligations and determine whether revenue should be recognized at a point in time or over time, based on when control of goods and services transfers to a customer. The Company’s revenue streams are recognized at a point in time.
The ASU requires the use of a new five-step model to recognize revenue from customer contracts. The five-step model requires that the Company (i) identify the contract with the customer, (ii) identify the performance obligations in the contract, (iii) determine the transaction price, including variable consideration to the extent that it is probable that a significant future reversal will not occur, (iv) allocate the transaction price to the respective performance obligations in the contract, and (v) recognize revenue when (or as) the Company satisfies the performance obligation. The application of the five-step model to the revenue streams compared to the prior guidance did not result in significant changes in the way the Company records its revenue. Upon adoption, the Company evaluated its revenue recognition policy for all revenue streams within the scope of the ASU under previous standards and using the five-step model under the new guidance and confirmed that there were no differences in the pattern of revenue recognition.
| 12 |
The Company derivescontinues to derive its revenues from sales contracts with its customers with revenues being recognized upon delivery of products. Persuasive evidence of an arrangement is demonstrated via sales contract and invoice; and the sales price to the customer is fixed upon acceptance of thesales contract and there is no separate sales rebate, discount, or volume incentive. The Company recognizes revenue when title and ownership of the goods are transferred upon shipment to the customer by the Company to consider control of goods are transferred to its customer and collectability of payment is reasonably assured. The Company’s revenues are recognized at a point in time after all performance obligations are satisfied.
The Company’scustomers are mainly agricultural cooperative company and distributors who then resell the Company’s products to individual farmers. Because the crop growing cycle usually takes approximately 3 to 9 months in the agricultural industry, for some co-ops and distributors, it will take approximately similar time frame of 3 to 9 months for farmers to harvest crops and to realize profits to repay them. As a result, for the sales contracts with these customers, the collectability of payment is highly dependent on the successful harvest of corps and the customers’ ability to collect money from farmers. The Company deemed the collectability of payment may not be reasonably assured until after the Company get paid. For thoseCollectability is a necessary condition for the contract to be accounted for to meet the criteria of the first step “identifying the contract with the customer” under the new revenue guidance in ASC 606. As a result, these sales contracts thatare not considered a contract under ASC 606, thus the Company has shipped its products butshipments under these contracts are not recognized as revenue until all criteria for “identifying the payment is contingent on collections of payments fromcontract with the downstream customers, the Company considers thecustomer” and revenue recognition criteria are not met and therefore defersusing the revenue and cost of goods sold until payments are collected. These revenue and cost of goods sold are classified in the captioned “Deferred revenue” and “Deferred cost of goods sold” in the accompanying unaudited condensed consolidated balance sheets. For other customers whose repayment term is within normal business course and not dependent on the harvest of corps, the Company recognized revenue when title and ownership of the goods are transferred upon shipment to the customer by the Company.
five-step model.
Deferred Revenue and Deferred Cost of Goods Sold
Deferred revenue and deferred cost of goods sold result from transactions where the Company has shipped product for which all revenue recognition criteria under the five-step model have not yet been met. Though these contracts are not considered a contract under ASC 606, they are legally enforceable, and the Company has an unconditional and immediate right to payment after the Company has shipped products, therefore, the Company recognizes a receivable and a corresponding deferred revenue upon shipment. Deferred cost of goods sold related to deferred product revenues includes direct inventory costs. Once all revenue recognition criteria under the five-step model have been met, the deferred revenues and associated cost of goods sold are recognized.
The Company’s provision for deferred cost of goods sold is made based on historical collection experience on such related accounts receivable and realizability of deferred revenue . The Company made provision of $2,448,764 and nil for deferred cost of goods sold for the six months ended June 30, 2019 and 2018, respectively.
Income Taxes
The Company accounts for income taxes under the provisions of FASB ASC Topic 740, “Income Tax,” which requires recognition of deferred tax assets and liabilities for the expected future tax consequences of events that have been included in the consolidated financial statements or tax returns. Deferred tax assets and liabilities are recognized for the future tax consequence attributable to the difference between the tax bases of assets and liabilities and their reported amounts in the financial statements. Deferred tax assets and liabilities are measured using the enacted tax rate expected to apply to taxable income in the years in which those temporary differences are expected to be recovered or settled. The effect on deferred tax assets and liabilities of a change in tax rates is recognized in income in the period that includes the enactment date. The Company establishes a valuation allowance when it is more likely than not that the assets will not be recovered.
FASB ASC Topic 740-10, “Accounting for Uncertainty in Income Taxes,” defines uncertainty in income taxes and the evaluation of a tax position as a two-step process. The first step is to determine whether it is more likely than not that a tax position will be sustained upon examination, including the resolution of any related appeals or litigation based on the technical merits of that position. The second step is to measure a tax position that meets the more-likely-than-not threshold to determine the amount of benefit to be recognized in the financial statements. A tax position is measured at the largest amount of benefit that is greater than 50 percent likelihood of being realized upon ultimate settlement. Tax positions that previously failed to meet the more-likely-than-not recognition threshold should be recognized in the first subsequent period in which the threshold is met. Previously recognized tax positions that no longer meet the more-likely-than-not criteria should be de-recognized in the first subsequent financial reporting period in which the threshold is no longer met. Penalties and interest incurred related to underpayment of income tax are classified as income tax expense in the period incurred. United States federal, state and local income tax returns prior to 20142015 are not subject to examination by any applicable tax authorities. PRC tax returns filed for 2014, 2015, 2016 and 20162017 are subject to examination by any applicable tax authorities.
| 13 |
Stock Based Compensation
The Company accounts for share-based compensation awards to employees in accordance with FASB ASC Topic 718, “Compensation – Stock Compensation”, which requires that share-based payment transactions with employees be measured based on the grant-date fair value of the equity instrument issued and recognized as compensation expense over the requisite service period. The Company records stock-based compensation expense at fair value on the grant date and recognizes the expense over the employee’s requisite service period. The Company’s expected volatility assumption is based on the historical volatility of Company’s stock. The expected life assumption is primarily based on historical exercise patterns and employee post-vesting termination behavior. The risk-free interest rate for the expected term of the option is based on the U.S. Treasury yield curve in effect at the time of grant. The expected dividend yield is based on the Company’s current and expected dividend policy.
The Company accounts for share-based compensation awards to non-employees in accordance with FASB ASC Topic 718 and FASB ASC Subtopic 505-50, “Equity-Based Payments to Non-employees”. Under FASB ASC Topic 718 and FASB ASC Subtopic 505-50, stock compensation granted to non-employees has been determined as the fair value of the consideration received or the fair value of equity instrument issued, whichever is more reliably measured and is recognized as an expense as the goods or services are received.
Foreign Currency Translation and Other Comprehensive Income
The Company uses United States dollars (“US Dollar” or “US$” or “$”) for financial reporting purposes. However, the Company maintains the books and records in its functional currency, Chinese Renminbi (“RMB”) and Hong Kong Dollar (“HKD”), being the functional currency of the economic environment in which its operations are conducted. In general, the Company translates its assets and liabilities into U.S. dollars using the applicable exchange rates prevailing at the balance sheet date, and the statement of comprehensive loss and the statement of cash flow are translated at average exchange rates during the reporting period. Equity accounts are translated at historical rates. Adjustments resulting from the translation of the Company’s financial statements are recorded as accumulated other comprehensive income.
Other comprehensive income for the ninethree and six months ended SeptemberJune 30, 20172019 and 20162018 represented foreign currency translation adjustments and were included in the unaudited condensed consolidated statements of operations and comprehensive income.
The exchange rates used to translate amounts in RMB into U.S. Dollars for the purposes of preparing the unaudited condensed consolidated financial statements were as follows:
| As of September 30, 2017 | As of December 31, 2016 | |||||||
| Balance sheet items, except for equity accounts | 6.6574 | 6.9472 | ||||||
| As of June 30, 2019 | As of December 31, 2018 | |||||||
| Balance sheet items, except for equity accounts | 6.8656 | 6.8761 | ||||||
| Three months ended September 30, | ||||||||
| 2017 | 2016 | |||||||
| Items in the statements of comprehensive income | 6.6721 | 6.6702 | ||||||
| Three months ended June 30, | ||||||||
| 2019 | 2018 | |||||||
| Items in the statements of comprehensive income | 6.8210 | 6.3726 | ||||||
| Nine months ended September 30, | ||||||||
| 2017 | 2016 | |||||||
| Items in the statements of comprehensive income | 6.8068 | 6.5806 | ||||||
| Six months ended June 30, | ||||||||
| 2019 | 2018 | |||||||
| Items in the statements of comprehensive income | 6.7839 | 6.3659 | ||||||
| 14 |
The exchange rates used to translate amounts in HKD into U.S. Dollars for the purposes of preparing the consolidated financial statements were as follows:
| As of June 30, 2019 | As of December 31, 2018 | |||||||
| Balance sheet items, except for equity accounts | 7.8121 | 7.8297 | ||||||
| Three months ended September 30, | ||||||||
| 2017 | 2016 | |||||||
| Items in the statements of comprehensive income | 7.8143 | - | ||||||
| Three months ended June 30, | ||||||||
| 2019 | 2018 | |||||||
| Items in the statements of comprehensive income | 7.8396 | 7.8476 | ||||||
| Nine months ended September 30, | ||||||||
| 2017 | 2016 | |||||||
| Items in the statements of comprehensive income | 7.7868 | - | ||||||
| Six months ended June 30, | ||||||||
| 2019 | 2018 | |||||||
| Items in the statements of comprehensive income | 7.8426 | 7.8372 | ||||||
Earnings Per Common Share
Net income per common share is computed pursuant to section 260-10-45 of the FASB Accounting Standards Codification. Basic net income per common share is computed by dividing net income by the weighted average number of common shares outstanding during the period.
Diluted net income per common share is computed by dividing net income by the weighted average number of shares of common stock and potentially outstanding shares of common stock during the period to reflect the potential dilution that could occur from common shares issuable through contingent shares issuance arrangement, stock options or warrants. Common stock equivalents having an anti-dilutive effect on earnings per share are excluded from the calculation of diluted earnings per share.
Commitments and Contingencies
The Company follows subtopic 450-20 of the FASB Accounting Standards Codification to report accounting for contingencies. Certain conditions may exist as of the date the consolidated financial statements are issued, which may result in a loss to the Company but which will only be resolved when one or more future events occur or fail to occur. The Company assesses such contingent liabilities, and such assessment inherently involves an exercise of judgment. In assessing loss contingencies related to legal proceedings that are pending against the Company or unassured claims that may result in such proceedings, the Company evaluates the perceived merits of any legal proceedings or unassured claims as well as the perceived merits of the amount of relief sought or expected to be sought therein.
If the assessment of a contingency indicates that it is probable that a material loss has been incurred and the amount of the liability can be estimated, then the estimated liability would be accrued in the Company’s consolidated financial statements. If the assessment indicates that a potential material loss contingency is not probable but is reasonably possible, or is probable but cannot be estimated, then the nature of the contingent liability, and an estimate of the range of possible losses, if determinable and material, would be disclosed.
Loss contingencies considered remote are generally not disclosed unless they involve guarantees, in which case the guarantees would be disclosed. Management does not believe, based upon information available at this time that these matters will have a material adverse effect on the Company’s financial position, results of operations or cash flows.
| 15 |
Cash Flow Reporting
The Company adopted paragraph 230-10-45-24 of the FASB Accounting Standards Codification for cash flows reporting, classifies cash receipts and payments according to whether they stem from operating, investing, or financing activities and provides definitions of each category, and uses the indirect or reconciliation method (“Indirect method”) as defined by paragraph 230-10-45-25 of the FASB Accounting Standards Codification to report net cash flow from operating activities by adjusting net income to reconcile it to net cash flow from operating activities by removing the effects of :
(a) all deferrals of past operating cash receipts and payments and all accruals of expected future operating cash receipts and payments;
(b) all items that are included in net income that do not affect operating cash receipts and payments.
The Company reports the reporting currency equivalent of foreign currency cash flows, using the current exchange rate at the time of the cash flows and the effect of exchange rate changes on cash held in foreign currencies is reported as a separate item in the reconciliation of beginning and ending balances of cash and cash equivalents and separately provides information about investing and financing activities not resulting in cash receipts or payments in the period pursuant to paragraph 830-230-45-1 of the FASB Accounting Standards Codification.
Recent Accounting Pronouncements
In May 2014, the Financial Accounting Standards Board (the “FASB”) issued Accounting Standards Update No. 2014-09 (ASU 2014-09), Revenue from Contracts with Customers. ASU 2014-09 will eliminate transaction- and industry-specific revenue recognition guidance under current GAAP and replace it with a principle based approach for determining revenue recognition. ASU 2014-09 will require that companies recognize revenue based on the value of transferred goods or services as they occur in the contract. ASU 2014-09 also will require additional disclosure about the nature, amount, timing and uncertainty of revenue and cash flows arising from customer contracts, including significant judgments and changes in judgments and assets recognized from costs incurred to obtain or fulfill a contract. Based on the FASB’s Exposure Draft Update issued on April 29, 2015, and approved in July 2015, Revenue from Contracts With Customers (Topic 606): Deferral of the Effective Date, ASU 2014-09 is now effective for reporting periods beginning after December 15, 2017, with early adoption permitted only as of annual reporting periods beginning after December 15, 2016, including interim reporting periods within that reporting period. Entities will be able to transition to the standard either retrospectively or as a cumulative-effect adjustment as of the date of adoption. While no significant impact is expected upon adoption of the new guidance, the Company will not be able to make that determination until the time of adoption based upon outstanding contracts at that time. In September 2017,February 2018, the FASB issued Accounting Standards Update (ASU) No. 2017-13,“Revenue RecognitionASU 2018-02, Income Statement - Reporting Comprehensive Income (Topic 605), Revenue220): Reclassification of Certain Tax Effects from Contracts with Customers (Topic 606), Leases (Topic 840), and Leases (Topic 842): Amendments to SEC Paragraphs Pursuant to the Staff Announcement at the July 20, 2017 EITF Meeting and Rescission of Prior SEC Staff Announcements and Observer Comments.”Accumulated Other Comprehensive Income. The amendments in ASU No. 2017-13 amendsthis Update affect any entity that is required to apply the early adoption date optionprovisions of Topic 220, Income Statement – Reporting Comprehensive Income, and has items of other comprehensive income for certain companieswhich the related to the adoption of ASU No. 2014-09.tax effects are presented in other comprehensive income as required by GAAP. The effective date for the Company is the same as the effective date and transition requirements for the amendments for ASU 2014-09 beginning in January 1, 2018.
In February 2016, the FASB issued Accounting Standardsthis Update No. 2016-02 (ASU 2016-02), Leases (Topic 842). ASU 2016-02 requires a lessee to record a right-of-use asset and a corresponding lease liability, initially measured at the present value of the lease payments, on the balance sheetare effective for all leases with terms longer than 12 months, as well as the disclosure of key information about leasing arrangements. ASU 2016-02 requires recognition in the statement of operations of a single lease cost, calculated so that the cost of the lease is allocated over the lease term. ASU 2016-02 requires classification of all cash payments within operating activities in the statement of cash flows. Disclosures are required to provide the amount, timing and uncertainty of cash flows arising from leases. A modified retrospective transition approach is required for lessees for capital and operating leases existing at, or entered into after, the beginning of the earliest comparative period presented in the financial statements, with certain practical expedients available. ASU 2016-02 is effectiveentities for fiscal years beginning after December IS,15, 2018, includingand interim periods within those fiscal years. Early applicationadoption of the amendments in this Update is permitted. The Company haspermitted, including adoption in any interim period, (1) for public business entities for reporting periods for which financial statements have not yet evaluated the impact of the adoption of ASU 2016-02 on the Company’s unaudited condensed consolidatedbeen issued and (2) for all other entities for reporting periods for which financial statement presentation or disclosures.
In January 2017, the FASB issued ASU 2017-01, “Business Combinations (Topic 805): Clarifying the Definition of a Business.”statements have not yet been made available for issuance. The amendments in this guidance are clarifyingUpdate should be applied either in the definitionperiod of adoption or retrospectively to each period (or periods) in which the effect of the change in the U.S. federal corporate income tax rate in the Tax Cuts and Jobs Act is recognized. The Company does not believe the adoption of this ASU would have a businessmaterial effect on the Company’s consolidated financial statements.
In August 2018, the FASB Accounting Standards Board issued ASU No. 2018-13, “Fair Value Measurement (Topic 820): Disclosure Framework Changes to assist entities when determining whether an integrated set of assets and activities meets the definition of a business. The update provides that when substantially allDisclosure Requirements for Fair Value Measurement” (“ASU 2018-13”). ASU 2018-13 modifies the disclosure requirements on fair value of the assets acquiredmeasurements. ASU 2018-13 is concentrated in a single identifiable asset or a group of similar identifiable assets, the set is not a business. The guidance is effective for public entities for fiscal years beginning after December 15, 2017, including interim periods within those fiscal years.2019, with early adoption permitted for any removed or modified disclosures. The adoption ofremoved and modified disclosures will be adopted on a retrospective basis and the new disclosures will be adopted on a prospective basis. The Company does not expect this new guidance is not expected towill have a material impact on our unauditedits condensed consolidated financial statements.
In January 2017, the FASB issued ASU 2017-04—Intangibles—Goodwill and Other (Topic 350): Simplifying the Test for Goodwill Impairment. The amendments in this guidance to eliminate the requirement to calculate the implied fair value of goodwill to measure goodwill impairment charge (Step 2). As a result, an impairment charge will equal the amount by which a reporting unit’s carrying amount exceeds its fair value, not to exceed the amount of goodwill allocated to the reporting unit. An entity still has the option to perform the qualitative assessment for a reporting unit to determine if the quantitative impairment test is necessary. The amendment should be applied on a prospective basis. The guidance is effective for goodwill impairment tests in fiscal years beginning after December 15, 2019. Early adoption is permitted for goodwill impairment tests performed after January 1, 2017. The impact of this guidance for the Company will depend on the outcomes of future goodwill impairment tests.
In May 2017, the FASB issued Accounting Standards Update No. 2017-09 (ASU 2017-09), Compensation — Stock Compensation (Topic 718) Scope of Modification Accounting. The amendments in ASU 2017-09 provide guidance about which changes to the terms or conditions of a share-based payment award require an entity to apply modification accounting in Topic 718. The adoption of ASU 2017-09 which will become effective for annual periods beginning after December 15, 2017 and for interim periods within those annual periods, is not expected to have any impact on the Company’s unaudited condensed consolidated financial statement presentation or disclosures.
In July 2017, the FASB issued Accounting Standards Update No. 2017-11 (ASU 2017-11), Earnings Per Share (Topic 260); Distinguishing Liabilities from Equity (Topic 480); Derivatives and Hedging (Topic 815): (Part I) Accounting for Certain Financial Instruments with Down Round Features, (Part II) Replacement of the Indefinite Deferral for Mandatorily Redeemable Financial Instruments of Certain Nonpublic Entities and Certain Mandatorily Redeemable Noncontrolling Interests with a Scope Exception. The amendments in ASU 2017-11 change the classification analysis of certain equity-linked financial instruments (or embedded features) with down round features. When determining whether certain financial instruments should be classified as liabilities or equity instruments, a down round feature no longer precludes equity classification when assessing whether the instrument is indexed to an entity’s own stock. The adoption of ASU 2017-11 which will become effective for annual periods beginning after December 15, 2018 and for interim periods within those annual periods. The Company elected to early adopt ASU 2017-11 when preparing these unaudited condensed consolidated financial statements for the nine months ended September 30, 2017.
Management does not believe that any other recently issued, but not yet effective, authoritative guidance, if currently adopted, would have a material impact on the Company’s unaudited condensed consolidated financial statement presentation or disclosures.
3. Going Concern
The unaudited condensed consolidated financial statements have been prepared assuming that the Company will continue as a going concern, which contemplates the realization of assets and the satisfaction of liabilities in the normal course of business.
As of September 30, 2017, the Company had an accumulated deficit of $17,072,416, and net cash used in continuing operating activities of $3,367,270. These circumstances, among others, raise substantial doubt about the Company’s ability to continue as a going concern. The accompanying unaudited condensed financial statements do not include any adjustments that might result from the outcome of this uncertainty. The accompanying unaudited condensed consolidated financial statements also do not include any adjustments relating to the recoverability and classification of recorded asset amounts, or amounts and classifications of liabilities that might be necessary should the Company be unable to continue as a going concern.
Though the Company is generating additional revenuebut not cash flow while seeking additional equity financing, the Company does not have enough cash to support the operation without raising additional capital, within the one year from the date of the issuance of these financial statements. To the extent that the Company is unable to successfully raise the capital necessary to fund its future cash requirements on a timely basis and under acceptable terms and conditions, the Company may not have sufficient liquidity to maintain operations and repay its liabilities for the next twelve months. As a result, the Company may be unable to implement its current plans for expansion, repay its debt obligations or respond to competitive pressures, any of which would have a material adverse effect on its business, prospects, financial condition and results of operations.
4. Accounts Receivable, net
As of SeptemberJune 30, 20172019 and December 31, 2016,2018, we had approximately $15.2$3.5 million and $1.1$6.8 million, respectively, of accounts receivable from the Company’s customers. Since the Companyobtained a fertilizer sales permit from the Chinese government in August 2016 and began to sell the products directly to its customers in September 2016, the Company’s strategy was to gain market shares in thebio-fertilizermarket by extending longer credit term to its customers. As a result, the Company’s accounts receivable increased from approximately $1.1 million at December 31, 2016 to approximately $15.2 million at September 30, 2017.The Company’s current payment terms on these customers are ranging typically from 60 days to 9 months after receipts of the goods depending on the creditworthiness of these customers.Thesecustomers are either agricultural cooperative company or distributors who then resell the Company’s products to individual farmers. The reason the Company decides to extend credit for up to 9 months is mainly because the crop growing cycle usually takes approximately 3 to 9 months in the agricultural industry, it will take approximately similar time frame of 3 to 9 months for farmers to harvest crops and to realize profits to repay us. It is very common for cooperative farms and distributors to request longer sales credit under these circumstances.
Based on the evaluation of the collectability of these accounts receivable, the Company has provided allowance for doubtful accounts of approximately $0.3 million as of September 30, 2017. As of the date of this report, the Company has subsequently collected approximately $8.7 million or 56% of these outstanding accounts receivable as of September 30, 2017. The Company expects to fully collect the remaining balance of approximately $6.8 million of these accounts receivable by December 31, 2017.
| 16 |
The Company’s provision on allowance for doubtful accounts is based on historical collection experience, the economic environment, trends in the microbial fertilizer industry, and a review of the current status of trade accounts receivable and come up with an aging allowance method. Currently, the Company provides a provision of 1%-6% of the allowance for doubtful accounts for accounts receivable balance that are more than 180 days old but less than one year old, 50% of the allowance for doubtful accounts for accounts receivable from one to one and half years old, 100% of the allowance for doubtful accounts for accounts receivable beyond one and half years old, plus additional amount as necessary, which the Company’s collection department had determined the collection of the full amount is remote with the approval from its management to provide a 100% provision allowance for doubtful accounts. The Company’s management has continued to evaluate the reasonableness of the valuation allowance policy and update it if necessary.
Accounts receivable consisted of the following:
| June 30, 2019 | December 31, 2018 | |||||||
| Accounts receivable | $ | 3,523,166 | $ | 6,751,113 | ||||
| Less: Allowance for doubtful accounts | - | - | ||||||
| Accounts receivable, net | $ | 3,523,166 | $ | 6,751,113 | ||||
| September 30, 2017 | December 31, 2016 | |||||||
| Accounts receivable | $ | 15,543,835 | $ | 1,177,994 | ||||
Less: Allowance for doubtful accounts | (298,580 | ) | (55,240 | ) | ||||
| Accounts receivable, net | $ | 15,245,255 | $ | 1,122,754 | ||||
Movement of allowance for doubtful accounts is as follows:
| Nine months ended September 30, 2017 | Year ended December 31, 2016 | |||||||
| Beginning balance | $ | 55,240 | $ | - | ||||
| Provision for doubtful accounts | 237,998 | 55,240 | ||||||
| Less: write-off | - | - | ||||||
| Exchange rate effect | 5,342 | - | ||||||
| Ending balance | $ | 298,580 | $ | 55,240 | ||||
5. Prepaid Expense
Prepaid expenses consisted of the following:
| Notes | September 30, 2017 | December 31, 2016 | ||||||||||
| Prepaid office rent | $ | 21,080 | $ | 12,504 | ||||||||
| Prepaid government filing expense | 33,036 | 5,000 | ||||||||||
| Prepaid consulting expenses | (1) | 1,160,145 | 1,400,050 | |||||||||
| $ | 1,214,261 | $ | 1,417,554 | |||||||||
| Notes | June 30, 2019 | December 31, 2018 | ||||||||||
| Prepaid office rent | $ | 2,457 | $ | 4,921 | ||||||||
| Prepaid Packaging Expense | 10,009 | |||||||||||
| Prepaid government filing expense | 12,000 | 7,000 | ||||||||||
| Prepaid consulting expenses | (1) | 1,798,356 | 2,230,553 | |||||||||
| Others | 17,118 | 17,091 | ||||||||||
| Total | $ | 1,839,940 | $ | 2,259,565 | ||||||||
(1) Prepaid consulting expense forexpenses represent issuance of common stock
for prepaid services. As of SeptemberJune 30, 2017, the Company issued a total of 1,825,916 shares of common stock to three consulting companies for investor relation consulting services, one individual for financing service, one consulting company for IT service and four individuals for the growth and development strategy consulting service in China, which represents the amount of $1,922,696 based on quoted price at issuance. Pursuant to the indemnification terms of the services agreements, the Company has the rights to demand the full services being accomplished as scheduled during the service period and to enforce the consultants to pay pro-rata penalties if the consultants do not fulfill the contract services within the services periods. As of September 30, 2017,2019, the Company evaluated the performance of the consultants and concluded all the contracts were on schedule of delivery. The Company recorded the prepaid consulting expenses totally $1,922,696 andcompany amortized the consulting fee over the service periods per agreements based on the progress of services delivered. For the ninethree months ended SeptemberJune 30, 20172019 and 2016,2018, the amortization of consulting expense was $474,301$591,377 and $57,717,$679,925, respectively. For the six months ended June 30, 2019 and 2018, the amortization of consulting expense was $1,105,046 and $1,268,460, respectively.
6. Advance to suppliers
Since currentlyAdvance to suppliers are mainly funds deposited for future raw material and finished goods purchases. The Company’s major vendors require deposits with them as a guarantee that the Company does not have manufacturing facility, it has contracted with several third parties to produce fertilizer products.These third parties produce the fertilizer products in accordance with the product formula and specification instructed by the Company.Pursuant to the agreements entered by the Company and those third-party companies, the Company was required to make partially prepayments in advance of securing thewill complete its purchases or completion of productions on a timely basis. basis as well as securing the current agreed upon purchase price. Since the Company anticipated the price of raw materials continues to be on the rise, the Company agreed to make large amount of advances to suppliers.
As of SeptemberJune 30, 20172019 and December 31, 2016, such2018, advance to suppliers was $ 2,979,664 and $1,880,044, respectively.consisted of the following:
| June 30, 2019 | December 31, 2018 | |||||||
| Advance to suppliers | $ | 23,233,227 | $ | 6,751,113 | ||||
| Less: provisions for advance to suppliers | (225,763 | ) | - | |||||
| Advance to suppliers, net | $ | 23,007,464 | $ | 6,751,113 | ||||
7. Inventory
Inventory consisted of the following:
| June 30, 2019 | December 31, 2018 | |||||||
| Raw materials | $ | - | $ | 1,358,384 | ||||
| Finished goods | 83,252 | 253,331 | ||||||
| Packing materials | 31,366 | 31,318 | ||||||
| Total | $ | 114,618 | $ | 1,643,033 | ||||
| 17 |
7.8. Property, Plant and Equipment
Property, plant and equipment, net consisted of the following:
| September 30, 2017 | December 31, 2016 | June 30, 2018 | December 31, 2018 | |||||||||||||
| Property, Plant and Equipment | ||||||||||||||||
| Office equipment | $ | 14,270 | $ | 896 | $ | 17,470 | $ | 17,451 | ||||||||
| Furniture | 22,813 | 7,838 | 31,335 | 27,312 | ||||||||||||
| Leasehold improvement | 74,251 | 66,896 | 165,012 | 130,357 | ||||||||||||
| Construction in progress | 26,137 | - | 25,344 | 25,305 | ||||||||||||
| Others | 1,082 | - | 292 | 1,047 | ||||||||||||
| Property, plant and equipment - total | $ | 138,553 | $ | 75,630 | $ | 239,453 | $ | 201,472 | ||||||||
| Less: accumulated depreciation | (54,100 | ) | (20,311 | ) | (121,668 | ) | (108,291 | ) | ||||||||
| Property, plant and equipment - net | $ | 84,453 | $ | 55,319 | $ | 117,785 | $ | 93,181 | ||||||||
Depreciation expense was $11,878$4,904 and $10,045$4,817 for the three months ended SeptemberJune 30, 20172019 and 2016,2018, and $29,527$10,588 and $ 13,039$20,451 for the ninesix months ended SeptemberJune 30, 20172019 and 2016,2018, respectively.
8.9. Deposit for Long-Term Investment
On June 8, 2017, Kiwa Hebei entered an equity purchase agreement with the shareholders of Yantai Peng Hao New Materials Technology Co. Ltd. (“Peng Hao”) to acquire 100% interest in Peng Hao for approximately RMB 15,000,000 (approximately US$ 2.2 million). As of SeptemberJune 30, 2017,2019, Kiwa Hebei has made deposit payment of RMB 5,000,000 (approximately $751,050)$0.7 million).
Due to certain administrative approval process from the Chinese government and the establishment of Yangling base in October 2018, the closing of the equity purchase agreement has been delayed. RMB 6,500,000 (approximately $0.9 million) will be paid upon completion of the land use rights ownership transfer and RMB 3,500,000 (approximately $0.5 million) will be paid upon completion of the business licenses transfer. The Company estimated the completion of the transfer will be in December 2019.
9. Salary10. Salaries payable
| June 30, 2019 | December 31, 2018 | |||||||
| Ms. Yvonne Wang (“Ms. Wang”) | $ | 301,000 | $ | 259,000 | ||||
| Hon Man Yun (“Mr. Yun”) | 119,589 | 60,702 | ||||||
| Other Employees | 839,086 | 705,257 | ||||||
| Total | $ | 1,259,675 | $ | 1,024,959 | ||||
There were $1,208,492 and $1,145,492 as at September 30, 2017 and December 31, 2016, respectively, among the balance of salary payable which were due to the former Chairman of the Board and CEO Mr. Li, and the current Chairman of the Board and CEO Ms. Wang. Mr. Li was the Chairman of the Board until November 2015 and was the Chief Executive Officer of the Company until July 2015. No salary was paid to Mr. Li during his service period.
Ms. Wang served as Chairman of the Board since November 2015 and served as CEO since August 2016. No salary was paid to Ms. Wang since December 2015. Mr. Yun was the Chief Financial Officer of the Company since April 2018. The Company expects to be in negotiations with both partiesMr. Yun and Ms. Wang to settle these obligations.
10.11. Related Party Transactions
Due from related parties – non-trade
Amounts due from related parties consisted of the following as of SeptemberJune 30, 20172019 and December 31, 2016:2018:
| Item | Nature | Notes | September 30, 2017 | December 31, 2016 | Nature | Notes | June 30, 2019 | December 31, 2018 | ||||||||||||||||||||||
| Kangtan Gerui (Beijing) Bio-Tech Co., Ltd. (“Gerui”) | Non-trade | (1) | $ | 963,846 | $ | 1,522,434 | ||||||||||||||||||||||||
| Mr. Xiaoqiang Yu | Non-trade | (1) | 18,244 | 12,108 | ||||||||||||||||||||||||||
| Total | $ | 963,846 | $ | 1,522,434 | $ | 18,244 | $ | 12,108 | ||||||||||||||||||||||
| 18 |
(1) GeruiMr. Xiaoqiang Yu
Ms. Feng Li, a member ofDuring the Company’s board of directors and shareholderyear ended December 31, 2018, Mr. Xiaoqiang Yu, the COO of the Company, (Ms. Li held approximately 20% of the Company’s Common Stock and 50% of the Company’s Series A Preferred Stock), is alsoobtained a 23% shareholder of Gerui. According to the agreement betweencash advance from the Company and Gerui, all the balances will be paid off beforefor operational purpose. As of June 30, 2018. During2019, and December 31, 2018, the nine months ended September 30, 2017, the Company collected $558,588amount due from GeruiMr. Xiaoqiang Yu was $18,244 and the remaining balance was $963,846 as at September 30, 2017. The management has determined that no allowance for doubtful debts was necessary.$12,108, respectively.
Due to related parties– non-trade
Amounts due to related parties consisted of the following as of SeptemberJune 30, 20172019 and December 31, 2016:2018:
| Item | Nature | Notes | September 30, 2017 | December 31, 2016 | ||||||||||||
| Ms. Yvonne Wang (“Ms. Wang”) | Non-trade | (1) | 130,199 | 100,798 | ||||||||||||
| Subtotal | 130,199 | 100,798 | ||||||||||||||
| CAAS IARRP and IAED Institutes | Trade | (2) | - | 160,461 | ||||||||||||
| Subtotal | - | 160,461 | ||||||||||||||
| Total amount due to related parties | 130,199 | 261,259 | ||||||||||||||
| Item | Nature | Notes | June 30, 2019 | December 31, 2018 | ||||||||||
| Ms. Wang | Non-trade | (1) | 281,844 | 534,563 | ||||||||||
| Ms. Feng Li (“Ms. Li”) | Non-trade | (2) | 9,467 | 36,358 | ||||||||||
| Total amount due to related parties | $ | 291,311 | $ | 570,921 | ||||||||||
(1) Ms. Wang
Effective as of November 20, 2015, the Company appointed Ms. Wang as the Chairman of the Board and effective as of August 11, 2016, the Company’s Board of Directors has assigned Ms. Wang the additional titles of Acting President, Acting Chief Executive Officer and Acting Chief Financial Officer. On April 15, 2018, Ms. Wang turned over the Acting Chief Financial Officer to her successor.
During the ninesix months ended SeptemberJune 30, 2017,2019 and 2018, Ms. Wang paid various expenses on behalf of the Company. As of SeptemberJune 30, 2017,2019 and December 31, 2018, the amount due to Ms. Wang was $130,199.$281,844 and $534,563, respectively.
(2) CAAS IARRP and IAED InstitutesMs. Feng Li
On November 5, 2015, the Company signedMs. Feng Li is a strategic cooperation agreement (the “Agreement”) with China Academy of Agricultural Science (“CAAS”)’s Institute of Agricultural Resources & Regional Planning (“IARRP”) and Institute of Agricultural Economy & Development (“IAED”). The term of the Agreement was three years that began on November 20, 2015 and ends on November 19, 2018.
Pursuant to the agreement, Kiwa agree to fund RMB 1 million (approximately $160,000) each year to the Spatial Agriculture Planning Method & Applications Innovation Team that belongs to the Institutes. Professor Yong Chang Wu, the authorized representative of CAAS IARRP, is also onemember of the Company’s board of directors effective since November 20, 2015 until March 13, 2017.
The Company recorded $37,469 and $37,303 researchshareholder of the Company. Ms. Li held approximately 11% of the Company’s Common Stock and development50% of the Company’s Series A Preferred Stock. Ms. Feng Li paid various expenses relatedon behalf of the Company. As of June 30, 2019 and December 31, 2018, the amount due to the institutes, for the three months ended September 30, 2017Ms. Feng Li was $9,467 and 2016, respectively, and $110,194 and $112,580 research and development expenses for the nine months ended September 30, 2017 and 2016,$36,358, respectively.
The amount due to CAAS IARRP and IAED Institutes was reclassified to other payables and accruals at September 30, 2017 since Professor Yong Chang Wu is no longer the Company’s director from March 13, 2017. See note 13.
11.12. Convertible Notes Payable
(1) Convertible Notes Payable - Currentnotes payable consisted of the following:
| June 30, 2019 | December 31, 2018 | |||||||
| 6% secured convertible notes – FirsTrust Group Inc. (1) | $ | 132,762 | $ | 125,692 | ||||
| 15% convertible notes- Mr. Geng Liu (2) | 145,655 | 145,431 | ||||||
| 15% convertible notes- Mr. Junwei Zheng (3) | 801,101 | 799,870 | ||||||
| 12% convertible notes- Labrys (4) | 1,213,250 | - | ||||||
| 12% convertible notes- TFK (5) | 150,000 | - | ||||||
| Less: notes discount | (631,050 | ) | (99,907 | ) | ||||
| Convertible notes payable - total | $ | 1,811,718 | $ | 971,086 | ||||
| 19 |
Convertible notes payable - current consists of $ 150,250$132,762 of 6% secured convertible notes issued to FirsTrust Group Inc. on June 29, 2006, and $136,742 (face amount $150,208 net of discount of $13,466)$145,655 of 15% convertible note issued to Mr. Geng Liu on January 17, 2017.2017, $801,101 of 15% convertible note issued to Mr. Junwei Zheng on May 9, 2017, $1,213,250 of 12% convertible note issued to Labrys on February 27, 2019, and $150,000 of 12% convertible note issued to TFK on March 21, 2019.
(1) 6% secured convertible notes – FirsTrust Group Inc.
On June 29, 2006, the Company entered into a securities purchase agreement (the “Purchase Agreement”) with six institutional investors (collectively, the “Purchasers”) for the issuance and sale of 6% secured convertible notes, due three years from the date of issuance, in the aggregate principal amount of $2,450,000 (the “6% Convertible Notes”), convertible into shares of the Company’s common stock.
On June 29, 2009, the 6% Notes were due. The Company informed the Purchasers of its inability to repay the outstanding balance on the due date. Therefore, the 6% Notes are in default and the default interest rate of 15% per annum is being charged on the 6% Notes.
On August 12, 2013, the Company, entered into a Settlement Agreement and Release (the “Release”) with the holders (the “Holders”) of the “6% Convertible Notes” in the aggregate principal amount of $2,000,000. Pursuant to the terms of the Release, the Company paid the Holders $75,000 for a full release, including the forgiveness of past defaults of unpaid principal amounts, interests and penalties. During the course of the time, certain notes had been converted as well. On March 18, 2008, FirsTrust Group, Inc. (“FirsTrust”) purchased the three remaining 6% Convertible Notes, totaling $168,000 ($59,100, $50,400 and $59,100 respectively), from Nite Capital, one of the six institutional investors which purchased a total of $300,000 of the Note in three tranches ($105,000, $90,000, $105,000 respectively), for a cash payment of $100,000. After the Release and conversion, FirsTrust is the only holder of the outstanding 6% Convertible Note with outstanding principal amount of $150,250.
On June 29, 2009, the 6% Notes were due. The Company informed the Purchasers of its inability to repay the outstanding balance on the due date. Therefore, the 6% Notes are in default and the default interest rate of 15% per annum is being charged on the 6% Notes.
The conversion price of the Notes is based on a 40% discount to the average of the lowest three days trading price of the Company’s common stock on the OTC Bulletin Board over a 20-day trading period. The conversion price is also adjusted for certain subsequent issuances of equity securities of the Company at prices below the conversion price then in effect. The Notes contain a volume limitation that prohibits the holder from further converting the 6% Notes if doing so would cause the holder and its affiliates to hold more than 4.99% of the Company’s outstanding common stock.
The Company has elected to early adopt the guidance in ASU 2017-11. As a result, the Company has concluded that the conversion feature of the Notes is indexed to its own stock and would be classified and recorded as equity. The Company retrospectively applied the guidance to the above Notes and determined that the impact of the conversion feature for the above Notes is immaterial.
The Company also incurs a financial liquidated damages in cash or shares at the option of the Company (equal to 2% of the outstanding amount of the Notes per month plus accrued and unpaid interest on the Notes, prorated for partial months) if it breaches any affirmative covenants in the Purchase Agreement, including a covenant to maintain a sufficient number of authorized shares under its Certificate of Incorporation to cover at least 110% of the stock issuable upon full conversion of the Notes. Pursuant to the relevant provisions for liquidated damages in Purchase Agreement, the Company has accrued the amounts of $61,730$17,759 and $57,672$16,801 for liquidated damages for the ninethree months ended SeptemberJune 30, 20172019 and 2016,2018, respectively, and the Company has accrued the amounts of $42,120 and $35,246 for liquidated damages for the six months ended June 30, 2019 and 2018, respectively. The Company also accrued $16,857$4,965 and $16,919$4,092 for interest at the rate of 15% per annum for the ninethree months ended SeptemberJune 30, 20172019 and 2016,2018, respectively, and the Company accrued $9,900 and $8,588 for interest at the rate of 15% per annum for the six months ended June 30, 2019 and 2018, respectively. The total 15% interest was $200,218accrued interests were $164,872 and $177,681$177,179 at SeptemberJune 30, 20172019 and 2016,December 31, 2018, respectively. The total accrued liquidated damages were $544,056$555,658 and $462,423$555,538 at SeptemberJune 30, 20172019 and 2016,December 31, 2018, respectively.
The Company’s obligations under the Notes are secured by a first priority security interest in the Company’s intellectual property pursuant to an Intellectual Property Security Agreement with the Holders. In addition, Mr. Li, the Company’s former Chief Executive Officer, until July 1, 2015, has pledged all of his common stock of the Company as collateral for the Company’s obligations under the 6% Convertible Notes.
On October 19, 2017, the Company issued total 14,151 common shares at $1.04 per share price to FirsTrust Group, Inc. for the conversion of convertible note. According to the convertible note agreement, the conversion price is based on a 40% discount to the average of the lowest three days trading price of the Company’s common stock on the OTC Bulletin Board over a 20-day trading period per the convertible notes agreement. As the carrying value of the notes and the intrinsic value of that conversion feature equaled to the fair value of the 14,151 common shares at $2.25 per share, no gain or loss were recognized upon this conversion.
| 20 |
On December 13, 2017, the Company issued total 105,095 common shares at $0.75 per share price to FirsTrust Group, Inc. for the conversion of convertible note. According to the convertible note agreement, the conversion price is based on a 40% discount to the average of the lowest three days trading price of the Company’s common stock on the OTC Bulletin Board over a 20-day trading period per the convertible notes agreement. As the carrying value of the notes and the intrinsic value of that conversion feature equaled to the fair value of the 105,095 common shares at $2.3 per share, no gain or loss were recognized upon this conversion.
On April 27, 2018, the Company issued total 126,045 common shares to FirsTrust Group, Inc. for the conversion of convertible note. According to the convertible note agreement, the conversion price is based on a 40% discount to the average of the lowest three days trading price of the Company’s common stock on the OTC Bulletin Board over a 20-day trading period per the convertible notes agreement.
On September 19, 2018, the Company has entered a Settlement Agreement and Release (“Settlement Agreement”) with FirsTrust to settle the 6% secured convertible notes and interest and penalties. The Company has agreed to allow FirsTrust to effect a conversion in accordance with the terms of the 6% Note by October 18, 2018, and to make a cash payment of $500,000 by December 17, 2018. If the payment is not timely made, then FirsTrust shall be permitted to immediately effect further conversion in accordance with the terms of the 6% Notes into the Company’s shares, and the Company shall make a final cash payment of $340,000 by February 28, 2019. The Settlement Agreement has not been carried out by the Company as agreed as of December 31, 2018. The interest and penalties on this Note are continuously accrued in accordance with the original terms.
On October 18, 2018, FirsTrust requested a conversion in accordance with the terms of the 6% Notes into the Company’s shares. The Company had failed to convert and thus incurred a financial liquidated damage at $245 per day for a total of $18,130 as of December 31, 2018, which had been added to the principle amount of the Note. On March 26, 2019, the Company issued 395,959 shares to FirsTrust for the conversion. According to the convertible note agreement, the conversion price is based on a 40% discount to the average of the lowest three days trading price of the Company’s common stock on the OTC Bulletin Board over a 20-day trading period per the convertible notes agreement.
On March 26, 2019, the Company has entered into a First Amendment to Settlement Agreement and Release (“First Amendment Agreement”) with FirsTrust to settle the 6% secured convertible notes together with the promissory notes as disclosed under Note 12 plus interest and penalties with a total payable of approximately $2.3 million as of the date of the First Amendment Agreement was entered. The Company has agreed to make a payment of approximately $29,789 (RMB200,000), which has been paid on April 1, 2019, to enter into this Amendment and settled with the total outstanding balance of $1.3 million to be due under the terms of the First Amendment Agreement by June 30, 2019. If such settled outstanding balance was not made by June 30, 2019, it will deem the First Amendment Agreement to be ineffective and the Company will need to continue to pay FirsTrust the amount set forth in the Settlement Agreement.
As of this date, the Company remains in default of the Settlement Agreement and Release and is in the process of raising funds to retire these obligations. Notwithstanding, there is no guarantee that the Company will be successful in these efforts and that FirsTrust will not exercise all rights available to it under the applicable agreements between the parties.
On July 30, 2019, the Company received a notice of default and formal demand for payment and performance, which was followed by correspondence from FirsTrust’s lawyers that the commencement of legal action was imminent. As of this date, the Company has not received the service of any formal legal papers related to the matter. Since this matter is in its early stages, the final outcome cannot be predicted at this time and is largely dependent on the Company’s ability to raise funding to retire these obligations. If FirsTrust is successful in pursuing its legal action, the result could have a material adverse impact on the Company and its operations.
(2) 15% convertible notes- Mr. Geng Liu
On January 17, 2017, the Company entered a Convertible Note Agreement with Mr. Geng Liu withand received principal of RMB 3 million.1 million, approximately $146,000. The note bears interest at 15% per annum and will maturematured on January 16, 2018. Before the maturity date, the Note holder has an option to convert partial or all of the outstanding principal to the Company’s common shares with a conversion price of $0.90 per share. AsThe maturity date of Septemberthe note has been extended to June 30, 2017, the Company has received partial principal totaled RMB 1 million ($150,208 equivalentrevalued as at September 30, 2017).2020.
The notes are convertible into shares of the common stock, at conversion price is $0.9$0.90 which is lower than the price of the Company’s common stock on the date of issue. Therefore, the conversion feature embedded in the convertible note meet the definition of beneficial conversion feature (“BCF”). The Company evaluated the intrinsic value of the BCF as $45,094 at the issue date. The relative fair values of the BCF were recorded into additional paid in capital, and the remainder proceeds of $99,850 from issuance of the convertible note was allocated to convertible notes payable.
| 21 |
For the ninesix months ended SeptemberJune 30, 2017,2019 and 2018, the Company recorded interest expense of $45,535$10,965 and $13,661 on the note, including the amortization of the debt discount resulting from the value of beneficial conversion feature, and the carrying value of the note as at SeptemberJune 30, 20172019 was $136,742 .
(2) Convertible Notes Payable - Non-current and derivative liabilities
Convertible notes payable – non-current consists $826,148 of 15% convertible note issued to Mr. Junwei Zheng on May 9, 2017.$145,655.
(3) 15% convertible notes- Mr. Junwei Zheng
On May 9, 2017, the Company entered a Convertible Note Agreement with Mr. Junwei Zheng with principal of RMB 30 million. The note bears interest at 15% per annum and will mature on May 8, 2019. Before the maturity date, the Note holder has an option to convert partial or all of the outstanding principal and accrued interest to the Company’s common shares with a conversion price of $3.5 per share. On August 17, 2018, the Company does not expect that the remaining funds will ever be so advanced. As of SeptemberJune 30, 2017,2019, the Company has received partial principal totaled RMB 5.5 million ($826,148801,101 equivalentrevalued USD at SeptemberJune 30, 2017).2019) out of the RMB 30 million Convertible Note Agreement. On May 7, 2019, the Company reached an agreement with Mr. Junwei Zheng that the maturity date will be extended to June 30, 2020.
The notes are convertible into shares of the common stock, at conversion price is $3.5 which is higher than the price of the Company’s common stock on the date of issue, therefore the conversion feature embedded in the note was out of money at the issue date thus did not meet the definition of BCF. The Company determined that conversion option embedded in the note meet the definition of a derivative instrument. Since the embedded conversion price of the conversion feature is denominated in U.S. dollar, a currency other than the convertible note payable currency. As a result, the embedded conversion feature is not considered indexed to the Company’s own stock due to the variable exchange rate between U.S. Dollar and RMB, and as such, the Company determined that the embedded conversion feature to be carried as a liability and remeasuredre-measured at fair value at each financial reporting date until such time as the conversion feature is exercised or expired. The Company evaluated the fair value of the embedded conversion feature at the issue date and recorded the amount into as discount to convertible note payable. The discount to convertible note payable is being amortized to interest expense over the life of the note using the straight-line method, which approximates the effective interest method.
On May 7, 2019, due to the extension of the convertible notes and embedded conversion feature continued to be considered as a derivative instrument, the Company determined that the embedded conversion feature to be carried as a liability and re-measured at fair value at each financial reporting date until such time as the conversion feature is exercised or expired. The Company evaluated the fair value of the embedded conversion feature at the renewal date and recorded the amount into as discount to convertible note payable. The discount to convertible note payable is being amortized to interest expense over the life of the note using the straight-line method, which approximates the effective interest method.
The fair value of embedded conversion feature were calculated using the BlackScholesMerton model based on the following variables at inception on May 9, 2017:
| ● | Strike price of $3.5, for the conversion options | |
| ● | Expected volatility of 260.8% calculated using the Company’s historical price of its common stock | |
| ● | Expected dividend yield of 0% | |
| ● | Risk-free interest rate of 1.37%, for the conversion options | |
| ● | Expected lives of 2.0 years | |
| ● | Market price at issuance date of $2.7 |
| 22 |
The fair value of embedded conversion feature werewas calculated using the BlackScholesMerton model based on the following variables on September 30, 2017:December 31, 2018:
| ● | Strike price of $3.5, for the conversion options | |
| ● | Expected volatility of | |
| ● | Expected dividend yield of 0% | |
| ● | Risk-free interest rate of | |
| ● | Expected lives of | |
| ● | Market price at |
On May 9, 2017, the Company recorded $569,784 as derivative liability forThe fair value of embedded conversion feature were calculated using the conversion option. The initial carrying value ofBlackScholesMerton model based on the Notes was $227,051. On September 30, 2017,following variables on May 7, 2019:
| ● | Strike price of $3.5, for the conversion options | |
| ● | Expected volatility of 192.48% calculated using the Company’s historical price of its common stock | |
| ● | Expected dividend yield of 0% | |
| ● | Risk-free interest rate of 2.37%, for the conversion options | |
| ● | Expected lives of 1.00 years | |
| ● | Market price at re-measurement date of $0.95 |
The fair value of derivative liabilities was recalculated at $370,733. embedded conversion feature were calculated using the BlackScholesMerton model based on the following variables on June 30, 2019:
| ● | Strike price of $3.5, for the conversion options | |
| ● | Expected volatility of 214.79% calculated using the Company’s historical price of its common stock | |
| ● | Expected dividend yield of 0% | |
| ● | Risk-free interest rate of 1.95%, for the conversion options | |
| ● | Expected lives of 0.83 years | |
| ● | Market price at re-measurement date of $0.75 |
For the three months ended June 30, 2019 and nine months ended September 30, 2017, the Company recognized a gain of $205,612 and $199,051, respectively, in change in fair value of derivative liabilities.
For the nine months ended September 30, 2017,2018, the Company recorded interest expense of $162,520$74,074 and $103,304, respectively, and for the six months ended June 30, 2019 and 2018, the Company recorded interest expense of $174,474 and $205,540, respectively, on the note, including the amortization of the debt discount resulting from the value of the embedded conversion feature, and the carrying value of the note was $720,215 and $699,963 as of SeptemberJune 30, 20172019 and December 31, 2018, respectively.
| 23 |
(4) 12% convertible notes- Labrys
On February 27, 2019, the Company entered into a Convertible Note Agreement with Labrys Fund, LP (“Labrys”), for the principal amount of $1,365,000 (the “Note”). The Note carries an Original Issue Discount of $102,375, bears interest at the rate of 12% per annum and must be repaid on or before 180 calendar days after the funding date of the respective tranche. The amounts advanced under the Note may be converted by Labrys at any time after 180 days from the date of the Note into shares of Company common stock at a conversion price equal to 70% of the lowest trading price during the 20 trading day period prior to the date of any notice of conversion. As of June 30, 2019, the Company has received principal totaled $1,213,250 out of the $1,365,000 Convertible Note Agreement.
In addition, the Company issued 50,000 shares of the Company’s common stock with a fair value of $40,000, determined using the closing price of the issuance date of $0.80 per shares in connection with these issuances along with the original issue discount of $90,994 were recognized as discounts from the principal amount to be amortized over 180 days.
Furthermore, the notes are convertible into shares of the common stock, at conversion price equal to 70% of the lowest trading price during the 20 trading day period prior to the date of any notice of conversion, which is lower than the price of the Company’s common stock on the date of issue. Therefore, the conversion feature embedded in the convertible note meet the definition of beneficial conversion feature (“BCF”). The Company evaluated the intrinsic value of the BCF as $1,071,506 at the issue date. The relative fair values of the BCF were recorded into additional paid in capital.
For the three and six months ended June 30, 2019, the Company recorded interest expense of $644,229 and $764,203 on the note, including the amortization of the debt discount of $607,931 and $721,503 resulting from the value of beneficial conversion feature, and the carrying value of the note as at June 30, 2019 was $370,321.$732,253.
12.(5) 12% convertible notes- TFK
On March 21, 2019, the Company entered into a Convertible Note Agreement with TFK Investments Inc. (“TFK”), for the principal amount of $300,000 (the “Note”). The Note carries an Original Issue Discount of 28,500, bears interest at the rate of 12% per annum and must be repaid on or before 180 calendar days after the funding date of the respective tranche. The amounts advanced under the Note may be converted by TFK at any time after 180 days from the date of the Note into shares of Company common stock at a conversion price equal to 70% of the lowest trading price during the 20 trading day period prior to the date of any notice of conversion. As of June 30, 2019, the Company has received principal totaled $150,000 out of the $300,000 Convertible Note Agreement.
In addition, the Company issued 7,500 shares of the Company’s common stock with a fair value of $6,975, determined using the closing price of the issuance date of $0.93 per shares in connection with these issuances along with the original issue discount of $14,250 were recognized as discounts from the principal amount to be amortized over 180 days.
Furthermore, the notes are convertible into shares of the common stock, at conversion price equal to 70% of the lowest trading price during the 20 trading day period prior to the date of any notice of conversion, which is lower than the price of the Company’s common stock on the date of issue. Therefore, the conversion feature embedded in the convertible note meet the definition of beneficial conversion feature (“BCF”). The Company evaluated the intrinsic value of the BCF as $128,775 at the issue date. The relative fair values of the BCF were recorded into additional paid in capital.
For the three and six months ended June 30, 2019, the Company recorded interest expense of $80,321 and $85,568 on the note, including the amortization of the debt discount of $75,833 and $80,833 resulting from the value of beneficial conversion feature, and the carrying value of the note as at June 30, 2019 was $80,833.
13. Note Payable
On May 29, 2007, the Company issued a $360,000 promissory note (the “Promissory Note”) to an unrelated individual (the “Original Note holder”). This note bears interest at 18% per annum and was due on July 27, 2007. This note is currently in default and bears interest of 25% per annum (the “Default rate”) until paid in full. This note is secured by a pledge of shares of the Company’s common stock owned by Investlink (China) Limited (the “Pledged Shares”). The Company accrued $22,500 and 22,500 interest expense on note payable for the three months ended September 30, 2017 and 2016, respectively, and $67,500 and $67,500 interest expense on note payable for the nine months ended September 30, 2017 and 2016, respectively.
As of December 31,In 2016, the Original Note holder informed the Company that all right, title and interests in the Promissory Note has been assigned and transferred to FirsTrust.
| 24 |
On September 19, 2018, the Company has entered a Settlement Agreement and Release with Firs Trust to settle the Notes and interest. The Company has agreed to make a cash payment of $200,000 and to issue 300,000 Shares to FirsTrust by October 18, 2018 and to make a final cash payment of $260,000 by February 28, 2019. However, the Company has not performed its obligations in the Settlement Agreement as of December 31, 2018, and considered the payment terms as default and continued to accrue its interest after September 19, 2018.
On March 21, 2019, the Company issued 300,000 shares of common stock with fair value of $222,000, determined using the closing prices of $0.74 on March 21, 2018, to repay $222,000 of the note payable. As a result, no gain or loss were recognized upon this conversion.
On March 26, 2019, the Company has entered into the First Amendment Agreement with FirsTrust to settle the promissory notes together with the 6% secured convertible notes as disclosed under Note 11 plus interest and penalties with a total payable of approximately $2.3 million as of the date of the First Amendment Agreement was entered. The Company has agreed to make a payment of $29,789 (RMB200,000) , which has been paid on April 1, 2019, to enter into this Amendment, and settled with the total outstanding balance of $1.3 million to be due under the terms of the First Amendment Agreement by June 30, 2019. If such settled outstanding balance was not made by June 30, 2019, it will deem the First Amendment Agreement to be ineffective and the Company will need to continue to pay FirsTrust the amount set forth in the Settlement Agreement.
As of SeptemberJune 30, 2017, all of2019 and December 31, 2018, $138,000 and $360,000 of Promissory Note to FirsTrust is still outstanding,outstanding. The Company accrued $8,625 and total$22,500 interest expense on note payable for the three months ended June 30, 2019 and 2018, respectively. The Company accrued $31,125 and $45,000 interest expense on note payable for the six months ended June 30, 2019 and 2018, respectively.
As of this date, the Company remains in default of the Promissory NoteSettlement Agreement and Release and is $ 926,800. Thein the process of raising funds to retire these obligations. Notwithstanding, there is no guarantee that the Company will be successful in these efforts and that FirsTrust will not exercise all rights available to it under the applicable agreements between the parties.
On July 30, 2019, the Company received a notice of default and formal demand for payment and performance, which was followed by correspondence from FirsTrust’s lawyers that the commencement of legal action was imminent. As of this date, the Company has begun preliminary discussion withnot received the service of any formal legal papers related to the matter. Since this matter is in its early stages, the final outcome cannot be predicted at this time and is largely dependent on the Company’s ability to raise funding to retire these obligations. If FirsTrust with regards tois successful in pursuing its legal action, the result could have a potential settlement ofmaterial adverse impact on the Note, but no agreement has been reached yet.Company and its operations.
13.14. Other Payables and accruals
Other payable consisted of the following:
| Notes | September 30, 2017 | December 31, 2016 | Notes | June 30, 2019 | December 31, 2018 | |||||||||||||||||||
| Stock subscription proceeds received in advance | (1) | $ | 1,310,522 | $ | 460,617 | (1) | $ | 1,693,167 | $ | 1,692,454 | ||||||||||||||
| Investment received in advance | (2) | - | 79,168 | |||||||||||||||||||||
| Accrued expenses | 59,216 | 385,090 | 289,002 | 219,033 | ||||||||||||||||||||
| R&D expense payable | 271,151 | - | 431,009 | 431,009 | ||||||||||||||||||||
| Others | 427,306 | 597,592 | ||||||||||||||||||||||
| $ | 1,640,889 | $ | 924,875 | $ | 2,840,484 | $ | 2,940,088 | |||||||||||||||||
(1). The Company received RMB 3.2 million ($466,092 equivalent as at June 30, 2019) in 2016 and RMB 5.5 million for the nine months ended September 30, 2017 from fourtwo unrelated potential investors, which was approximately $1,310,522.and additionally received RMB 8 million ($1,227,075 equivalent as at June 30, 2019) in 2017 from one unrelated potential investor pending for stock issuances. The Company has subsequently issued 38,000is in the process of negotiating the issuance price per shares of commonthese stock to one investor forsubscriptions with the amount $ 76,000 (RMB 0.5 million) and the other investment agreements have not been finalized yet for the remaining part.
(2). The Company received the investment funds in advance in 2016 from Mr. Geng Liu, which amount was approximately $79,168. Subsequently on January 17, 2017, the Company entered a Convertible Note Agreement with Mr. Geng. The note bears interest at 15% per annum and will mature on January 16, 2018. See Note 12.investors.
14.15. Stockholders’ Equity (Deficiency)
Preferred stock
On December 14, 2015, the Company issued 500,000 shares of preferred stock series A for the aggregate amount of $1,000,000 as debt cancellation owed to two related party individuals.
Reverse Split
On January 14, 2016,These shares of Series A Preferred Stock shall have voting rights equal to aggregate of 75% of total shares entitled to vote by both (i) the Company filed a Certificateholders of Amendmentall of its Certificate of Incorporation with the State of Delaware with reference to a 1-for-200 reverse stock split with respect to its Common Stock with effective date of January 28, 2016. In connection with the reverse split, the Company’s authorized capital was amended to be 120,000,000 shares, comprising 100,000,000then outstanding shares of Common Stock par value $0.001(whether or not such holders vote) and 20,000,000(ii) the holders of all of the then outstanding shares of the Company. The holders of preferred stock are entitled to receive noncumulative dividends, when and if declared by the board of directors. Dividends are not mandatory and shall not accrue. The Company shall have the right to redeem the Series A Preferred Stock, par value $0.001. All relevant information relatingplus any accrued and unpaid dividends at a cash redemption price equal to numbersthe aggregate issuance price of $2.0 per share.
| 25 |
On December 28, 2017, the Company issued 811,148 shares of preferred stock series B for the aggregate amount of $1,054,492 as debt cancellation owed to one related party individual.
These shares of Series B Preferred Stock have a liquidation preference which is same with the Company’s Series A Preferred Stock, and is entitled to vote on an as-converted basis as the holder of common stock, and is convertible into the Company’s common stock on a one-for-one basis at any time at the option of the holder. The holders of preferred stock are entitled to receive noncumulative dividends, when and if declared by the board of directors. Dividends are not mandatory and shall not accrue. The Company shall have the right to redeem the Series B Preferred Stock, plus any accrued and unpaid dividends at a cash redemption price equal to the aggregate issuance price of $1.3 per share information have been retrospectively adjusted to reflect the reverse stock split for all periods presented.share.
Common stock
During the ninesix months ended September 30, 2017, the Company issued 1,674,900 common shares to six individuals residing in China for net proceeds of $2,410,654.
On June 30, 2017, the Company issued 97,850 common shares to ten employees for cash at $1.95 per share for an aggregate price to $190,807. The difference $102,273 based on the calculation between stock price and employee purchase price was recognized as expense of employee benefits and accordingly, credited the same amount to APIC.
During the nine months ended September 30, 2017,2019, the Company entered into tenthree consulting agreements and issued 665,988784,999 shares of common stocks to consultants for financing,IR and business development services and IT services based on market price of issuance.the shares at the transaction dates. The valuation of the shares is amounted to an average issuance price of $0.86 per share.
During the six months ended June 30, 2018, the Company issued 20,657 common shares to one officer for salary payment based on the average stock price of his service period which valued at $17,665.
Conversion of convertible note
As disclosed in Note 12(1), on April 27, 2018, the Company issued total 126,045 common shares at $0.62 per share price to FirsTrust Group, Inc. for the conversion of convertible note.
As disclosed in Note 12(1), on March 26, 2019, the Company issued total 395,959 common shares at $0.20 per share price to FirsTrust Group, Inc. for the conversion of convertible note.
Additional paid-in-capital
As disclosed in Note 11(1), on January 17, 2017,12, in February and March 2019, the Company issued RMB 1 million ($144,944 equivalent).Convertible Note to Mr. Geng Liuin the principal amount of $1,363,250 convertible notes with BCF embedded. The Company evaluated the intrinsic value of the BCF as $45,094$1,200,281, at the issue date and recorded the amount into additional paid in capital. All other amounts recorded in additional paid in capital are derived from issuance of preferred shares or common shares as disclosed in the above.
15.16. Stock-based Compensation
On March 15, 2017, the Board of Directors approved a new stock option plan with ten years’ term. As of SeptemberJune 30, 2017,2019, the Company has not granted any incentive compensation under this plan.
| 26 |
16.17. Fair Value Measurements
The following table sets forth by level within the fair value hierarchy the Company’s financial assets and liabilities recorded at fair value on recurring basis that were accounted for at fair value as of:
SeptemberJune 30, 20172019
| Recurring Fair Value Measures | Level 1 | Level 2 | Level 3 | Total | Level 1 | Level 2 | Level 3 | Total | ||||||||||||||||||||||||
| Derivative liabilities | — | — | $ | 370,733 | $ | 370,733 | — | — | $ | 68,591 | $ | 68,591 | ||||||||||||||||||||
| Total | — | — | $ | 370,733 | $ | 370,733 | — | — | $ | 68,591 | $ | 68,591 | ||||||||||||||||||||
December 31, 2018
| Recurring Fair Value Measures | Level 1 | Level 2 | Level 3 | Total | ||||||||||||
| Derivative liabilities | — | — | $ | 6,621 | $ | 6,621 | ||||||||||
| Total | — | — | $ | 6,621 | $ | 6,621 | ||||||||||
The following is a reconciliation of the beginning and ending balance of the assets and liabilities measured at fair value on a recurring basis for the ninesix months ended SeptemberJune 30, 20172018 and for the year ended December 31, 2016:2017:
| Six months ended June 30, 2019 | Year ended December 31, 2018 | |||||||
| Beginning balance | $ | 6,621 | $ | 247,933 | ||||
| Fair value of derivative liabilities at inception | 95,144 | - | ||||||
| Change in fair value of derivative liabilities | (33,174 | ) | (241,312 | ) | ||||
| Ending balance | $ | 68,591 | $ | 6,621 | ||||
18. Earnings per share
The following table set forth the computation of basic and diluted earnings per share for the three and six months ended June 30, 2019 and 2018.
| Nine months ended September 30, 2017 | Year ended December 31, 2016 | |||||||
| Beginning balance | $ | - | $ | - | ||||
| Fair value of derivative liabilities at inception | 569,784 | - | ||||||
| Change in fair value of derivative liabilities | (199,051 | ) | - | |||||
| Ending balance | $ | 370,733 | $ | - | ||||
| Three months ended June 30, | Six months ended June 30, | |||||||||||||||
| 2019 | 2018 | 2019 | 2018 | |||||||||||||
| Numerator: | ||||||||||||||||
| Net loss | $ | (2,245,690 | ) | $ | (635,368 | ) | $ | (1,855,067 | ) | $ | (582,400 | ) | ||||
| Denominator: | ||||||||||||||||
| Denominator for basic earnings per share (weighted-average shares) | 19,343,881 | 16,479,316 | 18,272,950 | 16,201,020 | ||||||||||||
| Diluted effect of stocks – convertible note | - | - | - | - | ||||||||||||
| Denominator for diluted earnings per share (adjusted weighted-average shares) | 19,343,881 | 16,479,316 | 18,272,950 | 16,201,020 | ||||||||||||
| Basic earnings per share | (0.12 | ) | (0.04 | ) | (0.10 | ) | (0.04 | ) | ||||||||
| Diluted earnings per share | (0.12 | ) | (0.04 | ) | (0.10 | ) | (0.04 | ) | ||||||||
17. 19.Income Tax
In accordance with the current tax laws in the U.S., the Company is subject to a corporate tax rate of 34%21% on its taxable income. No provision for taxes is made for U.S. income tax for the three and ninesix months ended SeptemberJune 30, 20172019 and 20162018 as it has no taxable income in the U.S.
On December 22, 2017, the “Tax Cuts and Jobs Act” (“The 2017 Tax Act”) was enacted in the United States. Under the provisions of the Act, the U.S. corporate tax rate decreased from 34% to 21%. Accordingly, the Company has re-measured its deferred tax assets on net operating loss carry forwards in the U.S at the lower enacted cooperated tax rate of 21%. However, this re-measurement has no effect on the Company’s income tax expenses as the Company has provided a 100% valuation allowance on its deferred tax assets previously.
Additionally, the 2017 Tax Act implemented a modified territorial tax system and imposing a tax on previously untaxed accumulated earnings and profits (“E&P”) of foreign subsidiaries (the “Toll Charge”). The Toll Charge is based in part on the amount of E&P held in cash and other specific assets as of December 31, 2017. The Toll Charge can be paid over an eight year period, starting in 2018, and will not accrue interest. The 2017 Tax Act also imposed a global intangible low-taxed income tax (“GILTI”), which is a new tax on certain off-shore earnings at an effective rate of 10.5% for tax years beginning after December 31, 2017 (increasing to 13.125% for tax years beginning after December 31, 2025) with a partial offset for foreign tax credits.
The Company has determined that this one-time Toll Charge has no effect on the Company’s income tax expenses for the three months ended June 30, 2018 as the Company has no undistributed foreign earnings at either of the two testing dates of November 2, 2017 and December 31, 2017.
For purposes of the inclusion of GILTI, the Company has determined the taxable off-shore earnings in the amount of $3.5 million in the year ended December 31, 2018, which has been fully offset by the current year loss of $3.2 million and NOL carryforwards of $0.3 million of Kiwa US. Therefore, this is no accrual of US income tax for GILTI as of December 31, 2018. The Company will evaluate the GILTI tax effect at the year end for the year ended 31, 2019.
| 27 |
In accordance with the current tax laws in China, Kiwa Shandong, Kiwa Beijing, Kiwa Shenzhen, Kiwa Xian, Kiwa Hebei, Kiwa Yangling, and Kiwa Hebei isInstitute are subject to a corporate income tax rate of 25% on its taxable income. Kiwa Shandong hasShenzhen, Kiwa Baiao, Kiwa Hebei, and Kiwa Institute have not provided for any corporate income taxes since iteach had no taxable income for the three and nine monthsyear ended SeptemberJune 30, 2017 and 2016. Kiwa Shenzhen and Kiwa Hebei has not provided for any corporate income taxes since it had no taxable income for the three and nine months ended September 30, 2017 and 2016.2019. For the three and ninesix months ended SeptemberJune 30, 2017,2019, Kiwa BeijingYangling recorded no current income tax provision.provision for approximately $716,352 and $1,225,023 respectively, and Kiwa Xian recorded income tax provision for approximately $(2,350) and $9,887, respectively.
In accordance with the relevant tax laws in the British Virgin Islands, Kiwa BVI, as an International Business Company, is exempt from income taxes.taxes in the BVI.
A reconciliation of the provision for income taxes from continuing operation determined at the local income tax rate to the Company’s effective income tax rate is as follows:
| Three months ended September 30, | Nine months ended September 30, | |||||||||||||||
| 2017 | 2016 | 2017 | 2016 | |||||||||||||
| Pre-tax income (loss) from continuing operation | $ | (850,876 | ) | $ | 224,712 | $ | (2,227,413 | ) | $ | 570,397 | ||||||
| U.S. federal corporate income tax rate | 34 | % | 34 | % | 34 | % | 34 | % | ||||||||
Income tax expense (benefit) computed at U.S. federal corporation income tax rate | (289,298 | ) | 76,402 | (757,320 | ) | 193,935 | ||||||||||
| Reconciling items: | ||||||||||||||||
| Rate differential for PRC earnings | 85,840 | (32,403 | ) | 133,249 | (28,419 | ) | ||||||||||
| Change of valuation allowance | 73,251 | 60,880 | 381,789 | 180,581 | ||||||||||||
| Effect of tax exempted income in BVI | 7,139 | (25,934 | ) | 21,422 | (267,152 | ) | ||||||||||
| Effective tax expenses (benefits) | $ | (123,068 | ) | $ | 78,945 | $ | (220,860 | ) | $ | 78,945 | ||||||
| Three months ended June 30, | Six months ended June 30, | |||||||||||||||
| 2019 | 2018 | 2019 | 2018 | |||||||||||||
| Pre-tax income (loss) from continuing operation | $ | (1,531,688 | ) | $ | (277,302 | ) | $ | (620,157 | ) | $ | 314,809 | |||||
| U.S. federal corporate income tax rate | 21 | % | 21 | % | 21 | % | 21 | % | ||||||||
| Income tax expense (benefit) computed at U.S. federal corporation income tax rate | (321,654 | ) | (58,233 | ) | (130,233 | ) | 66,110 | |||||||||
| Reconciling items: | ||||||||||||||||
| Rate differential for PRC earnings | 1,020 | 24,563 | 83,265 | 80,270 | ||||||||||||
| Change of valuation allowance | 1,029,334 | 385,686 | 1,256,980 | 740,369 | ||||||||||||
| Effect of tax exempted income in BVI | 5,302 | 6,050 | 24,898 | 10,460 | ||||||||||||
| Deferred tax used to offset tax liability | - | - | - | - | ||||||||||||
| Effective tax expenses | $ | 714,002 | $ | 385,066 | $ | 1,234,910 | $ | 897,209 | ||||||||
The Company had deferred tax assets from continuing operation as follows:
| September 30, 2017 | December 31, 2016 | |||||||
| Net operating losses carried forward by the Company and its China subsidiaries except for Kiwa Beijing | $ | 2,814,453 | $ | 2,555,064 | ||||
| Less: Valuation allowance | (2,814,453 | ) | (2,555,064 | ) | ||||
| Bad debt allowance | 63,244 | - | ||||||
| Net operating losses carried forward by Kiwa Beijing | 183,628 | - | ||||||
| Net deferred tax assets | $ | 246,872 | $ | - | ||||
| June 30, 2019 | December 31, 2018 | |||||||
| Net operating losses carried forward by parent Company in the US | $ | 2,218,830 | $ | 1,676,335 | ||||
| Net operating losses carried forward by China Subsidiaries | 832,067 | 821,089 | ||||||
| Provision for Deferred COGS | 612,191 | |||||||
| Allowance for Bad Debt | 91,296 | |||||||
| Less: Valuation allowance | (3,754,384 | ) | (2,497,424 | ) | ||||
| Net deferred tax assets | $ | - | $ | - | ||||
| 28 |
As of SeptemberJune 30, 20172019 and December 31, 2016,2018, the Company had approximately $8.3$13.9 million and $7.5$11.3 million net operating loss carryforwards available to reduce future taxable income. Net operating loss of the parent Company could be carried forward and taken against any taxable income for a period of not more than twenty years from the year of the initial loss pursuant to Section 172 of the Internal Revenue Code of 1986, as amended. The net operating loss of Kiwa Baiao, Kiwa Shenzhen, Kiwa Xian, Kiwa Hebei, and Kiwa Institute could be carried forward for a period of not more than five years from the year of the initial loss pursuant to relevant PRC tax laws and regulations. It is more likely than not that the deferred tax assets cannot be utilized in the future because there will not be significant future earnings from the entity which generated the net operating loss. Therefore, the Company recorded a full valuation allowance on its deferred tax assets.
As of SeptemberJune 30, 2017, the Company had approximately $0.1 million deferred tax assets on bad debt allowance. Bad debt allowance must be approved by the PRC tax authority prior to being deducted as an expense item on the tax return.
As of September 30, 20172019 and December 31, 2016,2018, the Company has no material unrecognized tax benefits which would favorably affect the effective income tax rate in future periods and does not believe that there will be any significant increases or decreases of unrecognized tax benefits within the next twelve months. No interest or penalties relating to income tax matters have been imposed on the Company during the ninethree months ended SeptemberJune 30, 20172019 and December 31, 2016,2018, and no provision for interest and penalties is deemed necessary as of SeptemberJune 30, 20172019 and December 31, 2016.2018.
18. 20.Commitments and Contingencies
The Company has the following material contractual obligations:
(1) Investment in manufacturing facilities in Penglai City, Shandong Province in China
As disclosed in Note 8,9, on June 8, 2017, Kiwa Hebei entered an equity purchase agreement with the shareholders of Yantai Peng Hao New Materials Technology Co. Ltd. (“Peng Hao”) to acquire 100% interest in Peng Hao for approximately RMB 15,000,000 (approximately US$ 2.22.3 million). As of SeptemberJune 30, 2017,2019, Kiwa Hebei has made deposit payment of RMB 5,000,000 (approximately $751,050)$0.7 million) and is committed to pay the remaining RMB10,000,000 based on the payment milestone in the equity purchase agreement. RMB 6,500,000 (approximately $1.0 million) will be paid upon completion of the land use rights ownership transfer and RMB 3,500,000 (approximately $0.5 million) will be paid upon completion of the business licenses transfer.
(2) Strategic cooperation with the institutes in China21.
On November 5, 2015, the Company signed a strategic cooperation agreement (the “Agreement”) with China Academy of Agricultural Science (“CAAS”)’s Institute of Agricultural Resources & Regional Planning (“IARRP”) and Institute of Agricultural Economy & Development (“IAED”). Pursuant to the Agreement, the Company will form a strategic partnership with the two institutes and establish an “International Cooperation Platform for Internet and Safe Agricultural Products”. To fund the cooperation platform’s R&D activities, the Company will provide RMB 1 million (approximately $160,000) per year to the Spatial Agriculture Planning Method & Applications Innovation Team that belongs to the Institutes. The term of the Agreement is for three years beginning November 20, 2015 and will expire on November 19, 2018. However, the Company is only liable for the annual funds to be provided to the extent of the contract obligations performed by CAAS IARRP and IAED, and the agreement is terminable before the three years’ commitment date based on negotiations of both parties.
(3) Lease payments
(a) On March 21, 2016, Kiwa Baiao Bio-Tech (Beijing) Co., Ltd. entered an office lease agreement with two-year term. Monthly lease payment fee totaled RMB 68,133 or approximately USD $10,536.
(b) On November 20, 2016, Kiwa Baiao Bio-Tech (Beijing) Co., Ltd. entered an apartment lease agreement for its employees. The lease term is one year with monthly lease payment of RMB 6,000 or approximately USD $896. This lease was terminated on May 31, 2017 upon mutual agreement.
(c) On March 1, 2017, Kiwa Bio-Tech (Shenzhen) Co., Ltd, a newly established subsidiary entered an office lease agreement with one-year term. Monthly lease payment is RMB 29,000 or approximately of USD $4,320. This lease was terminated on August 31, 2017.
(d) On June 20, 2017, Kiwa Bio-Tech (Shenzhen) Co., Ltd, a newly established subsidiary entered an office lease agreement with two-year term. Monthly lease payment is RMB 117,221 or approximately of USD $17,213 for the first year and RMB 124,254 or approximately of USD $18,245 for the second year. And the previous lease agreement terminated automatically since the landlord is the same one.
(e) On September 1, 2017, Kiwa Bio-Tech (Shenzhen) Co., Ltd. entered a storage lease agreement with one-year term. Monthly lease payment fee totaled RMB 4,800 or approximately USD $721.
(f) On May 5, 2017, Kiwa Bio-Tech Products Group Corporation entered an office lease agreement with 13 months term. Monthly lease payment totaled USD $781.15.
(g) On July 1, 2017, Kiwa Bio-Tech Products Group Corporation entered an office lease agreement with one-year term. Monthly lease payment totaled USD $1,087.
(h) On July 4, 2017, Kiwa Bio-Tech (Hebei) Co., Ltd, a newly established subsidiary entered an office lease agreement with one-year term. Monthly lease payment is RMB 2,000 or approximately of USD $301.
(i) On September 1, 2017, Kiwa Bio-Tech (Hebei) Co., Ltd, entered an apartment lease agreement for its employees. The lease term is one year with monthly lease payment of RMB 1,060 or approximately USD $161.
The future lease payments at September 30, 2017 are summarized below.
| Twelve months ending September 30, 2018 | $ | 314,214 | ||
| Twelve months ending September 30, 2019 | $ | 167,976 | ||
| Thereafter | - | |||
| Total minimum lease payment | $ | 482,190 |
19. Concentration of Risk
Credit risk
Financial instruments that potentially subject the Company to significant concentrations of credit risk consist primarily of cash and accounts receivable. As of SeptemberJune 30, 20172019, and December 31, 2016, $23,275,2018, $10,099, and $13,469$7,859 were deposited with various major financial institutions located in the PRC, respectively. While management believes that these financial institutions are of high credit quality, it also continually monitors their credit worthiness.
Accounts receivable are typically unsecured and derived from revenue earned from customers, thereby exposed to credit risk. The risk is mitigated by the Company’s assessment of its customers’ creditworthiness and its ongoing monitoring of outstanding balances.
Customer and vendor concentration risk
For the ninethree months ended SeptemberJune 30, 2017, five2019, three customers accounted for 23%57%, 14%26%, 14%, 14% and 14% of17% for the Company’s total sales. For the ninesix months ended SeptemberJune 30, 2016,2019, three customers accounted for 48%, 26%, and 23% for the Company’s total sales.
For the three months ended June 30, 2018, one customer accounted for 100% of98% for the Company’s revenues.total sales. For the six months ended June 30, 2018, three customers accounted for 51%, 32%, and 15% for the Company’s total sales.
As of SeptemberJune 30, 2017,2019, three customers accounted for 45%40%, 30%29% and 12%26% of the Company’s accounts receivable. As of December 31, 2016, one customer2018, three customers accounted for 100%42%, 30%, and 27% of the Company’s accounts receivable.
For the ninethree months ended SeptemberJune 30, 2017,2019, one supplier accounted for 93%94% of the Company’s total purchases. For the ninesix months ended SeptemberJune 30, 2016,2019, one supplier accounted for 91%94% of the Company’s total purchases.
For the three months ended June 30, 2018, one supplier accounted for 95% of the Company’s total purchases. For the six months ended June 30, 2018, one supplier accounted for 95% of the Company’s total purchases.
As of SeptemberJune 30, 2017, two suppliers2019, one supplier accounted for 81% and 13%89% of the Company’s accounts payable. As of December 31, 2016, two suppliers2018, one supplier accounted for 57% and 43%84% of the Company’s accounts payable.
20. Discontinued Operation22.Subsequent Events
On February 11, 2017,July 8, 2019, the Company executed an Equity Transfer Agreement with Dian Shi Cheng Jing (Beijing) Technology Co. (“Transferee”) wherebyBoard of Directors removed Yongling Song as a member of the Company transferred allBoard of its right, title and interest inDirectors of Kiwa Bio-Tech Products (Shandong) Co., Ltd. (“Shandong”) toGroup Corp.
On July 8, 2019, the Transferee for the RMB 1.00. The government approval and processingBoard of Directors appointed Xiaoqiang Yu as a member of the transaction was completed on April 12, 2017. This transaction was considered as completed and effective on April 12, 2017.
The following table summarizes the assets and liabilitiesBoard of the discontinued operation, excluding intercompany balances eliminated in consolidation, at April 12, 2017 and December 31, 2016, respectively:
| April 12, 2017 | December 31, 2016 | |||||||
| Assets held for sale: | ||||||||
| Property, plant and equipment – Original cost | 2,117,324 | 2,117,324 | ||||||
| Less: accumulated depreciation | (765,598 | ) | (765,598 | ) | ||||
| Less: impairment | (1,351,726 | ) | (1,351,726 | ) | ||||
| Deferred tax assets | 1,013,365 | 1,013,365 | ||||||
| Less: Deferred tax assets allowance | (1,013,365 | ) | (1,013,365 | ) | ||||
| Total assets of business held for sale | $ | - | $ | - | ||||
| Liabilities of business held for sale: | ||||||||
| Accounts Payable | 253,208 | 251,466 | ||||||
| Advances from customers | 12,972 | 12,883 | ||||||
| Salary payable | 537,127 | 533,432 | ||||||
| Accrued expense | 29,035 | 28,835 | ||||||
| Other payable | 102,291 | 101,588 | ||||||
| Due to related party-trade | 1,130,534 | 1,122,754 | ||||||
| Loan payable | 1,666,813 | 1,655,343 | ||||||
| Construction cost payable | 257,309 | 255,539 | ||||||
| Tax payable | 522,893 | 502,845 | ||||||
| Total liabilities of business held for sale | $ | 4,512,182 | $ | 4,464,685 | ||||
The income statements for the three and nine months ended September 30, 2017 and 2016 reflected the Kiwa Shandong business segment as a discontinued operation. The following results of operationsDirectors of Kiwa Shandong are presented as a loss from a discontinued operation in the unaudited condensed consolidated statements of operations:
| Three months ended September 30, | Nine months ended September 30, | |||||||||||||||
| 2017 | 2016 | 2017 | 2016 | |||||||||||||
| Net sales | - | - | - | - | ||||||||||||
| Gross profit | - | - | - | - | ||||||||||||
| Operating expense | - | 52,166 | 16,790 | 159,745 | ||||||||||||
| Income tax | - | - | - | - | ||||||||||||
| Loss from discontinued operations | $ | - | $ | 52,166 | $ | 16,790 | $ | 159,745 | ||||||||
The following is the calculation of the gain on the sale of Kiwa Shandong:
| Selling price | $ | - | ||
| Net assets (liabilities) transferred at the transaction date | $ | (4,512,182 | ) | |
| Gain on sale of discontinued operations | $ | 4,512,182 |
Bio-Tech Products Group Corp.
21. Subsequent Events
On October 24, 2017, the Company issued 38,000 shares of restricted common stock at $2.00 per share to Erli Wei for an aggregate amount of $76,000. The Company has received the full amount.
On October 19, 2017, the Company issued total 14,151 common shares at $1.04 per share price to FirsTrust Group, Inc. for the conversion of convertible note.According to the convertible note agreement, the conversion price is based on a 40% discount to the average of the lowest three days trading price of the Company’s common stock on the OTC Bulletin Board over a 20-day trading period per the convertible notes agreement.
On October 24, 2017, the Company issued a total of 1,338,000 common shares to nine individuals for their consulting services to assist the Company in marketing and financing projects. The number of shares was determined based on the fair value of the services. The agreements have terms ranging from one to three years.
ITEM 2. MANAGEMENT’S DISCUSSION AND ANALYSIS OF FINANCIAL CONDITION AND RESULTS OF OPERATIONS.
This Quarterly Report on Form 10-Q for the three and ninesix months ended SeptemberJune 30, 20172019 contains “forward-looking statements” within the meaning of Section 21E of the Securities and Exchange Act of 1934, as amended, including statements that include the words “believes,” “expects,” “anticipates,” or similar expressions. These forward-looking statements include, among others, statements concerning our expectations regarding our working capital requirements, financing requirements, business, growth prospects, competition and results of operations, and other statements of expectations, beliefs, future plans and strategies, anticipated events or trends, and similar expressions concerning matters that are not historical facts. The forward-looking statements in this Quarterly Report on Form 10-Q for the three and ninesix months ended SeptemberJune 30, 20172019 involve known and unknown risks, uncertainties and other factors that could cause our actual results, performance or achievements to differ materially from those expressed in or implied by the forward-looking statements contained herein.
Overview
The Company took its present corporate form in March 2004 when shareholders of Kiwa Bio-Tech Products Group Ltd. (“Kiwa BVI”), a company originally organized under the laws of the British Virgin Islands on June 5, 2002 and Tintic Gold Mining Company (“Tintic”), a corporation originally incorporated in the state of Utah on June 14, 1933 to perform mining operations in Utah, entered into a share exchange transaction. The share exchange transaction left the shareholders of Kiwa BVI owning a majority of Tintic and Kiwa BVI a wholly-owned subsidiary of Tintic. For accounting purposes this transaction was treated as an acquisition of Tintic by Kiwa BVI in the form of a reverse triangular merger and a recapitalization of Kiwa BVI and its wholly owned subsidiary, Kiwa Bio-Tech Products (Shandong) Co., Ltd. (“Kiwa Shandong”). On July 21, 2004, we completed our reincorporation in the State of Delaware. On March 8, 2017, we completed our reincorporation in the State of Nevada.
On November 30, 2015, we entered into an acquisition agreement (the “Agreement”) withThe Company develops, manufactures, distributes and markets innovative, cost-effective and environmentally safe bio-technological products for agricultural use. Our products are designed to enhance the shareholdersquality of Caber Holdings LTD, whose Chinese name is Hong Kong Baina Group Co., Ltd, located in Hong Kong (“Baina Hong Kong”),human life by increasing the value, quality and Oriental Baina Co. Ltd. (hereinafter referred to as “Baina Beijing”), Baina Hong Kong’s wholly-owned subsidiary in Beijing, China. Kiwa will rename Baina Beijing toproductivity of crops and decreasing the negative environmental impact of chemicals and other wastes.
The Company currently mainly operates its business through Kiwa Baiao Co. Ltd. Kiwa Baiao Co. Ltd will replace Kiwa’s current subsidiary in China - Kiwa Bio-Tech (Shandong) Co., Ltd (“Kiwa Shandong”) - to operate Kiwa’s bio-fertilizer market expansion and become Kiwa’s platform for future acquisitions of new agricultural-related projects in China. In accordance with the terms of the Agreement, Kiwa agreed to pay approximately $34,000 (RMB 220,000) to the Baina Hong Kong Shareholders, a group of unrelated third parties, for the acquisition of 100% of the equity of Baina Hong Kong. The acquisition was completed on January 7, 2016. Both Baina Hong Kong and Baina Beijing had no activities before the acquisition date and had no assets and liabilities. The purpose of this acquisition was to acquire Baina Hong Kong’s corporation registration in Hong Kong and in China.
We previously established a subsidiary in China, Kiwa Shandong in 2002, a wholly-owned subsidiary, engaging in the bio-fertilizer business. Formerly, our subsidiary Tianjin Kiwa Feed(Beijing) Co., Ltd. (“Kiwa Tianjin”Beijing”), which was engagedincorporated in the bio-enhanced feed business. At the endChina in January 2016, Kiwa Bio-Tech Products (Shenzhen) Co., Ltd. (“Kiwa Shenzhen”), which was incorporated in China in November 2016, Kiwa Bio-Tech Products (Hebei) Co., Ltd. (“Kiwa Hebei”), which was incorporated in China in December 2016, Kiwa Bio-Tech Products (Shenzhen) Co., Ltd. Xian Branch Company, (“Kiwa Xian”), which was incorporated in China in December 2017, Kiwa Bio-Tech (Yangling) Co., Ltd. (“Kiwa Yangling”), which incorporated in March 2018, and The Institute of 2009, Kiwa-Yangling Ecological Agriculture and Environment Research Co., Ltd. (“Kiwa Tianjin could no longer use its assets including machinery and inventoryInstitute”), which incorporated in the normal course of operations. Kiwa Tianjin has been dissolved sinceMarch 2018. In July 11, 2012. On February 11, 2017, the Company entered an Equity Transfer Agreement with Dian Shi Cheng Jing (Beijing) Technology Co.established Kiwa Bio-Tech Asia Holding (Shenzhen) Ltd. (“Transferee”Kiwa Asia”) to transfer allbe the direct holding company of shareholders’ right, titleKiwa Beijing, Kiwa Shenzhen, Kiwa Xian, Kiwa Institue and interest in Kiwa Shandong to the Transferee for RMB1.00. On April 12, 2017, the government processing of transfer has been completed.Hebei.
Principal Factors Affecting Our Financial Performance
We believe that the following factors that wouldcould affect our financial performance:
| ● | Change in the Chinese Government Policy on agricultural |
| 30 |
In April 2008, the Ministry of Finance of PRC issued Circular No. 2008-56 to tax-exempt value-added taxes on all organically fertilizer related products effectively from June 1, 2008. | ||
| In June 2016, the PRC State Council issued Circular No. 2016-31 to prevent further deterioration of landfall soil action plan. | ||
In February 2017, the Ministry of Agriculture of PRC issued Circular No. 2017-02 to carry out replacement of chemical bio-fertilizers by organically bio-fertilizers action plan on vegetables, fruits and teas planting. | ||
| ○ | In April | |
| ○ | In February 2019, the Ministry of Agriculture |
| ● | Innovation Efforts. We strive to produce the most technically and scientifically advanced products for our customers and maintained close relationships with institutes in the PRC. |
In March 2018, Kiwa Bio-Tech has established a |
| 31 |
| On October 12, 2018, Kiwa Bio-Tech got the approval from the Administrative Committee of Yangling Agricultural High-tech Industry Demonstration Zone to obtain land use rights to construct a | ||
| ||
| The |
| ● | Experienced Management. Management’s technical knowledge and business relationships give us the ability to secure more sales orders with our customers. If there were to be any significant turnover in our senior management, it could deplete the institutional knowledge held by our existing senior management team. | |
| ● | Large Scale Customer Relationship. We have contracts with major customers that are distributors of our products. Our sales efforts focus on these distributors which place large recurring | |
| ● | Competition. Our competition includes a number of publicly traded companies in the PRC and privately-held PRC-based companies that produce and sell products similar to ours. We compete primarily on the basis of quality, technological innovation and price. Some of our competitors have achieved greater market penetration but with less sophisticated technological innovation than our products as there were in the transition period from being the chemical bio-fertilizer producers to the organically bio-fertilizer producers. We believe that we have a better competitive advantage over them as we are the pioneer within our markets. Some of our competitors competed within our markets have lesser financial and other resources than us as they have established their companies a few years behind us. If we are unable to compete successfully in our markets, our relative market share and profits could be reduced. |
Results of Operations
ThreeResults of Operations for three months ended SeptemberJune 30, 20172019 and SeptemberJune 30, 20162018
The following table summarizes the results of our operations during the three months periods ended SeptemberJune 30, 20172019 and 2016,2018, respectively, and provides information regarding the dollar and percentage increase or (decrease) during such periods.
(All amounts, other than percentages, in thousands of U.S. dollars)
| Three months Ended September 30, | Amount Increase | Percentage Increase | ||||||||||||||
| Statement of Operations Data: | 2017 | 2016 | (Decrease) | (Decrease) | ||||||||||||
| Revenues | $ | 31 | $ | 1,185 | $ | (1,154 | ) | (97 | )% | |||||||
| Cost of goods sold | (20 | ) | (770 | ) | (750 | ) | (97 | )% | ||||||||
| Gross profit | 11 | 415 | (404 | ) | (97 | )% | ||||||||||
| Operating expenses | ||||||||||||||||
| Research and development expense | 37 | 37 | - | - | % | |||||||||||
| Selling expenses | 148 | - | 148 | 100 | % | |||||||||||
| General and administrative expenses | 1,068 | 182 | 886 | 487 | % | |||||||||||
| Total operating expenses | 1,253 | 219 | 1,034 | 472 | % | |||||||||||
| Operating Income (Loss) | (1,242 | ) | 196 | (1,438 | ) | (734 | )% | |||||||||
| Other income/(expense), net | ||||||||||||||||
| Trademark license income-related party | - | 76 | (76 | ) | (100 | )% | ||||||||||
| Change in fair value of derivative liabilities | 205 | - | 205 | 100 | % | |||||||||||
| Interest expense | (169 | ) | (47 | ) | 122 | 260 | % | |||||||||
| Other income | 373 | - | 373 | 100 | % | |||||||||||
| Exchange loss | (18 | ) | - | 18 | 100 | % | ||||||||||
| Total other income/(expense), net | 391 | 29 | 362 | 1,248 | % | |||||||||||
| Income (loss) from continuing operations before income taxes | (851 | ) | 225 | (1,076 | ) | (478 | )% | |||||||||
| Provision (benefit) for income taxes | ||||||||||||||||
| Current | - | 79 | (79 | ) | (100 | )% | ||||||||||
| Deferred | (123 | ) | - | 123 | 100 | % | ||||||||||
| Total provision (benefit) for income taxes | (123 | ) | 79 | (202 | ) | (256 | %) | |||||||||
| Income (loss) from continuing operations | (728 | ) | 146 | (874 | ) | (599 | )% | |||||||||
| Discontinued operations: | ||||||||||||||||
| Loss from discontinued operations, net of taxes | - | (52 | ) | (52 | ) | (100 | )% | |||||||||
| Gain on disposal of discontinued operations, net of taxes | - | - | - | - | % | |||||||||||
| Income (loss) from discontinued operations, net of taxes | - | (52 | ) | (52 | ) | (100 | )% | |||||||||
| Net Income (loss) | $ | (728 | ) | $ | 94 | $ | (822 | ) | (874 | )% | ||||||
| Three months Ended June 30, | Change | Change | ||||||||||||||
| Statement of Operations Data: | 2019 | 2018 | (Amount) | (Percentage) | ||||||||||||
| Revenues | $ | 10,924,978 | $ | 5,334,830 | $ | 5,590,148 | 105 | % | ||||||||
| Cost of goods sold | (7,752,728 | ) | (3,873,502 | ) | (3,879,226 | ) | 100 | % | ||||||||
| Gross profit | 3,172,250 | 1,461,328 | 1,710,922 | 117 | % | |||||||||||
| Operating expenses | ||||||||||||||||
| Provision for deferred cost of goods sold | 2,448,764 | 2,448,764 | 100 | % | ||||||||||||
| Research and development expenses | - | 39,230 | (39,230 | ) | (100 | )% | ||||||||||
| Selling expenses | 63,501 | 161,256 | (97,755 | ) | (61 | )% | ||||||||||
| General and administrative expenses | 1,403,172 | 1,514,298 | (111,126 | ) | (7 | )% | ||||||||||
| Total operating expenses | 3,915,437 | 1,714,784 | 2,200,653 | 128 | % | |||||||||||
| Operating Loss | (743,187 | ) | (253,456 | ) | (489,731 | ) | 193 | % | ||||||||
| Other income/(expenses), net | ||||||||||||||||
| Change in fair value of derivative liabilities | 27,943 | 72,433 | (44,490 | ) | (61 | )% | ||||||||||
| Interest expense | (835,545 | ) | (152,564 | ) | (682,981 | ) | 448 | % | ||||||||
| Other expense | (2,920 | ) | - | (2,920 | ) | 100 | % | |||||||||
| Exchange gain | 22,021 | 56,285 | (34,264 | ) | (61 | )% | ||||||||||
| Total other income/(expenses), net | (788,501 | ) | (23,846 | ) | (764,655 | ) | 3,207 | % | ||||||||
| Loss before income taxes | (1,531,688 | ) | (277,302 | ) | (1,254,386 | ) | 452 | % | ||||||||
| (Provision) benefit for income taxes | ||||||||||||||||
| Current | (714,002 | ) | (358,066 | ) | (355,936 | ) | 99 | % | ||||||||
| Deferred | - | - | - | - | % | |||||||||||
| Total (provision) benefit for income taxes | (714,002 | ) | (358,066 | ) | (355,936 | ) | 99 | % | ||||||||
| Net Loss | $ | (2,245,690 | ) | $ | (635,368 | ) | $ | (1,610,322 | ) | 253 | % | |||||
Revenue
Revenue decreasedincreased by approximately $1.2$5.6 million or 97%105%, to approximately $31,000$10.9 million in the three months ended SeptemberJune 30, 20172019 from approximately $1.2$5.3 million in the three monthmonths ended SeptemberJune 30, 2016. The decrease is mainly due to approximately $5.9 million2018. More sales are achieved for all of our revenues is being deferred for the three months ended September 30, 2017. In August 2016, Kiwa Baiao Bio-Tech (Beijing) Co., Ltd obtained a fertilizer sales permit from the Chinese government and began to sell the products directly to customers in Northern areas of China. Dueproduct lines are due to the good quality of our products we have gainedand more reputation gained in different regions of the agricultural industryPRC, such as Hainan Province, Guangdong Province and were able to attract more customers. In addition, we established Kiwa Bio-Tech Products (Shenzhen) Co., Ltd. in November 2016 to support sales in Southern areas of China. Ourstrategy on the expansionShanxi Province upon establishment of our business was to gain market sharessales office in thebio-fertilizermarket, thereby, we have extended credit to our customers.Our current payment terms on these customers are ranging from 60 days to 9 months after receipts of the goods depending on the creditworthiness of these customers.Thesecustomers are mainly agricultural cooperative company and distributors who then resell our products to individual farmers. Because the crop growing cycle usually takes approximately 3 to 9 months in the agricultural industry, it will take approximately similar time frame of 3 to 9 months for farmers to harvest crops and to realize profits to repay our distributors. As a result, for the sales contracts with these customers, the collectability of payment is highly dependent on the successful harvest of corps and the customers' ability to collect money from farmers. The Company deemed the collectability of payment may not be reasonably assured until after the Company get paid. For those sales contracts that the Company has shipped its products but the payment is contingent on collections of payments from the downstream customers, the Company considers the revenue recognition criteria are not met and therefore defers the revenue and cost of goods sold until payments are collected. We have sold and shipped approximately $5.9 million of our products during the three months ended September 30, 2017 for which the revenue recognition criteria of collectability of payments is reasonably assured has not yet been met, and we have deferred approximately $5.9 million of revenues to be recognized in the future periods when our collectability of payments will be assured. As a result, our revenue decreased accordingly for the three months ended September 30, 2017 as compared to the same period in 2016.different regions.
We currently only realized revenue in onethree major product categories of Biological Organic Fertilizer. We sold and shipped another product category ofFertilizer, Compound Microbial Fertilizer, in the third quarter of 2017 and recorded the selling amount in deferred revenue. We plan to launch another product category of Bio-Water Soluble Fertilizer in 2018.Fertilizer. Our revenues from our major product category are summarized as follows:
| For the three months ended September 30, 2017 | For the three months ended September 30, 2016 | Change | Change (%) | For the three months ended June 30, 2019 | For the three months ended June 30, 2018 | Change | Change (%) | |||||||||||||||||||||||||
| Biological Organic Fertilizer | ||||||||||||||||||||||||||||||||
| Revenue in USD | $ | 31,025 | $ | 1,185,309 | $ | (1,154,284 | ) | -97.4 | % | $ | 4,405,120 | $ | 2,900,817 | $ | 1,504,303 | 52 | % | |||||||||||||||
| Quantity sold in tons | 162 | 6,500 | (6,338 | ) | -97.5 | % | 25,000 | 15,334 | 9,666 | 63 | % | |||||||||||||||||||||
| Average selling price | $ | 191.51 | $ | 182.36 | $ | 9.15 | 5.0 | % | $ | 176.20 | $ | 189.18 | $ | (12.98 | ) | (7 | )% | |||||||||||||||
| Compound Microbial Fertilizer | ||||||||||||||||||||||||||||||||
| Revenue in USD | $ | 5,160,534 | $ | 2,426,561 | $ | 2,733,973 | 113 | % | ||||||||||||||||||||||||
| Quantity sold in tons | 16,000 | 7,026 | 8,974 | 128 | % | |||||||||||||||||||||||||||
| Average selling price | $ | 322.53 | $ | 345.37 | $ | (22.84 | ) | (7 | )% | |||||||||||||||||||||||
| Bio-Water Soluble Fertilizer | ||||||||||||||||||||||||||||||||
| Revenue in USD | $ | 1,359,324 | $ | 7,452 | $ | 1,351,872 | 18,141 | % | ||||||||||||||||||||||||
| Quantity sold in tons | 2,032 | 10 | 2,022 | 20,220 | % | |||||||||||||||||||||||||||
| Average selling price | $ | 668.96 | $ | 745.22 | $ | (76.26 | ) | (10 | )% | |||||||||||||||||||||||
| Total | ||||||||||||||||||||||||||||||||
| Revenue in USD | $ | 10,924,978 | $ | 5,334,830 | $ | 5,590,148 | 105 | % | ||||||||||||||||||||||||
| Quantity sold in tons | 43,032 | 22,370 | 20,662 | 92 | % | |||||||||||||||||||||||||||
| Average selling price | $ | 253.88 | $ | 238.48 | $ | 15.40 | 6 | % | ||||||||||||||||||||||||
Revenue fromAverage selling prices of Biological Organic Fertilizers, Compound Microbial Fertilizer and Bio-Water Soluble Fertilizer decreased by approximately $1.2 million$12.98 or 97.4%7%, to approximately $31,000$22.84 or 7% and 76.26 or 10%, respectively in the three months ended SeptemberJune 30, 2017 from approximately $1.2 million in2019 as compared with the three month ended September 30, 2016.same period of 2018. The decrease in average selling price is mainly due to the fluctuation of exchange rate as Chinese Yuan depreciated against U.S. dollars by approximately $2.3 million of our revenues is being deferred as discussed above. Average selling prices increased by $9.15 or 5.0%7.0% during the three months ended SeptemberJune 30, 20172019 as compared to the three months ended September 30, 2016 was mainly due to the revenue that we generated for the three months September 30, 2017 are mainly from our individual customers who purchased from us with a slightly higher price.same period in 2018.
Because the Chinese Government is continuously to promote green environment and implement quality standards and environmentally sensitive policies in the Agricultural industry, we expect our revenues from our innovated and highly effective products, Compound Microbial Fertilizer, and Bio-Water Soluble Fertilizer, and Microbial Inoculum Fertilizer will continue to grow in a higher rate than that from Biological Organic Fertilizer. Our Compound Microbial Fertilizer, and Bio-Water Soluble Fertilizer generally have a higher effectiveness on the productivity of crops that are suitable for promoting green environment. In addition, our marketing team is expanding to the Western areas of China and Hainan province and we expect our revenues will continue to grow in the fourth quarter of 2017 and in 2018.2019. Meanwhile, we expect to continue to gain more market shares in our existing sales channel bases in the Northern and the Southern areas of China due to the good quality of the products and better reputation in the industry.
Non-GAAP analysis
Our selling and shipment from our two major products categories are summarized as follows including revenue recognized and deferred under U.S. GAAP:
| For the three months ended September 30, 2017 | For the three months ended September 30, 2016 | Change | Change (%) | |||||||||||||
| Biological Organic Fertilizer | ||||||||||||||||
| Sold and shipped in USD | $ | 2,369,119 | $ | 1,185,309 | $ | 1,183,810 | 99.9 | % | ||||||||
| Quantity sold in tons | 13,162 | 6,500 | 6,662 | 102.5 | % | |||||||||||
| Average selling price | $ | 180.00 | $ | 182.36 | $ | (2.36) | (1.3) | % | ||||||||
| Compound Microbial Fertilizer | ||||||||||||||||
| Sold and shipped in USD | $ | 3,528,125 | $ | - | $ | 3,528,125 | 100.0 | % | ||||||||
| Quantity sold in tons | 10,700 | - | 10,700 | 100.0 | % | |||||||||||
| Average selling price | $ | 329.73 | $ | - | $ | 329.73 | 100.0 | % | ||||||||
Compound Microbial Fertilizer is adding appropriate amount of nitrogen, phosphorus, potassium and other nutrients into Biological Organic Fertilizer. Through the action of organic matter and beneficial microorganisms, the utilization rate of nitrogen, phosphorus, potassium can be significantly improved. The Bio-Water Soluble Fertilizer is mainly another form of the biological fertilizer. It is in the form of powder which has high water solubility, and it is convenient for the farmers to use during the drop irrigation. Compound Microbial Fertilizer and Bio-Water Soluble Fertilizer generally contain more bacteria and have a higher effectiveness on the productivity of crops and increasing the value and quality of the crops harvested than Biological Organic Fertilizer. As a result, our Compound Microbial Fertilizer and Bio-Water Soluble Fertilizer generally have a higher average selling price.
The sold and shipped amount of Biological Organic Fertilizer increased by approximately $1.2 million or 99.9%, to approximately $2.4 million in the three months ended September 30, 2017 from approximately $1.2 million in the three month ended September 30, 2016. The increase was mainly because we have gained more reputation in the agricultural industry and were able to attract more customers during the three months ended September 30, 2017 as compared to the three months ended September 30, 2016 during which we just obtained our fertilizer sales permit from the Chinese government and began to sell the products during the period. Average selling prices for both periods remained stable. The slight decrease of $2.36 or 1.3% was mainly due to the effect of exchange rate.
The sold and shipped amount of Compound Microbial Fertilizer increased by approximately $3.5 million or 100.0% in the three months ended September 30, 2017 as we did not sell this product category during the same period for 2016. Compound Microbial Fertilizer products are our new products with higher effectiveness on the productivity of crops and increasing the value and quality of the crops harvested that we firstly introduced in March 2017
Cost of Revenue
Our cost of revenues from our major product category are summarized as follows:
| For the three months ended September 30, 2017 | For the three months ended September 30, 2016 | Change | Change (%) | For the three months ended June 30, 2019 | For the three months ended June 30, 2018 | Change | Change (%) | |||||||||||||||||||||||||
| Biological Organic Fertilizer | ||||||||||||||||||||||||||||||||
| Cost of Revenue in USD | $ | 19,697 | $ | 770,451 | $ | (750,754) | (97.4) | % | ||||||||||||||||||||||||
| Cost of revenue in USD | $ | 3,086,183 | $ | 1,968,584 | $ | 1,117,599 | 57 | % | ||||||||||||||||||||||||
| Quantity sold and shipped in tons | 25,000 | 15,334 | 9,666 | 62 | % | |||||||||||||||||||||||||||
| Average unit cost | $ | 123.45 | $ | 128.38 | $ | (4.93 | ) | (4 | )% | |||||||||||||||||||||||
| Compound Microbial Fertilizer | ||||||||||||||||||||||||||||||||
| Cost of revenue in USD | $ | 3,760,519 | $ | 1,900,474 | $ | 1,860,045 | 98 | % | ||||||||||||||||||||||||
| Quantity sold and shipped in tons | 16,000 | 7,026 | 8,974 | 128 | % | |||||||||||||||||||||||||||
| Average unit cost | $ | 235.03 | $ | 270.49 | $ | (35.46 | ) | (13 | )% | |||||||||||||||||||||||
| Bio-Water Soluble Fertilizer | ||||||||||||||||||||||||||||||||
| Cost of revenue in USD | $ | 906,026 | $ | 4,444 | $ | 901,582 | 20,288 | % | ||||||||||||||||||||||||
| Quantity sold in tons | 162 | 6,500 | (6,338) | (97.5) | % | 2,032 | 10 | 2,022 | 20,220 | % | ||||||||||||||||||||||
| Average unit cost | $ | 121.59 | $ | 118.53 | $ | 3.06 | 2.6 | % | $ | 445.88 | $ | 444.40 | $ | 1.48 | 0 | % | ||||||||||||||||
| Total | ||||||||||||||||||||||||||||||||
| Cost of revenue in USD | $ | 7,752,728 | $ | 3,873,502 | $ | 3,879,226 | 100 | % | ||||||||||||||||||||||||
| Quantity sold in tons | 43,032 | 22,370 | 20,662 | 92 | % | |||||||||||||||||||||||||||
| Average unit cost | $ | 180.16 | $ | 173.16 | $ | 7.00 | 4 | % | ||||||||||||||||||||||||
Cost of revenue from Biological Organic Fertilizer, decreased by approximately $0.8 million or 97.4%, to approximately $20,000 in the three months ended September 30, 2017 from approximately $0.8 million in the three month ended September 30, 2016. The decrease in cost of revenue during the period which is in line with the decrease in revenue from Biological Organic Fertilizer. We were able to stabilize our average unit production cost within a reasonable range of 2.6% increase. The increase of $3.06 or 2.6% of average unit production cost is mainly due to the increase of price for raw materials (mainly includes nitrogen, phosphorusCompound Microbial Fertilizer and potassium) used in the products for the three months ended September 30, 2017.
Non-GAAP analysis
Our cost of shipping to our two major products categories are summarized as follows including cost of goods sold recognized and deferred under U.S. GAAP:
| For the three months ended September 30, 2017 | For the three months ended September 30, 2016 | Change | Change (%) | |||||||||||||
| Biological Organic Fertilizer | ||||||||||||||||
| Cost of sold and shipped in USD | $ | 1,639,315 | $ | 770,451 | $ | 868,864 | 112.8 | % | ||||||||
| Quantity sold and shipped in tons | 13,162 | 6,500 | 6,662 | 102.5 | % | |||||||||||
| Average unit cost | $ | 124.55 | $ | 118.53 | $ | 6.02 | 5.1 | % | ||||||||
| Compound Microbial Fertilizer | ||||||||||||||||
| Cost of sold and shipped in USD | $ | 2,413,924 | $ | - | $ | 2,413,924 | 100.0 | % | ||||||||
| Quantity sold and shipped in tons | 10,700 | - | 10,700 | 100.0 | % | |||||||||||
| Average unit cost | $ | 225.60 | $ | - | $ | 225.60 | 100.0 | % | ||||||||
Cost of sold and shipped from Biological OrganicBio-Water Soluble Fertilizer increased by approximately $1.1 million, $1.9 million and $0.9 million or 112.8%57%, 98% and 20,288% to approximately $1.6$3.1 million, $3.8 million and $0.9 million in the three months ended SeptemberJune 30, 20172019 from approximately $0.8$2.0 million, $1.9 million, and $4,444 in the three monthmonths ended SeptemberJune 30, 2016.2018. The increase during the period is in line with the increase in the selling amount of Biological Organic Fertilizer. We were able to stabilize our average unit production cost within a reasonable range of 5.1% increase. The increase of $6.02 or 5.1% of average unit production cost is mainly due to the increasetotal quantity of price for raw materials (mainly includes nitrogen, phosphorusproduct sold increased due to the good quality of our products and potassium) usedmore reputation gained in the products foragricultural industry, which offset by the fluctuation of exchange rate as Chinese Yuan depreciated against U.S. dollars by approximately 7.0% during the three months ended SeptemberJune 30, 2017.2019 as compared to the same period in 2018, which in turn decrease our overall cost of revenue. As a result, our cost of revenue increased accordingly along with our sales.
| 34 |
Cost of sold and shipped from Compound Microbial Fertilizer increased by approximately $2.4 million or 100.0%. The increase was in line with the increase in the selling amount of Compound Microbial Fertilizer. We plan to launch the Bio-Water Soluble Fertilizer products in 2018.
Gross Profit
Our gross profit from our major product category are summarized as follows:
| For the three months ended September 30, 2017 | For the three months ended September 30, 2016 | Change | Change (%) | |||||||||||||
| Biological Organic Fertilizer | ||||||||||||||||
| Gross Profit | $ | 11,327 | $ | 414,858 | $ | (403,531) | (97.3 | )% | ||||||||
| Gross Profit Percentage | 36.5 | % | 35.0 | % | 1.5% | 4.3 | % | |||||||||
Gross profit percentage for Biological Organic Fertilizer increased from 35.0% for the three months ended September 30, 2016 to 36.5% for the three months ended September 30, 2017 mainly due to the increase in our unit selling price of our products at a rate higher than the increase in raw materials price of the products for the reason as discussed above.
Non-GAAP analysis
Our total gross profit from our two major products categories are summarized as follows including the gross profit recognized and deferred under U.S. GAAP:
| For the three months ended September 30, 2017 | For the three months ended September 30, 2016 | Change | Change (%) | For the three months ended June 30, 2019 | For the three months ended June 30, 2018 | Change | Change (%) | |||||||||||||||||||||||||
| Biological Organic Fertilizer | ||||||||||||||||||||||||||||||||
| Gross Profit | $ | 729,804 | $ | 414,858 | $ | 314,946 | 75.9 | % | $ | 1,318,937 | $ | 932,233 | $ | 386,704 | 41 | % | ||||||||||||||||
| Gross Profit Percentage | 30.8 | % | 35.0 | % | (4.2 | %) | (12 | %) | 29.9 | % | 32.1 | % | (2.2 | )% | (7 | )% | ||||||||||||||||
| Compound Microbial Fertilizer | ||||||||||||||||||||||||||||||||
| Gross Profit | $ | 1,114,200 | $ | - | $ | 1,114,200 | 100.0 | % | $ | 1,400,015 | $ | 526,087 | $ | 873,928 | 166 | % | ||||||||||||||||
| Gross Profit Percentage | 31.6 | % | - | 31.6 | % | 100.0 | % | 27.1 | % | 21.7 | % | 5.4 | % | 25 | % | |||||||||||||||||
| Bio-Water Soluble Fertilizer | ||||||||||||||||||||||||||||||||
| Gross Profit | $ | 453,298 | $ | 3,008 | $ | 450,290 | 14,970 | % | ||||||||||||||||||||||||
| Gross Profit Percentage | 33.3 | % | 40.4 | % | (7.0 | )% | (17 | )% | ||||||||||||||||||||||||
| Total | ||||||||||||||||||||||||||||||||
| Gross Profit | $ | 3,172,250 | $ | 1,461,328 | $ | 1,710,922 | 117 | % | ||||||||||||||||||||||||
| Gross Profit Percentage | 29.0 | % | 27.4 | % | 1.6 | % | 6 | % | ||||||||||||||||||||||||
Gross profit percentage for Biological Organic Fertilizer decreased from 35.0%32.1% for the three months ended SeptemberJune 30, 20162018 to 30.8%29.9% for the three months ended SeptemberJune 30, 20172019 mainly due to the increasedecrease in raw materialsaverage selling price is more than the decrease in average unit cost.
Gross profit percentage for Compound Microbial increased from 21.7% for the three months ended June 30, 2018 to 27.1% for the three months ended June 30, 2019 mainly due to the decrease in average unit cost is more than the decrease in average selling price.
Gross profit percentage for Bio-Water Soluble Fertilizer decrease from 40.4% for the three months ended June 30, 2018 to 33.3% for the three months ended June 30, 2019 mainly due to the average selling price decreased while the average unit costs remains unchanged.
Provision for Deferred Cost of Goods Sold
Provision on deferred cost of goods sold was $2.4 million for the three months ended June 30, 2019, increased by approximately $2.4 million or 100% from $0 for the three months ended June 30, 2018. The provision for deferred cost of goods sold is made based on historical collection experience on related accounts receivable and realizability of deferred revenue. Because part of the productsshipments to several clients, for which revenue have already been deferred, have been assessed to be uncollectible, $2.4 million of provision for deferred cost of goods sold were made during the reason as discussed above.three months ended June 30, 2019.
Research and Development Expenses
Research and development expenses was $0 for the three months ended June 30, 2019, decreased by approximately $37,000$39,000 or 100% from approximately $39,000 (RMB 250,000) for the three months ended SeptemberJune 30, 2017, keeping the same as the prior comparable period.2018. On November 20, 2015, the Company signed a strategic cooperation agreement (the “Agreement”) with China Academy of Agricultural Science (“CAAS”)’s Institute of Agricultural Resources & Regional Planning (“IARRP”) and Institute of Agricultural Economy & Development (“IAED”). Pursuant to the Agreement, the Company will form a strategic partnership with the two institutes and establish an “International Cooperation Platform for Internet and Safe Agricultural Products”. To fund the cooperation platform’s R&D activities, the Company will provide RMB 1 million (approximately $160,000)$148,000) per year to the Spatial Agriculture Planning Method & Applications Innovation Team that belongs to the Institutes. The term of the Agreement is for three years beginning November 20, 2015 and will expirehas expired on November 19, 2018. However, the Company is only liable for the annual funds to be provided to the extent of the contract obligations performed by CAAS IARRP and IAED, and the agreement is terminable before the three years’ commitment date based on negotiations of both parties. The Company contributed approximately $37,000 (RMB 250,000) forWe did not have such expenses during the three months ended SeptemberJune 30, 2017 and September 30, 2016. The Company plans to contribute the remaining balance quarterly until the date of the Agreement expired on November 19, 2018.2019.
| 35 |
Selling Expenses
Selling expenses for the three months ended September 30, 2017 and 2016 were approximately $148,000 and $0, respectively. Selling expenses include salaries of sales personnel, sales commission, travel and entertainment as well as freight out expenses. Selling expenses for the three months ended June 30, 2019 and 2018 were approximately $63,501 and $161,256, respectively. The increasedecrease in selling expenses is mainly becausedue to a decrease of approximately $97,000 of sales personnel salary in our Shenzhen and Beijing offices as we have started hiring sales managersmoved our headquarter to Yangling with cheaper labor cost and other costs in general as the living standards in Yangling is much cheaper than in the fourth quarterShenzhen and Beijing, a decrease of 2016 for the marketing of our products. During the three months ended September 30, 2016, there was no designated sales personnel since Kiwa Beijing just obtained the permit to sell bio-fertilizer in September 2016. With business expansion, we have hired more sales managers in Kiwa Beijing and in Kiwa Shenzhen to manage our sales activities in different regions of China from October 2016 to September 2017. In addition, the increase of sales also led to the increase ofapproximately $25,000 freight out expense, resulting in theoffset by an increase of approximately $20,000 advertising, and increase of office, insurance, travel, entertainment expenses and other selling expense.expenses of approximately $3,000.
General and Administration Expenses
General and administrative expenses increased by approximately 487% from approximately $0.2 million in the three month period ended September 30, 2016 to approximately $1.1 million in the same period in 2017. General and administrativeG&A expenses include professional fees, officers’ compensation, depreciation and amortization, insurance, salaries, employee benefits, travel, auto expense, meal and entertainment, rent, office expense and telephone expense and the like. The increaseother miscellaneous G&A expenses. G&A expenses decreased by approximately $0.1 million or 7% from approximately $1.5 million in general and administrative expenses is mainly attributed to business expansion and the establishment of Kiwa Shenzhen in November, 2016, Kiwa Hebei in December 2016 and Kiwa Asia in July 2017.
Right-to-use Trademark Income
Trademark license income totaled $0 for the three months ended SeptemberJune 30, 2017, compared with $76,235 for the same period of 2016, reflecting a decrease of 100% from the same period of last year. Income was generated from licensing our trademark to Gerui. We signed the license agreement with Gerui to allow Gerui to sell fertilizer using our trademark in December 2015. We charged Gerui 10% of net sales of fertilizers bearing Kiwa trademark for using our trademark. Gerui began to sell fertilizers bearing Kiwa trademark in 2016. In August 2016, the Company obtained the government approval of selling fertilizers in China. As a result, we ceased the licensing arrangement cooperation with Gerui and started to sell our own bio-fertilizers from September 2016.
Other Income
Other income increased by approximately $0.4 million from $0 in the three month period ended September 30, 20162018 to approximately $0.4$1.4 million in the same period in 2017.2019. The increasedecrease in G&A expenses is mainly attributabledue to a decrease of approximately $170,000 in rent, utilities, insurance and other related expense as we moved our headquarter to Yangling, where the accruedgovernment offered us free rent; a decrease of salaries and employee benefits of approximately $169,000 as we moved our headquarter to Yangling; a decrease of approximately $102,000 in travel and meal and entertainment expense; a decrease of approximately $25,000 in office and other miscellaneous expenses; and a decrease of approximately $11,000 in professional feesand legal fees. This decrease was offset by the increase of approximately $363,000 provision for advance to suppliers and other receivables for which were unclaimed for more than ten years and we have evaluated and reached the decisionmanagement assessed the Company cannot receive the goods to discharge these liabilities.be delivered.
Interest Expense
Net interest expense was $168,573$835,545 and $47,745$152,564 for the three months ended SeptemberJune 30, 20172019 and 2016,2018, respectively, representing an increase of approximately $0.1 million$682,981 or 253%448%. Interest expense included accrued interest on convertible note and other notenotes payable, and the amortization of the convertible note discount for the three months ended SeptemberJune 30, 20172019 and 2016.2018. The increase in interest expenses is mainly attributed to newly issuance of two 15%12% convertible notes fornote issued in the nineMarch 2019 where we did not have it in the three months ended SeptemberJune 30, 2017.2018.
Net Loss from discontinued operations, net of taxes
Loss from discontinued operations, net of taxes was $-0- and $52,166Net loss for the three months ended SeptemberJune 30, 2017 and 2016, respectively, which results in a decrease of $52,166 from discontinued operations, net of taxes for the three months ended September 30, 2017 to the same period of 2016. Due to suffering from losses for several years, On February 11, 2017, the Company executed an Equity Transfer Agreement with Dian Shi Cheng Jing (Beijing) Technology Co. (“Transferee”) whereby the Company transferred all of its right, title and interest in Kiwa Bio-Tech Products (Shandong) Co., Ltd. (“Shandong”) to the Transferee for RMB 1.00. The government processing of the transaction was completed on April 12, 2017. Therefore, it’s resulted in the decrease of loss from discontinued operations, net of taxes.
Net Income
Net income for the three months ended September 30, 2017 decreased2019 increased by approximately 874% from approximately profit of $94,000253% $635,368 to loss of approximately $728,000.$2,245,690. Such change was the result of the combination of the changes as discussed above.
Results of Operations for Nine Months Ended SeptemberSix months ended June 30, 20172019 and 2016June 30, 2018
The following table summarizes the results of our operations during the nine monthsix months periods ended SeptemberJune 30, 20172019 and 2016,2018, respectively, and provides information regarding the dollar and percentage increase or (decrease) during such periods.
(All amounts, other than percentages, in thousands of U.S. dollars)
| Nine months Ended September 30, | Amount Increase | Percentage Increase | ||||||||||||||
| Statement of Operations Data: | 2017 | 2016 | (Decrease) | (Decrease) | ||||||||||||
| Revenues | $ | 30 | $ | 1,185 | $ | (1,155 | ) | (97 | )% | |||||||
| Cost of goods sold | (19 | ) | (770 | ) | (751 | ) | (98 | )% | ||||||||
| Gross profit | 11 | 415 | (404 | ) | (97 | )% | ||||||||||
| Operating expenses | ||||||||||||||||
| Research and development expense | 110 | 113 | (3 | ) | (3 | )% | ||||||||||
| Selling expenses | 236 | - | 236 | 100 | % | |||||||||||
| General and administrative expenses | 2,073 | 376 | 1,697 | 451 | % | |||||||||||
| Total operating expenses | 2,419 | 489 | 1,930 | 395 | % | |||||||||||
| Operating Income (Loss) | (2,408 | ) | (74 | ) | 2,334 | 3,154 | % | |||||||||
| Other income/(expense), net | ||||||||||||||||
| Trademark license income-related party | - | 786 | (786 | ) | (100 | )% | ||||||||||
| Change in fair value of derivative liabilities | 199 | - | 199 | 100 | % | |||||||||||
| Interest expense | (356 | ) | (142 | ) | 214 | 151 | % | |||||||||
| Other income | 373 | - | 373 | 100 | % | |||||||||||
| Exchange loss | (35 | ) | - | 35 | 100 | % | ||||||||||
| Total other income/(expense), net | 181 | 644 | (463 | ) | (72 | )% | ||||||||||
| Income (loss) from continuing operations before income taxes | (2,227 | ) | 570 | (2,797 | ) | (491 | )% | |||||||||
| Provision (benefit) for income taxes | ||||||||||||||||
| Current | - | 79 | (79 | ) | (100 | )% | ||||||||||
| Deferred | (221 | ) | - | 221 | 100 | % | ||||||||||
| Total provision (benefit) for income taxes | (221 | ) | 79 | (300 | ) | (380 | )% | |||||||||
| Income (loss) from continuing operations | (2,006 | ) | 491 | (2,497 | ) | (509 | )% | |||||||||
| Discontinued operations: | ||||||||||||||||
| Loss from discontinued operations, net of taxes | (17 | ) | (159 | ) | 142 | (89 | )% | |||||||||
| Gain on disposal of discontinued operations, net of taxes | 4,512 | - | 4,512 | 100 | % | |||||||||||
| Income (loss) from discontinued operations, net of taxes | 4,495 | (159 | ) | 4,654 | 2,927 | % | ||||||||||
| Net income (loss) | $ | 2,489 | $ | 332 | $ | 2,157 | 650 | % | ||||||||
| Six months Ended June 30, | Change | Change | ||||||||||||||
| Statement of Operations Data: | 2019 | 2018 | (Amount) | (Percentage) | ||||||||||||
| (As Restated) | ||||||||||||||||
| Revenues | $ | 20,467,976 | $ | 14,086,221 | $ | 6,381,755 | 45 | % | ||||||||
| Cost of goods sold | (15,119,315 | ) | (10,180,066 | ) | (4,939,249 | ) | 49 | % | ||||||||
| Gross profit | 5,348,661 | 3,906,155 | 1,442,506 | 37 | % | |||||||||||
| Operating expenses | ||||||||||||||||
| Provision for deferred cost of goods sold | 2,448,764 | 2,448,764 | 100 | % | ||||||||||||
| Research and development expenses | - | 78,543 | (78,543 | ) | (100 | )% | ||||||||||
| Selling expenses | 101,307 | 345,567 | (244,260 | ) | (71 | )% | ||||||||||
| General and administrative expenses | 2,362,766 | 3,079,028 | (716,262 | ) | (23 | )% | ||||||||||
| Total operating expenses | 4,912,837 | 3,503,138 | 1,409,699 | 40 | % | |||||||||||
| Operating Income | 435,824 | 403,017 | 32,807 | 8 | % | |||||||||||
| Other income/(expenses), net | ||||||||||||||||
| Change in fair value of derivative liabilities | 33,174 | 202,371 | (169,197 | ) | (84 | )% | ||||||||||
| Interest expense | (1,139,513 | ) | (307,927 | ) | (831,586 | ) | 270 | % | ||||||||
| Other income/ (expenses) | 51,768 | (905 | ) | 52,673 | 5,820 | % | ||||||||||
| Exchange gain (loss) | (1,410 | ) | 18,253 | (19,663 | ) | (108 | )% | |||||||||
| Total other income/(expenses), net | (1,055,981 | ) | (88,208 | ) | (967,773 | ) | 1,097 | % | ||||||||
| Income (loss) before income taxes | (620,157 | ) | 314,809 | (934,966 | ) | (297 | )% | |||||||||
| (Provision) benefit for income taxes | ||||||||||||||||
| Current | (1,234,910 | ) | (897,209 | ) | (337,701 | ) | 38 | % | ||||||||
| Deferred | - | - | - | - | % | |||||||||||
| Total provision for income taxes | (1,234,910 | ) | (897,209 | ) | (337,701 | ) | 38 | % | ||||||||
| Net Loss | $ | (1,855,067 | ) | $ | (582,400 | ) | $ | (1,272,667 | ) | 219 | % | |||||
Revenue
Revenue decreasedincreased by approximately $1.2$6.4 million or 97%45%, to approximately $30,000$20.5 million in the ninesix months ended SeptemberJune 30, 20172019 from approximately $1.2$14.1 million in the ninesix months ended SeptemberJune 30, 2016.2018. The decreaseincrease is mainly due to: 1) a $4.9 million increase in sales of compound microbial fertilizer and bio-water soluble fertilizer revenues due to approximately $14.7 million of our revenues is being deferred for the nine months ended September 30, 2017. In August 2016, Kiwa Baiao Bio-Tech (Beijing) Co., Ltd obtained a fertilizermore sales permit from the Chinese government and began to sell the products directly to customers in Northern areas of China. Dueare achieved due to the good quality of our products we have gainedand more reputation gained in different regions of the PRC, such as Hainan Province, Guangdong Province and Shanxi Province upon establishment of our sales office in different regions) a $1.5 million increase in revenues of biological organic fertilizer due to a increase in average price and sale volume as this type of new product became more popular in the agricultural industrymarket.
| 37 |
We currently realized revenue in three major product categories of Biological Organic Fertilizer, Compound Microbial Fertilizer, and were able to attract more customers. In addition, we established Kiwa Bio-Tech Products (Shenzhen) Co.Bio-Water Soluble Fertilizer. Our revenues from our major product category are summarized as follows:
| For the six months ended June 30, 2019 | For the six months ended June 30, 2018 | Change | Change (%) | |||||||||||||
| Biological Organic Fertilizer | ||||||||||||||||
| Revenue in USD | $ | 8,418,098 | $ | 7,126,132 | $ | 1,291,966 | 18 | % | ||||||||
| Quantity sold in tons | 47,520 | 37,702 | 9,818 | 26 | % | |||||||||||
| Average selling price | $ | 177.15 | $ | 189.01 | $ | (11.86 | ) | (6 | )% | |||||||
| Compound Microbial Fertilizer | ||||||||||||||||
| Revenue in USD | $ | 10,560,861 | $ | 6,929,867 | $ | 3,630,994 | 52 | % | ||||||||
| Quantity sold in tons | 32,437 | 20,049 | 12,388 | 62 | % | |||||||||||
| Average selling price | $ | 325.58 | $ | 345.65 | $ | (20.06 | ) | (6 | )% | |||||||
| Bio-Water Soluble Fertilizer | ||||||||||||||||
| Revenue in USD | $ | 1,489,017 | $ | 30,222 | $ | 1,458,795 | 4,827 | % | ||||||||
| Quantity sold in tons | 2,159 | 72 | 2,087 | 2,899 | % | |||||||||||
| Average selling price | $ | 689.68 | $ | 419.75 | $ | 269.93 | 64 | % | ||||||||
| Total | ||||||||||||||||
| Revenue in USD | $ | 20,467,976 | $ | 14,086,221 | $ | 6,381,755 | 45 | % | ||||||||
| Quantity sold in tons | 82,116 | 57,823 | 24,293 | 42 | % | |||||||||||
| Average selling price | $ | 249.26 | 243.61 | 5.65 | 2 | % | ||||||||||
Average selling prices of Biological Organic Fertilizers and Compound Microbial Fertilizer decreased by $11.86 or 6% and $20.06 or 6%, Ltd. in November 2016 to support sales in Southern areas of China. Ourstrategy on the expansion of our business was to gain market shares in thebio-fertilizermarket, thereby, we have extended credit to our customers.Our current payment terms on these customers are ranging from 60 days to 9 months after receipts of the goods depending on the creditworthiness of these customers.Thesecustomers are mainly agricultural cooperative company and distributors who then resell our products to individual farmers. Because the crop growing cycle usually takes approximately 3 to 9 monthsrespectively in the agricultural industry, it will takesix months ended June 30, 2019 as compared with the same period of 2018. The decrease in average selling price is due to the fluctuation of exchange rate as Chinese Yuan depreciated against U.S. dollars by approximately similar time frame of 3 to 9 months for farmers to harvest crops and to realize profits to repay our distributors. As a result, for the sales contracts with these customers, the collectability of payment is highly dependent on the successful harvest of corps and the customers’ ability to collect money from farmers. The Company deemed the collectability of payment may not be reasonably assured until after the Company get paid. For those sales contracts that the Company has shipped its products but the payment is contingent on collections of payments from the downstream customers, the Company considers the revenue recognition criteria are not met and therefore defers the revenue and cost of goods sold until payments are collected. We have sold and shipped approximately $14.7 million of our products6.6% during the ninesix months ended SeptemberJune 30, 2017 for which the revenue recognition criteria of collectability of payments is reasonably assured has not yet been met, and we have deferred approximately $14.7 million of revenues to be recognized in the future periods when our collectability of payments will be assured. As a result, our revenue decreased accordingly for the nine months ended September 30, 20172019 as compared to the same period in 2016.
2018.
We currently only realized revenue in one major product categories of Biological Organic Fertilizer. We sold and shipped another product category of Compound Microbial Fertilizer in the third quarter of 2017 and recorded theAverage selling amount in deferred revenue. We plan to launch another product categoryprices of Bio-Water Soluble Fertilizer in 2018. Our revenues from our major product categories are summarized as follows:
| For the nine months ended September 30, 2017 | For the nine months ended September 30, 2016 | Change | Change (%) | |||||||||||||
| Biological Organic Fertilizer | ||||||||||||||||
| Revenue in USD | $ | 30,411 | $ | 1,185,310 | $ | (1,154,899 | ) | (97.4 | )% | |||||||
| Quantity sold in tons | 162 | 6,500 | (6,338 | ) | (97.5 | )% | ||||||||||
| Average selling price | $ | 187.72 | $ | 182.36 | $ | 5.36 | 2.9 | % | ||||||||
Revenue from Biological Organic Fertilizer decreasedincreased by approximately $1.2 million$269.93 or 97.4%, to approximately $30,00064% in the ninesix months ended SeptemberJune 30, 2017 from approximately $1.2 million2019 as compared with same period of 2018. This increase is mainly because we sold at a much lower price to attract the market when we first introduced Bio-Water Soluble Fertilizer in the nine month ended September 30, 2016. The decrease is mainly due to approximately $8.0 millionfirst quarter of our revenues is being deferred as discussed above. Average selling prices increased by $5.36 or 2.9% during the nine months ended September 30, 2017 as compared to the nine months ended September 30, 2016 was mainly due to the revenue that we generated for the nine months September 30, 2017 are mainly from our individual customers who purchased from us with a slightly higher price.2018.
Because the Chinese Government is continuously to promote green environment and implement quality standards and environmentally sensitive policies in the Agricultural industry, we expect our revenues from our innovated and highly effective products, Compound Microbial Fertilizer, and Bio-Water Soluble Fertilizer, and Microbial Inoculum Fertilizer will continue to grow in a higher rate than that from Biological Organic Fertilizer. Our Compound Microbial Fertilizer, and Bio-Water Soluble Fertilizer generally have a higher effectiveness on the productivity of crops that are suitable for promoting green environment. In addition, our marketing team is expanding to the Western areas of China and Hainan province and we expect our revenues will continue to grow in the fourth quarter of 2017 and in 2018.2019. Meanwhile, we expect to continue to gain more market shares in our existing sales channel bases in the Northern and the Southern areas of China due to the good quality of the products and better reputation in the industry.
| 38 |
Non-GAAP analysis
Our sales and shipment from our two major products categories are summarized as follows including revenue recognized and deferred under U.S. GAAP:
| For the nine months ended September 30, 2017 | For the nine months ended September 30, 2016 | Change | Change (%) | |||||||||||||
| Biological Organic Fertilizer | ||||||||||||||||
| Sold and shipped in USD | $ | 8,016,554 | $ | 1,185,310 | $ | 6,831,244 | 576.3 | % | ||||||||
| Quantity sold in tons | 45,462 | 6,500 | 38,962 | 599.4 | % | |||||||||||
| Average selling price | $ | 176.34 | $ | 182.36 | $ | (6.02 | ) | (3.3 | %) | |||||||
| Compound Microbial Fertilizer | ||||||||||||||||
| Sold and shipped in USD | $ | 6,680,682 | $ | - | $ | 6,680,682 | 100.0 | % | ||||||||
| Quantity sold in tons | 20,720 | - | 20,720 | 100.0 | % | |||||||||||
| Average selling price | $ | 322.43 | $ | - | $ | 322.43 | 100.0 | % | ||||||||
Compound Microbial Fertilizer is adding appropriate amount of nitrogen, phosphorus, potassium and other nutrients into Biological Organic Fertilizer. Through the action of organic matter and beneficial microorganisms, the utilization rate of nitrogen, phosphorus, potassium can be significantly improved. The Bio-Water Soluble Fertilizer is mainly another form of the biological fertilizer. It is in the form of powder which has high water solubility, and it is convenient for the farmers to use during the drop irrigation. Compound Microbial Fertilizer and Bio-Water Soluble Fertilizer generally contain more bacteria and have a higher effectiveness on the productivity of crops and increasing the value and quality of the crops harvested than Biological Organic Fertilizer. As a result, our Compound Microbial Fertilizer and Bio-Water Soluble Fertilizer generally have a higher average selling price.
The sold and shipped amount of Biological Organic Fertilizer increased by approximately $6.8 million or 576.3%, to approximately $8.0 million in the nine months ended September 30, 2017 from approximately $1.2 million in the nine month ended September 30, 2016. The increase was mainly because we have gained more reputation in the agricultural industry and were able to attract more customers during the nine months ended September 30, 2017 as compared to the nine months ended September 30, 2016 during which we just obtained our fertilizer sales permit from the Chinese government and began to sell the products during the period. Average selling prices for both periods remained stable with a decrease of $6.02 or 3.3% mainly due to the effect of exchange rate.
The sold and shipped amount of Compound Microbial Fertilizer increased by approximately $6.7 million or 100.0% in the nine months ended September 30, 2017 from $0 in the nine month ended September 30, 2016 as we did not sell this product category during the same period for 2016. Compound Microbial Fertilizer products are our new products with higher effectiveness on the productivity of crops and increasing the value and quality of the crops harvested that we firstly introduced in March 2017.
Cost of Revenue
Our cost of revenues from our major product category are summarized as follows:
| For the nine months ended September 30, 2017 | For the nine months ended September 30, 2016 | Change | Change (%) | For the six months ended June 30, 2019 | For the six months ended June 30, 2018 | Change | Change (%) | |||||||||||||||||||||||||
| Biological Organic Fertilizer | ||||||||||||||||||||||||||||||||
| Cost of Revenue in USD | $ | 19,308 | $ | 770,451 | $ | (751,143) | (97.5) | % | ||||||||||||||||||||||||
| Cost of revenue in USD | $ | 5,994,023 | $ | 4,834,082 | $ | 1,159,941 | 24 | % | ||||||||||||||||||||||||
| Quantity sold and shipped in tons | 47,520 | 37,702 | 9,818 | 26 | % | |||||||||||||||||||||||||||
| Average unit cost | $ | 126.14 | $ | 128.22 | $ | (2.08 | ) | (2 | )% | |||||||||||||||||||||||
| Compound Microbial Fertilizer | ||||||||||||||||||||||||||||||||
| Cost of revenue in USD | $ | 8,156,129 | $ | 5,325,880 | $ | 2,830,249 | 53 | % | ||||||||||||||||||||||||
| Quantity sold and shipped in tons | 32,437 | 20,049 | 12,388 | 62 | % | |||||||||||||||||||||||||||
| Average unit cost | $ | 251.45 | $ | 265.64 | $ | (14.19 | ) | (5 | )% | |||||||||||||||||||||||
| Bio-Water Soluble Fertilizer | ||||||||||||||||||||||||||||||||
| Cost of revenue in USD | $ | 969,163 | $ | 20,104 | $ | 949,059 | 4,721 | % | ||||||||||||||||||||||||
| Quantity sold in tons | 162 | 6,500 | (6,338) | (97.5) | % | 2,159 | 72 | 2,087 | 2,899 | % | ||||||||||||||||||||||
| Average unit cost | $ | 119.18 | $ | 118.53 | $ | 0.65 | 0.5 | % | $ | 448.89 | $ | 279.22 | $ | 169.67 | 61 | % | ||||||||||||||||
| Total | ||||||||||||||||||||||||||||||||
| Cost of revenue in USD | $ | 15,119,315 | $ | 10,180,066 | $ | 4,939,249 | 49 | % | ||||||||||||||||||||||||
| Quantity sold in tons | 82,116 | 57,823 | 24,293 | 42 | % | |||||||||||||||||||||||||||
| Average unit cost | 184.12 | 176.06 | 8.07 | 5 | % | |||||||||||||||||||||||||||
Cost of revenue from Biological Organic Fertilizer, decreasedCompound Microbial Fertilizer and Bio-Water Soluble Fertilizer increased by approximately $0.8$1.2 million, $2.8 million and $0.9 million or 97.5%24%, 53% and 4,721% to approximately $19,000 in the nine months ended September 30, 2017 from approximately $0.8$6.0 million, $8.2 million and $1.0 million in the nine monthsix months ended SeptemberJune 30, 2016. The decrease in cost of revenue during the period which is in line with the decrease in revenue2019 from Biological Organic Fertilizer. The average unit production cost of Biological Organic Fertilizer increased by $0.65 or 0.5%approximately $4.8 million, $5.3 million, and $20,000 in the ninesix months ended SeptemberJune 30, 2017 as compared to in the nine months ended September 30, 2016.2018. The reason of the slight increase is mainly due to the increasetotal quantity of price for raw materials (mainly includes nitrogen, phosphorusproducts sold increased due to the good quality of our products and potassium) usedmore reputation gained in the products, offsettingagricultural industry, which offset by the appreciationfluctuation of Renminbiexchange rate as Chinese Yuan depreciated against U.S. Dollar of approximately 4.2%.
Non-GAAP analysis
Our cost of sold and shipped from our two major products categories are summarized as follows including cost of goods sold recognized and deferred under U.S. GAAP:
| For the nine months ended September 30, 2017 | For the nine months ended September 30, 2016 | Change | Change (%) | |||||||||||||
| Biological Organic Fertilizer | ||||||||||||||||
| Cost of sold and shipped in USD | $ | 5,419,723 | $ | 770,451 | $ | 4,649,272 | 603.4 | % | ||||||||
| Quantity sold and shipped in tons | 45,462 | 6,500 | 38,962 | 599.4 | % | |||||||||||
| Average unit cost | $ | 119.21 | $ | 118.53 | $ | 0.68 | 0.6 | % | ||||||||
| Compound Microbial Fertilizer | ||||||||||||||||
| Cost of sold and shipped in USD | $ | 4,648,934 | $ | - | $ | 4,648,934 | 100.0 | % | ||||||||
| Quantity sold and shipped in tons | 20,720 | - | 20,720 | 100.0 | % | |||||||||||
| Average unit cost | $ | 224.37 | $ | - | $ | 224.37 | 100.0 | % | ||||||||
Cost of sold and shipped from Biological Organic Fertilizer increaseddollars by approximately $4.6 million or 603.4%, to approximately $5.4 million in6.6% during the ninesix months ended SeptemberJune 30, 2017 from approximately $0.8 million in the nine month ended September 30, 2016. The increase during the period which is in line with the increase in the selling amount of Biological Organic Fertilizer. The average unit production cost of Biological Organic Fertilizer increased by $0.68 or 0.6% in the nine months ended September 30, 20172019 as compared to the same period in the nine months ended September 30, 2016. The reason2018, which in turn decrease our overall cost of the slight increase is mainly due to the increaserevenue. As a result, our cost of price for raw materials (mainly includes nitrogen, phosphorus and potassium) used in the products, offsetting by the appreciation of Renminbi against U.S. Dollar of approximately 4.2%.revenue increased accordingly along with our sales.
Cost of sold and shipped from Compound Microbial Fertilizer increased by approximately $4.6 million or 100.0%. The increase were in line with the increase in the selling amount of from Compound Microbial Fertilizer. We plan to launch the Bio-Water Soluble Fertilizer products in 2018.
Gross Profit
Our gross profit from our major product category are summarized as follows:
| For the nine months ended September 30, 2017 | For the nine months ended September 30, 2016 | Change | Change (%) | |||||||||||||
| Biological Organic Fertilizer | ||||||||||||||||
| Gross Profit | $ | 11,103 | $ | 414,859 | $ | (403,756) | (97.3) | % | ||||||||
| Gross Profit Percentage | 36.5 | % | 35.0 | % | 1.5% | 4.3 | % | |||||||||
Gross profit percentage for Biological Organic Fertilizer increased from 35.0% for the nine months ended September 30, 2016 to 36.5% for the nine months ended September 30, 2017 mainly due to the increase in our unit selling price of our products at a rate higher than the increase in raw materials price of the products for the reason as discussed above.
Non-GAAP analysis
Our total gross profit from our two major products categories are summarized as follows including the gross profit recognized and deferred under U.S. GAAP:
| For the nine months ended September 30, 2017 | For the nine months ended September 30, 2016 | Change | Change (%) | For the six months ended June 30, 2019 | For the six months ended June 30, 2018 | Change | Change (%) | |||||||||||||||||||||||||
| Biological Organic Fertilizer | ||||||||||||||||||||||||||||||||
| Gross Profit | $ | 2,596,831 | $ | 414,859 | $ | 2,181,972 | 526.0 | % | $ | 2,424,075 | $ | 2,292,050 | $ | 132,025 | 6 | % | ||||||||||||||||
| Gross Profit Percentage | 32.4 | % | 35.0 | % | (2.6 | %) | (7.4 | %) | 28.8 | % | 32.2 | % | (3.4 | )% | (11 | )% | ||||||||||||||||
| Compound Microbial Fertilizer | ||||||||||||||||||||||||||||||||
| Gross Profit | $ | 2,031,748 | $ | - | $ | 2,031,748 | 100.0 | % | $ | 2,404,732 | $ | 1,603,987 | $ | 800,745 | 50 | % | ||||||||||||||||
| Gross Profit Percentage | 30.4 | % | - | 30.4 | % | 100.0 | % | 22.8 | % | 23.1 | % | (0.4 | )% | (2 | )% | |||||||||||||||||
| Bio-Water Soluble Fertilizer | ||||||||||||||||||||||||||||||||
| Gross Profit | $ | 519,854 | $ | 10,118 | $ | 509,736 | 5,038 | % | ||||||||||||||||||||||||
| Gross Profit Percentage | 34.9 | % | 33.5 | % | 1.4 | % | 4 | % | ||||||||||||||||||||||||
| Total | ||||||||||||||||||||||||||||||||
| Gross Profit | $ | 5,348,661 | $ | 3,906,155 | $ | 1,442,506 | 37 | % | ||||||||||||||||||||||||
| Gross Profit Percentage | 26.1 | % | 27.7 | % | (1.6 | )% | (6 | )% | ||||||||||||||||||||||||
Gross profit percentage for Biological Organic Fertilizer decreased from 35.0%32.2% for the ninesix months ended SeptemberJune 30, 20162018 to 32.4%28.8% for the ninesix months ended SeptemberJune 30, 2017. The decrease in gross profit were2019 mainly attributabledue to the decrease in average selling price more than decrease in average cost per unit as discussed above
Gross profit percentage for Compound Microbial decreased from 23.1% for the six months ended June 30, 2018 to 22.8% for the six months ended June 30, 2019 mainly due to the decrease in average selling price more than the decrease in average cost per unit as discussed above.
| 39 |
Gross profit percentage for Bio-Water Soluble Fertilizer increased from 33.5% for the six months ended June 30, 2018 to 34.9% for the six months ended June 30, 2019 mainly due to the increase in popularity of the productsthis product in fertilizer market and the increase in selling price is higher than the increase in unit production cost as discussed above.
Provision on Deferred Cost of Goods Sold
Provision on deferred cost of goods sold was $2.4 million for the six months ended June 30, 2019, increased by approximately $2.4 million or 100% from $0 for the six months ended June 30, 2018. The increase in provision on deferred cost of goods sold is made based on historical collection experience on related accounts receivable and realizability of deferred revenue. Because part of the shipments to several clients, for which revenue have already been deferred, have been assessed to be uncollectible, $2.4 million of provision for deferred cost of goods sold were made during the six months ended June 30, 2019.
Research and Development Expenses
Research and development expenses was approximately $110,000 (RMB 750,000)$0 for the ninesix months ended SeptemberJune 30, 2017, compared to2019, decreased by approximately $113,000$79,000 or 100% from approximately $79,000 (RMB 750,000)500,000) for the prior comparable period.six months ended June 30, 2018. On November 20, 2015, the Company signed a strategic cooperation agreement (the “Agreement”) with China Academy of Agricultural Science (“CAAS”)’s Institute of Agricultural Resources & Regional Planning (“IARRP”) and Institute of Agricultural Economy & Development (“IAED”). Pursuant to the Agreement, the Company will form a strategic partnership with the two institutes and establish an “International Cooperation Platform for Internet and Safe Agricultural Products”. To fund the cooperation platform’s R&D activities, the Company will provide RMB 1 million (approximately $160,000)$148,000) per year to the Spatial Agriculture Planning Method & Applications Innovation Team that belongs to the Institutes. The term of the Agreement is for three years beginning November 20, 2015 and will expirehas expired on November 19, 2018. However,We did not have such expenses during the Company is only liable for the annual funds to be provided to the extent of the contract obligations performed by CAAS IARRP and IAED, and the agreement is terminable before the three years’ commitment date based on negotiations of both parties. The Company contributed approximately $113,000 (RMB 750,000) for the ninesix months ended SeptemberJune 30, 2017 and September 30, 2016. The Company plans to contribute the remaining balance until the date of the Agreement expired on November 19, 2018.2019.
Selling Expenses
Selling expenses for the nine months ended September 30, 2017 and 2016 were approximately $236,252 and $0, respectively. Selling expenses include salaries of sales personnel, sales commission, travel and entertainment as well as freight out expenses. Selling expenses for the six months ended June 30, 2019 and 2018 were approximately $101,000 and $346,000, respectively. The increasedecrease in selling expenses is mainly becausedue to a decrease of approximately $197,000 of sales personnel salary in our Shenzhen and Beijing offices as we have started hiring sales managersmoved our headquarter to Yangling with cheaper labor cost and other costs in general as the living standards in Yangling is much cheaper than in the fourth quarterShenzhen and Beijing, a decrease of 2016 for the marketing of our products. During the nine months ended September 30, 2016, there was no designated sales personnel since Kiwa Beijing just obtained the permit to sell bio-fertilizer in September 2016. With business expansion, we have hired more sales managers in Kiwa Beijing and in Kiwa Shenzhen to manage our sales activities in different regions of China from October 2016 to September 2017. In addition, the increase of sales also led to the increase ofapproximately $65,000 freight out expense resulting in thebecause we optimized our selling procedures and our customers paid for shipping cost. This decrease was offset by an increase of selling expense.approximately $21,000 in advertising expenses.
General and Administration Expenses
General and administrative expenses increased by approximately 451% from approximately $0.4 million in the nine months ended September 30, 2016 to approximately $2.1 million in the same period in 2017. General and administrativeG&A expenses include professional fees, officers’ compensation, depreciation and amortization, insurance, salaries, employee benefits, travel, auto expense, meal and entertainment, rent, office expense and telephone expense and the like. The increase in general and administrativeother miscellaneous G&A expenses. G&A expenses is mainly attributed to business expansion and the establishment of Kiwa Shenzhen in November, 2016, Kiwa Hebei in December 2016 and Kiwa Asia in July 2017.
Right-to-use Trademark Income
Right-to-use Trademark income totaled $0 for the nine months ended September 30, 2017, compared with $786,329 for the same period of 2016, reflecting a decrease of 100% from the same period of last year. Income was generated from licensing our trademark to Gerui. We signed the license agreement with Gerui to allow Gerui to sell fertilizer using our trademark in December 2015. We charged Gerui 10% of net sales of fertilizers bearing Kiwa trademark for using our trademark. Gerui began to sell fertilizers bearing Kiwa trademark in 2016. In August 2016, the Company obtained the government approval of selling fertilizers in China. As a result, we ceased the cooperation with Gerui and started to sell our own bio-fertilizers from September 2016.
Other Income
Other income increaseddecreased by approximately $0.4$0.7 million or 23% from $0approximately $3.1 million in the ninesix months period ended SeptemberJune 30, 20162018 to approximately $0.4$2.4 million in the same period in 2017.2019. The increasedecrease in G&A expenses is mainly attributabledue to a decrease of salaries and employee benefits of approximately $362,000 as we moved our headquarter to Yangling; a decrease of approximately $335,000 in rent, utilities, insurance and other related expense due to the accruedmoving of our offices to Yangling, where the government offered us free rent; a decrease of approximately $251,000 in travel and meal and entertainment expense; and a decrease of approximately $167,000 in office and other miscellaneous expenses. The decrease was offset by the increase of approximately $365,000 provision for advance to suppliers and other receivables for which the management assessed the Company cannot receive the goods to be delivered, and increase of approximately $36,000 in professional fees which were unclaimed for more than ten years and we have evaluated and reached the decision to discharge these liabilities.legal fees.
| 40 |
Interest Expense
Net interest expense was $356,256$1,139,513 and $142,296$307,927 for the ninesix months ended SeptemberJune 30, 20172019 and 2016,2018, respectively, representing an increase of $213,960$831,586 or 150%270%. Interest expense included accrued interest on convertible note and other notenotes payable, and the amortization of the convertible note discount for the ninesix months ended SeptemberJune 30, 20172019 and 2016.2018. The increase in interest expenses is mainly attributed to newly issuance of two 15%12% convertible notes fornote issued in the nineMarch 2019 where we did not have it in the six months ended SeptemberJune 30, 2017.
Loss from discontinued operations, net of taxes
Loss from discontinued operations, net of taxes was approximately $17,000 and approximately 159,000 for the three months ended September 30, 2017 and 2016, respectively, which results an increase of approximately $142,000 from discontinued operations, net of taxes for the three months ended September 30, 2017 to the same period of 2016. Due to suffering from losses for several years, On February 11, 2017, the Company executed an Equity Transfer Agreement with Dian Shi Cheng Jing (Beijing) Technology Co. (“Transferee”) whereby the Company transferred all of its right, title and interest in Kiwa Bio-Tech Products (Shandong) Co., Ltd. (“Shandong”) to the Transferee for RMB 1.00. The government processing of the transaction was completed on April 12, 2017. Therefore, it’s resulted in the decrease of loss from discontinued operations, net of taxes.2018.
Net IncomeLoss
Net incomeloss for the ninesix months ended SeptemberJune 30, 20172019 increased by approximately 650%219% from approximately $332,000$582,400 to approximately $2, 489,000.$1,855,067. Such change was the result of the combination of the changes as discussed above.
Critical Accounting Policies and Estimates
We prepared our unaudited condensed consolidated financial statements in accordance with accounting principles generally accepted in the United States of America. The preparation of these financial statements requires the use of estimates and assumptions that affect the reported amounts of assets and liabilities and the disclosure of contingent assets and liabilities at the date of the financial statements and the reported amount of revenues and expenses during the reporting period. Management periodically evaluates the estimates and judgments made. Management bases its estimates and judgments on historical experience and on various factors that are believed to be reasonable under current circumstances. Actual results may differ from these estimates as a result of different assumptions or conditions.
The following critical accounting policies affect the more significant judgments and estimates used in the preparation of our consolidated financial statements. In addition, you should refer to our accompanying unaudited condensed consolidated balance sheets as of SeptemberJune 30, 2017,2019, and the unaudited condensed consolidated statements of operations and comprehensive income, and cash flows for the ninethree and six months ended SeptemberJune 30, 2017,2019, and the related notes thereto, for further discussion of our accounting policies.
Revenue Recognition
On January 1, 2018 we adopted Accounting Standards Update (“ASU”) 2014-09 Revenue from Contracts with Customers (FASB ASC Topic 606) using the modified retrospective method for contracts that were not completed as of January 1, 2018. We did not result in an adjustment to the retained earnings upon adoption of this new guidance as the Company’s revenue was recognized based on the amount of consideration we expect to receive in exchange for satisfying the performance obligations.
The core principle underlying the revenue recognition ASU is that the Company will recognize revenue to represent the transfer of goods and services to customers in an amount that reflects the consideration to which the Company expects to be entitled in such exchange. This will require the Company to identify contractual performance obligations and determine whether revenue should be recognized at a point in time or over time, based on when control of goods and services transfers to a customer. The Company’s revenue streams are recognized at a point in time.
The ASU requires the use of a new five-step model to recognize revenue from customer contracts. The five-step model requires that the Company (i) identify the contract with the customer, (ii) identify the performance obligations in the contract, (iii) determine the transaction price, including variable consideration to the extent that it is probable that a significant future reversal will not occur, (iv) allocate the transaction price to the respective performance obligations in the contract, and (v) recognize revenue when (or as) the Company satisfies the performance obligation. The application of the five-step model to the revenue streams compared to the prior guidance did not result in significant changes in the way the Company records its revenue. Upon adoption, the Company evaluated its revenue recognition policy for all revenue streams within the scope of the ASU under previous standards and using the five-step model under the new guidance and confirmed that there were no differences in the pattern of revenue recognition.
| 41 |
The Company applies paragraph 605-10-S99-1continues to derive its revenues from sales contracts with its customers with revenues being recognized upon delivery of products. Persuasive evidence of an arrangement is demonstrated via sales contract and invoice; and the sales price to the customer is fixed upon acceptance of the FASB Accounting Standards Codification for revenue recognition.sales contract and there is no separate sales rebate, discount, or volume incentive. The Company recognizes revenue when it is realized or realizabletitle and earned. The Company considers revenue realized or realizable and earned when allownership of the following criteriagoods are met: (i) persuasive evidence of an arrangement exists, (ii) the product has been shipped or the services have been renderedtransferred upon shipment to the customer (iii)by the sales price is fixed or determinable,Company to consider control of goods are transferred to its customer and (iv) collectability of payment is reasonably assured. The Company’s revenues are recognized at a point in time after all performance obligations are satisfied.
The Company’s current payment terms on credits to its customers are ranging from 60 days to 9 months after receipts of the goods depending on the creditworthiness of its customers.The Company’scustomers are mainly agricultural cooperative company and distributors who then resell the Company’s products to individual farmers. Because the crop growing cycle usually takes approximately 3 to 9 months in the agricultural industry for some of these Co-ops and distributors, will take approximately similar time frame of 3 to 9 months for farmers to harvest crops and to realize profits to repay the resellers. As a result, for the sales contracts with these customers, the collectability of payment is highly dependent on the successful harvest of corps and the customers’ ability to collect money from farmers. The Company deemed the collectability of payment may not be reasonably assured until after the Company get paid. For thoseCollectability is a necessary condition for the contract to be accounted for to meet the criteria of the first step “identifying the contract with the customer” under the new revenue guidance in ASC 606. As a result, the sales contracts thatwith these customers are not considered a contract under ASC 606, thus the Company has shipped its products butshipments under these contracts are not recognized as revenue until all criteria for “identifying the payment is contingent on collections of payments fromcontract with the downstream customers, the Company considers thecustomer” and revenue recognition criteria are not met and therefore defersusing the revenue and cost of goods sold until payments are collected. These revenue and cost of goods sold are classified in the captioned “Deferred revenue” and “Deferred cost of goods sold” in the accompanying unaudited condensed consolidated balance sheets. For other customers whose repayment is within normal business course and not highly dependent on the succession of corps being harvested, the Company recognized revenue when title and ownership of the goods are transferred upon shipment to the customer by the Company.
five-step model.
Deferred Revenue and Deferred Cost of Goods Sold
Deferred revenue and deferred cost of goods sold result from transactions where the Company has shipped product for which all revenue recognition criteria under the five-step model have not yet been met. Though these contracts are not considered a contract under ASC 606, they are legally enforceable, and the Company has an unconditional and immediate right to payment after the Company has shipped products, therefore, the Company recognizes a receivable and a corresponding deferred revenue upon shipment. Deferred cost of goods sold related to deferred product revenues includes direct inventory costs. Once all revenue recognition criteria under the five-step model have been met, the deferred revenues and associated cost of goods sold are recognized. The Company’s provision for deferred cost of goods sold is made based on historical collection experience on such related accounts receivable and realizability of deferred revenue.
Accounts receivable and allowance for doubtful accounts
Accounts receivable represent customer accounts receivables. The Company provides an allowance for doubtful accounts equal to the estimated uncollectible amounts. The Company’s estimate is based on historical collection experience, the economic environment trends in the microbial fertilizer industry, and a review of the current status of trade accounts receivable. Management reviews its accounts receivable each reporting period to determine if the allowance for doubtful accounts is adequate. Such allowances, if any, would be recorded in the period the impairment is identified. It is reasonably possible that the Company’s estimate of the allowance for doubtful accounts will change. Uncollectible accounts receivables are charged against the allowance for doubtful accounts when all reasonable efforts to collect the amounts due have been exhausted.
Impairment of Long-Lived Assets
The Company’s long-lived assets consist of property and equipment. The Company evaluates its investment in long-lived assets for recoverability whenever events or changes in circumstances indicate the net carrying amount may not be recoverable. It is possible that these assets could become impaired as a result of legal factors, market conditions, operational performance indicators, technological or other industry changes. If circumstances require a long-lived asset or asset group to be tested for possible impairment, the Company first compares undiscounted cash flows expected to be generated by that asset or asset group to its carrying value. If the carrying value of the long-lived asset or asset group is not recoverable on an undiscounted cash flow basis, an impairment is recognized to the extent that the carrying value exceeds its fair value. Fair value is determined through various valuation techniques, including discounted cash flow models, quoted market values and third-party independent appraisals, as considered necessary.
| 42 |
Related Parties
The Company follows subtopic 850-10 of the FASB Accounting Standards Codification for the identification of related parties and disclosure of related party transactions. Pursuant to Section 850-10-20 the related parties include: a) affiliates of the Company; b) entities for which investments in their equity securities would be required, absent the election of the fair value option under the Fair Value Option Subsection of Section 825–10–15, to be accounted for by the equity method by the investing entity; c) trusts for the benefit of employees, such as pension and profit-sharing trusts that are managed by or under the trusteeship of management; d) principal owners of the Company; e) management of the Company; f) other parties with which the Company may deal if one party controls or can significantly influence the management or operating policies of the other to an extent that one of the transacting parties might be prevented from fully pursuing its own separate interests; and g) other parties that can significantly influence the management or operating policies of the transacting parties or that have an ownership interest in one of the transacting parties and can significantly Influence the other to an extent that one or more of the transacting parties might be prevented from fully pursuing its own separate interests.
The disclosures shall include: a. the nature of the relationship(s) involved; b. a description of the transactions, including transactions to which no amounts or nominal amounts were ascribed, for each of the periods for which income statements are presented, and such other information deemed necessary to an understanding of the effects of the transactions on the consolidated financial statements; c. the dollar amounts of transactions for each of the periods for which income statements are presented and the effects of any change in the method of establishing the terms from that used in the preceding period; and d. amounts due from or to related parties as of the date of each balance sheet presented and, if not otherwise apparent, the terms and manner of settlement.
Income Taxes
The Company accounts for income taxes under the provisions of FASB ASC Topic 740, “Income Tax,” which requires recognition of deferred tax assets and liabilities for the expected future tax consequences of events that have been included in the consolidated financial statements or tax returns. Deferred tax assets and liabilities are recognized for the future tax consequence attributable to the difference between the tax bases of assets and liabilities and their reported amounts in the financial statements. Deferred tax assets and liabilities are measured using the enacted tax rate expected to apply to taxable income in the years in which those temporary differences are expected to be recovered or settled. The effect on deferred tax assets and liabilities of a change in tax rates is recognized in income in the period that includes the enactment date. The Company establishes a valuation when it is more likely than not that the assets will not be recovered.
ASC Topic 740-10, “Accounting for Uncertainty in Income Taxes,” defines uncertainty in income taxes and the evaluation of a tax position as a two-step process. The first step is to determine whether it is more likely than not that a tax position will be sustained upon examination, including the resolution of any related appeals or litigation based on the technical merits of that position. The second step is to measure a tax position that meets the more-likely-than-not threshold to determine the amount of benefit to be recognized in the financial statements. A tax position is measured at the largest amount of benefit that is greater than 50 percent likelihood of being realized upon ultimate settlement. Tax positions that previously failed to meet the more-likely-than-not recognition threshold should be recognized in the first subsequent period in which the threshold is met. Previously recognized tax positions that no longer meet the more-likely-than-not criteria should be de-recognized in the first subsequent financial reporting period in which the threshold is no longer met. Penalties and interest incurred related to underpayment of income tax are classified as income tax expense in the period incurred.
Liquidity and Capital Resources
Since inceptionIn assessing our liquidity, we monitor and analyze our cash on-hand and our operating and capital expenditure commitments. Our liquidity needs is to meet our working capital requirements, operating expenses and capital expenditure obligations. As of our agriculture-biotech business in 2002, we have reliedJune 30, 2019, Kiwa Hebei is committed to pay a RMB10,000,000 based on the proceeds frompayment milestone in the sale of our equity securities and loans from both unrelated and related parties to provide the resources necessary to fund our operations and the execution of our business plan.purchase agreement.
Our business is capital intensive as we need to make advance payment to our suppliers to secure timely delivery and current assets asmarket price of September 30, 2017 were approximately $30.8 million, and our current liabilities were approximately $29.7 million, which resulted in a current ratio of approximately 1.04. Total equity as of September 30, 2017 was approximately $1.9 million. Most of our current assets areraw materials. Debt financing in the form of accounts receivable generatednotes payable and loans from our sales. Werelated parties have subsequently collected approximately $8.7 million ofbeen utilized to finance our $15.2 million outstanding accounts receivables as of September 30, 2017. We expect to collect the remaining balance of these accounts receivable by the end of December 31, 2017.
While we had net working capital requirements. As of June 30, 2019, our working capital was approximately $1.1$12.3 million at September 30, 2017 and a small net income from our continued operations, we used approximately $3.4 million net cash in our operating activities and we had very little cash on hand as of September 30, 2017. These circumstances, among others, raise substantial doubt about$10,099, with remaining current assets mainly composed of advance to suppliers, account receivable, prepaid expense, inventory and deferred cost of goods sold. In addition, we sold Convertible Promissory Notes (“Notes”) in the Company’s abilityaggregate principal amount of $1,665,000.00 in February and March 2019.
We may have to continue as a going concern, which we believe is sufficientconsider supplementing our available sources of funds for operations through the following sources:
| ● | We will continuously seek additional equity financing to support our working capital; | |
| ● | other available sources of financing from PRC banks and other financial institutions; and | |
| ● | financial support and credit guarantee commitments from our major shareholder. |
Based on the above considerations, our management is of the opinion that it does not have sufficient funds to meet our working capital needs forrequirements and debt obligations as they become due one year from the next twelve months.
Our ability to repay its current obligations will depend ondate of this report. If the future operating revenues generated from our products and seeking additional equity financing. Because the Chinese Government is continuously to promote green environment and implement quality standards and environmentally sensitive policies in the Agricultural industry, we expect our revenues from our innovated and highly effective products, Compound Microbial Fertilizer and Bio-Water Soluble Fertilizer, will continue to grow in our business. In addition, our marketing team is expanding to the Western areas of China and Hainan province and we expect our revenues will continue to grow in the fourth quarter of 2017 and in 2018. Meanwhile, we expect to continue to gain market shares in our existing sales channel bases in the Northern and the Southern areas of China due to the good quality of the products and better reputation in the industry. We believe these factors will enable us sufficiently to support our working capital needs for the next twelve months. However, if management isCompany can’t raise enough funds, it might be unable to execute our revenue plan as expected, there would be likely being a material effect on our operations.
Furthermore, our management already raised additional equity for approximately $76,000 and reduced our convertible debts for approximately $15,000 in October 2017. Management is currently and will continuously seeking additional equity financing to support our working capital. To the extent that we are unable to successfully raise the capital necessary to fund our future cash requirementsrequirement on a timely basis and under acceptable terms and conditions weand may not have sufficient liquidity to maintain operations and repay our liabilities for the next twelve months. As a result, we may be unable to implement itsour current plans for expansion, repay our debt obligations or respond to competitive pressures, any of which would have a material adverse effect on our business, prospects, financial condition and results of operations.
Accounts receivable
| 43 |
As of September 30, 2017, we had approximately $15.2 million of accounts receivables from our customers. Since weobtained a fertilizer sales permit from the Chinese government in August 2016 and began to sell the products directly to customers in September 2016, our strategy was to gain market shares in the bio-fertilizer market by extending longer credit to our customers. As a result, our accounts receivable increased from approximately $1.1 million at December 31, 2016 to approximately $15.2 million at September 30, 2017. Our current payment terms on these customers are ranging from 60 days to 9 months after receipts of the goods depending on the creditworthiness of these customers. These customers are either agricultural cooperative company or distributors who then resell our products to individual farmers. Because the crop growing cycle usually takes approximately 3 to 9 months in the agricultural industry, it will take approximately similar time frame of 3 to 9 months for farmers to harvest crops and to realize profits to repay us. Based on our evaluation of the collectability of our trade accounts receivable, we have provided allowance for doubtful accounts of approximately $0.3 million as of September 30, 2017. As of the date of this report, we have subsequently collected approximately $8.7 million or 56% of the outstanding accounts receivable as of September 30, 2017. We expect to collect the remaining balance of approximately $6.8 million of these outstanding accounts receivable by the end of December 31, 2017.
Our provision on allowance for doubtful accounts is based on historical collection experience, the economic environment, trends in the microbial fertilizer industry, and a review of the current status of trade accounts receivable and come up with an aging allowance method. Currently, we provide a provision of 1%-6% of the allowance for doubtful accounts for accounts receivable balance that are more than 180 days old but less than one year old, 50% of the allowance for doubtful accounts for accounts receivable from one to one and half years old, 100% of the allowance for doubtful accounts for accounts receivable beyond one and half years old, plus additional amount as necessary, which our collection department had determined the collection of the full amount is remote with the approval from our management to provide a 100% provision allowance for doubtful accounts. Our management have continued to evaluate the reasonableness of the valuation allowance policy and update it if necessary.
Deferred revenue and deferred cost of goods sold
As of September 30, 2017, we had approximately $15.0 million of deferred revenue and approximately $10.3 million of deferred cost of goods soldbecause these transactions resulted from where we have shipped our products for which all revenue recognition criteria have not yet been met.As of the date of this report, we have subsequently collected approximately $8.7 million or 56% of the outstanding deferred revenues as of September 30, 2017. As a result, we expect to recognize approximately $8.7 million of deferred revenue and approximately $6.0 million of deferred cost of goods sold in the fourth quarter of 2017.
The following table set forth summary of our cash flows for the periods indicated:
(All in amounts in thousands of U.S. dollars)
| For the six months ended June 30, | ||||||||
| 2019 | 2018 | |||||||
| Net cash provided by (used in) operating activities | $ | (1,530,963 | ) | $ | 3,758,521 | |||
| Net cash used in investing activities | (38,890 | ) | (3,488 | ) | ||||
| Net cash provided by financing activities | 994,523 | 444,711 | ||||||
| Effect of exchange rate changes on cash | 577,570 | (201,693 | ) | |||||
| Net increase in cash | 2,240 | 3,998,051 | ||||||
| Cash, beginning of period | 7,859 | 1,083,539 | ||||||
| Cash, end of period | $ | 10,099 | $ | 5,081,590 | ||||
| Nine Months Ended | ||||||||
| 2017 | 2016 | |||||||
| Net cash (used) in continuing operating activities | $ | (3,367 | ) | $ | (738 | ) | ||
| Net cash (used) in continuing investing activities | (793 | ) | (79 | ) | ||||
| Net cash provided by continuing financing activities | 4,228 | 818 | ||||||
| Net cash used in discontinued operations | - | - | ||||||
| Effect of exchange rate changes on cash | (58 | ) | (1 | ) | ||||
| Net increase (decrease) in cash | 10 | (0 | ) | |||||
| Cash, beginning of nine month period | 13 | 1 | ||||||
| Cash, end of nine month period | $ | 23 | $ | 1 | ||||
Operating Activities
Net cash used in continuing operating activities was approximately $3.4 million in the nine months ended September 30, 2017, compared to cash used in operating activities was approximately $1.5 million for the six months ended June 30, 2019, compare to cash provided in operating activities of approximately $0.7$3.8 million for the same period in 2016. The increase in net2018. Net cash used in operating activities for the six months ended June 30, 2019 was primarily attributable to 1) increasea net loss of approximately $14.0$1.9 million, of accounts receivable as our strategy is to gainmarket shares in thebio-fertilizermarket by extending credit to our customers; 2) increase of approximately $1.1$7.5 million of advance to suppliersas we needwant to secure the current market price of raw materials purchases, as we are anticipating the raw materials price is on the rise in the near future; 3) increase of approximately $10.0$0.2 million account receivable as we increased on our credit sales, 4) decrease of approximately $0.1 million advance from customers and 5) decrease of approximately $0.1 million other payables and accruals. This cash outflow is offset by 6) approximately $2.4 million provision for deferred cost of goods sold offset by 4)as the collectability of our previously deferred revenues are exhausted, 7) decrease approximately $1.5 million inventory as we utilized our existing inventories for production instead of purchasing new raw materials, 8) increase of approximately $7.6$1.2 million tax payables, 9) an approximately $1.1 million of accounts payable as we have increased our purchases to fulfill more sales orders in the nine months ended September 30, 2017non-cash stock compensation issued for consulting fees and 5)officer salaries, 10) increase of approximately $14.7$1.0 million of deferred revenue.account payables, 11) decrease approximately 0.4 million on prepaid expenses, 12) increase approximately $0.2 million salary payables, 13) an approximately 0.4 million bad debt expense as allowance on advance to suppliers and other receivables, and 14) an approximately $0.1 million accrued interest and penalties due to two new issued convertible notes in March 2019.
Investing Activities
Net cash used in continuing investing activities was approximately $0.8 million$38,890 in the ninesix months ended SeptemberJune 30, 2017, and net2019, which was mainly attributable to purchase of office equipment. Net cash used in investing activities was approximately $0.08 million$3,488 for the ninesix months period ended SeptemberJune 30, 2016. The net cash used in investing activities was mainly attributable to deposit of investment. The Company entered an equity purchase agreement with the shareholders of Yantai Peng Hao New Materials Technology Co. Ltd. (“Peng Hao”) to acquire 100% interest in Peng Hao on June 8, 2017. As of September 30, 2017, the Company has made deposit payment of RMB 5,000,000 (approximately $751,050).2018.
Financing Activities
Net cash provided continuingby financing activities was approximately $4.2$1.0 million for the ninesix months ended SeptemberJune 30, 20172019 and net cash provided by financing activities was approximately $0.8$0.4 million for the ninesix months period ended SeptemberJune 30, 2016.2018. The cash inflow for the ninesix months ended SeptemberJune 30, 20172019 was mainly resulteddue to an approximately $1.2 million proceed from sale of common stocks oftwo new issued convertible notes, which offset by an approximately $3.2$0.3 million and from issuing of our convertible note of approximately $1 million.net payment to related parties.
| 44 |
Trends and Uncertainties in Regulation and Government Policy in China
Foreign Exchange Policy Changes
China is considering allowing its currency to be freely exchangeable for other major currencies. This change will result in greater liquidity for revenues generated in Renminbi (“RMB”). We would benefit by having easier access to and greater flexibility with capital generated in and held in the form of RMB. The majority of our assets are located in China and most of our earnings are currently generated in China and are therefore denominated in RMB. Changes in the RMB-U.S. Dollar exchange rate will impact our reported results of operations and financial condition. In the event that RMB appreciates over the next year as compared to the U.S. Dollar, our earnings will benefit from the appreciation of the RMB. However, if we have to use U.S. Dollars to invest in our Chinese operations, we will suffer from the depreciation of U.S. Dollars against the RMB. On the other hand, if the value of the RMB were to depreciate compared to the U.S. Dollar, then our reported earnings and financial condition would be adversely affected when converted to U.S. Dollars.
On July 21, 2005,From the People’s Bankend of China announced it would appreciate2018 through June 30, 2019, the value of the RMB increasingdepreciated by approximately 0.2% against the RMB-U.S. DollarU.S. Dollar. With the development of the foreign exchange market and progress towards interest rate liberalization and RMB internationalization, the PRC government may in the future announce further changes to the exchange rate from approximately US$1.00 =system and there is no guarantee that the RMB 8.28will not appreciate or depreciate significantly in value against the U.S. Dollar in the future. It is difficult to approximately US$1.00 =predict how market forces or PRC or U.S. government policy may impact the exchange rate between the RMB 8.11. So farand the trend of such appreciation continues.U.S. Dollar in the future. The exchange rate of U.S. Dollar against RMB on SeptemberJune 30, 20172019 was US$1.00 = RMB 6.6574.6.8656.
Commitments and Contingencies
See Note 1719 to the Unaudited Condensed Consolidated Financial Statements under Item 1 in Part I.
Off-Balance Sheet Arrangements
At SeptemberJune 30, 2017,2019, we did not have any relationships with unconsolidated entities or financial partnerships, such as entities often referred to as structured finance or special purpose entities, established for the purpose of facilitating off-balance sheet arrangements or other contractually narrow or limited purposes. As such, we are not exposed to any financing, liquidity, market or credit risk that could arise if we had engaged in such relationships.
ITEM 3. QUANTITATIVE AND QUALITATIVE DISCLOSURES ABOUT MARKET RISK
Not applicable.
ITEM 4. CONTROLS AND PROCEDURES
(a) Evaluation of Disclosure Controls and Procedures
Our Chief Executive Officer and Chief Financial Officer, after evaluating the effectiveness of our disclosure controls and procedures (as defined in Securities Exchange Act Rule 13a-15(e)) as of the end of the quarterly period covered by this report, have concluded that our disclosure controls and procedures are not effective as of June 30, 2019 to reasonably ensure that material information required to be disclosed by us in the reports that we file or submit under the Exchange Act is recorded, processed, summarized and reported within the time periods specified by the Securities and Exchange Commission’s Rules and forms and that such information is accumulated and communicated to our management, including our Chief Executive Officer and Chief Financial Officer, as appropriate, to allow timely decisions regarding required disclosure. The principal basis for this conclusion is the lack ofdue to (i) failure to engage sufficient resources in regard to our accounting and skilled accounting personnel with an appropriate level of technical accounting knowledgereporting obligations and experience in the application of US GAAP(ii) failure to fully document our internal control policies and the lack of audit committee oversight.procedures.
(b) Changes in Internal Control over Financial Reporting
On January 1, 2019, we adopted Accounting Standards Update (“ASU”) 2016-02 Leases (FASB ASC Topic 842). There have not been any other changes in the Company’s internal control over financial reporting (as such term is defined in Rules 13a-15(f) under the Exchange Act) during the current quarter ended SeptemberJune 30, 2017,2019 to have materially affected the Company’s internal control over financial reporting.
None.
Smaller reporting companies are not required to provide the information required by this item.
Item 2. Unregistered Sales of Equity Securities and Use of Proceeds
The following is a list of securitiesshares of Company Common Stock issued for cash, or converted withthe conversion of convertible debentures or as stock compensation to consultants during the period from January 1, 20172019 through December 22, 2017,August 19, 2019, which were not registered under the Securities Act:
| Consultant Fees | 784,999shares |
| | |
| Conversion of Convertible Note | 395,959 shares |
| Salary Compensation | 20,657 shares |
| Debt Settlement | 300,000 shares |
| Total | 2,494,116 shares |
There were no other sales of unregistered securities not already reported on the Company’s quarterly filings on Form 10-Q or on a Current Report on Form 8-K.
Item 3. Defaults Upon Senior Securities
None.
Item 4. Mine safety disclosures
Not applicable.
None.
| Exhibit No. | Description | |
| 31.1/31.2 | Certification of Principal Executive Officer and Principal Financial Officer pursuant to Rule 13a-14(a) and Rule15d-14(a) of the Securities Exchange Act of 1934, as amended | |
| 32.1/32.2 | Certification of Principal Executive Officer and Principal Financial Officer, pursuant to 18 U.S.C. 1350, as adopted pursuant to Section 906 of the Sarbanes-Oxley Act of 2002 | |
| 101.INS | XBRL Instance Document | |
| 101.SCH | XBRL Taxonomy Extension Schema Document | |
| 101.PRE | XBRL Taxonomy Extension Presentation Linkbase Document | |
| 101.CAL | XBRL Taxonomy Extension Calculation Linkbase Document | |
| 101.LAB | XBRL Taxonomy Extension Label Linkbase Document | |
| 101.DEF | XBRL Taxonomy Extension Definition Linkbase Document |
In accordance with the requirements of the Securities Exchange Act of 1934, the Registrant has caused this report to be signed on its behalf by the undersigned, thereunto duly authorized.
Date: August 19, 2019
| KIWA BIO-TECH PRODUCTS GROUP | ||
| By: | /s/ Yvonne Wang | |
Yvonne Wang Chief Executive Officer (Principal Executive Officer) | ||
| By: | /s/ Hon Man Yun | |
Hon Man Yun Chief Financial Officer (Principal Financial and Accounting Officer) | ||