UNITED STATES
SECURITIES AND EXCHANGE COMMISSION
WASHINGTON, DC 20549
FORM 10-Q
[X]Quarterly Report Pursuant to Section 13 or 15(d) of the Securities Exchange Act of 1934
For the Quarterly Period Ended March 31,June 30, 2019
or
[ ]Transition Report Pursuant to Section 13 or 15(d) of the Securities Exchange Act of 1934
For the Transition Period From to
Commission File Number 333-203707333-224557
SHEPHERD’S FINANCE, LLC
(Exact name of registrant as specified on its charter)
| Delaware | 36-4608739 | |
| (State or other jurisdiction of | (I.R.S. Employer | |
| Incorporation or organization) | Identification No.) |
13241 Bartram Park Blvd., Suite 2401, Jacksonville, Florida 32258
(Address of principal executive offices)
(302) 752-2688
(Registrant’s telephone number including area code)
Securities registered pursuant to Section 12(b) of the Act:
| Title of Each Class | Trading Symbol(s) | Name of Each Exchange on Which Registered | ||
| None | None | None |
Indicate by check mark whether the registrant (1) has filed all reports required to be filed by section 13 or 15(d) of the Securities Exchange Act of 1934 during the preceding 12 months (or for such shorter period that the registrant was required to file such reports) and (2) has been subject to such filing requirements for the past 90 days. Yes [X] No [ ]
Indicate by check mark whether the registrant has submitted electronically every Interactive Data File required to be submitted pursuant to Rule 405 of Regulation S-T (§232.405 of this chapter) during the preceding 12 months (or for such shorter period that the registrant was required to submit such files). Yes [X] No [ ]
Indicate by check mark whether the registrant is a large accelerated filer, an accelerated filer, a non-accelerated filer, smaller reporting company, or an emerging growth company. See the definitions of “large accelerated filer,” “accelerated filer,” “smaller reporting company,” and “emerging growth company” in Rule 12b-2 of the Exchange Act.
| Large accelerated filer | [ ] | Accelerated filer | [ ] | |
| Non-accelerated filer | [X] | Smaller reporting company | [X] | |
| Emerging growth company | [X] |
If an emerging growth company, indicate by check mark if the registrant has elected not to use the extended transition period for complying with any new or revised financial accounting standards provided pursuant to Section 13(a) of the Exchange Act. [X]
Indicate by check mark whether the registrant is a shell company (as defined in Rule 12b-2 of the Exchange Act). Yes [ ] No [X]
Securities registered pursuant to Section 12(b) of the Act:
FORM 10-Q
SHEPHERD’S FINANCE, LLC
TABLE OF CONTENTS
| 2 |
CAUTIONARY NOTE REGARDING FORWARD-LOOKING STATEMENTS
Certain statements contained in this Form 10-Q of Shepherd’s Finance, LLC, other than historical facts, may be considered forward-looking statements within the meaning of the federal securities laws. Words such as “may,” “will,” “expect,” “anticipate,” “believe,” “estimate,” “continue,” “predict,” or other similar words identify forward-looking statements. Forward-looking statements appear in a number of places in this report, including without limitation, “Management’s Discussion and Analysis of Financial Condition and Results of Operations,” and include statements regarding our intent, belief or current expectation about, among other things, trends affecting the markets in which we operate, our business, financial condition and growth strategies. Although we believe that the expectations reflected in these forward-looking statements are based on reasonable assumptions, forward-looking statements are not guarantees of future performance and involve risks and uncertainties. Actual results may differ materially from those predicted in the forward-looking statements as a result of various factors, including but not limited to those set forth in the “Risk Factors” section of our Annual Report on Form 10-K for the year ended December 31, 2018, as filed with the Securities and Exchange Commission. If any of the events described in “Risk Factors” occur, they could have an adverse effect on our business, consolidated financial condition, results of operations, and cash flows.
When considering forward-looking statements, you should keep these risk factors, as well as the other cautionary statements in this report and in our Annual Report on Form 10-K for the year ended December 31, 2018 in mind. You should not place undue reliance on any forward-looking statement. We are not obligated to update forward-looking statements.
| 3 |
PART I – FINANCIAL INFORMATION
Interim Condensed Consolidated Balance Sheets
| (in thousands of dollars) | March 31, 2019 | December 31, 2018 | June 30, 2019 | December 31, 2018 | ||||||||||||
| (Unaudited) | (Unaudited) | |||||||||||||||
| Assets | ||||||||||||||||
| Cash and cash equivalents | $ | 1,912 | $ | 1,401 | $ | 2,153 | $ | 1,401 | ||||||||
| Accrued interest receivable | 697 | 568 | 809 | 568 | ||||||||||||
| Loans receivable, net | 49,991 | 46,490 | 50,377 | 46,490 | ||||||||||||
| Foreclosed assets | 6,069 | 5,973 | 7,964 | 5,973 | ||||||||||||
| Premises and equipment | 1,030 | 1,051 | 1,006 | 1,051 | ||||||||||||
| Other assets | 80 | 327 | 399 | 327 | ||||||||||||
| Total assets | $ | 59,779 | $ | 55,810 | $ | 62,708 | $ | 55,810 | ||||||||
| Liabilities and Members’ Capital | ||||||||||||||||
| Customer interest escrow | $ | 1,289 | $ | 939 | $ | 1,109 | $ | 939 | ||||||||
| Accounts payable and accrued expenses | 581 | 724 | 412 | 724 | ||||||||||||
| Accrued interest payable | 2,098 | 2,140 | 2,269 | 2,140 | ||||||||||||
| Notes payable secured, net of deferred financing costs | 26,085 | 23,258 | 28,690 | 23,258 | ||||||||||||
| Notes payable unsecured, net of deferred financing costs | 23,231 | 22,635 | 23,635 | 22,635 | ||||||||||||
| Due to preferred equity member | 34 | 32 | 34 | 32 | ||||||||||||
| Total liabilities | $ | 53,318 | $ | 49,728 | $ | 56,149 | $ | 49,728 | ||||||||
| Commitments and Contingencies (Note 9) | ||||||||||||||||
| Redeemable Preferred Equity | ||||||||||||||||
| Series C preferred equity | $ | 2,457 | $ | 2,385 | $ | 2,715 | $ | 2,385 | ||||||||
| Members’ Capital | ||||||||||||||||
| Series B preferred equity | 1,380 | 1,320 | 1,420 | 1,320 | ||||||||||||
| Class A common equity | 2,624 | 2,377 | 2,424 | 2,377 | ||||||||||||
| Members’ capital | $ | 4,004 | $ | 3,697 | $ | 3,844 | $ | 3,697 | ||||||||
| Total liabilities, redeemable preferred equity and members’ capital | $ | 59,779 | $ | 55,810 | $ | 62,708 | $ | 55,810 | ||||||||
The accompanying notes are an integral part of these interim condensed consolidated financial statements.
| 4 |
Interim Condensed Consolidated Statements of Operations - Unaudited
For the Three and Six Months ended March 31,June 30, 2019 and 2018
| Three Months Ended | Three Months Ended | Six Months Ended | ||||||||||||||||||||||
| March 31, | June 30, | June 30, | ||||||||||||||||||||||
| (in thousands of dollars) | 2019 | 2018 | 2019 | 2018 | 2019 | 2018 | ||||||||||||||||||
| Interest Income | ||||||||||||||||||||||||
| Interest and fee income on loans | $ | 2,432 | $ | 1,707 | $ | 2,454 | $ | 1,925 | $ | 4,886 | $ | 3,632 | ||||||||||||
| Interest expense: | ||||||||||||||||||||||||
| Interest related to secured borrowings | 681 | 411 | 769 | 517 | 1,450 | 928 | ||||||||||||||||||
| Interest related to unsecured borrowings | 625 | 450 | 716 | 513 | 1,341 | 963 | ||||||||||||||||||
| Interest expense | 1,306 | 861 | 1,485 | 1,030 | 2,791 | 1,891 | ||||||||||||||||||
| Net interest income | 1,126 | 846 | 969 | 895 | 2,095 | 1,741 | ||||||||||||||||||
| Less: Loan loss provision | 47 | 40 | 151 | 19 | 198 | 59 | ||||||||||||||||||
| Net interest income after loan loss provision | 1,079 | 806 | 818 | 876 | 1,897 | 1,682 | ||||||||||||||||||
| Non-Interest Income | ||||||||||||||||||||||||
| Gain from foreclosure of assets | - | - | ||||||||||||||||||||||
| Gain on foreclosure of assets | 95 | – | 95 | – | ||||||||||||||||||||
| Total non-interest income | - | - | 95 | – | 95 | – | ||||||||||||||||||
| Income | 1,079 | 806 | 913 | 876 | 1,992 | 1,682 | ||||||||||||||||||
| Non-Interest Expense | ||||||||||||||||||||||||
| Selling, general and administrative | 624 | 497 | 620 | 571 | 1,244 | 1,068 | ||||||||||||||||||
| Depreciation and amortization | 23 | 17 | 22 | 21 | 45 | 38 | ||||||||||||||||||
| Loss on foreclosure of assets | 169 | – | 169 | – | ||||||||||||||||||||
| Impairment loss on foreclosed assets | 80 | 5 | 27 | 80 | 107 | 85 | ||||||||||||||||||
| Total non-interest expense | 727 | 519 | 838 | 672 | 1,565 | 1,191 | ||||||||||||||||||
| Net Income | $ | 352 | $ | 287 | $ | 75 | $ | 204 | $ | 427 | $ | 491 | ||||||||||||
| Earned distribution to preferred equity holders | 105 | 63 | 110 | 67 | 215 | 130 | ||||||||||||||||||
| Net income attributable to common equity holders | $ | 247 | $ | 224 | $ | (35 | ) | $ | 137 | $ | 212 | $ | 361 | |||||||||||
The accompanying notes are an integral part of these interim condensed consolidated financial statements.
| 5 |
Interim Condensed Consolidated Statements of Changes in Members’ Capital - Unaudited
For the Six and Three Months Ended June 30, 2019 and 2018
For the Six Months Ended June 30, 2019 and 2018
| (in thousands of dollars) | 2019 | 2018 | ||||||
| Members’ capital, beginning balance, December 31 | $ | 3,697 | $ | 3,686 | ||||
| Net income less distributions to preferred C of $148 and $68 | 279 | 423 | ||||||
| Contributions from preferred B equity holders | 100 | 40 | ||||||
| Earned distributions to preferred B equity holders | (66 | ) | (62 | ) | ||||
| Distributions to common equity holders | (166 | ) | (214 | ) | ||||
| Members’ capital, ending balance June 30 | $ | 3,844 | $ | 3,873 | ||||
For the Three Months Ended March 31,June 30, 2019 and 2018
| (in thousands of dollars) | Three Months Ended March 31, 2019 | Three Months Ended March 31, 2018 | ||||||
| Members’ capital, beginning balance | $ | 3,697 | $ | 3,686 | ||||
| Net income | 352 | 287 | ||||||
| Contributions from members (preferred) | 60 | - | ||||||
| Earned distributions to preferred equity holders | (105 | ) | (63 | ) | ||||
| Distributions to common equity holders | - | (22 | ) | |||||
| Members’ capital, ending balance | $ | 4,004 | $ | 3,888 | ||||
| (in thousands of dollars) | 2019 | 2018 | ||||||
| Members’ capital, beginning balance, March 31 | $ | 4,004 | $ | 3,888 | ||||
| Net income less distributions to preferred C of $75 and $33 | - | 171 | ||||||
| Contributions from preferred B equity holders | 40 | 40 | ||||||
| Earned distributions to preferred B equity holders | (34 | ) | (34 | ) | ||||
| Distributions to common equity holders | (166 | ) | (192 | ) | ||||
| Members’ capital, ending balance June 30 | $ | 3,844 | $ | 3,873 | ||||
The accompanying notes are an integral part of the interim condensed consolidated financial statements.
| 6 |
Interim Condensed Consolidated Statements of Cash Flows - Unaudited
For the ThreeSix Months Ended March 31,June 30, 2019 and 2018
Three Months Ended March 31, | Six Months Ended June 30, | |||||||||||||||
| (in thousands of dollars) | 2019 | 2018 | 2019 | 2018 | ||||||||||||
| Cash flows from operations | ||||||||||||||||
| Net income | $ | 352 | $ | 287 | $ | 427 | $ | 491 | ||||||||
| Adjustments to reconcile net income to net cash provided by (used in) operating activities | ||||||||||||||||
| Adjustments to reconcile net income to net cash provided by operating activities | ||||||||||||||||
| Amortization of deferred financing costs | 65 | 48 | 133 | 95 | ||||||||||||
| Provision for loan losses | 47 | 40 | 198 | 59 | ||||||||||||
| Net loan origination fees deferred | 54 | 85 | 155 | 351 | ||||||||||||
| Change in deferred origination expense | 5 | (23 | ) | 65 | (87 | ) | ||||||||||
| Impairment of foreclosed assets | 80 | 5 | 107 | 85 | ||||||||||||
| Loss on foreclosed assets | 169 | - | ||||||||||||||
| Gain on foreclosed assets | (95 | ) | - | |||||||||||||
| Depreciation and amortization | 20 | 17 | 45 | 38 | ||||||||||||
| Net change in operating assets and liabilities: | ||||||||||||||||
| Other assets | 247 | (39 | ) | (72 | ) | (118 | ) | |||||||||
| Accrued interest receivable | (129 | ) | (246 | ) | (241 | ) | (176 | ) | ||||||||
| Customer interest escrow | 350 | (149 | ) | 170 | (391 | ) | ||||||||||
| Accounts payable and accrued expenses | (185 | ) | (207 | ) | (181 | ) | 78 | |||||||||
| Net cash provided by (used in) operating activities | 906 | (182 | ) | |||||||||||||
| Net cash provided by operating activities | 880 | 425 | ||||||||||||||
| Cash flows from investing activities | ||||||||||||||||
| Loan originations and principal collections, net | (3,606 | ) | (9,751 | ) | (6,021 | ) | (15,996 | ) | ||||||||
| Investment in foreclosed assets | (176 | ) | (48 | ) | (456 | ) | (545 | ) | ||||||||
| Property plant and equipment additions | - | (25 | ) | |||||||||||||
| Premises and equipment additions | - | (63 | ) | |||||||||||||
| Net cash used in investing activities | (3,782 | ) | (9,824 | ) | (6,477 | ) | (16,604 | ) | ||||||||
| Cash flows from financing activities | ||||||||||||||||
| Contributions from preferred equity holders | 60 | - | 300 | 40 | ||||||||||||
| Distributions to preferred equity holders | (32 | ) | (30 | ) | (85 | ) | (62 | ) | ||||||||
| Distributions to common equity holders | - | (22 | ) | (166 | ) | (214 | ) | |||||||||
| Proceeds from secured note payable | 5,262 | 7,581 | 11,016 | 13,538 | ||||||||||||
| Repayments of secured note payable | (2,459 | ) | (1,665 | ) | (6,648 | ) | (4,118 | ) | ||||||||
| Proceeds from unsecured notes payable | 3,925 | 4,479 | 6,186 | 8,784 | ||||||||||||
| Redemptions/repayments of unsecured notes payable | (3,087 | ) | (3,400 | ) | (3,923 | ) | (4,953 | ) | ||||||||
| Deferred financing costs paid | (282 | ) | (35 | ) | (331 | ) | (67 | ) | ||||||||
| Net cash provided by financing activities | 3,387 | 6,908 | 6,349 | 12,948 | ||||||||||||
| Net increase (decrease) in cash and cash equivalents | 511 | (3,098 | ) | 752 | (3,231 | ) | ||||||||||
| Cash and cash equivalents | ||||||||||||||||
| Beginning of period | 1,401 | 3,478 | 1,401 | 3,478 | ||||||||||||
| End of period | $ | 1,912 | $ | 380 | $ | 2,153 | $ | 247 | ||||||||
| Supplemental disclosure of cash flow information | ||||||||||||||||
| Cash paid for interest | $ | 1,348 | $ | 813 | $ | 2,662 | $ | 1,533 | ||||||||
| Non-cash investing and financing activities | ||||||||||||||||
| Earned but not paid distribution of preferred B equity holders | $ | 34 | $ | 33 | ||||||||||||
| Earned but not paid preferred C equity holders | 72 | 33 | ||||||||||||||
| Earned by preferred B equity holders but not distributed to customer interest escrow | $ | 34 | $ | 31 | ||||||||||||
| Earned by preferred B equity holders and distributed to customer interest escrow | $ | 33 | $ | 31 | ||||||||||||
| Foreclosure of assets transferred from loans receivable | $ | 1,716 | $ | 3,897 | ||||||||||||
| Accrued interest reduction due to foreclosure | $ | - | $ | 243 | ||||||||||||
| Earned but not paid distributions of preferred C equity holders | $ | 148 | $ | 68 | ||||||||||||
| Unsecured transferred to secured notes payable | $ | 1,014 | $ | - | ||||||||||||
The accompanying notes are an integral part of these interim condensed consolidated financial statements.
| 7 |
Notes to Interim Condensed Consolidated Financial Statements (unaudited)
Information presented throughout these notes to the interim condensed consolidated financial statements (unaudited) is in thousands of dollars.
1. Description of Business and Basis of Presentation
Description of Business
Shepherd’s Finance, LLC and subsidiary (the “Company”) was originally formed as a Pennsylvania limited liability company on May 10, 2007. The Company is the sole member of a consolidating subsidiary, 84 REPA, LLC. The Company operates pursuant to its Second Amended and Restated Operating Agreement, as amended, by and among Daniel M. Wallach and the other members of the Company effective as of March 16, 2017.
As of March 31, 2019, theThe Company extends commercial loans to residential homebuilders (in 21 states)20 states as of June 30, 2019) to:
| ● | construct single family homes, | |
| ● | develop undeveloped land into residential building lots, and | |
| ● | purchase and improve for sale older homes. |
Basis of Presentation
The accompanying (a) interim condensed consolidated balance sheet as of December 31, 2018,June 30, 2019, which has been derived from audited consolidated financial statements, and (b) unaudited interim condensed consolidated financial statements have been prepared in accordance with accounting principles generally accepted in the United States of America (“U.S. GAAP”) for interim financial information, the instructions to Form 10-Q and Article 108 of Regulation S-X. While certain information and disclosures normally included in financial statements prepared in accordance with U.S. GAAP have been condensed or omitted pursuant to the rules and regulations of the Securities and Exchange Commission (“SEC”), management believes that the disclosures herein are adequate to make the unaudited interim condensed consolidated information presented not misleading. In the opinion of management, the unaudited interim condensed consolidated financial statements reflect all adjustments necessary for a fair presentation of the consolidated financial position, results of operations, and cash flows for the periods presented. Such adjustments are of a normal, recurring nature. The consolidated results of operations for any interim period are not necessarily indicative of results expected for the fiscal year ending December 31, 2019. These unaudited interim condensed consolidated financial statements should be read in conjunction with the 2018 consolidated financial statements and notes thereto (the “2018 Financial Statements”) included in the Company’s Annual Report on Form 10-K for the year ended December 31, 2018 (the “2018 Form 10-K”). The accounting policies followed by the Company are set forth in Note 2 –Summary of Significant Accounting Policiesin the 2018 Financial Statements.
Accounting Standards Adopted in the Period
Accounting Standards Update (“ASU”) 2016-13 – “Financial Instruments-Credit Losses: Measurement of Credit Losses on Financial Instruments”. The amendments in ASU 2016-13 introduce a new current expected credit loss (“CECL”) model for certain financial assets, including mortgage loans and reinsurance receivables. The new model will not apply to debt securities classified as available-for-sale. For assets within the scope of the new model, an entity will recognize as an allowance against earnings its estimate of the contractual cash flows not expected to be collected on day one of the asset’s acquisition. The allowance may be reversed through earnings if a security recovers in value. This differs from the current impairment model, which requires recognition of credit losses when they have been incurred and recognizes a security’s subsequent recovery in value in other comprehensive income. ASU 2016-13 also makes targeted changes to the current impairment model for available-for-sale debt securities, which comprise the majority of the Company’s invested assets. Similar to the CECL model, credit loss impairments will be recorded in an allowance against earnings that may be reversed for subsequent recoveries in value. The amendments in ASU 2016-13, along with related amendments in ASU No. 2018-19 - Codification Improvements to Topic 326, Financial Instruments-Credit Losses, are effective for annual and interim periods beginning after December 15, 2019 on a modified retrospective basis. The Company is reviewing its policies and processes to ensure compliance with the requirements in ASU 2016-13.
Accounting Standards Update (“ASU”) 2016-01, “Financial Instruments - Overall (Subtopic 825-10): Recognition and Measurement of Financial Assets and Financial Liabilities (An Amendment of FASB ASC 825).” The Financial Accounting Standards Board (“FASB”) issued ASU 2016-01 in January 2016, and it was intended to enhance the reporting model for financial instruments to provide users of financial statements with improved decision-making information. The amendments of ASU 2016-01 include: (i) requiring equity investments, except those accounted for under the equity method of accounting or those that result in the consolidation of an investee, to be measured at fair value, with changes in fair value recognized in net income; (ii) requiring a qualitative assessment to identify impairment of equity investments without readily determinable fair values; and (iii) clarifying that an entity should evaluate the need for a valuation allowance on a deferred tax asset related to available-for-sale securities in combination with the entity’s other deferred tax assets.
| 8 |
ASU 2016-01 became effective for the Company on January 1, 2018. The adoption of ASU 2016-01 did not have a material impact on the Company’s consolidated financial statements.
ASU 2014-09, “Revenue from Contracts with Customers (Topic 606).” Issued in May 2014, ASU 2014-09 added FASB Accounting Standards Codification (“ASC”) Topic 606, “Revenue from Contracts with Customers,” and superseded revenue recognition requirements in FASB ASC Topic 605, “Revenue Recognition,” and certain cost guidance in FASB ASC Topic 605-35, “Revenue Recognition – Construction-Type and Production-Type Contracts.” ASU 2014-09 requires an entity to recognize revenue when (or as) an entity transfers control of goods or services to a customer at the amount to which the entity expects to be entitled. Depending on whether certain criteria are met, revenue should be recognized either over time, in a manner that depicts the entity’s performance, or at a point in time, when control of the goods or services is transferred to the customer. ASU 2014-09 became effective for the Company on January 1, 2018. The adoption of ASU 2014-09 did not have a material impact on the Company’s consolidated financial statements.
On January 1, 2018, the Company implemented ASU 2014-09, codified at ASC Topic 606. The Company adopted ASC Topic 606 using the modified retrospective transition method. As of December 31, 2017, the Company had no uncompleted customer contracts and, as a result, no cumulative transition adjustment was made during the first quarter of 2018. Results for reporting periods beginning January 1, 2018 are presented under ASC Topic 606, while prior period amounts continue to be reported under legacy U.S. GAAP.
The majority of the Company’s revenue is generated through interest earned on financial instruments, including loans, which falls outside the scope of ASC Topic 606. All of the Company’s revenue that is subject to ASC Topic 606 would be included in non-interest income; however, not all non-interest income is subject to ASC Topic 606. The Company had no contract liabilities or unsatisfied performance obligations with customers as of March 31,June 30, 2019.
Reclassifications
Certain prior year amounts have been reclassified for consistency with current period presentation.
2. Fair Value
The Company had no financial instruments measured at fair value on a recurring basis as of March 31,June 30, 2019 and December 31, 2018.
The following tables present the balances of non-financial instruments measured at fair value on a non-recurring basis as of March 31,June 30, 2019 and December 31, 2018.
| Quoted Prices | Quoted Prices | |||||||||||||||||||||||||||||||||||||||
| in Active Markets for | Significant Other | Significant | in Active Markets for | Significant Other | Significant | |||||||||||||||||||||||||||||||||||
| March 31, 2019 | Identical | Observable | Unobservable | June 30, 2019 | Identical | Observable | Unobservable | |||||||||||||||||||||||||||||||||
| Carrying | Estimated | Assets | Inputs | Inputs | Carrying | Estimated | Assets | Inputs | Inputs | |||||||||||||||||||||||||||||||
| Amount | Fair Value | Level 1 | Level 2 | Level 3 | Amount | Fair Value | Level 1 | Level 2 | Level 3 | |||||||||||||||||||||||||||||||
| Foreclosed assets | $ | 6,069 | $ | 6,069 | $ | – | $ | – | $ | 6,069 | $ | 7,964 | $ | 7,964 | $ | – | $ | – | $ | 7,964 | ||||||||||||||||||||
| Impaired assets | 2,617 | 2,617 | – | – | 2,617 | 1,663 | 1,663 | – | – | 1,663 | ||||||||||||||||||||||||||||||
| Total | $ | 8,686 | $ | 8,686 | $ | – | $ | – | $ | 8,686 | $ | 9,627 | $ | 9,627 | $ | – | $ | – | $ | 9,627 | ||||||||||||||||||||
| 9 |
| Quoted Prices | ||||||||||||||||||||
| in Active | Significant | |||||||||||||||||||
| Markets for | Other | Significant | ||||||||||||||||||
| December 31, 2018 | Identical | Observable | Unobservable | |||||||||||||||||
| Carrying | Estimated | Assets | Inputs | Inputs | ||||||||||||||||
| Amount | Fair Value | Level 1 | Level 2 | Level 3 | ||||||||||||||||
| Foreclosed assets | $ | 5,973 | $ | 5,973 | $ | – | $ | – | $ | 5,973 | ||||||||||
| Impaired assets | 2,503 | 2,503 | – | – | 2,503 | |||||||||||||||
| Total | $ | 8,476 | $ | 8,476 | $ | – | $ | – | $ | 8,476 | ||||||||||
Quoted Prices | ||||||||||||||||||||
in Active Markets for | Significant Other | Significant | ||||||||||||||||||
| December 31, 2018 | Identical | Observable | Unobservable | |||||||||||||||||
| Carrying | Estimated | Assets | Inputs | Inputs | ||||||||||||||||
| Amount | Fair Value | Level 1 | Level 2 | Level 3 | ||||||||||||||||
| Foreclosed assets | $ | 5,973 | $ | 5,973 | $ | – | $ | – | $ | 5,973 | ||||||||||
| Impaired assets | 2,503 | 2,503 | – | – | 2,503 | |||||||||||||||
| Total | $ | 8,476 | $ | 8,476 | $ | – | $ | – | $ | 8,476 | ||||||||||
The table below is a summary of fair value estimates for financial instruments and the level of the fair value hierarchy within which the fair value measurements are categorized at the periods indicated:
| Quoted Prices | ||||||||||||||||||||||||||||||||||||||||
| in Active | Significant | QuotedPrices | ||||||||||||||||||||||||||||||||||||||
| Markets for | Other | Significant | in Active Markets for | Significant Other | Significant | |||||||||||||||||||||||||||||||||||
| March 31, 2019 | Identical | Observable | Unobservable | June 30, 2019 | Identical | Observable | Unobservable | |||||||||||||||||||||||||||||||||
| Carrying | Estimated | Assets | Inputs | Inputs | Carrying | Estimated | Assets | Inputs | Inputs | |||||||||||||||||||||||||||||||
| Amount | Fair Value | Level 1 | Level 2 | Level 3 | Amount | Fair Value | Level 1 | Level 2 | Level 3 | |||||||||||||||||||||||||||||||
| Financial Assets | ||||||||||||||||||||||||||||||||||||||||
| Cash and cash equivalents | $ | 1,912 | $ | 1,912 | $ | 1,912 | $ | – | $ | – | $ | 2,153 | $ | 2,153 | $ | 2,153 | $ | – | $ | – | ||||||||||||||||||||
| Loans receivable, net | 49,991 | 49,991 | – | – | 49,991 | 50,377 | 50,377 | – | – | 50,377 | ||||||||||||||||||||||||||||||
| Accrued interest on loans | 697 | 697 | – | – | 697 | 809 | 809 | – | – | 809 | ||||||||||||||||||||||||||||||
| Financial Liabilities | ||||||||||||||||||||||||||||||||||||||||
| Customer interest escrow | 1,289 | 1,289 | – | – | 1,289 | 1,109 | 1,109 | – | – | 1,109 | ||||||||||||||||||||||||||||||
| Notes payable secured, net | 26,085 | 26,085 | – | – | 26,085 | 28,690 | 28,690 | – | – | 28,690 | ||||||||||||||||||||||||||||||
| Notes payable unsecured, net | 23,231 | 23,231 | – | – | 23,231 | 23,635 | 23,635 | – | – | 23,635 | ||||||||||||||||||||||||||||||
| Accrued interest payable | 2,098 | 2,098 | – | – | 2,098 | 2,269 | 2,269 | – | – | 2,269 | ||||||||||||||||||||||||||||||
| Quoted Prices | ||||||||||||||||||||||||||||||||||||||||
| in Active | Significant | QuotedPrices | ||||||||||||||||||||||||||||||||||||||
| Markets for | Other | Significant | in Active Markets for | Significant Other | Significant | |||||||||||||||||||||||||||||||||||
| December 31, 2018 | Identical | Observable | Unobservable | December 31, 2018 | Identical | Observable | Unobservable | |||||||||||||||||||||||||||||||||
| Carrying | Estimated | Assets | Inputs | Inputs | Carrying | Estimated | Assets | Inputs | Inputs | |||||||||||||||||||||||||||||||
| Amount | Fair Value | Level 1 | Level 2 | Level 3 | Amount | Fair Value | Level 1 | Level 2 | Level 3 | |||||||||||||||||||||||||||||||
| Financial Assets | ||||||||||||||||||||||||||||||||||||||||
| Cash and cash equivalents | $ | 1,401 | $ | 1,401 | $ | 1,401 | $ | – | $ | – | $ | 1,401 | $ | 1,401 | $ | 1,401 | $ | – | $ | – | ||||||||||||||||||||
| Loans receivable, net | 46,490 | 46,490 | – | – | 46,490 | 46,490 | 46,490 | – | – | 46,490 | ||||||||||||||||||||||||||||||
| Accrued interest on loans | 568 | 568 | – | – | 568 | 568 | 568 | – | – | 568 | ||||||||||||||||||||||||||||||
| Financial Liabilities | ||||||||||||||||||||||||||||||||||||||||
| Customer interest escrow | 939 | 939 | – | – | 939 | 939 | 939 | – | – | 939 | ||||||||||||||||||||||||||||||
| Notes payable secured, net | 23,258 | 23,258 | – | – | 23,258 | 23,258 | 23,258 | – | – | 23,258 | ||||||||||||||||||||||||||||||
| Notes payable unsecured, net | 22,635 | 22,635 | – | – | 22,635 | 22,635 | 22,635 | – | – | 22,635 | ||||||||||||||||||||||||||||||
| Accrued interest payable | 2,140 | 2,140 | – | – | 2,140 | 2,140 | 2,140 | – | – | 2,140 | ||||||||||||||||||||||||||||||
| 10 |
3. Financing Receivables
Financing receivables are comprised of the following as of March 31,June 30, 2019 and December 31, 2018:
| March 31, 2019 | December 31, 2018 | |||||||
| Loans receivable, gross | $ | 52,931 | $ | 49,127 | ||||
| Less: Deferred loan fees | (1,303 | ) | (1,249 | ) | ||||
| Less: Deposits | (1,707 | ) | (1,510 | ) | ||||
| Plus: Deferred origination costs | 303 | 308 | ||||||
| Less: Allowance for loan losses | (233 | ) | (186 | ) | ||||
| Loans receivable, net | $ | 49,991 | $ | 46,490 | ||||
June 30, 2019 | December 31, 2018 | |||||||
| Loans receivable, gross | $ | 52,960 | $ | 49,127 | ||||
| Less: Deferred loan fees | (1,095 | ) | (1,249 | ) | ||||
| Less: Deposits | (1,517 | ) | (1,510 | ) | ||||
| Plus: Deferred origination costs | 243 | 308 | ||||||
| Less: Allowance for loan losses | (214 | ) | (186 | ) | ||||
| Loans receivable, net | $ | 50,377 | $ | 46,490 | ||||
Commercial Construction and Development Loans
Commercial Loans – Construction Loan Portfolio Summary
As of March 31,June 30, 2019, the Company’s portfolio consisted of 289246 commercial construction and sevennine development loans with 7567 borrowers in 2120 states.
The following is a summary of the loan portfolio to builders for home construction loans as of March 31,June 30, 2019 and December 31, 2018:
| Year | Number of States | Number of Borrowers | Number of Loans | Value of Collateral(1) | Commitment Amount | Gross Amount Outstanding | Loan to Value Ratio(2) | Loan Fee | Number of States | Number of Borrowers | Number of Loans | Value of Collateral(1) | Commitment Amount | Gross Amount Outstanding | Loan to Value Ratio(2) | Loan Fee | ||||||||||||||||||||||||||||||||||||||||||||||||||
| 2019 | 21 | 75 | 289 | $ | 111,976 | $ | 75,343 | $ | 46,662 | 67 | %(3) | 5 | % | 20 | 67 | 246 | $ | 100,556 | $ | 68,427 | $ | 45,514 | 68 | %(3) | 5 | % | ||||||||||||||||||||||||||||||||||||||||
| 2018 | 18 | 75 | 259 | 102,808 | 68,364 | 43,107 | 67 | %(3) | 5 | % | 18 | 75 | 259 | 102,808 | 68,364 | 43,107 | 67 | %(3) | 5 | % | ||||||||||||||||||||||||||||||||||||||||||||||
| (1) | The value is determined by the appraised value. |
| (2) | The loan to value ratio is calculated by taking the commitment amount and dividing by the appraised value. |
| (3) | Represents the weighted average loan to value ratio of the loans. |
Commercial Loans – Real Estate Development Loan Portfolio Summary
The following is a summary of our loan portfolio to builders for land development as of March 31,June 30, 2019 and December 31, 2018:
| Year | Number of States | Number of Borrowers | Number of | Gross Value of | Commitment Amount(2) | Gross Amount Outstanding | Loan to Value Ratio(3) | Loan Fee | Number of States | Number of Borrowers | Number of Loans | Gross Value of | Commitment Amount(2) | Gross Amount Outstanding | Loan to Value Ratio(3) | Loan Fee | ||||||||||||||||||||||||||||||||||||||||||||||||||
| 2019 | 3 | 3 | 7 | $ | 11,564 | $ | 8,010 | $ | 6,269 | 54 | % | $ | 1,000 | 4 | 5 | 9 | $ | 12,635 | $ | 8,444 | $ | 7,446 | 59 | % | $ | 1,000 | ||||||||||||||||||||||||||||||||||||||||
| 2018 | 3 | 4 | 9 | 10,134 | 7,456 | 6,020 | 59 | % | 1,000 | 3 | 4 | 9 | 10,134 | 7,456 | 6,020 | 59 | % | 1,000 | ||||||||||||||||||||||||||||||||||||||||||||||||
| (1) | The value is determined by the appraised value adjusted for remaining costs to be paid. A portion of this collateral is |
| (2) | The commitment amount does not include letters of credit and cash bonds. |
| (3) | The loan to value ratio is calculated by taking the outstanding amount and dividing by the appraised value calculated as described above. |
| 11 |
Credit Quality Information
The following tables present credit-related information at the “class” level in accordance with FASB ASC 310-10-50, “Disclosures about the Credit Quality of Finance Receivables and the Allowance for Credit Losses.” See our 2018 Form 10-K, as filed with the SEC, for more information.
Gross finance receivables – By risk rating:
| March 31, 2019 | December 31, 2018 | June 30, 2019 | December 31, 2018 | |||||||||||||
| Pass | $ | 47,941 | $ | 43,402 | $ | 49,916 | $ | 43,402 | ||||||||
| Special mention | 2,373 | 3,222 | 1,381 | 3,222 | ||||||||||||
| Classified – accruing | – | – | – | – | ||||||||||||
| Classified – nonaccrual | 2,617 | 2,503 | 1,663 | 2,503 | ||||||||||||
| Total | $ | 52,931 | $ | 49,127 | $ | 52,960 | $ | 49,127 | ||||||||
Gross finance receivables – Method of impairment calculation:
| March 31, 2019 | December 31, 2018 | June 30, 2019 | December 31, 2018 | |||||||||||||
| Performing loans evaluated individually | $ | 20,882 | $ | 19,037 | $ | 22,147 | $ | 19,037 | ||||||||
| Performing loans evaluated collectively | 29,432 | 27,587 | 27,769 | 27,587 | ||||||||||||
| Non-performing loans without a specific reserve | 2,311 | 2,204 | 1,381 | 2,204 | ||||||||||||
| Non-performing loans with a specific reserve | 306 | 299 | 1,663 | 299 | ||||||||||||
| Total evaluated collectively for loan losses | $ | 52,931 | $ | 49,127 | $ | 52,960 | $ | 49,127 | ||||||||
As March 31,June 30, 2019 and December 31, 2018, there were no loans acquired with deteriorated credit quality.
Impaired Loans
The following is a summary of our impaired nonaccrual commercial construction loans as of March 31,June 30, 2019 and December 31, 2018.
| March 31, 2019 | December 31, 2018 | |||||||
| Unpaid principal balance (contractual obligation from customer) | $ | 2,617 | $ | 2,503 | ||||
| Charge-offs and payments applied | - | - | ||||||
| Gross value before related allowance | 2,617 | 2,503 | ||||||
| Related allowance | (29 | ) | (20 | ) | ||||
| Value after allowance | $ | 2,588 | $ | 2,483 | ||||
| June 30, 2019 | December 31, 2018 | |||||||
| Unpaid principal balance (contractual obligation from customer) | $ | 1,663 | $ | 2,503 | ||||
| Charge-offs and payments applied | - | - | ||||||
| Gross value before related allowance | 1,663 | 2,503 | ||||||
| Related allowance | (7 | ) | (20 | ) | ||||
| Value after allowance | $ | 1,656 | $ | 2,483 | ||||
Concentrations
Financial instruments that potentially subject the Company to concentrations of credit risk consist principally of loans receivable. Our concentration risks for our top three customers listed by geographic real estate market are summarized in the table below:
| March 31, 2019 | December 31, 2018 | |||||||||||
| Percent of | Percent of | |||||||||||
| Borrower | Loan | Borrower | Loan | |||||||||
| City | Commitments | City | Commitments | |||||||||
| Highest concentration risk | Pittsburgh, PA | 23 | % | Pittsburgh, PA | 23 | % | ||||||
| Second highest concentration risk | Orlando, FL | 13 | % | Orlando, FL | 13 | % | ||||||
| Third highest concentration risk | Cape Coral, FL | 4 | % | Cape Coral, FL | 4 | % | ||||||
| 12 |
| June 30, 2019 | December 31, 2018 | |||||||||||
| Percent of | Percent of | |||||||||||
| Borrower | Loan | Borrower | Loan | |||||||||
| City | Commitments | City | Commitments | |||||||||
| Highest concentration risk | Pittsburgh, PA | 25 | % | Pittsburgh, PA | 23 | % | ||||||
| Second highest concentration risk | Orlando, FL | 15 | % | Orlando, FL | 13 | % | ||||||
| Third highest concentration risk | Cape Coral, FL | 4 | % | Cape Coral, FL | 4 | % | ||||||
4. Foreclosed Assets
The following table is a roll forward of foreclosed assets:
Three Months Ended March 31, 2019 | Year Ended December 31, 2018 | Three Months Ended March 31, 2018 | ||||||||||
| Beginning balance | $ | 5,973 | $ | 1,036 | $ | 1,036 | ||||||
| Additions from loans | - | 4,738 | - | |||||||||
| Additions for construction/development | 176 | 1,608 | 48 | |||||||||
| Sale proceeds | - | (809 | ) | - | ||||||||
| Gain on sale | - | - | - | |||||||||
| Loss on sale | - | (103 | ) | - | ||||||||
| Gain on foreclosure | - | 19 | - | |||||||||
| Loss on foreclosure | - | (47 | ) | - | ||||||||
| Impairment loss on foreclosed assets | (80 | ) | (468 | ) | (5 | ) | ||||||
| Ending balance | $ | 6,069 | $ | 5,973 | $ | 1,079 | ||||||
Six Months June 30, 2019 | Year Ended December 31, 2018 | Six Months June 30, 2018 | ||||||||||
| Beginning balance | $ | 5,973 | $ | 1,036 | $ | 1,036 | ||||||
| Additions from loans | 1,716 | 4,737 | 4,140 | |||||||||
| Additions for construction/development | 456 | 1,608 | 545 | |||||||||
| Sale proceeds | - | (809 | ) | - | ||||||||
| Gain on sale | - | - | - | |||||||||
| Loss on sale | - | (103 | ) | - | ||||||||
| Gain on foreclosure | 95 | 19 | - | |||||||||
| Loss on foreclosure | (169 | ) | (47 | ) | - | |||||||
| Impairment loss on foreclosed assets | (107 | ) | (468 | ) | (85 | ) | ||||||
| Ending balance | $ | 7,964 | $ | 5,973 | $ | 5,636 | ||||||
5. Borrowings
The following table displays our borrowings and a ranking of priority:
| Priority Rank | March 31, 2019 | December 31, 2018 | Priority Rank | June 30, 2019 | December 31, 2018 | |||||||||||||||||
| Borrowing Source | ||||||||||||||||||||||
| Purchase and sale agreements and other secured borrowings | 1 | $ | 25,382 | $ | 22,521 | 1 | $ | 28,086 | $ | 22,521 | ||||||||||||
| Secured lines of credit from affiliates | 2 | 758 | 816 | 2 | 633 | 816 | ||||||||||||||||
| Unsecured line of credit (senior) | 3 | 500 | 500 | 3 | 500 | 500 | ||||||||||||||||
| Other unsecured debt (senior subordinated) | 4 | 1,008 | 1,008 | 4 | 1,008 | 1,008 | ||||||||||||||||
| Unsecured notes through our public offering, gross | 5 | 18,831 | 17,348 | 5 | 19,241 | 17,348 | ||||||||||||||||
| Other unsecured debt (subordinated) | 5 | 2,756 | 3,401 | 5 | 2,756 | 3,401 | ||||||||||||||||
| Other unsecured debt (junior subordinated) | 6 | 590 | 590 | 6 | 590 | 590 | ||||||||||||||||
| Total | $ | 49,825 | $ | 46,184 | $ | 52,814 | $ | 46,184 | ||||||||||||||
| 13 |
The following table shows the maturity of outstanding debt as of March 31,June 30, 2019:
| Year Maturing | Total Amount Maturing | Public Offering | Other Unsecured | Secured Borrowings | Total Amount Maturing | Public Offering | Other Unsecured | Secured Borrowings | ||||||||||||||||||||||||
| 2019 | $ | 32,914 | $ | 5,521 | $ | 1,887 | $ | 25,506 | $ | 33,894 | $ | 3,921 | $ | 1,887 | $ | 28,086 | ||||||||||||||||
| 2020 | 5,073 | 4,006 | 1,052 | 15 | 5,642 | 4,575 | 1,052 | 15 | ||||||||||||||||||||||||
| 2021 | 7,202 | 7,187 | - | 15 | 8,075 | 8,059 | - | 16 | ||||||||||||||||||||||||
| 2022 | 3,841 | 2,079 | 1,746 | 16 | 3,842 | 2,080 | 1,746 | 16 | ||||||||||||||||||||||||
| 2023 and thereafter | 795 | 38 | 169 | 588 | 1,361 | 606 | 169 | 586 | ||||||||||||||||||||||||
| Total | $ | 49,825 | $ | 18,831 | $ | 4,854 | $ | 26,140 | $ | 52,814 | $ | 19,241 | $ | 4,854 | $ | 28,719 | ||||||||||||||||
Secured Borrowings
New Lines of Credit
During the quarter ended June 30, 2019, we entered into three line of credit agreements (the “New LOC Agreements”). Pursuant to the New LOC Agreements, the lenders provide us with revolving lines of credit with the following terms:
| ● | Principal not to exceed $2,250; | |
| ● | Secured with assignments of certain notes and mortgages; and | |
| ● | Terms allow the lenders to give one month notice after which the principal balance of a New LOC Agreement will reduce to a zero over the next six months. |
Interest expense was $30 for both the quarter and six months ended June 30, 2019.
| 14 |
Lines of Credit from Affiliates
As of March 31,June 30, 2019, the Company had borrowed $758$633 on its lines of credit from affiliates, which have a total limit of $2,500.
Deferred Financing Cost
The following is a roll forward of secured deferred financing costs:
| Three Months | Year | Three Months | ||||||||||
| Ended | Ended | Ended | ||||||||||
| March 31, 2019 | December 31, 2018 | March 31, 2018 | ||||||||||
| Deferred financing costs, beginning balance | $ | 104 | $ | – | $ | – | ||||||
| Additions | – | 104 | 5 | |||||||||
| Deferred financing costs, ending balance | $ | 104 | $ | 104 | $ | 5 | ||||||
| Less accumulated amortization | (50 | ) | (25 | ) | – | |||||||
| Deferred financing costs, net | $ | 54 | $ | 79 | $ | 5 | ||||||
Six MonthsEnded June 30, 2019 | Year Ended December 31, 2018 | Six Months Ended June 30, 2018 | ||||||||||
| Deferred financing costs, beginning balance | $ | 104 | $ | – | $ | – | ||||||
| Additions | – | 104 | – | |||||||||
| Deferred financing costs, ending balance | $ | 104 | $ | 104 | $ | – | ||||||
| Less accumulated amortization | (75 | ) | (25 | ) | – | |||||||
| Deferred financing costs, net | $ | 29 | $ | 79 | $ | – | ||||||
Summary
Borrowings secured by loan assets are summarized below:
| March 31, 2019 | December 31, 2018 | June 30, 2019 | December 31, 2018 | |||||||||||||||||||||||||||||
| Due from | Due from | Due from | Due from | |||||||||||||||||||||||||||||
Book Value of Loans which | Shepherd’s Finance to Loan | Book Value of Loans which | Shepherd’s Finance to Loan | Book Value of Loans which | Shepherd’s Finance to Loan | Book Value of Loans which | Shepherd’s Finance to Loan | |||||||||||||||||||||||||
| Served as Collateral | Purchaser or Lender | Served as Collateral | Purchaser or Lender | Served as Collateral | Purchaser or Lender | Served as Collateral | Purchaser or Lender | |||||||||||||||||||||||||
| Loan Purchaser | ||||||||||||||||||||||||||||||||
| Builder Finance, Inc. | $ | 9,578 | $ | 6,254 | $ | 8,742 | $ | 5,294 | $ | 10,615 | $ | 6,697 | $ | 8,742 | $ | 5,294 | ||||||||||||||||
| S.K. Funding, LLC | 12,693 | 6,907 | 11,788 | 6,408 | 12,640 | 6,922 | 11,788 | 6,408 | ||||||||||||||||||||||||
| Lender | ||||||||||||||||||||||||||||||||
| Stephen K. Shuman | 1,855 | 1,325 | 2,051 | 1,325 | 1,774 | 1,325 | 2,051 | 1,325 | ||||||||||||||||||||||||
| Jeff Eppinger | 1,893 | 1,000 | - | - | ||||||||||||||||||||||||||||
| Hardy Enterprises, Inc. | 1,797 | 1,000 | - | - | ||||||||||||||||||||||||||||
| Gary Zentner | 791 | 250 | - | - | ||||||||||||||||||||||||||||
| Paul Swanson | 9,476 | 7,000 | 8,079 | 5,986 | 10,264 | 7,000 | 8,079 | 5,986 | ||||||||||||||||||||||||
| Total | $ | 33,602 | $ | 21,486 | $ | 30,660 | $ | 19,013 | $ | 39,774 | $ | 24,194 | $ | 30,660 | $ | 19,013 | ||||||||||||||||
Unsecured Borrowings
Unsecured Notes through the Public Offering (“Notes Program”)
On March 22, 2019, the Company terminated its second public offering and commenced its third public offering of fixed rate subordinated notes (the “Notes”). The effective interest rate on borrowings through our Notes Program at March 31,June 30, 2019 and December 31, 2018 was 10.09%10.15% and 10.07%, respectively, not including the amortization of deferred financing costs. There are limited rights of early redemption. We generally offer four durations at any given time, ranging from 12 to 48 months from the date of issuance. The following table shows the roll forward of our Notes Program:
| Three Months Ended March 31, 2019 | Year Ended December 31, 2018 | Three Months Ended March 31, 2018 | Six Months Ended June 30, 2019 | Year Ended December 31, 2018 | Six Months Ended June 30, 2018 | |||||||||||||||||||
| Gross Notes outstanding, beginning of period | $ | 17,348 | $ | 14,121 | $ | 14,121 | $ | 17,348 | $ | 14,121 | $ | 14,121 | ||||||||||||
| Notes issued | 3,532 | 9,645 | 1,309 | 5,818 | 9,645 | 3,350 | ||||||||||||||||||
| Note repayments / redemptions | (2,049 | ) | (6,418 | ) | (1,645 | ) | (3,925 | ) | (6,418 | ) | (2,197 | ) | ||||||||||||
| Gross Notes outstanding, end of period | $ | 18,831 | $ | 17,348 | $ | 13,785 | $ | 19,241 | $ | 17,348 | $ | 15,274 | ||||||||||||
| Less deferred financing costs, net | 454 | 212 | 267 | 460 | 212 | 252 | ||||||||||||||||||
| Notes outstanding, net | $ | 18,377 | $ | 17,136 | $ | 13,518 | $ | 18,781 | $ | 17,136 | $ | 15,022 | ||||||||||||
The following is a roll forward of deferred financing costs:
| Three Months | Year | Three Months | ||||||||||
| Ended | Ended | Ended | ||||||||||
| March 31, 2019 | December 31, 2018 | March 31, 2018 | ||||||||||
| Deferred financing costs, beginning balance | $ | 1,212 | $ | 1,102 | $ | 1,102 | ||||||
| Additions | 282 | 117 | 29 | |||||||||
| Disposals | – | (7 | ) | – | ||||||||
| Deferred financing costs, ending balance | 1,494 | 1,212 | 1,131 | |||||||||
| Less accumulated amortization | (1,040 | ) | (1,000 | ) | (864 | ) | ||||||
| Deferred financing costs, net | $ | 454 | $ | 212 | $ | 267 | ||||||
Six Months Ended June 30, 2019 | Year Ended December 31, 2018 | Six Months Ended June 30, 2018 | ||||||||||
| Deferred financing costs, beginning balance | $ | 1,212 | $ | 1,102 | $ | 1,102 | ||||||
| Additions | 331 | 117 | 61 | |||||||||
| Disposals | - | (7 | ) | - | ||||||||
| Deferred financing costs, ending balance | 1,543 | 1,212 | 1,163 | |||||||||
| Less accumulated amortization | (1,083 | ) | (1,000 | ) | (911 | ) | ||||||
| Deferred financing costs, net | $ | 460 | $ | 212 | $ | 252 | ||||||
The following is a roll forward of the accumulated amortization of deferred financing costs:
| Three Months | Year | Three Months | ||||||||||||||||||||||
| Ended | Ended | Ended | ||||||||||||||||||||||
| March 31, 2019 | December 31, 2018 | March 31, 2018 | Six Months Ended June 30, 2019 | Year Ended December 31, 2018 | Six Months June 30, 2018 | |||||||||||||||||||
| Accumulated amortization, beginning balance | $ | 1,000 | $ | 816 | $ | 816 | $ | 1,000 | $ | 816 | $ | 816 | ||||||||||||
| Additions | 40 | 184 | 48 | 83 | 184 | 95 | ||||||||||||||||||
| Accumulated amortization, ending balance | $ | 1,040 | $ | 1,000 | $ | 864 | $ | 1,083 | $ | 1,000 | $ | 911 | ||||||||||||
Other Unsecured Debts, net
Our other unsecured debts are detailed below:
| Maturity | Interest | Principal Amount Outstanding as of | Principal Amount Outstanding as of | |||||||||||||||||||||||||
| Loan | Date | Rate(1) | March 31, 2019 | December 31, 2018 | Maturity Date | Interest Rate(1) | June 30, 2019 | December 31, 2018 | ||||||||||||||||||||
| Unsecured Note with Seven Kings Holdings, Inc. | Demand(2) | 9.5 | % | $ | 500 | $ | 500 | Demand(2) | 9.5 | % | $ | 500 | $ | 500 | ||||||||||||||
| Unsecured Line of Credit from Builder Finance, Inc. | January 2020 | 10.0 | % | 500 | 500 | January 2020 | 10.0 | % | 500 | 500 | ||||||||||||||||||
| Unsecured Line of Credit from Paul Swanson | March 2019 | 10.0 | % | - | 1,014 | July 2019 | 10.0 | % | - | 1,014 | ||||||||||||||||||
| Subordinated Promissory Note | September 2019 | 9.5 | % | 1,125 | 1,125 | September 2019 | 9.5 | % | 1,125 | 1,125 | ||||||||||||||||||
| Subordinated Promissory Note | December 2019 | 10.5 | % | 113 | 113 | December 2019 | 10.5 | % | 113 | 113 | ||||||||||||||||||
| Subordinated Promissory Note | April 2020 | 10.0 | % | 100 | 100 | April 2020 | 10.0 | % | 100 | 100 | ||||||||||||||||||
| Subordinated Promissory Notes | October 2019 | 10.0 | % | 150 | 150 | October 2019 | 10.0 | % | 150 | 150 | ||||||||||||||||||
| Subordinated Promissory Note | August 2022 | 11.0 | % | 200 | - | August 2022 | 11.0 | % | 200 | - | ||||||||||||||||||
| Subordinated Promissory Note | September 2020(6) | 11.0 | % | 168 | - | September 2020(6) | 11.0 | % | 169 | - | ||||||||||||||||||
| Senior Subordinated Promissory Note | March 2022(3) | 10.0 | % | 400 | 400 | March 2022(3) | 10.0 | % | 400 | 400 | ||||||||||||||||||
| Senior Subordinated Promissory Note | March 2022(4) | 1.0 | % | 728 | 728 | March 2022(4) | 1.0 | % | 728 | 728 | ||||||||||||||||||
| Junior Subordinated Promissory Note | March 2022(4) | 22.5 | % | 417 | 417 | March 2022(4) | 22.5 | % | 417 | 417 | ||||||||||||||||||
| Senior Subordinated Promissory Note | October 2020(5) | 1.0 | % | 279 | 279 | October 2020(5) | 1.0 | % | 279 | 279 | ||||||||||||||||||
| Junior Subordinated Promissory Note | October 2020(5) | 20.0 | % | 173 | 173 | October 2020(5) | 20.0 | % | 173 | 173 | ||||||||||||||||||
| $ | 4,853 | $ | 5,499 | $ | 4,854 | $ | 5,499 | |||||||||||||||||||||
(1)Interest rate per annum, based upon actual days outstanding and a 365/366-day year.
(2)Due six months after lender gives notice.
(3)Lender may require us to repay $20 of principal and all unpaid interest with 10 days’ notice.
(4)These notes were issued to the same holder and, when calculated together, yield a blended return of 11% per annum.
(5)These notes were issued to the same holder and, when calculated together, yield a blended return of 10% per annum.
(6)Due one month after lender gives notice, which notice may not be given prior to August 1, 2020.
6. Redeemable Preferred Equity
The following is a roll forward of our Series C cumulative preferred equity (“Series C Preferred Units”):
Three Months Ended March 31, 2019 | Year Ended December 31, 2018 | Three Months Ended March 31, 2018 | Six Months Ended June 30, 2019 | Year Ended December 31, 2018 | Six Months Ended June 30, 2018 | |||||||||||||||||||
| Beginning balance | $ | 2,385 | $ | 1,097 | $ | 1,097 | $ | 2,385 | $ | 1,097 | $ | 1,097 | ||||||||||||
| Additions from new investment | - | 2,300 | - | 200 | 2,300 | – | ||||||||||||||||||
| Redemptions | - | 1,177 | - | (18) | (1,177 | ) | – | |||||||||||||||||
| Additions from reinvestment | 72 | 165 | 33 | 148 | 165 | 68 | ||||||||||||||||||
| Ending balance | $ | 2,457 | $ | 2,385 | $ | 1,130 | $ | 2,715 | $ | 2,385 | $ | 1,165 | ||||||||||||
The following table shows the earliest redemption options for investors in our Series C Preferred Units as of March 31,June 30, 2019:
| Year of Available Redemption | Total Amount Redeemable | Total Amount Redeemable | ||||||
| 2024 | $ | 2,457 | $ | 2,515 | ||||
| 2025 | 200 | |||||||
| Total | $ | 2,457 | $ | 2,715 | ||||
7. Members’ Capital
There are currently two classes of equity units outstanding that the Company classifies as Members’ Capital: Class A common units (“Class A Common Units”) and Series B cumulative preferred units (“Series B Preferred Units”). As of March 31,June 30, 2019, the Class A Common Units are held by eightsix members, all of whom have no personal liability. All Class A common members have voting rights in proportion to their capital account. There were 2,629 Class A Common Units outstanding at both March 31,June 30, 2019 and December 31, 2018.
The Series B Preferred Units were issued to the Hoskins Group through a reduction in a loan issued by the Hoskins Group to the Company. In December 2015, the Hoskins Group agreed to purchase 0.1 Series B Preferred Units for $10 at each closing of a lot to a third party in the Hamlet’s and Tuscany subdivision.subdivisions. As of March 31,June 30, 2019, the Hoskins Group owns a total of 13.814.2 Series B Preferred Units, which were issued for a total of $1,380.$1,420.
8. Related Party Transactions
As of March 31,June 30, 2019, the Company had $1,108,$1,115, $250, and $384$501 available to borrow against the line of credit from Daniel M. Wallach (our Chief Executive Officer and chairman of the board of managers) and his wife, the line of credit from the 2007 Daniel M. Wallach Legacy Trust, and the line of credit from William Myrick (our Executive Vice President of Sales), respectively. A more detailed description is included in Note 6 of our 2018 Financial Statements. These borrowings are in notes payable secured, net of deferred financing costs on the interim condensed consolidated balance sheet.
9. Commitments and Contingencies
Unfunded commitments to extend credit, which have similar collateral, credit risk, and market risk to our outstanding loans, were $30,422$22,911 and $25,258 at March 31,June 30, 2019 and December 31, 2018, respectively.
10. Selected Quarterly Condensed Consolidated Financial Data (Unaudited)
Summarized unaudited quarterly condensed consolidated financial data for the quarters of 2019 and 2018 are as follows:
| Quarter 1 | Quarter 4 | Quarter 3 | Quarter 2 | Quarter 1 | ||||||||||||||||
| 2019 | 2018 | 2018 | 2018 | 2018 | ||||||||||||||||
| Net interest income after loan loss provision | $ | 1,079 | $ | 914 | $ | 783 | $ | 876 | $ | 806 | ||||||||||
| Non-interest income | – | (1 | ) | 20 | – | – | ||||||||||||||
| SG&A expense | 624 | 403 | 559 | 571 | 497 | |||||||||||||||
| Depreciation and amortization | 23 | 21 | 23 | 21 | 17 | |||||||||||||||
| Loss on sale of foreclosed assets | – | 100 | 3 | – | – | |||||||||||||||
| Impairment loss on foreclosed assets | 80 | 379 | 51 | 80 | 5 | |||||||||||||||
| Net income | $ | 352 | $ | 10 | $ | 167 | $ | 204 | $ | 287 | ||||||||||
Quarter 2 | Quarter 1 | Quarter 4 | Quarter 3 | Quarter 2 | Quarter 1 | |||||||||||||||||||
| 2019 | 2019 | 2018 | 2018 | 2018 | 2018 | |||||||||||||||||||
| Net Interest Income after Loan Loss Provision | $ | 818 | $ | 1,079 | $ | 914 | $ | 783 | $ | 876 | $ | 806 | ||||||||||||
| Non-Interest Income | 95 | – | (1 | ) | 20 | – | – | |||||||||||||||||
| SG&A Expense | 620 | 624 | 403 | 559 | 571 | 497 | ||||||||||||||||||
| Depreciation and Amortization | 22 | 23 | 21 | 23 | 21 | 17 | ||||||||||||||||||
| Loss on Sale of Foreclosed Assets | – | – | 100 | 3 | – | – | ||||||||||||||||||
| Loss on Foreclosure of Assets | 169 | – | – | – | – | – | ||||||||||||||||||
| Impairment Loss on Foreclosed Assets | 27 | 80 | 379 | 51 | 80 | 5 | ||||||||||||||||||
| Net Income | $ | 75 | $ | 352 | $ | 10 | $ | 167 | $ | 204 | $ | 287 | ||||||||||||
11. Non-Interest expense detailExpense Detail
The following table displays our selling, general and administrative (“SG&A”) expenses:
For the Three Months Ended March 31, | For the Six Months Ended June 30, | |||||||||||||||
| 2019 | 2018 | 2019 | 2018 | |||||||||||||
| Selling, general and administrative expenses | ||||||||||||||||
| Legal and accounting | $ | 127 | $ | 143 | $ | 174 | $ | 223 | ||||||||
| Salaries and related expenses | 362 | 236 | 784 | 593 | ||||||||||||
| Board related expenses | 16 | 22 | 41 | 37 | ||||||||||||
| Advertising | 19 | 17 | 50 | 35 | ||||||||||||
| Rent and utilities | 9 | 10 | 25 | 20 | ||||||||||||
| Loan and foreclosed asset expenses | 20 | 8 | 47 | 38 | ||||||||||||
| Travel | 32 | 23 | 46 | 51 | ||||||||||||
| Other | 39 | 38 | 77 | 71 | ||||||||||||
| Total SG&A | $ | 624 | $ | 497 | $ | 1,244 | $ | 1,068 | ||||||||
12. Subsequent Events
Management of the Company has evaluated subsequent events through May 9,August 14, 2019, the date these interim condensed consolidated financial statements were issued.
In AprilOn August 1, 2019, the Companywe sold one loan to our Executive Vice President of Sales at its gross loans receivable balance of $214, and as such, no gain or loss was recognized on the sale. The purchase price was funded throughforeclosed asset for $4,800 with a reduction in the principal balance of the line$4,817 which resulted in a loss of credit extended by the Executive Vice President of Sales to the Company.
In April 2019, we entered into a line of credit agreement Jeffrey Eppinger which provides us with a revolving line of credit with the following terms:
In April 2019, the Company signed an unsecured promissory note for $500 at a rate of 10% with Paul Swanson. The outstanding principal balance together with all accrued and unpaid interest is due in July 2019.approximately $274.
| ITEM 2. | MANAGEMENT’S DISCUSSION AND ANALYSIS OF FINANCIAL CONDITION AND RESULTS OF OPERATIONS |
(All dollar [$] amounts shown in thousands.)
The following Management’s Discussion and Analysis of Financial Condition and Results of Operations should be read in conjunction with our interim condensed consolidated financial statements and the notes thereto contained elsewhere in this report. The following Management’s Discussion and Analysis of Financial Condition and Results of Operations should also be read in conjunction with our audited annual consolidated financial statements and related notes and other consolidated financial data (the “20182018 Financial Statements”)Statements) included in the Company’s Annual Report on Form 10-K for the year ended December 31, 2018 (the “20182018 Form 10-K”)10-K). See also “Cautionary Note Regarding Forward-Looking Statements” preceding Part I.
Overview
Net income for the first quarter and six months ended June 30, 2019 decreased by $129 and $64, respectively, when compared to the same period of 2018. The decrease in net income was mainly due to an increase in loss and impairment of foreclosure of $116 and $191, respectively, for the quarter and six months ended June 30, 2019, which was offset by a gain on foreclosure of $95 for both the quarter and six months ended June 30, 2019. We reclassified 18 construction loan assets from loan assets, net to foreclosed assets during the quarter ended June 30, 2019 which resulted in a gain of $95 on five loans and a loss of $169 on 13 loans. The 18 loans had total outstanding balances of $1,432 and were to one customer who died.
| 19 |
In addition, loan loss provision increased by $65 when$132 and $139 for both the quarter and six months ended June 30, 2019 compared to the same period of 2018. The increase in net incomeloan loss provision was mainlyprimarily due to the sale of an increaseimpaired asset which resulted in net interest incomea loss of $280, partially offset by increases in loan loss reserve and impairment of $82 and selling, general and administrative (“SG&A”) expenses of $127. As of March 31, 2019, we had a total of 19 employees compared to 17 at March 31, 2018.
$124.
We had $49,991$50,377 and $46,490 in loan assets as of March 31,June 30, 2019 and December 31, 2018, respectively. In addition, as of March 31,June 30, 2019, we had 289246 construction loans in 2120 states with 7567 borrowers and sevennine development loans in three states with threefour borrowers.
Cash provided by operations increased $1,088$454 for threesix months ended March 31,June 30, 2019 as compared to the same period of 2018. Our increase in operating cash flow was due primarily to higher loan originations.
Loan originations increased by $3,024 or 19% to $18,981 for the quarter ended March 31, 2019 compared to the same period of 2018.interest escrows.
Critical Accounting Estimates
To assist in evaluating our interim condensed consolidated financial statements, we describe below the critical accounting estimates that we use. We consider an accounting estimate to be critical if: (1) the accounting estimate requires us to make assumptions about matters that were highly uncertain at the time the accounting estimate was made, and (2) changes in the estimate that are reasonably likely to occur from period to period, or use of different estimates that we reasonably could have used, would have a material impact on our consolidated financial condition or results of operations. See our 2018 Form 10-K, as filed with the SEC, for more information on our critical accounting estimates. No material changes to our critical accounting estimates have occurred since December 31, 2018 unless listed below.
Loan Losses
Fair value of collateral has the potential to impact the calculation of the loan loss provision (the amount we have expensed over time in anticipation of loan losses we have not yet realized). Specifically, relevant to the allowance for loan loss reserve is the fair value of the underlying collateral supporting the outstanding loan balances. Fair value measurements are an exit price, representing the amount that would be received to sell an asset or paid to transfer a liability in an orderly transaction between market participants. Due to a rapidly changing economic market, an erratic housing market, the various methods that could be used to develop fair value estimates, and the various assumptions that could be used, determining the collateral’s fair value requires significant judgment.
| March 31, 2019 | June 30, 2019 | |||||||
| Loan Loss | Loan Loss | |||||||
| Provision | Provision | |||||||
| Change in Fair Value Assumption | Higher/(Lower) | Higher/(Lower) | ||||||
| Increasing fair value of the real estate collateral by 35%* | $ | - | $ | - | ||||
| Decreasing fair value of the real estate collateral by 35%** | $ | (1,881 | ) | $ | (1,683 | ) | ||
* Increases in the fair value of the real estate collateral do not impact the loan loss provision, as the value generally is not “written up.”
** Assumes the loans were nonperforming and a book amount of the loans outstanding of $49,991.$50,229.
| 20 |
Foreclosed Assets
The fair value of real estate will impact our foreclosed asset value, which is recorded at 100% of fair value (after selling costs are deducted).
| March 31, 2019 | June 30, 2019 | |||||||
| Foreclosed | Foreclosed | |||||||
| Assets | Assets | |||||||
| Change in Fair Value Assumption | Higher/(Lower) | Higher/(Lower) | ||||||
| Increasing fair value of the foreclosed asset by 35%* | $ | - | $ | - | ||||
| Decreasing fair value of the foreclosed asset by 35%** | $ | (2,124 | ) | $ | (2,787 | ) | ||
* Increases in the fair value of the foreclosed assets do not impact the carrying value, as the value generally is not “written up.” Those gains would be recognized at the sale of the asset.
** Assumes a book amount of the foreclosed assets of $6,069.$7,964.
Consolidated Results of Operations
Key financial and operating data for the three and six months ended March 31,June 30, 2019 and 2018 are set forth below. For a more complete understanding of our industry, the drivers of our business, and our current period results, this discussion should be read in conjunction with our interim condensed consolidated financial statements, including the related notes and the other information contained in this document.
| Three Months Ended | Three Months Ended | Six Months Ended | ||||||||||||||||||||||
| March 31, | June 30, | June 30, | ||||||||||||||||||||||
| 2019 | 2018 | 2019 | 2018 | 2019 | 2018 | |||||||||||||||||||
| Interest Income | ||||||||||||||||||||||||
| Interest and fee income on loans | $ | 2,432 | $ | 1,707 | $ | 2,454 | $ | 1,925 | $ | 4,886 | $ | 3,632 | ||||||||||||
| Interest expense: | ||||||||||||||||||||||||
| Interest related to secured borrowings | 681 | 411 | 769 | 517 | 1,450 | 928 | ||||||||||||||||||
| Interest related to unsecured borrowings | 625 | 450 | 716 | 513 | 1,341 | 963 | ||||||||||||||||||
| Interest expense | 1,306 | 861 | 1,485 | 1,030 | 2,791 | 1,891 | ||||||||||||||||||
| Net interest income | 1,126 | 846 | 969 | 895 | 2,095 | 1,741 | ||||||||||||||||||
| Less: Loan loss provision | 47 | 40 | 151 | 19 | 198 | 59 | ||||||||||||||||||
| Net interest income after loan loss provision | 1,079 | 806 | 818 | 876 | 1,897 | 1,682 | ||||||||||||||||||
| Non-Interest Income | ||||||||||||||||||||||||
| Gain from foreclosure of assets | - | - | ||||||||||||||||||||||
| Gain on foreclosure of assets | 95 | – | 95 | – | ||||||||||||||||||||
| Total non-interest income | - | - | 95 | – | 95 | – | ||||||||||||||||||
| Income | 1,079 | 806 | 913 | 876 | 1,992 | 1,682 | ||||||||||||||||||
| Non-Interest Expense | ||||||||||||||||||||||||
| Selling, general and administrative | 624 | 497 | 620 | 571 | 1,244 | 1,068 | ||||||||||||||||||
| Depreciation and amortization | 23 | 17 | 22 | 21 | 45 | 38 | ||||||||||||||||||
| Loss on foreclosure of assets | 169 | – | 169 | – | ||||||||||||||||||||
| Impairment loss on foreclosed assets | 80 | 5 | 27 | 80 | 107 | 85 | ||||||||||||||||||
| Total non-interest expense | 727 | 519 | 838 | 672 | 1,565 | 1,191 | ||||||||||||||||||
| Net Income | $ | 352 | $ | 287 | $ | 75 | $ | 204 | $ | 427 | $ | 491 | ||||||||||||
| Earned distribution to preferred equity holders | 105 | 63 | 110 | 67 | 215 | 130 | ||||||||||||||||||
| Net income attributable to common equity holders | $ | 247 | $ | 224 | $ | (35 | ) | $ | 137 | $ | 212 | $ | 361 | |||||||||||
Interest Spread
The following table displays a comparison of our interest income, expense, fees, and spread:
| Three Months Ended | Three Months Ended | Six Months Ended | ||||||||||||||||||||||||||||||||||||||||||||||
| March 31, | June 30, | June 30, | ||||||||||||||||||||||||||||||||||||||||||||||
| 2019 | 2018 | 2019 | 2018 | 2019 | 2018 | |||||||||||||||||||||||||||||||||||||||||||
| Interest Income | * | * | * | * | * | * | ||||||||||||||||||||||||||||||||||||||||||
| Interest income on loans | $ | 1,712 | 13 | % | $ | 1,291 | 14 | % | $ | 1,849 | 14 | % | $ | 1,416 | 13 | % | $ | 3,561 | 14 | % | $ | 2,708 | 13 | % | ||||||||||||||||||||||||
| Fee income on loans | 720 | 6 | % | 416 | 4 | % | 605 | 5 | % | 629 | 6 | % | 1,325 | 5 | % | 924 | 5 | % | ||||||||||||||||||||||||||||||
| Interest and fee income on loans | 2,432 | 19 | % | 1,707 | 18 | % | 2,454 | 19 | % | 2,045 | 19 | % | 4,886 | 19 | % | 3,632 | 18 | % | ||||||||||||||||||||||||||||||
| Interest expense unsecured | 585 | 5 | % | 402 | 4 | % | 673 | 5 | % | 467 | 4 | % | 1,258 | 5 | % | 868 | 4 | % | ||||||||||||||||||||||||||||||
| Interest expense secured | 681 | 5 | % | 411 | 4 | % | 769 | 5 | % | 513 | 4 | % | 1,450 | 5 | % | 928 | 4 | % | ||||||||||||||||||||||||||||||
| Amortization of offering costs | 40 | - | 48 | 1 | % | |||||||||||||||||||||||||||||||||||||||||||
| Amortization offering costs | 43 | 1 | % | 50 | 1 | % | 83 | 1 | % | 95 | 1 | % | ||||||||||||||||||||||||||||||||||||
| Interest expense | 1,306 | 10 | % | 861 | 9 | % | 1,485 | 11 | % | 1,030 | 10 | % | 2,791 | 11 | % | 1,891 | 9 | % | ||||||||||||||||||||||||||||||
| Net interest income (spread) | $ | 1,126 | 9 | % | $ | 846 | 9 | % | 969 | 8 | % | 1,015 | 9 | % | 2,095 | 8 | % | 1,981 | 9 | % | ||||||||||||||||||||||||||||
| Weighted average outstanding loan asset balance | $ | 50,886 | $ | 37,831 | $ | 53,620 | $ | 42,439 | $ | 52,253 | $ | 40,135 | ||||||||||||||||||||||||||||||||||||
*annualized amount as percentage of weighted average outstanding gross loan balance
There are three main components that can impact our interest spread:
●Difference between the interest rate received (on our loan assets) and the interest rate paid (on our borrowings). The loans we have originated have interest rates which are based on our cost of funds, with a minimum cost of funds of 7%. For most loans, the margin is fixed at 3%; however, for our development loans the margin is fixed at 7%. Loans originated after June 30, 2018 are at an increase of 1% to approximately 3% margin, older loans are at a 2% margin. This component is also impacted by the lending of money with no interest cost (our equity).
For the periodquarter and six months ended March 31,June 30, 2019, the interest income on loans decreasedincreased by 1% compared to the prior year’s same periodperiods due to foreclosed assets which we now own (and which are not paying interest) were performingour increase in interest rates from 2% to 3% starting with new loans created in the same period last year. third quarter of 2018.
The difference between the interest rate received on our loans and the interest we paid was 3%, as compared to 5%. for both of the three months ended June 30, 2019 and 2018. The difference between the interest rate received on our loans and the interest we paid was 3% and 4% for the six months ended June 30, 2019 and 2018, respectively. The 3% is lower due to the dollar amount of loans that are not paying interest. The 5%4% from last year was higher than typical because of the dollar amount of loans we had paying default rate interest. Some of those loans have since paid off, and some have become foreclosed assets. While our stated margin is 3%, our actual is different because 1) some loans pay higher than the stated margin, 2) some loans are not paying interest, and 3) the dollar amount of loans may be different than the dollar amount of debt. Another factor that impacts this margin is the percentage of loans which are development loans paying the 7% margin.
We currently anticipate that the difference between our interest income and interest expense will continue to be 3% for the remainder of 2019. WithDue to the increase in our pricing which started with loans created in the third quarter of 2018, we anticipate our standard margin to be 3% on all future construction loans and 7% on all development loans which yields a blended margin of approximately 3.4%. These factors should yield us a spread in the low 3%’s until the foreclosed asset balance is reduced significantly, and then in the low 4%’s thereafter, assuming no other significant changes to our business. Our largest foreclosed asset, a property in Sarasota, Florida, is completed and on the market.
●Fee income. Our construction loans have a 5% fee on the amount that we commit to lend, which is amortized over the expected life of each of those loans; however, we do not recognize a loan fee on our development loans. When loans terminate quicker than their expected life, the remaining unrecognized fee is recognized upon the termination of the loan. Our fee income increased due to a modification fee charged to our largest customer of $125, and an increase in our loan turns.
| 22 |
We currently anticipate that fee income will be 5% for the remainder of 2019.
●Amount of nonperforming assets. Generally, we can have two types of nonperforming assets that negatively affect interest spread: loans not paying interest and foreclosed assets.
As of March 31,June 30, 2019, and 2018, $2,617 and $3,776, respectively,$1,663 of loans were not paying interest. Slightly more than halfAs of the 2019 amount is due to the death of a customer.June 30, 2018, all loans were paying interest.
Foreclosed assets do not provide a monthly interest return. As of March 31,June 30, 2019, and 2018, we had $6,069$7,964 and $1,079,$5,636, respectively, in foreclosed assets, which resulted in a negative impact on our interest spread.spread because the increase in 2018 to $6,323 occurred at the end of the second quarter of 2018.
The amount of nonperforming assets is expected to increasedecrease over the next quarter due to some of the nonperforming loans becomingour largest foreclosed assets, and will decrease as we sell some of those properties.asset being sold during August 2019.
SG&A Expenses
The following table displays our SG&A expenses:
| Three Months | Six Months | |||||||||||||||||||||||
For the Three Months Ended March 31, | Ended June 30, | Ended June 30, | ||||||||||||||||||||||
| 2019 | 2018 | 2019 | 2018 | 2019 | 2018 | |||||||||||||||||||
| Selling, general and administrative expenses | ||||||||||||||||||||||||
| Legal and accounting | $ | 127 | $ | 143 | $ | 47 | $ | 80 | $ | 174 | $ | 223 | ||||||||||||
| Salaries and related expenses | 362 | 236 | 422 | 357 | 784 | 593 | ||||||||||||||||||
| Board related expenses | 16 | 22 | 25 | 15 | 41 | 37 | ||||||||||||||||||
| Advertising | 19 | 17 | 31 | 18 | 50 | 35 | ||||||||||||||||||
| Rent and utilities | 9 | 10 | 16 | 10 | 25 | 20 | ||||||||||||||||||
| Loan and foreclosed asset expenses | 20 | 8 | 27 | 30 | 47 | 38 | ||||||||||||||||||
| Travel | 32 | 23 | 14 | 28 | 46 | 51 | ||||||||||||||||||
| Other | 39 | 38 | 38 | 33 | 77 | 71 | ||||||||||||||||||
| Total SG&A | $ | 624 | $ | 497 | $ | 620 | $ | 571 | $ | 1,244 | $ | 1,068 | ||||||||||||
Our SG&A expense increased $127$49 and $176 for the quarter and six months ended March 31,June 30, 2019, respectively, due significantlyprimarily to the following:salaries and related expenses from hiring additional employees to support Company growth.
Impairment Loss on Foreclosed Assets
We owned six25 and four foreclosed assets as of March 31,June 30, 2019 and 2018, respectively. ThreeExcluding the 18 recently taken from our deceased borrower, we had four properties completed and on the market as of June 30, 2019. In addition, two are vacant lots not under construction; however, on the foreclosed assets are lots under construction,market and one is a completedpartially built home under construction. Of the 18 which we received through foreclosure recently, there were originally 20, two of those which were resolved by us selling one loan to a third party before foreclosure, and twoa different third party buying one of the homes at the foreclosure sale. Of the remaining 18, eight are landpartially built in various stages of construction which we are planning on completing, and the other 10 are lots. We will decide whether to develop on the lots once we have made progress on the eight under construction. As of June 30, 2019, we do not anticipate losses on the sale of foreclosed assets in the future; however, this may be subject to change based on the final selling price of the foreclosed assets. We finished our largest foreclosed asset in Sarasota, Florida and recorded an impairment of $80 during the quarter on that property.
Loan Loss Provision
Our loan loss provision increased by $7$132 and $139 for the quarter and six months ended March 31,June 30, 2019, respectively, compared to the same periodperiods of 2018. In both quarters we increased our loan loss percentage on the collective reserve, and theThe increase of $7 was primarily due to the largersale of an impaired loan balances inasset during the second quarter of 2019 as compared to 2018.with a loss of $124.
Consolidated Financial Position
Loans Receivable
Commercial Loans – Construction Loan Portfolio Summary
We anticipate that the aggregate balance of our construction loan portfolio will increase as loans near maturity and as we have new loan originations.
The following is a summary of our loan portfolio to builders for home construction loans as of March 31,June 30, 2019:
| State | Number of | Number of | Value of Collateral(1) | Commitment Amount | Amount Outstanding | Loan to Value Ratio(2) | Loan Fee | Number of Borrowers | Number of Loans | Value of Collateral (1) | Commitment Amount | Amount Outstanding | Loan to Value Ratio(2) | Loan Fee | ||||||||||||||||||||||||||||||||||||||
| Arizona | 1 | 3 | $ | 1,830 | $ | 1,167 | $ | 393 | 64 | % | 5 | % | ||||||||||||||||||||||||||||||||||||||||
| Connecticut | 1 | 1 | 340 | 204 | 44 | 60 | % | 5 | % | 1 | 1 | 340 | 204 | 165 | 60 | % | 5 | % | ||||||||||||||||||||||||||||||||||
| Colorado | 2 | 4 | 2,549 | 1,739 | 1,576 | 68 | % | 5 | % | 2 | 2 | 1,260 | 838 | 835 | 67 | % | 5 | % | ||||||||||||||||||||||||||||||||||
| Florida | 16 | 119 | 33,500 | 24,195 | 12,935 | 72 | % | 5 | % | 15 | 104 | 30,973 | 22,706 | 13,401 | 73 | % | 5 | % | ||||||||||||||||||||||||||||||||||
| Georgia | 6 | 9 | 7,233 | 4,749 | 3,770 | 66 | % | 5 | % | 3 | 7 | 4,483 | 3,064 | 2,458 | 68 | % | 5 | % | ||||||||||||||||||||||||||||||||||
| Idaho | 1 | 2 | 605 | 423 | 121 | 70 | % | 5 | % | 1 | 2 | 605 | 424 | 260 | 70 | % | 5 | % | ||||||||||||||||||||||||||||||||||
| Indiana | 1 | 2 | 717 | 502 | 312 | 70 | % | 5 | % | 1 | 1 | 347 | 243 | 128 | 70 | % | 5 | % | ||||||||||||||||||||||||||||||||||
| Michigan | 4 | 30 | 7,119 | 4,863 | 2,787 | 68 | % | 5 | % | 3 | 11 | 3,386 | 2,349 | 1,559 | 69 | % | 5 | % | ||||||||||||||||||||||||||||||||||
| New Jersey | 5 | 14 | 4,728 | 3,591 | 2,881 | 76 | % | 5 | % | 4 | 13 | 4,638 | 3,571 | 2,416 | 77 | % | 5 | % | ||||||||||||||||||||||||||||||||||
| New York | 2 | 3 | 1,175 | 823 | 586 | 70 | % | 5 | % | 2 | 4 | 1,595 | 1,117 | 1,093 | 70 | % | 5 | % | ||||||||||||||||||||||||||||||||||
| North Carolina | 4 | 14 | 3,685 | 2,538 | 1,365 | 69 | % | 5 | % | 5 | 12 | 3,699 | 2,536 | 1,197 | 69 | % | 5 | % | ||||||||||||||||||||||||||||||||||
| North Dakota | 1 | 1 | 375 | 263 | 242 | 70 | % | 5 | % | |||||||||||||||||||||||||||||||||||||||||||
| Ohio | 3 | 6 | 4,787 | 3,057 | 1,937 | 64 | % | 5 | % | 3 | 6 | 4,787 | 3,057 | 2,305 | 64 | % | 5 | % | ||||||||||||||||||||||||||||||||||
| Oregon | 1 | 3 | 1,704 | 1,193 | 354 | 70 | % | 5 | % | 1 | 3 | 1,704 | 1,193 | 598 | 70 | % | 5 | % | ||||||||||||||||||||||||||||||||||
| Pennsylvania | 3 | 33 | 25,543 | 14,900 | 10,960 | 58 | % | 5 | % | 3 | 30 | 24,549 | 14,615 | 11,159 | 60 | % | 5 | % | ||||||||||||||||||||||||||||||||||
| South Carolina | 13 | 25 | 9,027 | 6,296 | 3,739 | 70 | % | 5 | % | 12 | 28 | 9,662 | 6,741 | 4,363 | 70 | % | 5 | % | ||||||||||||||||||||||||||||||||||
| Tennessee | 2 | 3 | 1,120 | 784 | 381 | 70 | % | 5 | % | 2 | 3 | 1,120 | 784 | 427 | 70 | % | 5 | % | ||||||||||||||||||||||||||||||||||
| Texas | 2 | 3 | 535 | 374 | 143 | 70 | % | 5 | % | 3 | 5 | 1,905 | 1,214 | 699 | 64 | % | 5 | % | ||||||||||||||||||||||||||||||||||
| Utah | 3 | 7 | 3,072 | 2,105 | 1,141 | 69 | % | 5 | % | 2 | 6 | 2,587 | 1,786 | 1,183 | 69 | % | 5 | % | ||||||||||||||||||||||||||||||||||
| Virginia | 2 | 6 | 2,104 | 1,417 | 953 | 67 | % | 5 | % | 2 | 5 | 1,819 | 1,217 | 1,060 | 67 | % | 5 | % | ||||||||||||||||||||||||||||||||||
| Washington | 1 | 1 | 590 | 413 | 101 | 70 | % | 5 | % | |||||||||||||||||||||||||||||||||||||||||||
| Wyoming | 1 | 1 | 228 | 160 | 42 | 70 | % | 5 | % | 1 | 2 | 507 | 355 | 107 | 70 | % | 5 | % | ||||||||||||||||||||||||||||||||||
| Total | 75 | 289 | $ | 111,976 | $ | 75,343 | $ | 46,662 | 67 | %(3) | 5 | % | 67 | 246 | $ | 100,556 | $ | 68,427 | $ | 45,514 | 68 | %(3) | 5 | % | ||||||||||||||||||||||||||||
| (1) | The value is determined by the appraised value. | |
| (2) | The loan to value ratio is calculated by taking the commitment amount and dividing by the appraised value. | |
| (3) | Represents the weighted average loan to value ratio of the loans. |
The following is a summary of our loan portfolio to builders for home construction loans as of December 31, 2018:
| State | Number of | Number of | Value of Collateral(1) | Commitment Amount | Amount Outstanding | Loan to Value Ratio(2) | Loan Fee | Number | Number of | Value of Collateral (1) | Commitment Amount | Amount Outstanding | Loan to Value Ratio(2) | Loan Fee | ||||||||||||||||||||||||||||||||||||||
| Arizona | 1 | 1 | $ | 1,140 | $ | 684 | $ | 214 | 60 | % | 5 | % | 1 | 1 | $ | 1,140 | $ | 684 | $ | 214 | 60 | % | 5 | % | ||||||||||||||||||||||||||||
| Colorado | 2 | 4 | 2,549 | 1,739 | 1,433 | 68 | % | 5 | % | 2 | 4 | 2,549 | 1,739 | 1,433 | 68 | % | 5 | % | ||||||||||||||||||||||||||||||||||
| Florida | 18 | 104 | 32,381 | 22,855 | 12,430 | 71 | % | 5 | % | 18 | 104 | 32,381 | 22,855 | 12,430 | 71 | % | 5 | % | ||||||||||||||||||||||||||||||||||
| Georgia | 5 | 6 | 5,868 | 3,744 | 2,861 | 64 | % | 5 | % | 5 | 6 | 5,868 | 3,744 | 2,861 | 64 | % | 5 | % | ||||||||||||||||||||||||||||||||||
| Idaho | 1 | 2 | 605 | 424 | 77 | 70 | % | 5 | % | 1 | 2 | 605 | 424 | 77 | 70 | % | 5 | % | ||||||||||||||||||||||||||||||||||
| Indiana | 2 | 5 | 1,567 | 1,097 | 790 | 70 | % | 5 | % | 2 | 5 | 1,567 | 1,097 | 790 | 70 | % | 5 | % | ||||||||||||||||||||||||||||||||||
| Michigan | 4 | 26 | 5,899 | 3,981 | 2,495 | 67 | % | 5 | % | 4 | 26 | 5,899 | 3,981 | 2,495 | 67 | % | 5 | % | ||||||||||||||||||||||||||||||||||
| New Jersey | 5 | 15 | 4,999 | 3,742 | 2,820 | 75 | % | 5 | % | 5 | 15 | 4,999 | 3,742 | 2,820 | 75 | % | 5 | % | ||||||||||||||||||||||||||||||||||
| New York | 2 | 4 | 1,555 | 1,089 | 738 | 70 | % | 5 | % | 2 | 4 | 1,555 | 1,089 | 738 | 70 | % | 5 | % | ||||||||||||||||||||||||||||||||||
| North Carolina | 5 | 12 | 3,748 | 2,580 | 1,712 | 69 | % | 5 | % | 5 | 12 | 3,748 | 2,580 | 1,712 | 69 | % | 5 | % | ||||||||||||||||||||||||||||||||||
| North Dakota | 1 | 1 | 375 | 263 | 227 | 70 | % | 5 | % | 1 | 1 | 375 | 263 | 227 | 70 | % | 5 | % | ||||||||||||||||||||||||||||||||||
| Ohio | 2 | 3 | 3,220 | 1,960 | 1,543 | 61 | % | 5 | % | 2 | 3 | 3,220 | 1,960 | 1,543 | 61 | % | 5 | % | ||||||||||||||||||||||||||||||||||
| Pennsylvania | 3 | 34 | 24,808 | 14,441 | 10,087 | 58 | % | 5 | % | 3 | 34 | 24,808 | 14,441 | 10,087 | 58 | % | 5 | % | ||||||||||||||||||||||||||||||||||
| South Carolina | 15 | 29 | 9,702 | 6,738 | 4,015 | 69 | % | 5 | % | 15 | 29 | 9,702 | 6,738 | 4,015 | 69 | % | 5 | % | ||||||||||||||||||||||||||||||||||
| Tennessee | 1 | 2 | 750 | 525 | 347 | 70 | % | 5 | % | 1 | 2 | 750 | 525 | 347 | 70 | % | 5 | % | ||||||||||||||||||||||||||||||||||
| Texas | 1 | 1 | 179 | 125 | 26 | 70 | % | 5 | % | 1 | 1 | 179 | 125 | 26 | 70 | % | 5 | % | ||||||||||||||||||||||||||||||||||
| Utah | 4 | 4 | 1,788 | 1,206 | 486 | 67 | % | 5 | % | 4 | 4 | 1,788 | 1,206 | 486 | 67 | % | 5 | % | ||||||||||||||||||||||||||||||||||
| Virginia | 3 | 6 | 1,675 | 1,172 | 806 | 70 | % | 5 | % | 3 | 6 | 1,675 | 1,172 | 806 | 70 | % | 5 | % | ||||||||||||||||||||||||||||||||||
| Total | 75 | 259 | $ | 102,808 | $ | 68,365 | $ | 43,107 | 67 | %(3) | 5 | % | 75 | 259 | $ | 102,808 | $ | 68,365 | $ | 43,107 | 67 | %(3) | 5 | % | ||||||||||||||||||||||||||||
| (1) | The value is determined by the appraised value. | |
| (2) | The loan to value ratio is calculated by taking the commitment amount and dividing by the appraised value. | |
| (3) | Represents the weighted average loan to value ratio of the loans. |
Commercial Loans – Real Estate Development Loan Portfolio Summary
The following is a summary of our loan portfolio to builders for land development as of March 31,June 30, 2019 and December 31, 2018. A significant portion of our development loans consist of three development loans to a borrower in Pittsburgh, Pennsylvania (the “Pennsylvania Loans”). Our additional development loans are with borrowers in North Carolina, South Carolina and Florida.
| Year | Number of States | Number of Borrowers | Number of | Gross Value of Collateral(1) | Commitment Amount(3) | Gross Amount Outstanding | Loan to Value Ratio(2) | Loan Fee | Number of States | Number of Borrowers | Number | Gross Value of Collateral(1) | Commitment Amount(3) | Gross Amount Outstanding | Loan to Value Ratio(2) | Loan Fee | ||||||||||||||||||||||||||||||||||||||||||||
| 2019 | 3 | 3 | 7 | $ | 11,564 | $ | 8,010 | $ | 6,269 | 54 | % | $ | 1,000 | 4 | 5 | 9 | $ | 12,635 | $ | 8,444 | $ | 7,446 | 59 | % | $ | 1,000 | ||||||||||||||||||||||||||||||||||
| 2018 | 3 | 4 | 9 | 10,134 | 7,456 | 6,020 | 59 | % | 1,000 | 3 | 4 | 9 | 10,134 | 7,456 | 6,020 | 59 | % | 1,000 | ||||||||||||||||||||||||||||||||||||||||||
| (1) | The value is determined by the appraised value adjusted for remaining costs to be paid. A portion of this collateral is |
| (2) | The loan to value ratio is calculated by taking the outstanding amount and dividing by the appraised value calculated as described above. |
| (3) | The commitment amount does not include letters of credit and cash bonds. |
| 25 |
Combined Loan Portfolio Summary
Financing receivables are comprised of the following as of March 31,June 30, 2019 and December 31, 2018:
| March 31, 2019 | December 31, 2018 | |||||||
| Loans receivable, gross | $ | 52,931 | $ | 49,127 | ||||
| Less: Deferred loan fees | (1,303 | ) | (1,249 | ) | ||||
| Less: Deposits | (1,707 | ) | (1,510 | ) | ||||
| Plus: Deferred origination costs | 303 | 308 | ||||||
| Less: Allowance for loan losses | (233 | ) | (186 | ) | ||||
| Loans receivable, net | $ | 49,991 | $ | 46,490 | ||||
| June 30, 2019 | December 31, 2018 | |||||||
| Loans receivable, gross | $ | 52,960 | $ | 49,127 | ||||
| Less: Deferred loan fees | (1,095 | ) | (1,249 | ) | ||||
| Less: Deposits | (1,517 | ) | (1,510 | ) | ||||
| Plus: Deferred origination costs | 243 | 308 | ||||||
| Less: Allowance for loan losses | (214 | ) | (186 | ) | ||||
| Loans receivable, net | $ | 50,377 | $ | 46,490 | ||||
The following is a roll forward of combined loans:
Three Months Ended 2019 | Year Ended 2018 | Three Months Ended 2018 | Six Months | Year | Six Months | |||||||||||||||||||
| Beginning balance | $ | 46,490 | $ | 30,043 | $ | 30,043 | $ | 46,490 | $ | 30,043 | $ | 30,043 | ||||||||||||
| Additions | 13,403 | 54,145 | 14,476 | 29,183 | 54,145 | 19,870 | ||||||||||||||||||
| Payoffs/sales | (9,600 | ) | (32,899 | ) | (4,649 | ) | (23,154 | ) | (32,899 | ) | (11,337 | ) | ||||||||||||
| Transferred to foreclosed assets | – | (4,494 | ) | – | (1,716 | ) | (4,494 | ) | 3,897 | |||||||||||||||
| Change in deferred origination expense | (5 | ) | 199 | 23 | (65 | ) | 199 | 87 | ||||||||||||||||
| Change in builder deposit | (197 | ) | (12 | ) | (76 | ) | (8 | ) | (12 | ) | (331 | ) | ||||||||||||
| Change in loan loss provision | (47 | ) | (89 | ) | (40 | ) | (198 | ) | (89 | ) | (59 | ) | ||||||||||||
| New loan fees | (947 | ) | (2,949 | ) | (619 | ) | (1,656 | ) | (2,949 | ) | (1,528 | ) | ||||||||||||
| Earned loan fees | 894 | 2,546 | 534 | 1,501 | 2,546 | 1,177 | ||||||||||||||||||
| Ending balance | $ | 49,991 | $ | 46,490 | $ | 39,692 | $ | 50,377 | $ | 46,490 | $ | 41,819 | ||||||||||||
Finance Receivables – By risk rating:
| March 31, 2019 | December 31, 2018 | June 30, 2019 | December 31, 2018 | |||||||||||||
| Pass | $ | 47,941 | $ | 43,402 | $ | 49,916 | $ | 43,402 | ||||||||
| Special mention | 2,373 | 3,222 | 1,381 | 3,222 | ||||||||||||
| Classified – accruing | – | – | – | – | ||||||||||||
| Classified – nonaccrual | 2,617 | 2,503 | 1,663 | 2,503 | ||||||||||||
| Total | $ | 52,931 | $ | 49,127 | $ | 52,960 | $ | 49,127 | ||||||||
Finance Receivables – Method of impairment calculation:
| March 31, 2019 | December 31, 2018 | June 30, 2019 | December 31, 2018 | |||||||||||||
| Performing loans evaluated individually | $ | 20,882 | $ | 19,037 | $ | 22,147 | $ | 19,037 | ||||||||
| Performing loans evaluated collectively | 29,432 | 27,587 | 27,769 | 27,587 | ||||||||||||
| Non-performing loans without a specific reserve | 2,311 | 2,204 | 1,381 | 2,204 | ||||||||||||
| Non-performing loans with a specific reserve | 306 | 299 | 1,663 | 299 | ||||||||||||
| Total evaluated collectively for loan losses | $ | 52,931 | $ | 49,127 | $ | 52,960 | $ | 49,127 | ||||||||
At March 31,June 30, 2019 and December 31, 2018, there were no loans acquired with deteriorated credit quality.
Impaired Loans
The following is a summary of our impaired nonaccrual commercial construction loans as of March 31,June 30, 2019 and December 31, 2018.2018:
| March 31, 2019 | December 31, 2018 | June 30, 2019 | December 31, 2018 | |||||||||||||
| Unpaid principal balance (contractual obligation from customer) | $ | 2,617 | $ | 2,503 | $ | 1,663 | $ | 2,503 | ||||||||
| Charge-offs and payments applied | - | - | - | - | ||||||||||||
| Gross value before related allowance | 2,617 | 2,503 | 1,663 | 2,503 | ||||||||||||
| Related allowance | (29 | ) | (20 | ) | (7 | ) | (20 | ) | ||||||||
| Value after allowance | $ | 2,588 | $ | 2,483 | $ | 1,656 | $ | 2,483 | ||||||||
Below is an aging schedule of loans receivable as of March 31,June 30, 2019, on a recency basis:
| No. Loans | Unpaid Balances | % | No. Loans | Unpaid Balances | % | |||||||||||||||||||
| Current loans (current accounts and accounts on which more than 50% of an original contract payment was made in the last 59 days) | 273 | $ | 50,314 | 95 | % | 247 | $ | 51,297 | 96 | % | ||||||||||||||
| 60-89 days | 20 | 1,617 | 3 | % | 7 | 1,378 | 3 | % | ||||||||||||||||
| 90-179 days | – | – | – | % | – | – | – | % | ||||||||||||||||
| 180-269 days | 3 | 1,000 | 2 | % | 1 | 285 | 1 | % | ||||||||||||||||
| Subtotal | 296 | $ | 52,931 | 100 | % | 255 | $ | 52,960 | 100 | % | ||||||||||||||
| Interest only accounts (Accounts on which interest, deferment, extension and/or default charges were received in the last 60 days) | – | $ | – | – | % | – | $ | – | – | % | ||||||||||||||
| Partial Payment accounts (Accounts on which the total received in the last 60 days was less than 50% of the original contractual monthly payment. “Total received” to include interest on simple interest accounts, as well as late charges on deferment charges on pre-computed accounts.) | – | $ | – | – | % | – | $ | – | – | % | ||||||||||||||
| Total | 296 | $ | 52,931 | 100 | % | 255 | $ | 52,960 | 100 | % | ||||||||||||||
Below is an aging schedule of loans receivable as of March 31,June 30, 2019, on a contractual basis:
| No. Loans | Unpaid Balances | % | No. Loans | Unpaid Balances | % | |||||||||||||||||||
| Contractual Terms - All current Direct Loans and Sales Finance Contracts with installments past due less than 60 days from due date. | 273 | $ | 50,314 | 95 | % | 247 | $ | 51,297 | 96 | % | ||||||||||||||
| 60-89 days | 20 | 1,617 | 3 | % | 7 | 1,378 | 3 | % | ||||||||||||||||
| 90-179 days | – | – | – | % | – | – | – | |||||||||||||||||
| 180-269 days | 3 | 1,000 | 2 | % | 1 | 285 | 1 | % | ||||||||||||||||
| Subtotal | 296 | $ | 52,931 | 100 | % | 255 | $ | 52,960 | 100 | % | ||||||||||||||
| Interest only accounts (Accounts on which interest, deferment, extension and/or default charges were received in the last 60 days) | – | $ | – | – | % | – | $ | – | – | % | ||||||||||||||
| Partial Payment accounts (Accounts on which the total received in the last 60 days was less than 50% of the original contractual monthly payment. “Total received” to include interest on simple interest accounts, as well as late charges on deferment charges on pre-computed accounts.) | – | $ | – | – | % | – | $ | – | – | % | ||||||||||||||
| Total | 296 | $ | 52,931 | 100 | % | 255 | $ | 52,960 | 100 | % | ||||||||||||||
Below is an aging schedule of loans receivable as of December 31, 2018, on a recency basis:
| No. Loans | Unpaid Balances | % | ||||||||||
| Current loans (current accounts and accounts on which more than 50% of an original contract payment was made in the last 59 days) | 265 | $ | 48,144 | 98 | % | |||||||
| 60-89 days | – | – | – | % | ||||||||
| 90-179 days | 1 | 299 | 1 | % | ||||||||
| 180-269 days | 2 | 684 | 1 | % | ||||||||
| Subtotal | 268 | $ | 49,127 | 100 | % | |||||||
| Interest only accounts (Accounts on which interest, deferment, extension and/or default charges were received in the last 60 days) | – | $ | – | – | % | |||||||
| Partial Payment accounts (Accounts on which the total received in the last 60 days was less than 50% of the original contractual monthly payment. “Total received” to include interest on simple interest accounts, as well as late charges on deferment charges on pre-computed accounts.) | – | $ | – | – | % | |||||||
| Total | 268 | $ | 49,127 | 100 | % | |||||||
Below is an aging schedule of loans receivable as of December 31, 2018, on a contractual basis:
| No. Loans | Unpaid Balances | % | ||||||||||
| Contractual Terms - All current Direct Loans and Sales Finance Contracts with installments past due less than 60 days from due date. | 265 | $ | 48,144 | 98 | % | |||||||
| 60-89 days | – | – | – | % | ||||||||
| 90-179 days | 1 | 299 | 1 | % | ||||||||
| 180-269 days | 2 | 684 | 1 | % | ||||||||
| Subtotal | 268 | $ | 49,127 | 100 | % | |||||||
| Interest only accounts (Accounts on which interest, deferment, extension and/or default charges were received in the last 60 days) | – | $ | – | – | % | |||||||
| Partial Payment accounts (Accounts on which the total received in the last 60 days was less than 50% of the original contractual monthly payment. “Total received” to include interest on simple interest accounts, as well as late charges on deferment charges on pre-computed accounts.) | – | $ | – | – | % | |||||||
| Total | 268 | $ | 49,127 | 100 | % | |||||||
Foreclosed Assets
Below is a roll forward of foreclosed assets:
Three Months Ended March 31, 2019 | Year Ended December 31, 2018 | Three Months Ended March 31, 2018 | Six Months June 30, 2019 | Year December 31, 2018 | Six Months June 30, 2018 | |||||||||||||||||||
| Beginning balance | $ | 5,973 | $ | 1,036 | $ | 1,036 | $ | 5,973 | $ | 1,036 | $ | 1,036 | ||||||||||||
| Additions from loans | - | 4,738 | - | 1,716 | 4,737 | 4,140 | ||||||||||||||||||
| Additions for construction/development | 176 | 1,608 | 48 | 456 | 1,608 | 545 | ||||||||||||||||||
| Sale proceeds | - | (809 | ) | - | - | (809 | ) | - | ||||||||||||||||
| Gain on sale | - | - | - | |||||||||||||||||||||
| Loss on sale | - | (103 | ) | - | - | (103 | ) | - | ||||||||||||||||
| Gain on foreclosure | - | 19 | - | 95 | 19 | - | ||||||||||||||||||
| Loss on foreclosure | - | (47 | ) | - | (169 | ) | (47 | ) | - | |||||||||||||||
| Impairment loss on foreclosed assets | (80 | ) | (468 | ) | (5 | ) | (107 | ) | (468 | ) | (85 | ) | ||||||||||||
| Ending balance | $ | 6,069 | $ | 5,973 | $ | 1,079 | $ | 7,964 | $ | 5,973 | $ | 5,636 | ||||||||||||
During the threequarter the Company reclassified18 construction loans from loans receivable, net to foreclosed assets and five properties recognized a gain on foreclosure of $95 which was offset by a loss on 13 properties of $169. The foreclosure was due to the death of a certain borrower.
During the six months ended March 31,June 30, 2019, we finished our largest foreclosed asset, a property in Sarasota, Florida, and listed it for sale, and substantially completed the two projects in Georgia which are also listed for sale. That property had an $80The Company recognized $27 and $107 of impairment in the quarter. We also added $176 total for the construction/developmentquarter and six months ended June 30, 2019 compared to $80 and $85 the same periods of three properties: the Sarasota property and two homes we are building Georgia.2018.
Customer Interest Escrow
Below is a roll forward of interest escrow:
Three Months Ended 2019 | Year Ended 2018 | Three Months Ended 2018 | Six Months Ended June 30, 2019 | Year Ended December 31, 2018 | Six Months Ended June 30, 2018 | |||||||||||||||||||
| Beginning balance | $ | 939 | $ | 935 | $ | 935 | $ | 939 | $ | 935 | $ | 935 | ||||||||||||
| Preferred equity dividends | 33 | 125 | 30 | 66 | 125 | 62 | ||||||||||||||||||
| Additions from Pennsylvania loans | 715 | 362 | - | |||||||||||||||||||||
| Additions from Pennsylvania Loans | 853 | 362 | 101 | |||||||||||||||||||||
| Additions from other loans | 108 | 1,214 | 102 | 295 | 1,214 | 160 | ||||||||||||||||||
| Interest, fees, principal or repaid to borrower | (506 | ) | (1,697 | ) | (281 | ) | (1,044 | ) | (1,697 | ) | (714 | ) | ||||||||||||
| Ending balance | $ | 1,289 | $ | 939 | $ | 786 | $ | 1,109 | $ | 939 | $ | 544 | ||||||||||||
Related Party Borrowings
As of March 31,June 30, 2019, the Company had $1,108, $250, and $384 available to borrow against the line of credit from Daniel M. Wallach (our Chief Executive Officer and chairman of the board of managers) and his wife, the line of credit from the 2007 Daniel M. Wallach Legacy Trust, and the line of credit from William Myrick (our Executive Vice President of Sales), respectively. A more detailed description is included in Note 6 to the 2018 Financial Statements. These borrowings are in notes payable secured, net of deferred financing costs on the interim condensed consolidated balance sheet.
Secured Borrowings
New Lines of Credit
During the quarter ended June 30, 2019, we entered into three line of credit agreements (the “New LOC Agreements”). Pursuant to the New LOC Agreements, the lenders provide us with revolving lines of credit with the following terms:
| ● | Principal not to exceed $2,250; | |
| ● | Secured with assignments of certain notes and mortgages; and | |
| ● | Terms allow the lenders to give one month notice after which the principal balance of a New LOC Agreement will reduce to zero over the next six months. |
Interest expense was $30 for both the quarter and six months ended June 30, 2019.
Lines of Credit from Affiliates
As of March 31,June 30, 2019, the Company had borrowed $758$633 on its lines of credit from affiliates, which have a total limit of $2,500.
None of our lines of credit have given us notice of nonrenewal, and the lines will continue to automatically renew unless notice is given by a lender.
Deferred Financing Costs
The following is a roll forward of deferred financing costs:
| Three Months | Year | Three Months | ||||||||||||||||||||||
| Ended | Ended | Ended | Six Months Ended | Year Ended | Six Months Ended | |||||||||||||||||||
| March 31, 2019 | December 31, 2018 | March 31, 2018 | June 30, 2019 | December 31, 2018 | June 30, 2018 | |||||||||||||||||||
| Deferred financing costs, beginning balance | $ | 104 | $ | – | $ | – | $ | 104 | $ | – | $ | – | ||||||||||||
| Additions | – | 104 | 5 | – | 104 | – | ||||||||||||||||||
| Deferred financing costs, ending balance | $ | 104 | $ | 104 | $ | 5 | $ | 104 | $ | 104 | $ | – | ||||||||||||
| Less accumulated amortization | (50 | ) | (25 | ) | – | (75 | ) | (25 | ) | – | ||||||||||||||
| Deferred financing costs, net | $ | 54 | $ | 79 | $ | 5 | $ | 29 | $ | 79 | $ | – | ||||||||||||
Summary
The borrowings secured by loan assets are summarized below:
| March 31, 2019 | December 31, 2018 | June 30, 2019 | December 31, 2018 | |||||||||||||||||||||||||||||
| Due from | Due from | Due from | Due from | |||||||||||||||||||||||||||||
Book Value of Loans which | Shepherd’s Finance to Loan | Book Value of Loans which | Shepherd’s Finance to Loan | Book Value of Loans which | Shepherd’s Finance to Loan | Book Value of Loans which | Shepherd’s Finance to Loan | |||||||||||||||||||||||||
| Served as Collateral | Purchaser or Lender | Served as Collateral | Purchaser or Lender | Served as Collateral | Purchaser or Lender | Served as Collateral | Purchaser or Lender | |||||||||||||||||||||||||
| Loan Purchaser | ||||||||||||||||||||||||||||||||
| Builder Finance, Inc. | $ | 9,578 | $ | 6,254 | $ | 8,742 | $ | 5,294 | $ | 10,615 | $ | 6,697 | $ | 8,742 | $ | 5,294 | ||||||||||||||||
| S.K. Funding, LLC | 12,693 | 6,907 | 11,788 | 6,408 | 12,640 | 6,922 | 11,788 | 6,408 | ||||||||||||||||||||||||
| Lender | ||||||||||||||||||||||||||||||||
| Stephen K. Shuman | 1,855 | 1,325 | 2,051 | 1,325 | 1,774 | 1,325 | 2,051 | 1,325 | ||||||||||||||||||||||||
| Jeff Eppinger | 1,893 | 1,000 | - | - | ||||||||||||||||||||||||||||
| Hardy Enterprises, Inc. | 1,797 | 1,000 | - | - | ||||||||||||||||||||||||||||
| Gary Zentner | 791 | 250 | - | - | ||||||||||||||||||||||||||||
| Paul Swanson | 9,476 | 7,000 | 8,079 | 5,986 | 10,264 | 7,000 | �� | 8,079 | 5,986 | |||||||||||||||||||||||
| Total | $ | 33,602 | $ | 21,486 | $ | 30,660 | $ | 19,013 | $ | 39,774 | $ | 24,194 | $ | 30,660 | $ | 19,013 | ||||||||||||||||
| Year | Typical Current Advance Rate | Does Buyer Portion | |||||||||||||||||||||
| Initiated | On New Loans | Have Priority? | Rate | Year Initiated | Typical Current Advance Rate On New Loans | Does Buyer Portion Have Priority? | |||||||||||||||||
| Loan Purchaser | |||||||||||||||||||||||
| Builder Finance, Inc. | 2014 | 75 | % | Yes | The rate our customer pays us | 2014 | 75 | % | Yes | ||||||||||||||
| S.K. Funding, LLC | 2015 | 55 | % | Varies | 9-10.5 | % | 2015 | 55 | % | Varies | |||||||||||||
| Lender | |||||||||||||||||||||||
| Stephen K. Shuman | 2017 | 67 | % | Yes | 10 | % | 2017 | 67 | % | Yes | |||||||||||||
| Jeff Eppinger | 2019 | 67 | % | Yes | |||||||||||||||||||
| Hardy Enterprises, Inc. | 2019 | 67 | % | Yes | |||||||||||||||||||
| Gary Zentner | 2019 | 67 | % | Yes | |||||||||||||||||||
| Paul Swanson | 2017 | 67 | % | Yes | 10 | % | 2017 | 67 | % | Yes | |||||||||||||
Unsecured Borrowings
Unsecured Notes through the Public Offering (“Notes Program”)
On March 22, 2019, the Company terminated its second public offering and commenced its third public third public offering of fixed rate subordinated notes (the “Notes”). The effective interest rate on borrowings through our Notes Program at March 31,June 30, 2019 and December 31, 2018 was 10.09%10.15% and 10.07%, respectively, not including the amortization of deferred financing costs. There are limited rights of early redemption. We generally offer four durations at any given time, ranging from 12 to 48 months from the date of issuance. The following table shows the roll forward of our Notes Program:
| Three Months Ended March 31, 2019 | Year Ended December 31, 2018 | Three Months Ended March 31, 2018 | Six Months Ended June 30, 2019 | Year Ended December 31, 2018 | Six Months Ended June 30, 2018 | |||||||||||||||||||
| Gross Notes outstanding, beginning of period | $ | 17,348 | $ | 14,121 | $ | 14,121 | $ | 17,348 | $ | 14,121 | $ | 14,121 | ||||||||||||
| Notes issued | 3,532 | 9,645 | 1,309 | 5,818 | 9,645 | 3,350 | ||||||||||||||||||
| Note repayments / redemptions | (2,049 | ) | (6,418 | ) | (1,645 | ) | (3,925 | ) | (6,418 | ) | (2,197 | ) | ||||||||||||
| Gross Notes outstanding, end of period | $ | 18,831 | $ | 17,348 | $ | 13,785 | $ | 19,241 | $ | 17,348 | $ | 15,274 | ||||||||||||
| Less deferred financing costs, net | 454 | 212 | 267 | 460 | 212 | 252 | ||||||||||||||||||
| Notes outstanding, net | $ | 18,377 | $ | 17,136 | $ | 13,518 | $ | 18,781 | $ | 17,136 | $ | 15,022 | ||||||||||||
The following is a roll forward of deferred financing costs:
| Three Months | Year | Three Months | ||||||||||||||||||||||
| Ended | Ended | Ended | Six Months Ended | Year Ended | Six Months Ended | |||||||||||||||||||
| March 31, 2019 | December 31, 2018 | March 31, 2018 | June 30, 2019 | December 31, 2018 | June 30, 2018 | |||||||||||||||||||
| Deferred financing costs, beginning balance | $ | 1,212 | $ | 1,102 | $ | 1,102 | $ | 1,212 | $ | 1,102 | $ | 1,102 | ||||||||||||
| Additions | $ | 282 | $ | 117 | $ | 29 | 331 | 117 | 61 | |||||||||||||||
| Disposals | – | (7 | ) | – | - | (7 | ) | - | ||||||||||||||||
| Deferred financing costs, ending balance | $ | 1,494 | $ | 1,212 | $ | 1,131 | $ | 1,543 | $ | 1,212 | $ | 1,163 | ||||||||||||
| Less accumulated amortization | (1,040 | ) | (1,000 | ) | (864 | ) | (1,083 | ) | (1,000 | ) | (911 | ) | ||||||||||||
| Deferred financing costs, net | $ | 454 | $ | 212 | $ | 267 | $ | 460 | $ | 212 | $ | 252 | ||||||||||||
| 31 |
The following is a roll forward of the accumulated amortization of deferred financing costs:
| Three Months | Year | Three Months | ||||||||||
| Ended | Ended | Ended | ||||||||||
| March 31, 2019 | December 31, 2018 | March 31, 2018 | ||||||||||
| Accumulated amortization, beginning balance | $ | 1,000 | $ | 816 | $ | 816 | ||||||
| Additions | 40 | 184 | 48 | |||||||||
| Accumulated amortization, ending balance | $ | 1,040 | $ | 1,000 | $ | 864 | ||||||
| Six Months Ended | Year Ended | Six Months Ended | ||||||||||
| June 30, 2019 | December 31, 2018 | June 30, 2018 | ||||||||||
| Accumulated amortization, beginning balance | $ | 1,000 | $ | 816 | $ | 816 | ||||||
| Additions | 83 | 184 | 95 | |||||||||
| Accumulated amortization, ending balance | $ | 1,083 | $ | 1,000 | $ | 911 | ||||||
Other Unsecured Debts, net
Our other unsecured debts are detailed below:
| Maturity | Interest | Principal Amount Outstanding as of | Principal Amount Outstanding as of | |||||||||||||||||||||||||||
| Loan | Date | Rate(1) | March 31, 2019 | December 31, 2018 | Maturity Date | Interest Rate(1) | June 30, 2019 | December 31, 2018 | ||||||||||||||||||||||
| Unsecured Note with Seven Kings Holdings, Inc. | Demand(2) | 9.5 | % | $ | 500 | $ | 500 | Demand(2) | 9.5 | % | $ | 500 | $ | 500 | ||||||||||||||||
| Unsecured Line of Credit from Builder Finance, Inc. | January 2020 | 10.0 | % | 500 | 500 | January 2020 | 10.0 | % | 500 | 500 | ||||||||||||||||||||
| Unsecured Line of Credit from Paul Swanson | March 2019 | 10.0 | % | - | 1,014 | July 2019 | 10.0 | % | - | 1,014 | ||||||||||||||||||||
| Subordinated Promissory Note | September 2019 | 9.5 | % | 1,125 | 1,125 | September 2019 | 9.5 | % | 1,125 | 1,125 | ||||||||||||||||||||
| Subordinated Promissory Note | December 2019 | 10.5 | % | 113 | 113 | December 2019 | 10.5 | % | 113 | 113 | ||||||||||||||||||||
| Subordinated Promissory Note | April 2020 | 10.0 | % | 100 | 100 | April 2020 | 10.0 | % | 100 | 100 | ||||||||||||||||||||
| Subordinated Promissory Notes | October 2019 | 10.0 | % | 150 | 150 | October 2019 | 10.0 | % | 150 | 150 | ||||||||||||||||||||
| Subordinated Promissory Note | August 2022 | 11.0 | % | 200 | - | August 2022 | 11.0 | % | 200 | - | ||||||||||||||||||||
| Subordinated Promissory Note | September 2020(6) | 11.0 | % | 169 | - | September 2020(6) | 11.0 | % | 169 | - | ||||||||||||||||||||
| Senior Subordinated Promissory Note | March 2022(3) | 10.0 | % | 400 | 400 | March 2022(3) | 10.0 | % | 400 | 400 | ||||||||||||||||||||
| Senior Subordinated Promissory Note | March 2022(4) | 1.0 | % | 728 | 728 | March 2022(4) | 1.0 | % | 728 | 728 | ||||||||||||||||||||
| Junior Subordinated Promissory Note | March 2022(4) | 22.5 | % | 417 | 417 | March 2022(4) | 22.5 | % | 417 | 417 | ||||||||||||||||||||
| Senior Subordinated Promissory Note | October 2020(5) | 1.0 | % | 279 | 279 | October 2020(5) | 1.0 | % | 279 | 279 | ||||||||||||||||||||
| Junior Subordinated Promissory Note | October 2020(5) | 20.0 | % | 173 | 173 | October 2020(5) | 20.0 | % | 173 | 173 | ||||||||||||||||||||
| $ | 4,854 | $ | 5,499 | $ | 4,854 | $ | 5,499 | |||||||||||||||||||||||
(1)Interest rate per annum, based upon actual days outstanding and a 365/366-day year.
(2)Due six months after lender gives notice.
(3)Lender may require us to repay $20 of principal and all unpaid interest with 10 days’ notice.
(4)These notes were issued to the same holder and, when calculated together, yield a blended return of 11% per annum.
(5)These notes were issued to the same holder and, when calculated together, yield a blended return of 10% per annum.
(6)Due one month after lender gives notice, which notice may not be given prior to August 1, 2020.
| 32 |
Redeemable Preferred Equity and Members’ Capital
We strive to maintain a reasonable (about 15%) balance between (1) redeemable preferred equity plus members’ capital and (2) total assets. The ratio of redeemable preferred equity plus members’ capital to assets was 11% as of March 31,June 30, 2019 and 12% as of December 31, 2018. We anticipate this ratio further decreasing until more preferred equity is added. We are currently exploring potential increases in preferred equity.
Priority of Borrowings
The following table displays our borrowings and a ranking of priority. The lower the number, the higher the priority.
| Priority Rank | March 31, 2019 | December 31, 2018 | Priority Rank | June 30, 2019 | December 31, 2018 | |||||||||||||||||
| Borrowing Source | ||||||||||||||||||||||
| Purchase and sale agreements and other secured borrowings | 1 | $ | 25,382 | $ | 22,521 | 1 | $ | 28,086 | $ | 22,521 | ||||||||||||
| Secured lines of credit from affiliates | 2 | 758 | 816 | 2 | 633 | 816 | ||||||||||||||||
| Unsecured line of credit (senior) | 3 | 500 | 500 | 3 | 500 | 500 | ||||||||||||||||
| Other unsecured debt (senior subordinated) | 4 | 1,008 | 1,008 | 4 | 1,008 | 1,008 | ||||||||||||||||
| Unsecured Notes through our public offering, gross | 5 | 18,831 | 17,348 | 5 | 19,241 | 17,348 | ||||||||||||||||
| Other unsecured debt (subordinated) | 5 | 2,756 | 3,401 | 5 | 2,756 | 3,401 | ||||||||||||||||
| Other unsecured debt (junior subordinated) | 6 | 590 | 590 | 6 | 590 | 590 | ||||||||||||||||
| Total | $ | 49,825 | $ | 46,184 | $ | 52,814 | $ | 46,184 | ||||||||||||||
Liquidity and Capital Resources
Our primary liquidity management objective is to meet expected cash flow needs while continuing to service our business and customers. As of March 31,June 30, 2019 and December 31, 2018, we had 296255 and 268, respectively, in combined loans outstanding, which totaled $52,931$52,960 and $49,127, respectively, in gross loan receivables outstanding. Unfunded commitments to extend credit, which have similar collateral, credit and market risk to our outstanding loans, were $30,422$22,911 and $25,258 as March 31,June 30, 2019 and December 31, 2018, respectively. We anticipate a significant increase in our gross loan receivables over the 12 months subsequent to March 31, 2019 by directly increasing originations to new and existing customers.
To fund our combined loans, we rely on secured debt, unsecured debt, and equity, which are described in the following table:
| Source of Liquidity | As of March 31, 2019 | As of December 31, 2018 | As of June 30, 2019 | As of December 31, 2018 | ||||||||||||
| Secured debt | $ | 26,085 | $ | 23,258 | $ | 28,690 | $ | 23,258 | ||||||||
| Unsecured debt | 23,231 | 22,635 | 23,635 | 22,635 | ||||||||||||
| Equity | 6,461 | 6,082 | 6,559 | 6,082 | ||||||||||||
Secured debt, net of deferred financing costs increased $2,827 during the three months ended March 31,$5,432 as of June 30, 2019, which consisted of an increase in borrowings secured by loans and foreclosed assets of $2,886 offset by a decrease in affiliate lines of $59.assets. We anticipate increasing our secured debt by roughly half of the increase in loan asset balances over the 12 months subsequent to March 31,June 30, 2019 through our existing loan purchase and sale agreements and additional lines of credit.
We anticipate that the other half of the loan asset growth will come from a combination of increases in our unsecured debt and equity. Unsecured debt, net of deferred financing costs increased $596 during the three months ended March 31,$1,000 as of June 30, 2019, and unsecured debt, net of deferred financing costs changed due to an increase in our Notes programProgram of $1,241,$1,645, which was offset by a decrease in other unsecured debt of $645. The change in other unsecured debt was due to the elimination of the of unsecured portion of the line of credit from Paul Swanson of $1,014, which was off setoffset by two new promissory notes ofwhich both total $369. We anticipate an increase in our unsecured debt through increased sales in the Notes Program to cover most of the increase in loan assets not covered by increases in our secured debt during the 12 months subsequent to March 31,June 30, 2019.
| 33 |
Equity increased $379$477 during the threesix months ended March 31,June 30, 2019, which consisted of an increase in Series C cumulative preferred units (“Series C Preferred Units”), Series B cumulative preferred units, and Class A common equity of $72, $60,$330, $100, and $247,$47, respectively. We anticipate an increase in our equity during the 12 months subsequent to March 31,June 30, 2019, through the issuance of additional Series C Preferred Units. During the year ended December 31, 2018, we increased the amount of Series C Preferred Units outstanding by $1,288. If we are not able to increase our equity through the issuance of additional Series C Preferred Units, we will rely more heavily on raising additional funds through the Notes Program. If we anticipate the abilityan inability to not fund our projected increases in loan balances as discussed above, we may reduce new loan originations to reduce need for additional funds.
Contractual Obligations
The following table shows the maturity of outstanding debt as of March 31,June 30, 2019:
| Year Maturing | Total Amount Maturing | Public Offering | Other Unsecured | Secured Borrowings | Total Amount Maturing | Public Offering | Other Unsecured | Secured Borrowings | ||||||||||||||||||||||||
| 2019 | $ | 32,914 | $ | 5,521 | $ | 1,887 | $ | 25,506 | $ | 33,894 | $ | 3,921 | $ | 1,887 | $ | 28,086 | ||||||||||||||||
| 2020 | 5,073 | 4,006 | 1,052 | 15 | 5,642 | 4,575 | 1,052 | 15 | ||||||||||||||||||||||||
| 2021 | 7,202 | 7,187 | - | 15 | 8,075 | 8,059 | - | 16 | ||||||||||||||||||||||||
| 2022 | 3,841 | 2,079 | 1,746 | 16 | 3,842 | 2,080 | 1,746 | 16 | ||||||||||||||||||||||||
| 2023 and thereafter | 795 | 38 | 169 | 588 | 1,361 | 606 | 169 | 586 | ||||||||||||||||||||||||
| Total | $ | 49,825 | $ | 18,831 | $ | 4,854 | $ | 26,140 | $ | 52,814 | $ | 19,241 | $ | 4,854 | $ | 28,719 | ||||||||||||||||
The total amount maturing through year ending December 31, 2019 is $32,914,$33,894, which consists of secured borrowings of $25,506$28,086 and unsecured borrowings of $7,408.$5,808.
Secured borrowings maturing through year ending December 31, 2019 significantly consistsis comprised mostly of loan purchase and sale agreements with two loan purchasers (Builder Finance, Inc. and S. K. Funding, LLC) and two lenders (Stephen K. Shuman and Paul Swanson). Our secured borrowings are mostly showinglargely reported as due by 2019 because the related collateral is demand loans. The following lists our secured facilities with maturity and renewal dates:
| ● | Swanson – $7,000 due April 2020, will automatically renew unless notice is given; | |
| ● | Shuman – $1,325 due July | |
| ● | S. K. Funding, LLC – $3,500 of the total due July | |
| ● | S. K. Funding, LLC – | |
| ● | BuilderFinance, Inc. – | |
| ● | Hardy Enterprises, Inc. - $1,000, due will automatically renew monthly unless notice is given; | |
| ● | Jeff Eppinger - $1,000, due will automatically renew monthly unless notice is given; | |
| ● | Gary Zentner - $250, due will automatically renew monthly unless notice is given; | |
| ● | London Financial Company, LLC – $3,250 due September 2019, renewal available; | |
| ● | Wallach LOC – | |
| ● | Myrick LOC – | |
| ● | Mortgage payable – |
Unsecured borrowings due on December 31, 2019 consist of Notes issued pursuant to the Notes Program and other unsecured debt of $5,521$3,921 and $1,887,$1,925, respectively. To the extent that Notes issued pursuant to the Notes Program are not reinvested upon maturity, we will be required to fund the maturities, which we anticipate funding through the issuance of new Notes in our Notes Program. Historically, approximately 82% of our Note holders reinvest upon maturity. Our other unsecured debt has historically renewed. For more information on other unsecured borrowings, see Note 5 – Borrowings. If other unsecured borrowings are not renewed in the future, we anticipate funding such maturities through investments in our Notes Program.
| 34 |
Summary
We have the funding available to address the loans we have today, including our unfunded commitments. We anticipate growing our assets through the net sources and uses (12-month liquidity) listed above as well as future capital increases from debt, redeemable preferred equity, and regular equity. Although our secured debt is almost entirely listed as currently due because of the underlying collateral being demand notes, the vast majority of our secured debt is either contractually set to automatically renew unless notice is given or, in the case of purchase and sale agreements, has no end date as to when the purchasers will not purchase new loans (although they are never required to purchase additional loans).
Inflation, Interest Rates, and Housing Starts
Since we are in the housing industry, we are affected by factors that impact that industry. Housing starts impact our customers’ ability to sell their homes. Faster sales generally mean higher effective interest rates for us, as the recognition of fees we charge is spread over a shorter period. Slower sales generally mean lower effective interest rates for us. Slower sales also are likely to increase the default rate we experience.
Housing inflation generally has a positive impact on our operations. When we lend initially, we are lending a percentage of a home’s expected value, based on historical sales. If those estimates prove to be low (in an inflationary market), the percentage we loaned of the value actually decreases, reducing potential losses on defaulted loans. The opposite is true in a deflationary housing price market. It is our opinion that values are average in many of the housing markets in the U.S. today, and our lending against these values is safer than loans made by financial institutions in 2006 to 2008. The U.S. may be entering into a housing slow down. Some markets seem to be slowing, although most of those markets are not markets in which we lend.
Interest rates have several impacts on our business. First, rates affect housing (starts, home size, etc.). High long termlong-term interest rates may decrease housing starts, having the effects listed above. Higher interest rates will also affect our investors. We believe that there will be a spread between the rate our Notes yield to our investors and the rates the same investors could getreceive on deposits at FDIC insured institutions. We also believe that the spread may need to widen if these rates rise. For instance, if we pay 7% above average CD rates when CDs are paying 0.5%, when CDs are paying 3%, we may have to have a larger than 7% difference. This may cause our lending rates, which are based on our cost of funds, to be uncompetitive. High interest rates may also increase builder defaults, as interest payments may become a higher portion of operating costs for the builder. Higher short termshort-term rates may increase the rates builders are charged by banks faster than our rates to the builder will grow, which might be a benefit for us. Below is a chart showing three yearthree-year U.S. treasury rates, which are being used by us here to approximate CD rates. Short term interest rates have risen slightly but are generally low historically.

Housing prices are also generally correlated with housing starts, so that increases in housing starts usually coincide with increases in housing values, and the reverse is generally true. Below is a graph showing single family housing starts from 2000 through today.
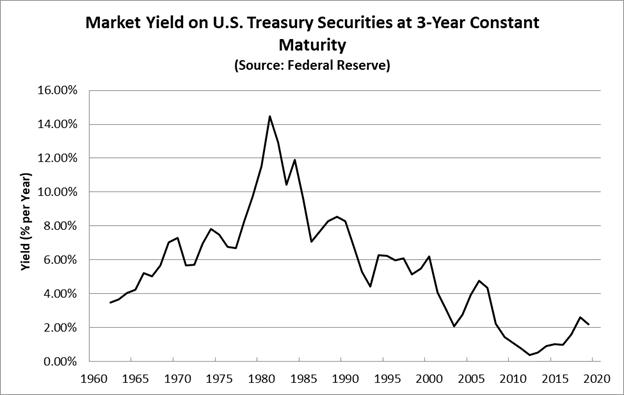
| 36 |
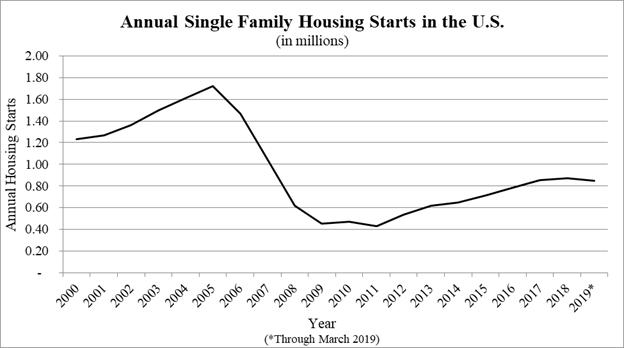
Source: U.S. Census Bureau
To date, changes in housing starts, CD rates, and inflation have not had a material impact on our business.
Off-Balance Sheet Arrangements
As of March 31,June 30, 2019 and December 31, 2018, we had no off-balance sheet transactions, nor do we currently have any such arrangements or obligations.
ITEM 3. QUANTITATIVE AND QUALITATIVE DISCLOSURE ABOUT MARKET RISK
We are a smaller reporting company as defined by Rule 12b-2 of the Securities Exchange Act of 1934 and are not required to provide the information under this item.
ITEM 4. CONTROLS AND PROCEDURES
Disclosure Controls and Procedures
As of the end of the period covered by this report, management including our Chief Executive Officer (our principal executive officer) and Acting Chief Financial Officer (our principal financial officer) evaluated the effectiveness of the design and operation of our disclosure controls and procedures. Based upon, and as of the date of, the evaluation, our CEO (our principal executive officer) and Acting CFO (our principal financial officer) concluded that the disclosure controls and procedures were effective as of the end of the period covered by this report to ensure that information required to be disclosed in the reports we file and submit under the Securities Exchange Act of 1934, as amended (the “Exchange Act”), is recorded, processed, summarized and reported as and when required. Disclosure controls and procedures include, without limitation, controls and procedures designed to ensure that information required to be disclosed by us in the reports we file and submit under the Exchange Act is accumulated and communicated to our management, including our CEO (our principal executive officer) and Acting CFO (our principal financial officer), as appropriate to allow timely decisions regarding required disclosure.
Internal Control over Financial Reporting
There has been no change in our internal controls over financial reporting during the quarter ended March 31,June 30, 2019 that has materially affected, or is reasonably likely to materially affect, our internal controls over financial reporting.
None.
Not applicable.
ITEM 2. UNREGISTERED SALES OF EQUITY SECURITIES AND USE OF PROCEEDS
| (a) | Reinvestments in Partial Series C Cumulative Preferred Units
Investors in the Series C cumulative preferred units (“Series C Preferred Units”) may elect to reinvest their distributions in additional Series C Preferred Units (the “Series C Reinvestment Program”). Pursuant to the Series C Reinvestment Program, we issued the following Series C Preferred Units on |
| Owner | Units | Amount | Units | Amount | ||||||||||||
| Daniel M. and Joyce S. Wallach | 0.3821598 | $ | 38,215.98 | 0.7758996 | $ | 77,589.96 | ||||||||||
| Gregory L. Sheldon | 0.0630627 | 6,306.27 | 0.1280362 | 12,803.62 | ||||||||||||
| BLDR, LLC | 0.1236402 | 12,364.02 | 0.2510268 | 25,102.68 | ||||||||||||
| Schultz Family Living Trust | 0.0307570 | 3,075.70 | 0.0412151 | 4,121.51 | ||||||||||||
| Jeffrey L. Eppinger | 0.1230281 | 12,302.81 | 0.0610040 | 6,100.40 | ||||||||||||
| Fernando and Lorraine Carol Ascencio | 0.0160000 | 1,600.00 | ||||||||||||||
| 37 |
| The proceeds received from the sales of the partial Series C Preferred Units in these transactions were used for the funding of construction loans. The transactions in Series C Preferred Units described above were effected in private transactions exempt from the registration requirements of the Securities Act under Section 4(a)(2) of the Securities Act. The transactions described above did not involve any public offering, were made without general solicitation or advertising, and the buyer represented to us that he/she/it is an “accredited investor” within the meaning of Rule 501 of Regulation D promulgated under the Securities Act, with access to all relevant information necessary to evaluate the investment in the Series C Preferred Units. | ||
Issuance of Series C Cumulative Preferred Units On June 7, 2019, we sold two Series C Preferred Units to two joint investors, for the total price of $200,000. This sale of Series C Preferred Units was effected in a private transaction exempt from the registration requirements of the Securities Act under Section 4(a)(2) of the Securities Act. This transaction in Series C Preferred Units did not involve any public offering, was made without general solicitation or advertising, and the buyers represented to the us that they were each an “accredited investor” as defined under the Securities Act, with access to all relevant information necessary to evaluate the investment in the Series C Preferred Units. | ||
Issuance of Partial Series B Cumulative Preferred Units We previously entered into an agreement with the Hoskins Group (consisting of Benjamin Marcus Homes, LLC, Investor’s Mark Acquisitions, LLC, and Mark L. Hoskins) pursuant to which we sell the Hoskins Group 0.1 Series B cumulative preferred units (“Series B Preferred Units”) upon the closing of certain lots. We issued 0.5 Series B Preferred Units to the Hoskins Group on January 30, 2019 for $50,000, The proceeds received from the sales of the Series B Preferred Units in those transactions were used for the funding of construction loans. The transactions in Series B Preferred Units described above were effected in private transactions exempt from the registration requirements of the Securities Act under Section 4(a)(2) of the Securities Act. The transactions described above did not involve any public offering, were made without general solicitation or advertising, and the buyers represented to us that they are an “accredited | ||
| (b) | We registered up to $70,000,000 in Fixed Rate Subordinated Notes (“Notes”) in our current public offering, which is our third public offering of Notes (SEC File No. 333-224557, effective March 22, 2019). As of | |
| (c) | None. |
ITEM 3. DEFAULTS UPON SENIOR SECURITIES
None.
ITEM 4. MINE SAFETY DISCLOSURES
Not applicable.
| (a) | During the quarter ended | |
| (b) | During the quarter ended |
The exhibits required to be filed with this report are set forth on the Exhibit Index hereto and incorporated by reference herein.
EXHIBIT INDEX
The following exhibits are included in this report on Form 10-Q for the period ended March 31,June 30, 2019 (and are numbered in accordance with Item 601 of Regulation S-K).
| 39 |
| 32.1* | Certification of Principal Executive Officer, pursuant to 18 U.S.C. Section 1350, as created by Section 906 of the Sarbanes-Oxley Act of 2002 | |
| 32.2* | Certification of Principal Financial Officer, pursuant to 18 U.S.C. Section 1350, as created by Section 906 of the Sarbanes-Oxley Act of 2002 | |
| XBRL Instance Document | ||
| 101.SCH** | XBRL Schema Document | |
| 101.CAL** | XBRL Calculation Linkbase Document | |
| 101.DEF** | XBRL Definition Linkbase Document | |
| 101.LAB** | XBRL Labels Linkbase Document | |
| 101.PRE** | XBRL Presentation Linkbase Document |
* Filed herewith.
** Pursuant to Regulation 406T of Regulation S-T, these Interactive Data Files are deemed not filed or part of a registration statement or prospectus for purpose of Section 11 or 12 of the Securities Act of 1933, as amended, or Section 18 of the Securities Exchange Act of 1934, as amended, and are otherwise not subject to liability.
SIGNATURES
Pursuant to the requirements of the Securities Exchange Act of 1934, the Registrant has duly caused this report to be signed on its behalf by the undersigned thereunto duly authorized.
SHEPHERD’S FINANCE, LLC (Registrant) | ||
| Dated: | By: | /s/ Catherine Loftin |
| Catherine Loftin | ||
| Acting Chief Financial Officer | ||