UNITED STATES
SECURITIES AND EXCHANGE COMMISSION
Washington, D.C. 20549
FORM 10-Q
| QUARTERLY REPORT PURSUANT TO SECTION 13 OR 15(d) OF THE SECURITIES EXCHANGE ACT OF 1934 |
For The Quarterly Period Ended JuneSeptember 30, 20202021
or
| TRANSITION REPORT PURSUANT TO SECTION 13 OR 15(d) OF THE SECURITIES EXCHANGE ACT OF 1934 |
For the transition period from ____________ to ____________
Commission File Number 333-235700
SYNERGY EMPIRE LIMITED
(Exact name of registrant issuer as specified in its charter)
| Nevada | 38-4096727 | |
(State or other jurisdiction of incorporation or organization) | (I.R.S. Employer Identification No.) |
| No.19 Jalan 12/118B, Desa Tun Razak, 56100, Kuala Lumpur |
| Address of principal executive offices, including zip code |
| +(60)3 - 9171 2828 |
| Registrant’s phone number, including area code |
N/A
N/A
(Former name, former address and former fiscal year, if changed since last report)
Securities registered pursuant to Section 12(b) of the Act:
| Title of each class | Trading Symbol(s) | Name on each exchange on which registered | ||
| N/A | N/A | N/A |
Indicate by check mark whether the registrant (1) has filed all reports required to be filed by Section 13 or 15(d) of the Securities Exchange Act of 1934 during the preceding 12 months (or for such shorter period that the registrant was required to file such reports), and (2) has been subject to such filing requirements for the past 90 days.
Yes [X] ☒ No [ ]☐
Indicate by check mark whether the registrant has submitted electronically every Interactive Data File required to be submitted pursuant to Rule 405 of Regulation S-T (§232.405 of this chapter) during the preceding 12 months (or for such shorter period that the registrant was required to submit such files).
Yes [X] ☒ No [ ]☐
Indicate by check mark whether the registrant is a large accelerated filer, an accelerated filer, a non-accelerated filer, a smaller reporting company, or an emerging growth company. See the definitions of “large accelerated filer”, “accelerated filer”, “smaller reporting company” and “emerging growth company” in Rule 12b-2 of the Exchange Act.
| Large Accelerated Filer | Accelerated Filer | Non-accelerated Filer | Smaller reporting company |
| Emerging growth company |
If an emerging growth company, indicate by check mark if the registrant has elected not to use the extended transition period for complying with any new or revised financial accounting standards provided pursuant to Section 13(a) of the Exchange Act. [ ]☐
Indicate by check mark whether the registrant is a shell company (as defined in Rule12b-2 of the Exchange Act).
Yes [ ] ☐ No [X] ☒
APPLICABLE ONLY TO ISSUERS INVOLVED IN BANKRUPTCY PROCEEDINGS DURING THE PRECEDING FIVE YEARS:
Indicate by check mark whether the registrant has filed all documents and reports required to be filed by Sections 12, 13 or 15(d) of the Securities Exchange Act of 1934 subsequent to the distribution of securities under a plan confirmed by a court.
N/A
Indicate the number of shares outstanding of each of the issuer’s classes of common stock, as of the latest practicable date.
| Class | Outstanding | |
| Common Stock, |
TABLE OF CONTENTS
| 2 |
PART I — FINANCIAL INFORMATION
SYNERGY EMPIRE LIMITED.LIMITED
CONDENSED CONSOLIDATED BALANCE SHEETS
AS OF JUNESEPTEMBER 30, 2020 and2021 AND MARCH 31, 20202021
(Currency expressed in United States Dollars (“US$”), except for number of share)
As of June 30, 2020 | As of March 31, 2020 | As of September 30, 2021 | As of March 31, 2021 | |||||||||||||
| (Unaudited) | (Audited) | (Unaudited) | (Audited) | |||||||||||||
| ASSETS | ||||||||||||||||
| CURRENT ASSETS | ||||||||||||||||
| Cash and cash equivalents | $ | 61,353 | $ | 87,492 | $ | 26,926 | $ | 345,161 | ||||||||
| Trade receivables, net | 726 | 721 | 731 | 739 | ||||||||||||
| Prepaid expenses and deposits | 26,185 | 23,743 | 26,806 | 26,387 | ||||||||||||
| Inventories | 17,125 | 17,005 | 15,306 | 11,482 | ||||||||||||
| TOTAL CURRENT ASSETS | $ | 105,389 | $ | 128,961 | $ | 69,769 | $ | 383,769 | ||||||||
| NON-CURRENT ASSETS | ||||||||||||||||
| Operating lease right of use asset, net | 127,351 | 144,536 | 278,678 | 308,918 | ||||||||||||
| Plant and equipment, net | 130,196 | 135,444 | 317,645 | 328,245 | ||||||||||||
| Intangible asset, net | 1,503 | - | ||||||||||||||
| TOTAL ASSETS | $ | 362,936 | $ | 408,941 | $ | 667,595 | $ | 1,020,932 | ||||||||
| LIABILITIES AND STOCKHOLDERS’ EQUITY | ||||||||||||||||
| CURRENT LIABILITIES | ||||||||||||||||
| Accounts payable | $ | 6,752 | $ | 11,427 | $ | 7,944 | $ | 8,857 | ||||||||
| Accrued expenses and other payables | 135,186 | 143,831 | 69,230 | 170,449 | ||||||||||||
| Operating lease liability | 53,802 | 63,419 | 68,025 | 63,493 | ||||||||||||
| Bank borrowing | 9,342 | 15,267 | 16,208 | 15,559 | ||||||||||||
| Amount due to related parties | 272,609 | 280,180 | ||||||||||||||
| Amount due to a director | 665,673 | 644,072 | 892,354 | 894,480 | ||||||||||||
| TOTAL CURRENT LIABILITIES | $ | 1,143,364 | $ | 1,158,196 | $ | 1,053,761 | $ | 1,152,838 | ||||||||
| NON-CURRENT LIABILITIES | ||||||||||||||||
| Operating lease liability | 75,439 | 82,619 | 214,927 | 249,142 | ||||||||||||
| Bank borrowing | 36,767 | 30,453 | 17,231 | 25,836 | ||||||||||||
| TOTAL LIABILITIES | $ | 1,255,570 | $ | 1,271,268 | $ | 1,285,919 | $ | 1,427,816 | ||||||||
| STOCKHOLDERS’ EQUITY | ||||||||||||||||
| Preferred stock – Par value $0.0001; Authorized: 50,000,000 None issued and outstanding | - | - | ||||||||||||||
| Common stock – Par value $0.0001; Authorized: 450,000,000 Issued and outstanding: 900,000 shares as of June 30, 2020 and 900,000 shares as of March 31, 2020 respectively | 90 | 90 | ||||||||||||||
| Preferred stock – Par value $; Authorized: issued and outstanding | - | - | ||||||||||||||
| Common stock – Par value $; Authorized: Issued and outstanding: shares as of September 30, 2021 and March 31, 2021 respectively | 100 | 100 | ||||||||||||||
| Additional paid-in capital | 284,093 | 284,093 | 784,083 | 784,083 | ||||||||||||
| Accumulated other comprehensive loss | (7,661 | ) | (2,109 | ) | (25,657 | ) | (34,804 | ) | ||||||||
| Accumulated deficit | (1,169,156 | ) | (1,144,401 | ) | (1,376,850 | ) | (1,156,263 | ) | ||||||||
| TOTAL STOCKHOLDERS’ DEFICIT | $ | (892,634 | ) | $ | (862,327 | ) | $ | (618,324 | ) | $ | (406,884 | ) | ||||
| TOTAL LIABILITIES AND STOCKHOLDERS’ EQUITY | $ | 362,936 | $ | 408,941 | $ | 667,595 | $ | 1,020,932 | ||||||||
See accompanying notes to the unaudited condensed consolidated financial statements.
| F-1 |
SYNERGY EMPIRE LIMITED
CONDENSED CONSOLIDATED STATEMENTS OF OPERATIONS AND COMPREHENSIVE INCOME (LOSS)LOSS
FOR THE THREE AND SIX MONTHS ENDED JUNESEPTEMBER 30, 20202021 AND 20192020
(Currency expressed in United States Dollars (“US$”), except for number of shares)
For the Three Months Ended, June 30 | ||||||||
| 2020 | 2019 | |||||||
| (Unaudited) | (Unaudited) | |||||||
| REVENUE | $ | 91,974 | $ | 48,727 | ||||
| COST AND EXPENSES: | ||||||||
| Cost of revenue | (24,499 | ) | (20,416 | ) | ||||
| General and administrative expenses | (101,202 | ) | (95,813 | ) | ||||
| Total operating costs and expenses | (125,701 | ) | (116,229 | ) | ||||
| Loss from operations | (33,727 | ) | (67,502 | ) | ||||
| Other income/(expenses), net | 8,972 | (728 | ) | |||||
| Loss before income tax | (24,755 | ) | (68,230 | ) | ||||
| Income tax expense | - | - | ||||||
| Net loss | (24,755 | ) | (68,230 | ) | ||||
| Foreign currency translation loss | (5,552 | ) | (3,247 | ) | ||||
| Total comprehensive loss | $ | (30,307 | ) | $ | (71,477 | ) | ||
| Net loss per share, basic and diluted | $ | (0.03 | ) | $ | (0.08 | ) | ||
| Weighted average number of common shares outstanding, basic and diluted | 900,000 | 900,000 | ||||||
(Unaudited)
| Three months ended September 30, | Six months ended September 30, | |||||||||||||||
| 2021 | 2020 | 2021 | 2020 | |||||||||||||
| REVENUE | $ | 16,837 | $ | 47,489 | $ | 27,883 | $ | 139,463 | ||||||||
| COST AND EXPENSES: | ||||||||||||||||
| Cost of revenue | (6,732 | ) | (17,485 | ) | (10,721 | ) | (41,984 | ) | ||||||||
| General and administrative expenses | (137,397 | ) | (91,327 | ) | (259,265 | ) | (192,529 | ) | ||||||||
| Total operating costs and expenses | (144,129 | ) | (108,812 | ) | (269,986 | ) | (234,513 | ) | ||||||||
| Loss from operations | (127,292 | ) | (61,323 | ) | (242,103 | ) | (95,050 | ) | ||||||||
| Other income, Net | 13,136 | 4,357 | 21,516 | 13,329 | ||||||||||||
| Loss before income tax | (114,156 | ) | (56,966 | ) | (220,587 | ) | (81,721 | ) | ||||||||
| Income tax expense | - | - | - | - | ||||||||||||
| Net Loss | (114,156 | ) | (56,966 | ) | (220,587 | ) | (81,721 | ) | ||||||||
| Foreign currency translation income/ (loss) | 6,845 | (26,670 | ) | 9,147 | (32,222 | ) | ||||||||||
| Total comprehensive loss | $ | (107,311 | ) | $ | (83,636 | ) | $ | (211,440 | ) | $ | (113,943 | ) | ||||
| NET LOSS PER SHARE, BASIC AND DILUTED | $ | (0.11 | ) | $ | (0.06 | ) | $ | (0.21 | ) | $ | (0.09 | ) | ||||
| WEIGHTED AVERAGE NUMBER OF COMMON SHARES OUTSTANDING, BASIC AND DILUTED | 1,000,000 | 900,000 | 1,000,000 | 900,000 | ||||||||||||
See accompanying notes to the unaudited condensed consolidated financial statements.
| F-2 |
SYNERGY EMPIRE LIMITED
CONDENSED CONSOLIDATED STATEMENTS OF CHANGES IN STOCKHOLDERS’ EQUITY
FOR THE THREE AND SIX MONTHS ENDED JUNESEPTEMBER 30, 20202021 AND 20192020
(Currency expressed in United States Dollars (“US$”), except for number of shares)
| Common Stock | ||||||||||||||||||||||||
| NUMBER OF Shares | Amount | Additional Paid-in Capital | Accumulated (DEFICIT)/ PROFIT | Accumulated comprehensive loss | Total STOCKHOLDERS EQUITY | |||||||||||||||||||
| Balance as of April 1, 2020 | 900,000 | $ | 90 | $ | 284,093 | $ | (1,144,401 | ) | $ | (2,109 | ) | $ | (862,327 | ) | ||||||||||
| Net loss for the period | - | - | - | (24,755 | ) | - | (24,755 | ) | ||||||||||||||||
| Foreign currency translation | - | - | - | - | (5,552 | ) | (5,552 | ) | ||||||||||||||||
| Balance as of June 30, 2020 | 900,000 | $ | 90 | $ | 284,093 | $ | (1,169,156 | ) | $ | (7,661 | ) | $ | (892,634 | ) | ||||||||||
| Common Stock | ||||||||||||||||||||||||
| NUMBER OF Shares | Amount | Additional Paid-in Capital | Accumulated (DEFICIT)/ PROFIT | Accumulated comprehensive loss | Total STOCKHOLDERS EQUITY | |||||||||||||||||||
| Balance as of April 1, 2019 | 900,000 | $ | 90 | $ | 284,093 | $ | (928,586 | ) | $ | (43,298 | ) | $ | (687,701 | ) | ||||||||||
| Net loss for the period | - | - | - | (68,230 | ) | - | (68,230 | ) | ||||||||||||||||
| Foreign currency translation | - | - | - | - | (3,247 | ) | (3,247 | ) | ||||||||||||||||
| Balance as of June 30, 2019 | 900,000 | $ | 90 | $ | 284,093 | $ | (996,816 | ) | $ | (46,545 | ) | $ | (759,178 | ) | ||||||||||
(Unaudited)
| Common Stock | ||||||||||||||||||||||||
| NUMBER OF Shares | Amount | Additional Paid-in Capital | Accumulated DEFICIT | Accumulated comprehensive loss | Total STOCKHOLDERS EQUITY | |||||||||||||||||||
| Balance as of April 1, 2021 | 1,000,000 | $ | 100 | $ | 784,083 | $ | (1,156,263 | ) | $ | (34,804 | ) | $ | (406,884 | ) | ||||||||||
| Net loss for the period | - | - | - | (106,431 | ) | - | (106,431 | ) | ||||||||||||||||
| Foreign currency translation | - | - | - | - | 2,302 | 2,302 | ||||||||||||||||||
| Balance as of June 30, 2021 | 1,000,000 | $ | 100 | $ | 784,083 | $ | (1,262,694 | ) | $ | (32,502 | ) | $ | (511,013 | ) | ||||||||||
| Net loss for the period | - | - | - | (114,156 | ) | - | (114,156 | ) | ||||||||||||||||
| Foreign currency translation gain | - | - | - | - | 6,845 | 6,845 | ||||||||||||||||||
| Balance as of September 30, 2021 | 1,000,000 | $ | 100 | $ | 784,083 | $ | (1,376,850 | ) | $ | (25,657 | ) | $ | (618,324 | ) | ||||||||||
| Common Stock | ||||||||||||||||||||||||
| NUMBER OF Shares | Amount | Additional Paid-in Capital | Accumulated DEFICIT | Accumulated comprehensive loss | Total STOCKHOLDERS EQUITY | |||||||||||||||||||
| Balance as of April 1, 2020 | 900,000 | $ | 90 | $ | 284,093 | $ | (1,144,401 | ) | $ | (2,109 | ) | $ | (862,327 | ) | ||||||||||
| Net loss for the period | - | - | - | (24,755 | ) | - | (24,755 | ) | ||||||||||||||||
| Foreign currency translation loss | - | - | - | - | (5,552 | ) | (5,552 | ) | ||||||||||||||||
| Balance as of June 30, 2020 | 900,000 | $ | 90 | $ | 284,093 | $ | (1,169,156 | ) | $ | (7,661 | ) | $ | (892,634 | ) | ||||||||||
| Net loss for the period | - | - | - | (56,966 | ) | - | (56,966 | ) | ||||||||||||||||
| Foreign currency translation loss | - | - | - | - | (26,670 | ) | (26,670 | ) | ||||||||||||||||
| Foreign currency translation gain (loss) | - | - | - | - | (26,670 | ) | (26,670 | ) | ||||||||||||||||
| Balance as of September 30, 2020 | 900,000 | $ | 90 | $ | 284,093 | $ | (1,226,122 | ) | $ | (34,331 | ) | $ | (976,270 | ) | ||||||||||
See accompanying notes to consolidated financial statements
| F-3 |
SYNERGY EMPIRE LIMITED
CONDENSED CONSOLIDATED STATEMENTS OF CASH FLOWS
FOR THREESIX MONTHS ENDED JUNESEPTMEBER 30, 20202021 AND 20192020
(Currency expressed in United States Dollars (“US$”), except for number of shares)
For the Three Months Ended, June 30 | For the Six Months Ended, September 30 | |||||||||||||||
| 2020 | 2019 | 2021 | 2020 | |||||||||||||
| (Unaudited) | (Unaudited) | (Unaudited) | (Unaudited) | |||||||||||||
| CASH FLOWS FROM OPERATING ACTIVITIES: | ||||||||||||||||
| Net loss | $ | (24,755 | ) | $ | (68,230 | ) | $ | (220,587 | ) | $ | (81,721 | ) | ||||
| Adjustments to reconcile net loss to net cash used in operating activities | ||||||||||||||||
| Depreciation expenses | 24,891 | 24,406 | 71,480 | 50,819 | ||||||||||||
| Disposal of fixed assets | - | (10,121 | ) | |||||||||||||
| Changes in operating assets and liabilities: | ||||||||||||||||
| Decrease/(Increase) in accounts receivable | - | (2,483 | ) | |||||||||||||
| Decrease/(Increase) in inventories | 4 | 2,307 | ||||||||||||||
| Decrease/(Increase) in prepaid expenses | (2,267 | ) | (1,019 | ) | ||||||||||||
| Increase/(Decrease) in accounts payable | (4,725 | ) | 1,181 | |||||||||||||
| Increase/(Decrease) in accrued liabilities | (9,442 | ) | 11,407 | |||||||||||||
| (Increase)/Decrease in inventories | (3,970 | ) | 1,981 | |||||||||||||
| Increase in prepaid expenses | (687 | ) | (5,279 | ) | ||||||||||||
| Decrease in accounts payable | (830 | ) | (2,136 | ) | ||||||||||||
| Decrease in accrued liabilities | (100,285 | ) | (3,962 | ) | ||||||||||||
| Change in operating lease liability | (17,684 | ) | (17,712 | ) | (31,824 | ) | (36,181 | ) | ||||||||
| Net cash flows used in operating activities | $ | (33,978 | ) | $ | (50,143 | ) | $ | (286,703 | ) | $ | (86,600 | ) | ||||
| CASH FLOWS FROM INVESTING ACTIVITIES: | ||||||||||||||||
| Purchase of plant and equipment | (701 | ) | (18,312 | ) | (31,659 | ) | (1,699 | ) | ||||||||
| Net cash flows used in investing activities | $ | (701 | ) | $ | (18,312 | ) | ||||||||||
| Application of trademark | (1,579 | ) | - | |||||||||||||
| Sale proceeds from disposal of plant and equipment | - | 10,121 | ||||||||||||||
| Net cash flows (used in)/provided by investing activities | $ | (33,238 | ) | $ | 8,422 | |||||||||||
| CASH FLOWS FROM FINANCING ACTIVITIES: | ||||||||||||||||
| (Repayment to)/advance from related parties | (9,418 | ) | 53,436 | |||||||||||||
| Repayment to from related parties | - | (8,847 | ) | |||||||||||||
| Advance from directors | 17,644 | 7,092 | 5,984 | 88,511 | ||||||||||||
| Principal repayments of hire purchase | - | (2,607 | ) | |||||||||||||
| Principal repayments of bank loan | 78 | (3,106 | ) | (7,590 | ) | 1,290 | ||||||||||
| Net cash flows provided by financing activities | $ | 8,304 | $ | 54,815 | ||||||||||||
| Net cash flows (used in)/provided by financing activities | $ | (1,606 | ) | $ | 80,954 | |||||||||||
| Effect of exchange rate changes in cash and cash equivalents | $ | 236 | $ | (415 | ) | $ | 3,312 | $ | 2,244 | |||||||
| Net changes in cash and cash equivalents | (26,139 | ) | (14,055 | ) | (318,235 | ) | 5,020 | |||||||||
| Cash and cash equivalents, beginning of year | 87,492 | 63,170 | 345,161 | 87,492 | ||||||||||||
| CASH AND CASH EQUIVALENTS, END OF YEAR | $ | 61,353 | $ | 49,115 | $ | 26,926 | $ | 92,512 | ||||||||
| SUPPLEMENTAL CASH FLOWS INFORMATION | ||||||||||||||||
| Income taxes paid | $ | - | $ | - | $ | - | $ | - | ||||||||
| Interest paid | $ | 1,586 | $ | 1,615 | $ | 1,794 | $ | 2,820 | ||||||||
See accompanying notes to the unaudited condensed consolidated financial statements.
| F-4 |
SYNERGY EMPIRE LIMITED
NOTES TO UNAUDITED CONDENSED CONSOLIDATED FINANCIAL STATEMENTS
FOR THE THREESIX MONTHS ENDED JUNESEPTEMBER 30, 20202021 AND 20192020
(Currency expressed in United States Dollars (“US$”), except for number of shares)
1. ORGANIZATION AND BUSINESS BACKGROUND
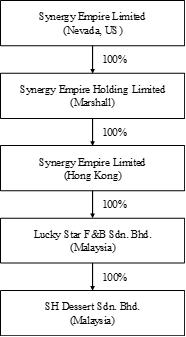
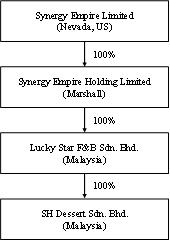
Synergy Empire Limited (“the Company”) was incorporated under the laws of the State of Nevada on October 17, 2018. We have historically conducted our business through Lucky Star F&B Sdn. Bhd. and SH Dessert Sdn. Bhd, both are private limited liability company, incorporated in Malaysia.
On January 16, 2019, the Company acquired 100%100% of the equity interests of Synergy Empire Holding Limited, a company incorporated in Republic of the Marshall Islands (“Synergy Empire Marshall”).
On December 31, 2018, Synergy Empire Marshall acquired 100%100% of Synergy Empire Limited, a limited liability company incorporated in Hong Kong (“Synergy Empire HK”).
On February 21, 2019, Synergy Empire HK acquired 100%100% of the equity interests of Lucky Star F&B Sdn. Bhd., a limited liability company incorporated in Malaysia (“Lucky Star”).
Lucky Star acquired 100%100% of the equity interests of SH Dessert Sdn. Bhd., a limited liability company incorporated in Malaysia (“SH Dessert”) by Lucky Star on February 19, 2016.
On February 26, 2021, Synergy Empire Marshall acquired 100% of Lucky Star F&B Sdn. Bhd from Synergy Empire HK. Subsequently on March 31, 2021, Mr. Leong Will Liam acquired 100% of Synergy Empire HK, as such Synergy Empire HK is no longer a subsidiary of the Company.
Mr. Leong Will Liam is the common director and major shareholder of the Company, Synergy Empire Marshall, Synergy Empire HK, Lucky Star and SH Dessert. As a result of this common ownership and in accordance with the FASB Accounting Standards Codification Section 805 “Business Combination”, the transaction is being treated as a combination between entities under common control. The recognized assets and liabilities were transferred at their carrying amounts at the date of the transaction. The equity accounts of the combining entities are combined. Further, the companies will be combined retrospectively for prior year comparative information as if the transaction had occurred on April 1, 2017.
The Company, through its wholly owned subsidiaries, produce and distribute high quality dessert through Lucky Star and operate fourtwo restaurants through SH Dessert. Details of the Company’s subsidiaries:
SCHEDULE OF COMPANY'S SUBSIDIARIES
| No. | Company Name | Domicile and Date of Incorporation | Particulars of Issued Capital | Principal Activities | ||||
| 1 | Synergy Empire Holding Limited | Marshall Islands, October 22, 2018 | Share of Ordinary Share, US$1 each | Investment Holding | ||||
| 2 | ||||||||
| Lucky Star F&B Sdn. Bhd. | Malaysia, February 9, 2010 | Share of Ordinary Share, | Dessert Producer and Distributor | |||||
| SH Dessert Sdn. Bhd. | Malaysia, February 19, 2016 | Share of Ordinary Share, | Restaurant Operator |
| F-5 |
2. SUMMARY OF SIGNIFICANT ACCOUNTING POLICIES
Basis of Presentation
These accompanying financial statements have been prepared in accordance with generally accepted accounting principles in the United States of America (“US GAAP”).
The accompanying financial statements include the accounts of the Company and its wholly-owned subsidiaries. Intercompany transactions and balances were eliminated in consolidation.
Below is the organization chart of the Group.
Use of Estimates
In preparing these financial statements, management makes estimates and assumptions that affect the reported amounts of assets and liabilities in the balance sheets and revenues and expenses during the years reported. Actual results may differ from these estimates.
Cash and Cash Equivalents
The Company considers short-term, highly liquid investments with an original maturity of 90 days or less to be cash equivalents.
Our deposit in Hong Kong is currently deposit in CMB Wing Lung Bank Limited, and there is a Deposit Protection Scheme protects our eligible deposits held with bank in Hong Kong which is members of the Scheme. The scheme will pay us a compensation up to a limit of Hong Kong Dollars (“HKD”) 500,000, which is equivalent to $64,516, if CMB Wing Lung Bank fails.
Our deposit in Malaysia is currently deposit in Public Bank Berhad and Standard Chartered Bank (Malaysia) Berhad, and there is a Perbadanan Insurans Deposit Malaysia protects our eligible deposits held with bank in Malaysia which is members of the Scheme. The scheme will pay a compensation up to a limit of Malaysia Ringgit (“MYR”) 250,000 per deposit per member bank, which is equivalent to $59,304$60,155 if the aforementioned banks fails.
Plant and Equipment
Plant and equipment are stated at cost, with depreciation and amortization provided using the straight-line method over the following periods:
SCHEDULE OF DEPRECIATION AND AMORTIZATION PERIODS OF PLANT AND EQUIPMENT
| Asset Categories | Depreciation Periods | |
| Renovation | over the remaining lease period | |
| Office and kitchen equipment | 10 years | |
| Motor vehicle | 5 years |
Intangible Asset
Intangible assets are stated at cost, with amortization provided using the straight-line method over the following periods:
SCHEDULE OF AMORTIZATION PERIOD OF INTANGIBLE ASSET
| Asset Categories | Amortization Periods | |
| Trademark | 10 years |
| F-6 |
Inventories
Inventories consisting of products available for sell, are stated at the lower of cost or market value. Cost of inventory is determined using the first-in, first-out (FIFO) method. Inventory reserve is recorded to write down the cost of inventory to the estimated market value due to slow-moving merchandise and damaged goods, which is dependent upon factors such as historical and forecasted consumer demand, and promotional environment. The Company takes ownership, risks and rewards of the products purchased. Write downs are recorded in cost of revenue in the consolidated statements of operations and comprehensive income (loss).
Revenue recognition
Revenue is generated through sale of goods and delivery services. Revenue is recognized when a customer obtains control of promised goods or services and is recognized in an amount that reflects the consideration that the Company expects to receive in exchange for those goods or services. In addition, the standard requires disclosure of the nature, amount, timing, and uncertainty of revenue and cash flows arising from contracts with customers. The amount of revenue that is recorded reflects the consideration that the Company expects to receive in exchange for those goods and services. The Company applies the following five-step model in order to determine this amount:
(i) identification of the promised goods and services in the contract;
(ii) determination of whether the promised goods and services are performance obligations, including whether they are distinct in the context of the contract;
(iii) measurement of the transaction price, including the constraint on variable consideration;
(iv) allocation of the transaction price to the performance obligations; and
(v) recognition of revenue when (or as) the Company satisfies each performance obligation.
The Company adopted ASU 2014-09, Revenue from Contracts with Customers (Topic 606). Under Topic 606, the Company records revenue when persuasive evidence of an arrangement exists, delivery has occurred, the fee is fixed or determinable and collectability is probable. The Company records revenue from the sale of product upon shipment or delivery of the products to the customer. The Company doesn’t allow return of the products purchased or refund unless the food delivered is spoilt.
Cost of revenue
Cost of revenue includes the purchase cost of raw material for manufacturing and distribute to customers and packing materials. It includes purchasing and receiving costs, internal transfer costs, other costs of distribution network, opening and closing inventory net off discount received and return outwards in cost of revenue.
Income tax expense
Income taxes are determined in accordance with the provisions of ASC Topic 740, “Income Taxes” (“ASC Topic 740”). Under this method, deferred tax assets and liabilities are recognized for the future tax consequences attributable to differences between the financial statement carrying amounts of existing assets and liabilities and their respective tax basis. Deferred tax assets and liabilities are measured using enacted income tax rates expected to apply to taxable income in the years in which those temporary differences are expected to be recovered or settled. Any effect on deferred tax assets and liabilities of a change in tax rates is recognized in income in the period that includes the enactment date.
ASC 740 prescribes a comprehensive model for how companies should recognize, measure, present, and disclosed in their financial statements uncertain tax positions taken or expected to be taken on a tax return. Under ASC 740, tax positions must initially be recognized in the financial statements when it is more likely than not the position will be sustained upon examination by the tax authorities. Such tax positions must initially and subsequently be measured as the largest amount of tax benefit that has a greater than 50% likelihood of being realized upon ultimate settlement with the tax authority assuming full knowledge of the position and relevant facts.
The Company conducts major businesses in Malaysia and is subject to tax in their own jurisdictions. As a result of its business activities, the Company will file separate tax returns that are subject to examination by the foreign tax authorities.
| F-7 |
Foreign currencies translation
Transactions denominated in currencies other than the functional currency are translated into the functional currency at the exchange rates prevailing at the dates of the transaction. Monetary assets and liabilities denominated in currencies other than the functional currency are translated into the functional currency using the applicable exchange rates at the balance sheet dates. The resulting exchange differences are recorded in the statement of operations and comprehensive income (loss).
The functional currency of the Company is the United States Dollars (“US$”) and the accompanying financial statements have been expressed in US$. In addition, the Company’s subsidiary maintains its books and record in the respective local currency, Hong Kong Dollars (“HK$”) and Malaysian Ringgits (“MYR”), which is the respective functional currency as being the primary currency of the economic environment in which the entity operates.
In general, for consolidation purposes, assets and liabilities of its subsidiaries whose functional currency is not US$ are translated into US$, in accordance with ASC Topic 830-30, “Translation of Financial Statement”, using the exchange rate on the balance sheet date. Revenues and expenses are translated at average rates prevailing during the period. The gains and losses resulting from translation of financial statements of foreign subsidiary are recorded as a separate component of accumulated other comprehensive income.
Translation of amounts from the local currency of the Company into US$1 has been made at the following exchange rates for the respective periods:
SCHEDULE OF EXCHANGE RATE TRANSLATION OF AMOUNTS FROM LOCAL CURRENCY
For the three months ended June 30 | For the six months ended September 30 | |||||||||||||||
| 2020 | 2019 | 2021 | 2020 | |||||||||||||
| Period-end MYR : US$1 exchange rate | 4.28 | 4.13 | 4.18 | 4.15 | ||||||||||||
| Period-average MYR : US$1 exchange rate | 4.31 | 4.15 | 4.16 | 4.25 | ||||||||||||
| Period-end/Period-average HK$ : US$1 exchange rate | 7.75 | 7.75 | ||||||||||||||
Related parties
Parties, which can be a corporation or individual, are considered to be related if the Company has the ability, directly or indirectly, to control the other party or exercise significant influence over the other party in making financial and operating decisions. Companies are also considered to be related if they are subject to common control or common significant influence.
Fair value of financial instruments
The carrying value of the Company’s financial instruments: cash and cash equivalents, trade receivable, deposits and other receivables, amount due to related parties and other payables approximate at their fair values because of the short-term nature of these financial instruments.
The Company also follows the guidance of the ASC Topic 820-10, “Fair Value Measurements and Disclosures” (“ASC 820-10”), with respect to financial assets and liabilities that are measured at fair value. ASC 820-10 establishes a three-tier fair value hierarchy that prioritizes the inputs used in measuring fair value as follows:
Level 1 : Observable inputs such as quoted prices in active markets;
Level 2 : Inputs, other than the quoted prices in active markets, that are observable either directly or indirectly; and
Level 3 : Unobservable inputs in which there is little or no market data, which require the reporting entity to develop its own assumptions.
As of JuneSeptember 30, 20202021 and 2019,2020, the Company did not have any nonfinancial assets and liabilities that are recognized or disclosed at fair value in the financial statements, at least annually, on a recurring basis, nor did the Company have any assets or liabilities measured at fair value on a non-recurring basis.
The Company calculates net income/(loss) per share in accordance with ASC Topic 260, “Earnings per Share.” Basic income/(loss) per share is computed by dividing the net income/(loss) by the weighted-average number of common shares outstanding during the period. Diluted income per share is computed similar to basic income/(loss) per share except that the denominator is increased to include the number of additional common shares that would have been outstanding if the potential common stock equivalents had been issued and if the additional common shares were dilutive.
| F-8 |
Recently Issued Accounting Standards
In February 2016, the FASB issued ASU 2016-02, “Leases (Topic 842),” to increase transparency and comparability among organizations by recognizing lease assets and lease liabilities on the balance sheet and disclosing key information about leasing arrangements. Most prominent among the amendments is the recognition of assets and liabilities by lessees for those leases classified as operating leases under current U.S. GAAP. ASU 2016-02 is effective for fiscal years beginning after December 15, 2018, including interim periods within those fiscal years. As required by the standard, the Company will adopt the provisions of the new standard effective April 1, 2019, using the required modified retrospective approach. We believe the adoption will not have a material impact on our financial statements.
In September 2016, the FASB issued ASU 2016-13, Measurement of Credit Losses on Financial Instruments (Topic 326), which replaces the incurred-loss impairment methodology and requires immediate recognition of estimated credit losses expected to occur for most financial assets, including trade receivables. Credit losses on available-for-sale debt securities with unrealized losses will be recognized as allowances for credit losses limited to the amount by which fair value is below amortized cost. ASU 2016-13 is effective for the Company beginning January 1, 2020 and early adoption is permitted. The Company does not believe the potential impact of the new guidance and related codification improvements will be material to its financial position, results of operations and cash flows.
Other recentRecent accounting pronouncements issued by the FASB, including its Emerging Issues Task Force, the American Institute of Certified Public Accountants, and the Securities and Exchange Commission did not or are not believed by management to have a material impact on the Company’s present or future financial statements.
3. GOING CONCERN UNCERTAINTIES
The accompanying financial statements have been prepared assuming that the Company will continue as a going concern. The company having accumulated deficit of $1,169,156$1,376,850 and $1,144,401$1,156,263 as of JuneSeptember 30, 20202021 and March 31, 20202021, respectively.
For the threesix months ended JuneSeptember 30, 20202021 and 2019,2020, the Company suffered from a net loss of $24,755$220,587 and $68,230$81,721 respectively.
For the six months ended September 30, 2021 and 2020, the Company recorded operating cash outflows of $286,703 and $86,600 in operating activities respectively.
Furthermore, the Company recorded a negative working capital of $1,037,975$983,992 and $1,029,235$769,069 as of as of JuneSeptember 30, 20202021 and March 31, 20202021 respectively.
The Company’s cash position is not significant to support the Company’s daily operations. While the Company believes in the viability of its strategy and in its ability to raise additional funds, there can be no assurances to that effect. The Company’s ability to continue as a going concern is dependent upon its ability to improve profitability and the ability to acquire financial support from its shareholder.
These and other factors raise substantial doubt about the Company’s ability to continue as a going concern within one year after the date that financial statements are issued. These financial statements do not include any adjustments to reflect the possible future effects on the recoverability and classification of assets or the amounts and classification of liabilities that may result in the Company not being able to continue as a going concern.
4. PREPAID EXPENSES AND DEPOSITS
SCHEDULE OF PREPAID EXPENSES AND DEPOSITS
As of June 30, 2020 | As of March 31, 2020 | As of September 30, 2021 (Unaudited) | As of March 31, 2021 (Audited) | |||||||||||||
| Rental deposits | $ | 20,607 | $ | 20,468 | $ | 22,151 | $ | 23,951 | ||||||||
| Other deposits | 1,802 | - | ||||||||||||||
| Prepaid expenses | 2,101 | 2,001 | 1,248 | 1,017 | ||||||||||||
| Other receivables | 3,477 | 1,274 | 1,605 | 1,419 | ||||||||||||
| Total | $ | 26,185 | $ | 23,743 | $ | 26,806 | $ | 26,387 | ||||||||
The rental deposits represent the deposit of the tenancy agreements.
Other deposits consist of deposit of copy machine, coffee machine and security deposits.
Prepaid expenses represent the deposit payments of public utilities, such as electricity, telephone, and water supplies.
Other receivables represent payment made on behalf of customers such as lorry rental.rental and outstanding payment due from delivery platform.
5. INVENTORIES
SCHEDULE OF INVENTORIES
As of June 30, 2020 | As of March 31, 2020 | |||||||
| Raw material, at cost | $ | 17,125 | $ | 17,005 | ||||
As of September 30, 2021 (Unaudited) | As of March 31, 2021 (Audited) | |||||||
| Raw material, at cost | $ | 15,306 | $ | 11,482 | ||||
| F-9 |
6. PLANT AND EQUIPMENT
SCHEDULE OF PLANT AND EQUIPMENT
| As of June 30, 2020 | As of March 31, 2020 | As of (Unaudited) | As of March 31, 2021 (Audited) | |||||||||||||
| Renovation | $ | 155,287 | $ | 154,240 | $ | 359,751 | $ | 354,963 | ||||||||
| Office equipment | 1,325 | 1,316 | 38,493 | 21,741 | ||||||||||||
| Kitchen equipment | 9,739 | 8,973 | 21,392 | 15,457 | ||||||||||||
| Motor vehicle | 41,781 | 41,500 | 11,709 | 11,828 | ||||||||||||
| Total plant and equipment | $ | 208,132 | $ | 206,029 | $ | 431,345 | $ | 403,989 | ||||||||
| Less: Accumulated depreciation | (77,936 | ) | (70,585 | ) | (113,700 | ) | (75,744 | ) | ||||||||
| Total plant and equipment | $ | 130,196 | $ | 135,444 | $ | 317,645 | $ | 328,245 | ||||||||
For the threesix months ended JuneSeptember 30, 2021, the Company has invested $6,135 in kitchen equipment, $8,434 in renovations and $17,090 in office equipment respectively.
For the six months ended September 30, 2020, the Company had invested $700$1,699 into kitchen equipment.equipment and disposed motor vehicle amounted $31,294 which were fully depreciated for a consideration of $10,121.
The depreciationDepreciation expenses for six months ended September 30, 2021 and 2020 amounted to $38,991 and $13,876 respectively.
7. INTANGIBLE ASSET
SCHEDULE OF INTANGIBLE ASSET
As of (Unaudited) | As of March 31, 2021 (Audited) | |||||||
| Trademark | $ | 1,569 | $ | - | ||||
| Less: Accumulated depreciation | (66 | ) | - | |||||
| Total plant and equipment | $ | 1,503 | $ | - | ||||
On May 11, 2021, the Company was granted approval by Intellectual Property Corporation of Malaysia for trademark application with 10 yearsvalidity with an aggregate cost of $1,579, filed by Lucky Star under class 30 and 43, the $10 difference in capitalization cost against cash flow is due to foreign translation difference.
Amortization expenses for the threesix months ended JuneSeptember 30, 2020 and 20192021 amounted to $6,831 and $6,304 respectively.$66.
NaN amortization expenses have been incurred for the six months ended September 30, 2020.
7. 8. ACCRUED EXPENSES AND OTHER PAYABLES
SCHEDULE OF ACCRUED EXPENSES AND OTHER PAYABLES
| As of June 30, 2020 | As of March 31, 2020 | As of September 30, 2021 (Unaudited) | As of March 31, 2021 (Audited) | |||||||||||||
| Accrued expenses | $ | 44,748 | $ | 53,244 | $ | 31,438 | $ | 35,066 | ||||||||
| Other payables | 90,438 | 90,587 | 37,792 | 135,383 | ||||||||||||
| Total | $ | 135,186 | $ | 143,831 | $ | 69,230 | $ | 170,449 | ||||||||
Accrued expenses consistedconsist of accrued salary, rental, utilities bills, audit fee, while other payables consistedexpenses and professional fee.
Other payable consist of some third-party loans.outstanding marketing expenses and sales and service tax payable.
The loan from third-party amounted to $54,060 and $53,973 as of June 30 and March 31, 2020 respectively, is unsecured, non-interest bearing and payable on demand.
8. AMOUNT DUE TO RELATED PARTIES
As of March 31, 2020 and 2019, the Company has an outstanding loan payable to our CEO, Mr. Law Jia Ming of $280,180 and $216,911 respectively. This loan is unsecured, non-interest bearing and payable on demand. Mr. Law Jia Ming was a director of our subsidiaries, Lucky Star F&B Sdn. Bhd. and SH Desserts Sdn Bhd., until February 21, 2019 and July 1, 2019 respectively. He has been our CEO and CFO since October 17, 2018.
| Amount due to related party, Mr. Law Jia Ming | ||||
| Balance as of March 31, 2019 | $ | 216,911 | ||
| Advancement from related party | 77,487 | |||
| Foreign currency translation | (14,218 | ) | ||
| Balance as of March 31, 2020 | $ | 280,180 | ||
| Repayment from related party | (9,418 | ) | ||
| Foreign currency translation | 1,847 | |||
| Balance as of June 30, 2020 | $ | 272,609 | ||
For the three months ended June 30, 2019, Mr. Law Jia Ming has advanced $6,823 to the Company.
For the three months ended June 30, 2020, the Company has repaid $9,418 to Mr. Law Jia Ming.
| F-10 |
9. AMOUNT DUE TO A DIRECTOR
As of March 31, 2019,2021, the Company has an outstanding loan payable to Mr. Leong Will Liam amounted $499,261.$894,480. Of which including an amount due to CBA Capital Holdings Sdn. Bhd, a company solely owned and controlled by Mr. Leong Will Liam,Synergy Empire HK, amounted to $24,822, which is$24,822.
No transaction for the consideration accrued by Company to acquired Lucky Star from its existing shareholder, paid by CBA Capital Holdings Sdn. Bhdsix months ended September 30, 2021, other than currency exchange fluctuation on behalf of the Company and a loan from directly from Mr. Leong Will Liam amounted $474,439.balance outstanding.
For the year ended March 31, 2020, Mr. Leong Will Liam has further loaned $173,862 to the Company.
As of March 31, 2020,September 30, 2021, the Company has an outstanding loan payable to Mr. Leong Will Liam amounted $644,072. Of$892,354, of which including an amount due to CBA Capital Holdings Sdn. Bhd.Synergy Empire HK, amounted $24,822.$24,822.
For the three months ended June 30, 2020, Mr. Leong Will Liam has further advance $17,644 to the Company.
As of March 31, 2020, the Company has an outstanding loan payable to Mr. Leong Will Liam amounted $665,673. Of which including an amount due to CBA Capital Holdings Sdn. Bhd. amounted $24,822.
Both aforementioned loans are unsecured, non-interest bearing and payable on demand.
SCHEDULE OF AMOUNT DUE TO DIRECTORS
| Amount due to director, Mr. Leong Will Liam | ||||
| Balance as of March 31, 2019 | $ | 474,439 | ||
| Loan from Director | 173,862 | |||
| Foreign currency translation | (29,051 | ) | ||
| Balance as of March 31, 2020 | $ | 619,250 | ||
| Advances from Director | 17,644 | |||
| Foreign currency translation | 3,957 | |||
| Balance as of June 30, 2020 | $ | 640,851 | ||
| Amount due to director, Mr. Leong Will Liam thru Synergy Empire HK | ||||
| Balance as of March 31, 2021 | 24,822 | |||
| Foreign currency translation | - | |||
| Balance as of September 30, 2021 | 24,822 |
| Amount due to director, Mr. Leong Will Liam directly | ||||
| Balance as of March 31, 2021 | 869,658 | |||
| Foreign currency translation | 2,126 | |||
| Balance as of September 30, 2021 | 867,532 |
On January 21, 2019, the Company acquired Lucky Star from its existing shareholder for a consideration of $24,822 which was paid by CBA Capital Holdings Sdn. Bhd., a company solely owned and controlled by our sole director, Mr. Leong Will Liam, on behalf of the Company. CBA Capital Holdings Sdn. Bhd. lent and waived an interest-free loan of $257,183 in Lucky Star F&B Sdn. Bhd., our wholly own subsidiary, as contribution and recorded in additional paid in capital.
No transaction took place for the year ended March 31, 2020 and three months ended June 30, 2020
| Amount due to director, CBA Capital Holdings Sdn. Bhd. | ||||
| Balance as of March 31, 2020 | $ | 24,822 | ||
| Balance as of June 30, 2020 | $ | 24,822 | ||
10. BANK BORROWING
On January 25, 2017, Lucky Star F&B Sdn. Bhd., a wholly owned subsidiary of the Company has acquired a business loan from Standard Chartered Saadiq Berhad, a bank incorporated in Malaysia, amounted to MYR342,834MYR342,834 (approximately $83,972)$82,493) at annual interest rate of 6.00% accrue6.00% accrued in arrear, for a repayment period of 72 months with interest bearing monthly installment of MYR6,473MYR6,473 (approximately $1,585)$1,558) which is the sole bank borrowing other than hire purchase obtained by the Company while the last repayment is expected on February 5, 2023.Company.
The outstanding balance of business loan as of September 30 and March 31, 2019 and 20182021 can be summarized as follow:
SUMMARY OF OUTSTANDING BALANCE OF BUSINESS LOANS
| As of June 30, 2020 | As of March 31, 2020 | As of September 30, 2021 (Unaudited) | As of March 31, 2021 (Audited) | |||||||||||||
| Bank borrowing (Current portion) | $ | 9,342 | $ | 15,267 | $ | 16,208 | $ | 15,559 | ||||||||
| Bank borrowing (Non-current portion) | 36,767 | 30,453 | 17,231 | 25,836 | ||||||||||||
| Total | $ | 46,109 | $ | 45,720 | $ | 33,439 | $ | 41,395 | ||||||||
For the threesix months ended JuneSeptember 30, 2020,2021, the Company repaid $1,116$7,590 while incurring additional $1,194$1,794 interest in loan deferment.
For the three months ended June 30, 2019, the Company repaid $3,106 in bank borrowings.
On April 1, 2020, Standard Chartered Saadiq Berhad announced to provide loan deferment to borrower for a period 6 months in supporting of Malaysia National Bank to ease financial pressure as a result of movement control order promulgated by Malaysia Government to contain the outbreak of COVID-19.
Pursuant to the announcement, no instalment is required, and no penalty will be imposed during the 6 months period however additional non-compounding interest will continue to accrue. As such, the Company has incurred additional interest of $1,257$2,820 interest expenses.
For the six months ended September 30, 2020, the Company repaid $1,319 while incurring additional $2,820 interest in loan deferment.
| F-11 |
Maturities of the loan for each of the five years and thereafter are as follows:
SCHEDULE OF MATURITIES OF LOAN
| 1 | ||||||||
| Year ending March 31 | ||||||||
| 2021 | $ | 5,729 | ||||||
| 2022 | $ | 15,042 | $ | 7,902 | ||||
| 2023 | $ | 16,618 | $ | 17,015 | ||||
| 2024 | $ | 8,720 | $ | 8,522 | ||||
| 2025 | $ | - | ||||||
| Total | $ | 46,109 | $ | 33,439 | ||||
11. LEASE - RIGHT-OF-USE ASSET AND LEASE LIABILITIES
SCHEDULE OF OPERATING LEASE RIGHT-OF-USE AND LEASE LIABILITIES
The Company officially adopted ASC 842 for the period on and after April 1, 2019 as permitted by ASU 2016-02. ASC 842 originally required all entities to use a “modified retrospective” transition approach that is intended to maximize comparability and be less complex than a full retrospective approach. On July 30, 2018, the FASB issued ASU 2018-11 to provide entities with relief from the costs of implementing certain aspects of the new leasing standard, ASU 2016-02 of which permits entities may elect not to recast the comparative periods presented when transitioning to ASC 842. As permitted by ASU 2018-11, the Company elect not to recast comparative periods, thusly.
As of March 31, 2020, the Company recognized approximately US$215,043, lease liability as well as right-of-use asset for all leases (with the exception of short-term leases) at the commencement date. Lease liabilities are measured at present value of the sum of remaining rental payments as of March 31, 2020, with discounted rate of 6.65% adopted from Malayan Banking (Maybank) Berhad’s base lending rate as a reference for discount rate, as this bank is the largest bank and national bank of Malaysia.
A single lease cost is recognized over the lease term on a generally straight-line basis. All cash payments of operating lease cost are classified within operating activities in the statement of cash flows.
The initial recognition of operating lease right and lease liability as follow:
| Gross lease payable | $ | 209,249 | ||
| Less: imputed interest | (25,507 | ) | ||
| Initial recognition as of April 1, 2019 | $ | 183,742 | ||
| Additional lease recognizes for the year ended March 31, 2020 | 31,301 | |||
| Gross lease as of March 31, 2020 | 215,043 |
As of June 30, 2020, operating lease right of use asset as follow:
| Gross lease as of March 31, 2020 | $ | 215,043 | ||
| Amortization for the year ended March 31, 2020 | (70,507 | ) | ||
| Balance as of March 31, 2020 | $ | 144,536 | ||
| Amortization for three months ended June 30, 2020 | (18,167 | ) | ||
| Foreign exchange translation | 982 | |||
| Balance as of June 30, 2020 | $ | 127,351 |
As of June 30, 2020, operating lease liability as follow:
| Gross lease as of March 31, 2020 | $ | 215,043 | ||
| Less: gross repayment for the year ended March 31, 2020 | (79,555 | ) | ||
| Add: imputed interest for the year ended March 31, 2020 | 10,550 | |||
| Balance as of March 31, 2020 | $ | 146,038 | ||
| Less: gross repayment for the year ended June 30, 2020 | (20,024 | ) | ||
| Add: imputed interest for the year ended June 30, 2020 | 2,235 | |||
| Foreign exchange translation | 992 | |||
| Balance as of June 30, 2020 | $ | 129,241 | ||
| Less: lease liability current portion | (53,802 | ) | ||
| Lease liability non-current portion | 75,439 |
| Balance as of March 31, 2021 | 308,918 | |||
| Amortization for the six months ended September 30, 2021 | (32,423 | ) | ||
| Adjustment for discount rate | 5,080 | |||
| Foreign exchange translation | (2,897 | ) | ||
| Balance as of September 30, 2021 | 278,678 |
For the year ended March 31, 2020 and threesix months ended JuneSeptember 30, 2021 and 2020, the amortization of the operating lease right of use asset amounted $70,507$32,423 and $18,167,$36,944, respectively.
| Lease Liability | ||||
| Balance as of March 31, 2021 | 312,635 | |||
| Imputed interest | 8,456 | |||
| Gross repayment | (40,280 | ) | ||
| Foreign exchange translation | 2,141 | |||
| Balance as of September 30, 2021 | 282,952 | |||
| Lease liability current portion | 68,025 | |||
| Lease liability non-current portion | $ | 214,927 |
Maturities of operating lease obligation as follow:
SCHEDULE OF MATURITIES OF OPERATING LEASE OBLIGATION
| 1 | ||||
| Year ending | ||||
| March 31, 2022 | 33,020 | |||
| March 31, 2023 | 71,026 | |||
| March 31, 2024 | 75,217 | |||
| March 31, 2025 | 68,560 | |||
| March 31, 2026 | 35,129 | |||
| Total | $ | 282,952 |
Other information:
SCHEDULE OF LEASE OTHER INFORMATION
For the six months ended September 30 | ||||||||
| 2021 | 2020 | |||||||
| Cash paid for amounts included in the measurement of lease liabilities: | - | |||||||
| Operating cash flow to operating lease | $ | 40,879 | $ | 40,390 | ||||
| Right-of-use assets obtained in exchange for operating lease liabilities | - | - | ||||||
| Remaining lease term for operating lease (years) | 3.89 | 4.33 | ||||||
| Weighted average discount rate for operating lease | 5.70 | % | 6.65 | % | ||||
| F-12 |
| Year ending | ||||
| March 31, 2021 | 46,061 | |||
| March 31, 2022 | 25,511 | |||
| March 31, 2023 | 19,129 | |||
| March 31, 2024 | 20,440 | |||
| March 31, 2025 | 18,100 | |||
| Total | $ | 129,241 |
Other information:
Three months ended June 30 | ||||||||
| 2020 | 2019 | |||||||
| (unaudited) | (unaudited) | |||||||
| Cash paid for amounts included in the measurement of lease liabilities: | ||||||||
| Operating cash flow to operating lease | $ | 17,684 | $ | 20,674 | ||||
| Right-of-use assets obtained in exchange for operating lease liabilities | - | 191,820 | ||||||
| Remaining lease term for operating lease (years) | 4.55 | 4.8 | ||||||
| Weighted average discount rate for operating lease | 6.65 | % | 6.65 | % | ||||
The Company has incurred lease expenses amounted to $20,282 for the three months ended June 30, 2020.
12. CONCENTRATION OF RISK
| (a) | Major Customers |
For the three and six months ended JuneSeptember 30, 20202021 and 2019,2020, there was no customer who accounted for 10% or more of the Company’s revenues nor with significant outstanding receivables.
| (b) | Major Suppliers |
For the three and six months ended JuneSeptember 30, 20202021 and 2019,2020, there was no supplier who accounted for 10% or more of the Company’s purchases nor with significant outstanding payables.
13. Income TaxesINCOME TAXES
The income / (loss) before income taxes of the Company for the threesix months ended JuneSeptember 30, 20202021 and 20192020 were comprised of the following:
SCHEDULE OF INCOME (LOSS) BEFORE INCOME TAXES
For the three months ended June 30 | For the six months ended September 30 | |||||||||||||||
| 2020 | 2019 | 2021 | 2020 | |||||||||||||
| Tax jurisdictions from: | ||||||||||||||||
| – Local | $ | (2,376 | ) | $ | (462 | ) | $ | (22,523 | ) | $ | (6,108 | ) | ||||
| – Foreign, representing: | ||||||||||||||||
| Marshall Islands (non-taxable jurisdiction) | - | - | - | - | ||||||||||||
| Hong Kong | (129 | ) | 6 | - | (129 | ) | ||||||||||
| Malaysia | (22,250 | ) | (67,774 | ) | (198,064 | ) | (75,484 | ) | ||||||||
| Loss before income taxes | $ | (24,755 | ) | $ | (68,230 | ) | $ | (220,587 | ) | $ | (81,721 | ) | ||||
| F-13 |
Provision for income taxes consisted of the following:
SUMMARY OF PROVISION FOR INCOME TAX
As of September 30, | As of March 31, | |||||||
| Current: | ||||||||
| – Local | $ | - | $ | - | ||||
| – Foreign: | ||||||||
| Marshall Islands (non-taxable jurisdiction) | - | - | ||||||
| Hong Kong | - | - | ||||||
| Malaysia | - | - | ||||||
| Deferred: | ||||||||
| – Local | - | - | ||||||
| – Foreign | - | - | ||||||
| $ | - | $ | - |
The effective tax rate in the periods presented is the result of the mix of income earned in various tax jurisdictions that apply a broad range of income tax rates. During the periods presented, the Company has a number of subsidiaries that operates in different countries and is subject to tax in the jurisdictions in which its subsidiaries operate, as follows:
United States of America
The Tax Act reduces the U.S. statutory corporate tax rate from 35% to 21% for our tax years beginning in 2018. The Company is registered in the State of Nevada and is subject to United States of America tax law. As of JuneSeptember 30, 2020,2021, the operations in the United States of America incurred $64,189$158,955 of cumulative net operating losses (NOL’s) which can be carried forward to offset future taxable income. The NOL carryforwards begin to expire in 2040, if unutilized. The Company has provided for a full valuation allowance of approximately $13,480$33,381 against the deferred tax assets on the expected future tax benefits from the net operating loss carryforwards as the management believes it is more likely than not that these assets will not be realized in the future.
Hong Kong
Synergy Empire HK operating in Hong Kong are subject to the Hong Kong Profits Tax at the statutory income tax rate of 8.25% on assessable profits up to HK$2,000,000; and 16.5% on any part of assessable profits over HK$2,000,000. As of June 30, 2020, subsidiary in Hong Kong incurred an aggregate operating loss of $1,441. The cumulative operating losses can be carried forward to offset future taxable income. The Company has provided for a full valuation allowance against the deferred tax assets of $119 on the expected future tax benefits from the net operating loss carryforwards as the management believes it is more likely than not that these assets will not be realized in the future.
Malaysia
Lucky Star F&B Sdn. Bhd. and SH Desserts Sdn. Bhd. are subject to the Malaysia Corporate Tax Laws at a two tier corporate income tax rate based on amount of paid up capital. The tax rate for year of assessment 20202021 for company with paid-up capital of MYR2,500,000 (approximately $580,000)$601,554) or less and that are not part of a group containing a company exceeding this capitalization threshold is 17% on the first MYR 600,000 (approximately $143,000)$144,373) taxable profit with the remaining balance being taxed at 24%.
For the threesix months ended JuneSeptember 30, 2020 and 2019,2021, Lucky Star F&B Sdn. Bhd. incurred a loss of $37,810 and $47,806 respectively, while SH Desserts Sdn. Bhd. incurred an operating profita loss of $15,579$113,282 and operating loss $19,968$84,645 respectively, which can be carried forward for seven years to offset its taxable income.
As of JuneSeptember 30, 2020,2021, the operations in Malaysia generated $1,100,243$1,214,403 of cumulative net operating losses which can be carried forward to offset future taxable income. The net operating loss can be carried forward for seven years. The Company has provided for a full valuation allowance against the deferred tax assets of $187,041$206,449 on the expected future tax benefits from the net operating loss carryforwards as the management believes it is more likely than not that these assets will not be realized in the future.
| F-14 |
The following table sets forth the significant components of the aggregate deferred tax assets of the Company as of JuneSeptember 30, 20202021 and 2019:March 31, 2021:
SCHEDULE OF DEFERRED TAX ASSETS AND LIABILITIES
| As of | As of | As of | As of | |||||||||||||
| March 31, 2020 | March 31, 2019 | September 30, 2020 | March 31, 2020 | |||||||||||||
| Deferred tax assets: | ||||||||||||||||
| Net operating loss carryforwards | $ | $ | $ | $ | ||||||||||||
| – United States of America | 13,480 | 12,981 | 33,381 | 28,691 | ||||||||||||
| – Marshall Islands | - | - | - | - | ||||||||||||
| – Hong Kong | 119 | 108 | ||||||||||||||
| – Malaysia | 187,401 | 183,262 | 206,449 | 172,801 | ||||||||||||
| 200,640 | 196,351 | 239,829 | 201,452 | |||||||||||||
| Less: valuation allowance | (200,640 | ) | (196,351 | ) | (239,829 | ) | (201,452 | ) | ||||||||
| Deferred tax assets | $ | - | $ | - | $ | - | $ | - | ||||||||
Management believes that it is more likely than not that the deferred tax assets will not be fully realizable in the future. Accordingly, the Company provided for a full valuation allowance against its deferred tax assets of $200,640$239,829 as of JuneSeptember 30, 2020.2021.
14. STOCKHOLDERS’ EQUITY
On October 17, 2018, the founder of the Company, Mr. Leong Will Liam purchased shares of restricted common stock of the Company at $0.03$ per share for the Company’s initial working capital. Each share was with a par value of $0.0001.$0.0001. All proceeds received are used for the Company’s working capital.
As of March 31, 2019 and 2018, there were 900,000 and nil shares of common stock issued and outstanding respectively. The share capital of $24,822 as of March 31, 2018 reflected the share capital of our wholly-owned subsidiary, Lucky Star F&B Sdn. Bhd.
On January 21, 2019, CBA Capital Holdings Sdn. Bhd. waived an interest-free loan of $257,183$257,183 in Lucky Star F&B Sdn. Bhd., our wholly own subsidiary, as contribution and recorded in additional paid in capital. CBA Capital Holdings Sdn. Bhd. is wholly owned by our Director, Mr. Leong Will Liam.
There were noOn December 30, 2020, the Company resolved to close the offering from the registration statement on Form S-1/A, dated February 25, 2020, that had been declared effective by the Securities and Exchange Commission on March 10, 2020. The Offering resulting in shares of common stock options, warrants or other potentially dilutive securities outstanding asbeing sold at $ per share for a total of June 30, 2020.$500,000. The proceed of $500,000 will become the capital for our expansion, pursuant to the use of proceed stated in the aforementioned Form S-1/A.
15. FOREIGN CURRENCY EXCHANGE RATE
The Company cannot guarantee that the current exchange rate will remain stable, therefore there is a possibility that the Company could post the same amount of income for two comparable periods and because of the fluctuating exchange rate post higher or lower income depending on exchange rate converted into US$ at the end of the financial year. The exchange rate could fluctuate depending on changes in political and economic environments without notice.
16. SUBSEQUENT EVENTS
In accordance with ASC Topic 855, “Subsequent Events”, which establishes general standards of accounting for and disclosure of events that occur after the balance sheet date but before financial statements are issued, the Company has evaluated all events or transactions that occurred after JuneSeptember 30, 20202021 up through the date the Company presented these auditedunaudited financial statements.
| F-15 |
ITEM 2. MANAGEMENT’S DISCUSSION AND ANALYSIS OF FINANCIAL CONDITION AND RESULTS OF OPERATIONS
The information contained in this quarter report on Form 10-Q is intended to update the information contained in our Form 10-K dated August 3, 2020,June 29, 2021, for the year ended March 31, 20202021 and presumes that readers have access to, and will have read, the “Management’s Discussion and Analysis of Financial Condition and Results of Operations” and other information contained in such Form 10-K. The following discussion and analysis also should be read together with our financial statements and the notes to the financial statements included elsewhere in this Form 10-Q.
Certain statements in this Report constitute forward-looking statements. These forward-looking statements include statements, which involve risks and uncertainties, regarding, among other things, (a) our projected sales, profitability, and cash flows, (b) our growth strategy, (c) anticipated trends in our industry, (d) our future financing plans, and (e) our anticipated needs for, and use of, working capital. They are generally identifiable by use of the words “may,” “will,” “should,” “anticipate,” “estimate,” “plan,” “potential,” “project,” “continuing,” “ongoing,” “expects,” “management believes,” “we believe,” “we intend,” or the negative of these words or other variations on these words or comparable terminology. In light of these risks and uncertainties, there can be no assurance that the forward-looking statements contained in this filing will in fact occur. You should not place undue reliance on these forward-looking statements.
The forward-looking statements speak only as of the date on which they are made, and, except to the extent required by federal securities laws, we undertake no obligation to update any forward-looking statements to reflect events or circumstances after the date on which the statements are made or to reflect the occurrence of unanticipated events.
Overview
We share the same business plan as that of our subsidiaries. We are engaged in the production and sale of food products, specifically dessert created and sold through various restaurants that we operate in Malaysia. We sell our goods under our brand name “Sweet Hut.” We have fourtwo dessert restaurant chains and one central kitchen.
It is worth highlighting that, on March 16, 2020,15 June 2021, Malaysia Prime Minister announcedGovernment introduced a four-phase National Recovery Plan (herein and after referred the implementation“NRP”) to help the country emerge from the COVID-19 pandemic and its economic fallout. As each phase is based on the number of Movement Control Order (“MCO”) under Control of Infectious Diseases Act 1988new cases, people requiring ICU treatment, and the Police Act 1967 to contain the spread of coronavirus disease 2019 (“COVID-19”). Pursuantvaccination rates, it can be extended, or moved on to the declaration, initialnext phase, ofwhenever possible.
Phase 1 - Conditions are the MCO effectively take placesame as “total lockdown” launched from March 18, 20201 June 2021. No social gatherings, dine-in eating at restaurants, interstate travel and non-essential services are permitted. Any remaining workplaces are required to March 31, 2020have their workers work from their homes. Phase 1 ended on September 10, 2021 for a period of 14 days,states the Company restaurant operates in and subsequently extendedon October 1, 2021, entire nation move to May 12, 2020phase 2.
Phase 2 – Allows Dine-in, gathering up to 5 people for fully vaccinated individual or 2 people for non-vaccinated individual including off-mask activities. Phase 2 ended on October 1, 2021 for states the Company restaurant operates in.
Phase 3 – Allow gathering up to 8 people for fully vaccinated individual or 5 people for non-vaccinated individual, all economic sectors will be allowed, excluding those with three 14-day MCO extensions declared by Malaysia Prime Minister.
Pursuant to the MCO, all government and private premises except those involved in essential supply of goods and serviceslarge crowds such as water, electricity, energy, telecommunications, postal, transportation, irrigation, oil, gas, fuel, lubricants, broadcasting, finance, banking, health, pharmacy, fire, prison, port, airport, safety, defense, cleaning, retailconventions and food supply should be closed.bars. Phase 3 ended on October 18, 2021 for states the Company restaurant operates in.
On May 1, 2020, Malaysia Prime Minister announced that Conditional Movement Control Order (“CMCO”), a relaxation of MCO will replaced existing MCOPhase 4 – No headcount restriction on May 4, 2020 onwards and scheduled to expire on original 4th MCO expiration date, May 12, 2020. On May 10, 2020, Malaysia Prime Minister announced that the CMCO will be extended for a period of 4 weeks from May 13, 2020 until June 9, 2020.gathering.
Pursuant to CMCO, most economic sectors and activities are allowed to operate while observing the business standard operation procedures such as in our case social distancing and recording the names and telephone numbers of customers and the dates of their visit.
On June 7, 2020, Malaysia Prime Minister announced that Recovery Movement Control Order (“RMCO”) would take place from June 10, 2020 to August 31, 2020, while preserving previous allowable economic activity, interstate travelling is now permissible.
The Company’s central kitchen and all fourtwo restaurants were operatingand will continue to operate throughout the MCO, CMCO and RMCO period.each phases of NRP.
Results of Operations
For the threesix months ended JuneSeptember 30, 20202021 and 2019,2020, the Company has generated a revenue of $91,974$27,883 and $48,727. Increment$139,463, respectively, with a decrement of 88.75%.80.00% Y-O-Y. Breakdown of revenue as following:
Three months ended June 30 | Three months ended September 30 | Six months ended September 30 | ||||||||||||||||||||||
| 2020 | 2019 | 2021 | 2020 | 2021 | 2020 | |||||||||||||||||||
| Dine-In and Take Away Revenue | $ | 59,066 | $ | 35,158 | $ | 1,502 | $ | 30,316 | $ | 7,759 | $ | 88,905 | ||||||||||||
| Percentage towards Total Revenue | 64.22 | % | 72.15 | % | 8.92 | % | 63.84 | % | 27.83 | % | 63.75 | % | ||||||||||||
| Delivery Revenue | $ | 32,908 | $ | 13,569 | $ | 15,335 | $ | 17,173 | $ | 20,124 | $ | 50,558 | ||||||||||||
| Percentage towards Total Revenue | 35.78 | % | 27.85 | % | 91.08 | % | 36.16 | % | 72.17 | % | 36.25 | % | ||||||||||||
| Total Revenue | $ | 91,974 | $ | 48,727 | $ | 16,837 | $ | 47,489 | $ | 27,883 | $ | 139,463 | ||||||||||||
| Total Cost of Sales | $ | 24,499 | $ | 20,416 | $ | (6,732 | ) | $ | (17,485 | ) | $ | (10,721 | ) | $ | (41,984 | ) | ||||||||
| Total Gross Profit | $ | 67,475 | $ | 28,311 | $ | 10,105 | $ | 30,004 | $ | 17,162 | $ | 97,479 | ||||||||||||
| Gross Profit Margin | 73.36 | % | 58.10 | % | 60.02 | % | 63.17 | % | 61.55 | % | 69.90 | % | ||||||||||||
| 3 |
Revenue for the Three Months ended September 30, 2021 and 2020
Dine-in and take away revenue growdecline from $35,158$30,316 for the three months ended JuneSeptember 30, 20192020 to $59,066$1,502 for the three months ended JuneSeptember 30, 20202021 for a growthdeclination rate of approximately 68.00%95%. The Company contributes such increase towardsDeclination in dine-in revenue primarily due to the improvement of quality control over meal servedimplementation NRP, which discourage nearby residents to travel beyond restricted area for dining and the introduction of new menu.take away thusly.
Delivery revenue growdecline from $13,569$17,173 for the three months ended JuneSeptember 30, 20192020 to $32,908$15,335 for the three months ended JuneSeptember 30, 2020 for a growthdeclination rate of approximately 142.51%11%. The Company believes while the dine-in experience improvement directly contributed to delivery
Total revenue growth such growth in delivery is primarily contributed by MCO.
Again the Company has seen an increasingly dependency over delivery revenue, as such portion of revenue accounting for total revenue, growdeclined from 27.85%$47,489 for the three months ended JuneSeptember 30, 20192020 to 35.78%$16,837 for the three months ended JuneSeptember 30, 2020. The management believes that, in the foreseeable future, revenue generated through food delivery shall continuously improve and account2021 for a significant portiondeclination rate of approximately 65% which primarily caused by declined in dine-in and take away revenue.
Revenue for the Six Months ended September 30, 2021 and 2020
Dine-in and take away decrease from $88,905 for the six months ended September 30, 2020 to $7,759 for the six months ended September 30, 2020, for a declination rate of 91%. Declination in dine-in revenue primarily due to the implementation NRP, which discourage nearby residents to travel beyond restricted area for dining and take away thusly.
Delivery revenue decrease from $50,558 for the six months ended September 30, 2020 to $30,434 for the six months ended September 30, 2021 for a declination rate of 60%.
Total revenue increased from $139,463 for the six months ended September 30, 2020 to $27,883 for the six months ended September 30, 2021 for a declination rate of 80%. Declination in revenue is primarily caused by declination in dine-in and take away revenue.
The Company expect, through relaxation of dine-in and gathering restriction, should expect a slow but gradual recovery in consumer confidence in consumption in public space, and revenue of the Company’s revenue.Company thusly.
Gross Profit
The Company gross profit margin has improved considerablydecreased marginally from 58.10%63.17% for the three months ended JuneSeptember 30, 20192020 to 73.36%60.02% for the three months ended JuneSeptember 30, 2020. Management believes that such improvement is due2021, while, gross profit margin decreased marginally from 69.90% for the six months ended September 30, 2020 to greater meal preparation procedure resulted in less wastage in raw material as part of quality control improvement and introduction of new menu item with greater margin. 61.55% for the six months ended September 30, 2021.
As a combination of favorable revenue and profit margin, the Company enjoys a growth of 138.33% inresult, gross profit in absolute figure, from $28,311 for the three months ended JuneSeptember 30, 20192020 decreased from $30,004 to $67,475$10,105 for the three months ended JuneSeptember 30, 2020.2021 for a declination rate of 66%, while gross profit for the six months ended September 30, 2020 decreased from $97,479 to $17,162 for the six months ended September 30, 2021 for a declination rate of 82%.
General and Administrative Expenses
For the threesix months ended JuneSeptember 30, 20202021 and 2019,2020, the Company has incurred a general and administrative expenses of $101,202$259,265 and $104,424$192,529 respectively. Of which primarily consist of salary, lease expenses, utilities, depreciation, professional fees and repair and maintenance and advertisement and promotions.
Three months ended June 30 | Six months ended September 30 | |||||||||||||||
| Primary expenses | 2020 | 2019 | 2021 | 2020 | ||||||||||||
| Salary and salary related expenses | $ | 56,735 | $ | 44,409 | $ | 122,374 | $ | 114,218 | ||||||||
| Percentage towards General and Administrative Expenses | 56.06 | % | 46.35 | % | 47.20 | % | 56.35 | % | ||||||||
| Lease expenses | $ | 20,282 | $ | 21,859 | $ | 40,879 | $ | 41,152 | ||||||||
| Percentage towards General and Administrative Expenses | 20.04 | % | 22.81 | % | 15.77 | % | 20.31 | % | ||||||||
| Utility expenses | $ | 9,916 | $ | 13,053 | $ | 12,693 | $ | 17,758 | ||||||||
| Percentage towards General and Administrative Expenses | 9.80 | % | 13.62 | % | 4.90 | % | 8.76 | % | ||||||||
| Depreciation expenses | $ | 6,832 | $ | 6,304 | $ | 39,057 | $ | 13,876 | ||||||||
| Percentage towards General and Administrative Expenses | 6.75 | % | 6.85 | % | 15.06 | % | 6.85 | % | ||||||||
| Professional expenses | $ | 2,606 | $ | 2,066 | $ | 16,068 | $ | 5,000 | ||||||||
| Percentage towards General and Administrative Expenses | 2.58 | % | 2.16 | % | 6.20 | % | 2.47 | % | ||||||||
| Repair and maintenance expenses | $ | 1,627 | $ | 4,804 | $ | 6,093 | $ | 3,469 | ||||||||
| Percentage towards General and Administrative Expenses | 1.61 | % | 5.01 | % | 2.35 | % | 1.71 | % | ||||||||
| Compliance expenses | $ | 200 | $ | 491 | $ | 3,059 | $ | 1,415 | ||||||||
| Percentage towards general and administrative expenses | 0.20 | % | 0.51 | % | 1.18 | % | 0.70 | % | ||||||||
| Advertisement and promotion expenses | $ | 928 | $ | - | $ | - | $ | 941 | ||||||||
| Percentage towards General and Administrative Expenses | 0.92 | % | - | 0.00 | % | 0.46 | % | |||||||||
| Total primary expenses | $ | 99,126 | $ | 92,986 | $ | 240,223 | $ | 197,829 | ||||||||
| Percentage towards General and Administrative Expenses | 97.95 | % | 97.05 | % | 92.66 | % | 97.62 | % | ||||||||
| Miscellaneous expenses | $ | 2,076 | 2,827 | $ | 19,042 | $ | 4,821 | |||||||||
| Percentage towards General and Administrative Expenses | 2.05 | % | 2.95 | % | 7.34 | % | 2.38 | % | ||||||||
| Gain on disposal of motor vehicle | $ | - | $ | (10,121 | ) | |||||||||||
| Total General and Administrative Expenses | $ | 259,265 | $ | 192,529 | ||||||||||||
Net Loss
For the threesix months ended JuneSeptember 30, 20202021 and 2019,2020, the Company has incurred a net loss of $24,755$220,587 and $68,230$81,721 respectively.
Foreign Currency Exposure
The Company cannot guarantee that the current exchange rate will remain stable, therefore there is a possibility that the Company could post the same amount of income for two comparable periods and because of the fluctuating exchange rate post higher or lower income depending on exchange rate converted into US$ at the end of the financial year. The exchange rate could fluctuate depending on changes in political and economic environments without notice.
| 4 |
Liquidity and Capital Resources
Cash Used In Operating Activities
For the threesix months ended JuneSeptember 30, 2021, the Company has used $286,703 in operating activities caused by net loss from operating, increase in inventories, prepayment, decrease in account payable, accrued liabilities and lease liability contra by depreciation.
For the six months ended September 30, 2020, the Company has used $33,978$86,600 in operating activities primarily caused by net loss from operating, increase in prepayment and decrease in trade payable, other payable, and lease liability and reclassification of gain from disposal of fixed assets to investing cashflow contra by depreciation.
For the three months ended June 30, 2019, the Company has used $50,143 in operating activities caused by net loss from operating, increase in trade receivable and prepaymentdepreciation and decrease in lease liability contra by decrease in inventory and increase in trade payable and other payables and depreciation.inventories.
Cash Used In investing activitiesin Investing Activities
The Company has invested $701$33,238 in investing activity for the acquisition of new kitchen equipment, office equipment, renovation and application of trademark for the threesix months ended JuneSeptember 30, 2020.2021.
The Company has invested $18,312$1,699 in renovation in central kitcheninvesting activity for the threeacquisition of new kitchen equipment and received $10,121 from disposing fully depreciated motor vehicle, netting a $8,422 net proceed from investing cash flow for the six months ended JuneSeptember 30, 2019.2020.
Cash Provided by Financing Activities
For the threesix months ended JuneSeptember 30, 2021, the Company received $5,984 of advances from director and repaid $7,590 to bank loan.
For the six months ended September 30, 2020, the Company received $8,304 from financing cash flow primarily consist of advances from director contra by repayment to officer.
For the three months ended June 30, 2019, the Company received $54,815$80,954 from financing cash flow primarily consist of advances from director and officerincrease in bank loan due compounding interest charged during MCO contra by repayment of hire purchase loan and business loan.to officer.
Off-balance Sheet Arrangements
We have no significant off-balance sheet arrangements that have or are reasonably likely to have a current or future effect on our financial condition, changes in our financial condition, revenues or expenses, results of operations, liquidity, capital expenditures or capital resources that are material to our stockholders as of JuneSeptember 30, 2020.2021.
Contractual Obligations
As of JuneSeptember 30, 2020,2021, the Company has no contractual obligations involved.
| 5 |
ITEM 3 QUANTITATIVE AND QUALITATIVE DISCLOSURES ABOUT MARKET RISK
As a “smaller reporting company” as defined by Item 10 of Regulation S-K, the Company is not required to provide information required by this Item.
ITEM 4 CONTROLS AND PROCEDURES
Evaluation of Disclosure Controls and Procedures:
We carried out an evaluation of the effectiveness of the design and operation of our disclosure controls and procedures (as defined in Exchange Act Rules 13a-15(e) and 15d-15(e)) as of JuneSeptember 30, 2020.2021. This evaluation was carried out under the supervision and with the participation of our Chief Executive Officer and our Chief Financial Officer. Based upon that evaluation, our Chief Executive Officer and Chief Financial Officer concluded that, as of JuneSeptember 30, 2020,2021, our disclosure controls and procedures were not effective due to the presence of material weaknesses in internal control over financial reporting.
A material weakness is a deficiency, or a combination of deficiencies, in internal control over financial reporting, such that there is a reasonable possibility that a material misstatement of the company’s annual or interim financial statements will not be prevented or detected on a timely basis. Management has identified the following material weaknesses which have caused management to conclude that, as of JuneSeptember 30, 2020,2021, our disclosure controls and procedures were not effective: (1) lack of a functioning audit committee due to a lack of a majority of independent members and a lack of a majority of outside directors on our board of directors, resulting in ineffective oversight in the establishment and monitoring of required internal controls and procedures; (2) inadequate segregation of duties and effective risk assessment; (3) insufficient written policies and procedures for accounting and financial reporting with respect to the requirements and application of both US GAAP and SEC guidelines; and (4) lack of internal audit function due to the fact that the Company lacks qualified resources to perform the internal audit functions properly and that the scope and effectiveness of the internal audit function are yet to be developed.
Changes in Internal Control Over Financial Reporting:
There were no changes in our internal control over financial reporting during the quarter ending JuneSeptember 30, 2020,2021, that have materially affected, or are reasonably likely to materially affect, our internal control over financial reporting.
| 6 |
From time to time, we may become party to litigation or other legal proceedings that we consider to be a part of the ordinary course of our business. We are not currently involved in legal proceedings that could reasonably be expected to have a material adverse effect on our business, prospects, financial condition or results of operations. We may become involved in material legal proceedings in the future.
Item 1A. Risk Factors
As a “smaller reporting company” as defined by Item 10 of Regulation S-K, the Company is not required to provide information required by this Item.
Item 2. Unregistered Sales of Equity Securities and Use of Proceeds
(a) None.
(b) None.
(c) None.
Item 3. Defaults Upon Senior Securities
(a) None.
(b) None.
Item 4. Mine Safety Disclosures
Not applicable.
None.
| 31.1 | Rule 13(a)-14(a) / 15(d)-14(a) Certification of principal executive officer and principal financial officer | |
| 32.1 | Section 1350 Certification of principal executive officer and principal financial officer | |
| 101.INS | Inline XBRL Instance Document | |
| 101.SCH | Inline XBRL Taxonomy Extension Schema Document | |
| 101.CAL | Inline XBRL Taxonomy Extension Calculation Linkbase Document | |
| 101.DEF | Inline XBRL Taxonomy Extension Definition Linkbase Document | |
| 101.LAB | Inline XBRL Taxonomy Extension Label Linkbase Document | |
| 101.PRE | Inline XBRL Taxonomy Extension Presentation Linkbase Document | |
| 104 | Cover Page Interactive Data File (embedded within the Inline XBRL document) |
| 7 |
Pursuant to the requirements of the Securities Exchange Act of 1934, the registrant has duly caused this report to be signed on its behalf by the undersigned, thereunto duly authorized.
| SYNERGY EMPIRE LIMITED | ||
| (Name of Registrant) | ||
| Date: | ||
| By: | /s/ Law Jia Ming | |
| Name: | Law Jia Ming | |
| Title: | Chief Executive Officer, Chief Financial Officer | |
| 8 |