
UNITED STATES
SECURITIES AND EXCHANGE COMMISSION
Washington, D.C. 20549
FORM 10-Q
| ☒ | QUARTERLY REPORT PURSUANT TO SECTION 13 OR 15(d) OF THE SECURITIES EXCHANGE ACT OF 1934 |
For The Quarterly Period Ended SeptemberJune 30, 20222023
or
| ☐ | TRANSITION REPORT PURSUANT TO SECTION 13 OR 15(d) OF THE SECURITIES EXCHANGE ACT OF 1934 |
For the transition period from ____________ to ____________
Commission File Number 333-235700
SYNERGY EMPIRE LIMITED
(Exact name of registrant issuer as specified in its charter)
| Nevada | 38-4096727 | |
(State or other jurisdiction of incorporation or organization) | (I.R.S. Employer Identification No.) |
No.19 Jalan 12/118B, Desa Tun Razak, 56100, Kuala Lumpur, Malaysia.
Address of principal executive offices, including zip code
+(60)3 - 9171 2828
Registrant’s phone number, including area code
N/A
(Former name, former address and former fiscal year, if changed since last report)
Securities registered pursuant to Section 12(b) of the Act:
| Title of each class | Trading Symbol(s) | Name on each exchange on which registered | ||
| N/A | N/A | N/A |
Indicate by check mark whether the registrant (1) has filed all reports required to be filed by Section 13 or 15(d) of the Securities Exchange Act of 1934 during the preceding 12 months (or for such shorter period that the registrant was required to file such reports), and (2) has been subject to such filing requirements for the past 90 days.
Yes ☒ No ☐
Indicate by check mark whether the registrant has submitted electronically every Interactive Data File required to be submitted pursuant to Rule 405 of Regulation S-T (§232.405 of this chapter) during the preceding 12 months (or for such shorter period that the registrant was required to submit such files).
Yes ☒ No ☐
Indicate by check mark whether the registrant is a large accelerated filer, an accelerated filer, a non-accelerated filer, a smaller reporting company, or an emerging growth company. See the definitions of “large accelerated filer”, “accelerated filer”, “smaller reporting company” and “emerging growth company” in Rule 12b-2 of the Exchange Act.
| Large Accelerated Filer ☐ | Accelerated Filer ☐ | Non-accelerated Filer ☒ | Smaller reporting company ☒ |
| Emerging growth company ☒ |
If an emerging growth company, indicate by check mark if the registrant has elected not to use the extended transition period for complying with any new or revised financial accounting standards provided pursuant to Section 13(a) of the Exchange Act. ☐
Indicate by check mark whether the registrant is a shell company (as defined in Rule12b-2 of the Exchange Act).
Yes ☐ No ☒
APPLICABLE ONLY TO ISSUERS INVOLVED IN BANKRUPTCY PROCEEDINGS DURING THE PRECEDING FIVE YEARS:
Indicate by check mark whether the registrant has filed all documents and reports required to be filed by Sections 12, 13 or 15(d) of the Securities Exchange Act of 1934 subsequent to the distribution of securities under a plan confirmed by a court.
N/A
Indicate the number of shares outstanding of each of the issuer’s classes of common stock, as of the latest practicable date.
| Class | Outstanding | |
| Common Stock, $0.0001 par value |
TABLE OF CONTENTS
| 2 |
PART I — FINANCIAL INFORMATION
Item 1. Financial statements
SYNERGY EMPIRE LIMITEDLIMITED.
CONDENSED CONSOLIDATED BALANCE SHEETS
AS OF SEPTEMBERJUNE 30, 2022 AND2023 and MARCH 31, 20222023
(Currency expressed in United States Dollars (“US$”), except for number of share)
As of September 30, 2022 | As of March 31, 2022 | As of June 30, 2023 | As of March 31, 2023 | |||||||||||||
| (Unaudited) | (Audited) | (Unaudited) | (Audited) | |||||||||||||
| ASSETS | ||||||||||||||||
| CURRENT ASSETS | ||||||||||||||||
| Cash and cash equivalents | $ | 5,807 | $ | 18,561 | $ | 3,680 | $ | 9,868 | ||||||||
| Trade receivables, net | 398 | 271 | ||||||||||||||
| Accounts receivable, net | - | - | ||||||||||||||
| Prepaid expenses and deposits | 29,045 | 35,773 | 9,193 | 15,681 | ||||||||||||
| Inventories | 12,991 | 11,198 | ||||||||||||||
| TOTAL CURRENT ASSETS | $ | 48,241 | $ | 65,803 | $ | 12,873 | $ | 25,549 | ||||||||
| NON-CURRENT ASSETS | ||||||||||||||||
| Operating lease right of use asset, net | 239,265 | 296,760 | ||||||||||||||
| Plant and equipment, net | 247,898 | 295,023 | 60,756 | 66,184 | ||||||||||||
| Intangible asset, net | 1,215 | 1,418 | 1,101 | 1,199 | ||||||||||||
| TOTAL ASSETS | $ | 536,619 | $ | 659,004 | $ | 74,730 | $ | 92,932 | ||||||||
| LIABILITIES AND STOCKHOLDERS’ EQUITY | ||||||||||||||||
| CURRENT LIABILITIES | ||||||||||||||||
| Accounts payable | $ | 12,197 | $ | 11,811 | $ | 5,617 | $ | 5,928 | ||||||||
| Accrued expenses and other payables | 83,435 | 93,901 | 58,507 | 70,885 | ||||||||||||
| Operating lease liability | 61,066 | 65,552 | ||||||||||||||
| Bank borrowing | 15,483 | 16,936 | 3,480 | 7,954 | ||||||||||||
| Amount due to a director | 1,209,827 | 1,066,422 | 1,290,909 | 1,325,308 | ||||||||||||
| TOTAL CURRENT LIABILITIES | $ | 1,382,008 | $ | 1,254,622 | $ | 1,358,513 | $ | 1,410,075 | ||||||||
| NON-CURRENT LIABILITIES | ||||||||||||||||
| Operating lease liability | 179,032 | 231,556 | ||||||||||||||
| Bank borrowing | - | 8,445 | ||||||||||||||
| TOTAL LIABILITIES | $ | 1,561,040 | $ | 1,494,623 | $ | 1,358,513 | $ | 1,410,075 | ||||||||
| STOCKHOLDERS’ EQUITY | ||||||||||||||||
| Preferred stock – Par value ; Authorized: issued and outstanding | - | - | ||||||||||||||
| Common stock – Par value ; Authorized: Issued and outstanding: shares as of September 30 and March 31, 2022 | 100 | 100 | ||||||||||||||
| Preferred stock – Par value $; Authorized: issued and outstanding | - | - | ||||||||||||||
| Common stock – Par value $; Authorized: Issued and outstanding: shares as of June 30 and March 31, 2023 | 100 | 100 | ||||||||||||||
| Additional paid-in capital | 784,083 | 784,083 | 784,083 | 784,083 | ||||||||||||
| Accumulated other comprehensive income/(loss) | 95,033 | (20,271 | ) | 113,054 | 32,881 | |||||||||||
| Accumulated deficit | (1,903,637 | ) | (1,599,531 | ) | (2,181,020 | ) | (2,134,207 | ) | ||||||||
| TOTAL STOCKHOLDERS’ DEFICIT | $ | (1,024,421 | ) | $ | (835,619 | ) | $ | (1,283,783 | ) | $ | (1,317,143 | ) | ||||
| TOTAL LIABILITIES AND STOCKHOLDERS’ EQUITY | $ | 536,619 | $ | 659,004 | $ | 74,730 | $ | 92,932 | ||||||||
See accompanying notes to the unaudited condensed consolidated financial statements.
| F-1 |
SYNERGY EMPIRE LIMITED
CONDENSED CONSOLIDATED STATEMENTS OF OPERATIONS AND COMPREHENSIVE LOSSINCOME (LOSS)
FOR THE THREE AND SIX MONTHS ENDED SEPTEMBERJUNE 30, 20222023 AND 20212022
(Currency expressed in United States Dollars (“US$”), except for number of shares)
(Unaudited)
| 2023 | 2022 | |||||||||||||||||||||||
| For the Three Months Ended, June 30 | ||||||||||||||||||||||||
| 2022 | 2021 | 2022 | 2021 | 2023 | 2022 | |||||||||||||||||||
| Three months ended September 30, | Six months ended September 30, | (Unaudited) | (Unaudited) | |||||||||||||||||||||
| 2022 | 2021 | 2022 | 2021 | |||||||||||||||||||||
| REVENUE | $ | 57,441 | $ | 16,837 | $ | 102,350 | $ | 27,883 | $ | 7,859 | $ | 44,909 | ||||||||||||
| COST AND EXPENSES: | ||||||||||||||||||||||||
| Cost of revenue | (38,832 | ) | (6,732 | ) | (59,795 | ) | (10,721 | ) | - | (20,963 | ) | |||||||||||||
| General and administrative expenses | (178,717 | ) | (137,397 | ) | (345,746 | ) | (259,265 | ) | (54,549 | ) | (167,029 | ) | ||||||||||||
| Total operating costs and expenses | (217,549 | ) | (144,129 | ) | (405,541 | ) | (269,986 | ) | (54,549 | ) | (187,992 | ) | ||||||||||||
| Loss from operations | (160,108 | ) | (127,292 | ) | (303,191 | ) | (242,103 | ) | (46,690 | ) | (143,083 | ) | ||||||||||||
| Other income, Net | (401 | ) | 13,136 | (915 | ) | 21,516 | ||||||||||||||||||
| Finance cost | (123 | ) | (514 | ) | ||||||||||||||||||||
| Loss before income tax | (160,509 | ) | (114,156 | ) | (304,106 | ) | (220,587 | ) | (46,813 | ) | (143,597 | ) | ||||||||||||
| Income tax expense | - | - | - | - | - | - | ||||||||||||||||||
| Net Loss | (160,509 | ) | (114,156 | ) | (304,106 | ) | (220,587 | ) | ||||||||||||||||
| Net loss | (46,813 | ) | (143,597 | ) | ||||||||||||||||||||
| Foreign currency translation gain | 61,927 | 6,845 | 115,303 | 9,147 | 80,173 | 53,377 | ||||||||||||||||||
| Total comprehensive loss | $ | (98,582 | ) | $ | (107,311 | ) | $ | (188,803 | ) | $ | (211,440 | ) | ||||||||||||
| Total comprehensive income | $ | 33,360 | $ | (90,220 | ) | |||||||||||||||||||
| NET LOSS PER SHARE, BASIC AND DILUTED | $ | (0.16 | ) | $ | (0.11 | ) | $ | (0.30 | ) | $ | (0.22 | ) | ||||||||||||
| WEIGHTED AVERAGE NUMBER OF COMMON SHARES OUTSTANDING, BASIC AND DILUTED | 1,000,000 | 1,000,000 | 1,000,000 | 1,000,000 | ||||||||||||||||||||
| Net loss per share, basic and diluted | $ | (0.05 | ) | $ | (0.14 | ) | ||||||||||||||||||
| Net loss per share, basic | $ | (0.05 | ) | $ | (0.14 | ) | ||||||||||||||||||
| Weighted average number of common shares outstanding, basic and diluted | 1,000,000 | 1,000,000 | ||||||||||||||||||||||
| Weighted average number of common shares outstanding, basic | 1,000,000 | 1,000,000 | ||||||||||||||||||||||
See accompanying notes to the unaudited condensed consolidated financial statements.
| F-2 |
SYNERGY EMPIRE LIMITED
CONDENSED CONSOLIDATED STATEMENTS OF STOCKHOLDERS’ EQUITY
FOR THE THREE AND SIX MONTHS ENDED SEPTEMBER 30, 2022 AND 2021
(Currency expressed in United States Dollars (“US$”), except for number of shares)
(Unaudited)
| NUMBER OF Shares | Amount | Additional Paid-in Capital | Accumulated (DEFICIT)/ PROFIT | Accumulated comprehensive INCOME | Total STOCKHOLDERS EQUITY | |||||||||||||||||||
| Common Stock | ||||||||||||||||||||||||
| NUMBER OF Shares | Amount | Additional Paid-in Capital | Accumulated (DEFICIT)/ PROFIT | Accumulated comprehensive INCOME | Total STOCKHOLDERS EQUITY | |||||||||||||||||||
| Balance as of April 1, 2022 | 1,000,000 | $ | 100 | $ | 784,083 | $ | (1,599,531 | ) | $ | (20,271 | ) | $ | (835,619 | ) | ||||||||||
| Net loss for the period | - | - | - | (143,597 | ) | - | (143,597 | ) | ||||||||||||||||
| Foreign currency translation gain | - | - | - | - | 53,377 | 53,377 | ||||||||||||||||||
| Balance as of June 30, 2022 | 1,000,000 | $ | 100 | $ | 784,083 | $ | (1,743,128 | ) | $ | 33,106 | $ | (925,839 | ) | |||||||||||
| Net loss for the period | - | - | - | (160,509 | ) | - | (160,509 | ) | ||||||||||||||||
| Foreign currency translation gain | - | - | - | - | 61,927 | 61,927 | ||||||||||||||||||
| Balance as of September 30, 2022 | 1,000,000 | $ | 100 | $ | 784,083 | $ | (1,903,637 | ) | $ | 95,033 | $ | (1,024,421 | ) | |||||||||||
| Common Stock | ||||||||||||||||||||||||
| NUMBER OF Shares | Amount | Additional Paid-in Capital | Accumulated (DEFICIT)/ PROFIT | Accumulated comprehensive loss | Total STOCKHOLDERS EQUITY | |||||||||||||||||||
| Balance as of April 1, 2021 | 1,000,000 | $ | 100 | $ | 784,083 | $ | (1,156,263 | ) | $ | (34,804 | ) | $ | (406,884 | ) | ||||||||||
| Net loss for the period | - | - | - | (106,431 | ) | - | (106,431 | ) | ||||||||||||||||
| Foreign currency translation gain | - | - | - | - | 2,302 | 2,302 | ||||||||||||||||||
| Balance as of June 30, 2021 | 1,000,000 | $ | 100 | $ | 784,083 | $ | (1,262,694 | ) | $ | (32,502 | ) | $ | (511,013 | ) | ||||||||||
| Net loss for the period | - | - | - | (114,156 | ) | - | (114,156 | ) | ||||||||||||||||
| Foreign currency translation gain | - | - | - | - | 6,845 | 6,845 | ||||||||||||||||||
| Balance as of September 30, 2021 | 1,000,000 | $ | 100 | $ | 784,083 | $ | (1,376,850 | ) | $ | (25,657 | ) | $ | (618,324 | ) | ||||||||||
See accompanying notes to consolidated financial statements
SYNERGY EMPIRE LIMITED
CONDENSED CONSOLIDATED STATEMENTS OF CASH FLOWSCHANGES IN STOCKHOLDERS’ EQUITY
FOR SIXTHE THREE MONTHS ENDED SEPTMEBERJUNE 30, 20222023 AND 20212022
(Currency expressed in United States Dollars (“US$”), except for number of shares)
| 2022 | 2021 | |||||||
For the Six Months Ended, September 30 | ||||||||
| 2022 | 2021 | |||||||
| (Unaudited) | (Unaudited) | |||||||
| CASH FLOWS FROM OPERATING ACTIVITIES: | ||||||||
| Net loss | $ | (304,106 | ) | $ | (220,587 | ) | ||
| Adjustments to reconcile net loss to net cash used in operating activities | ||||||||
| Depreciation expenses | 63,005 | 71,480 | ||||||
| Write off of other receivables | 688 | - | ||||||
| Changes in operating assets and liabilities: | ||||||||
| Increase in accounts receivable | (846 | ) | - | |||||
| Increase in inventories | (2,985 | ) | (3,970 | ) | ||||
| Decrease/(Increase) in prepaid expenses | 4,296 | (687 | ) | |||||
| Increase/(Decrease) in accounts payable | 1,548 | (830 | ) | |||||
| Decrease in accrued liabilities | (3,942 | ) | (100,285 | ) | ||||
| Change in operating lease liability | (30,546 | ) | (31,824 | ) | ||||
| Net cash flows used in operating activities | $ | (272,888 | ) | $ | (286,703 | ) | ||
| CASH FLOWS FROM INVESTING ACTIVITIES: | ||||||||
| Purchase of plant and equipment | (11,396 | ) | (31,659 | ) | ||||
| Application of trademark | - | (1,579 | ) | |||||
| Net cash flows used in investing activities | $ | (11,396 | ) | $ | (33,238 | ) | ||
| CASH FLOWS FROM FINANCING ACTIVITIES: | ||||||||
| Advance from directors | 224,091 | 5,984 | ||||||
| Principal repayments of bank loan | (7,846 | ) | (7,590 | ) | ||||
| Net cash flows provided by/(used in) financing activities | $ | 216,245 | $ | (1,606 | ) | |||
| Effect of exchange rate changes in cash and cash equivalents | $ | 55,285 | $ | 3,312 | ||||
| Net changes in cash and cash equivalents | (12,754 | ) | (318,235 | ) | ||||
| Cash and cash equivalents, beginning of year | 18,561 | 345,161 | ||||||
| CASH AND CASH EQUIVALENTS, END OF YEAR | $ | 5,807 | $ | 26,926 | ||||
| SUPPLEMENTAL CASH FLOWS INFORMATION | ||||||||
| Income taxes paid | $ | - | $ | - | ||||
| Interest paid | $ | 917 | $ | 1,794 | ||||
| NUMBER OF Shares | Amount | Additional Paid-in Capital | Accumulated (DEFICIT)/ PROFIT | Accumulated comprehensive loss | Total STOCKHOLDERS EQUITY | |||||||||||||||||||
| Common Stock | ||||||||||||||||||||||||
| NUMBER OF Shares | Amount | Additional Paid-in Capital | Accumulated (DEFICIT)/ PROFIT | Accumulated comprehensive loss | Total STOCKHOLDERS EQUITY | |||||||||||||||||||
| Balance as of April 1, 2023 | 1,000,000 | $ | 100 | $ | 784,083 | $ | (2,134,207 | ) | $ | 32,881 | $ | (1,317,143 | ) | |||||||||||
| Net loss for the period | - | - | - | (46,813 | ) | - | (46,813 | ) | ||||||||||||||||
| Foreign currency translation | - | - | - | - | 80,173 | 80,173 | ||||||||||||||||||
| Balance as of June 30, 2023 | 1,000,000 | $ | 100 | $ | 784,083 | $ | (2,181,020 | ) | $ | 113,054 | $ | (1,283,783 | ) | |||||||||||
| Common Stock | ||||||||||||||||||||||||
| NUMBER OF Shares | Amount | Additional Paid-in Capital | Accumulated (DEFICIT)/ PROFIT | Accumulated comprehensive loss | Total STOCKHOLDERS EQUITY | |||||||||||||||||||
| Balance as of April 1, 2022 | 1,000,000 | $ | 100 | $ | 784,083 | $ | (1,599,531 | ) | $ | (20,271 | ) | $ | (835,619 | ) | ||||||||||
| Net loss for the period | - | - | - | (143,597 | ) | - | (143,597 | ) | ||||||||||||||||
| Foreign currency translation | - | - | - | - | 53,377 | 53,377 | ||||||||||||||||||
| Balance as of June 30, 2022 | 1,000,000 | $ | 100 | $ | 784,083 | $ | (1,743,128 | ) | $ | 33,106 | $ | (925,839 | ) | |||||||||||
See accompanying notes to consolidated financial statements
| F-3 |
SYNERGY EMPIRE LIMITED
CONDENSED CONSOLIDATED STATEMENTS OF CASH FLOWS
FOR THREE MONTHS ENDED JUNE 30, 2023 AND 2022
(Currency expressed in United States Dollars (“US$”), except for number of shares)
| 2023 | 2022 | |||||||
| For the Three Months Ended, June 30 | ||||||||
| 2023 | 2022 | |||||||
| (Unaudited) | (Unaudited) | |||||||
| CASH FLOWS FROM OPERATING ACTIVITIES: | ||||||||
| Net loss | $ | (46,813 | ) | $ | (143,597 | ) | ||
| Adjustments to reconcile net loss to net cash used in operating activities | ||||||||
| Depreciation and amortization expenses | 2,027 | 31,882 | ||||||
| Write off of other receivables | - | 699 | ||||||
| Changes in operating assets and liabilities: | ||||||||
| Increase in accounts receivable | - | (740 | ) | |||||
| Increase in inventories | - | (3,664 | ) | |||||
| Decrease/(Increase) in prepaid expenses and deposit | 6,370 | (642 | ) | |||||
| Decrease in accounts payable | - | (57 | ) | |||||
| Decrease in accrued liabilities and other payables | (9,893 | ) | (15,365 | ) | ||||
| Change in operating lease liability | - | (15,413 | ) | |||||
| Net cash flows used in operating activities | $ | (48,309 | ) | $ | (146,897 | ) | ||
| CASH FLOWS FROM INVESTING ACTIVITY: | ||||||||
| Purchase of plant and equipment | - | (10,209 | ) | |||||
| Net cash flows used in investing activity | $ | - | $ | (10,209 | ) | |||
| CASH FLOWS FROM FINANCING ACTIVITIES: | ||||||||
| Advance from directors | 15,050 | 126,075 | ||||||
| Principal repayments of bank loan | (4,134 | ) | (3,938 | ) | ||||
| Net cash flows provided by financing activities | $ | 10,916 | $ | 122,137 | ||||
| Effect of exchange rate changes | $ | 31,205 | $ | 26,602 | ||||
| Net changes in cash and cash equivalents | (6,188 | ) | (8,367 | ) | ||||
| Cash and cash equivalents, beginning of year | 9,868 | 18,561 | ||||||
| CASH AND CASH EQUIVALENTS, END OF YEAR | $ | 3,680 | $ | 10,194 | ||||
| SUPPLEMENTAL CASH FLOWS INFORMATION | ||||||||
| Income taxes paid | $ | - | $ | - | ||||
| Interest paid | $ | 123 | $ | 514 | ||||
See accompanying notes to the unaudited condensed consolidated financial statements.
| F-4 |
SYNERGY EMPIRE LIMITED
NOTES TO UNAUDITED CONDENSED CONSOLIDATED FINANCIAL STATEMENTS
FOR THE SIXTHREE MONTHS ENDED SEPTEMBERJUNE 30, 20222023 AND 20212022
(Currency expressed in United States Dollars (“US$”), except for number of shares)
1.ORGANIZATION AND BUSINESS BACKGROUND
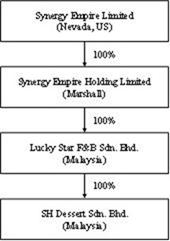
Synergy Empire Limited (“the Company”) was incorporated under the laws of the State of Nevada on October 17, 2018. We have historically conducted our business through Lucky Star F&B Sdn. Bhd. and SH Dessert Sdn. Bhd, both are private limited liability company, incorporated in Malaysia.
On January 16, 2019, the Company acquired 100% of the equity interests of Synergy Empire Holding Limited, a company incorporated in Republic of the Marshall Islands (“Synergy Empire Marshall”).
On December 31, 2018, Synergy Empire Marshall acquired 100% of Synergy Empire Limited, a limited liability company incorporated in Hong Kong (“Synergy Empire HK”).
On February 21, 2019, Synergy Empire HK acquired 100% of the equity interests of Lucky Star F&B Sdn. Bhd., a limited liability company incorporated in Malaysia (“Lucky Star”).
Lucky Star acquired 100% of the equity interests of SH Dessert Sdn. Bhd., a limited liability company incorporated in Malaysia (“SH Dessert”) by Lucky Star on February 19, 2016.
On February 26, 2021, Synergy Empire Marshall acquired 100% of Lucky Star F&B Sdn. Bhd from Synergy Empire HK. Subsequently on March 31, 2021, Mr. Leong Will Liam acquired 100% of Synergy Empire HK, as such Synergy Empire HK is no longer a subsidiary of the Company.
Mr. Leong Will Liam is the common director and major shareholder of the Company, Synergy Empire Marshall and Synergy Empire HK,HK.
On July 29, 2022, the Company approved the resignation of Mr. Leong Will Liam concurrently with the appointment of Mr. Vicknesya Naayaker A/L Punosamy as the director of Lucky Star andF&B Sdn. Bhd.
On July 29, 2022, the Company approved the resignation of Mr. Leong Will Liam concurrently with the appointment of Mr. Praveen A/L Ravichandran as the director of SH Dessert.Dessert Sdn. Bhd.
The Company, through its wholly owned subsidiaries, produce and distribute high quality dessert through Lucky Star and operate two restaurants through SH Dessert. Details of the Company’s subsidiaries:
SCHEDULE OF COMPANY'S SUBSIDIARIES
| No. | Company Name | Domicile and Date of Incorporation | Particulars of Issued Capital | Principal Activities | |||||
| 1 | Synergy Empire Holding Limited | Marshall Islands, October 22, 2018 | Share of Ordinary Share, US$1 each | Investment Holding | |||||
| 2 | Lucky Star F&B Sdn. Bhd. | Malaysia, February 9, 2010 | Share of Ordinary Share, MYR1 each | ||||||
| 3 | SH Dessert Sdn. | Malaysia, February 19, 2016 | Share of Ordinary Share, MYR1 each |
On October 31, 2022, the Company terminated all the tenancy agreements before the due date of the agreements.
On November 30, 2022, the Company has entered into a lease agreement with a third party, Sweet Bakery & Dessert Café Sdn Bhd to lease their assets to the third party. The leasing period is commencing from January 1, 2023 to December 31, 2023. The Company did not cease its business operation nor sell the operating assets. The Company is looking for a new strategic location to continue their business while leasing out their assets to the third party.
| F-5 |
2. SUMMARY OF SIGNIFICANT ACCOUNTING POLICIES
Basis of Presentation
These accompanying financial statements have been prepared in accordance with generally accepted accounting principles in the United States of America (“US GAAP”).
The accompanying financial statements include the accounts of the Company and its wholly-owned subsidiaries. Intercompany transactions and balances were eliminated in consolidation.
Below is the organization chart of the Group.
Use of Estimates
In preparing these financial statements, management makes estimates and assumptions that affect the reported amounts of assets and liabilities in the balance sheets and revenues and expenses during the years reported. Actual results may differ from these estimates.
Cash and Cash Equivalents
The Company considers short-term, highly liquid investments with an original maturity of 90 days or less to be cash equivalents.
Our deposit in Malaysia is currently deposit in Public Bank Berhad and Standard Chartered Bank (Malaysia) Berhad, and there is a Perbadanan Insurans Deposit Malaysia protects our eligible deposits held with bank in Malaysia which is members of the Scheme. The scheme will pay a compensation up to a limit of Malaysia Ringgit (“MYR”) 250,000 per deposit per member bank, which is equivalent to $53,92053,557, if the aforementioned banks fail.
Plant and Equipment
Plant and equipment are stated at cost, with depreciation and amortization provided using the straight-line method over the following periods:
SCHEDULE OF DEPRECIATION AND AMORTIZATION PERIODS OF PLANT AND EQUIPMENT
| Asset Categories | Depreciation Periods | |
| Office and kitchen equipment | 10 years | |
| Motor vehicle | 5 years |
Intangible Asset
Intangible assets are stated at cost, with amortization provided using the straight-line method over the following periods:
SCHEDULE OF AMORTIZATION PERIOD OF INTANGIBLE ASSET
| Asset Categories | Amortization Periods | |
| Trademark | 10 years |
| F-6 |
Inventories
Inventories consisting of products available for sell, are stated at the lower of cost or market value. Cost of inventory is determined using the first-in, first-out (FIFO) method. Inventory reserve is recorded to write down the cost of inventory to the estimated market value due to slow-moving merchandise and damaged goods, which is dependent upon factors such as historical and forecasted consumer demand, and promotional environment. The Company takes ownership, risks and rewards of the products purchased. Write downs are recorded in cost of revenue in the consolidated statements of operations and comprehensive income (loss).
Revenue recognition
Revenue is generated through sale of goods and delivery services. Revenue is recognized when a customer obtains control of promised goods or services and is recognized in an amount that reflects the consideration that the Company expects to receive in exchange for those goods or services. In addition, the standard requires disclosure of the nature, amount, timing, and uncertainty of revenue and cash flows arising from contracts with customers. The amount of revenue that is recorded reflects the consideration that the Company expects to receive in exchange for those goods and services. The Company applies the following five-step model in order to determine this amount:
(i) identification of the promised goods and services in the contract;
| (i) | identification of the promised goods and services in the contract; |
(ii) determination of whether the promised goods and services are performance obligations, including whether they are distinct in the context of the contract;
(iii) measurement of the transaction price, including the constraint on variable consideration;
(iv) allocation of the transaction price to the performance obligations; and
(v) recognition of revenue when (or as) the Company satisfies each performance obligation.
The Company adopted ASU 2014-09, Revenue from Contracts with Customers (Topic 606). Under Topic 606, the Company records revenue when persuasive evidence of an arrangement exists, delivery has occurred, the fee is fixed or determinable and collectability is probable. The Company records revenue from the sale of product upon shipment or delivery of the products to the customer. The Company doesn’t allow return of the products purchased or refund unless the food delivered is spoilt.
Cost of revenue
Cost of revenue includes the purchase cost of raw material for manufacturing and distribute to customers and packing materials. It includes purchasing and receiving costs, internal transfer costs, other costs of distribution network, opening and closing inventory net off discount received and return outwards in cost of revenue.
Income tax expense
Income taxes are determined in accordance with the provisions of ASC Topic 740, “Income Taxes” (“ASC Topic 740”). Under this method, deferred tax assets and liabilities are recognized for the future tax consequences attributable to differences between the financial statement carrying amounts of existing assets and liabilities and their respective tax basis. Deferred tax assets and liabilities are measured using enacted income tax rates expected to apply to taxable income in the years in which those temporary differences are expected to be recovered or settled. Any effect on deferred tax assets and liabilities of a change in tax rates is recognized in income in the period that includes the enactment date.
ASC 740 prescribes a comprehensive model for how companies should recognize, measure, present, and disclosed in their financial statements uncertain tax positions taken or expected to be taken on a tax return. Under ASC 740, tax positions must initially be recognized in the financial statements when it is more likely than not the position will be sustained upon examination by the tax authorities. Such tax positions must initially and subsequently be measured as the largest amount of tax benefit that has a greater than 50% likelihood of being realized upon ultimate settlement with the tax authority assuming full knowledge of the position and relevant factsfacts..
The Company conducts major businesses in Malaysia and is subject to tax in their own jurisdictions. As a result of its business activities, the Company will file separate tax returns that are subject to examination by the foreign tax authorities.
| F-7 |
Foreign currencies translation
Transactions denominated in currencies other than the functional currency are translated into the functional currency at the exchange rates prevailing at the dates of the transaction. Monetary assets and liabilities denominated in currencies other than the functional currency are translated into the functional currency using the applicable exchange rates at the balance sheet dates. The resulting exchange differences are recorded in the statement of operations and comprehensive income (loss).
The functional currency of the Company is the United States Dollars (“US$”) and the accompanying financial statements have been expressed in US$. In addition, the Company’s subsidiary maintains its books and record in MalaysiaMalaysian Ringgits (“MYR”) and United States Dollars (“US$”), which is the respective functional currency as being the primary currency of the economic environment in which the entity operates.
In general, for consolidation purposes, assets and liabilities of its subsidiaries whose functional currency is not US$ are translated into US$, in accordance with ASC Topic 830-30, “Translation of Financial Statement”, using the exchange rate on the balance sheet date. Revenues and expenses are translated at average rates prevailing during the period. The gains and losses resulting from translation of financial statements of foreign subsidiary are recorded as a separate component of accumulated other comprehensive income.
Translation of amounts from the local currency of the Company into US$1 has been made at the following exchange rates for the respective periods:
SCHEDULE OF EXCHANGE RATE TRANSLATION OF AMOUNTS FROM LOCAL CURRENCY
For the six months ended September 30 | For the three months ended June 30 | |||||||||||||||
| 2022 | 2021 | 2023 | 2022 | |||||||||||||
| Period-end MYR : US$1 exchange rate | 4.64 | 4.18 | 4.67 | 4.41 | ||||||||||||
| Period-average MYR : US$1 exchange rate | 4.45 | 4.16 | 4.58 | 4.38 | ||||||||||||
Related parties
Parties, which can be a corporation or individual, are considered to be related if the Company has the ability, directly or indirectly, to control the other party or exercise significant influence over the other party in making financial and operating decisions. Companies are also considered to be related if they are subject to common control or common significant influence.
Fair value of financial instruments
The carrying value of the Company’s financial instruments: cash and cash equivalents, tradeaccount receivable, deposits and other receivables, amount due to related partiesaccount payable and accrued expenses and other payablespayable approximate at their fair values because of the short-term nature of these financial instruments.
The Company also follows the guidance of the ASC Topic 820-10, “Fair Value Measurements and Disclosures” (“ASC 820-10”), with respect to financial assets and liabilities that are measured at fair value. ASC 820-10 establishes a three-tier fair value hierarchy that prioritizes the inputs used in measuring fair value as follows:
Level 1 : Observable inputs such as quoted prices in active markets;
Level 2 : Inputs, other than the quoted prices in active markets, that are observable either directly or indirectly; and
Level 3 : Unobservable inputs in which there is little or no market data, which require the reporting entity to develop its own assumptions.
As of SeptemberJune 30, 20222023 and 2021,2022, the Company did not have any nonfinancial assets and liabilities that are recognized or disclosed at fair value in the financial statements, at least annually, on a recurring basis, nor did the Company have any assets or liabilities measured at fair value on a non-recurring basis.
The Company calculates net income/(loss) per share in accordance with ASC Topic 260, “Earnings per Share.” Basic income/(loss) per share is computed by dividing the net income/(loss) by the weighted-average number of common shares outstanding during the period. Diluted income per share is computed similar to basic income/(loss) per share except that the denominator is increased to include the number of additional common shares that would have been outstanding if the potential common stock equivalents had been issued and if the additional common shares were dilutive.
| F-8 |
Lease
The Company adopted the ASU No. 2016-02, on April 1, 2019 (date of inception). The Company leases central kitchen and restaurants for fixed periods pre-emptive extension options. The Company recognizes lease payments for its short-term lease on a straight-line basis over the lease term.
As of SeptemberJune 30, 2022,2023, the Company have threeno operating lease of which lease liability is initially and subsequently measured at the present value of the unpaid lease payments at the lease commencement date. The right-of-use asset is initially measured at cost, which comprises the initial amount of the lease liability adjusted for lease payments made at or before the lease commencement date, plus any initial direct costs incurred less any lease incentives received. Costs associated with operating lease assets are recognized on a straight-line basis within operating expenses over the term of the lease.
In determining the present value of the unpaid lease payments, ASC 842 requires a lessee to discount its unpaid lease payments using the interest rate implicit in the lease or, if that rate cannot be readily determined, its incremental borrowing rate. As most of the Company leases do not provide an implicit rate, the Company uses its incremental borrowing rate as the discount rate for the lease. The Company incremental borrowing rate is estimated to approximate the interest rate on a collateralized basis with similar terms and payments.
Accounts Receivable
Financial instruments that potentially subject the Company to concentrations of credit risk consist primarily of accounts receivable. The Company extends credit to its customers in the normal course of business and generally does not require collateral. The Company’s credit terms are dependent upon the segment, and the customer. The Company assesses the probability of collection from each customer at the outset of the arrangement based on a number of factors, including the customer’s payment history and its current creditworthiness. If in management’s judgment collection is not probable, the Company does not record revenue until the uncertainty is removed.
Management performs ongoing credit evaluations, and the Company maintains an allowance for potential credit losses based upon its loss history and its aging analysis. The allowance for doubtful accounts is the Company’s best estimate of the amount of credit losses in existing accounts receivable. Management reviews the allowance for doubtful accounts each reporting period based on a detailed analysis of trade receivables. In the analysis, management primarily considers the age of the customer’s receivable, and also considers the creditworthiness of the customer, the economic conditions of the customer’s industry, general economic conditions and trends, and the business relationship and history with its customers, among other factors. If any of these factors change, the Company may also change its original estimates, which could impact the level of the Company’s future allowance for doubtful accounts. If judgments regarding the collectability of receivables were incorrect, adjustments to the allowance may be required, which would reduce profitability.
Accounts receivable are recognized and carried at the original invoice amount less an allowance for any uncollectible amounts. An estimate for doubtful accounts receivable is made when collection of the full amount is no longer probable. Bad debts are written off as identified. For the quarter ended June 30, 2023, the Company makes an allowance for expected credit loss of $7,859.
Recently Issued Accounting Standards
RecentIn June 2016, the FASB issued Accounting Standards Update No. 2016-13, Financial Instruments—Credit Losses (Topic 326): Measurement of Credit Losses on Financial Instruments, which introduced the expected credit losses methodology for the measurement of credit losses on financial assets measured at amortized cost basis, replacing the previous incurred loss methodology. In November 2019, the FASB issued ASU 2019-10 highlighted the adoption timeline. For smaller reporting entities, Topic 326 is effective for annual periods beginning after December 15, 2022, including interim periods within those fiscal years, of which is effective for the Company on April 1, 2023. An analysis of receivables, including credit losses, was conducted during the first quarter of fiscal 2023. The Company does not anticipate that the adoption of the new guidance will have a material impact on our consolidated financial statements.
Other recent accounting pronouncements issued by the FASB, including its Emerging Issues Task Force, the American Institute of Certified Public Accountants, and the Securities and Exchange Commission did not or are not believed by management to have a material impact on the Company’s present or future financial statements.
3. GOING CONCERN UNCERTAINTIES
The accompanying financial statements have been prepared assuming that the Company will continue as a going concern. The Companycompany having accumulated deficit of $1,903,6372,181,020 and $1,599,5312,134,207 as of SeptemberJune 30, 20222023 and March 31, 2022,2023 respectively.
For the sixthree months ended SeptemberJune 30, 20222023 and 2021,2022, the Company suffered from a net loss of $304,10646,813 and $220,587143,597 respectively.
For the six months ended September 30, 2022 and 2021, the Company recorded operating cash outflows of $272,888 and $286,703 in operating activities respectively.
Furthermore, the Company recorded a negative working capital of $1,333,7671,345,640 and $1,188,8191,384,526 as of as of SeptemberJune 30, 20222023 and March 31, 20222023 respectively.
The Company’s cash position is not sufficient to support the Company’s daily operations. While the Company believes in the viability of its strategy and in its ability to raise additional funds, there can be no assurances to that effect. The Company’s ability to continue as a going concern is dependent upon its ability to improve profitability and the ability to acquire financial support from its shareholder.
These and other factors raise substantial doubt about the Company’s ability to continue as a going concern within one year after the date that financial statements are issued. These financial statements do not include any adjustments to reflect the possible future effects on the recoverability and classification of assets or the amounts and classification of liabilities that may result in the Company not being able to continue as a going concern.
4. ACCOUNTS RECEIVABLE, NET
SCHEDULE OF ACCOUNTS RECEIVABLE NET
As of June 30, 2023 | As of March 31, 2023 | |||||||
| Accounts receivable, gross | $ | 7,859 | $ | - | ||||
| Allowance for expected credit loss | (7,859 | ) | - | |||||
| Accounts receivable, net | $ | - | $ | - | ||||
4.5. PREPAID EXPENSES AND DEPOSITS
SCHEDULE OF PREPAID EXPENSES AND DEPOSITS
As of September 30, 2022 | As of March 31, 2022 | |||||||
| Rental deposits | $ | 19,994 | $ | 22,048 | ||||
| Other deposits | 1,518 | - | ||||||
| Prepaid expenses | 7,533 | 12,050 | ||||||
| Other receivables | - | 1,675 | ||||||
| Total | $ | 29,045 | $ | 35,773 | ||||
The rental deposits represent the deposit of the tenancy agreements.
Other deposits consist of deposit of copy machine, coffee machine and security deposits.
| As of June 30, 2023 | As of March 31, 2023 | |||||||
| Prepaid expenses | 8,750 | 12,500 | ||||||
| Other receivables | 443 | 3,181 | ||||||
| Total | $ | 9,193 | $ | 15,681 | ||||
Prepaid expenses represent the deposit payments of public utilities, such as electricity, telephone, and water supplies.OTCQB annual fee.
5. INVENTORIESOther receivables consist of overpayment to supplier.
SCHEDULE OF INVENTORIES
As of September 30, 2022 | As of March 31, 2022 | |||||||
| Raw material, at cost | $ | 12,991 | $ | 11,198 | ||||
| F-9 |
6. PLANT AND EQUIPMENT
SCHEDULE OF PLANT AND EQUIPMENT
| As of September 30, 2022 | As of March 31, 2022 | As of June 30, 2023 | As of March 31, 2023 | |||||||||||||
| Renovation | $ | 326,865 | $ | 360,458 | ||||||||||||
| Office equipment | 37,475 | 41,187 | 37,223 | 39,285 | ||||||||||||
| Kitchen equipment | 41,124 | 33,427 | 40,953 | 43,222 | ||||||||||||
| Motor vehicle | 10,568 | 11,654 | 10,497 | 11,078 | ||||||||||||
| Total plant and equipment | $ | 416,032 | $ | 446,726 | $ | 88,673 | $ | 93,585 | ||||||||
| Less: Accumulated depreciation | (168,134 | ) | (151,703 | ) | (27,917 | ) | (27,401 | ) | ||||||||
| Total plant and equipment | $ | 247,898 | $ | 295,023 | $ | 60,756 | $ | 66,184 | ||||||||
For the sixthree months ended SeptemberJune 30, 2023, the Company does not invest in plant and equipment.
For the three months ended June 30, 2022, the Company has invested $11,26410,076 in kitchen equipment and $132 in office equipment respectively.
For the six months ended September 30, 2021, the Company has invested $6,135 in kitchen equipment, $8,434 in renovations and $17,090134 in office equipment respectively.
Depreciation expenses for sixthe three months ended SeptemberJune 30, 20222023 and 20212022 amounted to $31,8461,992 and $38,99116,157 respectively.
7. ACCRUED EXPENSES AND OTHER PAYABLES
SCHEDULE OF ACCRUED EXPENSES AND OTHER PAYABLES
As of September 30, 2022 | As of March 31, 2022 | As of June 30, 2023 | As of March 31, 2023 | |||||||||||||
| Accrued expenses | $ | 45,953 | $ | 50,388 | $ | 24,685 | $ | 31,322 | ||||||||
| Other payables | 37,482 | 43,513 | 33,394 | 39,111 | ||||||||||||
| Deposit received | 428 | 452 | ||||||||||||||
| Total | $ | 83,435 | $ | 93,901 | $ | 58,507 | $ | 70,885 | ||||||||
Accrued expenses consist of accrued salary utilities bills, and professional fee.
Other payable consist of outstanding marketing expenses, payables to suppliers loan from third party and sales and service tax payable.
Deposit received consist of deposit from lease agreement.
8. AMOUNT DUE TO A DIRECTOR
As of March 31, 2022,2023, the Company has an outstanding loan payable to Mr. Leong Will Liam amounted $1,066,422. Of which including an amount due to Synergy Empire HK, amounted $24,822.
For the six months ended September 30, 2022, Mr. Leong Will Liam has further advanced $224,091 to the Company for working capital purpose.
As of September 30, 2022, the Company has an outstanding loan payable to Mr. Leong Will Liam amounted $1,209,8271,325,308, of which including an amount due to Synergy Empire HK, amounted $24,822. For the three months ended June 30, 2023, Mr. Leong Will Liam has further advanced $15,050 to the Company for working capital purpose.
Both aforementioned loans are unsecured, non-interest bearing and payable on demand.
SCHEDULE OF AMOUNT DUE TO DIRECTORSA DIRECTOR
| Amount due to director, Mr. Leong Will Liam | ||||
| Balance as of March 31, 2023 | $ | 1,300,486 | ||
| Loan from Director | 15,050 | |||
| Foreign currency translation | (49,449 | ) | ||
| Balance as of June 30, 2023 | $ | 1,266,087 | ||
| Balance as of June 30, 2023 – Amount due to Synergy Empire HK | 24,822 | |||
| Balance as of June 30, 2023 – Total amount due to director | $ | 1,290,909 | ||
| Amount due to director, Mr. Leong Will Liam | ||||
| Balance as of March 31, 2022 | $ | 1,041,600 | ||
| Loan from Director | 224,091 | |||
| Foreign currency translation | (80,686 | ) | ||
| Balance as of September 30, 2022 | $ | 1,185,005 | ||
| Balance as of September 30, 2022 - Amount due to Synergy Empire HK | 24,822 | |||
| Balance as of September 30, 2022 - Total amount due to director | $ | 1,209,827 |
| F-10 |
9. BANK BORROWING
On January 25, 2017, Lucky Star F&B Sdn. Bhd., a wholly owned subsidiary of the Company has acquired a business loan from Standard Chartered Saadiq Berhad, a bank incorporated in Malaysia, amounted to MYR342,834 (approximately $83,972) at annual interest rate of 6.00% accrued in arrear, for a repayment period of 72 months with interest bearing monthly installment of MYR6,473 (approximately $1,585) which is the sole bank borrowing by the Company.
The outstanding balance of business loan as of SeptemberJune 30 and March 31, 20222023 can be summarized as follow:
SUMMARY OF OUTSTANDING BALANCE OF BUSINESS LOANS
As of September 30, 2022 | As of March 31, 2022 | As of June 30, 2022 | As of March 31, 2023 | |||||||||||||
| Bank borrowing (Current portion) | $ | 15,483 | $ | 16,936 | $ | 3,480 | $ | 7,954 | ||||||||
| Bank borrowing (Non-current portion) | - | 8,445 | - | - | ||||||||||||
| Total | $ | 15,483 | $ | 25,381 | $ | 3,480 | $ | 7,954 | ||||||||
On April 1, 2020, Standard Chartered Saadiq Berhad announced to provide loan deferment to borrower for a period 6 months in supporting of Malaysia National Bank to ease financial pressure as a result of movement control order promulgated by Malaysia Government to contain the outbreak of COVID-19.COVID- 19. Pursuant to the announcement, no instalment is required, and no penalty will be imposed during the 6 months period however additional non-compounding interest will continue to accrue. As such, the Company has incurred additional interest of $2,141 interest expenses. The last repayment is expected on August 2023.
For the sixthree months ended SeptemberJune 30, 2022,2023, the Company repaid $7,8464,134 in bank borrowings.
For the sixthree months ended SeptemberJune 30, 2021,2022, the Company repaid $7,5903,938 in bank borrowings.
Maturities of the loan for each of the three years and thereafter are as follows:
SCHEDULE OF MATURITIES OF LOAN
| Year ending March 31 | ||||
| 2023 | $ | 7,861 | ||
| 2024 | $ | 7,622 | ||
| Total | $ | 15,483 |
10. LEASE RIGHT-OF-USE ASSET AND LEASE LIABILITIES
SCHEDULE OF OPERATING LEASE RIGHT-OF-USE AND LEASE LIABILITIES
For the six months ended September 30, 2022 and 2021, the amortization of the operating lease right of use asset amounted $29,839 and $32,423, respectively.
| Lease Liability | ||||
| Balance as of March 31, 2022 | 297,108 | |||
| Imputed interest | 6,784 | |||
| Gross repayment | (36,105 | ) | ||
| Foreign exchange translation | (27,689 | ) | ||
| Balance as of September 30, 2022 | 240,098 | |||
| Lease liability current portion | 61,066 | |||
| Lease liability non-current portion | $ | 179,032 |
Maturities of operating lease obligation as follow:
SCHEDULE OF MATURITIES OF OPERATING LEASE OBLIGATION
| Year ending | ||||
| March 31, 2023 | 30,122 | |||
| March 31, 2024 | 62,734 | |||
| March 31, 2025 | 59,875 | |||
| March 31, 2026 | 49,814 | |||
| March 31, 2027 | 19,109 | |||
| February 29, 2028 | 18,444 | |||
| Total | $ | 240,098 | ||
Other information:
SCHEDULE OF LEASE OTHER INFORMATION
For the six months ended September 30 | ||||||||
| 2022 | 2021 | |||||||
| Cash paid for amounts included in the measurement of lease liabilities: | ||||||||
| Operating cash flow to operating lease | $ | 38,152 | $ | 40,879 | ||||
| Right-of-use assets obtained in exchange for operating lease liabilities | - | - | ||||||
| Remaining lease term for operating lease (years) | 3.97 | 3.89 | ||||||
| Weighted average discount rate for operating lease | 5.40 | % | 5.70 | % | ||||
| Year ending March 31 | |||||
| 2023 | $ | 3,480 | |||
| Total | $ | 3,480 | |||
11.10. CONCENTRATION OF RISK
(a) Major Customers
For the three and six months ended SeptemberJune 30, 2023, there was one customer who accounted for 100% of the Company’s revenues with significant outstanding receivables.
For the three months ended June 30, 2022, and 2021, there was no customer who accounted for 10% or more of the Company’s revenues nor with significant outstanding receivables.
(b) Major Suppliers
For the three and six months ended SeptemberJune 30, 20222023 and 2021,2022, there was no supplier who accounted for 10% or more of the Company’s purchases nor with significant outstanding payables.
12.11. INCOME TAXES
The loss before income taxes of the Company for the sixthree months ended SeptemberJune 30, 20222023 and 20212022 were comprised of the following:
SCHEDULE OF INCOME (LOSS) BEFORE INCOME TAXES
For the six months ended September 30 | For the three months ended June 30 | |||||||||||||||
| 2022 | 2021 | 2023 | 2022 | |||||||||||||
| Tax jurisdictions from: | ||||||||||||||||
| – Local | $ | (85,865 | ) | $ | (22,523 | ) | $ | (43,854 | ) | $ | (40,188 | ) | ||||
| – Foreign, representing: | ||||||||||||||||
| Marshall Islands (non-taxable jurisdiction) | - | - | - | - | ||||||||||||
| Hong Kong | - | - | - | - | ||||||||||||
| Malaysia | (218,241 | ) | (198,064 | ) | (2,959 | ) | (103,409 | ) | ||||||||
| Loss before income taxes | $ | (304,106 | ) | $ | (220,587 | ) | $ | (46,813 | ) | $ | (143,597 | ) | ||||
Provision for income taxes consisted of the following:
SUMMARY OF PROVISION FOR INCOME TAX
| For the six months ended September 30 | For the three months ended June 30 | |||||||||||||||
| 2022 | 2021 | 2023 | 2022 | |||||||||||||
| Current: | ||||||||||||||||
| – Local | $ | - | $ | - | $ | - | $ | - | ||||||||
| – Foreign: | ||||||||||||||||
| Marshall Islands (non-taxable jurisdiction) | - | - | - | - | ||||||||||||
| Malaysia | - | - | - | - | ||||||||||||
| Deferred: | ||||||||||||||||
| – Local | - | - | - | - | ||||||||||||
| – Foreign | - | - | - | - | ||||||||||||
| $ | - | $ | - | $ | - | $ | - | |||||||||
The effective tax rate in the periods presented is the result of the mix of income earned in various tax jurisdictions that apply a broad range of income tax rates. During the periods presented, the Company has a number of subsidiaries that operates in different countries and is subject to tax in the jurisdictions in which its subsidiaries operate, as follows:
United States of America
The Tax Act reduces the U.S. statutory corporate tax rate from 35% to 21% for our tax years beginning in 2018. The Company is registered in the State of Nevada and is subject to United States of America tax law. As of SeptemberJune 30, 2022,2023, the operations in the United States of America incurred $276,786331,658 of cumulative net operating losses (NOL’s) which can be carried forward to offset future taxable income. The NOL carry forwards begin to expire in 20422043, if unutilized. The Company has provided for a full valuation allowance of approximately $58,12569,648 against the deferred tax assets on the expected future tax benefits from the net operating loss carry forwards as the management believes it is more likely than not that these assets will not be realized in the future.
Malaysia
Lucky Star F&B Sdn. Bhd. and SH Desserts Sdn. Bhd. are subject to the Malaysia Corporate Tax Laws at a two-tier corporate income tax rate based on amount of paid-up capital. The 20222023 tax rate for company with paid-up capital of MYR 2,500,000 (approximately $539,200535,573) or less and that are not part of a group containing a company exceeding this capitalization threshold is 17% on the first MYR 600,000 (approximately $129,408)$128,537) taxable profit with the remaining balance being taxed at 24%..
For the sixthree months ended SeptemberJune 30, 2022,2023, Lucky Star F&B Sdn. Bhd. andBhd.and SH Desserts Sdn. Bhd. incurred a loss of $133,8401,483 and $84,4011,476 respectively, which can be carried forward for seven years to offset its taxable income.
As of SeptemberJune 30, 2022,2023, the operations in Malaysia generated $1,623,2551,844,318 of cumulative net operating losses which can be carried forward to offset future taxable income. The net operating loss can be carried forward for seven years. The Company has provided for a full valuation allowance against the deferred tax assets of $275,953313,534 on the expected future tax benefits from the net operating loss carry forwards as the management believes it is more likely than not that these assets will not be realized in the future.
The following table sets forth the significant components of the aggregate deferred tax assets of the Company as of SeptemberJune 30 2022 and March 31, 2022:2023:
SCHEDULE OF DEFERRED TAX ASSETS AND LIABILITIES
| As of | As of | |||||||||||||||
| September 30, 2022 | March 31, 2022 | As of June 30, 2023 | As of March 31, 2023 | |||||||||||||
| Deferred tax assets: | ||||||||||||||||
| Net operating loss carryforwards | $ | $ | $ | $ | ||||||||||||
| – United States of America | 58,125 | 40,093 | 69,648 | 60,439 | ||||||||||||
| – Marshall Islands | - | - | - | - | ||||||||||||
| – Malaysia | 275,953 | 238,867 | 313,534 | 313,031 | ||||||||||||
| 334,078 | 278,960 | 383,182 | 373,470 | |||||||||||||
| Less: valuation allowance | (334,078 | ) | (278,960 | ) | (383,182 | ) | (373,470 | ) | ||||||||
| Deferred tax assets | $ | - | $ | - | $ | - | $ | - | ||||||||
Management believes that it is more likely than not that the deferred tax assets will not be fully realizable in the future. Accordingly, the Company provided for a full valuation allowance against its deferred tax assets of $334,078383,182 as of SeptemberJune 30, 2022.2023. For sixthree months ended SeptemberJune 30, 2022,2023, the valuation allowance increased by $55,1189,712, primarily relating to the loss incurred by the Company, Lucky Star F&B Sdn. Bhd. and SH Desserts Sdn.Shd. Bhd.
13.12. STOCKHOLDERS’ EQUITY
On October 17, 2018, the founder of the Company, Mr. Leong Will Liam purchased shares of restricted common stock of the Company at $ per share for the Company’s initial working capital. Each share was with a par value of $0.0001. All proceeds received are used for the Company’s working capital.
On January 21, 2019, CBA Capital Holdings Sdn. Bhd. waived an interest-free loan of $257,183 in Lucky Star F&B Sdn. Bhd., our wholly own subsidiary, as contribution and recorded in additional paid in capital. CBA Capital Holdings Sdn. Bhd. is wholly owned by our Director, Mr. Leong Will Liam.
On December 30, 2020, the Company resolved to close the offering from the registration statement on Form S-1/A, dated February 25, 2020, that had been declared effective by the Securities and Exchange Commission on March 10, 2020. The Offering resulting in shares of common stock being sold at $ per share for a total of $500,000. The proceed of $500,000 will become the capital for our expansion, pursuant to the use of proceed stated in the aforementioned Form S-1/A.
As of March 31, 2021, the Company have an issued and outstanding share of common stock of with an authorized share of common stock of with a par value of $. In addition, the Company have an authorized share of preference stock of with a par value of $, however share of preference stock was issued and outstanding as of March 31, 2021.
During the year ended March 31, 2022, the Company reduce authorized share capital for both common stock of to and preferred stock of to , while par value remains the same for both common and preferred stock. As of SeptemberJune 30, 2022,2023, the Company have an issued and outstanding share of common stock of while preferred share was issued and outstanding.
14.13. FOREIGN CURRENCY EXCHANGE RATE
The Company cannot guarantee that the current exchange rate will remain stable, therefore there is a possibility that the Company could post the same amount of income for two comparable periods and because of the fluctuating exchange rate post higher or lower income depending on exchange rate converted into US$ at the end of the financial year. The exchange rate could fluctuate depending on changes in political and economic environments without notice.
15.14. SEGMENT REPORTING
ASC 280, “Segment Reporting” establishes standards for reporting information about operating segments on a basis consistent with the Company’s internal organization structure as well as information about services categories, business segments and major customers in financial statements. The Company has singletwo reportable segmentsegments based on business unit, food and beverage business and singleasset leasing business and three reportable segmentsegments based on country, United States, Marshall and Malaysia.
In accordance with the “Segment Reporting” Topic of the ASC, the Company’s chief operating decision maker has been identified as the Chief Executive Officer and President, who reviews operating results to make decisions about allocating resources and assessing performance for the entire Company. Existing guidance, which is based on a management approach to segment reporting, establishes requirements to report selected segment information quarterly and to report annually entity-wide disclosures about products and services, major customers, and the countries in which the entity holds material assets and reports revenue. All material operating units qualify for aggregation under “Segment Reporting” due to their similar customer base and similarities in economic characteristics; nature of products and services; and procurement, manufacturing and distribution processes.
SCHEDULE OF SEGMENT REPORTING INFORMATION BY BUSINESS UNIT
| For the Six Months Ended and As of September 30, 2022 | For the Three Months Ended and As of June 30, 2023 | |||||||||||||||||||
| By Business Unit | Food & Beverage Business | Total | Assets Leasing Business | Food & Beverage Business | Total | |||||||||||||||
| Revenue | $ | 102,350 | $ | 102,350 | $ | 7,859 | $ | - | $ | 7,859 | ||||||||||
| Cost of revenue | (59,795 | ) | (59,795 | ) | - | - | - | |||||||||||||
| General and administrative expenses | (345,746 | ) | (345,746 | ) | (54,549 | ) | - | (54,549 | ) | |||||||||||
| Loss from operations | (303,191 | ) | (303,191 | ) | (46,690 | ) | - | (46,690 | ) | |||||||||||
| Total assets | $ | 536,619 | $ | 536,619 | $ | 74,730 | $ | - | $ | 74,730 | ||||||||||
| Capital expenditure | $ | 11,396 | $ | 11,396 | $ | - | $ | - | $ | - | ||||||||||
| For the Six Months Ended and As of September 30, 2021 | For the Three Months Ended and As of June 30, 2022 | |||||||||||||||||||
| By Business Unit | Food & Beverage Business | Total | Assets Leasing Business | Food & Beverage Business | Total | |||||||||||||||
| Revenue | $ | 27,883 | $ | 27,883 | $ | - | $ | 44,909 | $ | 44,909 | ||||||||||
| Cost of revenue | (10,721 | ) | (10,721 | ) | - | (20,963 | ) | (20,963 | ) | |||||||||||
| General and administrative expenses | (259,265 | ) | (259,265 | ) | - | (167,029 | ) | (167,029 | ) | |||||||||||
| Loss from operations | (242,103 | ) | (242,103 | ) | - | (143,083 | ) | (143,083 | ) | |||||||||||
| Total assets | $ | 667,595 | $ | 667,595 | $ | - | $ | 604,353 | $ | 604,353 | ||||||||||
| Capital expenditure | $ | 31,659 | $ | 31,659 | $ | - | $ | 10,209 | $ | 10,209 | ||||||||||
SCHEDULE OF SEGMENT REPORTING INFORMATION BY COUNTRY
| For the Six Months Ended and As of September 30, 2022 | For the Three Months Ended and As of June 30, 2023 | |||||||||||||||||||||||||||
| By Country | United States | Malaysia | Total | United States | Marshall | Malaysia | Total | |||||||||||||||||||||
| Revenue | $ | - | $ | 102,350 | $ | 102,350 | $ | - | $ | - | $ | 7,859 | $ | 7,859 | ||||||||||||||
| Cost of revenue | - | (59,795 | ) | (59,795 | ) | - | - | - | - | |||||||||||||||||||
| General and administrative expenses | (85,865 | ) | (259,881 | ) | (345,746 | ) | (43,854 | ) | - | (10,695 | ) | (54,549 | ) | |||||||||||||||
| Loss from operations | (85,865 | ) | (217,326 | ) | (303,191 | ) | (43,854 | ) | - | (2,836 | ) | (46,690 | ) | |||||||||||||||
| Total assets | $ | 3,646 | $ | 532,973 | $ | 536,619 | $ | 8,834 | $ | - | $ | 65,896 | $ | 74,730 | ||||||||||||||
| Capital expenditure | $ | - | $ | 11,396 | $ | 11,396 | $ | - | $ | - | $ | - | $ | - | ||||||||||||||
| For the Six Months Ended and As of September 30, 2021 | For the Three Months Ended and As of June 30, 2022 | |||||||||||||||||||||||||||
| By Country | United States | Malaysia | Total | United States | Marshall | Malaysia | Total | |||||||||||||||||||||
| Revenue | $ | - | $ | 27,883 | $ | 27,883 | $ | - | $ | - | $ | 44,909 | $ | 44,909 | ||||||||||||||
| Cost of revenue | - | (10,721 | ) | (10,721 | ) | - | - | (20,963 | ) | (20,963 | ) | |||||||||||||||||
| General and administrative expenses | (23,243 | ) | (236,022 | ) | (259,265 | ) | - | - | (167,029 | ) | (167,029 | ) | ||||||||||||||||
| Loss from operations | (23,243 | ) | (218,860 | ) | (242,103 | ) | - | - | (143,083 | ) | (143,083 | ) | ||||||||||||||||
| Total assets | $ | 24,198 | $ | 643,397 | $ | 667,595 | $ | 7,310 | $ | - | $ | 597,043 | $ | 604,353 | ||||||||||||||
| Capital expenditure | $ | - | $ | 31,659 | $ | 31,659 | $ | - | $ | - | $ | 10,209 | $ | 10,209 | ||||||||||||||
| F-15 |
16.15. SUBSEQUENT EVENTS
In accordance with ASC Topic 855, “Subsequent Events”, which establishes general standards of accounting for and disclosure of events that occur after the balance sheet date but before financial statements are issued, the Company has evaluated all events or transactions that occurred after SeptemberJune 30, 20222023 up through the date the Company presented these unauditedaudited financial statements.
| F-16 |
ITEM 2. MANAGEMENT’S DISCUSSION AND ANALYSIS OF FINANCIAL CONDITION AND RESULTS OF OPERATIONS
The information contained in this quarter report on Form 10-Q is intended to update the information contained in our Form 10-K dated July 14, 2022,June 28, 2023, for the year ended March 31, 20222023 and presumes that readers have access to, and will have read, the “Management’s Discussion and Analysis of Financial Condition and Results of Operations” and other information contained in such Form 10-K. The following discussion and analysis also should be read together with our financial statements and the notes to the financial statements included elsewhere in this Form 10-Q.
Certain statements in this Report constitute forward-looking statements. These forward-looking statements include statements, which involve risks and uncertainties, regarding, among other things, (a) our projected sales, profitability, and cash flows, (b) our growth strategy, (c) anticipated trends in our industry, (d) our future financing plans, and (e)café our anticipated needs for, and use of, working capital. They are generally identifiable by use of the words “may,” “will,” “should,” “anticipate,” “estimate,” “plan,” “potential,” “project,” “continuing,” “ongoing,” “expects,” “management believes,” “we believe,” “we intend,” or the negative of these words or other variations on these words or comparable terminology. In light of these risks and uncertainties, there can be no assurance that the forward-looking statements contained in this filing will in fact occur. You should not place undue reliance on these forward-looking statements.
The forward-looking statements speak only as of the date on which they are made, and, except to the extent required by federal securities laws, we undertake no obligation to update any forward-looking statements to reflect events or circumstances after the date on which the statements are made or to reflect the occurrence of unanticipated events.
Overview
We share the same business plan as that of our subsidiaries. We are engaged in the production and sale of food products, specifically dessert created and sold through various restaurants that we operate in Malaysia. We sell our goods under our brand name “Sweet Hut.” We have two dessert restaurant chains and one central kitchen.
It is worth highlighting that, on 15 June 2021, Malaysia Government introduced a four-phase National Recovery Plan (herein and after referredOn October 31, 2022, the “NRP”) to helpCompany terminated all the country emerge fromtenancy agreements before the COVID-19 pandemic and its economic fallout. As each phase is based ondue date of the number of new cases, people requiring ICU treatment, and vaccination rates, it can be extended, or moved on to the next phase, whenever possible.agreements.
Phase 1 - Conditions areOn November 30, 2022, the same as “total lockdown” launched from 1 June 2021. No social gatherings, dine-in eating at restaurants, interstate travel and non-essential services are permitted. Any remaining workplaces are requiredCompany has entered into a lease agreement with a third party, Sweet Bakery & Dessecaféafe Sdn Bhd to havelease their workers work from their homes. This phase, based on the critical condition of the healthcare services, may last until end of July.
Phase 2 - If more people are vaccinated, ICU bed usage reduced to a moderate level; and new cases fall below 4,000, the country will move onassets to the next phase which allows more economic sectorsthird party. The leasing period is commencing from January 1, 2023 to resume operation.
Phase 3 - Once daily cases are reducedDecember 31, 2023. The Company did not cease its business operation nor sell the operating assets. The Company is looking for a new strategic location to 2,000,continue their business while leasing out their assets to the healthcare system has returned to a manageable level; ICU cases have been reduced to an adequate amount; and 40% of the people have been vaccinated. All economic sectors will be allowed to operate and most importantly dining in restaurants and cafes will be allowed. This phase will be expected to start on late August.
Phase 4 - Once daily cases have dropped to 500, the healthcare system becomes safe as ICU cases become low enough; and 60% of the people have been vaccinated. This phase will be expected to start on late October.
The Company’s central kitchen and two restaurants were and will continue to operate throughout each phase of NRP.third party.
Results of Operations
For the sixthree months ended SeptemberJune 30, 20222023 and 2021,2022, the Company has generated a revenue of $102,350$7,859 and $27,883, respectively. Breakdown$44,909. The breakdown of revenue is as following:
Three months ended September 30 | Six months ended September 30 | Three months ended June 30 | ||||||||||||||||||||||
| 2023 | 2022 | |||||||||||||||||||||||
| Lease Revenue | $ | 7,859 | $ | - | ||||||||||||||||||||
| Percentage towards Total Revenue | 100.00 | % | 0 | % | ||||||||||||||||||||
| 2022 | 2021 | 2022 | 2021 | |||||||||||||||||||||
| Dine-In and Take Away Revenue | $ | 34,063 | $ | 1,502 | $ | 60,558 | $ | 7,759 | $ | - | $ | 26,495 | ||||||||||||
| Percentage towards Total Revenue | 59.30 | % | 8.92 | % | 59.17 | % | 27.83 | % | 0 | % | 59.00 | % | ||||||||||||
| Delivery Revenue | $ | 23,378 | $ | 15,335 | $ | 41,792 | $ | 20,124 | $ | - | $ | 18,414 | ||||||||||||
| Percentage towards Total Revenue | 40.70 | % | 91.08 | % | 40.83 | % | 72.17 | % | 0 | % | 41.00 | % | ||||||||||||
| Total Revenue | $ | 57,441 | $ | 16,837 | $ | 102,350 | $ | 27,883 | $ | 7,859 | $ | 44,909 | ||||||||||||
| Total Cost of Sales | $ | (38,832 | ) | $ | (6,732 | ) | $ | (59,795 | ) | $ | (10,721 | ) | $ | - | $ | 20,963 | ||||||||
| Total Gross Profit | $ | 18,609 | $ | 10,105 | $ | 42,555 | $ | 17,162 | $ | 7,859 | $ | 23,946 | ||||||||||||
| Gross Profit Margin | 32.40 | % | 60.02 | % | 41.58 | % | 61.55 | % | 100.00 | % | 53.32 | % | ||||||||||||
| 3 |
The Company has experience significant deterioration in both delivery and dine in & take away revenue segment due to several reasons. One being the closure of previous four restaurants since September 2020 and launching of two brand new restaurants in C180 and Sri Petaling which commence operation on February and June 2021, respectively for business rebranding purpose and another being adversely impacted by COVID-19 Movement Control Order imposed by Malaysia Government.
Revenue for the Three Months ended SeptemberJune 30, 20222023 and 20212022
For the three months ended June 30, 2023, the Company earned a lease revenue of $7,859 due to the Company has entered into a lease agreement with a third party, Sweet Bakery & Dessert Café Sdn Bhd to lease their assets to the third party.
Dine-in and take away revenue improveddeclined from $1,502$26,495 for the three months ended SeptemberJune 30, 20212022 to $34,063$0 for the three months ended SeptemberJune 30, 2023. The decline in dine-in revenue primarily due to the termination of all the tenancy agreements on October 31, 2022. Therefore, the Company do not generate any dine-in revenue from March 2023 to June 2023.
Delivery revenue improveddeclined from $15,335$18,414 for the three months ended SeptemberJune 30, 20212022 to $23,378$0 for the three months ended SeptemberJune 30, 2023. The decline in delivery revenue primarily due to the termination of all the tenancy agreements on October 31, 2022. Therefore, the Company do not generate any dine-in revenue from March 2023 to June 2023.
Total revenue improveddeclined from $16,837$44,909 for the three months ended SeptemberJune 30, 20212022 to $57,441$7,859 for the three months ended SeptemberJune 30, 2022, which2023, primarily due to improvement inthe termination of all the tenancy agreements on October 31, 2022. Therefore, the Company do not generate any dine-in and take away revenue.
Revenue for the Six Months ended September 30, 2022 and 2021
Dine-in and take away improvedrevenue from $7,759 for the six months ended September 30, 2021March 2023 to $60,558 for the six months ended September 30, 2022
Delivery revenue improved from $20,124 for the six months ended September 30, 2021 to $41,792 for the six months ended September 30, 2022.
Total revenue improved from $27,883 for the six months ended September 30, 2021 to $102,350 for the six months ended September 30, 2022, which primarily due to improvement in dine-in and take away revenue as a result of the relaxation of NRP, which allow consumers to dine in public area and the effect of our advertisement and promotions.June 2023.
General and Administrative Expenses
For the sixthree months ended SeptemberJune 30, 20222023 and 2021,2022, the Company has incurred a general and administrative expenses of $345,746$54,549 and $259,265$167,029 respectively. Of which primarily consist of salary, lease expenses, utilities, depreciation, professional fees and repair and maintenance and advertisement and promotions.
Six months ended September 30 | Three months ended June 30 | |||||||||||||||
| Primary expenses | 2022 | 2021 | 2023 | 2022 | ||||||||||||
| Salary and salary related expenses | $ | 139,584 | $ | 122,374 | $ | - | $ | 68,913 | ||||||||
| Percentage towards General and Administrative Expenses | 40.37 | % | 47.20 | % | 0 | % | 41.26 | % | ||||||||
| Lease expenses | $ | 38,152 | $ | 40,879 | $ | - | $ | 19,382 | ||||||||
| Percentage towards General and Administrative Expenses | 11.03 | % | 15.77 | % | 0 | % | 11.60 | % | ||||||||
| Utility expenses | $ | 18,267 | $ | 12,693 | $ | - | $ | 8,955 | ||||||||
| Percentage towards General and Administrative Expenses | 5.28 | % | 4.90 | % | 0 | % | 5.36 | % | ||||||||
| Depreciation expenses | $ | 31,921 | $ | 39,057 | ||||||||||||
| Depreciation and amortization expenses | $ | 2,027 | $ | 16,194 | ||||||||||||
| Percentage towards General and Administrative Expenses | 9.23 | % | 15.06 | % | 3.71 | % | 9.70 | % | ||||||||
| Professional expenses | $ | 37,341 | $ | 16,068 | $ | 11,646 | $ | 13,325 | ||||||||
| Percentage towards General and Administrative Expenses | 10.80 | % | 6.20 | % | 21.35 | % | 7.98 | % | ||||||||
| Repair and maintenance expenses | $ | 5,961 | $ | 6,093 | $ | 70 | $ | 3,138 | ||||||||
| Percentage towards General and Administrative Expenses | 1.72 | % | 2.35 | % | 0.13 | % | 1.88 | % | ||||||||
| Compliance expenses | $ | 1,809 | $ | 3,059 | $ | 240 | $ | 410 | ||||||||
| Percentage towards general and administrative expenses | 0.52 | % | 1.18 | % | 0.44 | % | 0.24 | % | ||||||||
| Advertisement and promotion expenses | $ | 6,942 | $ | - | $ | - | $ | 2,967 | ||||||||
| Percentage towards General and Administrative Expenses | 2.01 | % | 0.00 | % | 0 | % | 1.78 | % | ||||||||
| Total primary expenses | $ | 279,977 | $ | 240,223 | $ | 13,983 | $ | 133,284 | ||||||||
| Percentage towards General and Administrative Expenses | 80.98 | % | 92.66 | % | 25.63 | % | 79.80 | % | ||||||||
| Miscellaneous expenses | $ | 65,769 | $ | 19,042 | $ | 40,566 | 33,745 | |||||||||
| Percentage towards General and Administrative Expenses | 19.02 | % | 7.34 | % | 74.37 | % | 20.20 | % | ||||||||
| Gain on disposal of motor vehicle | $ | - | $ | - | ||||||||||||
| Total General and Administrative Expenses | $ | 345,746 | $ | 259,265 | ||||||||||||
Net Loss
For the sixthree months ended SeptemberJune 30, 20222023 and 2021,2022, the Company has incurred a net loss of $304,106$46,813 and $220,587$143,597 respectively.
| 4 |
Liquidity and Capital Resources
Cash Used In Operating Activities
For the sixthree months ended SeptemberJune 30, 2022,2023, the Company has used $272,888 in operating activities caused by net loss from operating, increase in inventories, accounts receivable, accounts payable, decrease in prepayment, accrued liabilities and lease liability contra by depreciation and write off of other receivables.
For the six months ended September 30, 2021, the Company has used $286,703$48,309 in operating activities primarily caused by net loss from operating increase in inventories, prepayment,and decrease in account payable, accrued liabilities and other payables contra by depreciation expenses and decrease in prepaid expenses and deposit.
For the three months ended June 30, 2022, the Company has used $146,897 in operating activities primarily caused by net loss from operating, decrease in accrued liability and lease liability contra by depreciation expenses add back.
Cash Used inIn Investing Activities
The Company has invested $11,396$0 in investing activity for the three months ended June 30, 2023.
The Company has invested $10,209 in investing activity for the acquisition of new kitchen equipment and office equipment for the sixthree months ended SeptemberJune 30, 2022.
The Company has invested $33,238 in investing activity for the acquisition of new kitchen equipment, office equipment, renovation and application of trademark for the six months ended September 30, 2021.
Cash Provided by Financing Activities
For the sixthree months ended SeptemberJune 30, 2022,2023, the Company repaid $4,134 to bank loan and received $224,091$15,050 from financing cash flow primarily consist of advances from director and repaid $7,846 to bank loan.director.
For the sixthree months ended SeptemberJune 30, 2021,2022, the Company repaid $3,938 to bank loan and received $5,984$126,075 from financing cash flow primarily consist of advances from director and repaid $7,590 to bank loan.director.
Off-balance Sheet Arrangements
We have no significant off-balance sheet arrangements that have or are reasonably likely to have a current or future effect on our financial condition, changes in our financial condition, revenues or expenses, results of operations, liquidity, capital expenditures or capital resources that are material to our stockholders as of SeptemberJune 30, 2023 and June 30, 2022.
Contractual Obligations
As of SeptemberJune 30, 2022,2023, the Company has no contractual obligations involved.
| 5 |
ITEM 3 QUANTITATIVE AND QUALITATIVE DISCLOSURES ABOUT MARKET RISK
As a “smaller reporting company” as defined by Item 10 of Regulation S-K, the Company is not required to provide information required by this Item.
ITEM 4 CONTROLS AND PROCEDURES
Evaluation of Disclosure Controls and Procedures:
We carried out an evaluation of the effectiveness of the design and operation of our disclosure controls and procedures (as defined in Exchange Act Rules 13a-15(e) and 15d-15(e)) as of SeptemberJune 30, 2022.2023. This evaluation was carried out under the supervision and with the participation of our Chief Executive Officer and our Chief Financial Officer. Based upon that evaluation, our Chief Executive Officer and Chief Financial Officer concluded that, as of SeptemberJune 30, 2022,2023, our disclosure controls and procedures were not effective due to the presence of material weaknesses in internal control over financial reporting.
A material weakness is a deficiency, or a combination of deficiencies, in internal control over financial reporting, such that there is a reasonable possibility that a material misstatement of the company’s annual or interim financial statements will not be prevented or detected on a timely basis. Management has identified the following material weaknesses which have caused management to conclude that, as of SeptemberJune 30, 2022,2023, our disclosure controls and procedures were not effective: (1) lack of a functioning audit committee due to a lack of a majority of independent members and a lack of a majority of outside directors on our board of directors, resulting in ineffective oversight in the establishment and monitoring of required internal controls and procedures; (2) inadequate segregation of duties and effective risk assessment; (3) insufficient written policies and procedures for accounting and financial reporting with respect to the requirements and application of both US GAAP and SEC guidelines; and (4) lack of internal audit function due to the fact that the Company lacks qualified resources to perform the internal audit functions properly and that the scope and effectiveness of the internal audit function are yet to be developed.
Changes in Internal Control Over Financial Reporting:
There were no changes in our internal control over financial reporting during the quarter ended SeptemberJune 30, 2022,2023, that have materially affected, or are reasonably likely to materially affect, our internal control over financial reporting.
| 6 |
PART II — OTHER INFORMATION
Item 1. Legal Proceedings
From time to time, we may become party to litigation or other legal proceedings that we consider to be a part of the ordinary course of our business. We are not currently involved in legal proceedings that could reasonably be expected to have a material adverse effect on our business, prospects, financial condition or results of operations. We may become involved in material legal proceedings in the future.
Item 1A. Risk Factors
As a “smaller reporting company” as defined by Item 10 of Regulation S-K, the Company is not required to provide information required by this Item.
Item 2. Unregistered Sales of Equity Securities and Use of Proceeds
(a) None.
(b) None.
(c) None.
Item 3. Defaults Upon Senior Securities
(a) None.
(b) None.
Item 4. Mine Safety Disclosures
Not applicable.
Item 5. Other Information.
None.
Item 6. Exhibits
| 31.1 | Rule 13(a)-14(a) / 15(d)-14(a) Certification of principal executive officer and principal financial officer | |
| 32.1 | Section 1350 Certification of principal executive officer and principal financial officer | |
| Inline XBRL Instance Document | ||
| 101.SCH | Inline XBRL Taxonomy Extension Schema Document | |
| 101.CAL | Inline XBRL Taxonomy Extension Calculation Linkbase Document | |
| 101.DEF | Inline XBRL Taxonomy Extension Definition Linkbase Document | |
| 101.LAB | Inline XBRL Taxonomy Extension Label Linkbase Document | |
| 101.PRE | Inline XBRL Taxonomy Extension Presentation Linkbase Document | |
| 104 | Cover Page Interactive Data File (formatted as inline XBRL and contained in Exhibit 101) |
| 7 |
SIGNATURES
Pursuant to the requirements of the Securities Exchange Act of 1934, the registrant has duly caused this report to be signed on its behalf by the undersigned, thereunto duly authorized.
| SYNERGY EMPIRE LIMITED | |||
| (Name of Registrant) | |||
| Date: | August 14, 2023 | ||
| By: | /s/ Law Jia Ming | ||
| Name: | Law Jia Ming | ||
| Title: | Chief Executive Officer, Chief Financial Officer | ||
| 8 |