UNITED STATES
SECURITIES AND EXCHANGE COMMISSION
Washington, D.C. 20549
FORM 10-Q
| | | | | |
| ☒ | QUARTERLY REPORT PURSUANT TO SECTION 13 OR 15(d) OF THE SECURITIES EXCHANGE ACT OF 1934 |
For the quarterly period ended September 30, 20222023
or
| | | | | |
| ☐ | TRANSITION REPORT PURSUANT TO SECTION 13 OR 15(d) OF THE SECURITIES EXCHANGE ACT OF 1934 |
Commission File Number: 000-55190
NORTHSTAR HEALTHCARE INCOME, INC.
(Exact Name of Registrant as Specified in its Charter)
| | | | | |
| Maryland | 27-3663988 |
| (State or Other Jurisdiction of | (IRS Employer |
| Incorporation or Organization) | Identification No.) |
16 East 34th Street, 18th Floor, New York, NY 10016
(Address of Principal Executive Offices, Including Zip Code)
(929) 777-3135
(Registrant’s Telephone Number, Including Area Code)
Securities registered pursuant to Section 12(b) of the Act:
| | | | | | | | | | | | | | |
| Title of each class | | Trading Symbol(s) | | Name of each exchange on which registered |
| Common stock, par value $0.01 per share | None | None |
Indicate by check mark whether the registrant (1) has filed all reports required to be filed by Section 13 or 15(d) of the Securities Exchange Act of 1934 during the preceding 12 months (or for such shorter period that the registrant was required to file such reports), and (2) has been subject to such filing requirements for the past 90 days. Yes ý No o
Indicate by check mark whether the registrant has submitted electronically every Interactive Data File required to be submitted pursuant to Rule 405 of Regulation S-T (§232.405 of this chapter) during the preceding 12 months (or for such shorter period that the registrant was required to submit such files). Yes ý No o
Indicate by check mark whether the registrant is a large accelerated filer, an accelerated filer, a non-accelerated filer, a smaller reporting company, or an emerging growth company. See the definitions of “large accelerated filer,” “accelerated filer,” “smaller reporting company,” and “emerging growth company” in Rule 12b-2 of the Exchange Act.
| | | | | | | | | | | | | | | | | | | | | | | |
| Large accelerated filer | ¨ | Accelerated filer | ¨ | Non-accelerated filer | ý | Smaller reporting company | ☐ |
| | | | | | Emerging growth company | ☐ |
If an emerging growth company, indicate by check mark if the registrant has elected not to use the extended transition period for complying with any new or revised financial accounting standards provided pursuant to Section 13(a) of the Exchange Act. o
Indicate by check mark whether the registrant is a shell company (as defined in Rule 12b-2 of the Exchange Act). Yes ☐ No ý
Indicate the number of shares outstanding of each of the registrant’s classes of common stock, as of the latest practicable date:
The Company has one class of common stock, $0.01 par value per share, 195,287,174185,712,103 shares outstanding as of November 9, 2022.13, 2023.
NORTHSTAR HEALTHCARE INCOME, INC.
FORM 10-Q
TABLE OF CONTENTS
| | | | | | | | |
| Index | | Page |
| | |
| | |
| | |
| | |
| | |
| | |
| | |
| | |
| | |
| | |
| | |
| Control and Procedures | | |
| | |
| | |
| | |
| | |
| | |
| | |
| | |
| | |
| | |
FORWARD-LOOKING STATEMENTS
This Quarterly Report on Form 10-Q contains certain “forward-looking statements” within the meaning of the Private Securities Litigation Reform Act of 1995, Section 27A of the Securities Act of 1933, as amended, or Securities Act, and Section 21E of the Securities Exchange Act of 1934, as amended, or Exchange Act. Forward-looking statements are generally identifiable by use of forward-looking terminology such as “may,” “will,” “should,” “potential,” “intend,” “expect,” “seek,” “anticipate,” “estimate,” “believe,” “could,” “project,” “predict,” “continue,” “future” or other similar words or expressions. Forward-looking statements are not guarantees of performance and are based on certain assumptions, discuss future expectations, describe plans and strategies, contain projections of results of operations or of financial condition or state other forward-looking information. Such statements include, but are not limited to, those relating to our ability to make distributions to our stockholders, successfully manage the transition to self-management andstockholders; our ability to retain our senior executives;executives and other sufficient personnel to manage our business; our ability to realize substantial efficiencies as well as anticipated strategic and financial benefits of the internalization of our management function as operating costs and business disruption may be greater than expected; the operating performance of our investments, our financing needs, the effects of our current strategies and investment activities and our ability to effectively deploy capital. Our ability to predict results or the actual effect of plans or strategies is inherently uncertain. Although we believe that the expectations reflected in such forward-looking statements are based on reasonable assumptions, our actual results and performance could differ materially from those set forth in the forward-looking statements and you should not unduly rely on these statements. These forward-looking statements involve risks, uncertainties and other factors that may cause our actual results in future periods to differ materially from those forward-looking statements.
All forward-looking statements included in this Quarterly Report on Form 10-Q are based on information available to us on the date hereof and we are under no duty to update any of the forward-looking statements after the date of this report to conform these statements to actual results.
Factors that could have a material adverse effect on our operations and future prospects are set forth in our filings with the U.S. Securities and Exchange Commission, or the SEC, including Part I, Item 1A of our Annual Report on Form 10-K for the fiscal year ended December 31, 20212022 and in Part II, Item 1A of this Quarterly Report on Form 10-Q under the heading “Risk Factors.” The risk factors set forth in our filings with the SEC could cause our actual results to differ significantly from those contained in any forward-looking statement contained in this report.
PART I—Financial Information
Item 1. Financial Statements
NORTHSTAR HEALTHCARE INCOME, INC. AND SUBSIDIARIES
CONSOLIDATED BALANCE SHEETS
(Dollars in Thousands, Except Per Share Data)
| | | September 30, 2022 (Unaudited) | | December 31, 2021 | | September 30, 2023 (Unaudited) | | December 31, 2022 |
| Assets | Assets | | | | Assets | | | |
| Cash and cash equivalents | Cash and cash equivalents | $ | 95,145 | | | $ | 200,473 | | Cash and cash equivalents | $ | 87,581 | | | $ | 103,926 | |
| Restricted cash | Restricted cash | 12,537 | | | 10,465 | | Restricted cash | 11,386 | | | 11,734 | |
| Operating real estate, net | Operating real estate, net | 932,730 | | | 972,599 | | Operating real estate, net | 894,245 | | | 933,002 | |
| Investments in unconsolidated ventures | 205,207 | | | 212,309 | | |
| Investments in unconsolidated ventures ($3,075 held at fair value as of September 30, 2023) | | Investments in unconsolidated ventures ($3,075 held at fair value as of September 30, 2023) | 128,026 | | | 176,502 | |
| | Receivables, net | Receivables, net | 3,454 | | | 3,666 | | Receivables, net | 2,253 | | | 2,815 | |
| Intangible assets, net | Intangible assets, net | 2,337 | | | 2,590 | | Intangible assets, net | 2,000 | | | 2,253 | |
| Other assets | Other assets | 7,829 | | | 10,771 | | Other assets | 10,425 | | | 7,603 | |
Total assets(1) | Total assets(1) | $ | 1,259,239 | | | $ | 1,412,873 | | Total assets(1) | $ | 1,135,916 | | | $ | 1,237,835 | |
| | Liabilities | Liabilities | | Liabilities | |
| Mortgage and other notes payable, net | $ | 915,964 | | | $ | 929,811 | | |
| Mortgage notes payable, net | | Mortgage notes payable, net | $ | 901,610 | | | $ | 912,248 | |
| | Due to related party | Due to related party | 3,347 | | | 7,338 | | Due to related party | 292 | | | 469 | |
| Escrow deposits payable | Escrow deposits payable | 1,427 | | | 1,171 | | Escrow deposits payable | 1,023 | | | 993 | |
| Accounts payable and accrued expenses | Accounts payable and accrued expenses | 19,052 | | | 24,671 | | Accounts payable and accrued expenses | 23,967 | | | 21,034 | |
| Other liabilities | Other liabilities | 2,392 | | | 3,064 | | Other liabilities | 1,592 | | | 2,019 | |
Total liabilities(1) | Total liabilities(1) | 942,182 | | | 966,055 | | Total liabilities(1) | 928,484 | | | 936,763 | |
| Commitments and contingencies (Note 12) | Commitments and contingencies (Note 12) | | | | Commitments and contingencies (Note 12) | | | |
| Equity | Equity | | Equity | |
| NorthStar Healthcare Income, Inc. Stockholders’ Equity | NorthStar Healthcare Income, Inc. Stockholders’ Equity | | NorthStar Healthcare Income, Inc. Stockholders’ Equity | |
| Preferred stock, $0.01 par value, 50,000,000 shares authorized, no shares issued and outstanding as of September 30, 2022 and December 31, 2021 | — | | | — | | |
| Common stock, $0.01 par value, 400,000,000 shares authorized, 195,078,539 and 193,120,940 shares issued and outstanding as of September 30, 2022 and December 31, 2021, respectively | 1,951 | | | 1,930 | | |
| Preferred stock, $0.01 par value, 50,000,000 shares authorized, no shares issued and outstanding as of September 30, 2023 and December 31, 2022 | | Preferred stock, $0.01 par value, 50,000,000 shares authorized, no shares issued and outstanding as of September 30, 2023 and December 31, 2022 | — | | | — | |
| Common stock, $0.01 par value, 400,000,000 shares authorized, 185,712,103 and 195,421,656 shares issued and outstanding as of September 30, 2023 and December 31, 2022, respectively | | Common stock, $0.01 par value, 400,000,000 shares authorized, 185,712,103 and 195,421,656 shares issued and outstanding as of September 30, 2023 and December 31, 2022, respectively | 1,857 | | | 1,954 | |
| Additional paid-in capital | Additional paid-in capital | 1,728,383 | | | 1,720,719 | | Additional paid-in capital | 1,716,701 | | | 1,729,589 | |
| Retained earnings (accumulated deficit) | Retained earnings (accumulated deficit) | (1,410,309) | | | (1,277,688) | | Retained earnings (accumulated deficit) | (1,511,765) | | | (1,428,840) | |
| Accumulated other comprehensive income (loss) | Accumulated other comprehensive income (loss) | (5,088) | | | (486) | | Accumulated other comprehensive income (loss) | — | | | (3,679) | |
| Total NorthStar Healthcare Income, Inc. stockholders’ equity | Total NorthStar Healthcare Income, Inc. stockholders’ equity | 314,937 | | | 444,475 | | Total NorthStar Healthcare Income, Inc. stockholders’ equity | 206,793 | | | 299,024 | |
| Non-controlling interests | Non-controlling interests | 2,120 | | | 2,343 | | Non-controlling interests | 639 | | | 2,048 | |
| Total equity | Total equity | 317,057 | | | 446,818 | | Total equity | 207,432 | | | 301,072 | |
| Total liabilities and equity | Total liabilities and equity | $ | 1,259,239 | | | $ | 1,412,873 | | Total liabilities and equity | $ | 1,135,916 | | | $ | 1,237,835 | |
(1)Represents the consolidated assets and liabilities of NorthStar Healthcare Income Operating Partnership, LP (the “Operating Partnership”). The Operating Partnership is a consolidated variable interest entity (“VIE”), of which NorthStar Healthcare Income, Inc. (together with its consolidated subsidiaries, the “Company”) is the sole general partner and owns approximately 99.99%. As of September 30, 2022, the Operating Partnership includes $224.2Includes $174.4 million and $178.8$180.2 million of assets and liabilities, respectively, of certain VIEs that are consolidated by the Operating Partnership. Refer to Note 2, “Summary of Significant Accounting Policies.”
Refer to accompanying notes to consolidated financial statements (unaudited).
NORTHSTAR HEALTHCARE INCOME, INC. AND SUBSIDIARIES
CONSOLIDATED STATEMENTS OF OPERATIONS
(Dollars in Thousands, Except Per Share Data)
(Unaudited)
| | | Three Months Ended September 30, | | Nine Months Ended September 30, | | Three Months Ended September 30, | | Nine Months Ended September 30, |
| | 2022 | | 2021 | | 2022 | | 2021 | | 2023 | | 2022 | | 2023 | | 2022 |
| Property and other revenues | Property and other revenues | | | | | | | | | Property and other revenues | | | | | | | |
| Resident fee income | Resident fee income | | $ | 11,274 | | | $ | 27,370 | | | $ | 32,987 | | | $ | 83,906 | | Resident fee income | $ | 11,966 | | | $ | 11,274 | | | $ | 35,655 | | | $ | 32,987 | |
| Rental income | Rental income | | 36,165 | | | 37,006 | | | 103,001 | | | 101,669 | | Rental income | 40,330 | | | 36,165 | | | 115,897 | | | 103,001 | |
| Other revenue | Other revenue | | 300 | | | 38 | | | 457 | | | 80 | | Other revenue | 1,078 | | | 300 | | | 2,893 | | | 457 | |
| Total property and other revenues | Total property and other revenues | | 47,739 | | | 64,414 | | | 136,445 | | | 185,655 | | Total property and other revenues | 53,374 | | | 47,739 | | | 154,445 | | | 136,445 | |
| Interest income | | |
| Interest income on debt investments | | — | | | 1,067 | | | — | | | 4,667 | | |
| | Expenses | Expenses | | Expenses | |
| Property operating expenses | Property operating expenses | | 35,134 | | | 45,784 | | | 101,258 | | | 136,503 | | Property operating expenses | 36,890 | | | 35,134 | | | 106,993 | | | 101,258 | |
| Interest expense | Interest expense | | 11,014 | | | 15,780 | | | 31,877 | | | 47,767 | | Interest expense | 14,250 | | | 11,014 | | | 37,143 | | | 31,877 | |
| Transaction costs | Transaction costs | | 857 | | | — | | | 857 | | | 54 | | Transaction costs | 358 | | | 857 | | | 455 | | | 857 | |
| Asset management fees - related party | Asset management fees - related party | | 2,428 | | | 2,769 | | | 7,532 | | | 8,307 | | Asset management fees - related party | — | | | 2,428 | | | — | | | 7,532 | |
| General and administrative expenses | General and administrative expenses | | 2,859 | | | 2,432 | | | 10,300 | | | 8,544 | | General and administrative expenses | 2,921 | | | 2,859 | | | 10,424 | | | 10,300 | |
| Depreciation and amortization | Depreciation and amortization | | 9,642 | | | 13,828 | | | 29,105 | | | 44,772 | | Depreciation and amortization | 9,848 | | | 9,642 | | | 29,305 | | | 29,105 | |
| Impairment loss | Impairment loss | | 18,500 | | | 4,600 | | | 31,502 | | | 5,386 | | Impairment loss | — | | | 18,500 | | | 43,422 | | | 31,502 | |
| Total expenses | Total expenses | | 80,434 | | | 85,193 | | | 212,431 | | | 251,333 | | Total expenses | 64,267 | | | 80,434 | | | 227,742 | | | 212,431 | |
| Other income (loss) | Other income (loss) | | Other income (loss) | |
| Other income, net | Other income, net | | — | | | — | | | 77 | | | 6,892 | | Other income, net | — | | | — | | | 202 | | | 77 | |
| Realized gain (loss) on investments and other | | 325 | | | 75 | | | 660 | | | 7,479 | | |
| Gain (loss) on investments and other | | Gain (loss) on investments and other | (347) | | | 325 | | | (4,662) | | | 660 | |
| Income (loss) before equity in earnings (losses) of unconsolidated ventures and income tax expense | Income (loss) before equity in earnings (losses) of unconsolidated ventures and income tax expense | | (32,370) | | | (19,637) | | | (75,249) | | | (46,640) | | Income (loss) before equity in earnings (losses) of unconsolidated ventures and income tax expense | (11,240) | | | (32,370) | | | (77,757) | | | (75,249) | |
| Equity in earnings (losses) of unconsolidated ventures | Equity in earnings (losses) of unconsolidated ventures | | 2,872 | | | 7,943 | | | 39,427 | | | 17,819 | | Equity in earnings (losses) of unconsolidated ventures | (127) | | | 2,872 | | | (6,595) | | | 39,427 | |
| Income tax expense | Income tax expense | | (15) | | | (59) | | | (45) | | | (85) | | Income tax expense | (17) | | | (15) | | | (43) | | | (45) | |
| Net income (loss) | Net income (loss) | | (29,513) | | | (11,753) | | | (35,867) | | | (28,906) | | Net income (loss) | (11,384) | | | (29,513) | | | (84,395) | | | (35,867) | |
| Net (income) loss attributable to non-controlling interests | Net (income) loss attributable to non-controlling interests | | 73 | | | 100 | | | 298 | | | (73) | | Net (income) loss attributable to non-controlling interests | 166 | | | 73 | | | 1,470 | | | 298 | |
| Net income (loss) attributable to NorthStar Healthcare Income, Inc. common stockholders | Net income (loss) attributable to NorthStar Healthcare Income, Inc. common stockholders | | $ | (29,440) | | | $ | (11,653) | | | $ | (35,569) | | | $ | (28,979) | | Net income (loss) attributable to NorthStar Healthcare Income, Inc. common stockholders | $ | (11,218) | | | $ | (29,440) | | | $ | (82,925) | | | $ | (35,569) | |
Net income (loss) per share of common stock, basic/diluted(1) | Net income (loss) per share of common stock, basic/diluted(1) | | $ | (0.15) | | | $ | (0.06) | | | $ | (0.18) | | | $ | (0.15) | | Net income (loss) per share of common stock, basic/diluted(1) | $ | (0.06) | | | $ | (0.15) | | | $ | (0.43) | | | $ | (0.18) | |
Weighted average number of shares of common stock outstanding, basic/diluted(1) | Weighted average number of shares of common stock outstanding, basic/diluted(1) | | 194,670,948 | | | 191,937,161 | | | 194,032,819 | | | 191,285,186 | | Weighted average number of shares of common stock outstanding, basic/diluted(1) | 185,712,103 | | | 194,670,948 | | | 191,367,117 | | | 194,032,819 | |
| Distributions declared per share of common stock | Distributions declared per share of common stock | | $ | — | | | $ | — | | | $ | 0.50 | | | $ | — | | Distributions declared per share of common stock | $ | — | | | $ | — | | | $ | — | | | $ | 0.50 | |
(1) The Company issued 49,872203,742 and 66,840116,712 restricted stock units during the nine months endedas of September 30, 2023 and September 30, 2022, and 2021, respectively. The impact of the restricted stock units onhave been excluded from the diluted earnings per share calculation as their impact is de minimis foranti-dilutive due to the net loss generated during the three and nine months ended September 30, 20222023 and 2021.
Refer to accompanying notes to consolidated financial statements (unaudited).
NORTHSTAR HEALTHCARE INCOME, INC. AND SUBSIDIARIES
CONSOLIDATED STATEMENTS OF COMPREHENSIVE INCOME (LOSS)
(Dollars in Thousands)
(Unaudited)
| | | Three Months Ended September 30, | | Nine Months Ended September 30, | | Three Months Ended September 30, | | Nine Months Ended September 30, |
| | 2022 | | 2021 | | 2022 | | 2021 | | 2023 | | 2022 | | 2023 | | 2022 |
| Net income (loss) | Net income (loss) | | $ | (29,513) | | | $ | (11,753) | | | $ | (35,867) | | | $ | (28,906) | | Net income (loss) | | $ | (11,384) | | | $ | (29,513) | | | $ | (84,395) | | | $ | (35,867) | |
| Other comprehensive income (loss) | Other comprehensive income (loss) | | Other comprehensive income (loss) | |
| Foreign currency translation adjustments related to investment in unconsolidated venture | Foreign currency translation adjustments related to investment in unconsolidated venture | | (1,664) | | | (671) | | | (4,602) | | | (1,253) | | Foreign currency translation adjustments related to investment in unconsolidated venture | | — | | | (1,664) | | | 3,679 | | | (4,602) | |
| Total other comprehensive income (loss) | Total other comprehensive income (loss) | | (1,664) | | | (671) | | | (4,602) | | | (1,253) | | Total other comprehensive income (loss) | | — | | | (1,664) | | | 3,679 | | | (4,602) | |
| Comprehensive income (loss) | Comprehensive income (loss) | | (31,177) | | | (12,424) | | | (40,469) | | | (30,159) | | Comprehensive income (loss) | | (11,384) | | | (31,177) | | | (80,716) | | | (40,469) | |
| Comprehensive (income) loss attributable to non-controlling interests | Comprehensive (income) loss attributable to non-controlling interests | | 73 | | | 100 | | | 298 | | | (73) | | Comprehensive (income) loss attributable to non-controlling interests | | 166 | | | 73 | | | 1,470 | | | 298 | |
| Comprehensive income (loss) attributable to NorthStar Healthcare Income, Inc. common stockholders | Comprehensive income (loss) attributable to NorthStar Healthcare Income, Inc. common stockholders | | $ | (31,104) | | | $ | (12,324) | | | $ | (40,171) | | | $ | (30,232) | | Comprehensive income (loss) attributable to NorthStar Healthcare Income, Inc. common stockholders | | $ | (11,218) | | | $ | (31,104) | | | $ | (79,246) | | | $ | (40,171) | |
Refer to accompanying notes to consolidated financial statements (unaudited).
NORTHSTAR HEALTHCARE INCOME, INC. AND SUBSIDIARIES
CONSOLIDATED STATEMENTS OF EQUITY
(Dollars and Shares in Thousands)
| | | Common Stock | | Additional Paid-in Capital | | Retained Earnings (Accumulated Deficit) | | Accumulated Other Comprehensive Income (Loss) | | Total Company’s Stockholders’ Equity | | Non-controlling Interests | | Total Equity | | Common Stock | | Additional Paid-in Capital | | Retained Earnings (Accumulated Deficit) | | Accumulated Other Comprehensive Income (Loss) | | Total Company’s Stockholders’ Equity | | Non-controlling Interests | | Total Equity |
| | Shares | | Amount | | | Shares | | Amount | |
| Balance as of December 31, 2020 | 190,409 | | | $ | 1,904 | | | $ | 1,710,023 | | | $ | (1,302,755) | | | $ | 467 | | | $ | 409,639 | | | $ | 2,423 | | | $ | 412,062 | | |
| Balance as of December 31, 2021 | | Balance as of December 31, 2021 | 193,121 | | | $ | 1,930 | | | $ | 1,720,719 | | | $ | (1,277,688) | | | $ | (486) | | | $ | 444,475 | | | $ | 2,343 | | | $ | 446,818 | |
| Share-based payment of advisor asset management fees | Share-based payment of advisor asset management fees | 643 | | | 6 | | | 2,494 | | | — | | | — | | | 2,500 | | | — | | | 2,500 | | Share-based payment of advisor asset management fees | 698 | | | 7 | | | 2,722 | | | — | | | — | | | 2,729 | | | — | | | 2,729 | |
| Amortization of equity-based compensation | Amortization of equity-based compensation | — | | | — | | | 46 | | | — | | | — | | | 46 | | | — | | | 46 | | Amortization of equity-based compensation | — | | | — | | | 15 | | | — | | | — | | | 15 | | | — | | | 15 | |
| Non-controlling interests - contributions | Non-controlling interests - contributions | — | | | — | | | — | | | — | | | — | | | — | | | 240 | | | 240 | | Non-controlling interests - contributions | — | | | — | | | — | | | — | | | — | | | — | | | 64 | | | 64 | |
| Non-controlling interests - distributions | Non-controlling interests - distributions | — | | | — | | | — | | | — | | | — | | | — | | | (350) | | | (350) | | Non-controlling interests - distributions | — | | | — | | | — | | | — | | | — | | | — | | | (53) | | | (53) | |
| Other comprehensive income (loss) | Other comprehensive income (loss) | — | | | — | | | — | | | — | | | (474) | | | (474) | | | — | | | (474) | | Other comprehensive income (loss) | — | | | — | | | — | | | — | | | (568) | | | (568) | | | — | | | (568) | |
| Net income (loss) | Net income (loss) | — | | | — | | | — | | | (10,463) | | | — | | | (10,463) | | | 308 | | | (10,155) | | Net income (loss) | — | | | — | | | — | | | (12,936) | | | — | | | (12,936) | | | (45) | | | (12,981) | |
| Balance as of March 31, 2021 (Unaudited) | 191,052 | | | $ | 1,910 | | | $ | 1,712,563 | | | $ | (1,313,218) | | | $ | (7) | | | $ | 401,248 | | | $ | 2,621 | | | $ | 403,869 | | |
| Balance as of March 31, 2022 (Unaudited) | | Balance as of March 31, 2022 (Unaudited) | 193,819 | | | $ | 1,937 | | | $ | 1,723,456 | | | $ | (1,290,624) | | | $ | (1,054) | | | $ | 433,715 | | | $ | 2,309 | | | $ | 436,024 | |
| Share-based payment of advisor asset management fees | Share-based payment of advisor asset management fees | 643 | | | 6 | | | 2,494 | | | — | | | — | | | 2,500 | | | — | | | 2,500 | | Share-based payment of advisor asset management fees | 637 | | | 8 | | | 2,507 | | | — | | | — | | | 2,515 | | | — | | | 2,515 | |
| Amortization of equity-based compensation | Amortization of equity-based compensation | — | | | — | | | 73 | | | — | | | — | | | 73 | | | — | | | 73 | | Amortization of equity-based compensation | — | | | — | | | 13 | | | — | | | — | | | 13 | | | — | | | 13 | |
| Non-controlling interests - contributions | Non-controlling interests - contributions | — | | | — | | | — | | | — | | | — | | | — | | | 146 | | | 146 | | Non-controlling interests - contributions | — | | | — | | | — | | | — | | | — | | | — | | | 113 | | | 113 | |
| Non-controlling interests - distributions | Non-controlling interests - distributions | — | | | — | | | — | | | — | | | — | | | — | | | (33) | | | (33) | | Non-controlling interests - distributions | — | | | — | | | — | | | — | | | — | | | — | | | (61) | | | (61) | |
| Distributions declared | | Distributions declared | — | | | — | | | — | | | (97,052) | | | — | | | (97,052) | | | — | | | (97,052) | |
| Other comprehensive income (loss) | Other comprehensive income (loss) | — | | | — | | | — | | | — | | | (108) | | | (108) | | | — | | | (108) | | Other comprehensive income (loss) | — | | | — | | | — | | | — | | | (2,370) | | | (2,370) | | | — | | | (2,370) | |
| Net income (loss) | Net income (loss) | — | | | — | | | — | | | (6,863) | | | — | | | (6,863) | | | (135) | | | (6,998) | | Net income (loss) | — | | | — | | | — | | | 6,807 | | | — | | | 6,807 | | | (180) | | | 6,627 | |
| Balance as of June 30, 2021 (Unaudited) | 191,695 | | | $ | 1,916 | | | $ | 1,715,130 | | | $ | (1,320,081) | | | $ | (115) | | | $ | 396,850 | | | $ | 2,599 | | | $ | 399,449 | | |
| Balance as of June 30, 2022 (Unaudited) | | Balance as of June 30, 2022 (Unaudited) | 194,456 | | | $ | 1,945 | | | $ | 1,725,976 | | | $ | (1,380,869) | | | $ | (3,424) | | | $ | 343,628 | | | $ | 2,181 | | | $ | 345,809 | |
| Share-based payment of advisor asset management fees | Share-based payment of advisor asset management fees | 712 | | | 7 | | | 2,762 | | | — | | | — | | | 2,769 | | | — | | | 2,769 | | Share-based payment of advisor asset management fees | 623 | | | 6 | | | 2,407 | | | — | | | — | | | 2,413 | | | — | | | 2,413 | |
| Amortization of equity-based compensation | — | | | — | | | 23 | | | — | | | — | | | 23 | | | — | | | 23 | | |
| | Non-controlling interests - contributions | Non-controlling interests - contributions | — | | | — | | | — | | | — | | | — | | | — | | | 259 | | | 259 | | Non-controlling interests - contributions | — | | | — | | | — | | | — | | | — | | | — | | | 86 | | | 86 | |
| Non-controlling interests - distributions | Non-controlling interests - distributions | — | | | — | | | — | | | — | | | — | | | — | | | (45) | | | (45) | | Non-controlling interests - distributions | — | | | — | | | — | | | — | | | — | | | — | | | (74) | | | (74) | |
| | Other comprehensive income (loss) | Other comprehensive income (loss) | — | | | — | | | — | | | — | | | (671) | | | (671) | | | — | | | (671) | | Other comprehensive income (loss) | — | | | — | | | — | | | — | | | (1,664) | | | (1,664) | | | — | | | (1,664) | |
| Net income (loss) | Net income (loss) | — | | | — | | | — | | | (11,653) | | | — | | | (11,653) | | | (100) | | | (11,753) | | Net income (loss) | — | | | — | | | — | | | (29,440) | | | — | | | (29,440) | | | (73) | | | (29,513) | |
| Balance as of September 30, 2021 (Unaudited) | 192,407 | | | $ | 1,923 | | | $ | 1,717,915 | | | $ | (1,331,734) | | | $ | (786) | | | $ | 387,318 | | | $ | 2,713 | | | $ | 390,031 | | |
| Balance as of September 30, 2022 (Unaudited) | | Balance as of September 30, 2022 (Unaudited) | 195,079 | | | $ | 1,951 | | | $ | 1,728,383 | | | $ | (1,410,309) | | | $ | (5,088) | | | $ | 314,937 | | | $ | 2,120 | | | $ | 317,057 | |
Refer to accompanying notes to consolidated financial statements (unaudited).
NORTHSTAR HEALTHCARE INCOME, INC. AND SUBSIDIARIES
CONSOLIDATED STATEMENTS OF EQUITY
(Dollars and Shares in Thousands)
| | | Common Stock | | Additional Paid-in Capital | | Retained Earnings (Accumulated Deficit) | | Accumulated Other Comprehensive Income (Loss) | | Total Company’s Stockholders’ Equity | | Non-controlling Interests | | Total Equity | | Common Stock | | Additional Paid-in Capital | | Retained Earnings (Accumulated Deficit) | | Accumulated Other Comprehensive Income (Loss) | | Total Company’s Stockholders’ Equity | | Non-controlling Interests | | Total Equity |
| | Shares | | Amount | | | Shares | | Amount | |
| Balance as of December 31, 2021 | 193,121 | | | $ | 1,930 | | | $ | 1,720,719 | | | $ | (1,277,688) | | | $ | (486) | | | $ | 444,475 | | | $ | 2,343 | | | $ | 446,818 | | |
| Share-based payment of advisor asset management fees | 698 | | | 7 | | | 2,722 | | | — | | | — | | | 2,729 | | | — | | | 2,729 | | |
| Amortization of equity-based compensation | — | | | — | | | 15 | | | — | | | — | | | 15 | | | — | | | 15 | | |
| Non-controlling interests - contributions | — | | | — | | | — | | | — | | | — | | | — | | | 64 | | | 64 | | |
| Non-controlling interests - distributions | — | | | — | | | — | | | — | | | — | | | — | | | (53) | | | (53) | | |
| Other comprehensive income (loss) | — | | | — | | | — | | | — | | | (568) | | | (568) | | | — | | | (568) | | |
| Net income (loss) | — | | | — | | | — | | | (12,936) | | | — | | | (12,936) | | | (45) | | | (12,981) | | |
| Balance as of March 31, 2022 (Unaudited) | 193,819 | | | $ | 1,937 | | | $ | 1,723,456 | | | $ | (1,290,624) | | | $ | (1,054) | | | $ | 433,715 | | | $ | 2,309 | | | $ | 436,024 | | |
| Share-based payment of advisor asset management fees | 637 | | | 8 | | | 2,507 | | | — | | | — | | | 2,515 | | | — | | | 2,515 | | |
| Amortization of equity-based compensation | — | | | — | | | 13 | | | — | | | — | | | 13 | | | — | | | 13 | | |
| Non-controlling interests - contributions | — | | | — | | | — | | | — | | | — | | | — | | | 113 | | | 113 | | |
| Non-controlling interests - distributions | — | | | — | | | — | | | — | | | — | | | — | | | (61) | | | (61) | | |
| Balance as of December 31, 2022 | | Balance as of December 31, 2022 | 195,422 | | | $ | 1,954 | | | $ | 1,729,589 | | | $ | (1,428,840) | | | $ | (3,679) | | | $ | 299,024 | | | $ | 2,048 | | | $ | 301,072 | |
| | Distributions declared | — | | | — | | | — | | | (97,052) | | | — | | | (97,052) | | | — | | | (97,052) | | |
| | Other comprehensive income (loss) | — | | | — | | | — | | | — | | | (2,370) | | | (2,370) | | | — | | | (2,370) | | |
| Net income (loss) | — | | | — | | | — | | | 6,807 | | | — | | | 6,807 | | | (180) | | | 6,627 | | |
| Balance as of June 30, 2022 (Unaudited) | 194,456 | | | $ | 1,945 | | | $ | 1,725,976 | | | $ | (1,380,869) | | | $ | (3,424) | | | $ | 343,628 | | | $ | 2,181 | | | $ | 345,809 | | |
| Share-based payment of advisor asset management fees | 623 | | | 6 | | | 2,407 | | | — | | | — | | | 2,413 | | | — | | | 2,413 | | |
| | Non-controlling interests - contributions | Non-controlling interests - contributions | — | | | — | | | — | | | — | | | — | | | — | | | 86 | | | 86 | | Non-controlling interests - contributions | — | | | — | | | — | | | — | | | — | | | — | | | 45 | | | 45 | |
| Non-controlling interests - distributions | Non-controlling interests - distributions | — | | | — | | | — | | | — | | | — | | | — | | | (74) | | | (74) | | Non-controlling interests - distributions | — | | | — | | | — | | | — | | | — | | | — | | | (22) | | | (22) | |
| | Other comprehensive income (loss) | Other comprehensive income (loss) | — | | | — | | | — | | | — | | | (1,664) | | | (1,664) | | | — | | | (1,664) | | Other comprehensive income (loss) | — | | | — | | | — | | | — | | | 1,248 | | | 1,248 | | | — | | | 1,248 | |
| Net income (loss) | Net income (loss) | — | | | — | | | — | | | (29,440) | | | — | | | (29,440) | | | (73) | | | (29,513) | | Net income (loss) | — | | | — | | | — | | | (13,926) | | | — | | | (13,926) | | | (71) | | | (13,997) | |
| Balance as of September 30, 2022 (Unaudited) | 195,079 | | | $ | 1,951 | | | $ | 1,728,383 | | | $ | (1,410,309) | | | $ | (5,088) | | | $ | 314,937 | | | $ | 2,120 | | | $ | 317,057 | | |
| Balance as of March 31, 2023 (Unaudited) | | Balance as of March 31, 2023 (Unaudited) | 195,422 | | | $ | 1,954 | | | $ | 1,729,589 | | | $ | (1,442,766) | | | $ | (2,431) | | | $ | 286,346 | | | $ | 2,000 | | | $ | 288,346 | |
| Non-controlling interests - contributions | | Non-controlling interests - contributions | — | | | — | | | — | | | — | | | — | | | — | | | 55 | | | 55 | |
| Non-controlling interests - distributions | | Non-controlling interests - distributions | — | | | — | | | — | | | — | | | — | | | — | | | (33) | | | (33) | |
| Retirement of common stock (Note 8) | | Retirement of common stock (Note 8) | (9,710) | | | (97) | | | (13,302) | | | — | | | — | | | (13,399) | | | — | | | (13,399) | |
| Other comprehensive income (loss) | | Other comprehensive income (loss) | — | | | — | | | — | | | — | | | (844) | | | (844) | | | — | | | (844) | |
Reclassification of accumulated other comprehensive loss(1) | | Reclassification of accumulated other comprehensive loss(1) | — | | | — | | | — | | | — | | | 3,275 | | | 3,275 | | | — | | | 3,275 | |
| Net income (loss) | | Net income (loss) | — | | | — | | | — | | | (57,781) | | | — | | | (57,781) | | | (1,233) | | | (59,014) | |
| Balance as of June 30, 2023 (Unaudited) | | Balance as of June 30, 2023 (Unaudited) | 185,712 | | | $ | 1,857 | | | $ | 1,716,287 | | | $ | (1,500,547) | | | $ | — | | | $ | 217,597 | | | $ | 789 | | | $ | 218,386 | |
| Amortization of equity-based compensation | | Amortization of equity-based compensation | — | | | — | | | 414 | | | — | | | — | | | 414 | | | — | | | 414 | |
| Non-controlling interests - contributions | | Non-controlling interests - contributions | — | | | — | | | — | | | — | | | — | | | — | | | 44 | | | 44 | |
| Non-controlling interests - distributions | | Non-controlling interests - distributions | — | | | — | | | — | | | — | | | — | | | — | | | (28) | | | (28) | |
| | Net income (loss) | | Net income (loss) | — | | | — | | | — | | | (11,218) | | | — | | | (11,218) | | | (166) | | | (11,384) | |
| Balance as of September 30, 2023 (Unaudited) | | Balance as of September 30, 2023 (Unaudited) | 185,712 | | | $ | 1,857 | | | $ | 1,716,701 | | | $ | (1,511,765) | | | $ | — | | | $ | 206,793 | | | $ | 639 | | | $ | 207,432 | |
Refer to accompanying notes to consolidated financial statements (unaudited).
NORTHSTAR HEALTHCARE INCOME, INC. AND SUBSIDIARIES
CONSOLIDATED STATEMENTS OF CASH FLOWS
(Dollars in Thousands)
(Unaudited)
| | | | | | | | | | | |
| Nine Months Ended September 30, |
| 2022 | | 2021 |
| Cash flows from operating activities: | | | |
| Net income (loss) | $ | (35,867) | | | $ | (28,906) | |
| Adjustments to reconcile net income (loss) to net cash (used in) provided by operating activities: | | | |
| Equity in (earnings) losses of unconsolidated ventures | (39,427) | | | (17,819) | |
| Depreciation and amortization | 29,105 | | | 44,772 | |
| Impairment loss | 31,502 | | | 5,386 | |
| | | |
| Amortization of below market debt | 2,428 | | | 2,369 | |
| Straight-line rental (income) loss, net | — | | | 7,432 | |
| Amortization of discount/accretion of premium on investments | — | | | (697) | |
| Amortization of deferred financing costs | 475 | | | 1,354 | |
| Amortization of equity-based compensation | 150 | | | 142 | |
| Paid-in-kind interest on real estate debt investment | — | | | (194) | |
| Realized (gain) loss on investments and other | (660) | | | (7,479) | |
| Change in allowance for uncollectible accounts | 326 | | | 108 | |
| Issuance of common stock as payment for asset management fees | 7,532 | | | 7,769 | |
| Changes in assets and liabilities: | | | |
| Receivables | (114) | | | 1,191 | |
| Other assets | 3,583 | | | (7,560) | |
| Due to related party | (3,868) | | | (5,421) | |
| Escrow deposits payable | 256 | | | 1,758 | |
| Accounts payable and accrued expenses | (8,727) | | | (8,866) | |
| Other liabilities | (298) | | | 306 | |
| Net cash (used in) provided by operating activities | (13,604) | | | (4,355) | |
| Cash flows from investing activities: | | | |
| Capital expenditures for operating real estate | (17,924) | | | (17,344) | |
| Sales of operating real estate | — | | | 28,078 | |
| Repayment of real estate debt investment | — | | | 74,376 | |
| Investments in unconsolidated ventures | — | | | (400) | |
| Distributions from unconsolidated ventures | 42,173 | | | 6,971 | |
| Real estate debt investment modification fee | — | | | 686 | |
| | | |
| Net cash provided by (used in) investing activities | 24,249 | | | 92,367 | |
| Cash flows from financing activities: | | | |
| Borrowings from mortgage notes | — | | | 26,000 | |
| Repayments of mortgage notes | (16,514) | | | (61,121) | |
| | | |
| Repayment of borrowings from line of credit - related party | — | | | (35,000) | |
| Payment of deferred financing costs | (36) | | | (708) | |
| | | |
| Payments under finance leases | (408) | | | (446) | |
| | | |
| Distributions paid on common stock | (97,018) | | | — | |
| | | |
| Contributions from non-controlling interests | 263 | | | 645 | |
| Distributions to non-controlling interests | (188) | | | (428) | |
| Net cash (used in) provided by financing activities | (113,901) | | | (71,058) | |
| Net increase (decrease) in cash, cash equivalents and restricted cash | (103,256) | | | 16,954 | |
| Cash, cash equivalents and restricted cash-beginning of period | 210,938 | | | 93,570 | |
| Cash, cash equivalents and restricted cash-end of period | $ | 107,682 | | | $ | 110,524 | |
| | | | | | | | | | | |
| Nine Months Ended September 30, |
| 2023 | | 2022 |
| Cash flows from operating activities: | | | |
| Net income (loss) | $ | (84,395) | | | $ | (35,867) | |
| Adjustments to reconcile net income (loss) to net cash provided by (used in) operating activities: | | | |
| Equity in (earnings) losses of unconsolidated ventures | 6,595 | | | (39,427) | |
| Depreciation and amortization | 29,305 | | | 29,105 | |
| Impairment loss | 43,422 | | | 31,502 | |
| | | |
| Amortization of below market debt | 2,487 | | | 2,428 | |
| | | |
| | | |
| Amortization of deferred financing costs | 988 | | | 475 | |
| Amortization of equity-based compensation | 170 | | | 150 | |
| | | |
| (Gain) loss on investments and other | 4,662 | | | (660) | |
| Change in allowance for uncollectible accounts | 360 | | | 326 | |
| Issuance of common stock as payment for asset management fees | — | | | 7,532 | |
| Distributions from unconsolidated ventures | 10,640 | | | — | |
| Changes in assets and liabilities: | | | |
| Receivables | 203 | | | (114) | |
| Other assets | (3,786) | | | 3,583 | |
| Due to related party | (177) | | | (3,868) | |
| Escrow deposits payable | 30 | | | 256 | |
| Accounts payable and accrued expenses | 2,640 | | | (8,727) | |
| Other liabilities | (78) | | | (298) | |
| Net cash provided by (used in) operating activities | 13,066 | | | (13,604) | |
| Cash flows from investing activities: | | | |
| Capital expenditures for operating real estate | (28,425) | | | (17,924) | |
| Sales of real estate | 135 | | | — | |
| | | |
| | | |
| Distributions from unconsolidated ventures | 13,472 | | | 42,173 | |
| | | |
| Sales of other assets | 523 | | | — | |
| Net cash provided by (used in) investing activities | (14,295) | | | 24,249 | |
| Cash flows from financing activities: | | | |
| | | |
| Repayments of mortgage notes | (14,066) | | | (16,514) | |
| Payment of deferred financing costs | (48) | | | — | |
| | | |
| Payments under finance leases | (96) | | | (36) | |
| Acquisition and retirement of common stock | (1,315) | | | (408) | |
| Distributions paid on common stock | — | | | (97,018) | |
| | | |
| Contributions from non-controlling interests | 144 | | | 263 | |
| Distributions to non-controlling interests | (83) | | | (188) | |
| Net cash provided by (used in) financing activities | (15,464) | | | (113,901) | |
| Net increase (decrease) in cash, cash equivalents and restricted cash | (16,693) | | | (103,256) | |
| Cash, cash equivalents and restricted cash-beginning of period | 115,660 | | | 210,938 | |
| Cash, cash equivalents and restricted cash-end of period | $ | 98,967 | | | $ | 107,682 | |
Refer to accompanying notes to consolidated financial statements (unaudited).
NORTHSTAR HEALTHCARE INCOME, INC. AND SUBSIDIARIES
CONSOLIDATED STATEMENTS OF CASH FLOWS (Continued)
(Dollars in Thousands)
| | | Nine Months Ended September 30, | | Nine Months Ended September 30, |
| | 2022 | | 2021 | | 2023 | | 2022 |
| Supplemental disclosure of cash flow information: | Supplemental disclosure of cash flow information: | | | | Supplemental disclosure of cash flow information: | | | |
| Cash paid for interest | Cash paid for interest | $ | 28,625 | | | $ | 50,277 | | Cash paid for interest | $ | 29,666 | | | $ | 28,625 | |
| Cash paid for income taxes | Cash paid for income taxes | 41 | | | 45 | | Cash paid for income taxes | 61 | | | 41 | |
| Supplemental disclosure of non-cash investing and financing activities: | Supplemental disclosure of non-cash investing and financing activities: | | Supplemental disclosure of non-cash investing and financing activities: | |
| Accrued capital expenditures | Accrued capital expenditures | $ | 2,561 | | | $ | 1,391 | | Accrued capital expenditures | $ | 540 | | | $ | 2,561 | |
| Assets acquired under finance leases | — | | | 144 | | |
| Assets acquired under operating leases | — | | | 100 | | |
| Reclassification of assets held for sale | — | | | 488,241 | | |
| | Exchange of ownership interests in unconsolidated ventures for common stock | | Exchange of ownership interests in unconsolidated ventures for common stock | 13,399 | | | — | |
| Assets acquired under capital lease obligations | | Assets acquired under capital lease obligations | 25 | | | — | |
Refer to accompanying notes to consolidated financial statements (unaudited).
NORTHSTAR HEALTHCARE INCOME, INC. AND SUBSIDIARIES
NOTES TO CONSOLIDATED FINANCIAL STATEMENTS
(Unaudited)
1. Business and Organization
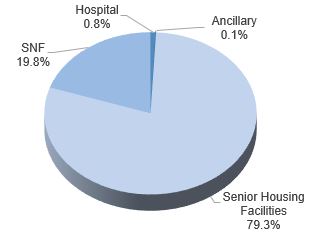
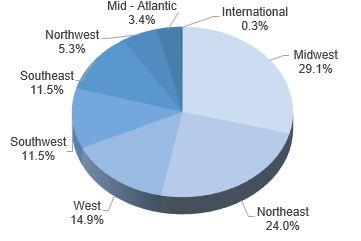
NorthStar Healthcare Income, Inc., together with its consolidated subsidiaries (the “Company”), managesowns a diversified portfolio of investments in healthcare real estate, owned directly or through joint ventures, with a focus on the seniors housing sector, which the Company defines as assisted living (“ALF”), memory care (“MCF”), skilled nursing (“SNF”),properties, including independent living facilities (“ILF”), assisted living (“ALF”) and continuingmemory care retirement communitiesfacilities (“CCRC”MCF”), which have ILF, ALF, SNF, and MCF available on one campus. The located throughout the United States. In addition, the Company is also investedhas investments through non-controlling interests in otherjoint ventures in a broader spectrum of healthcare property types,real estate, including medical office buildingsseniors housing properties, as well as skilled nursing (“MOB”SNF”), hospitals, rehabilitation facilities and ancillary healthcare services businesses. The Company’s investments are predominantly inbusinesses, located throughout the United States, but through a joint venture it also has international investments in the United Kingdom.States.
The Company was formed in October 2010 as a Maryland corporation and commenced operations in February 2013. The Company elected to be taxed as a real estate investment trust (“REIT”) under the Internal Revenue Code of 1986, as amended (the “Internal Revenue Code”), commencing with the taxable year ended December 31, 2013. The Company has conducted its operations, and intends to do so in the future, so as to continue to qualify as a REIT for U.S. federal income tax purposes.
Substantially all of the Company’s business is conducted through NorthStar Healthcare Income Operating Partnership, LP (the “Operating Partnership”). The Company is the sole general partner of the Operating Partnership. The limited partners of the Operating Partnership are NorthStar Healthcare Income Advisor, LLC and NorthStar Healthcare Income OP Holdings, LLC (the “Special Unit Holder”)., which became indirect subsidiaries of the Company on June 9, 2023. NorthStar Healthcare Income Advisor, LLC invested $1,000 in the Operating Partnership in exchange for common units and the Special Unit Holder invested $1,000 in the Operating Partnership and was issued a separate class of limited partnership units (the “Special Units”), which arewere collectively recorded as non-controlling interests on the accompanying consolidated balance sheets as of September 30, 2022 and December 31, 2021.prior to June 9, 2023. As the Company issued shares, it contributed substantially all of the proceeds from its continuous, public offerings to the Operating Partnership as a capital contribution. As of September 30, 2022,2023, the Company’s limited partnership interest in the Operating Partnership, directly or indirectly, was 99.99%100.0%.
The Company’s charter authorizes the issuance of up to 400.0 million shares of common stock with a par value of $0.01 per share and up to 50.0 million shares of preferred stock with a par value of $0.01 per share. The board of directors of the Company is authorized to amend its charter, without the approval of the stockholders, to increase the aggregate number of authorized shares of capital stock or the number of shares of any class or series that the Company has authority to issue.
SinceThe Company raised $2.0 billion in total gross proceeds from the sale of shares of common stock in its continuous, public offerings (the “Offering”), including $232.6 million pursuant to its distribution reinvestment plan (the “DRP”).
The Internalization
From inception through October 21, 2022, the Company was externally managed by CNI NSHC Advisors, LLC or its predecessor (the “Advisor”“Former Advisor”), an affiliate of NRF Holdco, LLC (the “Sponsor”“Former Sponsor”). The Former Advisor was responsible for managing the Company’s operations, subject to the supervision of the Company’s board of directors, pursuant to an advisory agreement. On October 21, 2022, the Company completed the internalization of the Company’s management function (the “Internalization”). In connection with the Internalization, the Company agreed with the Former Advisor to terminate the advisory agreement and arranged for the Former Advisor to continue to provide certain services for a transition period. Going forward, the Company will be self-managed under the leadership of Kendall Young, who was appointed by the board of directors as Chief Executive Officer and President concurrent with the Internalization. Refer to Note 13, “Subsequent Events” for further discussion.
From inception through September 30, 2022, the Company raised $2.0 billion in total gross proceeds from the sale of shares of common stock in its continuous, public offerings (the “Offering”), including $232.6 million pursuant to its distribution reinvestment plan (the “DRP”).
Impact of COVID-19
The Company's healthcare real estate business and investments have been challenged by suboptimal occupancy levels, lower labor force participation rates, which has driven increased labor costs, and inflationary pressures on other operating expenses.
These lasting effects from the response to the coronavirus 2019 (“COVID-19”) pandemic will continue to impact Company’s operational and financial performance. An extended recovery period increases the risk of a prolonged negative impact on the Company’s financial condition and results of operations. While the Company has the ability to meet its near term liquidity needs, general market concerns over credit and liquidity continue, and the effects of COVID-19 may also lead to heightened risk of litigation, with an ensuing increase in litigation and related costs.
NORTHSTAR HEALTHCARE INCOME, INC. AND SUBSIDIARIES
NOTES TO CONSOLIDATED FINANCIAL STATEMENTS (Continued)
(Unaudited)
At this time, the progression of the global economic recovery remains difficult for the Company to assess and estimate the future impact on the Company's results of operations. Accordingly, any estimates as reflected or discussed in these financial statements are based upon the Company's best estimates using information known to the Company as of the date of this Quarterly Report on Form 10-Q, and such estimates may change, the effects of which could be material. The Company will continue to monitor the progression of the economic recovery and reassess its effects on the Company’s results of operations and recoverability of value across its assets as conditions change.
2. Summary of Significant Accounting Policies
Basis of Accounting
The accompanying unaudited consolidated financial statements and related notes of the Company have been prepared in accordance with accounting principles generally accepted in the United States (“U.S. GAAP”) for interim financial reporting and the instructions to Form 10-Q and Rule 10-01 of Regulation S-X. Accordingly, certain information and note disclosures normally included in the consolidated financial statements prepared under U.S. GAAP have been condensed or omitted. In the opinion of management, all adjustments considered necessary for a fair presentation of the Company’s financial position, results of operations and cash flows have been included and are of a normal and recurring nature. The operating results presented for interim periods are not necessarily indicative of the results that may be expected for any other interim period or for the entire year. These consolidated financial statements should be read in conjunction with the Company’s consolidated financial statements and notes thereto included in the Company’s Annual Report on Form 10-K for the fiscal year ended December 31, 2021,2022, which was filed with the U.S. Securities and Exchange Commission on March 18, 2022.27, 2023.
NORTHSTAR HEALTHCARE INCOME, INC. AND SUBSIDIARIES
NOTES TO CONSOLIDATED FINANCIAL STATEMENTS (Continued)
(Unaudited)
Principles of Consolidation
The consolidated financial statements include the accounts of the Company, the Operating Partnership and their consolidated subsidiaries. The Company consolidates entities in which it has a controlling financial interest by first considering if an entity meets the definition of a variable interest entity (“VIE”) for which the Company is deemed to be the primary beneficiary or if the Company has the power to control an entity through majority voting interest or other arrangements. All significant intercompany balances are eliminated in consolidation.
Variable Interest Entities
A VIE is an entity that lacks one or more of the characteristics of a voting interest entity. A VIE is defined as an entity in which equity investors do not have the characteristics of a controlling financial interest or do not have sufficient equity at risk for the entity to finance its activities without additional subordinated financial support from other parties. The determination of whether an entity is a VIE includes both a qualitative and quantitative analysis. The Company bases its qualitative analysis on its review of the design of the entity, its organizational structure including decision-making ability and relevant financial agreements and the quantitative analysis on the forecasted cash flow of the entity. The Company reassesses its initial evaluation of an entity as a VIE upon the occurrence of certain reconsideration events.
A VIE must be consolidated only by its primary beneficiary, which is defined as the party who, along with its affiliates and agents, has both the: (i) power to direct the activities that most significantly impact the VIE’s economic performance; and (ii) obligation to absorb the losses of the VIE or the right to receive the benefits from the VIE, which could be significant to the VIE. The Company determines whether it is the primary beneficiary of a VIE by considering qualitative and quantitative factors, including, but not limited to: which activities most significantly impact the VIE’s economic performance and which party controls such activities; the amount and characteristics of its investment; the obligation or likelihood for the Company or other interests to provide financial support; consideration of the VIE’s purpose and design, including the risks the VIE was designed to create and pass through to its variable interest holders and the similarity with and significance to the business activities of the Company and the other interests. The Company reassesses its determination of whether it is the primary beneficiary of a VIE each reporting period. Judgments related to these determinations include estimates about the current and future fair value and performance of investments held by these VIEs and general market conditions.
The Company evaluates its investments and financings, including investments in unconsolidated ventures and securitization financing transactions to determine whether each investment or financing is a VIE. The Company analyzes new investments and financings, as well as reconsideration events for existing investments and financings, which vary depending on type of investment or financing.
NORTHSTAR HEALTHCARE INCOME, INC. AND SUBSIDIARIES
NOTES TO CONSOLIDATED FINANCIAL STATEMENTS (Continued)
(Unaudited)
As of September 30, 2022,2023, the Company has identified certain consolidated and unconsolidated VIEs. Assets of each of the VIEs, other than the Operating Partnership, may only be used to settle obligations of the respective VIE. Creditors of each of the VIEs have no recourse to the general credit of the Company.
Consolidated VIEs
The most significant VIEs of the Company are certain entities that are consolidated VIEs areby the Operating Partnership and certain properties that have non-controlling interests.Partnership. These entities are VIEs because theof non-controlling interests owned by third parties, which do not have substantive kick-out or participating rights. The Operating Partnership consolidates certain properties that have non-controlling interests. Included in operating real estate, net on the Company’s consolidated balance sheet as of September 30, 2022 is $214.2 million related to such consolidated VIEs. Included inand mortgage and other notes payable, net on the Company’s consolidated balance sheet as of September 30, 20222023 is $173.8$170.1 million collateralized by the real estate assets of theand $172.0 million, respectively, related to such consolidated VIEs.
Unconsolidated VIEs
As of September 30, 2022,2023, the Company identified unconsolidated VIEs related to its real estate equity investments in unconsolidated ventures with a carrying value of $205.2$128.0 million. The Company’s maximum exposure to loss as of September 30, 20222023 would not exceed the carrying value of its investment in the VIEs. Based on management’s analysis, theThe Company determined that it is not the primary beneficiary of these VIEs and, accordingly, they are not consolidated in the Company’s financial statements as of September 30, 2022.2023. The Company did not provide financial support to its unconsolidated VIEs during the nine months ended September 30, 2022.2023. As of September 30, 2022,2023, there were no explicit arrangements or implicit variable interests that could require the Company to provide financial support to its unconsolidated VIEs.
Voting Interest Entities
A voting interest entity is an entity in which the total equity investment at risk is sufficient to enable it to finance its activities independently and the equity holders have the power to direct the activities of the entity that most significantly impact its
NORTHSTAR HEALTHCARE INCOME, INC. AND SUBSIDIARIES
NOTES TO CONSOLIDATED FINANCIAL STATEMENTS (Continued)
(Unaudited)
economic performance, the obligation to absorb the losses of the entity and the right to receive the residual returns of the entity. The usual condition for a controlling financial interest in a voting interest entity is ownership of a majority voting interest. If the Company has a majority voting interest in a voting interest entity, the entity will generally be consolidated. The Company does not consolidate a voting interest entity if there are substantive participating rights by other parties and/or kick-out rights by a single party or through a simple majority vote.
The Company performs on-going reassessments of whether entities previously evaluated under the voting interest framework have become VIEs, based on certain events, and therefore subject to the VIE consolidation framework.
Investments in Unconsolidated Ventures
A non-controlling, unconsolidated ownership interest in an entity may be accounted for using the equity method or the Company may elect the fair value option.
The Company will account for an investment under the equity method of accounting if it has the ability to exercise significant influence over the operating and financial policies of an entity, but does not have a controlling financial interest. Under the equity method, the investment is adjusted each period for capital contributions and distributions and its share of the entity’s net income (loss). Capital contributions, distributions and net income (loss) of such entities are recorded in accordance with the terms of the governing documents. An allocation of net income (loss) may differ from the stated ownership percentage interest in such entity as a result of preferred returns and allocation formulas, if any, as described in such governing documents. Equity method investments are recognized using a cost accumulation model, in which the investment is recognized based on the cost to the investor, which includes acquisition fees. The Company records as an expense certain acquisition costs and fees associated with consolidated investments deemed to be business combinations and capitalizes these costs for investments deemed to be acquisitions of an asset, including an equity method investment.
The Company may elect the fair value option of accounting for an investment that would otherwise be accounted for under the equity method. The fair value option election allows an entity to make an irrevocable election of fair value for certain financial assets and liabilities on an instrument-by-instrument basis at the initial or subsequent measurement. The decision to elect the fair value option must be applied to an entire instrument and is irrevocable once elected. Under the fair value option, the Company records its share of the changes to fair value of the investment and any unrealized gains and losses.
On June 30, 2023, the Company elected the fair value option method to account for its investment in the Espresso joint venture, which is included in investments in unconsolidated ventures on the consolidated balance sheets. The fair value election was made based on the Company’s assessment that the expected return of investment was lower than the Company’s carrying value of its investment in the Espresso joint venture, which resulted in an impairment of $4.7 million and reduced the carrying value of its investment to recoverable fair value of $3.1 million as of June 30, 2023. The Company’s assessment for the recoverability of its investment took into consideration the joint venture’s remaining assets and estimated future cash distributions, less transaction and wind down costs. The Company will record any changes to its investment’s fair value in gain (loss) on investments and other in the consolidated statements of operations. During the three months ended September 30, 2023, the Company did not record any changes to the fair value of its investment in the Espresso joint venture. Refer to Note 4 “Investment in Unconsolidated Ventures” and Note 10 “Fair Value” for further discussion.
Non-controlling Interests
A non-controlling interest in a consolidated subsidiary is defined as the portion of the equity (net assets) in a subsidiary not attributable, directly or indirectly, to the Company. A non-controlling interest is required to be presented as a separate component of equity on the consolidated balance sheets and presented separately as net income (loss) and comprehensive income (loss) attributable to controlling and non-controlling interests. An allocation to a non-controlling interest may differ from the stated ownership percentage interest in such entity as a result of a preferred return and allocation formula, if any, as described in such governing documents.
NORTHSTAR HEALTHCARE INCOME, INC. AND SUBSIDIARIES
NOTES TO CONSOLIDATED FINANCIAL STATEMENTS (Continued)
(Unaudited)
Estimates
The preparation of consolidated financial statements in conformity with U.S. GAAP requires management to make estimates and assumptions that could affect the amounts reported in the consolidated financial statements and accompanying notes. Actual results could materially differ from those estimates and assumptions. Any estimates of the effects of the COVID-19 pandemic, inflation, rising interest rates, risk of recession and other economic conditions as reflected and/or discussed in these financial statements are based upon the Company's best estimates using information known to the Company as of the date of this Quarterly Report on Form 10-Q. Such estimates may change and the impact of which could be material.
NORTHSTAR HEALTHCARE INCOME, INC. AND SUBSIDIARIES
NOTES TO CONSOLIDATED FINANCIAL STATEMENTS (Continued)
(Unaudited)
Cash, Cash Equivalents and Restricted Cash
The Company considers all highly-liquid investments with an original maturity date of three months or less to be cash equivalents. Cash, including amounts restricted, may at times exceed the Federal Deposit Insurance Corporation deposit insurance limit of $250,000 per institution. The Company mitigates credit risk by placing cash and cash equivalents with major financial institutions.institutions and money market funds invested in short-term U.S. government securities. To date, the Company has not experienced any losses on cash and cash equivalents.
Restricted cash consists of amounts related to operating real estate (escrows for taxes, insurance, capital expenditures, security deposits received from residents and payments required under certain lease agreements) and other escrows required by lenders of the Company’s borrowings.
The following table provides a reconciliation of cash, cash equivalents, and restricted cash as reported on the consolidated balance sheets to the total of such amounts as reported on the consolidated statements of cash flows (dollars in thousands):
| | | September 30, 2022 (Unaudited) | | December 31, 2021 | | September 30, 2023 (Unaudited) | | December 31, 2022 |
| Cash and cash equivalents | Cash and cash equivalents | | $ | 95,145 | | | $ | 200,473 | | Cash and cash equivalents | | $ | 87,581 | | | $ | 103,926 | |
| Restricted cash | Restricted cash | | 12,537 | | | 10,465 | | Restricted cash | | 11,386 | | | 11,734 | |
| Total cash, cash equivalents and restricted cash | Total cash, cash equivalents and restricted cash | | $ | 107,682 | | | $ | 210,938 | | Total cash, cash equivalents and restricted cash | | $ | 98,967 | | | $ | 115,660 | |
Operating Real Estate
Operating real estate is carried at historical cost less accumulated depreciation. Major replacements and betterments which improve or extend the life of the asset are capitalized and depreciated over their useful life. Ordinary repairs and maintenance are expensed as incurred. Operating real estate is depreciated using the straight-line method over the estimated useful life of the assets, summarized as follows:
| | | | | | | | |
| Category: | | Term: |
| Building | | 30 to 50 years |
| Building improvements | | Lesser of the useful life or remaining life of the building |
| Land improvements | | 9 to 15 years |
| Tenant improvements | | Lesser of the useful life or remaining term of the lease |
| Furniture, fixtures and equipment | | 5 to 14 years |
Construction costs incurred in connection with the Company’s investments are capitalized and included in operating real estate, net on the consolidated balance sheets. Construction in progress is not depreciated until the asset is available for its intended use.
Lessee Accounting
A leasing arrangement, a right to control the use of an identified asset for a period of time in exchange for consideration, is classified by the lessee either as a finance lease, which represents a financed purchase of the leased asset, or as an operating lease. For leases with terms greater than 12 months, a lease asset and a lease liability are recognized on the balance sheet at commencement date based on the present value of lease payments over the lease term.
Lease renewal or termination options are included in the lease asset and lease liability only if it is reasonably certain that the option to extend would be exercised or the option to terminate would not be exercised. As the implicit rate in most leases are not readily determinable, the Company’s incremental borrowing rate for each lease at commencement date is used to determine the present value of lease payments. Consideration is given to the Company’s recent debt financing transactions, as well as publicly
NORTHSTAR HEALTHCARE INCOME, INC. AND SUBSIDIARIES
NOTES TO CONSOLIDATED FINANCIAL STATEMENTS (Continued)
(Unaudited)
available data for instruments with similar characteristics, adjusted for the respective lease term, when estimating incremental borrowing rates.
Lease expense is recognized over the lease term based on an effective interest method for finance leases and on a straight-line basis for operating leases.
NORTHSTAR HEALTHCARE INCOME, INC. AND SUBSIDIARIES
NOTES TO CONSOLIDATED FINANCIAL STATEMENTS (Continued)
(Unaudited)
Right of Use (“ROU”) - Finance Assets
The Company has entered into finance leases for equipment which are included in operating real estate, net on the Company’s consolidated balance sheets. As of September 30, 2022,2023, furniture, fixtures and equipment under finance leases totaled $2.5$0.3 million. The leased equipment is amortized on a straight-line basis. Payments for finance leases totaled $0.4$0.1 million and $0.5$0.4 million for the nine months ended September 30, 2023 and 2022, and 2021, respectively, including assets that were disposed of through portfolio sales.respectively.
The following table presents the future minimum lease payments under finance leases and the present value of the minimum lease payments, which are included in other liabilities on the Company’s consolidated balance sheets (dollars in thousands):
| | October 1 through December 31, 2022 | | $ | 69 | | |
| October 1 through December 31, 2023 | | October 1 through December 31, 2023 | | $ | 18 | |
| Years Ending December 31: | Years Ending December 31: | | Years Ending December 31: | |
| 2023 | | 93 | | |
| 2024 | 2024 | | 60 | | 2024 | | 69 | |
| 2025 | 2025 | | 29 | | 2025 | | 38 | |
| 2026 | 2026 | | 24 | | 2026 | | 33 | |
| 2027 | | 2027 | | 18 | |
| Thereafter | Thereafter | | 28 | | Thereafter | | 10 | |
| Total minimum lease payments | Total minimum lease payments | | $ | 303 | | Total minimum lease payments | | $ | 186 | |
| Less: Amount representing interest | Less: Amount representing interest | | (29) | | Less: Amount representing interest | | (27) | |
| Present value of minimum lease payments | Present value of minimum lease payments | | $ | 274 | | Present value of minimum lease payments | | $ | 159 | |
The weighted average interest rate related to the finance lease obligations is 7.2%6.8% with a weighted average lease term of 3.4 years.
As of September 30, 2022,2023, there were no leases that had yet to commence which would create significant rights and obligations to the Company as lessee.
Intangible Assets and Deferred Costs
Deferred Costs
Deferred costs primarily includeconsist of deferred financing costs and deferred leasing costs. Deferred financing costs represent commitment fees, legal and other third-party costs associated with obtaining financing. These costs are recorded against the carrying value of such financing and are amortized to interest expense over the term of the financing using the effective interest method. Unamortized deferred financing costs are expensed to realized gain (loss) on investments and other, when the associated borrowing is repaid before maturity. Costs incurred in seeking financing transactions which do not close are expensed in the period in which it is determined that the financing will not occur. Deferred lease costs consist of fees incurred to initiate and renew operating leases, which are amortized on a straight-line basis over the remaining lease term and are recorded to depreciation and amortization in the consolidated statements of operations.
Identified Intangibles
The Company records acquired identified intangibles, such as the value of in-place leases and other intangibles, based on estimated fair value at the acquisition date. The value allocated to the identified intangibles is amortized over the remaining lease term. In-place leases are amortized into depreciation and amortization expense.
Impairment analysis for identified intangible assets is performed in connection with the impairment assessment of the related operating real estate. An impairment establishes a new basis for the identified intangible asset and any impairment loss recognized is not subject to subsequent reversal. Refer to “—Impairment on Operating Real Estate and Investments in Unconsolidated Ventures” for additional information.
NORTHSTAR HEALTHCARE INCOME, INC. AND SUBSIDIARIES
NOTES TO CONSOLIDATED FINANCIAL STATEMENTS (Continued)
(Unaudited)
Identified intangible assets are recorded in intangible assets, net on the consolidated balance sheets. Intangible assets relate to the Company’s in-place lease values for the Company’s four net lease properties. The following table presents intangible assets, net (dollars in thousands):
| | | September 30, 2022 (Unaudited) | | December 31, 2021 | | September 30, 2023 (Unaudited) | | December 31, 2022 |
| In-place lease value | In-place lease value | | $ | 120,149 | | | $ | 120,149 | | In-place lease value | | $ | 120,149 | | | $ | 120,149 | |
| Less: Accumulated amortization | Less: Accumulated amortization | | (117,812) | | | (117,559) | | Less: Accumulated amortization | | (118,149) | | | (117,896) | |
| Intangible assets, net | Intangible assets, net | | $ | 2,337 | | | $ | 2,590 | | Intangible assets, net | | $ | 2,000 | | | $ | 2,253 | |
The Company recorded $0.1 million and $0.3 million of amortization expense for in-place leases for the three and nine months ended September 30, 2022, respectively. For the three2023 and nine months ended September 30, 2021, amortization expense for in-place leases and deferred costs was $0.3 million and $1.3 million,2022, respectively.
The following table presents future amortization of in-place lease value (dollars in thousands):
| | October 1 through December 31, 2022 | | $ | 84 | | | |
| October 1 through December 31, 2023 | | October 1 through December 31, 2023 | | $ | 84 | | |
| Years Ending December 31: | Years Ending December 31: | | | Years Ending December 31: | | |
| 2023 | | 337 | | | |
| 2024 | 2024 | | 337 | | | 2024 | | 337 | | |
| 2025 | 2025 | | 337 | | | 2025 | | 337 | | |
| 2026 | 2026 | | 337 | | | 2026 | | 337 | | |
| 2027 | | 2027 | | 337 | | |
| Thereafter | Thereafter | | 905 | | | Thereafter | | 568 | | |
| Total | Total | | $ | 2,337 | | | Total | | $ | 2,000 | | |
Derivative Instruments
The Company uses derivative instruments to manage its interest rate risk. The Company’s derivative instruments are recorded at fair value. The accounting for changes in fair value of derivatives depends upon whether or not the Company has elected to designate the derivative in a hedging relationship and the derivative qualifies for hedge accounting. Under hedge accounting, changes in fair value for derivatives are recorded through other comprehensive income. When hedge accounting is not elected, changes in fair value for derivatives are recorded through the income statement.
The Company has interest rate caps that have not been designated for hedge accounting. The fair value of the Company's interest rate caps totaled $0.8 million and $0.7 million as of September 30, 2023 and December 31, 2022, respectively, and are included in other assets on the consolidated balance sheets. Changes in fair value of derivatives have been recorded in gain (loss) on investments and other in the consolidated statements of operations. The Company recognized losses totaling $0.3 million and $0.5 million for the three and nine months ended September 30, 2023, respectively, and gains totaling $0.3 million and $0.6 million for the three and nine months ended September 30, 2022, respectively.
Revenue Recognition
Operating Real Estate
Rental income from operating real estate is derived from leasing of space to healthcare operators and residents, including rent received from the Company’s net lease properties and rent, ancillary service fees and other related revenue earned from ILF residents. Rental income recognition commences when the operator takes legal possession of the leased space and the leased space is substantially ready for its intended use. The leases are for fixed terms of varying length and generally provide for rentals and expense reimbursements to be paid in monthly installments. Rental income from leases, which includes community and move-in fees, is recognized over the term of the respective leases. ILF resident agreements are generally short-term in nature and may allow for termination with 30 days’ notice.
The Company also generates revenue from operating healthcare properties. Revenue related to operating healthcare properties includes resident room and care charges, ancillary fees and other resident service charges. Rent is charged and revenue is recognized when such services are provided, generally defined per the resident agreement as of the date upon which a resident occupies a room or uses the services. Resident agreements are generally short-term in nature and may allow for termination with 30 days’ notice. Revenue derived from our ALFs MCFs and CCRCsMCFs is recorded in resident fee income in the consolidated statements of operations.
NORTHSTAR HEALTHCARE INCOME, INC. AND SUBSIDIARIES
NOTES TO CONSOLIDATED FINANCIAL STATEMENTS (Continued)
(Unaudited)
Revenue from operators and residents is recognized at lease commencement only to the extent collection is expected to be probable. This assessment is based on several qualitative and quantitative factors, including and as appropriate, the payment history, ability to satisfy its lease obligations, the value of the underlying collateral or deposit, if any, and current economic conditions. If collection is assessed to not be probable, thereafter lease income recognized is limited to amounts collected, with the reversal of any revenue recognized to date in excess of amounts received. If collection is subsequently reassessed to be probable, revenue is adjusted to reflect the amount that would have been recognized had collection always been assessed as probable.
The operator of the Company’s remaining four net lease properties failed to remit contractual monthly rent obligations and the Company deemed it not probable that these obligations will be satisfied in the foreseeable future. On March 27, 2023, the Company entered into a lease forbearance and modification agreement (the “Forbearance Agreement”) with the existing operator, pursuant to which, among other things, the Company will be entitled to receive all cash flow in excess of permitted expenses, and be required to fund any operating deficits, through 2025, subject to the terms and conditions thereof. For the three and nine months ended September 30, 2022,2023, the Company received excess cash flow of $0.8 million and $1.2 million, respectively, which was recorded as rental income to the extent rental payments were received.income.
For the three months ended September 30, 20222023 and 2021,2022, total property and other revenues includes variable lease revenue of $2.1$3.6 million and $3.5$2.1 million, respectively. For the nine months ended September 30, 20222023 and 2021,2022, total property and other
NORTHSTAR HEALTHCARE INCOME, INC. AND SUBSIDIARIES
NOTES TO CONSOLIDATED FINANCIAL STATEMENTS (Continued)
(Unaudited)
revenue includes variable lease revenue of $9.2$10.7 million and $10.1$9.2 million, respectively. Variable lease revenue includes ancillary services provided to operator/residents, as well as non-recurring services and fees at the Company’s operating facilities.
The Company did not receive or recognize any grant income from the Provider Relief Fund administered by the U.S. Department of Health and Human Services during the nine months ended September 30, 2022. During the nine months ended September 30, 2021, the Company recognized $7.4 million of grant income. The grant income is classified as other income, net in the consolidated statements of operations. These grants are intended to mitigate the negative financial impact of the COVID-19 pandemic as reimbursements for expenses incurred to prevent, prepare for and respond to COVID-19 and lost revenues attributable to COVID-19. Provided that the Company attests to and complies with certain terms and conditions of the grants, the Company will not be required to repay these grants in the future.
Real Estate Debt Investments
Interest income is recognized on an accrual basis and any related premium, discount, origination costs and fees are amortized over the life of the investment using the effective interest method. The amortization is reflected as an adjustment to interest income in the consolidated statements of operations. The amortization of a premium or accretion of a discount is discontinued if such investment is reclassified to held for sale. The Company had one debt investment, which was repaid in full in August 2021.
Impairment on Operating Real Estate and Investments in Unconsolidated Ventures
At this time, it is difficult for the Company to assess and estimate the future economiclasting effects of the COVID-19 pandemic, inflation, rising interest rates, risk of recession and other economic conditions with any meaningful precision.conditions. The future economic effects will depend on many factors beyond the Company’s control and knowledge. The resulting effect on impairment of the Company's real estate held for investment and held for sale and investments in unconsolidated ventures may materially differ from the Company's current expectations and further impairment charges may be recorded in future periods.
Operating Real Estate
The Company’s real estate portfolio is reviewed on a quarterly basis, or more frequently as necessary, to assess whether there are any indicators that the value of its operating real estate may be impaired or that its carrying value may not be recoverable. A property’s value is considered impaired if the Company’s estimate of the aggregate expected future undiscounted cash flow generated by the property is less than the carrying value. In conducting this review, the Company considers U.S. macroeconomic factors, real estate and healthcare sector conditions, together with asset specific and other factors. To the extent an impairment has occurred, the loss is measured as the excess of the carrying value of the property over the estimated fair value and recorded in impairment loss in the consolidated statements of operations.
Real estate held for sale is stated at the lower of its carrying amount or estimated fair value less disposal cost, with any write-down to disposal cost recorded as an impairment loss. For any increase in fair value less disposal cost subsequent to classification as held for sale, the impairment may be reversed, but only up to the amount of cumulative loss previously recognized.
The Company considered the potential impact of the lasting effects of the COVID-19 pandemic, inflation, rising interest rates, risk of recession and other economic conditions on the future net operating income of its healthcare real estate held for investment as an indicator of impairment. Fair values were estimated based upon the income capitalization approach, using net operating income for each property and applying indicative capitalization rates.
During the nine months ended September 30, 2023, the Company recorded impairment losses on its operating real estate totaling $38.7 million, including impairment losses of $38.6 million for five facilities within the Rochester portfolio as a result of revised holding period assumptions. Additionally, the Company recorded impairment losses totaling $0.1 million for a land parcel within the Rochester portfolio as a result of lower estimated market value.
During the nine months ended September 30, 2022, the Company recorded impairment losses on its operating real estate totaling $31.5 million. The Company recorded impairment losses of $18.5 million, $8.5 million, and $3.9 million for facilities in its Arbors, Winterfell and Rochester portfolios, respectively, as a result of declining operating margins and lower projected future cash flows. In addition, the Company recorded impairment losses totaling $0.6 million for property damage sustained by facilities in its Winterfell portfolio. During the nine months ended September 30, 2021, the Company recorded impairment losses totaling $5.4 million, consisting of $4.6 million recognized for one independent living facility within its Winterfell portfolio and $0.8 million for its Smyrna net lease property, which was sold in May 2021.
NORTHSTAR HEALTHCARE INCOME, INC. AND SUBSIDIARIES
NOTES TO CONSOLIDATED FINANCIAL STATEMENTS (Continued)
(Unaudited)
Investments in Unconsolidated Ventures
The Company reviews its investments in unconsolidated ventures for which the Company did not elect the fair value option on a quarterly basis, or more frequently as necessary, to assess whether there are any indicators that the value may be impaired or that its carrying value may not be recoverable. An investment is considered impaired if the projected net recoverable amount over the expected holding period is less than the carrying value. In conducting this review, the Company considers global macroeconomic factors, including real estate sector conditions, together with investment specific and other factors. To the extent an impairment has occurred on the Company’s investment in unconsolidated ventures, and is considered to be other than temporary, the loss is measured as the excess of the carrying value of the investment over the estimated fair value and recorded in equity in earnings (losses) of unconsolidated venturesimpairment loss in the consolidated statements of operations.
During the nine months ended September 30, 2022,2023, the Company did not impair anyrecorded an impairment on its investment in the Espresso joint venture totaling $4.7 million, which reduced the carrying value of its investments in unconsolidated ventures, however,investment to $3.1 million. The Company’s assessment for the underlyingrecoverability of its investment took into consideration the joint ventures recorded impairmentsventure’s remaining assets and reserves on properties in their respective portfolios, whichestimated future cash distributions, less transaction and wind down costs. Upon impairing its investment, the Company recognized through equityelected the fair value option method to account for its investment in earnings (losses), of which the Company’s proportionate share was de minimis.Espresso joint venture on June 30, 2023. During the nine months ended September 30, 2021, the Company did not impair2022, there was no impairment recorded on any of itsthe Company’s investments in unconsolidated ventures.
The joint ventures nor didunderlying the Company’s unconsolidated ventures assess and record impairment and reserves on their respective real estate portfolios, goodwill, and other assets, and the Company recognizes its proportionate share through equity in earnings (losses). In May 2023, prior to the Sale of Minority Interests (as defined in Note 4, “Investments in Unconsolidated Ventures”), the Diversified US/UK joint venture recorded impairment losses on its remaining properties, 48 care homes located in the United Kingdom (the “UK Portfolio”), due to, among other things, the extended period contemplated for the UK Portfolio to reach stabilization. The Company’s proportionate share of the impairment losses recorded by the Diversified US/UK portfolio totaled $11.4 million. The Company’s proportionate share of impairment and reserves recognized by the underlying joint ventures record any impairments or reserves on properties in their respective portfolios.of its unconsolidated ventures during the nine months ended September 30, 2022 was de minimis.
Credit Losses on Receivables
The current expected credit loss model, in estimating expected credit losses over the life of a financial instrument at the time of origination or acquisition, considers historical loss experiences, current conditions and the effects of reasonable and supportable expectations of changes in future macroeconomic conditions. The Company assesses the estimate of expected credit losses on a quarterly basis or more frequently as necessary. The Company considers historical credit loss information that is adjusted for current conditions and reasonable and supportable forecasts.
The Company measures expected credit losses of receivables on a collective basis when similar risk characteristics exist. If the Company determines that a particular receivable does not share risk characteristics with its other receivables, the Company evaluates the receivable for expected credit losses on an individual basis.
When developing an estimate of expected credit losses on receivables, the Company considers available information relevant to assessing the collectability of cash flows. This information may include internal information, external information, or a combination of both relating to past events, current conditions, and reasonable and supportable forecasts. The Company considers relevant qualitative and quantitative factors that relate to the environment in which the Company operates and are specific to the borrower.
Further, the fair value of the collateral, less estimated costs to sell, may be used when determining the allowance for credit losses for a receivable for which the repayment is expected to be provided substantially through the sale of the collateral when the borrower is experiencing financial difficulty.
As of September 30, 2022,2023, the Company has not recorded an allowance for credit losses on its receivables.
Acquisition Fees and Expenses
The total of all acquisition fees and expenses for an investment, including acquisition fees to the Advisor, cannot exceed, in the aggregate, 6.0% of the contract purchase price of such investment unless such excess is approved by a majority of the Company’s directors, including a majority of its independent directors. The Company records asrecorded an expense for certain acquisition costs and fees associated with transactions deemed to be business combinations in which it consolidatesconsolidated the asset and capitalizescapitalized these costs for transactions deemed to be acquisitions of an asset, including an equity investment. Effective January 1, 2018, the Advisor no longer receives an acquisition fee in connection with the Company’s acquisitions of real estate properties or debt investments. On October 21, 2022, the advisory agreement was terminated. Refer to Note 13, “Subsequent Events” for further discussion.
Equity-Based Compensation
The Company accounts for equity-based compensation awards using the fair value method, which requires an estimate of fair value of the award at the time of grant. All fixed equity-based awards to directors, which have no vesting conditions other than
NORTHSTAR HEALTHCARE INCOME, INC. AND SUBSIDIARIES
NOTES TO CONSOLIDATED FINANCIAL STATEMENTS (Continued)
(Unaudited)
time of service, are amortized to compensation expense over the awards’ vesting period on a straight-line basis. Equity-based compensation is classified within general and administrative expenses in the consolidated statements of operations.
NORTHSTAR HEALTHCARE INCOME, INC. AND SUBSIDIARIES
NOTES TO CONSOLIDATED FINANCIAL STATEMENTS (Continued)
(Unaudited)
Income Taxes
The Company elected to be taxed as a REIT and to comply with the related provisions of the Internal Revenue Code beginning in its taxable year ended December 31, 2013. Accordingly, the Company will generally not be subject to U.S. federal income tax to the extent of its distributions to stockholders as long as certain asset, gross income and share ownership tests are met. To maintain its qualification as a REIT, the Company must annually distribute dividends equal to at least 90.0% of its REIT taxable income (with certain adjustments) to its stockholders and meet certain other requirements. The Company believes that all of the criteria to maintain the Company’s REIT qualification have been met for the applicable periods, but there can be no assurance that these criteria will continue to be met in subsequent periods. If the Company were to fail to meet these requirements, it would be subject to U.S. federal income tax and potential interest and penalties, which could have a material adverse impact on its results of operations and amounts available for distributions to its stockholders. The Company’s accounting policy with respect to interest and penalties is to classify these amounts as a component of income tax expense, where applicable. The Company has assessed its tax positions for all open tax years, which include 2018 to 2021,2022, and concluded there were no material uncertainties to be recognized.
The Company may also be subject to certain state, local and franchise taxes. Under certain circumstances, federal income and excise taxes may be due on its undistributed taxable income.
The Company made a joint election to treat certain subsidiaries as taxable REIT subsidiaries (“TRS”) which may be subject to U.S. federal, state and local income taxes. In general, a TRS of the Company may perform services for managers/operators/residents of the Company, hold assets that the Company cannot hold directly and may engage in any real estate or non-real estate related business.
Certain subsidiaries of the Company are subject to taxation by federal and state authorities for the periods presented. Income taxes are accounted for by the asset/liability approach in accordance with U.S. GAAP. Deferred taxes, if any, represent the expected future tax consequences when the reported amounts of assets and liabilities are recovered or paid. Such amounts arise from differences between the financial reporting and tax bases of assets and liabilities and are adjusted for changes in tax laws and tax rates in the period which such changes are enacted. A provision for income tax represents the total of income taxes paid or payable for the current period, plus the change in deferred taxes. Current and deferred taxes are provided on the portion of earnings (losses) recognized by the Company with respect to its interest in the TRS. Deferred income tax assets and liabilities are calculated based on temporary differences between the Company’s U.S. GAAP consolidated financial statements and the federal and state income tax basis of assets and liabilities as of the consolidated balance sheet date. The Company evaluates the realizability of its deferred tax assets (e.g., net operating loss and capital loss carryforwards) and recognizes a valuation allowance if, based on the available evidence, it is more likely than not that some portion or all of its deferred tax assets will not be realized. When evaluating the realizability of its deferred tax assets, the Company considers estimates of expected future taxable income, existing and projected book/tax differences, tax planning strategies available and the general and industry specific economic outlook. This realizability analysis is inherently subjective, as it requires the Company to forecast its business and general economic environment in future periods. Changes in estimate of deferred tax asset realizability, if any, are included in provision for income tax benefit (expense) in the consolidated statements of operations. The Company has a deferred tax asset, which as of September 30, 20222023 totaled $14.5$15.9 million and continues to have a full valuation allowance recognized, as there are no changes in the facts and circumstances to indicate that the Company should release the valuation allowance.
The Company recorded an income tax expense of approximately $17,000 and $43,000 for the three and nine months ended September 30, 2023, respectively. The Company recorded an income tax expense of approximately $15,000 and $45,000 for the three and nine months ended September 30, 2022, respectively. The Company recorded an income tax expense of approximately $59,000 and $85,000 for the three and nine months ended September 30, 2021, respectively.
Comprehensive Income (Loss)
The Company reports consolidated comprehensive income (loss) in separate statements following the consolidated statements of operations. Comprehensive income (loss) is defined as the change in equity resulting from net income (loss) and other comprehensive income (loss) (“OCI”). The only component of OCI for the Company iswas foreign currency translation adjustments related to its investment in an unconsolidated venture.
NORTHSTAR HEALTHCARE INCOME, INC. AND SUBSIDIARIES
NOTES TO CONSOLIDATED FINANCIAL STATEMENTS (Continued)
(Unaudited)
Foreign Currency
Assets and liabilities denominated in a foreign currency for which the functional currency is a foreign currency are translated using the currency exchange rate in effect at the end of the period presented and the results of operations for such entities are translated into U.S. dollars using the average currency exchange rate in effect during the period. The resulting foreign currency translation adjustment is recorded as a component of accumulated OCI in the consolidated statements of equity.
NORTHSTAR HEALTHCARE INCOME, INC. AND SUBSIDIARIES
NOTES TO CONSOLIDATED FINANCIAL STATEMENTS (Continued)
(Unaudited)
Assets and liabilities denominated in a foreign currency for which the functional currency is the U.S. dollar are remeasured using the currency exchange rate in effect at the end of the period presented and the results of operations for such entities are remeasured into U.S. dollars using the average currency exchange rate in effect during the period.
As of September 30, 2022 andFor the period December 31, 2021,2022 through June 9, 2023, the Company had exposure to foreign currency through an investment in an unconsolidated venture, the effects of which are reflectedwere recorded as a component of accumulated OCI in the consolidated statements of equity and in equity in earnings (losses) in the consolidated statements of operations. As a result of the Sale of Minority Interests (as defined in Note 4, “Investments in Unconsolidated Ventures”) in June 2023, the Company is no longer exposed to foreign currency as of September 30, 2023. The Company reclassified the accumulated foreign currency losses, totaling $3.3 million, related to the Diversified US/UK joint venture, previously recorded through other comprehensive income on the consolidated statements of equity to gain (loss) on investments and other on the consolidated statements of operations.
Recent Accounting Pronouncements
Accounting Standards Adopted in 20222023
Disclosures by Business Entities about Government Assistance—In November 2021, the Financial Accounting Standards Board (the “FASB”) issued Accounting Standards Update (“ASU”) No. 2021-10: Disclosures by Business Entities about Government Assistance. The guidance requires expanded disclosure for transactions involving the receipt of government assistance. Required disclosures include a description of the nature of transactions with government entities, accounting policies for such transactions and their impact to the Company’s consolidated financial statements. The Company adopted ASU No. 2021-10 on January 1, 2022, with no transitional impact upon adoption.
Certain Leases with Variable Lease Payments—In July 2021,March 2020, the FASB issued ASU No. 2021-05, Leases (Topic 842): Lessors—Certain Leases with Variable Lease Payments. The guidance in ASU No. 2021-05 amendsan amendment to the lease classification requirements forreference rate reform standard, which provides the lessors under certain leases containing variable payments to align with practice under ASC 840. Under the guidance, the lessor should classify and accountoption for a lease with variable lease paymentslimited period of time to ease the potential burden in accounting for, or recognizing the effects of, reference rate reform on contract modifications and hedge accounting. An example of such reform is the market transition from the London Interbank Offered Rate (“LIBOR”) to alternative reference rates. Entities that doesmake this optional expedient election would not depend on ahave to remeasure the contracts at the modification date or reassess the accounting treatment if certain criteria are met and would continue applying hedge accounting for relationships affected by reference index or a rate as an operating lease if bothreform. In December 2022, the FASB extended the date for which this guidance can be applied from December 31, 2022 to December 31, 2024. The Company did not make the optional election of the following criteria are met: 1) the lease would have been classified as a sales-type lease or a direct financing lease in accordance with the classification criteria in ASC No. 842-10-25-2 through 25-3; and 2) the lessor would have otherwise recognized a day-one loss. The amendments in ASU No. 2021-05 are effective for fiscal years beginning after December 15, 2021. The Company adopted ASU No. 2021-05 on January 1, 2022, with no transitional impact upon adoption.aforementioned accounting standards.
Future Application of Accounting Standards
Reference Rate Reform—In March 2020,None.
3. Operating Real Estate
The following table presents operating real estate, net (dollars in thousands):
| | | | | | | | | | | | | | |
| | September 30, 2023 (Unaudited) | | December 31, 2022 |
| Land | | $ | 121,424 | | | $ | 121,518 | |
| Land improvements | | 19,913 | | | 18,945 | |
| Buildings and improvements | | 932,261 | | | 957,924 | |
| Tenant improvements | | 372 | | | 372 | |
| Construction in progress | | 8,956 | | | 6,736 | |
| Furniture, fixtures and equipment | | 103,876 | | | 91,058 | |
| Subtotal | | $ | 1,186,802 | | | $ | 1,196,553 | |
| Less: Accumulated depreciation | | (292,557) | | | (263,551) | |
| Operating real estate, net | | $ | 894,245 | | | $ | 933,002 | |
For the FASB issued ASU No. 2020-04, Reference Rate Reform (Topic 848): Facilitationthree and nine months ended September 30, 2023, depreciation expense was $9.8 million and $29.1 million, respectively. For the three and nine months ended September 30, 2022, depreciation expense was $9.6 million and $28.9 million, respectively.
Within the table above, operating real estate has been reduced by accumulated impairment losses of the Effects$220.2 million and $181.5 million as of Reference Rate Reform on Financial Reporting. The guidance in ASU No. 2020-04 is optional, the election of which provides temporary relief for the accounting effects on contracts, hedging relationshipsSeptember 30, 2023 and other transactions impacted by the transition from interbank offered rates (such as London Interbank Offered Rate (“LIBOR”)) to alternative reference rates (such as Secured Overnight Financing Rate). Modification of contractual terms to effect the reference rate reform transition on debt, leases, derivatives and other contracts is eligible for relief from modification accounting and accounted for as a continuation of the existing contract. ASU No. 2020-04 is effective upon issuance through December 31, 2022, respectively. Impairment losses on the Company’s operating real estate totaled $38.7 million and may be applied retrospectively to January 1, 2020. The Company may elect practical expedients or exceptions as applicable over time as reference rate reform activities occur.
In January 2021,$31.5 million for the FASB issued ASU No. 2021-01, Reference Rate Reform (Topic 848): Scope. The guidance amends the scope of the recent reference rate reform guidance issued in ASU No. 2020-04. New optional expedients allow derivative instruments impacted by changes in the interest rate used for margining, discounting, or contract price alignment to qualify for certain optional relief. The guidance was effective immediatelynine months ended September 30, 2023 and may be applied retrospectively to January 1, 2020. The Company may elect practical expedients or exceptions as applicable over time as reference rate reform activities occur.2022, respectively, and are
NORTHSTAR HEALTHCARE INCOME, INC. AND SUBSIDIARIES
NOTES TO CONSOLIDATED FINANCIAL STATEMENTS (Continued)
(Unaudited)
3. Operating Real Estate
The following table presents operating real estate, net (dollarsrecorded in thousands):
| | | | | | | | | | | | | | |
| | September 30, 2022 (Unaudited) | | December 31, 2021 |
| Land | | $ | 121,518 | | | $ | 121,518 | |
| Land improvements | | 18,453 | | | 17,798 | |
| Buildings and improvements | | 945,526 | | | 965,630 | |
| Tenant improvements | | 322 | | | — | |
| Construction in progress | | 12,154 | | | 8,141 | |
| Furniture, fixtures and equipment | | 88,910 | | | 84,813 | |
| Subtotal | | $ | 1,186,883 | | | $ | 1,197,900 | |
| Less: Accumulated depreciation | | (254,153) | | | (225,301) | |
| Operating real estate, net | | $ | 932,730 | | | $ | 972,599 | |
For the three and nine months ended September 30, 2022, depreciation expense was $9.6 million and $28.9 million, respectively. For the three and nine months ended September 30, 2021, depreciation expense was $13.5 million and $43.5 million, respectively.
Within the table above, buildings and improvements have been reduced by accumulated impairment losses of $181.2 million and $149.7 million as of September 30, 2022 and December 31, 2021, respectively. Impairment loss, as presented on the consolidated statements of operations, totaled $31.5 million and $5.4 million for the nine months ended September 30, 2022 and 2021, respectively.operations. Refer to Note 2, “Summary of Significant Accounting Policies” for further discussion.
4. Investments in Unconsolidated Ventures
AllThe Company’s investments in unconsolidated ventures are accounted for under the equity method.method or fair value option. The following table presents the Company’s investments in unconsolidated ventures (dollars in thousands):
| | | Carrying Value(1) | | Carrying Value |
| Portfolio | Portfolio | | Acquisition Date | | Ownership | | September 30, 2022 (Unaudited) | | December 31, 2021 | Portfolio | | Acquisition Date | | Ownership | | September 30, 2023 (Unaudited) | | December 31, 2022 |
Trilogy | Trilogy | | Dec-2015 | | 23.2 | % | | $ | 130,224 | | | $ | 126,366 | | Trilogy | | Dec-2015 | | 23.4 | % | | $ | 124,670 | | | $ | 128,884 | |
| Diversified US/UK | | Dec-2014 | | 14.3 | % | | 69,815 | | | 80,766 | | |
| Eclipse | | May-2014 | | 5.6 | % | | 3,295 | | | 4,856 | | |
Espresso(2) | Espresso(2) | | Jul-2015 | | 36.7 | % | | 1,593 | | | — | | Espresso(2) | | Jul-2015 | | 36.7 | % | | 3,075 | | | 18,019 | |
Solstice(3) | | Solstice(3) | Jul-2017 | | 20.0 | % | | 281 | | | 323 | |
Investments sold(4) | | Investments sold(4) | | — | | | 29,276 | |
| | Subtotal | | $ | 204,927 | | | $ | 211,988 | | |
Solstice(3) | Jul-2017 | | 20.0 | % | | 280 | | | 321 | | |
| Total | | $ | 205,207 | | | $ | 212,309 | | |
| | Investments in Unconsolidated Ventures | | Investments in Unconsolidated Ventures | | $ | 128,026 | | | $ | 176,502 | |
(1)Includes $1.3 million, $13.4 million andThe carrying value for the Company’s investment in the Trilogy joint venture includes $9.8 million of capitalized acquisition costs for the Company’s investments in the Eclipse, Diversified US/UK, and Trilogy joint ventures, respectively.costs.
(2)As a resultIn June 2023, the Company recorded an impairment of impairments and other non-cash reserves recorded by$4.7 million to reflect the joint venture, the Company’s carryingfair value of its investment in Espresso was reduced to zero in the fourth quarter of 2018. The Company recognized its proportionate share of earnings and losses of the Espresso joint venture, throughbased on the carryingestimated cash distributions to be received from the joint venture. Based on the Company’s assessment, it elected the fair value ofoption method to account for its mezzanine loan debt investment which was originated to a subsidiary ofin the Espresso joint venture through the time of its repayment in August 2021. During the nine months ended Septemberon June 30, 2022, the Espresso joint venture recognized gains on sub-portfolio sales, which increased the Company��s carrying value in its investment as of September 30, 2022.2023.
(3)Represents the Company’s investment in Solstice Senior Living, LLC (“Solstice”), the manager of the Winterfell portfolio. Solstice is a joint venture between affiliates of Integral Senior Living, LLC (“ISL”), a management company of ILF, ALF and MCF founded in 2000, which owns 80.0%, and the Company, which owns 20.0%.
21
NORTHSTAR HEALTHCARE INCOME, INC. AND SUBSIDIARIES
NOTES TO CONSOLIDATED FINANCIAL STATEMENTS (Continued)
(Unaudited)
each joint venture, for all of the Company’s equity securities held by the Former Sponsor and its affiliates, including 9,709,553 shares of common stock of the Company, 100 common units in the Operating Partnership and 100 special units in the Operating Partnership (the “Sale of Minority Interests”).The following table presents the results of the Company’s investment in unconsolidated ventures (dollars in thousands):
| | | Three Months Ended September 30, | | Nine Months Ended September 30, | | | Three Months Ended September 30, | | Nine Months Ended September 30, |
| | 2022 | | 2021 | | 2022 | | 2021 | | | 2023 | | 2022 | | 2023 | | 2022 |
| Portfolio | Portfolio | | Equity in Earnings (Losses) | | Cash Distribution | | Equity in Earnings (Losses) | | Cash Distribution | | Equity in Earnings (Losses) | | Cash Distribution | | Equity in Earnings (Losses) | | Cash Distribution | Portfolio | | Equity in Earnings (Losses) | | Cash Distribution | | Equity in Earnings (Losses) | | Cash Distribution | | Equity in Earnings (Losses) | | Cash Distribution | | Equity in Earnings (Losses) | | Cash Distribution |
| Trilogy | Trilogy | | $ | 6,052 | | | $ | 2,300 | | | $ | 763 | | | $ | — | | | $ | 10,757 | | | $ | 6,900 | | | $ | (2,839) | | | $ | — | | Trilogy | | $ | (146) | | | $ | — | | | $ | 6,052 | | | $ | 2,300 | | | $ | 454 | | | $ | 4,668 | | | $ | 10,757 | | | $ | 6,900 | |
| Diversified US/UK | | (2,611) | | | 358 | | | (330) | | | 966 | | | (4,060) | | | 2,290 | | | (2,387) | | | 3,256 | | |
| Eclipse | | (344) | | | — | | | (194) | | | 2,898 | | | (940) | | | 620 | | | 3,739 | | | 2,898 | | |
Espresso(1) | Espresso(1) | | (242) | | | 1,375 | | | 7,693 | | | — | | | 33,711 | | | 32,363 | | | 18,636 | | | — | | Espresso(1) | | — | | | — | | | (242) | | | 1,375 | | | 9,228 | | | 19,444 | | | 33,711 | | | 32,363 | |
| Envoy | | — | | | — | | | — | | | 78 | | | — | | | — | | | 740 | | | 817 | | |
| Subtotal | | $ | 2,855 | | | $ | 4,033 | | | $ | 7,932 | | | $ | 3,942 | | | $ | 39,468 | | | $ | 42,173 | | | $ | 17,889 | | | $ | 6,971 | | |
| Solstice | Solstice | | 17 | | | — | | | 11 | | | — | | | (41) | | | — | | | (70) | | | — | | Solstice | | 19 | | | — | | | 17 | | | — | | | (41) | | | — | | | (41) | | | — | |
Investments sold(2) | | Investments sold(2) | | — | | | — | | | (2,955) | | | 358 | | | (16,236) | | | — | | | (5,000) | | | 2,910 | |
| | Total | Total | | $ | 2,872 | | | $ | 4,033 | | | $ | 7,943 | | | $ | 3,942 | | | $ | 39,427 | | | $ | 42,173 | | | $ | 17,819 | | | $ | 6,971 | | Total | | $ | (127) | | | $ | — | | | $ | 2,872 | | | $ | 4,033 | | | $ | (6,595) | | | $ | 24,112 | | | $ | 39,427 | | | $ | 42,173 | |
(1)During the nine months ended September 30, 2022, theThe Espresso joint venture recognized net gains related to sub-portfolio sales, of which the Company’s proportionate share totaled $9.2 million and $32.0 million.million for the nine months ended September 30, 2023 and 2022, respectively. The Company was distributed its proportionate share of the net proceeds generated from the sales totaling $27.4 million.
Summarized Financial Data
The following table presentsduring the Trilogy unconsolidated venture’s balance sheets as of September 30, 2022 and December 31, 2021 and statements of operations for the three and nine months ended September 30, 2023 and 2022, totaling $17.3 million and 2021 (dollars in thousands):
| | | | | | | | | | | | | | | | | | | | | | | | | | | | | | | | | | | | | | | | | | | | |
| | September 30, 2022 (Unaudited) | | December 31, 2021 | | | | Three Months Ended September 30, | | Nine Months Ended September 30, |
| | 2022 | | 2021 | | 2022 | | 2021 |
| Assets | | | | | | | | | | | | | | |
| Operating real estate, net | | $ | 1,364,535 | | | $ | 1,271,376 | | | Total revenues | | $ | 328,072 | | | $ | 264,848 | | | $ | 895,722 | | | $ | 753,056 | |
| Other assets | | 755,164 | | | 575,573 | | | Net income (loss) | | $ | 26,081 | | | $ | 3,298 | | | $ | 46,361 | | | $ | (12,199) | |
| Total assets | | $ | 2,119,699 | | | $ | 1,846,949 | | | | | | | | | |
| | | | | | | | | | | | |
| Liabilities and equity | | | | | | | | | | | | |
| Total liabilities | | $ | 1,583,870 | | | $ | 1,327,531 | | | | | | | | | |
| Equity | | 535,829 | | | 519,418 | | | | | | | | | |
| Total liabilities and equity | | $ | 2,119,699 | | | $ | 1,846,949 | | | | | | | | | |
NORTHSTAR HEALTHCARE INCOME, INC. AND SUBSIDIARIES
NOTES TO CONSOLIDATED FINANCIAL STATEMENTS (Continued)
(Unaudited)
5. Borrowings
The following table presents the Company’s mortgage and other notes payable (dollars in thousands):
| | | | | | | | | | | | | | | | | | | | | | | | | | | | | | | | | | | | | | | | | |
| | | | | | | September 30, 2022 (Unaudited) | | December 31, 2021 |
| Recourse vs. Non-Recourse | | Initial
Maturity | | Contractual Interest Rate(1) | | Principal Amount(2) | | Carrying Value(2) | | Principal
Amount(2) | | Carrying
Value(2) |
| Mortgage notes payable, net | | | | | | | | | | | | | |
| Watermark Aqua Portfolio | | | | | | | | | | | | | |
| | | | | | | | | | | | | |
Frisco, TX(3) | Non-recourse | | Feb 2026 | | 3.0% | | $ | 26,000 | | | $ | 25,527 | | | $ | 26,000 | | | $ | 25,431 | |
| Milford, OH | Non-recourse | | Sep 2026 | | LIBOR + 2.68% | | 18,394 | | | 18,169 | | | 18,661 | | | 18,388 | |
| Rochester Portfolio | | | | | | | | | | | | | |
| Rochester, NY | Non-recourse | | Feb 2025 | | 4.25% | | 18,385 | | | 18,338 | | | 18,911 | | | 18,853 | |
Rochester, NY(4) | Non-recourse | | Aug 2027 | | LIBOR + 2.34% | | 101,081 | | | 100,443 | | | 101,224 | | | 100,495 | |
| Rochester, NY | Non-recourse | | Aug 2023 | | LIBOR + 2.90% | | 11,383 | | | 11,354 | | | 11,732 | | | 11,716 | |
Arbors Portfolio(5) | | | | | | | | | | | | | |
| Various locations | Non-recourse | | Feb 2025 | | 3.99% | | 83,919 | | | 83,498 | | | 85,369 | | | 84,799 | |
| | | | | | | | | | | | |
| | | | | | | | | | | | | |
| | | | | | | | | | | | | |
Winterfell Portfolio(6) | | | | | | | | | | | | | |
| Various locations | Non-recourse | | Jun 2025 | | 4.17% | | 599,574 | | | 590,652 | | | 608,810 | | | 597,460 | |
Avamere Portfolio(7) | | | | | | | | | | | | | |
| Various locations | Non-recourse | | Feb 2027 | | 4.66% | | 68,314 | | | 67,983 | | | 69,144 | | | 68,755 | |
| Subtotal mortgage notes payable, net | | | | | | $ | 927,050 | | | $ | 915,964 | | | $ | 939,851 | | | $ | 925,897 | |
| Other notes payable | | | | | | | | | | | | | |
| Oak Cottage | | | | | | | | | | | | | |
Santa Barbara, CA(8) | Non-recourse | | Repaid | | 6.00% | | $ | — | | | $ | — | | | $ | 3,914 | | | $ | 3,914 | |
| Subtotal other notes payable, net | | | | | | $ | — | | | $ | — | | | $ | 3,914 | | | $ | 3,914 | |
| Total mortgage and other notes payable, net | | | | | | $ | 927,050 | | | $ | 915,964 | | | $ | 943,765 | | | $ | 929,811 | |
| | | | | | | | | | | | | | | | | | | | | | | | | | | | | | | | | | | | | | | | | |
| | | | | | | September 30, 2023 (Unaudited) | | December 31, 2022 |
| Recourse vs. Non-Recourse(1) | | Initial
Maturity | | Contractual Interest Rate(2) | | Principal Amount(3) | | Carrying Value(3) | | Principal
Amount(3) | | Carrying
Value(3) |
| | | | | | | | | | | | | |
| Aqua Portfolio | | | | | | | | | | | | | |
Frisco, TX(4) | Non-recourse | | Feb 2026 | | 3.0% | | $ | 26,000 | | | $ | 25,660 | | | $ | 26,000 | | | $ | 25,560 | |
| Milford, OH | Non-recourse | | Sep 2026 | | SOFR + 2.79% | | 18,212 | | | 18,036 | | | 18,336 | | | 18,126 | |
| Rochester Portfolio | | | | | | | | | | | | | |
| Rochester, NY | Non-recourse | | Feb 2025 | | 4.25% | | 17,657 | | | 17,629 | | | 18,206 | | | 18,165 | |
Rochester, NY(5) | Non-recourse | | Jul 2023 | | SOFR + 2.45% | | 99,786 | | | 99,787 | | | 100,651 | | | 100,042 | |
| Rochester, NY | Non-recourse | | Aug 2024 | | SOFR + 2.93% | | 10,922 | | | 10,891 | | | 11,336 | | | 11,315 | |
Arbors Portfolio(6) | | | | | | | | | | | | | |
| Various locations | Non-recourse | | Feb 2025 | | 3.99% | | 81,912 | | | 81,680 | | | 83,423 | | | 83,051 | |
Winterfell Portfolio(7) | | | | | | | | | | | | | |
| Various locations | Non-recourse | | Jun 2025 | | 4.17% | | 586,773 | | | 581,157 | | | 596,408 | | | 588,306 | |
Avamere Portfolio(8) | | | | | | | | | | | | | |
| Various locations | Non-recourse | | Feb 2027 | | 4.66% | | 67,025 | | | 66,770 | | | 67,995 | | | 67,683 | |
| Mortgage notes payable, net | | | | | | $ | 908,287 | | | $ | 901,610 | | | $ | 922,355 | | | $ | 912,248 | |
(1)Subject to non-recourse carve-outs.
(2)Floating-rate borrowings total $130.9$128.9 million of principal outstanding and reference one-month LIBOR.SOFR as of September 30, 2023.
(2)(3)The difference between principal amount and carrying value of mortgage notes payable is attributable to deferred financing costs, net for all borrowings, other than the Winterfell portfolio which is attributable to below market debt intangibles.
(3)(4)The mortgage note carries a fixed interest rate of 3.0% through February 2024, followed by the greater of the fixed rate or one-month LIBORadjusted SOFR, plus 2.80% through the initial maturity date of February 2026.
(4)(5)Composed of seven individual mortgage notes payable (the “Rochester Sub-Portfolio Loan”) secured by seven healthcare real estate properties (the “Rochester Sub-Portfolio”), cross-collateralized and subject to cross-default. In July 2023, the Company elected not to pay debt service on the Rochester Sub-Portfolio Loan, which resulted in a default notice accelerating the maturity of the loan from its original terms of August 2027.
(5)(6)Composed of four individual mortgage notes payable secured by four healthcare real estate properties, cross-collateralized and subject to cross-default.
(6)(7)Composed of 32 individual mortgage notes payable secured by 32 healthcare real estate properties, cross-collateralized and subject to cross-default.
(7)(8)Composed of five individual mortgage notes payable secured by five healthcare real estate properties, cross-collateralized and subject to cross-default.
(8)In June 2022, the Company repaid the outstanding financing on the Oak Cottage portfolio at discounted payoff of $3.7 million.
The following table presents future scheduled principal payments on mortgage and other notes payable based on initial maturity as of September 30, 2023 (dollars in thousands):
| | October 1 through December 31, 2022 | | $ | 4,948 | | |
| October 1 through December 31, 2023 | | October 1 through December 31, 2023 | | $ | 104,238 | |
| Years Ending December 31: | Years Ending December 31: | | Years Ending December 31: | |
| 2023 | | 31,032 | | |
| 2024 | 2024 | | 20,406 | | 2024 | | 28,761 | |
| 2025 | 2025 | | 670,302 | | 2025 | | 667,741 | |
| 2026 | 2026 | | 46,964 | | 2026 | | 45,151 | |
| Thereafter | | 153,398 | | |
| 2027 | | 2027 | | 62,396 | |
| | Total | Total | | $ | 927,050 | | Total | | $ | 908,287 | |
Beginning in February 2021, the operator of the four net lease properties in the Arbors portfolio was unable to satisfy its obligations under its leases and began remitting rent based on its available cash after satisfying property-level expenses, which resulted in a default under the mortgage notes collateralized by the properties. On March 27, 2023, with consent of the lender, the Company entered into a Forbearance Agreement relating to these defaults. During the nine months ended September 30, 2023, the Company remitted contractual debt service and is in compliance with the other contractual terms under the mortgage notes collateralized by the properties.
NORTHSTAR HEALTHCARE INCOME, INC. AND SUBSIDIARIES
NOTES TO CONSOLIDATED FINANCIAL STATEMENTS (Continued)
(Unaudited)
In July 2023, the Company elected not to pay July debt service on the Rochester Sub-Portfolio Loan in light of the continued negative cash flow generated by the Rochester Sub-Portfolio. The Rochester Sub-Portfolio Loan is non-recourse to the Company, subject to limited customary exceptions. As a result of September 30, 2022, the operator forpayment default, in July 2023, the Arbors portfolio failed to remit contractual rentCompany received a notice of acceleration of the Rochester Sub-Portfolio Loan and comply with other contractual terms of its lease agreements, which resulted in defaultsreserving all rights and remedies under the operator’s leases, which in turn, resulted in a non-monetary default under the mortgage notes collateralized by the properties. During the nine months ended September 30, 2022, the Company remitted contractual debt service and is in compliance with the other contractual terms under the mortgage notes collateralized by the properties.
The financial covenant requirements under a mortgage note secured by a property in the Rochester portfolio have been waived by the lender through December 31, 2022. During the nine months ended September 30, 2022, the Company remitted contractual debt service and is in compliance with the other contractual terms under the mortgage note. As of September 30, 2022, the mortgage note payable had an outstanding principal balance of $18.4 million, which matures in February 2025. The mortgage note payable is not cross collateralized by the other properties in the Rochester portfolio.
Line of Credit - Related Party
In October 2017, the Company obtained a revolving line of credit from an affiliate of the Sponsor (the “Sponsor Line”). As of September 30, 2022, the Sponsor Line had a borrowing capacity of $35.0 million at an interest rate of 3.5% plus LIBOR and had a maturity date of February 2024. As of September 30, 2022 and December 31, 2021, the Company had no outstanding borrowings under the Sponsor Line. The Sponsor Line was terminated on October 21, 2022 in connection with the termination of the advisory agreement. No amounts were outstanding under the Sponsor Line at the time of termination.applicable loan documents. Refer to Note 13, “Subsequent Events” for further discussion.additional information.
6. Related Party Arrangements
Former Advisor
In connection with the Internalization, the advisory agreement was terminated on October 21, 2022. Prior to the Internalization, the Former Advisor was responsible for managing the Company’s affairs on a day-to-day basis and for identifying, acquiring, originating and asset managing investments on behalf of the Company. For such services, to the extent permitted by law and regulations, the Former Advisor received fees and reimbursements from the Company. Pursuant to the advisory agreement, the Former Advisor could defer or waive fees in its discretion.
Transition Services
In connection with the Internalization, the advisory agreement was terminated on October 21, 2022. Refer2022, the Company, the Operating Partnership and the Former Advisor entered into a Transition Services Agreement (the “TSA”) to Note 13, “Subsequent Events” for further discussion.
Fees to Advisor
Asset Management Fee
Prior to the termination of the advisory agreement, the Advisor received a monthly asset management fee equal to one-twelfth of 1.5%facilitate an orderly transition of the Company’s most recently published aggregate estimated net asset value,management of its operations. The TSA, as may be subsequently adjustedamended on March 22, 2023, provides for, any special distribution declared byamong other things, the boardFormer Advisor to provide certain services, including primarily technology and insurance, for a transition period of directors in connectionup to six months following the Internalization, with a sale, transfer or other disposition of a substantial portion of the Company’s assets. From January 1, 2022 through the October 21, 2022 termination of the advisory agreement, the fee was reduced if the Company’s corporate cash balance exceeded $75.0 million, subjectlegal, treasury and accounts payable services to the terms and conditions set forth in the advisory agreement.
Effective July 1, 2021, the asset management fee was paid entirely in shares of the Company’s common stock at a price per share equal to the most recently published net asset value per share.
Acquisition Fee
Effective January 1, 2018, the Advisor no longer received an acquisition fee in connection with the Company’s acquisitions of real estate properties or debt investments.
NORTHSTAR HEALTHCARE INCOME, INC. AND SUBSIDIARIES
NOTES TO CONSOLIDATED FINANCIAL STATEMENTS (Continued)
(Unaudited)
Disposition Fee
Effective June 30, 2020, the Advisor no longer had the potential to receive a disposition fee in connection with the sale of real estate properties or debt investments.
Reimbursements to Advisor
Operating Costs
Prior to the termination of the advisory agreement, the Advisor was entitled to receive reimbursement for direct and indirect operating costs incurred by the Advisor in connection with administrative services provided to the Company. The Advisor allocated, in good faith, indirect costs tocontinue until the Company related to the Advisor’s and its affiliates’ employees, occupancy andterminates these services or in other general and administrative costs and expensesspecified circumstances in accordance with the termsTSA. The Company will reimburse the Former Advisor for costs to provide the services, including the allocated cost of employee wages and subject to the limitations contained in, the advisory agreement with the Advisor. The indirect costs included the Company’s allocable share of the Advisor’s compensation and benefit costs associated with dedicated or partially dedicated personnel who spent all or a portion of their time managing the Company’s affairs, based upon the percentage of time devoted by such personnel to the Company’s affairs. The indirect costs also included rental and occupancy, technology, office supplies and other general and administrative costs andincurred out-of-pocket expenses. However, there was no reimbursement for personnel costs related to executive officers (although reimbursement for certain executive officers of the Advisor was permissible) and other personnel involved in activities for which the Advisor received an acquisition fee or a disposition fee. The Advisor allocated these costs to the Company relative to its and its affiliates’ other managed companies in good faith and reviewed the allocation with the Company’s board of directors, including its independent directors. The Advisor updated the board of directors on a quarterly basis of any material changes to the expense allocation and provided a detailed review to the board of directors, at least annually, and as otherwise requested by the board of directors.
The Company reimbursed the Advisor quarterly for operating costs (including the asset management fee) based on a calculation for the four preceding fiscal quarters not to exceed the greater of: (i) 2.0% of its average invested assets; or (ii) 25.0% of its net income determined without reduction for any additions to reserves for depreciation, loan losses or other similar non-cash reserves and excluding any gain from the sale of assets for that period. Notwithstanding the above, the Company could reimburse the Advisor for expenses in excess of this limitation if a majority of the Company’s independent directors determines that such excess expenses are justified based on unusual and non-recurring factors. The Company had calculated the expense reimbursement quarterly based upon the trailing twelve-month period. As of September 30, 2022, the Advisor did not have any unreimbursed operating costs which remained eligible to be allocated to the Company.
As of September 30, 2022, the outstanding operating costs reimbursable to the Advisor totaled $2.5 million and were reimbursed by the Company during the fourth quarter of 2022. The Advisor continued to incur direct and indirect operating costs on behalf of the Company through the termination of the advisory agreement on October 21, 2022. In addition, the Company will pay the Advisor’s costs for certain services for a transition period. Refer to Note 13, “Subsequent Events” for further discussion.
Summary of Fees and Reimbursements
The following table presents the fees and reimbursements incurred and paid to the Former Advisor (dollars in thousands):
| | | | | | | | | | | | | | | | | | | | | | | | | | | | | | | | |
| Type of Fee or Reimbursement | | | | Due to Related Party as of December 31, 2021 | | Nine months Ended September 30, 2022 | | Due to Related Party as of September 30, 2022 (Unaudited) |
| Financial Statement Location | | | Incurred | | Paid | |
| Fees to Advisor Entities | | | | | | | | | | |
| Asset management | | Asset management fees-related party | | $ | 937 | | | $ | 7,532 | | | $ | (7,657) | |
| $ | 812 | |
| Reimbursements to Advisor Entities | | | | | | | | |
| Operating costs | | General and administrative expenses | | 6,401 | | | 8,789 | | | (12,655) | | | 2,535 | |
| Total | | | | $ | 7,338 | | | $ | 16,321 | | | $ | (20,312) | | | $ | 3,347 | |
| | | | | | | | | | | | | | | | | | | | | | | | | | | | | | | | |
| Reimbursements to Former Advisor Entities | | | | Due to Related Party as of December 31, 2022 | | Nine Months Ended September 30, 2023 | | Due to Related Party as of September 30, 2023 (Unaudited) |
| Financial Statement Location | | | Incurred | | Paid | |
| | | | | | | | |
| Operating costs | | General and administrative expenses/ Transaction costs | | $ | 469 | | | $ | 520 | | (1) | $ | (697) | | | $ | 292 | |
| | | | | | | | | | |
_______________________________________Pursuant to(1)Represents costs incurred under the advisory agreement, forTSA during the nine months ended September 30, 2022, the Company issued 2.0 million shares totaling $7.7 million, based on the estimated value per share on the date of each issuance, to an affiliate of the Advisor as part of its asset management fee. The Company will issue shares to satisfy outstanding asset management fees incurred and payable through the termination of the advisory agreement on October 21, 2022. As of September 30, 2022, the Advisor, the Sponsor and their affiliates owned a total of 9.4 million shares, or $36.6 million of the Company’s common stock based on the Company’s most recent estimated value per share. As of September 30, 2022, the Advisor, the Sponsor and their affiliates owned 4.8% of the total outstanding shares of the Company’s common stock.
NORTHSTAR HEALTHCARE INCOME, INC. AND SUBSIDIARIES
NOTES TO CONSOLIDATED FINANCIAL STATEMENTS (Continued)
(Unaudited)
Incentive Fee
The Special Unit Holder, formerly an affiliate of the Former Advisor, iswas entitled to receive distributions equal to 15.0% of net cash flows of the Company, whether from continuing operations, repayment of loans, disposition of assets or otherwise, but only after stockholders have received, in the aggregate, cumulative distributions equal to their invested capital plus a 6.75% cumulative, non-compounded annual pre-tax return on such invested capital. From inception through September 30, 2022,the date of the Sale of Minority Interests, the Special Unit Holder hasdid not receivedreceive any incentive fees from the Company.
In connection with the Sale of Minority Interests, as of June 9, 2023, the Special Unit Holder became an indirect subsidiary of the Company, though the Special Unit Holder continues to have a contractual obligation to pay any such incentive fees to affiliates of the Former Sponsor, if ever earned.
Investments in Joint Ventures
Solstice, the manager of the Winterfell portfolio, is a joint venture between affiliates of ISL, which owns 80.0%, and the Company, which owns 20.0%. For the nine months ended September 30, 2022,2023, the Company recognized property management fee expense of $4.1$5.1 million paidpayable to Solstice related to the Winterfell portfolio.
The below table indicatesIn June 2023, the Company completed the Sale of Minority Interests, involving the sale of its minority interests in the Diversified US/UK and Eclipse Portfolios, together with $1.1 million in cash, to its Former Sponsor, who is affiliated with the majority partner of each joint venture, for all of the Company’s investments for which the Sponsor is also an equity partner in the joint venture. Each investment was approvedsecurities held by the Company’s board of directors, including all ofFormer Sponsor and its independent directors.affiliates. Refer to Note 4, “Investments in Unconsolidated Ventures” for further discussion of these investments:the Sale of Minority Interests.
| | | | | | | | | | | | | | | | | | | | |
Portfolio | | Partner(s) | | Acquisition Date | | Ownership |
Eclipse | | NRF and Partner/
Formation Capital, LLC | | May 2014 | | 5.6% |
Diversified US/UK | | NRF and Partner | | December 2014 | | 14.3% |
Line
22
The Company had a Sponsor Line, which provided up to $35.0 million at an interest rate of 3.5% plus LIBOR. The Sponsor Line was terminated on October 21, 2022 in connection with the termination of the advisory agreement. Refer to Note 13, “Subsequent Events” for further discussion.NORTHSTAR HEALTHCARE INCOME, INC. AND SUBSIDIARIES
NOTES TO CONSOLIDATED FINANCIAL STATEMENTS (Continued)
(Unaudited)
7. Equity-Based Compensation
The Company adopted a long-term incentive plan, as amended (the “Plan”), which it may use to attract and retain qualified officers, directors, employees and consultants, as well as an independent directors compensation plan, which is a component of the Plan. Under the Plan, 2.0 million shares of restricted common stock were eligible to be issued for any equity-based awards granted under the Plan.
Pursuant to the Plan, as of September 30, 2022,2023, the Company’s independent directors were granted a total of 159,932 shares of restricted common stock and 116,712203,742 restricted stock units totaling $1.3 million and $0.5$0.7 million, respectively, based on the share price on the date of each grant.
The restricted common stock and restricted stock units granted generally vest quarterly over two years in equal installments and will become fully vested on the earlier occurrence of: (i) the termination of the independent director’s service as a director due to his or her death or disability; or (ii) a change in control of the Company. The restricted stock units are convertible, on a one-for-one basis, into shares of the Company’s common stock upon the earlier occurrence of: (i) the termination of the independent director’s service as a director; or (ii) a change in control of the Company.
The Company recognized equity-based compensation expense of $56,875$56,250 and $55,625$56,875 for the three months ended September 30, 20222023 and 2021,2022, respectively, and $150,042$170,000 and $174,458$150,042 for the nine months ended September 30, 20222023 and 2021,2022, respectively. Equity-based compensation expense is recorded in general and administrative expenses in the consolidated statements of operations.
Unrecognized expense related to unvested restricted common stock units totaled $296,250 and $211,250 as of September 30, 2023 and December 31, 2022, respectively. Unvested restricted stock units totaled $268,12594,853 and $223,16754,114 as of September 30, 20222023 and December 31, 2021,2022, respectively. The Company had 4,800As of December 31, 2022, the Company’s shares of restricted common stock that were unvested as of December 31, 2021 and have fully vested as of September 30, 2022. Unvested restricted stock units totaled 68,703 and 50,130 as of September 30, 2022 and December 31, 2021, respectively.vested.
NORTHSTAR HEALTHCARE INCOME, INC. AND SUBSIDIARIES
NOTES TO CONSOLIDATED FINANCIAL STATEMENTS (Continued)
(Unaudited)
8. Stockholders’ Equity
Common Stock
The Company stopped accepting subscriptions for its Offering on December 17, 2015 and all of the shares initially registered for its Offering were issued on or before January 19, 2016. The Company issued 173.4 million shares of common stock generating gross proceeds of $1.7 billion, excluding proceeds from the DRP.
Distribution Reinvestment Plan
The Company adopted the DRP through which common stockholders maywere able to elect to reinvest an amount equal to the distributions declared on their shares in additional shares of the Company’s common stock in lieu of receiving cash distributions. The purchase price under the Company’s initial DRP was $9.50. In connection with its determination of the offering price for shares of the Company’s common stock in the follow-on offering, the board of directors determined that distributions may be reinvested in shares of the Company’s common stock at a price of $9.69 per share, which was approximately 95% of the offering price of $10.20 per share established for purposes of the follow-on offering. In April 2016, the board of directors determined that distributions may be reinvested in shares of the Company’s common stock at a price equal to the most recent estimated value per share of common stock. The following table presents the estimated value per share of common stock based on when the value became effective:
| | | | | | | | | | | | | | |
Effective Date | | Estimated Value per Share | | Valuation Date |
April 2016 | | $ | 8.63 | | | 12/31/2015 |
December 2016 | | 9.10 | | | 6/30/2016 |
December 2017 | | 8.50 | | | 6/30/2017 |
December 2018 | | 7.10 | | | 6/30/2018 |
December 2019 | | 6.25 | | | 6/30/2019 |
December 2020 | | 3.89 | | | 6/30/2020 |
November 2021 | | 3.91 | | | 6/30/2021 |
Refer to Part II, Item 5. “Other Items” for additional details on the Company’s most recent published estimated value per share of common stock.
No selling commissions or dealer manager fees were paid on shares issued pursuant to the DRP. The board of directors of the Company may amend, suspend or terminate the DRP for any reason upon ten-days’ notice to participants, except that the Company may not amend the DRP to eliminate a participant’s ability to withdraw from the DRP. In April 2022, the Company’s board of directors elected to suspend the DRP, effective April 30, 2022. As a result, all future distributions, if any, will be paid in cash.
Since inception, the Company issued 25.7 million shares of common stock, generating gross offering proceeds of $232.6 million pursuant to the DRP. For the nine months ended September 30, 2022, the Company has notNo selling commissions or dealer manager fees were paid on shares issued shares of common stock pursuant to the DRP. In April 2022, the Company’s board of directors elected to end the DRP, effective April 30, 2022.
Distributions
Effective February 1, 2019, the Company’s board of directors determined to suspendstop recurring distributions in order to preserve capital and liquidity.
On April 20, 2022, the Company’s board of directors declared a special distribution of $0.50 per share (the “Special Distribution”) for each stockholder of record on May 2, 2022 totaling $97.1approximately $97.0 million. On or around May 5, 2022, $97.0 million of the Special Distribution was paid in cash and an outstanding distribution payable as of September 30, 2022 is attributable to restricted stock units and will be paid upon the conversion of the units to shares of the Company’s common stock. The outstanding distribution payable of $33,419 is recorded as other liabilities on the accompanying consolidated balance sheets as of September 30, 2022.
NORTHSTAR HEALTHCARE INCOME, INC. AND SUBSIDIARIES
NOTES TO CONSOLIDATED FINANCIAL STATEMENTS (Continued)
(Unaudited)
In order to continue to qualify as a REIT, the Company must distribute annually dividends equal to at least 90% of its REIT taxable income (with certain adjustments). The Company did not have REIT taxable income for its taxable year ending December 31, 2021,2022, therefore, it was not required to make distributions to its stockholders in 20212022 to qualify as a REIT. The Company’s most recently filed tax return is for the year ended December 31, 20212022 and includes a net operating loss carry-forward of $226.5$248.5 million.
Share Repurchase Program
The Company adopted the share repurchase program (the “Share Repurchase Program”) that enabled stockholders to sell their shares to the Company in limited circumstances.circumstances and could be amended, suspended, or terminated at any time. The Company is not obligated to
NORTHSTAR HEALTHCARE INCOME, INC. AND SUBSIDIARIES
NOTES TO CONSOLIDATED FINANCIAL STATEMENTS (Continued)
(Unaudited)
previously funded repurchase shares under the Share Repurchase Program. The Company may amend, suspendrequests with cash on hand, borrowings or terminate the Share Repurchase Program at its discretion at any time, subject to certain notice requirements.
other available capital. In April 2020, the Company’s board of directors determined to suspend all repurchases under the Share Repurchase Program effective April 30, 2020 in order to preserve capital and liquidity and hasdoes not repurchased anycurrently anticipate resuming the Share Repurchase Program.
Retirement of Shares
In connection with the Sale of Minority Interests, the Company acquired 9.7 million shares duringof its common stock in exchange for its minority interests in the nine months ended September 30, 2022.Diversified US/UK and Eclipse Portfolios from its Former Sponsor, who is affiliated with the majority partner of each joint venture. Upon completion of the Sale of Minority Interests, the Company retired all of the shares of common stock acquired.
To account for the acquisition and retirement of the common stock, the Company estimated the value of its minority interests in the Diversified US/UK and Eclipse Portfolios based on a variety of factors, including historical and projected revenues, market lease rates, the partners’ respective rights under the joint venture agreements, independent third-party appraisals obtained by the joint ventures and other factors deemed relevant. The Company previously funded repurchase requestsdetermined the estimated value of minority interests to be approximately $12.5 million at the time of transaction. The estimated value, together with the $1.1 million of cash consideration, net of closing costs, is presented on hand, borrowings or other available capital.the consolidated statements of equity as retirement of common stock.
9. Non-controlling Interests
Operating Partnership
Non-controlling interests includeincluded the aggregate limited partnership interests in the Operating Partnership held by limited partners, other than the Company. Income (loss) attributable to the non-controlling interests iswas based on the limited partners’ ownership percentage of the Operating Partnership. As a result of the Sale of Minority Interests, the Company’s limited partnership interest in the Operating Partnership, directly or indirectly, is 100.0% as of September 30, 2023. Income (loss) allocated to the Operating Partnership non-controlling interests for the three and nine months ended September 30, 2022 and 2021 wasperiod prior to June 9, 2023 were de minimis.
Other
Other non-controlling interests represent third-party equity interests in ventures that are consolidated with the Company’s financial statements. Net loss attributable to the other non-controlling interests was $0.1$0.2 million and $0.3 million for the three and nine months ended September 30, 2022, respectively. Net loss attributable to the other non-controlling interests was $0.1 million for the three months ended September 30, 20212023 and net income attributable to the other non-controlling interests was $0.12022, respectively, and $1.5 million and $0.3 million for the nine months ended September 30, 2021.2023 and 2022, respectively.
10. Fair Value
Fair Value Measurement
The fair value of financial instruments is categorized based on the priority of the inputs to the valuation technique and categorized into a three-level fair value hierarchy. The fair value hierarchy gives the highest priority to quoted prices in active markets for identical assets or liabilities (Level 1) and the lowest priority to unobservable inputs (Level 3). If the inputs used to measure the financial instruments fall within different levels of the hierarchy, the categorization is based on the lowest level input that is significant to the fair value measurement of the instrument.
Financial assets and liabilities recorded at fair value on the consolidated balance sheets are categorized based on the inputs to the valuation techniques as follows:
Level 1.Quoted prices for identical assets or liabilities in an active market.
Level 2.Financial assets and liabilities whose values are based on the following:
a)Quoted prices for similar assets or liabilities in active markets.
b)Quoted prices for identical or similar assets or liabilities in non-active markets.
c)Pricing models whose inputs are observable for substantially the full term of the asset or liability.
d)Pricing models whose inputs are derived principally from or corroborated by observable market data for substantially the full term of the asset or liability.
NORTHSTAR HEALTHCARE INCOME, INC. AND SUBSIDIARIES
NOTES TO CONSOLIDATED FINANCIAL STATEMENTS (Continued)
(Unaudited)
Level 3.Prices or valuation techniques based on inputs that are both unobservable and significant to the overall fair value measurement.
Derivative Instruments
Derivative instruments consist of interest rate contracts and foreign exchange contracts that are generally traded over-the-counter, and are valued using a third-party service provider. Quotations on over-the-counter derivatives are not adjusted and are generally valued using observable inputs such as contractual cash flows, yield curve, foreign currency rates and credit spreads, and are classified as Level 2 of the fair value hierarchy. Although credit valuation adjustments, such as the risk of default, rely on Level 3 inputs, these inputs are not significant to the overall valuation of its derivatives. As a result, derivative valuations in their entirety are classified as Level 2 of the fair value hierarchy.
Fair Value Hierarchy
Financial assets recorded at fair value on a recurring basis are classified in their entirety based on the lowest level of input that is significant to the fair value measurement. The following table presents financial assets that were accounted for at fair value on a recurring basis as of September 30, 2023 and December 31, 2022 by level within the fair value hierarchy (dollars in thousands):
| | | | | | | | | | | | | | | | | | | | | | | | | | | | | | | | | | | |
| September 30, 2023 (Unaudited) | | December 31, 2022 |
| Level 1 | | Level 2 | | Level 3 | | Level 1 | | Level 2 | | Level 3 |
| Financial assets: | | | | | | | | | | | |
| Derivative assets - interest rate caps | $ | — | | | $ | 820 | | | $ | — | | | $ | — | | | $ | 652 | | | $ | — | |
Investment in Espresso joint venture(1) | — | | | — | | | 3,075 | | | — | | | — | | | — | |
(1)The Company elected the fair value option method to account for its investment in the Espresso joint venture on June 30, 2023. As of December 31, 2022, the investment was accounted for under the equity method.
Derivative Assets - Interest Rate Caps
The Company’s interest rate caps fair values are determined using models developed by the respective counterparty that use the market standard methodology of discounting the future expected cash receipts that would occur if variable interest rates rise above the strike rate of the caps. The floating interest rates used in the calculation of projected receipts on the caps are based on an expectation of future interest rates derived from observable market interest rate curves and volatilities.
Investment in Espresso Joint Venture
The Company’s assessment of fair value for its unconsolidated investment in the Espresso joint venture took into consideration the net proceeds that are estimated to be realized from the sales, under contract, of the remaining real estate owned by the joint venture as well as forecasted distributions of available cash, less and wind down and other expenses.
Fair Value of Financial Instruments
U.S. GAAP requires disclosure of fair value about all financial instruments. The following disclosure of estimated fair value of financial instruments was determined by the Company using available market information and appropriate valuation methodologies. Considerable judgment is necessary to interpret market data and develop estimated fair value. Accordingly, the estimates presented herein are not necessarily indicative of the amounts the Company could realize on disposition of the financial instruments. The use of different market assumptions and/or estimation methodologies may have a material effect on estimated fair value.
The following table presents the principal amount, carrying value and fair value of certain financial assets and liabilities (dollars in thousands):
| | September 30, 2022 (Unaudited) | | December 31, 2021 | |
| | Principal Amount | | Carrying Value | | Fair Value | | Principal Amount | | Carrying Value | | Fair Value | | | | | | | | | | | | | | | | | | | | | | | | | | | | | | |
| | | September 30, 2023 (Unaudited) | | December 31, 2022 |
| | | Principal Amount | | Carrying Value | | Fair Value | | Principal Amount | | Carrying Value | | Fair Value |
Financial liabilities:(1) | Financial liabilities:(1) | | | | | | | | | | | | Financial liabilities:(1) | | | | | | | | | | | |
| Mortgage and other notes payable, net | $ | 927,050 | | | $ | 915,964 | | | $ | 883,040 | | | $ | 943,765 | | | $ | 929,811 | | | $ | 889,485 | | |
| | Mortgage notes payable, net | | Mortgage notes payable, net | $ | 908,287 | | | $ | 901,610 | | | $ | 842,325 | | | $ | 922,355 | | | $ | 912,248 | | | $ | 882,754 | |
(1)The fair value of other financial instruments not included in this table is estimated to approximate their carrying value.
NORTHSTAR HEALTHCARE INCOME, INC. AND SUBSIDIARIES
NOTES TO CONSOLIDATED FINANCIAL STATEMENTS (Continued)
(Unaudited)
Disclosure about fair value of financial instruments is based on pertinent information available to management as of the reporting date. Although management is not aware of any factors that would significantly affect fair value, such amounts have not been comprehensively revalued for purposes of these consolidated financial statements since that date and current estimates of fair value may differ significantly from the amounts presented herein.
Mortgage and Other Notes Payable
The Company primarily uses rates currently available with similar terms and remaining maturities to estimate fair value. These measurements are determined using comparable U.S. Treasury and LIBORSOFR rates as of the end of the reporting period. These fair value measurements are based on observable inputs, and as such, are classified as Level 2 of the fair value hierarchy.
Derivative Instruments
For certain mortgage notes payable, the Company has interest rate caps with fair values that are de minimis as of September 30, 2022.
Nonrecurring Fair Values
The Company measures fair value of certain assets on a nonrecurring basis when events or changes in circumstances indicate that the carrying value of the assets may not be recoverable. Adjustments to fair value generally result from the application of lower of amortized cost or fair value accounting for assets held for sale or otherwise, write-down of asset values due to impairment.
The following table summarizes the fair value measured at the time ofand impairment losses of Level 3 assets which have been measured at fair value on a nonrecurring basis at the time of impairment during the periods presented and the associated impairment losses (dollars in thousands):
| | | | | | | | | | | | | | | | | | | | | | | | | | |
| | September 30, 2022 (Unaudited) | | December 31, 2021 |
| | Fair Value | | Impairment Losses | | Fair Value | | Impairment Losses |
Operating real estate, net(1) | | $ | 80,931 | | | $ | 30,900 | | | $ | 11,793 | | | $ | 5,386 | |
| | | | | | | | |
| | | | | | | | | | | | | | | | | | | | | | | | | | |
| | Nine Months Ended | | Year Ended |
| | September 30, 2023 (Unaudited) | | December 31, 2022 |
| | Fair Value | | Impairment Losses | | Fair Value | | Impairment Losses |
Operating real estate, net(1) | | $ | 41,496 | | | $ | 38,694 | | | $ | 80,931 | | | $ | 30,900 | |
| Investments in unconsolidated ventures | | 3,075 | | | 4,728 | | | 28,442 | | | 13,419 | |
| | | | | | | | |
(1)During the nine monthsyear ended September 30,December 31, 2022, the Company recorded impairment losses totaling $0.6$1.0 million for property damage sustained by facilities in its Winterfell portfolio.and Avamere portfolios. The fair value and impairment losses of these facilities are excluded from the table as of September 30, 2022.table.
NORTHSTAR HEALTHCARE INCOME, INC. AND SUBSIDIARIES
NOTES TO CONSOLIDATED FINANCIAL STATEMENTS (Continued)
(Unaudited)
Operating Real Estate, Net
Operating real estate that is impaired is carried at fair value at the time of impairment. Impairment was driven by various factors that impacted undiscounted future net cash flows, including declines in operating performance, market growth assumptions and expected margins to be generated by the properties. Fair value of impaired operating real estate was estimated based upon various approaches including discounted cash flow analysis using terminal capitalization rates ranging from 6.0%6.00% to 8.0%8.50% and discount rates ranging from 8.5% to 10.5%, third party appraisals and offer prices.
Assets Held For SaleInvestments in Unconsolidated Ventures
Assets heldIn June 2023, the Company recorded impairment on its investment in the Espresso joint venture, which totaled $4.7 million and reduced the carrying value of its investment to $3.1 million as of June 30, 2023. The Company’s assessment for salethe recoverability of its investment took into consideration the net proceeds that are carried atestimated to be realized from the lowersales, under contract, of amortized cost or fair value. Assets held for sale that were writtenthe remaining real estate owned by the joint venture as well as forecasted distributions of available cash, less and wind down toand other expenses. Upon impairing its investment, the Company elected the fair value were generally valued using either broker opinions of value, or a combination of market information, including third-party appraisals and indicative sale prices, adjusted as deemed appropriate by managementoption method to account for its investment in the inherent risk associated with specific properties. In all cases, fairEspresso joint venture on June 30, 2023.
During the year ended December 31, 2022, the Company recorded impairment on its investment in the Diversified US/UK joint venture, which totaled $13.4 million and reduced the carrying value of its investment to $28.4 million as of December 31, 2022. The Company’s assessment for the recoverability of its investment took into consideration the joint venture’s post-COVID-19 underperformance, rising interest rates and the joint venture’s ability to continue to service debt collateralized by substantially all of its domestically-located healthcare real estate. Fair value of the joint venture’s underlying operating real estate held for sale is reduced forwas estimated selling costs. Asbased upon various approaches including discounted cash flow analysis, using terminal capitalization rates ranging from 6.6% to 12.5% and discount rates ranging from 8.8% to 16.0%, and offer prices.
NORTHSTAR HEALTHCARE INCOME, INC. AND SUBSIDIARIES
NOTES TO CONSOLIDATED FINANCIAL STATEMENTS (Continued)
(Unaudited)
11. Segment Reporting
The Company conducts its business through the following five segments, which are based on how management reviews and manages its business.
•Direct Investments - Operating - Healthcare propertiesProperties operated pursuant to management agreements with healthcare managers.
•Direct Investments - Net Lease - Healthcare propertiesProperties operated under net leases with an operator.
•Unconsolidated Investments - Healthcare jointJoint ventures, including properties operated under net leases with operators or pursuant to management agreements with healthcare managers, in which the Company owns a minority interest.
•Debt Investments- Mortgage loans or mezzanine loans to owners of healthcare real estate. The Company’s remaining mezzanine loan was repaid in August 2021.
•Corporate - The corporate segment includes corporate level asset management fees - related party and general and administrative expenses.
The Company primarily generates rental and resident fee income from its direct investments. Additionally, the Company reports its proportionate interest of revenues and expenses from unconsolidated investments through equity in earnings (losses) of unconsolidated ventures. During the three and nine months ended September 30, 2021, the Company generated interest income on its real estate debt investment.
The following tables present segment reporting (dollars in thousands):
| | | | | | | | | | | | | | | | | | | | | | | | | | | | | | | | | | |
| | Direct Investments | | | | | | | | |
| Three Months Ended September 30, 2023 | | Net Lease | | Operating | | Unconsolidated Investments | | | | Corporate | | Total |
| Property and other revenues | | $ | 837 | | | $ | 51,459 | | | $ | — | | | | | $ | 1,078 | | | $ | 53,374 | |
| | | | | | | | | | | | |
| Property operating expenses | | — | | | (36,890) | | | — | | | | | — | | | (36,890) | |
| Interest expense | | (883) | | | (13,367) | | | — | | | | | — | | | (14,250) | |
| Transaction costs | | — | | | — | | | (358) | | | | | — | | | (358) | |
| | | | | | | | | | | | |
| General and administrative expenses | | — | | | (30) | | | — | | | | | (2,891) | | | (2,921) | |
| Depreciation and amortization | | (729) | | | (9,119) | | | — | | | | | — | | | (9,848) | |
| | | | | | | | | | | | |
| | | | | | | | | | | | |
| Gain (loss) on investments and other | | — | | | (311) | | | (36) | | | | | — | | | (347) | |
| Equity in earnings (losses) of unconsolidated ventures | | — | | | — | | | (127) | | | | | — | | | (127) | |
| Income tax expense | | — | | | (17) | | | — | | | | | — | | | (17) | |
| Net income (loss) | | $ | (775) | | | $ | (8,275) | | | $ | (521) | | | | | $ | (1,813) | | | $ | (11,384) | |
| | | | | | | | | | | | | | | | | | | | | | | | | | | | | | | | |
| | Direct Investments | | | | | | |
| Three Months Ended September 30, 2022 | | Net Lease | | Operating | | Unconsolidated Investments | | Corporate | | Total |
| Property and other revenues | | $ | 724 | | | $ | 46,715 | | | $ | — | | | $ | 300 | | | $ | 47,739 | |
| | | | | | | | | | |
| Property operating expenses | | — | | | (35,134) | | | — | | | — | | | (35,134) | |
| Interest expense | | (907) | | | (10,107) | | | — | | | — | | | (11,014) | |
| Transaction costs | | — | | | — | | | — | | | (857) | | | (857) | |
| Asset management fees - related party | | — | | | — | | | — | | | (2,428) | | | (2,428) | |
| General and administrative expenses | | — | | | (8) | | | — | | | (2,851) | | | (2,859) | |
| Depreciation and amortization | | (870) | | | (8,772) | | | — | | | — | | | (9,642) | |
| Impairment loss | | (18,500) | | | — | | | — | | | — | | | (18,500) | |
| | | | | | | | | | |
| Gain (loss) on investments and other | | — | | | 325 | | | — | | | — | | | 325 | |
| Equity in earnings (losses) of unconsolidated ventures | | — | | | — | | | 2,872 | | | — | | | 2,872 | |
| Income tax expense | | — | | | (15) | | | — | | | — | | | (15) | |
| Net income (loss) | | $ | (19,553) | | | $ | (6,996) | | | $ | 2,872 | | | $ | (5,836) | | | $ | (29,513) | |
NORTHSTAR HEALTHCARE INCOME, INC. AND SUBSIDIARIES
NOTES TO CONSOLIDATED FINANCIAL STATEMENTS (Continued)
(Unaudited)
The following tables present segment reporting (dollars in thousands): | | | | | | | | | | | | | | | | | | | | | | | | | | | | | | | | | | |
| | Direct Investments | | | | | | | | |
| Nine Months Ended September 30, 2023 | | Net Lease | | Operating | | Unconsolidated Investments | | | | Corporate | | Total |
| Property and other revenues | | $ | 1,178 | | | $ | 150,374 | | | $ | — | | | | | $ | 2,893 | | | $ | 154,445 | |
| | | | | | | | | | | | |
| Property operating expenses | | — | | | (106,993) | | | — | | | | | — | | | (106,993) | |
| Interest expense | | (2,639) | | | (34,504) | | | — | | | | | — | | | (37,143) | |
| Transaction costs | | — | | | — | | | (358) | | | | | (97) | | | (455) | |
| | | | | | | | | | | | |
| General and administrative expenses | | — | | | (555) | | | — | | | | | (9,869) | | | (10,424) | |
| Depreciation and amortization | | (2,187) | | | (27,118) | | | — | | | | | — | | | (29,305) | |
| Impairment loss | | — | | | (38,694) | | | (4,728) | | | | | — | | | (43,422) | |
| Other income, net | | — | | | 202 | | | — | | | | | — | | | 202 | |
| Gain (loss) on investments and other | | — | | | (28) | | | (4,634) | | | | | — | | | (4,662) | |
| Equity in earnings (losses) of unconsolidated ventures | | — | | | — | | | (6,595) | | | | | — | | | (6,595) | |
| Income tax expense | | — | | | (43) | | | — | | | | | — | | | (43) | |
| Net income (loss) | | $ | (3,648) | | | $ | (57,359) | | | $ | (16,315) | | | | | $ | (7,073) | | | $ | (84,395) | |
| | | | | | | | | | | | | | | | | | | | | | | | | | | | | | | | | | | | | | |
| | Direct Investments | | | | | | | | |
| Three Months Ended September 30, 2022 | | Net Lease | | Operating | | Unconsolidated Investments | | Debt Investment | | Corporate(1) | | Total |
| Property and other revenues | | $ | 724 | | | $ | 46,715 | | | $ | — | | | $ | — | | | $ | 300 | | | $ | 47,739 | |
| Interest income on debt investments | | — | | | — | | | — | | | — | | | — | | | — | |
| Property operating expenses | | — | | | (35,134) | | | — | | | — | | | — | | | (35,134) | |
| Interest expense | | (907) | | | (10,107) | | | — | | | — | | | — | | | (11,014) | |
| Transaction costs | | — | | | — | | | — | | | — | | | (857) | | | (857) | |
| Asset management fees - related party | | — | | | — | | | — | | | — | | | (2,428) | | | (2,428) | |
| General and administrative expenses | | — | | | (8) | | | — | | | — | | | (2,851) | | | (2,859) | |
| Depreciation and amortization | | (870) | | | (8,772) | | | — | | | — | | | — | | | (9,642) | |
| Impairment loss | | (18,500) | | | — | | | — | | | — | | | — | | | (18,500) | |
| Other income, net | | — | | | — | | | — | | | — | | | — | | | — | |
| Realized gain (loss) on investments and other | | — | | | 325 | | | — | | | — | | | — | | | 325 | |
| Equity in earnings (losses) of unconsolidated ventures | | — | | | — | | | 2,872 | | | — | | | — | | | 2,872 | |
| Income tax expense | | — | | | (15) | | | — | | | — | | | — | | | (15) | |
| Net income (loss) | | $ | (19,553) | | | $ | (6,996) | | | $ | 2,872 | | | $ | — | | | $ | (5,836) | | | $ | (29,513) | |
(1)Includes unallocated asset management fee-related party and general and administrative expenses.
| | | | | | | | | | | | | | | | | | | | | | | | | | | | | | | | | | | | | | |
| | Direct Investments | | | | | | | | |
| Three Months Ended September 30, 2021 | | Net Lease | | Operating | | Unconsolidated Investments | | Debt Investment | | Corporate(1) | | Total |
| Property and other revenues | | $ | 6,012 | | | $ | 58,364 | | | $ | — | | | $ | — | | | $ | 38 | | | $ | 64,414 | |
| Interest income on debt investments | | — | | | — | | | — | | | 1,067 | | | — | | | 1,067 | |
| Real estate properties - operating expenses | | — | | | (45,784) | | | — | | | — | | | — | | | (45,784) | |
| Interest expense | | (2,907) | | | (12,768) | | | — | | | — | | | (105) | | | (15,780) | |
| Transaction costs | | — | | | — | | | — | | | — | | | — | | | — | |
| Asset management fees - related party | | — | | | — | | | — | | | — | | | (2,769) | | | (2,769) | |
| General and administrative expenses | | (64) | | | (111) | | | — | | | — | | | (2,257) | | | (2,432) | |
| Depreciation and amortization | | (3,027) | | | (10,801) | | | — | | | — | | | — | | | (13,828) | |
| Impairment loss | | — | | | (4,600) | | | — | | | — | | | — | | | (4,600) | |
| Other income, net | | — | | | — | | | — | | | — | | | — | | | — | |
| Realized gain (loss) on investments and other | | — | | | — | | | 75 | | | — | | | — | | | 75 | |
| Equity in earnings (losses) of unconsolidated ventures | | — | | | — | | | 7,943 | | | — | | | — | | | 7,943 | |
| Income tax benefit (expense) | | — | | | (59) | | | — | | | — | | | — | | | (59) | |
| Net income (loss) | | $ | 14 | | | $ | (15,759) | | | $ | 8,018 | | | $ | 1,067 | | | $ | (5,093) | | | $ | (11,753) | |
_______________________________________(1)Includes unallocated asset management fee-related party and general and administrative expenses.
| | | | | | | | | | | | | | | | | | | | | | | | | | | | | | | | | | |
| | Direct Investments | | | | | | | | |
| Nine Months Ended September 30, 2022 | | Net Lease | | Operating | | Unconsolidated Investments | | | | Corporate | | Total |
| Property and other revenues | | $ | 1,220 | | | $ | 134,768 | | | $ | — | | | | | $ | 457 | | | $ | 136,445 | |
| | | | | | | | | | | | |
| Property operating expenses | | (35) | | | (101,223) | | | — | | | | | — | | | (101,258) | |
| Interest expense | | (2,708) | | | (29,169) | | | — | | | | | — | | | (31,877) | |
| Transaction costs | | — | | | — | | | — | | | | | (857) | | | (857) | |
| Asset management fees - related party | | — | | | — | | | — | | | | | (7,532) | | | (7,532) | |
| General and administrative expenses | | — | | | (24) | | | — | | | | | (10,276) | | | (10,300) | |
| Depreciation and amortization | | (2,601) | | | (26,504) | | | — | | | | | — | | | (29,105) | |
| Impairment loss | | (18,500) | | | (13,002) | | | — | | | | | — | | | (31,502) | |
| Other income, net | | — | | | 77 | | | — | | | | | — | | | 77 | |
| Gain (loss) on investments and other | | (206) | | | 620 | | | 246 | | | | | — | | | 660 | |
| Equity in earnings (losses) of unconsolidated ventures | | — | | | — | | | 39,427 | | | | | — | | | 39,427 | |
| Income tax expense | | — | | | (45) | | | — | | | | | — | | | (45) | |
| Net income (loss) | | $ | (22,830) | | | $ | (34,502) | | | $ | 39,673 | | | | | $ | (18,208) | | | $ | (35,867) | |
31
NORTHSTAR HEALTHCARE INCOME, INC. AND SUBSIDIARIES
NOTES TO CONSOLIDATED FINANCIAL STATEMENTS (Continued)
(Unaudited)
| | | | | | | | | | | | | | | | | | | | | | | | | | | | | | | | | | | | | | |
| | Direct Investments | | | | | | | | |
| Nine Months Ended September 30, 2022 | | Net Lease | | Operating | | Unconsolidated Investments | | Debt Investment | | Corporate(1) | | Total |
| Property and other revenues | | $ | 1,220 | | | $ | 134,768 | | | $ | — | | | $ | — | | | $ | 457 | | | $ | 136,445 | |
| Interest income on debt investments | | — | | | — | | | — | | | — | | | — | | | — | |
| Property operating expenses | | (35) | | | (101,223) | | | — | | | — | | | — | | | (101,258) | |
| Interest expense | | (2,708) | | | (29,169) | | | — | | | — | | | — | | | (31,877) | |
| Transaction costs | | — | | | — | | | — | | | — | | | (857) | | | (857) | |
| Asset management fees - related party | | — | | | — | | | — | | | — | | | (7,532) | | | (7,532) | |
| General and administrative expenses | | — | | | (24) | | | — | | | — | | | (10,276) | | | (10,300) | |
| Depreciation and amortization | | (2,601) | | | (26,504) | | | — | | | — | | | — | | | (29,105) | |
| Impairment loss | | (18,500) | | | (13,002) | | | — | | | — | | | — | | | (31,502) | |
| Other income, net | | — | | | 77 | | | — | | | — | | | — | | | 77 | |
| Realized gain (loss) on investments and other | | (206) | | | 620 | | | 246 | | | — | | | — | | | 660 | |
| Equity in earnings (losses) of unconsolidated ventures | | — | | | — | | | 39,427 | | | — | | | — | | | 39,427 | |
| Income tax expense | | — | | | (45) | | | — | | | — | | | — | | | (45) | |
| Net income (loss) | | $ | (22,830) | | | $ | (34,502) | | | $ | 39,673 | | | $ | — | | | $ | (18,208) | | | $ | (35,867) | |
(1)Includes unallocated asset management fee-related party and general and administrative expenses.
| | | | | | | | | | | | | | | | | | | | | | | | | | | | | | | | | | | | | | |
| | Direct Investments | | | | | | | | |
| Nine Months Ended September 30, 2021 | | Net Lease | | Operating | | Unconsolidated Investments | | Debt Investment | | Corporate(1) | | Total |
| Property and other revenues | | $ | 10,942 | | | $ | 174,633 | | | $ | — | | | $ | — | | | $ | 80 | | | $ | 185,655 | |
| Interest income on debt investments | | — | | | — | | | — | | | 4,667 | | | — | | | 4,667 | |
| Property operating expenses | | (25) | | | (136,478) | | | — | | | — | | | — | | | (136,503) | |
| Interest expense | | (8,670) | | | (38,355) | | | — | | | — | | | (742) | | | (47,767) | |
| Transaction costs | | — | | | (54) | | | — | | | — | | | — | | | (54) | |
| Asset management fees - related party | | — | | | — | | | — | | | — | | | (8,307) | | | (8,307) | |
| General and administrative expenses | | (171) | | | (225) | | | — | | | — | | | (8,148) | | | (8,544) | |
| Depreciation and amortization | | (10,887) | | | (33,885) | | | — | | | — | | | — | | | (44,772) | |
| Impairment loss | | (786) | | | (4,600) | | | — | | | — | | | — | | | (5,386) | |
| Other income, net | | — | | | 6,892 | | | — | | | — | | | — | | | 6,892 | |
| Realized gain (loss) on investments and other | | (159) | | | 7,563 | | | 75 | | | — | | | — | | | 7,479 | |
| Equity in earnings (losses) of unconsolidated ventures | | — | | | — | | | 17,819 | | | — | | | — | | | 17,819 | |
| Income tax benefit (expense) | | — | | | (85) | | | — | | | — | | | — | | | (85) | |
| Net income (loss) | | $ | (9,756) | | | $ | (24,594) | | | $ | 17,894 | | | $ | 4,667 | | | $ | (17,117) | | | $ | (28,906) | |
(1)Includes unallocated asset management fee-related party and general and administrative expenses.
The following table presents total assets by segment (dollars in thousands):
| | | | | | | | | | | | | | | | | | | | | | | | | | | | | | | | | | | | | | |
| | Direct Investments | | | | | | | | |
| Total Assets: | | Net Lease | | Operating | | Unconsolidated Investments | | Debt Investment | | Corporate(1) | | Total |
| September 30, 2022 (Unaudited) | | $ | 84,668 | | | $ | 891,283 | | | $ | 205,207 | | | $ | — | | | $ | 78,081 | | | $ | 1,259,239 | |
| December 31, 2021 | | 104,809 | | | 908,517 | | | 212,309 | | | — | | | 187,238 | | | 1,412,873 | |
| | | | | | | | | | | | | | | | | | | | | | | | | | | | | | | | |
| | Direct Investments | | | | | | |
| Total Assets: | | Net Lease | | Operating | | Unconsolidated Investments | | Corporate(1) | | Total |
| September 30, 2023 (Unaudited) | | $ | 80,782 | | | $ | 847,401 | | | $ | 128,026 | | | $ | 79,707 | | | $ | 1,135,916 | |
| December 31, 2022 | | 83,435 | | | 884,137 | | | 176,502 | | | 93,761 | | | 1,237,835 | |
(1)Represents primarily corporate cash and cash equivalents balances.
NORTHSTAR HEALTHCARE INCOME, INC. AND SUBSIDIARIES
NOTES TO CONSOLIDATED FINANCIAL STATEMENTS (Continued)
(Unaudited)
The following table presents the operators and managers of the Company’s properties, excluding properties owned through unconsolidated joint ventures (dollars in thousands):
| | | As of September 30, 2022 | | Nine Months Ended September 30, 2022 | | As of September 30, 2023 | | Nine Months Ended September 30, 2023 |
| Operator / Manager | Operator / Manager | Properties Under Management | | Units Under Management(1) | | Property and Other Revenues(2) | | % of Total Property and Other Revenues | Operator / Manager | Properties Under Management | | Units Under Management(1) | | Property and Other Revenues(2) | | % of Total Property and Other Revenues |
Solstice Senior Living(3) | Solstice Senior Living(3) | 32 | | | 4,000 | | | $ | 82,607 | | | 60.5 | % | Solstice Senior Living(3) | 32 | | | 3,969 | | | $ | 94,469 | | | 61.2 | % |
| Watermark Retirement Communities | Watermark Retirement Communities | 14 | | | 1,753 | | | 33,770 | | | 24.8 | % | Watermark Retirement Communities | 14 | | | 1,782 | | | 35,967 | | | 23.2 | % |
| Avamere Health Services | Avamere Health Services | 5 | | | 453 | | | 14,764 | | | 10.8 | % | Avamere Health Services | 5 | | | 453 | | | 16,266 | | | 10.5 | % |
| Integral Senior Living | Integral Senior Living | 1 | | | 44 | | | 3,628 | | | 2.7 | % | Integral Senior Living | 1 | | | 40 | | | 3,672 | | | 2.4 | % |
Arcadia Management(4) | Arcadia Management(4) | 4 | | | 572 | | | 1,220 | | | 0.9 | % | Arcadia Management(4) | 4 | | | 572 | | | 1,178 | | | 0.8 | % |
Other(5) | Other(5) | — | | | — | | | 456 | | | 0.3 | % | Other(5) | — | | | — | | | 2,893 | | | 1.9 | % |
| Total | Total | 56 | | | 6,822 | | | $ | 136,445 | | | 100.0 | % | Total | 56 | | | 6,816 | | | $ | 154,445 | | | 100.0 | % |
(1)Represents rooms for ALFs, and ILFs and beds for MCFs, and SNFs, based on predominant type.
(2)Includes rental income received from the Company’s net lease properties as well as rental income, ancillary service fees and other related revenue earned from ILF residents and resident fee income derived from the Company’s ALFs and MCFs, which includes resident room and care charges, ancillary fees and other resident service charges.
(3)Solstice is a joint venture of which affiliates of ISL own 80%.
(4)During the nine months ended September 30, 2022,2023, the Company recorded rental income to the extent payments were received.
(5)Consists primarily of interest income earned on corporate-level cash accounts.
12. Commitments and Contingencies
As of September 30, 2022,2023, the Company believes there are no material unrecorded contingencies that would affect its results of operations, cash flows or financial position.
Litigation and Claims
The Company may be involved in various litigation matters arising in the ordinary course of its business. Although the Company is unable to predict with certainty the eventual outcome of any litigation, any current legal proceedings are not expected to have a material adverse effect on its financial position or results of operations.
The Company’s tenants, operators and managers may be involved in various litigation matters arising in the ordinary course of their business. The unfavorable resolution of any such actions, investigations or claims could, individually or in the aggregate, materially adversely affect such tenants’, operators’ or managers’ liquidity, financial condition or results of operations and their ability to satisfy their respective obligations to the Company, which, in turn, could have a material adverse effect on the Company. The effects
As of COVID-19 may also leadSeptember 30, 2023, the Company has an accrued reserve of $0.6 million, inclusive of legal fees, relating to heightened riska resolution of litigation, with an ensuing increase in litigation-related costs.claims against a manager of one of the Company’s direct operating investments, for which the Company has indemnification obligations under the management agreement.
Environmental Matters
The Company follows a policy of monitoring its properties for the presence of hazardous or toxic substances. While there can be no assurance that a material environmental liability does not exist at its properties, the Company is not currently aware of any environmental liability with respect to its properties that would have a material effect on its consolidated financial position, results of operations or cash flows. Further, the Company is not aware of any material environmental liability or any unasserted claim or assessment with respect to an environmental liability that it believes would require additional disclosure or the recording of a loss contingency.
NORTHSTAR HEALTHCARE INCOME, INC. AND SUBSIDIARIES
NOTES TO CONSOLIDATED FINANCIAL STATEMENTS (Continued)
(Unaudited)
General Uninsured Losses
The Company obtains various types of insurance to mitigate the impact of professional liability, property, business interruption, liability, flood, windstorm, earthquake, environmental and terrorism related losses. The Company attempts to obtain appropriate policy terms, conditions, limits and deductibles considering the relative risk of loss, the cost of such coverage and current industry practice. ThereDisruptions in insurance markets may increase the costs of coverage and result in the Company retaining more risk, to the extent it is more commercially reasonable to do so. In addition, there are however,also certain types of extraordinary losses, such as those due to acts of war or other events, including those that are related to the COVID-19 pandemic, that may be either uninsurable or not economically insurable.
NORTHSTAR HEALTHCARE INCOME, INC. AND SUBSIDIARIES
NOTES TO CONSOLIDATED FINANCIAL STATEMENTS (Continued)
(Unaudited)
Other
Other commitments and contingencies include the usual obligations of real estate owners and operators in the normal course of business, as well as commitments to fund capital expenditures for certain net lease properties. These commitments do not have a required minimum funding and are limited by agreed upon maximum annual funding amounts.
13. Subsequent Events
The following is a discussion of material events which have occurred subsequent to September 30, 20222023 through the issuance of the consolidated financial statements.
InternalizationRochester Receivership
OnAs a result of the payment default in July 2023 of the Rochester Sub-Portfolio Loan, on October 21, 2022,25, 2023, the lender filed a complaint seeking the appointment of a receiver and foreclosure on the underlying properties and to enforce its rights in its collateral under the loan documents and, on October 30, 2023, the properties underlying the Rochester Sub-Portfolio Loan were placed into a receivership. The receiver now has effective control of the properties and the Company completed the Internalization. In connectionis working with the Internalization, on October 21, 2022, the Company entered into a Termination Agreement with the Advisor, the Sponsorlender and the Operating Partnership, which provides for the immediate termination of the advisory agreement, as well as the final settlement of any amounts owing under the advisory agreement and the transition of certain employees from the Advisor to the Company (including our assumption of certain related employment liabilities). In addition, the Advisor agreed to vote its shares of the Company’s common stock in favor of the director nominees recommended by the board of directors and say-on-pay at the first annual meeting following the Internalization, provided the Advisor retains a minimum share ownership. No termination fee will be paid by the Company to the Advisor in connection with the Internalization.
Sponsor Line of Credit
In connection with the termination of the advisory agreement, the Company’s Sponsor Line was terminated on October 21, 2022. No amounts were outstanding under the Sponsor Line at the time of termination.
Transition Services Agreement
In connection with the Internalization, on October 21, 2022, the Company, the Operating Partnership and the Advisor entered into a Transition Services Agreement (the “TSA”)receiver to facilitate an orderly transition of the Company’s managementoperations, and eventually ownership, of the properties.
Trilogy Option Agreement
On November 3, 2023, the Company entered into an agreement to sell all of its operations. The TSA provides for, among other things,ownership interests in Trilogy REIT Holdings, LLC (the “Trilogy Joint Venture”), which indirectly owns 123 integrated senior health campuses, to American Healthcare REIT, Inc. or its affiliates (“AHR”), the Advisormajority partner of the Trilogy Joint Venture. Under the agreement, AHR has the right to providepurchase the Company’s ownership interests in the Trilogy Joint Venture at any time prior to September 30, 2025, assuming AHR exercises all of its extension options and subject to satisfaction of certain servicesclosing conditions, for a transition period ofpurchase price ranging from $240.5 million to up to six months following$260 million depending upon the Internalization,purchase price consideration and timing of the closing. A minimum of 10% of the purchase price consideration must be paid in cash, with the Operating Partnership havingbalance payable in either cash or new Series A Cumulative Convertible Preferred Stock to be issued by AHR in connection with the optionclosing. The portion of the purchase price consideration paid in cash may be subject to extenda 7.5% or 5% discount, respectively, if the initial term oncetransaction closes prior to March 31, 2024 or December 31, 2024, respectively. In addition, the Company may be entitled to a supplemental cash payment of $25,600 per day for the period between July 1, 2023 until the closing date, for up to three months. Treasury and accounts payable services will be provided for 12 months and will continue until either party providesapproximately $21 million, if the Trilogy Joint Venture does not distribute an equivalent amount to the Company during the interim period. AHR may terminate the agreement at any time, subject to payment of a termination fee equal to: (i) if terminated prior to the initial outside date, September 30, 2024, $3.9 million or, if a “Qualifying IPO” (i.e., an underwritten public offering of AHR’s common stock resulting in at least six months’ notice$200 million of termination. The services primarily include technology, insurance, legal, treasurynet proceeds) has occurred, $7.8 million, (ii) if extended and accounts payable services. The Companyterminated prior March 31, 2025, $11.7 million and (iii) if further extended and terminated prior to September 30, 2025, $15.6 million. There can be no assurance that AHR will reimburseconsummate the Advisor for costs to provide the services, including the allocated cost of employee wages and compensation and incurred out-of-pocket expenses.
Distribution from Unconsolidated Venture
In October 2022, the Espresso joint venture completed the sale of 17 properties. As resultpurchase of the sale, the Company received a distribution totaling $22.3 million in November 2022.Company’s interests on these terms or at all.
Item 2. Management’s Discussion and Analysis of Financial Condition and Results of Operations
The following discussion should be read in conjunction with our consolidated financial statements and notes thereto included in Part I, Item 1. “Financial Statements” and the risk factors in Part II, Item 1A. “Risk Factors.” References to “we,” “us,” “our,” or “NorthStar Healthcare” refer to NorthStar Healthcare Income, Inc. and its subsidiaries unless the context specifically requires otherwise.
Overview
We manageown a diversified portfolio of investments in healthcare real estate, owned directly or through joint ventures, with a focus on the seniors housing sector, which we define as assisted living, or ALF, memory care, or MCF, skilled nursing, or SNF, andproperties, including independent living facilities, or ILF,ILFs, assisted living facilities, or ALFs, and continuingmemory care retirement communities,facilities, or CCRC, whichMCFs, located throughout the United States. In addition, we have ILF, ALF, SNF, and MCF available on one campus. We are also investedinvestments through non-controlling interests in otherjoint ventures in a broader spectrum of healthcare property types,real estate, including medical office buildings,seniors housing properties, as well as, skilled nursing facilities, or MOB, hospitals, rehabilitation facilitiesSNFs, and ancillary healthcare services businesses. Our investments are predominantly inbusinesses, located throughout the United States, but we have international investments through a joint venture.States.
We were formed in October 2010 as a Maryland corporation and commenced operations in February 2013. We elected to be taxed as a REIT under the Internal Revenue Code of 1986, as amended, or the Internal Revenue Code, commencing with the taxable year ended December 31, 2013. We conduct our operations so as to continue to qualify as a REIT for U.S. federal income tax purposes.
SinceWe raised $2.0 billion in total gross proceeds from the sale of shares of our common stock in our continuous, public offerings, including $232.6 million pursuant to our distribution reinvestment plan, or our DRP, collectively referred to as our Offering.
The Internalization
From inception through October 21, 2022, we were externally managed by CNI NSHC Advisors, LLC or its predecessor, or the Former Advisor, an affiliate of NRF Holdco, LLC, or the Former Sponsor. The Former Advisor was responsible for managing our operations, subject to the supervision of our board of directors, pursuant to an advisory agreement. On October 21, 2022, we completed the internalization of our management function, or the Internalization. In connection with the Internalization, we agreed with the Former Advisor to terminate the advisory agreement and arranged for the Former Advisor to continue to provide certain services for a transition period. Going forward,
Our Strategy
Our primary objective is to maximize value and generate liquidity for shareholders. The key elements of our strategy include:
•Grow the Operating Income Generated by Our Portfolio. Through active portfolio management, we will be self-managed undercontinue to review and implement operating strategies and initiatives that address factors impacting the leadership of Kendall Young, who was appointed by the board of directors as Chief Executive Officerindustry, including inflation and President concurrent with the Internalization. Referother economic conditions, to “—Recent Developments” for further discussion.
From inception through September 30, 2022, we raised $2.0 billion in total gross proceeds from the sale of shares of our common stock in our continuous, public offerings, including $232.6 million pursuant to our distribution reinvestment plan, or our DRP, collectively referred to as our Offering.
Significant Developments
Operating Performance
The following is a summary ofenhance the performance of our existing investment segmentsportfolio.
•Deploy Strategic Capital Expenditures. We will continue to invest capital into our investments in order to maintain market position, functional and operating standards, and improve occupancy and resident rates, in an effort to enhance the overall value of our assets.
•Pursue Disposition Opportunities that Maximize Value. We will pursue dispositions of assets and portfolios where we believe the disposition will achieve a desired return and generate value for shareholders.
Market Update
Current market conditions impacting property-level performance are generally favorable. Industry occupancy continues to grow, with an industry average of 84.4% for the threethird quarter of 2023, up 80 basis points from the previous quarter, but still remains below the pre-pandemic average of 87.1% in March 2020 (source: NIC MAP Vision 3Q2023 Market Fundamentals Report). The 80+ population, a key demographic for senior housing, is expected to grow by 24% through 2028 (source: Organization for Economic Cooperation and Development as of November 2023), and new supply and new construction remain low compared to historical levels, resulting in a demand and supply environment that should contribute to overall industry occupancy and revenue growth. We have made significant capital improvements to many of our properties, which along with these positive dynamics, has contributed to the strong 29.3% growth in revenues, net of property expenses, for the nine months ended September 30, 2022 as2023 compared to the three months ended June 30, 2022.Our healthcare real estate business and investments have been challenged by suboptimal occupancy levels, lower labor force participation rates, which have driven increasedsame period last year in our directly owned portfolio. Although we continue to face higher labor costs and inflationary pressures on other operating expenses. We continueexpenses due to monitor the progressioninflation, overall we remain optimistic that revenue growth will exceed expense growth, resulting in continued improved net operating income growth.
By contrast, current market conditions affecting transactions, including asset sales, are challenging. The current state of the economic recovery frompublic and private capital markets have been affected by a general tightening of availability of credit (including the coronavirus 2019, or COVID-19, pandemic and its effects on our results of operations and assess recoverability of value across our assets as conditions change. For additional information on financial results, refer to “—Results of Operations.”
Direct Investments - Operating
During the three months ended September 30, 2022, our direct operating investments continued to attract new residents and improve occupancy. While the pace of resident move-ins at our direct operating investments slowed by 13.4%, resident move-outs declined by 4.6% as compared to the three months ended June 30, 2022. A summary of average occupancy of our direct operating investments by property manager is as follows:
| | | | | | | | | | | | | | | | | | | | | | | | | | | | | | | | | | | | | | |
| | Average Monthly Occupancy | | Average Quarterly Occupancy |
| Operator / Manager | | September 2022 | | June 2022 | | Variance | | Q3 2022 | | Q2 2022 | | Variance |
| Solstice Senior Living | | 84.6 | % | | 82.4 | % | | 2.2 | % | | 84.0 | % | | 81.4 | % | | 2.6 | % |
| Watermark Retirement Communities | | 78.0 | % | | 77.0 | % | | 1.0 | % | | 77.7 | % | | 76.9 | % | | 0.8 | % |
| Avamere Health Services | | 91.4 | % | | 88.5 | % | | 2.9 | % | | 90.4 | % | | 87.7 | % | | 2.7 | % |
| Integral Senior Living | | 97.5 | % | | 97.5 | % | | — | % | | 95.8 | % | | 99.2 | % | | (3.4) | % |
| Direct Investments - Operating | | 83.3 | % | | 81.4 | % | | 1.9 | % | | 82.8 | % | | 80.7 | % | | 2.1 | % |
Rental and resident feeconditions under which financing can be obtained), rising interest rates and a general decrease in liquidity in the healthcare lending markets, which has resulted in higher capitalization rates, adversely impacting property values and limiting transaction activity. The senior housing and care transaction volume totaled $700 million during the third quarter of 2023, the lowest quarterly level in ten years according to McKnights Senior Living. Although opportunities may exist to dispose of assets in the current market environment and there are certain scenarios where a sale can generate acceptable market returns for shareholders, many opportunities in the current market would require us to take significant discounts to our view of value.
Liquidity Update
We have not announced or adopted a plan for liquidation and are not required to liquidate by any specified date. We do not have a stated term for a liquidity event, as we believe setting a finite date for a possible, but uncertain future liquidity transaction may result in actions that are not necessarily in the best interest or within the expectations of our stockholders. However, our board of directors, through a special committee formed in August 2020, has evaluated a broad range of transactions, including restructurings, dispositions of particular assets and the company as a whole and the internalization of management, among others. Although this review process did not result in any opportunities to effect a liquidity event for stockholders at an acceptable value at that time, the board of directors has implemented steps to better position us for a future liquidity event. First, our current focus is on growing the net operating income of our existing direct operating investments, increasedincluding through selectively investing capital into certain properties in order to $46.7 million forachieve a better return upon the three months ended September 30,sale of those properties. If market conditions improve, we will then proceed with a general plan to sell assets over the next 2-3 years, while also exploring potential merger transactions in which the whole company would be acquired. In addition, the board of directors believes that the decision to internalize management in 2022, as comparedand the ability to $45.0 million formore closely align management’s incentives with this strategy, will give us the three months ended June 30, 2022 as a resultbest chance of improved occupancy.success.
Property operating expensesBased on the current forecasted cash flow of our direct operating investments increasedand cash needs to $34.9operate the business, we do not anticipate paying recurring dividends in the near future. Although we have more than $98.7 million forof unrestricted cash as of November 9, 2023, we require capital to fund operations, capital expenditures, including those invested to improve performance, and other important business uses, as well as to fund our debt service obligations and potentially to refinance indebtedness. Current cash flow generated by operations is not sufficient to cover all of these obligations. If we do not have sufficient capital available to fund our obligations, we may be unable to position properties to maximize value or meet debt service obligations. Instead, the three months ended September 30, 2022 as comparedboard of directors will evaluate special distributions in connection with any future sales and other realizations of investments on a case-by-case basis based on, among other factors, current and projected liquidity needs.
In light of the foregoing, we do not currently anticipate resuming the share repurchase program, or the Share Repurchase Program. If we have sufficient capital available, at this stage in our life cycle, we believe that returning capital to $33.1 million for the three months ended June 30, 2022. The increase was attributable to inflationary pressures on operating costs, higher utility costs due to seasonality, and staffing challenges, which in turn have resulted in additional overtime hours,stockholders through special distributions, rather than repurchases, is a better use of agencythat capital.
Business Update
•On November 9, 2023, upon the recommendation of the audit committee of the board of directors, or the Audit Committee, the board of directors, including all of its independent directors, approved and contract labor and increased salaries and wages expense.
Overall, rental and resident fee income, net of property operating expenses,established an estimated value per share of our direct operating investments decreasedcommon stock of $2.64. Refer to $11.8 millionPart II, Item 5. “Other Items” for the three months ended September 30, 2022 as comparedadditional information.
Transaction and Financing Activities
•In November 2023, we entered into an agreement to $11.9 million for the three months ended June 30, 2022.
Direct Investments - Net Lease
The operatorsell all of our Arbors portfolio continuesownership interests in Trilogy REIT Holdings, LLC, or the Trilogy Joint Venture, which indirectly owns 123 integrated senior health campuses, to make partial contractual rental payments based on availabilityAmerican Healthcare REIT, Inc. or its affiliates, or AHR, the majority partner of cash and liquidity andthe Trilogy Joint Venture. AHR has not satisfied full contractual rent obligations. We have recorded rental incomethe right to the extent rental payments were received during the three months ended September 30, 2022. The Arbors portfolio recognized rental income of $0.7 million for the three months ended September 30, 2022, as compared to $0.2 million for the three months ended June 30, 2022.
Unconsolidated Investments
Equity in earnings recognized frompurchase our unconsolidated investments, totaled $2.9 million for the three months ended September 30, 2022 as compared to $34.1 million for the three months ended June 30, 2022. The decrease was primarily a result of net gains recognized from sub-portfolio sales within the Espresso joint venture during the three months ended June 30, 2022, of which our proportionate share totaled $31.2 million.
During the three months ended September 30, 2022, we received distributions from our unconsolidated investments, which totaled $4.0 million as compared to $31.1 million for the three months ended June 30, 2022. Higher distributions during the three months ended June 30, 2022 were a result of proceeds from sales transactions in the Espresso joint venture. Distributions continued to be limited by reinvestment and developmentownership interests in the Trilogy joint ventureJoint Venture at any time prior to September 30, 2025, assuming AHR exercises all of its extension options and operational challengessubject to satisfaction of certain closing conditions, ranging from $240.5 million to up to $260 million depending upon the purchase price consideration and timing of the closing. A minimum of 10% of the purchase price consideration must be paid in cash, with the balance payable in either cash or new Series A Cumulative Convertible Preferred Stock to be issued by AHR in connection with the closing. The portion of the purchase price consideration paid in cash may be subject to a 7.5% or 5% discount, respectively, if the transaction closes prior to March 31, 2024 or December 31, 2024, respectively. In addition, we may be entitled to a supplemental cash payment of $25,600 per day for the period between July 1, 2023 until the closing date, for up to approximately $21 million, reduced by any distributions received from the Trilogy Joint Venture by us during the interim period. AHR may terminate the agreement at any time, subject to payment of a termination fee equal to: (i) if terminated prior to the initial outside date, September 30, 2024, $3.9 million or, if a “Qualifying IPO” (i.e., an underwritten public offering of AHR’s common stock resulting in at least $200 million of net proceeds) has occurred prior to the termination, $7.8 million, (ii) if extended and terminated prior March 31, 2025, $11.7 million and (iii) if further extended and terminated prior to
September 30, 2025, $15.6 million. Although there can be no assurance that AHR will consummate the purchase of our interests in the Diversified US/UK and EclipseTrilogy Joint Venture on these terms, or at all, we believe that this proposed transaction presents an attractive opportunity for us to execute on our disposition strategy, particularly for this minority position in a joint ventures.
The following is a summary of operations and performance for the Trilogy, Diversified US/UK, and Espresso joint ventures for the three months ended September 30, 2022:venture.
•Trilogy: The joint venture's facilities experienced improvements to resident occupancy and revenues, however, its operating margin continues to be impacted by the effects of labor shortages and inflationary pressures. Additionally, the joint venture recognized federal and state COVID-19 provider relief grants as income.
•Diversified US/UK: The joint venture classified the 106 properties within the MOB portfolio and two hospitals as held for sale during the three months ended September 30, 2022. The operators of the joint venture’s net lease portfolios, including its portfolio in the United Kingdom, continue to face occupancy and expense pressures, which impacted certain operator’s ability to pay contractual rent during the quarter and may require lease restructurings. CCRC, SNF and ALF operating portfolios continue to sustain suboptimal occupancy levels, and experienced staffing challenges. These factors, along with rising interest rates have reduced the joint venture’s net cash flows and subjected it to cash flow sweeps.
•Espresso: The joint venture received full contractual rent from its net lease operators. During the three months ended September 30, 2022, the joint venture distributed excess cash flows from operations, of which our proportionate share totaled $1.4 million. Rental income collected has declinedIn October 2023, as a result of the sub-portfolio salespayment default in July 2023 on seven cross-defaulted and cross-collateralized mortgage notes with an aggregate principal amount outstanding of $99.8 million, or the Rochester Sub-Portfolio Loan, secured by seven healthcare real estate properties, or the Rochester Sub-Portfolio, the lender filed a complaint seeking the appointment of a receiver and foreclosure on the underlying properties and to enforce its rights in its collateral under the loan documents and, on October 30, 2023, the properties underlying the Rochester Sub-Portfolio Loan were placed into a receivership. The receiver now has effective control of the properties and we are working with the lender and the joint venture continuesreceiver to pursue dispositionsfacilitate an orderly transition of its remainingthe operations, and eventually ownership, of the properties. The transition of these properties asis expected to have a positive impact on our cash flows and will not have a negative impact on value since the balance of September 30, 2022. Referdebt is believed to “—Recent Developments” for additional information on distributions from portfolio sales.
Investments, Financings and Disposition Activities
•Duringexceed the nine months ended September 30, 2022,value of the Espresso joint venture distributed proceeds from sub-portfolio sales, of which our proportionate share totaled $27.4 million.
•In June 2022, we repaid the outstanding financing on the Oak Cottage portfolio at a discounted payoff of $3.7 million.properties.
•In July 2022,2023, we exercised our option to extend the maturity date of a mortgage note payable collateralized by a property within the Rochester portfolio from August 20222023 to August 2023, which required2024 and made a $0.2$0.3 million principal repayment toward the outstanding principal balance.
•In June 2023, we sold our minority interests in the Healthcare GA Holdings, General Partnership, which indirectly owned 48 care homes across the United Kingdom, or the Diversified US/UK Portfolio, and the Eclipse Health, General Partnership, which indirectly owned 34 seniors housing facilities, or the Eclipse Portfolio, together with $1.1 million in cash, to our Former Sponsor, who is affiliated with the majority partner of each joint venture, for all of the equity held by the Former Sponsor and its affiliates, including 9,709,553 shares of our common stock, 100 common units in the Operating Partnership and 100 special units in the Operating Partnership, or the Sale of Minority Interests. Upon completion of the Sale of Minority Interests, we retired all of the shares of our common stock acquired. With this Sale of Minority Interests, we were able to strategically exit two minority positions in joint ventures experiencing significant distress, where we had limited ability to control outcomes and a lack of alignment with the majority partner, through a transaction that we believe creates additional value for our remaining shareholders.
•In April 2023, the Espresso joint venture completed the sale of 10 properties, the first of two scheduled sale closings for its remaining sub-portfolio, generating net proceeds, of which our proportionate share totaled $17.3 million. The transaction was structured such that the second closing sales price approximates the outstanding debt on the remaining properties and, as such, is not forecasted to generate net proceeds. The second sale closing is scheduled to close during the fourth quarter of 2023, though there can be no assurance that the transaction will close on this timeframe or at all.
Operating Performance
Our occupancy has recovered to pre-pandemic levels, driven by supply-demand fundamentals in the industry overall and specifically by our investment of capital to enhance our facilities, which has led to increases in revenues. However, operating costs remained elevated as a result of macroeconomic trends, including increases in labor costs and historically low unemployment, inflation and rising interest rates, as well as increased health and safety measures. Increased labor costs and a shortage of available skilled and unskilled workers has, and may continue to increase the cost of staffing at our facilities. We have offset increased labor and inflation with increased rates charged to residents, but continuing to do so may result in a decline in occupancy and revenues. Increases in interest rates may help ease inflation and our operating costs, but have increased our debt service obligations on our variable rate debt and may create the possibility of slowing economic growth.
The following is a summary of the performance of our investment segments for the three months ended September 30, 2023 as compared to the three months ended June 30, 2023. For additional information on financial results, refer to “—Results of Operations.”
Direct Investments - Operating
The average quarterly occupancy of our facilities improved 1.4% to 86.5% for the third quarter of 2023, while the quarterly occupancy for the seniors housing industry averaged 84.4% for the same period. The average industry occupancy remains 2.7% below its pre-pandemic level of 87.1% in the first quarter of 2020 (source: The National Investment Centers for Seniors Housing & Care Map Top 31 Primary Metropolitan Markets).
•We recorded impairment losses totaling $31.5A summary of average occupancy of our direct operating investments by property manager is as follows:
| | | | | | | | | | | | | | | | | | | | | | | | | | | | | | | | | | | | | | |
| | Average Monthly Occupancy | | Average Quarterly Occupancy |
| Manager | | September 2023 | | June 2023 | | Variance | | Q3 2023 | | Q2 2023 | | Variance |
| Solstice Senior Living | | 89.1 | % | | 87.6 | % | | 1.5 | % | | 88.7 | % | | 87.4 | % | | 1.3 | % |
| Watermark Retirement Communities | | 81.4 | % | | 79.3 | % | | 2.1 | % | | 80.8 | % | | 78.9 | % | | 1.9 | % |
| Avamere Health Services | | 90.8 | % | | 88.1 | % | | 2.7 | % | | 90.3 | % | | 88.7 | % | | 1.6 | % |
| Integral Senior Living | | 83.2 | % | | 86.9 | % | | (3.7) | % | | 85.0 | % | | 84.5 | % | | 0.5 | % |
| Direct Investments - Operating | | 87.0 | % | | 85.2 | % | | 1.8 | % | | 86.5 | % | | 85.1 | % | | 1.4 | % |
The following table is a summary of the operating performance at our direct operating investments for the three months ended September 30, 2023 and June 30, 2023 (dollars in thousands):
| | | | | | | | | | | | | | | | | | | | | | | | | | |
| | Three Months Ended | | Increase (Decrease) |
| | September 30, 2023 | | June 30, 2023 | | Amount | | % |
| Property revenues | | | | | | | | |
| Resident fee income | | $ | 11,966 | | | $ | 11,839 | | | $ | 127 | | | 1.1 | % |
| Rental income | | 39,493 | | | 38,227 | | | 1,266 | | | 3.3 | % |
| Total property revenues | | 51,459 | | | 50,066 | | | 1,393 | | | 2.8 | % |
| Property operating expenses | | | | | | | | |
| Salaries and wages | | 16,897 | | | 16,561 | | | 336 | | | 2.0 | % |
| Utilities | | 3,429 | | | 2,694 | | | 735 | | | 27.3 | % |
| Food and beverage | | 2,748 | | | 2,649 | | | 99 | | | 3.7 | % |
| Repairs and maintenance | | 3,700 | | | 3,627 | | | 73 | | | 2.0 | % |
| Property taxes | | 2,848 | | | 2,880 | | | (32) | | | (1.1) | % |
| Property management fee | | 2,989 | | | 2,499 | | | 490 | | | 19.6 | % |
| All other expenses | | 4,279 | | | 4,116 | | | 163 | | | 4.0 | % |
| Total property operating expenses | | 36,890 | | | 35,026 | | | 1,864 | | | 5.3 | % |
| Total property revenues, net of property operating expenses | | $ | 14,569 | | | $ | 15,040 | | | $ | (471) | | | (3.1) | % |
Overall, property revenues, net of property operating expenses, decreased by $0.5 million for facilities within the Arbors,three months ended September 30, 2023 as compared to the prior quarter. Property operating expenses increased by $1.9 million due to higher utility costs, salaries, and additional management fees accrued at our Winterfell portfolio due to exceeding performance targets for the nine months ended September 30, 2023, per the terms of our management agreements. Rental and resident fee income increased by $1.4 million as a result of improved occupancy and increases in market rates for new residents and in-place rates for existing residents across our direct operating investments.
Despite overall improved operating performance at our direct operating investments, certain properties continue to struggle with occupancy, rate growth and controlling expenses. In particular, the Rochester portfoliosSub-Portfolio has generated negative cash flow of approximately $3.2 million after capital expenditure and debt service payments remitted during the nine months ended September 30, 2022.2023. We elected to default on our debt service payments on the Rochester Sub-Portfolio Loan in July 2023 because we do not expect the portfolio to generate sufficient cash flow to cover debt service obligations for an extended period of time and ultimately do not believe the portfolio will be able to generate sufficient sales proceeds in order to repay its cross-collateralized debt outstanding at maturity. Refer to “—Transaction and Financing Activities” for further information.
Special DistributionDirect Investments - Net Lease
•On April 20, 2022,Beginning in February 2021, the operator of the four net lease properties in our board of directors declaredArbors portfolio has been unable to satisfy its obligations under its leases. In accordance with a special distribution,forbearance and modification agreement entered into in March 2023, or the Special Distribution, of $0.50 per share for each stockholder of recordForbearance Agreement, the operator remits rent based on May 2, 2022 totaling $97.1 million. On or around May 5, 2022, $97.0 million of the Special Distribution was paid in cash.properties’ available cash after satisfying property-level expenses.
Recent Developments
The following is a discussion of material events which have occurred subsequent toDuring the three months ended September 30, 2022 through November 9, 2022.
Internalization
On October 21, 2022,2023, we completed the Internalization. In connection with the Internalization, on October 21, 2022, we entered into a Termination Agreement with the Advisor, the Sponsor and the Operating Partnership, which provides for the immediate termination of the advisory agreement, as well as the final settlement of any amounts owing under the advisory agreement and the transition of certain employeesrecognized rental income from the Advisor to us (including our assumption of certain related employment liabilities). In addition, the Advisor agreed to vote its shares of our common stock in favor of the director nominees recommended by our board of directors and say-on-pay at the first annual meeting following the Internalization, provided the Advisor retains a minimum share ownership. No termination fee will be paid by usArbors portfolio to the Advisor in connection withextent excess cash flow was received, which totaled $0.8 million as compared to $0.3 million recognized during the Internalization.
Sponsor Line of Credit
In connection with the termination of the advisory agreement, our revolving line of credit from an affiliate of the Sponsor, or the Sponsor Line, was terminated on October 21, 2022. No amounts were outstanding under the Sponsor Line at the time of termination.
Transition Service Agreement
In connection with the Internalization, on October 21, 2022, we, the Operating Partnership and the Advisor entered into a Transition Services Agreement, or TSA, to facilitate an orderly transition of the management of our operations. The TSA provides for, among other things, the Advisor to provide certain services for a transition period of up to sixthree months following the Internalization, with the Operating Partnership having the option to extend the initial term once for up to three months. Treasury and accounts payable services will be provided for 12 months and will continue until either party provides at least six months’ notice of termination. The services primarily include technology, insurance, legal, treasury and accounts payable services. We will reimburse the Advisor for costs to provide the services, including the allocated cost of employee wages and compensation and actually incurred out-of-pocket expenses.
Resignation and Appointment of Officers
Effective upon on the Internalization, on October 21, 2022, Ann B. Harrington, Paul V. Varisano and Douglas W. Bath provided notice of their respective resignations as Interim Chief Executive Officer, President, General Counsel and Secretary, Chief Financial Officer and Treasurer and Chief Investment Officer. Their resignations are a result of the termination of the advisory agreement, and not due to any disagreement with us on any matter relating to our operations, policies or practices.
On October 21, 2022, our board of directors appointed Kendall K. Young as our Chief Executive Officer and President and as a member of our board of directors to fill an existing vacancy. In addition, our board of directors appointed Nicholas R. Balzo as our Chief Financial Officer, Treasurer and Secretary.
Distribution from Unconsolidated Venture
In October 2022, the Espresso joint venture completed the sale of 17 properties. As result of the sale, we received a distribution totaling $22.3 million in November 2022.
Estimated Net Asset Value
On November 10, 2022, upon the recommendation of the audit committee, or the Audit Committee, of the Board, the Board, including all of its independent directors, approved and established an estimated value per share of our common stock of $2.93. Refer to Part II, Item 5. “Other Items” for additional information.ended June 30, 2023.
The operator of our net lease properties continues to be impacted by sub-optimal occupancy levels and elevated operating expenses, which has resulted in limited cash flow generated by properties. As a result, during the nine months ended September 30, 2023 we have utilized cash reserves of approximately $2.8 million to fund debt service payments, including principal amortization. Average quarterly occupancy improved 0.8% to 73.8% during the three months ended September 30, 2023 from 73.0% during the three months ended June 30, 2023, but we continue to monitor the portfolio for occupancy and revenue growth and evaluate the potential options for this portfolio.
Unconsolidated Investments
We own minority, non-controlling interests in joint ventures, which own investments in real estate properties. During the three months ended September 30, 2023, we did not receive any distributions from our unconsolidated investments as compared to $21.8 million during the three months ended June 30, 2023, which consisted primarily of excess cash flow and sub-portfolio sales proceeds distributed from the Espresso joint venture, of which our proportionate share totaled $2.2 million and $17.3 million, respectively. In addition, we received a quarterly distribution from the Trilogy joint venture, of which our proportionate share totaled $2.3 million during the three months ended June 30, 2023.
The following is a summary of operations and performance for our unconsolidated investments, excluding sold investments, for the three months ended September 30, 2023:
Trilogy
While continuing to improve from pandemic-era lows, the occupancy of the joint venture's facilities remains below historical levels, which has impacted operating revenues. Operating expenses continue to be impacted by inflationary pressures, most significantly labor-related costs, however, the joint venture has recognized COVID-19 provider relief grant income, which has partially offset the elevated expenses. In addition, the joint venture has incurred higher interest expense on its floating rate debt outstanding due to rising market interest rates, which has limited cash available to be distributed.
Espresso
The joint venture received full contractual rent from the net lease operators of its remaining portfolio. The sale of the remaining portfolio is scheduled to close during the fourth quarter of 2023. Refer to “—Transaction and Financing Activities” for additional information.
Our Investments
Our investments are categorized as follows:
•Direct Investments - Operating - Healthcare propertiesProperties operated pursuant to management agreements with healthcare managers.managers, in which we own a controlling interest.
•Direct Investments - Net Lease - Healthcare propertiesProperties operated under net leases with an operator.operator, in which we own a controlling interest.
•Unconsolidated Investments - Healthcare jointJoint ventures, includingwhich include properties operated under net leases with an operator or pursuant to management agreements with healthcare managers, in which we own a minority, non-controlling interest.
We generate revenues from resident fees and rental income. Resident fee income is recorded by ourOur direct investments are in seniors housing facilities, which include ILFs, ALFs and MCFs, when services are rendered and includes resident room and care charges and other resident charges. Rental income is generated from net leases to healthcare operators and tenants as well by our ILFs. Additionally, we report our proportionate interest of revenues and expenses from unconsolidated joint ventures, which own healthcare real estate, through equity in earnings (losses) of unconsolidated ventures on our consolidated statements of operations.
For financial information regarding our reportable segments, refer to Note 11, “Segment Reporting” in our accompanying consolidated financial statements included in Part I, Item 1. “Financial Statements.”
The following table presents a summary of investments as of September 30, 2022 (dollars in thousands):
| | | | | | | | | | | | | | | | | | | | | | | | | | | | | | | | | | | | | | | | | | | | | | | | | | |
| | | | Properties(1)(2) | | | | |
| Investment Type / Portfolio | | Amount(2)(3) | | Seniors Housing | | MOB | | SNF | | Hospitals | | Total | | Primary Locations | | Ownership
Interest |
| Direct Investments - Operating | | | | | | | | | | | | | | | | |
| Winterfell | | $ | 904,985 | | | 32 | | — | | — | | — | | 32 | | Various | | 100.0% |
| Rochester | | 219,518 | | | 10 | | — | | — | | — | | 10 | | Northeast | | 97.0% |
| Watermark Aqua | | 77,521 | | | 4 | | — | | — | | — | | 4 | | Southwest/Midwest | | 97.0% |
| Avamere | | 99,438 | | | 5 | | — | | — | | — | | 5 | | Northwest | | 100.0% |
| Oak Cottage | | 19,427 | | | 1 | | — | | — | | — | | 1 | | West | | 100.0% |
Other(4) | | 2,030 | | | — | | — | | — | | — | | — | | West | | 97.0% |
| Subtotal | | $ | 1,322,919 | | | 52 | | — | | — | | — | | 52 | | | | |
| | | | | | | | | | | | | | | | |
Direct Investments -
Net Lease | | | | | | | | | | | | | | | | |
| Arbors | | $ | 126,825 | | | 4 | | — | | — | | — | | 4 | | Northeast | | 100.0% |
| | | | | | | | | | | | | | | | |
| Unconsolidated Investments | | | | | | | | | | | | | | | | |
Trilogy(5) | | $ | 440,942 | | | 23 | | — | | 75 | | — | | 98 | | Southwest/Midwest | | 23.2% |
Diversified US/UK(6) | | 261,186 | | | 92 | | — | | 39 | | 7 | | 138 | | Various | | 14.3% |
| Eclipse | | 37,291 | | | 42 | | — | | 9 | | — | | 51 | | Various | | 5.6% |
Espresso(7) | | — | | | — | | — | | — | | — | | — | | Midwest | | 36.7% |
Solstice(8) | | — | | | — | | — | | — | | — | | — | | | | 20.0% |
| Subtotal | | $ | 739,419 | | | 157 | | — | | 123 | | 7 | | 287 | | | | |
| | | | | | | | | | | | | | | | |
| Total Investments | | $ | 2,189,163 | | | 213 | | — | | 123 | | 7 | | 343 | | | | |
(1)Classification based on predominant services provided, but may include other services.
(2)Excludes properties held for sale.
(3)Based on cost for real estate equity investments, which includes purchase price allocations related to net intangibles, deferred costs, other assets, if any, and adjusted for subsequent capital expenditures. For real estate equity investments, includes cost associated with purchased land parcels that are not included in the count.
(4)Represents seven condominium units for which we hold future interests.
(5)Includes institutional pharmacy, therapy businesses and lease purchase buy-out options in connection with the Trilogy investment, which are not subject to property count.
(6)The joint venture classified the 106 properties within the MOB portfolio and two hospitals as held for sale as of September 30, 2022.
(7)As a result of the joint venture pursuing dispositions of its various sub-portfolios, the remaining 62 properties are excluded from the table as of September 30, 2022. Refer to “—Recent Developments” for additional information on portfolio sales.
(8)Represents our investment in Solstice Senior Living, LLC, or Solstice, the manager of the Winterfell portfolio. Solstice is a joint venture between affiliates of Integral Senior Living, LLC, or ISL, a management company of ILF, ALF and MCF founded in 2000, which owns 80.0%, and us, who owns 20.0%.
The following presents our real estate equity portfolio diversity across property type and geographic location based on cost as of September 30, 2022:
| | | | | | | | |
Real Estate Equity by Property Type(1)
| | Real Estate Equity by Geographic Location |
| | |
(1)Classification based on predominant services provided, but may include other services.
Our investments include the following types of healthcare facilities as of September 30, 2022:
•Seniors Housing Facilities. We define seniors housing facilities to include ILFs, ALFs, MCFs and CCRCs, as described in further detail below. Revenues generated by seniors housing facilities typically come from private pay sources, including private insurance, and to a much lesser extent government reimbursement programs, such as Medicare and Medicaid.
◦•Independent living facilities. ILFs are properties with central dining facilities that provide services that include security, housekeeping, nutrition and limited laundry services. ILFs are designed specifically for independent seniors who are able to live on their own, but desire the security and conveniences of community living. ILFs typically offer several services covered under a regular monthly fee.
◦•Assisted living facilities. ALFs provide services that include minimal assistance for activities in daily living and permit residents to maintain some of their privacy and independence as they do not require constant supervision and assistance. Services may be bundled within one regular monthly fee or based on the care needs of the resident and usually include three meals per day in a central dining room, daily housekeeping, laundry, medical reminders and 24-hour availability of assistance with the activities of daily living, such as eating, dressing and bathing. Professional nursing and healthcare services are usually available at the facility on call or at regularly scheduled times. ALFs typically are comprised of studios, one and two bedroom suites equipped with private bathrooms and efficiency kitchens.
•Memory care facilities. MCFs offer specialized options for seniors with Alzheimer’s disease and other forms of dementia. These facilities offer dedicated care and specialized programming for various conditions relating to memory loss in a secured environment. Residents require a higher level of care and more assistance with activities of daily living than in ALFs. Therefore, these facilities have staff available 24 hours a day to respond to the unique needs of their residents.
Through our unconsolidated investments, we have additional investments in seniors housing facilities, as well as in additional types of healthcare real estate, including the following:
◦•Continuing care retirement community.Integrated Senior Health Campuses. CCRCs provide,Provide a range of services, such as a continuum of care, the servicesthose described for ILFs, ALFs, andMCFs, SNFs, in an integrated campus. CCRCs can be structured to offer services covered under a regular monthly rental fee or under a one-time upfront entrance fee, which is partially refundable in certain circumstances.
•Skilled Nursing Facilities. SNFs provide services that include daily nursing, therapeutic rehabilitation, social services, housekeeping, nutrition and administrative services for individuals requiring certain assistance for activities in daily living. A typical SNF includes mostly one and two bed units, each equipped with a private or shared bathroom and community dining facilities. Revenues generated from SNFs typically come from government reimbursement programs, including Medicare and Medicaid, as well as private pay sources, including private insurance.
For financial information regarding our reportable segments, refer to Note 11, “Segment Reporting” in our accompanying consolidated financial statements included in Part I, Item 1. “Financial Statements.”
The following table presents a summary of investments as of September 30, 2023 (dollars in thousands):
| | | | | | | | | | | | | | | | | | | | | | | | | | | | | | | | | | | | | | | | | | | | | | | | | | | | | | | | |
| | | | Properties(1) | | | | |
| Investment Type / Portfolio | | Amount(2) | | ILF | | ALF | | MCF | | SNF | | Integrated Campus | | Total | | Primary Locations | | Ownership
Interest |
| Direct Investments - Operating | | | | | | | | | | | | | | | | | | |
| Winterfell | | $ | 737,058 | | | 32 | | — | | — | | — | | — | | 32 | | 12 U.S. States | | 100.0% |
| Rochester | | 149,204 | | | 7 | | 3 | | — | | — | | — | | 10 | | New York | | 97.0% |
| Avamere | | 94,246 | | | — | | 5 | | — | | — | | — | | 5 | | Washington/Oregon | | 100.0% |
| Aqua | | 83,684 | | | 2 | | 1 | | 1 | | — | | — | | 4 | | Texas/Ohio | | 97.0% |
| Oak Cottage | | 18,695 | | | — | | — | | 1 | | — | | — | | 1 | | California | | 100.0% |
| Subtotal | | $ | 1,082,887 | | | 41 | | 9 | | 2 | | — | | — | | 52 | | | | |
| | | | | | | | | | | | | | | | | | |
Direct Investments -
Net Lease | | | | | | | | | | | | | | | | | | |
| Arbors | | $ | 103,915 | | | — | | 4 | | — | | — | | — | | 4 | | New York | | 100.0% |
| Total Direct Investments | | $ | 1,186,802 | | | 41 | | 13 | | 2 | | — | | — | | 56 | | | | |
| | | | | | | | | | | | | | | | | | |
| Unconsolidated Investments | | | | | | | | | | | | | | | | | | |
Trilogy(3) | | $ | 124,670 | | | — | | — | | — | | — | | 123 | | 123 | | 4 U.S. States | | 23.4% |
| Espresso | | 3,075 | | | — | | — | | | | 23 | | — | | 23 | | Ohio/Michigan | | 36.7% |
Solstice(4) | | 281 | | | — | | — | | — | | — | | — | | — | | | | 20.0% |
| Total Unconsolidated Investments | | $ | 128,026 | | | — | | — | | — | | 23 | | 123 | | 146 | | | | |
| | | | | | | | | | | | | | | | | | |
| Total Investments | | $ | 1,314,828 | | | 41 | | 13 | | 2 | | 23 | | 123 | | 202 | | | | |
(1)Classification based on predominant services provided, but may include other services.
(2)For direct investments, amount represents operating real estate, before accumulated depreciation as presented in our consolidated financial statements as of September 30, 2023. For unconsolidated investments, amount represents the carrying value of our investments in unconsolidated ventures as presented in our consolidated financial statements as of September 30, 2023. For additional information, refer to “Note 3, Operating Real Estate” and “Note 4, Investments in Unconsolidated Ventures” of Part I, Item 1. “Financial Statements.”
(3)Property count includes properties owned and leased by the joint venture and excludes its institutional pharmacy and therapy businesses.
(4)Represents our investment in Solstice Senior Living, LLC, or Solstice, the manager of the Winterfell portfolio. Solstice is a joint venture between affiliates of Integral Senior Living, LLC, or ISL, a management company of ILF, ALF and MCF founded in 2000, which owns 80.0%, and us, who owns 20.0%.
•Medical Office Buildings. MOBs are typically either single-tenantThe following presents the properties associated with a specialty group or multi-tenant properties leased to several unrelated medical practices. Tenants include physicians, dentists, psychologists, therapistsof our direct and other healthcare providers, who require space devoted to patient examinationunconsolidated investments by property type and treatment, diagnostic imaging, outpatient surgery and other outpatient services. MOBs are similar to commercial office buildings, although they require greater plumbing, electrical and mechanical systems to accommodate physicians’ requirements such as sinks in every room, brighter lights and specialized medical equipment.
•Hospitals. Services provided by operators and tenants in hospitals are paid for by private sources, third-party payers (e.g., insurance and Health Maintenance Organizations), or through the Medicare and Medicaid programs. Our hospital properties typically will include acute care, long-term acute care, specialty and rehabilitation hospitals and generally are leased to operators under triple-net lease structures.
Direct Investments - Operating
For our operating properties, we enter into management agreements that generally provide for the payment of a fee to a manager, typically 4-5% of gross revenues with the potential for certain incentive compensation, and have direct exposure to the revenues and operating expenses of a property. As a result, our operating properties allow us to participate in the risks and rewards of the operations of healthcare facilities.
Direct Investments - Net Lease
For our net lease properties, we enter into net leases that generally provide for fixed rental payments, subject to periodic increasesgeographic location based on certain percentages or the consumer price index, and obligate the operator to pay all property-related expenses, including maintenance, utilities, repairs, taxes, insurance and capital expenditures.
Our remaining four net lease properties are leased and operated by Arcadia Management with a lease term that expires in August 2029. However, the operator has failed to remit contractual rent and comply with other contractual termsour proportionate share of its lease agreements, which resulted in defaults under the operator’s leasescost as of September 30, 2022.2023:
Operators and Managers | | | | | | | | |
Real Estate Equity by Property Type(1) | | Real Estate Equity by Geographic Location |
| | |
(1)Classification based on predominant services provided, but may include other services.
The following table presents the operators and managers of our direct investments (dollars in thousands):
| | | As of September 30, 2022 | | Nine Months Ended September 30, 2022 | | As of September 30, 2023 | | Nine Months Ended September 30, 2023 |
| Operator / Manager | Operator / Manager | | Properties Under Management | | Units Under Management(1) | | Property and Other Revenues(2) | | % of Total Property and Other Revenues | Operator / Manager | | Properties Under Management | | Units Under Management(1) | | Property and Other Revenues(2) | | % of Total Property and Other Revenues |
Solstice Senior Living(3) | Solstice Senior Living(3) | | 32 | | | 4,000 | | | $ | 82,607 | | | 60.5 | % | Solstice Senior Living(3) | | 32 | | | 3,969 | | | $ | 94,469 | | | 61.2 | % |
| Watermark Retirement Communities | Watermark Retirement Communities | | 14 | | | 1,753 | | | 33,770 | | | 24.8 | % | Watermark Retirement Communities | | 14 | | | 1,782 | | | 35,967 | | | 23.2 | % |
| Avamere Health Services | Avamere Health Services | | 5 | | | 453 | | | 14,764 | | | 10.8 | % | Avamere Health Services | | 5 | | | 453 | | | 16,266 | | | 10.5 | % |
| Integral Senior Living | Integral Senior Living | | 1 | | | 44 | | | 3,628 | | | 2.7 | % | Integral Senior Living | | 1 | | | 40 | | | 3,672 | | | 2.4 | % |
Arcadia Management(4) | Arcadia Management(4) | | 4 | | | 572 | | | 1,220 | | | 0.9 | % | Arcadia Management(4) | | 4 | | | 572 | | | 1,178 | | | 0.8 | % |
Other(5) | Other(5) | | — | | | — | | | 456 | | | 0.3 | % | Other(5) | | — | | | — | | | 2,893 | | | 1.9 | % |
| Total | Total | | 56 | | | 6,822 | | | $ | 136,445 | | | 100.0 | % | Total | | 56 | | | 6,816 | | | $ | 154,445 | | | 100.0 | % |
(1)Represents rooms for ALFs, and ILFs and beds for MCFs, and SNFs, based on predominant type.
(2)Includes rental income received from our net lease properties as well as rental income, ancillary service fees and other related revenue earned from ILF residents and resident fee income derived from our ALFs and MCFs, which includes resident room and care charges, ancillary fees and other resident service charges.
(3)Solstice is a joint venture of which affiliates of ISL own 80%.
(4)During the nine months ended September 30, 2022,2023, we recorded rental income to the extent rental payments were received.
(5)Consists primarily of interest income earned on corporate-level cash accounts.and cash equivalents.
Direct Investments - Operating
We generate revenues from resident fees and rental income through our operating properties. Resident fee income is recorded by our ALFs and MCFs when services are rendered and includes resident room and care charges and other resident charges, and rental income is generated from our ILFs.
Our operating properties allow us to participate in the risks and rewards of the operations of the facilities as compared to receiving only contractual rent under a net lease. We engage independent managers to operate these facilities pursuant to management agreements, including procuring supplies, hiring and training all employees, entering into all third-party contracts for the benefit of the property, including resident/patient agreements, complying with laws and regulations, including but not limited to healthcare laws, and providing resident care and services, in exchange for a management fee. As a result, we must rely on our managers’ personnel, expertise, technical resources and information systems, risk management processes, proprietary information, good faith and judgment to manage our operating properties efficiently and effectively. We also rely on our managers to set appropriate resident fees, to provide accurate property-level financial results in a timely manner and otherwise
operate our seniors housing facilities in compliance with the terms of our management agreements and all applicable laws and regulations.
Our management agreements generally provide for monthly management fees which are calculated based on various performance measures, including revenue, net operating income and other objective financial metrics. We are also required to reimburse our managers for expenses incurred in the operation of the properties, as well as to indemnify our managers in connection with potential claims and liabilities arising out of the operation of the properties. Our management agreements are terminable after a stated term with certain renewal rights, though we have the ability to terminate earlier upon certain events with or without the payment of a fee.
Watermark Retirement Communities and Solstice, together with their affiliates, manage substantially all of our operating properties. As a result, we are dependent uponof September 30, 2023, Watermark and Solstice or their personnel, expertise, technical resourcesrespective affiliates collectively managed 46 of our seniors housing facilities pursuant to management agreements. For the nine months ended September 30, 2023, properties managed by Watermark and information systems, proprietary information, good faithSolstice represented 23.2% and judgment to manage61.2% of our properties efficientlytotal property and effectively.other revenues, respectively, and 19.6% and 62.1% of our operating real estate, respectively. Through our 20.0% ownership of Solstice, we are entitled to certain rights and minority protections. As Solstice is a joint venture formed exclusively to operate the Winterfell portfolio, Solstice has generated, and may continue to generate, operating losses if declines in occupancy and operating revenues at our Winterfell portfolio continue.
Unconsolidated Investments
The following table presents a summary of the terms of the Watermark and Solstice management agreements:
| | | | | | | | | | | | | | | | | | | | | | | | | | |
| Manager | | Portfolio | | Properties | | Expiration Date | | Management Fees |
| Solstice Senior Living | | Winterfell | | 32 | | | October 2025 | | •5% of monthly gross revenues, subject to certain exclusions •7% of actual costs of certain capital projects •Additional fees if net operating income exceeds annual target •Additional fees if net operating income long-term growth is achieved |
Watermark Retirement Communities(1) | | Aqua | | 2 | | | December 2023 | | •5% of monthly gross revenues, subject to certain exclusions •Eligible for promote in connection with disposition |
| Aqua | | 2 | | | February 2024 | |
| Rochester | | 10 | | | August 2024 | |
| | | | | | | | |
| | | | | | | | |
(1)Affiliates of Watermark also own a 3% non-controlling interest in the Rochester and Aqua portfolios, which may impact various rights and economics under the management agreements.
Direct Investments - Net Lease
We generate revenues from rental income from net leases to operators through our unconsolidated investments (dollarsnet lease properties. A net lease will typically provide for fixed rental payments, subject to periodic increases based on certain percentages or the consumer price index, and obligate the operator to pay all property-related expenses, including maintenance, utilities, repairs, taxes, insurance and capital expenditures.
As of September 30, 2023, we had four ALF properties operated by Arcadia Management under net leases. These leases obligate Arcadia to pay a fixed rental amount and pay all property-level expenses, with a lease term that expires in thousands):August 2029. However, Arcadia has been unable to satisfy its obligations under its leases since February 2021, and instead remits rent and pays property-level expenses based on its available cash. On March 27, 2023, we entered into the Forbearance Agreement, with Arcadia, pursuant to which we are entitled to receive all cash flow in excess of permitted expenses, and are required to fund any operating deficits, through 2025, subject to the terms and conditions thereof. As a result, we participate in the risks and rewards of this portfolio similar to our operating properties. We also agreed to make available funds for capital improvements in order to stabilize and drive improved performance in this portfolio. If Arcadia performs under the Forbearance Agreement, it will be entitled to forgiveness of accrued and unpaid rent during the forbearance period and a potential incentive fee tied to disposition of the portfolio above a certain value.
| | | | | | | | | | | | | | | | | | | | | | | | | | | | | | | | | | | | | | | | | | | | | | | | | | | | | | | | | | | | | | |
| | | | | | | | | | | | Properties as of September 30, 2022(1) |
| Portfolio | | Partner | | Acquisition Date | | Ownership | | AUM(2) | | Equity Investment(3) | | Seniors Housing Facilities | | MOB | | SNF | | Hospitals | | Total |
| Trilogy | | American Healthcare REIT / Management Team of Trilogy Investors, LLC | | Dec-2015 | | 23.2 | % | | $ | 440,942 | | | 189,032 | | | 23 | | | — | | | 75 | | | — | | | 98 | |
Diversified US/UK (4) | | NRF and Partner | | Dec-2014 | | 14.3 | % | | 261,186 | | | $ | 243,544 | | | 92 | | | — | | | 39 | | | 7 | | | 138 | |
| Eclipse | | NRF and Partner/
Formation Capital, LLC | | May-2014 | | 5.6 | % | | 37,291 | | | 23,400 | | | 42 | | | — | | | 9 | | | — | | | 51 | |
Espresso(5) | | Formation Capital, LLC/Safanad Management Limited | | Jul-2015 | | 36.7 | % | | — | | | 55,146 | | | — | | | — | | | — | | | — | | | — | |
| Subtotal | | | | | | | | $ | 739,419 | | | $ | 511,122 | | | 157 | | | — | | | 123 | | | 7 | | | 287 | |
| Solstice | | | | Jul-2017 | | 20.0 | % | | — | | | 402 | | | — | | | — | | | — | | | — | | | — | |
| Total | | | | | | | | $ | 739,419 | | | $ | 511,524 | | | 157 | | | — | | | 123 | | | 7 | | | 287 | |
(1)Excludes properties classified as heldFor investments accounted for sale.
(2)Representsunder the equity method, we report our proportionate shareinterest of assetsrevenues and expenses from our unconsolidated joint ventures through equity in earnings (losses) of unconsolidated ventures on our consolidated statements of operations. For investments accounted for under management basedthe fair value option method, we will record any changes to its investment’s fair value in gain (loss) on cost, which includes purchase price allocations related to net intangibles, deferred costs,investments and other assets, if any, and adjusted for subsequent capital expenditures. Does not include costin the consolidated statements of properties held for sale.
(3)Represents initial and subsequent contributions to the underlying joint venture through September 30, 2022.
(4)The joint venture classified the 106 properties within the MOB portfolio and two hospitals as held for sale asoperations. As of September 30, 2022.
(5)As a result of the joint venture pursuing dispositions of its various sub-portfolios, the remaining 62 properties2023, our unconsolidated investment portfolios are excluded from the table as of September 30, 2022. Refer to “—Recent Developments” for additional information on distributions from portfolio sales.
•Diversified US/UK. Portfolio of SNFs, ALFs, CCRCs and hospitals across the United States and care homes in the United Kingdom. The Sponsor and other minority partners own the remaining 85.7% of this portfolio.follows:
•Trilogy. Portfolio of predominantly SNFsIntegrated Senior Health Campuses located in the Midwest and operated pursuant to management agreements with Trilogy Health Services, as well asServices. The portfolio includes ancillary services businesses, including a therapy business and a pharmacy business. American Healthcare REIT, Inc., or AHR and management of Trilogy own the remaining 76.8%76.6% of this portfolio.
•Eclipse. Portfolio of SNFs and ALFs leased to, or managed by, a variety of different operators/managers across the United States. The Sponsor and other minority partners and Formation Capital, LLC, or Formation, own 86.4% and 8.0% of this portfolio, respectively.
•Espresso. PortfolioThe joint venture is in the process ofpredominantly completing the second and final sale of its remaining net lease portfolio consisting of 23 SNFs located in the MidwestOhio and organized in sub-portfolios under net leases.Michigan. An affiliate of Formation acts as the general partner and manager of this investment. Formation and Safanad Management Limited own the remaining 63.3% of this portfolio.
•Solstice. Operator platform joint venture established to manage the operations of the Winterfell portfolio. An affiliate of ISL owns the remaining 80.0%.
Our Strategy
Our primary objective isIn connection with the Sale of Minority Interests, we sold our minority, non-controlling interests in the Diversified US/UK portfolio and Eclipse portfolios. Refer to maximize value“—Transaction and generate liquidityFinancing Activities” for shareholders. Although our short-term strategy may continue to be impacted by inflation, rising interest rates and other economic industry conditions, the key elements of our strategy include:
•Grow the Operating Income Generated by Our Portfolio. Through active portfolio management, we will continue to review and implement operating strategies and initiatives in order to enhance the performance of our existing investment portfolio.
•Deploy Strategic Capital Expenditures. We will continue to invest capital into our operating portfolio in order to maintain market position, functional and operating standards, and provide an optimal mix of services and enhance the overall value of our assets.
•Pursue Dispositions and Opportunities for Asset Repositioning and Other Strategic Initiatives to Maximize Value. We will actively pursue dispositions of assets and portfolios where we believe the disposition will achieve a desired return and generate value for shareholders. Additionally, we will continue to assess the need for strategic repositioning or sale
of assets, joint ventures, operators and markets to position our portfolio for optimal performance. We will also opportunistically explore other strategic initiatives to create value for shareholders.additional information.
Portfolio Management
Since our inception through October 21, 2022, we were externally managed by the Advisor, with the Advisor responsible for managing our operations, subject to the supervision of our board of directors, pursuant to an advisory agreement. On October 21, 2022, we completed the Internalization and became a self-managed REIT, with an internal asset management team. The portfolio management process for our investments includes oversight by our executive and asset management team,teams, regular management meetings and an operating results review process. These processes are designed to evaluate and proactively identify asset-specific issues and trends on a portfolio-wide, sub-portfolio or asset type basis. The teams work in conjunction with our managers and operators to create tailored action plans to address issues identified.
Our executive and asset management teamteams are experienced and use many methods to actively manage our investments to enhance or preserve our income, value and capital and mitigate risk. Our asset management team seeksteams seek to identify opportunities for our investments that may involve replacing converting or renovating facilities in our portfolio which, in turn, would allow us to provide optimal mix of servicesimprove occupancy and resident rates and enhance the overall value of our assets. To manage risk, our asset management team engagesteams engage in frequent review and dialogue with operators/managers/borrowers/third party advisors and periodic inspections of our owned properties and collateral.properties. In addition, our asset management team considersteams consider the impact of regulatory changes on the performance of our portfolio.
Our asset management teamteams will continue to monitor the performance of, and actively manage, all of our investments. However, there can be no assurance that our investments will continue to perform in accordance with the contractual terms of the governing documents or underwriting and we may, in the future, record impairment, as appropriate, if required.
Outlook and Recent Trends
The healthcare industry, which includes ILFs, ALFs, MCFs, CCRCs, SNFs, MOBs and hospitals, continues to be impacted by inflation, rising interest rates and other economic market conditions. While the healthcare industry continues to experience occupancy recovery, operating margins will continue to be impacted by cost inflation, labor pressures, additional staffing needs and related cost burdens. The healthcare industry’s operational and financial recovery will depend on a variety of factors, which may differ considerably across regions, fluctuate over time and are highly uncertain.
As a result of overall increase in resident demand, improving consumer sentiment and easing restrictions on visitation and admissions, the seniors housing industry occupancy average rose to 82.2% during the third quarter of 2022 from 81.4% in the second quarter of 2022. In addition, annual inventory growth decreased to 1.4% during the third quarter of 2022, while construction versus inventory ratio of 5.0% remained elevated in the third quarter of 2022 (source: The National Investment Centers for Seniors Housing & Care, or NIC).
Seniors Housing
Supply growth, which has outpaced demand over the past several years, has challenged the seniors housing industry. New inventory, coupled with the average move-in age of seniors housing residents increasing over time, has resulted in declining occupancy for the industry on average. Further, to remain competitive with the new supply, owners and operators of older facilities have increased capital expenditure spending, which in turn has negatively affected cash flow. While off its peak of 7.7% in the fourth quarter of 2017, seniors housing under construction as a share of inventory was 5.0% in the third quarter of 2022 (source: NIC). It is expected that, as demographics and demand continue to increase long-term, supply growth will follow.
While increased supply has resulted in competitive pressures that have limited rent growth over the past several years for the senior housing industry, during the third quarter of 2022, market rent growth averaged 4.4% (source: NIC) as a result of increased demand. However, a tight labor market and competition to attract quality staff has resulted in increased wages and personnel costs, resulting in lower margins. The COVID-19 pandemic has further exacerbated operating expense growth, with increased staffing needs and personal protective equipment requirements and wage and benefits increases may continue to impact the industry’s margins in the future, as labor represents approximately 60% of the seniors housing industry’s operating expenses (source: Green Street).
Skilled Nursing
While generally impacted by the same conditions as the seniors housing industry, SNF operators are currently facing various operational, reimbursement, legal and regulatory challenges. Increased wages and labor costs, narrowing of referral networks, shorter lengths of stay, staffing shortages, expenses associated with inspections, enforcement proceedings and legal actions related to professional and general liability claims have contributed to compressed margins and declines in cash flow.
SNF operators receive a majority of their revenues from governmental payors, primarily Medicare and Medicaid. With a dependence on government reimbursement as the primary source of their revenues, SNF operators are also subject to intensified efforts to impose pricing pressures and more stringent cost controls, through value-based payments, managed care and similar programs, which could result in lower daily reimbursement rates, lower lease coverage, decreased occupancy and declining operating margins, liquidity and financial conditions.
Regulatory initiatives announced in 2022 and aimed at improving safety and quality of nursing home care could further increase the cost burdens for our SNF operators and expose them to financial penalties. The Biden Administration announced its focus on establishing a minimum nursing home staffing requirement, reducing resident room crowding and reinforcing safeguards against unnecessary medications and treatments. These reforms might result in increased government inspections, financial penalties and other enforcement sanctions against facilities not meeting the set standards.expectations.
Critical Accounting Policies and Estimates
Our consolidated financial statements are prepared in accordance with accounting principles generally accepted in the United States, or U.S. GAAP, which requires the use of estimates and assumptions that involve the exercise of judgment and that affect the reported amounts of assets and liabilities at the date of the consolidated financial statements and the reported amounts of revenues and expenses during the reporting period.
Certain accounting policies are considered to be critical accounting policies. Critical accounting policies are those that are most important to the portrayal of our financial condition and results of operations and require management’s subjective and complex judgments, and for which the impact of changes in estimates and assumptions could have a material effect on our financial statements. We believe that all of the decisions and assessments upon which our financial statements are based were reasonable at the time made, based upon information available to us at that time.
For a summary of our accounting policies, refer to Note 2, “Summary of Significant Accounting Policies” in our accompanying consolidated financial statements included in Part I, Item 1. “Financial Statements.”
We believe impairment to be a critical accounting estimate based on the nature of our operations and/or require significant management judgment and assumptions. Our investments are reviewed on a quarterly basis, or more frequently as necessary, to assess whether there are any indicators that the value of our investments may be impaired or that carrying value may not be recoverable. In conducting these reviews, we consider macroeconomic factors, including healthcare sector conditions, together with asset and market specific circumstance,circumstances, among other factors. To the extent an impairment has occurred, the loss will be measured as compared to the carrying amount of the investment. Fair values can be estimated based upon the income capitalization approach, using net operating income for each property and applying indicative capitalization and discount rates or
sales comparison approach, using what other purchasers and sellers in the market have agreed to as price for comparable properties.
Impairment
During the nine months ended September 30, 2022, we recorded impairment losses on our operating real estate totaling $31.5 million. We recorded impairment losses of $18.5 million, $8.5 million and $3.9 million for facilities in our Arbors, Winterfell and Rochester portfolios, respectively, as a result of declining operating margins and lower projected future cash flows. In addition, we recorded impairment losses totaling $0.6 million for property damage sustained by facilities in our Winterfell portfolio.
Accumulated impairment losses for operating real estate that we continue to hold as of September 30, 2022 totaled $181.2 million. Refer to our Annual Report on Form 10-K for the fiscal year ended December 31, 2021 for additional information regarding impairment recorded in prior years.
During the nine months ended September 30, 2022, we did not impair any of our investments in unconsolidated ventures, however, our unconsolidated ventures have recorded impairments and reserves on properties in their respective portfolios, which have been recognized through our equity in earnings (losses), of which our proportionate share was de minimis.
At this time, it is difficult to assess and estimate the continuing impactlasting effects of the COVID-19 pandemic, inflation, rising interest rates, risk of recession and other economic conditions with any meaningful precision.conditions. As the future impact will depend on many factors beyond our control and knowledge, the resulting effect on impairment of our operating real estate and investments in unconsolidated ventures may materially differ from our current expectations and further impairment charges may be recorded in the future.
Direct Operating Investments
During the nine months ended September 30, 2023, we recorded impairment losses on our operating real estate totaling $38.7 million, including impairment losses of $38.6 million for five facilities within the Rochester portfolio as a result of shortened hold period assumptions due to the facilities defaulting on their loan payments in July 2023. On October 30, 2023, the properties underlying the Rochester Sub-Portfolio Loan were placed into a receivership. The receiver now has effective control of the properties and we are working with the lender and the receiver to facilitate an orderly transition of the operations, and eventually ownership, of the properties. Refer to “—Transaction and Financing Activities” for additional discussion. Additionally, we recorded impairment losses totaling $0.1 million for a land parcel within the Rochester Portfolio as a result of lower estimated market value.
Accumulated impairment losses totaled $220.2 million for operating real estate that we continue to hold as of September 30, 2023. Refer to our Annual Report on Form 10-K for the fiscal year ended December 31, 2022 and 2021 for additional information regarding impairment recorded in prior years.
Unconsolidated Investments
During the nine months ended September 30, 2023, we recorded an impairment on our investment in the Espresso joint venture totaling $4.7 million, which reduced the carrying value of our investment to $3.1 million. Our assessment for the recoverability of our investment took into consideration the joint venture’s remaining assets and estimated future cash distributions, less transaction and wind down costs. Upon impairing our investment, we elected the fair value option method to account for our investment in the Espresso joint venture on June 30, 2023.
The joint ventures underlying our unconsolidated ventures assess and record impairment and reserves on their respective real estate portfolios, goodwill, and other assets, and we recognize our proportionate share through equity in earnings (losses). In May 2023, prior to the Sale of Minority Interests, the underlying Diversified US/UK joint venture recorded impairment losses on its UK Portfolio, due to, among other things, an extended period contemplated for the UK Portfolio to reach stabilization. Our proportionate share of the impairment losses recorded by the Diversified US/UK joint venture totaled $11.4 million.
Results of Operations
Comparison of the Three Months Ended September 30, 20222023 to September 30, 20212022 (dollars in thousands):
| | | Three Months Ended September 30, | | Increase (Decrease) | | Three Months Ended September 30, | | Increase (Decrease) |
| | 2022 | | 2021 | | Amount | | % | | 2023 | | 2022 | | Amount | | % |
| Property and other revenues | Property and other revenues | | | | | | | | | Property and other revenues | | | | | | | | |
| Resident fee income | Resident fee income | | $ | 11,274 | | | $ | 27,370 | | | $ | (16,096) | | | (58.8) | % | Resident fee income | | $ | 11,966 | | | $ | 11,274 | | | $ | 692 | | | 6.1 | % |
| Rental income | Rental income | | 36,165 | | | 37,006 | | | (841) | | | (2.3) | % | Rental income | | 40,330 | | | 36,165 | | | 4,165 | | | 11.5 | % |
| Other revenue | Other revenue | | 300 | | | 38 | | | 262 | | | 689.5 | % | Other revenue | | 1,078 | | | 300 | | | 778 | | | 259.3 | % |
| Total property and other revenues | Total property and other revenues | | 47,739 | | | 64,414 | | | (16,675) | | | (25.9) | % | Total property and other revenues | | 53,374 | | | 47,739 | | | 5,635 | | | 11.8 | % |
| Interest income | | |
| Interest income on debt investments | | — | | | 1,067 | | | (1,067) | | | (100.0) | % | |
| | Expenses | Expenses | | Expenses | |
| Property operating expenses | Property operating expenses | | 35,134 | | | 45,784 | | | (10,650) | | | (23.3) | % | Property operating expenses | | 36,890 | | | 35,134 | | | 1,756 | | | 5.0 | % |
| Interest expense | Interest expense | | 11,014 | | | 15,780 | | | (4,766) | | | (30.2) | % | Interest expense | | 14,250 | | | 11,014 | | | 3,236 | | | 29.4 | % |
| Transaction costs | Transaction costs | | 857 | | | — | | | 857 | | | NA | Transaction costs | | 358 | | | 857 | | | (499) | | | (58.2) | % |
| Asset management fees - related party | Asset management fees - related party | | 2,428 | | | 2,769 | | | (341) | | | (12.3) | % | Asset management fees - related party | | — | | | 2,428 | | | (2,428) | | | (100.0) | % |
| General and administrative expenses | General and administrative expenses | | 2,859 | | | 2,432 | | | 427 | | | 17.6 | % | General and administrative expenses | | 2,921 | | | 2,859 | | | 62 | | | 2.2 | % |
| Depreciation and amortization | Depreciation and amortization | | 9,642 | | | 13,828 | | | (4,186) | | | (30.3) | % | Depreciation and amortization | | 9,848 | | | 9,642 | | | 206 | | | 2.1 | % |
| Impairment loss | Impairment loss | | 18,500 | | | 4,600 | | | 13,900 | | | 302.2 | % | Impairment loss | | — | | | 18,500 | | | (18,500) | | | (100.0) | % |
| Total expenses | Total expenses | | 80,434 | | | 85,193 | | | (4,759) | | | (5.6) | % | Total expenses | | 64,267 | | | 80,434 | | | (16,167) | | | (20.1) | % |
| Other income, net | | — | | | — | | | — | | | NA | |
| Realized gain (loss) on investments and other | | 325 | | | 75 | | | 250 | | | 333.3 | % | |
| | Gain (loss) on investments and other | | Gain (loss) on investments and other | | (347) | | | 325 | | | (672) | | | (206.8) | % |
| Equity in earnings (losses) of unconsolidated ventures | Equity in earnings (losses) of unconsolidated ventures | | 2,872 | | | 7,943 | | | (5,071) | | | (63.8) | % | Equity in earnings (losses) of unconsolidated ventures | | (127) | | | 2,872 | | | (2,999) | | | (104.4) | % |
| Income tax expense | Income tax expense | | (15) | | | (59) | | | 44 | | | (74.6) | % | Income tax expense | | (17) | | | (15) | | | (2) | | | 13.3 | % |
| Net income (loss) | Net income (loss) | | $ | (29,513) | | | $ | (11,753) | | | $ | (17,760) | | | 151.1 | % | Net income (loss) | | $ | (11,384) | | | $ | (29,513) | | | $ | 18,129 | | | (61.4) | % |
Resident Fee IncomeTotal Property and Other Revenues
The following table presents resident fee incometotal property and other revenues generated by our direct investments (dollars in thousands):
| | | | | | | | | | | | | | | | | | | | | | | | | | |
| | Three Months Ended September 30, | | Increase (Decrease) |
| | 2022 | | 2021 | | Amount | | % |
| Same store ALF/MCF properties (excludes properties sold) | | $ | 11,274 | | | $ | 10,302 | | | $ | 972 | | | 9.4 | % |
| Properties sold | | — | | | 17,068 | | | (17,068) | | | (100.0) | % |
| Total resident fee income | | $ | 11,274 | | | $ | 27,370 | | | $ | (16,096) | | | (59) | % |
| | | | | | | | |
| | | | | | | | |
| | | | | | | | |
| | | | | | | | | | | | | | | | | | | | | | | | | | |
| | Three Months Ended September 30, | | Increase (Decrease) |
| | 2023 | | 2022 | | Amount | | % |
| ALF/MCF properties | | $ | 11,966 | | | $ | 11,274 | | | $ | 692 | | | 6.1 | % |
| ILF properties | | 34,644 | | | 30,855 | | | 3,789 | | | 12.3 | % |
| Net lease properties | | 837 | | | 724 | | | 113 | | | 15.6 | % |
| Rochester Sub-Portfolio (in loan default) | | 4,849 | | | 4,586 | | | 263 | | | 5.7 | % |
| Other revenue | | 1,078 | | | 300 | | | 778 | | | 259.3 | % |
| Total property and other revenues | | $ | 53,374 | | | $ | 47,739 | | | $ | 5,635 | | | 11.8 | % |
Resident fee income decreased $16.1Overall, total property and other revenues increased $5.6 million as a result of property sales during 2021. The Watermark Fountains portfolio sold in December 2021, the Kansas City portfolio in June 2021 and a property within the Aqua portfolio sold in March 2021.
Excluding properties sold, resident fee income increased by $1.0 million primarily as a result of increases in average occupancy rates at our ALFs.
Rental Income
The following table presents rental incomethree months ended September 30, 2023. Revenues generated by our direct investments (dollars in thousands):
| | | | | | | | | | | | | | | | | | | | | | | | | | |
| | Three Months Ended September 30, | | Increase (Decrease) |
| | 2022 | | 2021 | | Amount | | % |
| Same store ILF properties (excludes properties sold) | | $ | 35,441 | | | $ | 30,994 | | | $ | 4,447 | | | 14.3 | % |
| Same store net lease properties (excludes properties sold) | | | | | | | | |
| Rental payments | | 724 | | | 1,122 | | | (398) | | | (35.5) | % |
| | | | | | | | |
| Properties sold | | — | | | 4,890 | | | (4,890) | | | (100.0) | % |
| Total rental income | | $ | 36,165 | | | $ | 37,006 | | | $ | (841) | | | (2.3) | % |
Rental income decreased by $0.8 million primarily as a result of the sale of the Fountains net lease portfolio in December 2021.
On a same store basis, rental income at our ILFsoperating properties increased by $4.4 million as a result of improved occupancy while rental payments from our net lease properties decreased due toand higher market rates for new residents and in-place rates for existing residents. Other revenue consists of interest earned on cash and cash equivalents, which increased during the operator of our Arbors net lease portfolio remitting less contractual rent as compared to the three months endedSeptember 30, 2021.
Interest Income on Debt Investments
There was no interest income on debt investments recognized during the three months ended September 30, 20222023 as a result of receiving the full repayment of outstanding principal on our mezzanine loan debt investment in August 2021.higher market interest rates.
Property Operating Expenses
The following table presents property operating expenses incurred by our direct investments (dollars in thousands):
| | | Three Months Ended September 30, | | Increase (Decrease) | | Three Months Ended September 30, | | Increase (Decrease) |
| | | 2022 | | 2021 | | Amount | | % | | | 2023 | | 2022 | | Amount | | % |
| Same store (excludes properties sold and COVID-19 related expenses) | | | | | | | | | |
| ALF/MCF properties | ALF/MCF properties | | $ | 9,459 | | | $ | 7,718 | | | $ | 1,741 | | | 22.6 | % | ALF/MCF properties | | $ | 9,387 | | | $ | 9,069 | | | $ | 318 | | | 3.5 | % |
| ILF properties | ILF properties | | 25,360 | | | 23,528 | | | 1,832 | | | 7.8 | % | ILF properties | | 23,504 | | | 21,790 | | | 1,714 | | | 7.9 | % |
| | COVID-19 related expenses | | 107 | | | 359 | | | (252) | | | (70.2) | % | |
| Properties sold | | 208 | | | 14,179 | | | (13,971) | | | (98.5) | % | |
| Rochester Sub-Portfolio (in loan default) | | Rochester Sub-Portfolio (in loan default) | | 3,999 | | | 4,275 | | | (276) | | | (6.5) | % |
| Total property operating expenses | Total property operating expenses | | $ | 35,134 | | | $ | 45,784 | | | $ | (10,650) | | | (23.3) | % | Total property operating expenses | | $ | 36,890 | | | $ | 35,134 | | | $ | 1,756 | | | 5.0 | % |
Overall, total operating expenses decreased $10.7increased $1.8 million, primarily due to an increase in management fees at our Winterfell portfolio as a result of property sales duringrevenue growth and additional fees for exceeding performance targets per the year ended December 31, 2021.
Excluding properties sold, operating expenses increased $3.3 million primarily as a resultterms of our operators experiencing staffing challenges, which has increased salaries and wages due to additional overtime hours and use of agency and contract labor to fill open positions.the management agreements. In addition, higher occupancy and inflationary pressures drove an increase in overallsignificantly impacted all variable operating costs, specifically utilitiesmost notably wages and foodbenefits, repairs and beveragemaintenance, and insurance costs.
Interest Expense
The following table presents interest expense incurred on our borrowings (dollars in thousands):
| | | Three Months Ended September 30, | | Increase (Decrease) | | Three Months Ended September 30, | | Increase (Decrease) |
| | | 2022 | | 2021 | | Amount | | % | | | 2023 | | 2022 | | Amount | | % |
| Same store (excludes properties sold) | | | | | | | | | |
| ALF/MCF properties | ALF/MCF properties | | $ | 1,526 | | | $ | 1,400 | | | $ | 126 | | | 9.0 | % | ALF/MCF properties | | $ | 1,315 | | | $ | 1,310 | | | $ | 5 | | | 0.4 | % |
| ILF properties | ILF properties | | 8,581 | | | 8,279 | | | 302 | | | 3.6 | % | ILF properties | | 7,482 | | | 7,583 | | | (101) | | | (1.3) | % |
| Net lease properties | Net lease properties | | 907 | | | 930 | | | (23) | | | (2.5) | % | Net lease properties | | 883 | | | 907 | | | (24) | | | (2.6) | % |
| Properties sold | | — | | | 5,066 | | | (5,066) | | | (100.0) | % | |
| Corporate | | — | | | 105 | | | (105) | | | (100.0) | % | |
| Rochester Sub-Portfolio (in loan default) | | Rochester Sub-Portfolio (in loan default) | | 4,570 | | | 1,214 | | | 3,356 | | | 276.4 | % |
| | Total interest expense | Total interest expense | | $ | 11,014 | | | $ | 15,780 | | | $ | (4,766) | | | (30.2) | % | Total interest expense | | $ | 14,250 | | | $ | 11,014 | | | $ | 3,236 | | | 29.4 | % |
Interest expense decreased $4.8increased $3.2 million primarily as a result of the repayment of mortgage notes payable which were collateralized by properties sold during the year ended December 31, 2021 and the repayment of the Sponsor Line, in July 2021.
On a same store basis, while average mortgage notes principal balances have decreased as compared to September 30, 2021 due to continued principal amortization,higher interest expense on our floating rate debt has increased as a result of a higher London Interbank Offered Rate, or LIBOR.and default interest and prepayment penalties accrued due to Rochester Sub-Portfolio Loan default and acceleration in July 2023. We do not anticipate remitting payment for debt service obligations due under the Rochester Sub-Portfolio Loan.
Transaction Costs
Transaction costs for the three months ended September 30, 2023 consisted of legal and professional fees incurred for investment activity. Transaction costs for the three months ended September 30, 2022 consisted of legal and professional fees incurred to complete the Internalization.Refer to “—Recent Developments” for additional information on the Internalization.
Asset Management Fees - Related Party
Prior to the termination of the advisory agreement, the Advisor received a monthly asset management fee equal to one-twelfth of 1.5% of our most recently published aggregate estimated net asset value, adjusted for any special distribution declared by our board of directors and adjusted for corporate cash balances in excess of $75.0 million. Asset management fees decreased by $0.3 million due to the Special Distribution paid in May 2022 and adjustments for excess corporate cash balances.
& General and Administrative Expenses
The advisory agreement with our Former Advisor was terminated on October 21, 2022. As a result, no asset management fees were incurred during 2023 as compared to $2.4 million incurred during the three months endedSeptember 30, 2022.
Under our new internalized structure, we directly incur and pay all general and administrative expenses, including personnel costs related to our executive officers, which were not allocable under the former advisory agreement. General and administrative expenses increased $0.4were comparable for the three months endedSeptember 30, 2023 and 2022.
Combining asset management fees and general and administrative expenses, $2.4 million primarilyof cost savings were realized under the internalized structure during the three months ended September 30, 2023 as a result of amortizing our directors’ and officers’ insurance premium incurred and reimbursedcompared to the Advisor over the term of the policy, beginning in December 2021.three months endedSeptember 30, 2022.
Depreciation and Amortization
The following table presents depreciation and amortization recognized on our direct investments (dollars in thousands):
| | | Three Months Ended September 30, | | Increase (Decrease) | | Three Months Ended September 30, | | Increase (Decrease) |
| | | 2022 | | 2021 | | Amount | | % | | | 2023 | | 2022 | | Amount | | % |
| Same store (excludes properties sold) | | | | | | | | | |
| ALF/MCF properties | ALF/MCF properties | | $ | 1,770 | | | $ | 1,749 | | | $ | 21 | | | 1.2 | % | ALF/MCF properties | | $ | 1,652 | | | $ | 1,581 | | | $ | 71 | | | 4.5 | % |
| ILF properties | ILF properties | | 7,002 | | | 7,356 | | | (354) | | | (4.8) | % | ILF properties | | 6,439 | | | 5,900 | | | 539 | | | 9.1 | % |
| Net lease properties | Net lease properties | | 870 | | | 861 | | | 9 | | | 1.0 | % | Net lease properties | | 729 | | | 870 | | | (141) | | | (16.2) | % |
| Properties sold | | — | | | 3,862 | | | (3,862) | | | (100.0) | % | |
| Rochester Sub-Portfolio (in loan default) | | Rochester Sub-Portfolio (in loan default) | | 1,028 | | | 1,291 | | | (263) | | | (20.4) | % |
| Total depreciation and amortization | Total depreciation and amortization | | $ | 9,642 | | | $ | 13,828 | | | $ | (4,186) | | | (30.3) | % | Total depreciation and amortization | | $ | 9,848 | | | $ | 9,642 | | | $ | 206 | | | 2.1 | % |
Depreciation and amortization expense decreased $4.2increased $0.2 million primarily as a result of properties soldadditional capital expenditures, primarily at our Winterfell portfolio. The increase was partially offset by lower depreciation for our Rochester Sub-Portfolio due to impairments recognized during the yearthree months ended December 31, 2021.June 30, 2023, which reduced building depreciation expense for the three months ended September 30, 2023.
Impairment Loss
During the three months ended September 30, 2023, we did not record any impairment losses on our investments. During the three months ended September 30, 2022, impairment losses on operating real estate totaled $18.5 million for facilities within theour Arbors net lease portfolio.
During the three months ended September 30, 2021, impairment losses on operating real estate totaled $4.6 million for one independent living facility within the Winterfell portfolio.
Gain (Loss) on Investments and Other
During the three months ended September 30, 2022,2023, we recorded gainslosses on the change in value of our mortgage note payable interest rate caps totaling $0.3 million.
Duringmillion as compared to losses totaling $0.3 million recognized during the three months ended September 30, 2021, we realized gains of $0.1 million for distributions received from the Envoy joint venture that exceeded our carrying value in the investment.2022.
Equity in Earnings (Losses) of Unconsolidated Ventures
The following table presents the results of our unconsolidated ventures (dollars in thousands):
| | | Three Months Ended September 30, | | Three Months Ended September 30, | | Three Months Ended September 30, | |
| | 2022 | | 2021 | | 2022 | | 2021 | | 2022 | | 2021 | | 2022 | | 2021 | | 2023 | | 2022 | | 2023 | | 2022 | | 2023 | | 2022 | |
| Portfolio | Portfolio | | Equity in Earnings (Losses) | | FFO and MFFO adjustments(1) | | Equity in Earnings, after FFO and MFFO adjustments | | Increase (Decrease) | | Cash Distributions | Portfolio | | Equity in Earnings (Losses) | | FFO and MFFO adjustments(1) | | Equity in Earnings, after FFO and MFFO adjustments | | Increase (Decrease) |
| Eclipse | | $ | (344) | | | $ | (194) | | | $ | 309 | | | $ | 273 | | | $ | (35) | | | $ | 79 | | | $ | (114) | | | (144.3) | % | | $ | — | | | $ | 2,898 | | |
| Envoy | | — | | | — | | | — | | | — | | | — | | | — | | | — | | | — | % | | — | | | 78 | | |
| Diversified US/UK | | (2,611) | | | (330) | | | 3,125 | | | 3,724 | | | 514 | | | 3,394 | | | (2,880) | | | (84.9) | % | | 358 | | | 966 | | |
| Trilogy | | Trilogy | | $ | (146) | | | $ | 6,052 | | | $ | 4,460 | | | $ | (753) | | | $ | 4,314 | | | $ | 5,299 | | | $ | (985) | | | (18.6) | % |
| Espresso | Espresso | | (242) | | | 7,693 | | | 1,617 | | | (5,370) | | | 1,375 | | | 2,323 | | | (948) | | | (40.8) | % | | 1,375 | | | — | | Espresso | | — | | | (242) | | | — | | | 1,617 | | | — | | | 1,375 | | | (1,375) | | | (100.0) | % |
| Trilogy | | 6,052 | | | 763 | | | (753) | | | 3,663 | | | 5,299 | | | 4,426 | | | 873 | | | 19.7 | % | | 2,300 | | | — | | |
| Solstice | | Solstice | | 19 | | | 17 | | | — | | | — | | | 19 | | | 17 | | | 2 | | | 11.8 | % |
| Subtotal | Subtotal | | $ | 2,855 | | | $ | 7,932 | | | $ | 4,298 | | | $ | 2,290 | | | $ | 7,153 | | | $ | 10,222 | | | $ | (3,069) | | | (30.0) | % | | $ | 4,033 | | | $ | 3,942 | | Subtotal | | (127) | | | 5,827 | | | 4,460 | | | 864 | | | 4,333 | | | 6,691 | | | (2,358) | | | (35.2) | % |
| Solstice | | 17 | | | 11 | | | — | | | 1 | | | 17 | | | 12 | | | 5 | | | 41.7 | % | | — | | | — | | |
| Investments sold | | Investments sold | | — | | | (2,955) | | | — | | | 3,434 | | | — | | | 479 | | | (479) | | | (100.0) | % |
| | Total | Total | | $ | 2,872 | | | $ | 7,943 | | | $ | 4,298 | | | $ | 2,291 | | | $ | 7,170 | | | $ | 10,234 | | | $ | (3,064) | | | (29.9) | % | | $ | 4,033 | | | $ | 3,942 | | Total | | $ | (127) | | | $ | 2,872 | | | $ | 4,460 | | | $ | 4,298 | | | $ | 4,333 | | | $ | 7,170 | | | $ | (2,837) | | | (39.6) | % |
(1)Represents our proportionate share of revenues and expenses excluded from the calculation of FFO and MFFO for unconsolidated investments. Refer to “—Non-GAAP Financial Measures” for additional discussion.
OurExcluding the investments in unconsolidated ventures sold, equity in earnings generated by our unconsolidated investments decreased by $5.1$6.0 millionprimarily due to gains recognized on property sales in the Espresso joint venture during the three months ended September 30, 2021. The decrease was partially offset by the Trilogy joint venture recognizing a gain upon acquiring the remaining ownership interest of an investment portfolio during the three months ended September 30, 2022.
Excluding the investments in unconsolidated ventures sold, equity in earnings, after FFO and MFFO adjustments, decreased $2.4 million. The Espresso joint venture has sold properties, which has resulted in lower rental income recognized and as of June 30, 2023, we elected to account for the Espresso joint venture under the fair value option, resulting in no equity in earnings recorded during the three months ended September 30, 2023. In addition, higher interest expense on floating rate debt in the Trilogy joint venture has offset operational improvements in the joint venture, resulting in lower cash flows generated.
Comparison of the Nine Months Ended September 30, 2023 to September 30, 2022 (dollars in thousands):
| | | | | | | | | | | | | | | | | | | | | | | | | | |
| | Nine Months Ended September 30, | | Increase (Decrease) |
| | 2023 | | 2022 | | Amount | | % |
| Property and other revenues | | | | | | | | |
| Resident fee income | | $ | 35,655 | | | $ | 32,987 | | | $ | 2,668 | | | 8.1 | % |
| Rental income | | 115,897 | | | 103,001 | | | 12,896 | | | 12.5 | % |
| Other revenue | | 2,893 | | | 457 | | | 2,436 | | | 533.0 | % |
| Total property and other revenues | | 154,445 | | | 136,445 | | | 18,000 | | | 13.2 | % |
| | | | | | | | |
| | | | | | | | |
| Expenses | | | | | | | | |
| Property operating expenses | | 106,993 | | | 101,258 | | | 5,735 | | | 5.7 | % |
| Interest expense | | 37,143 | | | 31,877 | | | 5,266 | | | 16.5 | % |
| Transaction costs | | 455 | | | 857 | | | (402) | | | (46.9) | % |
| Asset management fees - related party | | — | | | 7,532 | | | (7,532) | | | (100.0) | % |
| General and administrative expenses | | 10,424 | | | 10,300 | | | 124 | | | 1.2 | % |
| Depreciation and amortization | | 29,305 | | | 29,105 | | | 200 | | | 0.7 | % |
| Impairment loss | | 43,422 | | | 31,502 | | | 11,920 | | | 37.8 | % |
| Total expenses | | 227,742 | | | 212,431 | | | 15,311 | | | 7.2 | % |
| Other income, net | | 202 | | | 77 | | | 125 | | | 162.3 | % |
| Gain (loss) on investments and other | | (4,662) | | | 660 | | | (5,322) | | | (806.4) | % |
| Equity in earnings (losses) of unconsolidated ventures | | (6,595) | | | 39,427 | | | (46,022) | | | (116.7) | % |
| Income tax expense | | (43) | | | (45) | | | 2 | | | (4.4) | % |
| Net income (loss) | | $ | (84,395) | | | $ | (35,867) | | | $ | (48,528) | | | 135.3 | % |
Equity in earnings, after FFOTotal Property and MFFO adjustments, decreased by $3.1 million as a result of lower rental income recognized by the Diversified US/UK and Espresso joint ventures during the three months ended September 30, 2022.
Comparison of the Nine Months Ended September 30, 2022 to September 30, 2021 (dollars in thousands)
| | | | | | | | | | | | | | | | | | | | | | | | | | |
| | Nine Months Ended September 30, | | Increase (Decrease) |
| | 2022 | | 2021 | | Amount | | % |
| Property and other revenues | | | | | | | | |
| Resident fee income | | $ | 32,987 | | | $ | 83,906 | | | $ | (50,919) | | | (60.7) | % |
| Rental income | | 103,001 | | | 101,669 | | | 1,332 | | | 1.3 | % |
| Other revenue | | 457 | | | 80 | | | 377 | | | 471.3 | % |
| Total property and other revenues | | 136,445 | | | 185,655 | | | (49,210) | | | (26.5) | % |
| Interest income | | | | | | | | |
| Interest income on debt investments | | — | | | 4,667 | | | (4,667) | | | (100.0) | % |
| Expenses | | | | | | | | |
| Property operating expenses | | 101,258 | | | 136,503 | | | (35,245) | | | (25.8) | % |
| Interest expense | | 31,877 | | | 47,767 | | | (15,890) | | | (33.3) | % |
| Transaction costs | | 857 | | | 54 | | | 803 | | | 1,487.0 | % |
| Asset management fees - related party | | 7,532 | | | 8,307 | | | (775) | | | (9.3) | % |
| General and administrative expenses | | 10,300 | | | 8,544 | | | 1,756 | | | 20.6 | % |
| Depreciation and amortization | | 29,105 | | | 44,772 | | | (15,667) | | | (35.0) | % |
| Impairment loss | | 31,502 | | | 5,386 | | | 26,116 | | | 484.9 | % |
| Total expenses | | 212,431 | | | 251,333 | | | (38,902) | | | (15.5) | % |
| Other income, net | | 77 | | | 6,892 | | | (6,815) | | | (98.9) | % |
| Realized gain (loss) on investments and other | | 660 | | | 7,479 | | | (6,819) | | | (91.2) | % |
| Equity in earnings (losses) of unconsolidated ventures | | 39,427 | | | 17,819 | | | 21,608 | | | 121.3 | % |
| Income tax expense | | (45) | | | (85) | | | 40 | | | (47.1) | % |
| Net income (loss) | | $ | (35,867) | | | $ | (28,906) | | | $ | (6,961) | | | 24.1 | % |
Resident Fee IncomeOther Revenues
The following table presents resident fee income generated by our direct investmentstotal property and other revenues (dollars in thousands):
| | | | | | | | | | | | | | | | | | | | | | | | | | |
| | Nine Months Ended September 30, | | Increase (Decrease) |
| | 2022 | | 2021 | | Amount | | % |
| Same store ALF/MCF properties (excludes properties sold) | | $ | 32,987 | | | $ | 30,212 | | | $ | 2,775 | | | 9.2 | % |
| Properties sold | | — | | | 53,694 | | | (53,694) | | | (100.0) | % |
| Total resident fee income | | $ | 32,987 | | | $ | 83,906 | | | $ | (50,919) | | | (61) | % |
| | | | | | | | |
| | | | | | | | |
| | | | | | | | |
Resident fee income decreased $50.9 million as a result of property sales during 2021. The Watermark Fountains portfolio sold in December 2021, the Kansas City portfolio in June 2021 and a property within the Aqua portfolio sold in March 2021.
Excluding properties sold, resident fee income increased by $2.8 million primarily as a result of increases in average occupancy and rates at our ALFs.
Rental Income
The following table presents rental income generated by our direct investments (dollars in thousands):
| | | | | | | | | | | | | | | | | | | | | | | | | | |
| | Nine Months Ended September 30, | | Increase (Decrease) |
| | 2022 | | 2021 | | Amount | | % |
| Same store ILF properties (excludes properties sold) | | $ | 101,781 | | | $ | 90,727 | | | $ | 11,054 | | | 12.2 | % |
| Same store net lease properties (excludes properties sold) | | | | | | | | |
| Rental payments | | 1,220 | | | 2,951 | | | (1,731) | | | (58.7) | % |
| Straight-line rental income (loss) | | — | | | (7,350) | | | 7,350 | | | (100.0) | % |
| Properties sold | | — | | | 15,341 | | | (15,341) | | | (100.0) | % |
| Total rental income | | $ | 103,001 | | | $ | 101,669 | | | $ | 1,332 | | | 1.3 | % |
| | | | | | | | | | | | | | | | | | | | | | | | | | |
| | Nine Months Ended September 30, | | Increase (Decrease) |
| | 2023 | | 2022 | | Amount | | % |
| ALF/MCF properties | | $ | 35,655 | | | $ | 32,987 | | | $ | 2,668 | | | 8.1 | % |
| ILF properties | | 100,583 | | | 88,146 | | | 12,437 | | | 14.1 | % |
| Net lease properties | | 1,178 | | | 1,220 | | | (42) | | | (3.4) | % |
| Rochester Sub-Portfolio (in loan default) | | 14,136 | | | 13,635 | | | 501 | | | 3.7 | % |
| Other revenue | | 2,893 | | | 457 | | | 2,436 | | | 533.0 | % |
| Total property and other revenues | | $ | 154,445 | | | $ | 136,445 | | | $ | 18,000 | | | 13.2 | % |
Overall, rental incometotal property and other revenues increased by $1.3$18.0 million as compared toduring the nine months ended September 30, 2021. The increase was partially offset2023. Revenues generated by the loss of revenues fromour operating properties sold in 2021.
Excluding properties sold, rental income increased by $16.7 million primarily as a result of improved occupancy at our ILFsand higher market rates for new residents and in-place rates for existing residents. Other revenue consists of interest earned on cash and cash equivalents, which increased during the nine months ended September 30, 2022 and the write-off of straight-line rent receivables at our Arbors portfolio during 2021.
Interest Income on Debt Investments
There was no interest income on debt investments recognized during the nine months ended September 30, 20222023 as a result of receiving the full repayment of outstanding principal on our mezzanine loan debt investment in August 2021.higher market interest rates.
Property Operating Expenses
The following table presents property operating expenses incurred by our direct investments (dollars in thousands):
| | | | | | | | | | | | | | | | | | | | | | | | | | |
| | Nine Months Ended September 30, | | Increase (Decrease) |
| | 2022 | | 2021 | | Amount | | % |
| Same store (excludes properties sold and COVID-19 related expenses) | | | | | | | | |
| ALF/MCF properties | | $ | 26,525 | | | $ | 22,121 | | | $ | 4,404 | | | 19.9 | % |
| ILF properties | | 74,036 | | | 66,763 | | | 7,273 | | | 10.9 | % |
| Net lease properties | | 35 | | | 25 | | | 10 | | | 40.0 | % |
| COVID-19 related expenses | | 366 | | | 1,920 | | | (1,554) | | | (80.9) | % |
| Properties sold | | 296 | | | 45,674 | | | (45,378) | | | (99.4) | % |
| Total Property operating expenses | | $ | 101,258 | | | $ | 136,503 | | | $ | (35,245) | | | (25.8) | % |
| | | | | | | | | | | | | | | | | | | | | | | | | | |
| | Nine Months Ended September 30, | | Increase (Decrease) |
| | 2023 | | 2022 | | Amount | | % |
| ALF/MCF properties | | $ | 26,920 | | | $ | 24,937 | | | $ | 1,983 | | | 8.0 | % |
| ILF properties | | 67,849 | | | 63,431 | | | 4,418 | | | 7.0 | % |
| Net lease properties | | — | | | 35 | | | (35) | | | (100.0) | % |
| Rochester Sub-Portfolio (in loan default) | | 12,224 | | | 12,855 | | | (631) | | | (4.9) | % |
| Total property operating expenses | | $ | 106,993 | | | $ | 101,258 | | | $ | 5,735 | | | 5.7 | % |
Overall, total operating expenses decreased $35.2increased $5.7 million, primarily as a result of property sales during the year ended December 31, 2021.
Excluding properties sold, operating expenses increased $10.1 million, primarily as a result of our operators experiencing staffing challenges, which has increased salaries and wages due to additional overtime hours and use of agency and contract labor to fill open positions. In addition, higher occupancy and inflationary pressures drove an increase in overallsignificantly impacting all variable operating costs, specificallymost notably wages and benefits, repairs and maintenance, insurance, utilities and food and beverage costs.
revenue growth and additional fees for exceeding performance targets per the terms of the management agreements.Interest Expense
The following table presents interest expense incurred on our borrowings (dollars in thousands):
| | | Nine Months Ended September 30, | | Increase (Decrease) | | Nine Months Ended September 30, | | Increase (Decrease) |
| | | 2022 | | 2021 | | Amount | | % | | | 2023 | | 2022 | | Amount | | % |
| Same store (excludes properties sold) | | | | | | | | | |
| ALF/MCF properties | ALF/MCF properties | | $ | 4,339 | | | $ | 4,169 | | | $ | 170 | | | 4.1 | % | ALF/MCF properties | | $ | 3,937 | | | $ | 3,855 | | | $ | 82 | | | 2.1 | % |
| ILF properties | ILF properties | | 24,830 | | | 24,809 | | | 21 | | | 0.1 | % | ILF properties | | 22,342 | | | 22,603 | | | (261) | | | (1.2) | % |
| Net lease properties | Net lease properties | | 2,708 | | | 2,775 | | | (67) | | | (2.4) | % | Net lease properties | | 2,639 | | | 2,708 | | | (69) | | | (2.5) | % |
| Properties sold | | — | | | 15,273 | | | (15,273) | | | (100.0) | % | |
| Corporate | | — | | | 741 | | | (741) | | | (100.0) | % | |
| Rochester Sub-Portfolio (in loan default) | | Rochester Sub-Portfolio (in loan default) | | 8,225 | | | 2,711 | | | 5,514 | | | 203.4 | % |
| Total interest expense | Total interest expense | | $ | 31,877 | | | $ | 47,767 | | | $ | (15,890) | | | (33.3) | % | Total interest expense | | $ | 37,143 | | | $ | 31,877 | | | $ | 5,266 | | | 16.5 | % |
Interest expense decreased $15.9increased $5.3 million primarily as a result of the repayment of mortgage notes payable which were collateralized by properties sold during the year ended December 31, 2021. Corporate interest expense represents interest resulting from the borrowings under the Sponsor Line, which was repaid in full in July 2021.
On a same store basis, while average mortgage notes principal balances have decreased as compared to September 30, 2021 due to continued principal amortization,higher interest expense on our floating rate debt has increasedand default interest and prepayment penalties accrued due to higher LIBOR.Rochester Sub-Portfolio Loan default and acceleration in July 2023. We do not anticipate remitting payment for debt service obligations due under the Rochester Sub-Portfolio Loan. The increase was partially offset by a decrease in the average mortgage notes principal balances as compared to September 30, 2022 due to continued principal amortization.
Transaction Costs
Transaction costs for the nine months ended September 30, 2023 consisted primarily of legal and professional fees incurred for investment activity and costs incurred in connection with the Internalization and the transition of services and systems previously provided by the Former Advisor.
Transaction costs for the nine months ended September 30, 2022 consisted of legal and professional fees incurred to complete the Internalization.Refer to “—Recent Developments” for additional information on the Internalization.
Asset Management Fees - Related Party
Prior to the termination of the advisory agreement, the Advisor received a monthly asset management fee equal to one-twelfth of 1.5% of our most recently published aggregate estimated net asset value, adjusted for any special distribution declared by our board of directors and adjusted for corporate cash balances in excess of $75.0 million. Asset management fees decreased by $0.8 million due to the Special Distribution paid in May 2022 and adjustments for excess corporate cash balances.
& General and Administrative Expenses
The advisory agreement with our Former Advisor was terminated on October 21, 2022. As result, no asset management fees were incurred during 2023 as compared to $7.5 million incurred during the nine months ended September 30, 2022.
Under our new internalized structure, we directly incur and pay all general and administrative expenses, including personnel costs related to our executive officers, which were not allocable under the former advisory agreement. General and administrative expenses increased $1.8were comparable for the nine months ended September 30, 2023 and 2022.
Combining asset management fees and general and administrative expenses, $7.4 million primarilyof cost savings were realized under the internalized structure during the nine months ended September 30, 2023 as a result of amortizing our directors’ and officers’ insurance premium incurred and reimbursedcompared to the Advisor over the term of the policy, beginning in December 2021.nine months ended September 30, 2022.
Depreciation and Amortization
The following table presents depreciation and amortization recognized on our direct investments (dollars in thousands):
| | | Nine Months Ended September 30, | | Increase (Decrease) | | Nine Months Ended September 30, | | Increase (Decrease) |
| | | 2022 | | 2021 | | Amount | | % | | | 2023 | | 2022 | | Amount | | % |
| Same store (excludes properties sold) | | | | | | | | | |
| ALF/MCF properties | ALF/MCF properties | | $ | 5,397 | | | $ | 5,207 | | | $ | 190 | | | 3.6 | % | ALF/MCF properties | | $ | 4,930 | | | $ | 4,703 | | | $ | 227 | | | 4.8 | % |
| ILF properties | ILF properties | | 21,107 | | | 21,891 | | | (784) | | | (3.6) | % | ILF properties | | 18,539 | | | 17,828 | | | 711 | | | 4.0 | % |
| Net lease properties | Net lease properties | | 2,601 | | | 2,583 | | | 18 | | | 0.7 | % | Net lease properties | | 2,187 | | | 2,601 | | | (414) | | | (15.9) | % |
| Properties sold | | — | | | 15,091 | | | (15,091) | | | (100.0) | % | |
| Rochester Sub-Portfolio (in loan default) | | Rochester Sub-Portfolio (in loan default) | | 3,649 | | | 3,973 | | | (324) | | | (8.2) | % |
| Total depreciation and amortization | Total depreciation and amortization | | $ | 29,105 | | | $ | 44,772 | | | $ | (15,667) | | | (35.0) | % | Total depreciation and amortization | | $ | 29,305 | | | $ | 29,105 | | | $ | 200 | | | 0.7 | % |
Depreciation and amortization expense decreased $15.7 million,increased at our ALFs, MCFs and ILFs, primarily as a result of capital improvements during 2023. The increase was partially offset by decreased depreciation primarily as a result of impairments recognized at our net lease properties soldand our Rochester Sub-Portfolio during the year ended December 31, 2021.2022 and three months ended June 30, 2023, respectively, which reduced building depreciation expense for the nine months ended September 30, 2023.
Impairment Loss
During the nine months ended September 30, 2023, impairment losses on operating real estate totaled $38.7 million and impairment losses recorded on unconsolidated ventures investments totaled $4.7 million. Refer to “—Impairment” for additional discussion.
During the nine months ended September 30, 2022, impairment losses on operating real estate totaled $31.5 million, consisting of $18.5 million, $8.5 million and $3.9 million for facilities in Arbors, Winterfell and Rochester portfolios, respectively. In addition, we recorded $0.6 million of impairment losses for property damage sustained by facilities within our Winterfell portfolio.
Other Income, Net
During the nine months ended September 30, 2023, other income, net consisted primarily of capital expenditure reimbursements from the state of Oregon’s Long-Term Care Capital Improvement and Emergency Preparedness Program received and recognized by facilities within our Avamere portfolio.
During the nine months ended September 30, 2022, impairmentother income, net consisted of COVID-19 testing reimbursements received and recognized by our Avamere portfolio.
Gain (Loss) on Investments and Other
In connection with the Sale of Minority Interests, we realized a loss totaling $1.3 million, representing the difference between the fair value and carrying value of our investments in the Diversified US/UK and Eclipse joint ventures, which was the consideration exchanged in the transaction for the acquisition of our common stock. In addition, as a result of the Sale of Minority Interests, we reclassified the accumulated foreign currency losses, totaling $3.3 million, related to the Diversified US/UK portfolio, previously recorded through other comprehensive income on operating real estate totaled $31.5 million.the consolidated statements of equity to gain (loss) on investments and other. Refer to “—Impairment”Transaction and Financing Activities” for additional discussion.
During the nine months ended September 30, 2021, impairment losses on operating real estate totaled $5.4 million, consisting of $4.6 million recognized for one independent living facility within our Winterfell portfolio and $0.8 million for our Smyrna net lease property, which was sold in May 2021.
Other Income, Net
Other income, net for the nine months ended September 30, 2022 consisted of $0.1 million in COVID-19 testing reimbursements received and recognized at our Avamere portfolio. For the nine months ended September 30, 2021, other income, net consisted of $7.4 million in federal COVID-19 provider relief grants from DHHS, partially offset by a $0.5 million non-operating loss recognized at a property within the Watermark Fountains.
Realized Gain (Loss) on Investments and Other
During the nine months ended September 30, 2022, we recognized gains on mortgage interest rate caps, a discounted financing payoff and a distribution that exceeded our carrying value for an unconsolidated investment. Gains were partially offset by losses recognized on investment activity.
During the nine months ended September 30, 2021, we recognized gains on the sale of four properties totaling $7.4 million. In addition, we recognized gains on distributions that exceeded our carrying value for our investment in the Envoy joint venture.
Equity in Earnings (Losses) of Unconsolidated Ventures
The following table presents the results of our unconsolidated ventures (dollars in thousands):
| | | Nine Months Ended September 30, | | Nine Months Ended September 30, | | Nine Months Ended September 30, | |
| | 2022 | | 2021 | | 2022 | | 2021 | | 2022 | | 2021 | | 2022 | | 2021 | | 2023 | | 2022 | | 2023 | | 2022 | | 2023 | | 2022 | |
| Portfolio | Portfolio | | Equity in Earnings (Losses) | | FFO and MFFO adjustments(1) | | Equity in Earnings, after FFO and MFFO adjustments | | Increase (Decrease) | | Cash Distributions | Portfolio | | Equity in Earnings (Losses) | | FFO and MFFO adjustments(1) | | Equity in Earnings, after FFO and MFFO adjustments | | Increase (Decrease) |
| Eclipse | | $ | (940) | | | $ | 3,739 | | | $ | 876 | | | $ | (3,319) | | | $ | (64) | | | $ | 420 | | | $ | (484) | | | (115.2) | % | | $ | 620 | | | $ | 2,898 | | |
| Envoy | | — | | | 740 | | | — | | | (744) | | | — | | | (4) | | | 4 | | | (100.0) | % | | — | | | 817 | | |
| Diversified US/UK | | (4,060) | | | (2,387) | | | 8,503 | | | 13,713 | | | 4,443 | | | 11,326 | | | (6,883) | | | (60.8) | % | | 2,290 | | | 3,256 | | |
| Trilogy | | Trilogy | | $ | 454 | | | $ | 10,757 | | | $ | 13,448 | | | $ | 7,415 | | | $ | 13,902 | | | $ | 18,172 | | | $ | (4,270) | | | (23.5) | % |
| Espresso | Espresso | | 33,711 | | | 18,636 | | | (28,121) | | | (11,087) | | | 5,590 | | | 7,549 | | | (1,959) | | | (26.0) | % | | 32,363 | | | — | | Espresso | | 9,228 | | | 33,711 | | | (8,283) | | | (28,121) | | | 945 | | | 5,590 | | | (4,645) | | | (83.1) | % |
| Trilogy | | 10,757 | | | (2,839) | | | 7,415 | | | 11,265 | | | 18,172 | | | 8,426 | | | 9,746 | | | 115.7 | % | | 6,900 | | | — | | |
| Solstice | | Solstice | | (41) | | | (41) | | | — | | | — | | | (41) | | | (41) | | | — | | | — | % |
| Subtotal | Subtotal | | $ | 39,468 | | | $ | 17,889 | | | $ | (11,327) | | | $ | 9,828 | | | $ | 28,141 | | | $ | 27,717 | | | $ | 424 | | | 1.5 | % | | $ | 42,173 | | | $ | 6,971 | | Subtotal | | 9,641 | | | 44,427 | | | 5,165 | | | (20,706) | | | 14,806 | | | 23,721 | | | (8,915) | | | (37.6) | % |
| Solstice | | (41) | | | (70) | | | — | | | 2 | | | (41) | | | (68) | | | 27 | | | (39.7) | % | | — | | | — | | |
| Investments sold | | Investments sold | | (16,236) | | | (5,000) | | | 15,087 | | | 9,379 | | | (1,149) | | | 4,379 | | | (5,528) | | | (126.2) | % |
| | Total | Total | | $ | 39,427 | | | $ | 17,819 | | | $ | (11,327) | | | $ | 9,830 | | | $ | 28,100 | | | $ | 27,649 | | | $ | 451 | | | 1.6 | % | | $ | 42,173 | | | $ | 6,971 | | Total | | $ | (6,595) | | | $ | 39,427 | | | $ | 20,252 | | | $ | (11,327) | | | $ | 13,657 | | | $ | 28,100 | | | $ | (14,443) | | | (51.4) | % |
(1)Represents our proportionate share of revenues and expenses excluded from the calculation of FFO and MFFO for unconsolidated investments. Refer to “—Non-GAAP Financial Measures” for additional discussion.
OurExcluding the investments in unconsolidated ventures sold, equity in earnings generated by our unconsolidated investments increased by $21.6(losses) decreased $34.8 million primarily due to prior period gains on sales exceeding gains recognized on property sales induring the nine months ended September 30, 2023 by the Espresso joint venture and gains recognized byventure. In addition, the Trilogy joint venture recognized a gain upon acquiring the remaining ownership interest of an investment portfolio. Gainsportfolio during nine months ended September 30, 2022.
Excluding the investments in unconsolidated ventures sold, equity in earnings (losses), after FFO and MFFO adjustments, decreased $8.9 million. The Espresso joint venture has sold properties, which has resulted in lower rental income recognized during the nine months ended September 30, 2022 exceeded the gains recognized on property sales in2023 and as of June 30, 2023, we elected to account for the Espresso and Eclipse joint venturesventure under the fair value option, resulting in no equity in earnings recorded during the ninethree months ended September 30, 2021.
Equity in earnings, after FFO and MFFO adjustments, increased by $0.5 million as a result of improvements2023. In addition, higher interest expense on floating rate debt in the Trilogy joint venture partiallyhas offset by lower rental income recognizedoperational improvements in the Diversified US/UK and Espresso joint ventures during the nine months ended September 30, 2022.venture, resulting in lower cash flows generated.
Non-GAAP Financial Measures
Funds from Operations and Modified Funds from Operations
We believe that Funds from Operations, or FFO, and Modified Funds from Operations, or MFFO, are additional appropriate measures of the operating performance of a REIT and of us in particular. We compute FFO in accordance with the standards established by the National Association of Real Estate Investment Trusts, or NAREIT, as net income (loss) (computed in accordance with U.S. GAAP), excluding gains (losses) from sales of depreciable property, the cumulative effect of changes in accounting principles, real estate-related depreciation and amortization, impairment on depreciable property owned directly or indirectly and after adjustments for unconsolidated ventures.
Changes in the accounting and reporting rules under U.S. GAAP that have been put into effect since the establishment of NAREIT’s definition of FFO have prompted an increase in the non-cash and non-operating items included in FFO. For instance, the accounting treatment for acquisition fees related to business combinations has changed from being capitalized to being
expensed. Additionally, publicly registered, non-traded REITs are typically different from traded REITs because they generally have a limited life followed by a liquidity event or other targeted exit strategy. Non-traded REITs typically have a significant amount of acquisition activity and are substantially more dynamic during their initial years of investment and operation as compared to later years when the proceeds from their initial public offering have been fully invested and when they may seek to implement a liquidity event or other exit strategy. However, it is likely that we will make investments past the acquisition and development stage, albeit at a substantially lower pace.
Acquisition fees paid to the Advisor in connection with the origination and acquisition of debt investments have been amortized over the life of the investment as an adjustment to interest income, while fees paid to the Advisor in connection with the acquisition of equity investments were generally expensed under U.S. GAAP. In both situations, the fees were included in the computation of net income (loss) and income (loss) before equity in earnings (losses) of unconsolidated ventures and income tax benefit (expense), both of which are performance measures under U.S. GAAP. We adjusted MFFO for the amortization of acquisition fees in the period when such amortization was recognized under U.S. GAAP or in the period in which the acquisition fees were expensed. Acquisition fees were paid in cash that would otherwise have been available to distribute to our stockholders. Such fees and expenses will not be reimbursed by the Advisor or its affiliates and third parties. However, in general, we earned origination fees for debt investments from our borrowers in an amount equal to the acquisition fees paid to the Advisor. Effective January 1, 2018, the Advisor no longer receives an acquisition fee in connection with our acquisition of real estate properties or debt investments.
Due to certain of the unique features of publicly-registered, non-traded REITs, the Institute for Portfolio Alternatives, or IPA, an industry trade group, standardized a performance measure known as MFFO and recommends the use of MFFO for such REITs. Management believes MFFO is a useful performance measure to evaluate our business and further believes it is important to disclose MFFO in order to be consistent with the IPA recommendation and other non-traded REITs. MFFO adjustments for items such as acquisition fees would only be comparable to non-traded REITs that have completed the majority of their acquisition activity and have other similar operating characteristics as us. Neither the U.S. Securities and Exchange Commission, or SEC, nor any other regulatory body has approved the acceptability of the adjustments that we use to calculate MFFO. In the future, the SEC or another regulatory body may decide to standardize permitted adjustments across the non-listed REIT industry and we may need to adjust our calculation and characterization of MFFO.
MFFO is a metric used by management to evaluate our future operating performance once our organization and offering and acquisition and development stages are complete and is not intended to be used as a liquidity measure. Although management uses the MFFO metric to evaluate future operating performance, this metric excludes certain key operating items and other adjustments that may affect our overall operating performance. MFFO is not equivalent to net income (loss) as determined under U.S. GAAP. In addition, MFFO is not a useful measure in evaluating net asset value, since impairment is taken into account in determining net asset value but not in determining MFFO.
We define MFFO in accordance with the concepts established by the IPA, and adjust for certain items, such as accretion of a discount and amortization of a premium on borrowings and related deferred financing costs, as such adjustments are comparable to adjustments for debt investments and will be helpful in assessing our operating performance. Similarly, we adjust for the non-cash effect of unrealized gains or losses on unconsolidated ventures.IPA. Our computation of MFFO may not be comparable to other REITs that do not calculate MFFO using the same method MFFO is calculated using FFO. FFO, as defined by NAREIT, is a computation made by analysts and investors to measure a real estate company’s operating performance. The IPA’s definition of MFFO excludes from FFO the following items:
•acquisition fees and expenses;
•non-cash amounts related to straight-line rent and the amortization of above or below market and in-place intangible lease assets and liabilities (which are adjusted in order to reflect such payments from an accrual basis of accounting under U.S. GAAP to a cash basis of accounting);
•amortization of a premium and accretion of a discount on debt investments;
•non-recurring impairment of real estate-related investments that meet the specified criteria identified in the rules and regulations of the SEC;
•realized gains (losses) from the early extinguishment of debt;
•realized gains (losses) on the extinguishment or sales of hedges, foreign exchange, securities and other derivative holdings except where the trading of such instruments is a fundamental attribute of our business;
•unrealized gains (losses) from fair value adjustments on real estate securities, including CMBS and other securities, interest rate swaps and other derivatives not deemed hedges and foreign exchange holdings;
•unrealized gains (losses) from the consolidation from, or deconsolidation to, equity accounting;
•adjustments related to contingent purchase price obligations; and
•adjustments for consolidated and unconsolidated partnerships and joint ventures calculated to reflect MFFO on the same basis as above.
Certain of the above adjustments are also madeWe believe that MFFO is a useful non-GAAP measure for non-traded REITs. It is helpful to reconcile net income (loss) to net cash provided by (used in)management and stockholders in assessing our future operating activities, such as for the amortization of a premium and accretion of a discount on debt and securities investments, amortization of fees, any unrealized gains (losses) on derivatives, securities or other investments, as well as other adjustments.
MFFO excludes non-recurring impairment of real estate-related investments. We assess the credit qualityperformance upon completion of our investmentsorganization and adequacy of reserves/impairment on a quarterly basis, or more frequently as necessary. Significant judgment is required in this analysis. With respect to debt investments, we consider the estimated net recoverable value of the loan as well as other factors, including but not limited to the fair value of any collateral, the amountoffering, and the status of any senior debt, the prospects for the borroweracquisition and the competitive situation of the region where the borrower does business. Fair value is typically estimated based on discounting expected future cash flow of the underlying collateral taking into consideration the discount rate, capitalization rate, occupancy, creditworthiness of major tenants and many other factors. This requires significant judgment and because it is based on projections of future economic events, which are inherently subjective, the amount ultimately realized may differ materially from the carrying value as of the consolidated balance sheet date. If the estimated fair value of the underlying collateral for the debt investment is less than its net carrying value, a loan loss reserve is recorded with a corresponding charge to provision for loan losses. With respect to a real estate investment, a property’s value is considered impaired if a triggering event is identified and our estimate of the aggregate future undiscounted cash flow to be generated by the property is less than the carrying value of the property. The value of our investments may be impaired and their carrying valuesdevelopment stages. However, MFFO may not be recoverable duea useful measure of our operating performance or as a comparable measure to other typical non-traded REITs if we do not continue to operate in a similar manner to other non-traded REITs, including if we determined not to pursue an exit strategy.
MFFO does have certain limitations. For instance, realized gains (losses) from acquisitions and dispositions and other adjustments listed above are not reported in MFFO, even though such realized gains (losses) and other adjustments could affect our limited life.operating performance and cash available for distribution. Any mark-to-market or fair value adjustments may be based on many factors, including current operational or individual property issues or general market or overall industry conditions. Investors should note that while impairment charges are excluded from the calculation of MFFO, investors are cautioned that due to the fact that impairments are based on estimated future undiscounted cash flow and the relatively limited term of a non-traded REIT’s anticipated operations, it could be difficult to recover any impairment charges through operational net revenues or cash flow prior to any liquidity event.
We believe that In addition, MFFO is a useful non-GAAP measure for non-traded REITs. It is helpful to management and stockholders in assessing our future operating performance once our organization and offering, and acquisition and development stages are complete. However, MFFO may not be a useful measure of our operating performance or as a comparable measure to other typical non-traded REITs if we doin evaluating net asset value, since impairment is taken into account in determining net asset value but not continue to operate in a similar manner to other non-traded REITs, including if we were to extend our acquisition and development stage or if we determined not to pursue an exit strategy.
However, MFFO does have certain limitations. For instance, the effect of any amortization or accretion on debt investments originated or acquired at a premium or discount, respectively, is not reported indetermining MFFO. In addition, realized gains (losses) from acquisitions and dispositions and other adjustments listed above are not reported in MFFO, even though such realized gains (losses) and other adjustments could affect our operating performance and cash available for distribution. Any mark-to-market or fair value adjustments may be based on many factors, including current operational or individual property issues or general market or overall industry conditions.
Neither FFO nor MFFO is equivalent to net income (loss) or cash flow provided by operating activities determined in accordance with U.S. GAAP and should not be construed to be more relevant or accurate than the U.S. GAAP methodology in evaluating our operating performance. Neither FFO nor MFFO is necessarily indicative of cash flow available to fund our cash needs including our ability to make distributions to our stockholders. FFO and MFFO do not represent amounts available for management’s discretionary use because of needed capital replacement or expansion, debt service obligations or other commitments or uncertainties. Furthermore, neither FFO nor MFFO should be considered as an alternative to net income (loss) as an indicator of our operating performance.
The following table presents a reconciliation of net income (loss) attributable to common stockholders to FFO and MFFO attributable to common stockholders (dollars in thousands):
| | | Three Months Ended September 30, | | Nine Months Ended September 30, | | Three Months Ended September 30, | | Nine Months Ended September 30, |
| | 2022 | | 2021 | | 2022 | | 2021 | | 2023 | | 2022 | | 2023 | | 2022 |
| Funds from operations: | Funds from operations: | | | | | | | | | Funds from operations: | | | | | | | | |
| Net income (loss) attributable to NorthStar Healthcare Income, Inc. common stockholders | Net income (loss) attributable to NorthStar Healthcare Income, Inc. common stockholders | | $ | (29,440) | | | $ | (11,653) | | | $ | (35,569) | | | $ | (28,979) | | Net income (loss) attributable to NorthStar Healthcare Income, Inc. common stockholders | | $ | (11,218) | | | $ | (29,440) | | | $ | (82,925) | | | $ | (35,569) | |
| Adjustments: | Adjustments: | | Adjustments: | |
| Depreciation and amortization | Depreciation and amortization | | 9,642 | | | 13,828 | | | 29,105 | | | 44,772 | | Depreciation and amortization | | 9,848 | | | 9,642 | | | 29,305 | | | 29,105 | |
| Depreciation and amortization related to non-controlling interests | Depreciation and amortization related to non-controlling interests | | (71) | | | (120) | | | (215) | | | (409) | | Depreciation and amortization related to non-controlling interests | | (67) | | | (71) | | | (214) | | | (215) | |
| Depreciation and amortization related to unconsolidated ventures | Depreciation and amortization related to unconsolidated ventures | | 7,290 | | | 7,609 | | | 21,386 | | | 23,009 | | Depreciation and amortization related to unconsolidated ventures | | 4,137 | | | 7,290 | | | 14,328 | | | 21,386 | |
| Realized (gain) loss from sales of property | | — | | | — | | | 425 | | | (7,417) | | |
| Realized gain (loss) from sales of property related to non-controlling interests | | — | | | — | | | (6) | | | 226 | | |
| Realized (gain) loss from sales of property related to unconsolidated ventures | | (505) | | | (9,898) | | | (44,407) | | | (31,277) | | |
| (Gain) loss from sales of property | | (Gain) loss from sales of property | | — | | | — | | | (136) | | | 425 | |
| Gain (loss) from sales of property related to non-controlling interests | | Gain (loss) from sales of property related to non-controlling interests | | — | | | — | | | 4 | | | (6) | |
| (Gain) loss from sales of property related to unconsolidated ventures | | (Gain) loss from sales of property related to unconsolidated ventures | | — | | | (505) | | | (7,894) | | | (44,407) | |
| Impairment losses of depreciable real estate | Impairment losses of depreciable real estate | | 18,500 | | | 4,600 | | | 31,502 | | | 5,386 | | Impairment losses of depreciable real estate | | — | | | 18,500 | | | 38,694 | | | 31,502 | |
| Impairment loss on real estate related to non-controlling interests | Impairment loss on real estate related to non-controlling interests | | — | | | — | | | (117) | | | — | | Impairment loss on real estate related to non-controlling interests | | — | | | — | | | (1,161) | | | (117) | |
| Impairment losses of depreciable real estate held by unconsolidated ventures | Impairment losses of depreciable real estate held by unconsolidated ventures | | 38 | | | — | | | 58 | | | (327) | | Impairment losses of depreciable real estate held by unconsolidated ventures | | — | | | 38 | | | 7,682 | | | 58 | |
| Funds from operations attributable to NorthStar Healthcare Income, Inc. common stockholders | Funds from operations attributable to NorthStar Healthcare Income, Inc. common stockholders | | $ | 5,454 | | | $ | 4,366 | | | $ | 2,162 | | | $ | 4,984 | | Funds from operations attributable to NorthStar Healthcare Income, Inc. common stockholders | | $ | 2,700 | | | $ | 5,454 | | | $ | (2,317) | | | $ | 2,162 | |
| Modified funds from operations: | Modified funds from operations: | | | | | | | | | Modified funds from operations: | | | | | | | | |
| Funds from operations attributable to NorthStar Healthcare Income, Inc. common stockholders | Funds from operations attributable to NorthStar Healthcare Income, Inc. common stockholders | | $ | 5,454 | | | $ | 4,366 | | | $ | 2,162 | | | $ | 4,984 | | Funds from operations attributable to NorthStar Healthcare Income, Inc. common stockholders | | $ | 2,700 | | | $ | 5,454 | | | $ | (2,317) | | | $ | 2,162 | |
| Adjustments: | Adjustments: | | Adjustments: | |
| Transaction costs | Transaction costs | | 857 | | | — | | | 857 | | | 54 | | Transaction costs | | 358 | | | 857 | | | 455 | | | 857 | |
| Straight-line rental (income) loss | | — | | | 347 | | | — | | | 7,432 | | |
| | Amortization of premiums, discounts and fees on investments and borrowings | Amortization of premiums, discounts and fees on investments and borrowings | | 983 | | | 778 | | | 2,927 | | | 3,081 | | Amortization of premiums, discounts and fees on investments and borrowings | | 1,513 | | | 983 | | | 3,507 | | | 2,927 | |
| Realized (gain) loss on investments and other | | (325) | | | (75) | | | (1,085) | | | (62) | | |
| (Gain) loss on investments and other | | (Gain) loss on investments and other | | 347 | | | (325) | | | 4,798 | | | (1,085) | |
Adjustments related to unconsolidated ventures(1) | Adjustments related to unconsolidated ventures(1) | | (2,525) | | | 4,580 | | | 11,636 | | | 18,425 | | Adjustments related to unconsolidated ventures(1) | | 323 | | | (2,525) | | | 6,136 | | | 11,636 | |
| Adjustments related to non-controlling interests | Adjustments related to non-controlling interests | | 7 | | | (10) | | | 11 | | | (50) | | Adjustments related to non-controlling interests | | (27) | | | 7 | | | (28) | | | 11 | |
| | Impairment of real estate related investment | | Impairment of real estate related investment | | — | | | — | | | 4,728 | | | — | |
| Modified funds from operations attributable to NorthStar Healthcare Income, Inc. common stockholders | Modified funds from operations attributable to NorthStar Healthcare Income, Inc. common stockholders | | $ | 4,451 | | | $ | 9,986 | | | $ | 16,508 | | | $ | 33,864 | | Modified funds from operations attributable to NorthStar Healthcare Income, Inc. common stockholders | | $ | 5,214 | | | $ | 4,451 | | | $ | 17,279 | | | $ | 16,508 | |
(1)Primarily represents our proportionate share of liability extinguishment gains, loan loss reserves, transaction costs and amortization of above/below market debt adjustments, straight-line rent adjustments, impairment of goodwill, debt extinguishment losses and deferred financing costs, incurred through our investments in unconsolidated ventures.
Liquidity and Capital Resources
Our current principal liquidity needs are to fund: (i) operating expenses, including corporate general and administrative expenses; (ii) principal and interest payments on our borrowings and other commitments; and (iii) capital expenditures, including capital calls in connection with our unconsolidated joint venture investments.
Our current primary sources of liquidity include the following: (i) cash on hand; (ii) proceeds from full or partial realization of investments; (iii) cash flow generated by our investments, both from our operating activities and distributions from our unconsolidated joint ventures; and (iv) secured or unsecured financings from banks and other lenders.
We generated significant liquidity in 2021 from proceeds from asset sales and other realization events. As a result, on April 20, 2022, our board of directors declared the Special Distribution of $0.50 per share for each stockholder of record on May 2, 2022. The Special Distribution paid in cash on or around May 5, 2022 totaled $97.0 million. While we do not anticipate recurring dividends in the near future, in light of the cash flow generated by our investments as compared to our capital expenditure needs and debt service obligations, our management and board of directors will evaluate special distributions in connection with asset sales and other realizations of our investments on a case-by-case basis based on, among other factors, current and projected liquidity needs, opportunities for investment in our assets (such as capital expenditure and de-levering opportunities) and other strategic initiatives.
As of November 9, 2022,2023, we had approximately $114.9$98.7 million of unrestricted cash and currently believe that our capital resources are sufficient to meet our capital needs for the following 12 months.
Cash From Operations
We primarily generate cash flow from operations through net operating income from our operating properties and rental income from our net lease properties. In addition, we receivedreceive distributions from our investments in unconsolidated ventures, which are classified as cash flows from investing activities on our consolidated statements of cash flows.ventures. Net cash used inprovided by operating activities was $13.6$13.1 million for the nine months ended September 30, 2022. During the nine months ended September 30, 2022, debt service payments, which include principal amortization, on our borrowings exceeded our cash flow from operations. We have utilized cash reserves generated from asset realizations to fund debt service payments, which is expected to continue until the operating margins of our direct investments improve from current levels.2023.
A substantial majority of our direct investments are operating properties whereby we are directly exposed to various operational risks. While our direct operating investments have not experienced any significant issues collecting rents or other fees from residents, cash flow has continued to be negatively impacted by suboptimal occupancy levels, rate pressures, cost inflation, rising interest rates and other economic market
conditions. We expect that these factors will continue to materially impact our revenues, expenses and cash flow generated by the communities of our direct operating investments.
The operator of our Arbors net lease portfolio has been impacted by the same factors discussed above, which has and will continue to affect its ability and willingness to pay rent. The operator continues to make partial contractual rental payments based on availability of cash and liquidity and has not satisfied full contractual rent obligations. The operator has applied for and benefited from federal relief assistance, however, the operator’s ability to pay rent in the future is currently unknown.
We have a significant joint ventures and will not be able tounconsolidated investment in the Trilogy Joint Venture, where we have no control over the timing of distributions, if any, from these investments. As of September 30, 2022, our unconsolidated joint ventures and consolidated joint ventures represented 33.8% and 13.7%, respectively, of our total real estate equity investments, based on cost. Our unconsolidated joint ventures, which haveany. The Trilogy Joint Venture has been similarly impacted as our direct investments by the COVID-19 pandemic, inflation, rising interest rates and other economic market conditions, and, as a result, does not expect to make further distributions in 2023 and may continue to limit distributions to preserve liquidity.liquidity in the future.
Borrowings
We use asset-level financing as part of our investment strategy to leverage our investments while managing refinancing and interest rate risk. We typically financehave financed our investments with medium to long-term, non-recourse mortgage loans, though our borrowing levels and terms vary depending upon the nature of the assets and the related financing.
We are required to make recurring principal and interest payments on our borrowings. As ofDuring the nine months ended September 30, 2022,2023, we had $927.1 million of consolidated asset-level borrowings outstanding and paid $41.5$43.7 million in recurring principal and interest payments on borrowings. Excluding the Rochester Sub-Portfolio Loan, we had $808.5 million of consolidated asset-level borrowings during the nine months ended September 30, 2022. Our unconsolidated joint ventures also have significant asset level borrowings, which may restrict cash distributions from the joint ventures if certain lender requirements are not met and may require capital to be funded if favorable refinancing is not obtained.
The operator for the Arbors portfolio has failed to remit contractual rent and satisfy other conditions under its leases, which resulted in defaults under the operator’s leases, and in turn, resulted in a non-monetary default under the mortgage notes collateralized by the propertiesoutstanding as of September 30, 2022. We have remitted contractual debt service2023. Fixed-rate borrowings totaled $779.4 million with interest rates ranging from 3.00% to 4.66%. Excluding the Rochester Sub-Portfolio Loan, floating-rate borrowings totaled $29.1 million and are in compliance with subject to fluctuating Secured Overnight Financing Rate, or SOFR. As of September 30, 2023, excluding the other contractual terms under the mortgage notes collateralized by the properties.Rochester Sub-Portfolio Loan, effective interest rates on floating rate debt ranged from 8.11% to 8.26%.
As the impact of the inflation, rising interest rates, risk of recession and other economic market conditions continue to influence our investments’ performance which may have a negative impact onand market values, our ability to service or refinance our borrowings and we may experience defaultsbe negatively impacted, including $586.8 million of borrowings collateralized by our Winterfell portfolio that mature in the future.June 2025.
Our charter limits us from incurring borrowings that would exceed 300.0% of our net assets. We cannot exceed this limit unless any excess in borrowing over such level is approved by a majority of our independent directors. We would need to disclose any such approval to our stockholders in our next quarterly report along with the justification for such excess. An approximation of this leverage limitation, excluding indirect leverage held through our unconsolidated joint venture investments and any securitized mortgage obligations to third parties, is 75.0% of our assets, other than intangibles, before deducting loan loss reserves, other non-cash reserves and depreciation. As of September 30, 2022,2023, our leverage was 55.6%55.5% of our assets, other than intangibles, before deducting loan loss reserves, other non-cash reserves and depreciation. As of September 30, 2022,2023, indirect leverage on assets, other than intangibles, before deducting loan loss reserves, other non-cash reserves and depreciation, held through our unconsolidated joint ventures was 57.9%57.7%.
For additional information regarding our borrowings, including principal repayments, timing of maturities and loans currently in default, refer to Note 5, “Borrowings” in our accompanying consolidated financial statements included in Part I, Item 1. “Financial Statements.”
Capital Expenditures Activities
We are responsible for capital expenditures for our operating properties and from time to time, may also fund capital expenditures for certainour net lease properties. We continue to invest capitalcash from reserves and asset sales proceeds into our operating portfoliodirect investments in order to maintain market position, functional and operating standards, increase operating income, achieve property stabilization and enhance the overall value of our assets. However, there can be no assurance that these initiatives will achieve these intended results.
We are also party to certain joint venture agreements that contemplate development of healthcare properties funded by us andThe following table presents cash used for capital expenditures at our joint venture partners. Although we may not be obligated to fund such capital contributions or capital projects, we may be subject to adverse consequences under our joint venture governing documents for any such failure to fund.direct investments (dollars in thousands):
| | | | | | | | | | | | | | | | | | | | |
| | Nine Months Ended September 30, | | |
| | 2023 | | 2022 | | 2023 vs. 2022 Change |
| ALF/MCF properties | | $ | 2,066 | | | $ | 1,993 | | | $ | 73 | |
| ILF properties | | 26,359 | | | 15,609 | | | 10,750 | |
| Net lease properties | | — | | | 322 | | | (322) | |
| | | | | | |
| Total capital expenditures | | $ | 28,425 | | | $ | 17,924 | | | $ | 10,501 | |
Realization and Disposition of Investments
We will actively pursue dispositions of assets and portfolios where we believe the disposition will achieve a desired return, improve our liquidity position and generate value for shareholders. As the impact of inflation, rising interest rates, risk of recession and other economic market conditions continue to influence the properties’ performance, it may have a negative impact on our ability to generate desired returns on dispositions.
We have made significant investments through both consolidated and unconsolidated joint ventures with third parties. Decision-making authorities for these joint ventures could prevent us from selling properties or our interest inparties, which we have limited ability to influence material decisions, including the joint venture. During the nine months ended September 30, 2022, our Espresso joint venture distributed the net proceeds generated from sub-portfolios sales,disposition of which our proportionate share totaled $27.4 million.assets. Refer to “—Recent Developments”Market Update” and “—Business Update” for additionalfurther information on distributions from portfolio sales.regarding dispositions.
Distributions
To continue to qualify as a REIT, we are required to distribute annually dividends equal to at least 90% of our taxable income, subject to certain adjustments, to stockholders. We have generated net operating losses for tax purposes and, accordingly, are currently not required to make distributions to our stockholders to qualify as a REIT. Refer to “—Distributions Declared and Paid” and “—Liquidity Update” for further information regarding our distributions.
Repurchases
We adopted a share repurchase program, or the Share Repurchase Program effective August 7, 2012, which enabled stockholders to sell their shares to us in limited circumstances. Our board of directors may amend, suspendcircumstances and could be amended, suspended, or terminate our Share Repurchase Programterminated at any time, subject to certain notice requirements. In October 2018, our board of directors approved an amended and restated Share Repurchase Program, under which we only repurchased shares in connection with the death or qualifying disability of a stockholder.time. On April 7, 2020, our board of directors suspended all repurchases under our existing Share Repurchase Program effective April 30, 2020 in order to preserve capital and liquidity. We do not currently anticipate resuming the Share Repurchase Program. If we have sufficient capital available, at this stage in our life cycle, we believe that returning capital to stockholders through special distributions, rather than repurchases, is a better use of that capital.
Other Commitments
On October 21, 2022, we terminated the advisory agreement and completed the Internalization. Prior to the termination of the advisory agreement, we reimbursed the Former Advisor for direct and indirect operating costs in connection with services provided to us. Under our new internalized structure, we will directly incur and pay all general and administrative costs.
In connection with the Internalization, we entered into the TSA, to facilitate an orderly transition of the management of our operations. The TSA provides for, among other things, the Advisor to provide certain services, which primarily include technology, insurance, legal, treasury and accounts payable services. We will reimburse the Advisor for costs to provide such services. Refer to “—Recent Developments” for further information.
Cash Flows
The following presents a summary of our consolidated statements of cash flows (dollars in thousands):
| | | Nine Months Ended September 30, | | | Nine Months Ended September 30, | |
| Cash flows provided by (used in): | Cash flows provided by (used in): | | 2022 | | 2021 | | 2022 vs. 2021 Change | Cash flows provided by (used in): | | 2023 | | 2022 | | 2023 vs. 2022 Change |
| Operating activities | Operating activities | | $ | (13,604) | | | $ | (4,355) | | | $ | (9,249) | | Operating activities | | $ | 13,066 | | | $ | (13,604) | | | $ | 26,670 | |
| Investing activities | Investing activities | | 24,249 | | | 92,367 | | | (68,118) | | Investing activities | | (14,295) | | | 24,249 | | | (38,544) | |
| Financing activities | Financing activities | | (113,901) | | | (71,058) | | | (42,843) | | Financing activities | | (15,464) | | | (113,901) | | | 98,437 | |
| Net increase (decrease) in cash, cash equivalents and restricted cash | Net increase (decrease) in cash, cash equivalents and restricted cash | | $ | (103,256) | | | $ | 16,954 | | | $ | (120,210) | | Net increase (decrease) in cash, cash equivalents and restricted cash | | $ | (16,693) | | | $ | (103,256) | | | $ | 86,563 | |
Operating Activities
Net cash used inprovided by operating activities totaled $13.6$13.1 million for the nine months ended September 30, 2022,2023 as compared to $4.4$13.6 million net cash used in operating activities for the nine months ended September 30, 2021.2022. The change in cash flow from operating activities was a result of receiving $7.4distributions received from our unconsolidated investment in the Espresso joint venture, $10.6 million of which has been classified as operating cash flows. Additionally, increases in federal COVID-19 provider relief grants from HHS during the nine months ended September 30, 2021 as well as generating lower rentalrates and occupancy at our direct operating investments, resulted in higher rent and resident fee income, net of property operating expensesfees collected during the nine months ended September 30, 2022 as a result of portfolio sales during the year ended December 31, 2021.2023 and lower reimbursement payments made to our Former Advisor increased cash flow from operations.
Investing Activities
Our cash flows from investing activities are primarily proceeds from investment dispositions, net of any capital expenditures. Net cash provided by investing activities was $24.2 million for the nine months ended September 30, 2022ascompared to $92.4 million for the nine months ended September 30, 2021. Cash flows provided by investing activities for the nine months ended September 30, 2022 were from distributions received from our unconsolidated investments. Cash inflows were used to fund recurring capital expenditures and operating shortfalls for existing investments and to pay corporate general and administrative expenses. Cash flows provided by investing activities for the nine months ended September 30, 2021 were from collections of outstanding principal on our real estate debt investment and proceeds from property sales.
On a same store basis, capital expenditures increased during the nine months ended September 30, 2022, as compared to the nine months ended September 30, 2021. The resumption of normalized business operations has allowed our managers to commence additional improvement projects as weWe continue to invest capital into our operating portfolios in order to maintain market position and enhance overall asset value.
The following table presents Net cash used in investing activities totaled $14.3 million for the nine months ended September 30, 2023ascompared to $24.2 million net cash provided by investing activities for the nine months ended September 30, 2022. Cash flows used in investing activities for the nine months ended September 30, 2023 consisted of capital expenditures excludingfor our direct investments, partially offset by distributions received from our Espresso and Trilogy unconsolidated investments classified as investing cash flows, which totaled $8.8 million and $4.7 million, respectively. Cash flows provided by investing activities for the nine months ended September 30, 2022 consisted of distributions received from our unconsolidated ventures (dollars in thousands):
| | | | | | | | | | | | | | | | | | | | |
| | Nine Months Ended September 30, | | |
| | 2022 | | 2021 | | 2022 vs. 2021 Change |
| Same store (excludes properties sold) | | | | | | |
| ALF/MCF properties | | $ | 1,993 | | | $ | 1,552 | | | $ | 441 | |
| ILF properties | | 15,609 | | | 9,700 | | | 5,909 | |
| Net lease properties | | 322 | | | — | | | 322 | |
| Properties sold | | — | | | 6,092 | | | (6,092) | |
| Total capital expenditures | | $ | 17,924 | | | $ | 17,344 | | | $ | 580 | |
Financing Activities
Cash flows used in financing activities weretotaled $15.5 million for the nine months ended September 30, 2023 compared to $113.9 million for the nine months ended September 30, 2022 compared to $71.1 million for2022. For the nine months ended September 30, 2021.2023, net cash flows used in financing activities were primarily recurring principal amortization on our mortgage notes. For the nine months ended September 30, 2022, net cash flows used in financing activities were primarily attributable to the paymentspecial distribution our board of the Special Distribution to stockholders, repayment of the financing on the Oak Cottage portfolio and continued principal amortization on our mortgage notes. Cash flows used in financing activities during the nine months ended September 30, 2021 were primarily the repayment of the $35.0 million borrowed under the Sponsor Line and principal amortization and repayments on our mortgage notes payable. Cash outflows were partially offset by the refinancing of a mortgage note for a property within our Aqua portfolio, which generated $6.5 million in net proceeds.
directors declared of $0.50 per share for each stockholder of record on May 2, 2022, or the Special Distribution, which was paid in cash on or around May 5, 2022 and totaled approximately $97.0 million. In addition, the repayment of the financing on Oak Cottage and recurring principal amortization on our mortgage notes contributed to cash flows used in financing activities.
Off-Balance Sheet Arrangements
As of September 30, 2022,2023, we are not dependent on the use of any off-balance sheet financing arrangements for liquidity. We have made investments in unconsolidated ventures. Refer to Note 4, “Investments in Unconsolidated Ventures” in Part I.I, Item 1. “Financial Statements” for a discussion of such unconsolidated ventures in our consolidated financial statements. In each case, our exposure to loss is limited to the carrying value of our investment.
Inflation
Macroeconomic trends such as increases in inflation and rising interest rates can have a substantial impact on our business and financial results. Many of our costs are subject to inflationary pressures. These include labor, repairs and maintenance, food costs, utilities, insurance and other operating costs. Our managers’ ability to offset increased costs by increasing the rates charged to residents may be limited, therefore, cost inflation may substantially affect the net operating income of our operating properties as well as the ability of our net lease operator to make payments to us.
Distributions Declared and Paid
SinceFrom inception of our first investment, through September 30, 2022,2023, we declared $530.9 million in distributions, inclusive of the recent Special Distribution, and generated cumulative FFO of $134.0$107.0 million. From the date of our first investment on April 5, 2013 through December 31, 2017, we declared an annualized distribution amount of $0.675 per share of our common stock. From January 1, 2018 through January 31, 2019, we declared an annualized distribution amount of $0.3375 per share of our common stock. Effective February 1, 2019, our board of directors suspendedstopped recurring distributions in order to preserve capital and liquidity. On April 20, 2022, our board of directors declared the Special Distribution of $0.50 per share for each stockholder of record on May 2, 2022 totaling $97.1approximately $97.0 million. On or around May 5, 2022, $97.0 million of the Special Distribution was paid in cash from sources other than our cash flow provided by operations, including cash proceeds generated from asset sales and realizations during the year ended December 31, 2021. While we do not anticipate recurring dividends in the near future, in light of the cash flow generated by our investments as compared to our capital expenditure needs and debt service obligations, our management and board of directors will evaluate special distributions in connection with asset sales and other realizations of our investments on a case-by-case basis based on, among other factors, current and projected liquidity needs, opportunities for investment in our assets (such as capital expenditure and de-levering opportunities) and other strategic initiatives.
To the extent distributions are paid from sources other than FFO, the ownership interest of our public stockholders may be diluted. Future distributions declared and paid may exceed FFO and cash flow provided by operations. FFO, as defined, may not reflect actual cash available for distributions.
Related Party Arrangements
Former Advisor
In connection with the Internalization, the advisory agreement was terminated on October 21, 2022. Prior to the Internalization, the Former Advisor was responsible for managing our affairs on a day-to-day basis and for identifying, acquiring, originating and asset managing investments on our behalf. For such services, to the extent permitted by law and regulations, the Former Advisor received fees and reimbursements from us. Pursuant to the advisory agreement, the Former Advisor could defer or waive fees in its discretion.
Transition Services
In connection with the Internalization, the advisory agreement was terminated on October 21, 2022. Refer2022, we, the Operating Partnership and the Former Advisor entered into a Transition Services Agreement, or TSA, to “—Recent Developments” for further information.
Fees to Advisor
Asset Management Fee
Prior to the terminationfacilitate an orderly transition of the advisory agreement, the Advisor received a monthly asset management fee equal to one-twelfth of 1.5% of our most recently published aggregate estimated net asset value,operations. The TSA, as may be subsequently adjustedamended on March 22, 2023, provides for, any special distribution declared by our boardamong other things, the Former Advisor to provide certain services, including primarily technology and insurance, for a transition period of directorsup to six months following the Internalization, with legal, treasury and accounts payable services to continue until we terminate these services or in connection with a sale, transfer or other disposition of a substantial portion of our assets. From January 1, 2022 through the October 21, 2022 termination of the advisory agreement, the fee was reduced if our corporate cash balances exceeded $75.0 million, subject to the terms and conditions set forth in the advisory agreement.
Effective July 1, 2021, the asset management fee was paid entirely in shares of our common stock at a price per share equal to the most recently published net asset value per share.
Acquisition Fee
Effective January 1, 2018, the Advisor no longer received an acquisition fee in connection with our acquisitions of real estate properties or debt investments.
Disposition Fee
Effective June 30, 2020, the Advisor no longer had the potential to receive a disposition fee in connection with the sale of real estate properties or debt investments.
Reimbursements to Advisor
Operating Costs
Prior to the termination of the advisory agreement, the Advisor was entitled to receive reimbursement for direct and indirect operating costs incurred by the Advisor in connection with administrative services provided to us. The Advisor allocated, in good faith, indirect costs to us related to the Advisor’s and its affiliates’ employees, occupancy and other general and administrative costs and expensesspecified circumstances in accordance with the termsTSA. We will reimburse the Former Advisor for costs to provide the services, including the allocated cost of employee wages and subject to the limitations contained in, the advisory agreement with the Advisor. The indirect costs included our allocable share of the Advisor’s compensation and benefit costs associated with dedicated or partially dedicated personnel who spent all or a portion of their time managing our affairs, based upon the percentage of time devoted by such personnel to our affairs. The indirect costs also included rental and occupancy, technology, office supplies and other general and administrative costs andactually incurred out-of-pocket expenses. However, there was no reimbursement for personnel costs related to our executive officers (although reimbursement for certain executive officers of the Advisor was permissible) and other personnel involved in activities for which the Advisor received an acquisition fee or a disposition fee. The Advisor allocated these costs to us relative to its and its affiliates’ other managed companies in good faith and reviewed the allocation with our board of directors, including our independent directors. The Advisor updated our board of directors on a quarterly basis of any material changes to the expense allocation and provided a detailed review to the board of directors, at least annually, and as otherwise requested by the board of directors.
We reimbursed the Advisor quarterly for operating costs (including the asset management fee) based on a calculation, or the 2%/25% Guidelines, for the four preceding fiscal quarters not to exceed the greater of: (i) 2.0% of our average invested assets; or (ii) 25.0% of our net income determined without reduction for any additions to reserves for depreciation, loan losses or other similar non-cash reserves and excluding any gain from the sale of assets for that period. Notwithstanding the above, we could reimburse the Advisor for expenses in excess of this limitation if a majority of our independent directors determined that such excess expenses are justified based on unusual and non-recurring factors. We have calculated the expense reimbursement quarterly based upon the trailing twelve-month period. As of September 30, 2022, the Advisor did not have any unreimbursed operating costs which remained eligible to be allocated to us.
As of September 30, 2022, the outstanding operating costs reimbursable to the Advisor totaled $2.5 million and were reimbursed during the fourth quarter of 2022. The Advisor continued to incur direct and indirect operating costs on our behalf through the termination of the advisory agreement on October 21, 2022. In addition, we will pay the Advisor’s costs for certain services for a transition period. Refer to “—Recent Developments” for further discussion.
Summary of Fees and Reimbursements
The following table presents the fees and reimbursements incurred and paid to the Former Advisor (dollars in thousands):
| | | | | | | | | | | | | | | | | | | | | | | | | | | | | | | | |
| Type of Fee or Reimbursement | | | | Due to Related Party as of December 31, 2021 | | Nine Months Ended September 30, 2022 | | Due to Related Party as of September 30, 2022 (Unaudited) |
| Financial Statement Location | | | Incurred | | Paid | |
| Fees to Advisor Entities | | | | | | | | | | |
| Asset management | | Asset management fees-related party | | $ | 937 | | | $ | 7,532 | | | $ | (7,657) | |
| $ | 812 | |
| Reimbursements to Advisor Entities | | | | | | | | |
| Operating costs | | General and administrative expenses | | 6,401 | | | 8,789 | | | (12,655) | | | 2,535 | |
| Total | | | | $ | 7,338 | | | $ | 16,321 | | | $ | (20,312) | | | $ | 3,347 | |
| | | | | | | | | | | | | | | | | | | | | | | | | | | | | | | | |
| Reimbursements to Former Advisor Entities | | | | Due to Related Party as of December 31, 2022 | | Nine Months Ended September 30, 2023 | | Due to Related Party as of September 30, 2023 (Unaudited) |
| Financial Statement Location | | | Incurred | | Paid | |
| | | | | | | | |
| Operating costs | | General and administrative expenses/Transaction costs | | $ | 469 | | | $ | 520 | | (1) | $ | (697) | | | $ | 292 | |
| | | | | | | | | | |
_____________________________________Pursuant to(1)Represents costs incurred under the advisory agreement, forTSA during the nine months ended September 30, 2022, we issued 2.0 million shares totaling $7.7 million based on the estimated value per share on the date of each issuance, to an affiliate of the Advisor as part of its asset management fee. We will issue shares to satisfy outstanding asset management fees incurred and payable through the termination of the advisory agreement on October 21, 2022. As of September 30, 2022, the Advisor, the Sponsor and their affiliates owned a total of 9.4 million shares, or $36.6 million of our common stock based on our most recent estimated value per2023.
share. As of September 30, 2022, the Advisor, the Sponsor and their affiliates owned 4.8% of the total outstanding shares of our common stock.
Incentive Fee
NorthStar Healthcare Income OP Holdings, LLC,The Special Unit Holder, an affiliate of the Former Advisor, or the Special Unit Holder, iswas entitled to receive distributions equal to 15.0% of our net cash flows, whether from continuing operations, repayment of loans, disposition of assets or otherwise, but only after stockholders have received, in the aggregate, cumulative distributions equal to their invested capital plus a 6.75% cumulative, non-compounded annual pre-tax return on such invested capital. From inception through September 30, 2022,the Sale of Minority Interests, the Special Unit Holder hasdid not receivedreceive any incentive fees.
In connection with the Sale of Minority Interests, as of June 9, 2023, the Special Unit Holder became an indirect subsidiary of us, though the Special Unit Holder continues to have a contractual obligation to pay any such incentive fees to affiliates of the Former Sponsor, if ever earned.
Investments in Joint Ventures
Solstice, the manager of the Winterfell portfolio, is a joint venture between affiliates of ISL, who ownsown 80.0%, and us, who owns 20.0%. For the nine months ended September 30, 2022,2023, we recognized property management fee expense of $4.1$5.1 million paidpayable to Solstice related to the Winterfell portfolio.
The below table indicatesIn June 2023, we completed the Sale of Minority Interests, involving the sale of our investments for which the Sponsor is also an equity partnerminority interests in the Diversified US/UK Portfolio and Eclipse Portfolio, together with $1.1 million in cash, to our Former Sponsor, who is affiliated with the majority partner of each joint venture. Each investment was approved by our board of directors, includingventure, for all of our equity securities held by the Former Sponsor and its independent directors.affiliates. Refer to Note 4, “Investments in Unconsolidated Ventures” of Part I, Item 1. “Financial Statements”“—Transaction and Financing Activities” for further discussion of these investments:
| | | | | | | | | | | | | | | | | | | | |
Portfolio | | Partner(s) | | Acquisition Date | | Ownership |
Eclipse | | NRF and Partner/
Formation Capital, LLC | | May 2014 | | 5.6% |
Diversified US/UK | | NRF and Partner | | December 2014 | | 14.3% |
| | | | | | |
Linethe Sale of Credit - Related Party
In October 2017, we obtained the Sponsor Line, which was approved by our board of directors, including all of our independent directors. In April 2020, we borrowed $35.0 million under the Sponsor Line to improve our liquidity position in response to the COVID-19 pandemic. In July 2021, we repaid, in full, the $35.0 million outstanding borrowing and as of September 30, 2022, we had no outstanding borrowings under the Sponsor Line. The Sponsor Line had a borrowing capacity of $35.0 million at an interest rate of 3.5% plus LIBOR and had a maturity date of February 2024. On October 21, 2022, the Sponsor Line was terminated in connection with the termination of the advisory agreement. No amounts were outstanding under the Sponsor Line at the time of termination. Refer to “—Recent Developments” for additional information on the internalizationMinority Interests.
Item 3. Quantitative and Qualitative Disclosures About Market Risk
The principal market risks affecting us are interest rate risk, inflation risk and credit risk. These risks are dependent on various factors beyond our control, including monetary and fiscal policies, domestic and international economic conditions and political considerations. Our market risk sensitive assets, liabilities and related derivative positions (if any) are held for investment and not for trading purposes.
Interest Rate Risk
Changes in interest rates may affect our net income as a result of changes in interest expense incurred in connection with floating-rate borrowings used to finance our equity investments. As of September 30, 2022, 14.1%2023, 14.2% of our total borrowings were floating-rate liabilities, which are related to mortgage notes payable of our direct operating investments.
Our interest rate risk management objectives are to limit the impact of interest rate changes on earnings, prepayment penalties and cash flows and to lower overall borrowing costs by borrowing primarily at fixed rates. When borrowing at variable rates, we seek the lowest margins available and evaluate hedging opportunities. For our floating-rate borrowings we have entered into interest rate caps that involve the receipt of variable amounts from a counterparty if interest rates rise above the strike rate on the contract in exchange for an up-front premium.
For longer duration, relatively stable real estate cash flows, such as those derived from net lease assets, we seek to use fixed rate financing. For real estate cash flows with greater growth potential, such as operating properties, we may use floating-rate financing which provides prepayment flexibility and may provide a better match between underlying cash flow projections and potential increases in interest rates.
The interest rate on our floating-rate liabilities is a fixed spread over an index such as LIBORSOFR and typically reprices every 30 days based on LIBOR in effect at the time.days. As of September 30, 2022,2023, a hypothetical 100 basis point increase in interest rates would increasenot impact net annual interest expense by $1.0 million annually.
In July 2017,due to the Chief Executive of the U.K. Financial Conduct Authority, or FCA, announced that the FCA intends to stop persuading or compelling banks to submit rates for the calculation of LIBOR after 2021. The FCA subsequently announced on March 5, 2021 that the publication of LIBOR will cease for the one-week and two-month USD LIBOR settings immediately after December 31, 2021, and the remaining USD LIBOR settings immediately after June 30, 2023. Based on undertakings received from the panel banks, the FCA does not expect that any LIBOR settings will become unrepresentative before these dates. Nevertheless, the U.S. Federal Reserve System, Office of the Comptroller of the Currency, and Federal Deposit Insurance Corporation have issued guidance encouraging market participants to adopt alternatives to LIBORinterest rate caps in new contracts as soon as practicable.
The discontinuation of a benchmark rate or other financial metric, changes in a benchmark rate or other financial metric, or changes in market perceptions of the acceptability of a benchmark rate or other financial metric, including LIBOR, could, among other things result in increased interest payments, changes to our risk exposures, or require renegotiation of previous transactions. In addition, any such discontinuation or changes, whether actual or anticipated, could result in market volatility, adverse tax or accounting effects, increased compliance, legal and operational costs, and risks associated with contract negotiations.place.
Inflation Risk
Many of our costs are subject to inflationary pressures. These include labor, repairs and maintenance, food costs, utilities, insurance and other operating costs. Higher rates of inflation affecting the economy may substantially affect the operating margins of our investments. While our managers have an ability to partially offset cost inflation by increasing the rates charged to residents, this ability is often limited by competitive conditions and timing may lag behind cost volatility. Therefore, there can be no assurance that cost increases can be offset by increased rates charged to residents in real time or that increased rates will not result in occupancy declines.
Credit Risk
We are subject to the credit risk of the operators of our healthcare properties. The operator of our four net lease properties failed to remit contractual monthly rent obligations and it is not probable that these obligations will be satisfied in the foreseeable future.
Risk Concentration
The following table presents the operators and managers of our properties, excluding properties owned through unconsolidated joint ventures (dollars in thousands):
| | | As of September 30, 2022 | | Nine Months Ended September 30, 2022 | | As of September 30, 2023 | | Nine Months Ended September 30, 2023 |
| Operator / Manager | Operator / Manager | | Properties Under Management | | Units Under Management(1) | | Property and Other Revenues(2) | | % of Total Property and Other Revenues | Operator / Manager | | Properties Under Management | | Units Under Management(1) | | Property and Other Revenues(2) | | % of Total Property and Other Revenues |
Solstice Senior Living(3) | Solstice Senior Living(3) | | 32 | | | 4,000 | | | $ | 82,607 | | | 60.5 | % | Solstice Senior Living(3) | | 32 | | | 3,969 | | | $ | 94,469 | | | 61.2 | % |
| Watermark Retirement Communities | Watermark Retirement Communities | | 14 | | | 1,753 | | | 33,770 | | | 24.8 | % | Watermark Retirement Communities | | 14 | | | 1,782 | | | 35,967 | | | 23.2 | % |
| Avamere Health Services | Avamere Health Services | | 5 | | | 453 | | | 14,764 | | | 10.8 | % | Avamere Health Services | | 5 | | | 453 | | | 16,266 | | | 10.5 | % |
| Integral Senior Living | Integral Senior Living | | 1 | | | 44 | | | 3,628 | | | 2.7 | % | Integral Senior Living | | 1 | | | 40 | | | 3,672 | | | 2.4 | % |
Arcadia Management(4) | Arcadia Management(4) | | 4 | | | 572 | | | 1,220 | | | 0.9 | % | Arcadia Management(4) | | 4 | | | 572 | | | 1,178 | | | 0.8 | % |
Other(5) | Other(5) | | — | | | — | | | 456 | | | 0.3 | % | Other(5) | | — | | | — | | | 2,893 | | | 1.9 | % |
| Total | Total | | 56 | | | 6,822 | | | $ | 136,445 | | | 100.0 | % | Total | | 56 | | | 6,816 | | | $ | 154,445 | | | 100.0 | % |
(1)Represents rooms for ALFs, and ILFs and beds for MCFs, and SNFs, based on predominant type.
(2)Includes rental income received from our net lease properties, as well as rental income, ancillary service fees and other related revenue earned from ILF residents and resident fee income derived from our ALFs and MCFs, which includes resident room and care charges, ancillary fees and other resident service charges.
(3)Solstice is a joint venture of which affiliates of ISL own 80%.
(4)During the nine months ended September 30, 2022,2023, we recorded rental income to the extent rental payments were received.
(5)Consists primarily of interest income earned on corporate-level cash accounts.and cash equivalents.
Watermark Retirement Communities and Solstice, together with their affiliates, manage substantially all of our operating properties. As a result, we are dependent upon their personnel, expertise, technical resources and information systems, proprietary information, good faith and judgment to manage our properties efficiently and effectively. Through our 20.0% ownership of Solstice, we are entitled to certain rights and minority protections. As Solstice is a joint venture formed exclusively to operate the Winterfell portfolio, Solstice has generated, and may continue to generate, operating losses if our Winterfell portfolio experiences declines in occupancy and operating revenues at our Winterfell portfolio continue.revenues.
Item 4. Controls and Procedures
Internal Control over Financial Reporting
Changes in Internal Control over Financial Reporting.
There have not been any changes in our internal control over financial reporting (as defined in Rules 13a-15(f) and 15d-15(f) under the Exchange Act) during the most recent fiscal quarter that materially affected, or are reasonably likely to materially affect, our internal control over financial reporting.
Disclosure Controls and Procedures
Our management established and maintains disclosure controls and procedures that are designed to ensure that material information relating to us and our subsidiaries required to be disclosed in reports that are filed or submitted under the Securities Exchange Act of 1934, as amended, or Exchange Act, are recorded, processed, summarized and reported within the time periods specified in the SEC’s rules and forms, and that such information is accumulated and communicated to management, including our Chief Executive Officer and Chief Financial Officer, as appropriate, to allow timely decisions regarding required disclosures.
As of the end of the period covered by this report, management conducted an evaluation as required under Rules 13a-15(b) and 15d-15(b) under the Exchange Act, under the supervision and with the participation of the Company’s Chief Executive Officer and Chief Financial Officer of the effectiveness of the Company’s disclosure controls and procedures (as defined in Rules 13a-15(e) and 15d-15(e) under the Exchange Act).
Based on this evaluation, the Company’s Chief Executive Officer and Chief Financial Officer concluded that, as of the end of the period covered by this report, the Company’s disclosure controls and procedures are effective. Notwithstanding the foregoing, a control system, no matter how well designed and operated, can provide only reasonable, not absolute, assurance that it will detect or uncover failures to disclose material information otherwise required to be set forth in the Company’s periodic reports.
Our internal control framework, which includes controls over financial reporting and disclosure, continues to operate effectively. Considering the COVID-19 pandemic, we have supplemented our framework by instituting certain entity level procedures and controls that ensure communication amongst our team that enhances our ability to prevent and detect material errors and omissions.
Internal Control over Financial Reporting
Changes in Internal Control over Financial Reporting.
There have not been any changes in our internal control over financial reporting (as defined in Rules 13a-15(f) and 15d-15(f) under the Exchange Act) during the most recent fiscal quarter that materially affected, or are reasonably likely to materially affect, our internal control over financial reporting.
Part II—Other Information
Item 1. Legal Proceedings
We may be involved in various litigation matters arising in the ordinary course of our business. The effects of COVID-19 may also lead to heightened risk of litigation, with an ensuing increase in litigation-related costs. Although we are unable to predict with certainty the eventual outcome of any litigation, in the opinion of management, any current legal proceedings are not expected to have a material adverse effect on our financial position or results of operations.
Item 1A. Risk Factors
There are no material changes from the risk factors previously disclosed in our Annual Report on Form 10-K for the fiscal year ended December 31, 2021, as filed with the SEC on March 18, 2022, except as noted below.
If we pay distributions from sources other than our cash flow provided by operations, we will have less cash available for investments and your overall return may be reduced.
Our organizational documents permit us to pay distributions from any source, including offering proceeds, borrowings the Advisor’s agreement to defer, reduce or waive fees (or accept, in lieu of cash, shares of our common stock) or sales of assets or we may make distributions in the form of taxable stock dividends. We have not established a limit on the amount of proceeds we may use to fund distributions. We have funded distributions in the past in excess of our cash flow from operations. From February 2019 through April 2022operations and from June 2022 through September 2022, we did not declare any distributions.
We may not have sufficient cash availablecontinue to pay distributions atdo so in the rate we had paid during preceding periods or at all.future. If we pay distributions from sources other than our cash flow provided by operations, our book value may be negatively impacted and stockholders’ overall return may be reduced. In April 2022, our board of directors declared a special distribution to stockholders, of which approximately $97.0 million was paid in cash in May 2022, we paid the Special Distribution, which totaled $97.0 million,using proceeds from sources other than ourasset sales and not cash flow provided by operations.
As a result of the Internalization, we are newly self-managed.
As a result of the Internalization, we are a self-managed REIT. We no longer bear the costs of the various fees and expense reimbursements previously paid to the Advisor and its affiliates; however, we are now directly responsible for our expenses, including the compensation and benefits of our officers, employees and consultants, overhead and other general and administrative expenses previously paid by the Advisor and its affiliates. We are also now subject to potential liabilities that are commonly faced by employers, such as workers’ disability and compensation claims, potential labor disputes, and other employee-related liabilities and grievances, and we bear the cost of the establishment and maintenance ofdid not declare any employee compensation plans. We may encounter unforeseen costs, expenses, and difficulties managing these costs on a standalone basis. If we incur unexpected expenses as a result of our self-management, our results of operations could be lower than they otherwise would have been.
We may not realize some or all of the targeted benefits of the Internalization.
In connection with the Internalization, we entered into the TSA, pursuant to which the Advisor agreed to provide certain services for a transition period. The failure to effectively complete the transition of these services to a fully internal basis, efficiently manage the transition with the Advisor or find adequate internal replacements for these services, could impede our ability to achieve the targeted cost savings of the Internalization and adversely affect our operations. In addition, we anticipate operating on a smaller scale going forward, with fewer resources than have historically been available to us through our Adviser’s organization, which may adversely impact our ability to achieve our investment objectives. In addition, complexities arising from the Internalization could increase our overhead costs and detract from management’s ability to focus on operating our business. There can be no assurance we will be able to realize the expected cost savings or strategic benefits of the Internalization.
We are reliant on certain transition services provided by the Advisor under the TSA, and may not find a suitable provider for these transition services if the Advisor no longer provides the transition services to which we are entitled under the TSA.
We remain reliant on the Advisordistributions during the period of the TSA, and the loss of these transition services could adversely affect our operations. We are subject to the risk that the Advisor will default on its obligation to provide the transition services to which we are entitled under the TSA, or that we or the Advisor will terminate the TSA pursuant to its termination provisions, and that we will not be able to find a suitable replacement for the transition services provided under the TSA in a timely manner, at a reasonable cost or at all. In addition, the Advisor’s liability to us if it defaults on its obligation to provide transition services to us during the transition period is limited by the terms of the TSA, and we may not recover the full cost of any losses related to such a default.
nine months ended September 30, 2023.
Item 2. Unregistered Sales of Equity Securities and Use of Proceeds
Purchases of Equity Securities by the Issuer and Affiliated Purchasers
We adopted oura Share Repurchase Program effective August 7,in 2012, which enabled stockholdersshareholders to sell their shares to us in limited circumstances.circumstances and could be amended, suspended and terminated by our board of directors at any time in their sole discretion (subject to certain notice requirements set forth in the Share Repurchase Program). On April 7, 2020, in accordance with the terms of our Share Repurchase Program, our board of directors determined to suspendsuspended all repurchases under ourthe Share Repurchase Program effective April 30, 2020 in order to preserve capital and liquidity.liquidity and does not currently anticipate resuming the Share Repurchase Program.
Unregistered Sales of Equity Securities
We aredid not obligated to repurchaseissue any shares under our Share Repurchase Program when our Share Repurchase Program is in effect. Our board of directors may, in its sole discretion, amend, suspend or terminate our Share Repurchase Program at any time provided that any amendment that adversely affects the rights or obligations of a participant (as determined in the sole discretion of our board of directors) will only take effect upon ten days’ prior written notice except that changes in the number of shares that can be repurchasedcommon stock during any calendar year will take effect only upon ten business days’ prior written notice. In addition, our Share Repurchase Program will terminate in the event a secondary market develops for our shares or if our shares are listed on a national exchange or included for quotation in a national securities market.
For the nine months ended September 30, 2022, we have not repurchased any shares of our common stock.
Unregistered Sales of Equity Securities
On July 31, 2022, August 31, 2022 and September 30, 2022 we issued 204,700, 205,472 and 206,886 shares of common stock at $3.91 per share, respectively, to the Advisor as part of its asset management fee, pursuant to the advisory agreement. These shares were issued pursuant to an exemption from registration under Section 4(a)(2) of the Securities Act for transactions not involving a public offering.2023.
Item 3. Defaults Upon Senior Securities
Not applicable.None.
Item 4. Mine Safety Disclosures
Not applicable.
Item 5. Other Information
Securities Trading Plans of Directors and Executive Officers
During our last fiscal quarter, no director or officer, as defined in Rule 16a-1(f), adopted or terminated a “Rule 10b5-1 trading arrangement” or a “non-Rule 10b5-1 trading arrangement,” each as defined in Regulation S-K Item 408.
Determination of Estimated Value Per Share
Overview
On November 10, 2022,9, 2023, upon the recommendation of the Audit Committee of the Board of NorthStar Healthcare Income, Inc., the Board, including all of its independent directors, approved and established an estimated value per share of NorthStar Healthcare’s common stock of $2.93.$2.64. The estimated value per share is based upon the estimated value of NorthStar Healthcare’s assets less the estimated value of NorthStar Healthcare’s liabilities as of June 30, 2022,2023, divided by the number of shares of NorthStar Healthcare’s common stock outstanding as of June 30, 2022.2023. The information used to generate the estimated value per share, including market information, investment- and property-level data and other information provided by third parties, was the most recent information practically available as of June 30, 2022.2023.
Process
The estimated value per share was calculated with the assistance of NorthStar Healthcare’s management team or Management, and Kroll, LLC, or Kroll, an experienced third-party independent valuation and consulting firm engaged by NorthStar Healthcare to assist with theperform an appraisal and valuation of its assets and liabilities. The engagement of Kroll was approved by the Board, including all of its independent directors. Kroll has extensive experience in conducting asset valuations, including appraisals of healthcare properties similar to those owned by NorthStar Healthcare. While NorthStar Healthcare has engaged or may engage Kroll in the future for services of various kinds, NorthStar Healthcare believes that there are no material conflicts of interest with respect to its engagement of Kroll.
The Audit Committee recommended and the Board established the estimated value per share as of June 30, 2023 based upon the analyses and reports provided by Kroll and Management, including an evaluation of NorthStar Healthcare’s assets and liabilities as of June 30, 2022.management team. In arriving at its recommendation, the Audit Committee relied in part on valuation and appraisal methodologies that Kroll and ManagementNorthStar Healthcare’s management team believe are standard and acceptable in the real estate and non-listed REIT industries for the types of assets and liabilities held by
NorthStar Healthcare. The process for estimating the value of NorthStar Healthcare’s assets and liabilities was performed in accordance with the provisions of the Institute for Portfolio Alternatives Practice Guideline 2013-01, Valuations of Publicly Registered Non-Listed REITs. NorthStar Healthcare believes that the valuation was developed in a manner reasonably designed to ensure its reliability.
On November 10, 2022,9, 2023, Kroll delivered its report related to the valuation and appraisal of NorthStar Healthcare’s assets and liabilities as of June 30, 2022,2023, reflecting thean estimated range of values for NorthStar Healthcare’s 56 healthcare real estate properties, or the Healthcare Properties, including 56 consolidated Healthcare Properties, 6 of which have excess land and two undeveloped land parcels, or collectively the Direct Investments, and interests in 121 Healthcare Properties, two ancillary businesses and related assets and liabilities held through two unconsolidated joint ventures, collectively the Unconsolidated Investments, in each case less the fair value of outstanding borrowings on the Healthcare Properties, four healthcare real estate investments and one healthcare real estate property management platform held through unconsolidated joint ventures, or the Joint Venture Investments, and 52 healthcare real estate liabilities, or the Healthcare Borrowings.
The Board currently expects that NorthStar Healthcare’s next estimated value per share will be based upon its assets and liabilities as of June 30, 2023,2024, and that such value will be included in a report filed with the SEC. NorthStar Healthcare intends to publish estimated values per share annually, although NorthStar Healthcare may determine to publish such revised values more frequently.
Valuation Methodology
Valuation of Healthcare Properties
To estimate the range of value of the Healthcare Properties, Kroll conducted an appraisal for the Healthcare Properties performed in accordance with the Uniform Standards of Professional Appraisal Practice of the Appraisal Foundation and with an effective valuation date of June 30, 2022.2023. Kroll’s appraisals were certified by an appraiser licensed in the state in which the Healthcare Properties were located. In determining the value of each Healthcare Property, Kroll utilized all information that they deemed relevant, including information from Management,NorthStar Healthcare’s management team, and its own data sources, including trends in capitalization rates, leasing rates and other economic factors. In conducting its appraisals of the Healthcare Properties, other than for the undeveloped land parcels and any excess land associated with the Healthcare Properties, Kroll utilized both the direct capitalization approach and discounted cash flow, or the DCF, approach to value the Healthcare Properties.
In the direct capitalization approach, a market overall capitalization rate is applied to the estimated forward-year annual stabilized net operating income. In the DCF approach, a market terminal capitalization and discount rate isare utilized to derive a value indication from the estimated forward multi-year annual net operating income. Kroll placed primary emphasis on the direct capitalization approach for the operating Healthcare Properties and for the net leased Healthcare Properties with stable and long-term income streams. The DCF was completed as a secondary, confirmatory approach. Kroll placed primary emphasis on the DCF approach for the net leased Healthcare Properties with fluctuating cash flows or near-term lease expirations.that are not stabilized. Kroll believes the two methodologies are the most appropriate for valuing healthcare assets similar to those owned by NorthStar Healthcare. In selecting each capitalization rate range for the direct capitalization or DCF approach, Kroll took into account, among other factors, prevailing capitalization rates in the healthcare property sector, the property’s location, age and condition, the property’s operating trends and lease coverage ratios, if applicable, and other unique property factors. As applicable, Kroll adjusted the capitalized value range of each Healthcare Propertyinvestment it appraised for any excess land, deferred maintenance or other anticipated property capital expenditures, lease-up costs and other adjustments as appropriate to estimate the “as-is” value range of each of the Healthcare Properties it appraised. For the Healthcare Properties with excess land and undeveloped land parcels, Kroll valued the land by utilizing a comparable sales analysis, where land sales or listings in the market were analyzed and a market-based value indication per square foot or acre was derived and applied to the land parcel to determine the parcel’s estimated market value. Kroll adjusted the “as-is” property values as of June 30, 2022, as appropriate, for NorthStar Healthcare’s allocable ownership interest in the Healthcare Properties to account for the interests of any third-party investment partners, including any priority distributions. Kroll’ appraisals were certified by an appraiser licensed in the state in which the Healthcare Properties were located.
As of June 30, 2022, the estimated value of the Healthcare Properties underlying the $2.93 estimated per share value was $1.00 billion, compared with an aggregate cost, including purchase price, deferred costs, and other assets of $1.45 billion, or the Property Purchase Price. The following summarizes the key assumptions that were used in the DCF and direct capitalization analyses to arrive at the value of the Healthcare Properties:
| | | | | | | | | | | | | | | | | | | | |
| | Range | | Weighted Average |
| | Minimum | | Maximum | | |
| | | | | | |
Net Leased Senior Housing Properties(1) | | | | | | |
| Discount Rate | | 10.00 | % | | 10.00 | % | | 10.00 | % |
| Terminal Capitalization Rate | | 8.00 | % | | 8.00 | % | | 8.00 | % |
| | | | | | |
| Operating Senior Housing Properties | | | | | | |
| Direct Capitalization Rate | | 6.00 | % | | 7.00 | % | | 6.35 | % |
(1)Consists of four facilities in the Arbors net lease investments valued using the same terminal capitalization and discount rates.
Valuation of Joint Venture Investments
The healthcare real estate portfolios held through the four healthcare real estate Joint Venture Investments were valued similarly to the process described above in “Valuation of Healthcare Properties.” For each healthcare real estate Joint Venture Investment, KrollAfter establishing an estimated the aggregate value range of the underlying healthcare properties andfor each Healthcare Property, Kroll then added or subtracted, as appropriate, outstanding borrowings,the estimated fair value of Healthcare Borrowings after factoring in any adjustments for above- or below-market in-place financing, as deemed applicable based on information provided on such borrowings, and other joint venture balance sheet assets and liabilities to derive an estimated equity value range of the healthcare real estate Joint Venture Investments. Kroll then applied the terms of the applicable joint venture agreement, including any distribution priorities, to its equity value estimate to establish NorthStar Healthcare’s allocable share of these healthcare real estate Joint Venture Investments.
The one healthcare real estate property management platform held through a Joint Venture Investment, or the Solstice Joint Venture, is a property management venture that as of June 30, 2022 manages solely NorthStar Healthcare’s 32-property independent living portfolio, or the Winterfell Portfolio. To estimate the value of the Solstice Joint Venture, Kroll reviewed the joint venture agreements, historical revenues and earnings before interest, taxes, depreciation and amortization, or EBITDA, for the Solstice Joint Venture, historical and budgeted property operating revenues for the Winterfell Portfolio, the estimated property revenue utilized in the appraisal for the Winterfell Portfolio, and revenue and EBITDA valuation metrics associated with real estate management companies. Based on the above, Kroll determined an appropriate range of revenue and EBITDA multiples for the Solstice Joint Venture to determine a value range for the Solstice Joint Venture. Kroll then applied the terms of the Solstice Joint Venture agreements, including any distribution priorities and considering transfer rights associated with the joint venture interest, to its Solstice Joint Venture value estimate to establish the value range of NorthStar Healthcare’s interest in the Solstice Joint Venture.
As of June 30, 2022, the estimated value of the Joint Venture Investments underlying the $2.93 estimated per share value was $355.4 million, compared with an aggregate equity contribution, net of distributions in connection with asset sales, of $434.1 million, or the Joint Venture Equity Contribution. The following summarizes the key assumptions that were used in the DCF, direct capitalization, and Revenue and EBITDA valuation multiple analyses to arrive at the value of the Joint Venture Investments:
| | | | | | | | | | | | | | | | | | | | |
| | Range | | Weighted Average |
| | Minimum | | Maximum | | |
| Net Leased Senior Housing & Skilled Nursing Properties | | | | | | |
| Discount Rate | | 8.50 | % | | 15.50 | % | | 11.43 | % |
| Terminal Capitalization Rate | | 7.00 | % | | 12.50 | % | | 10.44 | % |
| Direct Capitalization Rate | | 6.50 | % | | 15.75 | % | | 9.61 | % |
| | | | | | |
| Operating Senior Housing & Skilled Nursing Properties | | | | | | |
| Direct Capitalization Rate | | 6.25 | % | | 9.25 | % | | 7.76 | % |
| | | | | | |
| Medical Office Buildings | | | | | | |
| Direct Capitalization Rate | | 5.75 | % | | 8.25 | % | | 6.36 | % |
| | | | | | |
| Net Leased Hospitals | | | | | | |
| Discount Rate | | 8.75 | % | | 8.75 | % | | 8.75 | % |
| Terminal Capitalization Rate | | 7.50 | % | | 7.50 | % | | 7.50 | % |
| Direct Capitalization Rate | | 7.00 | % | | 7.50 | % | | 7.29 | % |
| | | | | | |
| Property Management & Ancillary Businesses | | | | | | |
| Revenue Valuation Multiple | | 1.1x | | 1.2x | | 1.3x |
Valuation of Healthcare Borrowings
applicable. Kroll estimated the fair value range of NorthStar Healthcare’sthe long-term liabilities by discounting the stream of expected interest and principal payments for each liability by an interest rate range that Kroll estimated a current market participant would require for instruments with similar collateral and duration assuming an orderly market environment, taking into account factors such as remaining loan term, loan-to-value ratio, collateral type, debt service coverage, security position and other factors deemed relevant. AsIn the aggregate, the estimated market adjustment to our proportionate share of June 30, 2022, the gross estimated valueoutstanding principal balance of the Healthcare Borrowings underlyingtotaled $96.9 million, which reduced the $2.93 estimated per share value was $885.1 million, compared with an aggregate gross outstanding principal amountliabilities to fair value.
For both the Direct Investments where there is a minority joint venture partner and the Unconsolidated Investments, Kroll adjusted the values of $931.6 million. the Healthcare Properties, net of Healthcare Borrowings, and any other balance sheet assets and liabilities, for NorthStar Healthcare’s allocable ownership interest.
The discount rates used by Kroll toManagement Company Investment is a property management venture that as of June 30, 2023 manages solely NorthStar Healthcare’s 32-property independent living portfolio, or the Winterfell Portfolio. To estimate the value of the Management Company Investment, Kroll reviewed the joint venture agreement, historical revenues and earnings before interest, taxes, depreciation and amortization, or EBITDA, for the Management Company Investment, historical and budgeted property operating revenues for the Winterfell Portfolio, the estimated property revenue utilized in the appraisal for the Winterfell Portfolio, and revenue and EBITDA valuation metrics associated with real estate management companies. Based on the above, Kroll determined an appropriate range of revenue and EBITDA multiples for the Management Company Investment to determine a value range for the Management Company Investment. Kroll then applied the terms of the joint venture agreement, including any distribution priorities, to its Management Company Investment value estimate to establish the value range of NorthStar Healthcare’s interest in the Management Company Investment. In addition, Kroll utilized a similar valuation approach to establish an estimated range of value for the Unconsolidated Ventures’ ancillary businesses.
The following summarizes the key assumptions that were used in the DCF, direct capitalization, and Revenue and EBITDA valuation multiple analyses to arrive at the value of the Direct Investments, Unconsolidated Investments and Management Company Investment:
| | | | | | | | | | | | | | | | | | | | |
| | Range | | Weighted Average(1) |
| | Minimum | | Maximum | | |
| | | | | | |
| Healthcare Properties | | | | | | |
| Discount Rate | | 7.50 | % | | 12.25 | % | | 8.95 | % |
| Terminal Capitalization Rate | | 6.25 | % | | 11.00 | % | | 7.51 | % |
| Direct Capitalization Rate | | 6.00 | % | | 10.75 | % | | 7.26 | % |
| | | | | | |
| Property Management & Ancillary Businesses | | | | | | |
| Revenue Valuation Multiple | | 1.10x | | 1.30x | | 1.20x |
| | | | | | |
| Healthcare Borrowings | | | | | | |
| Discount Rate | | 3.04 | % | | 8.17 | % | | 5.89 | % |
(1)Weighted averages are calculated using the applicable ownership percentage for each Healthcare Borrowings ranged from approximately 4.50%Property and Healthcare Borrowing. Healthcare Properties’ property types for Direct Investments include independent living, assisted living & memory care facilities. In addition to 7.50% with a weighted average of approximately 6.28%.
Cash, Other Tangible Assetsthe same property types owned by the Direct Investments, the Unconsolidated Investments also own skilled nursing facilities, which have been ascribed higher capitalization and Other Liabilities
The fair value of NorthStar Healthcare’s cash, other tangible assets and liabilities was estimated by ManagementNorthStar Healthcare’s management team to approximate carrying value as of June 30, 20222023 and Kroll relied upon and utilized such amounts in its determination of the estimated value range per share.
Estimated Value Per Share
Based on the above valuations and estimates and subject to the assumptions and limiting conditions contained in its report, Kroll estimated the net asset value range per fully diluted common share outstanding of NorthStar Healthcare as of June 30, 20222023 from $2.54$2.30 to $3.31$2.98 per share. Based on its review of the Kroll report and the analysis of Management,NorthStar Healthcare’s management team, the Audit Committee recommended and the Board approved an estimated value per share of $2.93$2.64 as of June 30, 2022.
The table below illustrates a breakdown of NorthStar Healthcare’s estimated value per share as of June 30, 20222023 ($ in thousands, except per share values):
| | | | | | | | | | | | | | |
| | Estimated Value | | Estimated Value Per Share |
| Healthcare Properties | | $ | 1,000,650 | | | $ | 5.14 | |
| Joint Venture Investments | | 355,408 | | | 1.83 | |
| Investments Subtotal: | | 1,356,058 | | 6.97 | |
| Cash and other tangible assets | | 126,004 | | | 0.65 | |
| Healthcare Borrowings | | (885,126) | | | (4.55) | |
| Other Liabilities | | (24,776) | | | (0.13) | |
| Non Controlling Interests | | (2,126) | | | (0.01) | |
| Estimated net asset value as of June 30, 2022 | | $ | 570,034 | | | $ | 2.93 | |
| Estimated enterprise value per share | | | | None assumed |
| | | | |
| Shares outstanding (in thousands) | | 194,666 | | | |
In the aggregate, the estimated value
56
| | | | | | | | | | | | | | |
| | Estimated Value | | Estimated Value Per Share |
| Healthcare Properties, net Healthcare Borrowings, at ownership share | | $ | 387,184 | | | $ | 2.08 | |
| Cash and other tangible assets | | 124,711 | | | 0.67 | |
| Other liabilities | | (21,993) | | | (0.12) | |
| Estimated net asset value as of June 30, 2023 | | $ | 489,902 | | | $ | 2.64 | |
| Estimated enterprise value per share | | | | None assumed |
| | | | |
| Shares outstanding (in thousands) | | | | 185,712 | |
As previously described, the estimated value per share recommended by the Audit Committee and approved by the Board does not reflect NorthStar Healthcare’s “enterprise value,” which may include a premium or discount for:be affected by:
•the characteristics of NorthStar Healthcare’s working capital, leverage and other financial structures where some buyers may ascribe different values;
•investments through joint ventures, where NorthStar Healthcare owns a non-controlling interest and may have limited decision making authority, as some buyers may pay less for these types of investments;
•disposition and other expenses that would be necessary to realize the value;
•NorthStar Healthcare’s general and administrative expenses, including the costcosts to secure the services of Management on a long-term basis; orretain its management team; and
•the potential difference in per share value if NorthStar Healthcare were to list its shares of common stock on a national securities exchange.
On November 10, 2022,9, 2023, Kroll delivered its valuation report to the Audit Committee. The Audit Committee was given an opportunity to confer with Kroll and ManagementNorthStar Healthcare’s management team regarding the methodologies and assumptions used therein, and determined to recommend to the Board the estimated value per share of NorthStar Healthcare’s common stock.
The Board is ultimately and solely responsible for the establishment of the estimated value per share of NorthStar Healthcare’s common stock. In arriving at its determination of the estimated value per share, the Board considered all information provided in light of its own familiarity with NorthStar Healthcare’s assets and unanimously approved the estimated value recommended by the Audit Committee.
Sensitivity Analysis
Changes to the key assumptions used to arrive at the estimated value per share, including the capitalization rates and discount rates used to value the Healthcare Properties Joint Venture Investments and Healthcare Borrowings, would have a significant impact on the underlying value of NorthStar Healthcare’s assets. The following table presents the impact on the estimated value per share of NorthStar Healthcare’s common stock resulting from a 5.0% increase and decrease to both (1) the capitalization and discount rates used to value the Healthcare Properties (2) the capitalization and discount rates used to value the Joint Venture Investments (and the discount rates used in the determination of the debt fair market values within the Joint Venture Investments) and (3)(2) the discount rates used to value the Healthcare Borrowings:
| | | | | | | | | | | | | | | | | |
| Range of Value |
| Low | | Estimated Value | | High |
| Estimated Net Asset Value Per Share | $2.54 | | $2.93 | | $3.31 |
| | | | | |
| Healthcare Properties: | | | | | |
| Weighted Average Capitalization Rate | 6.66% | | 6.35% | | 6.03% |
| Weighted Average Discount Rate | 8.50% | | 8.10% | | 7.69% |
| | | | | |
| Joint Venture Investments: | | | | | |
Weighted Average Capitalization Rate(1) | 8.40% | | 7.99% | | 7.59% |
| Weighted Average Discount Rate | 12.12% | | 11.35% | | 10.98% |
| | | | | |
| Healthcare Borrowings: | | | | | |
| Weighted Average Discount Rate | 5.96% | | 6.28% | | 6.59% |
___________________
(1) Includes the effective revenue and EBITDA capitalization rate applied to the Solstice Joint Venture.
The following table presents the impact on the estimated value per share of NorthStar Healthcare’s common stock resulting from a 5.0% increase and decrease to (1) the capitalization and discount rates used to value the Healthcare Properties, (2) the capitalization and discount rates used to value the Joint Venture Investments (and the discount rates used in the determination of the debt fair market values within the Joint Venture Investments) and (3) the discount rates used to value the Healthcare Borrowings, with the impact of each asset or liability class within NorthStar Healthcare’s portfolio shown in isolation:
| | | | | | | | | | | | | | | | | |
| Range of Value |
| Low | | Estimated Value | | High |
| Healthcare Properties (Capitalization & Discount Rates) | $2.63 | | $2.93 | | $3.18 |
Joint Venture Investments (Capitalization & Discount Rates)(1) | $2.73 | | $2.93 | | $3.28 |
| Healthcare Borrowings (Discount Rates) | $2.92 | | $2.93 | | $2.94 |
_______________
(1) Includes the impact of 5% increase and decrease to the interest rates used in the determination of the debt fair market values within the Joint Venture Investments.
| | | | | | | | | | | | | | | | | |
| Sensitized Range of Value |
| Low | | Estimated Value | | High |
| Estimated Net Asset Value Per Share | $2.09 | | $2.64 | | $3.02 |
| | | | | |
| Healthcare Properties: | | | | | |
| Weighted Average Capitalization Rate | 7.62% | | 7.26% | | 6.90% |
| Weighted Average Discount Rate | 9.34% | | 8.95% | | 8.47% |
| | | | | |
| Healthcare Borrowings: | | | | | |
| Weighted Average Discount Rate | 5.60% | | 5.89% | | 6.19% |
The above sensitivity analysis differs from the methodology employed by Kroll to generate the range of estimated per share values in its report. The sensitivity analysis above assumes a 5.0% increase and decrease to the underlying valuation assumptions, which generally differs from the adjustments to the valuation assumptions employed by Kroll in its valuation report.
Limitations and Risks
As with any valuation methodology, the methodologies used to determine the estimated value per share are based upon a number of estimates and assumptions that may prove later to be inaccurate or incomplete. Further, different market participants using different assumptions and estimates could derive different estimated values.
Although the Board relied on estimated value ranges of NorthStar Healthcare’s assets and liabilities in establishing the estimated value per share, the estimated value per share may bear no relationship to NorthStar Healthcare’s book or asset value. In
addition, the estimated value per share may not represent the price at which the shares of NorthStar Healthcare’s common stock would trade on a national securities exchange, the amount realized in a sale, merger or liquidation of NorthStar Healthcare or the amount a stockholder would realize in a private sale of shares.
The estimated value of NorthStar Healthcare’s assets and liabilities is as of a specific date and such value is expected to fluctuate over time in response to future events, including but not limited to, the lasting effects of the COVID-19 pandemic, inflationary pressures on operating expenses, changes to commercial real estate values, particularly healthcare-related commercial real estate, developments related to individual assets, changes in market interest rates for commercial real estate debt and its impact on transaction executions, including, in particular, the current rising interest rate environment, changes in capitalization rates, rental and growth rates, changes in laws or regulations impacting the healthcare industry, demographic changes, returns on competing investments, changes in administrative expenses and other costs, the amount of distributions on NorthStar Healthcare’s common stock, repurchases of NorthStar Healthcare’s common stock, changes in the number of shares of NorthStar Healthcare’s common stock outstanding, the proceeds obtained for any common stock transactions, local and national economic factors and the factors specified in Part I, Item 1A. of NorthStar Healthcare’s Annual Report on Form 10-K for the fiscal year ended December 31, 20212022 and Part II, Item IA. of NorthStar Healthcare's Quarterly Report on Form 10-Q for the quarter ended September 30, 20222023 under the heading "Risk Factors". There is no assurance that the methodologies used to establish the estimated value per share would be acceptable to the Financial Industry Regulatory Authority, Inc. or in compliance with guidelines pursuant to the Employee Retirement Income Security Act of 1974 with respect to their reporting requirements.
EXHIBIT INDEX
| | | | | | | | |
Exhibit
Number | | Description of Exhibit |
| 3.1 | | |
| 3.2 | | |
| 3.3 | | |
| 4.1 | | |
| 10.1 | | |
| 31.1* | | |
| 31.2** | | |
| 32.1** | | |
| 32.2* | | |
| 101.INS* | | XBRL Instance Document - the instance document does not appear in the Interactive Data File because its XBRL tags are embedded within the Inline XBRL document |
| 101.SCH* | | Inline XBRL Taxonomy Extension Schema Document |
| 101.CAL* | | Inline XBRL Taxonomy Extension Calculation Linkbase Document |
| 101.DEF* | | Inline XBRL Taxonomy Extension Definition Linkbase Document |
| 101.LAB* | | Inline XBRL Taxonomy Extension Label Linkbase Document |
| 101.PRE* | | Inline XBRL Taxonomy Extension Presentation Linkbase Document |
| 104 | | Cover Page Interactive Data File (formatted as Inline XBRL and contained in Exhibit 101) |
* Filed herewith
** Furnished herewith
^ Portions of this exhibit have been omitted pursuant to Item 601(b)(10)(iv) of Regulation S-K.
^^ Certain schedules and similar attachments have been omitted in reliance on Item 601(a)(5) of Regulation S-K. The Company will provide, on a supplemental basis, a copy of any omitted schedule or attachment to the SEC or its staff upon request.
SIGNATURES
Pursuant to the requirements of the Securities Exchange Act of 1934, the Registrant has duly caused this report to be signed on its behalf by the undersigned thereunto duly authorized.
| | | | | | | | | | | | | | |
| | NorthStar Healthcare Income, Inc.
|
| Date: | November 10, 202213, 2023 | By: | /s/ KENDALL K. YOUNG |
| | | Name: | Kendall K. Young |
| | | Title: | Chief Executive Officer, President and Vice ChairmanDirector |
| | | | |
| | By: | /s/ NICHOLAS R. BALZO |
| | | Name: | Nicholas R. Balzo |
| | | Title: | Chief Financial Officer Treasurer and SecretaryTreasurer |