UNITED STATES
SECURITIES AND EXCHANGE COMMISSION
Washington, D.C. 20549
FORM 10-Q
| | | | | |
| ☒ | QUARTERLY REPORT PURSUANT TO SECTION 13 OR 15(d) OF THE SECURITIES EXCHANGE ACT OF 1934 |
For the quarterly period ended September 30, 2023March 31, 2024
or
| | | | | |
| ☐ | TRANSITION REPORT PURSUANT TO SECTION 13 OR 15(d) OF THE SECURITIES EXCHANGE ACT OF 1934 |
Commission File Number: 000-55190
NORTHSTAR HEALTHCARE INCOME, INC.
(Exact Name of Registrant as Specified in its Charter)
| | | | | |
| Maryland | 27-3663988 |
| (State or Other Jurisdiction of | (IRS Employer |
| Incorporation or Organization) | Identification No.) |
16 East 34th Street, 18th575 Lexington Avenue, 14th Floor, New York, NY 1001610022
(Address of Principal Executive Offices, Including Zip Code)
(929) 777-3135
(Registrant’s Telephone Number, Including Area Code)
16 East 34th Street, 18th Floor,
New York, NY 10016
(Former name or former address, if changed since last report.)
Securities registered pursuant to Section 12(b) of the Act:
| | | | | | | | | | | | | | |
| Title of each class | | Trading Symbol(s) | | Name of each exchange on which registered |
| Common stock, par value $0.01 per share | None | None |
Indicate by check mark whether the registrant (1) has filed all reports required to be filed by Section 13 or 15(d) of the Securities Exchange Act of 1934 during the preceding 12 months (or for such shorter period that the registrant was required to file such reports), and (2) has been subject to such filing requirements for the past 90 days. Yes ý No o
Indicate by check mark whether the registrant has submitted electronically every Interactive Data File required to be submitted pursuant to Rule 405 of Regulation S-T (§232.405 of this chapter) during the preceding 12 months (or for such shorter period that the registrant was required to submit such files). Yes ý No o
Indicate by check mark whether the registrant is a large accelerated filer, an accelerated filer, a non-accelerated filer, a smaller reporting company, or an emerging growth company. See the definitions of “large accelerated filer,” “accelerated filer,” “smaller reporting company,” and “emerging growth company” in Rule 12b-2 of the Exchange Act.
| | | | | | | | | | | | | | | | | | | | | | | |
| Large accelerated filer | ¨ | Accelerated filer | ¨ | Non-accelerated filer | ý | Smaller reporting company | ☐ |
| | | | | | Emerging growth company | ☐ |
If an emerging growth company, indicate by check mark if the registrant has elected not to use the extended transition period for complying with any new or revised financial accounting standards provided pursuant to Section 13(a) of the Exchange Act. o
Indicate by check mark whether the registrant is a shell company (as defined in Rule 12b-2 of the Exchange Act). Yes ☐ No ý
Indicate the number of shares outstanding of each of the registrant’s classes of common stock, as of the latest practicable date:
The Company has one class of common stock, $0.01 par value per share, 185,712,103 shares outstanding as of November 13, 2023.May 7, 2024.
NORTHSTAR HEALTHCARE INCOME, INC.
FORM 10-Q
TABLE OF CONTENTS
FORWARD-LOOKING STATEMENTS
This Quarterly Report on Form 10-Q contains certain “forward-looking statements” within the meaning of the Private Securities Litigation Reform Act of 1995, Section 27A of the Securities Act of 1933, as amended, or Securities Act, and Section 21E of the Securities Exchange Act of 1934, as amended, or Exchange Act. Forward-looking statements are generally identifiable by use of forward-looking terminology such as “may,” “will,” “should,” “potential,” “intend,” “expect,” “seek,” “anticipate,” “estimate,” “believe,” “could,” “project,” “predict,” “continue,” “future” or other similar words or expressions. Forward-looking statements are not guarantees of performance and are based on certain assumptions, discuss future expectations, describe plans and strategies, contain projections of results of operations or of financial condition or state other forward-looking information. Such statements include, but are not limited to, those relating to our ability to make distributions to our stockholders; our ability to retain our senior executives and other sufficient personnel to manage our business; our ability to realize substantial efficiencies as well as anticipated strategic and financial benefits of the internalization of our management function as operating costs and business disruption may be greater than expected;function; the operating performance of our investments,investments; our financing needs,needs; the effects of our current strategies and investment activitiesactivities; and our ability to effectively deploy capital. Our ability to predict results or the actual effect of plans or strategies is inherently uncertain. Although we believe that the expectations reflected in such forward-looking statements are based on reasonable assumptions, our actual results and performance could differ materially from those set forth in the forward-looking statements and you should not unduly rely on these statements. These forward-looking statements involve risks, uncertainties and other factors that may cause our actual results in future periods to differ materially from those forward-looking statements.
All forward-looking statements included in this Quarterly Report on Form 10-Q are based on information available to us on the date hereof and we are under no duty to update any of the forward-looking statements after the date of this report to conform these statements to actual results.
Factors that could have a material adverse effect on our operations and future prospects are set forth in our filings with the U.S. Securities and Exchange Commission, or the SEC, including Part I, Item 1A of our Annual Report on Form 10-K for the fiscal year ended December 31, 20222023 and in Part II, Item 1A of this Quarterly Report on Form 10-Q under the heading “Risk Factors.” The risk factors set forth in our filings with the SEC could cause our actual results to differ significantly from those contained in any forward-looking statement contained in this report.
PART I—Financial Information
Item 1. Financial Statements
NORTHSTAR HEALTHCARE INCOME, INC. AND SUBSIDIARIES
CONSOLIDATED BALANCE SHEETS
(Dollars in Thousands, Except Per Share Data)
| | September 30, 2023 (Unaudited) | | December 31, 2022 |
| March 31, 2024 (Unaudited) | | | March 31, 2024 (Unaudited) | | December 31, 2023 |
| Assets | Assets | | | | Assets | | | |
| Cash and cash equivalents | Cash and cash equivalents | $ | 87,581 | | | $ | 103,926 | |
| Restricted cash | Restricted cash | 11,386 | | | 11,734 | |
| Operating real estate, net | Operating real estate, net | 894,245 | | | 933,002 | |
| Investments in unconsolidated ventures ($3,075 held at fair value as of September 30, 2023) | 128,026 | | | 176,502 | |
| | Investments in unconsolidated ventures ($142 held at fair value as of March 31, 2024 and December 31, 2023) | |
| Assets held for sale | |
| Receivables, net | Receivables, net | 2,253 | | | 2,815 | |
| Intangible assets, net | Intangible assets, net | 2,000 | | | 2,253 | |
| Other assets | Other assets | 10,425 | | | 7,603 | |
Total assets(1) | Total assets(1) | $ | 1,135,916 | | | $ | 1,237,835 | |
| | Liabilities | Liabilities | |
| Liabilities | |
| Liabilities | |
| Mortgage notes payable, net | Mortgage notes payable, net | $ | 901,610 | | | $ | 912,248 | |
| | Mortgage notes payable, net | |
| Mortgage notes payable, net | |
| Due to related party | Due to related party | 292 | | | 469 | |
| Escrow deposits payable | Escrow deposits payable | 1,023 | | | 993 | |
| Accounts payable and accrued expenses | Accounts payable and accrued expenses | 23,967 | | | 21,034 | |
| Other liabilities | Other liabilities | 1,592 | | | 2,019 | |
Total liabilities(1) | Total liabilities(1) | 928,484 | | | 936,763 | |
| Commitments and contingencies (Note 12) | Commitments and contingencies (Note 12) | | | | Commitments and contingencies (Note 12) | | | |
| Equity | Equity | |
| NorthStar Healthcare Income, Inc. Stockholders’ Equity | NorthStar Healthcare Income, Inc. Stockholders’ Equity | |
| Preferred stock, $0.01 par value, 50,000,000 shares authorized, no shares issued and outstanding as of September 30, 2023 and December 31, 2022 | — | | | — | |
| Common stock, $0.01 par value, 400,000,000 shares authorized, 185,712,103 and 195,421,656 shares issued and outstanding as of September 30, 2023 and December 31, 2022, respectively | 1,857 | | | 1,954 | |
| NorthStar Healthcare Income, Inc. Stockholders’ Equity | |
| NorthStar Healthcare Income, Inc. Stockholders’ Equity | |
| Preferred stock, $0.01 par value, 50,000,000 shares authorized, no shares issued and outstanding as of March 31, 2024 and December 31, 2023 | |
| Preferred stock, $0.01 par value, 50,000,000 shares authorized, no shares issued and outstanding as of March 31, 2024 and December 31, 2023 | |
| Preferred stock, $0.01 par value, 50,000,000 shares authorized, no shares issued and outstanding as of March 31, 2024 and December 31, 2023 | |
| Common stock, $0.01 par value, 400,000,000 shares authorized, 185,712,103 shares issued and outstanding as of March 31, 2024 and December 31, 2023 | |
| Additional paid-in capital | Additional paid-in capital | 1,716,701 | | | 1,729,589 | |
| Retained earnings (accumulated deficit) | Retained earnings (accumulated deficit) | (1,511,765) | | | (1,428,840) | |
| Accumulated other comprehensive income (loss) | — | | | (3,679) | |
| | Total NorthStar Healthcare Income, Inc. stockholders’ equity | |
| Total NorthStar Healthcare Income, Inc. stockholders’ equity | |
| Total NorthStar Healthcare Income, Inc. stockholders’ equity | Total NorthStar Healthcare Income, Inc. stockholders’ equity | 206,793 | | | 299,024 | |
| Non-controlling interests | Non-controlling interests | 639 | | | 2,048 | |
| Total equity | Total equity | 207,432 | | | 301,072 | |
| Total liabilities and equity | Total liabilities and equity | $ | 1,135,916 | | | $ | 1,237,835 | |
(1)Includes $174.4$107.6 million and $180.2$174.9 million of assets and liabilities, respectively, of certain VIEs that are consolidated by the Operating Partnership.Partnership as of March 31, 2024. Refer to Note 2, “Summary of Significant Accounting Policies.”
Refer to accompanying notes to consolidated financial statements (unaudited).
NORTHSTAR HEALTHCARE INCOME, INC. AND SUBSIDIARIES
CONSOLIDATED STATEMENTS OF OPERATIONS
(Dollars in Thousands, Except Per Share Data)
(Unaudited)
| | Three Months Ended September 30, | | Nine Months Ended September 30, |
| 2023 | | 2022 | | 2023 | | 2022 |
| Three Months Ended March 31, | |
| Three Months Ended March 31, | |
| Three Months Ended March 31, | |
| 2024 | |
| 2024 | |
| 2024 | |
| Property and other revenues | |
| Property and other revenues | |
| Property and other revenues | Property and other revenues | | | | | | | |
| Resident fee income | Resident fee income | $ | 11,966 | | | $ | 11,274 | | | $ | 35,655 | | | $ | 32,987 | |
| Resident fee income | |
| Resident fee income | |
| Rental income | |
| Rental income | |
| Rental income | Rental income | 40,330 | | | 36,165 | | | 115,897 | | | 103,001 | |
| Other revenue | Other revenue | 1,078 | | | 300 | | | 2,893 | | | 457 | |
| Other revenue | |
| Other revenue | |
| Total property and other revenues | |
| Total property and other revenues | |
| Total property and other revenues | Total property and other revenues | 53,374 | | | 47,739 | | | 154,445 | | | 136,445 | |
| | Expenses | Expenses | |
| | Expenses | |
| | Expenses | |
| Property operating expenses | |
| Property operating expenses | |
| Property operating expenses | Property operating expenses | 36,890 | | | 35,134 | | | 106,993 | | | 101,258 | |
| Interest expense | Interest expense | 14,250 | | | 11,014 | | | 37,143 | | | 31,877 | |
| Interest expense | |
| Interest expense | |
| Transaction costs | Transaction costs | 358 | | | 857 | | | 455 | | | 857 | |
| Asset management fees - related party | — | | | 2,428 | | | — | | | 7,532 | |
| Transaction costs | |
| Transaction costs | |
| General and administrative expenses | |
| General and administrative expenses | |
| General and administrative expenses | General and administrative expenses | 2,921 | | | 2,859 | | | 10,424 | | | 10,300 | |
| Depreciation and amortization | Depreciation and amortization | 9,848 | | | 9,642 | | | 29,305 | | | 29,105 | |
| Depreciation and amortization | |
| Depreciation and amortization | |
| Impairment loss | |
| Impairment loss | |
| Impairment loss | Impairment loss | — | | | 18,500 | | | 43,422 | | | 31,502 | |
| Total expenses | Total expenses | 64,267 | | | 80,434 | | | 227,742 | | | 212,431 | |
| Total expenses | |
| Total expenses | |
| Other income (loss) | |
| Other income (loss) | |
| Other income (loss) | Other income (loss) | |
| Other income, net | Other income, net | — | | | — | | | 202 | | | 77 | |
| Other income, net | |
| Other income, net | |
| Gain (loss) on investments and other | |
| Gain (loss) on investments and other | |
| Gain (loss) on investments and other | Gain (loss) on investments and other | (347) | | | 325 | | | (4,662) | | | 660 | |
| Income (loss) before equity in earnings (losses) of unconsolidated ventures and income tax expense | Income (loss) before equity in earnings (losses) of unconsolidated ventures and income tax expense | (11,240) | | | (32,370) | | | (77,757) | | | (75,249) | |
| Income (loss) before equity in earnings (losses) of unconsolidated ventures and income tax expense | |
| Income (loss) before equity in earnings (losses) of unconsolidated ventures and income tax expense | |
| Equity in earnings (losses) of unconsolidated ventures | |
| Equity in earnings (losses) of unconsolidated ventures | |
| Equity in earnings (losses) of unconsolidated ventures | Equity in earnings (losses) of unconsolidated ventures | (127) | | | 2,872 | | | (6,595) | | | 39,427 | |
| Income tax expense | Income tax expense | (17) | | | (15) | | | (43) | | | (45) | |
| Income tax expense | |
| Income tax expense | |
| Net income (loss) | |
| Net income (loss) | |
| Net income (loss) | Net income (loss) | (11,384) | | | (29,513) | | | (84,395) | | | (35,867) | |
| Net (income) loss attributable to non-controlling interests | Net (income) loss attributable to non-controlling interests | 166 | | | 73 | | | 1,470 | | | 298 | |
| Net (income) loss attributable to non-controlling interests | |
| Net (income) loss attributable to non-controlling interests | |
| Net income (loss) attributable to NorthStar Healthcare Income, Inc. common stockholders | |
| Net income (loss) attributable to NorthStar Healthcare Income, Inc. common stockholders | |
| Net income (loss) attributable to NorthStar Healthcare Income, Inc. common stockholders | Net income (loss) attributable to NorthStar Healthcare Income, Inc. common stockholders | $ | (11,218) | | | $ | (29,440) | | | $ | (82,925) | | | $ | (35,569) | |
Net income (loss) per share of common stock, basic/diluted(1) | Net income (loss) per share of common stock, basic/diluted(1) | $ | (0.06) | | | $ | (0.15) | | | $ | (0.43) | | | $ | (0.18) | |
Net income (loss) per share of common stock, basic/diluted(1) | |
Net income (loss) per share of common stock, basic/diluted(1) | |
Weighted average number of shares of common stock outstanding, basic/diluted(1) | |
Weighted average number of shares of common stock outstanding, basic/diluted(1) | |
Weighted average number of shares of common stock outstanding, basic/diluted(1) | Weighted average number of shares of common stock outstanding, basic/diluted(1) | 185,712,103 | | | 194,670,948 | | | 191,367,117 | | | 194,032,819 | |
| Distributions declared per share of common stock | Distributions declared per share of common stock | $ | — | | | $ | — | | | $ | — | | | $ | 0.50 | |
| Distributions declared per share of common stock | |
| Distributions declared per share of common stock | |
(1) The Company had issued 203,742 and 116,712 restricted stock units as of September 30,March 31, 2024 and 2023, and September 30, 2022, respectively. The restricted stock units have been excluded from the diluted earnings per share calculation as their impact is anti-dilutive due to the net loss generated during the three and nine months ended September 30, 2023March 31, 2024 and 2022.2023.
Refer to accompanying notes to consolidated financial statements (unaudited).
NORTHSTAR HEALTHCARE INCOME, INC. AND SUBSIDIARIES
CONSOLIDATED STATEMENTS OF COMPREHENSIVE INCOME (LOSS)
(Dollars in Thousands)
(Unaudited)
| | Three Months Ended September 30, | | Nine Months Ended September 30, |
| 2023 | | 2022 | | 2023 | | 2022 |
| | Three Months Ended March 31, | |
| | Three Months Ended March 31, | |
| | Three Months Ended March 31, | |
| | 2024 | |
| | 2024 | |
| | 2024 | |
| Net income (loss) | |
| Net income (loss) | |
| Net income (loss) | Net income (loss) | | $ | (11,384) | | | $ | (29,513) | | | $ | (84,395) | | | $ | (35,867) | |
| Other comprehensive income (loss) | Other comprehensive income (loss) | |
| Other comprehensive income (loss) | |
| Other comprehensive income (loss) | |
| Foreign currency translation adjustments related to investment in unconsolidated venture | |
| Foreign currency translation adjustments related to investment in unconsolidated venture | |
| Foreign currency translation adjustments related to investment in unconsolidated venture | Foreign currency translation adjustments related to investment in unconsolidated venture | | — | | | (1,664) | | | 3,679 | | | (4,602) | |
| Total other comprehensive income (loss) | Total other comprehensive income (loss) | | — | | | (1,664) | | | 3,679 | | | (4,602) | |
| Total other comprehensive income (loss) | |
| Total other comprehensive income (loss) | |
| Comprehensive income (loss) | |
| Comprehensive income (loss) | |
| Comprehensive income (loss) | Comprehensive income (loss) | | (11,384) | | | (31,177) | | | (80,716) | | | (40,469) | |
| Comprehensive (income) loss attributable to non-controlling interests | Comprehensive (income) loss attributable to non-controlling interests | | 166 | | | 73 | | | 1,470 | | | 298 | |
| Comprehensive (income) loss attributable to non-controlling interests | |
| Comprehensive (income) loss attributable to non-controlling interests | |
| Comprehensive income (loss) attributable to NorthStar Healthcare Income, Inc. common stockholders | Comprehensive income (loss) attributable to NorthStar Healthcare Income, Inc. common stockholders | | $ | (11,218) | | | $ | (31,104) | | | $ | (79,246) | | | $ | (40,171) | |
| Comprehensive income (loss) attributable to NorthStar Healthcare Income, Inc. common stockholders | |
| Comprehensive income (loss) attributable to NorthStar Healthcare Income, Inc. common stockholders | |
Refer to accompanying notes to consolidated financial statements (unaudited).
NORTHSTAR HEALTHCARE INCOME, INC. AND SUBSIDIARIES
CONSOLIDATED STATEMENTS OF EQUITY
(Dollars and Shares in Thousands)
| | Common Stock | | Additional Paid-in Capital | | Retained Earnings (Accumulated Deficit) | | Accumulated Other Comprehensive Income (Loss) | | Total Company’s Stockholders’ Equity | | Non-controlling Interests | | Total Equity |
| Shares | | Amount | |
| Balance as of December 31, 2021 | 193,121 | | | $ | 1,930 | | | $ | 1,720,719 | | | $ | (1,277,688) | | | $ | (486) | | | $ | 444,475 | | | $ | 2,343 | | | $ | 446,818 | |
| Share-based payment of advisor asset management fees | 698 | | | 7 | | | 2,722 | | | — | | | — | | | 2,729 | | | — | | | 2,729 | |
| Amortization of equity-based compensation | — | | | — | | | 15 | | | — | | | — | | | 15 | | | — | | | 15 | |
| Common Stock | | | Common Stock | | Additional Paid-in Capital | | Retained Earnings (Accumulated Deficit) | | Accumulated Other Comprehensive Income (Loss) | | Total Company’s Stockholders’ Equity | | Non-controlling Interests | | Total Equity |
| Shares | |
| Balance as of December 31, 2022 | |
| Balance as of December 31, 2022 | |
| Balance as of December 31, 2022 | |
| Non-controlling interests - contributions | Non-controlling interests - contributions | — | | | — | | | — | | | — | | | — | | | — | | | 64 | | | 64 | |
| Non-controlling interests - distributions | Non-controlling interests - distributions | — | | | — | | | — | | | — | | | — | | | — | | | (53) | | | (53) | |
| Other comprehensive income (loss) | Other comprehensive income (loss) | — | | | — | | | — | | | — | | | (568) | | | (568) | | | — | | | (568) | |
| Net income (loss) | Net income (loss) | — | | | — | | | — | | | (12,936) | | | — | | | (12,936) | | | (45) | | | (12,981) | |
| Balance as of March 31, 2022 (Unaudited) | 193,819 | | | $ | 1,937 | | | $ | 1,723,456 | | | $ | (1,290,624) | | | $ | (1,054) | | | $ | 433,715 | | | $ | 2,309 | | | $ | 436,024 | |
| Share-based payment of advisor asset management fees | 637 | | | 8 | | | 2,507 | | | — | | | — | | | 2,515 | | | — | | | 2,515 | |
| Balance as of March 31, 2023 (Unaudited) | |
| | Balance as of December 31, 2023 | |
| Balance as of December 31, 2023 | |
| Balance as of December 31, 2023 | |
| Amortization of equity-based compensation | Amortization of equity-based compensation | — | | | — | | | 13 | | | — | | | — | | | 13 | | | — | | | 13 | |
| Non-controlling interests - contributions | Non-controlling interests - contributions | — | | | — | | | — | | | — | | | — | | | — | | | 113 | | | 113 | |
| Non-controlling interests - distributions | Non-controlling interests - distributions | — | | | — | | | — | | | — | | | — | | | — | | | (61) | | | (61) | |
| Distributions declared | — | | | — | | | — | | | (97,052) | | | — | | | (97,052) | | | — | | | (97,052) | |
| Other comprehensive income (loss) | — | | | — | | | — | | | — | | | (2,370) | | | (2,370) | | | — | | | (2,370) | |
| Net income (loss) | Net income (loss) | — | | | — | | | — | | | 6,807 | | | — | | | 6,807 | | | (180) | | | 6,627 | |
| Balance as of June 30, 2022 (Unaudited) | 194,456 | | | $ | 1,945 | | | $ | 1,725,976 | | | $ | (1,380,869) | | | $ | (3,424) | | | $ | 343,628 | | | $ | 2,181 | | | $ | 345,809 | |
| Share-based payment of advisor asset management fees | 623 | | | 6 | | | 2,407 | | | — | | | — | | | 2,413 | | | — | | | 2,413 | |
| | Non-controlling interests - contributions | — | | | — | | | — | | | — | | | — | | | — | | | 86 | | | 86 | |
| Non-controlling interests - distributions | — | | | — | | | — | | | — | | | — | | | — | | | (74) | | | (74) | |
| | Other comprehensive income (loss) | — | | | — | | | — | | | — | | | (1,664) | | | (1,664) | | | — | | | (1,664) | |
| Net income (loss) | — | | | — | | | — | | | (29,440) | | | — | | | (29,440) | | | (73) | | | (29,513) | |
| Balance as of September 30, 2022 (Unaudited) | 195,079 | | | $ | 1,951 | | | $ | 1,728,383 | | | $ | (1,410,309) | | | $ | (5,088) | | | $ | 314,937 | | | $ | 2,120 | | | $ | 317,057 | |
| Balance as of March 31, 2024 (Unaudited) | |
Refer to accompanying notes to consolidated financial statements (unaudited).
NORTHSTAR HEALTHCARE INCOME, INC. AND SUBSIDIARIES
CONSOLIDATED STATEMENTS OF EQUITYCASH FLOWS
(Dollars and Shares in Thousands)
(Unaudited)
| | | | | | | | | | | | | | | | | | | | | | | | | | | | | | | | | | | | | | | | | | | | | | | |
| Common Stock | | Additional Paid-in Capital | | Retained Earnings (Accumulated Deficit) | | Accumulated Other Comprehensive Income (Loss) | | Total Company’s Stockholders’ Equity | | Non-controlling Interests | | Total Equity |
| Shares | | Amount | | | | | | |
| Balance as of December 31, 2022 | 195,422 | | | $ | 1,954 | | | $ | 1,729,589 | | | $ | (1,428,840) | | | $ | (3,679) | | | $ | 299,024 | | | $ | 2,048 | | | $ | 301,072 | |
| | | | | | | | | | | | | | | |
| | | | | | | | | | | | | | | |
| Non-controlling interests - contributions | — | | | — | | | — | | | — | | | — | | | — | | | 45 | | | 45 | |
| Non-controlling interests - distributions | — | | | — | | | — | | | — | | | — | | | — | | | (22) | | | (22) | |
| | | | | | | | | | | | | | | |
| | | | | | | | | | | | | | | |
| | | | | | | | | | | | | | | |
| Other comprehensive income (loss) | — | | | — | | | — | | | — | | | 1,248 | | | 1,248 | | | — | | | 1,248 | |
| Net income (loss) | — | | | — | | | — | | | (13,926) | | | — | | | (13,926) | | | (71) | | | (13,997) | |
| Balance as of March 31, 2023 (Unaudited) | 195,422 | | | $ | 1,954 | | | $ | 1,729,589 | | | $ | (1,442,766) | | | $ | (2,431) | | | $ | 286,346 | | | $ | 2,000 | | | $ | 288,346 | |
| Non-controlling interests - contributions | — | | | — | | | — | | | — | | | — | | | — | | | 55 | | | 55 | |
| Non-controlling interests - distributions | — | | | — | | | — | | | — | | | — | | | — | | | (33) | | | (33) | |
| Retirement of common stock (Note 8) | (9,710) | | | (97) | | | (13,302) | | | — | | | — | | | (13,399) | | | — | | | (13,399) | |
| Other comprehensive income (loss) | — | | | — | | | — | | | — | | | (844) | | | (844) | | | — | | | (844) | |
Reclassification of accumulated other comprehensive loss(1) | — | | | — | | | — | | | — | | | 3,275 | | | 3,275 | | | — | | | 3,275 | |
| Net income (loss) | — | | | — | | | — | | | (57,781) | | | — | | | (57,781) | | | (1,233) | | | (59,014) | |
| Balance as of June 30, 2023 (Unaudited) | 185,712 | | | $ | 1,857 | | | $ | 1,716,287 | | | $ | (1,500,547) | | | $ | — | | | $ | 217,597 | | | $ | 789 | | | $ | 218,386 | |
| Amortization of equity-based compensation | — | | | — | | | 414 | | | — | | | — | | | 414 | | | — | | | 414 | |
| Non-controlling interests - contributions | — | | | — | | | — | | | — | | | — | | | — | | | 44 | | | 44 | |
| Non-controlling interests - distributions | — | | | — | | | — | | | — | | | — | | | — | | | (28) | | | (28) | |
| | | | | | | | | | | | | | | |
| | | | | | | | | | | | | | | |
| | | | | | | | | | | | | | | |
| Net income (loss) | — | | | — | | | — | | | (11,218) | | | — | | | (11,218) | | | (166) | | | (11,384) | |
| Balance as of September 30, 2023 (Unaudited) | 185,712 | | | $ | 1,857 | | | $ | 1,716,701 | | | $ | (1,511,765) | | | $ | — | | | $ | 206,793 | | | $ | 639 | | | $ | 207,432 | |
| | | | | | | | | | | |
| Three Months Ended March 31, |
| 2024 | | 2023 |
| Cash flows from operating activities: | | | |
| Net income (loss) | $ | (8,047) | | | $ | (13,997) | |
| Adjustments to reconcile net income (loss) to net cash provided by (used in) operating activities: | | | |
| Equity in (earnings) losses of unconsolidated ventures | (1,014) | | | 3,922 | |
| Depreciation and amortization | 8,901 | | | 9,649 | |
| Impairment loss | 456 | | | — | |
| | | |
| Amortization of below market debt | 844 | | | 824 | |
| | | |
| | | |
| Amortization of deferred financing costs | 140 | | | 155 | |
| Amortization of equity-based compensation | 56 | | | 57 | |
| | | |
| (Gain) loss on investments and other | 178 | | | (332) | |
| Change in allowance for uncollectible accounts | 139 | | | 167 | |
| | | |
| | | |
| Changes in assets and liabilities: | | | |
| Receivables | (438) | | | 587 | |
| Other assets | 628 | | | (374) | |
| Due to related party | (121) | | | (208) | |
| Escrow deposits payable | 367 | | | 330 | |
| Accounts payable and accrued expenses | (1,203) | | | (4,445) | |
| Other liabilities | 41 | | | 129 | |
| Net cash provided by (used in) operating activities | 927 | | | (3,536) | |
| Cash flows from investing activities: | | | |
| Capital expenditures for operating real estate | (2,926) | | | (3,810) | |
| Sales of real estate | 11,573 | | | 135 | |
| | | |
| | | |
| | | |
| Distributions from unconsolidated ventures | — | | | 2,334 | |
| | | |
| Sales of other assets | — | | | 523 | |
| Net cash provided by (used in) investing activities | 8,647 | | | (818) | |
| Cash flows from financing activities: | | | |
| | | |
| Repayments of mortgage notes | (15,299) | | | (4,819) | |
| | | |
| | | |
| | | |
| Payments on financing and other obligations | (13) | | | (32) | |
| | | |
| | | |
| | | |
| Contributions from non-controlling interests | 13 | | | 45 | |
| Distributions to non-controlling interests | (38) | | | (22) | |
| Net cash provided by (used in) financing activities | (15,337) | | | (4,828) | |
| Net increase (decrease) in cash, cash equivalents and restricted cash | (5,763) | | | (9,182) | |
| Cash, cash equivalents and restricted cash-beginning of period | 92,943 | | | 115,660 | |
| Cash, cash equivalents and restricted cash-end of period | $ | 87,180 | | | $ | 106,478 | |
(1)
The Company reclassified the accumulated other comprehensive loss related to foreign currency adjustments for an unconsolidated venture ownership interest that was sold during the three months ended June 30, 2023. The accumulated balance was reclassified to gain (loss) on investments and other on the consolidated statements of operations.
| | | | | | | | | | | |
| Three Months Ended March 31, |
| 2024 | | 2023 |
| Supplemental disclosure of cash flow information: | | | |
| Cash paid for interest | $ | 8,673 | | | $ | 10,434 | |
| | | |
| Supplemental disclosure of non-cash investing and financing activities: | | | |
| Accrued capital expenditures | $ | 972 | | | $ | 1,071 | |
| | | |
| | | |
| Reclassification of assets held for sale | 534 | | | — | |
| | | |
Refer to accompanying notes to consolidated financial statements (unaudited).
NORTHSTAR HEALTHCARE INCOME, INC. AND SUBSIDIARIES
CONSOLIDATED STATEMENTS OF CASH FLOWS
(Dollars in Thousands)
(Unaudited)
| | | | | | | | | | | |
| Nine Months Ended September 30, |
| 2023 | | 2022 |
| Cash flows from operating activities: | | | |
| Net income (loss) | $ | (84,395) | | | $ | (35,867) | |
| Adjustments to reconcile net income (loss) to net cash provided by (used in) operating activities: | | | |
| Equity in (earnings) losses of unconsolidated ventures | 6,595 | | | (39,427) | |
| Depreciation and amortization | 29,305 | | | 29,105 | |
| Impairment loss | 43,422 | | | 31,502 | |
| | | |
| Amortization of below market debt | 2,487 | | | 2,428 | |
| | | |
| | | |
| Amortization of deferred financing costs | 988 | | | 475 | |
| Amortization of equity-based compensation | 170 | | | 150 | |
| | | |
| (Gain) loss on investments and other | 4,662 | | | (660) | |
| Change in allowance for uncollectible accounts | 360 | | | 326 | |
| Issuance of common stock as payment for asset management fees | — | | | 7,532 | |
| Distributions from unconsolidated ventures | 10,640 | | | — | |
| Changes in assets and liabilities: | | | |
| Receivables | 203 | | | (114) | |
| Other assets | (3,786) | | | 3,583 | |
| Due to related party | (177) | | | (3,868) | |
| Escrow deposits payable | 30 | | | 256 | |
| Accounts payable and accrued expenses | 2,640 | | | (8,727) | |
| Other liabilities | (78) | | | (298) | |
| Net cash provided by (used in) operating activities | 13,066 | | | (13,604) | |
| Cash flows from investing activities: | | | |
| Capital expenditures for operating real estate | (28,425) | | | (17,924) | |
| Sales of real estate | 135 | | | — | |
| | | |
| | | |
| Distributions from unconsolidated ventures | 13,472 | | | 42,173 | |
| | | |
| Sales of other assets | 523 | | | — | |
| Net cash provided by (used in) investing activities | (14,295) | | | 24,249 | |
| Cash flows from financing activities: | | | |
| | | |
| Repayments of mortgage notes | (14,066) | | | (16,514) | |
| Payment of deferred financing costs | (48) | | | — | |
| | | |
| Payments under finance leases | (96) | | | (36) | |
| Acquisition and retirement of common stock | (1,315) | | | (408) | |
| Distributions paid on common stock | — | | | (97,018) | |
| | | |
| Contributions from non-controlling interests | 144 | | | 263 | |
| Distributions to non-controlling interests | (83) | | | (188) | |
| Net cash provided by (used in) financing activities | (15,464) | | | (113,901) | |
| Net increase (decrease) in cash, cash equivalents and restricted cash | (16,693) | | | (103,256) | |
| Cash, cash equivalents and restricted cash-beginning of period | 115,660 | | | 210,938 | |
| Cash, cash equivalents and restricted cash-end of period | $ | 98,967 | | | $ | 107,682 | |
| | | | | | | | | | | |
| Nine Months Ended September 30, |
| 2023 | | 2022 |
| Supplemental disclosure of cash flow information: | | | |
| Cash paid for interest | $ | 29,666 | | | $ | 28,625 | |
| Cash paid for income taxes | 61 | | | 41 | |
| Supplemental disclosure of non-cash investing and financing activities: | | | |
| Accrued capital expenditures | $ | 540 | | | $ | 2,561 | |
| | | |
| Exchange of ownership interests in unconsolidated ventures for common stock | 13,399 | | | — | |
| Assets acquired under capital lease obligations | 25 | | | — | |
Refer to accompanying notes to consolidated financial statements (unaudited).
NORTHSTAR HEALTHCARE INCOME, INC. AND SUBSIDIARIES
NOTES TO CONSOLIDATED FINANCIAL STATEMENTS
(Unaudited)
1. Business and Organization
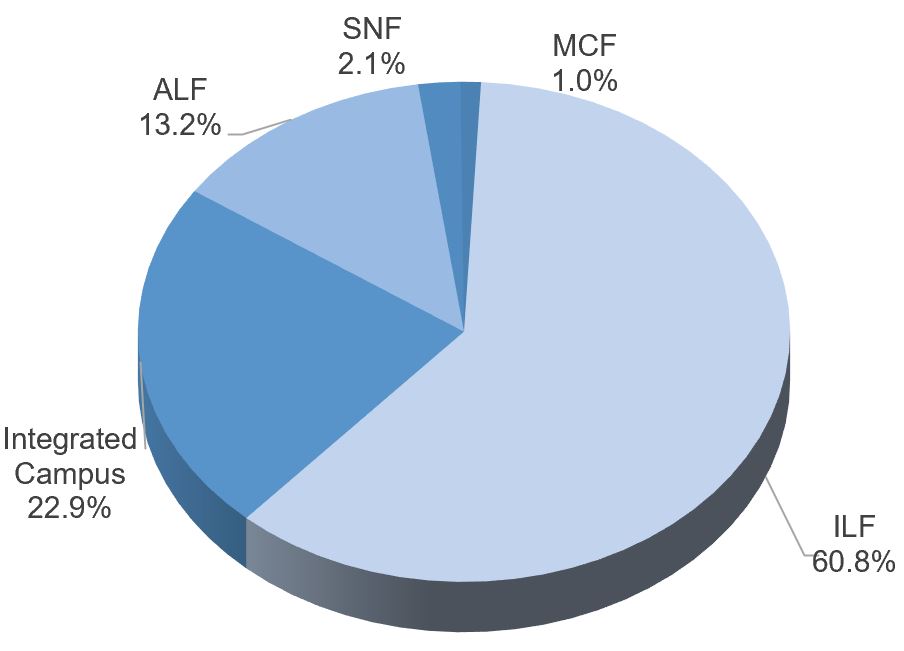
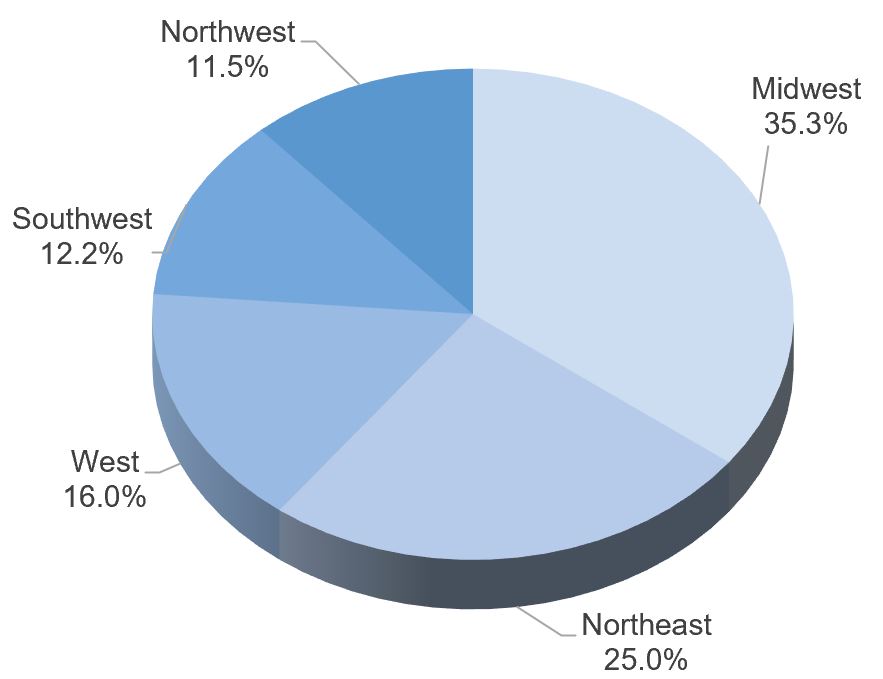
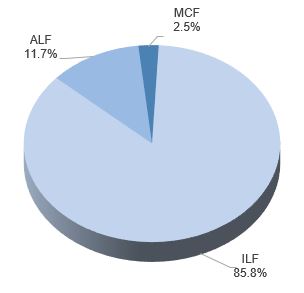
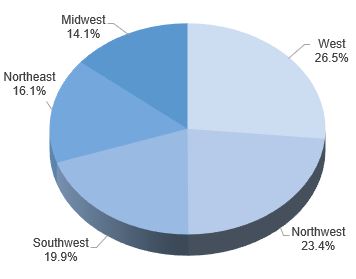
NorthStar Healthcare Income, Inc., together with its consolidated subsidiaries (the “Company”), owns a diversified portfolio of seniors housing properties, including independent living facilities (“ILF”), assisted living facilities (“ALF”) and memory care facilities (“MCF”) located throughout the United States. In addition, the Company also has investmentsan investment through a non-controlling interests in joint venturesinterest in a broader spectrum of healthcare real estate, including seniors housing properties, as well asjoint venture that invests in integrated senior health campuses, which provide services associated with ILFs, ALFs, MCFs and skilled nursing facilities (“SNF”) and ancillary services businesses, located throughout, across the Midwest region of the United States.
The Company was formed in October 2010 as a Maryland corporation and commenced operations in February 2013. The Company elected to be taxed as a real estate investment trust (“REIT”) under the Internal Revenue Code of 1986, as amended (the “Internal Revenue Code”), commencing with the taxable year ended December 31, 2013. The Company has conducted its operations, and intends to do so in the future, so as to continue to qualify as a REIT for U.S. federal income tax purposes.
Substantially all of the Company’s business is conducted through NorthStar Healthcare Income Operating Partnership, LP (the “Operating Partnership”). The Company is the sole general partner of the Operating Partnership. The limited partners of the Operating Partnership are NorthStar Healthcare Income Advisor, LLC and NorthStar Healthcare Income OP Holdings, LLC (the “Special Unit Holder”), which became indirect subsidiaries of the Company on June 9, 2023. NorthStar Healthcare Income Advisor, LLC invested $1,000 in the Operating Partnership in exchange for common units and the Special Unit Holder invested $1,000 in the Operating Partnership and was issued a separate class of limited partnership units (the “Special Units”), which were collectively recorded as non-controlling interests on the accompanying consolidated balance sheets prior to June 9, 2023. As the Company issued shares, it contributed substantially all of the proceeds from its continuous, public offerings to the Operating Partnership as a capital contribution. As of September 30, 2023,March 31, 2024, the Company’s limited partnership interest in the Operating Partnership, directly or indirectly, was 100.0%100%.
The Company’s charter authorizes the issuance of up to 400.0 million shares of common stock with a par value of $0.01 per share and up to 50.0 million shares of preferred stock with a par value of $0.01 per share. The board of directors of the Company is authorized to amend its charter, without the approval of the stockholders, to increase the aggregate number of authorized shares of capital stock or the number of shares of any class or series that the Company has authority to issue.
The Company raised $2.0 billion in total gross proceeds from the sale of shares of common stock in its continuous, public offerings (the “Offering”), including $232.6 million pursuant to its distribution reinvestment plan (the “DRP”).
The Internalization
From inception through October 21, 2022, the Company was externally managed by CNI NSHC Advisors, LLC or its predecessor (the “Former Advisor”), an affiliate of NRF Holdco, LLC (the “Former Sponsor”). The Former Advisor was responsible for managing the Company’s operations, subject to the supervision of the Company’s board of directors, pursuant to an advisory agreement. On October 21, 2022, the Company completed the internalization of the Company’s management function (the “Internalization”). In connection with the Internalization, the Company agreed with the Former Advisor to terminate the advisory agreement and arranged for the Former Advisor to continue to provide certain services for a transition period.
2. Summary of Significant Accounting Policies
Basis of Accounting
The accompanying consolidated financial statements and related notes of the Company have been prepared in accordance with accounting principles generally accepted in the United States (“U.S. GAAP”) for interim financial reporting and the instructions to Form 10-Q and Rule 10-01 of Regulation S-X. Accordingly, certain information and note disclosures normally included in the consolidated financial statements prepared under U.S. GAAP have been condensed or omitted. In the opinion of management, all adjustments considered necessary for a fair presentation of the Company’s financial position, results of operations and cash flows have been included and are of a normal and recurring nature. The operating results presented for interim periods are not necessarily indicative of the results that may be expected for any other interim period or for the entire year. These consolidated financial statements should be read in conjunction with the Company’s consolidated financial statements and notes thereto included in the Company’s Annual Report on Form 10-K for the fiscal year ended December 31, 2022,2023, which was filed with the U.S. Securities and Exchange Commission on March 27, 2023.22, 2024.
NORTHSTAR HEALTHCARE INCOME, INC. AND SUBSIDIARIES
NOTES TO CONSOLIDATED FINANCIAL STATEMENTS (Continued)
(Unaudited)
Principles of Consolidation
The consolidated financial statements include the accounts of the Company, the Operating Partnership and their consolidated subsidiaries. The Company consolidates entities in which it has a controlling financial interest by first considering if an entity meets the definition of a variable interest entity (“VIE”) for which the Company is deemed to be the primary beneficiary or if the Company has the power to control an entity through majority voting interest or other arrangements. All significant intercompany balances are eliminated in consolidation.
Variable Interest Entities
A VIE is an entity that lacks one or more of the characteristics of a voting interest entity. A VIE is defined as an entity in which equity investors do not have the characteristics of a controlling financial interest or do not have sufficient equity at risk for the entity to finance its activities without additional subordinated financial support from other parties. The determination of whether an entity is a VIE includes both a qualitative and quantitative analysis. The Company bases its qualitative analysis on its review of the design of the entity, its organizational structure including decision-making ability and relevant financial agreements and the quantitative analysis on the forecasted cash flow of the entity. The Company reassesses its initial evaluation of an entity as a VIE upon the occurrence of certain reconsideration events.
A VIE must be consolidated only by its primary beneficiary, which is defined as the party who, along with its affiliates and agents, has both the: (i) power to direct the activities that most significantly impact the VIE’s economic performance; and (ii) obligation to absorb the losses of the VIE or the right to receive the benefits from the VIE, which could be significant to the VIE. The Company determines whether it is the primary beneficiary of a VIE by considering qualitative and quantitative factors, including, but not limited to: which activities most significantly impact the VIE’s economic performance and which party controls such activities; the amount and characteristics of its investment; the obligation or likelihood for the Company or other interests to provide financial support; consideration of the VIE’s purpose and design, including the risks the VIE was designed to create and pass through to its variable interest holders and the similarity with and significance to the business activities of the Company and the other interests. The Company reassesses its determination of whether it is the primary beneficiary of a VIE each reporting period. Judgments related to these determinations include estimates about the current and future fair value and performance of investments held by these VIEs and general market conditions.
The Company evaluates its investments and financings, including investments in unconsolidated ventures and securitization financing transactions to determine whether each investment or financing is a VIE. The Company analyzes new investments and financings, as well as reconsideration events for existing investments and financings, which vary depending on type of investment or financing.
As of September 30, 2023,March 31, 2024, the Company has identified certain consolidated and unconsolidated VIEs. Assets of each of the VIEs may only be used to settle obligations of the respective VIE. Creditors of each of the VIEs have no recourse to the general credit of the Company.
Consolidated VIEs
The most significant VIEs of the Company are certain entities that are consolidated by the Operating Partnership. These entities are VIEs because of non-controlling interests owned by third parties, which do not have substantive kick-out or participating rights. Included in operating real estate, net and mortgage notes payable, net on the Company’s consolidated balance sheet as of September 30, 2023March 31, 2024 is $170.1$100.3 million and $172.0$160.8 million, respectively, related to such consolidated VIEs.
Unconsolidated VIEs
As of September 30, 2023,March 31, 2024, the Company identified unconsolidated VIEs related to its investments in unconsolidated ventures with a carrying value of $128.0$124.0 million. The Company’s maximum exposure to loss as of September 30, 2023March 31, 2024 would not exceed the carrying value of its investment in the VIEs. The Company determined that it is not the primary beneficiary of these VIEs and, accordingly, they are not consolidated in the Company’s financial statements as of September 30, 2023.March 31, 2024. The Company did not provide financial support to its unconsolidated VIEs during the ninethree months ended September 30, 2023.March 31, 2024. As of September 30, 2023,March 31, 2024, there were no explicit arrangements or implicit variable interests that could require the Company to provide financial support to its unconsolidated VIEs.
Voting Interest Entities
A voting interest entity is an entity in which the total equity investment at risk is sufficient to enable it to finance its activities independently and the equity holders have the power to direct the activities of the entity that most significantly impact its
NORTHSTAR HEALTHCARE INCOME, INC. AND SUBSIDIARIES
NOTES TO CONSOLIDATED FINANCIAL STATEMENTS (Continued)
(Unaudited)
economic performance, the obligation to absorb the losses of the entity and the right to receive the residual returns of the entity. The usual condition for a controlling financial interest in a voting interest entity is ownership of a majority voting interest. If the Company has a majority voting interest in a voting interest entity, the entity will generally be consolidated. The Company does
NORTHSTAR HEALTHCARE INCOME, INC. AND SUBSIDIARIES
NOTES TO CONSOLIDATED FINANCIAL STATEMENTS (Continued)
(Unaudited)
not consolidate a voting interest entity if there are substantive participating rights by other parties and/or kick-out rights by a single party or through a simple majority vote.
The Company performs on-going reassessments of whether entities previously evaluated under the voting interest framework have become VIEs, based on certain events, and therefore subject to the VIE consolidation framework.
Investments in Unconsolidated Ventures
A non-controlling, unconsolidated ownership interest in an entity may be accounted for using the equity method or the Company may elect the fair value option.
The Company will account for an investment under the equity method of accounting if it has the ability to exercise significant influence over the operating and financial policies of an entity, but does not have a controlling financial interest. Under the equity method, the investment is adjusted each period for capital contributions and distributions and its share of the entity’s net income (loss). Capital contributions, distributions and net income (loss) of such entities are recorded in accordance with the terms of the governing documents. An allocation of net income (loss) may differ from the stated ownership percentage interest in such entity as a result of preferred returns and allocation formulas, if any, as described in such governing documents. Equity method investments are recognized using a cost accumulation model, in which the investment is recognized based on the cost to the investor, which includes acquisition fees. The Company records as an expense certain acquisition costs and fees associated with consolidated investments deemed to be business combinations and capitalizes these costs for investments deemed to be acquisitions of an asset, including an equity method investment.
The Company may elect the fair value option of accounting for an investment that would otherwise be accounted for under the equity method. The fair value option election allows an entity to make an irrevocable election of fair value for certain financial assets and liabilities on an instrument-by-instrument basis at the initial or subsequent measurement. The decision to elect the fair value option must be applied to an entire instrument and is irrevocable once elected. Under the fair value option, the Company records its share of the changes to fair value of the investment and any unrealized gains and losses.
On June 30, 2023, the Company elected the fair value option method to account for its investment in the Espresso joint venture, which is included in investments in unconsolidated ventures on the consolidated balance sheets. The fair value election was made based on the Company’s assessment that the expected return of investment was lower than the Company’s carrying value of its investment in the Espresso joint venture, which resulted in an impairment of $4.7 million and reduced the carrying value of its investment to recoverable fair value of $3.1 million as of June 30, 2023. The Company’s assessment for the recoverability of its investment took into consideration the joint venture’s remaining assets and estimated future cash distributions, less transaction and wind down costs. The Company will record any changes to its investment’s fair value in gain (loss) on investments and other in the consolidated statements of operations. DuringFrom the three months ended September 30, 2023,date of the election of fair value through March 31, 2024, the Company did not record any changes to the fair value of its investment in the Espresso joint venture. Refer to Note 4 “Investment in Unconsolidated Ventures” and Note 10 “Fair Value” for further discussion.
Non-controlling Interests
A non-controlling interest in a consolidated subsidiary is defined as the portion of the equity (net assets) in a subsidiary not attributable, directly or indirectly, to the Company. A non-controlling interest is required to be presented as a separate component of equity on the consolidated balance sheets and presented separately as net income (loss) and comprehensive income (loss) attributable to controlling and non-controlling interests. An allocation to a non-controlling interest may differ from the stated ownership percentage interest in such entity as a result of a preferred return and allocation formula, if any, as described in suchthe relevant governing documents.
Estimates
The preparation of consolidated financial statements in conformity with U.S. GAAP requires management to make estimates and assumptions that could affect the amounts reported in the consolidated financial statements and accompanying notes. Actual results could materially differ from those estimates and assumptions. Any estimates of the effects of the COVID-19 pandemic, inflation, rising interest rates, risk of recession and other economic conditions as reflected and/or discussed in these financial statements are based upon the Company's best estimates using information known to the Company as of the date of this Quarterly Report on Form 10-Q. Such estimates may change and the impact of which could be material.
NORTHSTAR HEALTHCARE INCOME, INC. AND SUBSIDIARIES
NOTES TO CONSOLIDATED FINANCIAL STATEMENTS (Continued)
(Unaudited)
Cash, Cash Equivalents and Restricted Cash
The Company considers all highly-liquid investments with an original maturity date of three months or less to be cash equivalents. Cash, including amounts restricted, may at times exceed the Federal Deposit Insurance Corporation deposit insurance limit of $250,000 per institution. The Company mitigates credit risk by placing cash and cash equivalents with major
NORTHSTAR HEALTHCARE INCOME, INC. AND SUBSIDIARIES
NOTES TO CONSOLIDATED FINANCIAL STATEMENTS (Continued)
(Unaudited)
financial institutions and money market funds invested in short-term U.S. government securities. To date, the Company has not experienced any losses on cash and cash equivalents.
Restricted cash consists of amounts related to operating real estate (escrows for taxes, insurance, capital expenditures, security deposits received from residents and payments required under certain lease agreements) and other escrows required by lenders of the Company’s borrowings.
The following table provides a reconciliation of cash, cash equivalents and restricted cash as reported on the consolidated balance sheets to the total of such amounts as reported on the consolidated statements of cash flows (dollars in thousands):
| | September 30, 2023 (Unaudited) | | December 31, 2022 |
| | March 31, 2024 (Unaudited) | | | | March 31, 2024 (Unaudited) | | December 31, 2023 |
| Cash and cash equivalents | Cash and cash equivalents | | $ | 87,581 | | | $ | 103,926 | |
| Restricted cash | Restricted cash | | 11,386 | | | 11,734 | |
| Total cash, cash equivalents and restricted cash | Total cash, cash equivalents and restricted cash | | $ | 98,967 | | | $ | 115,660 | |
Operating Real Estate
Operating real estate is carried at historical cost less accumulated depreciation. Major replacements and betterments which improve or extend the life of the asset are capitalized and depreciated over their useful life. Ordinary repairs and maintenance are expensed as incurred. Operating real estate is depreciated using the straight-line method over the estimated useful life of the assets, summarized as follows:
| | | | | | | | |
| Category: | | Term: |
| Building | | 3039 to 5049 years |
| Building improvements | | Lesser of the useful life or remaining life of the building |
| Land improvements | | 9 to 15 years |
| Tenant improvements | | Lesser of the useful life or remaining term of the lease |
| Furniture, fixtures and equipment | | 5 to 14 years |
Construction costs incurred in connection with the Company’s investments are capitalized and included in operating real estate, net on the consolidated balance sheets. Construction in progress is not depreciated until the asset is available for its intended use.
Lessee Accounting
A leasing arrangement, a right to control the use of an identified asset for a period of time in exchange for consideration, is classified by the lessee either as a finance lease, which represents a financed purchase of the leased asset, or as an operating lease. For leases with terms greater than 12 months, a lease asset and a lease liability are recognized on the balance sheet at commencement date based on the present value of lease payments over the lease term.
Lease renewal or termination options are included in the lease asset and lease liability only if it is reasonably certain that the option to extend would be exercised or the option to terminate would not be exercised. As the implicit rate in most leases are not readily determinable, the Company’s incremental borrowing rate for each lease at commencement date is used to determine the present value of lease payments. Consideration is given to the Company’s recent debt financing transactions, as well as publicly available data for instruments with similar characteristics, adjusted for the respective lease term, when estimating incremental borrowing rates.
Lease expense is recognized over the lease term based on an effective interest method for finance leases and on a straight-line basis for operating leases.
Right of Use (“ROU”) - Finance Assets
The Company has entered into finance leases for equipment which are included in operating real estate, net on the Company’s consolidated balance sheets. As of March 31, 2024, furniture, fixtures and equipment under finance leases totaled $0.2 million. The leased equipment is amortized on a straight-line basis. Payments for finance leases totaled $9,399 and $29,070 for the three months ended March 31, 2024 and 2023, respectively.
NORTHSTAR HEALTHCARE INCOME, INC. AND SUBSIDIARIES
NOTES TO CONSOLIDATED FINANCIAL STATEMENTS (Continued)
(Unaudited)
Right of Use (“ROU”) - Finance Assets
The Company has entered into finance leases for equipment which are included in operating real estate, net on the Company’s consolidated balance sheets. As of September 30, 2023, furniture, fixtures and equipment under finance leases totaled $0.3 million. The leased equipment is amortized on a straight-line basis. Payments for finance leases totaled $0.1 million and $0.4 million for the nine months ended September 30, 2023 and 2022, respectively.
The following table presents the future minimum lease payments under finance leases and the present value of the minimum lease payments, which are included in other liabilities on the Company’s consolidated balance sheets (dollars in thousands):
| | October 1 through December 31, 2023 | | $ | 18 | |
| April 1 through December 31, 2024 | |
| Years Ending December 31: | Years Ending December 31: | |
| 2024 | | 69 | |
| 2025 | |
| 2025 | |
| 2025 | 2025 | | 38 | |
| 2026 | 2026 | | 33 | |
| 2027 | 2027 | | 18 | |
| Thereafter | | 10 | |
| 2028 | |
| | Total minimum lease payments | |
| Total minimum lease payments | |
| Total minimum lease payments | Total minimum lease payments | | $ | 186 | |
| Less: Amount representing interest | Less: Amount representing interest | | (27) | |
| Present value of minimum lease payments | Present value of minimum lease payments | | $ | 159 | |
The weighted average interest rate related to the finance lease obligations is 6.8%6.6% with a weighted average lease term of 3.43.6 years.
As of September 30, 2023,March 31, 2024, there were no leases that had yet to commence which would create significant rights and obligations to the Company as lessee.
Assets Held For Sale
The Company classifies certain long-lived assets as held for sale once the criteria, as defined by U.S. GAAP, have been met and are expected to sell within one year. Long-lived assets to be disposed of are reported at the lower of their carrying amount or fair value minus cost to sell, with any write-down recorded to impairment loss on the consolidated statements of operations. Depreciation and amortization is not recorded for assets classified as held for sale.
In March 2024, the Company entered into an agreement to sell a land parcel within the Rochester portfolio for $0.5 million, and as of March 31, 2024, has classified the property as held for sale on its consolidated balance sheets. At the time of the reclassification to held for sale, the Company recorded an impairment loss of $39,000. As of December 31, 2023, the Company had one property within the Rochester portfolio classified as held for sale, which was sold in February 2024.
Intangible Assets and Deferred Costs
Deferred Costs
Deferred costs consist of deferred financing costs. Deferred financing costs represent commitment fees, legal and other third-party costs associated with obtaining financing. These costs are recorded against the carrying value of such financing and are amortized to interest expense over the term of the financing using the effective interest method. Unamortized deferred financing costs are expensed to gain (loss) on investments and other, when the associated borrowing is repaid before maturity. Costs incurred in seeking financing transactions which do not close are expensed in the period in which it is determined that the financing will not occur.
Identified Intangibles
The Company records acquired identified intangibles, such as the value of in-place leases and other intangibles, based on estimated fair value at the acquisition date. The value allocated to the identified intangibles is amortized over the remaining lease term. In-place leases are amortized into depreciation and amortization expense.
Impairment analysis for identified intangible assets is performed in connection with the impairment assessment of the related operating real estate. An impairment establishes a new basis for the identified intangible asset and any impairment loss recognized is not subject to subsequent reversal. Refer to “—Impairment on Operating Real Estate and Investments in Unconsolidated Ventures” for additional information.
NORTHSTAR HEALTHCARE INCOME, INC. AND SUBSIDIARIES
NOTES TO CONSOLIDATED FINANCIAL STATEMENTS (Continued)
(Unaudited)
Identified intangibleIntangible assets, are recorded in intangible assets, net, as presented on the consolidated balance sheets. Intangible assetssheets relate to the Company’s in-place lease values for the Company’s four net lease properties. The following table presents intangible assets, net (dollars in thousands):
| | September 30, 2023 (Unaudited) | | December 31, 2022 |
| | March 31, 2024 (Unaudited) | | | | March 31, 2024 (Unaudited) | | December 31, 2023 |
| In-place lease value | In-place lease value | | $ | 120,149 | | | $ | 120,149 | |
| Less: Accumulated amortization | Less: Accumulated amortization | | (118,149) | | | (117,896) | |
| Intangible assets, net | Intangible assets, net | | $ | 2,000 | | | $ | 2,253 | |
The Company recorded $0.1 million and $0.3 million of amortization expense for in-place leases for the three and nine months ended September 30, 2023March 31, 2024 and 2022, respectively.2023.
The following table presents future amortization of in-place lease value (dollars in thousands):
| | October 1 through December 31, 2023 | | $ | 84 | | |
| April 1 through December 31, 2024 | |
| April 1 through December 31, 2024 | |
| April 1 through December 31, 2024 | |
| Years Ending December 31: | Years Ending December 31: | | |
| 2024 | | 337 | | |
| Years Ending December 31: | |
| Years Ending December 31: | |
| 2025 | |
| 2025 | |
| 2025 | 2025 | | 337 | | |
| 2026 | 2026 | | 337 | | |
| 2026 | |
| 2026 | |
| 2027 | 2027 | | 337 | | |
| 2027 | |
| 2027 | |
| 2028 | |
| 2028 | |
| 2028 | |
| Thereafter | |
| Thereafter | |
| Thereafter | Thereafter | | 568 | | |
| Total | Total | | $ | 2,000 | | |
| Total | |
| Total | |
Derivative Instruments
The Company uses derivative instruments to manage its interest rate risk. The Company’s derivative instruments are recorded at fair value. The accounting for changes in fair value of derivatives depends upon whether or not the Company has elected to designate the derivative in a hedging relationship and the derivative qualifies for hedge accounting. Under hedge accounting, changes in fair value for derivatives are recorded through other comprehensive income. When hedge accounting is not elected, changes in fair value for derivatives are recorded through the income statement.
The Company has interest rate caps that have not been designated for hedge accounting. The fair value of the Company's interest rate caps totaled $0.8$0.2 million and $0.7$0.4 million as of September 30, 2023March 31, 2024 and December 31, 2022,2023, respectively, and are included in other assets on the consolidated balance sheets. Changes in fair value of derivatives have been recorded in gain (loss) on investments and other in the consolidated statements of operations. The Company recognized losses totaling $0.3$0.1 million and $0.5$0.2 million for the three and nine months ended September 30,March 31, 2024 and 2023, respectively, and gains totaling $0.3 million and $0.6 million for the three and nine months ended September 30, 2022, respectively.
Revenue Recognition
Operating Real Estate
Rental income from operating real estate is derived from leasing of space to operators and residents, including rent received from the Company’s net lease properties and rent, ancillary service fees and other related revenue earned from ILF residents. Rental income recognition commences when the operator takes legal possession of the leased space and the leased space is substantially ready for its intended use. The leases are for fixed terms of varying length and generally provide for rentals and expense reimbursements to be paid in monthly installments. Rental income from leases, which includes community and move-in fees, is recognized over the term of the respective leases. ILF resident agreements are generally short-term in nature and may allow for termination with 30 days’ notice.
The Company also generates revenue from operating healthcare properties. Revenue related to operating healthcare properties includes resident room and care charges, ancillary fees and other resident service charges. Rent is charged and revenue is recognized when such services are provided, generally defined per the resident agreement as of the date upon which a resident occupies a room or uses the services. Resident agreements are generally short-term in nature and may allow for termination with 30 days’ notice. Revenue derived from our ALFs and MCFs is recorded in resident fee income in the consolidated statements of operations.
NORTHSTAR HEALTHCARE INCOME, INC. AND SUBSIDIARIES
NOTES TO CONSOLIDATED FINANCIAL STATEMENTS (Continued)
(Unaudited)
Revenue from operators and residents is recognized at lease commencement only to the extent collection is expected to be probable. This assessment is based on several qualitative and quantitative factors, including and as appropriate, the payment
NORTHSTAR HEALTHCARE INCOME, INC. AND SUBSIDIARIES
NOTES TO CONSOLIDATED FINANCIAL STATEMENTS (Continued)
(Unaudited)
history, ability to satisfy its lease obligations, the value of the underlying collateral or deposit, if any, and current economic conditions. If collection is assessed to not be probable, thereafter lease income recognized is limited to amounts collected, with the reversal of any revenue recognized to date in excess of amounts received. If collection is subsequently reassessed to be probable, revenue is adjusted to reflect the amount that would have been recognized had collection always been assessed as probable.
TheBeginning in February 2021, the operator of the Company’s four net lease properties failed to remit contractual monthly rent obligations and the Company deemed it not probable that these obligations will be satisfied in the foreseeable future. On March 27, 2023, the Company entered into a lease forbearance and modification agreement (the “Forbearance Agreement”) with the existing operator, pursuant to which, among other things, the Company will be entitled to receive all cash flow in excess of permitted expenses, and be required to fund any operating deficits, through 2025, subject to the terms and conditions thereof. For the three and nine months ended September 30,March 31, 2024 and 2023, the Company receiveddid not receive any excess cash flow of $0.8 millionor fund any operating deficits and, $1.2 million, respectively, which was recorded as such, did not record any rental income.income related to its net lease properties.
For the three months ended September 30,March 31, 2024 and 2023, and 2022, total property and other revenues includes variable lease revenue of $3.6 million and $2.1 million, respectively. For the nine months ended September 30, 2023 and 2022, total property and other revenue includes variable lease revenue of $10.7$3.5 million and $9.2$3.4 million, respectively. Variable lease revenue includes ancillary services provided to operator/residents, as well as non-recurring services and fees at the Company’s operating facilities.
Impairment on Operating Real Estate and Investments in Unconsolidated Ventures
At this time, it is difficult for the Company to assess and estimate the lasting effects of the COVID-19 pandemic, inflation, rising interest rates, risk of recession and other economic conditions. The future economic effects will depend on many factors beyond the Company’s control and knowledge. The resulting effect on impairment of the Company's real estate held for investment and held for sale and investments in unconsolidated ventures may materially differ from the Company's current expectations and further impairment charges may be recorded in future periods.
Operating Real Estate and Assets Held for Sale
The Company’s real estate portfolio is reviewed on a quarterly basis, or more frequently as necessary, to assess whether there are any indicators that the value of its operating real estate may be impaired or that its carrying value may not be recoverable. A property’s value is considered impaired if the Company’s estimate of the aggregate expected future undiscounted cash flow generated by the property is less than the carrying value. In conducting this review, the Company considers U.S. macroeconomic factors, real estate and healthcare sector conditions, together with asset specific and other factors. To the extent an impairment has occurred, the loss is measured as the excess of the carrying value of the property over the estimated fair value and recorded in impairment loss in the consolidated statements of operations.
Real estate held for sale is stated at the lower of its carrying amount or estimated fair value less disposal cost, with any write-down to disposal cost recorded as an impairment loss. For any increase in fair value less disposal cost subsequent to classification as held for sale, the impairment may be reversed, but only up to the amount of cumulative loss previously recognized.
The Company considered the potential impact of the lasting effects of the COVID-19 pandemic, inflation, rising interest rates, risk of recession and other economic conditions on the future net operating income of its healthcare real estate held for investment as an indicator of impairment. Fair values were estimated based upon the income capitalization approach, using net operating income for each property and applying indicative capitalization rates.
During the ninethree months ended September 30, 2023,March 31, 2024, the Company recorded impairment losses on its operating real estate totaling $38.7$0.5 million including impairment lossesto reflect the market value of $38.6 million for five facilities within the Rochester portfolio as a result of revised holding period assumptions. Additionally, the Company recorded impairment losses totaling $0.1 million for a land parcel within the Rochester portfolio designated as a result of lower estimated market value.held for sale and for property damage sustained by facilities within the Winterfell and Aqua portfolios.
During the ninethree months ended September 30, 2022,March 31, 2023, the Company recordeddid not record any impairment losses on its operating real estate totaling $31.5 million. The Company recorded impairment losses of $18.5 million, $8.5 million, and $3.9 million for facilities in its Arbors, Winterfell and Rochester portfolios, respectively, as a result of declining operating margins and lower projected future cash flows. In addition, the Company recorded impairment losses totaling $0.6 million for property damage sustained by facilities in its Winterfell portfolio.
NORTHSTAR HEALTHCARE INCOME, INC. AND SUBSIDIARIES
NOTES TO CONSOLIDATED FINANCIAL STATEMENTS (Continued)
(Unaudited)
estate.Investments in Unconsolidated Ventures
The Company reviews its investments in unconsolidated ventures on a quarterly basis, or more frequently as necessary, to assess whether there are any indicators that the value may be impaired or that its carrying value may not be recoverable. An investment is considered impaired if the projected net recoverable amount over the expected holding period is less than the carrying value. In conducting this review, the Company considers global macroeconomic factors, including real estate sector conditions, together with investment specific and other factors. To the extent an impairment has occurred on the Company’s investment in unconsolidated ventures, and is considered to be other than temporary, the loss is measured as the excess of the carrying value of the investment over the estimated fair value and recorded in impairment loss in the consolidated statements of operations.
During the ninethree months ended September 30,March 31, 2024 and 2023, the Company recorded an impairment on its investment in the Espresso joint venture totaling $4.7 million, which reduced the carrying valuedid not impair any of its investment to $3.1 million. The Company’s assessment for the recoverability of its investment took into consideration the joint venture’s remaining assets and estimated future cash distributions, less transaction and wind down costs. Upon impairing its investment, the Company elected the fair value option method to account for its investment in the Espresso joint venture on June 30, 2023. During the nine months ended September 30, 2022, there was no impairment recorded on any of the Company’s investments in unconsolidated ventures.
The joint ventures, underlying the Company’s unconsolidated ventures assess and record impairment and reserves on their respective real estate portfolios, goodwill, and other assets, and the Company recognizes its proportionate share through equity in earnings (losses). In May 2023, prior to the Sale of Minority Interests (as defined in Note 4, “Investments in Unconsolidated Ventures”), the Diversified US/UK joint venture recorded impairment losses on its remaining properties, 48 care homes located in the United Kingdom (the “UK Portfolio”), due to, among other things, the extended period contemplated for the UK Portfolio to reach stabilization. The Company’s proportionate share of the impairment losses recorded by the Diversified US/UK portfolio totaled $11.4 million. The Company’s proportionate share of impairment and reserves recognized bynor did the underlying joint ventures record any impairments or reserves on properties in their respective portfolios.
NORTHSTAR HEALTHCARE INCOME, INC. AND SUBSIDIARIES
NOTES TO CONSOLIDATED FINANCIAL STATEMENTS (Continued)
(Unaudited)
Credit Losses on Receivables
The current expected credit loss model, in estimating expected credit losses over the life of a financial instrument at the time of origination or acquisition, considers historical loss experiences, current conditions and the effects of reasonable and supportable expectations of changes in future macroeconomic conditions. The Company assesses the estimate of expected credit losses on a quarterly basis or more frequently as necessary. The Company considers historical credit loss information that is adjusted for current conditions and reasonable and supportable forecasts.
The Company measures expected credit losses of receivables on a collective basis when similar risk characteristics exist. If the Company determines that a particular receivable does not share risk characteristics with its other receivables, the Company evaluates the receivable for expected credit losses on an individual basis.
When developing an estimate of expected credit losses on receivables, the Company considers available information relevant to assessing the collectability of cash flows. This information may include internal information, external information, or a combination of both relating to past events, current conditions, and reasonable and supportable forecasts. The Company considers relevant qualitative and quantitative factors that relate to the environment in which the Company operates and are specific to the borrower.
Further, the fair value of the collateral, less estimated costs to sell, may be used when determining the allowance for credit losses for a receivable for which the repayment is expected to be provided substantially through the sale of the collateral when the borrower is experiencing financial difficulty.
As of September 30, 2023,March 31, 2024, the Company has not recorded an allowance for credit losses on its receivables.
Acquisition Fees and Expenses
The Company recorded an expense for certain acquisition costs and fees associated with transactions deemed to be business combinations in which it consolidated the asset and capitalized these costs for transactions deemed to be acquisitions of an asset, including an equity investment.
Equity-Based Compensation
The Company accounts for equity-based compensation awards using the fair value method, which requires an estimate of fair value of the award at the time of grant. All fixed equity-based awards to directors, which have no vesting conditions other than
NORTHSTAR HEALTHCARE INCOME, INC. AND SUBSIDIARIES
NOTES TO CONSOLIDATED FINANCIAL STATEMENTS (Continued)
(Unaudited)
time of service, are amortized to compensation expense over the awards’ vesting period on a straight-line basis. Equity-based compensation is classified within general and administrative expenses in the consolidated statements of operations.
Income Taxes
The Company elected to be taxed as a REIT and to comply with the related provisions of the Internal Revenue Code beginning in its taxable year ended December 31, 2013. Accordingly, the Company will generally not be subject to U.S. federal income tax to the extent of its distributions to stockholders as long as certain asset, gross income and share ownership tests are met. To maintain its qualification as a REIT, the Company must annually distribute dividends equal to at least 90.0% of its REIT taxable income (with certain adjustments) to its stockholders and meet certain other requirements. The Company believes that all of the criteria to maintain the Company’s REIT qualification have been met for the applicable periods, but there canperiods.
For the taxable year ended December 31, 2023, the Company anticipates that its REIT taxable income, if any, will be no assurance that these criteriaoffset by its net operating loss carry-forward and as such, the Company will continuenot be subject to be met in subsequent periods. the distribution requirements. The Company’s most recently filed tax return is for the year ended December 31, 2022 and includes a net operating loss carry-forward of $248.5 million.
If the Company were to fail to meet these requirements, it would be subject to U.S. federal income tax and potential interest and penalties, which could have a material adverse impact on its results of operations and amounts available for distributions to its stockholders. The Company’s accounting policy with respect to interest and penalties is to classify these amounts as a component of income tax expense, where applicable. The Company has assessed its tax positions for all open tax years, which include 20182019 to 2022,2023, and concluded there were no material uncertainties to be recognized.
The Company may also be subject to certain state, local and franchise taxes. Under certain circumstances, federal income and excise taxes may be due on its undistributed taxable income.
NORTHSTAR HEALTHCARE INCOME, INC. AND SUBSIDIARIES
NOTES TO CONSOLIDATED FINANCIAL STATEMENTS (Continued)
(Unaudited)
The Company made a joint election to treat certain subsidiaries as taxable REIT subsidiaries (“TRS”) which may be subject to U.S. federal, state and local income taxes. In general, a TRS of the Company may perform services for managers/operators/residents of the Company, hold assets that the Company cannot hold directly and may engage in any real estate or non-real estate related business.
Certain subsidiaries of the Company are subject to taxation by federal and state authorities for the periods presented. Income taxes are accounted for by the asset/liability approach in accordance with U.S. GAAP. Deferred taxes, if any, represent the expected future tax consequences when the reported amounts of assets and liabilities are recovered or paid. Such amounts arise from differences between the financial reporting and tax bases of assets and liabilities and are adjusted for changes in tax laws and tax rates in the period which such changes are enacted. A provision for income tax represents the total of income taxes paid or payable for the current period, plus the change in deferred taxes. Current and deferred taxes are provided on the portion of earnings (losses) recognized by the Company with respect to its interest in the TRS.
The Company recorded an income tax expense of $20,000 and $15,000 for the three months ended March 31, 2024 and 2023, respectively.
Deferred income tax assets and liabilities are calculated based on temporary differences between the Company’s U.S. GAAP consolidated financial statements and the federal and state income tax basis of assets and liabilities as of the consolidated balance sheet date. The Company evaluates the realizability of its deferred tax assets (e.g., net operating loss and capital loss carryforwards) and recognizes a valuation allowance if, based on the available evidence, it is more likely than not that some portion or all of its deferred tax assets will not be realized. When evaluating the realizability of its deferred tax assets, the Company considers estimates of expected future taxable income, existing and projected book/tax differences, tax planning strategies available and the general and industry specific economic outlook. This realizability analysis is inherently subjective, as it requires the Company to forecast its business and general economic environment in future periods. Changes in estimate of deferred tax asset realizability, if any, are included in provision for income tax benefit (expense)expense in the consolidated statements of operations. The Company has a deferred tax asset which as of September 30, 2023 totaled $15.9 million and continues to have a full valuation allowance recognized, as there are no changes in the facts and circumstances to indicate that the Company should release the valuation allowance.
The Company recorded an incomecomponents of the Company’s deferred tax expenseassets as of approximately $17,000March 31, 2024 and $43,000 for the three and nine months ended September 30,December 31, 2023 respectively. The Company recorded an income tax expense of approximately $15,000 and $45,000 for the three and nine months ended September 30, 2022, respectively.are as follows (in thousands):
| | | | | | | | | | | | | | |
| | March 31, 2024 (Unaudited) | | December 31, 2023 |
| Fixed assets and other | | $ | 634 | | | $ | 656 | |
| Net operating losses | | 16,079 | | | 15,827 | |
| Total deferred tax assets | | $ | 16,713 | | | $ | 16,483 | |
| Valuation allowance | | (16,713) | | | (16,483) | |
| Net deferred income tax assets | | $ | — | | | $ | — | |
Comprehensive Income (Loss)
The Company reports consolidated comprehensive income (loss) in separate statements following the consolidated statements of operations. Comprehensive income (loss) is defined as the change in equity resulting from net income (loss) and other comprehensive income (loss) (“OCI”). The only component of OCI for the Company was foreign currency translation adjustments related to its investment in an unconsolidated venture.
NORTHSTAR HEALTHCARE INCOME, INC. AND SUBSIDIARIES
NOTES TO CONSOLIDATED FINANCIAL STATEMENTS (Continued)
(Unaudited)
Foreign Currency
Assets and liabilities denominated in aThe Company is no longer exposed to foreign currency for which the functional currency isas a foreign currency are translated using the currency exchange rate in effect at the endresult of the period presented andSale of Minority Interests (as defined in Note 4, “Investments in Unconsolidated Ventures”). Prior to the resultsSale of operations for such entities are translated into U.S. dollars using the average currency exchange rate in effect during the period. The resulting foreign currency translation adjustment is recorded as a component of accumulated OCI in the consolidated statements of equity.
Assets and liabilities denominated in a foreign currency for which the functional currency is the U.S. dollar are remeasured using the currency exchange rate in effect at the end of the period presented and the results of operations for such entities are remeasured into U.S. dollars using the average currency exchange rate in effect during the period.
For the period December 31, 2022 throughMinority Interests on June 9, 2023, the Company had exposure to foreign currency through an investment in an unconsolidated venture, the effects of which were recorded as a component of accumulated OCI in the consolidated statements of equity and in equity in earnings (losses) in the consolidated statements of operations. As a result ofUpon the Sale of Minority Interests, (as defined in Note 4, “Investments in Unconsolidated Ventures”) in June 2023, the Company is no longer exposed to foreign currency as of September 30, 2023. The Company reclassified the accumulated foreign currency losses totaling $3.3 million, related to the Diversified US/UK joint venture, previously recorded through other comprehensive income on the consolidated statements of equitywere reclassified to gain (loss) on investments and other on the consolidated statements of operations.
Recent Accounting Pronouncements
Accounting Standards Adopted in 2023
In March 2020, the FASB issued an amendment to the reference rate reform standard, which provides the option for a limited period of time to ease the potential burden in accounting for, or recognizing the effects of, reference rate reform on contract modifications and hedge accounting. An example of such reform is the market transition from the London Interbank Offered Rate (“LIBOR”) to alternative reference rates. Entities that make this optional expedient election would not have to remeasure the contracts at the modification date or reassess the accounting treatment if certain criteria are met and would continue applying hedge accounting for relationships affected by reference rate reform. In December 2022, the FASB extended the date for which this guidance can be applied from December 31, 2022 to December 31, 2024. The Company did not make the optional election of the aforementioned accounting standards.
Future Application of Accounting Standards
None.
3. Operating Real Estate
The following table presents operating real estate, net (dollars in thousands):
| | | | | | | | | | | | | | |
| | September 30, 2023 (Unaudited) | | December 31, 2022 |
| Land | | $ | 121,424 | | | $ | 121,518 | |
| Land improvements | | 19,913 | | | 18,945 | |
| Buildings and improvements | | 932,261 | | | 957,924 | |
| Tenant improvements | | 372 | | | 372 | |
| Construction in progress | | 8,956 | | | 6,736 | |
| Furniture, fixtures and equipment | | 103,876 | | | 91,058 | |
| Subtotal | | $ | 1,186,802 | | | $ | 1,196,553 | |
| Less: Accumulated depreciation | | (292,557) | | | (263,551) | |
| Operating real estate, net | | $ | 894,245 | | | $ | 933,002 | |
For the three and nine months ended September 30, 2023, depreciation expense was $9.8 million and $29.1 million, respectively. For the three and nine months ended September 30, 2022, depreciation expense was $9.6 million and $28.9 million, respectively.
Within the table above, operating real estate has been reduced by accumulated impairment losses of $220.2 million and $181.5 million as of September 30, 2023 and December 31, 2022, respectively. Impairment losses on the Company’s operating real estate totaled $38.7 million and $31.5 million for the nine months ended September 30, 2023 and 2022, respectively, and are
NORTHSTAR HEALTHCARE INCOME, INC. AND SUBSIDIARIES
NOTES TO CONSOLIDATED FINANCIAL STATEMENTS (Continued)
(Unaudited)
recordedRecent Accounting Pronouncements
Accounting Standards Adopted in 2024
None.
Future Application of Accounting Standards
In November 2023, the FASB issued ASU No. 2023-07, Segment Reporting (Topic 280): Improvements to Reportable Segment Disclosures, which requires disclosure of incremental segment information on an annual and interim basis, primarily through enhanced disclosures of significant segment expenses. ASU No. 2023-07 is effective for fiscal years beginning after December 15, 2023, and interim periods within fiscal years beginning after December 15, 2024 and requires retrospective application to all periods presented upon adoption. Early adoption is permitted. The Company plans to adopt ASU No. 2023-07 on its Annual Report on Form 10-K for the fiscal year ended December 31, 2024 and does not anticipate the application of the accounting standards will have a material impact on the Company’s financial statements.
In December 2023, the FASB issued ASU No. 2023-09, Income Taxes (Topic 740): Improvements to Income Tax Disclosures, which requires disclosure of incremental income tax information within the rate reconciliation and expanded disclosures of income taxes paid, among other disclosure requirements. ASU No. 2023-09 is effective for fiscal years beginning after December 15, 2024. Early adoption is permitted. The Company plans to adopt ASU No. 2023-09 on its Annual Report on Form 10-K for the fiscal year ended December 31, 2024 and does not anticipate the application of the accounting standards will have a material impact on the Company’s financial statements.
3. Operating Real Estate
The following table presents operating real estate, net (dollars in thousands):
| | | | | | | | | | | | | | |
| | March 31, 2024 (Unaudited) | | December 31, 2023 |
| Land | | $ | 115,225 | | | $ | 115,758 | |
| Land improvements | | 12,819 | | | 12,705 | |
| Buildings and improvements | | 865,304 | | | 861,452 | |
| Tenant improvements | | 372 | | | 372 | |
| Construction in progress | | 3,635 | | | 5,493 | |
| Furniture, fixtures and equipment | | 94,746 | | | 93,373 | |
| Subtotal | | $ | 1,092,101 | | | $ | 1,089,153 | |
| Less: Accumulated depreciation | | (276,701) | | | (267,883) | |
| Operating real estate, net | | $ | 815,400 | | | $ | 821,270 | |
For the three months ended March 31, 2024 and 2023, depreciation expense was $8.8 million and $9.6 million, respectively.
Within the table above, operating real estate has been reduced by accumulated impairment losses of $163.3 million and $162.9 million as of March 31, 2024 and December 31, 2023, respectively. Impairment losses, as presented on the consolidated statements of operations.operations, for the Company’s operating real estate and properties held for sale totaled $0.5 million for the three months ended March 31, 2024. There were no impairment losses recorded for the three months ended March 31, 2023. Refer to Note 2, “Summary of Significant Accounting Policies” for further discussion.
NORTHSTAR HEALTHCARE INCOME, INC. AND SUBSIDIARIES
NOTES TO CONSOLIDATED FINANCIAL STATEMENTS (Continued)
(Unaudited)
The following table presents the operators and managers of the Company’s operating real estate (dollars in thousands):
| | | | | | | | | | | | | | | | | | | | | | | | | | |
| | As of March 31, 2024 | | Three Months Ended March 31, 2024 |
| Operator / Manager | | Properties Under Management | | Units Under Management(1) | | Property and Other Revenues(2) | | % of Total Property and Other Revenues |
Solstice Senior Living(3) | | 32 | | | 3,969 | | | $ | 33,695 | | | 69.1 | % |
Watermark Retirement Communities(4) | | 6 | | | 723 | | | 7,346 | | | 15.1 | % |
| Avamere Health Services | | 5 | | | 453 | | | 5,690 | | | 11.7 | % |
| Integral Senior Living | | 1 | | | 40 | | | 1,141 | | | 2.3 | % |
Arcadia Management(5) | | 4 | | | 564 | | | — | | | — | % |
Other(6) | | — | | | — | | | 880 | | | 1.8 | % |
| Total | | 48 | | | 5,749 | | | $ | 48,752 | | | 100.0 | % |
(1)Represents rooms for ALFs, ILFs and MCFs.
(2)Includes rental income received from the Company’s net lease properties, rental income, ancillary service fees and other related revenue earned from ILF residents and resident fee income derived from the Company’s ALFs and MCFs, which includes resident room and care charges, ancillary fees and other resident service charges.
(3)Solstice is a joint venture of which affiliates of Integral Senior Living own 80%.
(4)Property count and units exclude the properties within the Rochester Sub-Portfolio, which were placed into a receivership in October 2023.
(5)During the three months ended March 31, 2024, the Company did not record any rental income from its net lease operator.
(6)Consists primarily of interest income earned on corporate-level cash and cash equivalents.
Rochester Sub-Portfolio
As a result of the mortgage loan payment defaults in July 2023, on October 30, 2023, the Rochester Sub-Portfolio (as defined in Note 5, “Borrowings”) was placed into a receivership. The receiver now has effective control of the properties until ownership of the properties transfers to the lender or its designee.
As a result of the loss of control, the Company discontinued recognizing revenues and expenses related to the Rochester Sub-Portfolio as of October 30, 2023 and derecognized the properties and related assets from the Company’s financial statements, which resulted in a $59.0 million loss recognized in accordance with ASC 610-20, “Gains and Losses from the Derecognition of Nonfinancial Assets.”
Arbors Portfolio
Beginning in February 2021, Arcadia Management, the operator of the Company’s four net lease properties in the Arbors portfolio, failed to remit contractual monthly rent obligations. The Company deemed it not probable that these obligations will be satisfied in the foreseeable future and began recognizing rental income as received on a cash basis. During the three months ended March 31, 2024, the Company did not record any rental income related to its net lease properties.
4. Investments in Unconsolidated Ventures
The Company’s investments in unconsolidated ventures are accounted for under the equity method or fair value option. The following table presents the Company’s investments in unconsolidated ventures (dollars in thousands):
| | | | | | | Carrying Value | | | | | | | | Carrying Value |
| Portfolio | | Portfolio | | Acquisition Date | | Ownership | | March 31, 2024 (Unaudited) | | December 31, 2023 |
| Trilogy | |
| Solstice | |
Espresso(2) | |
| | Carrying Value |
| Portfolio | | Acquisition Date | | Ownership | | September 30, 2023 (Unaudited) | | December 31, 2022 |
Trilogy(1) | | Dec-2015 | | 23.4 | % | | $ | 124,670 | | | $ | 128,884 | |
Espresso(2) | | Jul-2015 | | 36.7 | % | | 3,075 | | | 18,019 | |
Solstice(3) | Jul-2017 | | 20.0 | % | | 281 | | | 323 | |
Investments sold(4) | | — | | | 29,276 | |
| | Investments in Unconsolidated Ventures | Investments in Unconsolidated Ventures | | $ | 128,026 | | | $ | 176,502 | |
| | Investments in Unconsolidated Ventures | |
| | Investments in Unconsolidated Ventures | |
(1)The carrying value for the Company’s investmentTrilogy
Trilogy Investors, LLC (“Trilogy”) indirectly owns 126 integrated senior health campuses located in the Midwest, which are all operating properties managed pursuant to a management agreement with Trilogy joint venture includes $9.8 millionManagement Services, as well as ancillary services businesses, including a therapy business and a pharmacy business. Affiliates of capitalized acquisition costs.American Healthcare REIT, Inc.(“AHR”) own approximately 75.4% of Trilogy, with management of Trilogy owning the remaining 0.8%.
NORTHSTAR HEALTHCARE INCOME, INC. AND SUBSIDIARIES
NOTES TO CONSOLIDATED FINANCIAL STATEMENTS (Continued)
(Unaudited)
In JuneNovember 2023, the Company recordedentered into an impairmentagreement giving AHR the right to purchase the Company’s ownership interests in Trilogy at any time prior to September 30, 2025, assuming AHR exercises all of $4.7its extension options and subject to satisfaction of certain closing conditions, ranging from $240.5 million to reflectup to $260 million depending upon the fair valuepurchase price consideration, timing of its investmentthe closing and certain additional fees that AHR may pay us in the Espresso joint venture, based on the estimated cash distributions to be received from the joint venture. Based on the Company’s assessment, it elected the fair value option method to account for its investment in the Espresso joint venture on June 30, 2023.interim.
Solstice
(3)Represents the Company’s investment in Solstice Senior Living, LLC (“Solstice”), the manager of the Winterfell portfolio. Solsticeportfolio, is a joint venture between affiliates of Integral Senior Living, LLC (“ISL”), a management company of ILF, ALF and MCF founded in 2000, which owns 80.0%, and the Company, which owns 20.0%.
(4)In JuneEspresso
During the year ended December 31, 2023, the Company soldEspresso joint venture completed the sale of its ownership interestsremaining sub-portfolios. The Company’s elected the fair value option method to account for its investment in the Diversified US/UKEspresso joint venture on June 30, 2023. As of March 31, 2024, the remaining carrying value represents the Company’s proportionate share of available cash, less wind down costs and Eclipseother expenses.
The following table presents the results of the Company’s investment in unconsolidated ventures (dollars in thousands):
| | | | | | | | | | | | | | | | | | | | | | | | | | | | | | | | | | | | | | |
| | | | Three Months Ended March 31, |
| | | | | | 2024 | | 2023 | | |
| Portfolio | | | | | | | | | | Equity in Earnings (Losses) | | Cash Distribution | | Equity in Earnings (Losses) | | Cash Distribution | | | | |
| Trilogy | | | | | | | | | | $ | 1,052 | | | $ | — | | | $ | (309) | | | $ | 2,334 | | | | | |
| Solstice | | | | | | | | | | (38) | | | — | | | (29) | | | — | | | | | |
Espresso(1) | | | | | | | | | | — | | | — | | | 109 | | | — | | | | | |
| Investments sold | | | | | | | | | | — | | | — | | | (3,693) | | | — | | | | | |
| | | | | | | | | | | | | | | | | | | | |
| | | | | | | | | | | | | | | | | | | | |
| Total | | | | | | | | | | $ | 1,014 | | | $ | — | | | $ | (3,922) | | | $ | 2,334 | | | | | |
(1) The Company elected to the fair value option method to account for the joint ventures.venture on June 30, 2023, which resulted in no equity in earnings (losses) recorded subsequent to the accounting policy election.
Sale of Minority InterestsInvestments Sold
In June 2023, the Company sold its 14% interest in Healthcare GA Holdings, General Partnership, which indirectly owned 48 care homes across the United Kingdom (the “Diversified US/UK Portfolio”), and its 6% interest in Eclipse Health, General Partnership, which indirectly owned 34 seniors housing facilities (the “Eclipse Portfolio”), together with $1.1 million in cash, to its Former Sponsor, who is affiliated with the majority partner of each joint venture, for all of the Company’s equity securities held by the Former Sponsor and its affiliates, including 9,709,553 shares of common stock of the Company, 100 common units in the Operating Partnership and 100 special units in the Operating Partnership (the “Sale of Minority Interests”).
The following table presents the results Upon completion of the Company’s investment in unconsolidated ventures (dollars in thousands):
| | | | | | | | | | | | | | | | | | | | | | | | | | | | | | | | | | | | | | | | | | | | | | | | | | | | | | | | |
| | | | Three Months Ended September 30, | | Nine Months Ended September 30, |
| | | | | | 2023 | | 2022 | | 2023 | | 2022 |
| Portfolio | | | | | | | | | | Equity in Earnings (Losses) | | Cash Distribution | | Equity in Earnings (Losses) | | Cash Distribution | | Equity in Earnings (Losses) | | Cash Distribution | | Equity in Earnings (Losses) | | Cash Distribution |
| Trilogy | | | | | | | | | | $ | (146) | | | $ | — | | | $ | 6,052 | | | $ | 2,300 | | | $ | 454 | | | $ | 4,668 | | | $ | 10,757 | | | $ | 6,900 | |
Espresso(1) | | | | | | | | | | — | | | — | | | (242) | | | 1,375 | | | 9,228 | | | 19,444 | | | 33,711 | | | 32,363 | |
| Solstice | | | | | | | | | | 19 | | | — | | | 17 | | | — | | | (41) | | | — | | | (41) | | | — | |
Investments sold(2) | | | | | | | | | | — | | | — | | | (2,955) | | | 358 | | | (16,236) | | | — | | | (5,000) | | | 2,910 | |
| | | | | | | | | | | | | | | | | | | | | | | | |
| | | | | | | | | | | | | | | | | | | | | | | | |
| Total | | | | | | | | | | $ | (127) | | | $ | — | | | $ | 2,872 | | | $ | 4,033 | | | $ | (6,595) | | | $ | 24,112 | | | $ | 39,427 | | | $ | 42,173 | |
(1)The Espresso joint venture recognized net gains related to sub-portfolio sales,Sale of whichMinority Interests, the Company’s proportionate share totaled $9.2 million and $32.0 million for the nine months ended September 30, 2023 and 2022, respectively. The Company was distributed its proportionate shareretired all of the net proceeds generated from the sales during the nine months ended September 30, 2023 and 2022, totaling $17.3 million and $27.4 million, respectively.
(2)In May 2023, the Diversified US/UK joint venture recognized impairment,shares of which the Company’s proportionate share totaled $11.4 million and is included in equity in earnings (losses) for the nine months ended September 30, 2023.common stock acquired.
NORTHSTAR HEALTHCARE INCOME, INC. AND SUBSIDIARIES
NOTES TO CONSOLIDATED FINANCIAL STATEMENTS (Continued)
(Unaudited)
5. Borrowings
The following table presents the Company’s mortgage notes payable (dollars in thousands):
| | September 30, 2023 (Unaudited) | | December 31, 2022 |
| Recourse vs. Non-Recourse(1) | | Initial
Maturity | | Contractual Interest Rate(2) | | Principal Amount(3) | | Carrying Value(3) | | Principal
Amount(3) | | Carrying
Value(3) |
| | | | | | | March 31, 2024 (Unaudited) | | | | | | | | | March 31, 2024 (Unaudited) | | December 31, 2023 |
| Recourse vs. Non-Recourse(1) | | | Recourse vs. Non-Recourse(1) | | Initial
Maturity | | Contractual Interest Rate(2) | | Principal Amount(3) | | Carrying Value(3) | | Principal
Amount(3) | | Carrying
Value(3) |
| | Aqua Portfolio | Aqua Portfolio | |
Frisco, TX(4) | Non-recourse | | Feb 2026 | | 3.0% | | $ | 26,000 | | | $ | 25,660 | | | $ | 26,000 | | | $ | 25,560 | |
| Aqua Portfolio | |
| Aqua Portfolio | |
| Frisco, TX | |
| Frisco, TX | |
| Frisco, TX | |
| Milford, OH | Milford, OH | Non-recourse | | Sep 2026 | | SOFR + 2.79% | | 18,212 | | | 18,036 | | | 18,336 | | | 18,126 | |
| Rochester Portfolio | Rochester Portfolio | |
| Rochester, NY | Rochester, NY | Non-recourse | | Feb 2025 | | 4.25% | | 17,657 | | | 17,629 | | | 18,206 | | | 18,165 | |
| Rochester, NY | |
| Rochester, NY | |
Rochester, NY(4) | |
Rochester, NY(5) | Rochester, NY(5) | Non-recourse | | Jul 2023 | | SOFR + 2.45% | | 99,786 | | | 99,787 | | | 100,651 | | | 100,042 | |
| Rochester, NY | Non-recourse | | Aug 2024 | | SOFR + 2.93% | | 10,922 | | | 10,891 | | | 11,336 | | | 11,315 | |
Arbors Portfolio(6) | Arbors Portfolio(6) | |
| Various locations | |
| Various locations | |
| Various locations | Various locations | Non-recourse | | Feb 2025 | | 3.99% | | 81,912 | | | 81,680 | | | 83,423 | | | 83,051 | |
Winterfell Portfolio(7) | Winterfell Portfolio(7) | |
| Various locations | Various locations | Non-recourse | | Jun 2025 | | 4.17% | | 586,773 | | | 581,157 | | | 596,408 | | | 588,306 | |
| Various locations | |
| Various locations | |
Avamere Portfolio(8) | Avamere Portfolio(8) | |
| Various locations | Various locations | Non-recourse | | Feb 2027 | | 4.66% | | 67,025 | | | 66,770 | | | 67,995 | | | 67,683 | |
| Various locations | |
| Various locations | |
| Mortgage notes payable, net | Mortgage notes payable, net | | $ | 908,287 | | | $ | 901,610 | | | $ | 922,355 | | | $ | 912,248 | |
(1)Subject to non-recourse carve-outs.
(2)Floating-rate borrowings total $128.9$143.9 million of principal outstanding and reference one-month SOFR as of September 30, 2023.the Secured Overnight Financing Rate (“SOFR”).
(3)The difference between principal amount and carrying value of mortgage notes payable is attributable to deferred financing costs, net for all borrowings, other than the Winterfell portfolio which is attributable to below market debt intangibles.
(4)The mortgage note carries a fixed interest rate of 3.0% through February 2024, followed by one-month adjusted SOFR, plus 2.80% through the initial maturity date of February 2026.
(5)Composed of seven individual mortgage notes payable (the “Rochester Sub-Portfolio Loan”) secured by seven healthcare real estate properties (the “Rochester Sub-Portfolio”)the Rochester Sub-Portfolio (as defined below), cross-collateralized and subject to cross-default. In July 2023,
(5)Upon the Company elected not to pay debt service on the Rochester Sub-Portfolio Loan, which resulted in a default notice accelerating the maturitysale of the loan from its original terms of August 2027.underlying collateral property, the mortgage note was repaid in full in February 2024.
(6)Composed of four individual mortgage notes payable secured by four healthcare real estate properties, cross-collateralized and subject to cross-default.
(7)Composed of 32 individual mortgage notes payable secured by 32 healthcare real estate properties, cross-collateralized and subject to cross-default.
(8)Composed of five individual mortgage notes payable secured by five healthcare real estate properties, cross-collateralized and subject to cross-default.
The following table presents future scheduled principal payments on mortgage notes payable based on initial maturity as of September 30, 2023March 31, 2024 (dollars in thousands):
| | October 1 through December 31, 2023 | | $ | 104,238 | |
April 1 through December 31, 2024(1) | |
| Years Ending December 31: | Years Ending December 31: | |
| 2024 | | 28,761 | |
| 2025 | |
| 2025 | |
| 2025 | 2025 | | 667,741 | |
| 2026 | 2026 | | 45,151 | |
| 2027 | 2027 | | 62,396 | |
| | Total | Total | | $ | 908,287 | |
(1)Includes the outstanding principal of the Rochester Sub-Portfolio Loan (as defined below), which is in default.
Rochester Sub-Portfolio Loan
In July 2023, the Company elected not to use cash reserves to pay July debt service on seven cross-defaulted and cross-collateralized mortgage notes with an aggregate principal amount outstanding of $99.8 million (the “Rochester Sub-Portfolio Loan") secured by seven healthcare real estate properties (the “Rochester Sub-Portfolio") that did not generate sufficient cash flow to pay debt service in full. The Rochester Sub-Portfolio Loan is non-recourse to the Company, subject to limited customary exceptions.
NORTHSTAR HEALTHCARE INCOME, INC. AND SUBSIDIARIES
NOTES TO CONSOLIDATED FINANCIAL STATEMENTS (Continued)
(Unaudited)
As a result of the payment default, on October 25, 2023, the lender filed a complaint seeking the appointment of a receiver and foreclosure on the underlying properties and to enforce its rights in its collateral under the loan documents and, on October 30, 2023, the Rochester Sub-Portfolio was placed into a receivership to facilitate an orderly transition of the operations, and eventually ownership, of the properties.
Once legal ownership of the Rochester Sub-Portfolio transfers and the obligations under the Rochester Sub-Portfolio Loan are extinguished, the Company expects to recognize a gain related to the debt extinguishment in accordance with ASC 470, “Debt.” However, until the extinguishment occurs, default interest expense and any other expenses related to the Rochester Sub-Portfolio Loan will continue to accrue. As of March 31, 2024, $99.8 million of outstanding mortgage debt and $11.0 million of accrued interest expense were included on the Company's consolidated balance sheets related to the Rochester Sub-Portfolio Loan.
Arbors Portfolio
Beginning in February 2021, the operator of the four net lease properties in the Arbors portfolio was unable to satisfy its obligations under its leases and began remitting rent based on its available cash after satisfying property-level expenses, which resulted in a default under the four cross-defaulted and cross-collateralized mortgage notes collateralizedsecured by the properties.Arbor portfolio (the “Arbors Loan”). On March 27, 2023, with consent of the lender, the Company entered into a Forbearance Agreementforbearance agreement relating to thesethe lease defaults. During the ninethree months ended September 30, 2023,March 31, 2024, cash flow, net of expenses, paid by the operator of the Arbors portfolio to the Company remitted contractual debt service and is in complianceaccordance with the other contractual terms under the mortgage notes collateralized by the properties.
NORTHSTAR HEALTHCARE INCOME, INC. AND SUBSIDIARIES
NOTES TO CONSOLIDATED FINANCIAL STATEMENTS (Continued)
(Unaudited)
In July 2023, the Company electedforbearance agreement was not sufficient to pay Julycover related debt service on the Rochester Sub-PortfolioArbors Loan and the Company used $1.5 million of cash reserves to pay contractual debt service on the Arbors Loan. As of March 31, 2024, the Company is current with all payment obligations under the Arbors Loan. The Arbors Loan matures in light of the continued negative cash flow generated by the Rochester Sub-Portfolio. The Rochester Sub-Portfolio LoanFebruary 2025 and is non-recourse to the Company, subject to limited customary exceptions. As a resultThe Company will continue to monitor the operator of the payment default, in July 2023, the Company received a notice of acceleration of the Rochester Sub-Portfolio LoanArbors portfolio’s performance and reserving all rights and remedies under the applicable loan documents. Refer to Note 13, “Subsequent Events”cash flows closely, as well as evaluate options for additional information.this portfolio.
6. Related Party Arrangements
Former Advisor
In connection with the Internalization, on October 21, 2022, the advisory agreement was terminated on October 21, 2022. and, along with the Operating Partnership and the Former Advisor, the Company entered into a Transition Services Agreement (the “TSA”) to facilitate an orderly transition of the Company’s management of its operations. As of December 31, 2023, the TSA was effectively terminated.
Prior to the Internalization, the Former Advisor was responsible for managing the Company’s affairs on a day-to-day basis and for identifying, acquiring, originating and asset managing investments on behalf of the Company. For such services, to the extent permitted by law and regulations, the Former Advisor received fees and reimbursements from the Company. Pursuant to the advisory agreement, the Former Advisor could defer or waive fees in its discretion.
Transition Services
In connection with the Internalization, on October 21, 2022, the Company, the Operating Partnership and the Former Advisor entered into a Transition Services Agreement (the “TSA”) to facilitate an orderly transition of the Company’s management of its operations. The TSA, as amended on March 22, 2023, provides for, among other things, the Former Advisor to provide certain services, including primarily technology and insurance, for a transition period of up to six months following the Internalization, with legal, treasury and accounts payable services to continue until the Company terminates these services or in other specified circumstances in accordance with the TSA. The Company will reimburse the Former Advisor for costs to provide the services, including the allocated cost of employee wages and compensation and incurred out-of-pocket expenses.
Summary of Fees and Reimbursements
The following table presents the fees and reimbursements incurred and paid to the Former Advisor (dollars in thousands):
| | | | | | | | | | | | | | | | | | | | | | | | | | | | | | | | |
| Reimbursements to Former Advisor Entities | | | | Due to Related Party as of December 31, 2022 | | Nine Months Ended September 30, 2023 | | Due to Related Party as of September 30, 2023 (Unaudited) |
| Financial Statement Location | | | Incurred | | Paid | |
| | | | | | | | |
| Operating costs | | General and administrative expenses/ Transaction costs | | $ | 469 | | | $ | 520 | | (1) | $ | (697) | | | $ | 292 | |
| | | | | | | | | | |
_______________________________________(1)Represents costs incurred under the TSA during the nine months ended September 30, 2023.
Incentive Fee
The Special Unit Holder, formerly an affiliate of the Former Advisor, was entitled to receive distributions equal to 15.0% of net cash flows of the Company, whether from continuing operations, repayment of loans, disposition of assets or otherwise, but only after stockholders have received, in the aggregate, cumulative distributions equal to their invested capital plus a 6.75% cumulative, non-compounded annual pre-tax return on such invested capital. From inception through the date of the Sale of Minority Interests, the Special Unit Holder did not receive any incentive fees from the Company.
In connection with the Sale of Minority Interests, as of June 9, 2023, the Special Unit Holder became an indirect subsidiary of the Company, though the Special Unit Holder continues to have a contractual obligation to pay any such incentive fees to affiliates of the Former Sponsor, if ever earned.
Investments in JointUnconsolidated Ventures
Solstice, the manager of the Winterfell portfolio, is a joint venture between affiliates of ISL, which owns 80.0%, and the Company, which owns 20.0%. For the ninethree months ended September 30, 2023,March 31, 2024, the Company recognized property management fee expense of $5.1$1.7 million payable to Solstice related to the Winterfell portfolio.
In June 2023, the Company completed the Sale of Minority Interests, involving the sale of its minority interests in the Diversified US/UK and Eclipse Portfolios, together with $1.1 million in cash, to its Former Sponsor, who is affiliated with the majority partner of each joint venture, for all of the Company’s equity securities held by the Former Sponsor and its affiliates. Refer to Note 4, “Investments in Unconsolidated Ventures” for further discussion of the Sale of Minority Interests.
NORTHSTAR HEALTHCARE INCOME, INC. AND SUBSIDIARIES
NOTES TO CONSOLIDATED FINANCIAL STATEMENTS (Continued)
(Unaudited)
7. Equity-Based Compensation
The Company adopted a long-term incentive plan, as amended (the “Plan”), which it may use to attract and retain qualified officers, directors, employees and consultants, as well as an independent directors compensation plan, which is a component of the Plan. Under the Plan, 2.0 million shares of restricted common stock were eligible to be issued for any equity-based awards granted under the Plan.
Pursuant to the Plan, as of September 30, 2023,March 31, 2024, the Company’s independent directors were granted a total of 159,932 shares of restricted common stock and 203,742 restricted stock units totaling $1.3 million and $0.7 million, respectively, based on the share price on the date of each grant.
The restricted common stock and restricted stock units granted generally vest quarterly over two years in equal installments and will become fully vested on the earlier occurrence of: (i) the termination of the independent director’s service as a director due to his or her death or disability; or (ii) a change in control of the Company. The restricted stock units are convertible, on a one-for-one basis, into shares of the Company’s common stock upon the earlier occurrence of: (i) the termination of the independent director’s service as a director; or (ii) a change in control of the Company.
NORTHSTAR HEALTHCARE INCOME, INC. AND SUBSIDIARIES
NOTES TO CONSOLIDATED FINANCIAL STATEMENTS (Continued)
(Unaudited)
The Company recognized equity-based compensation expense of $56,250 and $56,875 for the three months ended September 30,March 31, 2024 and 2023, and 2022, respectively, and $170,000 and $150,042 for the nine months ended September 30, 2023 and 2022, respectively. Equity-based compensation expense is recorded in general and administrative expenses in the consolidated statements of operations.
Unrecognized expense related to unvested restricted stock units totaled $296,250$183,750 and $211,250$240,000 as of September 30, 2023March 31, 2024 and December 31, 2022,2023, respectively. Unvested restricted stock units totaled 94,85360,628 and 54,11477,741 as of September 30, 2023March 31, 2024 and December 31, 2022,2023, respectively. As of December 31, 2022, the Company’s shares of restricted common stock were fully vested.
8. Stockholders’ Equity
Common Stock
The Company stopped accepting subscriptions for its Offering on December 17, 2015 and all of the shares initially registered for its Offering were issued on or before January 19, 2016. The Company issued 173.4 million shares of common stock generating gross proceeds of $1.7 billion, excluding proceeds from the DRP.
Distribution Reinvestment Plan
The Company adopted the DRP through which common stockholders were able to elect to reinvest an amount equal to the distributions declared on their shares in additional shares of the Company’s common stock in lieu of receiving cash distributions. Since inception, the Company issued 25.7 million shares of common stock, generating gross offering proceeds of $232.6 million pursuant to the DRP. No selling commissions or dealer manager fees were paid on shares issued pursuant to the DRP. In April 2022, the Company’s board of directors elected to end the DRP, effective April 30, 2022.
Distributions
Effective February 1, 2019, the Company’s board of directors determined to stop recurring distributions in order to preserve capital and liquidity.
On April 20, 2022, the Company’s board of directors declared a special distribution of $0.50 per share (the “Special Distribution”) for each stockholder of record on May 2, 2022 totaling approximately $97.0 million.
In order to continue to qualify as a REIT, the Company must distribute annually dividends equal to at least 90% of its REIT taxable income (with certain adjustments). The Company did not have REIT taxable income for its taxable year ending December 31, 2022, therefore, it was not required to make distributions to its stockholders in 2022 to qualify as a REIT. The Company’s most recently filed tax return is for the year ended December 31, 2022 and includes a net operating loss carry-forward of $248.5 million.
Share Repurchase Program
The Company adopted thea share repurchase program (the “Share Repurchase Program”) that enabled stockholders to sell their shares to the Company in limited circumstances and could be amended, suspended, or terminated at any time. The Company
NORTHSTAR HEALTHCARE INCOME, INC. AND SUBSIDIARIES
NOTES TO CONSOLIDATED FINANCIAL STATEMENTS (Continued)
(Unaudited)
previously funded repurchase requests with cash on hand, borrowings or other available capital. In April 2020, the Company’s board of directors determined to suspend all repurchases under the Share Repurchase Programshare repurchase program effective April 30, 2020 in order to preserve capital and liquidity and does not currently anticipate resuming the Share Repurchase Program.
Retirement of Shares
In connection with the Sale of Minority Interests, the Company acquired 9.7 million shares of its common stock in exchange for its minority interests in the Diversified US/UK and Eclipse Portfolios from its Former Sponsor, who is affiliated with the majority partner of each joint venture. Upon completion of the Sale of Minority Interests, the Company retired all of the shares of common stock acquired.
To account for the acquisition and retirement of the common stock, the Company estimated the value of its minority interests in the Diversified US/UK and Eclipse Portfolios based on a variety of factors, including historical and projected revenues, market lease rates, the partners’ respective rights under the joint venture agreements, independent third-party appraisals obtained by the joint ventures and other factors deemed relevant. The Company determined the estimated value of minority interests to be approximately $12.5 million at the time of transaction. The estimated value, together with the $1.1 million of cash consideration, net of closing costs, is presented on the consolidated statements of equity as retirement of common stock.share repurchase program.
9. Non-controlling Interests
Operating Partnership
Non-controlling interests included the aggregate limited partnership interests in the Operating Partnership held by limited partners, other than the Company. Income (loss) attributable to the non-controlling interests was based on the limited partners’ ownership percentage of the Operating Partnership. As a result of the Sale of Minority Interests on June 9, 2023, the Company’s limited partnership interest in the Operating Partnership, directly or indirectly, is 100.0%100% as of September 30, 2023.March 31, 2024. Income (loss) allocated to the Operating Partnership non-controlling interests for the period prior to June 9, 2023 werewas de minimis.
Other
Other non-controlling interests represent third-party equity interests in ventures that are consolidated with the Company’s financial statements. Net loss attributable to the other non-controlling interests was $0.2 million$114,761 and $0.1 million$71,242 for the three months ended September 30,March 31, 2024 and 2023, and 2022, respectively, and $1.5 million and $0.3 million for the nine months ended September 30, 2023 and 2022, respectively.
NORTHSTAR HEALTHCARE INCOME, INC. AND SUBSIDIARIES
NOTES TO CONSOLIDATED FINANCIAL STATEMENTS (Continued)
(Unaudited)
10. Fair Value
Fair Value Measurement
The fair value of financial instruments is categorized based on the priority of the inputs to the valuation technique and categorized into a three-level fair value hierarchy. The fair value hierarchy gives the highest priority to quoted prices in active markets for identical assets or liabilities (Level 1) and the lowest priority to unobservable inputs (Level 3). If the inputs used to measure the financial instruments fall within different levels of the hierarchy, the categorization is based on the lowest level input that is significant to the fair value measurement of the instrument.
Financial assets and liabilities recorded at fair value on the consolidated balance sheets are categorized based on the inputs to the valuation techniques as follows:
Level 1.Quoted prices for identical assets or liabilities in an active market.
Level 2.Financial assets and liabilities whose values are based on the following:
a)Quoted prices for similar assets or liabilities in active markets.
b)Quoted prices for identical or similar assets or liabilities in non-active markets.
c)Pricing models whose inputs are observable for substantially the full term of the asset or liability.
d)Pricing models whose inputs are derived principally from or corroborated by observable market data for substantially the full term of the asset or liability.
Level 3.Prices or valuation techniques based on inputs that are both unobservable and significant to the overall fair value measurement.
NORTHSTAR HEALTHCARE INCOME, INC. AND SUBSIDIARIES
NOTES TO CONSOLIDATED FINANCIAL STATEMENTS (Continued)
(Unaudited)
Level 3.Prices or valuation techniques based on inputs that are both unobservable and significant to the overall fair value measurement.
Derivative Instruments
Derivative instruments consist of interest rate contracts and foreign exchange contracts that are generally traded over-the-counter, and are valued using a third-party service provider. Quotations on over-the-counter derivatives are not adjusted and are generally valued using observable inputs such as contractual cash flows, yield curve, foreign currency rates and credit spreads, and are classified as Level 2 of the fair value hierarchy. Although credit valuation adjustments, such as the risk of default, rely on Level 3 inputs, these inputs are not significant to the overall valuation of its derivatives. As a result, derivative valuations in their entirety are classified as Level 2 of the fair value hierarchy.
Fair Value Hierarchy
Financial assets recorded at fair value on a recurring basis are classified in their entirety based on the lowest level of input that is significant to the fair value measurement. The following table presents financial assets that were accounted for at fair value on a recurring basis as of September 30, 2023March 31, 2024 and December 31, 20222023 by level within the fair value hierarchy (dollars in thousands):
| | | | | | | | | | | | | | | | | | | | | | | | | | | | | | | | | | | |
| September 30, 2023 (Unaudited) | | December 31, 2022 |
| Level 1 | | Level 2 | | Level 3 | | Level 1 | | Level 2 | | Level 3 |
| Financial assets: | | | | | | | | | | | |
| Derivative assets - interest rate caps | $ | — | | | $ | 820 | | | $ | — | | | $ | — | | | $ | 652 | | | $ | — | |
Investment in Espresso joint venture(1) | — | | | — | | | 3,075 | | | — | | | — | | | — | |
(1)The Company elected the fair value option method to account for its investment in the Espresso joint venture on June 30, 2023. As of December 31, 2022, the investment was accounted for under the equity method. | | | | | | | | | | | | | | | | | | | | | | | | | | | | | | | | | | | |
| March 31, 2024 (Unaudited) | | December 31, 2023 |
| Level 1 | | Level 2 | | Level 3 | | Level 1 | | Level 2 | | Level 3 |
| Financial assets: | | | | | | | | | | | |
| Derivative assets - interest rate caps | $ | — | | | $ | 223 | | | $ | — | | | $ | — | | | $ | 433 | | | $ | — | |
| Investment in Espresso joint venture | — | | | — | | | 142 | | | — | | | — | | | 142 | |
Derivative Assets - Interest Rate Caps
The Company’s interest rate caps fair values are determined using models developed by the respective counterparty that use the market standard methodology of discounting the future expected cash receipts that would occur if variable interest rates rise above the strike rate of the caps. The floating interest rates used in the calculation of projected receipts on the caps are based on an expectation of future interest rates derived from observable market interest rate curves and volatilities.
Investment in Espresso Joint Venture
The Company’s assessment of fair value for its unconsolidated investment in the Espresso joint venture took into consideration the net proceeds that are estimated to be realized from the sales, under contract, of the remaining real estate owned by the joint venture as well as forecasted distributionsits proportionate share of available cash, less and wind down costs and other expenses. The Company believes the assessment of fair value to be reasonable as of March 31, 2024 and did not make any fair value adjustments during the three months ended March 31, 2024.
Fair Value of Financial Instruments
U.S. GAAP requires disclosure of fair value about all financial instruments. The following disclosure of estimated fair value of financial instruments was determined by the Company using available market information and appropriate valuation methodologies. Considerable judgment is necessary to interpret market data and develop estimated fair value. Accordingly, the estimates presented herein are not necessarily indicative of the amounts the Company could realize on disposition of the financial instruments. The use of different market assumptions and/or estimation methodologies may have a material effect on estimated fair value.
The following table presents the principal amount, carrying value and fair value of certain financial assets and liabilities (dollars in thousands):
| | September 30, 2023 (Unaudited) | | December 31, 2022 |
| Principal Amount | | Carrying Value | | Fair Value | | Principal Amount | | Carrying Value | | Fair Value |
| March 31, 2024 (Unaudited) | | | March 31, 2024 (Unaudited) | | December 31, 2023 |
| Principal Amount | | | Principal Amount | | Carrying Value | | Fair Value | | Principal Amount | | Carrying Value | | Fair Value |
Financial liabilities:(1) | Financial liabilities:(1) | | | | | | | | | | | |
| Mortgage notes payable, net | Mortgage notes payable, net | $ | 908,287 | | | $ | 901,610 | | | $ | 842,325 | | | $ | 922,355 | | | $ | 912,248 | | | $ | 882,754 | |
| Mortgage notes payable, net | |
| Mortgage notes payable, net | |
(1)The fair value of other financial instruments not included in this table is estimated to approximate their carrying value.
NORTHSTAR HEALTHCARE INCOME, INC. AND SUBSIDIARIES
NOTES TO CONSOLIDATED FINANCIAL STATEMENTS (Continued)
(Unaudited)
Disclosure about fair value of financial instruments is based on pertinent information available to management as of the reporting date. Although management is not aware of any factors that would significantly affect fair value, such amounts have not been comprehensively revalued for purposes of these consolidated financial statements since that date and current estimates of fair value may differ significantly from the amounts presented herein.
NORTHSTAR HEALTHCARE INCOME, INC. AND SUBSIDIARIES
NOTES TO CONSOLIDATED FINANCIAL STATEMENTS (Continued)
(Unaudited)
Mortgage Notes Payable
The Company primarily uses rates currently available with similar terms and remaining maturities to estimate fair value. These measurements are determined using comparable U.S. Treasury and SOFR rates as of the end of the reporting period. These fair value measurements are based on observable inputs, and as such, are classified as Level 2 of the fair value hierarchy.
Nonrecurring Fair Values
The Company measures fair value of certain assets on a nonrecurring basis when events or changes in circumstances indicate that the carrying value of the assets may not be recoverable. Adjustments to fair value generally result from the application of lower of amortized cost or fair value accounting for assets held for sale or otherwise or write-down of asset values due to impairment.
The following table summarizes the fair value and impairment losses of Level 3 assets which have been measured at fair value on a nonrecurring basis at the time of impairment during the periods presented (dollars in thousands):
| | Nine Months Ended | | Year Ended |
| September 30, 2023 (Unaudited) | | December 31, 2022 |
| Fair Value | | Impairment Losses | | Fair Value | | Impairment Losses |
Operating real estate, net(1) | | $ | 41,496 | | | $ | 38,694 | | | $ | 80,931 | | | $ | 30,900 | |
| | Three Months Ended | |
| | Three Months Ended | |
| | Three Months Ended | |
| | March 31, 2024 (Unaudited) | |
| | March 31, 2024 (Unaudited) | |
| | March 31, 2024 (Unaudited) | |
| | Fair Value | |
| | Fair Value | |
| | Fair Value | |
| Operating real estate, net | |
| Operating real estate, net | |
| Operating real estate, net | |
| Investments in unconsolidated ventures | Investments in unconsolidated ventures | | 3,075 | | | 4,728 | | | 28,442 | | | 13,419 | |
| | Investments in unconsolidated ventures | |
| Investments in unconsolidated ventures | |
| Assets held for sale | |
| Assets held for sale | |
| Assets held for sale | |
(1)During the year ended December 31, 2022, the Company recordedExcludes impairment losses totaling $1.0 million for property damage sustained by facilities in its Winterfell and Avamere portfolios. The fair value and impairment losses of these facilities are excluded from the table.facilities.
Operating Real Estate, Net
Operating real estate that is impaired is carried at fair value at the time of impairment. Impairment was driven by various factors that impacted undiscounted future net cash flows, including declines in operating performance, market growth assumptions and expected margins to be generated by the properties. Fair value of impaired operating real estate was estimated based upon various approaches including discounted cash flow analysis using terminal capitalization rates ranging from 6.00%6.25% to 8.50% and discount rates ranging from 8.5%7.75% to 10.5%10.50%, third party appraisals and offer prices.
Investments in Unconsolidated Ventures
In June 2023, the Company recorded impairment onimpaired its investment in the Espresso joint venture which totaledby $4.7 million, andwhich reduced the carrying value of its investment to $3.1 million as of June 30, 2023. The Company’s assessment forof fair value at the recoverabilitytime of impairment for its investment took into consideration the net proceeds that are estimated to be realized from the sales, under contract, of the remaining real estate owned by the joint venture as well as forecasted distributionsthe Company’s proportionate share of available cash, less and wind down costs and other expenses. Upon impairing its investment, the Company elected the fair value option method to account for its investment in the Espresso joint venture on June 30, 2023.
DuringAssets Held For Sale
Assets held for sale are carried at the year ended Decemberlower of amortized cost or fair value. Assets held for sale that were written down to fair value were generally valued using either broker opinions of value, or a combination of market information, including third-party appraisals and indicative sale prices, adjusted as deemed appropriate by management to account for the inherent risk associated with specific properties. In all cases, the fair value of assets held for sale is reduced for estimated selling costs. As of March 31, 2022,2024, the Company recorded impairment on its investment inclassified one land parcel within the Diversified US/UK joint venture, which totaled $13.4 million and reduced the carrying value of its investment to $28.4 millionRochester portfolio as held for sale. As of December 31, 2022. The Company’s assessment for2023, the recoverability of its investment took into consideration the joint venture’s post-COVID-19 underperformance, rising interest rates and the joint venture’s ability to continue to service debt collateralized by substantially all of its domestically-located healthcare real estate. Fair value of the joint venture’s underlyingCompany classified one operating real estate property within the Rochester portfolio as held for sale, which was estimated based upon various approaches including discounted cash flow analysis, using terminal capitalization rates ranging from 6.6% to 12.5% and discount rates ranging from 8.8% to 16.0%, and offer prices.sold in February 2024.
NORTHSTAR HEALTHCARE INCOME, INC. AND SUBSIDIARIES
NOTES TO CONSOLIDATED FINANCIAL STATEMENTS (Continued)
(Unaudited)
11. Segment Reporting
The Company conducts its business through the following segments, which are based on how management reviews and manages its business.
•Direct Operating Investments - Operating- Properties operated pursuant to management agreements with healthcare managers.
NORTHSTAR HEALTHCARE INCOME, INC. AND SUBSIDIARIES
NOTES TO CONSOLIDATED FINANCIAL STATEMENTS (Continued)
(Unaudited)
•Direct Investments - Net Lease Investments - Properties operated under net leases with an operator.
•Unconsolidated Investments - Joint ventures, including properties operated under net leases with operators or pursuant to management agreements with healthcare managers,venture investments, in which the Company owns a minority, non-controlling interest.
•Corporate -Our chief operating decision maker (“CODM”) evaluates performance of each reportable business segment and determines how to allocate resources to those segments, in significant part, based on net operating income (“NOI”) and related measures for each segment. The corporate segment includes corporate level assetCompany defines NOI as property and other revenues, less property operating expenses. While the Company believes that net income (loss), as defined by GAAP, is the most appropriate earnings measurement, the Company believes that NOI provides useful information to stockholders and provides management fees - related party and general and administrative expenses.with a performance measure to compare the Company's operating results to the operating results of other healthcare real estate companies between periods on a consistent basis.
The Company primarily generatesfollowing tables present the NOI of the Company’s direct investments segments and the Company's proportionate share of the NOI generated by the joint ventures of its unconsolidated investments segment (dollars in thousands):
| | | | | | | | | | | | | | | | | | | | | | | | | | | | | | | | | | | | | | |
| | Direct Investments | | | | | | | | |
| Three Months Ended March 31, 2024 | | Net Lease | | Operating | | Unconsolidated Investments | | Non-Segment(2) | | Adjustments(3) | | Total(4) |
Property and other revenues(1) | | $ | — | | | $ | 47,872 | | | $ | 92,022 | | | $ | 880 | | | $ | (92,022) | | | $ | 48,752 | |
| Property operating expenses | | — | | | (33,381) | | | (81,899) | | | — | | | 81,899 | | | (33,381) | |
| Net operating income | | $ | — | | | $ | 14,491 | | | $ | 10,123 | | | $ | 880 | | | $ | (10,123) | | | $ | 15,371 | |
| | | | | | | | | | | | |
| Interest expense | | | | | | | | | | | | (12,862) | |
| Transaction costs | | | | | | | | | | | | (16) | |
| General and administrative expenses | | | | | | | | | | | | (3,327) | |
| Depreciation and amortization | | | | | | | | | | | | (8,901) | |
| Impairment loss | | | | | | | | | | | | (456) | |
| Other income, net | | | | | | | | | | | | 1,000 | |
| Gain (loss) on investments and other | | | | | | | | | | | | 150 | |
| Equity in earnings (losses) of unconsolidated ventures | | | | | | | | | | | | 1,014 | |
| Income tax expense | | | | | | | | | | | | (20) | |
| Net income (loss) | | | | | | | | | | | | $ | (8,047) | |
(1)Includes rental income received from net lease properties, if any, as well as resident room and resident feecare charges, ancillary service fees and other related revenue earned from operating properties.
(2)Primarily consists of interest income from its direct investments. Additionally,earned on corporate cash and equivalents.
(3)Represents adjustments to eliminate the NOI presented for the unconsolidated investments segment, in order to reconcile to the Company's net income (loss) prepared in accordance with GAAP. For investments accounted for under the equity method of accounting, the Company reportsrecords its proportionate interestshare of revenues and expenses fromthe net income of its unconsolidated investments through equity in earnings (losses) of unconsolidated ventures.ventures as presented on its consolidated statements of operations.
The following tables present(4)Non-NOI items are not allocated to individual segments for purposes of assessing segment reporting (dollars in thousands):
| | | | | | | | | | | | | | | | | | | | | | | | | | | | | | | | | | |
| | Direct Investments | | | | | | | | |
| Three Months Ended September 30, 2023 | | Net Lease | | Operating | | Unconsolidated Investments | | | | Corporate | | Total |
| Property and other revenues | | $ | 837 | | | $ | 51,459 | | | $ | — | | | | | $ | 1,078 | | | $ | 53,374 | |
| | | | | | | | | | | | |
| Property operating expenses | | — | | | (36,890) | | | — | | | | | — | | | (36,890) | |
| Interest expense | | (883) | | | (13,367) | | | — | | | | | — | | | (14,250) | |
| Transaction costs | | — | | | — | | | (358) | | | | | — | | | (358) | |
| | | | | | | | | | | | |
| General and administrative expenses | | — | | | (30) | | | — | | | | | (2,891) | | | (2,921) | |
| Depreciation and amortization | | (729) | | | (9,119) | | | — | | | | | — | | | (9,848) | |
| | | | | | | | | | | | |
| | | | | | | | | | | | |
| Gain (loss) on investments and other | | — | | | (311) | | | (36) | | | | | — | | | (347) | |
| Equity in earnings (losses) of unconsolidated ventures | | — | | | — | | | (127) | | | | | — | | | (127) | |
| Income tax expense | | — | | | (17) | | | — | | | | | — | | | (17) | |
| Net income (loss) | | $ | (775) | | | $ | (8,275) | | | $ | (521) | | | | | $ | (1,813) | | | $ | (11,384) | |
| | | | | | | | | | | | | | | | | | | | | | | | | | | | | | | | |
| | Direct Investments | | | | | | |
| Three Months Ended September 30, 2022 | | Net Lease | | Operating | | Unconsolidated Investments | | Corporate | | Total |
| Property and other revenues | | $ | 724 | | | $ | 46,715 | | | $ | — | | | $ | 300 | | | $ | 47,739 | |
| | | | | | | | | | |
| Property operating expenses | | — | | | (35,134) | | | — | | | — | | | (35,134) | |
| Interest expense | | (907) | | | (10,107) | | | — | | | — | | | (11,014) | |
| Transaction costs | | — | | | — | | | — | | | (857) | | | (857) | |
| Asset management fees - related party | | — | | | — | | | — | | | (2,428) | | | (2,428) | |
| General and administrative expenses | | — | | | (8) | | | — | | | (2,851) | | | (2,859) | |
| Depreciation and amortization | | (870) | | | (8,772) | | | — | | | — | | | (9,642) | |
| Impairment loss | | (18,500) | | | — | | | — | | | — | | | (18,500) | |
| | | | | | | | | | |
| Gain (loss) on investments and other | | — | | | 325 | | | — | | | — | | | 325 | |
| Equity in earnings (losses) of unconsolidated ventures | | — | | | — | | | 2,872 | | | — | | | 2,872 | |
| Income tax expense | | — | | | (15) | | | — | | | — | | | (15) | |
| Net income (loss) | | $ | (19,553) | | | $ | (6,996) | | | $ | 2,872 | | | $ | (5,836) | | | $ | (29,513) | |
NORTHSTAR HEALTHCARE INCOME, INC. AND SUBSIDIARIES
NOTES TO CONSOLIDATED FINANCIAL STATEMENTS (Continued)
(Unaudited)
| | | Direct Investments | |
| Three Months Ended March 31, 2023 | |
| Three Months Ended March 31, 2023 | |
| Three Months Ended March 31, 2023 | | | Net Lease | | Operating | | Unconsolidated Investments(2) | | Non-Segment(3) | | Adjustments(4) | | Total(5) |
Property and other revenues(1) | |
| Property operating expenses | |
| Net operating income | |
| | Direct Investments | | | |
| Nine Months Ended September 30, 2023 | | Net Lease | | Operating | | Unconsolidated Investments | | | Corporate | | Total |
| Property and other revenues | | $ | 1,178 | | | $ | 150,374 | | | $ | — | | | | $ | 2,893 | | | $ | 154,445 | |
| | Property operating expenses | | — | | | (106,993) | | | — | | | | — | | | (106,993) | |
| Interest expense | |
| Interest expense | |
| Interest expense | Interest expense | | (2,639) | | | (34,504) | | | — | | | | — | | | (37,143) | |
| Transaction costs | Transaction costs | | — | | | — | | | (358) | | | | (97) | | | (455) | |
| | General and administrative expenses | General and administrative expenses | | — | | | (555) | | | — | | | | (9,869) | | | (10,424) | |
| Depreciation and amortization | Depreciation and amortization | | (2,187) | | | (27,118) | | | — | | | | — | | | (29,305) | |
| Impairment loss | | — | | | (38,694) | | | (4,728) | | | | — | | | (43,422) | |
| | Other income, net | |
| Other income, net | |
| Other income, net | Other income, net | | — | | | 202 | | | — | | | | — | | | 202 | |
| Gain (loss) on investments and other | Gain (loss) on investments and other | | — | | | (28) | | | (4,634) | | | | — | | | (4,662) | |
| Equity in earnings (losses) of unconsolidated ventures | Equity in earnings (losses) of unconsolidated ventures | | — | | | — | | | (6,595) | | | | — | | | (6,595) | |
| Income tax expense | Income tax expense | | — | | | (43) | | | — | | | | — | | | (43) | |
| Net income (loss) | Net income (loss) | | $ | (3,648) | | | $ | (57,359) | | | $ | (16,315) | | | | $ | (7,073) | | | $ | (84,395) | |
| | | | | | | | | | | | | | | | | | | | | | | | | | | | | | | | | | |
| | Direct Investments | | | | | | | | |
| Nine Months Ended September 30, 2022 | | Net Lease | | Operating | | Unconsolidated Investments | | | | Corporate | | Total |
| Property and other revenues | | $ | 1,220 | | | $ | 134,768 | | | $ | — | | | | | $ | 457 | | | $ | 136,445 | |
| | | | | | | | | | | | |
| Property operating expenses | | (35) | | | (101,223) | | | — | | | | | — | | | (101,258) | |
| Interest expense | | (2,708) | | | (29,169) | | | — | | | | | — | | | (31,877) | |
| Transaction costs | | — | | | — | | | — | | | | | (857) | | | (857) | |
| Asset management fees - related party | | — | | | — | | | — | | | | | (7,532) | | | (7,532) | |
| General and administrative expenses | | — | | | (24) | | | — | | | | | (10,276) | | | (10,300) | |
| Depreciation and amortization | | (2,601) | | | (26,504) | | | — | | | | | — | | | (29,105) | |
| Impairment loss | | (18,500) | | | (13,002) | | | — | | | | | — | | | (31,502) | |
| Other income, net | | — | | | 77 | | | — | | | | | — | | | 77 | |
| Gain (loss) on investments and other | | (206) | | | 620 | | | 246 | | | | | — | | | 660 | |
| Equity in earnings (losses) of unconsolidated ventures | | — | | | — | | | 39,427 | | | | | — | | | 39,427 | |
| Income tax expense | | — | | | (45) | | | — | | | | | — | | | (45) | |
| Net income (loss) | | $ | (22,830) | | | $ | (34,502) | | | $ | 39,673 | | | | | $ | (18,208) | | | $ | (35,867) | |
(3)Primarily consists of interest income earned on corporate cash and equivalents.
(4)Represents adjustments to eliminate the NOI presented for the unconsolidated investments segment, in order to reconcile to the Company's net income (loss) prepared in accordance with GAAP. For investments accounted for under the equity method of accounting, the Company records its proportionate share of the net income of its unconsolidated investments through equity in earnings (losses) of unconsolidated ventures as presented on its consolidated statements of operations.
(5)Non-NOI items are not allocated to individual segments for purposes of assessing segment performance.
The following table presents total assets by segment (dollars in thousands):
| | | | | | | | | | | | | | | | | | | | | | | | | | | | | | | | |
| | Direct Investments | | | | | | |
| Total Assets: | | Net Lease | | Operating | | Unconsolidated Investments | | Corporate(1) | | Total |
| September 30, 2023 (Unaudited) | | $ | 80,782 | | | $ | 847,401 | | | $ | 128,026 | | | $ | 79,707 | | | $ | 1,135,916 | |
| December 31, 2022 | | 83,435 | | | 884,137 | | | 176,502 | | | 93,761 | | | 1,237,835 | |
| | | | | | | | | | | | | | | | | | | | | | | | | | | | | | | | |
| | Direct Investments | | | | | | |
| Total Assets: | | Net Lease | | Operating | | Unconsolidated Investments | | Non-Segment(1) | | Total |
| March 31, 2024 | | $ | 73,633 | | | $ | 770,400 | | | $ | 123,963 | | | $ | 69,135 | | | $ | 1,037,131 | |
| December 31, 2023 | | 74,655 | | | 787,925 | | | 122,949 | | | 73,890 | | | 1,059,419 | |
(1)Represents primarily corporate cash and cash equivalents balances.
NORTHSTAR HEALTHCARE INCOME, INC. AND SUBSIDIARIES
NOTES TO CONSOLIDATED FINANCIAL STATEMENTS (Continued)
(Unaudited)
The following table presents capital expenditures made by the operators and managersCompany for each of the Company’s properties, excluding properties owned through unconsolidated joint venturesits reportable segments (dollars in thousands):
| | | | | | | | | | | | | | | | | | | | | | | |
| As of September 30, 2023 | | Nine Months Ended September 30, 2023 |
| Operator / Manager | Properties Under Management | | Units Under Management(1) | | Property and Other Revenues(2) | | % of Total Property and Other Revenues |
Solstice Senior Living(3) | 32 | | | 3,969 | | | $ | 94,469 | | | 61.2 | % |
| Watermark Retirement Communities | 14 | | | 1,782 | | | 35,967 | | | 23.2 | % |
| Avamere Health Services | 5 | | | 453 | | | 16,266 | | | 10.5 | % |
| Integral Senior Living | 1 | | | 40 | | | 3,672 | | | 2.4 | % |
Arcadia Management(4) | 4 | | | 572 | | | 1,178 | | | 0.8 | % |
Other(5) | — | | | — | | | 2,893 | | | 1.9 | % |
| Total | 56 | | | 6,816 | | | $ | 154,445 | | | 100.0 | % |
(1)Represents rooms for ALFs, ILFs and MCFs, based on predominant type.
(2)Includes rental income received from the Company’s net lease properties as well as rental income, ancillary service fees and other related revenue earned from ILF residents and resident fee income derived from the Company’s ALFs and MCFs, which includes resident room and care charges, ancillary fees and other resident service charges.
(3)Solstice is a joint venture of which affiliates of ISL own 80%.
(4)During the nine months ended September 30, 2023, the Company recorded rental income to the extent payments were received.
(5)Consists primarily of interest income earned on corporate-level cash and cash equivalents. | | | | | | | | | | | | | | | | | | | | | | | | | | | | | | | | |
| | Direct Investments | | | | | | |
| Total Capital Expenditures for the Three Months Ended: | | Net Lease | | Operating | | Unconsolidated Investments | | Non-Segment | | Total |
| March 31, 2024 | | $ | — | | | 2,926 | | | $ | — | | | $ | — | | | $ | 2,926 | |
| March 31, 2023 | | — | | | 3,810 | | | — | | | — | | | 3,810 | |
12. Commitments and Contingencies
As of September 30, 2023,March 31, 2024, the Company believes there are no material unrecorded contingencies that would affect its results of operations, cash flows or financial position.
Litigation and Claims
The Company may be involved in various litigation matters arising in the ordinary course of its business. Although the Company is unable to predict with certainty the eventual outcome of any litigation, any current legal proceedings are not expected to have a material adverse effect on its financial position or results of operations.
NORTHSTAR HEALTHCARE INCOME, INC. AND SUBSIDIARIES
NOTES TO CONSOLIDATED FINANCIAL STATEMENTS (Continued)
(Unaudited)
The Company’s operators and managers may be involved in various litigation matters arising in the ordinary course of their business. The unfavorable resolution of any such actions, investigations or claims could, individually or in the aggregate, materially adversely affect such operators’ or managers’ liquidity, financial condition or results of operations and their ability to satisfy their respective obligations to the Company, which, in turn, could have a material adverse effect on the Company.
As of September 30, 2023,March 31, 2024, the Company has an accrued reserve of $0.6 million, inclusive of legal fees, relating to a resolution of claims against a manager of one of the Company’s direct operating investments, for which the Company has indemnification obligations under the management agreement.
Environmental Matters
The Company follows a policy of monitoring its properties for the presence of hazardous or toxic substances. While there can be no assurance that a material environmental liability does not exist at its properties, the Company is not currently aware of any environmental liability with respect to its properties that would have a material effect on its consolidated financial position, results of operations or cash flows. Further, the Company is not aware of any material environmental liability or any unasserted claim or assessment with respect to an environmental liability that it believes would require additional disclosure or the recording of a loss contingency.
NORTHSTAR HEALTHCARE INCOME, INC. AND SUBSIDIARIES
NOTES TO CONSOLIDATED FINANCIAL STATEMENTS (Continued)
(Unaudited)
General Uninsured Losses
The Company obtains various types of insurance to mitigate the impact of professional liability, property, business interruption, liability, flood, windstorm, earthquake, environmental and terrorism related losses. The Company attempts to obtain appropriate policy terms, conditions, limits and deductibles considering the relative risk of loss, the cost of such coverage and current industry practice. Disruptions in insurance markets may increase the costs of coverage and result in the Company retaining more risk, to the extent it is more commercially reasonable to do so. In addition, there are also certain types of extraordinary losses, such as those due to acts of war or other events, that may be either uninsurable or not economically insurable.
Other
Other commitments and contingencies include the usual obligations of real estate owners and operators in the normal course of business, as well as commitments to fund capital expenditures for certain net lease properties. These commitments do not have a required minimum funding and are limited by agreed upon maximum annual funding amounts.
13. Subsequent Events
The following is a discussion ofThere were no material events which have occurred subsequent to September 30, 2023March 31, 2024 through the issuance of the consolidated financial statements.
Rochester Receivership
As a result of the payment default in July 2023 of the Rochester Sub-Portfolio Loan, on October 25, 2023, the lender filed a complaint seeking the appointment of a receiver and foreclosure on the underlying properties and to enforce its rights in its collateral under the loan documents and, on October 30, 2023, the properties underlying the Rochester Sub-Portfolio Loan were placed into a receivership. The receiver now has effective control of the properties and the Company is working with the lender and the receiver to facilitate an orderly transition of the operations, and eventually ownership, of the properties.
Trilogy Option Agreement
On November 3, 2023, the Company entered into an agreement to sell all of its ownership interests in Trilogy REIT Holdings, LLC (the “Trilogy Joint Venture”), which indirectly owns 123 integrated senior health campuses, to American Healthcare REIT, Inc. or its affiliates (“AHR”), the majority partner of the Trilogy Joint Venture. Under the agreement, AHR has the right to purchase the Company’s ownership interests in the Trilogy Joint Venture at any time prior to September 30, 2025, assuming AHR exercises all of its extension options and subject to satisfaction of certain closing conditions, for a purchase price ranging from $240.5 million to up to $260 million depending upon the purchase price consideration and timing of the closing. A minimum of 10% of the purchase price consideration must be paid in cash, with the balance payable in either cash or new Series A Cumulative Convertible Preferred Stock to be issued by AHR in connection with the closing. The portion of the purchase price consideration paid in cash may be subject to a 7.5% or 5% discount, respectively, if the transaction closes prior to March 31, 2024 or December 31, 2024, respectively. In addition, the Company may be entitled to a supplemental cash payment of $25,600 per day for the period between July 1, 2023 until the closing date, for up to approximately $21 million, if the Trilogy Joint Venture does not distribute an equivalent amount to the Company during the interim period. AHR may terminate the agreement at any time, subject to payment of a termination fee equal to: (i) if terminated prior to the initial outside date, September 30, 2024, $3.9 million or, if a “Qualifying IPO” (i.e., an underwritten public offering of AHR’s common stock resulting in at least $200 million of net proceeds) has occurred, $7.8 million, (ii) if extended and terminated prior March 31, 2025, $11.7 million and (iii) if further extended and terminated prior to September 30, 2025, $15.6 million. There can be no assurance that AHR will consummate the purchase of the Company’s interests on these terms or at all.
Item 2. Management’s Discussion and Analysis of Financial Condition and Results of Operations
The following discussion should be read in conjunction with our consolidated financial statements and notes thereto included in Part I, Item 1. “Financial Statements” and the risk factors in Part II, Item 1A. “Risk Factors.” References to “we,” “us,” “our,” or “NorthStar Healthcare” refer to NorthStar Healthcare Income, Inc. and its subsidiaries unless the context specifically requires otherwise.
Overview
We own a diversified portfolio of seniors housing properties, including independent living facilities, or ILFs, assisted living facilities, or ALFs, and memory care facilities, or MCFs, located throughout the United States. In addition, we have investmentsan investment through a non-controlling interests in joint venturesinterest in a broader spectrum of healthcare real estate, including seniors housing properties, as well as,joint venture that invests in integrated senior health campuses, which provide services associated with ILFs, ALFs, MCFs and skilled nursing facilities, or SNFs, and ancillary services businesses, located throughoutacross the Midwest region of the United States.
We were formed in October 2010 as a Maryland corporation and commenced operations in February 2013. We elected to be taxed as a REIT under the Internal Revenue Code of 1986, as amended, or the Internal Revenue Code, commencing with the taxable year ended December 31, 2013. We conduct our operations so as to continue to qualify as a REIT for U.S. federal income tax purposes.
We raised $2.0 billion in total gross proceeds from the sale of shares of our common stock in our continuous, public offerings, including $232.6 million pursuant to our distribution reinvestment plan, or our DRP, collectively referred to as our Offering.
The Internalization
From inception through October 21, 2022, we were externally managed by CNI NSHC Advisors, LLC or its predecessor, or the Former Advisor, an affiliate of NRF Holdco, LLC, or the Former Sponsor. The Former Advisor was responsible for managing our operations, subject to the supervision of our board of directors, pursuant to an advisory agreement. On October 21, 2022, we completed the internalization of our management function, or the Internalization. In connection with the Internalization, we agreed with the Former Advisor to terminate the advisory agreement and arranged for the Former Advisor to continue to provide certain services for a transition period.agreement.
Our Strategy
Our primary objective is to maximize value and generate liquidity for shareholders. The key elements of our strategy include:
•Grow the Operating Income Generated by Our Portfolio. ThroughWe are focused on growing the net operating income generated by our properties, through active portfolio management we will continueand selectively deploying capital expenditures to review and implement operating strategies and initiatives that address factors impacting the industry, including inflation and other economic conditions, to enhance the performance of our existing investment portfolio.
•Deploy Strategic Capital Expenditures. We will continue to invest capital into our investments in order to maintain market position, functional and operating standards, and improve occupancy and resident rates while managing expenses, in an effort to enhance the overall value of our assets.
•Pursue Disposition Opportunities that Maximize Value. We will pursue dispositions of assets and portfolios where we believe the disposition will achieve a desired return and generateor strategic outcome, with the goal of maximizing value for shareholders.shareholders overall.
Market Update
Seniors Housing Fundamentals
Current market conditions impacting property-level performance are generally favorable. Industry occupancy continues to grow, with an industry average of 84.4%85.6% for the thirdfirst quarter of 2023,2024, up 8050 basis points from the previous quarter, but still remains below the pre-pandemic average of 87.1% in March 2020 (source: NIC MAP Vision 3Q20231Q2024 Market Fundamentals Report). The 80+ population, a key demographic for seniorseniors housing, is expected to grow by 24% through 2028 (source: Organization for Economic Cooperation and Developmentis forecasted to increase by 3.7% in 2024 (Source: NIC MAP Vision as of NovemberDecember 2023), and new supply and new construction remain low compared to historical levels, resulting in a demand and supply environment that should contribute to continued overall industry occupancy and revenue growth. We have made significant capital improvements to many of our properties, which along with these positive dynamics, has contributed to the strong 29.3% growth in revenues, net of property expenses, for the nine months ended September 30, 2023 compared to the same period last year in our directly owned portfolio. Although we continue to face higher labor costs and operating expenses due to inflation, overall we remain optimistic that revenue growth will exceed expense growth, resulting in continued improved net operating income growth.
By contrast, currentSeniors Housing Transactions
Current market conditions affecting transactions, including asset sales, areremain challenging. The current state of the public and private capital markets have been affected by a general tightening of availability of credit (including the price, terms
and conditions under which financing can be obtained), risingelevated interest rates and a general decrease in liquidity in the healthcare lending markets, which has resulted in higher capitalization rates, adversely impacting property values and limiting transaction activity. The senior housing and care transaction volume totaled $700 million during the third quarter
Liquidity Update
We have not announced or adopted a plan for liquidation and are not required to liquidate by any specified date. We do not have a stated term for a liquidity event, as we believe setting a finite date for a possible, but uncertain, future liquidity transaction may result in actions that are not necessarily in the best interest or within the expectations of our stockholders. However,shareholders.
Although opportunities may exist to dispose of assets in the current market environment and there are certain scenarios where a sale can generate acceptable market returns for shareholders, many opportunities in the current market may require us to take significant discounts to our boardview of directors, through a special committee formed in August 2020, has evaluated a broad range of transactions, including restructurings, dispositions of particular assets and the company as a whole and the internalization of management, among others. Although this review process did not result in any opportunities to effect a liquidity event for stockholders at an acceptable value at that time, the board of directors has implemented steps to better position us for a future liquidity event. First, our.
Our current focus is on growing the net operating income of our existing direct investments, including through selectively investing capital into certain properties in order to achieve a better return upon the sale of those properties. If market conditions improve, we will then proceed with a general plan to sell assets over the next 2-3 years, while also exploring potential merger transactions in which the whole company would be acquired. In addition, the board of directors believes that the decision to internalize management in 2022, and the ability to more closely align management’s incentives with this strategy, will give us the best chance of success.
Based on the current forecasted cash flow of our investments and cash needs to operate the business, we do not anticipate paying recurring dividends or resuming our share repurchase program in the near future. Although we have more than $98.7approximately $91.3 million of unrestricted cash as of November 9, 2023,May 7, 2024, we require capital to fund operations, capital expenditures, including those invested to improve performance, and other important business uses, as well as to fund our debt service obligations and potentially to refinance indebtedness. Current cash flow generated by operations is not sufficient to cover all of these obligations. If we do not have sufficient capital available to fund our obligations, we may be unable to position properties to maximize value or meet debt service obligations. Instead, the board of directors will evaluate special distributions in connection with any future sales and other realizations of investments on a case-by-case basis based on, among other factors, current and projected liquidity needs.
In light of the foregoing, we do not currently anticipate resuming the share repurchase program, or the Share Repurchase Program. If we have sufficient capital available, at this stage in our life cycle, we believe that returning capital to stockholders through special distributions, rather than repurchases, is a better use of that capital.
Business Update
•On November 9, 2023, upon the recommendationOperating Performance
The following is a summary of the audit committee of the board of directors, or the Audit Committee, the board of directors, including all of its independent directors, approved and established an estimated value per shareperformance of our common stock of $2.64. Refer to Part II, Item 5. “Other Items”investment segments for additional information.
Transaction and Financing Activities
•In November 2023, we entered into an agreement to sell all of our ownership interests in Trilogy REIT Holdings, LLC, or the Trilogy Joint Venture, which indirectly owns 123 integrated senior health campuses, to American Healthcare REIT, Inc. or its affiliates, or AHR, the majority partner of the Trilogy Joint Venture. AHR has the right to purchase our ownership interests in the Trilogy Joint Venture at any time prior to September 30, 2025, assuming AHR exercises all of its extension options and subject to satisfaction of certain closing conditions, ranging from $240.5 million to up to $260 million depending upon the purchase price consideration and timing of the closing. A minimum of 10% of the purchase price consideration must be paid in cash, with the balance payable in either cash or new Series A Cumulative Convertible Preferred Stock to be issued by AHR in connection with the closing. The portion of the purchase price consideration paid in cash may be subject to a 7.5% or 5% discount, respectively, if the transaction closes prior tothree months ended March 31, 2024 or December 31, 2024, respectively. In addition, we may be entitled to a supplemental cash payment of $25,600 per day for the period between July 1, 2023 until the closing date, for up to approximately $21 million, reduced by any distributions received from the Trilogy Joint Venture by us during the interim period. AHR may terminate the agreement at any time, subject to payment of a termination fee equal to: (i) if terminated prioras compared to the initial outside date, September 30, 2024, $3.9 million or, if a ��Qualifying IPO” (i.e., an underwritten public offering of AHR’s common stock resulting in at least $200 million of net proceeds) has occurred prior to the termination, $7.8 million, (ii) if extended and terminated priorthree months ended March 31, 2025, $11.7 million2023. For additional information on financial results, refer to “—Results of Operations.”
Direct Operating Investments
The following table presents a summary of average occupancy of our direct operating investments by property manager:
| | | | | | | | | | | | | | | | | | | | | | | | | | |
| | | | Average Quarterly Occupancy |
| Manager | | Units Under Management | | Q1 2024 | | Q1 2023 | | Change |
| Solstice Senior Living | | 3,969 | | | 89.1 | % | | 86.7 | % | | 2.4 | % |
Watermark Retirement Communities(1) | | 723 | | | 86.3 | % | | 88.4 | % | | (2.1) | % |
| Avamere Health Services | | 453 | | | 89.6 | % | | 89.8 | % | | (0.2) | % |
| Integral Senior Living | | 40 | | | 76.4 | % | | 93.7 | % | | (17.3) | % |
| Direct Operating Investments | | 5,185 | | | 88.7 | % | | 87.3 | % | | 1.4 | % |
(1)Average quarterly occupancy excludes properties sold and (iii) if further extended and terminated prior tothe Rochester Sub-Portfolio (as defined in “—Results of Operations”).
September 30, 2025, $15.6 million. Although there can be no assurance that AHR will consummate the purchaseNOI is a supplemental non-GAAP financial measure of our interestsoperating performance. The following table presents the NOI of our direct operating investments (dollars in the Trilogy Joint Venture on these terms, or at all, we believe that this proposed transaction presents an attractive opportunity for us to execute on our disposition strategy, particularly for this minority position in a joint venture.thousands):
| | | | | | | | | | | | | | | | | | | | | | | | | | |
| | Three Months Ended March 31, | | Increase (Decrease) |
| | 2024 | | 2023 | | Amount | | % |
Same store(1) | | | | | | | | |
| Property and other revenues | | | | | | | | |
| Resident fee income | | $ | 12,296 | | | $ | 11,850 | | | $ | 446 | | | 3.8 | % |
| Rental income | | 35,409 | | | 32,038 | | | 3,371 | | | 10.5 | % |
| Other revenue | | 17 | | | — | | | 17 | | | NA |
| Total property and other revenues | | 47,722 | | | 43,888 | | | 3,834 | | | 8.7 | % |
| Property operating expenses | | | | | | | | |
| Salaries and wages | | 15,603 | | | 14,956 | | | 647 | | | 4.3 | % |
| Utilities | | 3,279 | | | 3,029 | | | 250 | | | 8.3 | % |
| Food and beverage | | 2,524 | | | 2,329 | | | 195 | | | 8.4 | % |
| Repairs and maintenance | | 3,505 | | | 2,972 | | | 533 | | | 17.9 | % |
| Property taxes | | 2,356 | | | 2,547 | | | (191) | | | (7.5) | % |
| Property management fee | | 2,431 | | | 2,196 | | | 235 | | | 10.7 | % |
| Marketing | | 1,129 | | | 1,071 | | | 58 | | | 5.4 | % |
| Insurance | | 1,253 | | | 797 | | | 456 | | | 57.2 | % |
| All other expenses | | 1,189 | | | 903 | | | 286 | | | 31.7 | % |
| Total property operating expenses | | 33,269 | | | 30,800 | | | 2,469 | | | 8.0 | % |
| Same store NOI | | $ | 14,453 | | | $ | 13,088 | | | $ | 1,365 | | | 10.4 | % |
| Non-same store NOI | | $ | 38 | | | $ | 684 | | | $ | (646) | | | (94.4) | % |
Total direct operating investments NOI(2) | | $ | 14,491 | | | $ | 13,772 | | | $ | 719 | | | 5.2 | % |
•(1)In October 2023, as a resultSame store excludes revenues and expense of the payment default in July 2023 on seven cross-defaultedproperties sold and cross-collateralized mortgage notes with an aggregate principal amount outstanding of $99.8 million, or the Rochester Sub-Portfolio Loan, secured by seven healthcare real estate properties, or the Rochester Sub-Portfolio the lender filed a complaint seeking the appointment(as defined in “—Results of a receiver and foreclosure on the underlying properties and to enforce its rights in its collateral under the loan documents and, on October 30, 2023, the properties underlying the Rochester Sub-Portfolio Loan were placed into a receivership. The receiver now has effective control of the properties and we are working with the lender and the receiver to facilitate an orderly transition of the operations, and eventually ownership, of the properties. The transition of these properties is expected to have a positive impact on our cash flows and will not have a negative impact on value since the balance of debt is believed to exceed the value of the properties.Operations”).
•(2)In July 2023, we exercisedFor a reconciliation of our optiondirect operating investments segment NOI to extend the maturity datesegment net income (loss) as presented in accordance with U.S. GAAP in our consolidated financial statements as of a mortgage note payable collateralized by a property within the Rochester portfolio from August 2023 to AugustMarch 31, 2024 and made a $0.3 million principal repayment toward2023, refer to “—Non-GAAP Financial Measures.”
During the outstanding principal balance.
•In June 2023, we sold our minority interests inthree months ended March 31, 2024, the Healthcare GA Holdings, General Partnership, which indirectly owned 48 care homes across the United Kingdom, or the Diversified US/UK Portfolio, and the Eclipse Health, General Partnership, which indirectly owned 34 seniors housing facilities, or the Eclipse Portfolio, together with $1.1 million in cash, to our Former Sponsor, who is affiliated with the majority partner of each joint venture, for all of the equity held by the Former Sponsor and its affiliates, including 9,709,553 shares of our common stock, 100 common units in the Operating Partnership and 100 special units in the Operating Partnership, or the Sale of Minority Interests. Upon completion of the Sale of Minority Interests, we retired all of the shares of our common stock acquired. With this Sale of Minority Interests, we were able to strategically exit two minority positions in joint ventures experiencing significant distress, where we had limited ability to control outcomes and a lack of alignment with the majority partner, through a transaction that we believe creates additional valueaverage occupancy for our remaining shareholders.
•In April 2023,direct operating investments improved by 1.4% over the Espresso joint venture completed the sale of 10 properties, the first of two scheduled sale closings for its remaining sub-portfolio, generating net proceeds, of which our proportionate share totaled $17.3 million. The transaction was structured such that the second closing sales price approximates the outstanding debt on the remaining properties and, as such, is not forecastedprior period, to generate net proceeds. The second sale closing is scheduled to close during the fourth quarter of 2023, though there can be no assurance that the transaction will close on this timeframe or at all.
Operating Performance
88.7%. Our occupancy has recovered to pre-pandemic levels, driven by supply-demand fundamentals in the industry overall and specifically by our investment of capital to enhance ourthe facilities which has led to increases in revenues. However, operating costs remained elevated as a result of macroeconomic trends, including increases in labor costs and historically low unemployment, inflation and rising interest rates, as well as increased health and safety measures. Increased labor costs and a shortage of available skilled and unskilled workers has, and may continue to increase the cost of staffing at our facilities. We have offset increased labor and inflation with increased rates charged to residents, but continuing to do so may result in a decline in occupancy and revenues. Increases in interest rates may help ease inflation and our operating costs, but have increased our debt service obligations on our variable rate debt and may create the possibility of slowing economic growth.
The following is a summary of the performance of our investment segments for the three months ended September 30, 2023 as comparedproperties contributed to the three months ended June 30, 2023. For additional information on financial results, refer to “—Results of Operations.”
Direct Investments - Operating
The average quarterlyincrease in occupancy. With the properties approaching stabilized occupancy of our facilities improved 1.4% to 86.5% forlevels, the third quarter of 2023, while the quarterly occupancy for the seniors housing industry averaged 84.4% for the same period. The average industry occupancy remains 2.7% below its pre-pandemic level of 87.1% in the first quarter of 2020 (source: The National Investment Centers for Seniors Housing & Care Map Top 31 Primary Metropolitan Markets).
A summary of average occupancymanagers of our direct operating investments by property manager is as follows:
| | | | | | | | | | | | | | | | | | | | | | | | | | | | | | | | | | | | | | |
| | Average Monthly Occupancy | | Average Quarterly Occupancy |
| Manager | | September 2023 | | June 2023 | | Variance | | Q3 2023 | | Q2 2023 | | Variance |
| Solstice Senior Living | | 89.1 | % | | 87.6 | % | | 1.5 | % | | 88.7 | % | | 87.4 | % | | 1.3 | % |
| Watermark Retirement Communities | | 81.4 | % | | 79.3 | % | | 2.1 | % | | 80.8 | % | | 78.9 | % | | 1.9 | % |
| Avamere Health Services | | 90.8 | % | | 88.1 | % | | 2.7 | % | | 90.3 | % | | 88.7 | % | | 1.6 | % |
| Integral Senior Living | | 83.2 | % | | 86.9 | % | | (3.7) | % | | 85.0 | % | | 84.5 | % | | 0.5 | % |
| Direct Investments - Operating | | 87.0 | % | | 85.2 | % | | 1.8 | % | | 86.5 | % | | 85.1 | % | | 1.4 | % |
The following table is a summaryhave been focused on implementing resident rate increases and generating higher revenues, which outpaced the impact of inflation on variable operating costs over the operating performance at our direct operating investments for the three months ended September 30, 2023 and June 30, 2023 (dollars in thousands):
| | | | | | | | | | | | | | | | | | | | | | | | | | |
| | Three Months Ended | | Increase (Decrease) |
| | September 30, 2023 | | June 30, 2023 | | Amount | | % |
| Property revenues | | | | | | | | |
| Resident fee income | | $ | 11,966 | | | $ | 11,839 | | | $ | 127 | | | 1.1 | % |
| Rental income | | 39,493 | | | 38,227 | | | 1,266 | | | 3.3 | % |
| Total property revenues | | 51,459 | | | 50,066 | | | 1,393 | | | 2.8 | % |
| Property operating expenses | | | | | | | | |
| Salaries and wages | | 16,897 | | | 16,561 | | | 336 | | | 2.0 | % |
| Utilities | | 3,429 | | | 2,694 | | | 735 | | | 27.3 | % |
| Food and beverage | | 2,748 | | | 2,649 | | | 99 | | | 3.7 | % |
| Repairs and maintenance | | 3,700 | | | 3,627 | | | 73 | | | 2.0 | % |
| Property taxes | | 2,848 | | | 2,880 | | | (32) | | | (1.1) | % |
| Property management fee | | 2,989 | | | 2,499 | | | 490 | | | 19.6 | % |
| All other expenses | | 4,279 | | | 4,116 | | | 163 | | | 4.0 | % |
| Total property operating expenses | | 36,890 | | | 35,026 | | | 1,864 | | | 5.3 | % |
| Total property revenues, net of property operating expenses | | $ | 14,569 | | | $ | 15,040 | | | $ | (471) | | | (3.1) | % |
Overall, property revenues, net of propertysame period. While certain operating expenses decreased by $0.5 million for the three months ended September 30, 2023 as comparedremain elevated, in particular, insurance costs, same store NOI continued to trend positively, increasing 10.4% over the prior quarter. Property operating expenses increased by $1.9 million due to higher utility costs, salaries, and additional management fees accrued at our Winterfell portfolio due to exceeding performance targets for the nine months ended September 30, 2023, per the terms of our management agreements. Rental and resident fee income increased by $1.4 million as a result of improved occupancy and increases in market rates for new residents and in-place rates for existing residents across our direct operating investments.
Despite overall improved operating performance at our direct operating investments, certain properties continue to struggle with occupancy, rate growth and controlling expenses. In particular, the Rochester Sub-Portfolio has generated negative cash flow of approximately $3.2 million after capital expenditure and debt service payments remitted during the nine months ended September 30, 2023. We elected to default on our debt service payments on the Rochester Sub-Portfolio Loan in July 2023 because we do not expect the portfolio to generate sufficient cash flow to cover debt service obligations for an extended period of time and ultimately do not believe the portfolio will be able to generate sufficient sales proceeds in order to repay its cross-collateralized debt outstanding at maturity. Refer to “—Transaction and Financing Activities” for further information.period.
Direct Investments - Net Lease Investments
Beginning in February 2021, the operator of the four net lease properties in our Arbors portfolio has been unable to satisfy its obligations under its leases. In accordance with a forbearance and modification agreement entered into in March 2023, or the Forbearance Agreement, the operator remits rent based on the properties’ available cash after satisfying property-level expenses.
DuringDespite occupancy and resident rate improvements realized in Q1 2024, the portfolio’s continued sub-optimal occupancy levels and rising operating expenses resulted in limited cash flow distributed to us in accordance with the operator’s forbearance agreement. We did not recognize rental income from the portfolio for the three months ended September 30,March 31, 2024 and 2023, and we recognized rental income fromutilized cash reserves to cover our related debt service in each period. We continue to monitor the operator’s performance and cash flows closely, as well as evaluate potential options for this portfolio.
The following table presents the cash reserves used to service the debt obligations for our Arbors portfolio, toas well as the extent excess cash flow was received, which totaled $0.8 million as compared to $0.3 million recognized duringaverage resident occupancy of the three months ended June 30, 2023.underlying properties (dollars in thousands):
| | | | | | | | | | | | | | | | | | |
| | Three Months Ended March 31, | | |
| | 2024 | | 2023 | | | | |
| | | | | | | | |
| Cash reserves used to fund debt service payments, including principal amortization | | 1,457 | | 1,394 | | | | |
| Average quarterly occupancy | | 74.4 | % | | 72.3 | % | | | | |
The operator of our net lease properties continues to be impacted by sub-optimal occupancy levels and elevated operating expenses, which has resulted in limited cash flow generated by properties. As a result, during the nine months ended September 30, 2023 we have utilized cash reserves of approximately $2.8 million to fund debt service payments, including principal amortization. Average quarterly occupancy improved 0.8% to 73.8% during the three months ended September 30, 2023 from 73.0% during the three months ended June 30, 2023, but we continue to monitor the portfolio for occupancy and revenue growth and evaluate the potential options for this portfolio.
Unconsolidated Investments
We ownhave made investments in minority, non-controlling interests in joint ventures, which own investments inhealthcare real estate properties. Duringand related assets. As of March 31, 2024, our investment in Trilogy (as defined in “—Our Investments”), is our most significant remaining unconsolidated investment. The following table presents a summary of the three months ended September 30, 2023, weTrilogy joint venture’s financial results (dollars in thousands):
| | | | | | | | | | | | | | | | | | | | | | | | | | | | | | | | | | |
| | Trilogy | | |
| | Three Months Ended March 31, | | Increase (Decrease) | | | | |
| | 2024 | | 2023 | | Amount | | % | | | | | | | | |
| Property and other revenues | | | | | | | | | | | | | | | | |
| Total property and other revenues | | $ | 385,219 | | $ | 354,421 | | $ | 30,798 | | | 8.7 | % | | | | | | | | |
| Expenses | | | | | | | | | | | | | | | | |
| Property operating expenses | | 342,532 | | 321,016 | | 21,516 | | | 6.7 | % | | | | | | | | |
| Interest expense | | 19,609 | | 17,559 | | 2,050 | | | 11.7 | % | | | | | | | | |
| Administrative, transaction & other | | 210 | | 82 | | 128 | | | 156.1 | % | | | | | | | | |
| Depreciation and amortization | | 16,600 | | 17,559 | | (959) | | | (5.5) | % | | | | | | | | |
| | | | | | | | | | | | | | | | |
| Total expenses | | 378,951 | | 356,216 | | 22,735 | | | 6.4 | % | | | | | | | | |
| Other income (loss), net | | (1,205) | | (306) | | (899) | | | 293.8 | % | | | | | | | | |
| Other gains (losses) | | (644) | | 785 | | (1,429) | | | (182.0) | % | | | | | | | | |
| Net income (loss) | | $ | 4,419 | | $ | (1,316) | | $ | 5,735 | | | (435.8) | % | | | | | | | | |
| Our ownership % | | 23.8 | % | | 23.4 | % | | | | | | | | | | | | |
| Equity in earnings (losses) | | $ | 1,052 | | $ | (309) | | $ | 1,361 | | (440.5) | % | | | | | | | | |
Occupancy recovery at Trilogy’s integrated senior health campuses continued through Q1 2024, and coupled with higher resident rates, resulted in revenue growth, which outpaced rising operating costs over the same period. While operating income has improved, higher interest expense from Trilogy’s floating-rate debt and other financing initiatives reduced cash flow and the joint venture did not receive anymake distributions from our unconsolidated investments as compared to $21.8 millionits investors during the three months ended June 30, 2023, which consisted primarily of excess cash flow and sub-portfolio sales proceeds distributed from the Espresso joint venture, of which our proportionate share totaled $2.2 million and $17.3 million, respectively. In addition, we received a quarterly distribution from the Trilogy joint venture, of which our proportionate share totaled $2.3 million during the three months ended June 30, 2023.
The following is a summary of operations and performance for our unconsolidated investments, excluding sold investments, for the three months ended September 30, 2023:
Trilogy
While continuing to improve from pandemic-era lows, the occupancy of the joint venture's facilities remains below historical levels, which has impacted operating revenues. Operating expenses continue to be impacted by inflationary pressures, most significantly labor-related costs, however, the joint venture has recognized COVID-19 provider relief grant income, which has partially offset the elevated expenses. In addition, the joint venture has incurred higher interest expense on its floating rate debt outstanding due to rising market interest rates, which has limited cash available to be distributed.
Espresso
The joint venture received full contractual rent from the net lease operators of its remaining portfolio. The sale of the remaining portfolio is scheduled to close during the fourth quarter of 2023. Refer to “—Transaction and Financing Activities” for additional information.March 31, 2024.
Our Investments
Our investments are categorized as follows:in the following reportable segments:
•Direct Operating Investments - Operating - Properties operated pursuant to management agreements with managers, in which we own a controlling interest.
•Direct Investments - Net Lease Investments - Properties operated under net leases with an operator, in which we own a controlling interest.
•Unconsolidated Investments - Joint ventures, which include properties operated under net leases with an operator or pursuant to management agreements with managers,venture investments, in which we own a minority, non-controlling interest.
OurFor financial information regarding our reportable segments, refer to Note 11, “Segment Reporting” in our accompanying consolidated financial statements included in Part I, Item 1. “Financial Statements.”
The following table presents a summary of investments as of March 31, 2024 (dollars in thousands):
| | | | | | | | | | | | | | | | | | | | | | | | | | | | | | | | | | | | | | | | | | | | | | | | | | | | |
| | | | Properties(1) | | | | |
| Investment Type / Portfolio | | Amount(2) | | ILF | | ALF | | MCF | | | | Integrated Campus | | Total | | Primary Locations | | Ownership
Interest |
| Direct Operating Investments | | | | | | | | | | | | | | | | | | |
| Winterfell | | $ | 748,389 | | | 32 | | — | | — | | | | — | | 32 | | 12 U.S. States | | 100.0% |
| Avamere | | 94,772 | | | — | | 5 | | — | | | | — | | 5 | | Washington/Oregon | | 100.0% |
| Aqua | | 85,124 | | | 2 | | 1 | | 1 | | | | — | | 4 | | Texas/Ohio | | 97.0% |
Rochester(3) | | 46,771 | | | 1 | | 1 | | — | | | | — | | 2 | | New York | | 97.0% |
| Oak Cottage | | 18,730 | | | — | | — | | 1 | | | | — | | 1 | | California | | 100.0% |
| Subtotal | | $ | 993,786 | | | 35 | | 7 | | 2 | | | | — | | 44 | | | | |
| | | | | | | | | | | | | | | | | | |
| Direct Net Lease Investments | | | | | | | | | | | | | | | | | | |
| Arbors | | $ | 98,315 | | | — | | 4 | | — | | | | — | | 4 | | New York | | 100.0% |
| Total Direct Investments | | $ | 1,092,101 | | | 35 | | 11 | | 2 | | | | — | | 48 | | | | |
| | | | | | | | | | | | | | | | | | |
| Unconsolidated Investments | | | | | | | | | | | | | | | | | | |
Trilogy(4) | | $ | 123,391 | | | — | | — | | — | | | | 126 | | 126 | | 4 U.S. States | | 23.8% |
| | | | | | | | | | | | | | | | | | |
| Solstice | | 430 | | | — | | — | | — | | | | — | | — | | | | 20.0% |
| Total Unconsolidated Investments | | $ | 123,821 | | | — | | — | | — | | | | 126 | | 126 | | | | |
| | | | | | | | | | | | | | | | | | |
| Total Investments | | $ | 1,215,922 | | | 35 | | 11 | | 2 | | | | 126 | | 174 | | | | |
(1)Classification based on predominant services provided, but may include other services.
(2)For direct investments, areamount represents gross real estate carrying value, net of impairment, before accumulated depreciation as presented in seniors housing facilities, whichour consolidated financial statements as of March 31, 2024. For unconsolidated investments, amount represents the carrying value of the investments in unconsolidated ventures as presented in our consolidated financial statements as of March 31, 2024. For additional information, refer to “Note 3, Operating Real Estate” and “Note 4, Investments in Unconsolidated Ventures” of Part I, Item 1. “Financial Statements.”
(3)Excludes the Rochester Sub-Portfolio (as defined in “—Results of Operations”).
(4)Property count includes properties owned and leased by the joint venture and excludes its institutional pharmacy and therapy businesses.
Our investments include ILFs, ALFs and MCFs, as described in further detail below. Revenues generated by seniors housing facilities typically come from private pay sources, including private insurance, and to a much lesser extent government reimbursement programs, such as Medicaid.the following types of properties:
•Independent living facilities. ILFs are properties with central dining facilities that provide services that include security, housekeeping, nutrition and limited laundry services. ILFs are designed specifically for independent seniors who are able to live on their own, but desire the security and conveniences of community living. ILFs typically offer several services covered under a regular monthly fee. Fees at these communities are paid from private sources. As of March 31, 2024, we had 35 ILFs in our direct operating investments segment.
•Assisted living facilities. ALFs provide services that include minimal assistance for activities in daily living and permit residents to maintain some of their privacy and independence as they do not require constant supervision and assistance. Services may be bundled within one monthly fee or based on the care needs of the resident and usually include three meals per day in a centraland dining, room, daily housekeeping, laundry, medical reminders and 24-hour availability of assistance with the activities of daily living,assistance. Revenues generated by ALFs primarily come from private pay sources, including private insurance, and government reimbursement programs, such as eating, dressingMedicaid, to a lesser extent. As of March 31, 2024, we had seven properties that are predominantly ALFs in our direct operating investments segment and bathing.four properties that are predominantly ALFs typically are comprised of studios, one and two bedroom suites equipped with private bathrooms and efficiency kitchens.in our direct net lease investments segment.
•Memory care facilities. MCFs offer specialized options for seniors with Alzheimer’s disease and other forms of dementia. These facilities offer dedicated care and specialized programming for various conditions relating to memory loss in a secured environment. Residents require a higher level of care and more assistance with activities of daily living than in ALFs. Therefore, these facilities have staff available 24 hours a day to respond to the unique needs of their residents. Fees at these communities are paid primarily from private sources and, to a lesser extent, government reimbursement, such as Medicaid. As of March 31, 2024, we had two properties that are predominantly MCFs in our direct operating investments segment.
Through our unconsolidated investments, we have additional investments in seniors housing facilities, as well as in additional types
•Integrated Senior Health Campuses. Provide a range of services such asin an integrated campus, including those described above for ILFs, ALFs, MCFs, SNFs, in an integrated campus.
•Skilled Nursing Facilities. as well as SNFs. SNFs provide services that include daily nursing, therapeutic rehabilitation, social services, housekeeping, nutrition and administrative services for individuals requiring certain assistance for activities in daily living. A typical SNF includes mostly one and two bed units, each equipped with a private or shared bathroom and community dining facilities. Revenues generated from SNFs typicallyIntegrated Senior Health Campuses come from government reimbursement programs, including Medicare and Medicaid, as well as private pay sources, including private insurance.
For financial information regarding our reportable segments, refer to Note 11, “Segment Reporting” As of March 31, 2024, we had 126 Integrated Health Campuses in our accompanying consolidated financial statements included in Part I, Item 1. “Financial Statements.”
The following table presents a summary of investments as of September 30, 2023 (dollars in thousands):
| | | | | | | | | | | | | | | | | | | | | | | | | | | | | | | | | | | | | | | | | | | | | | | | | | | | | | | | |
| | | | Properties(1) | | | | |
| Investment Type / Portfolio | | Amount(2) | | ILF | | ALF | | MCF | | SNF | | Integrated Campus | | Total | | Primary Locations | | Ownership
Interest |
| Direct Investments - Operating | | | | | | | | | | | | | | | | | | |
| Winterfell | | $ | 737,058 | | | 32 | | — | | — | | — | | — | | 32 | | 12 U.S. States | | 100.0% |
| Rochester | | 149,204 | | | 7 | | 3 | | — | | — | | — | | 10 | | New York | | 97.0% |
| Avamere | | 94,246 | | | — | | 5 | | — | | — | | — | | 5 | | Washington/Oregon | | 100.0% |
| Aqua | | 83,684 | | | 2 | | 1 | | 1 | | — | | — | | 4 | | Texas/Ohio | | 97.0% |
| Oak Cottage | | 18,695 | | | — | | — | | 1 | | — | | — | | 1 | | California | | 100.0% |
| Subtotal | | $ | 1,082,887 | | | 41 | | 9 | | 2 | | — | | — | | 52 | | | | |
| | | | | | | | | | | | | | | | | | |
Direct Investments -
Net Lease | | | | | | | | | | | | | | | | | | |
| Arbors | | $ | 103,915 | | | — | | 4 | | — | | — | | — | | 4 | | New York | | 100.0% |
| Total Direct Investments | | $ | 1,186,802 | | | 41 | | 13 | | 2 | | — | | — | | 56 | | | | |
| | | | | | | | | | | | | | | | | | |
| Unconsolidated Investments | | | | | | | | | | | | | | | | | | |
Trilogy(3) | | $ | 124,670 | | | — | | — | | — | | — | | 123 | | 123 | | 4 U.S. States | | 23.4% |
| Espresso | | 3,075 | | | — | | — | | | | 23 | | — | | 23 | | Ohio/Michigan | | 36.7% |
Solstice(4) | | 281 | | | — | | — | | — | | — | | — | | — | | | | 20.0% |
| Total Unconsolidated Investments | | $ | 128,026 | | | — | | — | | — | | 23 | | 123 | | 146 | | | | |
| | | | | | | | | | | | | | | | | | |
| Total Investments | | $ | 1,314,828 | | | 41 | | 13 | | 2 | | 23 | | 123 | | 202 | | | | |
(1)Classification based on predominant services provided, but may include other services.
(2)For direct investments, amount represents operating real estate, before accumulated depreciation as presented in our consolidated financial statements as of September 30, 2023. For unconsolidated investments amount represents the carrying value of our investments in unconsolidated ventures as presented in our consolidated financial statements as of September 30, 2023. For additional information, refer to “Note 3, Operating Real Estate”segment.
Operators and “Note 4, Investments in Unconsolidated Ventures” of Part I, Item 1. “Financial Statements.”
(3)Property count includes properties owned and leased by the joint venture and excludes its institutional pharmacy and therapy businesses.
(4)Represents our investment in Solstice Senior Living, LLC, or Solstice, the manager of the Winterfell portfolio. Solstice is a joint venture between affiliates of Integral Senior Living, LLC, or ISL, a management company of ILF, ALF and MCF founded in 2000, which owns 80.0%, and us, who owns 20.0%.
The following presents the properties of our direct and unconsolidated investments by property type and geographic location based on our proportionate share of cost as of September 30, 2023:
| | | | | | | | |
Real Estate Equity by Property Type(1)
| | Real Estate Equity by Geographic Location |
| | |
(1)Classification based on predominant services provided, but may include other services.
The following table presents the operators and managers of our direct investments and our Trilogy unconsolidated investment (dollars in thousands):
| | As of September 30, 2023 | | Nine Months Ended September 30, 2023 |
| | As of March 31, 2024 | | | | As of March 31, 2024 | | Three Months Ended March 31, 2024 |
| Operator / Manager | Operator / Manager | | Properties Under Management | | Units Under Management(1) | | Property and Other Revenues(2) | | % of Total Property and Other Revenues | Operator / Manager | | Properties Under Management | | Units Under Management(1) | | Property and Other Revenues(2) | | % of Total Property and Other Revenues |
| Direct Investments | |
Solstice Senior Living(3) | |
Solstice Senior Living(3) | |
Solstice Senior Living(3) | Solstice Senior Living(3) | | 32 | | | 3,969 | | | $ | 94,469 | | | 61.2 | % | | 32 | | | 3,969 | | 3,969 | | | $ | | $ | 33,695 | | | 69.1 | | 69.1 | % |
Watermark Retirement Communities | Watermark Retirement Communities | | 14 | | | 1,782 | | | 35,967 | | | 23.2 | % | Watermark Retirement Communities | | 6 | | | 723 | | 723 | | | 7,346 | | 7,346 | | | 15.1 | | 15.1 | % |
| Avamere Health Services | Avamere Health Services | | 5 | | | 453 | | | 16,266 | | | 10.5 | % | Avamere Health Services | | 5 | | | 453 | | 453 | | | 5,690 | | 5,690 | | | 11.7 | | 11.7 | % |
| Integral Senior Living | Integral Senior Living | | 1 | | | 40 | | | 3,672 | | | 2.4 | % | Integral Senior Living | | 1 | | | 40 | | 40 | | | 1,141 | | 1,141 | | | 2.3 | | 2.3 | % |
Arcadia Management(4)(5) | Arcadia Management(4)(5) | | 4 | | | 572 | | | 1,178 | | | 0.8 | % | Arcadia Management(4)(5) | | 4 | | | 564 | | 564 | | | — | | — | | | — | | — | % |
Other(5)(6) | Other(5)(6) | | — | | | — | | | 2,893 | | | 1.9 | % | Other(5)(6) | | — | | | — | | — | | | 880 | | 880 | | | 1.8 | | 1.8 | % |
| Total | | 56 | | | 6,816 | | | $ | 154,445 | | | 100.0 | % |
| Total Direct Investments | | Total Direct Investments | | 48 | | | 5,749 | | | $ | 48,752 | | | 100.0 | % |
| Unconsolidated Investments | |
Trilogy Management Services(7) | |
Trilogy Management Services(7) | |
Trilogy Management Services(7) | | | 126 | | | 14,376 | | | $ | 91,682 | | | N/A |
(1)Represents rooms for ALFs, ILFs and MCFs, based on predominant type.MCFs.
(2)Includes rental income received from our net lease properties, as well as rental income, ancillary service fees and other related revenue earned from ILF residents and resident fee income derived from our ALFs and MCFs, which includes resident room and care charges, ancillary fees and other resident service charges.
(3)Solstice is a joint venture of which affiliates of ISLIntegral Senior Living own 80%.
(4)DuringProperty count and units exclude properties sold and the nine months ended September 30, 2023, we recorded rental income to the extent payments were received.Rochester Sub-Portfolio (as defined in “—Results of Operations”).
(5)During the three months ended March 31, 2024, we did not record any rental income from our net lease operator.
(6)Consists primarily of interest income earned on corporate-level cash and cash equivalents.
Direct Operating Investments - Operating
We generate revenues from resident fees and rental income through our operating properties. Resident fee income is recorded by our ALFs and MCFs when services are rendered and includes resident room and care charges and other resident charges, and rental income is generated from our ILFs.
Our operating properties allow us to participate in the risks and rewards of the operations of the facilities as compared to receiving only contractual rent under a net lease. We engage independent managers to operate these facilities pursuant to management agreements, including procuring supplies, hiring and training all employees, entering into all third-party contracts for the benefit of the property, including resident/patient agreements, complying with laws and regulations, including but not limited to healthcare laws, and providing resident care and services, in exchange for a management fee. As a result, we must rely on our managers’ personnel, expertise, technical resources and information systems, risk management processes, proprietary information, good faith and judgment to manage our operating properties efficiently and effectively. We also rely on our managers to set appropriate resident fees, to provide accurate property-level financial results in a timely manner and otherwise
operate our seniors housing facilities in compliance with the terms of our management agreements and all applicable laws and regulations.
As of March 31, 2024, we had 44 senior housing facilities in our direct operating investments segment with four different managers. The following presents the facilities by property type and geographic location as of March 31, 2024:
| | | | | | | | |
Property Type(1) | | Geographic Location |
| | |
(1)Classification based on predominant services provided, but may include other services.
Our management agreements generally provide for monthly management fees which are calculated based on various performance measures, including revenue, net operating income and other objective financial metrics. We are also required to reimburse our managers for expenses incurred in the operation of the properties, as well as to indemnify our managers in connection with potential claims and liabilities arising out of the operation of the properties. Our management agreements are terminable after a stated term with certain renewal rights, though we have the ability to terminate earlier upon certain events with or without the payment of a fee.
Watermark Retirement Communities and Solstice, together with their affiliates, manage substantially all of our operating properties. As of September 30, 2023, Watermark and Solstice or their respective affiliates collectively managed 46 of our seniors housing facilities pursuant to management agreements. For the nine months ended September 30, 2023, properties managed by Watermark and Solstice represented 23.2% and 61.2% of our total property and other revenues, respectively, and 19.6% and 62.1% of our operating real estate, respectively. Through our 20.0% ownership of Solstice, we are entitled to certain rights and minority protections.
The following table presents a summary of the terms of the Watermark and Solsticeour management agreements:
| | | | | | | | | | | | | | | | | | | | | | | | | | |
| Manager | | Portfolio | | Properties | | Expiration Date | | Management Fees |
| Solstice Senior Living | | Winterfell | | 32 | | | October 2025 | | •5% of monthly gross revenues, subject to certain exclusions •7% of actual costs of certain capital projects •Additional fees if net operating income exceeds annual target •Additional fees if net operating income long-term growth is achieved |
Watermark Retirement Communities(1) | | Aqua | | 2 | | | December 20232024 | | •5% of monthly gross revenues, subject to certain exclusions •Eligible for promote in connection with disposition |
| Aqua | | 2 | | | February 2025 | |
| Rochester(2) | | 2 | | August 2024 | |
| Avamere Health Services | | Avamere | | 5 | | January 2025 | | •4% of monthly gross revenues, plus 3% of monthly net operating income subject to certain exclusions •Additional fees based on net operating income exceeds annual target |
| Integral Senior Living | | Oak Cottage | | 1 | | April 2024 | |
| Rochester | | 10 | | | August•Greater of 5% of monthly gross revenues, subject to certain exclusions, or $12,000 per month
2024•Additional fees if net operating income exceeds annual target
| |
| | | | | | | | |
| | | | | | | | |
(1)Affiliates of Watermark also own a 3% non-controlling interest in the Rochester and Aqua portfolios, which may impact various rights and economics under the management agreements.
(2)Property count excludes the properties within the Rochester Sub-Portfolio (as defined in “—Results of Operations”).
Certain of our properties in our direct operating investments segment are held through joint ventures, where an affiliate of the manager owns a 3% non-controlling interest, primarily to create alignment and incentives for the manager to perform. In addition, we own a 20% interest in Solstice Senior Living, the manager of the Winterfell portfolio, which gives us additional rights and minority protections.
Direct Investments - Net Lease
We generate revenues from rental income from net leases to operators through our net lease properties. A net lease will typically provide for fixed rental payments, subject to periodic increases based on certain percentages or the consumer price index, and obligate the operator to pay all property-related expenses, including maintenance, utilities, repairs, taxes, insurance and capital expenditures. Investments
As of September 30, 2023,March 31, 2024, we had four ALF properties located in New York operated by Arcadia Management under net leases. These leases obligate Arcadia to pay a fixed rental amount and pay all property-level expenses, with a lease term that expires in August 2029. However, Arcadia has been unable to satisfy its obligations under its leases since February 2021, and instead remits rent and pays property-level expenses based on its available cash. On March 27, 2023, we entered into the Forbearance Agreement,a forbearance agreement with Arcadia, pursuant to which we are entitled to receive all cash flow in excess of permitted expenses, and are required to fund any operating deficits, through 2025, subject to the terms and conditions thereof. As a result, we participate in the risks and rewards of this portfolio similar to our operating properties. We also agreed to make available funds for capital improvements in order to stabilize and drive improved performance in this portfolio. If Arcadia performs under the Forbearance Agreement,forbearance agreement, it will be entitled to forgiveness of accrued and unpaid rent during the forbearance period and a potential incentive fee tied to disposition of the portfolio above a certain value.
We continue to monitor Arcadia’s performance and cash flows closely, as well as evaluate potential options for this portfolio.Unconsolidated Investments
For investments accounted for under the equity method, we report our proportionate interest of revenues and expenses from our unconsolidated joint ventures through equity in earnings (losses) of unconsolidated ventures on our consolidated statements of operations. For investments accounted for under the fair value option method, we will record any changes to its investment’s fair value in gain (loss) on investments and other in the consolidated statements of operations. As of September 30, 2023,March 31, 2024, our unconsolidated investment portfolios are as follows:
•segment primarily consists of our 23.8% interest in Trilogy. Portfolio of Investors, LLC, or Trilogy. Trilogy indirectly owns 126 Integrated Senior Health Campuses located in the Midwest, and operatedwhich are all operating properties managed pursuant to a management agreementsagreement with Trilogy Health Services. The portfolio includesManagement Services, as well as ancillary services businesses, including a therapy business and a pharmacy business. Affiliates of American Healthcare REIT, Inc., or AHR, andown approximately 75.4% of Trilogy, with management of Trilogy ownowning the remaining 76.6%0.8%.
Our joint venture agreement with AHR, through which we hold our interest in Trilogy, provides that AHR is generally responsible for the day-to-day affairs of this portfolio.
•Espresso. the joint venture, subject to certain limitations and exceptions, including our right to consent to certain significant decisions. The joint venture isagreement also contains provisions relating to rights and obligations to call capital to fund the joint venture, distributions of available cash flow, customary forced sale and other liquidity rights.
In November 2023, we entered into an agreement giving AHR the right to purchase our ownership interests in Trilogy at any time prior to September 30, 2025, assuming AHR exercises all of its extension options and subject to satisfaction of certain closing conditions, for a purchase price ranging from $240.5 million to up to $260 million depending upon the purchase price consideration, timing of the closing and certain additional fees that AHR may pay us in the processinterim. A minimum of completing the second and final sale of its remaining net lease portfolio consisting of 23 SNFs located in Ohio and Michigan. An affiliate of Formation acts as the general partner and manager of this investment. Formation and Safanad Management Limited own the remaining 63.3% of this portfolio.
•Solstice. Operator platform joint venture established to manage the operations10% of the Winterfell portfolio. An affiliate of ISL ownspurchase price consideration must be paid in cash, with the remaining 80.0%.
Inbalance payable in either cash or new Series A Cumulative Convertible Preferred Stock to be issued by AHR in connection with the Saleclosing. The portion of Minority Interests, we sold our minority, non-controlling intereststhe purchase price consideration paid in cash may be subject to a 5% discount if the Diversified US/UK portfolio and Eclipse portfolios. Refertransaction closes prior to “—Transaction and Financing Activities” for additional information.
Portfolio Management
The portfolio management process for our investments includes oversight by our executive and asset management teams, regular management meetings and an operating results review process. These processes are designed to evaluate and proactively identify asset-specific issues and trends on a portfolio-wide, sub-portfolio or asset type basis. The teams work in conjunction with our managers and operators to create tailored action plans to address issues identified.
Our executive and asset management teams are experienced and use many methods to actively manage our investments to enhance or preserve our income, value and capital and mitigate risk. Our teams seek to identify opportunities for our investments that may involve replacing or renovating facilities in our portfolio which, in turn, would allow us to improve occupancy and resident rates and enhance the overall value of our assets. To manage risk, our teams engage in frequent review and dialogue with operators/managers/third party advisors and periodic inspections of our owned properties.December 31, 2024. In addition, our teams considerwe may be entitled to a supplemental cash payment of $25,600 per day for the impactperiod between July 1, 2023 until the closing date, for up to approximately $21 million, reduced by any distributions received from Trilogy by us during the interim period. AHR may terminate the agreement at any time, subject to payment of regulatory changes ona termination fee equal to: (i) if terminated prior to the performance of our portfolio.
Our teams will continueinitial outside date, September 30, 2024, $7.8 million, (ii) if extended and terminated prior March 31, 2025, $11.7 million and (iii) if further extended and terminated prior to monitorSeptember 30, 2025, $15.6 million. As a condition to exercising any extension option, AHR must advance any termination fees that have accrued prior to such exercise to the performance of, and actively manage, all of our investments. However,Company. Although there can be no assurance that AHR will consummate the purchase of our investments will continueinterests in Trilogy on these terms, or at all, we believe that this proposed transaction presents an attractive opportunity for us to performexit our position in accordancethis portfolio in furtherance of our disposition strategy.
In addition to our investment in Trilogy, as discussed above, we also have a 20.0% minority interest in Solstice Senior Living, LLC, or Solstice, a management platform formed with Integral Senior Living, or ISL, exclusively to manage our expectations.Winterfell portfolio.
Critical Accounting Policies and Estimates
Our consolidated financial statements are prepared in accordance with accounting principles generally accepted in the United States, or U.S. GAAP, which requires the use of estimates and assumptions that involve the exercise of judgment and that affect the reported amounts of assets and liabilities at the date of the consolidated financial statements and the reported amounts of revenues and expenses during the reporting period.
Certain accounting policies are considered to be critical accounting policies. Critical accounting policies are those that are most important to the portrayal of our financial condition and results of operations and require management’s subjective and complex judgments, and for which the impact of changes in estimates and assumptions could have a material effect on our financial statements. We believe that all of the decisions and assessments upon which our financial statements are based were reasonable at the time made, based upon information available to us at that time.
For a summary of our accounting policies, refer to Note 2, “Summary of Significant Accounting Policies” in our accompanying consolidated financial statements included in Part I, Item 1. “Financial Statements.”
,Impairment
We believe impairment to be a critical accounting estimate based on the nature of our operations and/or requirebecause it requires significant management judgment and assumptions. Our investments are reviewed on a quarterly basis, or more frequently as necessary, to assess whether there are any indicators that the value of our investments may be impaired or that carrying value may not be recoverable. In conducting these reviews, we consider macroeconomic factors, including healthcare sector conditions, together with asset and market specific circumstances, among other factors. To the extent an impairment has occurred, the loss will be measured as compared to the carrying amount of the investment. Fair values can be estimated based upon the income capitalization approach, using net operating income for each property and applying indicative capitalization and discount rates or
sales comparison approach, using what other purchasers and sellers in the market have agreed to as price for comparable properties.
Impairment
At this time, it is difficult to assessDirect Operating Investments and estimate the lasting effects of the COVID-19 pandemic, inflation, rising interest rates, risk of recession and other economic conditions. As the future impact will depend on many factors beyond our control and knowledge, the resulting effect on impairment of our operating real estate and investments in unconsolidated ventures may materially differ from our current expectations and further impairment charges may be recorded in the future.
Direct OperatingNet Lease Investments
During the ninethree months ended September 30, 2023,March 31, 2024, we recorded impairment losses on our operating real estate totaling $38.7$0.5 million including impairment lossesto reflect the market value of $38.6 million for five facilities within the Rochester portfolio as a result of shortened hold period assumptions due to the facilities defaulting on their loan payments in July 2023. On October 30, 2023, the properties underlying the Rochester Sub-Portfolio Loan were placed into a receivership. The receiver now has effective control of the properties and we are working with the lender and the receiver to facilitate an orderly transition of the operations, and eventually ownership, of the properties. Refer to “—Transaction and Financing Activities” for additional discussion. Additionally, we recorded impairment losses totaling $0.1 million for a land parcel within the Rochester Portfolioportfolio designated as a result of lower estimated market value.held for sale and for property damage sustained by facilities in our Winterfell and Aqua portfolios.
Accumulated impairment losses totaled $220.2$163.3 million for operating real estate that we continue to hold as of September 30, 2023.March 31, 2024. Refer to our Annual Report on Form 10-K for the fiscal year ended December 31, 20222023 and 20212022 for additional information regarding impairment recorded in prior years.
Unconsolidated Investments
During the ninethree months ended September 30, 2023,March 31, 2024, we recorded an impairment on our investment in the Espresso joint venture totaling $4.7 million, which reduced the carrying valuedid not impair any of our investment to $3.1 million. Our assessment forinvestments in unconsolidated ventures, nor did the recoverability of our investment took into consideration the joint venture’s remaining assets and estimated future cash distributions, less transaction and wind down costs. Upon impairing our investment, we elected the fair value option method to account for our investment in the Espresso joint venture on June 30, 2023.
Theunderlying joint ventures underlying our unconsolidated ventures assess and record impairment andany impairments or reserves on properties in their respective real estate portfolios, goodwill, and other assets, and we recognize our proportionate share through equity in earnings (losses). In May 2023, prior to the Saleportfolios.
Results of Minority Interests, the underlying Diversified US/UK joint venture recorded impairment losses on its UK Portfolio, due to, among other things, an extended period contemplated for the UK Portfolio to reach stabilization. Our proportionate shareOperations
Comparison of the impairment losses recorded by the Diversified US/UK joint venture totaled $11.4 million.Three Months Ended March 31, 2024 to March 31, 2023 (dollars in thousands):
| | | | | | | | | | | | | | | | | | | | | | | | | | |
| | Three Months Ended March 31, | | Increase (Decrease) |
| | 2024 | | 2023 | | Amount | | % |
| Property and other revenues | | | | | | | | |
| Resident fee income | | $ | 12,296 | | | $ | 11,850 | | | $ | 446 | | | 3.8 | % |
| Rental income | | 35,559 | | | 36,999 | | | (1,440) | | | (3.9) | % |
| Other revenue | | 897 | | | 719 | | | 178 | | | 24.8 | % |
| Total property and other revenues | | 48,752 | | | 49,568 | | | (816) | | | (1.6) | % |
| | | | | | | | |
| | | | | | | | |
| Expenses | | | | | | | | |
| Property operating expenses | | 33,381 | | | 35,077 | | | (1,696) | | | (4.8) | % |
| Interest expense | | 12,862 | | | 11,359 | | | 1,503 | | | 13.2 | % |
| Transaction costs | | 16 | | | 97 | | | (81) | | | (83.5) | % |
| General and administrative expenses | | 3,327 | | | 3,910 | | | (583) | | | (14.9) | % |
| Depreciation and amortization | | 8,901 | | | 9,649 | | | (748) | | | (7.8) | % |
| Impairment loss | | 456 | | | — | | | 456 | | | NA |
| Total expenses | | 58,943 | | | 60,092 | | | (1,149) | | | (1.9) | % |
| Other income, net | | 1,000 | | | 132 | | | 868 | | | 657.6 | % |
| Gain (loss) on investments and other | | 150 | | | 332 | | | (182) | | | (54.8) | % |
| Equity in earnings (losses) of unconsolidated ventures | | 1,014 | | | (3,922) | | | 4,936 | | | (125.9) | % |
| Income tax expense | | (20) | | | (15) | | | (5) | | | 33.3 | % |
| Net income (loss) | | $ | (8,047) | | | $ | (13,997) | | | $ | 5,950 | | | (42.5) | % |
Results of OperationsRochester Sub-Portfolio
ComparisonIn October 2023, as a result of the Three Months Ended Septemberpayment default in July 2023 on seven individual mortgage notes payable, or the Rochester Sub-Portfolio Loan, Fannie Mae, as the lender, filed a complaint seeking the appointment of a receiver and foreclosure on the seven underlying healthcare real estate properties, or the Rochester Sub-Portfolio, and to enforce its rights in its collateral under the loan documents. On October 30, 2023, the properties underlying the Rochester Sub-Portfolio Loan were placed into a receivership. Although we continue to Septemberhave legal ownership of the Rochester Sub-Portfolio until transferred to Fannie Mae or its designee, the receiver now has effective control of the properties and, as of the date of the receivership order, we discontinued recognizing revenues and expenses related to the Rochester Sub-Portfolio and derecognized the properties and related assets from our financial statements. However, until legal ownership of the Rochester Sub-Portfolio is transferred and the associated debt extinguished, we continue to recognize liabilities associated with the Rochester Sub-Portfolio Loan. As of March 31, 2024, we continue to own all of the properties in the Rochester Sub-Portfolio.
We discontinued recognizing property revenues and expenses for the Rochester Sub-Portfolio as of October 30, 2022 (dollars in thousands):2023, the date of the receivership order. As a result, we did not recognize property revenues and expenses for the Rochester Sub-Portfolio during the three months ended March 31, 2024 as compared to a full three months of activity presented for the three months ended March 31, 2023.
| | | | | | | | | | | | | | | | | | | | | | | | | | |
| | Three Months Ended September 30, | | Increase (Decrease) |
| | 2023 | | 2022 | | Amount | | % |
| Property and other revenues | | | | | | | | |
| Resident fee income | | $ | 11,966 | | | $ | 11,274 | | | $ | 692 | | | 6.1 | % |
| Rental income | | 40,330 | | | 36,165 | | | 4,165 | | | 11.5 | % |
| Other revenue | | 1,078 | | | 300 | | | 778 | | | 259.3 | % |
| Total property and other revenues | | 53,374 | | | 47,739 | | | 5,635 | | | 11.8 | % |
| | | | | | | | |
| | | | | | | | |
| Expenses | | | | | | | | |
| Property operating expenses | | 36,890 | | | 35,134 | | | 1,756 | | | 5.0 | % |
| Interest expense | | 14,250 | | | 11,014 | | | 3,236 | | | 29.4 | % |
| Transaction costs | | 358 | | | 857 | | | (499) | | | (58.2) | % |
| Asset management fees - related party | | — | | | 2,428 | | | (2,428) | | | (100.0) | % |
| General and administrative expenses | | 2,921 | | | 2,859 | | | 62 | | | 2.2 | % |
| Depreciation and amortization | | 9,848 | | | 9,642 | | | 206 | | | 2.1 | % |
| Impairment loss | | — | | | 18,500 | | | (18,500) | | | (100.0) | % |
| Total expenses | | 64,267 | | | 80,434 | | | (16,167) | | | (20.1) | % |
| | | | | | | | |
| Gain (loss) on investments and other | | (347) | | | 325 | | | (672) | | | (206.8) | % |
| Equity in earnings (losses) of unconsolidated ventures | | (127) | | | 2,872 | | | (2,999) | | | (104.4) | % |
| Income tax expense | | (17) | | | (15) | | | (2) | | | 13.3 | % |
| Net income (loss) | | $ | (11,384) | | | $ | (29,513) | | | $ | 18,129 | | | (61.4) | % |
Total Property and Other Revenues
The following table presents total property and other revenues generated by our direct investments (dollars in thousands):
| | Three Months Ended September 30, | | Increase (Decrease) |
| | 2023 | | 2022 | | Amount | | % |
| | Three Months Ended March 31, | | | | Three Months Ended March 31, | | Increase (Decrease) |
| | 2024 | | | | 2024 | | 2023 | | Amount | | % |
| ILF properties | | ILF properties | | $ | 35,409 | | | $ | 32,038 | | | $ | 3,371 | | | 10.5 | % |
| ALF/MCF properties | ALF/MCF properties | | $ | 11,966 | | | $ | 11,274 | | | $ | 692 | | | 6.1 | % | ALF/MCF properties | | 12,296 | | | 11,850 | | 11,850 | | | 446 | | 446 | | | 3.8 | | 3.8 | % |
| ILF properties | | 34,644 | | | 30,855 | | | 3,789 | | | 12.3 | % |
| Net lease properties | Net lease properties | | 837 | | | 724 | | | 113 | | | 15.6 | % | Net lease properties | | — | | | — | | — | | | — | | — | | | — | | — | % |
| Rochester Sub-Portfolio (in loan default) | | 4,849 | | | 4,586 | | | 263 | | | 5.7 | % |
| Same store subtotal | | Same store subtotal | | 47,705 | | | 43,888 | | | 3,817 | | | 8.7 | % |
| Rochester Sub-Portfolio | | Rochester Sub-Portfolio | | — | | | 4,548 | | | (4,548) | | | (100.0) | % |
| Properties sold | | Properties sold | | 150 | | | 413 | | | (263) | | | (63.7) | % |
| Other revenue | Other revenue | | 1,078 | | | 300 | | | 778 | | | 259.3 | % | Other revenue | | 897 | | | 719 | | 719 | | | 178 | | 178 | | | 24.8 | | 24.8 | % |
| Total property and other revenues | Total property and other revenues | | $ | 53,374 | | | $ | 47,739 | | | $ | 5,635 | | | 11.8 | % | Total property and other revenues | | $ | 48,752 | | | $ | | $ | 49,568 | | | $ | | $ | (816) | | | (1.6) | | (1.6) | % |
Overall, on a same store basis, total property and other revenues increased $5.6 million during the three months ended September 30, 2023. March 31, 2024. Revenues generated by our operating properties increased as a result of improved occupancy and higher market rates for new residents and in-place rates for existing residents. Other revenue consists of interest earned on cash and cash equivalents, which increased during the three months ended September 30, 2023 March 31, 2024 as a result of higher market interest rates.
Property Operating Expenses
The following table presents property operating expenses incurred by our direct investments (dollars in thousands):
| | Three Months Ended September 30, | | Increase (Decrease) |
| | 2023 | | 2022 | | Amount | | % |
| | Three Months Ended March 31, | | | | Three Months Ended March 31, | | Increase (Decrease) |
| | 2024 | | | | 2024 | | 2023 | | Amount | | % |
| ILF properties | | ILF properties | | $ | 23,909 | | | $ | 22,115 | | | $ | 1,794 | | | 8.1 | % |
| ALF/MCF properties | ALF/MCF properties | | $ | 9,387 | | | $ | 9,069 | | | $ | 318 | | | 3.5 | % | ALF/MCF properties | | 9,360 | | | 8,685 | | 8,685 | | | 675 | | 675 | | | 7.8 | | 7.8 | % |
| ILF properties | | 23,504 | | | 21,790 | | | 1,714 | | | 7.9 | % |
| | Rochester Sub-Portfolio (in loan default) | | 3,999 | | | 4,275 | | | (276) | | | (6.5) | % |
| Net lease properties | | Net lease properties | | — | | | — | | | — | | | NA |
| Same store subtotal | | Same store subtotal | | 33,269 | | | 30,800 | | | 2,469 | | | 8.0 | % |
| Rochester Sub-Portfolio | | Rochester Sub-Portfolio | | — | | | 4,116 | | | (4,116) | | | (100.0) | % |
| Properties sold | | Properties sold | | 112 | | | 161 | | | (49) | | | (30.4) | % |
| Total property operating expenses | Total property operating expenses | | $ | 36,890 | | | $ | 35,134 | | | $ | 1,756 | | | 5.0 | % | Total property operating expenses | | $ | 33,381 | | | $ | | $ | 35,077 | | | $ | | $ | (1,696) | | | (4.8) | | (4.8) | % |
Overall, on a same store basis, total operating expenses increased $1.8 million, primarily due to an increase in management fees at our Winterfell portfolio as a result of revenue growth and additional fees for exceeding performance targets per the terms of the management agreements. In addition, inflationary pressures significantly impactedimpacting all variable operating costs, most notably wages and benefits costs, insurance and utilities. In addition, repairs and maintenance costs increased due to additional repairs required as the result of property damage sustained by facilities in our Winterfell and insurance costs.Aqua portfolios.
Interest Expense
The following table presents interest expense incurred on our borrowings (dollars in thousands):
| | Three Months Ended September 30, | | Increase (Decrease) |
| | 2023 | | 2022 | | Amount | | % |
| | Three Months Ended March 31, | | | | Three Months Ended March 31, | | Increase (Decrease) |
| | 2024 | | | | 2024 | | 2023 | | Amount | | % |
| ILF properties | | ILF properties | | $ | 7,162 | | | $ | 7,214 | | | $ | (52) | | | (0.7) | % |
| ALF/MCF properties | ALF/MCF properties | | $ | 1,315 | | | $ | 1,310 | | | $ | 5 | | | 0.4 | % | ALF/MCF properties | | 1,563 | | | 1,305 | | 1,305 | | | 258 | | 258 | | | 19.8 | | 19.8 | % |
| ILF properties | | 7,482 | | | 7,583 | | | (101) | | | (1.3) | % |
| Net lease properties | Net lease properties | | 883 | | | 907 | | | (24) | | | (2.6) | % | Net lease properties | | 862 | | | 876 | | 876 | | | (14) | | (14) | | | (1.6) | | (1.6) | % |
| Rochester Sub-Portfolio (in loan default) | | 4,570 | | | 1,214 | | | 3,356 | | | 276.4 | % |
| | Same store subtotal | | Same store subtotal | | 9,587 | | | 9,395 | | | 192 | | | 2.0 | % |
| Rochester Sub-Portfolio | | Rochester Sub-Portfolio | | 3,095 | | | 1,759 | | | 1,336 | | | 76.0 | % |
| Properties sold | | Properties sold | | $ | 180 | | | 205 | | | (25) | | | (12.2) | % |
| Total interest expense | Total interest expense | | $ | 14,250 | | | $ | 11,014 | | | $ | 3,236 | | | 29.4 | % | Total interest expense | | $ | 12,862 | | | $ | | $ | 11,359 | | | $ | | $ | 1,503 | | | 13.2 | | 13.2 | % |
InterestOn a same store basis, interest expense increased $3.2 millionduring the three months ended March 31, 2024. Interest expense on our fixed-rate debt declined as a result of higher interesta decrease in the average mortgage notes principal balances as compared to March 31, 2023 due to continued principal amortization. Interest expense on our floating ratefloating-rate debt and default interest and prepayment penalties accruedincreased primarily due to a mortgage payable secured by properties within Aqua portfolio converting to a floating-rate loan in February 2024.
Interest expense for the Rochester Sub-Portfolio Loan increased as a result of its floating interest rate and the recognition of default and acceleration in July 2023. We do not anticipate remitting payment for debt service obligations due underinterest, which will continue to accrue until the Rochester Sub-Portfolio Loan.loan is extinguished.
Transaction Costs
Transaction costs forFor the three months ended September 30, 2023 March 31, 2024, transaction costs consisted primarily of legallegal and professional fees incurred for investment activity. Transactioncorporate strategic initiatives. Prior period transaction costs forconsisted of costs incurred in connection with the Internalization and the transition of services and systems previously provided by the Former Advisor.
General and Administrative Expenses
Corporate cost savings of $0.6 million were realized during the three months ended September 30, 2022 consisted of legal and professional fees incurred to complete the Internalization.
Asset Management Fees - Related Party & General and Administrative Expenses
The advisory agreement with our Former Advisor was terminated on October 21, 2022. As a result, no asset management fees were incurred during 2023 as compared to $2.4 million incurred during the three months ended September 30, 2022.
Under our new internalized structure, we directly incur and pay all general and administrative expenses, including personnel costs related to our executive officers, which were not allocable under the former advisory agreement. General and administrative expenses were comparable for the three months endedSeptember 30, 2023 and 2022.
Combining asset management fees and general and administrative expenses, $2.4 million of cost savings were realized under the internalized structure during the three months ended September 30, 2023March 31, 2024, as compared to the three months endedSeptember 30, 2022.March 31, 2023 primarily due to a reduction in corporate insurance premiums.
Depreciation and Amortization
The following table presents depreciation and amortization recognized on our direct investments (dollars in thousands):
| | Three Months Ended September 30, | | Increase (Decrease) |
| | 2023 | | 2022 | | Amount | | % |
| | Three Months Ended March 31, | | | | Three Months Ended March 31, | | Increase (Decrease) |
| | 2024 | | | | 2024 | | 2023 | | Amount | | % |
| ILF properties | | ILF properties | | $ | 6,604 | | | $ | 5,865 | | | $ | 739 | | | 12.6 | % |
| ALF/MCF properties | ALF/MCF properties | | $ | 1,652 | | | $ | 1,581 | | | $ | 71 | | | 4.5 | % | ALF/MCF properties | | 1,613 | | | 1,658 | | 1,658 | | | (45) | | (45) | | | (2.7) | | (2.7) | % |
| ILF properties | | 6,439 | | | 5,900 | | | 539 | | | 9.1 | % |
| Net lease properties | Net lease properties | | 729 | | | 870 | | | (141) | | | (16.2) | % | Net lease properties | | 684 | | | 729 | | 729 | | | (45) | | (45) | | | (6.2) | | (6.2) | % |
| Rochester Sub-Portfolio (in loan default) | | 1,028 | | | 1,291 | | | (263) | | | (20.4) | % |
| Same store subtotal | | Same store subtotal | | 8,901 | | | 8,252 | | | 649 | | | 7.9 | % |
| Rochester Sub-Portfolio | | Rochester Sub-Portfolio | | — | | | 1,302 | | | (1,302) | | | (100.0) | % |
| Properties sold | | Properties sold | | — | | | 95 | | | (95) | | | (100.0) | % |
| Total depreciation and amortization | Total depreciation and amortization | | $ | 9,848 | | | $ | 9,642 | | | $ | 206 | | | 2.1 | % | Total depreciation and amortization | | $ | 8,901 | | | $ | | $ | 9,649 | | | $ | | $ | (748) | | | (7.8) | | (7.8) | % |
DepreciationOverall, on a same store basis, depreciation and amortization expense increased $0.2 millionduring the three months ended March 31, 2024 primarily as a result of additional capital expenditures, primarilyimprovements completed at the facilities within our Winterfell portfolio.
Depreciation and amortization expense decreased at our Winterfell portfolio. The increase was partially offset by lower depreciation for our Rochester Sub-Portfolio due tonet lease properties as a result of impairments recognized during the three monthsyear ended June 30,December 31, 2023, which reduced building depreciation expense for the three months ended September 30, 2023.March 31, 2024.
Impairment Loss
DuringFor the three months ended September 30, 2023, we did not record any impairment losses on our investments. During the three months ended September 30, 2022,March 31, 2024, impairment losses on operating real estate totaled $18.5 million$0.5 million. Refer to “—Impairment” for facilities within our Arbors net lease portfolio.additional discussion.
Other Income, Net
For the three months ended March 31, 2024, other income, net consisted of a consent fee received and recognized from the majority partner of the Trilogy joint venture. For the three months ended March 31, 2023, other income, net consisted primarily of capital expenditure reimbursements from the state of Oregon’s Long-Term Care Capital Improvement and Emergency Preparedness Program received and recognized by facilities within our Avamere portfolio.
Gain (Loss) on Investments and Other
During the three months ended September 30, 2023,March 31, 2024, we recordedrecognized a gain on an insurance settlement within our Winterfell portfolio. The gain was partially offset by net losses on the change in value of our mortgage note payable interest rate caps totaling $0.3 million as compared to losses totaling $0.3 million recognized duringcaps. During the three months ended September 30, 2022.March 31, 2023, we recognized a gain on the sale of other assets and operating real estate, partially offset by net losses on mortgage interest rate caps.
Equity in Earnings (Losses) of Unconsolidated Ventures
The following table presents the results of our unconsolidated ventures (dollars in thousands):
| | Three Months Ended September 30, | |
| 2023 | | 2022 | | 2023 | | 2022 | | 2023 | | 2022 | |
| | Three Months Ended March 31, | |
| | 2024 | |
| | 2024 | |
| | 2024 | |
| Portfolio | |
| Portfolio | |
| Portfolio | Portfolio | | Equity in Earnings (Losses) | | FFO and MFFO adjustments(1) | | Equity in Earnings, after FFO and MFFO adjustments | | Increase (Decrease) | | Equity in Earnings (Losses) | | FFO and MFFO adjustments(1) | | MFFO | | Increase (Decrease) |
| Trilogy | Trilogy | | $ | (146) | | | $ | 6,052 | | | $ | 4,460 | | | $ | (753) | | | $ | 4,314 | | | $ | 5,299 | | | $ | (985) | | | (18.6) | % | Trilogy | | $ | 1,052 | | | $ | | $ | (309) | | | $ | | $ | 4,522 | | | $ | | $ | 4,337 | | | $ | | $ | 5,574 | | | $ | | $ | 4,028 | | | $ | | $ | 1,546 | | | 38.4 | | 38.4 | % |
| Espresso | | — | | | (242) | | | — | | | 1,617 | | | — | | | 1,375 | | | (1,375) | | | (100.0) | % |
| Solstice | Solstice | | 19 | | | 17 | | | — | | | — | | | 19 | | | 17 | | | 2 | | | 11.8 | % | Solstice | | (38) | | | (29) | | (29) | | | — | | — | | | — | | — | | | (38) | | (38) | | | (29) | | (29) | | | (9) | | (9) | | | 31.0 | | 31.0 | % |
| Subtotal | Subtotal | | (127) | | | 5,827 | | | 4,460 | | | 864 | | | 4,333 | | | 6,691 | | | (2,358) | | | (35.2) | % | Subtotal | | 1,014 | | | (338) | | (338) | | | 4,522 | | 4,522 | | | 4,337 | | 4,337 | | | 5,536 | | 5,536 | | | 3,999 | | 3,999 | | | 1,537 | | 1,537 | | | 38.4 | | 38.4 | % |
| Espresso | | Espresso | | — | | | 109 | | | — | | | 535 | | | — | | | 644 | | | (644) | | | (100.0) | % |
| Investments sold | Investments sold | | — | | | (2,955) | | | — | | | 3,434 | | | — | | | 479 | | | (479) | | | (100.0) | % | Investments sold | | — | | | (3,693) | | (3,693) | | | — | | — | | | 2,393 | | 2,393 | | | — | | — | | | (1,300) | | (1,300) | | | 1,300 | | 1,300 | | | (100.0) | | (100.0) | % |
| | Total | Total | | $ | (127) | | | $ | 2,872 | | | $ | 4,460 | | | $ | 4,298 | | | $ | 4,333 | | | $ | 7,170 | | | $ | (2,837) | | | (39.6) | % |
| | Total | |
| | Total | | | $ | 1,014 | | | $ | (3,922) | | | $ | 4,522 | | | $ | 7,265 | | | $ | 5,536 | | | $ | 3,343 | | | $ | 2,193 | | | 65.6 | % |
(1)Represents our proportionate share of revenues and expenses excluded from the calculation of FFO and MFFO for unconsolidated investments. Refer to “—Non-GAAP Financial Measures” for additional discussion.
Excluding the investments in unconsolidated ventures sold equity in earnings decreased by $6.0 millionprimarily due to the Trilogy joint venture recognizing a gain upon acquiring the remaining ownership interest of an investment portfolio during the three months ended September 30, 2022.
Excluding the investments in unconsolidated ventures sold, equity in earnings, after FFO and MFFO adjustments, decreased $2.4 million. The Espresso joint venture has sold properties, which has resulted in lower rental income recognized and as of June 30, 2023, we elected to account for the Espresso joint venture, under the fair value option, resulting in no equity in earnings recorded during the three months ended September 30, 2023. In addition, higher interest expense on floating rate debt in the Trilogy joint venture has offset operational improvements in the joint venture, resulting in lower cash flows generated.
Comparison of the Nine Months Ended September 30, 2023 to September 30, 2022 (dollars in thousands):
| | | | | | | | | | | | | | | | | | | | | | | | | | |
| | Nine Months Ended September 30, | | Increase (Decrease) |
| | 2023 | | 2022 | | Amount | | % |
| Property and other revenues | | | | | | | | |
| Resident fee income | | $ | 35,655 | | | $ | 32,987 | | | $ | 2,668 | | | 8.1 | % |
| Rental income | | 115,897 | | | 103,001 | | | 12,896 | | | 12.5 | % |
| Other revenue | | 2,893 | | | 457 | | | 2,436 | | | 533.0 | % |
| Total property and other revenues | | 154,445 | | | 136,445 | | | 18,000 | | | 13.2 | % |
| | | | | | | | |
| | | | | | | | |
| Expenses | | | | | | | | |
| Property operating expenses | | 106,993 | | | 101,258 | | | 5,735 | | | 5.7 | % |
| Interest expense | | 37,143 | | | 31,877 | | | 5,266 | | | 16.5 | % |
| Transaction costs | | 455 | | | 857 | | | (402) | | | (46.9) | % |
| Asset management fees - related party | | — | | | 7,532 | | | (7,532) | | | (100.0) | % |
| General and administrative expenses | | 10,424 | | | 10,300 | | | 124 | | | 1.2 | % |
| Depreciation and amortization | | 29,305 | | | 29,105 | | | 200 | | | 0.7 | % |
| Impairment loss | | 43,422 | | | 31,502 | | | 11,920 | | | 37.8 | % |
| Total expenses | | 227,742 | | | 212,431 | | | 15,311 | | | 7.2 | % |
| Other income, net | | 202 | | | 77 | | | 125 | | | 162.3 | % |
| Gain (loss) on investments and other | | (4,662) | | | 660 | | | (5,322) | | | (806.4) | % |
| Equity in earnings (losses) of unconsolidated ventures | | (6,595) | | | 39,427 | | | (46,022) | | | (116.7) | % |
| Income tax expense | | (43) | | | (45) | | | 2 | | | (4.4) | % |
| Net income (loss) | | $ | (84,395) | | | $ | (35,867) | | | $ | (48,528) | | | 135.3 | % |
Total Property(losses) and Other Revenues
The following table presents total property and other revenues (dollars in thousands):
| | | | | | | | | | | | | | | | | | | | | | | | | | |
| | Nine Months Ended September 30, | | Increase (Decrease) |
| | 2023 | | 2022 | | Amount | | % |
| ALF/MCF properties | | $ | 35,655 | | | $ | 32,987 | | | $ | 2,668 | | | 8.1 | % |
| ILF properties | | 100,583 | | | 88,146 | | | 12,437 | | | 14.1 | % |
| Net lease properties | | 1,178 | | | 1,220 | | | (42) | | | (3.4) | % |
| Rochester Sub-Portfolio (in loan default) | | 14,136 | | | 13,635 | | | 501 | | | 3.7 | % |
| Other revenue | | 2,893 | | | 457 | | | 2,436 | | | 533.0 | % |
| Total property and other revenues | | $ | 154,445 | | | $ | 136,445 | | | $ | 18,000 | | | 13.2 | % |
Overall, total property and other revenues increased $18.0 million during the nine months ended September 30, 2023. Revenues generated by our operating properties increased as a result of improved occupancy and higher market rates for new residents and in-place rates for existing residents. Other revenue consists of interest earned on cash and cash equivalents, which increased during the nine months ended September 30, 2023 as a result of higher market interest rates.
Property Operating Expenses
The following table presents property operating expenses incurred by our direct investments (dollars in thousands):
| | | | | | | | | | | | | | | | | | | | | | | | | | |
| | Nine Months Ended September 30, | | Increase (Decrease) |
| | 2023 | | 2022 | | Amount | | % |
| ALF/MCF properties | | $ | 26,920 | | | $ | 24,937 | | | $ | 1,983 | | | 8.0 | % |
| ILF properties | | 67,849 | | | 63,431 | | | 4,418 | | | 7.0 | % |
| Net lease properties | | — | | | 35 | | | (35) | | | (100.0) | % |
| Rochester Sub-Portfolio (in loan default) | | 12,224 | | | 12,855 | | | (631) | | | (4.9) | % |
| Total property operating expenses | | $ | 106,993 | | | $ | 101,258 | | | $ | 5,735 | | | 5.7 | % |
Overall, total operating expenses increased $5.7 million, primarily due to inflationary pressures significantly impacting all variable operating costs, most notably wages and benefits, repairs and maintenance, insurance, utilities and food and beverage costs. In addition, management fees at our Winterfell portfolioMFFO increased as a result of revenue growth and additional fees for exceeding performance targets peroperational improvements generated from the terms of Trilogy joint venture during the management agreements.
Interest Expense
The following table presents interest expense incurred on our borrowings (dollars in thousands):
| | | | | | | | | | | | | | | | | | | | | | | | | | |
| | Nine Months Ended September 30, | | Increase (Decrease) |
| | 2023 | | 2022 | | Amount | | % |
| ALF/MCF properties | | $ | 3,937 | | | $ | 3,855 | | | $ | 82 | | | 2.1 | % |
| ILF properties | | 22,342 | | | 22,603 | | | (261) | | | (1.2) | % |
| Net lease properties | | 2,639 | | | 2,708 | | | (69) | | | (2.5) | % |
| Rochester Sub-Portfolio (in loan default) | | 8,225 | | | 2,711 | | | 5,514 | | | 203.4 | % |
| Total interest expense | | $ | 37,143 | | | $ | 31,877 | | | $ | 5,266 | | | 16.5 | % |
Interest expense increased $5.3 million as a result of higher interest expense on our floating rate debt and default interest and prepayment penalties accrued due to Rochester Sub-Portfolio Loan default and acceleration in July 2023. We do not anticipate remitting payment for debt service obligations due under the Rochester Sub-Portfolio Loan. The increase was partially offset by a decrease in the average mortgage notes principal balances as compared to September 30, 2022 due to continued principal amortization.
Transaction Costs
Transaction costs for the ninethree months ended September 30, 2023 consisted primarily of legal and professional fees incurred for investment activity and costs incurred in connection with the Internalization and the transition of services and systems previously provided by the Former Advisor.
Transaction costs for the nine months ended September 30, 2022 consisted of legal and professional fees incurred to complete the Internalization.
Asset Management Fees - Related Party & General and Administrative Expenses
The advisory agreement with our Former Advisor was terminated on October 21, 2022. As result, no asset management fees were incurred during 2023 as compared to $7.5 million incurred during the nine months ended September 30, 2022.
Under our new internalized structure, we directly incur and pay all general and administrative expenses, including personnel costs related to our executive officers, which were not allocable under the former advisory agreement. General and administrative expenses were comparable for the nine months ended September 30, 2023 and 2022.
Combining asset management fees and general and administrative expenses, $7.4 million of cost savings were realized under the internalized structure during the nine months ended September 30, 2023March 31, 2024 as compared to the nine months ended September 30, 2022.
Depreciation and Amortization
The following table presents depreciation and amortization recognized on our direct investments (dollars in thousands):
| | | | | | | | | | | | | | | | | | | | | | | | | | |
| | Nine Months Ended September 30, | | Increase (Decrease) |
| | 2023 | | 2022 | | Amount | | % |
| ALF/MCF properties | | $ | 4,930 | | | $ | 4,703 | | | $ | 227 | | | 4.8 | % |
| ILF properties | | 18,539 | | | 17,828 | | | 711 | | | 4.0 | % |
| Net lease properties | | 2,187 | | | 2,601 | | | (414) | | | (15.9) | % |
| Rochester Sub-Portfolio (in loan default) | | 3,649 | | | 3,973 | | | (324) | | | (8.2) | % |
| Total depreciation and amortization | | $ | 29,305 | | | $ | 29,105 | | | $ | 200 | | | 0.7 | % |
Depreciation and amortization expense increased at our ALFs, MCFs and ILFs, primarily as a result of capital improvements during 2023. The increase was partially offset by decreased depreciation primarily as a result of impairments recognized at our net lease properties and our Rochester Sub-Portfolio during the year ended December 31, 2022 and three months ended June 30, 2023, respectively, which reduced building depreciation expense for the nine months ended September 30, 2023.
Impairment Loss
During the nine months ended September 30, 2023, impairment losses on operating real estate totaled $38.7 million and impairment losses recorded on unconsolidated ventures investments totaled $4.7 million. Refer to “—Impairment” for additional discussion.March 31, 2023.
During the nine months ended September 30, 2022, impairment losses on operating real estate totaled $31.5 million, consisting of $18.5 million, $8.5 million and $3.9 million for facilities in Arbors, Winterfell and Rochester portfolios, respectively. In addition, we recorded $0.6 million of impairment losses for property damage sustained by facilities within our Winterfell portfolio.
Other Income, Net
During the nine months ended September 30, 2023, other income, net consisted primarily of capital expenditure reimbursements from the state of Oregon’s Long-Term Care Capital Improvement and Emergency Preparedness Program received and recognized by facilities within our Avamere portfolio.
During the nine months ended September 30, 2022, other income, net consisted of COVID-19 testing reimbursements received and recognized by our Avamere portfolio.
Gain (Loss) on Investments and Other
In connection with the Sale of Minority Interests, we realized a loss totaling $1.3 million, representing the difference betweenelected the fair value and carrying value of our investments in the Diversified US/UK and Eclipse joint ventures, which was the consideration exchanged in the transaction for the acquisition of our common stock. In addition, as a result of the Sale of Minority Interests, we reclassified the accumulated foreign currency losses, totaling $3.3 million, related to the Diversified US/UK portfolio, previously recorded through other comprehensive income on the consolidated statements of equity to gain (loss) on investments and other. Refer to “—Transaction and Financing Activities” for additional discussion.
During the nine months ended September 30, 2022, we recognized gains on mortgage interest rate caps, a discounted financing payoff and a distribution that exceeded our carrying value for an unconsolidated investment. Gains were partially offset by losses recognized on investment activity.
Equity in Earnings (Losses) of Unconsolidated Ventures
The following table presents the results of our unconsolidated ventures (dollars in thousands):
| | | | | | | | | | | | | | | | | | | | | | | | | | | | | | | | | | | | | | | | | | | | | | | | | | |
| | Nine Months Ended September 30, | | | | |
| | 2023 | | 2022 | | 2023 | | 2022 | | 2023 | | 2022 | | | | |
| Portfolio | | Equity in Earnings (Losses) | | FFO and MFFO adjustments(1) | | Equity in Earnings, after FFO and MFFO adjustments | | Increase (Decrease) |
| Trilogy | | $ | 454 | | | $ | 10,757 | | | $ | 13,448 | | | $ | 7,415 | | | $ | 13,902 | | | $ | 18,172 | | | $ | (4,270) | | | (23.5) | % |
| Espresso | | 9,228 | | | 33,711 | | | (8,283) | | | (28,121) | | | 945 | | | 5,590 | | | (4,645) | | | (83.1) | % |
| Solstice | | (41) | | | (41) | | | — | | | — | | | (41) | | | (41) | | | — | | | — | % |
| Subtotal | | 9,641 | | | 44,427 | | | 5,165 | | | (20,706) | | | 14,806 | | | 23,721 | | | (8,915) | | | (37.6) | % |
| Investments sold | | (16,236) | | | (5,000) | | | 15,087 | | | 9,379 | | | (1,149) | | | 4,379 | | | (5,528) | | | (126.2) | % |
| | | | | | | | | | | | | | | | |
| | | | | | | | | | | | | | | | |
| Total | | $ | (6,595) | | | $ | 39,427 | | | $ | 20,252 | | | $ | (11,327) | | | $ | 13,657 | | | $ | 28,100 | | | $ | (14,443) | | | (51.4) | % |
(1)Represents our proportionate share of revenues and expenses excluded from the calculation of FFO and MFFO for unconsolidated investments. Refer to “—Non-GAAP Financial Measures” for additional discussion.
Excluding the investments in unconsolidated ventures sold, equity in earnings (losses) decreased $34.8 million primarily due to prior period gains on sales exceeding gains recognized during the nine months ended September 30, 2023 by the Espresso joint venture. In addition, the Trilogy joint venture recognized a gain upon acquiring the remaining ownership interest of an investment portfolio during nine months ended September 30, 2022.
Excluding the investments in unconsolidated ventures sold, equity in earnings (losses), after FFO and MFFO adjustments, decreased $8.9 million. The Espresso joint venture has sold properties, which has resulted in lower rental income recognized during the nine months ended September 30, 2023 and as of June 30, 2023, we electedoption method to account for our investment in the Espresso joint venture under the fair value option, resultingon June 30, 2023, which resulted in no equity in earnings recorded during the three months ended September 30, 2023. In addition, higher interest expense on floating rate debt inMarch 31, 2024 as compared to a full three months of activity presented for the Trilogy joint venture has offset operational improvements in the joint venture, resulting in lower cash flows generated.three months ended March 31, 2023.
Non-GAAP Financial Measures
We consider certain non-GAAP financial measures, including Funds from Operations, or FFO, Modified Funds from Operations, or MFFO, and NOI, to be useful supplemental measures of our operating performance. These non-GAAP financial measures are not equivalent or an alternative to net income (loss) or cash flow provided by operating activities determined in accordance with U.S. GAAP and should not be construed to be more relevant or accurate than the U.S. GAAP methodology in evaluating our operating performance. In addition, these non-GAAP financial measures are not necessarily indicative of cash flow available to fund our cash needs, including our ability to make distributions to our stockholders.
Funds from Operations and Modified Funds from Operations
We believe that Funds from Operations, or FFO, and Modified Funds from Operations, or MFFO, are additional appropriate measures of the operating performance of a REIT and of us in particular. We compute FFO in accordance with the standards established by the National Association of Real Estate Investment Trusts, or NAREIT, as net income (loss) (computed in accordance with U.S. GAAP), excluding gains (losses) from sales of depreciable property, the cumulative effect of changes in accounting principles, real estate-related depreciation and amortization, impairment on depreciable property owned directly or indirectly and after adjustments for unconsolidated ventures.
Due to certain of the unique features of publicly-registered, non-traded REITs, the Institute for Portfolio Alternatives, or IPA, an industry trade group, standardized a performance measure known as MFFO and recommends the use of MFFO for such REITs. Management believes MFFO is a useful performance measure to evaluate our business and further believes it is important to disclose MFFO in order to be consistent with the IPA recommendation and other non-traded REITs. Neither the U.S. Securities and Exchange Commission, or SEC, nor any other regulatory body has approved the acceptability of the adjustments that we use to calculate MFFO. In the future, the SEC or another regulatory body may decide to standardize permitted adjustments across the non-listed REIT industry and we may need to adjust our calculation and characterization of MFFO.
We define MFFO in accordance with the concepts established by the IPA. Our computation of MFFO may not be comparable to other REITs that do not calculate MFFO using the same method MFFO is calculated using FFO. FFO, as defined by NAREIT, is a computation made by analysts and investors to measure a real estate company’s operating performance. The IPA’s definition of MFFO excludes from FFO the following items:
•acquisition fees and expenses;
•non-cash amounts related to straight-line rent and the amortization of above or below market and in-place intangible lease assets and liabilities (which are adjusted in order to reflect such payments from an accrual basis of accounting under U.S. GAAP to a cash basis of accounting);
•amortization of a premium and accretion of a discount on debt investments;
•non-recurring impairment of real estate-related investments that meet the specified criteria identified in the rules and regulations of the SEC;
•realized gains (losses) from the early extinguishment of debt;
•realized gains (losses) on the extinguishment or sales of hedges, foreign exchange, securities and other derivative holdings except where the trading of such instruments is a fundamental attribute of our business;
•unrealized gains (losses) from fair value adjustments on real estate securities, including CMBS and other securities, interest rate swaps and other derivatives not deemed hedges and foreign exchange holdings;
•unrealized gains (losses) from the consolidation from, or deconsolidation to, equity accounting;
•adjustments related to contingent purchase price obligations; and
•adjustments for consolidated and unconsolidated partnerships and joint ventures calculated to reflect MFFO on the same basis as above.
We believe that MFFO is a useful non-GAAP measure for non-traded REITs. It is helpful to management and stockholders in assessing our future operating performance upon completion of our organization and offering, and acquisition and development stages. However, MFFO may not be a useful measure of our operating performance or as a comparable measure to other typical non-traded REITs if we do not continue to operate in a similar manner to other non-traded REITs, including if we determined not to pursue an exit strategy.
MFFO does have certain limitations. For instance, realized gains (losses) from acquisitions and dispositions and other adjustments listed above are not reported in MFFO, even though such realized gains (losses) and other adjustments could affect our operating performance and cash available for distribution. Any mark-to-market or fair value adjustments may be based on many factors, including current operational or individual property issues or general market or overall industry conditions. Investors should note that while impairment charges are excluded from the calculation of MFFO, investors are cautioned that due to the fact that impairments are based on estimated future undiscounted cash flow and the relatively limited term of a non-traded REIT’s anticipated operations, it could be difficult to recover any impairment charges through operational net revenues or cash flow prior to any liquidity event. In addition, MFFO is not a useful measure in evaluating net asset value, since impairment is taken into account in determining net asset value but not in determining MFFO.
Neither FFO nor In addition, MFFO is equivalent to net income (loss) or cash flow provided by operating activities determined in accordance with U.S. GAAP and shouldmay not be construed to be more relevant or accurate than the U.S. GAAP methodology in evaluating our operating performance. Neither FFO nor MFFO is necessarily indicative of cash flow available to fund our cash needs including our ability to make distributions to our stockholders. FFO and MFFO do not represent amounts available for management’s discretionary use because of needed capital replacement or expansion, debt service obligations or other commitments or uncertainties. Furthermore, neither FFO nor MFFO should be considered as an alternative to net income (loss) as an indicatora useful measure of our operating performance.performance or as a comparable measure to other typical non-traded REITs if we do not continue to operate in a similar manner to other non-traded REITs.
The following table presents a reconciliation of net income (loss) attributable to common stockholders to FFO and MFFO attributable to common stockholders (dollars in thousands):
| | Three Months Ended September 30, | | Nine Months Ended September 30, |
| 2023 | | 2022 | | 2023 | | 2022 |
| | Three Months Ended March 31, | |
| | Three Months Ended March 31, | |
| | Three Months Ended March 31, | |
| | 2024 | |
| | 2024 | |
| | 2024 | |
| Funds from operations: | |
| Funds from operations: | |
| Funds from operations: | Funds from operations: | | | | | | | | |
| Net income (loss) attributable to NorthStar Healthcare Income, Inc. common stockholders | Net income (loss) attributable to NorthStar Healthcare Income, Inc. common stockholders | | $ | (11,218) | | | $ | (29,440) | | | $ | (82,925) | | | $ | (35,569) | |
| Net income (loss) attributable to NorthStar Healthcare Income, Inc. common stockholders | |
| Net income (loss) attributable to NorthStar Healthcare Income, Inc. common stockholders | |
| Adjustments: | |
| Adjustments: | |
| Adjustments: | Adjustments: | |
| Depreciation and amortization | Depreciation and amortization | | 9,848 | | | 9,642 | | | 29,305 | | | 29,105 | |
| Depreciation and amortization | |
| Depreciation and amortization | |
| Depreciation and amortization related to non-controlling interests | |
| Depreciation and amortization related to non-controlling interests | |
| Depreciation and amortization related to non-controlling interests | Depreciation and amortization related to non-controlling interests | | (67) | | | (71) | | | (214) | | | (215) | |
| Depreciation and amortization related to unconsolidated ventures | Depreciation and amortization related to unconsolidated ventures | | 4,137 | | | 7,290 | | | 14,328 | | | 21,386 | |
| Depreciation and amortization related to unconsolidated ventures | |
| Depreciation and amortization related to unconsolidated ventures | |
| (Gain) loss from sales of property | |
| (Gain) loss from sales of property | |
| (Gain) loss from sales of property | (Gain) loss from sales of property | | — | | | — | | | (136) | | | 425 | |
| Gain (loss) from sales of property related to non-controlling interests | Gain (loss) from sales of property related to non-controlling interests | | — | | | — | | | 4 | | | (6) | |
| Gain (loss) from sales of property related to non-controlling interests | |
| Gain (loss) from sales of property related to non-controlling interests | |
| (Gain) loss from sales of property related to unconsolidated ventures | |
| (Gain) loss from sales of property related to unconsolidated ventures | |
| (Gain) loss from sales of property related to unconsolidated ventures | (Gain) loss from sales of property related to unconsolidated ventures | | — | | | (505) | | | (7,894) | | | (44,407) | |
| Impairment losses of depreciable real estate | Impairment losses of depreciable real estate | | — | | | 18,500 | | | 38,694 | | | 31,502 | |
| Impairment losses of depreciable real estate | |
| Impairment losses of depreciable real estate | |
| Impairment loss on real estate related to non-controlling interests | Impairment loss on real estate related to non-controlling interests | | — | | | — | | | (1,161) | | | (117) | |
| Impairment losses of depreciable real estate held by unconsolidated ventures | | — | | | 38 | | | 7,682 | | | 58 | |
| Impairment loss on real estate related to non-controlling interests | |
| Impairment loss on real estate related to non-controlling interests | |
| | Funds from operations attributable to NorthStar Healthcare Income, Inc. common stockholders | |
| | Funds from operations attributable to NorthStar Healthcare Income, Inc. common stockholders | |
| | Funds from operations attributable to NorthStar Healthcare Income, Inc. common stockholders | Funds from operations attributable to NorthStar Healthcare Income, Inc. common stockholders | | $ | 2,700 | | | $ | 5,454 | | | $ | (2,317) | | | $ | 2,162 | |
| Modified funds from operations: | Modified funds from operations: | | | | | | | | |
| Modified funds from operations: | |
| Modified funds from operations: | |
| Funds from operations attributable to NorthStar Healthcare Income, Inc. common stockholders | |
| Funds from operations attributable to NorthStar Healthcare Income, Inc. common stockholders | |
| Funds from operations attributable to NorthStar Healthcare Income, Inc. common stockholders | Funds from operations attributable to NorthStar Healthcare Income, Inc. common stockholders | | $ | 2,700 | | | $ | 5,454 | | | $ | (2,317) | | | $ | 2,162 | |
| Adjustments: | Adjustments: | |
| Adjustments: | |
| Adjustments: | |
| Transaction costs | Transaction costs | | 358 | | | 857 | | | 455 | | | 857 | |
| | Transaction costs | |
| Transaction costs | |
| Amortization of premiums, discounts and fees on investments and borrowings | |
| Amortization of premiums, discounts and fees on investments and borrowings | |
| Amortization of premiums, discounts and fees on investments and borrowings | Amortization of premiums, discounts and fees on investments and borrowings | | 1,513 | | | 983 | | | 3,507 | | | 2,927 | |
| (Gain) loss on investments and other | (Gain) loss on investments and other | | 347 | | | (325) | | | 4,798 | | | (1,085) | |
| (Gain) loss on investments and other | |
| (Gain) loss on investments and other | |
Adjustments related to unconsolidated ventures(1) | |
Adjustments related to unconsolidated ventures(1) | |
Adjustments related to unconsolidated ventures(1) | Adjustments related to unconsolidated ventures(1) | | 323 | | | (2,525) | | | 6,136 | | | 11,636 | |
| Adjustments related to non-controlling interests | Adjustments related to non-controlling interests | | (27) | | | 7 | | | (28) | | | 11 | |
| Impairment of real estate related investment | | — | | | — | | | 4,728 | | | — | |
| Adjustments related to non-controlling interests | |
| Adjustments related to non-controlling interests | |
| | Modified funds from operations attributable to NorthStar Healthcare Income, Inc. common stockholders | Modified funds from operations attributable to NorthStar Healthcare Income, Inc. common stockholders | | $ | 5,214 | | | $ | 4,451 | | | $ | 17,279 | | | $ | 16,508 | |
| | Modified funds from operations attributable to NorthStar Healthcare Income, Inc. common stockholders | |
| | Modified funds from operations attributable to NorthStar Healthcare Income, Inc. common stockholders | |
(1)Primarily represents our proportionate share of liability extinguishment gains and losses, loan loss reserves, transaction costs and amortization of above/below market debt adjustments, straight-line rent adjustments, impairment of goodwill, debt extinguishment losses and deferred financing costs, incurred throughrecorded by the joint ventures of our investments in unconsolidated ventures.
Net Operating Income
We believe NOI provides useful information to stockholders and provides our management with a performance measure to compare our operating results to the operating results of other real estate companies between periods on a consistent basis. We define NOI as property and other revenues, less property operating expenses.
The following table reconciles net income (loss), computed in accordance with U.S. GAAP, to NOI for our direct operating investments segment (in thousands):
| | | | | | | | | | | | | | | | |
| | Three Months Ended March 31, |
| | 2024 | | 2023 | | |
| Direct Operating Investments | | | | | | |
| Net income (loss) | | $ | (6,016) | | | $ | (5,184) | | | |
| Adjustments: | | | | | | |
| Income tax expense | | 20 | | | 15 | | | |
| Gain (loss) on investments and other | | (150) | | | (332) | | | |
| Other income, net | | — | | | (132) | | | |
| Impairment loss | | 456 | | | — | | | |
| Depreciation and amortization | | 8,218 | | | 8,920 | | | |
| General and administrative expenses | | (39) | | | — | | | |
| Transaction costs | | 2 | | | 2 | | | |
| Interest expense | | 12,000 | | | 10,483 | | | |
| Net operating income | | $ | 14,491 | | | $ | 13,772 | | | |
For additional information regarding our direct operating investments segment, refer to “— Our Investments” above and for financial information refer to Note 11, “Segment Reporting” in our accompanying consolidated financial statements included in Part I, Item 1. “Financial Statements.”
Liquidity and Capital Resources
Our current principal liquidity needs are to fund: (i) operating expenses, including corporate general and administrative expenses; (ii) principal and interest payments on our borrowings and other commitments; and (iii) capital expenditures, including capital calls in connection with our unconsolidated joint venture investments.expenditures.
Our current primary sources of liquidity include the following: (i) cash on hand; (ii) proceeds from full or partial realization of investments; (iii) cash flow generated by our investments, both from our operating activities and distributions from our unconsolidated joint ventures; and (iv) secured or unsecured financings from banks and other lenders.
As of November 9, 2023,May 7, 2024, we had approximately $98.7$91.3 million of unrestricted cash and currently believe that our capital resources are sufficient to meet our capital needs for the following 12 months.
Cash From Operations
We primarily generate cash flow from operations through net operating income from our operating properties and rental income from our net lease properties. In addition, we receive distributions from our investments in unconsolidated ventures. Net cash provided by operating activities was $13.1$0.9 million for the ninethree months ended September 30, 2023.March 31, 2024.
A substantial majority of our direct investmentsWe are operating properties whereby we are directly exposed to various operational risks. While our direct investments have not experienced any significant issues collecting rents or other fees from residents, cash flow has continued to be negatively impacted by rate pressures, costrisks, including rising labor costs, increases in inflation and rising interest rates, and other economic market
conditions.our properties. We expect that these factors will continue to materially impact our revenues, expenses and cash flow generated by the communities of our direct investments.
We have a significant unconsolidated investment in the Trilogy, Joint Venture, where we have no control over the timing of distributions, if any. The Trilogy, Joint Venturesimilar to our direct operating investments, has been similarly impacted as our direct investments by inflation, rising interest rates and other economic market conditions, and, as a result, does not expect to make further distributions in 2023 and may continue to limit distributions to preserve liquidity in the future.
Borrowings
We typically have financed our investments with medium to long-term, non-recourse mortgage loans, though our borrowing levels and terms vary depending upon the nature of the assets and the related financing.
During the ninethree months ended September 30, 2023,March 31, 2024, we paid $43.7$4.4 million and $8.6 million in recurring principal and interest payments, respectively, on borrowings. Excluding the Rochester Sub-Portfolio Loan, we had $808.5$788.8 million of consolidated asset-level borrowings outstanding as of September 30, 2023. Fixed-rateMarch 31, 2024.
We have $678.3 million of borrowings totaled $779.4 million with interest rates ranging from 3.00% to 4.66%. Excluding the Rochester Sub-Portfolio Loan, floating-rate borrowings totaled $29.1 million and are subject to fluctuating Secured Overnight Financing Rate, or SOFR. As of September 30, 2023, excluding the Rochester Sub-Portfolio Loan, effective interest rates on floating rate debt ranged from 8.11% to 8.26%.
As the impact of inflation, rising interest rates, risk of recession and other economic market conditions continue to influence our investments’ performance and market values, our ability to service or refinance our borrowings may be negatively impacted,that mature in 2025, including $586.8$580.1 million of borrowings collateralized by our Winterfell portfolio. We may be unable to extend or refinance these borrowings without a significant pay down of existing loan balances. If we do not have sufficient capital to pay down existing loan balances, we may be forced to sell assets to generate additional capital or sell the portfolio that mature in June 2025.advance of the loan maturity. Our ability to refinance these borrowings and/or sell assets will be significantly impacted by market conditions, over which we have no control. Further, given the nature of our assets and the materiality of this portfolio, we may not be able to respond quickly to changes in market conditions. Even if we are able to extend or refinance these borrowings, it will likely be at a significantly higher interest rate.
Our charter limits us from incurring borrowings that would exceed 300.0% of our net assets. We cannot exceed this limit unless any excess in borrowing over such level is approved by a majority of our independent directors. We would need to disclose any such approval to our stockholders in our next quarterly report along with the justification for such excess. An approximation of this leverage limitation, excluding indirect leverage held through our unconsolidated joint venture investments and any securitized mortgage obligations to third parties, is 75.0% of our assets, other than intangibles, before deducting loan loss reserves, other non-cash reserves and depreciation. As of September 30, 2023,March 31, 2024, our leverage was 55.5%60.2% of our assets, other than intangibles, before deducting non-cash reserves and depreciation. As of September 30, 2023, indirect leverage on assets, other than intangibles, before deducting non-cash reserves and depreciation, held through our unconsolidated joint ventures was 57.7%.
For additional information regarding our borrowings, including principal repayments, timing of maturities and loans currently in default, refer to Item 3. “Quantitative and Qualitative Disclosures About Market Risk” and Note 5, “Borrowings” in our accompanying consolidated financial statements included in Part I, Item 1. “Financial Statements.”
Capital Expenditures Activities
We are responsible for capital expenditures for our operating properties and may also fund capital expenditures for our net lease properties. We continuehave made significant investments in capital expenditures to invest cash from reservesincrease operating income and asset sales proceeds into our direct investmentsenhance the overall value of certain properties and in order to maintain market position, functional and operating standards, increase operating income, achieve property stabilizationstandards. We will continue to invest going forward, although we expect aggregate spending to decrease in the near-term compared to 2023 and enhanceprior years. During the overall value of our assets. However, there can be no assurance that these initiatives will achieve these intended results.
The following table presentsthree months ended March 31, 2024, cash used for capital expenditures at our direct investments (dollars in thousands):totaled $2.9 million.
| | | | | | | | | | | | | | | | | | | | |
| | Nine Months Ended September 30, | | |
| | 2023 | | 2022 | | 2023 vs. 2022 Change |
| ALF/MCF properties | | $ | 2,066 | | | $ | 1,993 | | | $ | 73 | |
| ILF properties | | 26,359 | | | 15,609 | | | 10,750 | |
| Net lease properties | | — | | | 322 | | | (322) | |
| | | | | | |
| Total capital expenditures | | $ | 28,425 | | | $ | 17,924 | | | $ | 10,501 | |
Realization and Disposition of Investments
We will pursue dispositions of assets and portfolios where we believe the disposition will achieve a desired return or strategic outcome, improve our liquidity position and generate value for shareholders. Although opportunities may exist to dispose of assets in the current market environment and there are certain scenarios where a sale can generate acceptable market returns for shareholders, many opportunities in the current market may require us to take significant discounts to our view of value.
We have made significant investments through unconsolidated joint ventures with third parties, whichIn addition, we have a significant minority investment in Trilogy with limited ability to influence material decisions, including the disposition of assets. Refer to “—Market Update” and “—Business Update” for further information regarding dispositions.
Distributions
To continue to qualify as a REIT, we are required to distribute annually dividends equal to at least 90% of our taxable income, subject to certain adjustments, to stockholders. We have generated net operating losses for tax purposes and, accordingly, are currently not required to make distributions to our stockholders to qualify as a REIT. Refer to “—Distributions Declared and Paid” and “—Liquidity Update” for further information regarding our distributions.
Share Repurchases
We adopted a Share Repurchase Programshare repurchase program effective August 7, 2012, which enabled stockholders to sell their shares to us in limited circumstances and could be amended, suspended, or terminated at any time. On April 7, 2020, our board of directors suspended all repurchases under our existing Share Repurchase Programshare repurchase program effective April 30, 2020 in order to preserve capital and liquidity. We do not currently anticipate resuming the Share Repurchase Program.share repurchase program. If we have sufficient capital available, at this stage in our life cycle, we believe that returning capital to stockholders through special distributions, rather than repurchases, is a better use of that capital.
Other Commitments
On October 21, 2022, we terminated the advisory agreement and completed the Internalization. Prior to the termination of the advisory agreement, we reimbursed the Former Advisor for direct and indirect operating costs in connection with services provided to us. Under our new internalized structure, we will directly incur and pay all general and administrative costs.
Cash Flows
The following presents a summary of our consolidated statements of cash flows (dollars in thousands):
| | Nine Months Ended September 30, | |
| | Three Months Ended March 31, | |
| | Three Months Ended March 31, | |
| | Three Months Ended March 31, | |
| Cash flows provided by (used in): | |
| Cash flows provided by (used in): | |
| Cash flows provided by (used in): | Cash flows provided by (used in): | | 2023 | | 2022 | | 2023 vs. 2022 Change |
| Operating activities | Operating activities | | $ | 13,066 | | | $ | (13,604) | | | $ | 26,670 | |
| Operating activities | |
| Operating activities | |
| Investing activities | |
| Investing activities | |
| Investing activities | Investing activities | | (14,295) | | | 24,249 | | | (38,544) | |
| Financing activities | Financing activities | | (15,464) | | | (113,901) | | | 98,437 | |
| Financing activities | |
| Financing activities | |
| Net increase (decrease) in cash, cash equivalents and restricted cash | Net increase (decrease) in cash, cash equivalents and restricted cash | | $ | (16,693) | | | $ | (103,256) | | | $ | 86,563 | |
| Net increase (decrease) in cash, cash equivalents and restricted cash | |
| Net increase (decrease) in cash, cash equivalents and restricted cash | |
Operating Activities
Net cash provided by operating activities totaled $13.1$0.9 million for the ninethree months ended September 30, 2023March 31, 2024 as compared to $13.6$3.5 million net cash used in operating activities for the ninethree months ended September 30, 2022.March 31, 2023. The change in net cash flowprovided from operating activities was a result of distributions received from our unconsolidated investment in the Espresso joint venture, $10.6 million of which has been classified as operating cash flows. Additionally, increases in ratesoccupancy and occupancyrates at our direct operating investments, which resulted in higher rent and resident fees collected during the ninethree months ended September 30,March 31, 2024. In addition, the Rochester Sub-Portfolio Loan default in July 2023 andresulted in lower reimbursement payments madeinterest expense paid in cash as compared to our Former Advisor increased cash flow from operations.the prior period.
Investing Activities
Our cash flows from investing activities are primarily proceeds from investment dispositions, including distributions received from our investments in unconsolidated investments that have been classified as investing cash flows, net of any capital expenditures. We continue to invest capital into our operating portfolios in order to maintain market position and enhance overall asset value.value, although we expect aggregate spending to decrease in the near-term compared to 2023 and 2022. Net cash used inprovided by investing activities totaled $14.3$8.6 million for the ninethree months ended September 30, 2023March 31, 2024 as compared to $24.2$0.8 million net cash used in investing activities for the three months ended March 31, 2023. Net cash provided by investing activities for the ninethree months ended September 30, 2022. Cash flowsMarch 31, 2024 were from property sales, less capital expenditures of our direct investments. Net cash used in investing activities for the ninethree months ended September 30,March 31, 2023 consisted ofwere capital expenditures for our direct investments, partially offset by distributions received from our Espresso and Trilogy unconsolidated investments classified as investing cash flows, which totaled $8.8 million and $4.7 million, respectively. Cash flows provided by investing activities for the nine months ended September 30, 2022 consisted of distributions received from our unconsolidated investments, which totaled $42.2 million, less capital expenditures for our direct investments.investment.
Financing Activities
Cash flows used in financing activities totaled $15.5 million forFor the ninethree months ended September 30, 2023 compared to $113.9 million for the nine months ended September 30, 2022. For the nine months ended September 30, 2023,March 31, 2024, net cash flows used in financing activities were primarily recurring principal amortization and repayments on our mortgage notes. Fornotes payable, which increased to $15.3 million for the ninethree months ended September 30, 2022, net cash flows used in financing activities were primarily attributable to the special distribution our board ofMarch 31, 2024 as
directors declared of $0.50 per sharecompared to $4.8 million for each stockholder of record on May 2, 2022, or the Special Distribution, which was paid in cash on or around May 5, 2022 and totaled approximately $97.0 million. In addition,three months ended March 31, 2023 due to the repayment of the financing on Oak Cottage and recurring principal amortization onmortgage note for a property sold within our mortgage notes contributed to cash flows used in financing activities.Rochester Portfolio.
Off-Balance Sheet Arrangements
As of September 30, 2023,March 31, 2024, we are not dependent on the use of any off-balance sheet financing arrangements for liquidity. We have made investments in unconsolidated ventures. Refer to Note 4, “Investments in Unconsolidated Ventures” in Part I, Item 1. “Financial Statements”Statements.” for a discussion of such unconsolidated ventures in our consolidated financial statements. In each case, our exposure to loss is limited to the carrying value of our investment.
Distributions Declared and Paid
From inception through September 30, 2023,March 31, 2024, we declared $530.9 million in distributions inclusive of the Special Distribution, and generated cumulative FFO of $107.0$57.9 million. From April 5, 2013, the date of our first investment, on April 5, 2013 through December 31, 2017, we declaredpaid monthly distributions in an amount that was equivalent to an annualized distribution amount of $0.675 per share of our common stock. FromIn order to better align the distribution with anticipated cash flows from operations, beginning in January 1, 2018 through January 31, 2019, we declaredpaid monthly distributions in an amount that was equivalent to an annualized distribution amount of $0.3375 per share of our common stock. Effective February 1, 2019, our board of directors stopped recurring distributions in order to preserve capital and liquidity. On April 20,In May 2022, our board of directors declaredwe paid a special distribution in the Special Distributionamount of $0.50 per share for each stockholder of record on May 2, 2022 totaling approximately $97.0 million. our common stock. During the three months ended March 31, 2024, we did not declare any distributions to stockholders.
While we do not anticipate recurring dividends in the near future, in light of the cash flow generated by our investments as compared to our capital expenditure needs and debt service obligations, our management and board of directors will evaluate special distributions in connection with asset sales and other realizations of our investments on a case-by-case basis based on, among other factors, current and projected liquidity needs, opportunities for investment in our assets (such as capital expenditure and de-levering opportunities) and other strategic initiatives.
To the extent distributions are paid from sources other than FFO, the ownership interest of our public stockholders may be diluted. Future distributions declared and paid may exceed FFO and cash flow provided by operations. FFO, as defined, may not reflect actual cash available for distributions.
Related Party Arrangements
Former Advisor
In connection with the Internalization, on October 21, 2022 the advisory agreement was terminated on October 21, 2022. and, along with the Operating Partnership and the Former Advisor, we entered into a Transition Services Agreement, or TSA, to facilitate an orderly transition of the management of our operations. As of December 31, 2023, the TSA was effectively terminated.
Prior to the Internalization, the Former Advisor was responsible for managing our affairs on a day-to-day basis and for identifying, acquiring, originating and asset managing investments on our behalf. For such services, to the extent permitted by law and regulations, the Former Advisor received fees and reimbursements from us. Pursuant to the advisory agreement, the Former Advisor could defer or waive fees in its discretion.
Transition Services
In connection with the Internalization, on October 21, 2022, we, the Operating Partnership and the Former Advisor entered into a Transition Services Agreement, or TSA, to facilitate an orderly transition of the management of our operations. The TSA, as amended on March 22, 2023, provides for, among other things, the Former Advisor to provide certain services, including primarily technology and insurance, for a transition period of up to six months following the Internalization, with legal, treasury and accounts payable services to continue until we terminate these services or in other specified circumstances in accordance with the TSA. We will reimburse the Former Advisor for costs to provide the services, including the allocated cost of employee wages and compensation and actually incurred out-of-pocket expenses.
Summary of Fees and Reimbursements
The following table presents the fees and reimbursements incurred and paid to the Former Advisor (dollars in thousands):
| | | | | | | | | | | | | | | | | | | | | | | | | | | | | | | | |
| Reimbursements to Former Advisor Entities | | | | Due to Related Party as of December 31, 2022 | | Nine Months Ended September 30, 2023 | | Due to Related Party as of September 30, 2023 (Unaudited) |
| Financial Statement Location | | | Incurred | | Paid | |
| | | | | | | | |
| Operating costs | | General and administrative expenses/Transaction costs | | $ | 469 | | | $ | 520 | | (1) | $ | (697) | | | $ | 292 | |
| | | | | | | | | | |
_____________________________________(1)Represents costs incurred under the TSA during the nine months ended September 30, 2023.
Incentive Fee
The Special Unit Holder, an affiliate of the Former Advisor, was entitled to receive distributions equal to 15.0% of our net cash flows, whether from continuing operations, repayment of loans, disposition of assets or otherwise, but only after stockholders have received, in the aggregate, cumulative distributions equal to their invested capital plus a 6.75% cumulative, non-compounded annual pre-tax return on such invested capital. From inception through the Sale of Minority Interests, the Special Unit Holder did not receive any incentive fees.
In connection with the Sale of Minority Interests, as of June 9, 2023, the Special Unit Holder became an indirect subsidiary of us, though the Special Unit Holder continues to have a contractual obligation to pay any such incentive fees to affiliates of the Former Sponsor, if ever earned.
Investments in Joint Ventures
Solstice, the manager of the Winterfell portfolio, is a joint venture between affiliates of ISL, who ownwhich owns 80.0%, and us, whowhich owns 20.0%. For the ninethree months ended September 30, 2023,March 31, 2024, we recognized property management fee expense of $5.1$1.7 million payable to Solstice related to the Winterfell portfolio.
In June 2023, we completed the Sale of Minority Interests, involving the sale of our minority interests in the Diversified US/UK Portfolio and Eclipse Portfolio, together with $1.1 million in cash, to our Former Sponsor, who is affiliated with the majority partner of each joint venture, for all of our equity securities held by the Former Sponsor and its affiliates. Refer to “—Transaction and Financing Activities” for further discussion of the Sale of Minority Interests.
Item 3. Quantitative and Qualitative Disclosures About Market Risk
The principal market risks affecting us are interest rate risk inflation risk and creditinflation risk. These risks are dependent on various factors beyond our control, including monetary and fiscal policies, domestic and international economic conditions and political considerations. Our market risk sensitive assets, liabilities and related derivative positions (if any) are held for investment and not for trading purposes.
Interest Rate Risk
Changes in interest rates may affect our net income as a result of changes in interest expense incurred in connection with floating-rate borrowings usedWe have exposure to finance our equity investments. As of September 30, 2023, 14.2% of our total borrowings were floating-rate liabilities, which are related to mortgage notes payable of our direct operating investments.
Our interest rate risk management objectives are to limit the impact of interest rate changes primarily through our borrowing activities. To limit this exposure, we have generally sought long-term debt financing on earnings, prepayment penaltiesa fixed-rate basis. However, certain of our borrowings are subject to variable-rate interest.
The following table presents a summary of our borrowings as of March 31, 2024 (dollars in thousands):
| | | | | | | | | | | | | | | | | | | | | | | | | | |
| Borrowing Type | | Loan Count | | Interest Rate(2) | | Principal Outstanding | | % of Outstanding Debt |
| Fixed-rate debt | | 42 | | 4.2 | % | | $ | 744,644 | | | 83.8 | % |
| Floating-rate debt | | 2 | | 7.2 | % | | 44,133 | | | 5.0 | % |
Rochester Sub-Portfolio Loan(1) | | 7 | | 7.7 | % | | 99,786 | | | 11.2 | % |
| Total/WA | | 51 | | 4.6 | % | | $ | 888,563 | | | 100.0 | % |
(1)The Rochester Sub-Portfolio Loan is comprised of seven individual floating-rate mortgage notes payable in payment default, cross-collateralized and cash flows andsubject to lower overall borrowing costscross-default, secured by borrowing primarily at fixed rates. the seven healthcare properties, which have been placed into a receivership.
(2)Represents the weighted average interest rate effective as of March 31, 2024.
When borrowing at variable rates, we seek the lowest margins available and evaluate hedging opportunities. The interest rate on our floating-rate borrowings is a fixed spread over an index such as the Secured Overnight Financing Rate, or SOFR, and typically reprices every 30 days. For our floating-rate borrowings, we have entered into interest rate caps that involve the receipt of variable amounts from a counterparty if interest rates rise above the strike rate on the contract in exchange for an up-front premium.
The As of March 31, 2024, eight of our nine floating-rate borrowings are hedged with contracts in place through the third quarter of 2024 that have effectively capped interest at a weighted average rate of 7.41% (excluding the Rochester Sub-Portfolio Loan, the weighted average interest rate is 5.61%). Based on our floating-rate liabilities is a fixed spread over an index such as SOFR and typically reprices every 30 days. Asmarket interest rates of September 30, 2023,March 31, 2024, a hypothetical 100 basis point increase in interest rates would not impact net annual interest expense due toon the interest rate capsfor our one floating-rate loan without an interest rate cap in place.place would increase our interest expense by $0.3 million.
Increases in market interest rates typically result in a decrease in the fair value of fixed-rate borrowings, while decreases in market interest rates typically result in an increase in the fair value of fixed-rate borrowings. While changes in market interest rates affect the fair value of our fixed-rate borrowings, these changes do not affect the interest expense associated with our fixed-rate borrowings. Therefore, interest rate risk does not have a significant impact on our fixed-rate borrowings until their maturity or earlier prepayment and refinancing. If we seek to refinance our fixed-rate borrowings, whether at maturity or otherwise, and interest rates have risen, our future earnings and cash flows could be adversely affected by additional borrowing costs. Conversely, lower interest rates at the time of refinancing may reduce our overall borrowing costs. Further, the fair value of the real estate collateral for our borrowings may be negatively impacted by rising interest rates.
Inflation Risk
Many of our costs are subject to inflationary pressures. These include labor, repairs and maintenance, food costs, utilities, insurance and other operating costs. Higher rates of inflation affecting the economy may substantially affect the operating margins of our investments. While our managers have an ability to partially offset cost inflation by increasing the rates charged to residents, this ability is often limited by competitive conditions, affordability and timing, which may lag behind cost volatility. Therefore, there can be no assurance that cost increases can be offset by increased rates charged to residents in real time or that increased rates will not result in occupancy declines.
Credit Risk
We are subject to the credit risk of the operators of our healthcare properties. The operator of our four net lease properties failed to remit contractual monthly rent obligations and it is not probable that these obligations will be satisfied in the foreseeable future.
Risk Concentration
The following table presents the operators and managers of our properties, excluding properties owned through unconsolidated joint ventures (dollars in thousands):
| | | | | | | | | | | | | | | | | | | | | | | | | | |
| | As of September 30, 2023 | | Nine Months Ended September 30, 2023 |
| Operator / Manager | | Properties Under Management | | Units Under Management(1) | | Property and Other Revenues(2) | | % of Total Property and Other Revenues |
Solstice Senior Living(3) | | 32 | | | 3,969 | | | $ | 94,469 | | | 61.2 | % |
| Watermark Retirement Communities | | 14 | | | 1,782 | | | 35,967 | | | 23.2 | % |
| Avamere Health Services | | 5 | | | 453 | | | 16,266 | | | 10.5 | % |
| Integral Senior Living | | 1 | | | 40 | | | 3,672 | | | 2.4 | % |
Arcadia Management(4) | | 4 | | | 572 | | | 1,178 | | | 0.8 | % |
Other(5) | | — | | | — | | | 2,893 | | | 1.9 | % |
| Total | | 56 | | | 6,816 | | | $ | 154,445 | | | 100.0 | % |
(1)Represents rooms for ALFs, ILFs and MCFs, based on predominant type.
(2)Includes rental income received from our net lease properties, as well as rental income, ancillary service fees and other related revenue earned from ILF residents and resident fee income derived from our ALFs and MCFs, which includes resident room and care charges, ancillary fees and other resident service charges.
(3)Solstice is a joint venture of which affiliates of ISL own 80%.
(4)During the nine months ended September 30, 2023, we recorded rental income to the extent payments were received.
(5)Consists primarily of interest income earned on corporate-level cash and cash equivalents.
Watermark Retirement Communities and Solstice, together with their affiliates, manage substantially all of our operating properties. As a result, we are dependent upon their personnel, expertise, technical resources and information systems, proprietary information, good faith and judgment to manage our properties efficiently and effectively. Through our 20.0% ownership of Solstice, we are entitled to certain rights and minority protections. As Solstice is a joint venture formed exclusively to operate the Winterfell portfolio, Solstice has generated, and may generate, operating losses if our Winterfell portfolio experiences declines in occupancy and operating revenues.
Item 4. Controls and Procedures
Internal Control over Financial Reporting
Changes in Internal Control over Financial Reporting.
There have not been any changes in our internal control over financial reporting (as defined in Rules 13a-15(f) and 15d-15(f) under the Exchange Act) during the most recent fiscal quarter that materially affected, or are reasonably likely to materially affect, our internal control over financial reporting.
Disclosure Controls and Procedures
Our management established and maintains disclosure controls and procedures that are designed to ensure that material information relating to us and our subsidiaries required to be disclosed in reports that are filed or submitted under the Securities Exchange Act of 1934, as amended, or Exchange Act, are recorded, processed, summarized and reported within the time periods specified in the SEC’s rules and forms, and that such information is accumulated and communicated to management, including our Chief Executive Officer and Chief Financial Officer, as appropriate, to allow timely decisions regarding required disclosures.
As of the end of the period covered by this report, management conducted an evaluation as required under Rules 13a-15(b) and 15d-15(b) under the Exchange Act, under the supervision and with the participation of the Company’s Chief Executive Officer and Chief Financial Officer, of the effectiveness of the Company’s disclosure controls and procedures (as defined in Rules 13a-15(e) and 15d-15(e) under the Exchange Act).
Based on this evaluation, the Company’s Chief Executive Officer and Chief Financial Officer concluded that, as of the end of the period covered by this report, the Company’s disclosure controls and procedures are effective. Notwithstanding the foregoing, a control system, no matter how well designed and operated, can provide only reasonable, not absolute, assurance that it will detect or uncover failures to disclose material information otherwise required to be set forth in the Company’s periodic reports. Our internal control framework, which includes controls over financial reporting and disclosure, continues to operate effectively.
Part II—Other Information.
Item 1. Legal Proceedings
We may be involved in various litigation matters arising in the ordinary course of our business. Although we are unable to predict with certainty the eventual outcome of any litigation, in the opinion of management, any current legal proceedings are not expected to have a material adverse effect on our financial position or results of operations.
Item 1A. Risk Factors
If we pay distributions from sources other than our cash flow provided by operations, we will have less cash available for investments and your overall return may be reduced.
Our organizational documents permit us to pay distributions from any source, including offering proceeds, borrowings or sales of assets or we may make distributions in the form of taxable stock dividends. We have not established a limit on the amount of proceeds we may use to fund distributions. We have funded distributions in the past in excess of our cash flow from operations and may continue to do so in the future. If we pay distributions from sources other than our cash flow provided by operations, such as using the proceeds of asset sales, our book value may be negatively impacted and stockholders’ overall return maythe value of our shares will be reduced. In AprilMay 2022, our board of directors declaredwe paid a special distribution to stockholders of which approximately $97.0 million was paid in cash in May 2022,$0.50 per share of common stock using proceeds from asset sales and not cash flow provided by operations. We did not declare any distributions during the ninethree months ended September 30, 2023.March 31, 2024.
Item 2. Unregistered Sales of Equity Securities and Use of Proceeds
Purchases of Equity Securities by the Issuer and Affiliated Purchasers
We adopted a Share Repurchase Programshare repurchase program in 2012, which enabled shareholders to sell their shares to us in limited circumstances and could be amended, suspended and terminated by our board of directors at any time in their sole discretion (subject to certain notice requirements set forth in the Share Repurchase Program)share repurchase program). On April 7, 2020, in accordance with the terms of our Share Repurchase Program,share repurchase program, our board of directors suspended all repurchases under the Share Repurchase Programshare repurchase program effective April 30, 2020 in order to preserve capital and liquidity and does not currently anticipate resuming the Share Repurchase Program.share repurchase program.
We did not repurchase any shares of common stock during the three months ended March 31, 2024.
Unregistered Sales of Equity Securities
We did not issue any shares of common stock during the ninethree months ended September 30, 2023.March 31, 2024.
Item 3. Defaults Upon Senior Securities
None.
Item 4. Mine Safety Disclosures
Not applicable.
Item 5. Other Information
Securities Trading Plans of Directors and Executive Officers
During our last fiscal quarter, no director or officer, as defined in Rule 16a-1(f), adopted or terminated a “Rule 10b5-1 trading arrangement” or a “non-Rule 10b5-1 trading arrangement,” each as defined in Regulation S-K Item 408.
Determination of Estimated Value Per Share
Overview
On November 9, 2023, upon the recommendation of the Audit Committee of the Board of NorthStar Healthcare Income, Inc., the Board, including all of its independent directors, approved and established an estimated value per share of NorthStar Healthcare’s common stock of $2.64. The estimated value per share is based upon the estimated value of NorthStar Healthcare’s assets less the estimated value of NorthStar Healthcare’s liabilities as of June 30, 2023, divided by the number of shares of NorthStar Healthcare’s common stock outstanding as of June 30, 2023. The information used to generate the estimated value per share, including market information, investment- and property-level data and other information provided by third parties, was the most recent information practically available as of June 30, 2023.
Process
The estimated value per share was calculated with the assistance of NorthStar Healthcare’s management team and Kroll, LLC, or Kroll, an experienced third-party independent valuation and consulting firm engaged by NorthStar Healthcare to perform an appraisal and valuation of its assets and liabilities. The engagement of Kroll was approved by the Board, including all of its independent directors. Kroll has extensive experience in conducting asset valuations, including appraisals of properties similar to those owned by NorthStar Healthcare. While NorthStar Healthcare has engaged or may engage Kroll in the future for services of various kinds, NorthStar Healthcare believes that there are no material conflicts of interest with respect to its engagement of Kroll.
The Audit Committee recommended and the Board established the estimated value per share as of June 30, 2023 based upon the analyses and reports provided by Kroll and NorthStar Healthcare’s management team. In arriving at its recommendation, the Audit Committee relied in part on valuation and appraisal methodologies that Kroll and NorthStar Healthcare’s management team believe are standard and acceptable in the real estate and non-listed REIT industries for the types of assets and liabilities held by NorthStar Healthcare. The process for estimating the value of NorthStar Healthcare’s assets and liabilities was performed in accordance with the provisions of the Institute for Portfolio Alternatives Practice Guideline 2013-01, Valuations of Publicly Registered Non-Listed REITs. NorthStar Healthcare believes that the valuation was developed in a manner reasonably designed to ensure its reliability.
On November 9, 2023, Kroll delivered its report related to the valuation and appraisal of NorthStar Healthcare’s assets and liabilities as of June 30, 2023, reflecting an estimated range of values for NorthStar Healthcare’s real estate properties, or the Healthcare Properties, including 56 consolidated Healthcare Properties, 6 of which have excess land and undeveloped land parcels, collectively the Direct Investments, and interests in 121 Healthcare Properties, two ancillary businesses and related assets and liabilities held through two unconsolidated joint ventures, collectively the Unconsolidated Investments, in each case less the fair value of outstanding borrowings on the Healthcare Properties, or the Healthcare Borrowings, as well as one unconsolidated joint venture investment in a senior housing management company, or the Management Company Investment. The Direct Investments, Unconsolidated Investments and Management Company Investment are collectively referred to herein as the “Investments”.
The Board currently expects that NorthStar Healthcare’s next estimated value per share will be based upon its assets and liabilities as of June 30, 2024, and that such value will be included in a report filed with the SEC. NorthStar Healthcare intends to publish estimated values per share annually, although NorthStar Healthcare may determine to publish such revised values more frequently.
Valuation Methodology
To estimate the range of value of the Healthcare Properties, Kroll conducted an appraisal for the Healthcare Properties performed in accordance with the Uniform Standards of Professional Appraisal Practice of the Appraisal Foundation and with an effective valuation date of June 30, 2023. Kroll’s appraisals were certified by an appraiser licensed in the state in which the Healthcare Properties were located. In determining the value of each Healthcare Property, Kroll utilized all information that they deemed relevant, including information from NorthStar Healthcare’s management team, and its own data sources, including trends in capitalization rates, leasing rates and other economic factors. In conducting its appraisals of the Healthcare Properties, other than for the undeveloped land parcels and any excess land associated with the Healthcare Properties, Kroll utilized both the direct capitalization approach and discounted cash flow, or the DCF, approach to value Healthcare Properties.
In the direct capitalization approach, a market capitalization rate is applied to the estimated forward-year annual stabilized net operating income. In the DCF approach, a market terminal capitalization and discount rate are utilized to derive a value indication from the estimated forward multi-year annual net operating income. Kroll placed primary emphasis on the direct capitalization approach for the Healthcare Properties with stable and long-term income streams. The DCF was completed as a secondary, confirmatory approach. Kroll placed primary emphasis on the DCF approach for the Healthcare Properties that are not stabilized. Kroll believes the two methodologies are the most appropriate for valuing assets similar to those owned by NorthStar Healthcare. In selecting each capitalization rate range for the direct capitalization or DCF approach, Kroll took into account, among other factors, prevailing capitalization rates in the healthcare property sector, the property’s location, age and condition, the property’s operating trends and lease coverage ratios, if applicable, and other unique property factors. As applicable, Kroll adjusted the capitalized value range of each investment it appraised for any excess land, deferred maintenance or other anticipated property capital expenditures, lease-up costs and other adjustments as appropriate to estimate the “as-is” value range of each of the Healthcare Properties it appraised. For the Healthcare Properties with excess land and undeveloped land parcels, Kroll valued the land by utilizing a comparable sales analysis, where land sales or listings in the market were analyzed and a market-based value indication per square foot or acre was derived and applied to the land parcel to determine the parcel’s estimated market value.
After establishing an estimated value range for each Healthcare Property, Kroll then added or subtracted, as appropriate, the estimated fair value of Healthcare Borrowings after factoring in any adjustments for above- or below-market in-place financing, as deemed applicable. Kroll estimated the fair value range of the long-term liabilities by discounting the stream of expected interest and principal payments for each liability by an interest rate range that Kroll estimated a current market participant would require for instruments with similar collateral and duration assuming an orderly market environment, taking into account factors such as remaining loan term, loan-to-value ratio, collateral type, debt service coverage, security position and other factors deemed relevant. In the aggregate, the estimated market adjustment to our proportionate share of the outstanding principal balance of the Healthcare Borrowings totaled $96.9 million, which reduced the liabilities to fair value.
For both the Direct Investments where there is a minority joint venture partner and the Unconsolidated Investments, Kroll adjusted the values of the Healthcare Properties, net of Healthcare Borrowings, and any other balance sheet assets and liabilities, for NorthStar Healthcare’s allocable ownership interest.
The Management Company Investment is a property management venture that as of June 30, 2023 manages solely NorthStar Healthcare’s 32-property independent living portfolio, or the Winterfell Portfolio. To estimate the value of the Management Company Investment, Kroll reviewed the joint venture agreement, historical revenues and earnings before interest, taxes, depreciation and amortization, or EBITDA, for the Management Company Investment, historical and budgeted property operating revenues for the Winterfell Portfolio, the estimated property revenue utilized in the appraisal for the Winterfell Portfolio, and revenue and EBITDA valuation metrics associated with real estate management companies. Based on the above, Kroll determined an appropriate range of revenue and EBITDA multiples for the Management Company Investment to determine a value range for the Management Company Investment. Kroll then applied the terms of the joint venture agreement, including any distribution priorities, to its Management Company Investment value estimate to establish the value range of NorthStar Healthcare’s interest in the Management Company Investment. In addition, Kroll utilized a similar valuation approach to establish an estimated range of value for the Unconsolidated Ventures’ ancillary businesses.
The following summarizes the key assumptions that were used in the DCF, direct capitalization, and Revenue and EBITDA valuation multiple analyses to arrive at the value of the Direct Investments, Unconsolidated Investments and Management Company Investment:
| | | | | | | | | | | | | | | | | | | | |
| | Range | | Weighted Average(1) |
| | Minimum | | Maximum | | |
| | | | | | |
| Healthcare Properties | | | | | | |
| Discount Rate | | 7.50 | % | | 12.25 | % | | 8.95 | % |
| Terminal Capitalization Rate | | 6.25 | % | | 11.00 | % | | 7.51 | % |
| Direct Capitalization Rate | | 6.00 | % | | 10.75 | % | | 7.26 | % |
| | | | | | |
| Property Management & Ancillary Businesses | | | | | | |
| Revenue Valuation Multiple | | 1.10x | | 1.30x | | 1.20x |
| | | | | | |
| Healthcare Borrowings | | | | | | |
| Discount Rate | | 3.04 | % | | 8.17 | % | | 5.89 | % |
(1)Weighted averages are calculated using the applicable ownership percentage for each Healthcare Property and Healthcare Borrowing. Healthcare Properties’ property types for Direct Investments include independent living, assisted living & memory care facilities. In addition to the same property types owned by the Direct Investments, the Unconsolidated Investments also own skilled nursing facilities, which have been ascribed higher capitalization and discount rates relative to the other property types.
The fair value of NorthStar Healthcare’s cash, other tangible assets and liabilities was estimated by NorthStar Healthcare’s management team to approximate carrying value as of June 30, 2023 and Kroll relied upon and utilized such amounts in its determination of the estimated value range per share.
Estimated Value Per Share
Based on the above valuations and estimates and subject to the assumptions and limiting conditions contained in its report, Kroll estimated the net asset value range per fully diluted common share outstanding of NorthStar Healthcare as of June 30, 2023 from $2.30 to $2.98 per share. Based on its review of the Kroll report and the analysis of NorthStar Healthcare’s management team, the Audit Committee recommended and the Board approved an estimated value per share of $2.64 as of June 30, 2023.
The table below illustrates a breakdown of NorthStar Healthcare’s estimated value per share as of June 30, 2023 ($ in thousands, except per share values):
| | | | | | | | | | | | | | |
| | Estimated Value | | Estimated Value Per Share |
| Healthcare Properties, net Healthcare Borrowings, at ownership share | | $ | 387,184 | | | $ | 2.08 | |
| Cash and other tangible assets | | 124,711 | | | 0.67 | |
| Other liabilities | | (21,993) | | | (0.12) | |
| Estimated net asset value as of June 30, 2023 | | $ | 489,902 | | | $ | 2.64 | |
| Estimated enterprise value per share | | | | None assumed |
| | | | |
| Shares outstanding (in thousands) | | | | 185,712 | |
As previously described, the estimated value per share recommended by the Audit Committee and approved by the Board does not reflect NorthStar Healthcare’s “enterprise value,” which may be affected by:
•the characteristics of NorthStar Healthcare’s working capital, leverage and other financial structures where some buyers may ascribe different values;
•investments through joint ventures, where NorthStar Healthcare owns a non-controlling interest and may have limited decision making authority, as some buyers may pay less for these types of investments;
•disposition and other expenses that would be necessary to realize the value;
•NorthStar Healthcare’s general and administrative expenses, including the costs to retain its management team; and
•the potential difference in per share value if NorthStar Healthcare were to list its shares of common stock on a national securities exchange.
On November 9, 2023, Kroll delivered its valuation report to the Audit Committee. The Audit Committee was given an opportunity to confer with Kroll and NorthStar Healthcare’s management team regarding the methodologies and assumptions used therein, and determined to recommend to the Board the estimated value per share of NorthStar Healthcare’s common stock.
The Board is ultimately and solely responsible for the establishment of the estimated value per share of NorthStar Healthcare’s common stock. In arriving at its determination of the estimated value per share, the Board considered all information provided in light of its own familiarity with NorthStar Healthcare’s assets and unanimously approved the estimated value recommended by the Audit Committee.
Sensitivity Analysis
Changes to the key assumptions used to arrive at the estimated value per share, including the capitalization rates and discount rates used to value the Healthcare Properties and Healthcare Borrowings, would have a significant impact on the underlying value of NorthStar Healthcare’s assets. The following table presents the impact on the estimated value per share of NorthStar Healthcare’s common stock resulting from a 5.0% increase and decrease to both (1) the capitalization and discount rates used to value the Healthcare Properties and (2) the discount rates used to value the Healthcare Borrowings:
| | | | | | | | | | | | | | | | | |
| Sensitized Range of Value |
| Low | | Estimated Value | | High |
| Estimated Net Asset Value Per Share | $2.09 | | $2.64 | | $3.02 |
| | | | | |
| Healthcare Properties: | | | | | |
| Weighted Average Capitalization Rate | 7.62% | | 7.26% | | 6.90% |
| Weighted Average Discount Rate | 9.34% | | 8.95% | | 8.47% |
| | | | | |
| Healthcare Borrowings: | | | | | |
| Weighted Average Discount Rate | 5.60% | | 5.89% | | 6.19% |
The above sensitivity analysis differs from the methodology employed by Kroll to generate the range of estimated per share values in its report. The sensitivity analysis above assumes a 5.0% increase and decrease to the underlying valuation assumptions, which generally differs from the adjustments to the valuation assumptions employed by Kroll in its valuation report.
Limitations and Risks
As with any valuation methodology, the methodologies used to determine the estimated value per share are based upon a number of estimates and assumptions that may prove later to be inaccurate or incomplete. Further, different market participants using different assumptions and estimates could derive different estimated values.
Although the Board relied on estimated value ranges of NorthStar Healthcare’s assets and liabilities in establishing the estimated value per share, the estimated value per share may bear no relationship to NorthStar Healthcare’s book or asset value. In
addition, the estimated value per share may not represent the price at which the shares of NorthStar Healthcare’s common stock would trade on a national securities exchange, the amount realized in a sale, merger or liquidation of NorthStar Healthcare or the amount a stockholder would realize in a private sale of shares.
The estimated value of NorthStar Healthcare’s assets and liabilities is as of a specific date and such value is expected to fluctuate over time in response to future events, including but not limited to, the lasting effects of the COVID-19 pandemic, inflationary pressures on operating expenses, changes to commercial real estate values, particularly healthcare-related commercial real estate, developments related to individual assets, changes in market interest rates for commercial real estate debt and its impact on transaction executions, including, in particular, the current interest rate environment, changes in capitalization rates, rental and growth rates, changes in laws or regulations impacting the healthcare industry, demographic changes, returns on competing investments, changes in administrative expenses and other costs, the amount of distributions on NorthStar Healthcare’s common stock, repurchases of NorthStar Healthcare’s common stock, changes in the number of shares of NorthStar Healthcare’s common stock outstanding, local and national economic factors and the factors specified in Part I, Item 1A. of NorthStar Healthcare’s Annual Report on Form 10-K for the fiscal year ended December 31, 2022 and Part II, Item IA. of NorthStar Healthcare's Quarterly Report on Form 10-Q for the quarter ended September 30, 2023 under the heading "Risk Factors". There is no assurance that the methodologies used to establish the estimated value per share would be acceptable to the Financial Industry Regulatory Authority, Inc. or in compliance with guidelines pursuant to the Employee Retirement Income Security Act of 1974 with respect to their reporting requirements.
EXHIBIT INDEX
| | | | | | | | |
Exhibit
Number | | Description of Exhibit |
| 3.1 | | |
| 3.2 | | |
| 3.3 | | |
| 4.1 | |
| 10.1 | |
| | |
| | |
| | |
| | |
| | |
| | |
| | |
| | |
| | |
| | |
| | |
| | |
| | |
| | |
| | |
| | |
| | |
| 31.1* | | |
| 31.2** | | |
| 32.1** | | |
| 32.2* | | |
| 101.INS* | | XBRL Instance Document - the instance document does not appear in the Interactive Data File because its XBRL tags are embedded within the Inline XBRL document |
| 101.SCH* | | Inline XBRL Taxonomy Extension Schema Document |
| 101.CAL* | | Inline XBRL Taxonomy Extension Calculation Linkbase Document |
| 101.DEF* | | Inline XBRL Taxonomy Extension Definition Linkbase Document |
| 101.LAB* | | Inline XBRL Taxonomy Extension Label Linkbase Document |
| 101.PRE* | | Inline XBRL Taxonomy Extension Presentation Linkbase Document |
| 104 | | Cover Page Interactive Data File (formatted as Inline XBRL and contained in Exhibit 101) |
* Filed herewith
** Furnished herewith
^ Portions of this exhibit have been omitted pursuant to Item 601(b)(10)(iv) of Regulation S-K.
^^ Certain schedules and similar attachments have been omitted in reliance on Item 601(a)(5) of Regulation S-K. The Company will provide, on a supplemental basis, a copy of any omitted schedule or attachment to the SEC or its staff upon request.
SIGNATURES
Pursuant to the requirements of the Securities Exchange Act of 1934, the Registrant has duly caused this report to be signed on its behalf by the undersigned thereunto duly authorized.
| | | | | | | | | | | | | | |
| | NorthStar Healthcare Income, Inc.
|
| Date: | November 13, 2023May 9, 2024 | By: | /s/ KENDALL K. YOUNG |
| | | Name: | Kendall K. Young |
| | | Title: | Chief Executive Officer, President and Director |
| | | | |
| | By: | /s/ NICHOLAS R. BALZO |
| | | Name: | Nicholas R. Balzo |
| | | Title: | Chief Financial Officer and Treasurer |