UNITED STATES
SECURITIES AND EXCHANGE COMMISSION
Washington, D.C. 20549
|
| |
| ☒ | QUARTERLY REPORT PURSUANT TO SECTION 13 OR 15(d) OF THE SECURITIES EXCHANGE ACT OF 1934 |
ýQUARTERLY REPORT PURSUANT TO SECTION 13 OR 15(d) OF THE SECURITIES EXCHANGE ACT OF 1934
For the quarterly period endedSeptemberJune 30, 20172019
OR
oTRANSITION REPORT PURSUANT TO SECTION 13 OR 15(d) OF THE SECURITIES EXCHANGE ACT OF 1934 |
| |
| ☐ | TRANSITION REPORT PURSUANT TO SECTION 13 OR 15(d) OF THE SECURITIES EXCHANGE ACT OF 1934 |
For the transition period from to
Commission File Number: 001-35039
BankUnited, Inc.
(Exact name of registrant as specified in its charter)
|
| | |
| Delaware | | 27-0162450 |
(State or other jurisdiction of incorporation or organization) | | (I.R.S. Employer Identification No.) |
|
| | | |
| 14817 Oak Lane | Miami Lakes FL | FL | 33016 |
| (Address of principal executive offices) | | | (Zip Code) |
Registrant’s telephone number, including area code: (305) (305) 569-2000
Indicate by check mark whether the registrant (1) has filed all reports required to be filed by Section 13 or 15(d) of the Securities Exchange Act of 1934 during the preceding 12 months (or for such shorter period that the registrant was required to file such reports), and (2) has been subject to such filing requirements for the past 90 days. Yes ý No o
Indicate by check mark whether the registrant has submitted electronically and posted on its corporate Web site, if any, every Interactive Data File required to be submitted and posted pursuant to Rule 405 of Regulation S-T (§232.405 of this chapter) during the preceding 12 months (or for such shorter period that the registrant was required to submit and post such files). Yes ý No o
Indicate by check mark whether the registrant is a large accelerated filer, an accelerated filer, a non-accelerated filer, or a smaller reporting company. See the definitions of “large accelerated filer,” “accelerated filer” and “smaller reporting company” in Rule 12b-2 of the Exchange Act.
|
| | | |
Large accelerated filerý | ☒ | Accelerated filer | | Accelerated filer o
☐ |
Non-accelerated filero | ☐ | Smaller reporting companyo | ☐ |
| | | Emerging growth companyo | ☐ |
If an emerging growth company, indicate by check mark if the registrant has elected not to use the extended transition period for complying with any new or revised financial accounting standards provided pursuant to Section 13(a) of the Exchange Act o
Indicate by check mark whether the registrant is a shell company (as defined in Rule 12b-2 of the Exchange Act). Yes o☐ Noý ☒
Indicate the number of shares outstanding of each of the issuer’s classes of common stock, as of the latest practicable date.
|
| | | | |
| Class | | November 6, 2017Trading Symbol | | Name of Exchange on Which Registered |
| Common Stock, $0.01 Par Value | | 106,820,503BKU | | New York Stock Exchange |
The number of outstanding shares of the registrant common stock, $0.01 par value was 95,067,938 as of August 2, 2019.
BANKUNITED, INC.
Form 10-Q
For the Quarter Ended SeptemberJune 30, 20172019
TABLE OF CONTENTS
|
| | |
| | | Page |
| | | |
| | | |
| | | |
| PART I. | | |
| | | |
| ITEM 1. | | |
| | | |
| | | |
| | | |
| | | |
| | | |
| | | |
| | | |
| ITEM 2. | | |
| | | |
| ITEM 3. | | |
| | | |
| ITEM 4. | | |
| | | |
| PART II. | | |
| | | |
| ITEM 1. | | |
| | | |
| ITEM 1A. | | |
| | |
| ITEM 2. | | |
| | | |
| ITEM 6. | | |
| | | |
| |
| | | |
GLOSSARY OF DEFINED TERMS
The following acronyms and terms may be used throughout this Form 10-Q, including the consolidated financial statements and related notes.
|
| | |
| ACI | | Loans acquired with evidence of deterioration in credit quality since origination (Acquired Credit Impaired) |
| AFS | | Available for sale |
| ALCO | | Asset/Liability Committee |
| ALLL | | Allowance for loan and lease losses |
| AOCI | | Accumulated other comprehensive income |
ARM | | Adjustable rate mortgage |
| ASC | | Accounting Standards Codification |
| ASU | | Accounting Standards Update |
| BKU | | BankUnited, Inc. |
| BankUnited | | BankUnited, National Association |
| The Bank | | BankUnited, National Association |
| Bridge | | Bridge Funding Group, Inc. |
| Buyout loans | | FHA and VA insured mortgages from third party servicers who have exercised their right to purchase these loans out of GNMA securitizations |
| CET1 | | Common Equity Tier 1 capital |
| CECL | | Current expected credit lossesloss |
| CME | | Chicago Mercantile Exchange |
| CLOs | | Collateralized loan obligations |
| CMOs | | Collateralized mortgage obligations |
Commercial Shared-Loss Agreement | | A commercial and other loans shared-loss agreement entered into with the FDIC in connection with the FSB Acquisition |
| Covered assets | | Assets covered under the Loss Sharing Agreements |
| Covered loans | | Loans covered under the Loss Sharing Agreements |
| DSCR | | Debt Service Coverage Ratio |
| EPS | | Earnings per common share |
| EVE | | Economic value of equity |
| FASB | | Financial Accounting Standards Board |
| FDIA | | Federal Deposit Insurance Act |
| FDIC | | Federal Deposit Insurance Corporation |
FEMA | | Federal Emergency Management Agency |
| FHLB | | Federal Home Loan Bank |
| FHA loan | | Loan guaranteed by the Federal Housing Administration |
| FICO | | Fair Isaac Corporation (credit score) |
| FRB | | Federal Reserve Bank |
| FSB Acquisition | | Acquisition of substantially all of the assets and assumption of all of the non-brokered deposits and substantially all of the other liabilities of BankUnited, FSB from the FDIC on May 21, 2009 |
| FSB Loans | | 1-4 single family residential loans acquired in the FSB Acquisition that were formally covered by the Single Family Shared-Loss Agreement |
| GAAP | | U.S. generally accepted accounting principles |
GDPGNMA | | Gross Domestic ProductGovernment National Mortgage Association |
HAMPHTM | | Home Affordable Modification ProgramHeld to maturity |
| IPO | | Initial public offering |
| ISDA | | International Swaps and Derivatives Association |
| LIBOR | | London InterBank Offered Rate |
LIHTC | | Low Income Housing Tax Credits |
| Loss Sharing Agreements | | Two loss sharing agreements entered into with the FDIC in connection with the FSB Acquisition |
|
| | |
| LTV | | Loan-to-value |
| MBS | | Mortgage-backed securities |
MSA | | Metropolitan Statistical Area |
|
| | |
MSRs | | Mortgage servicing rights |
NewNon-Covered Loans | | Loans originated or purchased sinceother than those covered under the FSB AcquisitionLoss Sharing Agreements |
Non-ACIOCI | | Loans acquired without evidence of deterioration in credit quality since origination |
NSF | | Non-sufficient funds |
NYTLC | | New York City Taxi and Limousine CommissionOther comprehensive income |
| OCC | | Office of the Comptroller of the Currency |
| OREO | | Other real estate owned |
| OTTI | | Other-than-temporary impairment |
| PSU | | Performance Share Unit |
| Pinnacle | | Pinnacle Public Finance, Inc. |
| ROU Asset | | Right-of-use Asset |
| RSU | | Restricted Share Unit |
| SBA | | U.S. Small Business Administration |
| SBF | | Small Business Finance Unit |
| SEC | | Securities and Exchange Commission |
| Single Family Shared-Loss Agreement | | A single-family loan shared-loss agreement entered into with the FDIC in connection with the FSB Acquisition |
| SOFR | | Secured Overnight Financing Rate |
| TDR | | Troubled-debt restructuring |
| UPB | | Unpaid principal balance |
2014 PlanVA loan | | 2014 Omnibus Equity Incentive PlanLoan guaranteed by the U.S. Department of Veterans Affairs |
PART I - FINANCIAL INFORMATION
Item 1. Financial Statements and Supplementary Data
BANKUNITED, INC. AND SUBSIDIARIES
CONSOLIDATED BALANCE SHEETS - UNAUDITED
(In thousands, except share and per share data) | | | | September 30,
2017 | | December 31,
2016 | June 30,
2019 | | December 31,
2018 |
| ASSETS | |
| | |
| |
| | |
|
| Cash and due from banks: | |
| | |
| |
| | |
|
| Non-interest bearing | $ | 34,883 |
| | $ | 40,260 |
| $ | 10,152 |
| | $ | 9,392 |
|
| Interest bearing | 3,714 |
| | 35,413 |
| 432,681 |
| | 372,681 |
|
| Interest bearing deposits at Federal Reserve Bank | 254,004 |
| | 372,640 |
| |
| Cash and cash equivalents | 292,601 |
| | 448,313 |
| 442,833 |
| | 382,073 |
|
| Investment securities available for sale, at fair value | 6,893,472 |
| | 6,073,584 |
| |
| Investment securities held to maturity | 10,000 |
| | 10,000 |
| |
| Investment securities (including securities recorded at fair value of $8,128,708 and $8,156,878) | | 8,138,708 |
| | 8,166,878 |
|
| Non-marketable equity securities | 270,239 |
| | 284,272 |
| 289,789 |
| | 267,052 |
|
| Loans held for sale | 31,507 |
| | 41,198 |
| 224,759 |
| | 36,992 |
|
| Loans (including covered loans of $537,976 and $614,042) | 20,610,430 |
| | 19,395,394 |
| |
| Loans (including covered loans of $201,376 at December 31, 2018) | | 22,591,849 |
| | 21,977,008 |
|
| Allowance for loan and lease losses | (158,573 | ) | | (152,953 | ) | (112,141 | ) | | (109,931 | ) |
| Loans, net | 20,451,857 |
| | 19,242,441 |
| 22,479,708 |
| | 21,867,077 |
|
| FDIC indemnification asset | 349,617 |
| | 515,933 |
| |
| Bank owned life insurance | 248,876 |
| | 239,736 |
| 274,603 |
| | 263,340 |
|
| Equipment under operating lease, net | 588,207 |
| | 539,914 |
| 707,680 |
| | 702,354 |
|
| Deferred tax asset, net | 23,910 |
| | 62,940 |
| |
| Goodwill and other intangible assets | 77,857 |
| | 78,047 |
| 77,696 |
| | 77,718 |
|
| Other assets | 316,688 |
| | 343,773 |
| 456,489 |
| | 400,842 |
|
| Total assets | $ | 29,554,831 |
| | $ | 27,880,151 |
| $ | 33,092,265 |
| | $ | 32,164,326 |
|
| | | | | | | |
| LIABILITIES AND STOCKHOLDERS’ EQUITY | |
| | |
| |
| | |
|
| Liabilities: | |
| | |
| |
| | |
|
| Demand deposits: | |
| | |
| |
| | |
|
| Non-interest bearing | $ | 3,096,492 |
| | $ | 2,960,591 |
| $ | 4,099,636 |
| | $ | 3,621,254 |
|
| Interest bearing | 1,828,809 |
| | 1,523,064 |
| 1,831,441 |
| | 1,771,465 |
|
| Savings and money market | 9,964,242 |
| | 9,251,593 |
| 10,910,607 |
| | 11,261,746 |
|
| Time | 6,333,701 |
| | 5,755,642 |
| 7,080,716 |
| | 6,819,758 |
|
| Total deposits | 21,223,244 |
| | 19,490,890 |
| 23,922,400 |
| | 23,474,223 |
|
| Federal funds purchased | | 99,000 |
| | 175,000 |
|
| Federal Home Loan Bank advances | 4,871,000 |
| | 5,239,348 |
| 5,331,000 |
| | 4,796,000 |
|
| Notes and other borrowings | 402,828 |
| | 402,809 |
| 403,661 |
| | 402,749 |
|
| Other liabilities | 434,270 |
| | 328,675 |
| 468,294 |
| | 392,521 |
|
| Total liabilities | 26,931,342 |
| | 25,461,722 |
| 30,224,355 |
| | 29,240,493 |
|
| | | | | | | |
| Commitments and contingencies |
|
| |
|
|
|
| |
|
|
| | | | | | | |
| Stockholders' equity: | |
| | |
| |
| | |
|
| Common stock, par value $0.01 per share, 400,000,000 shares authorized; 106,821,902 and 104,166,945 shares issued and outstanding | 1,068 |
| | 1,042 |
| |
| Common stock, par value $0.01 per share, 400,000,000 shares authorized; 95,315,633 and 99,141,374 shares issued and outstanding | | 953 |
| | 991 |
|
| Paid-in capital | 1,492,790 |
| | 1,426,459 |
| 1,080,966 |
| | 1,220,147 |
|
| Retained earnings | 1,077,042 |
| | 949,681 |
| 1,803,360 |
| | 1,697,822 |
|
| Accumulated other comprehensive income | 52,589 |
| | 41,247 |
| |
| Accumulated other comprehensive income (loss) | | (17,369 | ) | | 4,873 |
|
| Total stockholders' equity | 2,623,489 |
| | 2,418,429 |
| 2,867,910 |
| | 2,923,833 |
|
| Total liabilities and stockholders' equity | $ | 29,554,831 |
| | $ | 27,880,151 |
| $ | 33,092,265 |
| | $ | 32,164,326 |
|
The accompanying notes are an integral part of these consolidated financial statements.
1
BANKUNITED, INC. AND SUBSIDIARIES
CONSOLIDATED STATEMENTS OF INCOME - UNAUDITED
(In thousands, except per share data)
| | | | Three Months Ended September 30, | | Nine Months Ended September 30, | Three Months Ended June 30, | | Six Months Ended June 30, |
| | 2017 | | 2016 | | 2017 | | 2016 | 2019 | | 2018 | | 2019 | | 2018 |
| Interest income: | | | | | |
| | |
| | | | | |
| | |
|
| Loans | $ | 253,815 |
| | $ | 227,233 |
| | $ | 739,586 |
| | $ | 662,439 |
| $ | 249,364 |
| | $ | 288,264 |
| | $ | 489,996 |
| | $ | 562,264 |
|
| Investment securities | 51,851 |
| | 39,712 |
| | 141,624 |
| | 109,963 |
| 72,796 |
| | 56,092 |
| | 149,141 |
| | 106,077 |
|
| Other | 3,777 |
| | 3,036 |
| | 10,606 |
| | 8,850 |
| 5,069 |
| | 4,499 |
| | 9,921 |
| | 8,290 |
|
| Total interest income | 309,443 |
| | 269,981 |
| | 891,816 |
| | 781,252 |
| 327,229 |
| | 348,855 |
| | 649,058 |
| | 676,631 |
|
| Interest expense: | | | | | | | | | | | | | | |
| Deposits | 45,919 |
| | 30,968 |
| | 120,161 |
| | 86,427 |
| 99,987 |
| | 65,298 |
| | 197,408 |
| | 121,659 |
|
| Borrowings | 22,260 |
| | 17,278 |
| | 60,209 |
| | 51,939 |
| 36,359 |
| | 28,294 |
| | 69,866 |
| | 51,900 |
|
| Total interest expense | 68,179 |
| | 48,246 |
| | 180,370 |
| | 138,366 |
| 136,346 |
| | 93,592 |
| | 267,274 |
| | 173,559 |
|
| Net interest income before provision for loan losses | 241,264 |
| | 221,735 |
| | 711,446 |
| | 642,886 |
| 190,883 |
| | 255,263 |
| | 381,784 |
| | 503,072 |
|
| Provision for (recovery of) loan losses (including $261, $(445), $2,693 and $(1,119) for covered loans) | 37,854 |
| | 24,408 |
| | 63,573 |
| | 42,449 |
| |
| Provision for (recovery of) loan losses (including $294 and $567 for covered loans for the three and six months ended June 30, 2018) | | (2,747 | ) | | 8,995 |
| | 7,534 |
| | 12,142 |
|
| Net interest income after provision for loan losses | 203,410 |
| | 197,327 |
| | 647,873 |
| | 600,437 |
| 193,630 |
| | 246,268 |
| | 374,250 |
| | 490,930 |
|
| Non-interest income: | | | | | | | | | | | | | | |
| Income from resolution of covered assets, net | 6,400 |
| | 8,883 |
| | 22,066 |
| | 26,426 |
| — |
| | 4,238 |
| | — |
| | 7,555 |
|
| Net gain (loss) on FDIC indemnification | (4,838 | ) | | 993 |
| | (14,174 | ) | | (9,410 | ) | |
| Service charges and fees | 4,938 |
| | 5,171 |
| | 15,554 |
| | 14,529 |
| |
| Gain (loss) on sale of loans, net (including $0, $(10,033), $(1,582) and $(14,895) related to covered loans) | 2,447 |
| | (7,947 | ) | | 6,601 |
| | (7,360 | ) | |
| Gain on investment securities available for sale, net | 26,931 |
| | 3,008 |
| | 29,194 |
| | 10,065 |
| |
| Net loss on FDIC indemnification | | — |
| | (1,400 | ) | | — |
| | (5,015 | ) |
| Deposit service charges and fees | | 4,290 |
| | 3,510 |
| | 8,120 |
| | 6,997 |
|
| Gain (loss) on sale of loans, net (including $(2,002) and $(298) related to covered loans for the three and six months ended June 30, 2018) | | 2,121 |
| | 768 |
| | 5,057 |
| | 4,269 |
|
| Gain on investment securities, net | | 4,116 |
| | 2,142 |
| | 9,901 |
| | 2,506 |
|
| Lease financing | 13,287 |
| | 11,188 |
| | 40,067 |
| | 32,762 |
| 17,005 |
| | 17,492 |
| | 34,191 |
| | 31,594 |
|
| Other non-interest income | 4,161 |
| | 3,779 |
| | 12,055 |
| | 10,118 |
| 7,805 |
| | 5,223 |
| | 14,323 |
| | 12,053 |
|
| Total non-interest income | 53,326 |
| | 25,075 |
| | 111,363 |
| | 77,130 |
| 35,337 |
| | 31,973 |
| | 71,592 |
| | 59,959 |
|
| Non-interest expense: | | | | | | | | | | | | | | |
| Employee compensation and benefits | 58,327 |
| | 55,162 |
| | 178,386 |
| | 166,374 |
| 57,251 |
| | 65,537 |
| | 122,484 |
| | 132,573 |
|
| Occupancy and equipment | 18,829 |
| | 18,867 |
| | 56,689 |
| | 57,199 |
| 13,991 |
| | 14,241 |
| | 27,157 |
| | 28,544 |
|
| Amortization of FDIC indemnification asset | 45,225 |
| | 38,957 |
| | 135,351 |
| | 116,711 |
| — |
| | 44,250 |
| | — |
| | 84,597 |
|
| Deposit insurance expense | 5,764 |
| | 4,943 |
| | 16,827 |
| | 12,866 |
| 5,027 |
| | 4,623 |
| | 9,068 |
| | 9,435 |
|
| Professional fees | 2,748 |
| | 3,884 |
| | 12,573 |
| | 10,119 |
| 6,937 |
| | 2,657 |
| | 14,808 |
| | 5,532 |
|
| Telecommunications and data processing | 3,452 |
| | 3,746 |
| | 10,481 |
| | 10,800 |
| |
| Technology and telecommunications | | 12,013 |
| | 8,644 |
| | 23,181 |
| | 16,858 |
|
| Depreciation of equipment under operating lease | 8,905 |
| | 6,855 |
| | 25,655 |
| | 20,004 |
| 11,489 |
| | 9,476 |
| | 23,301 |
| | 18,792 |
|
| Other non-interest expense | 13,455 |
| | 15,590 |
| | 37,735 |
| | 40,151 |
| 13,377 |
| | 11,819 |
| | 26,776 |
| | 26,733 |
|
| Total non-interest expense | 156,705 |
| | 148,004 |
| | 473,697 |
| | 434,224 |
| 120,085 |
| | 161,247 |
| | 246,775 |
| | 323,064 |
|
| Income before income taxes | 100,031 |
| | 74,398 |
| | 285,539 |
| | 243,343 |
| 108,882 |
| | 116,994 |
| | 199,067 |
| | 227,825 |
|
| Provision for income taxes | 32,252 |
| | 23,550 |
| | 89,060 |
| | 80,896 |
| 27,431 |
| | 27,094 |
| | 51,644 |
| | 52,690 |
|
| Net income | $ | 67,779 |
| | $ | 50,848 |
| | $ | 196,479 |
| | $ | 162,447 |
| $ | 81,451 |
| | $ | 89,900 |
| | $ | 147,423 |
| | $ | 175,135 |
|
| Earnings per common share, basic (see Note 2) | $ | 0.62 |
| | $ | 0.47 |
| | $ | 1.79 |
| | $ | 1.52 |
| |
| Earnings per common share, diluted (see Note 2) | $ | 0.62 |
| | $ | 0.47 |
| | $ | 1.79 |
| | $ | 1.50 |
| |
| Cash dividends declared per common share | $ | 0.21 |
| | $ | 0.21 |
| | $ | 0.63 |
| | $ | 0.63 |
| |
| Earnings per common share, basic | | $ | 0.81 |
| | $ | 0.82 |
| | $ | 1.46 |
| | $ | 1.60 |
|
| Earnings per common share, diluted | | $ | 0.81 |
| | $ | 0.82 |
| | $ | 1.45 |
| | $ | 1.59 |
|
The accompanying notes are an integral part of these consolidated financial statements.
2
BANKUNITED, INC. AND SUBSIDIARIES
CONSOLIDATED STATEMENTS OF COMPREHENSIVE INCOME - UNAUDITED
(In thousands)
| | | | Three Months Ended September 30, | | Nine Months Ended September 30, | Three Months Ended June 30, | | Six Months Ended June 30, |
| | 2017 | | 2016 | | 2017 | | 2016 | 2019 | | 2018 | | 2019 | | 2018 |
| | | | | | | | | | | | | | | |
| Net income | $ | 67,779 |
| | $ | 50,848 |
| | $ | 196,479 |
| | $ | 162,447 |
| $ | 81,451 |
| | $ | 89,900 |
| | $ | 147,423 |
| | $ | 175,135 |
|
| Other comprehensive income (loss), net of tax: | | |
|
| | | | |
| |
| Other comprehensive loss, net of tax: | | | |
|
| | | | |
|
| Unrealized gains on investment securities available for sale: | | |
|
| | | | |
| | |
|
| | | | |
|
| Net unrealized holding gain arising during the period | 8,557 |
| | 3,216 |
| | 32,826 |
| | 53,490 |
| |
| Net unrealized holding gain (loss) arising during the period | | 23,326 |
| | (13,106 | ) | | 44,943 |
| | (40,430 | ) |
| Reclassification adjustment for net securities gains realized in income | (16,293 | ) | | (1,820 | ) | | (17,662 | ) | | (6,090 | ) | (2,877 | ) | | (1,875 | ) | | (6,050 | ) | | (2,592 | ) |
| Net change in unrealized gains on securities available for sale | (7,736 | ) | | 1,396 |
| | 15,164 |
| | 47,400 |
| |
| Net change in unrealized gain on securities available for sale | | 20,449 |
| | (14,981 | ) | | 38,893 |
| | (43,022 | ) |
| Unrealized losses on derivative instruments: | | |
|
| | | | |
| | |
|
| | | | |
|
| Net unrealized holding gain (loss) arising during the period | (170 | ) | | 5,055 |
| | (8,337 | ) | | (34,948 | ) | (37,218 | ) | | 9,846 |
| | (57,893 | ) | | 29,639 |
|
| Reclassification adjustment for net losses realized in income | 1,210 |
| | 2,264 |
| | 4,515 |
| | 7,896 |
| |
| Net change in unrealized losses on derivative instruments | 1,040 |
| | 7,319 |
| | (3,822 | ) | | (27,052 | ) | |
| Other comprehensive income (loss) | (6,696 | ) | | 8,715 |
| | 11,342 |
| | 20,348 |
| |
| Reclassification adjustment for net (gains) losses realized in income | | (1,241 | ) | | (535 | ) | | (3,242 | ) | | 155 |
|
| Net change in unrealized loss on derivative instruments | | (38,459 | ) | | 9,311 |
| | (61,135 | ) | | 29,794 |
|
| Other comprehensive loss | | (18,010 | ) | | (5,670 | ) | | (22,242 | ) | | (13,228 | ) |
| Comprehensive income | $ | 61,083 |
| | $ | 59,563 |
| | $ | 207,821 |
| | $ | 182,795 |
| $ | 63,441 |
| | $ | 84,230 |
| | $ | 125,181 |
| | $ | 161,907 |
|
The accompanying notes are an integral part of these consolidated financial statements.
3
BANKUNITED, INC. AND SUBSIDIARIES
CONSOLIDATED STATEMENTS OF CASH FLOWS - UNAUDITED
(In thousands)
| | | | Nine Months Ended September 30, | Six Months Ended June 30, |
| | 2017 | | 2016 | 2019 | | 2018 |
| Cash flows from operating activities: | |
| | |
| |
| | |
|
| Net income | $ | 196,479 |
| | $ | 162,447 |
| $ | 147,423 |
| | $ | 175,135 |
|
| Adjustments to reconcile net income to net cash provided by operating activities: | | | | | | |
| Amortization and accretion, net | (71,111 | ) | | (90,360 | ) | (22,452 | ) | | (69,157 | ) |
| Provision for loan losses | 63,573 |
| | 42,449 |
| 7,534 |
| | 12,142 |
|
| Income from resolution of covered assets, net | (22,066 | ) | | (26,426 | ) | — |
| | (7,555 | ) |
| Net loss on FDIC indemnification | 14,174 |
| | 9,410 |
| — |
| | 5,015 |
|
| (Gain) loss on sale of loans, net | (6,601 | ) | | 7,360 |
| |
| Increase in cash surrender value of bank owned life insurance | (4,647 | ) | | (2,973 | ) | |
| Gain on investment securities available for sale, net | (29,194 | ) | | (10,065 | ) | |
| Gain on sale of loans, net | | (5,057 | ) | | (4,269 | ) |
| Gain on investment securities, net | | (9,901 | ) | | (2,506 | ) |
| Equity based compensation | 14,337 |
| | 13,418 |
| 11,251 |
| | 12,272 |
|
| Depreciation and amortization | 45,204 |
| | 38,971 |
| 35,555 |
| | 31,391 |
|
| Deferred income taxes | 31,625 |
| | 33,958 |
| 10,813 |
| | 24,074 |
|
| Proceeds from sale of loans held for sale | 126,778 |
| | 121,968 |
| 209,854 |
| | 86,118 |
|
| Loans originated for sale, net of repayments | (109,588 | ) | | (108,075 | ) | (51,024 | ) | | (73,633 | ) |
| Other: | | | | | | |
| (Increase) decrease in other assets | 15,743 |
| | (9,502 | ) | |
| Decrease in other assets | | 31,897 |
| | 15,625 |
|
| Increase (decrease) in other liabilities | (33,546 | ) | | 44,708 |
| (128,097 | ) | | 25,242 |
|
| Net cash provided by operating activities | 231,160 |
| | 227,288 |
| 237,796 |
| | 229,894 |
|
| | | | | | | |
| Cash flows from investing activities: | |
| | |
| |
| | |
|
| Purchase of investment securities available for sale | (2,355,872 | ) | | (2,224,174 | ) | |
| Proceeds from repayments and calls of investment securities available for sale | 861,618 |
| | 457,610 |
| |
| Proceeds from sale of investment securities available for sale | 827,353 |
| | 753,756 |
| |
| Purchase of investment securities | | (2,160,715 | ) | | (1,730,173 | ) |
| Proceeds from repayments and calls of investment securities | | 647,214 |
| | 691,220 |
|
| Proceeds from sale of investment securities | | 1,626,250 |
| | 836,317 |
|
| Purchase of non-marketable equity securities | (185,718 | ) | | (178,813 | ) | (196,137 | ) | | (166,813 | ) |
| Proceeds from redemption of non-marketable equity securities | 199,751 |
| | 115,388 |
| 173,400 |
| | 154,063 |
|
| Purchases of loans | (949,294 | ) | | (936,882 | ) | (894,235 | ) | | (604,278 | ) |
| Loan originations, repayments and resolutions, net | (192,075 | ) | | (1,389,435 | ) | (51,014 | ) | | 152,848 |
|
| Proceeds from sale of loans, net | 98,404 |
| | 120,537 |
| 9,560 |
| | 115,560 |
|
| Decrease in FDIC indemnification asset for claims filed | 16,768 |
| | 30,829 |
| |
| Acquisition of equipment under operating lease, net | (73,948 | ) | | (52,399 | ) | |
| Proceeds from sale of equipment under operating lease | | 8,986 |
| | 49,892 |
|
| Acquisition of equipment under operating lease | | (37,122 | ) | | (56,132 | ) |
| Other investing activities | (31,718 | ) | | (19,577 | ) | (24,950 | ) | | (16,404 | ) |
| Net cash used in investing activities | (1,784,731 | ) | | (3,323,160 | ) | (898,763 | ) | | (573,900 | ) |
| | | | (Continued) |
| | | (Continued) |
|
BANKUNITED, INC. AND SUBSIDIARIES
CONSOLIDATED STATEMENTS OF CASH FLOWS - UNAUDITED (Continued)
(In thousands)
| | | | Nine Months Ended September 30, | Six Months Ended June 30, |
| | 2017 | | 2016 | 2019 | | 2018 |
| Cash flows from financing activities: | |
| | |
| |
| | |
|
| Net increase in deposits | 1,732,354 |
| | 1,897,808 |
| 448,177 |
| | 299,471 |
|
| Net decrease in federal funds purchased | | (76,000 | ) | | — |
|
| Additions to Federal Home Loan Bank advances | 3,921,000 |
| | 3,360,000 |
| 2,456,000 |
| | 2,201,000 |
|
| Repayments of Federal Home Loan Bank advances | (4,290,000 | ) | | (2,150,000 | ) | (1,921,000 | ) | | (1,901,000 | ) |
| Dividends paid | (68,583 | ) | | (67,342 | ) | (42,937 | ) | | (45,996 | ) |
| Exercise of stock options | 61,519 |
| | 222 |
| |
| Repurchase of common stock | | (142,065 | ) | | (54,399 | ) |
| Other financing activities | 41,569 |
| | 49,638 |
| (448 | ) | | 29,604 |
|
| Net cash provided by financing activities | 1,397,859 |
| | 3,090,326 |
| 721,727 |
| | 528,680 |
|
| Net increase (decrease) in cash and cash equivalents | (155,712 | ) | | (5,546 | ) | |
| Net increase in cash and cash equivalents | | 60,760 |
| | 184,674 |
|
| Cash and cash equivalents, beginning of period | 448,313 |
| | 267,500 |
| 382,073 |
| | 194,582 |
|
| Cash and cash equivalents, end of period | $ | 292,601 |
| | $ | 261,954 |
| $ | 442,833 |
| | $ | 379,256 |
|
| | | | | | | |
| Supplemental disclosure of cash flow information: | | | | | | |
| Interest paid | $ | 169,759 |
| | $ | 132,398 |
| $ | 258,561 |
| | $ | 171,379 |
|
| Income taxes paid, net | $ | 46,320 |
| | $ | 8,168 |
| |
| Income taxes (refunded) paid, net | | $ | (4,350 | ) | | $ | 18,677 |
|
| | | | | | | |
| Supplemental schedule of non-cash investing and financing activities: | | | | | | |
| Transfers from loans to other real estate owned and other repossessed assets | $ | 6,738 |
| | $ | 11,679 |
| $ | 2,817 |
| | $ | 7,574 |
|
| Transfers from loans to loans held for sale | | $ | 342,310 |
| | $ | 22,094 |
|
| Dividends declared, not paid | $ | 23,045 |
| | $ | 22,482 |
| $ | 20,621 |
| | $ | 22,916 |
|
| Unsettled purchases of investment securities available for sale | $ | 107,500 |
| | $ | — |
| |
| Unsettled purchases of investment securities | | $ | 21,396 |
| | $ | 272,500 |
|
The accompanying notes are an integral part of these consolidated financial statements.
5
BANKUNITED, INC. AND SUBSIDIARIES
CONSOLIDATED STATEMENTS OF STOCKHOLDERS’ EQUITY - UNAUDITED
(In thousands, except share data)
|
| | | | | | | | | | | | | | | | | | | | | | |
| | Common Shares Outstanding | | Common Stock | | Paid-in Capital | | Retained Earnings | | Accumulated Other Comprehensive Income (Loss) | | Total Stockholders’ Equity |
| Balance at March 31, 2019 | 98,404,303 |
| | $ | 984 |
| | $ | 1,179,235 |
| | $ | 1,742,530 |
| | $ | 641 |
| | $ | 2,923,390 |
|
| Comprehensive income | — |
| | — |
| | — |
| | 81,451 |
| | (18,010 | ) | | 63,441 |
|
| Dividends ($0.21 per common share) | — |
| | — |
| | — |
| | (20,621 | ) | | — |
| | (20,621 | ) |
| Equity based compensation | 18,383 |
| | — |
| | 3,967 |
| | — |
| | — |
| | 3,967 |
|
| Forfeiture of unvested shares | (95,061 | ) | | (1 | ) | | (175 | ) | | — |
| | — |
| | (176 | ) |
| Repurchase of common stock | (3,011,992 | ) | | (30 | ) | | (102,061 | ) | | — |
| | — |
| | (102,091 | ) |
| Balance at June 30, 2019 | 95,315,633 |
| | $ | 953 |
| | $ | 1,080,966 |
| | $ | 1,803,360 |
| | $ | (17,369 | ) | | $ | 2,867,910 |
|
| | | | | | | | | | | | |
| Balance at March 31, 2018 | 106,160,751 |
| | $ | 1,061 |
| | $ | 1,450,107 |
| | $ | 1,525,174 |
| | $ | 56,330 |
| | $ | 3,032,672 |
|
| Comprehensive income | — |
| | — |
| | — |
| | 89,900 |
| | (5,670 | ) | | 84,230 |
|
| Dividends ($0.21 per common share) | — |
| | — |
| | — |
| | (22,917 | ) | | — |
| | (22,917 | ) |
| Equity based compensation | 14,380 |
| | — |
| | 4,958 |
| | — |
| | — |
| | 4,958 |
|
| Forfeiture of unvested shares and shares surrendered for tax withholding obligations | (40,186 | ) | | — |
| | (378 | ) | | — |
| | — |
| | (378 | ) |
| Exercise of stock options | 251,189 |
| | 2 |
| | 6,633 |
| | — |
| | — |
| | 6,635 |
|
| Repurchase of common stock | (145,018 | ) | | (1 | ) | | (5,766 | ) | | — |
| | — |
| | (5,767 | ) |
| Balance at June 30, 2018 | 106,241,116 |
| | $ | 1,062 |
| | $ | 1,455,554 |
| | $ | 1,592,157 |
| | $ | 50,660 |
| | $ | 3,099,433 |
|
| | | | Common Shares Outstanding | | Common Stock | | Paid-in Capital | | Retained Earnings | | Accumulated Other Comprehensive Income | | Total Stockholders’ Equity | Common Shares Outstanding | | Common Stock | | Paid-in Capital | | Retained Earnings | | Accumulated Other Comprehensive Income (Loss) | | Total Stockholders’ Equity |
| Balance at December 31, 2016 | 104,166,945 |
| | $ | 1,042 |
| | $ | 1,426,459 |
| | $ | 949,681 |
| | $ | 41,247 |
| | $ | 2,418,429 |
| |
| Balance at December 31, 2018 | | 99,141,374 |
| | $ | 991 |
| | $ | 1,220,147 |
| | $ | 1,697,822 |
| | $ | 4,873 |
| | $ | 2,923,833 |
|
| Comprehensive income | — |
| | — |
| | — |
| | 196,479 |
| | 11,342 |
| | 207,821 |
| — |
| | — |
| | — |
| | 147,423 |
| | (22,242 | ) | | 125,181 |
|
| Dividends | — |
| | — |
| | — |
| | (69,118 | ) | | — |
| | (69,118 | ) | |
| Dividends ($0.42 per common share) | | — |
| | — |
| | — |
| | (41,885 | ) | | — |
| | (41,885 | ) |
| Equity based compensation | 618,306 |
| | 6 |
| | 12,103 |
| | — |
| | — |
| | 12,109 |
| 582,353 |
| | 6 |
| | 9,050 |
| | — |
| | — |
| | 9,056 |
|
| Forfeiture of unvested shares and shares surrendered for tax withholding obligations | (267,457 | ) | | (3 | ) | | (7,268 | ) | | — |
| | — |
| | (7,271 | ) | (286,927 | ) | | (3 | ) | | (6,251 | ) | | — |
| | — |
| | (6,254 | ) |
| Exercise of stock options | 2,304,108 |
| | 23 |
| | 61,496 |
| | — |
| | — |
| | 61,519 |
| 3,910 |
| | — |
| | 44 |
| | — |
| | — |
| | 44 |
|
| Balance at September 30, 2017 | 106,821,902 |
| | $ | 1,068 |
| | $ | 1,492,790 |
| | $ | 1,077,042 |
| | $ | 52,589 |
| | $ | 2,623,489 |
| |
| Repurchase of common stock | | (4,125,077 | ) | | (41 | ) | | (142,024 | ) | | — |
| | — |
| | (142,065 | ) |
| Balance at June 30, 2019 | | 95,315,633 |
| | $ | 953 |
| | $ | 1,080,966 |
| | $ | 1,803,360 |
| | $ | (17,369 | ) | | $ | 2,867,910 |
|
| | | | | | | | | | | | | | | | | | | | | | | |
| Balance at December 31, 2015 | 103,626,255 |
| | $ | 1,036 |
| | $ | 1,406,786 |
| | $ | 813,894 |
| | $ | 22,182 |
| | $ | 2,243,898 |
| |
| Balance at December 31, 2017 | | 106,848,185 |
| | $ | 1,068 |
| | $ | 1,498,227 |
| | $ | 1,471,781 |
| | $ | 54,986 |
| | $ | 3,026,062 |
|
| Cumulative effect of adoption of new accounting standards | | — |
| | — |
| | — |
| | (8,902 | ) | | 8,902 |
| | — |
|
| Comprehensive income | — |
| | — |
| | — |
| | 162,447 |
| | 20,348 |
| | 182,795 |
| — |
| | — |
| | — |
| | 175,135 |
| | (13,228 | ) | | 161,907 |
|
| Dividends | — |
| | — |
| | — |
| | (67,444 | ) | | — |
| | (67,444 | ) | |
| Dividends ($0.42 per common share) | | — |
| | — |
| | — |
| | (45,857 | ) | | — |
| | (45,857 | ) |
| Equity based compensation | 644,888 |
| | 6 |
| | 13,250 |
| | — |
| | — |
| | 13,256 |
| 654,420 |
| | 6 |
| | 10,336 |
| | — |
| | — |
| | 10,342 |
|
| Forfeiture of unvested shares and shares surrendered for tax withholding obligations | (139,718 | ) | | (1 | ) | | (483 | ) | | — |
| | — |
| | (484 | ) | (207,720 | ) | | (2 | ) | | (6,347 | ) | | — |
| | — |
| | (6,349 | ) |
| Exercise of stock options | 10,000 |
| | — |
| | 222 |
| | — |
| | — |
| | 222 |
| 291,689 |
| | 3 |
| | 7,724 |
| | — |
| | — |
| | 7,727 |
|
| Tax benefits from dividend equivalents and equity based compensation | — |
| | — |
| | 847 |
| | — |
| | — |
| | 847 |
| |
| Balance at September 30, 2016 | 104,141,425 |
| | $ | 1,041 |
| | $ | 1,420,622 |
| | $ | 908,897 |
| | $ | 42,530 |
| | $ | 2,373,090 |
| |
| Repurchase of common stock | | (1,345,458 | ) | | (13 | ) | | (54,386 | ) | | — |
| | — |
| | (54,399 | ) |
| Balance at June 30, 2018 | | 106,241,116 |
| | $ | 1,062 |
| | $ | 1,455,554 |
| | $ | 1,592,157 |
| | $ | 50,660 |
| | $ | 3,099,433 |
|
The accompanying notes are an integral part of these consolidated financial statements.
6
BANKUNITED, INC. AND SUBSIDIARIES
NOTES TO CONSOLIDATED FINANCIAL STATEMENTS - UNAUDITED
SeptemberJune 30, 20172019
Note 1 Basis of Presentation and Summary of Significant Accounting Policies
BankUnited, Inc. is a national bank holding company with one wholly-owned subsidiary, BankUnited, collectively, the Company. BankUnited, a national banking association headquartered in Miami Lakes, Florida, provides a full range of banking and related services to individual and corporate customers through 9080 banking centers located in 1514 Florida counties and 65 banking centers located in the New York metropolitan area at SeptemberJune 30, 2017.2019. The Bank also offers certain commercial lending and deposit products through national platforms.
In connection with the FSB Acquisition, BankUnited entered into two loss sharing agreements with the FDIC. The Loss Sharing Agreements consist of the Single Family Shared-Loss Agreement and the Commercial Shared-Loss Agreement. Assets covered by the Loss Sharing Agreements are referred to as covered assets or, in certain cases, covered loans. The Single Family Shared-Loss Agreement provides for FDIC loss sharing and the Bank’s reimbursement for recoveries to the FDIC through May 21, 2019 for single family residential loans and OREO. Loss sharing under the Commercial Shared-Loss Agreement terminated on May 21, 2014. The Commercial Shared-Loss Agreement continued to provide for the Bank’s reimbursement of recoveries to the FDIC through June 30, 2017 for all other covered assets, including commercial real estate, commercial and industrial and consumer loans, certain investment securities and commercial OREO. Pursuant to the terms of the Loss Sharing Agreements, the covered assets are subject to a stated loss threshold whereby the FDIC will reimburse BankUnited for 80% of losses related to the covered assets up to $4.0 billion and 95% of losses in excess of this amount, beginning with the first dollar of loss incurred.
The accompanying unaudited consolidated financial statements have been prepared in accordance with generally accepted accounting principles for interim financial information and the instructions to Form 10-Q and Article 10 of Regulation S-X of the SEC. Accordingly, theythese do not include all of the information and footnotes required for a fair presentation of financial position, results of operations and cash flows in conformity with GAAP and should be read in conjunction with the Company’s consolidated financial statements and the notes thereto appearing in BKU’s Annual Report on Form 10-K for the year ended December 31, 20162018 filed with the SEC. In the opinion of management, all adjustments, consisting of normal recurring adjustments, considered necessary for a fair presentation have been included. Operating results for the three and ninesix months ended SeptemberJune 30, 20172019 are not necessarily indicative of the results that may be expected in future periods.
Certain amounts presented for prior periods have been reclassified to conform to the current period presentation.
Accounting Estimates
In preparing the consolidated financial statements, management is required to make estimates and assumptions that affect the reported amounts of assets, liabilities, revenues, and expenses and disclosures of contingent assets and liabilities. Actual results could differ significantly from these estimates.
Significant estimates include the ALLL the amount and timing of expected cash flows from covered assets and the FDIC indemnification asset, and the fair values of investment securities and other financial instruments. Management has used information provided by third party valuation specialists to assist in the determination of the fair values of investment securities.
New Accounting Pronouncements Adopted During the Six Months Ended June 30, 2019
ASU No. 2016-09, Compensation - Stock Compensation2016-02, Leases (Topic 718): Improvements to Employee Share-Based Payment Accounting842). The amendments in this ASU, simplified several aspects of the accounting for share-based payment transactions. The Company adopted this ASU in the first quarter of 2017. The amendment requiring the recognition of excess tax benefits and deficiencies as income tax benefit or expense in the income statement as opposed to being recognized as additional paid-in-capital was applied prospectively and resulted in the recognition of $0.3 million and $3.2 million in excess tax benefits in the consolidated statement of income line item "Provision for income taxes" for the three and nine months ended September 30, 2017, increasing net income by the same amount in each period. The adoption had no impact on basic and diluted earnings per share for the three months ended September 30, 2017 and increased basic and diluted earnings per share by $0.02 and $0.03, respectively, for the nine months ended September 30, 2017. The Company retrospectively adopted the amendments requiring the classification of excess tax benefits and deficienciesalong with other income tax cash flows as operating activities and cash paid when directly withholding shares as financing activities in the accompanying consolidated statements of cash flows; the impact was not material. The Company elected to continue its practice of estimating the number of awards expected to vest in determining the amount of compensation cost to be recognized related to share based payment transactions.
BANKUNITED, INC. AND SUBSIDIARIES
NOTES TO CONSOLIDATED FINANCIAL STATEMENTS - UNAUDITED
September 30, 2017
ASU No. 2017-08, Receivables—Nonrefundable Fees and Other Costs (Subtopic 310-20): Premium Amortization on Purchased Callable Debt Securities. The amendments in this ASU require certain premiums on callable debt securities to be amortized to the earliest call date. The amortization period for callable debt securities purchased as a discount will not be impacted. The Company early-adopted this ASU in the first quarter of 2017 with no material impact on the Company's consolidated financial position, results of operations or cash flows.
ASU No. 2016-06, Derivatives and Hedging (Topic 815):Contingent Put and Call Options in Debt Instruments. The amendments in this ASU clarify the requirements for assessing whether contingent call (put) options that can accelerate the payment of principal on debt instruments are clearly and closely related to their debt hosts. A company performing the assessment under these amendments is required to assess the embedded call (put) options solely in accordance with a four-step decision sequence, without also considering whether the contingency is related to interest rates or credit risks. The Company adopted this ASU in the first quarter of 2017 with no impact on its consolidated financial position, results of operations or cash flows.
ASU No. 2017-04, Intangibles—Goodwill and Other (Topic 350): Simplifying the Test for Goodwill Impairment, an amendment to simplify the subsequent quantitative measurement of goodwill by eliminating step two from the goodwill impairment test. As amended, an entity recognizes an impairment charge for the amount by which the carrying amount of a reporting unit exceeds its fair value, not to exceed the total amount of goodwill allocated to the reporting unit. An entity still has the option to perform the qualitative test for a reporting unit to determine if the quantitative impairment test is necessary. The Company early adopted this ASU in the third quarter of 2017, concurrent with performance of its annual goodwill impairment test, with no impact on its consolidated financial position, results of operations or cash flows.
ASU No. 2017-12, Derivatives and Hedging (Topic 815): Targeted Improvements to Accounting for Hedging Activities. The new guidance eliminates the requirement to separately measure and report hedge ineffectiveness after initial qualification. For qualifying cash flow and net investment hedges, this means that the entire change in the fair value of the hedging instrument included in the assessment of hedge effectiveness will be recorded in other comprehensive income (OCI), and amounts deferred in OCI will be reclassified to earnings in the same income statement line item that is used to present the earnings effect of the hedged item when the hedged item affects earnings. The Company will have until the end of the first quarter in which a hedge is designated to perform an initial assessment of a hedge’s effectiveness. The new guidance also permits a qualitative effectiveness assessment for certain hedges instead of a quantitative test, such as a regression analysis, if the company can reasonably support an expectation of high effectiveness throughout the term of the hedge. In addition, in order to better align an entity's risk management activities and financial reporting for hedging relationships, the ASU allows for more hedging strategies to be eligible for hedge accounting. From a disclosure standpoint, to help users of the financial statements better understand the effects of hedge accounting, the guidance requires revised tabular disclosures that focus on the effect of hedge accounting by income statement line, and eliminates today’s requirement to disclose hedge ineffectiveness because this amount is no longer separately measured. The Company early adopted this ASU during the quarter ended September 30, 2017 with no material impact on the Company's consolidated financial position, results of operations or cash flows.
Recent Accounting Pronouncements
In May 2014, the FASB issued ASU No. 2014-09, Revenue from Contracts with Customers (Topic 606), which will supersede the revenue recognition requirements in Topic 605, Revenue Recognition, and most industry-specific revenue recognition guidance throughout the Accounting Standards Codification. The amendments in this update affect any entity that either enters into contracts with customers to transfer goods or services or enters into contracts for the transfer of non-financial assets unless those contracts, including leases and insurance contracts, are within the scope of other standards. The amendments establish a core principle requiring the recognition of revenue to depict the transfer of goods or services to customers in an amount reflecting the consideration to which the entity expects to be entitled in exchange for such goods or services. The amendments also require expanded disclosures concerning the nature, amount, timing and uncertainty of revenues and cash flows arising from contracts with customers. Financial instruments and lease contracts are generally outside the scope of the ASU as are revenues that are in the scope of ASC 860 "Transfers and Servicing", ASC 460 "Guarantees" and ASC 815 "Derivatives and Hedging". The FASB has issued subsequent ASUs issued to clarify certain aspectsprovisions of ASU 2014-09, without changing the core principle of the guidance and to defer the effective date of ASU 2014-09 to annual periods and interim periods within fiscal years beginning after December 15, 2017. Although management has not finalized its evaluation of the impact of adoption of this ASU, substantially all of the Company's revenues have historically been, and are expected to continue to be, generated from activities that are outside the scope of the ASU. Therefore, management does not expect adoption to have a material impact on the Company's consolidated financial position, results of operations or cash flows.
BANKUNITED, INC. AND SUBSIDIARIES
NOTES TO CONSOLIDATED FINANCIAL STATEMENTS - UNAUDITED
September 30, 2017
Service charges on deposit accounts, which totaled approximately $9.8 million for the nine months ended September 30, 2017, is the most significant category of revenue identified as within the scope of the ASU; management does not expect the amount and timing of recognition of such revenue to be materially impacted by adoption, which management expects to apply using the modified retrospective approach, whereby the cumulative effect of initially applying the amendments is recognized as an adjustment to opening retained earnings at the date of adoption.
In January 2016, the FASB issued ASU No. 2016-01, Financial Instruments - Overall (Subtopic 825-10): Recognition and Measurement of Financial Assets and Financial Liabilities. The amendments in the ASU that are expected to be most applicable to the Company (1) eliminate the available for sale classification for equity securities and require investments in equity securities (except those accounted for under the equity method of accounting or those that result in consolidation of the investee) to be measured at fair value with changes in fair value recognized in net income, provided that equity investments that do not have readily determinable fair values may be re-measured at fair value upon occurrence of an observable price change or recognition of impairment, (2) eliminate the requirement to disclose the method(s) and significant assumptions used to estimate the fair value that is required to be disclosed for financial instruments measured at amortized cost on the balance sheet, and (3) require public business entities to use the exit price notion when measuring the fair value of financial instruments for disclosure purposes. The amendments also clarify that an entity should evaluate the need for a valuation allowance on a deferred tax asset related to available for sale securities in combination with the entity's other deferred tax assets, which is consistent with the Company's current practice. The amendments in this ASU are effective for the Company for interim and annual periods in fiscal years beginning after December 15, 2017 and will be adopted by means of a cumulative-effect adjustment to the balance sheet, except for amendments related to equity securities without readily determinable fair values, which will be applied prospectively. Although management has not finalized its evaluation of the impact of adoption of this ASU, adoption is not expected to have any impact on the Company's consolidated financial position or cash flows, other than a cumulative effect adjustment to reclassify any unrealized gains or losses related to equity securities from AOCI to retained earnings. The carrying value of equity investments for which fair value changes will be recognized in earnings after adoption totaled $71 million and had unrealized gains of $10.0 million at September 30, 2017. Adoption of the ASU will impact the Company's disclosures about the fair value of certain financial instruments.
In February 2016, the FASB issued ASU No. 2016-02, Leases (Topic 842). The amendments in this ASUTopic 842, require a lessee to recognize in the statement of financial position a liability to make lease payments and a right-of-use asset representing its right to use the underlying asset for leases with terms longer than one year. Accounting applied by lessors iswas largely unchanged by this ASU. The ASU also requires both qualitative and quantitative disclosures that provide additional information about the amounts recorded in the consolidated financial statements. The amendments in this ASU arewere effective for the Company for interim and annual periods in fiscal years beginning after December 15, 2018. Early adoption is permitted; however, the Company does not intend to early adopt this ASU. Lessees and lessors are required to apply the provisions of the ASU at the beginning of the earliest period presented using a modified retrospective approach. Management has not completed its evaluation of theThe most significant impact of adoption of this ASU and is not currently able to reasonably estimate the impact of adoption on the consolidated financial statements; however, the most significant impact is expected to bewas the recognition, as lessee, of new right-of-use assets and lease liabilities on the consolidated balance sheetConsolidated Balance Sheet for real estate leases currently classified as operating leases. Under a package of practical expedients that the Company elected, as lessee and lessor, the Company did not have to (i) re-assess whether expired or existing contracts contain leases, (ii) re-assess the classification of expired or existing leases, (iii) re-evaluate initial direct costs for existing leases or (iv) separate lease components of certain contracts from non-lease components. The Company also elected the transition method that allows entities the option of applying the provisions of the ASU at the effective date without adjusting the comparative periods presented. The Company adopted this ASU in the first quarter of 2019 using the modified retrospective transition method. The Company recognized a lease liability and related right of use asset of approximately $104 million and $95 million, respectively, upon adoption on January 1, 2019.
ASU No. 2018-16, Derivatives and Hedging (Topic 815): Inclusion of the Secured Overnight Financing Rate (SOFR) Overnight Index Swap (OIS) Rate as a Benchmark Interest Rate for Hedge Accounting Purposes. The ASU added the OIS rate based on SOFR as a benchmark interest rate for hedge accounting purposes. The ASU was effective for the Company for interim and annual periods in fiscal years beginning after December 15, 2018. The Company adopted this ASU in the first quarter of 2019 with no impact at adoption to its consolidated financial position, results of operations, or cash flows.
Recent Accounting Pronouncements Not Yet Adopted
In June 2016, the FASB issued ASU No. 2016-13, Financial Instruments - Credit Losses (Topic 326); Measurement of Credit Losses on Financial Instruments. The This ASU, along with subsequent ASUs issued to clarify certain of its provisions, introduces new guidance which makes substantive changes to the accounting for credit losses. The ASU introduces the CECL
BANKUNITED, INC. AND SUBSIDIARIES
NOTES TO CONSOLIDATED FINANCIAL STATEMENTS - UNAUDITED
June 30, 2019
model which applies to financial assets subject to credit losses and measured at amortized cost, as well as certain off-balance sheet credit exposures. This includes loans, loan commitments, standby letters of credit, net investments in leases recognized by a lessor and held-to-maturityHTM debt securities. The CECL model requires an entity to estimate credit losses expected over the life of an exposure, considering information about historical events, current conditions and reasonable and supportable forecasts.forecasts, and is generally expected to result in earlier recognition of credit losses. The ASU also modifies certain provisions of the current OTTI model for available for saleAFS debt securities requiring an estimate of expected credit losses only when the fair value of an available for sale debt security is below its amortized cost.securities. Credit losses on available for saleAFS debt securities will be limited to the difference between the security's amortized cost basis and its fair value.value, and will be recognized through an allowance for credit losses rather than as a direct reduction in amortized cost basis. The ASU also provides for a simplified accounting model for purchased financial assets with more than insignificant credit deterioration since their origination. The ASU requires expanded disclosures including, but not limited to, (i) information about the methods and assumptions used to estimate expected credit losses, including changes in the factors that influenced management's estimate and the reasons for those changes, (ii) for financing receivables and net investment in leases measured at amortized cost, further disaggregation of information about the credit quality of those assets and (iii) a rollforward of the allowance for credit losses for AFS and HTM securities. The amendments in this ASU are effective for the Company for interim and annual periods in fiscal years beginning after December 15, 2019. Early adoption is permitted; however, the Company does not intend to early adopt this ASU. Management has not yet completed its evaluationis in the process of evaluating the impact of adoption of this ASU on its consolidated financial statements, processes and controls and is not currently able to reasonably estimate the impact of adoption on the Company's consolidated financial statements;position, results of operations or cash flows; however, adoption is likely towill lead to significant changes in accounting policies related to, and the methods employed in estimating, the ALLL. It is possible that the impact will be material to the Company's consolidated financial position and results of operations. To date, the Company has completed a gap analysis, adopted and is in the process of executing a detailed implementation plan, established a formal governance structure, selected and implemented credit loss models for key portfolio segments, chosen loss estimation methodologies for key portfolio segments, implemented a software solution to serve as its CECL platform, and initiated a "parallel run" of the CECL estimation process.
Leases
The Company determines whether a contract is or contains a lease at inception. For leases with terms greater than twelve months under which the Company is lessee, ROU assets and lease liabilities are recorded at the commencement date. Lease liabilities are initially recorded based on the present value of future lease payments over the lease term. ROU assets are initially recorded at the amount of the associated lease liabilities plus prepaid lease payments and initial direct costs, less any lease incentives received. The cost of short term leases is recognized on a straight line basis over the lease term. The lease term includes options to extend if the exercise of those options is reasonably certain and includes termination options if there is reasonable certainty the options will not be exercised. Lease payments are discounted using the Company's FHLB borrowing rate for borrowings of a similar term unless an implicit rate is defined in the contract or is determinable, which is generally not the case. Leases are classified as financing or operating leases at commencement; generally, leases are classified as finance leases when effective control of the underlying asset is transferred. The substantial majority of leases under which the Company is lessee are classified as operating leases. For operating leases, lease cost is recognized in the Consolidated Statements of Income on a straight line basis over the lease terms. For finance leases, interest expense on lease liabilities is recognized on the effective interest method and amortization of ROU assets is recognized on a straight line basis over the lease terms. Variable lease costs are recognized in the period in which the obligation for those costs is incurred. The Company has elected not to separate lease from non-lease components of its lease contracts.
BANKUNITED, INC. AND SUBSIDIARIES
NOTES TO CONSOLIDATED FINANCIAL STATEMENTS - UNAUDITED
SeptemberJune 30, 20172019
In August 2016, the FASB issued ASU No. 2016-15, Statement of Cash Flows (Topic 230): Classification of Certain Cash Receipts and Cash Payments. The amendments in this ASU provide guidance on eight specific cash flow classification issues where there has been diversity in practice. The guidance in the ASU that is expected to be most applicable to the Company requires: (1) cash payments for debt prepayment or extinguishment costs to be classified as cash outflows for financing activities, (2) proceeds from settlement of insurance claims to be classified on the basis of the nature of the loss and (3) cash proceeds from settlement of bank-owned life insurance policies to be classified as cash flows from investing activities. Cash payments for premiums on bank-owned life insurance may be classified as cash flows for investing activities, operating activities or a combination thereof. The amendments in this ASU are effective for the Company for interim and annual periods in fiscal years beginning after December 15, 2017 and will be applied retrospectively to each period presented. The provisions of this ASU are generally consistent with the Company's current practice and adoption is not expected to materially impact the Company's consolidated cash flows.
Note 2 Earnings Per Common Share
The computation of basic and diluted earnings per common share is presented below for the periods indicated (in thousands, except share and per share data):
|
| | | | | | | | | | | | | | | |
| | Three Months Ended June 30, | | Six Months Ended June 30, |
| c | 2019 | | 2018 | | 2019 |
| 2018 |
| Basic earnings per common share: | | | | | |
| | |
| Numerator: | | | | | |
| | |
| Net income | $ | 81,451 |
| | $ | 89,900 |
| | $ | 147,423 |
| | $ | 175,135 |
|
| Distributed and undistributed earnings allocated to participating securities | (3,382 | ) | | (3,463 | ) | | (6,074 | ) | | (6,676 | ) |
| Income allocated to common stockholders for basic earnings per common share | $ | 78,069 |
| | $ | 86,437 |
| | $ | 141,349 |
| | $ | 168,459 |
|
| Denominator: | | | | | | | |
| Weighted average common shares outstanding | 97,451,019 |
| | 106,170,834 |
| | 98,150,014 |
| | 106,347,378 |
|
| Less average unvested stock awards | (1,174,339 | ) | | (1,222,436 | ) | | (1,173,137 | ) | | (1,165,750 | ) |
| Weighted average shares for basic earnings per common share | 96,276,680 |
| | 104,948,398 |
| | 96,976,877 |
| | 105,181,628 |
|
| Basic earnings per common share | $ | 0.81 |
| | $ | 0.82 |
| | $ | 1.46 |
| | $ | 1.60 |
|
| Diluted earnings per common share: | | | | | | | |
| Numerator: | | | | | | | |
| Income allocated to common stockholders for basic earnings per common share | $ | 78,069 |
| | $ | 86,437 |
| | $ | 141,349 |
| | $ | 168,459 |
|
| Adjustment for earnings reallocated from participating securities | 9 |
| | 12 |
| | 13 |
| | 23 |
|
| Income used in calculating diluted earnings per common share | $ | 78,078 |
| | $ | 86,449 |
| | $ | 141,362 |
| | $ | 168,482 |
|
| Denominator: | | |
|
| | | | |
| Weighted average shares for basic earnings per common share | 96,276,680 |
| | 104,948,398 |
| | 96,976,877 |
| | 105,181,628 |
|
| Dilutive effect of stock options and certain share-based awards | 345,899 |
| | 522,997 |
| | 312,821 |
| | 519,598 |
|
| Weighted average shares for diluted earnings per common share | 96,622,579 |
| | 105,471,395 |
| | 97,289,698 |
| | 105,701,226 |
|
| Diluted earnings per common share | $ | 0.81 |
| | $ | 0.82 |
| | $ | 1.45 |
| | $ | 1.59 |
|
|
| | | | | | | | | | | | | | | |
| | Three Months Ended September 30, | | Nine Months Ended September 30, |
| c | 2017 | | 2016 | | 2017 |
| 2016 |
| Basic earnings per common share: | | | | | |
| | |
| Numerator: | | | | | |
| | |
| Net income | $ | 67,779 |
| | $ | 50,848 |
| | $ | 196,479 |
| | $ | 162,447 |
|
| Distributed and undistributed earnings allocated to participating securities | (2,525 | ) | | (2,031 | ) | | (7,331 | ) | | (6,522 | ) |
| Income allocated to common stockholders for basic earnings per common share | $ | 65,254 |
| | $ | 48,817 |
| | $ | 189,148 |
| | $ | 155,925 |
|
| Denominator: | | | | | | | |
| Weighted average common shares outstanding | 106,809,381 |
| | 104,153,018 |
| | 106,488,396 |
| | 104,077,932 |
|
| Less average unvested stock awards | (1,101,485 | ) | | (1,150,268 | ) | | (1,102,381 | ) | | (1,165,509 | ) |
| Weighted average shares for basic earnings per common share | 105,707,896 |
| | 103,002,750 |
| | 105,386,015 |
| | 102,912,423 |
|
| Basic earnings per common share | $ | 0.62 |
| | $ | 0.47 |
| | $ | 1.79 |
| | $ | 1.52 |
|
| Diluted earnings per common share: | | | | | | | |
| Numerator: | | | | | | | |
| Income allocated to common stockholders for basic earnings per common share | $ | 65,254 |
| | $ | 48,817 |
| | $ | 189,148 |
| | $ | 155,925 |
|
| Adjustment for earnings reallocated from participating securities | 6 |
| | (81 | ) | | 21 |
| | (264 | ) |
| Income used in calculating diluted earnings per common share | $ | 65,260 |
| | $ | 48,736 |
| | $ | 189,169 |
| | $ | 155,661 |
|
| Denominator: | | |
|
| | | | |
| Weighted average shares for basic earnings per common share | 105,707,896 |
| | 103,002,750 |
| | 105,386,015 |
| | 102,912,423 |
|
| Dilutive effect of stock options and executive share-based awards | 365,286 |
| | 558,304 |
| | 479,459 |
| | 699,977 |
|
| Weighted average shares for diluted earnings per common share | 106,073,182 |
| | 103,561,054 |
| | 105,865,474 |
| | 103,612,400 |
|
| Diluted earnings per common share | $ | 0.62 |
| | $ | 0.47 |
| | $ | 1.79 |
| | $ | 1.50 |
|
BANKUNITED, INC. AND SUBSIDIARIES
NOTES TO CONSOLIDATED FINANCIAL STATEMENTS - UNAUDITED
September 30, 2017
Included in participating securities above are unvested shares and 3,023,314 dividend equivalent rights outstanding at SeptemberJune 30, 20172019 that were issued in conjunction with the IPO of the Company's common stock. These dividend equivalent rights expire in 2021 and participate in dividends on a one-for-one basis.
The following potentially dilutive securities were outstanding at SeptemberJune 30, 20172019 and 2016,2018 but excluded from the calculation of diluted earnings per common share for the periods indicated because their inclusion would have been anti-dilutive:
| | | | Three Months Ended September 30, | | Nine Months Ended September 30, | Three Months Ended June 30, | | Six Months Ended June 30, |
| | 2017 | | 2016 | | 2017 | | 2016 | 2019 | | 2018 | | 2019 | | 2018 |
| Unvested shares and share units | 1,111,300 |
| | 1,296,848 |
| | 1,111,300 |
| | 1,296,848 |
| 1,119,641 |
| | 1,644,336 |
| | 1,119,641 |
| | 1,644,336 |
|
| Stock options and warrants | 1,850,279 |
| | 1,851,376 |
| | 1,850,279 |
| | 1,851,376 |
| — |
| | 1,850,279 |
| | — |
| | 1,850,279 |
|
BANKUNITED, INC. AND SUBSIDIARIES
NOTES TO CONSOLIDATED FINANCIAL STATEMENTS - UNAUDITED
June 30, 2019
Note 3 Investment Securities
Investment securities include investment securities available for sale, marketable equity securities, and investment securities held to maturity. The investment securities portfolio consisted of the following at the dates indicated (in thousands):
| | | | September 30, 2017 | June 30, 2019 |
| | Amortized Cost | | Gross Unrealized | | Fair Value | Amortized Cost | | Gross Unrealized | | Carrying Value (1) |
| | | Gains | | Losses | | | Gains | | Losses | |
| Investment securities available for sale: | | | | | | | | |
| U.S. Treasury securities | $ | 24,969 |
| | $ | — |
| | $ | (12 | ) | | $ | 24,957 |
| $ | 49,992 |
| | $ | 221 |
| | $ | — |
| | $ | 50,213 |
|
| U.S. Government agency and sponsored enterprise residential MBS | 2,332,616 |
| | 16,762 |
| | (691 | ) | | 2,348,687 |
| 2,222,327 |
| | 14,446 |
| | (8,978 | ) | | 2,227,795 |
|
| U.S. Government agency and sponsored enterprise commercial MBS | 139,966 |
| | 1,067 |
| | (1,813 | ) | | 139,220 |
| 378,167 |
| | 4,057 |
| | (1,120 | ) | | 381,104 |
|
| Private label residential MBS and CMOs | 507,381 |
| | 20,812 |
| | (335 | ) | | 527,858 |
| 1,374,008 |
| | 22,256 |
| | (1,082 | ) | | 1,395,182 |
|
| Private label commercial MBS | 1,140,465 |
| | 14,646 |
| | (1,510 | ) | | 1,153,601 |
| 1,549,733 |
| | 8,462 |
| | (242 | ) | | 1,557,953 |
|
| Single family rental real estate-backed securities | 566,635 |
| | 6,425 |
| | (112 | ) | | 572,948 |
| 387,104 |
| | 5,392 |
| | (190 | ) | | 392,306 |
|
| Collateralized loan obligations | 695,414 |
| | 4,905 |
| | — |
| | 700,319 |
| 1,205,295 |
| | 766 |
| | (7,779 | ) | | 1,198,282 |
|
| Non-mortgage asset-backed securities | 80,255 |
| | 2,382 |
| | — |
| | 82,637 |
| 155,542 |
| | 2,321 |
| | (46 | ) | | 157,817 |
|
| Preferred stocks | 60,716 |
| | 10,000 |
| | — |
| | 70,716 |
| |
| State and municipal obligations | 666,013 |
| | 14,370 |
| | (3,368 | ) | | 677,015 |
| 265,856 |
| | 13,471 |
| | — |
| | 279,327 |
|
| SBA securities | 572,540 |
| | 14,152 |
| | (17 | ) | | 586,675 |
| 418,494 |
| | 5,631 |
| | (2,352 | ) | | 421,773 |
|
| Other debt securities | 4,056 |
| | 4,783 |
| | — |
| | 8,839 |
| 1,395 |
| | 3,386 |
| | — |
| | 4,781 |
|
| | $ | 6,791,026 |
| | $ | 110,304 |
| | $ | (7,858 | ) | | $ | 6,893,472 |
| 8,007,913 |
| | $ | 80,409 |
| | $ | (21,789 | ) | | 8,066,533 |
|
| Investment securities held to maturity | | 10,000 |
| | | | | | 10,000 |
|
| | | $ | 8,017,913 |
| | | | | | 8,076,533 |
|
| Marketable equity securities | | | | | | | | 62,175 |
|
| | | | | | | | | $ | 8,138,708 |
|
BANKUNITED, INC. AND SUBSIDIARIES
NOTES TO CONSOLIDATED FINANCIAL STATEMENTS - UNAUDITED
SeptemberJune 30, 20172019
| | | | December 31, 2016 | December 31, 2018 |
| | Amortized Cost | | Gross Unrealized | | Fair Value | Amortized Cost | | Gross Unrealized | | Carrying Value (1) |
| | | Gains | | Losses | | | Gains | | Losses | |
| Investment securities available for sale: | | | | | | | | |
| U.S. Treasury securities | $ | 4,999 |
| | $ | 6 |
| | $ | — |
| | $ | 5,005 |
| $ | 39,885 |
| | $ | 2 |
| | $ | (14 | ) | | $ | 39,873 |
|
| U.S. Government agency and sponsored enterprise residential MBS | 1,513,028 |
| | 15,922 |
| | (1,708 | ) | | 1,527,242 |
| 1,885,302 |
| | 16,580 |
| | (4,408 | ) | | 1,897,474 |
|
| U.S. Government agency and sponsored enterprise commercial MBS | 126,754 |
| | 670 |
| | (2,838 | ) | | 124,586 |
| 374,569 |
| | 1,293 |
| | (1,075 | ) | | 374,787 |
|
| Private label residential MBS and CMOs | 334,167 |
| | 42,939 |
| | (2,008 | ) | | 375,098 |
| 1,539,058 |
| | 10,138 |
| | (14,998 | ) | | 1,534,198 |
|
| Private label commercial MBS | 1,180,386 |
| | 9,623 |
| | (2,385 | ) | | 1,187,624 |
| 1,486,835 |
| | 5,021 |
| | (6,140 | ) | | 1,485,716 |
|
| Single family rental real estate-backed securities | 858,339 |
| | 4,748 |
| | (1,836 | ) | | 861,251 |
| 406,310 |
| | 266 |
| | (4,118 | ) | | 402,458 |
|
| Collateralized loan obligations | 487,678 |
| | 868 |
| | (1,250 | ) | | 487,296 |
| 1,239,355 |
| | 1,060 |
| | (5,217 | ) | | 1,235,198 |
|
| Non-mortgage asset-backed securities | 187,660 |
| | 2,002 |
| | (2,926 | ) | | 186,736 |
| 204,372 |
| | 1,031 |
| | (1,336 | ) | | 204,067 |
|
| Preferred stocks | 76,180 |
| | 12,027 |
| | (4 | ) | | 88,203 |
| |
| State and municipal obligations | 705,884 |
| | 3,711 |
| | (11,049 | ) | | 698,546 |
| 398,810 |
| | 3,684 |
| | (4,065 | ) | | 398,429 |
|
| SBA securities | 517,129 |
| | 7,198 |
| | (421 | ) | | 523,906 |
| 514,765 |
| | 6,502 |
| | (1,954 | ) | | 519,313 |
|
| Other debt securities | 3,999 |
| | 4,092 |
| | — |
| | 8,091 |
| 1,393 |
| | 3,453 |
| | — |
| | 4,846 |
|
| | $ | 5,996,203 |
| | $ | 103,806 |
| | $ | (26,425 | ) | | $ | 6,073,584 |
| 8,090,654 |
| | $ | 49,030 |
| | $ | (43,325 | ) | | 8,096,359 |
|
| Investment securities held to maturity | | 10,000 |
| |
|
| |
|
| | 10,000 |
|
| | | $ | 8,100,654 |
| | | | | | 8,106,359 |
|
| Marketable equity securities | |
|
| | | | | | 60,519 |
|
| | | | |
|
| |
|
| | $ | 8,166,878 |
|
| |
| (1) | At fair value except for securities held to maturity. |
Investment securities held to maturity at SeptemberJune 30, 20172019 and December 31, 20162018 consisted of one State of Israel bond with a carrying value of $10 million. Fair value approximated carrying value at September 30, 2017 and December 31, 2016. The bond maturesmaturing in 2024.
At SeptemberJune 30, 2017,2019, contractual maturities of investment securities available for sale, adjusted for anticipated prepayments of mortgage-backed and other pass-through securities,when applicable, were as follows (in thousands):
|
| | | | | | | |
| | Amortized Cost | | Fair Value |
| Due in one year or less | $ | 684,986 |
| | $ | 697,034 |
|
| Due after one year through five years | 3,363,698 |
| | 3,406,609 |
|
| Due after five years through ten years | 2,252,239 |
| | 2,282,220 |
|
| Due after ten years | 429,387 |
| | 436,893 |
|
| Preferred stocks with no stated maturity | 60,716 |
| | 70,716 |
|
| | $ | 6,791,026 |
| | $ | 6,893,472 |
|
Based on the Company’s assumptions, the estimated weighted average life of the investment portfolio as of September 30, 2017 was 4.9 years. The effective duration of the investment portfolio as of September 30, 2017 was 1.7 years. The model results are based on assumptions that may differ from actual results. |
| | | | | | | |
| | Amortized Cost | | Fair Value |
| Due in one year or less | $ | 767,598 |
| | $ | 775,378 |
|
| Due after one year through five years | 4,350,779 |
| | 4,371,075 |
|
| Due after five years through ten years | 2,457,216 |
| | 2,480,114 |
|
| Due after ten years | 432,320 |
| | 439,966 |
|
| | $ | 8,007,913 |
| | $ | 8,066,533 |
|
The carrying value of securities pledged as collateral for FHLB advances, public deposits, interest rate swaps and to secure borrowing capacity at the FRB totaled $2.5$2.2 billion and $1.8$2.1 billion at SeptemberJune 30, 20172019 and December 31, 2016,2018, respectively.
BANKUNITED, INC. AND SUBSIDIARIES
NOTES TO CONSOLIDATED FINANCIAL STATEMENTS - UNAUDITED
SeptemberJune 30, 20172019
The following table provides information about gains and losses on investment securities available for sale for the periods indicated (in thousands):
|
| | | | | | | | | | | | | | | |
| | Three Months Ended June 30, | | Six Months Ended June 30, |
| | 2019 | | 2018 | | 2019 | | 2018 |
| Proceeds from sale of investment securities available for sale | $ | 850,527 |
|
| $ | 569,387 |
| | $ | 1,626,250 |
| | $ | 836,317 |
|
| | | | | | | | |
| Gross realized gains: | | |
|
| | | | |
| Investment securities available for sale | $ | 4,631 |
| | $ | 2,554 |
| | $ | 8,956 |
| | $ | 6,041 |
|
| Gross realized losses: | | |
|
| | | | |
| Investment securities available for sale | (716 | ) | | (4 | ) | | (724 | ) | | (2,514 | ) |
| Net realized gain | 3,915 |
| | 2,550 |
| | 8,232 |
| | 3,527 |
|
| | | | | | | | |
| Net unrealized gains (losses) on marketable equity securities recognized in earnings | 201 |
| | (408 | ) | | 1,669 |
| | (1,021 | ) |
| | | | | | | | |
| Gain on investment securities, net | $ | 4,116 |
| | $ | 2,142 |
| | $ | 9,901 |
| | $ | 2,506 |
|
|
| | | | | | | | | | | | | | | |
| | Three Months Ended September 30, | | Nine Months Ended September 30, |
| | 2017 | | 2016 | | 2017 | | 2016 |
| Proceeds from sale of investment securities available for sale | $ | 399,430 |
|
| $ | 259,571 |
| | $ | 827,353 |
| | $ | 753,756 |
|
| | | | | | | | |
| Gross realized gains | $ | 28,261 |
| | $ | 3,471 |
| | $ | 30,553 |
| | $ | 10,528 |
|
| Gross realized losses | (1,330 | ) | | — |
| | (1,359 | ) | | — |
|
| Net realized gain | 26,931 |
| | 3,471 |
| | 29,194 |
| | 10,528 |
|
| OTTI | — |
| | (463 | ) | | — |
| | (463 | ) |
| Gain on investment securities available for sale, net | $ | 26,931 |
| | $ | 3,008 |
| | $ | 29,194 |
| | $ | 10,065 |
|
During the three and nine months ended September 30, 2016, OTTI was recognized on two positions in one private label commercial MBS. These positions were in unrealized loss positions at September 30, 2016 and the Company intended to sell the security before recovery of the amortized cost basis.
The following tables present the aggregate fair value and the aggregate amount by which amortized cost exceeded fair value for investment securities available for sale in unrealized loss positions, aggregated by investment category and length of time that individual securities had been in continuous unrealized loss positions at the dates indicated (in thousands):
| | | | September 30, 2017 | June 30, 2019 |
| | Less than 12 Months | | 12 Months or Greater | | Total | Less than 12 Months | | 12 Months or Greater | | Total |
| | Fair Value | | Unrealized Losses | | Fair Value | | Unrealized Losses | | Fair Value | | Unrealized Losses | Fair Value | | Unrealized Losses | | Fair Value | | Unrealized Losses | | Fair Value | | Unrealized Losses |
| U.S. Treasury securities | $ | 24,957 |
| | $ | (12 | ) | | $ | — |
| | $ | — |
| | $ | 24,957 |
| | $ | (12 | ) | |
| U.S. Government agency and sponsored enterprise residential MBS | 460,806 |
| | (425 | ) | | 9,544 |
| | (266 | ) | | 470,350 |
| | (691 | ) | $ | 919,284 |
| | $ | (6,994 | ) | | $ | 140,310 |
| | $ | (1,984 | ) | | $ | 1,059,594 |
| | $ | (8,978 | ) |
| U.S. Government agency and sponsored enterprise commercial MBS | 55,152 |
| | (1,783 | ) | | 14,270 |
| | (30 | ) | | 69,422 |
| | (1,813 | ) | 99,590 |
| | (1,083 | ) | | 6,477 |
| | (37 | ) | | 106,067 |
| | (1,120 | ) |
| Private label residential MBS and CMOs | 72,557 |
| | (217 | ) | | 5,820 |
| | (118 | ) | | 78,377 |
| | (335 | ) | 121,628 |
| | (180 | ) | | 204,205 |
| | (902 | ) | | 325,833 |
| | (1,082 | ) |
| Private label commercial MBS | 124,664 |
| | (1,510 | ) | | — |
| | — |
| | 124,664 |
| | (1,510 | ) | 100,262 |
| | (220 | ) | | 14,780 |
| | (22 | ) | | 115,042 |
| | (242 | ) |
| Single family rental real estate-backed securities | 14,708 |
| | (112 | ) | | — |
| | — |
| | 14,708 |
| | (112 | ) | 142,824 |
| | (148 | ) | | 22,946 |
| | (42 | ) | | 165,770 |
| | (190 | ) |
| State and municipal obligations | 184,082 |
| | (3,368 | ) | | — |
| | — |
| | 184,082 |
| | (3,368 | ) | |
| Collateralized loan obligations | | 623,797 |
| | (5,981 | ) | | 80,202 |
| | (1,798 | ) | | 703,999 |
| | (7,779 | ) |
| Non-mortgage asset-backed securities | | 39,505 |
| | (46 | ) | | — |
| | — |
| | 39,505 |
| | (46 | ) |
| SBA securities | — |
| | — |
| | 18,229 |
| | (17 | ) | | 18,229 |
| | (17 | ) | 62,857 |
| | (1,050 | ) | | 101,227 |
| | (1,302 | ) | | 164,084 |
| | (2,352 | ) |
| | $ | 936,926 |
| | $ | (7,427 | ) | | $ | 47,863 |
| | $ | (431 | ) | | $ | 984,789 |
| | $ | (7,858 | ) | $ | 2,109,747 |
| | $ | (15,702 | ) | | $ | 570,147 |
| | $ | (6,087 | ) | | $ | 2,679,894 |
| | $ | (21,789 | ) |
BANKUNITED, INC. AND SUBSIDIARIES
NOTES TO CONSOLIDATED FINANCIAL STATEMENTS - UNAUDITED
SeptemberJune 30, 20172019
| | | | December 31, 2016 | December 31, 2018 |
| | Less than 12 Months | | 12 Months or Greater | | Total | Less than 12 Months | | 12 Months or Greater | | Total |
| | Fair Value | | Unrealized Losses | | Fair Value | | Unrealized Losses | | Fair Value | | Unrealized Losses | Fair Value | | Unrealized Losses | | Fair Value | | Unrealized Losses | | Fair Value | | Unrealized Losses |
| U.S. Treasury securities | | $ | 14,921 |
| | $ | (14 | ) | | $ | — |
| | $ | — |
| | $ | 14,921 |
| | $ | (14 | ) |
| U.S. Government agency and sponsored enterprise residential MBS | $ | 191,463 |
| | $ | (628 | ) | | $ | 112,391 |
| | $ | (1,080 | ) | | $ | 303,854 |
| | $ | (1,708 | ) | 450,666 |
| | (1,828 | ) | | 87,311 |
| | (2,580 | ) | | 537,977 |
| | (4,408 | ) |
| U.S. Government agency and sponsored enterprise commercial MBS | 89,437 |
| | (2,838 | ) | | — |
| | — |
| | 89,437 |
| | (2,838 | ) | 146,096 |
| | (352 | ) | | 25,815 |
| | (723 | ) | | 171,911 |
| | (1,075 | ) |
| Private label residential MBS and CMOs | 122,142 |
| | (1,680 | ) | | 8,074 |
| | (328 | ) | | 130,216 |
| | (2,008 | ) | 759,921 |
| | (7,073 | ) | | 278,108 |
| | (7,925 | ) | | 1,038,029 |
| | (14,998 | ) |
| Private label commercial MBS | 169,535 |
| | (2,370 | ) | | 24,985 |
| | (15 | ) | | 194,520 |
| | (2,385 | ) | 742,092 |
| | (5,371 | ) | | 39,531 |
| | (769 | ) | | 781,623 |
| | (6,140 | ) |
| Single family rental real estate-backed securities | 139,867 |
| | (842 | ) | | 176,057 |
| | (994 | ) | | 315,924 |
| | (1,836 | ) | 234,305 |
| | (1,973 | ) | | 85,282 |
| | (2,145 | ) | | 319,587 |
| | (4,118 | ) |
| Collateralized loan obligations | 69,598 |
| | (402 | ) | | 173,983 |
| | (848 | ) | | 243,581 |
| | (1,250 | ) | 749,047 |
| | (5,217 | ) | | — |
| | — |
| | 749,047 |
| | (5,217 | ) |
| Non-mortgage asset-backed securities | 139,477 |
| | (2,926 | ) | | — |
| | — |
| | 139,477 |
| | (2,926 | ) | 136,100 |
| | (1,336 | ) | | — |
| | — |
| | 136,100 |
| | (1,336 | ) |
| Preferred stocks | 10,087 |
| | (4 | ) | | — |
| | — |
| | 10,087 |
| | (4 | ) | |
| State and municipal obligations | 448,180 |
| | (11,049 | ) | | — |
| | — |
| | 448,180 |
| | (11,049 | ) | 208,971 |
| | (3,522 | ) | | 46,247 |
| | (543 | ) | | 255,218 |
| | (4,065 | ) |
| SBA securities | 4,204 |
| | (13 | ) | | 20,076 |
| | (408 | ) | | 24,280 |
| | (421 | ) | 215,975 |
| | (1,391 | ) | | 31,481 |
| | (563 | ) | | 247,456 |
| | (1,954 | ) |
| | $ | 1,383,990 |
| | $ | (22,752 | ) | | $ | 515,566 |
| | $ | (3,673 | ) | | $ | 1,899,556 |
| | $ | (26,425 | ) | $ | 3,658,094 |
| | $ | (28,077 | ) | | $ | 593,775 |
| | $ | (15,248 | ) | | $ | 4,251,869 |
| | $ | (43,325 | ) |
The Company monitors its investment securities available for sale for OTTI on an individual security basis. No securities were determined to be other-than-temporarily impaired during the ninesix months ended SeptemberJune 30, 2017.2019 or 2018. The Company does not intend to sell securities that are in significant unrealized loss positions at SeptemberJune 30, 20172019 and it is not more likely than not that the Company will be required to sell these securities before recovery of the amortized cost basis, which may be at maturity. At SeptemberJune 30, 2017, 542019, 126 securities were in unrealized loss positions. The amount of impairment related to 2048 of these securities was considered insignificant both individually and in the aggregate, totaling approximately $237$422 thousand and no further analysis with respect to these securities was considered necessary. The basis for concluding that impairment of the remaining securities was not other-than-temporary is further described below:below.
U.S. Government agency and sponsored enterprise residentialMBSand commercialMBS
At SeptemberJune 30, 2017, eight2019, thirty-six U.S. Government agency and sponsored enterprise residential MBS and four U.S. Government agency and sponsored enterprise commercial MBS were in unrealized loss positions. For five fixed rateImpairment of these securities the impairment was primarily attributable to an increaseincreases in medium and long-term market interest rates subsequent to the date of acquisition. For the remaining seven variable rateacquisition and for certain securities, the amount of impairment was less than 1% of amortized cost.widening spreads. The timely payment of principal and interest on these securities is explicitly or implicitly guaranteed by the U.S. Government. Given the expectation of timely payment of principal and interest the impairments were considered to be temporary.
Private label residentialMBSandCMOs
At SeptemberJune 30, 2017, five2019, eight private label residential MBS and CMOs were in unrealized loss positions, primarily as a result of an increase in medium and long-term market interest rates subsequent to acquisition. The amount of impairment of each of the individual securities was less than 3% of amortized cost. These securities were assessed for OTTI using credit and prepayment behavioral models that incorporate CUSIP level constant default rates, voluntary prepayment rates and loss severity and delinquency assumptions. The results of these assessments were not indicative of credit losses related to any of these securities as of SeptemberJune 30, 2017.2019. Given the limited severity of impairment and the expectation of timely recovery of outstanding principal the impairments were considered to be temporary.
Private label commercialMBS
At June 30, 2019, three private label commercial MBS were in unrealized loss positions, primarily as a result of an increase in market interest rates since acquisition. These securities were assessed for OTTI using credit and prepayment behavioral
BANKUNITED, INC. AND SUBSIDIARIES
NOTES TO CONSOLIDATED FINANCIAL STATEMENTS - UNAUDITED
SeptemberJune 30, 20172019
Private label commercialMBSmodels incorporating assumptions consistent with the collateral characteristics of each security. The results of this analysis were not indicative of expected credit losses. Given the expectation of timely recovery of outstanding principal the impairments were considered to be temporary.
Single family rental real estate-backed securities
At SeptemberJune 30, 2017, four private label commercial MBS2019, two single family rental real estate-backed securities were in unrealized loss positions. The amount of impairment of each of the individual securities was less than 3% of amortized cost. The unrealized losses were primarily attributabledue to increases in market interest rates since the purchase of the securities. Management's analysis of the credit characteristics, including loan-to-value and debt service coverage ratios, and levels of subordination for each of the securities is not indicative of projected credit losses. Given the absence of projected credit losses the impairments were considered to be temporary.
Collateralized loan obligations:
At June 30, 2019, sixteen collateralized loan obligations were in unrealized loss positions, primarily due to widening credit spreads for this asset class. These securities were assessed for OTTI using credit and prepayment behavioral models incorporating assumptions consistent with the collateral characteristics of each security. The results of this analysis were not indicative of expected credit losses. Given the limited severity of impairment and the expectation of timely recovery of outstanding principal, the impairments were considered to be temporary.
Single family rental real estate-backedNon-mortgage asset-backed securities
At SeptemberJune 30, 2017, two single family rental real estate-backed2019, one non-mortgage asset-backed security was in an unrealized loss position, due primarily to increases in market interest rates subsequent to the date of acquisition. This security was assessed for OTTI using a credit and prepayment behavioral model incorporating assumptions consistent with the collateral characteristics of the security. The results of this analysis were not indicative of expected credit losses. Given the expectation of timely recovery of outstanding principal, the impairment was considered to be temporary.
SBA Securities
At June 30, 2019, eight SBA securities were in unrealized loss positions. These securities were purchased at a premium and the impairment was attributable primarily to increased prepayment speeds. The unrealized losses were primarily due to increases in markettimely payment of principal and interest rates since the purchase of the securities. The amount of impairment of each of the individual securities was less than 2% of amortized cost. Management's analysis of the credit characteristics, including loan-to-value and debt service coverage ratios, and levels of subordination for each of theon these securities is not indicative of projected credit losses.guaranteed by this U.S. Government agency. Given the limited severityexpectation of impairmenttimely payment of principal and the absence of projected credit losses,interest, the impairments were considered to be temporary.
State and municipal obligations
At September 30, 2017, 11 state and municipal obligations were in unrealized loss positions. The amount of impairment of each of the individual securities was less than 5% of amortized cost. All of the securities are rated investment grade by nationally recognized statistical ratings organizations. Management's evaluation of these securities for OTTI also encompassed the review of credit scores and analysis provided by a third party firm specializing in the analysis and credit review of municipal securities. Given the absence of expected credit losses and management's ability and intent to hold the securities until recovery, the impairments were considered to be temporary.
BANKUNITED, INC. AND SUBSIDIARIES
NOTES TO CONSOLIDATED FINANCIAL STATEMENTS - UNAUDITED
SeptemberJune 30, 20172019
Note 4 Loans and Allowance for Loan and Lease Losses
The Company segregates its loan portfolio between covered and non-covered loans. Non-covered loans include loans originated since the FSB acquisition and commercial and consumer loans acquired in the FSB Acquisition for which loss share coverage has terminated. Covered loans are further segregated between ACI loans and non-ACI loans.
Loans consisted of the following at the dates indicated (dollars in thousands):
| | | | September 30, 2017 | | | | | | | | | |
| |
| | Covered Loans | | | | Percent of Total | June 30, 2019 | | December 31, 2018 |
| | Non-Covered Loans | | ACI | | Non-ACI | | Total | | Total | | Percent of Total | | Total | | Percent of Total |
| Residential and other consumer: | |
| | |
| | |
| | |
| | |
| |
| | |
| | |
| | |
|
| 1-4 single family residential | $ | 3,958,205 |
| | $ | 470,300 |
| | $ | 28,589 |
| | $ | 4,457,094 |
| | 21.7 | % | $ | 4,830,943 |
| | 21.4 | % | | $ | 4,606,828 |
| | 21.0 | % |
| Home equity loans and lines of credit | 1,644 |
| | 5,640 |
| | 37,764 |
| | 45,048 |
| | 0.2 | % | |
| Other consumer loans | 20,166 |
| | — |
| | — |
| | 20,166 |
| | 0.1 | % | |
| Government insured residential | | 354,731 |
| | 1.6 | % | | 265,701 |
| | 1.2 | % |
| Other | | 14,533 |
| | 0.1 | % | | 17,369 |
| | 0.1 | % |
| | 3,980,015 |
| | 475,940 |
| | 66,353 |
| | 4,522,308 |
| | 22.0 | % | 5,200,207 |
| | 23.1 | % | | 4,889,898 |
| | 22.3 | % |
| Commercial: | | | | | | | | | | | | | | | | |
| Multi-family | 3,358,801 |
| | — |
| | — |
| | 3,358,801 |
| | 16.3 | % | 2,381,346 |
| | 10.6 | % | | 2,583,331 |
| | 11.8 | % |
| Non-owner occupied commercial real estate | 4,183,275 |
| | — |
| | — |
| | 4,183,275 |
| | 20.4 | % | 4,945,017 |
| | 21.9 | % | | 4,700,188 |
| | 21.4 | % |
| Construction and land | 271,994 |
| | — |
| | — |
| | 271,994 |
| | 1.3 | % | 237,222 |
| | 1.1 | % | | 227,134 |
| | 1.0 | % |
| Owner occupied commercial real estate | 1,959,464 |
| | — |
| | — |
| | 1,959,464 |
| | 9.5 | % | 2,080,578 |
| | 9.2 | % | | 2,122,381 |
| | 9.7 | % |
| Commercial and industrial | 3,900,290 |
| | — |
| | — |
| | 3,900,290 |
| | 19.0 | % | 5,164,571 |
| | 22.9 | % | | 4,801,226 |
| | 21.9 | % |
| Commercial lending subsidiaries | 2,374,193 |
| | — |
| | — |
| | 2,374,193 |
| | 11.5 | % | 2,531,767 |
| | 11.2 | % | | 2,608,834 |
| | 11.9 | % |
| | 16,048,017 |
| | — |
| | — |
| | 16,048,017 |
| | 78.0 | % | 17,340,501 |
| | 76.9 | % | | 17,043,094 |
| | 77.7 | % |
| Total loans | 20,028,032 |
| | 475,940 |
| | 66,353 |
| | 20,570,325 |
| | 100.0 | % | 22,540,708 |
| | 100.0 | % | | 21,932,992 |
| | 100.0 | % |
| Premiums, discounts and deferred fees and costs, net | 44,422 |
| | — |
| | (4,317 | ) | | 40,105 |
| | | 51,141 |
| | | | 44,016 |
| | |
| Loans including premiums, discounts and deferred fees and costs | 20,072,454 |
| | 475,940 |
| | 62,036 |
| | 20,610,430 |
| | | 22,591,849 |
| | | | 21,977,008 |
| | |
| Allowance for loan and lease losses | (153,725 | ) | | (1,812 | ) | | (3,036 | ) | | (158,573 | ) | | | (112,141 | ) | | | | (109,931 | ) | | |
| Loans, net | $ | 19,918,729 |
| | $ | 474,128 |
| | $ | 59,000 |
| | $ | 20,451,857 |
| | | $ | 22,479,708 |
| | | | $ | 21,867,077 |
| | |
During the three and six months ended June 30, 2019 and 2018, the Company purchased 1-4 single family residential loans totaling $589 million, $894 million, $271 million and $604 million, respectively. Purchases for the three and six months ended June 30, 2019 and 2018 included $151 million, $284 million, $72 million and $112 million, respectively, of government insured residential loans.
At June 30, 2019, the Company had pledged real estate loans with a carrying value of approximately $9.9 billion as security for FHLB advances.
BANKUNITED, INC. AND SUBSIDIARIES
NOTES TO CONSOLIDATED FINANCIAL STATEMENTS - UNAUDITED
SeptemberJune 30, 20172019
The following presents the Company's recorded investment in ACI loans, included in the table above, as of the dates indicated (in thousands):
|
| | | | | | | |
| | June 30, 2019 | | December 31, 2018 |
| Residential | $ | 174,029 |
| | $ | 190,223 |
|
| Commercial | 17,544 |
| | 17,925 |
|
| | $ | 191,573 |
| | $ | 208,148 |
|
|
| | | | | | | | | | | | | | | | | | |
| | December 31, 2016 |
| |
| | Covered Loans | | | | Percent of Total |
| | Non-Covered Loans | | ACI | | Non-ACI | | Total | |
| Residential and other consumer: | |
| | |
| | |
| | |
| | |
|
| 1-4 single family residential | $ | 3,422,425 |
| | $ | 532,348 |
| | $ | 36,675 |
| | $ | 3,991,448 |
| | 20.6 | % |
| Home equity loans and lines of credit | 1,120 |
| | 3,894 |
| | 47,629 |
| | 52,643 |
| | 0.3 | % |
| Other consumer loans | 24,365 |
| | — |
| | — |
| | 24,365 |
| | 0.1 | % |
| | 3,447,910 |
| | 536,242 |
| | 84,304 |
| | 4,068,456 |
| | 21.0 | % |
| Commercial: | | | | | | | | | |
| Multi-family | 3,824,973 |
| | — |
| | — |
| | 3,824,973 |
| | 19.8 | % |
| Non-owner occupied commercial real estate | 3,739,235 |
| | — |
| | — |
| | 3,739,235 |
| | 19.3 | % |
| Construction and land | 311,436 |
| | — |
| | — |
| | 311,436 |
| | 1.6 | % |
| Owner occupied commercial real estate | 1,736,858 |
| | — |
| | — |
| | 1,736,858 |
| | 9.0 | % |
| Commercial and industrial | 3,391,614 |
| | — |
| | — |
| | 3,391,614 |
| | 17.5 | % |
| Commercial lending subsidiaries | 2,280,685 |
| | — |
| | — |
| | 2,280,685 |
| | 11.8 | % |
| | 15,284,801 |
| | — |
| | — |
| | 15,284,801 |
| | 79.0 | % |
| Total loans | 18,732,711 |
| | 536,242 |
| | 84,304 |
| | 19,353,257 |
| | 100.0 | % |
| Premiums, discounts and deferred fees and costs, net | 48,641 |
| | — |
| | (6,504 | ) | | 42,137 |
| | |
| Loans including premiums, discounts and deferred fees and costs | 18,781,352 |
| | 536,242 |
| | 77,800 |
| | 19,395,394 |
| | |
| Allowance for loan and lease losses | (150,853 | ) | | — |
| | (2,100 | ) | | (152,953 | ) | | |
| Loans, net | $ | 18,630,499 |
| | $ | 536,242 |
| | $ | 75,700 |
| | $ | 19,242,441 |
| | |
Included in non-covered loans above are $38 million and $47 million at SeptemberAt June 30, 20172019 and December 31, 2016, respectively, of ACI commercial loans acquired in the FSB Acquisition.
Through two subsidiaries, the Bank provides commercial and municipal equipment and franchise financing utilizing both loan and lease structures. At September 30, 2017 and December 31, 2016, the commercial lending subsidiaries portfolio included a net investment in direct financing leases of $680 million and $643 million, respectively.
During the three and nine months ended September 30, 2017 and 2016, the Company purchased 1-4 single family residential loans totaling $312 million, $949 million, $355 million and $937 million, respectively.
At September 30, 2017, the Company had pledged real estate loans with UPB of approximately $10.5 billion and recorded investment of approximately $9.9 billion as security for FHLB advances.
At September 30, 2017 and December 31, 2016,2018, the UPB of ACI loans was $1.2 billion$367 million and $1.5 billion,$408 million, respectively. The accretable yield on ACI loans represents the amount by which undiscounted expected future cash flows exceed recorded investment. Changes in the accretable yield on ACI loans for the ninesix months ended SeptemberJune 30, 20172019 and the year ended December 31, 20162018 were as follows (in thousands):
|
| | | |
| Balance at December 31, 2017 | $ | 455,059 |
|
| Reclassifications from non-accretable difference, net | 128,499 |
|
| Accretion | (369,915 | ) |
Other changes, net (1) | 78,204 |
|
| Balance at December 31, 2018 | 291,847 |
|
| Reclassifications to non-accretable difference, net | (429 | ) |
| Accretion | (33,103 | ) |
Other changes, net (1) | (6,929 | ) |
| Balance at June 30, 2019 | $ | 251,386 |
|
| |
| (1) | Represents changes in cash flows expected to be collected due to the impact of changes in prepayment assumptions or changes in benchmark interest rates. |
|
| | | |
| Balance at December 31, 2015 | $ | 902,565 |
|
| Reclassifications from non-accretable difference | 76,751 |
|
| Accretion | (303,931 | ) |
| Balance at December 31, 2016 | 675,385 |
|
| Reclassifications from non-accretable difference | 72,827 |
|
| Accretion | (226,251 | ) |
| Balance at September 30, 2017 | $ | 521,961 |
|
BANKUNITED, INC. AND SUBSIDIARIES
NOTES TO CONSOLIDATED FINANCIAL STATEMENTS - UNAUDITED
SeptemberJune 30, 20172019
Covered loan sales
During the periods indicated, the Company sold covered residential loans to third parties on a non-recourse basis. The following table summarizes the impact of these transactions (in thousands):
|
| | | | | | | | | | | |
| | Three Months Ended September 30, | | Nine Months Ended September 30, |
| | 2016 | | 2017 | | 2016 |
| UPB of loans sold | $ | 61,406 |
| | $ | 123,737 |
| | $ | 176,958 |
|
| | | | | | |
| Cash proceeds, net of transaction costs | $ | 37,047 |
| | $ | 98,404 |
| | $ | 120,537 |
|
| Recorded investment in loans sold | 47,080 |
| | 99,986 |
| | 135,432 |
|
| Loss on sale of covered loans, net | $ | (10,033 | ) | | $ | (1,582 | ) | | $ | (14,895 | ) |
| | | | | | |
| Gain on FDIC indemnification, net | $ | 8,026 |
| | $ | 1,266 |
| | $ | 11,958 |
|
There was no sale of covered loans for the three months ended September 30, 2017.
Allowance for loan and lease losses
Activity in the ALLL is summarized as follows for the periods indicated (in thousands)(thousands):
|
| | | | | | | | | | | | | | | | | | | | | | | | | | | |
| | Three Months Ended September 30, |
| | 2017 | | 2016 |
| | Residential and Other Consumer | | Commercial | | Unallocated | | Total | | Residential and Other Consumer | | Commercial | | Total |
| Beginning balance | $ | 13,550 |
| | $ | 142,098 |
| | $ | — |
| | $ | 155,648 |
| | $ | 12,415 |
| | $ | 123,303 |
| | $ | 135,718 |
|
| Provision for (recovery of) loan losses: | | | | | | | | | | | | | |
| Covered loans | 268 |
| | (7 | ) | | — |
| | 261 |
| | (430 | ) | | (15 | ) | | (445 | ) |
| Non-covered loans | 363 |
| | 32,230 |
| | 5,000 |
| | 37,593 |
| | 1,974 |
| | 22,879 |
| | 24,853 |
|
| Total provision | 631 |
| | 32,223 |
| | 5,000 |
| | 37,854 |
| | 1,544 |
| | 22,864 |
| | 24,408 |
|
| Charge-offs: | | | | | | | | | | | | | |
| Covered loans | — |
| | — |
| | — |
| | — |
| | (247 | ) | | — |
| | (247 | ) |
| Non-covered loans | — |
| | (36,028 | ) | | — |
| | (36,028 | ) | | — |
| | (6,615 | ) | | (6,615 | ) |
| Total charge-offs | — |
| | (36,028 | ) | | — |
| | (36,028 | ) | | (247 | ) | | (6,615 | ) | | (6,862 | ) |
| Recoveries: | | | | | | | | | | | | | |
| Covered loans | 31 |
| | 7 |
| | — |
| | 38 |
| | 9 |
| | 15 |
| | 24 |
|
| Non-covered loans | 8 |
| | 1,053 |
| | — |
| | 1,061 |
| | 5 |
| | 1,183 |
| | 1,188 |
|
| Total recoveries | 39 |
| | 1,060 |
| | — |
| | 1,099 |
| | 14 |
| | 1,198 |
| | 1,212 |
|
| Ending balance | $ | 14,220 |
| | $ | 139,353 |
| | $ | 5,000 |
| | $ | 158,573 |
| | $ | 13,726 |
| | $ | 140,750 |
| | $ | 154,476 |
|
|
| | | | | | | | | | | | | | | | | | | | | | | |
| | Three Months Ended June 30, |
| | 2019 | | 2018 |
| | Residential and Other Consumer | | Commercial | | Total | | Residential and Other Consumer | | Commercial | | Total |
| Beginning balance | $ | 10,952 |
| | $ | 103,751 |
| | $ | 114,703 |
| | $ | 10,832 |
| | $ | 126,644 |
| | $ | 137,476 |
|
| Provision (recovery) | 131 |
| | (2,878 | ) | | (2,747 | ) | | (280 | ) | | 9,275 |
| | 8,995 |
|
| Charge-offs | — |
| | (1,711 | ) | | (1,711 | ) | | (222 | ) | | (12,046 | ) | | (12,268 | ) |
| Recoveries | 153 |
| | 1,743 |
| | 1,896 |
| | 8 |
| | 760 |
| | 768 |
|
| Ending balance | $ | 11,236 |
| | $ | 100,905 |
| | $ | 112,141 |
| | $ | 10,338 |
| | $ | 124,633 |
| | $ | 134,971 |
|
18 |
| | | | | | | | | | | | | | | | | | | | | | | |
| | Six Months Ended June 30, |
| | 2019 | | 2018 |
| | Residential and Other Consumer | | Commercial | | Total | | Residential and Other Consumer | | Commercial | | Total |
| Beginning balance | $ | 10,788 |
| | $ | 99,143 |
| | $ | 109,931 |
| | $ | 10,720 |
| | $ | 134,075 |
| | $ | 144,795 |
|
| Provision | 281 |
| | 7,253 |
| | 7,534 |
| | 94 |
| | 12,048 |
| | 12,142 |
|
| Charge-offs | — |
| | (7,844 | ) | | (7,844 | ) | | (504 | ) | | (22,396 | ) | | (22,900 | ) |
| Recoveries | 167 |
| | 2,353 |
| | 2,520 |
| | 28 |
| | 906 |
| | 934 |
|
| Ending balance | $ | 11,236 |
| | $ | 100,905 |
| | $ | 112,141 |
| | $ | 10,338 |
| | $ | 124,633 |
| | $ | 134,971 |
|
BANKUNITED, INC. AND SUBSIDIARIES
NOTES TO CONSOLIDATED FINANCIAL STATEMENTS - UNAUDITED
September 30, 2017
|
| | | | | | | | | | | | | | | | | | | | | | | | | | | |
| | Nine Months Ended September 30, |
| | 2017 | | 2016 |
| | Residential and Other Consumer | | Commercial | | Unallocated | | Total | | Residential and Other Consumer | | Commercial | | Total |
| Beginning balance | $ | 11,503 |
| | $ | 141,450 |
| | $ | — |
| | $ | 152,953 |
| | $ | 16,211 |
| | $ | 109,617 |
| | $ | 125,828 |
|
| Provision for (recovery of) loan losses: | | | | | | | | | | | | | |
| Covered loans | 2,738 |
| | (45 | ) | | — |
| | 2,693 |
| | (1,074 | ) | | (45 | ) | | (1,119 | ) |
| Non-covered loans | (52 | ) | | 55,932 |
| | 5,000 |
| | 60,880 |
| | (420 | ) | | 43,988 |
| | 43,568 |
|
| Total provision | 2,686 |
| | 55,887 |
| | 5,000 |
| | 63,573 |
| | (1,494 | ) | | 43,943 |
| | 42,449 |
|
| Charge-offs: | | | | | | | | | | | | | |
| Covered loans | (55 | ) | | — |
| | — |
| | (55 | ) | | (1,086 | ) | | — |
| | (1,086 | ) |
| Non-covered loans | — |
| | (61,034 | ) | | — |
| | (61,034 | ) | | — |
| | (15,748 | ) | | (15,748 | ) |
| Total charge-offs | (55 | ) | | (61,034 | ) | | — |
| | (61,089 | ) | | (1,086 | ) | | (15,748 | ) | | (16,834 | ) |
| Recoveries: | | | | | | | | | | | | | |
| Covered loans | 65 |
| | 45 |
| | — |
| | 110 |
| | 77 |
| | 45 |
| | 122 |
|
| Non-covered loans | 21 |
| | 3,005 |
| | — |
| | 3,026 |
| | 18 |
| | 2,893 |
| | 2,911 |
|
| Total recoveries | 86 |
| | 3,050 |
| | — |
| | 3,136 |
| | 95 |
| | 2,938 |
| | 3,033 |
|
| Ending balance | $ | 14,220 |
| | $ | 139,353 |
| | $ | 5,000 |
| | $ | 158,573 |
| | $ | 13,726 |
| | $ | 140,750 |
| | $ | 154,476 |
|
BANKUNITED, INC. AND SUBSIDIARIES
NOTES TO CONSOLIDATED FINANCIAL STATEMENTS - UNAUDITED
September 30, 2017
The following table presents information about the balance of the ALLL and related loans at the dates indicated (in thousands):
|
| | | | | | | | | | | | | | | | | | | | | | | |
| | June 30, 2019 | | December 31, 2018 |
| | Residential and Other Consumer | | Commercial | | Total | | Residential and Other Consumer | | Commercial | | Total |
| Allowance for loan and lease losses: | | | | | | | |
| | |
| | |
|
| Ending balance | $ | 11,236 |
| | $ | 100,905 |
| | $ | 112,141 |
| | $ | 10,788 |
| | $ | 99,143 |
| | $ | 109,931 |
|
| Ending balance: loans individually evaluated for impairment | $ | 15 |
| | $ | 9,481 |
| | $ | 9,496 |
| | $ | 134 |
| | $ | 12,143 |
| | $ | 12,277 |
|
| Ending balance: loans collectively evaluated for impairment | $ | 11,221 |
| | $ | 91,424 |
| | $ | 102,645 |
| | $ | 10,654 |
| | $ | 87,000 |
| | $ | 97,654 |
|
| Ending balance: ACI loans | $ | — |
| | $ | — |
| | $ | — |
| | $ | — |
| | $ | — |
| | $ | — |
|
| Loans: | | | | | 0 |
| | | | | | |
| Ending balance | $ | 5,267,788 |
| | $ | 17,324,061 |
| | $ | 22,591,849 |
| | $ | 4,948,989 |
| | $ | 17,028,019 |
| | $ | 21,977,008 |
|
| Ending balance: loans individually evaluated for impairment | $ | 14,572 |
| | $ | 123,119 |
| | $ | 137,691 |
| | $ | 7,690 |
| | $ | 108,841 |
| | $ | 116,531 |
|
| Ending balance: loans collectively evaluated for impairment | $ | 5,079,187 |
| | $ | 17,183,398 |
| | $ | 22,262,585 |
| | $ | 4,751,076 |
| | $ | 16,901,253 |
| | $ | 21,652,329 |
|
| Ending balance: ACI loans | $ | 174,029 |
| | $ | 17,544 |
| | $ | 191,573 |
| | $ | 190,223 |
| | $ | 17,925 |
| | $ | 208,148 |
|
|
| | | | | | | | | | | | | | | | | | | | | | | | | | | |
| | September 30, 2017 | | December 31, 2016 |
| | Residential and Other Consumer | | Commercial | | Unallocated | | Total | | Residential and Other Consumer | | Commercial | | Total |
| Allowance for loan and lease losses: | | | | | | | | | |
| | |
| | |
|
| Ending balance | $ | 14,220 |
| | $ | 139,353 |
| | $ | 5,000 |
| | $ | 158,573 |
| | $ | 11,503 |
| | $ | 141,450 |
| | $ | 152,953 |
|
| Covered loans: | | | | | | | | | | | | | |
| Ending balance | $ | 4,848 |
| | $ | — |
| | $ | — |
| | $ | 4,848 |
| | $ | 2,100 |
| | $ | — |
| | $ | 2,100 |
|
| Ending balance: non-ACI loans individually evaluated for impairment | $ | 1,024 |
| | $ | — |
| | $ | — |
| | $ | 1,024 |
| | $ | 529 |
| | $ | — |
| | $ | 529 |
|
| Ending balance: non-ACI loans collectively evaluated for impairment | $ | 2,012 |
| | $ | — |
| | $ | — |
| | $ | 2,012 |
| | $ | 1,571 |
| | $ | — |
| | $ | 1,571 |
|
| Ending balance: ACI loans | $ | 1,812 |
| | $ | — |
| | $ | — |
| | $ | 1,812 |
| | $ | — |
| | $ | — |
| | $ | — |
|
| Non-covered loans: | | | | | | | | | | | | | |
| Ending balance | $ | 9,372 |
| | $ | 139,353 |
| | $ | 5,000 |
| | $ | 153,725 |
| | $ | 9,403 |
| | $ | 141,450 |
| | $ | 150,853 |
|
| Ending balance: new loans individually evaluated for impairment | $ | 71 |
| | $ | 23,902 |
| | $ | — |
| | $ | 23,973 |
| | $ | 12 |
| | $ | 19,229 |
| | $ | 19,241 |
|
| Ending balance: new loans collectively evaluated for impairment | $ | 9,301 |
| | $ | 115,451 |
| | $ | 5,000 |
| | $ | 129,752 |
| | $ | 9,391 |
| | $ | 122,221 |
| | $ | 131,612 |
|
| Ending balance: ACI loans | $ | — |
| | $ | — |
| | $ | — |
| | $ | — |
| | $ | — |
| | $ | — |
| | $ | — |
|
| Loans: | | | | | | | 0 |
| | | | | | |
| Covered loans: | | | | | | | | | | | | | |
| Ending balance | $ | 537,976 |
| | $ | — |
| | $ | — |
| | $ | 537,976 |
| | $ | 614,042 |
| | $ | — |
| | $ | 614,042 |
|
| Ending balance: non-ACI loans individually evaluated for impairment | $ | 11,721 |
| | $ | — |
| | $ | — |
| | $ | 11,721 |
| | $ | 12,396 |
| | $ | — |
| | $ | 12,396 |
|
| Ending balance: non-ACI loans collectively evaluated for impairment | $ | 50,315 |
| | $ | — |
| | $ | — |
| | $ | 50,315 |
| | $ | 65,404 |
| | $ | — |
| | $ | 65,404 |
|
| Ending balance: ACI loans | $ | 475,940 |
| | $ | — |
| | $ | — |
| | $ | 475,940 |
| | $ | 536,242 |
| | $ | — |
| | $ | 536,242 |
|
| Non-covered loans: | | | | | | | | | | | | | |
| Ending balance | $ | 4,033,612 |
| | $ | 16,038,842 |
| | $ | — |
| | $ | 20,072,454 |
| | $ | 3,495,775 |
| | $ | 15,285,577 |
| | $ | 18,781,352 |
|
| Ending balance: new loans individually evaluated for impairment | $ | 911 |
| | $ | 210,364 |
| | $ | — |
| | $ | 211,275 |
| | $ | 561 |
| | $ | 176,932 |
| | $ | 177,493 |
|
| Ending balance: new loans collectively evaluated for impairment | $ | 4,032,701 |
| | $ | 15,790,546 |
| | $ | — |
| | $ | 19,823,247 |
| | $ | 3,495,207 |
| | $ | 15,061,707 |
| | $ | 18,556,914 |
|
| Ending balance: ACI loans | $ | — |
| | $ | 37,932 |
| | $ | — |
| | $ | 37,932 |
| | $ | 7 |
| | $ | 46,938 |
| | $ | 46,945 |
|
The ALLL on residential and other consumer ACI loans at September 30, 2017 represents impairment of one pool of ACI home equity loans and lines of credit.
The ALLL at September 30, 2017 included $5.4 million related to the impact of Hurricanes Irma and Harvey, which made landfall during the three months ended September 30, 2017. The ALLL includes $0.4 million related to commercial loans that were downgraded during the three months ended September 30, 2017 as a result of the hurricanes and a $5.0 million unallocated qualitative allowance.
BANKUNITED, INC. AND SUBSIDIARIES
NOTES TO CONSOLIDATED FINANCIAL STATEMENTS - UNAUDITED
September 30, 2017
Credit quality information
Loans, other than ACI loans and government insured residential loans, are considered impaired when, based on current information and events, it is probable that the Company will be unable to collect the scheduled payments of principal or interest when due, according to the contractual terms of the loan agreements. Commercial relationships on non-accrual status with committed balances
BANKUNITED, INC. AND SUBSIDIARIES
NOTES TO CONSOLIDATED FINANCIAL STATEMENTS - UNAUDITED
June 30, 2019
greater than or equal to $1.0 million that have internal risk ratings of substandard or doubtful and are on non-accrual status, as well as loans that have been modified in TDRs, are individually evaluated for impairment. Other commercial relationships on non-accrual status with committed balances under $1.0 million may also be evaluated individually for impairment at management's discretion. The likelihood of loss related to loans assigned internal risk ratings of substandard or doubtful is considered elevated due to their identified credit weaknesses. Factors considered by management in evaluating impairment include payment status, financial condition of the borrower, collateral value, and other factors impacting the probability of collecting scheduled principal and interest payments when due.
An ACI loanspool or pools areloan is considered to be impaired when it is probable that the Company will be unable to collect all of the expected cash flows expected at acquisition, (as adjusted for anyplus additional cash flows expected to be collected arising from changes in estimates after acquisition), other than dueacquisition. 1-4 single family residential and home equity ACI loans accounted for in pools are evaluated collectively for impairment on a pool by pool basis based on expected pool cash flows. Commercial ACI loans are individually evaluated for impairment based on expected cash flows from the individual loans. Discount continues to changesbe accreted on ACI loans or pools as long as there are expected future cash flows in interest rate indicesexcess of the current carrying amount of the loans or pools.
The table below presents information about loans identified as impaired at the dates indicated (in thousands):
|
| | | | | | | | | | | | | | | | | | | | | | | |
| | June 30, 2019 | | December 31, 2018 |
| | Recorded Investment | | UPB | | Related Specific Allowance | | Recorded Investment | | UPB | | Related Specific Allowance |
| With no specific allowance recorded: | |
| | |
| | |
| | |
| | |
| | |
|
1-4 single family residential (1) | $ | 10,005 |
| | $ | 9,922 |
| | $ | — |
| | $ | 5,724 |
| | $ | 5,605 |
| | $ | — |
|
| Multi-family | 24,834 |
| | 24,866 |
| | — |
| | 25,560 |
| | 25,592 |
| | — |
|
| Non-owner occupied commercial real estate | 26,101 |
| | 26,134 |
| | — |
| | 12,293 |
| | 12,209 |
| | — |
|
| Construction and land | 9,418 |
| | 9,421 |
| | — |
| | 9,923 |
| | 9,925 |
| | — |
|
| Owner occupied commercial real estate | 14,791 |
| | 14,890 |
| | — |
| | 9,007 |
| | 9,024 |
| | — |
|
Commercial and industrial | 8,432 |
| | 8,436 |
| | — |
| | 13,514 |
| | 13,519 |
| | — |
|
| Commercial lending subsidiaries | 5,205 |
| | 5,226 |
| | — |
| | 3,152 |
| | 3,149 |
| | — |
|
| With a specific allowance recorded: | | | | | | | | | | | |
| 1-4 single family residential | 4,567 |
| | 4,496 |
| | 15 |
| | 1,966 |
| | 1,941 |
| | 134 |
|
| Owner occupied commercial real estate | — |
| | — |
| | — |
| | 3,316 |
| | 3,322 |
| | 844 |
|
| Non-owner occupied commercial real estate | — |
| | — |
| | — |
| | 1,666 |
| | 1,667 |
| | 731 |
|
| Commercial and industrial | 24,522 |
| | 24,524 |
| | 6,533 |
| | 10,939 |
| | 10,946 |
| | 3,831 |
|
| Commercial lending subsidiaries | 9,816 |
| | 9,736 |
| | 2,948 |
| | 19,471 |
| | 19,385 |
| | 6,737 |
|
| Total: | | | | | | | | | | | |
| Residential and other consumer | $ | 14,572 |
| | $ | 14,418 |
| | $ | 15 |
| | $ | 7,690 |
| | $ | 7,546 |
| | $ | 134 |
|
| Commercial | 123,119 |
| | 123,233 |
| | 9,481 |
| | 108,841 |
| | 108,738 |
| | 12,143 |
|
| | $ | 137,691 |
| | $ | 137,651 |
| | $ | 9,496 |
| | $ | 116,531 |
| | $ | 116,284 |
| | $ | 12,277 |
|
| |
| (1) | Includes government insured residential loans modified in TDRs totaling $9.9 million and $3.5 million at June 30, 2019 and December 31, 2018, respectively. |
Included in the table above is the guaranteed portion of impaired SBA loans totaling $21.8 million and prepayment assumptions.$13.1 million at June 30, 2019 and December 31, 2018, respectively, with no specific allowance recorded. Interest income recognized on impaired loans was immaterial for the three and six months ended June 30, 2019 and 2018.
BANKUNITED, INC. AND SUBSIDIARIES
NOTES TO CONSOLIDATED FINANCIAL STATEMENTS - UNAUDITED
SeptemberJune 30, 20172019
The table below presents information about loans or ACI pools identified as impaired at the dates indicated (in thousands):
|
| | | | | | | | | | | | | | | | | | | | | | | |
| | September 30, 2017 | | December 31, 2016 |
| | Recorded Investment | | UPB | | Related Specific Allowance | | Recorded Investment | | UPB | | Related Specific Allowance |
| Non-covered loans: | |
| | |
| | |
| | |
| | |
| | |
|
| With no specific allowance recorded: | |
| | |
| | |
| | |
| | |
| | |
|
| 1-4 single family residential | $ | 27 |
| | $ | 32 |
| | $ | — |
| | $ | — |
| | $ | — |
| | $ | — |
|
| Non-owner occupied commercial real estate | 9,041 |
| | 9,224 |
| | — |
| | 510 |
| | 512 |
| | — |
|
| Construction and land | 1,238 |
| | 1,238 |
| | — |
| | 1,238 |
| | 1,238 |
| | — |
|
| Owner occupied commercial real estate | 16,786 |
| | 16,949 |
| | — |
| | 16,834 |
| | 16,894 |
| | — |
|
Commercial and industrial |
|
| |
|
| |
|
| |
|
| |
|
| | |
| Taxi medallion loans | 20,320 |
| | 20,321 |
| | — |
| | 18,107 |
| | 18,107 |
| | — |
|
| Other commercial and industrial | 1,081 |
| | 1,095 |
| | — |
| | 6,172 |
| | 6,172 |
| | — |
|
| Commercial lending subsidiaries | 12,810 |
| | 12,815 |
| | — |
| | 10,620 |
| | 10,510 |
| | — |
|
| With a specific allowance recorded: | | | | | | | | | | | |
| 1-4 single family residential | 884 |
| | 863 |
| | 71 |
| | 561 |
| | 546 |
| | 12 |
|
| Owner occupied commercial real estate | 3,961 |
| | 3,943 |
| | 2,994 |
| | 491 |
| | 513 |
| | 263 |
|
| Commercial and industrial |
|
| |
|
| |
|
| |
|
| |
|
| |
|
|
| Taxi medallion loans | 100,252 |
| | 100,255 |
| | 13,117 |
| | 73,131 |
| | 73,147 |
| | 5,948 |
|
| Other commercial and industrial | 41,297 |
| | 41,292 |
| | 7,313 |
| | 29,452 |
| | 29,463 |
| | 9,168 |
|
| Commercial lending subsidiaries | 3,578 |
| | 3,553 |
| | 478 |
| | 21,712 |
| | 21,605 |
| | 3,850 |
|
| Total: | | | | | | | | | | | |
| Residential and other consumer | $ | 911 |
| | $ | 895 |
| | $ | 71 |
| | $ | 561 |
| | $ | 546 |
| | $ | 12 |
|
| Commercial | 210,364 |
| | 210,685 |
| | 23,902 |
| | 178,267 |
| | 178,161 |
| | 19,229 |
|
| | $ | 211,275 |
| | $ | 211,580 |
| | $ | 23,973 |
| | $ | 178,828 |
| | $ | 178,707 |
| | $ | 19,241 |
|
| Covered loans: | | | | | | | | | | | |
| Non-ACI loans: | | | | | | | |
| | |
| | |
|
| With no specific allowance recorded: | | | | | | | |
| | |
| | |
|
| 1-4 single family residential | $ | 102 |
| | $ | 118 |
| | $ | — |
| | $ | 1,169 |
| | $ | 1,391 |
| | $ | — |
|
| Home equity loans and lines of credit | 1,312 |
| | 1,324 |
| | — |
| | 2,255 |
| | 2,286 |
| | — |
|
| With a specific allowance recorded: | | | | | | | | | | | |
| 1-4 single family residential | 2,221 |
| | 2,579 |
| | 208 |
| | 1,272 |
| | 1,514 |
| | 181 |
|
| Home equity loans and lines of credit | 8,086 |
| | 8,163 |
| | 816 |
| | 7,700 |
| | 7,804 |
| | 348 |
|
| | $ | 11,721 |
| | $ | 12,184 |
| | $ | 1,024 |
| | $ | 12,396 |
| | $ | 12,995 |
| | $ | 529 |
|
| ACI loans: | | | | | | | |
| | |
| | |
|
| With a specific allowance recorded: | | | | | | | |
| | |
| | |
|
| Home equity loans and lines of credit | $ | 5,640 |
| | $ | 27,731 |
| | $ | 1,812 |
| | $ | — |
| | $ | — |
| | $ | — |
|
Non-covered impaired loans include commercial real estate ACI loans modified in TDRs with a carrying value of $1.3 million as of December 31, 2016. Interest income recognized on impaired loans and pools for the three and nine months ended September 30, 2017 was approximately $2.9 million and $8.3 million, respectively. Interest income recognized on impaired loans for the three and nine months ended September 30, 2016 was not material.
BANKUNITED, INC. AND SUBSIDIARIES
NOTES TO CONSOLIDATED FINANCIAL STATEMENTS - UNAUDITED
September 30, 2017
The following tables presenttable presents the average recorded investment in impaired loans or ACI pools for the periods indicated (in thousands):
|
| | | | | | | | | | | | | | | |
| | Three Months Ended June 30, | | Six Months Ended June 30, |
| | 2019 | | 2018 | | 2019 | | 2018 |
| Residential and other consumer: | |
| | | | |
| | |
| 1-4 single family residential | $ | 12,732 |
| | $ | 6,932 |
| | $ | 11,011 |
| | $ | 5,764 |
|
| | | | | | | | |
| Commercial: | | | | | | | |
| Multi-family | 25,066 |
| | 26,260 |
| | 25,248 |
| | 25,490 |
|
| Non-owner occupied commercial real estate | 24,599 |
| | 14,123 |
| | 21,563 |
| | 13,499 |
|
| Construction and land | 9,604 |
| | 5,244 |
| | 9,730 |
| | 4,196 |
|
| Owner occupied commercial real estate | 12,741 |
| | 16,751 |
| | 12,124 |
| | 19,175 |
|
Commercial and industrial(1) | 32,690 |
| | 109,186 |
| | 30,564 |
| | 109,749 |
|
| Commercial lending subsidiaries | 18,082 |
| | 1,506 |
| | 19,982 |
| | 1,816 |
|
| | 122,782 |
| | 173,070 |
| | 119,211 |
| | 173,925 |
|
| | $ | 135,514 |
| | $ | 180,002 |
| | $ | 130,222 |
| | $ | 179,689 |
|
|
| | | | | | | | | | | | | | | | | | | | | | | |
| | Three Months Ended September 30, |
| | 2017 | | 2016 |
| | | | Covered Loans | | | | Covered Loans |
| | Non-Covered Loans | | Non-ACI Loans | | ACI Loans | | Non-Covered Loans | | Non-ACI
Loans | | ACI Loans |
| Residential and other consumer: | |
| | |
| | | | | | |
| | |
| 1-4 single family residential | $ | 962 |
| | $ | 2,304 |
| | $ | — |
| | $ | 344 |
| | $ | 3,001 |
| | $ | — |
|
| Home equity loans and lines of credit | — |
| | 9,533 |
| | 5,166 |
| | — |
| | 9,551 |
| | — |
|
| | 962 |
| | $ | 11,837 |
| | $ | 5,166 |
| | 344 |
| | $ | 12,552 |
| | $ | — |
|
| Commercial: | | | | | | | | | | | |
| Multi-family | 1,359 |
| | | | | | — |
| | | | |
| Non-owner occupied commercial real estate | 8,216 |
| | | | | | 506 |
| | | | |
| Construction and land | 2,797 |
| | | | | | 1,285 |
| | | | |
| Owner occupied commercial real estate | 20,579 |
| | | | | | 18,231 |
| | | | |
| Commercial and industrial | | | | | | |
|
| | | | |
| Taxi medallion loans | 123,867 |
| | | | | | 56,125 |
| | | | |
| Other commercial and industrial | 42,479 |
| | | | | | 48,143 |
| | | | |
| Commercial lending subsidiaries | 21,398 |
| | | | | | 13,873 |
| | | | |
| | 220,695 |
| | | | | | 138,163 |
| | | |
|
|
| | $ | 221,657 |
| | | | | | $ | 138,507 |
| | | |
|
|
|
| | | | | | | | | | | | | | | | | | | | | | | |
| | Nine Months Ended September 30, |
| | 2017 | | 2016 |
| | | | Covered Loans | | | | Covered Loans |
| | Non-Covered Loans | | Non-ACI Loans | | ACI Loans | | Non-Covered Loans | | Non-ACI
Loans | | ACI Loans |
| Residential and other consumer: | |
| | |
| | | | | | |
| | |
| 1-4 single family residential | $ | 800 |
| | $ | 2,369 |
| | $ | — |
| | $ | 251 |
| | $ | 3,186 |
| | $ | — |
|
| Home equity loans and lines of credit | — |
| | 9,638 |
| | 4,209 |
| | — |
| | 8,920 |
| | — |
|
| | 800 |
| | $ | 12,007 |
| | $ | 4,209 |
| | 251 |
| | $ | 12,106 |
| | $ | — |
|
| Commercial: | | | | | | | | | | | |
| Multi-family | 1,816 |
| | | | | | — |
| | | | |
| Non-owner occupied commercial real estate | 4,056 |
| | | | | | 776 |
| | | | |
| Construction and land | 3,317 |
| | | | | | 650 |
| | | | |
| Owner occupied commercial real estate | 18,872 |
| | | | | | 13,711 |
| | | | |
| Commercial and industrial | | | | | | |
|
| | | | |
| Taxi medallion loans | 107,529 |
| | | | | | 30,977 |
| | | | |
| Other commercial and industrial | 43,308 |
| | | | | | 41,975 |
| | | | |
| Commercial lending subsidiaries | 27,202 |
| | | | | | 11,293 |
| | | | |
| | 206,100 |
| | | | | | 99,382 |
| | | |
|
|
| | $ | 206,900 |
| | | | | | $ | 99,633 |
| | | |
|
|
BANKUNITED, INC. AND SUBSIDIARIES
NOTES TO CONSOLIDATED FINANCIAL STATEMENTS - UNAUDITED
September 30, 2017
| |
| (1) | Includes average recorded investment in taxi medallion loans totaling $93 million and $97 million during the three and six months ended June 30, 2018, respectively. |
The following table presents the recorded investment in loans on non-accrual status as of the dates indicated (in thousands):
| | | | September 30, 2017 | | December 31, 2016 | | | | | |
| | Non-Covered Loans | | Covered
Non-ACI Loans | | Non-Covered Loans | | Covered Non-ACI Loans | June 30, 2019 | | December 31, 2018 |
| Residential and other consumer: | |
| | |
| | |
| | |
| |
| | |
|
| 1-4 single family residential | $ | 1,890 |
| | $ | 934 |
| | $ | 566 |
| | $ | 918 |
| $ | 10,807 |
| | $ | 6,316 |
|
| Home equity loans and lines of credit | — |
| | 2,369 |
| | — |
| | 2,283 |
| 30 |
| | — |
|
| Other consumer loans | 332 |
| | — |
| | 2 |
| | — |
| 277 |
| | 288 |
|
| | 2,222 |
| | $ | 3,303 |
| | 568 |
| | $ | 3,201 |
| 11,114 |
| | 6,604 |
|
| Commercial: | | | | | |
| | |
| | | |
| Multi-family | | 24,834 |
| | 25,560 |
|
| Non-owner occupied commercial real estate | 9,930 |
| | | | 559 |
| |
|
| 27,623 |
| | 16,050 |
|
| Construction and land | 1,238 |
| | | | 1,238 |
| |
|
| 9,418 |
| | 9,923 |
|
| Owner occupied commercial real estate | 21,455 |
| | | | 19,439 |
| |
|
| 21,752 |
| | 19,789 |
|
Commercial and industrial | | | | |
|
| |
|
| 27,176 |
| | 28,584 |
|
| Taxi medallion loans | 120,572 |
| | | | 60,660 |
| | | |
| Other commercial and industrial | 27,569 |
| | | | 16,036 |
| | | |
| Commercial lending subsidiaries | 16,625 |
| | | | 32,645 |
| |
|
| 16,236 |
| | 22,733 |
|
| | 197,389 |
| | | | 130,577 |
| |
|
| 127,039 |
| | 122,639 |
|
| | $ | 199,611 |
| | | | $ | 131,145 |
| |
|
| $ | 138,153 |
| | $ | 129,243 |
|
Non-coveredIncluded in the table above is the guaranteed portion of non-accrual SBA loans totaling $28.4 million and $17.8 million at June 30, 2019 and December 31, 2018, respectively. Loans contractually delinquent by 90 days or more and still accruing totaled $0.7 million at December 31, 2018. There were no loans contractually delinquent by 90 days or more and still accruing totaled $0.8 million and $1.6 million at SeptemberJune 30, 2017 and December 31, 2016, respectively.2019. The amount of additional interest income that would have been recognized on non-accrual loans had they performed in accordance with their contractual terms was approximately $1.4$2.5 million and $3.7$4.3 million for the three and ninesix months ended SeptemberJune 30, 2017,2019, respectively, and $1.1$1.8 million and $2.3$3.0 million for the three and ninesix months ended SeptemberJune 30, 2016,2018, respectively.
Management considers delinquency status to be the most meaningful indicator of the credit quality of 1-4 single family residential, home equity and consumer loans. Delinquency statistics are updated at least monthly. See "Aging of loans" below
BANKUNITED, INC. AND SUBSIDIARIES
NOTES TO CONSOLIDATED FINANCIAL STATEMENTS - UNAUDITED
June 30, 2019
for more information on the delinquency status of loans. Original LTV and original FICO score are also important indicators of credit quality for the non-covered 1-4 single family residential portfolio.loans other than the FSB loans and government insured loans.
Internal risk ratings are considered the most meaningful indicator of credit quality for commercial loans. Internal risk ratings are a key factor in identifying loans that are individually evaluated for impairment and impact management’s estimates of loss factors used in determining the amount of the ALLL. Internal risk ratings are updated on a continuous basis. Generally, relationships with balances in excess of defined thresholds, ranging from $1 million to $3 million, are re-evaluated at least annually and more frequently if circumstances indicate that a change in risk rating may be warranted. Loans exhibiting potential credit weaknesses that deserve management’s close attention and that if left uncorrected may result in deterioration of the repayment capacity of the borrower are categorized as special mention. Loans with well-defined credit weaknesses, including payment defaults, declining collateral values, frequent overdrafts, operating losses, increasing balance sheet leverage, inadequate cash flow, project cost overruns, unreasonable construction delays, past due real estate taxes or exhausted interest reserves, are assigned an internal risk rating of substandard. A loan with a weakness so severe that collection in full is highly questionable or improbable, but because of certain reasonably specific pending factors has not been charged off, will be assigned an internal risk rating of doubtful.
BANKUNITED, INC. AND SUBSIDIARIES
NOTES TO CONSOLIDATED FINANCIAL STATEMENTS - UNAUDITED
September 30, 2017
The following tables summarize key indicators of credit quality for the Company's loans at the dates indicated. Amounts include premiums, discounts and deferred fees and costs (in thousands):
1-4 Single Family Residential credit exposure for non-coveredloans, excluding FSB loans and government insured residential loans, based on original LTV and FICO score:
| | | | | September 30, 2017 | | June 30, 2019 |
| | | FICO | | FICO |
| LTV | | 720 or less | | 721 - 740 | | 741 - 760 | | 761 or greater | | Total | | 720 or less | | 721 - 740 | | 741 - 760 | | 761 or
greater | | Total |
| 60% or less | | $ | 94,357 |
| | $ | 111,279 |
| | $ | 185,614 |
| | $ | 819,422 |
| | $ | 1,210,672 |
| |
| Less than 60% | | | $ | 110,475 |
| | $ | 124,463 |
| | $ | 190,874 |
| | $ | 796,918 |
| | $ | 1,222,730 |
|
| 60% - 70% | | 93,963 |
| | 102,461 |
| | 140,350 |
| | 586,158 |
| | 922,932 |
| | 139,870 |
| | 120,664 |
| | 178,995 |
| | 625,452 |
| | 1,064,981 |
|
| 70% - 80% | | 139,923 |
| | 173,808 |
| | 316,544 |
| | 1,091,868 |
| | 1,722,143 |
| | 183,277 |
| | 221,490 |
| | 400,406 |
| | 1,375,700 |
| | 2,180,873 |
|
| More than 80% | | 24,725 |
| | 20,610 |
| | 24,981 |
| | 85,781 |
| | 156,097 |
| | 21,467 |
| | 35,938 |
| | 39,863 |
| | 147,703 |
| | 244,971 |
|
| | | $ | 352,968 |
| | $ | 408,158 |
| | $ | 667,489 |
| | $ | 2,583,229 |
| | $ | 4,011,844 |
| | $ | 455,089 |
| | $ | 502,555 |
| | $ | 810,138 |
| | $ | 2,945,773 |
| | $ | 4,713,555 |
|
| | | | | December 31, 2016 | | December 31, 2018 |
| | | FICO | | FICO |
| LTV | | 720 or less | | 721 - 740 | | 741 - 760 | | 761 or greater | | Total | | 720 or less | | 721 - 740 | | 741 - 760 | | 761 or
greater | | Total |
| 60% or less | | $ | 87,035 |
| | $ | 113,401 |
| | $ | 163,668 |
| | $ | 751,291 |
| | $ | 1,115,395 |
| |
| Less than 60% | | | $ | 105,812 |
| | $ | 123,877 |
| | $ | 197,492 |
| | $ | 813,944 |
| | $ | 1,241,125 |
|
| 60% - 70% | | 80,694 |
| | 94,592 |
| | 124,180 |
| | 523,970 |
| | 823,436 |
| | 120,982 |
| | 109,207 |
| | 170,531 |
| | 597,659 |
| | 998,379 |
|
| 70% - 80% | | 110,509 |
| | 148,211 |
| | 276,425 |
| | 907,450 |
| | 1,442,595 |
| | 156,519 |
| | 203,121 |
| | 374,311 |
| | 1,264,491 |
| | 1,998,442 |
|
| More than 80% | | 22,115 |
| | 9,058 |
| | 15,470 |
| | 42,280 |
| | 88,923 |
| | 17,352 |
| | 35,036 |
| | 36,723 |
| | 136,487 |
| | 225,598 |
|
| | | $ | 300,353 |
| | $ | 365,262 |
| | $ | 579,743 |
| | $ | 2,224,991 |
| | $ | 3,470,349 |
| | $ | 400,665 |
| | $ | 471,241 |
| | $ | 779,057 |
| | $ | 2,812,581 |
| | $ | 4,463,544 |
|
BANKUNITED, INC. AND SUBSIDIARIES
NOTES TO CONSOLIDATED FINANCIAL STATEMENTS - UNAUDITED
SeptemberJune 30, 20172019
Commercial credit exposure, based on internal risk rating:
| | | | September 30, 2017 | June 30, 2019 |
| | | | | | | | | | Commercial and Industrial | | | | | | | | | | | | | | | Commercial Lending Subsidiaries | | |
| | Multi-Family | | Non-Owner Occupied Commercial Real Estate | | Construction
and Land | | Owner Occupied Commercial Real Estate | | Taxi Medallion Loans | | Other Commercial and Industrial | | Commercial Lending Subsidiaries | | Total | Multi-Family | | Non-Owner Occupied Commercial Real Estate | | Construction
and Land | | Owner Occupied Commercial Real Estate | | Commercial and Industrial | | Pinnacle | | Bridge | | Total |
| Pass | $ | 3,299,753 |
| | $ | 4,069,749 |
| | $ | 265,921 |
| | $ | 1,890,785 |
| | $ | — |
| | $ | 3,666,227 |
| | $ | 2,313,152 |
| | $ | 15,505,587 |
| $ | 2,335,356 |
| | $ | 4,826,910 |
| | $ | 227,476 |
| | $ | 2,026,416 |
| | $ | 5,063,682 |
| | $ | 1,269,469 |
| | $ | 1,207,657 |
| | $ | 16,956,966 |
|
| Special mention | 32,255 |
| | 12,824 |
| | — |
| | 31,495 |
| | — |
| | 38,389 |
| | 35,936 |
| | 150,899 |
| — |
| | 6,744 |
| | — |
| | 20,212 |
| | 24,014 |
| | — |
| | 8,817 |
| | 59,787 |
|
| Substandard | 30,253 |
| | 90,996 |
| | 5,535 |
| | 31,460 |
| | 120,572 |
| | 64,087 |
| | 33,637 |
| | 376,540 |
| 47,760 |
| | 100,403 |
| | 9,418 |
| | 31,189 |
| | 61,264 |
| | — |
| | 50,726 |
| | 300,760 |
|
| Doubtful | — |
| | — |
| | — |
| | 3,009 |
| | — |
| | 2,807 |
| | — |
| | 5,816 |
| — |
| | — |
| | — |
| | — |
| | 3,683 |
| | — |
| | 2,865 |
| | 6,548 |
|
| | $ | 3,362,261 |
| | $ | 4,173,569 |
| | $ | 271,456 |
| | $ | 1,956,749 |
| | $ | 120,572 |
| | $ | 3,771,510 |
| | $ | 2,382,725 |
| | $ | 16,038,842 |
| $ | 2,383,116 |
| | $ | 4,934,057 |
| | $ | 236,894 |
| | $ | 2,077,817 |
| | $ | 5,152,643 |
| | $ | 1,269,469 |
| | $ | 1,270,065 |
| | $ | 17,324,061 |
|
|
| | | | | | | | | | | | | | | | | | | | | | | | | | | | | | | |
| | December 31, 2016 |
| | | | | | | | | | Commercial and Industrial | | | | |
| | Multi-Family | | Non-Owner Occupied Commercial Real Estate | | Construction and Land | | Owner Occupied Commercial Real Estate | | Taxi Medallion Loans | | Other Commercial and Industrial | | Commercial Lending Subsidiaries | | Total |
| Pass | $ | 3,811,822 |
| | $ | 3,694,931 |
| | $ | 309,675 |
| | $ | 1,672,199 |
| | $ | 40,460 |
| | $ | 3,112,590 |
| | $ | 2,255,444 |
| | $ | 14,897,121 |
|
| Special mention | 12,000 |
| | 7,942 |
| | — |
| | 33,274 |
| | — |
| | 19,009 |
| | — |
| | 72,225 |
|
| Substandard | 5,852 |
| | 28,935 |
| | 1,238 |
| | 30,377 |
| | 138,035 |
| | 68,704 |
| | 31,572 |
| | 304,713 |
|
| Doubtful | — |
| | — |
| | — |
| | — |
| | 178 |
| | 8,162 |
| | 3,178 |
| | 11,518 |
|
| | $ | 3,829,674 |
| | $ | 3,731,808 |
|
| $ | 310,913 |
| | $ | 1,735,850 |
|
| $ | 178,673 |
|
| $ | 3,208,465 |
| | $ | 2,290,194 |
|
| $ | 15,285,577 |
|
BANKUNITED, INC. AND SUBSIDIARIES
NOTES TO CONSOLIDATED FINANCIAL STATEMENTS - UNAUDITED
September 30, 2017
|
| | | | | | | | | | | | | | | | | | | | | | | | | | | | | | | |
| | December 31, 2018 |
| | | | | | | | | | | | Commercial Lending Subsidiaries | | |
| | Multi-Family | | Non-Owner Occupied Commercial Real Estate | | Construction
and Land | | Owner Occupied Commercial Real Estate | | Commercial and Industrial | | Pinnacle | | Bridge | | Total |
| Pass | $ | 2,547,835 |
| | $ | 4,611,029 |
| | $ | 216,917 |
| | $ | 2,077,611 |
| | $ | 4,706,666 |
| | $ | 1,462,655 |
| | $ | 1,105,821 |
| | $ | 16,728,534 |
|
| Special mention | 2,932 |
| | 16,516 |
| | — |
| | 13,368 |
| | 38,097 |
| | — |
| | 10,157 |
| | 81,070 |
|
| Substandard | 34,654 |
| | 61,335 |
| | 9,923 |
| | 28,901 |
| | 43,691 |
| | — |
| | 31,522 |
| | 210,026 |
|
| Doubtful | — |
| | — |
| | — |
| | — |
| | 1,746 |
| | — |
| | 6,643 |
| | 8,389 |
|
| | $ | 2,585,421 |
| | $ | 4,688,880 |
|
| $ | 226,840 |
| | $ | 2,119,880 |
|
| $ | 4,790,200 |
| | $ | 1,462,655 |
| | $ | 1,154,143 |
|
| $ | 17,028,019 |
|
Aging of loans:
The following table presents an aging of loans at the dates indicated. Amounts include premiums, discounts and deferred fees and costs (in thousands):
|
| | | | | | | | | | | | | | | | | | | | | | | | | | | | | | | | | | | | | | | |
| | June 30, 2019 | | December 31, 2018 |
| | Current | | 30 - 59 Days Past Due | | 60 - 89 Days Past Due | | 90 Days or More Past Due | | Total | | Current | | 30 - 59 Days Past Due | | 60 - 89 Days Past Due | | 90 Days or More Past Due | | Total |
| 1-4 single family residential | $ | 4,835,228 |
| | $ | 49,673 |
| | $ | 2,522 |
| | $ | 10,129 |
| | $ | 4,897,552 |
| | $ | 4,640,771 |
| | $ | 15,070 |
| | $ | 2,126 |
| | $ | 6,953 |
| | $ | 4,664,920 |
|
| Government insured residential | 37,086 |
| | 16,530 |
| | 14,878 |
| | 287,225 |
| | 355,719 |
| | 31,348 |
| | 8,342 |
| | 8,871 |
| | 218,168 |
| | 266,729 |
|
| Home equity loans and lines of credit | 1,393 |
| | 22 |
| | — |
| | 30 |
| | 1,445 |
| | 1,393 |
| | — |
| | — |
| | — |
| | 1,393 |
|
| Other consumer loans | 12,400 |
| | 672 |
| | — |
| | — |
| | 13,072 |
| | 15,947 |
| | — |
| | — |
| | — |
| | 15,947 |
|
| Multi-family | 2,364,546 |
| | 18,570 |
| | — |
| | — |
| | 2,383,116 |
| | 2,585,421 |
| | — |
| | — |
| | — |
| | 2,585,421 |
|
| Non-owner occupied commercial real estate | 4,927,847 |
| | 714 |
| | 559 |
| | 4,937 |
| | 4,934,057 |
| | 4,682,443 |
| | 3,621 |
| | 1,374 |
| | 1,442 |
| | 4,688,880 |
|
| Construction and land | 236,012 |
| | — |
| | — |
| | 882 |
| | 236,894 |
| | 224,828 |
| | 916 |
| | — |
| | 1,096 |
| | 226,840 |
|
| Owner occupied commercial real estate | 2,064,064 |
| | 2,124 |
| | — |
| | 11,629 |
| | 2,077,817 |
| | 2,106,104 |
| | 2,826 |
| | 1,087 |
| | 9,863 |
| | 2,119,880 |
|
| Commercial and industrial | 5,136,585 |
| | 5,498 |
| | 367 |
| | 10,193 |
| | 5,152,643 |
| | 4,772,978 |
| | 6,732 |
| | 926 |
| | 9,564 |
| | 4,790,200 |
|
| Commercial lending subsidiaries | | | | | | | | | | | | | | | | | | | |
| Pinnacle | 1,269,469 |
| | — |
| | — |
| | — |
| | 1,269,469 |
| | 1,462,655 |
| | — |
| | — |
| | — |
| | 1,462,655 |
|
| Bridge | 1,252,556 |
| | 13,879 |
| | — |
| | 3,630 |
| | 1,270,065 |
| | 1,152,312 |
| | 603 |
| | — |
| | 1,228 |
| | 1,154,143 |
|
| | $ | 22,137,186 |
| | $ | 107,682 |
| | $ | 18,326 |
| | $ | 328,655 |
| | $ | 22,591,849 |
| | $ | 21,676,200 |
| | $ | 38,110 |
| | $ | 14,384 |
| | $ | 248,314 |
| | $ | 21,977,008 |
|
BANKUNITED, INC. AND SUBSIDIARIES
NOTES TO CONSOLIDATED FINANCIAL STATEMENTS - UNAUDITED
June 30, 2019
|
| | | | | | | | | | | | | | | | | | | | | | | | | | | | | | | | | | | | | | | |
| | September 30, 2017 | | December 31, 2016 |
| | Current | | 30 - 59 Days Past Due | | 60 - 89 Days Past Due | | 90 Days or More Past Due | | Total | | Current | | 30 - 59 Days Past Due | | 60 - 89 Days Past Due | | 90 Days or More Past Due | | Total |
| Non-covered loans: | |
| | |
| | |
| | |
| | |
| | |
| | |
| | |
| | |
| | |
|
| 1-4 single family residential | $ | 3,994,758 |
| | $ | 13,964 |
| | $ | 444 |
| | $ | 2,678 |
| | $ | 4,011,844 |
| | $ | 3,457,606 |
| | $ | 10,355 |
| | $ | 325 |
| | $ | 2,063 |
| | $ | 3,470,349 |
|
| Home equity loans and lines of credit | 1,623 |
| | 21 |
| | — |
| | — |
| | 1,644 |
| | 1,120 |
| | — |
| | — |
| | — |
| | 1,120 |
|
| Other consumer loans | 19,623 |
| | 500 |
| | — |
| | 1 |
| | 20,124 |
| | 24,306 |
| | — |
| | — |
| | — |
| | 24,306 |
|
| Multi-family | 3,362,261 |
| | — |
| | — |
| | — |
| | 3,362,261 |
| | 3,829,674 |
| | — |
| | — |
| | — |
| | 3,829,674 |
|
| Non-owner occupied commercial real estate | 4,171,880 |
| | — |
| | — |
| | 1,689 |
| | 4,173,569 |
| | 3,730,470 |
| | 754 |
| | — |
| | 584 |
| | 3,731,808 |
|
| Construction and land | 270,218 |
| | — |
| | — |
| | 1,238 |
| | 271,456 |
| | 309,675 |
| | — |
| | — |
| | 1,238 |
| | 310,913 |
|
| Owner occupied commercial real estate | 1,947,728 |
| | 1,261 |
| | 266 |
| | 7,494 |
| | 1,956,749 |
| | 1,726,826 |
| | 1,557 |
| | 797 |
| | 6,670 |
| | 1,735,850 |
|
| Commercial and industrial | | | | | | | | | | | | | | | | | | | |
| Taxi medallion loans | 107,325 |
| | — |
| | 2,803 |
| | 10,444 |
| | 120,572 |
| | 137,856 |
| | 7,037 |
| | 4,563 |
| | 29,217 |
| | 178,673 |
|
| Other commercial and industrial | 3,769,065 |
| | 1,629 |
| | 58 |
| | 758 |
| | 3,771,510 |
| | 3,198,008 |
| | 2,515 |
| | 954 |
| | 6,988 |
| | 3,208,465 |
|
| Commercial lending subsidiaries | 2,382,725 |
| | — |
| | — |
| | — |
| | 2,382,725 |
| | 2,284,435 |
| | 12 |
| | 3,247 |
| | 2,500 |
| | 2,290,194 |
|
| | $ | 20,027,206 |
| | $ | 17,375 |
| | $ | 3,571 |
| | $ | 24,302 |
| | $ | 20,072,454 |
| | $ | 18,699,976 |
| | $ | 22,230 |
| | $ | 9,886 |
| | $ | 49,260 |
| | $ | 18,781,352 |
|
| Covered loans: | | | | | | | | | | | | | | | | | | | |
| Non-ACI loans: | | | | | | | | | | | |
| | |
| | |
| | |
| | |
|
| 1-4 single family residential | $ | 23,002 |
| | $ | 691 |
| | $ | — |
| | $ | 934 |
| | $ | 24,627 |
| | $ | 29,406 |
| | $ | 481 |
| | $ | — |
| | $ | 918 |
| | $ | 30,805 |
|
| Home equity loans and lines of credit | 33,263 |
| | 1,114 |
| | 663 |
| | 2,369 |
| | 37,409 |
| | 43,129 |
| | 1,255 |
| | 534 |
| | 2,077 |
| | 46,995 |
|
| | $ | 56,265 |
| | $ | 1,805 |
| | $ | 663 |
| | $ | 3,303 |
| | $ | 62,036 |
| | $ | 72,535 |
| | $ | 1,736 |
| | $ | 534 |
| | $ | 2,995 |
| | $ | 77,800 |
|
| ACI loans: | | | | | | | | | | | | | | | | | | | |
| 1-4 single family residential | $ | 436,051 |
| | $ | 14,126 |
| | $ | 2,549 |
| | $ | 17,574 |
| | $ | 470,300 |
| | $ | 500,272 |
| | $ | 13,524 |
| | $ | 2,990 |
| | $ | 15,562 |
| | $ | 532,348 |
|
| Home equity loans and lines of credit | 4,876 |
| | 89 |
| | 40 |
| | 635 |
| | 5,640 |
| | 3,460 |
| | 148 |
| | 23 |
| | 263 |
| | 3,894 |
|
| | $ | 440,927 |
| | $ | 14,215 |
| | $ | 2,589 |
| | $ | 18,209 |
| | $ | 475,940 |
| | $ | 503,732 |
| | $ | 13,672 |
| | $ | 3,013 |
| | $ | 15,825 |
| | $ | 536,242 |
|
1-4 single family residential and home equity ACIIncluded in the table above is the guaranteed portion of SBA loans that are contractually delinquent bypast due more than 90 days and accounted for in pools that are on accrual status because discount continues to be accreted totaled $18totaling $18.4 million and $16$8.8 million at SeptemberJune 30, 20172019 and December 31, 2016,2018, respectively.
Foreclosure of residential real estate
The carrying amount of foreclosed residential real estate properties included in "Other assets" in the accompanying consolidated balance sheets all of which were covered, totaled $4$5 million and $5$6 million at SeptemberJune 30, 20172019 and December 31, 2016,2018, respectively. The recorded investment in non-government insured residential mortgage loans in the process of foreclosure was $1.6 million at June 30, 2019 and was insignificant at December 31, 2018. The recorded investment in government insured residential loans in the process of foreclosure totaled $13$93 million and $8$85 million at SeptemberJune 30, 20172019 and December 31, 2016, respectively, substantially all of which were covered loans.
BANKUNITED, INC. AND SUBSIDIARIES
NOTES TO CONSOLIDATED FINANCIAL STATEMENTS - UNAUDITED
September 30, 2017
2018, respectively.
Troubled debt restructurings
The following table summarizestables summarize loans that were modified in TDRs during the periods indicated, as well as loans modified during the twelve months preceding SeptemberJune 30, 20172019 and 2016,2018 that experienced payment defaults during the periods indicated (dollars in thousands):
|
| | | | | | | | | | | | | | | | | | | | | | | | | | | |
| | Three Months Ended September 30, |
| | 2017 | | 2016 |
| | Loans Modified in TDRs
During the Period | | TDRs Experiencing Payment
Defaults During the Period | | Loans Modified in TDRs
During the Period | | TDRs Experiencing Payment
Defaults During the Period |
| | Number of
TDRs | | Recorded
Investment | | Number of
TDRs | | Recorded
Investment | | Number of
TDRs | | Recorded
Investment | | Number of
TDRs | | Recorded
Investment |
| Non-covered loans: | |
| | |
| | |
| | |
| | |
| | |
| | |
| | |
|
| 1-4 single family residential | — |
| | $ | — |
| | 2 |
| | $ | 269 |
| | — |
| | $ | — |
| | — |
| | $ | — |
|
| Owner occupied commercial real estate | — |
| | — |
| | — |
| | — |
| | 1 |
| | 491 |
| | — |
| | — |
|
| Commercial and industrial | | | | | | | | | | | | | | | |
| Taxi medallion loans | 15 |
| | 5,439 |
| | 6 |
| | 2,105 |
| | 18 |
| | 29,854 |
| | 8 |
| | 4,104 |
|
| Other commercial and industrial | 1 |
| | 978 |
| | — |
| | — |
| | 2 |
| | 1,646 |
| | — |
| |
|
|
| Commercial lending subsidiaries | — |
| | — |
| | — |
| | — |
| | 5 |
| | 4,433 |
| | 1 |
| | 3,500 |
|
| | 16 |
| | $ | 6,417 |
| | 8 |
| | $ | 2,374 |
| | 26 |
| | $ | 36,424 |
| | 9 |
| | $ | 7,604 |
|
| Covered loans: | | | | | | | | | | | | | | | |
| Non-ACI loans: | | | | | | | | | |
| | |
| | |
| | |
|
| Home equity loans and lines of credit | — |
| | $ | — |
| | 1 |
| | $ | 70 |
| | 10 |
| | $ | 1,671 |
| | — |
| | $ | — |
|
| ACI loans: | | | | | | | | | | | | | | | |
| Owner occupied commercial real estate | — |
| | $ | — |
| | — |
| | $ | — |
| | 1 |
| | $ | 839 |
| | — |
| | $ | — |
|
|
| | | | | | | | | | | | | | | | | | | | | | | | | | | |
| | Three Months Ended June 30, |
| | 2019 | | 2018 |
| | Loans Modified in TDRs
During the Period | | TDRs Experiencing Payment
Defaults During the Period | | Loans Modified in TDRs
During the Period | | TDRs Experiencing Payment
Defaults During the Period |
| | Number of
TDRs | | Recorded
Investment | | Number of
TDRs | | Recorded
Investment | | Number of
TDRs | | Recorded
Investment | | Number of
TDRs | | Recorded
Investment |
1-4 single family residential(1) | 34 |
| | $ | 5,164 |
| | 31 |
| | $ | 4,355 |
| | 9 |
| | $ | 2,106 |
| | 3 |
| | $ | 507 |
|
| Non-owner occupied commercial real estate | 1 |
| | 12,085 |
| | 1 |
| | 2,772 |
| | — |
| | — |
| | — |
| | — |
|
| Owner occupied commercial real estate | — |
| | — |
| | 3 |
| | 1,878 |
| | — |
| | — |
| | — |
| | — |
|
| Commercial and industrial | 4 |
| | 7,354 |
| | 1 |
| | 1,233 |
| | 3 |
| | 415 |
| | 2 |
| | 437 |
|
| Commercial lending subsidiaries | 1 |
| | 2,073 |
| | — |
| | — |
| | — |
| | — |
| | — |
| | — |
|
| | 40 |
| | $ | 26,676 |
| | 36 |
| | $ | 10,238 |
| | 12 |
| | $ | 2,521 |
| | 5 |
| | $ | 944 |
|
|
| | | | | | | | | | | | | | | | | | | | | | | | | | | |
| | Nine Months Ended September 30, |
| | 2017 | | 2016 |
| | Loans Modified in TDRs
During the Period | | TDRs Experiencing Payment
Defaults During the Period | | Loans Modified in TDRs
During the Period | | TDRs Experiencing Payment
Defaults During the Period |
| | Number of
TDRs | | Recorded
Investment | | Number of
TDRs | | Recorded
Investment | | Number of
TDRs | | Recorded
Investment | | Number of
TDRs | | Recorded
Investment |
| Non-covered loans: | |
| | |
| | |
| | |
| | |
| | |
| | |
| | |
|
| 1-4 single family residential | 4 |
| | $ | 351 |
| | 2 |
| | $ | 269 |
| | 1 |
| | $ | 107 |
| | — |
| | $ | — |
|
| Non-owner occupied commercial real estate | 1 |
| | 5,389 |
| | — |
| | — |
| | — |
| | — |
| | — |
| | — |
|
| Owner occupied commercial real estate | 2 |
| | 4,522 |
| | — |
| | — |
| | 3 |
| | 5,225 |
| | — |
| | — |
|
| Commercial and industrial | | | | | | | | | | | | |
|
| |
|
|
| Taxi medallion loans | 97 |
| | 48,692 |
| | 8 |
| | 3,509 |
| | 58 |
| | 57,341 |
| | 8 |
| | 4,104 |
|
| Other commercial and industrial | 14 |
| | 20,860 |
| | — |
| | — |
| | 7 |
| | 21,422 |
| | 1 |
| | 3,500 |
|
| Commercial lending subsidiaries | 1 |
| | 12,810 |
| | — |
| | — |
| | 6 |
| | 7,933 |
| | — |
| | — |
|
| | 119 |
| | $ | 92,624 |
| | 10 |
| | $ | 3,778 |
| | 75 |
| | $ | 92,028 |
| | 9 |
| | $ | 7,604 |
|
| Covered loans: | | | | | | | | | | | | | | | |
| Non-ACI loans: | | | | | | | | | |
| | |
| | |
| | |
|
| Home equity loans and lines of credit | 5 |
| | $ | 939 |
| | 1 |
| | $ | 70 |
| | 16 |
| | $ | 2,293 |
| | — |
| | $ | — |
|
| ACI loans: | | | | | | | | | | | | | | | |
| Owner occupied commercial real estate | — |
| | $ | — |
| | — |
| | $ | — |
| | 1 |
| | $ | 839 |
| | — |
| | $ | — |
|
| |
| (1) | Includes government insured residential loans modified totaling $5 million and $1 million during the three months ended June 30, 2019 and 2018, respectively. |
|
| | | | | | | | | | | | | | | | | | | | | | | | | | | |
| | Six Months Ended June 30, |
| | 2019 | | 2018 |
| | Loans Modified in TDRs
During the Period | | TDRs Experiencing Payment
Defaults During the Period | | Loans Modified in TDRs
During the Period | | TDRs Experiencing Payment
Defaults During the Period |
| | Number of
TDRs | | Recorded
Investment | | Number of
TDRs | | Recorded
Investment | | Number of
TDRs | | Recorded
Investment | | Number of
TDRs | | Recorded
Investment |
1-4 single family residential(1) | 48 |
| | $ | 7,345 |
| | 32 |
| | $ | 4,517 |
| | 17 |
| | $ | 5,545 |
| | 3 |
| | $ | 507 |
|
| Non-owner occupied commercial real estate | 1 |
| | 12,085 |
| | 1 |
| | 2,772 |
| | — |
| | — |
| | — |
| | — |
|
| Owner occupied commercial real estate | 1 |
| | 849 |
| | 3 |
| | 1,878 |
| | — |
| | — |
| | — |
| | — |
|
| Commercial and industrial | 6 |
| | 17,994 |
| | 1 |
| | 1,233 |
| | 8 |
| | 1,517 |
| | 5 |
| | 1,372 |
|
| Commercial lending subsidiaries | 4 |
| | 4,085 |
| | — |
| | — |
| | — |
| | — |
| | — |
| | — |
|
| | 60 |
| | $ | 42,358 |
| | 37 |
| | $ | 10,400 |
| | 25 |
| | $ | 7,062 |
| | 8 |
| | $ | 1,879 |
|
| |
| (1) | Includes government insured residential loans modified totaling $7 million and $1 million during the six months ended June 30, 2019 and 2018, respectively. |
Modifications during the three and ninesix months ended SeptemberJune 30, 20172019 and 20162018 included interest rate reductions, restructuring of the amount and timing of required periodic payments, extensions of maturity and covenant waivers. Included in TDRs are residential loans to borrowers who have not reaffirmed their debt discharged in Chapter 7 bankruptcy. The total amount of such loans is not material. Modified ACI loans accounted for in pools are not considered TDRs, are not separated from the pools and are not classified as impaired loans.
BANKUNITED, INC. AND SUBSIDIARIES
NOTES TO CONSOLIDATED FINANCIAL STATEMENTS - UNAUDITED
SeptemberJune 30, 20172019
Note 5 FDIC Indemnification AssetLeases
WhenLeases under which the Company recognizes gains or losses relatedis the lessee
The Company leases branches, office space and a small amount of equipment under operating and finance leases with terms ranging from one to covered16 years, some of which include extension options.
The following table presents ROU assets in its consolidated financial statements, changes in the estimated amount recoverable from the FDIC under the Loss Sharing Agreements with respect to those gains or losses are also reflected in the consolidated financial statements. Covered loans may be resolved through prepayment, short saleand lease liabilities as of the underlying collateral, foreclosure, sale of the loans or charge-off. For loans resolved through prepayment, short sale or foreclosure, the difference between consideration received in satisfaction of the loans and the carrying value of the loans is recognized in the consolidated statement of income line item “Income from resolution of covered assets, net.” Losses from the resolution of covered loans increase the amount recoverable from the FDIC under the Loss Sharing Agreements. Gains from the resolution of covered loans reduce the amount recoverable from the FDIC under the Loss Sharing Agreements. Similarly, differences in proceeds received on the sale of covered OREO and covered loans and their carrying amounts result in gains or losses and reduce or increase the amount recoverable from the FDIC under the Loss Sharing Agreements. Increases in valuation allowances or impairment charges related to covered assets also increase the amount estimated to be recoverable from the FDIC. These additions to or reductions in amounts recoverable from the FDIC related to transactions in the covered assets are recorded in the consolidated statement of income line item “Net gain (loss) on FDIC indemnification” and reflected as corresponding increases or decreases in the FDIC indemnification asset.
In addition, through June 30, 2017, recoveries of previously indemnified losses on2019 (in thousands):
|
| | | |
| | June 30, 2019 |
| ROU assets: | |
| Operating leases | $ | 87,596 |
|
| Finance leases | 6,627 |
|
| | $ | 94,223 |
|
| Lease liabilities: | |
| Operating leases | $ | 96,908 |
|
| Finance leases | 8,926 |
|
| | $ | 105,834 |
|
ROU assets that were formerly covered under the Commercial Shared-Loss Agreement resulted in reimbursements due to the FDIC. These transactionsand lease liabilities for operating leases are included in the tables below. Amounts payable to the FDIC resulting from these transactions are recognized in other liabilities"other assets" and "other liabilities", respectively, in the accompanying consolidated balance sheet at December 31, 2016.Consolidated Balance Sheet. ROU assets and lease liabilities for finance leases are included in "other assets" and "notes and other borrowings", respectively.
The following tables summarize theweighted average remaining lease term and weighted average discount rate at June 30, 2019 were:
|
| | |
| Weighted average remaining lease term: | |
| Operating lease | 7.89 years |
|
| Finance lease | 6.30 years |
|
| Weighted average discount rate: | |
| Operating lease | 3.4 | % |
| Finance lease | 11.7 | % |
The components of the gains and losses associated with covered assets, along with the related additions to or reductions in the amounts recoverable from the FDIC under the Loss Sharing Agreements, as reflected in the consolidated statements of incomelease expense for the periodsperiod indicated were (in thousands):
|
| | | | | | | | | | | | | | | | | | | | | | | |
| | Three Months Ended September 30, |
| | 2017 | | 2016 |
| | Transaction
Income (Loss) | | Net Loss on FDIC
Indemnification | | Net Impact
on Pre-tax
Earnings | | Transaction
Income (Loss) | | Net Gain on FDIC
Indemnification | | Net Impact
on Pre-tax
Earnings |
| Recovery of (provision for) losses on covered loans | $ | (261 | ) | | $ | 215 |
| | $ | (46 | ) | | $ | 445 |
| | $ | (368 | ) | | $ | 77 |
|
| Income from resolution of covered assets, net | 6,400 |
| | (5,082 | ) | | 1,318 |
| | 8,883 |
| | (7,106 | ) | | 1,777 |
|
| Loss on sale of covered loans | — |
| | — |
| | — |
| | (10,033 | ) | | 8,026 |
| | (2,007 | ) |
| Loss on covered OREO | (35 | ) | | 29 |
| | (6 | ) | | (552 | ) | | 441 |
| | (111 | ) |
| | $ | 6,104 |
| | $ | (4,838 | ) | | $ | 1,266 |
| | $ | (1,257 | ) | | $ | 993 |
| | $ | (264 | ) |
|
| | | | | | | |
| | Three Months Ended June 30, 2019 | | Six Months Ended June 30, 2019 |
| Operating lease cost | $ | 5,046 |
| | $ | 10,080 |
|
| Finance lease cost: | | | |
| Amortization of ROU assets | $ | 359 |
| | $ | 709 |
|
| Interest on lease liabilities | 250 |
| | 505 |
|
| Total finance lease cost | $ | 609 |
| | $ | 1,214 |
|
|
| | | | | | | | | | | | | | | | | | | | | | | |
| | Nine Months Ended September 30, |
| | 2017 | | 2016 |
| | Transaction
Income (Loss) | | Net Loss on FDIC
Indemnification | | Net Impact
on Pre-tax
Earnings | | Transaction
Income (Loss) | | Net Loss on FDIC
Indemnification | | Net Impact
on Pre-tax
Earnings |
| Recovery of (provision for) losses on covered loans | $ | (2,693 | ) | | $ | 2,095 |
| | $ | (598 | ) | | $ | 1,119 |
| | $ | (1,007 | ) | | $ | 112 |
|
| Income from resolution of covered assets, net | 22,066 |
| | (17,591 | ) | | 4,475 |
| | 26,426 |
| | (21,140 | ) | | 5,286 |
|
| Loss on sale of covered loans | (1,582 | ) | | 1,266 |
| | (316 | ) | | (14,895 | ) | | 11,958 |
| | (2,937 | ) |
| Loss on covered OREO | (65 | ) | | 56 |
| | (9 | ) | | (957 | ) | | 779 |
| | (178 | ) |
| | $ | 17,726 |
| | $ | (14,174 | ) | | $ | 3,552 |
| | $ | 11,693 |
| | $ | (9,410 | ) | | $ | 2,283 |
|
BANKUNITED, INC. AND SUBSIDIARIES
NOTES TO CONSOLIDATED FINANCIAL STATEMENTS - UNAUDITED
SeptemberJune 30, 20172019
Changes inShort-term lease cost, variable lease cost, and sublease income were immaterial for the FDIC indemnification assetthree and in the liability to the FDIC for recoveriessix months ended June 30, 2019.
Additional information related to assets previously covered under the Commercial Shared-Loss Agreementoperating and finance leases for the nine months ended September 30, 2017 and the year ended December 31, 2016, were asperiods indicated follows (in thousands):
|
| | | | | | | |
| | Three Months Ended June 30, 2019 | | Six Months Ended June 30, 2019 |
| Cash paid for amounts included in the measurement of lease liabilities: | | | |
| Operating cash flows from finance leases | $ | 250 |
| | $ | 505 |
|
| Operating cash flows from operating leases | 5,216 |
| | 10,359 |
|
| Financing cash flows from finance leases | 726 |
| | 1,461 |
|
| | $ | 6,192 |
| | $ | 12,325 |
|
| | | | |
| Lease liabilities recognized from obtaining ROU assets: | | | |
| Operating lease liabilities recognized upon adoption of ASC 842 | $ | — |
| | $ | 104,064 |
|
| Operating leases | 1,597 |
| | 1,597 |
|
| Finance leases | — |
| | 1,521 |
|
| | $ | 1,597 |
| | $ | 107,182 |
|
|
| | | |
| Balance at December 31, 2015 | $ | 739,843 |
|
| Amortization | (160,091 | ) |
| Reduction for claims filed | (46,083 | ) |
| Net loss on FDIC indemnification | (17,759 | ) |
| Balance at December 31, 2016 | 515,910 |
|
| Amortization | (135,351 | ) |
| Reduction for claims filed | (16,768 | ) |
| Net loss on FDIC indemnification | (14,174 | ) |
| Balance at September 30, 2017 | $ | 349,617 |
|
The balances at SeptemberFuture lease payment obligations under leases with terms in excess of one year and a reconciliation to lease liabilities as of June 30, 2017 and December 31, 2016 are reflected in the consolidated balance sheets as2019 follows (in thousands):
|
| | | | | | | |
| | September 30, 2017 | | December 31, 2016 |
| FDIC indemnification asset | $ | 349,617 |
| | $ | 515,933 |
|
| Other liabilities | — |
| | (23 | ) |
| | $ | 349,617 |
| | $ | 515,910 |
|
|
| | | | | | | | | | | |
| | Operating Leases | | Finance Leases | | Total |
| Years ending December 31: | | | | | |
| 2019 (excluding the six months ending June 30, 2019) | $ | 10,379 |
| | $ | 939 |
| | $ | 11,318 |
|
| 2020 | 17,499 |
| | 2,456 |
| | 19,955 |
|
| 2021 | 15,762 |
| | 2,514 |
| | 18,276 |
|
| 2022 | 12,524 |
| | 2,053 |
| | 14,577 |
|
| 2023 | 10,764 |
| | 2,124 |
| | 12,888 |
|
| Thereafter | 43,873 |
| | 2,825 |
| | 46,698 |
|
| Total future minimum lease payments | 110,801 |
| | 12,911 |
| | 123,712 |
|
| Less: interest component | (13,893 | ) | | (3,985 | ) | | (17,878 | ) |
| Lease liabilities | $ | 96,908 |
| | $ | 8,926 |
| | $ | 105,834 |
|
BANKUNITED, INC. AND SUBSIDIARIES
NOTES TO CONSOLIDATED FINANCIAL STATEMENTS - UNAUDITED
June 30, 2019
As of December 31, 2018, future minimum rentals under non-cancelable operating leases with initial or remaining terms in excess of one year were as follows (in thousands):
|
| | | |
| Years ending December 31: | |
|
| 2019 | $ | 21,207 |
|
| 2020 | 17,629 |
|
| 2021 | 15,858 |
|
| 2022 | 12,114 |
|
| 2023 | 10,311 |
|
| Thereafter through 2034 | 42,984 |
|
| | $ | 120,103 |
|
Leases under which the Company is the lessor
Through its commercial lending subsidiaries, Pinnacle and Bridge, the Bank provides equipment financing using a variety of loan and lease structures. Pinnacle provides essential use equipment financing to state and local governmental entities. Bridge provides primarily transportation equipment financing.
The following table presents the components of the investment in direct or sales type financing leases, included in loans in the Consolidated Balance Sheet, at the dates indicated (in thousands):
|
| | | | | | | |
| | June 30, 2019 | | December 31, 2018 |
| Total minimum lease payments to be received | $ | 844,442 |
| | $ | 808,921 |
|
| Estimated unguaranteed residual value of leased assets | 8,369 |
| | 7,355 |
|
| Gross investment in direct or sales type financing leases | 852,811 |
| | 816,276 |
|
| Unearned income | (83,943 | ) | | (81,864 | ) |
| Initial direct costs | 4,728 |
| | 4,833 |
|
| | $ | 773,596 |
| | $ | 739,245 |
|
As of June 30, 2019, future minimum lease payments to be received under direct or sales type financing leases were as follows (in thousands):
|
| | | |
| Years Ending December 31: | |
| 2019 (excluding the six months ending June 30, 2019) | $ | 122,931 |
|
| 2020 | 192,841 |
|
| 2021 | 132,419 |
|
| 2022 | 88,202 |
|
| 2023 | 68,031 |
|
| Thereafter | 240,018 |
|
| | $ | 844,442 |
|
BANKUNITED, INC. AND SUBSIDIARIES
NOTES TO CONSOLIDATED FINANCIAL STATEMENTS - UNAUDITED
June 30, 2019
Equipment under operating lease consists primarily of railcars, non-commercial aircraft and other transportation equipment leased to commercial end users. Original lease terms generally range from three to ten years. Asset risk is evaluated and managed by a dedicated internal staff of seasoned equipment finance professionals with a broad depth and breadth of experience in the leasing business. Additionally, we have partnered with an industry leading, experienced service provider who provides fleet management and servicing relating to the railcar fleet. Residual risk is managed by setting appropriate residual values at inception and systematic reviews of residual values based on independent appraisals, performed at least annually. We endeavor to lease to a stable end-user base, maintain a relatively young and diversified fleet of assets and stagger lease maturities.
As of June 30, 2019, scheduled minimum rental payments under operating leases were as follows (in thousands):
|
| | | |
| Years Ending December 31: | |
|
| 2019 (excluding the six months ending June 30, 2019) | $ | 34,159 |
|
| 2020 | 62,299 |
|
| 2021 | 52,949 |
|
| 2022 | 46,162 |
|
| 2023 | 37,951 |
|
| Thereafter through 2034 | 109,933 |
|
| | $ | 343,453 |
|
Lease income recognized for operating leases and direct or sales type finance leases follows (in thousands):
|
| | | | | | | | | |
| | Three Months Ended June 30, 2019 | | Six Months Ended June 30, 2019 | | Location of Lease Income on Consolidated Statements of Income |
| Operating leases | $ | 17,005 |
| | $ | 34,191 |
| | Non-interest income from lease financing |
| Direct or sales type finance leases | 5,489 |
| | 10,798 |
| | Interest income on loans |
| Total lease income | $ | 22,494 |
| | $ | 44,989 |
| | |
Note 6Income Taxes
The Company’s effective income tax rate was 32.2%25.2% and 31.7%25.9% for the three and six months ended SeptemberJune 30, 2017 and 2016,2019, respectively, and 31.2%23.2% and 33.2%23.1% for the ninethree and six months ended SeptemberJune 30, 2017 and 2016,2018, respectively. The effective income tax rate differed from the statutory federal income tax rate of 35% in all periods21% for the three and six months ended June 30, 2019 and 2018 due primarily to the effect ofstate income taxes, offset by income not subject to tax, offset by state income taxes. In addition, the effective income tax rate for the three and nine months ended September 30, 2017 reflected the impact of $0.3 million and $3.2 million, respectively, in excess tax benefits resulting from activity related to vesting of share-based awards and exercise of stock options.
The Company has investments in affordable housing limited partnerships which generate federal Low Income Housing Tax Credits and other tax benefits. The balance of these investments, included in other assets in the accompanying consolidated balance sheet, was $66 million and $71 million at September 30, 2017 and December 31, 2016, respectively. Unfunded commitments for affordable housing investments, included in other liabilities in the accompanying consolidated balance sheet, were $29 million and $53 million at September 30, 2017 and December 31, 2016, respectively. The maximum exposure to loss as a result of the Company's involvement with these limited partnerships at September 30, 2017 was approximately $73 million. While the Company believes the likelihood of potential losses from these investments is remote, the maximum exposure was determined by assuming a scenario where the projects completely fail and do not meet certain government compliance requirements resulting in recapture of the related tax credits. These investments did not have a material impact on income tax expense for the three and nine months ended September 30, 2017 and 2016.tax.
Note 7 Derivatives and Hedging Activities
The Company uses interest rate swaps to manage interest rate risk related to liabilities that expose the Company to variability in cash flows due to changes in interest rates. The Company enters into LIBOR-based interest rate swaps that are designated as cash flow hedges with the objective of limiting the variability of interest payment cash flows resulting from changes in the benchmark interest rate LIBOR. Changes in the fair value of interest rate swaps designated as cash flow hedging instruments are reported in AOCI and subsequently reclassified into interest expense in the same period in which the related interest on the floating-rate debt obligations affects earnings.
BANKUNITED, INC. AND SUBSIDIARIES
NOTES TO CONSOLIDATED FINANCIAL STATEMENTS - UNAUDITED
September 30, 2017
The Company also enters into interest rate derivative contracts with certain of its commercial borrowers to enable those borrowers to manage their exposure to interest rate fluctuations. To mitigate interest rate risk associated with these derivative contracts, the Company enters into offsetting derivative contract positions with primary dealers. These interest rate derivative contracts are not designated as hedging instruments; therefore, changes in the fair value of these derivatives are recognized immediately in earnings. The impact on earnings related to changes in fair value of these derivatives for the three and ninesix months ended SeptemberJune 30, 20172019 and 20162018 was not material.
The Company may be exposed to credit risk in the event of non-performance by the counterparties to its interest rate derivative agreements. The Company assesses the credit risk of its financial institution counterparties by monitoring publicly available credit rating and financial information. The Company manages dealer credit risk by entering into interest rate
BANKUNITED, INC. AND SUBSIDIARIES
NOTES TO CONSOLIDATED FINANCIAL STATEMENTS - UNAUDITED
June 30, 2019
derivatives only with primary and highly rated counterparties, the use of ISDA master agreements, central clearing mechanisms and counterparty limits. The agreements contain bilateral collateral arrangements with the amount of collateral to be posted generally governed by the settlement value of outstanding swaps. The Company manages the risk of default by its borrower counterparties through its normal loan underwriting and credit monitoring policies and procedures. The Company does not currently anticipate any losses from failure of interest rate derivative counterparties to honor their obligations.
The CME amended its rules effective January 2017 to legally characterizecharacterizes variation margin payments for centrally cleared derivatives as settlements of the derivatives' exposures rather than collateral. As a result, the variation margin payment and the related derivative instruments are considered a single unit of account for accounting and financial reporting purposes. The Company's clearing agent for interest rate derivative contracts centrally cleared through the CME settles the variation margin daily with the CME; therefore, those interest rate derivative contracts the Company clears through the CME are reported at a fair value of approximately zero at SeptemberJune 30, 2017.2019 and December 31, 2018.
The following tables set forth certain information concerning the Company’s interest rate contract derivative financial instruments and related hedged items at the dates indicated (dollars in thousands):
| | | | September 30, 2017 | June 30, 2019 |
| | | Weighted Average Pay Rate | | Weighted Average Receive Rate | | Weighted Average Remaining Life in Years | | | | | | Weighted Average Pay Rate | | Weighted Average Receive Rate | | Weighted Average Remaining Life in Years | | | | |
| | | | Notional Amount | | Balance Sheet Location | | Fair Value | | | Notional Amount | | Balance Sheet Location | | Fair Value |
| | Hedged Item | | Asset | | Liability | Hedged Item | | Asset | | Liability |
| Derivatives designated as cash flow hedges: | | | | | | | | | |
| | | | |
| | |
| | | | | | | | | |
| | | | |
| | |
|
| Pay-fixed interest rate swaps | Variability of interest cash flows on variable rate borrowings | | 1.77% | | 3-Month Libor | | 4.6 | | $ | 2,046,000 |
| | Other assets / Other liabilities | | $ | 1,066 |
| | $ | (259 | ) | Variability of interest cash flows on variable rate borrowings | | 2.37% | | 3-Month Libor | | 3.7 | | $ | 3,131,000 |
| | Other assets / Other liabilities | | $ | — |
| | $ | (1,485 | ) |
| Derivatives not designated as hedges: | | | | | | | | | | | | | | |
| Pay-fixed interest rate swaps | | | 3.86% | | Indexed to 1-month Libor | | 6.4 | | 1,000,763 |
| | Other assets / Other liabilities | | 7,605 |
| | (18,311 | ) | �� | | 4.09% | | Indexed to 1-month Libor | | 6.0 | | 1,130,652 |
| | Other assets / Other liabilities | | 1,616 |
| | (16,236 | ) |
| Pay-variable interest rate swaps | | | Indexed to 1-month Libor | | 3.86% | | 6.4 | | 1,000,763 |
| | Other assets / Other liabilities | | 19,648 |
| | (8,491 | ) | | | Indexed to 1-month Libor | | 4.09% | | 6.0 | | 1,130,652 |
| | Other assets / Other liabilities | | 39,789 |
| | (1,530 | ) |
| Interest rate caps purchased, indexed to 1-month Libor | | 2.80% | | 1.6 | | 145,957 |
| | Other assets | | 15 |
| | — |
| | 3.62% | | 0.9 | | 80,313 |
| | Other assets | | — |
| | — |
|
| Interest rate caps sold, indexed to 1-month Libor | | 2.80% | | 1.6 | | 145,957 |
| | Other liabilities | | — |
| | (15 | ) | | 3.62% | | 0.9 | | 80,313 |
| | Other liabilities | | — |
| | — |
|
| | | | $ | 4,339,440 |
| | $ | 28,334 |
| | $ | (27,076 | ) | | | $ | 5,552,930 |
| | $ | 41,405 |
| | $ | (19,251 | ) |
BANKUNITED, INC. AND SUBSIDIARIES
NOTES TO CONSOLIDATED FINANCIAL STATEMENTS - UNAUDITED
SeptemberJune 30, 20172019
|
| | | | | | | | | | | | | | | | | | | | | |
| | December 31, 2018 |
| | | | Weighted Average Pay Rate | | Weighted Average Receive Rate | | Weighted Average Remaining Life in Years | | | | | | |
| | | | | | | Notional Amount | | Balance Sheet Location | | Fair Value |
| | Hedged Item | | | | | | | Asset | | Liability |
| Derivatives designated as cash flow hedges: | | | | | | | | | |
| | | | |
| | |
|
| Pay-fixed interest rate swaps | Variability of interest cash flows on variable rate borrowings | | 2.38% | | 3-Month Libor | | 4.0 | | $ | 2,846,000 |
| | Other assets / Other liabilities | | $ | 3,405 |
| | $ | — |
|
| Derivatives not designated as hedges: | | |
| |
| |
| |
|
| | | |
|
| | |
| Pay-fixed interest rate swaps | | | 4.10% | | Indexed to 1-month Libor | | 6.0 | | 1,048,196 |
| | Other assets / Other liabilities | | 14,883 |
| | (6,991 | ) |
| Pay-variable interest rate swaps | | | Indexed to 1-month Libor | | 4.10% | | 6.0 | | 1,048,196 |
| | Other assets / Other liabilities | | 11,318 |
| | (16,874 | ) |
| Interest rate caps purchased, indexed to 1-month Libor | | |
| | 3.43% | | 1.2 | | 98,407 |
| | Other assets | | 9 |
| | — |
|
| Interest rate caps sold, indexed to 1-month Libor | | | 3.43% | | | | 1.2 | | 98,407 |
| | Other liabilities | | — |
| | (9 | ) |
| | | | | | | | | | $ | 5,139,206 |
| | | | $ | 29,615 |
| | $ | (23,874 | ) |
|
| | | | | | | | | | | | | | | | | | | | | |
| | December 31, 2016 |
| | | | Weighted Average Pay Rate | | Weighted Average Receive Rate | | Weighted Average Remaining Life in Years | | | | | | |
| | | | | | | Notional Amount | | Balance Sheet Location | | Fair Value |
| | Hedged Item | | | | | | | Asset | | Liability |
| Derivatives designated as cash flow hedges: | | | | | | | | | |
| | | | |
| | |
|
| Pay-fixed interest rate swaps | Variability of interest cash flows on variable rate borrowings | | 1.58% | | 3-Month Libor | | 3.3 | | $ | 1,715,000 |
| | Other assets / Other liabilities | | $ | 19,648 |
| | $ | (3,112 | ) |
| Pay-fixed forward-starting interest rate swaps | Variability of interest cash flows on variable rate borrowings | | 3.43% | | 3-Month Libor | | 10.5 | | 300,000 |
| | Other liabilities | | — |
| | (27,866 | ) |
| Derivatives not designated as hedges: | | |
| |
| |
| |
|
| | | |
|
| | |
| Pay-fixed interest rate swaps | | | 3.77% | | Indexed to 1-month Libor | | 6.8 | | 912,000 |
| | Other assets / Other liabilities | | 9,949 |
| | (20,383 | ) |
| Pay-variable interest rate swaps | | | Indexed to 1-month Libor | | 3.77% | | 6.8 | | 912,000 |
| | Other assets / Other liabilities | | 20,383 |
| | (9,949 | ) |
| Interest rate caps purchased, indexed to 1-month Libor | | |
| | 2.96% | | 2.3 | | 189,057 |
| | Other assets | | 252 |
| | — |
|
| Interest rate caps sold, indexed to 1-month Libor | | | 2.96% | | | | 2.3 | | 189,057 |
| | Other liabilities | | — |
| | (252 | ) |
| | | | | | | | | | $ | 4,217,114 |
| | | | $ | 50,232 |
| | $ | (61,562 | ) |
The following table provides information about the amount of lossgain (loss) related to derivatives designated as cash flow hedges reclassified from AOCI into interest expense for the periods indicated (dollars in thousands): |
| | | | | | | | | | | | | | | | | |
| | Amount of Loss Reclassified from AOCI on Derivatives | | |
| | Three Months Ended September 30, | | Nine Months Ended September 30, | | |
| Derivatives in Cash Flow Hedging Relationships | 2017 | | 2016 | | 2017 | | 2016 | | Location of Loss Reclassified from AOCI into Income |
| Interest rate contracts | $ | (2,001 | ) | | $ | (3,741 | ) | | $ | (7,463 | ) | | $ | (13,050 | ) | | Interest expense on borrowings |
|
| | | | | | | | | | | | | | | | | |
| | Three Months Ended June 30, | | Six Months Ended June 30, | | |
| | 2019 | | 2018 | | 2019 | | 2018 | | Location of Gain (Loss) Reclassified from AOCI into Income |
| Interest rate contracts | $ | 1,688 |
| | $ | 728 |
| | $ | 4,411 |
| | $ | (211 | ) | | Interest expense on borrowings |
During the ninethree and six months ended SeptemberJune 30, 20172019 and 2016,2018, no derivative positions designated as cash flow hedges were discontinued and none of the gains and losses reported in AOCI were reclassified into earnings as a result of the discontinuance of cash flow hedges or because of the early extinguishment of debt. As of SeptemberJune 30, 2017,2019, the amount of net loss expected to be reclassified from AOCI into earnings during the next twelve months was $6.2$11.5 million.
Some of the Company’s ISDA master agreements with financial institution counterparties contain provisions that permit either counterparty to terminate the agreements and require settlement in the event that regulatory capital ratios fall below certain designated thresholds, upon the initiation of other defined regulatory actions or upon suspension or withdrawal of the Bank’s credit rating. Currently, there are no circumstances that would trigger these provisions of the agreements.
BANKUNITED, INC. AND SUBSIDIARIES
NOTES TO CONSOLIDATED FINANCIAL STATEMENTS - UNAUDITED
September 30, 2017
The Company does not offset assets and liabilities under master netting agreements for financial reporting purposes. Information on interest rate swaps subject to these agreements is as follows at the dates indicated (in thousands):
| | | | September 30, 2017 | | | | | | | | | | | | | |
| | |
| Gross Amounts Offset in Balance
Sheet |
| Net Amounts Presented in
Balance Sheet |
| Gross Amounts Not Offset in Balance Sheet |
| | June 30, 2019 |
| | Gross Amounts Recognized |
| Derivative Instruments |
| Collateral Pledged |
| Net Amount | |
| Gross Amounts Offset in Balance
Sheet |
| Net Amounts Presented in
Balance Sheet |
| Gross Amounts Not Offset in Balance Sheet |
| |
|
|
|
|
|
|
|
|
|
|
|
|
|
|
|
|
|
| Gross Amounts Recognized |
| Derivative Instruments |
| Collateral Pledged |
| Net Amount |
| Derivative assets | $ | 8,686 |
| | $ | — |
| | $ | 8,686 |
| | $ | (6,814 | ) | | $ | (1,539 | ) | | $ | 333 |
| $ | 1,616 |
| | $ | — |
| | $ | 1,616 |
| | $ | (1,616 | ) | | $ | — |
| | $ | — |
|
| Derivative liabilities | (18,570 | ) | | — |
| | (18,570 | ) | | 6,814 |
| | 11,756 |
| | — |
| (17,721 | ) | | — |
| | (17,721 | ) | | 1,616 |
| | 16,105 |
| | — |
|
| | $ | (9,884 | ) | | $ | — |
| | $ | (9,884 | ) | | $ | — |
| | $ | 10,217 |
| | $ | 333 |
| $ | (16,105 | ) | | $ | — |
| | $ | (16,105 | ) | | $ | — |
| | $ | 16,105 |
| | $ | — |
|
BANKUNITED, INC. AND SUBSIDIARIES
NOTES TO CONSOLIDATED FINANCIAL STATEMENTS - UNAUDITED
June 30, 2019
| | | | December 31, 2016 | | | | | | | | | | | | | |
| | | | Gross Amounts Offset in Balance
Sheet | | Net Amounts Presented in
Balance Sheet | | Gross Amounts Not Offset in Balance Sheet | | | December 31, 2018 |
| | Gross Amounts Recognized | | Derivative Instruments | | Collateral Pledged | | Net Amount | | | Gross Amounts Offset in Balance
Sheet | | Net Amounts Presented in
Balance Sheet | | Gross Amounts Not Offset in Balance Sheet | | |
| | | | | | | | | | | | | Gross Amounts Recognized | | Derivative Instruments | | Collateral Pledged | | Net Amount |
| Derivative assets | $ | 29,849 |
| | $ | — |
| | $ | 29,849 |
| | $ | (27,485 | ) | | $ | — |
| | $ | 2,364 |
| $ | 18,297 |
| | $ | — |
| | $ | 18,297 |
| | $ | (5,264 | ) | | $ | (13,129 | ) | | $ | (96 | ) |
| Derivative liabilities | (51,362 | ) | | — |
| | (51,362 | ) | | 27,485 |
| | 23,796 |
| | (81 | ) | (6,991 | ) | | — |
| | (6,991 | ) | | 5,264 |
| | 436 |
| | (1,291 | ) |
| | $ | (21,513 | ) | | $ | — |
| | $ | (21,513 | ) | | $ | — |
| | $ | 23,796 |
| | $ | 2,283 |
| $ | 11,306 |
| | $ | — |
| | $ | 11,306 |
| | $ | — |
| | $ | (12,693 | ) | | $ | (1,387 | ) |
The difference between the amounts reported for interest rate swaps subject to master netting agreements and the total fair value of interest rate contract derivative financial instruments reported in the consolidated balance sheets is related to interest rate contracts entered into with borrowers not subject to master netting agreements.
At SeptemberJune 30, 2017,2019, the Company had pledged investment securities available for sale with a carrying amountnet financial collateral of $40 million and cash on deposit of $2$17.3 million as collateral for interest rate swaps in a liability position. $2 million of financial collateral was pledged by counterparties to the Company for interest rate swaps in an asset position.position that are not centrally cleared. The amount of collateral required to be posted varies based on the settlement value of outstanding swaps and in some cases may include initial margin requirements.
BANKUNITED, INC. AND SUBSIDIARIES
NOTES TO CONSOLIDATED FINANCIAL STATEMENTS - UNAUDITED
September 30, 2017
Note 8 Stockholders’ Equity
Accumulated Other Comprehensive Income
Changes in AOCIother comprehensive income are summarized as follows for the periods indicated (in thousands):
| | | | Three Months Ended September 30, | Three Months Ended June 30, |
| | 2017 | | 2016 | 2019 | | 2018 |
| | Before Tax | | Tax Effect | | Net of Tax | | Before Tax | | Tax Effect | | Net of Tax | Before Tax | | Tax Effect | | Net of Tax | | Before Tax | | Tax Effect | | Net of Tax |
| Unrealized gains on investment securities available for sale: | |
| | |
| | |
| | | | | | | |
| | |
| | |
| | | | | | |
| Net unrealized holding gain arising during the period | $ | 14,144 |
| | $ | (5,587 | ) | | $ | 8,557 |
| | $ | 5,316 |
| | $ | (2,100 | ) | | $ | 3,216 |
| |
| Net unrealized holding gain (loss) arising during the period | | $ | 31,737 |
| | $ | (8,410 | ) | | $ | 23,326 |
| | $ | (17,831 | ) | | $ | 4,725 |
| | $ | (13,106 | ) |
| Amounts reclassified to gain on investment securities available for sale, net | (26,931 | ) | | 10,638 |
| | (16,293 | ) | | (3,008 | ) | | 1,188 |
| | (1,820 | ) | (3,914 | ) | | 1,037 |
| | (2,877 | ) | | (2,551 | ) | | 676 |
| | (1,875 | ) |
| Net change in unrealized gains on investment securities available for sale | (12,787 | ) | | 5,051 |
| | (7,736 | ) | | 2,308 |
| | (912 | ) | | 1,396 |
| 27,823 |
| | (7,373 | ) | | 20,449 |
| | (20,382 | ) | | 5,401 |
| | (14,981 | ) |
| Unrealized losses on derivative instruments: | | | | | | | | | | | | | | | | | | | | | | |
| Net unrealized holding gain (loss) arising during the period | (281 | ) | | 111 |
| | (170 | ) | | 8,356 |
| | (3,301 | ) | | 5,055 |
| (50,637 | ) | | 13,419 |
| | (37,218 | ) | | 13,396 |
| | (3,550 | ) | | 9,846 |
|
| Amounts reclassified to interest expense on borrowings | 2,001 |
| | (791 | ) | | 1,210 |
| | 3,741 |
| | (1,477 | ) | | 2,264 |
| (1,688 | ) | | 447 |
| | (1,241 | ) | | (728 | ) | | 193 |
| | (535 | ) |
| Net change in unrealized losses on derivative instruments | 1,720 |
| | (680 | ) | | 1,040 |
| | 12,097 |
| | (4,778 | ) | | 7,319 |
| (52,325 | ) | | 13,866 |
| | (38,459 | ) | | 12,668 |
| | (3,357 | ) | | 9,311 |
|
| Other comprehensive income (loss) | $ | (11,067 | ) | | $ | 4,371 |
| | $ | (6,696 | ) | | $ | 14,405 |
| | $ | (5,690 | ) | | $ | 8,715 |
| |
| Other comprehensive loss | | $ | (24,502 | ) | | $ | 6,493 |
| | $ | (18,010 | ) | | $ | (7,714 | ) | | $ | 2,044 |
| | $ | (5,670 | ) |
|
| | | | | | | | | | | | | | | | | | | | | | | |
| | Nine Months Ended September 30, |
| | 2017 | | 2016 |
| | Before Tax | | Tax Effect | | Net of Tax | | Before Tax | | Tax Effect | | Net of Tax |
| Unrealized gains on investment securities available for sale: | |
| | |
| | |
| | | | | | |
| Net unrealized holding gain arising during the period | $ | 54,258 |
| | $ | (21,432 | ) | | $ | 32,826 |
| | $ | 88,413 |
| | $ | (34,923 | ) | | $ | 53,490 |
|
| Amounts reclassified to gain on investment securities available for sale, net | (29,194 | ) | | 11,532 |
| | (17,662 | ) | | (10,065 | ) | | 3,975 |
| | (6,090 | ) |
| Net change in unrealized gains on investment securities available for sale | 25,064 |
| | (9,900 | ) | | 15,164 |
| | 78,348 |
| | (30,948 | ) | | 47,400 |
|
| Unrealized losses on derivative instruments: | | | | | | | | | | | |
| Net unrealized holding loss arising during the period | (13,780 | ) | | 5,443 |
| | (8,337 | ) | | (57,765 | ) | | 22,817 |
| | (34,948 | ) |
| Amounts reclassified to interest expense on borrowings | 7,463 |
| | (2,948 | ) | | 4,515 |
| | 13,050 |
| | (5,154 | ) | | 7,896 |
|
| Net change in unrealized losses on derivative instruments | (6,317 | ) | | 2,495 |
| | (3,822 | ) | | (44,715 | ) | | 17,663 |
| | (27,052 | ) |
| Other comprehensive income | $ | 18,747 |
| | $ | (7,405 | ) | | $ | 11,342 |
| | $ | 33,633 |
| | $ | (13,285 | ) | | $ | 20,348 |
|
BANKUNITED, INC. AND SUBSIDIARIES
NOTES TO CONSOLIDATED FINANCIAL STATEMENTS - UNAUDITED
SeptemberJune 30, 20172019
|
| | | | | | | | | | | | | | | | | | | | | | | |
| | Six Months Ended June 30, |
| | 2019 | | 2018 |
| | Before Tax | | Tax Effect | | Net of Tax | | Before Tax | | Tax Effect | | Net of Tax |
| Unrealized gains on investment securities available for sale: | |
| | |
| | |
| | | | | | |
| Net unrealized holding gain (loss) arising during the period | $ | 61,147 |
| | $ | (16,204 | ) | | $ | 44,943 |
| | $ | (55,007 | ) | | $ | 14,577 |
| | $ | (40,430 | ) |
| Amounts reclassified to gain on investment securities available for sale, net | (8,231 | ) | | 2,181 |
| | (6,050 | ) | | (3,527 | ) | | 935 |
| | (2,592 | ) |
| Net change in unrealized gains on investment securities available for sale | 52,916 |
| | (14,023 | ) | | 38,893 |
| | (58,534 | ) | | 15,512 |
| | (43,022 | ) |
| Unrealized losses on derivative instruments: | | | | | | | | | | | |
| Net unrealized holding gain (loss) arising during the period | (78,766 | ) | | 20,873 |
| | (57,893 | ) | | 40,325 |
| | (10,686 | ) | | 29,639 |
|
| Amounts reclassified to interest expense on borrowings | (4,411 | ) | | 1,169 |
| | (3,242 | ) | | 211 |
| | (56 | ) | | 155 |
|
| Net change in unrealized losses on derivative instruments | (83,177 | ) | | 22,042 |
| | (61,135 | ) | | 40,536 |
| | (10,742 | ) | | 29,794 |
|
| Other comprehensive loss | $ | (30,261 | ) | | $ | 8,019 |
| | $ | (22,242 | ) | | $ | (17,998 | ) | | $ | 4,770 |
| | $ | (13,228 | ) |
The categories of AOCI and changes therein are presented below for the periods indicated (in thousands):
|
| | | | | | | | | | | |
| | Unrealized Gains on Investment Securities Available for Sale | | Unrealized Losses on Derivative Instruments | | Total |
| Balance at December 31, 2016 | $ | 47,057 |
| | $ | (5,810 | ) | | $ | 41,247 |
|
| Other comprehensive income | 15,164 |
| | (3,822 | ) | | 11,342 |
|
| Balance at September 30, 2017 | $ | 62,221 |
| | $ | (9,632 | ) | | $ | 52,589 |
|
| | | | | | |
| Balance at December 31, 2015 | $ | 41,535 |
| | $ | (19,353 | ) | | $ | 22,182 |
|
| Other comprehensive income | 47,400 |
| | (27,052 | ) | | 20,348 |
|
| Balance at September 30, 2016 | $ | 88,935 |
| | $ | (46,405 | ) | | $ | 42,530 |
|
|
| | | | | | | | | | | |
| | Unrealized Gain (Loss) on Investment Securities Available for Sale | | Unrealized Gain (Loss) on Derivative Instruments | | Total |
| Balance at December 31, 2018 | $ | 4,194 |
| | $ | 679 |
| | $ | 4,873 |
|
| Other comprehensive loss | 38,893 |
| | (61,135 | ) | | (22,242 | ) |
| Balance at June 30, 2019 | $ | 43,087 |
| | $ | (60,456 | ) | | $ | (17,369 | ) |
| | | | | | |
| Balance at December 31, 2017 | $ | 56,534 |
| | $ | (1,548 | ) | | $ | 54,986 |
|
| Cumulative effect of adoption of new accounting standards | 9,187 |
| | (285 | ) | | 8,902 |
|
| Other comprehensive loss | (43,022 | ) | | 29,794 |
| | (13,228 | ) |
| Balance at June 30, 2018 | $ | 22,699 |
| | $ | 27,961 |
| | $ | 50,660 |
|
Other
In January 2019, the Company's Board of Directors authorized the repurchase of up to $150 million of its outstanding common stock. Any repurchases will be made in accordance with applicable securities laws from time to time in open market or private transactions. The program may be commenced, suspended or discontinued without prior notice.
BANKUNITED, INC. AND SUBSIDIARIES
NOTES TO CONSOLIDATED FINANCIAL STATEMENTS - UNAUDITED
June 30, 2019
Note 9 Equity Based and Other Compensation Plans
Share Awards
Unvested share awards
During the nine months ended September 30, 2017, the Company granted 618,306A summary of activity related to unvested share awards underfollows for the 2014 Plan. Allperiods indicated:
|
| | | | | | |
| | Number of Share Awards | | Weighted Average Grant Date Fair Value |
| Unvested share awards outstanding, December 31, 2018 | 1,186,238 |
| | $ | 38.86 |
|
| Granted | 582,353 |
| | 36.57 |
|
| Vested | (533,125 | ) | | 37.67 |
|
| Canceled or forfeited | (115,825 | ) | | 39.11 |
|
| Unvested share awards outstanding, June 30, 2019 | 1,119,641 |
| | $ | 38.21 |
|
| |
|
| |
|
|
| Unvested share awards outstanding, December 31, 2017 | 1,108,477 |
| | $ | 36.06 |
|
| Granted | 640,828 |
| | 40.34 |
|
| Vested | (513,948 | ) | | 34.68 |
|
| Canceled or forfeited | (48,907 | ) | | 38.21 |
|
| Unvested share awards outstanding, June 30, 2018 | 1,186,450 |
| | $ | 38.88 |
|
Unvested share awards are generally valued at the closing price of the Company's common stock on the date of grant. All shares granted prior to 2019 vest in equal annual installments over a period of three years from the date of grant. TheAll shares granted were valued atin 2019 to Company employees vest in equal annual installments over a period of four years from the date of grant. Shares granted to the Company's Board of Directors vest over a period of one year. The following table summarizes the closing price of the Company’s commonCompany's stock on the date of grant ranging from $33.21 to $40.84,for shares granted and had anthe aggregate grant date fair value of $24.9 million. shares vesting for the periods indicated (in thousands, except per share data):
|
| | | | | | | |
| | Six Months Ended June 30, |
| | 2019 | | 2018 |
| Range of the closing price on date of grant | $34.23 - $36.65 |
| | $40.28 - $42.80 |
|
| Aggregate grant date fair value of shares vesting | $ | 20,083 |
| | $ | 17,825 |
|
The total unrecognized compensation cost of $26.7$32.3 million for all unvested share awards outstanding at SeptemberJune 30, 20172019 will be recognized over a weighted average remaining period of 1.982.42 years.
During the nine months ended September 30, 2016, the Company granted 644,888 unvested share awards under the 2014 Plan. All of the shares vest in equal annual installments over a period of three years from the date of grant. The shares granted were valued at the closing price of the Company’s common stock on the date of grant, ranging from $29.78 to $33.76, and had an aggregate fair value of $20.0 million.
Executive share-based awards
Certain of the Company's executives are eligible to receive annual awards of RSUs and PSUs (collectively, the "share units"). Annual awards of RSUs represent a fixed number of shares and vest on December 31st in equal tranches over three years.years for awards issued prior to 2019 and over four years for awards issued in 2019. PSUs are initially granted based on a target value. The number of PSUs that ultimately vest at the end of a three-yearthe performance measurement period will be based on the achievement of performance criteria pre-established by the Compensation Committee of the Board of Directors. The performance criteria established for the PSUs granted in 20172019, 2018 and 20162017 include both performance and market conditions. Upon vesting, the share units will be converted to common stock on a one-for-one basis, or may be settled in cash at the Company's option. The share units will accumulate dividends declared on the Company's common stock from the date of grant to be paid subsequent to vesting.
The first trancheCompany has cash settled all tranches of RSUs grantedand PSUs that have vested onthrough December 31, 2016. The Company cash settled these share units in the amount of $0.8 million during the first quarter of 2017.2018. As a result of thisthe previous cash settlement,settlements, all RSUs and PSUs have been determined to be liability instruments and will beare remeasured at fair
BANKUNITED, INC. AND SUBSIDIARIES
NOTES TO CONSOLIDATED FINANCIAL STATEMENTS - UNAUDITED
June 30, 2019
value each reporting period until the awards are settled. The RSUs are valued based on the closing price of the Company's common stock at the reporting date. The PSUs are valued based on the closing price of the Company's common stock at the reporting date net of a discount related to any applicable market conditions, considering the probability of meeting the defined performance conditions. Compensation cost related to PSUs is recognized during the performance period based on the probable outcome of the respective performance conditions.
DuringA summary of activity related to executive share-based awards for the nine months ended September 30, 2017, 47,848 RSUs and 47,848 PSUs were granted. During the nine months ended September 30, 2016, 57,873 RSUs and 57,873 PSUs were granted. periods indicated follows:
|
| | | | | |
| | RSU | | PSU |
| Unvested executive share-based awards outstanding, December 31, 2018 | 90,612 |
| | 99,874 |
|
| Granted | 73,062 |
| | 73,062 |
|
| Unvested executive share-based awards outstanding, June 30, 2019 | 163,674 |
| | 172,936 |
|
| | | | |
| Unvested executive share-based awards outstanding, December 31, 2017 | 91,171 |
| | 105,721 |
|
| Granted | 52,026 |
| | 52,026 |
|
| Unvested executive share-based awards outstanding, June 30, 2018 | 143,197 |
| | 157,747 |
|
The total liability for the share unitsthese executive share-based awards was $2.6$4.0 million at SeptemberJune 30, 2017.2019. The total unrecognized compensation cost of $5.3$7.2 million for these share unitsunvested executive share-based awards at SeptemberJune 30, 20172019 will be recognized over a weighted average remaining period of 2.182.28 years.
Incentiveawards
BANKUNITED, INC. AND SUBSIDIARIES
NOTES TO CONSOLIDATED FINANCIAL STATEMENTS - UNAUDITED
September 30, 2017
The618,306 unvested share awards granted during the nine months ended September 30, 2017, as discussed above, included 25,321 unvested share awards granted to certain of the Company's executives based on the achievement of performance criteria pre-established by the Compensation Committee for the year ended December 31, 2016.
Incentiveawards
Beginning in 2017, the Company's annual incentive compensation arrangements for employees other than those eligible for the executive share-based awards discussed above provide for settlement through a combination of cash payments and unvested share awards following the end of the annual performance period. The dollar value of share awards to be granted is based on the achievement of performance criteria established in the incentive arrangements. The number of shares of common stock to be awarded is variable based on the closing price of the Company's stock on the date of grant; therefore, these awards are initially classified as liability instruments, with compensation cost recognized from the beginning of the performance period. TheAwards related to performance periods prior to 2019, included in the summary of activity related to unvested share awards above, vest overthree years and awards related to the 2019 performance period will vest in equal installments over a period of threefour years from the date of grant. The total liability for the incentive share awards for the 2019 performance period was $1.2$0.4 million at SeptemberJune 30, 2017.2019. The related total unrecognized compensation cost of $5.3$3.6 million for these incentive share awards at SeptemberJune 30, 20172019 will be recognized over a weighted average remaining period of 3.254.51 years. The accrued liability and unrecognized compensation cost are based on management's current estimate of the likely outcome of the performance criteria established in the incentive arrangements and may differ from actual results.
The 582,353 unvested share awards granted during the six months ended June 30, 2019, as discussed above, included 60,290 unvested share awards granted under the Company's annual incentive compensation arrangements based on the achievement of established performance criteria for the year ended December 31, 2018.
BANKUNITED, INC. AND SUBSIDIARIES
NOTES TO CONSOLIDATED FINANCIAL STATEMENTS - UNAUDITED
June 30, 2019
Option Awards
A summary of activity related to stock option awards for the ninesix months ended SeptemberJune 30, 20172019 and 2018 follows:
|
| | | | | | |
| | Number of Option Awards | | Weighted Average Exercise Price |
| Option awards outstanding, December 31, 2018 | 964,840 |
| | $ | 26.53 |
|
| Exercised | (3,910 | ) | | 11.14 |
|
| Canceled or forfeited | (1,960 | ) | | 63.74 |
|
| Option awards outstanding and exercisable, June 30, 2019 | 958,970 |
| | $ | 26.52 |
|
| |
|
| |
|
|
| Option awards outstanding, December 31, 2017 | 1,270,688 |
| | $ | 26.93 |
|
| Exercised | (291,689 | ) | | 26.94 |
|
| Option awards outstanding, June 30, 2018 | 978,999 |
| | $ | 27.07 |
|
|
| | | | | | |
| | Number of Option Awards | | Weighted Average Exercise Price |
| Option awards outstanding, December 31, 2016 | 3,602,076 |
| | $ | 26.74 |
|
| Exercised | (2,304,108 | ) | | 26.70 |
|
| Option awards outstanding and exercisable, September 30, 2017 | 1,297,968 |
| | $ | 26.81 |
|
Activity related to stock option awards for the nine months ended September 30, 2016 was not significant. The intrinsic value of options exercised and the related tax benefit was $25.3$0.1 million and $3.8$4.6 million, respectively, during the ninesix months ended SeptemberJune 30, 2017.2019 and 2018. The related tax benefit of options exercised was immaterial for both the six months ended June 30, 2019 and 2018.
Note 10 Fair Value Measurements
Assets and liabilities measured at fair value on a recurring basis
Following is a description of the methodologies used to estimate the fair values of assets and liabilities measured at fair value on a recurring basis and the level within the fair value hierarchy in which those measurements are typically classified.
Investment securities available for sale and marketable equity securities—Fair value measurements are based on quoted prices in active markets when available; these measurements are classified within level 1 of the fair value hierarchy. These securities typically include U.S. Treasury securities and certain preferred stocks. If quoted prices in active markets are not available, fair values are estimated using quoted prices of securities with similar characteristics, quoted prices of identical securities in less active markets, discounted cash flow techniques, or matrix pricing models. These securities are generally classified within level 2 of the fair value hierarchy and include U.S. Government agency securities, U.S. Government agency and sponsored enterprise MBS, preferred stock investments for which level 1 valuations are not available, corporate debt securities, non-mortgage asset-backed securities, single family rental real estate-backed securities, certain private label residential MBS and CMOs, private label commercial MBS, collateralized loan obligations and state and municipal obligations. Pricing of these securities is generally primarily spread driven. Observable inputs that may impact the valuation of these securities include benchmark yield curves, credit spreads, reported trades, dealer quotes, bids, issuer spreads, current rating, historical constant prepayment rates, historical voluntary prepayment rates, structural and waterfall features of individual securities, published collateral data, and for certain securities, historical constant default rates and default severities. Investment securities available for sale generally classified within level 3 of the fair value hierarchy include certain private label MBS and trust preferred securities. The Company typically values these securities using third-party proprietary pricing models, primarily discounted cash flow valuation techniques, which incorporate both observable and unobservable inputs. Unobservable inputs that may impact the valuation of
BANKUNITED, INC. AND SUBSIDIARIES
NOTES TO CONSOLIDATED FINANCIAL STATEMENTS - UNAUDITED
September 30, 2017
these securities include risk adjusted discount rates, projected prepayment rates, projected default rates and projected loss severity.
The Company uses third-party pricing services in determining fair value measurements for investment securities. To obtain an understanding of the methodologies and assumptions used, management reviews written documentation provided by the pricing services, conducts interviews with valuation desk personnel and reviews model results and detailed assumptions used to value selected securities as considered necessary. Management has established a robust price challenge process that includes a review by the treasury front office of all prices provided on a monthly basis. Any price evidencing unexpected month over month fluctuations or deviations from expectations is challenged. If considered necessary to resolve any discrepancies, a price will be obtained from an additional independent valuation source. The Company does not typically adjust the prices provided, other than through this established challenge process. The results of price challenges are subject to review by executive management. The Company has also established a quarterly process whereby prices provided by its primary pricing service for
BANKUNITED, INC. AND SUBSIDIARIES
NOTES TO CONSOLIDATED FINANCIAL STATEMENTS - UNAUDITED
June 30, 2019
a sample of securities are validated. Any price discrepancies are resolved based on careful consideration of the assumptions and inputs employed by each of the pricing sources.
Servicing rights—Commercial servicing rights are valued using a discounted cash flow methodology incorporating contractually specified servicing fees and market based assumptions about prepayments, discount rates, default rates and costs of servicing. Prepayment and default assumptions are based on historical industry data for loans with similar characteristics. Assumptions about costs of servicing are based on market convention. Discount rates are based on rates of return implied by observed trades of underlying loans in the secondary market. Fair value of residential MSRs is estimated using a discounted cash flow technique that incorporates market‑based assumptions including estimated prepayment speeds, contractual servicing fees, cost to service, discount rates, escrow account earnings, ancillary income, and estimated defaults. Due to the nature of the valuation inputs and the limited availability of market pricing, servicing rights are classified as level 3.
Derivative financial instruments—Fair values of interest rate swaps are determined using widely accepted discounted cash flow modeling techniques. These discounted cash flow models use projections of future cash payments and receipts that are discounted at mid-market rates. Observable inputs that may impact the valuation of these instruments include LIBOR swap rates and LIBOR forward yield curves. These fair value measurements are generally classified within level 2 of the fair value hierarchy.
BANKUNITED, INC. AND SUBSIDIARIES
NOTES TO CONSOLIDATED FINANCIAL STATEMENTS - UNAUDITED
September 30, 2017
The following tables present assets and liabilities measured at fair value on a recurring basis at the dates indicated (in thousands):
| | | | September 30, 2017 | June 30, 2019 |
| | Level 1 | | Level 2 | | Level 3 | | Total | Level 1 | | Level 2 | | Level 3 | | Total |
| Investment securities available for sale: | |
| | |
| | |
| | |
| |
| | |
| | |
| | |
|
| U.S. Treasury securities | $ | 24,957 |
| | $ | — |
| | $ | — |
| | $ | 24,957 |
| $ | 50,213 |
| | $ | — |
| | $ | — |
| | $ | 50,213 |
|
| U.S. Government agency and sponsored enterprise residential MBS | — |
| | 2,348,687 |
| | — |
| | 2,348,687 |
| — |
| | 2,227,795 |
| | — |
| | 2,227,795 |
|
| U.S. Government agency and sponsored enterprise commercial MBS | — |
| | 139,220 |
| | — |
| | 139,220 |
| — |
| | 381,104 |
| | — |
| | 381,104 |
|
| Private label residential MBS and CMOs | — |
| | 467,061 |
| | 60,797 |
| | 527,858 |
| — |
| | 1,369,656 |
| | 25,526 |
| | 1,395,182 |
|
| Private label commercial MBS | — |
| | 1,153,601 |
| | — |
| | 1,153,601 |
| — |
| | 1,557,953 |
| | — |
| | 1,557,953 |
|
| Single family rental real estate-backed securities | — |
| | 572,948 |
| | — |
| | 572,948 |
| — |
| | 392,306 |
| | — |
| | 392,306 |
|
| Collateralized loan obligations | — |
| | 700,319 |
| | — |
| | 700,319 |
| — |
| | 1,198,282 |
| | — |
| | 1,198,282 |
|
| Non-mortgage asset-backed securities | — |
| | 82,637 |
| | — |
| | 82,637 |
| — |
| | 157,817 |
| | — |
| | 157,817 |
|
| Preferred stocks | 70,038 |
| | 678 |
| | — |
| | 70,716 |
| |
| State and municipal obligations | — |
| | 677,015 |
| | — |
| | 677,015 |
| — |
| | 279,327 |
| | — |
| | 279,327 |
|
| SBA securities | — |
| | 586,675 |
| | — |
| | 586,675 |
| — |
| | 421,773 |
| | — |
| | 421,773 |
|
| Other debt securities | — |
| | 3,815 |
| | 5,024 |
| | 8,839 |
| — |
| | — |
| | 4,781 |
| | 4,781 |
|
| Marketable equity securities | | 62,175 |
| | — |
| | — |
| | 62,175 |
|
| Servicing rights | — |
| | — |
| | 30,136 |
| | 30,136 |
| — |
| | — |
| | 9,435 |
| | 9,435 |
|
| Derivative assets | — |
| | 28,334 |
| | — |
| | 28,334 |
| — |
| | 41,405 |
| | — |
| | 41,405 |
|
| Total assets at fair value | $ | 94,995 |
| | $ | 6,760,990 |
| | $ | 95,957 |
| | $ | 6,951,942 |
| $ | 112,388 |
| | $ | 8,027,418 |
| | $ | 39,742 |
| | $ | 8,179,548 |
|
| Derivative liabilities | $ | — |
| | $ | 27,076 |
| | $ | — |
| | $ | 27,076 |
| $ | — |
| | $ | (19,251 | ) | | $ | — |
| | $ | (19,251 | ) |
| Total liabilities at fair value | $ | — |
| | $ | 27,076 |
| | $ | — |
| | $ | 27,076 |
| $ | — |
| | $ | (19,251 | ) | | $ | — |
| | $ | (19,251 | ) |
BANKUNITED, INC. AND SUBSIDIARIES
NOTES TO CONSOLIDATED FINANCIAL STATEMENTS - UNAUDITED
SeptemberJune 30, 20172019
|
| | | | | | | | | | | | | | | |
| | December 31, 2018 |
| | Level 1 | | Level 2 | | Level 3 | | Total |
| Investment securities available for sale: | |
| | |
| | |
| | |
|
| U.S. Treasury securities | $ | 39,873 |
| | $ | — |
| | $ | — |
| | $ | 39,873 |
|
| U.S. Government agency and sponsored enterprise residential MBS | — |
| | 1,897,474 |
| | — |
| | 1,897,474 |
|
| U.S. Government agency and sponsored enterprise commercial MBS | — |
| | 374,787 |
| | — |
| | 374,787 |
|
| Private label residential MBS and CMOs | — |
| | 1,499,514 |
| | 34,684 |
| | 1,534,198 |
|
| Private label commercial MBS | — |
| | 1,485,716 |
| | — |
| | 1,485,716 |
|
| Single family rental real estate-backed securities | — |
| | 402,458 |
| | — |
| | 402,458 |
|
| Collateralized loan obligations | — |
| | 1,235,198 |
| | — |
| | 1,235,198 |
|
| Non-mortgage asset-backed securities | — |
| | 204,067 |
| | — |
| | 204,067 |
|
| State and municipal obligations | — |
| | 398,429 |
| | — |
| | 398,429 |
|
| SBA securities | — |
| | 519,313 |
| | — |
| | 519,313 |
|
| Other debt securities | — |
| | — |
| | 4,846 |
| | 4,846 |
|
| Marketable securities | 60,519 |
| | — |
| | — |
| | 60,519 |
|
| Servicing rights | — |
| | — |
| | 9,525 |
| | 9,525 |
|
| Derivative assets | — |
| | 29,615 |
| | — |
| | 29,615 |
|
| Total assets at fair value | $ | 100,392 |
| | $ | 8,046,571 |
| | $ | 49,055 |
| | $ | 8,196,018 |
|
| Derivative liabilities | $ | — |
| | $ | (23,874 | ) | | $ | — |
| | $ | (23,874 | ) |
| Total liabilities at fair value | $ | — |
| | $ | (23,874 | ) | | $ | — |
| | $ | (23,874 | ) |
BANKUNITED, INC. AND SUBSIDIARIES
NOTES TO CONSOLIDATED FINANCIAL STATEMENTS - UNAUDITED
June 30, 2019
|
| | | | | | | | | | | | | | | |
| | December 31, 2016 |
| | Level 1 | | Level 2 | | Level 3 | | Total |
| Investment securities available for sale: | |
| | |
| | |
| | |
|
| U.S. Treasury securities | $ | 5,005 |
| | $ | — |
| | $ | — |
| | $ | 5,005 |
|
| U.S. Government agency and sponsored enterprise residential MBS | — |
| | 1,527,242 |
| | — |
| | 1,527,242 |
|
| U.S. Government agency and sponsored enterprise commercial MBS | — |
| | 124,586 |
| | — |
| | 124,586 |
|
| Private label residential MBS and CMOs | — |
| | 254,488 |
| | 120,610 |
| | 375,098 |
|
| Private label commercial MBS | — |
| | 1,187,624 |
| | — |
| | 1,187,624 |
|
| Single family rental real estate-backed securities | — |
| | 861,251 |
| | — |
| | 861,251 |
|
| Collateralized loan obligations | — |
| | 487,296 |
| | — |
| | 487,296 |
|
| Non-mortgage asset-backed securities | — |
| | 186,736 |
| | — |
| | 186,736 |
|
| Preferred stocks | 86,890 |
| | 1,313 |
| | — |
| | 88,203 |
|
| State and municipal obligations | — |
| | 698,546 |
| | — |
| | 698,546 |
|
| SBA securities | — |
| | 523,906 |
| | — |
| | 523,906 |
|
| Other debt securities | — |
| | 3,519 |
| | 4,572 |
| | 8,091 |
|
| Servicing rights | — |
| | — |
| | 27,159 |
| | 27,159 |
|
| Derivative assets | — |
| | 50,232 |
| | — |
| | 50,232 |
|
| Total assets at fair value | $ | 91,895 |
| | $ | 5,906,739 |
| | $ | 152,341 |
| | $ | 6,150,975 |
|
| Derivative liabilities | $ | — |
| | $ | 61,562 |
| | $ | — |
| | $ | 61,562 |
|
| Total liabilities at fair value | $ | — |
| | $ | 61,562 |
| | $ | — |
| | $ | 61,562 |
|
There were no transfers of financial assets between levels of the fair value hierarchy during the nine months ended September 30, 2017.
The following table reconciles changes in the fair value of assets and liabilities measured at fair value on a recurring basis and classified in level 3 of the fair value hierarchy during the periods indicated (in thousands):
|
| | | | | | | | | | | | | | | | | | | | | | | |
| | Three Months Ended September 30, |
| | 2017 | | 2016 |
| | Private Label Residential MBS | | Other Debt Securities | | Servicing Rights | | Private Label Residential MBS | | Other Debt Securities | | Servicing Rights |
| Balance at beginning of period | $ | 108,790 |
| | $ | 4,923 |
| | $ | 29,128 |
| | $ | 131,156 |
| | $ | 4,292 |
| | $ | 24,891 |
|
| Gains (losses) for the period included in: | | | | | | | | | | | |
| Net income | 24,146 |
| | — |
| | (1,330 | ) | | — |
| | — |
| | (2,369 | ) |
| Other comprehensive income | (24,668 | ) | | 101 |
| | — |
| | 337 |
| | 22 |
| | — |
|
| Discount accretion | 2,332 |
| | 59 |
| | — |
| | 1,404 |
| | 36 |
| | — |
|
| Purchases or additions | — |
| | — |
| | 2,338 |
| | — |
| | — |
| | 2,194 |
|
| Sales | (40,732 | ) | | — |
| | — |
| | — |
| | — |
| | — |
|
| Settlements | (9,071 | ) | | (59 | ) | | — |
| | (5,594 | ) | | (26 | ) | | — |
|
| Transfers into level 3 | — |
| | — |
| | — |
| | — |
| | — |
| | — |
|
| Transfers out of level 3 | — |
| | — |
| | — |
| | — |
| | — |
| | — |
|
| Balance at end of period | $ | 60,797 |
| | $ | 5,024 |
| | $ | 30,136 |
| | $ | 127,303 |
| | $ | 4,324 |
| | $ | 24,716 |
|
BANKUNITED, INC. AND SUBSIDIARIES
NOTES TO CONSOLIDATED FINANCIAL STATEMENTS - UNAUDITED
September 30, 2017
|
| | | | | | | | | | | | | | | | | | | | | | | |
| | Three Months Ended June 30, |
| | 2019 | | 2018 |
| | Private Label
Residential
MBS | | Other Debt
Securities | | Servicing Rights | | Private Label
Residential
MBS | | Other Debt
Securities | | Servicing Rights |
| Balance at beginning of period | $ | 27,904 |
| | $ | 4,818 |
| | $ | 9,585 |
| | $ | 44,120 |
| | $ | 5,714 |
| | $ | 33,432 |
|
| Gains (losses) for the period included in: | | | | | | | | | | | |
| Net income | 196 |
| | — |
| | (486 | ) | | — |
| | — |
| | (1,868 | ) |
| Other comprehensive income | (800 | ) | | (32 | ) | | — |
| | (963 | ) | | (91 | ) | | — |
|
| Discount accretion | 941 |
| | 55 |
| | — |
| | 714 |
| | 182 |
| | — |
|
| Purchases or additions | — |
| | — |
| | 336 |
| | — |
| | — |
| | 4,351 |
|
| Sales | (561 | ) | | — |
| | — |
| | — |
| | — |
| | — |
|
| Settlements | (2,154 | ) | | (60 | ) | |
|
| | (3,307 | ) | | (224 | ) | | — |
|
| Transfers into level 3 | — |
| | — |
| | — |
| | — |
| | — |
| | — |
|
| Transfers out of level 3 | — |
| | — |
| | — |
| | — |
| | — |
| | — |
|
| Balance at end of period | $ | 25,526 |
| | $ | 4,781 |
| | $ | 9,435 |
| | $ | 40,564 |
| | $ | 5,581 |
| | $ | 35,915 |
|
| Change in unrealized gains or losses included in OCI for assets held at the end of the reporting period | $ | (320 | ) | | $ | (32 | ) | | | | $ | (933 | ) | | $ | (91 | ) | | |
| | | | Nine Months Ended September 30, | Six Months Ended June 30, |
| | 2017 | | 2016 | 2019 | | 2018 |
| | Private Label Residential MBS | | Other Debt Securities | | Servicing Rights | | Private Label Residential MBS | | Other Debt Securities | | Servicing Rights | Private Label
Residential
MBS | | Other Debt
Securities | | Servicing Rights | | Private Label
Residential
MBS | | Other Debt
Securities | | Servicing Rights |
| Balance at beginning of period | $ | 120,610 |
| | $ | 4,572 |
| | $ | 27,159 |
| | $ | 140,883 |
| | $ | 4,532 |
| | $ | 20,017 |
| $ | 34,684 |
| | $ | 4,846 |
| | $ | 9,525 |
| | $ | 52,214 |
| | $ | 5,329 |
| | $ | 30,737 |
|
| Gains (losses) for the period included in: | | | | | | | | | | | | | | | | | | | | | | |
| Net income | 24,146 |
| | — |
| | (4,273 | ) | | — |
| | — |
| | (5,983 | ) | 1,630 |
| | — |
| | (1,148 | ) | | 1,319 |
| | — |
| | (1,621 | ) |
| Other comprehensive income | (25,651 | ) | | 469 |
| | — |
| | (190 | ) | | (245 | ) | | — |
| (4,064 | ) | | (67 | ) | | — |
| | (3,461 | ) | | 287 |
| | — |
|
| Discount accretion | 5,208 |
| | 248 |
| | — |
| | 4,485 |
| | 88 |
| | — |
| 3,044 |
| | 70 |
| | — |
| | 1,585 |
| | 213 |
| | — |
|
| Purchases or additions | — |
| | — |
| | 7,250 |
| | — |
| | — |
| | 10,682 |
| — |
| | — |
| | 1,058 |
| | — |
| | — |
| | 6,799 |
|
| Sales | (40,732 | ) | | — |
| | — |
| | — |
| | — |
| | — |
| (5,531 | ) | | — |
| | — |
| | (5,120 | ) | | — |
| | — |
|
| Settlements | (22,784 | ) | | (265 | ) | | — |
| | (17,875 | ) | | (51 | ) | | — |
| (4,237 | ) | | (68 | ) | | — |
| | (5,973 | ) | | (248 | ) | | — |
|
| Transfers into level 3 | — |
| | — |
| | — |
| | — |
| | — |
| | — |
| — |
| | — |
| | — |
| | — |
| | — |
| | — |
|
| Transfers out of level 3 | — |
| | — |
| | — |
| | — |
| | — |
| | — |
| — |
| | — |
| | — |
| | — |
| | — |
| | — |
|
| Balance at end of period | $ | 60,797 |
| | $ | 5,024 |
| | $ | 30,136 |
| | $ | 127,303 |
| | $ | 4,324 |
| | $ | 24,716 |
| $ | 25,526 |
| | $ | 4,781 |
| | $ | 9,435 |
| | $ | 40,564 |
| | $ | 5,581 |
| | $ | 35,915 |
|
| Change in unrealized gains or losses included in OCI for assets held at the end of the reporting period | | $ | (731 | ) | | $ | (67 | ) | | | | $ | (1,992 | ) | | $ | 287 |
| | |
Gains on private label residential MBS recognized in net income during the three and ninesix months ended SeptemberJune 30, 20172019 and 2018 are included in the consolidated statement of income line item "Gain"Gain on investment securities, available for sale, net.net." Changes in the fair value of servicing rights are included in the consolidated statement of income line item “Other“Other non-interest income.income.” Changes in fair value include changes due to valuation assumptions, primarily discount rates and prepayment speeds, as well as other changes such as runoff and the passage of time. The amount of net unrealized lossesgains (losses) included in earnings for the nine six
BANKUNITED, INC. AND SUBSIDIARIES
NOTES TO CONSOLIDATED FINANCIAL STATEMENTS - UNAUDITED
June 30, 2019
months ended SeptemberJune 30, 2017 and 2016 that were2019 related to servicing rights held at SeptemberJune 30, 20172019 was insignificant; and 2016 totaled approximately $0.8$1.1 million and $1.7 million, respectively, and for the six months ended June 30, 2018 related to servicing rights held at June 30, 2018. The net unrealized gains (losses)were primarily due to changes in discount rates and prepayment speeds.
Securities for which fair value measurements are categorized in level 3 of the fair value hierarchy at SeptemberJune 30, 20172019 consisted of pooled trust preferred securities with a fair value of $5 million and private label residential MBS and CMOs with a fair value of $61$26 million. The trust preferred securities are not material to the Company’s financial statements. Private label residential MBS consisted of senior and mezzanine tranches collateralized by prime fixed rate and hybrid 1-4 single family residential mortgages originated before 2005, some of which contain option-arm features.2005. Substantially all of these securities have variable rate coupons. Weighted average subordination levels at SeptemberJune 30, 20172019 were 16.4%19.4% and 10.4%14.4% for investment grade and non-investment grade securities, respectively.
The following table provides information about the valuation techniques and unobservable inputs used in the valuation of private label residential MBS and CMOs falling within level 3 of the fair value hierarchy as of SeptemberJune 30, 20172019 (dollars in thousands):
| | | | | Fair Value at | | Valuation Technique | | Unobservable Input | | Range (Weighted Average) | | Fair Value at | | Valuation Technique | | Unobservable Input | | Range (Weighted Average) |
| | | September 30, 2017 | | | June 30, 2019 | |
| Investment grade | | $ | 34,245 |
| | Discounted cash flow | | Voluntary prepayment rate | | 6.60% - 25.60% (15.92%) | | $ | 13,199 |
| | Discounted cash flow | | Voluntary prepayment rate | | 5.00% - 27.20% (15.70%) |
| | | | | Probability of default | | 0.13% - 4.04% (1.36%) | | | | Probability of default | | 0.10% - 10.00% (2.09%) |
| | | | | Loss severity | | 15.00% - 75.00% (33.10%) | | | | Loss severity | | 15.00% - 100.00% (41.05%) |
| | | | | Discount rate | | 1.88% - 7.43% (3.48%) | | | | Discount rate | | 2.40% - 6.15% (3.42%) |
| | | | | | | |
| Non-investment grade | | $ | 26,552 |
| | Discounted cash flow | | Voluntary prepayment rate | | 1.10% - 29.30% (15.35%) | | $ | 12,327 |
| | Discounted cash flow | | Voluntary prepayment rate | | 7.10% - 30.00% (15.48%) |
| | | | | Probability of default | | 0.13% - 4.15% (1.51%) | | | | Probability of default | | 0.00% - 5.56% (2.26%) |
| | | | | Loss severity | | 15.00% - 95.00% (32.96%) | | | | Loss severity | | 15.00% - 100.00% (29.87%) |
| | | | | Discount rate | | 1.35% - 9.43% (5.89%) | | | | Discount rate | | 1.59% - 12.15% (4.61%) |
The significant unobservable inputs impacting the fair value measurement of private label residential MBS and CMOs include voluntary prepayment rates, probability of default, loss severity given default and discount rates. Generally, increases in
BANKUNITED, INC. AND SUBSIDIARIES
NOTES TO CONSOLIDATED FINANCIAL STATEMENTS - UNAUDITED
September 30, 2017
probability of default, loss severity or discount rates would result in a lower fair value measurement. Alternatively, decreases in probability of default, loss severity or discount rates would result in a higher fair value measurement. For securities with less favorable credit characteristics, decreases in voluntary prepayment speeds may be interpreted as a deterioration in the overall credit quality of the underlying collateral and as such, lead to lower fair value measurements. The fair value measurements of those securities with higher levels of subordination will be less sensitive to changes in these unobservable inputs other than discount rates, while securities with lower levels of subordination will show a higher degree of sensitivity to changes in these unobservable inputs other than discount rates. Generally, a change in the assumption used for probability of default is accompanied by a directionally similar change in the assumption used for loss severity given default and a directionally opposite change in the assumption used for voluntary prepayment rate.
The following table provides information about the valuation techniques and significant unobservable inputs used in the valuation of servicing rights as of SeptemberJune 30, 20172019 (dollars in thousands):
|
| | | | | | | | | | |
| | | Fair Value at | | Valuation Technique | | Unobservable Input | | Range (Weighted Average) |
| | | September 30, 2017 | | | |
| Residential MSRs | | $ | 18,006 |
| | Discounted cash flow | | Prepayment rate | | 2.76% - 29.96% (12.88%) |
| | | | | | | Discount rate | | 9.50% - 9.58% (9.51%) |
| | | | | | | | | |
| Commercial servicing rights | | $ | 12,130 |
| | Discounted cash flow | | Prepayment rate | | 0.09% - 9.99% (7.81%) |
| | | | | | | Discount rate | | 8.12% - 14.57% (12.48%) |
|
| | | | | | | | | | |
| | | Fair Value at | | Valuation Technique | | Unobservable Input | | Range (Weighted Average) |
| | | June 30, 2019 | | | |
| Commercial servicing rights | | $ | 9,435 |
| | Discounted cash flow | | Prepayment rate | | 0.60% - 19.91% (14.11%) |
| | | | | | | Discount rate | | 3.61% - 16.81% (11.28%) |
Increases in prepayment rates or discount rates would result in lower fair value measurements and decreases in prepayment rates or discount rates would result in higher fair value measurements. Although the prepayment rate and the discount rate are not directly interrelated, they generally move in opposite directions.
BANKUNITED, INC. AND SUBSIDIARIES
NOTES TO CONSOLIDATED FINANCIAL STATEMENTS - UNAUDITED
June 30, 2019
Assets and liabilities measured at fair value on a non-recurring basis
Following is a description of the methodologies used to estimate the fair values of assets and liabilities that may be measured at fair value on a non-recurring basis, and the level within the fair value hierarchy in which those measurements are typically classified.
Impaired loans, OREOand other repossessed assets—The carrying amount of collateral dependent impaired loans is typically based on the fair value of the underlying collateral, which may be real estate taxi medallions, or other business assets, less estimated costs to sell. The carrying value of OREO is initially measured based on the fair value of the real estate acquired in foreclosure and subsequently adjusted to the lower of cost or estimated fair value, less estimated cost to sell. Fair values of real estate collateral and OREO are typically based on third-party real estate appraisals which utilize market and income approaches to valuation incorporating both observable and unobservable inputs. When current appraisals are not available, the Company may use brokers’ price opinions, home price indices or other available information about changes in real estate market conditions to adjust the latest appraised value available. These adjustments to appraised values may be subjective and involve significant management judgment. The fair value of repossessed assets other than taxi medallions, or collateral consisting of other business assets may be based on third-party appraisals or internal analyses that use market approaches to valuation incorporating primarily unobservable inputs.
The fair value of New York City taxi medallions is based primarily on an internal analysis that utilizes an income approach to valuation. This analysis utilizes data obtained from the NYTLC about the fleet in general and in some cases, our portfolio specifically, and management's assumptions, based on external data when available, about revenues, costs and expenses, to estimate the value that can reasonably be supported by the cash flow generating capacity of a medallion. We further discount the results of this analysis in recognition of estimated selling costs and declining trends in medallion values. We also consider prices of recent medallion transfers as published by the NYTLC; however, the market for taxi medallions is illiquid and information about the circumstances underlying observed transfers is unavailable, therefore, information about recent transfers is not considered sufficient to establish a reliable estimate of value. The Company's medallion valuations fall within the range of published transfer prices over the last six months. Taxi medallions in municipalities other than New York City are generally valued based on published information about recent transfer prices; the valuation of these assets did not have a material impact on the Company's consolidated financial statements for any period presented as the taxi medallion portfolio is heavily concentrated in New York City.
BANKUNITED, INC. AND SUBSIDIARIES
NOTES TO CONSOLIDATED FINANCIAL STATEMENTS - UNAUDITED
September 30, 2017
Fair value measurements related to collateral dependent impaired loans, OREO and other repossessed assets are classified within levellevels 2 and 3 of the fair value hierarchy.
The following tables present the carrying value of assets for which non-recurring changes in fair value have been recorded for the periods indicated (in thousands):
| | | | September 30, 2017 | | Losses from Fair Value Changes | June 30, 2019 | | Losses from Fair Value Changes |
| | Level 1 | | Level 2 | | Level 3 | | Total | | Three Months Ended
September 30, 2017 | | Nine Months Ended
September 30, 2017 | Level 1 | | Level 2 | | Level 3 | | Total | | Three Months Ended
June 30, 2019 | | Six Months Ended June 30, 2019 |
| OREO and repossessed assets | $ | — |
| | $ | — |
| | $ | 5,520 |
| | $ | 5,520 |
| | $ | (515 | ) | | $ | (1,534 | ) | $ | — |
| | $ | — |
| | $ | 1,557 |
| | $ | 1,557 |
| | $ | (203 | ) | | $ | (221 | ) |
| Impaired loans | $ | — |
| | $ | — |
| | $ | 107,173 |
| | $ | 107,173 |
| | $ | (35,106 | ) | | $ | (58,073 | ) | $ | — |
| | $ | — |
| | $ | 15,385 |
| | $ | 15,385 |
| | $ | (529 | ) | | $ | (279 | ) |
| | | | September 30, 2016 | | Losses from Fair Value Changes | June 30, 2018 | | Losses from Fair Value Changes |
| | Level 1 | | Level 2 | | Level 3 | | Total | | Three Months Ended
September 30, 2016 | | Nine Months Ended
September 30, 2016 | Level 1 | | Level 2 | | Level 3 | | Total | | Three Months Ended June 30, 2018 | | Six Months Ended June 30, 2018 |
| OREO and repossessed assets | $ | — |
| | $ | — |
| | $ | 7,923 |
| | $ | 7,923 |
| | $ | (372 | ) | | $ | 740 |
| $ | — |
| | $ | 1,530 |
| | $ | 432 |
| | $ | 1,962 |
| | $ | (396 | ) | | $ | (1,801 | ) |
| Impaired loans | $ | — |
| | $ | — |
| | $ | 59,678 |
| | $ | 59,678 |
| | $ | (10,623 | ) | | $ | (18,873 | ) | $ | — |
| | $ | 26,604 |
| | $ | 54,089 |
| | $ | 80,693 |
| | $ | (10,966 | ) | | $ | (14,157 | ) |
Included in the tables above are impaired taxi medallion loans with carrying values of $90.1 million and $39.6$66.1 million at SeptemberJune 30, 2017 and September 30, 2016, respectively,2018. Losses from fair value changes included in the majority of which were in New York City. Losses of $54.3tables above include $12.7 million and $10.2 million were recognized on impaired taxi medallion loans during the ninesix months ended SeptemberJune 30, 20172018. In addition, OREO and 2016, respectively.
Decreases in the value of medallions are largely driven by decreases in revenues generated from the medallions. Inputs that had the most significant impact on the valuation of New York Cityrepossessed assets reported above included repossessed taxi medallions with carrying values of $1.5 million at SeptemberJune 30, 2017 are presented below:2018. Losses of $0.1 million and $0.6 million were recognized on repossessed taxi medallions during the three and six months ended June 30, 2018.
|
| | |
| Average Amount |
Average fare per trip | $16.12 |
Number of trips per shift | 15.4 |
|
Days worked per month | 25.6 |
|
BANKUNITED, INC. AND SUBSIDIARIES
NOTES TO CONSOLIDATED FINANCIAL STATEMENTS - UNAUDITED
SeptemberJune 30, 20172019
The following table presents the carrying value and fair value of financial instruments and the level within the fair value hierarchy in which those measurements are classified at the dates indicated (dollars in thousands):
|
| | | | | | | | | | | | | | | | | |
| | | | June 30, 2019 | | December 31, 2018 |
| | Level | | Carrying Value | | Fair Value | | Carrying Value | | Fair Value |
| Assets: | | | |
| | |
| | |
| | |
|
| Cash and cash equivalents | 1 | | $ | 442,833 |
| | $ | 442,833 |
| | $ | 382,073 |
| | $ | 382,073 |
|
| Investment securities | 1/2/3 | | 8,138,708 |
| | 8,139,257 |
| | 8,166,878 |
| | 8,167,127 |
|
| Non-marketable equity securities | 2 | | 289,789 |
| | 289,789 |
| | 267,052 |
| | 267,052 |
|
| Loans held for sale | 2 | | 224,759 |
| | 232,000 |
| | 36,992 |
| | 39,931 |
|
| Loans | 3 | | 22,479,708 |
| | 22,815,851 |
| | 21,867,077 |
| | 21,868,258 |
|
| Derivative assets | 2 | | 41,405 |
| | 41,405 |
| | 29,615 |
| | 29,615 |
|
| Liabilities: | | | | | | | | | |
| Demand, savings and money market deposits | 2 | | $ | 16,841,684 |
| | $ | 16,841,684 |
| | $ | 16,654,465 |
| | $ | 16,654,465 |
|
| Time deposits | 2 | | 7,080,716 |
| | 7,093,055 |
| | 6,819,758 |
| | 6,820,355 |
|
| Federal funds purchased | 2 | | 99,000 |
| | 99,000 |
| | 175,000 |
| | 175,000 |
|
| FHLB advances | 2 | | 5,331,000 |
| | 5,353,836 |
| | 4,796,000 |
| | 4,810,446 |
|
| Notes and other borrowings | 2 | | 403,661 |
| | 442,782 |
| | 402,749 |
| | 416,142 |
|
| Derivative liabilities | 2 | | 19,251 |
| | 19,251 |
| | 23,874 |
| | 23,874 |
|
|
| | | | | | | | | | | | | | | | | |
| | | | September 30, 2017 | | December 31, 2016 |
| | Level | | Carrying Value | | Fair Value | | Carrying Value | | Fair Value |
| Assets: | | | |
| | |
| | |
| | |
|
| Cash and cash equivalents | 1 | | $ | 292,601 |
| | $ | 292,601 |
| | $ | 448,313 |
| | $ | 448,313 |
|
| Investment securities available for sale | 1/2/3 | | 6,893,472 |
| | 6,893,472 |
| | 6,073,584 |
| | 6,073,584 |
|
| Investment securities held to maturity | 3 | | 10,000 |
| | 10,000 |
| | 10,000 |
| | 10,000 |
|
| Non-marketable equity securities | 2 | | 270,239 |
| | 270,239 |
| | 284,272 |
| | 284,272 |
|
| Loans held for sale | 2 | | 31,507 |
| | 35,113 |
| | 41,198 |
| | 45,833 |
|
| Loans: | | | | | | | | | |
| Covered | 3 | | 533,128 |
| | 997,376 |
| | 611,942 |
| | 1,200,291 |
|
| Non-covered | 3 | | 19,918,729 |
| | 19,906,579 |
| | 18,630,499 |
| | 18,713,495 |
|
| FDIC Indemnification asset | 3 | | 349,617 |
| | 168,415 |
| | 515,933 |
| | 256,691 |
|
| Derivative assets | 2 | | 28,334 |
| | 28,334 |
| | 50,232 |
| | 50,232 |
|
| Liabilities: | | | | | | | | | |
| Demand, savings and money market deposits | 2 | | $ | 14,889,543 |
| | $ | 14,889,543 |
| | $ | 13,735,248 |
| | $ | 13,735,248 |
|
| Time deposits | 2 | | 6,333,701 |
| | 6,335,324 |
| | 5,755,642 |
| | 5,759,787 |
|
| FHLB advances | 2 | | 4,871,000 |
| | 4,876,017 |
| | 5,239,348 |
| | 5,244,188 |
|
| Notes and other borrowings | 2 | | 402,828 |
| | 427,748 |
| | 402,809 |
| | 403,733 |
|
| Derivative liabilities | 2 | | 27,076 |
| | 27,076 |
| | 61,562 |
| | 61,562 |
|
The following methods and assumptions were used to estimate the fair value of each class of financial instruments, other than those described above:
Cash and cash equivalents
The carrying value of cash and cash equivalents approximates fair value due to their short-term nature and generally negligible credit risk.
Investment securities held to maturity
Investment securities held to maturity includes one bond issued by the State of Israel, with fair value obtained from a third party pricing service.
Non-marketable equity securities
Non-marketable equity securities include FHLB and FRB stock. There is no market for these securities, which can be liquidated only by redemption by the issuer. These securities are valued at par, which has historically represented the redemption price and is therefore considered to approximate fair value.
Loans held for sale
The fair value of the portion of small business loans guaranteed by U.S. Government agencies being held for sale is estimated using pricing on recent sales of similar loans by the Company in active markets.
BANKUNITED, INC. AND SUBSIDIARIES
NOTES TO CONSOLIDATED FINANCIAL STATEMENTS - UNAUDITED
September 30, 2017
Covered loans
Fair values are estimated based on a discounted cash flow analysis. Estimates of future cash flows incorporate various factors that may include the type of loan and related collateral, estimated collateral values, estimated voluntary prepayment rates, estimated default probability and loss severity given default, whether the interest rate is fixed or variable, term of loan and whether or not the loan is amortizing. The fair values of loans accounted for in pools are estimated on a pool basis. Discount rates for residential loans are based on observable fixed income market data for products with similar credit characteristics.
Non-covered loans
Fair values of residential loans are estimated using a discounted cash flow analysis with discount rates based on yields at which similar loans are trading in the secondary market, which reflect assumptions about credit risk. Fair values of commercial and consumer loans are estimated using a discounted cash flow analysis with discount rates based on interest rates currently being offered for loans with similar terms to borrowers of similar credit quality. The ALLL related to commercial and consumer loans is considered a reasonable estimate of the required adjustment to fair value to reflect the impact of credit risk. This estimate may not represent an exit value as defined in ASC 820.
FDIC indemnification asset
The fair value of the FDIC indemnification asset has been estimated using a discounted cash flow technique incorporating assumptions about the timing and amount of future projected cash payments from the FDIC related to the resolution of covered assets. The factors that impact estimates of future cash flows are similar to those impacting estimated cash flows from covered loans. The discount rate is determined by adjusting the risk free rate to incorporate uncertainty in the estimate of the timing and amount of future cash flows and illiquidity.
Deposits
The fair value of demand deposits, savings accounts and money market deposits is the amount payable on demand at the reporting date. The fair value of time deposits is estimated using a discounted cash flow technique based on rates currently offered for deposits of similar remaining maturities.
FHLB advances
Fair value is estimated by discounting contractual future cash flows using the current rate at which borrowings with similar terms and remaining maturities could be obtained by the Company.
Senior notes
Fair value is estimated based on quoted prices of identical securities in less active markets.
Note 11 Commitments and Contingencies
The Company issues off-balance sheet financial instruments to meet the financing needs of its customers. These financial instruments include commitments to fund loans, unfunded commitments under existing lines of credit, and commercial and standby letters of credit. These commitments expose the Company to varying degrees of credit and market risk which are essentially the same as those involved in extending loans to customers, and are subject to the same credit policies used in underwriting loans. Collateral may be obtained based on the Company’s credit evaluation of the counterparty. The Company’s maximum exposure to credit loss is represented by the contractual amount of these commitments. Unfunded commitments under lines of credit include $10.0 million available under non-cancellable commitments in effect at the date of the FSB Acquisition, which are covered under the Single Family Shared-Loss Agreement if prescribed conditions are met.
Commitments to fund loans
These are agreements to lend funds to customers as long as there is no violation of any condition established in the contract. Commitments to fund loans generally have fixed expiration dates or other termination clauses and may require payment of a fee. Many of these commitments are expected to expire without being funded and, therefore, the total commitment amounts do not necessarily represent future liquidity requirements.
BANKUNITED, INC. AND SUBSIDIARIES
NOTES TO CONSOLIDATED FINANCIAL STATEMENTS - UNAUDITED
September 30, 2017
Unfunded commitments under lines of credit
Unfunded commitments under lines of credit include commercial, commercial real estate, home equity and consumer lines of credit to existing customers. Some of these commitments may mature without being fully funded.
Commercial and standby letters of credit
Letters of credit are conditional commitments issued by the Company to guarantee the performance of a customer to a third party. These letters of credit are primarily issued to support trade transactions or guarantee arrangements. The credit risk involved in issuing letters of credit is essentially the same as that involved in extending loan facilities to customers.
BANKUNITED, INC. AND SUBSIDIARIES
NOTES TO CONSOLIDATED FINANCIAL STATEMENTS - UNAUDITED
June 30, 2019
Total lending related commitments outstanding at SeptemberJune 30, 20172019 were as follows (in thousands):
|
| | | |
| Commitments to fund loans | $ | 450,898 |
|
| Commitments to purchase loans | 660,965 |
|
| Unfunded commitments under lines of credit | 2,950,555 |
|
| Commercial and standby letters of credit | 84,731 |
|
| | $ | 4,147,149 |
|
|
| | | |
| Commitments to fund loans | $ | 417,943 |
|
| Commitments to purchase loans | 287,302 |
|
| Unfunded commitments under lines of credit | 2,361,922 |
|
| Commercial and standby letters of credit | 83,141 |
|
| | $ | 3,150,308 |
|
Legal Proceedings
The Company is involved as plaintiff or defendant in various legal actions arising in the normal course of business. In the opinion of management, based upon advice of legal counsel, the likelihood is remote that the impact of these proceedings, either individually or in the aggregate, would be material to the Company’s consolidated financial position, results of operations or cash flows.
Item 2. Management's Discussion and Analysis of Financial Condition and Results of Operations
The following discussion and analysis is intended to focus on significant matters impacting and changes in the financial condition and results of operations of the Company during the three and ninesix months ended SeptemberJune 30, 20172019 and should be read in conjunction with the consolidated financial statements and notes hereto included in this Quarterly Report on Form 10-Q and BKU's 20162018 Annual Report on Form 10-K for the year ended December 31, 20162018 (the "2016"2018 Annual Report on Form 10-K”).
Forward-Looking Statements
This Quarterly Report on Form 10-Q contains forward-looking statements within the meaning of the Private Securities Litigation Reform Act of 1995 that reflect the Company’s current views with respect to, among other things, future events and financial performance. Words such as “anticipates,” “expects,” “intends,” “plans,” “believes,” “seeks,” “estimates” and similar expressions identify forward-looking statements. These forward-looking statements are based on the historical performance of the Company or on the Company’s current plans, estimates and expectations. The inclusion of this forward-looking information should not be regarded as a representation by the Company that the future plans, estimates or expectations so contemplated will be achieved. Such forward-looking statements are subject to various risks and uncertainties and assumptions relating to the Company’s operations, financial results, financial condition, business prospects, growth strategy and liquidity. If one or more of these or other risks or uncertainties materialize, or if the Company’s underlying assumptions prove to be incorrect, the Company’s actual results may vary materially from those indicated in these statements. A number of important factors could cause actual results to differ materially from those indicated by the forward-looking statements, including, but not limited to, the risk factors described in Part II, Item 1A of this Quarterly Report on Form 10- Q and in Part I, Item 1A of the 20162018 Annual Report on Form 10-K. The Company does not undertake any obligation to publicly update or review any forward looking statement, whether as a result of new information, future developments or otherwise.
Overview
Quarterly Highlights
In evaluating our financial performance, we consider the level of and trends in net interest income, the net interest margin, levels and composition of non-interest income and non-interest expense, performance ratios such as the return on average equity and return on average assets and asset quality ratios, particularly for the non-covered portfolio, including the ratio of non-performing loans to total loans, non-performing assets to total assets, and portfolio delinquency and charge-off trends. We consider growth in earning assets and deposits, trends in funding mix and cost of funds. We analyze these ratios and trends against our own historical performance, our budgeted performance and the financial condition and performance of comparable financial institutions.
Quarterly highlights include:
Net income for the quarterthree months ended SeptemberJune 30, 20172019 was $67.8$81.5 million, or $0.62$0.81 per diluted share, compared to $50.8$89.9 million, or $0.47$0.82 per diluted share, for the three months ended June 30, 2018. Non-loss share diluted earnings per share, as previously reported, for the quarter ended SeptemberJune 30, 2016.2018 was $0.59. For the ninesix months ended SeptemberJune 30, 2017,2019 net income was $196.5$147.4 million,, or $1.79$1.45 per diluted share, compared to $162.4$175.1 million,, or $1.50$1.59 per diluted share, for
the ninesix months ended SeptemberJune 30, 2016.2018. Earnings for the ninesix months ended SeptemberJune 30, 20172019 generated an annualized return on average stockholders' equity of 10.21%10.1% and an annualized return on average assets of 0.92%0.91%.
Net interest incomeFor the quarter ended June 30, 2019, non-interest bearing demand deposits grew by $335 million, to 17.1% of total deposits at June 30, 2019 compared to 15.4% of total deposits at December 31, 2018. Total deposits increased by $19.5 million to $241.3$243 million for the quarter ended SeptemberJune 30, 20172019. Non-interest bearing demand deposits grew by $478 million for the six months ended June 30, 2019 while total deposits increased by $448 million.
Loans and leases, including equipment under operating lease, grew by $231 million during the quarter; loan and lease growth was $420 million excluding the transfer of $189 million of Pinnacle Public Finance loans to loans held for sale at June 30, 2019. For the six months ended June 30, 2019, excluding the transfer of Pinnacle loans to held for sale, loans and leases grew by $809 million.
Net interest income for the quarter ended June 30, 2019 decreased by $64.4 million from $221.7$255.3 million for the quarter ended September 30, 2016. Interest income increased by $39.5 million, driven by increases in the average balances of loans and investment securities outstanding and an increase in the yield on interest earning assets. Interest expense increased by $19.9 million, driven by increases in average interest bearing liabilities and the cost of those liabilities. For the nine months ended September 30, 2017, net interest income increased by $68.6 million to $711.4 million from $642.9 million for the nine months ended September 30, 2016.
The net interest margin, calculated on a tax-equivalent basis, decreased to 3.62% for the quarter ended September 30, 2017 from 3.69% for the quarter ended September 30, 2016 and 3.76% for the immediately preceding quarter ended June 30, 2017. Significant factors contributing to the decline in the net interest margin included the continued run-off of high-yielding covered loans and an increase in the cost of interest bearing liabilities.2018. The net interest margin, calculated on a tax-equivalent basis, was 3.69% for the nine months ended September 30, 2017 compared to 3.75% for the nine months ended September 30, 2016.
Total interest earning assets increased by $613 million during the third quarter of 2017. Non-covered loans and leases, including equipment under operating lease, grew by $384 million during the quarter. For the nine months ended
September 30, 2017, total interest earning assets increased by $1.9 billion and non-covered loans and leases grew by $1.3 billion.
Total deposits increased by $445 million2.52% for the quarter ended SeptemberJune 30, 20172019, compared to $21.2 billion. For the nine months ended September 30, 2017, total deposits increased by $1.7 billion.
At September 30, 2017, 96.7% of the non-covered commercial loan portfolio was rated "pass" and substantially all of the non-covered residential portfolio was current. The ratio of non-performing, non-covered loans to total non-covered loans was 1.00% and the ratio of non-performing, non-covered assets to total assets was 0.69% at September 30, 2017. Non-performing taxi medallion loans comprised 0.60% of total non-covered loans and 0.41% of total assets at September 30, 2017.
The provision for loan losses3.60% for the quarter and nine months ended SeptemberJune 30, 2017 totaled $37.9 million and $63.6 million, respectively, compared to $24.4 million and $42.4 million, respectively, for the comparable periods of the prior year.2018. The most significant reason for these increasesthe decline in net interest income and the provision for loan losses was the provision related to the taxi medallion portfolio as discussed further in the sections entitled "Asset Quality" and "Analysis of the Allowance for Loan and Lease Losses."
Gain on sale of investment securities available for sale, net totaled $26.9 millioninterest margin for the quarter ended SeptemberJune 30, 2017. Substantially all of these gains related2019 compared to sales of securitiesthe quarter ended June 30, 2018 was the decrease in accretion on formerly covered under the Commercial Shared-Loss Agreement.residential loans.
The Company’s capital ratios exceeded all regulatory “well capitalized” guidelines, with a Tier 1 leverage ratio of 8.6%, CET1 and Tier 1 risk-based capital ratios of 11.9% and a Total risk-based capital ratio of 12.7% at September 30, 2017. | |
| • | During the quarter ended June 30, 2019, the Company repurchased approximately 3.0 million shares of its common stock for an aggregate purchase price of approximately $102 million. During the six months ended June 30, 2019, the Company repurchased approximately 4.1 million shares of its common stock for an aggregate purchase price of approximately $142 million, at a weighted average price of $34.44 per share. |
Book value per common share grew to $24.56$30.09 at SeptemberJune 30, 2017, a 7.8% increase2019 from September 30, 2016. Tangible$29.49 at December 31, 2018 while tangible book value per common share increased by 8.1%to $29.27 from $28.71 over the same period,period.
Asset quality remained strong. The ratio of non-performing loans to $23.83 at September 30, 2017.
Hurricanes Irma and Harvey
On September 10, 2017, Hurricane Irma made landfall in Florida as a Category 4 hurricane affecting some areas of the state with significant flooding, wind damage and power outages. In addition, the Bank has a limited number of customers and collateral properties located in areas of Texas that were impacted by Hurricane Harvey during August, 2017.
Loan and Lease Portfolio
The Company has assessed the potential impact of the hurricanes on the value of collateral underlying ourtotal loans was 0.61% and the abilityratio of borrowersnon-performing assets to repay their obligations to the Bank. We believe the storms did not materially impact the ability of the substantial majority of our borrowers to repay their loans; however, uncertainty remains as to the ultimate impact of these events on the level of our loan losses and our results of operations.
In order to assess the impact of these hurricanes on our loan and lease portfolio, the Company performed an extensive review of loans with borrowers and/or collateral located in areas impacted by these storms. This analysis entailed the identification of and direct communication with borrowers located in impacted areas to determine the population of borrowers that may have been significantly impacted as well as consideration of factors including but not limited to level and type of insurance coverage, collateral and lien position and the financial condition of the borrower.
Commercial and commercial real estate loans with an aggregate UPB of approximately $7.1 billiontotal assets was 0.45% at SeptemberJune 30, 2017 were determined to be either made to borrowers that have significant business operations in or secured by collateral in areas that were potentially impacted by the hurricanes. Substantially all of those borrowers had been contacted as of October 3, 2017 and responses were considered in the determination of the ALLL as of September 30, 2017. As of October 31, 2017, commercial loans with an aggregate UPB of $22.2 million had been downgraded to criticized or classified status as a result of this analysis. Residential mortgage and other consumer loans with a carrying value of approximately $977 million at September 30, 2017, of which $315 million are covered loans, were determined to be either made to borrowers living in or secured by collateral in areas potentially impacted by the hurricanes; such loans with a carrying value of approximately $902 million, of which $312 million are covered loans, were determined to be in severely impacted areas, based on FEMA’s designation as “individual assistance” areas (“FEMA designated areas”). As of October 31, 2017, 74% of borrowers in FEMA designated areas had been contacted or property inspections conducted to assist in assessing the extent of potential damage to underlying collateral. During the quarter ended September 30, 2017, the Company recorded a loan loss provision of $5.4 million related to the impact of Hurricanes Irma and Harvey.
Impairment of Other Assets
Management also considered the impact of the hurricanes in our analysis of investment securities for OTTI, as well as our evaluation of potential impairment of our investment in equipment under operating lease, LIHTC partnerships, servicing assets and OREO at September 30, 2017 and determined there was no potentially material impact.
Fees, Operations and Facilities
To help those affected by Hurricane Irma, the Company waived or refunded certain fees such as overdraft, NSF and uncollected fees on consumer deposit accounts and late fees on residential mortgage, consumer and small business loans for consumer and small business customers in FEMA designated disaster areas for the period September 10, 2017 through September 30, 2017. In addition, certain residential mortgage and SBA loan customers impacted by the storm may be eligible for assistance in the form of temporary payment deferrals. Waived and refunded fees were not significant.
The Company’s operations and facilities were not materially impacted by Hurricane Irma. The Company continued operating throughout the storm although all of our Florida branch locations were closed from September 8, 2017 through September 11, 2017. The majority of our Florida branch locations and our Miami Lakes corporate headquarters re-opened on September 12, 2017 and all of our Florida branch locations re-opened prior to September 30, 2017.
During the quarter ended September 30, 2017, the Company recorded expenses of $0.6 million related primarily to facilities damage and employee relocation and assistance. We do not expect future expenses related to facilities damage to be material to the Company.
Community Assistance
To help with the recovery efforts of the communities in which we operate, work and live, BankUnited has made donations totaling $100,000 to non-profit organizations focused on recovery and relief efforts in Florida. These organizations were selected based on their ability to immediately deploy resources directly to targeted affected areas.2019.
Results of Operations
Net Interest Income
Net interest income is the difference between interest earned on interest earning assets and interest incurred on interest bearing liabilities and is the primary driver of core earnings. Net interest income is impacted by the relative mix of interest earning assets and interest bearing liabilities, the ratio of interest earning assets to total assets and of interest bearing liabilities to total funding sources, movements in market interest rates, the shape of the yield curve, levels of non-performing assets and pricing pressure from competitors.
The mix of interest earning assets is influenced by loan demand, market and competitive conditions in our primary lending markets and by management's continual assessment of the rate of return and relative risk associated with various classes of earning assets. The mix of interest bearing liabilities is influenced by the Company's liquidity profile, management's assessment of the desire for lower cost funding sources weighed against relationships with customers and growth requirementsexpectations and is impacted by competition for deposits in the Company's markets and the availability and pricing of other sources of funds.
Net interest income is also impacted by the accounting for ACI loans acquired in conjunction with the FSB Acquisition. ACI loans were initially recorded at fair value, measured based on the present value of expected cash flows. The excess of expected cash flows over carrying value, known as accretable yield, is recognized as interest income over the lives of the underlying loans. The positive impact of accretion related to ACI loans on the net interest margin and the interest rate spread is expected to continue to decline as ACI loans comprise a declining percentage of total loans. The proportion of total loans represented by ACI loans is declining as the ACI loans are resolved and new loans are added to the portfolio. ACI loans represented 2.5% and 3.0% of total loans, including premiums, discounts and deferred fees and costs, at September 30, 2017 and December 31, 2016, respectively. As this trend continues, assuming an otherwise stable interest rate environment, we would expect our net interest margin and interest rate spread to decrease as covered loans are resolved.
The impact of ACI loan accounting on net interest income makes it difficult to compare our net interest margin and interest rate spread to those reported by other financial institutions.
The following table presents, for the periods indicated, information about (i) average balances, the total dollar amount of taxable equivalent interest income from earning assets and the resultant average yields; (ii) average balances, the total dollar amount of interest expense on interest bearing liabilities and the resultant average rates; (iii) net interest income; (iv) the interest rate spread; and (v) the net interest margin. Non-accrual and restructured loans are included in the average balances presented in this table; however, interest income foregone on non-accrual loans is not included. Interest income, yields, spread and margin have been calculated on a tax-equivalent basis for loans and investment securities that are exempt from federal income taxes, at a federal tax rate of 35.0%21% (dollars in thousands):
|
| | | | | | | | | | | | | | | | | | | | | |
| | Three Months Ended September 30, |
| | 2017 | | 2016 |
| | Average
Balance | | Interest (1) | | Yield/
Rate (1)(2) | | Average
Balance | | Interest (1) | | Yield/
Rate (1)(2) |
| Assets: | | | | | | | | | | | |
| Interest earning assets: | |
| | |
| | |
| | |
| | |
| | |
|
| Non-covered loans | $ | 19,710,115 |
| | $ | 187,928 |
| | 3.79 | % | | $ | 17,813,925 |
| | $ | 158,963 |
| | 3.56 | % |
| Covered loans | 518,026 |
| | 73,452 |
| | 56.70 | % | | 700,884 |
| | 74,487 |
| | 42.50 | % |
| Total loans | 20,228,141 |
| | 261,380 |
| | 5.15 | % | | 18,514,809 |
| | 233,450 |
| | 5.03 | % |
Investment securities (3) | 7,002,615 |
| | 55,046 |
| | 3.14 | % | | 5,898,382 |
| | 42,262 |
| | 2.87 | % |
| Other interest earning assets | 545,224 |
| | 3,777 |
| | 2.75 | % | | 557,490 |
| | 3,036 |
| | 2.17 | % |
| Total interest earning assets | 27,775,980 |
| | 320,203 |
| | 4.60 | % | | 24,970,681 |
| | 278,748 |
| | 4.45 | % |
| Allowance for loan and lease losses | (160,231 | ) | | | | | | (139,284 | ) | | | | |
| Non-interest earning assets | 1,699,912 |
| | | | | | 1,884,894 |
| | | | |
| Total assets | $ | 29,315,661 |
| | | | | | $ | 26,716,291 |
| | | | |
| Liabilities and Stockholders' Equity: | | | | | | | | | | | |
| Interest bearing liabilities: | | | | | | | | | | | |
| Interest bearing demand deposits | $ | 1,590,206 |
| | 3,415 |
| | 0.85 | % | | $ | 1,437,677 |
| | 2,224 |
| | 0.62 | % |
| Savings and money market deposits | 9,968,512 |
| | 21,964 |
| | 0.87 | % | | 8,349,281 |
| | 12,974 |
| | 0.62 | % |
| Time deposits | 6,290,056 |
| | 20,540 |
| | 1.30 | % | | 5,567,909 |
| | 15,770 |
| | 1.13 | % |
| Total interest bearing deposits | 17,848,774 |
| | 45,919 |
| | 1.02 | % | | 15,354,867 |
| | 30,968 |
| | 0.80 | % |
| FHLB advances | 4,924,325 |
| | 16,946 |
| | 1.37 | % | | 5,143,003 |
| | 11,956 |
| | 0.92 | % |
| Notes and other borrowings | 402,828 |
| | 5,314 |
| | 5.28 | % | | 403,590 |
| | 5,322 |
| | 5.27 | % |
| Total interest bearing liabilities | 23,175,927 |
| | 68,179 |
| | 1.17 | % | | 20,901,460 |
| | 48,246 |
| | 0.92 | % |
| Non-interest bearing demand deposits | 3,036,046 |
| | | | | | 2,981,017 |
| | | | |
| Other non-interest bearing liabilities | 468,735 |
| | | | | | 460,514 |
| | | | |
| Total liabilities | 26,680,708 |
| | | | | | 24,342,991 |
| | | | |
| Stockholders' equity | 2,634,953 |
| | | | | | 2,373,300 |
| | | | |
| Total liabilities and stockholders' equity | $ | 29,315,661 |
| | | | | | $ | 26,716,291 |
| | | | |
| Net interest income | | | $ | 252,024 |
| | | | | | $ | 230,502 |
| | |
| Interest rate spread | | | | | 3.43 | % | | | | | | 3.53 | % |
| Net interest margin | | | | | 3.62 | % | | | | | | 3.69 | % |
|
| | | | | | | | | | | | | | | | | | | | | | |
| | | Three Months Ended June 30, |
| | | 2019 | | 2018 |
| | | Average
Balance | | Interest (1)(2) | | Yield/
Rate (1)(2) | | Average
Balance | | Interest (1)(2) | | Yield/
Rate (1)(2) |
| Assets: | | | | | | | | | | | | |
| Interest earning assets: | | |
| | |
| | |
| | |
| | |
| | |
|
| Non-covered loans | | $ | 22,505,138 |
| | $ | 253,766 |
| | 4.52 | % | | $ | 21,117,897 |
| | $ | 208,415 |
| | 3.96 | % |
| Covered loans | | — |
| | — |
| | — | % | | 475,568 |
| | 84,200 |
| | 70.82 | % |
| Total loans | | 22,505,138 |
| | 253,766 |
| | 4.52 | % | | 21,593,465 |
| | 292,615 |
| | 5.43 | % |
Investment securities (3) | | 8,187,518 |
| | 73,867 |
| | 3.61 | % | | 6,902,634 |
| | 57,444 |
| | 3.33 | % |
| Other interest earning assets | | 525,563 |
| | 5,069 |
| | 3.87 | % | | 484,087 |
| | 4,499 |
| | 3.73 | % |
| Total interest earning assets | | 31,218,219 |
| | 332,702 |
| | 4.27 | % | | 28,980,186 |
| | 354,558 |
| | 4.90 | % |
| Allowance for loan and lease losses | | (117,206 | ) | | | | | | (140,223 | ) | | | | |
| Non-interest earning assets | | 1,589,286 |
| | | | | | 1,912,471 |
| | | | |
| Total assets | | $ | 32,690,299 |
| | | | | | $ | 30,752,434 |
| | | | |
| Liabilities and Stockholders' Equity: | | | | | | | | | | | | |
| Interest bearing liabilities: | | | | | | | | | | | | |
| Interest bearing demand deposits | | $ | 1,773,912 |
| | 6,225 |
| | 1.41 | % | | $ | 1,621,161 |
| | 4,195 |
| | 1.04 | % |
| Savings and money market deposits | | 10,924,580 |
| | 52,191 |
| | 1.92 | % | | 10,553,624 |
| | 33,317 |
| | 1.27 | % |
| Time deposits | | 6,944,862 |
| | 41,571 |
| | 2.40 | % | | 6,475,569 |
| | 27,786 |
| | 1.72 | % |
| Total interest bearing deposits | | 19,643,354 |
| | 99,987 |
| | 2.04 | % | | 18,650,354 |
| | 65,298 |
| | 1.40 | % |
| Federal funds purchased | | 127,242 |
| | 771 |
| | 2.42 | % | | — |
| | — |
| | — | % |
| FHLB advances | | 5,028,418 |
| | 30,263 |
| | 2.41 | % | | 4,761,659 |
| | 22,988 |
| | 1.94 | % |
| Notes and other borrowings | | 405,726 |
| | 5,325 |
| | 5.25 | % | | 402,805 |
| | 5,306 |
| | 5.27 | % |
| Total interest bearing liabilities | | 25,204,740 |
| | 136,346 |
| | 2.17 | % | | 23,814,818 |
| | 93,592 |
| | 1.58 | % |
| Non-interest bearing demand deposits | | 3,932,716 |
| | | | | | 3,315,851 |
| | | | |
| Other non-interest bearing liabilities | | 601,703 |
| | | | | | 536,800 |
| | | | |
| Total liabilities | | 29,739,159 |
| | | | | | 27,667,469 |
| | | | |
| Stockholders' equity | | 2,951,140 |
| | | | | | 3,084,965 |
| | | | |
| Total liabilities and stockholders' equity | | $ | 32,690,299 |
| | | | | | $ | 30,752,434 |
| | | | |
| Net interest income | | | | $ | 196,356 |
| | | | | | $ | 260,966 |
| | |
| Interest rate spread | | | | | | 2.10 | % | | | | | | 3.32 | % |
| Net interest margin | | | | | | 2.52 | % | | | | | | 3.60 | % |
| |
| (1) | On a tax-equivalent basis.basis where applicable. The tax-equivalent adjustment for tax-exempt loans was $7.6$4.4 million and $6.2$4.4 million, and the tax-equivalent adjustment for tax-exempt investment securities was $3.2$1.1 million and $2.6$1.4 million for the three months ended SeptemberJune 30, 20172019 and 2016,2018, respectively. |
| |
| (3) | At fair value except for securities held to maturity. |
|
| | | | | | | | | | | | | | | | | | | | | |
| | Nine Months Ended September 30, |
| | 2017 | | 2016 |
| | Average
Balance | | Interest (1) | | Yield/
Rate (1)(2) | | Average
Balance | | Interest (1) | | Yield/
Rate (1)(2) |
| Assets: | | | | | | | | | | | |
| Interest earning assets: | |
| | |
| | |
| | |
| | |
| | |
|
| Non-covered loans | $ | 19,169,479 |
| | $ | 535,926 |
| | 3.73 | % | | $ | 16,876,786 |
| | $ | 452,525 |
| | 3.58 | % |
| Covered loans | 560,934 |
| | 225,194 |
| | 53.54 | % | | 746,709 |
| | 226,659 |
| | 40.48 | % |
| Total loans | 19,730,413 |
| | 761,120 |
| | 5.15 | % | | 17,623,495 |
| | 679,184 |
| | 5.14 | % |
Investment securities (3) | 6,569,553 |
| | 151,337 |
| | 3.07 | % | | 5,551,249 |
| | 117,478 |
| | 2.82 | % |
| Other interest earning assets | 557,623 |
| | 10,606 |
| | 2.54 | % | | 531,245 |
| | 8,850 |
| | 2.22 | % |
| Total interest earning assets | 26,857,589 |
| | 923,063 |
| | 4.59 | % | | 23,705,989 |
| | 805,512 |
| | 4.53 | % |
| Allowance for loan and lease losses | (157,015 | ) | | | | | | (133,280 | ) | | | | |
| Non-interest earning assets | 1,754,499 |
| | | | | | 1,946,846 |
| | | | |
| Total assets | $ | 28,455,073 |
| | | | | | $ | 25,519,555 |
| | | | |
| Liabilities and Stockholders' Equity: | | | | | | | | | | | |
| Interest bearing liabilities: | | | | | | | | | | | |
| Interest bearing demand deposits | $ | 1,564,229 |
| | 8,913 |
| | 0.76 | % | | $ | 1,341,218 |
| | 6,140 |
| | 0.61 | % |
| Savings and money market deposits | 9,557,907 |
| | 55,741 |
| | 0.78 | % | | 8,203,676 |
| | 37,285 |
| | 0.61 | % |
| Time deposits | 5,988,433 |
| | 55,507 |
| | 1.24 | % | | 5,177,191 |
| | 43,002 |
| | 1.11 | % |
| Total interest bearing deposits | 17,110,569 |
| | 120,161 |
| | 0.94 | % | | 14,722,085 |
| | 86,427 |
| | 0.78 | % |
| FHLB advances | 4,889,578 |
| | 44,262 |
| | 1.21 | % | | 4,698,492 |
| | 35,972 |
| | 1.02 | % |
| Notes and other borrowings | 402,821 |
| | 15,947 |
| | 5.28 | % | | 403,213 |
| | 15,967 |
| | 5.28 | % |
| Total interest bearing liabilities | 22,402,968 |
| | 180,370 |
| | 1.08 | % | | 19,823,790 |
| | 138,366 |
| | 0.93 | % |
| Non-interest bearing demand deposits | 3,034,682 |
| | | | | | 2,944,861 |
| | | | |
| Other non-interest bearing liabilities | 443,430 |
| | | | | | 431,921 |
| | | | |
| Total liabilities | 25,881,080 |
| | | | | | 23,200,572 |
| | | | |
| Stockholders' equity | 2,573,993 |
| | | | | | 2,318,983 |
| | | | |
| Total liabilities and stockholders' equity | $ | 28,455,073 |
| | | | | | $ | 25,519,555 |
| | | | |
| Net interest income | | | $ | 742,693 |
| | | | | | $ | 667,146 |
| | |
| Interest rate spread | | | | | 3.51 | % | | | | | | 3.60 | % |
| Net interest margin | | | | | 3.69 | % | | | | | | 3.75 | % |
|
| | | | | | | | | | | | | | | | | | | | | | |
| | | Six Months Ended June 30, |
| | | 2019 | | 2018 |
| | | Average
Balance | | Interest (1)(2) | | Yield/
Rate (1)(2) | | Average
Balance | | Interest (1)(2) | | Yield/
Rate (1)(2) |
| Assets: | | | | | | | | | | | | |
| Interest earning assets: | | |
| | |
| | |
| | |
| | |
| | |
|
| Non-covered loans | | $ | 22,241,262 |
| | $ | 498,776 |
| | 4.51 | % | | $ | 20,951,864 |
| | $ | 405,293 |
| | 3.89 | % |
| Covered loans | | — |
| | — |
| | — | % | | 487,070 |
| | 165,509 |
| | 67.96 | % |
| Total loans | | 22,241,262 |
| | 498,776 |
| | 4.51 | % | | 21,438,934 |
| | 570,802 |
| | 5.35 | % |
Investment securities (3) | | 8,353,116 |
| | 151,474 |
| | 3.63 | % | | 6,837,901 |
| | 108,967 |
| | 3.19 | % |
| Other interest earning assets | | 510,933 |
| | 9,921 |
| | 3.91 | % | | 501,376 |
| | 8,291 |
| | 3.33 | % |
| Total interest earning assets | | 31,105,311 |
| | 660,171 |
| | 4.26 | % | | 28,778,211 |
| | 688,060 |
| | 4.80 | % |
| Allowance for loan and lease losses | | (114,157 | ) | | | | | | (142,706 | ) | | | | |
| Non-interest earning assets | | 1,596,565 |
| | | | | | 1,928,486 |
| | | | |
| Total assets | | $ | 32,587,719 |
| | | | | | $ | 30,563,991 |
| | | | |
| Liabilities and Stockholders' Equity: | | | | | | | | | | | | |
| Interest bearing liabilities: | | | | | | | | | | | | |
| Interest bearing demand deposits | | $ | 1,738,393 |
| | 11,864 |
| | 1.38 | % | | $ | 1,610,643 |
| | 8,352 |
| | 1.05 | % |
| Savings and money market deposits | | 11,187,818 |
| | 105,008 |
| | 1.89 | % | | 10,675,768 |
| | 62,371 |
| | 1.18 | % |
| Time deposits | | 6,926,041 |
| | 80,536 |
| | 2.34 | % | | 6,395,299 |
| | 50,936 |
| | 1.61 | % |
| Total interest bearing deposits | | 19,852,252 |
| | 197,408 |
| | 2.01 | % | | 18,681,710 |
| | 121,659 |
| | 1.31 | % |
| Federal funds purchased | | 132,282 |
| | 1,596 |
| | 2.41 | % | | — |
| | — |
| | — | % |
| FHLB advances | | 4,845,337 |
| | 57,637 |
| | 2.40 | % | | 4,611,359 |
| | 41,285 |
| | 1.81 | % |
| Notes and other borrowings | | 405,547 |
| | 10,633 |
| | 5.24 | % | | 402,822 |
| | 10,615 |
| | 5.27 | % |
| Total interest bearing liabilities | | 25,235,418 |
| | 267,274 |
| | 2.13 | % | | 23,695,891 |
| | 173,559 |
| | 1.48 | % |
| Non-interest bearing demand deposits | | 3,769,828 |
| | | | | | 3,306,238 |
| | | | |
| Other non-interest bearing liabilities | | 629,123 |
| | | | | | 487,313 |
| | | | |
| Total liabilities | | 29,634,369 |
| | | | | | 27,489,442 |
| | | | |
| Stockholders' equity | | 2,953,350 |
| | | | | | 3,074,549 |
| | | | |
| Total liabilities and stockholders' equity | | $ | 32,587,719 |
| | | | | | $ | 30,563,991 |
| | | | |
| Net interest income | | | | $ | 392,897 |
| | | | | | $ | 514,501 |
| | |
| Interest rate spread | | | | | | 2.13 | % | | | | | | 3.32 | % |
| Net interest margin | | | | | | 2.53 | % | | | | | | 3.58 | % |
| |
| (1) | On a tax-equivalent basis.basis where applicable. The tax-equivalent adjustment for tax-exempt loans was $21.5$8.8 million and $16.7$8.5 million and the tax-equivalent adjustment for tax-exempt investment securities was $9.7$2.3 million and $7.5$2.9 million for the ninesix months ended SeptemberJune 30, 20172019 and 2016,2018, respectively. |
| |
| (3) | At fair value except for securities held to maturity. |
Three months ended SeptemberJune 30, 20172019 compared to three months ended SeptemberJune 30, 20162018
Net interest income, calculated on a tax-equivalent basis, was $252.0$196.4 million for the three months ended SeptemberJune 30, 20172019 compared to $230.5$261.0 million for the three months ended SeptemberJune 30, 2016, an increase2018, a decrease of $21.5$65 million. The increasedecrease in net interest income was comprised of an increasea decrease in tax-equivalent interest income of $41.5$21.9 million, offset byand an increase in interest expense of $19.9$42.8 million.
The increasedecrease in tax-equivalent interest income was comprised primarily of a $27.9$38.8 million increasedecrease in interest income from loans andpartially offset by a $12.8$16.4 million increase in interest income from investment securities.
Increased Decreased interest income from loans was primarily attributable to a $1.7 billion0.91% decrease in the tax-equivalent yield to 4.52% for the three months ended June 30, 2019 from 5.43% for the three months ended June 30, 2018, partially offset by a $912 million increase in the average balance outstanding and a 0.12% increaseoutstanding.
The decline in the tax-equivalent yield on loans was mainly the result of the decrease in accretion on formerly covered residential loans. Both the average balance of and yield on these loans declined. The decline in the average balance resulted from the sale of a substantial portion of the loans during 2018 in anticipation of the termination of the Single Family Shared-Loss Agreement. Interest income on formerly covered residential loans declined by $67.7 million to 5.15%$16.5 million for the three months ended SeptemberJune 30, 20172019 from 5.03%$84.2 million for the three months ended SeptemberJune 30, 2016. Factors contributing to the increase in the2018. The yield on the remaining loans included:declined to 34.05% for the three months ended June 30, 2019 from 70.82% for the three months ended June 30, 2018, due primarily to changes in assumptions about the remaining period over which accretable yield would be realized, attributable to management's decision to retain certain loans beyond expiration of the Single Family Shared-Loss Agreement.
The tax-equivalent yield on non-covered loans was 3.79%other than formerly covered residential loans increased to 4.26% for the three months ended SeptemberJune 30, 2017 compared to 3.56%2019, from 3.96% for the three months ended SeptemberJune 30, 2016.2018. The most significant factor contributing to thethis increased yield on non-covered loans was the impact of increases in marketbenchmark interest rates.
Interest income on covered loans totaled $73.5 million and $74.5 million for the three months ended September 30, 2017 and 2016, respectively. The tax-equivalent yield on those loans increased to 56.70% for the three months ended September 30, 2017 from 42.50% for the three months ended September 30, 2016. The increase in the yield on covered loans resulted primarily from improvements in expected cash flows for ACI loans.
The impact on the overall yield on loans of increased yields on both covered and non-covered loans considered individually was somewhat offset by the continued increase in non-covered loans, with yields lower than those on covered loans, as a percentage of total loans.
The average balance of investment securities increased by $1.1$1.3 billion for the three months ended SeptemberJune 30, 20172019 from the three months ended SeptemberJune 30, 20162018, while the tax-equivalent yield increased to 3.14%3.61% from 2.87%3.33%. The most significant factor contributing to the increase in the tax-equivalent yield were increases inprimarily reflects resetting of coupon rates on floating-rate securities.
The primary components of the increase in interest expense for the three months ended SeptemberJune 30, 20172019 as compared to the three months ended SeptemberJune 30, 20162018 were a $15.0$35 million increase in interest expense on deposits and a $5.0$7 million increase in interest expense on FHLB advances.
The increase in interest expense on deposits was attributable to an increase of $2.5 billion$993 million in average interest bearing deposits and an increase in the average cost of interest bearing deposits of 0.22%0.64% to 1.02%2.04% for the three months ended SeptemberJune 30, 20172019 from 0.80%1.40% for the three months ended SeptemberJune 30, 2016.2018. These cost increases were generally driven by the growth of deposits in competitive markets and a rising marketshort-term interest rate environment.
The increase in interest expense on FHLB advances reflectedwas primarily a result of an increase in the average cost of advances of 0.45%0.47% to 1.37%2.41% for the three months ended SeptemberJune 30, 20172019 from 0.92%1.94% for the three months ended SeptemberJune 30, 2016.2018. The increase inincreased cost was driven primarily by increased market rates and to a lesser extent, an extension of maturities through interest rate swaps.rates.
The net interest margin, calculated on a tax-equivalent basis, for the three months ended SeptemberJune 30, 20172019 was 3.62%2.52% as compared to 3.69%3.60% for the three months ended SeptemberJune 30, 2016.2018. The interest rate spread decreased to 3.43%2.10% for the three months ended SeptemberJune 30, 20172019 from 3.53%3.32% for the three months ended SeptemberJune 30, 2016.2018. The declinesdecrease in net interest margin and interest rate spread resultedis primarily from the cost of interest-bearing liabilities increasing by more than the yield on interest earning assets. This difference was driven primarily byattributed to the decline in the average balance of and yield on formerly covered residential loans as a percentage of total loans. Future trends in the net interest margin will be impacted by changes in market interest rates, including changes in the shape of the yield curve, by the mix of interest earning assets, including the decline in covered loans as a percentage of total loans, and by the Company's ability to manage the cost of funds while growing deposits in competitive markets.discussed above.
NineSix months ended SeptemberJune 30, 20172019 compared to ninesix months ended SeptemberJune 30, 20162018
Net interest income, calculated on a tax-equivalent basis, was $742.7$392.9 million for the ninesix months ended SeptemberJune 30, 20172019 compared to $667.1$514.5 million for the ninesix months ended SeptemberJune 30, 2016, an increase2018, a decrease of $75.5$121.6 million. The increasedecrease in net interest income was comprised of an increasea decrease in tax-equivalent interest income of $117.6$27.9 million offset byand an increase in interest expense of $42.0$93.7 million. Interest income on formerly covered residential loans declined by $132.7 million to $32.8 million for the six months ended June 30, 2019 from $165.5 million for the six months ended June 30, 2018.
The increasedecrease in tax-equivalent interest income was comprised primarily of an $81.9a $72.0 million increasedecrease in interest income from loans andpartially offset by a $33.9$42.5 million increase in interest income from investment securities.
IncreasedDecreased interest income from loans was primarily attributable to a $2.1 billion0.84% decrease in the tax-equivalent yield to 4.51% for the six months ended June 30, 2019 from 5.35% for the six months ended June 30, 2018, partially offset by an $802 million increase in the average balance and a 0.01% increase in the tax-equivalent yield to 5.15% for the nine months ended September 30, 2017 from 5.14% for the nine months ended September 30, 2016. Offsetting factors contributing to the relatively steady yield on loans included:
Although the yield on non-covered loans increased to 3.73% for the nine months ended September 30, 2017 from 3.58% for the nine months ended September 30, 2016, lower-yielding non-covered loans comprised a greater percentage of the portfolio for the nine months ended September 30, 2017 than for the corresponding period in 2016. Non-covered loans represented 97.2% of the average balance of loans outstanding for the nine months ended September 30, 2017 compared to 95.8% for the nine months ended September 30, 2016.
Interest income on covered loans totaled $225.2 million and $226.7 million for the nine months ended September 30, 2017 and 2016, respectively. The tax-equivalent yield on those loans increased to 53.54% for the nine months ended September 30, 2017 from 40.48% for the nine months ended September 30, 2016.outstanding.
The average balance of investment securities increased by $1.0$1.5 billion for the ninesix months ended SeptemberJune 30, 20172019 from the ninesix months ended SeptemberJune 30, 20162018, while the tax-equivalent yield increased to 3.07%3.63% from 2.82%3.19%.
The primary components of the increase in interest expense for the ninesix months ended SeptemberJune 30, 20172019 as compared to the ninesix months ended SeptemberJune 30, 20162018 were a $33.7$75.7 million increase in interest expense on deposits and an $8.3a $16.4 million increase in interest expense on FHLB advances.
The increase in interest expense on deposits was attributable to an increase of $2.4$1.2 billion in average interest bearing deposits and an increase in the average cost of interest bearing deposits of 0.16%0.70% to 0.94%2.01% for the ninesix months ended SeptemberJune 30, 20172019 from 0.78%1.31% for the ninesix months ended SeptemberJune 30, 2016.2018. The increase in interest expense on FHLB advances was primarily a result of an increase in the average cost of advances of 0.19%0.59% to 1.21%2.40% for the ninesix months ended SeptemberJune 30, 20172019 from 1.02%1.81% for the ninesix months ended SeptemberJune 30, 2016.2018.
Factors contributing to the changes in yields and costs for the ninesix month periods were generally consistent with those for the three month periods discussed above.
The net interest margin, calculated on a tax-equivalent basis, for the ninesix months ended SeptemberJune 30, 20172019 was 3.69%2.53% as compared to 3.75%3.58% for the ninesix months ended SeptemberJune 30, 2016.2018. The interest rate spread decreased to 3.51%2.13% for the ninesix months ended SeptemberJune 30, 20172019 from 3.60%3.32% for the ninesix months ended SeptemberJune 30, 2016.2018. The declines in net interest margin and interest rate spread resulted primarily from the factors discussed above.
Provision for Loan Losses
The provision for loan losses is the amount of expense that, based on our judgment, is required to maintain the ALLL at an adequate level to absorb probable losses inherent in the loan portfolio at the balance sheet date and that, in management’s judgment, is appropriate under GAAP. The amount of the provision is impacted by loan growth, portfolio mix, historical loss rates, the level of charge-offs and specific reserves for impaired loans, and management's evaluation of qualitative factors in the determination of general reserves. The determination of the amount of the ALLL is complex and involves a high degree of judgment and subjectivity. Our determination of the amount of the allowance and corresponding provision for loan losses considers ongoing evaluations of the credit quality of and level of credit risk inherent in various segments of the loan portfolio and of individually significant credits, levels of non-performing loans and charge-offs, historical and statistical trends and economic and other relevant factors. See “Analysis of the Allowance for Loan and Lease Losses” below for more information about how we determine the appropriate level of the allowance.
The provision for loan losses for the quarter and nine months ended September 30, 2017 included $5.4 million related to the impact of Hurricanes Irma and Harvey. The amount of this provision was determined based on our evaluation of an intensive analysis conducted by our credit teams of the individual loans potentially impacted by these storms, including but not limited to direct contact with borrowers, preliminary assessments of the extent of damage to collateral and impacts on borrowers’ business operations and consideration of the impact of insurance coverage. The amount of the provision related to the impact of these storms is subject to change as individual situations evolve.
For the three months ended SeptemberJune 30, 20172019 and 2016, we2018 the Company recorded a net recovery of loan losses of $2.7 million and a provision for loan losses of $9.0 million, respectively. Factors contributing to the recovery of loan losses for the three months ended June 30, 2019 as compared to the provision recorded for the three months ended June 30, 2018 included reductions in the provision related to (i) taxi medallion loans; (ii) a decrease in the provision related to specific reserves for other loans; and (iii) changes in the composition of portfolio growth; partially offset by increases related to the relative impact on the provision of changes in certain qualitative loss factors. For the three months ended June 30, 2018, there was a reduction in overall qualitative reserves.
For the six months ended June 30, 2019 and 2018, the Company recorded provisions for loan losses of $37.6$7.5 million and $24.9$12.1 million, respectively, related to non-covered loans. Forrespectively. Offsetting factors impacting thenine months ended September 30, 2017 and 2016, we recorded provisions for loan losses of $60.9 million and $43.6 million, respectively, related to non-covered loans. The amount of the provision is impacted by loan growth, portfolio mix, historical loss rates, the level of charge-offs and specific reserves for impaired loans, and management's evaluation of qualitative factors in the determination of general reserves.
The most significant reason for the increase in the provision for loan losses related to non-covered loans for the quartersix months ended SeptemberJune 30, 20172019 as compared to the quartersix months ended SeptemberJune 30, 2016 was an increase of $28.9 million2018 were (i) the reduction in the provision related to taxi medallion loans. Theloans; (ii) a decrease in the provision related to taxi medallion loans totaled $32.7 millionspecific reserves for the quarter ended September 30, 2017, compared to $3.9 million for the quarter ended September 30, 2016. A $5.4 million provision recognized in the quarter ended September 30, 2017 related to the impact of hurricanes was more thanother loans; partially offset by (i) a net decrease in(iii) increases related to the relative impact on the provision of changes in quantitative and qualitative loss factors, (ii)factors. For the impact of lower loan growth, and (iii) a decrease in provisions for criticized and classified loans.
Factors contributing to the increase in the provision for loan losses related to non-covered loans for the ninesix months ended SeptemberJune 30, 2017 as compared to the nine months ended September 30, 2016 were generally consistent with those for the three month periods discussed above.
For the three months ended September 30, 2017 and 2016, we recorded provisions for (recovery of) loan losses of $0.3 million and $(0.4) million, respectively, related to covered loans. For the nine months ended September 30, 2017 and 2016, we recorded provisions for (recovery of) loan losses of $2.7 million and $(1.1) million, respectively, related to covered loans. The provision for the nine months ended September 30, 2017 related primarily to impairment recognized on an ACI HELOC pool. As discussed below2018, there was a reduction in the section entitled "Non-interest income," the impact on our results of operations of any provision for (recovery of) loan losses on covered loans is significantly mitigated by the corresponding impact on the FDIC indemnification asset, recorded in non-interest income.overall qualitative reserves.
Non-Interest Income
The Company reported non-interest income of $53.3 million and $25.1 million for the three months ended September 30, 2017 and 2016, respectively. Non-interest income was $111.4 million and $77.1 million for the nine months ended September 30, 2017 and 2016, respectively. A significant portion of our non-interest income has historically related to transactions in the covered assets. We have broken out the significant categories of non-interest income that relate to covered assets in the table below, to assist in the comparison of the amount and composition of our non-interest income with that of other financial institutions.
The following table presents a comparison of the categories of non-interest income for the periods indicated (in thousands):
|
| | | | | | | | | | | | | | | |
| | Three Months Ended September 30, | | Nine Months Ended September 30, |
| | 2017 | | 2016 | | 2017 | | 2016 |
| Income from resolution of covered assets, net | $ | 6,400 |
| | $ | 8,883 |
| | $ | 22,066 |
| | $ | 26,426 |
|
| Loss on sale of covered loans, net | — |
| | (10,033 | ) | | (1,582 | ) | | (14,895 | ) |
| Net gain (loss) on FDIC indemnification | (4,838 | ) | | 993 |
| | (14,174 | ) | | (9,410 | ) |
| Other | 237 |
| | 371 |
| | 957 |
| | 623 |
|
| Non-interest income related to the covered assets | 1,799 |
| | 214 |
| | 7,267 |
| | 2,744 |
|
| Service charges and fees | 4,938 |
| | 5,171 |
| | 15,554 |
| | 14,529 |
|
| Gain on sale of non-covered loans | 2,447 |
| | 2,086 |
| | 8,183 |
| | 7,535 |
|
| Gain on investment securities available for sale, net | 26,931 |
| | 3,008 |
| | 29,194 |
| | 10,065 |
|
| Lease financing | 13,287 |
| | 11,188 |
| | 40,067 |
| | 32,762 |
|
| Other non-interest income | 3,924 |
| | 3,408 |
| | 11,098 |
| | 9,495 |
|
| | $ | 53,326 |
| | $ | 25,075 |
| | $ | 111,363 |
| | $ | 77,130 |
|
|
| | | | | | | | | | | | | | | |
| | Three Months Ended June 30, | | Six Months Ended June 30, |
| | 2019 | | 2018 | | 2019 | | 2018 |
| Income from resolution of covered assets, net | $ | — |
| | $ | 4,238 |
| | $ | — |
| | $ | 7,555 |
|
| Net loss on FDIC indemnification | — |
| | (1,400 | ) | | — |
| | (5,015 | ) |
| Deposit service charges and fees | 4,290 |
| | 3,510 |
| | 8,120 |
| | 6,997 |
|
| Gain on sale of loans, net | 2,121 |
| | 768 |
| | 5,057 |
| | 4,269 |
|
| Gain on investment securities, net | 4,116 |
| | 2,142 |
| | 9,901 |
| | 2,506 |
|
| Lease financing | 17,005 |
| | 17,492 |
| | 34,191 |
| | 31,594 |
|
| Other non-interest income | 7,805 |
| | 5,223 |
| | 14,323 |
| | 12,053 |
|
| | $ | 35,337 |
| | $ | 31,973 |
| | $ | 71,592 |
| | $ | 59,959 |
|
Non-interest income related to transactionsDeclines in thecovered assets
The consolidated financial statements reflect the impact of gains or losses arising from transactions in the covered assets. The balance of the FDIC indemnification asset is reduced or increased as a result of decreases or increases in cash flows expected to be received from the FDIC related to these gains or losses. When these transaction gains or losses are recorded, we also record an offsetting amount in the consolidated statement of income line item “Net gain (loss) on FDIC indemnification.” This line item includes the significantly mitigating impact of FDIC indemnification related to the following types of transactions in covered assets:
gains or losses from the resolution of covered assets;
provisions for (recoveries of) losses on covered loans;
gains or losses on the sale of covered loans; and
gains or losses on covered OREO.
See Note 5 to the consolidated financial statements for further details about the components of these gains and losses associated with covered assets, along with the related additions to or reductions in the amounts recoverable from the FDIC under the Loss Sharing Agreements, as reflected in the consolidated statements of income for the three and nine months ended September 30, 2017 and 2016.
Covered loans may be resolved through prepayment, short sale of the underlying collateral, foreclosure, sale of the loans or charge-off. For loans resolved through prepayment, short sale or foreclosure, the difference between consideration received in resolution of the loans and the carrying value of the loans is recorded in the consolidated statement of income line item “Income
from resolution of covered assets, net.” Both gains and losses on individual resolutions are included in this line item. Losses from the resolution of covered loans increase the amount recoverable from the FDIC under the Loss Sharing Agreements. Gains from the resolution of covered loans reduce the amount recoverable from the FDIC under the Loss Sharing Agreements. These additions to or reductions in amounts recoverable from the FDIC related to the resolution of covered loans are recorded in non-interest income in the line item “Net gain (loss) on FDIC indemnification” and reflected as corresponding increases or decreases in the FDIC indemnification asset. The amount of income or loss recorded in any period will be impacted by the amount of covered loans resolved, the amount of consideration received, and our ability to accurately project cash flows from ACI loans in future periods.
The following table provides further detail of the components of income from resolution of covered assets, net for the periods indicated (in thousands):
|
| | | | | | | | | | | | | | | |
| | Three Months Ended September 30, | | Nine Months Ended September 30, |
| | 2017 | | 2016 | | 2017 | | 2016 |
| Payments in full | $ | 6,423 |
| | $ | 9,371 |
| | $ | 22,201 |
| | $ | 26,790 |
|
| Other | (23 | ) | | (488 | ) | | (135 | ) | | (364 | ) |
| Income from resolution of covered assets, net | $ | 6,400 |
| | $ | 8,883 |
| | $ | 22,066 |
| | $ | 26,426 |
|
Under the terms of the Purchase and Assumption Agreement with thenet loss on FDIC the Bank may sell up to 2.5% of the covered loans based on UPB at the date of the FSB Acquisition, or approximately $280 million, on an annual basis without prior consent of the FDIC. Any losses incurred from such loan sales are covered under the Single Family Shared-Loss Agreement. Any loan sale in excess of this stipulated annual threshold requires approvalindemnification resulted from the FDIC to be eligible for loss share coverage. However, if the Bank seeks to sell covered loans in excesstermination of the 2.5% threshold in the nine months prior to the stated termination date of loss share coverage, May 21, 2019, and the FDIC does not consent, the Single Family Shared-Loss Agreement will be extended for two additional years with respecton February 13, 2019.
The most significant contributor to the increases in deposit service charges and fees was higher treasury management fee income.
The most significant components of gain on sale of loans, requested to be included in such sales. The Bank will then have the right to sell all or any portion of such loans without FDIC consent at any time within the nine months prior to the extended termination date, and any losses incurred will be covered under the Single Family Shared-Loss Agreement. This final sale mechanism, if exercised, ensures no residual credit risk in our covered loan portfolio that would otherwise arise from credit losses occurring after the termination datenet are gains on sales of the Single Family Shared-Loss Agreement.guaranteed portions of SBA loans totaling $0.8 million and $2.6 million for the three and six months ended June 30, 2019, respectively; and gains on sale of
The following table summarizes
government-insured residential loans totaling $1.3 million and $2.2 million for the gain (loss) recordedthree and six months ended June 30, 2019, respectively. Gain on sale of loans, net for the three and six months ended June 30, 2018 included losses of $2.0 million and $0.3 million, respectively, related to the sale of covered residential loansloans.
Gain on investment securities, net for the three and six months ended June 30, 2019 reflected net realized gains of $3.9 million and $8.2 million, respectively, from the sale of investment securities available for sale and net unrealized gains on marketable equity securities of $0.2 million and $1.7 million, respectively. Sales of securities during the quarter and six month periods related primarily to ongoing management of the Company's liquidity position and the impactrisk/return profile of related FDIC indemnificationthe portfolio.
Lease financing income decreased by $0.5 million for the periods indicated (in thousands):
|
| | | | | | | | | | | |
| | Three Months Ended September 30, | | Nine Months Ended September 30, |
| | 2016 | | 2017 | | 2016 |
| Loss on sale of covered loans | $ | (10,033 | ) | | $ | (1,582 | ) | | $ | (14,895 | ) |
| Net gain on FDIC indemnification | 8,026 |
| | 1,266 |
| | 11,958 |
|
| Net impact on pre-tax earnings | $ | (2,007 | ) | | $ | (316 | ) | | $ | (2,937 | ) |
The Bank did not sell covered residential loans in the three months ended SeptemberJune 30, 2017, due2019 compared to the potential impactthree months ended June 30, 2018. The three months ended June 30, 2018 included gains of Hurricane Irma on$3.8 million related to the market for these loans, the collateral for manydisposition of which is located in Florida.
Pricing received on the sale of covered loans may vary based on (i) market conditions, including the interest rate environment, the amount of capital seeking investment and the secondary supply of loans with a particular performance history or collateral type, (ii) the type and quality of collateral, (iii) the performance history of loans included in the sale and (iv) whether or not the loans have been modified. We anticipate that we will continue to exercise our right to sell covered residential loans on a quarterly basis in the future.
Other components of non-interest income
Periodequipment under operating lease. Year over periodyear increases in income from lease financing generally corresponded to the growth in the portfolio of equipment under operating lease.
Gains on sale of non-covered loans for the three and nine months ended September 30, 2017 and 2016 related primarily to sales of loans by SBF.
Gain on sale of investment securities available for sale, net totaled $26.9 million for the quarter ended September 30, 2017. Substantially all of these gains resulted from the sale of securities formerly covered under the Commercial Shared-Loss Agreement and originally acquired at significant discounts in the FSB Acquisition. Other gains on investment securities available for sale for the three and nine months ended September 30, 2017 and 2016 related to sales of securities in the normal course of managing liquidity, portfolio duration and yield.
Non-Interest Expense
The following table presents the components of non-interest expense for the periods indicated (in thousands):
| | | | Three Months Ended September 30, | | Nine Months Ended September 30, | Three Months Ended June 30, | | Six Months Ended June 30, |
| | 2017 | | 2016 | | 2017 | | 2016 | 2019 | | 2018 | | 2019 | | 2018 |
| Employee compensation and benefits | $ | 58,327 |
| | $ | 55,162 |
| | $ | 178,386 |
| | $ | 166,374 |
| $ | 57,251 |
| | $ | 65,537 |
| | $ | 122,484 |
| | $ | 132,573 |
|
| Occupancy and equipment | 18,829 |
| | 18,867 |
| | 56,689 |
| | 57,199 |
| 13,991 |
| | 14,241 |
| | 27,157 |
| | 28,544 |
|
| Amortization of FDIC indemnification asset | 45,225 |
| | 38,957 |
| | 135,351 |
| | 116,711 |
| — |
| | 44,250 |
| | — |
| | 84,597 |
|
| Deposit insurance expense | 5,764 |
| | 4,943 |
| | 16,827 |
| | 12,866 |
| 5,027 |
| | 4,623 |
| | 9,068 |
| | 9,435 |
|
| Professional fees | 2,748 |
| | 3,884 |
| | 12,573 |
| | 10,119 |
| 6,937 |
| | 2,657 |
| | 14,808 |
| | 5,532 |
|
| Telecommunications and data processing | 3,452 |
| | 3,746 |
| | 10,481 |
| | 10,800 |
| |
| Technology and telecommunications | | 12,013 |
| | 8,644 |
| | 23,181 |
| | 16,858 |
|
| Depreciation of equipment under operating lease | 8,905 |
| | 6,855 |
| | 25,655 |
| | 20,004 |
| 11,489 |
| | 9,476 |
| | 23,301 |
| | 18,792 |
|
| Other non-interest expense | 13,455 |
| | 15,590 |
| | 37,735 |
| | 40,151 |
| 13,377 |
| | 11,819 |
| | 26,776 |
| | 26,733 |
|
| | $ | 156,705 |
| | $ | 148,004 |
| | $ | 473,697 |
| | $ | 434,224 |
| $ | 120,085 |
| | $ | 161,247 |
| | $ | 246,775 |
| | $ | 323,064 |
|
Annualized non-interest expense as a percentage of average assets was 2.1% and 2.2% for the three and nine months ended September 30, 2017, respectively, and 2.2% and 2.3% for the three and nine months ended September 30, 2016, respectively. Excluding amortization of the FDIC indemnification asset, non-interest expense as a percentage of average assets was 1.5% and 1.6% for the three and nine months ended September 30, 2017, respectively, and 1.6% and 1.7% for the three and nine months ended September 30, 2016, respectively. The more significant changes in the components of non-interest expense are discussed below.
Employee compensation and benefits
As is typical for financial institutions, employee compensation and benefits represents the single largest component of recurring non-interest expense. Employee compensation and benefits for the three and nine months ended September 30, 2017 increased by $3.2 million and $12.0 million compared to the corresponding periods in 2016. The increases for the three and nine months ended September 30, 2017 primarily reflected increased headcount and general increases in compensation levels.
Amortization of FDIC indemnification asset
Amortization of FDIC indemnification asset totaled $45.2 million and $135.4 million, respectively, for the three and nine months ended September 30, 2017 compared to $39.0 million and $116.7 million, respectively, for the three and nine months ended September 30, 2016.
The FDIC indemnification asset was initially recorded at its estimated fair value, representingamortized to zero during the present valuefourth quarter of estimated future cash payments from the FDIC for probable losses on covered assets. As projected cash flows from the ACI loans have increased, the yield on the loans has increased accordingly and the estimated future cash payments from the FDIC have decreased. This change2018 in estimated cash flows is recognized prospectively, consistent with the recognitionlight of the increased cash flows from the ACI loans. As a result, the FDIC indemnification asset is being amortized to the amount of the estimated future cash flows. For the three and nine months ended September 30, 2017, the average rate at which the FDIC indemnification asset was amortized was 46.62% and 41.19%, respectively, compared to 25.36% and 23.48%, respectively, during the comparable periods in 2016.
The rate of amortization will increase if estimated future cash payments from the FDIC decrease. The amount of amortization is impacted by both the change in the amortization rate and the decrease in the average balance of the indemnification asset. As we continue to submit claims under the Loss Sharing Agreements and recognize periodic amortization, the balance of the indemnification asset will continue to decline.
See Note 5 to the consolidated financial statements for a rollforward of the FDIC indemnification asset for the nine months ended September 30, 2017 and the year ended December 31, 2016. The entire balance of the FDIC indemnification asset relates
to residential loans and OREO covered under the Single Family Shared-Loss Agreement. The following table presents the carrying value of the FDIC indemnification asset and the estimated future cash flows at the dates indicated (in thousands):
|
| | | | | | | |
| | September 30, 2017 | | December 31, 2016 |
| FDIC indemnification asset | $ | 349,617 |
| | $ | 515,933 |
|
| Less expected amortization | (173,685 | ) | | (245,350 | ) |
| Amount expected to be collected from the FDIC | $ | 175,932 |
| | $ | 270,583 |
|
The amount of expected amortization reflects the impact of improvements in cash flows expected to be collected from the covered loans, as well as the impact of time value resulting from the discounting of the asset when it was initially established. This amount will be amortized to non-interest expense using the effective interest method over the period during which cash flows from the FDIC are expected to be collected, which is limited to the lesser of the contractual termtermination of the Single Family Shared-Loss Agreement
Employee compensation and the expected remaining life of the indemnified assets.benefits
Deposit insurance expense
Deposit insurance expense increased $0.8Employee compensation and benefits declined by $8.3 million and $4.0$10.1 million respectively, for the three and ninesix months ended SeptemberJune 30, 20172019 relative to the comparable periods of the prior year, primarily due to a reduction in headcount.
Professional fees
Professional fees increased by $4.3 million and $9.3 million, respectively, during the three and six months ended June 30, 2019 compared to the corresponding periods in 2016. These increases primarily reflect the growth of the balance sheet, the large bank surcharge imposed by the FDIC, which began in the third quarter of 2016,three and six months ended June 30, 2018. The increases in certain componentsprofessional fees were primarily attributable to consulting services related to our BankUnited 2.0 initiative.
Technology and telecommunications
Increased technology and telecommunications expense related primarily to investments we are making in cloud technology, our digital platforms, data initiatives and enhancement of the Bank's assessment rate.some of our risk management capabilities.
Depreciation of equipment under operating lease
Depreciation of equipment under operating lease increased by $2.1 million and $5.7 million, respectively, for the three and nine months ended September 30, 2017 compared to the corresponding periods in 2016. These increases generally correspond to the growth in the portfolio of equipment under operating lease.
Other non-interest expense
The most significant components of other non-interest expense are advertising, promotion and promotion,business development, costs related to lending activities and deposit generation, OREOexpenses related expenses, insurance,to workouts and foreclosures, regulatory examination assessments, travel and general office expense. Other non-interest expense for the three months ended September 30, 2017 includes $0.6 million related primarily to facilities damage and employee relocation and assistance due to the impact of Hurricane Irma. We do not expect future expenses related to facilities damage and employee relocation to be material to the Company.
Income Taxes
The Company’s effective income tax rate was 32.2%25.2% and 31.2%25.9% for the three and ninesix months ended SeptemberJune 30, 2017,2019, respectively, compared to 31.7%and 33.2%23.2% and 23.1% for the three and ninesix months ended SeptemberJune 30, 2016,2018, respectively. Significant components included in the reconciliation of the Company'sThe effective income tax rate todiffered from the statutory federal income tax rate of 35.0% included21% for the effect ofthree and six months ended June 30, 2019 and 2018 due primarily to state income taxes, and the impact ofoffset by income not subject to federal tax for each of the periods presented. In addition, the effective income tax rate for the three and nine months ended September 30, 2017 reflected the impact of $0.3 million and $3.2 million, respectively, in excess tax benefits resulting from activity related to vesting of share-based awards and exercise of stock options.tax.
Analysis of Financial Condition
Average interest-earning assets increased $3.2$2.3 billion to $26.9$31.1 billion for the ninesix months ended SeptemberJune 30, 20172019 from $23.7$28.8 billion for the ninesix months ended SeptemberJune 30, 2016.2018. This increase was driven by a $2.1 billionan $802 million increase in the average balance of outstanding loans and a $1.0$1.5 billion increase in the average balance of investment securities. The increase in average loans reflected growth of $2.3 billion in average non-covered loans outstanding, partially offset by a $186A $332 million decrease in the average balance of covered loans. The decrease in average non-interest earning assets period over periodwas primarily reflected aattributed to (i) the decrease in the FDIC indemnification asset. Growthasset, which was amortized to zero during the fourth quarter of 2018 and (ii) a decrease in interest earning assets, resolutionincome taxes receivable related to a discrete income tax benefit recognized during the fourth quarter of covered loans and declines in2017, partially offset by (iii) the amountrecognition of the FDIC indemnificationROU asset are trends that are expectedsubsequent to continue.the adoption of ASU 2016-02 effective January1, 2019.
Average interest bearing liabilities increased $2.6$1.5 billion to $22.4$25.2 billion for the ninesix months ended SeptemberJune 30, 20172019 from $19.8$23.7 billion for the ninesix months ended SeptemberJune 30, 2016,2018, due primarily to increasesan increase of $2.4$1.2 billion in average interest bearing deposits and $191 million in average FHLB advances. Average non-interest bearing deposits increased by $90 million. We expect growth in average deposits to continue, corresponding to anticipated growth in interest earning assets.
deposits.
Average stockholders' equity increaseddecreased by $255$121 million, due primarily to the repurchase of common stock, offset by the retention of earnings, but also reflecting proceeds from the exercise of stock options and an increase in accumulated other comprehensive income.earnings.
Investment Securities Available for Sale
The following table shows the amortized cost and carrying value, which, with the exception of investment securities held to maturity, is fair value, of investment securities available for sale as of the dates indicated (in thousands):
| | | | September 30, 2017 | | December 31, 2016 | June 30, 2019 | | December 31, 2018 |
| | Amortized Cost | | Fair Value | | Amortized Cost | | Fair Value | Amortized Cost | | Carrying Value | | Amortized Cost | | Carrying Value |
| U.S. Treasury securities | $ | 24,969 |
| | $ | 24,957 |
| | $ | 4,999 |
| | $ | 5,005 |
| $ | 49,992 |
| | $ | 50,213 |
| | $ | 39,885 |
| | $ | 39,873 |
|
| U.S. Government agency and sponsored enterprise residential MBS | 2,332,616 |
| | 2,348,687 |
| | 1,513,028 |
| | 1,527,242 |
| 2,222,327 |
| | 2,227,795 |
| | 1,885,302 |
| | 1,897,474 |
|
| U.S. Government agency and sponsored enterprise commercial MBS | 139,966 |
| | 139,220 |
| | 126,754 |
| | 124,586 |
| 378,167 |
| | 381,104 |
| | 374,569 |
| | 374,787 |
|
| Private label residential MBS and CMOs | 507,381 |
| | 527,858 |
| | 334,167 |
| | 375,098 |
| 1,374,008 |
| | 1,395,182 |
| | 1,539,058 |
| | 1,534,198 |
|
| Private label commercial MBS | 1,140,465 |
| | 1,153,601 |
| | 1,180,386 |
| | 1,187,624 |
| 1,549,733 |
| | 1,557,953 |
| | 1,486,835 |
| | 1,485,716 |
|
| Single family rental real estate-backed securities | 566,635 |
| | 572,948 |
| | 858,339 |
| | 861,251 |
| 387,104 |
| | 392,306 |
| | 406,310 |
| | 402,458 |
|
| Collateralized loan obligations | 695,414 |
| | 700,319 |
| | 487,678 |
| | 487,296 |
| 1,205,295 |
| | 1,198,282 |
| | 1,239,355 |
| | 1,235,198 |
|
| Non-mortgage asset-backed securities | 80,255 |
| | 82,637 |
| | 187,660 |
| | 186,736 |
| 155,542 |
| | 157,817 |
| | 204,372 |
| | 204,067 |
|
| Preferred stocks | 60,716 |
| | 70,716 |
| | 76,180 |
| | 88,203 |
| |
| State and municipal obligations | 666,013 |
| | 677,015 |
| | 705,884 |
| | 698,546 |
| 265,856 |
| | 279,327 |
| | 398,810 |
| | 398,429 |
|
| SBA securities | 572,540 |
| | 586,675 |
| | 517,129 |
| | 523,906 |
| 418,494 |
| | 421,773 |
| | 514,765 |
| | 519,313 |
|
| Other debt securities | 4,056 |
| | 8,839 |
| | 3,999 |
| | 8,091 |
| 1,395 |
| | 4,781 |
| | 1,393 |
| | 4,846 |
|
| Investment securities held to maturity | | 10,000 |
| | 10,000 |
| | 10,000 |
| | 10,000 |
|
| | $ | 6,791,026 |
| | $ | 6,893,472 |
| | $ | 5,996,203 |
| | $ | 6,073,584 |
| $ | 8,017,913 |
| | 8,076,533 |
| | $ | 8,100,654 |
| | 8,106,359 |
|
| Marketable equity securities | | | | 62,175 |
| | | | 60,519 |
|
| | | | | $ | 8,138,708 |
| | | | $ | 8,166,878 |
|
Our investment strategy has focused on insuring adequate liquidity, addingmaintaining a suitable balance of high credit quality, diversifyingdiverse assets, to the consolidated balance sheet, managing interest rate risk, and generating acceptable returns given our established risk parameters. We have sought to maintain liquidity by investing a significant portion of the portfolio in high quality liquid securities including U.S. Treasury securities, GNMA securities, SBA securities and U.S. Government agencyAgency MBS. Investment grade municipal securities provide liquidity along with higherand attractive tax-equivalent yields at longer durations than the portfolio in general.yields. We have also invested in highly rated structured products, including private-label commercial and residential MBS, collateralized loan obligations, single family rental real estate-backed securities and non-mortgage asset-backed securities that, while somewhat less liquid, provide us with attractive yields. Relatively short effective portfolio duration helps mitigate interest rate risk arising fromrisk. Based on the currently low level of market interest rates. The Company’s assumptions, the estimated
weighted average expected life of the investment portfolio as of SeptemberJune 30, 20172019 was 4.9 years and the4.6 years. The effective duration of the investment portfolio as of June 30, 2019 was 1.71.2 years. The model results are based on assumptions that may differ from actual results.
The following table shows the scheduled maturities, carrying values and current yields for investment securities available for sale as of SeptemberJune 30, 2017.2019, as well as the carrying value and yield of marketable equity securities. Scheduled maturities have been adjusted for anticipated prepayments of MBS and other pass through securities.when applicable. Yields on tax-exempt securities have been calculated on a tax-equivalent basis, based on a federal income tax rate of 21% (dollars in thousands):
| | | | Within One Year | | After One Year Through Five Years | | After Five Years Through Ten Years | | After Ten Years | | Total | Within One Year | | After One Year Through Five Years | | After Five Years Through Ten Years | | After Ten Years | | Total |
| | Carrying Value | | Weighted Average Yield | | Carrying Value | | Weighted Average Yield | | Carrying Value | | Weighted Average Yield | | Carrying Value | | Weighted Average Yield | | Carrying Value | | Weighted Average Yield | Carrying Value | | Weighted Average Yield | | Carrying Value | | Weighted Average Yield | | Carrying Value | | Weighted Average Yield | | Carrying Value | | Weighted Average Yield | | Carrying Value | | Weighted Average Yield |
| U.S. Treasury securities | $ | 24,957 |
| | 1.19 | % | | $ | — |
| | — | % | | $ | — |
| | — | % | | $ | — |
| | — | % | | $ | 24,957 |
| | 1.19 | % | $ | 50,213 |
| | 2.27 | % | | $ | — |
| | — | % | | $ | — |
| | — | % | | $ | — |
| | — | % | | $ | 50,213 |
| | 2.27 | % |
| U.S. Government agency and sponsored enterprise residential MBS | 355,685 |
| | 2.94 | % | | 860,103 |
| | 2.28 | % | | 893,121 |
| | 2.14 | % | | 239,778 |
| | 2.15 | % | | 2,348,687 |
| | 2.31 | % | 213,745 |
| | 3.06 | % | | 1,001,087 |
| | 2.90 | % | | 851,341 |
| | 2.78 | % | | 161,622 |
| | 2.80 | % | | 2,227,795 |
| | 2.86 | % |
| U.S. Government agency and sponsored enterprise commercial MBS | 5,562 |
| | 3.80 | % | | 11,066 |
| | 3.71 | % | | 83,066 |
| | 2.50 | % | | 39,526 |
| | 3.57 | % | | 139,220 |
| | 2.95 | % | 4,562 |
| | 3.79 | % | | 41,748 |
| | 3.69 | % | | 228,039 |
| | 3.17 | % | | 106,755 |
| | 3.78 | % | | 381,104 |
| | 3.40 | % |
| Private label residential MBS and CMOs | 113,951 |
| | 4.01 | % | | 284,366 |
| | 3.82 | % | | 101,127 |
| | 4.07 | % | | 28,414 |
| | 4.39 | % | | 527,858 |
| | 3.94 | % | 288,891 |
| | 3.85 | % | | 791,200 |
| | 3.85 | % | | 244,915 |
| | 3.68 | % | | 70,176 |
| | 3.70 | % | | 1,395,182 |
| | 3.81 | % |
| Private label commercial MBS | 90,284 |
| | 3.80 | % | | 786,542 |
| | 3.57 | % | | 276,775 |
| | 3.20 | % | | — |
| | — | % | | 1,153,601 |
| | 3.50 | % | 71,294 |
| | 4.24 | % | | 1,279,895 |
| | 3.99 | % | | 204,844 |
| | 3.51 | % | | 1,920 |
| | 3.28 | % | | 1,557,953 |
| | 3.94 | % |
| Single family rental real estate-backed securities | 1,516 |
| | 3.18 | % | | 546,920 |
| | 2.92 | % | | 24,512 |
| | 3.70 | % | | — |
| | — | % | | 572,948 |
| | 2.95 | % | 12,920 |
| | 2.94 | % | | 113,041 |
| | 3.24 | % | | 266,345 |
| | 3.52 | % | | — |
| | — | % | | 392,306 |
| | 3.42 | % |
| Collateralized loan obligations | — |
| | — | % | | 573,474 |
| | 3.32 | % | | 126,845 |
| | 3.52 | % | | — |
| | — | % | | 700,319 |
| | 3.36 | % | 28,470 |
| | 4.37 | % | | 821,206 |
| | 4.04 | % | | 348,606 |
| | 4.43 | % | | — |
| | — | % | | 1,198,282 |
| | 4.16 | % |
| Non-mortgage asset-backed securities | 11,999 |
| | 3.91 | % | | 70,638 |
| | 3.63 | % | | — |
| | — | % | | — |
| | — | % | | 82,637 |
| | 3.67 | % | 18,397 |
| | 4.57 | % | | 93,114 |
| | 3.53 | % | | 45,005 |
| | 3.44 | % | | 1,301 |
| | 3.58 | % | | 157,817 |
| | 3.62 | % |
| State and municipal obligations | — |
| | — | % | | 27,509 |
| | 3.00 | % | | 624,758 |
| | 4.46 | % | | 24,748 |
| | 5.60 | % | | 677,015 |
| | 4.45 | % | 1,581 |
| | 1.96 | % | | 33,425 |
| | 2.78 | % | | 196,001 |
| | 3.98 | % | | 48,320 |
| | 4.09 | % | | 279,327 |
| | 3.84 | % |
| SBA securities | 93,080 |
| | 2.54 | % | | 245,991 |
| | 2.50 | % | | 150,116 |
| | 2.47 | % | | 97,488 |
| | 2.43 | % | | 586,675 |
| | 2.49 | % | 85,305 |
| | 3.50 | % | | 196,359 |
| | 3.41 | % | | 95,018 |
| | 3.36 | % | | 45,091 |
| | 3.31 | % | | 421,773 |
| | 3.41 | % |
| Other debt securities | — |
| | — | % | | — |
| | — | % | | 1,900 |
| | 9.17 | % | | 6,939 |
| | 9.13 | % | | 8,839 |
| | 9.14 | % | — |
| | — | % | | — |
| | — | % | | — |
| | — | % | | 4,781 |
| | 14.74 | % | | 4,781 |
| | 14.74 | % |
| | $ | 697,034 |
| | 3.13 | % | | $ | 3,406,609 |
| | 3.04 | % | | $ | 2,282,220 |
| | 3.11 | % | | $ | 436,893 |
| | 2.74 | % | | 6,822,756 |
| | 3.05 | % | $ | 775,378 |
| | 3.54 | % | | $ | 4,371,075 |
| | 3.66 | % | | $ | 2,480,114 |
| | 3.40 | % | | $ | 439,966 |
| | 3.42 | % | | 8,066,533 |
| | 3.56 | % |
| Preferred stocks with no scheduled maturity | |
| | |
| | |
| | |
| | |
| | |
| | |
| | |
| | 70,716 |
| | 8.66 | % | |
| Total investment securities available for sale | |
| | |
| | |
| | |
| | |
| | |
| | |
| | |
| | $ | 6,893,472 |
| | 3.11 | % | |
| Marketable equity securities with no scheduled maturity | | |
| | |
| | |
| | |
| | |
| | |
| | |
| | |
| | 62,175 |
| | 7.29 | % |
| Total investment securities available for sale and marketable equity securities | | |
| | |
| | |
| | |
| | |
| | |
| | |
| | |
| | $ | 8,128,708 |
| | 3.58 | % |
The investment securities available for sale investment securities portfolio was in a net unrealized gain position of $102.4$58.6 million at SeptemberJune 30, 20172019 with aggregate fair value equal to 101.5%100.7% of amortized cost. Net unrealized gains included $110.3$80.4 million of gross unrealized gains and $7.9$21.8 million of gross unrealized losses. Investment securities available for sale in an unrealized loss position at SeptemberJune 30, 20172019 had an aggregate fair value of $1.0$2.7 billion. At SeptemberJune 30, 2017, 96.7%2019, 99.1% of investment securities available for sale were backed by the U.S. Government, U.S. Government agencies or sponsored enterprises or were rated AAA, , AA or A, based on the most recent third-party ratings. Investment securities available for sale totaling $33$63 million were not rated at June 30, 2019. These securities have been determined by management to be of investment grade quality. Additionally, $12 million of securities acquired at substantial discounts in the FSB acquisition were rated below investment grade or not rated at SeptemberJune 30, 2017, all2019. The majority of whichthese securities were acquiredheld in the FSB Acquisition and substantially all of which were insignificant unrealized gain positions at September 30, 2017.positions.
We evaluate the credit quality of individual securities in the portfolio quarterly to determine whether any of the investments in unrealized loss positions are other-than-temporarily impaired. This evaluation considers, but is not necessarily limited to, the following factors, the relative significance of which varies depending on the circumstances pertinent to each individual security:
our intent to hold the security until maturity or for a period of time sufficient for a recovery in value;
whether it is more likely than not that we will be required to sell the security prior to recovery of its amortized cost basis;
the length of time and extent to which fair value has been less than amortized cost;
adverse changes in expected cash flows;
collateral values and performance;
the payment structure of the security, including levels of subordination or over-collateralization;
changes in the economic or regulatory environment;
the general market condition of the geographic area or industry of the issuer;
the issuer’s financial condition, performance and business prospects; and
changes in credit ratings.
Our evaluation of non-agency impaired securities for OTTI as of September 30, 2017 included consideration of the potential impacts of Hurricanes Irma and Harvey. Our considerations included but were not necessarily limited to (i) observations of market pricing since the hurricanes, (ii) whether a significant portion of the underlying collateral was in an
impacted area, (iii) whether credit enhancement significantly exceeded the balance of collateral in impacted areas, (iv) for residential mortgage-backed securities, the evaluation of the extent and nature of damage to residential collateral for loans in the Bank’s residential loan portfolio located in the same areas, and (v) discussions with sponsors or managers of individual securities about specific collateral impact.
During the three and nine months ended September 30, 2016, OTTI was recognized on two positions in one private label commercial MBS. These positions were in unrealized loss positions at September 30, 2016 and the Company intended to sell the security before recovery of the amortized cost basis. No securities were determined to be other-than-temporarily impaired at SeptemberJune 30, 2017, or during the three2019 and nine months then ended.2018.
We do not intend to sell securities in significant unrealized loss positions at SeptemberJune 30, 2017.2019. Based on an assessment of our liquidity position and internal and regulatory guidelines for permissible investments and concentrations, it is not more likely than not that we will be required to sell securities in significant unrealized loss positions prior to recovery of amortized cost basis. The severity of impairment of individual securities in the portfolio is generally not material. Unrealized losses in the portfolio at SeptemberJune 30, 20172019 were primarily attributable to an increase in market interest rates subsequent to the date the securities were acquired.acquired and, for some securities, widening spreads. At June 30, 2019, 83%, 14% and 3% of CLOs were rated AAA, AA and A, respectively, based on the most recent third-party ratings, with a weighted-average subordination level at 41.6%, ranging from 26.3% to 43.6%. Management performs a thorough analysis prior to purchasing CLOs, including extensive vetting of the asset manager and stress testing of collateral. Management engages an independent third party to perform ongoing credit surveillance of the CLO portfolio, performs periodic stress testing of the portfolio and continuously monitors exposure, default status, and other relevant security characteristics.
The timely repayment of principal and interest on U.S. Treasury,SBA securities and U.S. Government agency and sponsored enterprise securities in unrealized loss positions is explicitly or implicitly guaranteed by the full faith and credit of the U.S. Government. Management performed projected cash flow analyses of the private label residential MBS and CMOs, private label commercial MBS, collateralized loan obligations and non-mortgage asset-backed securities in unrealized loss positions, incorporating CUSIP level assumptions consistent with the collateral characteristics of each security including collateral default rate, voluntary prepayment rate, severity and delinquency assumptions. Based on the results of this analysis, no credit losses were projected. Management's analysis of the credit characteristics of individual securities and the underlying collateral and levels of subordination for each of the single family rental real estate-backed securities in unrealized loss positions is not indicative of projected credit losses. Management's analysis of the state and municipal obligations in unrealized loss positions included reviewing the ratings of the securities and the results of credit surveillance performed by an independent third party. Given the expectation of timely repayment of principal and interest and the generally limited severity of impairment, the impairments were considered to be temporary.
For further discussion of our analysis of investment securities for OTTI, see Note 3 to the consolidated financial statements.
We use third-party pricing services to assist us in estimating the fair value of investment securities. We perform a variety of procedures to ensure that we have a thorough understanding of the methodologies and assumptions used by the pricing services including obtaining and reviewing written documentation of the methods and assumptions employed, conducting interviews with valuation desk personnel and reviewing model results and detailed assumptions used to value selected securities as considered necessary. Our classification of prices within the fair value hierarchy is based on an evaluation of the nature of the significant assumptions impacting the valuation of each type of security in the portfolio. We have established a robust price challenge process that includes a review by our treasury front office of all prices provided on a monthly basis. Any price evidencing unexpected month over month fluctuations or deviations from our expectations based on recent observed trading activity and other information available in the marketplace that would impact the value of the security is challenged. Responses to the price challenges, which generally include specific information about inputs and assumptions incorporated in the valuation and their sources, are reviewed in detail. If considered necessary to resolve any discrepancies, a price will be obtained from an additional independent valuation specialist.sources. We do not typically adjust the prices provided, other than through this established challenge process. Our primary pricing services utilize observable inputs when available, and employ unobservable inputs and proprietary models only when observable inputs are not available. As a matter of course, the services validate prices by comparison to recent trading activity whenever such activity exists. Quotes obtained from the pricing services are typically non-binding.
We have also established a quarterly price validation process to assess the propriety of the pricing methodologies utilized by our primary pricing services by independently verifying the prices of a sample of securities in the portfolio. Sample sizes vary based on the type of security being priced, with higher sample sizes applied to more difficult to value security types. Verification procedures may consist of obtaining prices from an additional outside source or internal modeling, generally based on Intex. We have established acceptable percentage deviations from the price provided by the initial pricing source. If deviations fall outside the established parameters, we will obtain and evaluate more detailed information about the assumptions and inputs used by each pricing source or, if considered necessary, employ an additional valuation specialistsource to price the security in question. Pricing issues identified through this evaluation are addressed with the applicable pricing service and methodologies or inputs are revised as determined necessary. Depending on the results of the validation process, sample sizes may be extended for particular classes of securities. Results of the validation process are reviewed by the treasury front office and by senior management.
The majority of our investment securities are classified within level 2 of the fair value hierarchy. U.S. Treasury securities and certain preferred stocksmarketable equity securities are classified within level 1 of the hierarchy. At SeptemberJune 30, 20172019 and December 31, 2016, 1.0%2018, 0.4% and 2.1%0.7%, respectively, of our investment securities were classified within level 3 of the fair value hierarchy. Securities classified within level 3 of the hierarchy at SeptemberJune 30, 20172019 included certain private label residential MBS and trust preferred securities. These
securities were classified within level 3 of the hierarchy because proprietary assumptions related to voluntary prepayment rates, default probabilities, loss severities and discount rates were considered significant to the valuation. There were no transfers of investment securities between levels of the fair value hierarchy during the ninesix months ended SeptemberJune 30, 20172019 and 2016.2018.
For additional discussion of the fair values of investment securities, see Note 10 to the consolidated financial statements.
Loans Held for Sale
Loans held for sale at SeptemberJune 30, 20172019 included $32$189 million of commercialPinnacle loans originated by SBF withtransferred to held for sale and $36 million of the intent to sellguaranteed portion of SBA loans held for sale in the secondary market. CommercialAt December 31, 2018, loans held for sale are comprisedconsisted entirely of the guaranteed portion of SBA loans. SBA loans guaranteed by U.S. government agencies. Loans are generally sold with servicing retained. ServicingCommercial servicing activity did not have a material impact on the results of operations for the three and ninesix months ended SeptemberJune 30, 20172019 and 2016.2018.
Loans
The loan portfolio comprises the Company’s primary interest-earning asset. The following tables show the composition of the loan portfolio and the breakdown of the portfolio among non-covered loans, covered ACI loans and covered non-ACI loans at the dates indicated (dollars in thousands):
| | | | September 30, 2017 | | | | | | | | | |
| |
| | Covered Loans | | | | Percent of Total | June 30, 2019 | | December 31, 2018 |
| | Non-Covered Loans | | ACI | | Non-ACI | | Total | | Total | | Percent of Total | | Total | | Percent of Total |
| Residential and other consumer: | |
| | |
| | |
| | |
| | |
| |
| | |
| | |
| | |
|
| 1-4 single family residential | $ | 3,958,205 |
| | $ | 470,300 |
| | $ | 28,589 |
| | $ | 4,457,094 |
| | 21.7 | % | $ | 4,830,943 |
| | 21.4 | % | | $ | 4,606,828 |
| | 21.0 | % |
| Home equity loans and lines of credit | 1,644 |
| | 5,640 |
| | 37,764 |
| | 45,048 |
| | 0.2 | % | |
| Other consumer loans | 20,166 |
| | — |
| | — |
| | 20,166 |
| | 0.1 | % | |
| Government insured residential | | 354,731 |
| | 1.6 | % | | 265,701 |
| | 1.2 | % |
| Other | | 14,533 |
| | 0.1 | % | | 17,369 |
| | 0.1 | % |
| | 3,980,015 |
| | 475,940 |
| | 66,353 |
| | 4,522,308 |
| | 22.0 | % | 5,200,207 |
| | 23.1 | % | | 4,889,898 |
| | 22.3 | % |
| Commercial: | | | | | | | | | | | | | | | | |
| Multi-family | 3,358,801 |
| | — |
| | — |
| | 3,358,801 |
| | 16.3 | % | 2,381,346 |
| | 10.6 | % | | 2,583,331 |
| | 11.8 | % |
| Non-owner occupied commercial real estate | 4,183,275 |
| | — |
| | — |
| | 4,183,275 |
| | 20.4 | % | 4,945,017 |
| | 21.9 | % | | 4,700,188 |
| | 21.4 | % |
| Construction and land | 271,994 |
| | — |
| | — |
| | 271,994 |
| | 1.3 | % | 237,222 |
| | 1.1 | % | | 227,134 |
| | 1.0 | % |
| Owner occupied commercial real estate | 1,959,464 |
| | — |
| | — |
| | 1,959,464 |
| | 9.5 | % | 2,080,578 |
| | 9.2 | % | | 2,122,381 |
| | 9.7 | % |
| Commercial and industrial | 3,900,290 |
| | — |
| | — |
| | 3,900,290 |
| | 19.0 | % | 5,164,571 |
| | 22.9 | % | | 4,801,226 |
| | 21.9 | % |
| Commercial lending subsidiaries | 2,374,193 |
| | — |
| | — |
| | 2,374,193 |
| | 11.5 | % | 2,531,767 |
| | 11.2 | % | | 2,608,834 |
| | 11.9 | % |
| | 16,048,017 |
| | — |
| | — |
| | 16,048,017 |
| | 78.0 | % | 17,340,501 |
| | 76.9 | % | | 17,043,094 |
| | 77.7 | % |
| Total loans | 20,028,032 |
| | 475,940 |
| | 66,353 |
| | 20,570,325 |
| | 100.0 | % | 22,540,708 |
| | 100.0 | % | | 21,932,992 |
| | 100.0 | % |
| Premiums, discounts and deferred fees and costs, net | 44,422 |
| | — |
| | (4,317 | ) | | 40,105 |
| | | 51,141 |
| | | | 44,016 |
| | |
| Loans including premiums, discounts and deferred fees and costs | 20,072,454 |
| | 475,940 |
| | 62,036 |
| | 20,610,430 |
| | | 22,591,849 |
| | | | 21,977,008 |
| | |
| Allowance for loan and lease losses | (153,725 | ) | | (1,812 | ) | | (3,036 | ) | | (158,573 | ) | | | (112,141 | ) | | | | (109,931 | ) | | |
| Loans, net | $ | 19,918,729 |
| | $ | 474,128 |
| | $ | 59,000 |
| | $ | 20,451,857 |
| | | $ | 22,479,708 |
| | | | $ | 21,867,077 |
| | |
|
| | | | | | | | | | | | | | | | | | |
| | December 31, 2016 |
| |
| | Covered Loans | | | | Percent of Total |
| | Non-Covered Loans | | ACI | | Non-ACI | | Total | |
| Residential and other consumer: | |
| | |
| | |
| | |
| | |
|
| 1-4 single family residential | $ | 3,422,425 |
| | $ | 532,348 |
| | $ | 36,675 |
| | $ | 3,991,448 |
| | 20.6 | % |
| Home equity loans and lines of credit | 1,120 |
| | 3,894 |
| | 47,629 |
| | 52,643 |
| | 0.3 | % |
| Other consumer loans | 24,365 |
| | — |
| | — |
| | 24,365 |
| | 0.1 | % |
| | 3,447,910 |
| | 536,242 |
| | 84,304 |
| | 4,068,456 |
| | 21.0 | % |
| Commercial: | | | | | | | | | |
| Multi-family | 3,824,973 |
| | — |
| | — |
| | 3,824,973 |
| | 19.8 | % |
| Non-owner occupied commercial real estate | 3,739,235 |
| | — |
| | — |
| | 3,739,235 |
| | 19.3 | % |
| Construction and land | 311,436 |
| | — |
| | — |
| | 311,436 |
| | 1.6 | % |
| Owner occupied commercial real estate | 1,736,858 |
| | — |
| | — |
| | 1,736,858 |
| | 9.0 | % |
| Commercial and industrial | 3,391,614 |
| | — |
| | — |
| | 3,391,614 |
| | 17.5 | % |
| Commercial lending subsidiaries | 2,280,685 |
| | — |
| | — |
| | 2,280,685 |
| | 11.8 | % |
| | 15,284,801 |
| | — |
| | — |
| | 15,284,801 |
| | 79.0 | % |
| Total loans | 18,732,711 |
| | 536,242 |
| | 84,304 |
| | 19,353,257 |
| | 100.0 | % |
| Premiums, discounts and deferred fees and costs, net | 48,641 |
| | — |
| | (6,504 | ) | | 42,137 |
| | |
| Loans including premiums, discounts and deferred fees and costs | 18,781,352 |
| | 536,242 |
| | 77,800 |
| | 19,395,394 |
| | |
| Allowance for loan and lease losses | (150,853 | ) | | — |
| | (2,100 | ) | | (152,953 | ) | | |
| Loans, net | $ | 18,630,499 |
| | $ | 536,242 |
| | $ | 75,700 |
| | $ | 19,242,441 |
| | |
Total loans, including premiums, discounts and deferred fees and costs, increased by $1.2 billion$615 million to $20.6$22.6 billion at SeptemberJune 30, 2017,2019, from $19.4$22.0 billion at December 31, 2016. Non-covered loans grew by $1.3 billion while covered loans declined by $76 million from December 31, 2016 to September 30, 2017. Non-covered residential2018.
Residential and other consumer loans grew by $538$319 million and non-coveredfor the six months ended June 30, 2019. Multi-family loans declined by $202 million for the six months ended June 30, 2019, primarily due to continued run-off of the New York portfolio, while other categories of commercial real estate loans grew by $753 million during the nine months ended September 30, 2017.
Growth in non-covered$213 million. Commercial and industrial loans, including premiums, discounts and deferred fees and costs, for the nine months ended September 30, 2017 reflected an increaseinclusive of $536owner occupied commercial real estate, grew by $320 million for the Florida franchise, a decreasesix months ended June 30, 2019.
Included in multi-family and non-owner occupied commercial real estate loans above were $81 million and $14 million, respectively, in re-positioning loans at June 30, 2019. These loans, substantially all of $74 million for thewhich are in New York, franchiseprovided financing for some level of improvements by the borrower to the underlying collateral to enhance the cash flow generating capacity of the collateral. The primary purpose of these loans was not for construction.
Residential mortgages and an increase of $829 million for the national platforms.other consumer loans
The following tables showtable shows the composition of the non-covered loan portfolioresidential and the breakdown among the Florida and New York franchises and national platformsother consumer loans at the dates indicated. Amounts include premiums, discounts and deferred fees and costs (dollars in(in thousands):
|
| | | | | | | | | | | | | | | |
| | September 30, 2017 |
| | Florida | | New York | | National | | Total |
| Residential and other consumer | $ | 228,300 |
| | $ | 206,308 |
| | $ | 3,599,004 |
| | $ | 4,033,612 |
|
| Commercial: | | | | | | | |
| Multi-family | 555,193 |
| | 2,807,068 |
| | — |
| | 3,362,261 |
|
| Non-owner occupied commercial real estate | 2,572,743 |
| | 1,501,597 |
| | 99,229 |
| | 4,173,569 |
|
| Construction and land | 123,655 |
| | 134,854 |
| | 12,947 |
| | 271,456 |
|
| Owner occupied commercial real estate | 1,110,581 |
| | 748,339 |
| | 97,829 |
| | 1,956,749 |
|
| Commercial and industrial | 2,509,353 |
| | 891,978 |
| | 490,751 |
| | 3,892,082 |
|
| Commercial lending subsidiaries | — |
| | — |
| | 2,382,725 |
| | 2,382,725 |
|
| | $ | 7,099,825 |
| | $ | 6,290,144 |
| | $ | 6,682,485 |
| | $ | 20,072,454 |
|
| | 35.4 | % | | 31.3 | % | | 33.3 | % | | 100.0 | % |
|
| | | | | | | | | | | | | | | |
| | December 31, 2016 |
| | Florida | | New York | | National | | Total |
| Residential and other consumer: | $ | 254,139 |
| | $ | 226,154 |
| | $ | 3,015,482 |
| | $ | 3,495,775 |
|
| Commercial: | | | | | | | |
| Multi-family | 520,263 |
| | 3,309,411 |
| | — |
| | 3,829,674 |
|
| Non-owner occupied commercial real estate | 2,337,806 |
| | 1,294,231 |
| | 99,771 |
| | 3,731,808 |
|
| Construction and land | 174,494 |
| | 125,983 |
| | 10,436 |
| | 310,913 |
|
| Owner occupied commercial real estate | 1,042,441 |
| | 602,155 |
| | 91,254 |
| | 1,735,850 |
|
| Commercial and industrial | 2,234,393 |
| | 806,660 |
| | 346,085 |
| | 3,387,138 |
|
| Commercial lending subsidiaries | — |
| | — |
| | 2,290,194 |
| | 2,290,194 |
|
| | $ | 6,563,536 |
| | $ | 6,364,594 |
| | $ | 5,853,222 |
| | $ | 18,781,352 |
|
| | 34.9 | % | | 33.9 | % | | 31.2 | % | | 100.0 | % |
|
| | | | | | | |
| | June 30, 2019 | | December 31, 2018 |
| 1-4 single family residential | $ | 4,897,552 |
| | $ | 4,664,920 |
|
| Government insured residential | 355,719 |
| | 266,729 |
|
| Home equity loans and lines of credits | 1,445 |
| | 1,393 |
|
| Other consumer loans | 13,072 |
| | 15,947 |
|
| | $ | 5,267,788 |
| | $ | 4,948,989 |
|
The increase in non-owner occupied commercial real estate loans and the decrease in multi-family loans in the New York franchise over the nine months ended September 30, 2017 includes the impact of reclassifying $207 million of loans on mixed-use properties from multi-family to non-owner occupied commercial real estate loans, based on the primary source of rental income on those properties.
Residential mortgages and other consumer loans
Residential mortgages and other consumer loans totaled $4.5 billion, or 22.0% of total loans, at September 30, 2017 and $4.1 billion, or 21.0% of total loans, at December 31, 2016.
The non-covered1-4 single family residential loan portfolio is primarily comprised of loans purchased on a national basis through established correspondent channels. The portfolio also includes loans originated through retail channels in our Florida and New York geographic footprint prior to the termination of our retail residential mortgage origination business in early 2016. Non-covered1-4 single family residential mortgage loans are primarily closed-end, first lien jumbo mortgages for the purchase or re-finance of owner occupied property. The loans have terms ranging from 10 to 30 years, with either fixed or adjustable interest rates. At SeptemberJune 30, 2017, $1132019, $111 million or 2.8%2.3% of non-covered residential mortgage loans were interest-only loans, substantially all of which begin amortizing 10 years after origination.
We doThe Company acquires non-performing FHA and VA insured mortgages from third party servicers who have exercised their right to purchase these loans out of GNMA securitizations (collectively, "government insured pool buyout loans" or "buyout loans"). Buyout loans that re-perform, either through modification or self-cure, may be eligible for re-securitization. The balance of government insured residential buyout loans totaled $331 million at June 30, 2019. The Company is not originate or acquire option ARMs, “no-doc” or “reduced-doc” mortgages and do not utilize wholesale mortgage origination channels although the covered loan portfolio contains loans withservicer of these characteristics. The Company’s exposure to future losses on these mortgage loans is mitigated by the Single Family Shared-Loss Agreement.loans.
The following charts present the distribution of the non-covered 1-4 single family residential mortgage portfolio by interest rate terms and contractual lives at the dates indicated: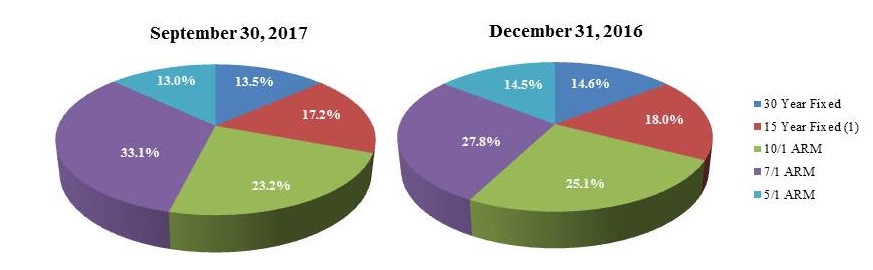
| |
(1) | Fixed-rate loans with contractual terms of 20 years comprise less than 3% of the total at both September 30, 2017 and December 31, 2016, and are reported with 15 year fixed above. |
The following table presents the five states with the largest geographic concentrationconcentrations of the non-covered 1-4 single family residential portfolio is summarized as followsloans, excluding government insured residential loans, at the dates indicated (dollar(dollars in thousands):
|
| | | | | | | | | | | | | |
| | September 30, 2017 | | December 31, 2016 |
| California | $ | 1,052,154 |
| | 26.2 | % | | $ | 904,107 |
| | 26.1 | % |
| New York | 848,123 |
| | 21.1 | % | | 763,824 |
| | 22.0 | % |
| Florida | 530,056 |
| | 13.2 | % | | 487,294 |
| | 14.0 | % |
| District of Columbia | 177,978 |
| | 4.4 | % | | 123,825 |
| | 3.6 | % |
| Virginia | 175,550 |
| | 4.4 | % | | 152,113 |
| | 4.4 | % |
Others (1) | 1,227,983 |
| | 30.7 | % | | 1,039,186 |
| | 29.9 | % |
| | $ | 4,011,844 |
| | 100.0 | % | | $ | 3,470,349 |
| | 100.0 | % |
| |
(1) | No other state represented borrowers with more than 4.0% of non-covered 1-4 single family residential loans outstanding at September 30, 2017 or December 31, 2016. |
Home equity loans and lines of credit are not significant to the non-covered loan portfolio.
Other consumer loans are comprised primarily of consumer installment financing, loans secured by certificates of deposit, unsecured personal lines of credit and demand deposit account overdrafts. |
| | | | | | | | | | | | | |
| | June 30, 2019 | | December 31, 2018 |
| California | $ | 1,254,896 |
| | 25.6 | % | | $ | 1,177,221 |
| | 25.2 | % |
| New York | 1,012,800 |
| | 20.7 | % | | 977,146 |
| | 20.9 | % |
| Florida | 643,887 |
| | 13.2 | % | | 645,020 |
| | 13.8 | % |
| Virginia | 202,096 |
| | 4.1 | % | | 184,756 |
| | 4.0 | % |
| DC | 196,024 |
| | 4.0 | % | | 183,211 |
| | 4.0 | % |
| All others | 1,587,849 |
| | 32.4 | % | | 1,497,566 |
| | 32.1 | % |
| | $ | 4,897,552 |
| | 100.0 | % | | $ | 4,664,920 |
| | 100.0 | % |
Commercial loans and leases
The commercial portfolio segment includes loans secured by multi-family properties, loans secured by both owner-occupied and non-owner occupied commercial real estate, a limited amount of construction and land loans, commercial and industrial loans and direct financing leases.
Management’s loan origination strategy is heavily focused on the commercial portfolio segment, which comprised 80.1%76.9% and 81.6%77.7% of non-covered loans as of SeptemberJune 30, 20172019 and December 31, 2016,2018, respectively.
The following table shows the composition of the commercial loan portfolio held for investment at the dates indicated. Amounts include premiums, discounts and deferred fees and costs (in thousands):
|
| | | | | | | |
| | June 30, 2019 | | December 31, 2018 |
| Multi-family | $ | 2,383,116 |
| | $ | 2,585,421 |
|
| Non-owner occupied commercial real estate | 4,862,256 |
| | 4,611,573 |
|
| Construction and land | 220,536 |
| | 210,516 |
|
| Owner occupied commercial real estate | 1,966,004 |
| | 2,007,603 |
|
| Commercial and industrial | 4,531,948 |
| | 4,312,213 |
|
| National commercial lending platforms | | | |
| Pinnacle | 1,269,468 |
| | 1,462,655 |
|
| Bridge - franchise finance | 593,005 |
| | 517,305 |
|
| Bridge - equipment finance | 677,061 |
| | 636,838 |
|
| SBF | 256,274 |
| | 252,221 |
|
| Mortgage warehouse lending | 564,393 |
| | 431,674 |
|
| | $ | 17,324,061 |
| | $ | 17,028,019 |
|
Commercial real estate loans include term loans secured by owner and non-owner occupied income producing properties including rental apartments, mixed-use properties, industrial properties, retail shopping centers, free-standing single-tenant buildings, office buildings, warehouse facilities and hotels as well as real estate secured lines of credit.
The following charts present the distribution of non-owner occupied commercial real estate by product typestype at the dates indicated:
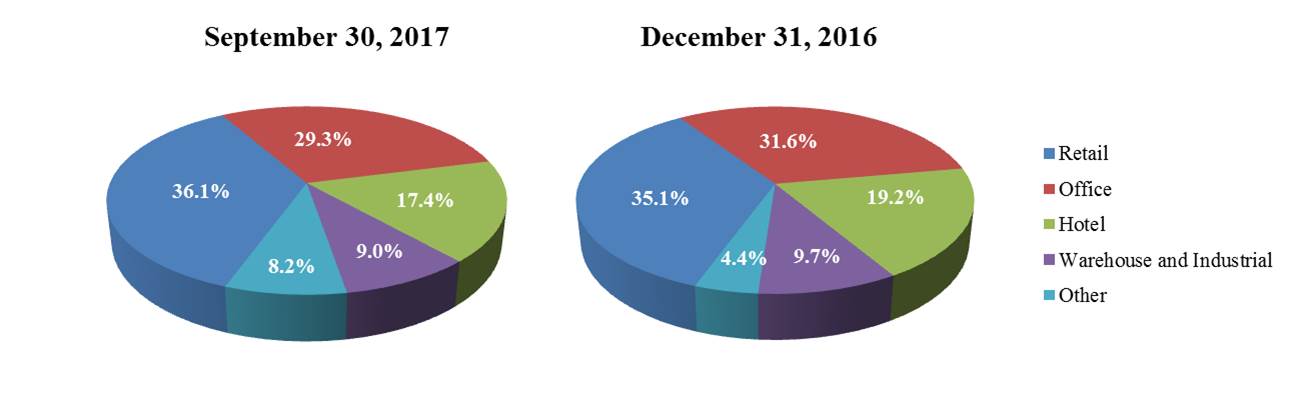
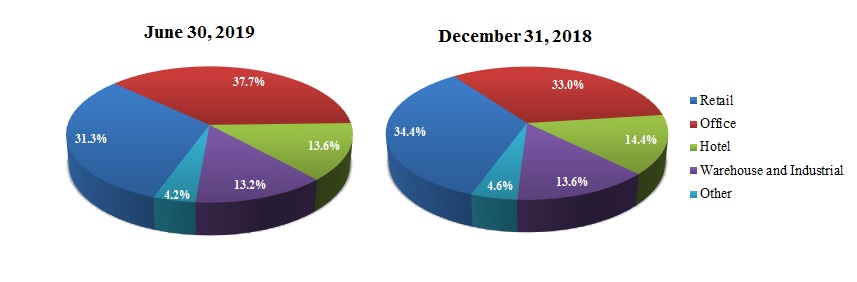
Loans secured byThe Company’s commercial real estate typically have shorter repayment periods and re-price more frequently than 1-4 single family residential loans but may have longer terms and re-price less frequently than commercial and industrial loans. The Company’s underwriting standards generally provide for loan terms of five to tenseven years, with amortization schedules of no more than thirty years. LTV ratios are typically limited to no more than 80%. Owner-occupied commercial real estate loans typically have risk profiles more closely aligned with that of commercial and industrial loans than with other types of commercial real estate loans. Construction and land loans represented only 1.3%1.1% of the total loan portfolio at SeptemberJune 30, 2017.2019. Construction and land loans are generally made for projects expected to stabilize within eighteen months of completion
in sub-markets with strong fundamentals and, to a lesser extent, for-sale residential projects to experienced developers with a strong cushion between market prices and loan basis.
The New York legislature recently enacted a number of rent regulation reform measures that generally have the impact of limiting landlords' ability to increase rents on stabilized units and to convert stabilized units to market rate units. The following tables present information about the Company's exposure to rent-regulated multi-family properties at June 30, 2019 (in thousands):
|
| | | |
| Loans to stabilized properties subject to rent regulation | $ | 1,364,261 |
|
| Loans to non-stabilized properties subject to rent regulation | 85,168 |
|
| | $ | 1,449,429 |
|
|
| | | | | |
| DSCR | | | |
| Less than 1.11 | | | $ | 163,690 |
|
| 1.11 - 1.24 | | | 387,445 |
|
| 1.25 - 1.50 | | | 556,078 |
|
| 1.51 or greater | | | 257,048 |
|
| | | | $ | 1,364,261 |
|
|
| | | | | |
| LTV | | | |
| Less than 50% | | | $ | 301,941 |
|
| 50% - 65% | | | 737,626 |
|
| 66% - 75% | | | 313,394 |
|
| More than 75% | | | 11,300 |
|
| | | | $ | 1,364,261 |
|
Commercial and industrial loans are typically made to small, and middle market and larger corporate businesses and include equipment loans, secured and unsecured working capital facilities, formula-based loans, trade finance, mortgage warehouse lines, taxi medallion loans, SBA product offerings and business acquisition finance credit facilities. These loans may be structured as term loans, typically with maturities of threefive to seven years, or revolving lines of credit which may have multi-year maturities. The Bank also provides financing to state and local governmental entities within its geographic footprint. Commercial loans includeincluded shared
national credits totaling $1.5$3.0 billion at SeptemberJune 30, 2017, typically2019, the majority of which are relationship based loans to borrowers in our geographic footprint.Florida and New York.
Through its commercial lending subsidiaries, Pinnacle and Bridge, the Bank provides equipment and franchise financing on a national basis using both loan and lease structures. Pinnacle provides essential use equipment financing to state and local governmental entities directly and through vendor programs and alliances. Pinnacle offers a full array of financing structures including equipment lease purchase agreements and direct (private placement) bond re-fundings and loan agreements. Bridge has two operating divisions. The franchise finance division offers franchise acquisition, expansion and equipment financing, typically to experienced operators in well-established concepts. The equipment finance division provides primarily transportation equipment financing through a variety of loan and lease structures. The Bank's SBF unit primarily originates SBA guaranteed commercial and commercial real estate loans, generally selling the guaranteed portion in the secondary market and retaining the unguaranteed portion in portfolio. The Bank engages in mortgage warehouse lending on a national basis.
The following table presents the recorded investment in loans and direct finance leases held for investment for each of our national commercial lending platforms atfive states with the dates indicated (in thousands):
|
| | | | | | | |
| | September 30, 2017 | | December 31, 2016 |
| Pinnacle | $ | 1,393,965 |
| | $ | 1,317,820 |
|
| Bridge - franchise finance | 421,821 |
| | 426,661 |
|
| Bridge - transportation equipment finance | 566,939 |
| | 545,713 |
|
| SBF | 235,433 |
| | 225,241 |
|
| Mortgage warehouse lending | 465,323 |
| | 322,305 |
|
| | $ | 3,083,481 |
| | $ | 2,837,740 |
|
The geographiclargest concentration of the commercial loans and direct financing leases in the national platforms is summarized as follows at the dates indicated. Amounts include premiums, discounts and deferred fees and costs (dollars in thousands):
| | | | September 30, 2017 | | December 31, 2016 | June 30, 2019 | | December 31, 2018 |
| California | | $ | 567,705 |
| | 16.9 | % | | $ | 498,842 |
| | 15.1 | % |
| Florida | $ | 593,307 |
| | 19.2 | % | | $ | 543,445 |
| | 19.2 | % | 473,198 |
| | 14.1 | % | | 595,843 |
| | 18.1 | % |
| California | 464,853 |
| | 15.1 | % | | 421,480 |
| | 14.9 | % | |
| Texas | | 150,330 |
| | 4.5 | % | | 150,878 |
| | 4.6 | % |
| Virginia | | 149,038 |
| | 4.4 | % | | 153,619 |
| | 4.7 | % |
| Arizona | 171,321 |
| | 5.6 | % | | 133,549 |
| | 4.7 | % | 144,850 |
| | 4.3 | % | | 149,087 |
| | 4.5 | % |
| Texas | 161,662 |
| | 5.2 | % | | 118,122 |
| | 4.2 | % | |
| Iowa | 152,869 |
| | 5.0 | % | | 161,874 |
| | 5.7 | % | |
| Virginia | 131,041 |
| | 4.2 | % | | 138,417 |
| | 4.9 | % | |
| All others (1) | 1,408,428 |
| | 45.7 | % | | 1,320,853 |
| | 46.4 | % | |
| All others | | 1,875,080 |
| | 55.8 | % | | 1,752,424 |
| | 53.0 | % |
| | $ | 3,083,481 |
| | 100.0 | % | | $ | 2,837,740 |
| | 100.0 | % | $ | 3,360,201 |
| | 100.0 | % | | $ | 3,300,693 |
| | 100.0 | % |
At June 30, 2019, 37.0% and 24.8% of commercial loans were originated within the Florida and New York portfolios, respectively. At December 31, 2018, 37.0% and 25.4% of commercial loans were originated within the Florida and New York portfolios, respectively.
| |
(1) | No other state represented borrowers with more than 4.0% of loans outstanding at September 30, 2017 or December 31, 2016. |
Equipment under Operating Lease
Equipment under operating lease increased by $48 million to $588totaled $708 million at SeptemberJune 30, 2017, from $540 million at December 31, 2016.2019. The portfolio consisted primarily of 5,424 railcars, non-commercial aircraft and other transport equipment. We have a total of 5,629 railcars with a carrying value of $441 million at June 30, 2019, including hoppers, tank cars, boxcars, auto carriers, center beams and gondolas leased to North American commercial end-users. The portfolio also included non-commercial aircraft and other transport equipment. The largest concentrations of rail cars were 2,2642,421 hopper cars and 1,6831,594 tank cars, primarily used to ship sand and petroleum products, respectively, for the energy industry. Equipment with a carrying value of $288$285 million at SeptemberJune 30, 20172019 was leased to companies for use in the energy industry.
The chart below presents equipment under operating lease by type at the dates indicated:
Asset Quality
In discussing asset quality, we distinguish between covered loans and non-covered loans. Although the risk profile of covered loans is higher than that of non-covered loans, our exposure to loss related to covered loans is significantly mitigated by the fair value basis recorded in these loans resulting from the application of acquisition accounting and by the Single Family Shared-Loss Agreement. At September 30, 2017, residential loans covered under the Single Family Shared-Loss Agreement totaled $538 million.Commercial Loans
We have established a robust credit risk management framework, put in place an experienced team to lead the workout and recovery process for the commercial and commercial real estate portfolios and implemented a dedicated internal credit review function. We have an experienced resolution team in place for covered residential mortgage loans, and have implemented outsourcing arrangements with industry leading firms in certain areas such as OREO resolution.
Loan performance is monitored by our credit administration and workout and recovery departments. Generally, commercial relationships with balances in excess of defined thresholds are re-evaluated at least annually and more frequently if circumstances indicate that a change in risk rating may be warranted. The defined thresholds range from $1 million to $3 million. Homogenous groups of smaller balance commercial loans may be monitored collectively. Additionally, commercial loans as well as underwriting and portfolio management practices are regularly reviewed by our internal credit review department. The Company utilizes a 13 grade internal asset risk classification system as part of its efforts to monitor and maintain commercial asset quality. Loans exhibiting potential credit weaknesses that deserve management’s close attention and, that if left uncorrected, may result in deterioration of the repayment capacity of the borrower are categorized as special mention. These borrowers may exhibit negative financial trends or erratic financial performance, strained liquidity, marginal collateral coverage, declining industry trends or weak management. Loans with well-defined credit weaknesses that may result in a loss if the deficiencies are not corrected are assigned a risk rating of substandard. These borrowers may exhibit payment defaults, inadequate cash flows, operating losses, increasing balance sheet leverage, project cost overruns, unreasonable construction delays, exhausted interest reserves, declining collateral values, frequent overdrafts or past due real estate taxes. Loans with weaknesses so severe that collection in full is highly questionable or improbable, but because of certain reasonably specific pending factors have not been charged off, are assigned an internal risk rating of doubtful.
Residential mortgage loans and consumer loans are not individually risk rated. Delinquency status is the primary measure we use to monitor the credit quality of these loans. We also consider original LTV and FICO score to be significant indicators of credit quality for the non-covered 1-4 single family residential portfolio.
Although our assessment is ongoing and the results of that assessment are subject to change in the future, we do not currently believe the ability of the substantial majority of our borrowers to repay their loans or the value of the collateral securing those loans has been materially impacted by Hurricanes Irma and Harvey.
Non-covered Loans and Leases
Commercial Loans
The ongoing asset quality of significant commercial loans is monitored on an individual basis through our regular credit review and risk rating process. We believe internal risk rating is the best indicator of the credit quality of commercial loans. Homogenous groups of smaller balance commercial loans may be monitored collectively.
The following table summarizes the Company's commercial credit exposure, based on internal risk rating, at the dates indicated (in thousands):
|
| | | | | | | | |
| | | September 30, 2017 | | December 31, 2016 |
| Pass | | $ | 15,505,587 |
| | $ | 14,897,121 |
|
| Special mention | | 150,899 |
| | 72,225 |
|
Substandard (1) | | 376,540 |
| | 304,713 |
|
| Doubtful | | 5,816 |
| | 11,518 |
|
| | | $ | 16,038,842 |
| | $ | 15,285,577 |
|
| |
(1) | The balance of substandard loans at September 30, 2017 and December 31, 2016 included $121 million and $138 million, respectively, of taxi medallion finance loans. Criticized and classified loans represented 3.3% of the commercial loan portfolio, of which 0.8% were taxi medallion loans, at September 30, 2017. See Note 4 to the consolidated financial statements for more detailed information about risk rating of commercial loans.
|
Taxi Medallion Finance
The commercial and industrial loan portfolio includes exposure to taxi medallion finance of $121 million at September 30, 2017. The estimated value of underlying taxi medallion collateral and liquidity in the market for sales of medallions, a potential secondary source of repayment, have declined significantly in recent years due to competitive developments in the transportation-for-hire industry. Due to the ongoing trend of declining estimated cash flows from the operation of taxi medallions leading to declines in medallion valuations, the entire taxi medallion portfolio was placed on non-accrual status and risk rated substandard as of September 30, 2017. In addition, partial charge-offs were recognized on all taxi medallion loans with carrying values in excess of collateral values, determined using the cash flow template discussed below, to reduce the carrying value of those loans to this estimated collateral value.
We update our analysis of the cash flow generating capacity of the operation of New York City medallions on a regular basis using current available taxi industry data from which taxi medallion values and prospective debt service capacity are estimated. This analysis is based on an extensive data set obtained from the NYTLC and assumptions that we believe are reasonable estimates of fleet utilization and borrower expenses. We update our analysis of estimated medallion valuations on a quarterly basis, based on these cash flow capacity estimates. At September 30, 2017, our estimate of the value of New York City taxi medallions based on our cash flow template and consideration of estimated selling costs and declining trends in medallion values was $351,000 for both corporate and individual medallions. We used this value for purposes of determining the partial charge-offs and the value of repossessed medallions. See Note 10 to the consolidated financial statements for additional information about the valuation of New York City taxi medallions.
The taxi medallion portfolio had the following characteristics at September 30, 2017:
Approximately 97% of the portfolio secured directly by taxi medallions was concentrated in New York City.
Loans delinquent by 30 days or more totaled $13.2 million or 11.0% of the portfolio, compared to $40.8 million or 22.8% of the portfolio at December 31, 2016. Loans delinquent by 90 days or more totaled $10.4 million or 8.7% of the portfolio, compared to $29.2 million or 16.4% of the portfolio at December 31, 2016. The most significant factor contributing to the decrease in delinquencies was one large relationship that was brought current and restructured in the first quarter.
The portfolio included 173 loans modified in TDRs with a recorded investment of $92.4 million.
In the aggregate, the ALLL related to taxi medallion loans was 10.9% of the outstanding balance at September 30, 2017, compared to 6.0% at December 31, 2016. Charge-offs of $35.3 million and $47.1 million were recognized in the three and nine months ended September 30, 2017 related to taxi medallion loans.
We are no longer originating new taxi medallion loans. Our portfolio management strategies include, but are not limited to, working with borrowers experiencing cash flow challenges to provide short term relief and/or extended amortization periods, pro-actively attempting to refinance loans prior to maturity, continuing to monitor industry data and obtaining updated borrower and guarantor financial information. As taxi medallion loans approach maturity or are refinanced, we expect the number and amount of TDRs in this portfolio segment to continue to increase.
Hurricane Impact - Commercial Loans
Commercial loans totaling $1.9 million and $19.4 million had been modified or granted temporary payment deferrals as of September 30, 2017 and October 31, 2017, respectively, related to the recent hurricanes. Of these modifications and deferrals, none were determined to be TDRs due to the generally insignificant nature of the payment delays.
As of September 30 and October 31, 2017, respectively, commercial loans to borrowers that have significant business operations in or are secured by collateral in areas impacted by Hurricanes Irma and Harvey totaling approximately $4.7 million and $21.3 million were more than 30 days past due; $3.7 million of these loans were more than 30 days past due prior to the storms. Approximately $22.2 million of commercial loans have been downgraded to criticized or classified status through October 31, 2017 as a result of the impact of the storms.
|
| | | | | | | | | | | | | |
| | June 30, 2019 | | December 31, 2018 |
| | Balance | | Percent of Total | | Balance | | Percent of Total |
| Pass | $ | 16,956,966 |
| | 97.9 | % | | $ | 16,728,534 |
| | 98.2 | % |
| Special mention | 59,787 |
| | 0.3 | % | | 81,070 |
| | 0.5 | % |
| Substandard | 300,760 |
| | 1.7 | % | | 210,026 |
| | 1.2 | % |
| Doubtful | 6,548 |
| | 0.1 | % | | 8,389 |
| | 0.1 | % |
| | $ | 17,324,061 |
| | 100.0 | % | | $ | 17,028,019 |
| | 100.0 | % |
Equipment Under Operating Lease
FourThree operating lease relationships with a carrying value of assets under lease with a carrying value totaling $81$72 million, of which $75$67 million were exposures to the energy industry, were internally risk rated special mention or substandard at SeptemberJune 30, 2017. The present value of remaining lease payments on these leases totaled approximately $22 million at September 30, 2017, of which $17 million were exposures to the energy industry. There have been no missed payments related to the operating lease portfolio to date.2019. One relationship hashad been restructured to date, with no decrease in total minimum lease payments.as of June 30, 2019.
The primary risks inherent in the equipment leasing business are asset risk resulting from ownership of the equipment on operating lease and credit risk. Asset risk arises from fluctuations in supply and demand for the underlying leased equipment. Railcars are long-lived equipment with useful lives of approximately 35-50 years. The equipment is leased to commercial end-users with original lease terms generally ranging from 3-9three to ten years at SeptemberJune 30, 2017.2019. We are exposed to the risk that, at the end of the lease term, the value of the asset will be lower than expected, potentially resulting in reduced future lease income over the remaining life of the asset or a lower sale value. Asset risk may also lead to changes in depreciation as a result of changes in the residual values of the operating lease assets or through impairment of asset carrying values.
Asset risk is evaluated and managed by a dedicated internal staff of asset managers, managed by seasoned equipment finance professionals with a broad depth and breadth of experience in the leasing business. Additionally, we have partnered with an industry leading, experienced service provider who provides fleet management and servicing relating to the railcar fleet, including lease administration and reporting, a Regulation Y compliant full service maintenance program and railcar re-marketing. Risk is managed by setting appropriate residual values at inception and systematic reviews of residual values based on independent appraisals, performed at least annually. Additionally, our internal management team and our external service provider closely follow the rail markets, monitoring traffic flows, supply and demand trends and the impact of new technologies and regulatory requirements. Demand for railcars is sensitive to shifts in general and industry specific economic and market trends and shifts in trade flows from specific events such as natural or man-made disasters. We seek to mitigate these risks by leasing to a stable end-user base, by maintaining a relatively young and diversified fleet of assets that are expected to maintain stronger and more stable utilization rates despite impacts from unexpected events or cyclical trends and
by staggering lease maturities. We regularly monitor the impact of lower oil prices on the estimated residual value of rail cars being used in the petroleum/natural gas extraction sector.
Credit risk in the leased equipment portfolio results from the potential default of lessees, possibly driven by obligor specific or industry-wide conditions, and is economically less significant than asset risk, because in the operating lease business, there is no extension of credit to the obligor. Instead, the lessor deploys a portion of the useful life of the asset. Credit losses, if any, will manifest through reduced rental income due to missed payments, time off lease, or lower rental payments due either to a restructuring or re-leasing of the asset to another obligor. Credit risk in the operating lease portfolio is managed and monitored utilizing credit administration infrastructure, processes and procedures similar to those used to manage and monitor credit risk in the commercial loan portfolio. We also mitigate credit risk in this portfolio by leasing only to high credit quality obligors.
We expect our operating lease portfolio to continue to grow, and we may expand into other asset classes.
Based on our initial analysis of the location and condition of equipment under operating lease, we do not currently believe there has been any significant damage to such equipment or to the ongoing operations of lessees from Hurricanes Irma and Harvey.
Residential and Other Consumer Loans
The majority of our non-covered residential mortgage portfolio consists of loans purchased through established correspondent channels. In general, we purchaseMost of our purchases are of performing jumbo mortgage loans which have FICO scores above 700, primarily are owner-occupied and full documentation, and have a current LTV of 80% or less although loans with LTVs higher than 80% may be extended to selected credit-worthy borrowers. We perform due diligence on the purchased loans for credit, compliance, counterparty, payment history and property valuation.
We have a dedicated residential credit risk management function, and the residential portfolio is monitored by our internal credit review function. Residential mortgage loans and consumer loans are not individually risk rated. Delinquency status is the primary measure we use to monitor the credit quality of these loans. We also consider original LTV and FICO score to be significant indicators of credit quality for the 1-4 single family residential portfolio, excluding FSB loans and government insured residential loans.
The following tables show the distribution of non-covered 1-4 single family residential loans, excluding FSB loans and government insured residential loans, by original FICO and LTV as of the dates indicated:
| | | | | September 30, 2017 | | June 30, 2019 |
| | | FICO | | FICO |
| LTV | | 720 or less | | 721 - 740 | | 741 - 760 | | 761 or
greater | | Total | | 720 or less | | 721 - 740 | | 741 - 760 | | 761 or
greater | | Total |
| 60% or less | | 2.4 | % | | 2.8 | % | | 4.6 | % | | 20.4 | % | | 30.2 | % | |
| Less than 60% | | | 2.3 | % | | 2.6 | % | | 4.0 | % | | 16.9 | % | | 25.8 | % |
| 60% - 70% | | 2.3 | % | | 2.6 | % | | 3.5 | % | | 14.6 | % | | 23.0 | % | | 3.0 | % | | 2.6 | % | | 3.8 | % | | 13.3 | % | | 22.7 | % |
| 70% - 80% | | 3.5 | % | | 4.4 | % | | 7.9 | % | | 27.2 | % | | 43.0 | % | | 3.9 | % | | 4.7 | % | | 8.5 | % | | 29.2 | % | | 46.3 | % |
| More than 80% | | 0.6 | % | | 0.5 | % | | 0.6 | % | | 2.1 | % | | 3.8 | % | | 0.5 | % | | 0.8 | % | | 0.8 | % | | 3.1 | % | | 5.2 | % |
| | | 8.8 | % | | 10.3 | % | | 16.6 | % | | 64.3 | % | | 100.0 | % | | 9.7 | % | | 10.7 | % | | 17.1 | % | | 62.5 | % | | 100.0 | % |
| | | | | December 31, 2016 | | December 31, 2018 |
| | | FICO | | FICO |
| LTV | | 720 or less | | 721 - 740 | | 741 - 760 | | 761 or
greater | | Total | | 720 or less | | 721 - 740 | | 741 - 760 | | 761 or
greater | | Total |
| 60% or less | | 2.5 | % | | 3.2 | % | | 4.7 | % | | 21.7 | % | | 32.1 | % | |
| Less than 60% | | | 2.4 | % | | 2.8 | % | | 4.4 | % | | 18.2 | % | | 27.8 | % |
| 60% - 70% | | 2.3 | % | | 2.7 | % | | 3.6 | % | | 15.1 | % | | 23.7 | % | | 2.7 | % | | 2.4 | % | | 3.8 | % | | 13.4 | % | | 22.3 | % |
| 70% - 80% | | 3.2 | % | | 4.3 | % | | 8.0 | % | | 26.1 | % | | 41.6 | % | | 3.5 | % | | 4.6 | % | | 8.4 | % | | 28.3 | % | | 44.8 | % |
| More than 80% | | 0.7 | % | | 0.3 | % | | 0.4 | % | | 1.2 | % | | 2.6 | % | | 0.4 | % | | 0.8 | % | | 0.8 | % | | 3.1 | % | | 5.1 | % |
| | | 8.7 | % | | 10.5 | % | | 16.7 | % | | 64.1 | % | | 100.0 | % | | 9.0 | % | | 10.6 | % | | 17.4 | % | | 63.0 | % | | 100.0 | % |
At SeptemberJune 30, 2017,2019, the non-covered 1-4 single family residential loan portfolio, excluding FSB loans and government insured residential loans, had the following characteristics: substantially all were full documentation with a weighted-average FICO score of 765763 and a weighted-average LTV of 66.6%68.2%. The majority of this portfolio was owner-occupied, with 87.9%84.7% primary residence, 8.3%7.3% second homes and 3.8%8.0% investment properties. In terms of vintage, 22.2%42.1% of the portfolio was originated pre-2014, 13.1%pre-2016, 18.2% in 2014, 22.2%2016, 20.4% in 2015, 26.0%2017, 14.5% in 20162018 and 16.5%4.8% in 2017.2019.
Non-covered
1-4 single family residential loans, excluding government insured residential loans, past due more than 30 days totaled $17.1$62.3 million and $12.7$23.5 million at SeptemberJune 30, 20172019 and December 31, 2016,2018, respectively. The increase in loans past due more than 30 days is procedural, attributable to the transfer of the servicing of the residential loan portfolio during the first quarter of 2019. Delinquency levels have started to normalize subsequent to quarter-end. The amount of these loans 90 days or more past due was $2.7$10.1 million and $2.1$7.0 million at SeptemberJune 30, 20172019 and December 31, 2016,2018, respectively.
Hurricane Impact- Residential loans
The following table presents information related to 1-4 single family residential mortgages with borrowers and/or collateral located in areas impacted by Hurricanes Irma and Harvey, at the dates indicated (in thousands):
|
| | | | | | | |
| | September 30, 2017 | | October 31, 2017 |
| Past due more than 30 days: | | | |
| Covered loans | $ | 14,669 |
| | $ | 13,454 |
|
| Total | $ | 20,099 |
| | $ | 21,350 |
|
| Granted temporary payment deferrals: | | | |
| Covered loans | $ | 14,807 |
| | $ | 16,983 |
|
| Total | $ | 24,772 |
| | $ | 25,969 |
|
Other Consumer Loans
Substantially all other consumer loans were current at SeptemberJune 30, 2017. At2019 and December 31, 2016, there were no delinquent consumer loans.
Covered Loans
At September 30, 2017, residential ACI loans totaled $476 million and residential non-ACI loans totaled $62 million, including premiums, discounts and deferred fees and costs. All of these loans are covered under the Single Family Shared-Loss Agreement.
Covered residential loans were placed into homogenous pools at the time of the FSB Acquisition and the ongoing credit quality and performance of these loans is monitored on a pool basis. We monitor the pools quarterly to determine whether any changes have occurred in expected cash flows that would be indicative of impairment or necessitate reclassification between non-accretable difference and accretable yield. At September 30, 2017, accretable yield on residential ACI loans totaled $511 million and non-accretable difference related to those loans totaled $227 million.
At September 30, 2017, the recorded investment in non-ACI 1-4 single family residential loans was $24.6 million; $1.6 million or 6.6% of these loans were 30 days or more past due and $0.9 million or 3.8% of these loans were 90 days or more past due. At September 30, 2017, the recorded investment in ACI 1-4 single family residential loans totaled $470.3 million; $34.2 million or 7.3% of these loans were delinquent by 30 days or more and $17.6 million or 3.7% were delinquent by 90 days or more.
At September 30, 2017, non-ACI home equity loans and lines of credit had an aggregate recorded investment of $37.4 million; $4.1 million or 11.1% of these loans were 30 days or more past due and $2.4 million or 6.3% were 90 days or more past due. ACI home equity loans and lines of credit had a carrying amount of $5.6 million at September 30, 2017; 13.5% of these loans were delinquent by 30 days or more.
Home equity lines of credit generally provide that payment terms be reset after an initial contractual period of interest only payments, requiring the pay down of principal through balloon payments or amortization. Additional information regarding ACI and non-ACI home equity lines of credit at September 30, 2017 is summarized as follows:
|
| | | | | |
| | ACI | | Non-ACI |
| Loans resetting from interest only: | |
| | |
|
| Previously reset | 72.3 | % | | 51.5 | % |
| Scheduled to reset within 12 months | 2.5 | % | | 5.5 | % |
| Scheduled to reset after 12 months | 25.2 | % | | 43.0 | % |
| | 100.0 | % | | 100.0 | % |
| Lien position: | |
| | |
|
| First liens | 10.3 | % | | 18.8 | % |
| Second or third liens | 89.7 | % | | 81.2 | % |
| | 100.0 | % | | 100.0 | % |
The Company's exposure to loss related to covered loans is significantly mitigated by the Single Family Shared-Loss Agreement and by the fair value basis recorded in these assets resulting from the application of acquisition accounting. Management regularly evaluates the impact of resets of interest only loans on default rates for the covered home equity portfolio.2018.
Impaired Loans and Non-Performing Assets
Non-performing assets generally consist of (i) non-accrual loans, including loans that have been modified in TDRs and placed on non-accrual status, (ii) accruing loans that are more than 90 days contractually past due as to interest or principal, excluding ACI loans and government insured residential loans, and (iii) OREO and repossessed assets. Impaired loans also typically include loans modified in TDRs that are accruing and ACI loans or pools for which expected cash flows at acquisition (as adjusted for any additional cash flows expected to be collected arising from changes in estimates after acquisition) have been revised downward since acquisition, other than due to changes in interest rate indices and prepayment assumptions.
The following tables summarizetable summarizes the Company's impaired loans and non-performing assets at the dates indicated (dollars in thousands):
| | | | September 30, 2017 | | December 31, 2016 | | | | | |
| | Covered
Assets | | Non-Covered
Assets | | Total | | Covered Assets | | Non-Covered Assets | | Total | June 30, 2019 | | December 31, 2018 |
| Non-accrual loans | | | | | | | | | | | | | | |
| Residential and other consumer: | | | | | | | | | | | | | | |
| 1 - 4 single family residential | $ | 934 |
| | $ | 1,890 |
| | $ | 2,824 |
| | $ | 918 |
| | $ | 566 |
| | $ | 1,484 |
| |
| 1-4 single family residential | | $ | 10,807 |
| | $ | 6,316 |
|
| Home equity loans and lines of credit | 2,369 |
| | — |
| | 2,369 |
| | 2,283 |
| | — |
| | 2,283 |
| 30 |
| | — |
|
| Other consumer loans | — |
| | 332 |
| | 332 |
| | — |
| | 2 |
| | 2 |
| 277 |
| | 288 |
|
| Total residential and other consumer loans | 3,303 |
| | 2,222 |
| | 5,525 |
| | 3,201 |
| | 568 |
| | 3,769 |
| 11,114 |
| | 6,604 |
|
| Commercial: | | | | | | | | | | | | | | |
| Multi-family | | 24,834 |
| | 25,560 |
|
| Non-owner occupied commercial real estate | — |
| | 9,930 |
| | 9,930 |
| | — |
| | 559 |
| | 559 |
| 27,623 |
| | 16,050 |
|
| Construction and land | — |
| | 1,238 |
| | 1,238 |
| | — |
| | 1,238 |
| | 1,238 |
| 9,418 |
| | 9,923 |
|
| Owner occupied commercial real estate | — |
| | 21,455 |
| | 21,455 |
| | — |
| | 19,439 |
| | 19,439 |
| 21,752 |
| | 19,789 |
|
| Commercial and industrial | | | | | | | | | | |
|
| 27,176 |
| | 28,584 |
|
| Taxi medallion loans | — |
| | 120,572 |
| | 120,572 |
| | — |
| | 60,660 |
| | 60,660 |
| |
| Other commercial and industrial | — |
| | 27,569 |
| | 27,569 |
| | — |
| | 16,036 |
| | 16,036 |
| |
| Commercial lending subsidiaries | — |
| | 16,625 |
| | 16,625 |
| | — |
| | 32,645 |
| | 32,645 |
| 16,236 |
| | 22,733 |
|
| Total commercial loans | — |
| | 197,389 |
| | 197,389 |
| | — |
| | 130,577 |
| | 130,577 |
| 127,039 |
| | 122,639 |
|
| Total non-accrual loans | 3,303 |
| | 199,611 |
| | 202,914 |
| | 3,201 |
| | 131,145 |
| | 134,346 |
| 138,153 |
| | 129,243 |
|
| Non-ACI and new loans past due 90 days and still accruing | — |
| | 846 |
| | 846 |
| | — |
| | 1,551 |
| | 1,551 |
| |
| Loans past due 90 days and still accruing | | — |
| | 650 |
|
| Total non-performing loans | 3,303 |
| | 200,457 |
| | 203,760 |
| | 3,201 |
| | 132,696 |
| | 135,897 |
| 138,153 |
| | 129,893 |
|
| OREO | 4,114 |
| | 1,661 |
| | 5,775 |
| | 4,658 |
| | 4,882 |
| | 9,540 |
| |
| Repossessed assets | — |
| | 2,457 |
| | 2,457 |
| | — |
| | 3,551 |
| | 3,551 |
| |
| OREO and repossessed assets | | 10,042 |
| | 9,517 |
|
| Total non-performing assets | 7,417 |
| | 204,575 |
| | 211,992 |
| | 7,859 |
| | 141,129 |
| | 148,988 |
| 148,195 |
| | 139,410 |
|
| Impaired ACI loans and pools on accrual status | 5,640 |
| | — |
| | 5,640 |
| | — |
| | 1,335 |
| | 1,335 |
| |
| Performing TDRs | | | | | | | | | | |
|
| 31,303 |
| | 7,898 |
|
| Taxi medallion loans | — |
| | — |
| | — |
| | — |
| | 36,848 |
| | 36,848 |
| |
| Other | 10,786 |
| | 19,365 |
| | 30,151 |
| | 11,166 |
| | 26,282 |
| | 37,448 |
| |
| Total impaired loans and non-performing assets | $ | 23,843 |
| | $ | 223,940 |
| | $ | 247,783 |
| | $ | 19,025 |
| | $ | 205,594 |
| | $ | 224,619 |
| $ | 179,498 |
| | $ | 147,308 |
|
| | | | | | | | | | | | | | | |
Non-performing loans to total loans (1) (3) | | | 1.00 | % | | 0.99 | % | | | | 0.71 | % | | 0.70 | % | |
Non-performing assets to total assets (2) | | | 0.69 | % | | 0.72 | % | | | | 0.51 | % | | 0.53 | % | |
Non-performing loans to total loans (1)(4) | | 0.61 | % | | 0.59 | % |
Non-performing assets to total assets (4) | | 0.45 | % | | 0.43 | % |
ALLL to total loans (1) | | | 0.77 | % | | 0.77 | % | | | | 0.80 | % | | 0.79 | % | 0.50 | % | | 0.50 | % |
| ALLL to non-performing loans | | | 76.69 | % | | 77.82 | % | | | | 113.68 | % | | 112.55 | % | 81.17 | % | | 84.63 | % |
Net charge-offs to average loans (4) (5) | | | 0.40 | % | | 0.39 | % | | | | 0.13 | % | | 0.13 | % | |
Net charge-offs to average loans(2)(3) | | 0.05 | % | | 0.28 | % |
| | | | | | | | | | | | | | | |
| |
| (1) | Total loans for purposes of calculating these ratios include premiums, discounts and deferred fees and costs. |
| |
| (2) | RatioAnnualized for non-covered assets is calculated as non-performing non-covered assets to total assets.June 30, 2019. |
| |
| (3) | Non-performing taxi medallion loans comprised 0.60% and 0.32% of total non-covered loans at September 30, 2017 and December 31, 2016, respectively. |
| |
(4) | Annualized for September 30, 2017. |
| |
(5) | The annualized ratio of charge-offs of taxi medallion loans to average non-coveredtotal loans was 0.33% and 0.06%0.18% for the nine months ended September 30, 2017 and the year ended December 31, 2016.2018. |
The increases in the non-performing loans to total loans and non-performing assets to total assets ratios at September 30, 2017 compared to December 31, 2016 were primarily attributable to the increase in non-accrual taxi medallion loans. The decrease in the ALLL to non-performing loans ratio at September 30, 2017 compared to December 31, 2016 was primarily attributable to increased charge-offs of taxi medallion loans during the three months ended September 30, 2017.
| |
| (4) | Non-performing loans and assets include the guaranteed portion of non-accrual SBA loans totaling $28.4 million or 0.13% of total loans and 0.09% of total assets, at June 30, 2019; compared to $17.8 million or 0.08% of total loans and 0.06% of total assets, at December 31, 2018. |
Contractually delinquent ACI loans with remaining accretable yield are not reflected as non-accrual loans and are not considered to be non-performing assets because accretion continues to be recorded in income. Accretion continues to be recorded as long as there is an expectation of future cash flows in excess of carrying amount from these loans. The carrying value of ACI loans contractually delinquent by more than 90 days but on which income was still being recognized was $18 million and $16 millionimmaterial at SeptemberJune 30, 20172019 and December 31, 2016,2018. Contractually delinquent government insured residential loans are excluded from non-performing loans as defined in the table above. The carrying value of such loans contractually delinquent by more than 90 days was $287 million and $218 million at June 30, 2019 and December 31, 2018, respectively.
New commercialCommercial loans, other than ACI loans, are placed on non-accrual status when (i) management has determined that full repayment of all contractual principal and interest is in doubt, or (ii) the loan is past due 90 days or more as to principal or interest unless the loan is well secured and in the process of collection. NewResidential and non-ACI residentialconsumer loans, other than ACI loans and consumergovernment insured pool buyout loans, are generally placed on non-accrual status when 90 days of interest is due and unpaid. When a loan is placed on non-accrual status, uncollected interest accrued is reversed and charged to interest income. Commercial loans are returned to accrual status only after all past due principal and interest has been collected and full repayment of remaining contractual principal and interest is reasonably assured. Residential loans are generally returned to accrual status when less than 90 days of interest is due and unpaid. Past due status of loans is determined based on the contractual next payment due date. Loans less than 30 days past due are reported as current.
A loan modification is considered a TDR if the Company, for economic or legal reasons related to the borrower’s financial difficulties, grants a concession to the borrower that the Company would not otherwise grant. These concessions may take the form of temporarily or permanently reduced interest rates, payment abatement periods, restructuring of payment terms, extensions of maturity at below market terms, or in some cases, partial forgiveness of principal. Under GAAP, modified ACI loans accounted for in pools are not accounted for as TDRs and are not separated from their respective pools when modified. Included in TDRs are residential loans to borrowers who have not reaffirmed their debt discharged in Chapter 7 bankruptcy.
The following table summarizes loans that have been modified in TDRs at SeptemberJune 30, 20172019 (dollars in thousands):
|
| | | | | | | | | | | |
| | | Number of TDRs | | Recorded Investment | | Related Specific Allowance |
| Residential and other consumer: | | | | | | |
| Covered | | 59 |
| | $ | 11,721 |
| | $ | 1,024 |
|
| Non-covered | | 9 |
| | 912 |
| | 71 |
|
| Commercial: | | | | | | |
| Taxi medallion loans | | 173 |
| | 92,370 |
| | 10,505 |
|
| Other | | 30 |
| | 72,702 |
| | 10,581 |
|
| | | 271 |
| | $ | 177,705 |
| | $ | 22,181 |
|
|
| | | | | | | | | | |
| | Number of TDRs | | Recorded Investment | | Related Specific Allowance |
| Residential and other consumer | 90 |
| | $ | 14,572 |
| | $ | 15 |
|
| Commercial | 29 |
| | 65,472 |
| | 4,075 |
|
| | 119 |
| | $ | 80,044 |
| | $ | 4,090 |
|
See Note 4 to the Consolidated Financial Statements for additional information about TDRs.
Potential Problem Loans
Potential problem loans have been identified by management as those commercial loans included in the "substandard accruing" risk rating category. These loans are typically performing, but possess specifically identified credit weaknesses that, if not remedied, may lead to a downgrade to non-accrual status and identification as impaired in the near-term. Substandard accruing commercial loans totaled $185$180 million and $96 million at SeptemberJune 30, 2017,2019 and December 31, 2018, respectively, substantially all of which were current as to principal and interestinterest. Management closely monitors each of these loans as well as indicators of potential negative trends developing within any particular portfolio segment. The increase in substandard accruing loans at SeptemberJune 30, 2017.2019 compared to December 31, 2018 does not appear to be concentrated in any one business line, geography, product type or asset class. Management has not identified any specific trends or correlated risk characteristics associated with these downgrades.
Loss Mitigation Strategies
Criticized or classified commercial loans in excess of certain thresholds are reviewed quarterly by the Criticized Asset Committee, which determinesevaluates the appropriate strategy for collection to mitigate the amount of credit losses. Criticized asset reports for each relationship are presented by the assigned relationship manager and credit officer to the Criticized Asset Committee until such time as the relationships are returned to a satisfactory credit risk rating or otherwise resolved. The Criticized Asset Committee may require the transfer of a loan to our workout and recovery department, which is tasked to effectively manage the loan with the goal of minimizing losses and expenses associated with restructure, collection and/or liquidation of collateral. Commercial loans with a risk rating of substandard; impaired loans on non-accrual status; loans modified as TDRs; taxi medallion loans; or assets classified as OREO or repossessed assets are usually transferred to workout and recovery. Oversight of the workout and recovery department is provided by the Asset Recovery Committee.
WeOur servicers evaluate each residential loan in default to determine the most effective loss mitigation strategy, which may be modification, short sale, or foreclosure. Throughforeclosure, and pursue the program's expiration on December 31, 2016, we offered loan modifications under the HAMP program to eligible borrowers in the residential portfolio. HAMP is a uniform loan modification process that provides eligible borrowers with sustainable monthly mortgage payments equal to a target 31% of their gross monthly income. We began offering a new modification program in late 2016 modeled after the FNMA standard modification program.
In additionalternative most suitable to the modification programs discussed above, we offer a proprietary Subordinate Lien Modification Program for home equity loansconsumer and lines of credit. This provides BankUnitedto mitigate losses to the ability to offer a modification on loans covered under the Single Family Shared-Loss Agreement that are subordinate to either a BankUnited first lien or a first lien from another lender.bank.
Analysis of the Allowance for Loan and Lease Losses
The ALLL relates to (i) new loans, (ii) estimated additional losses arising on non-ACI loans subsequent to the FSB Acquisition, and (iii) impairment recognized as a result of decreases in expected cash flows on ACI loans due to further credit deterioration. The impact of any additional provision for losses on covered loans is significantly mitigated by an increase in the FDIC indemnification asset. The determination of the amount of the ALLL is, by nature, highly complex and subjective. Future events that are inherently uncertain could result in material changes to the level of the ALLL. General economic conditions including but not limited to unemployment rates, the level of business investment and growth, real estate values, vacancy rates and rental rates in our primary market areas, the level of interest rates, and a variety of other factors that affect the ability of borrowers’ businesses to generate cash flows sufficient to service their debts will impact the future performance of the portfolio.
New and non-ACILoans
Residential and other consumer
DueAdoption of the CECL model in the first quarter of 2020 will result in significant changes to the lack of similarity betweenmethodology employed to determine the risk characteristics of new loans and covered loans in the residential and home equity portfolios, management does not believe it is appropriate to use the historical performance of the covered residential mortgage portfolio as a basis for calculating the ALLL applicable to new loans. The new loan portfolio has not yet developed an observable loss trend. Therefore, the ALLL for new residential loans is based primarily on relevant proxy historical loss rates. The ALLL for new 1-4 single family residential loans is estimated using average annual loss rates on prime residential mortgage securitizations issued between 2003 and 2008 as a proxy. Based on the comparability of FICO scores and LTV ratios between loans included in those securitizations and loans in the Bank’s portfolio and the geographic diversity in the new purchased residential portfolio, we determined that prime residential mortgage securitizations provide an appropriate proxy for incurred losses in this portfolio class. A peer group 16-quarter average net charge-off rate is used to estimate the ALLL for the new home equity and other consumer loan classes. See further discussion of the use of peer group loss factors below. The new home equity and other consumer loan portfolios are not significant components of the overall loan portfolio.
Based on an analysis of historical performance, OREO and short sale losses, recent trending data and other internal and external factors, we have concluded that historical performance by portfolio class is the best indicator of incurred loss for the non-ACI 1-4 single family residential and home equity portfolio classes. For each of these portfolio classes, a quarterly roll rate matrix is calculated by delinquency bucket to measure the rate at which loans move from one delinquency bucket to the next during a given quarter. An average 16-quarter roll rate matrix is used to estimate the amount within each delinquency bucket expected to roll to 120+ days delinquent. We assume no cure for those loans that are currently 120+ days delinquent. Loss severity given default is estimated based on internal data about OREO sales and short sales from the portfolio. The ALLL calculation incorporates a 100% loss severity assumption for home equity loans that are projected to roll to default. For non-ACI residential loans, the allowance is initially calculated based on UPB. The total of UPB less the calculated allowance is then compared to the carrying amount of the loans, net of unamortized credit related fair value adjustments established at acquisition. IfALLL, and may materially impact the calculated balance netamount of the allowance is less than the carrying amount, an additional allowance is established. Any increase or decreaseALLL recorded in the allowance for non-ACI residential loans will result in a corresponding increase or decrease in the FDIC indemnification asset. consolidated financial statements.
Commercial loans
The allowance is comprised of specific reserves for loans that are individually evaluated and determined to be impaired as well as general reserves for loans that have not been identified as impaired.
Commercial relationships graded substandard or doubtful and on non-accrual status with committed credit facilities greater than or equal to $1.0 million, as well as loans modified in TDRs, are individually evaluated for impairment. Other commercial
relationships on non-accrual status with committed balances under $1.0 million may also be evaluated individually for impairment, at management's discretion. For loans evaluated individually for impairment and determined to be impaired, a specific allowance is established based on the present value of expected cash flows discounted at the loan’s effective interest rate, the estimated fair value of the loan, or the estimated fair value of collateral less costs to sell. We recognized partial charge-offs at September 30, 2017 on taxi medallion loans all of which are risk-rated substandard and on non-accrual status, as necessary to reduce the carrying value of the loans to our estimate of the value of New York City taxi medallions based on our cash flow template. Additionally, a specific allowance was recognized equal to the amount by which each loan exceeded 85% of the estimated value, in recognition of the continued declining trend in cash flows and lower prices observed on certain recent taxi medallion transfers. The amount of this specific allowance was determined based on management's judgment.
We believe that loans rated special mention, substandard or doubtful that are not individually evaluated for impairment exhibit characteristics indicative of a heightened level of credit risk. We apply a quantitative loss factor for loans rated special mention based on average annual probability of default and implied severity, derived from internal and external data. Loss factors for substandard and doubtful loans that are not individually evaluated are determined by using default frequency and severity information applied at the loan level. Estimated default frequencies and severities are based on available industry and internal data. In addition, we apply a floor to these calculated loss factors, based on the loss factor applied to the special mention portfolio.
SinceTo the majorityextent, in management's judgment, commercial portfolio segments have sufficient observable loss history, the quantitative portion of the newALLL is based on the Bank's historical net charge-off rates. These commercial loansegments include owner-occupied commercial real estate loans, commercial and industrial loans and the Bridge portfolios. For commercial portfolio issegments that have not yet seasoned enough to exhibit aexhibited an observable loss trend, the quantitative loss factors for a majority of pass rated new commercial loans isare based on peer group average annual historical net charge-off rates by loan class and the Company’s internal credit risk rating system. Beginning in the first quarter of 2017, we revised the source ofThese commercial segments include multifamily, non-owner occupied commercial real estate and construction and land loans. For Pinnacle, quantitative loss factors for certain loans, as follows:
Given the emergence of observable loss trends, the quantitative loss factors for the taxi medallion and Bridge portfolios are based primarily on historical municipal default data. For most commercial portfolio segments, we use a 20 quarter look-back period in the Company’s averagecalculation of historical net charge-off rates. Beginning in
Where applicable, the third quarter of 2017, all taxi medallion loans are individually evaluated for impairment as described above.
The general quantitative loss factor for municipal finance receivables is based on the portfolio's external ratings and Moody's historical transition matrix, as opposed to the historical cumulative default curve for municipal obligations that was used previously.
For loans that are partially guaranteed by the SBA, the loss factor applied to the non-guaranteed portion of these loans is based on the 16-quarter average charge-off rate published by the SBA for each program
Mortgage warehouse loans have been segregated for the purpose of determining a quantitative loss factor, to better recognize the risk profile of this portfolio segment.
The net impact of these changes on the ALLL was not material.
The peer group used to calculate the average annual historical net charge-off rates that form the basis for ourused in estimating general reserve calculations for the majority of new commercial, home equity and consumer loansreserves is made up of the24 banks included in the OCC Midsize Bank Group plus twofive additional banks not included in the New York regionOCC Midsize Bank Group that management believes to be comparable based on size, geography and nature of lending operations. The OCC Midsize Bank Group primarily includes commercial banks with total assets ranging from $10 - $50 billion and included 28 banks at September 30, 2017. Peer bank data is obtained from the Statistics on Depository Institutions Report published by the FDIC for the most recent quarter available. These banks, as a group, are considered by management to be comparable to BankUnited in size, nature of lending operations and loan portfolio composition. We evaluate the composition of the peer group annually, or more frequently if, in our judgment, a more frequent evaluation is necessary. Our internal risk rating system comprises 13 credit grades; grades 1 through 8 are “pass” grades. The risk ratings are driven largely by debt service coverage. Peer group historical loss rates are adjusted upward for loans assigned a lower “pass” rating.
WeAs noted above, we generally use a 16-quarter loss experience20 quarter look-back period to calculate peer group average annual net charge-off rates for commercial loans.quantitative loss rates. We believe this look-back period to be consistent with the range of industry practice and appropriate to capture a sufficient range of observations reflecting the performance of our loans, most of which were originated in the current economic cycle. Prior to the third quarter of 2017, we used a four-quarter loss experience period for the taxi medallion portfolio to recognize the recent deterioration in that portfolio. We use a 14-quarter loss experience period for the Bridge portfolios, reflective of the period over which an observable loss trend began to emerge.
With the exception of the Pinnacle municipal finance portfolio, a four quarter loss emergence period is used in the calculation of general reserves. A twelve quarter loss emergence period is used in the calculation of general reserves for the Pinnacle portfolio.
The primary assumptions underlying estimates of expected cash flows for ACI commercial loans are default probability and severity of loss given default. Assessments of default probability and severity are based on net realizable value analyses prepared at the individual loan level. Based on our analysis, no ALLL related to ACI commercial loans was recorded at June 30, 2019 or December 31, 2018. Commercial ACI loans are not a significant portion of the loan portfolio.
Residential and other consumer loans
The residential and other consumer loan portfolio has not yet developed an observable loss trend. Therefore, the ALLL for residential loans is based primarily on relevant proxy historical loss rates. The ALLL for 1-4 single family residential loans, excluding government insured residential loans and ACI loans, is estimated using average annual loss rates on prime residential mortgage securitizations issued between 2003 and 2008 as a proxy. Based on the comparability of FICO scores and LTV ratios between loans included in those securitizations and loans in the Bank’s portfolio and the geographic diversity in the new purchased residential portfolio, we determined that prime residential mortgage securitizations provide an appropriate proxy for incurred losses in this portfolio class. A peer group 20-quarter average net charge-off rate is used to estimate the ALLL for the home equity and other consumer loan classes. See further discussion of peer group loss factors above. The home equity and other consumer loan portfolios are not significant components of the overall loan portfolio.
Qualitative Factors
Qualitative adjustments are made to the ALLL when, based on management’s judgment, there are internal or external factors impacting probable incurred losses not taken into account by the quantitative calculations. Potential qualitative adjustments are categorized as follows:
Portfolio performance trends, including trends in and the levels of delinquencies, non-performing loans and classified loans;
Changes in the nature of the portfolio and terms of the loans, specifically including the volume and nature of policy and procedural exceptions;
Portfolio growth trends;
Changes in lending policies and procedures, including credit and underwriting guidelines;guidelines and portfolio management practices;
Economic factors, including unemployment rates and GDP growth rates;rates and other factors considered relevant by management;
Changes in the value of underlying collateral;
Quality of risk ratings, as evaluated by our independent credit review function;
Credit concentrations;
Changes in and experience levels of credit administration management and staff; and
Other factors identified by management that may impact the level of losses inherent in the portfolio, including but not limited to competition and legal and regulatory considerations.
ACILoans
For ACI loans, a valuation allowance is established when periodic evaluations of expected cash flows reflect a deterioration resulting from credit related factors from the level of cash flows that were estimated to be collected at acquisition plus any additional expected cash flows arising from revisions in those estimates. We perform a quarterly analysis of expected cash flows for ACI loans.
Expected cash flows are estimated on a pool basis for ACI 1-4 single family residential and home equity loans.loans are estimated at the pool level. The analysis of expected pool cash flows incorporates updated pool levelassumptions about expected prepayment rate,rates, default rate,rates, delinquency levellevels and loss severity given default assumptions. Prepayment, delinquency and default curves are derived primarily from roll rates generated from the historical performance of the portfolio over the immediately preceding four quarters. Loss severity given default assumptions are generated from the historical performance of the portfolio over the immediately preceding four quarters, while loss severity from loan sales is generated from historical performance over the immediately preceding twelve quarters. Estimates of default probability and loss severity given default also incorporate updated LTV ratios, at the loan level, based on Case-Shiller Home Price Indices for the relevant MSA. Costs and fees represent an additional component of loss on default and are projected based on historical experience over the last three years. The ACI home equity roll rates include the impact of delinquent, related senior liens and loans to borrowers who have not reaffirmed their debt discharged in Chapter 7 bankruptcy. default.
Our projected cash flow analysis reflected a decrease in expected cash flows due to credit related factors for the home equity ACI pool; therefore, a provision for loan losses of $1.8 million was recorded for the nine months ended September 30, 2017, along with a corresponding increase in the FDIC indemnification asset of $1.4 million. No ALLL related to 1-4 single family residential ACI pools was recorded at SeptemberJune 30, 2017. No ALLL related to 1-4 single family residential and home equity ACI pools was recorded at December 31, 2016.
The primary assumptions underlying estimates of expected cash flows for ACI commercial loans are default probability and severity of loss given default. Assessments of default probability and severity are based on net realizable value analyses prepared at the individual loan level. Based on our analysis, no ALLL related to ACI commercial loans was recorded at September 30, 20172019 or December 31, 2016. 2018.
The following tables providetable provides an analysis of the ALLL, provision for loan losses and net charge-offs for the periods indicated (in thousands):
| | | | Nine Months Ended September 30, 2017 | Six Months Ended June 30, |
| | | | Covered Loans | | | 2019 | | 2018 |
| | Non-Covered Loans | | ACI Loans | | Non-ACI Loans | | Total | |
| Balance at December 31, 2016 | $ | 150,853 |
| | $ | — |
| | $ | 2,100 |
| | $ | 152,953 |
| |
| Balance at beginning of period: | | $ | 109,931 |
| | $ | 144,795 |
|
| Provision for (recovery of) loan losses: | | | | | | | | | | |
| 1-4 single family residential | (4 | ) | | — |
| | 212 |
| | 208 |
| 397 |
| | (35 | ) |
| Home equity loans and lines of credit | — |
| | 1,812 |
| | 714 |
| | 2,526 |
| (150 | ) | | (8 | ) |
| Other consumer loans | (48 | ) | | — |
| | — |
| | (48 | ) | 34 |
| | 137 |
|
| Multi-family | (3,303 | ) | | — |
| | — |
| | (3,303 | ) | (1,330 | ) | | (6,421 | ) |
| Non-owner occupied commercial real estate | 4,032 |
| | — |
| | — |
| | 4,032 |
| 5,309 |
| | (3,864 | ) |
| Construction and land | (9 | ) | | — |
| | — |
| | (9 | ) | 498 |
| | (651 | ) |
| Owner occupied commercial real estate | 4,884 |
| | — |
| | — |
| | 4,884 |
| (2,611 | ) | | 2,036 |
|
| Commercial and industrial | | | | | | | | 6,481 |
| | 19,096 |
|
| Taxi medallion loans | 49,604 |
| | — |
| | — |
| | 49,604 |
| |
| Other commercial and industrial | 9,338 |
| | — |
| | (45 | ) | | 9,293 |
| |
| Commercial lending subsidiaries | (8,614 | ) | | — |
| | — |
| | (8,614 | ) | | | |
| Unallocated | 5,000 |
| | — |
| | — |
| | 5,000 |
| |
| Pinnacle | | (116 | ) | | (36 | ) |
| Bridge - franchise finance | | 1,094 |
| | 585 |
|
| Bridge - equipment finance | | (2,072 | ) | | 1,303 |
|
| Total Provision | 60,880 |
| | 1,812 |
| | 881 |
| | 63,573 |
| 7,534 |
| | 12,142 |
|
| Charge-offs: | | | | | | | | | | |
| Home equity loans and lines of credit | — |
| | — |
| | (55 | ) | | (55 | ) | |
| 1-4 single family residential | | — |
| | (239 | ) |
| Other consumer loans | | — |
| | (265 | ) |
| Non-owner occupied commercial real estate | (162 | ) | | — |
| | — |
| | (162 | ) | (1,703 | ) | | (243 | ) |
| Construction and land | | (76 | ) | | — |
|
| Owner occupied commercial real estate | (1,164 | ) | | — |
| | — |
| | (1,164 | ) | (174 | ) | | (5,640 | ) |
| Commercial and industrial | | | | | | | | |
| Taxi medallion loans | (47,141 | ) | | — |
| | — |
| | (47,141 | ) | |
| Other commercial and industrial | (12,567 | ) | | — |
| | — |
| | (12,567 | ) | |
Commercial and industrial(1) | | (4,688 | ) | | (16,513 | ) |
| Commercial lending subsidiaries | — |
| | — |
| | — |
| | — |
| | | |
| Bridge - franchise finance | | (1,203 | ) | | — |
|
| Total Charge-offs | (61,034 | ) | | — |
| | (55 | ) | | (61,089 | ) | (7,844 | ) | | (22,900 | ) |
| Recoveries: | | | | | | | | | | |
| Home equity loans and lines of credit | — |
| | — |
| | 65 |
| | 65 |
| 149 |
| | 4 |
|
| Other consumer loans | 21 |
| | — |
| | — |
| | 21 |
| 18 |
| | 24 |
|
| Non-owner occupied commercial real estate | | 41 |
| | 123 |
|
| Owner occupied commercial real estate | 2 |
| | — |
| | — |
| | 2 |
| 718 |
| | 42 |
|
| Commercial and industrial | | | | | | | | 1,594 |
| | 739 |
|
| Other commercial and industrial | 2,400 |
| | — |
| | 45 |
| | 2,445 |
| |
| Commercial lending subsidiaries | 603 |
| | — |
| | — |
| | 603 |
| | | |
| Bridge - franchise finance | | — |
| | 2 |
|
| Total Recoveries | 3,026 |
| | — |
| | 110 |
| | 3,136 |
| 2,520 |
| | 934 |
|
| Net Charge-offs: | (58,008 | ) | | — |
| | 55 |
| | (57,953 | ) | (5,324 | ) | | (21,966 | ) |
| Balance at September 30, 2017 | $ | 153,725 |
| | $ | 1,812 |
| | $ | 3,036 |
| | $ | 158,573 |
| |
| Balance at end of period | | $ | 112,141 |
| | $ | 134,971 |
|
|
| | | | | | | | | | | | | | | |
| | Nine Months Ended September 30, 2016 |
| | | | Covered Loans | | |
| | Non-Covered Loans | | ACI Loans | | Non-ACI Loans | | Total |
| Balance at December 31, 2015 | $ | 120,960 |
| | $ | — |
| | $ | 4,868 |
| | $ | 125,828 |
|
| Provision for (recovery of) loan losses: | | | | | | | |
| 1-4 single family residential | (324 | ) | | — |
| | 23 |
| | (301 | ) |
| Home equity loans and lines of credit | 2 |
| | — |
| | (1,097 | ) | | (1,095 | ) |
| Other consumer loans | (98 | ) | | — |
| | — |
| | (98 | ) |
| Multi-family | 1,509 |
| | — |
| | — |
| | 1,509 |
|
| Non-owner occupied commercial real estate | 7,563 |
| | — |
| | — |
| | 7,563 |
|
| Construction and land | (980 | ) | | — |
| | — |
| | (980 | ) |
| Owner occupied commercial real estate | 4,854 |
| | — |
| | — |
| | 4,854 |
|
| Commercial and industrial | | | | | | | |
| Taxi medallion loans | 9,679 |
| | — |
| | — |
| | 9,679 |
|
| Other commercial and industrial | 16,686 |
| | — |
| | (45 | ) | | 16,641 |
|
| Commercial lending subsidiaries | 4,677 |
| | — |
| | — |
| | 4,677 |
|
| Total Provision | 43,568 |
| | — |
| | (1,119 | ) | | 42,449 |
|
| Charge-offs: | | | | | | | |
| 1-4 single family residential | — |
| | — |
| | (312 | ) | | (312 | ) |
| Home equity loans and lines of credit | — |
| | — |
| | (774 | ) | | (774 | ) |
| Non-owner occupied commercial real estate | (128 | ) | | — |
| | — |
| | (128 | ) |
| Construction and land | (93 | ) | | — |
| | — |
| | (93 | ) |
| Owner occupied commercial real estate | (2,615 | ) | | — |
| | — |
| | (2,615 | ) |
| Commercial and industrial | | | | | | | |
| Taxi medallion loans | (4,235 | ) | | — |
| | — |
| | (4,235 | ) |
| Other commercial and industrial | (7,245 | ) | | — |
| | — |
| | (7,245 | ) |
| Commercial lending subsidiaries | (1,432 | ) | | — |
| | — |
| | (1,432 | ) |
| Total Charge-offs | (15,748 | ) | | — |
| | (1,086 | ) | | (16,834 | ) |
| Recoveries: | | | | | | | |
| Home equity loans and lines of credit | — |
| | — |
| | 77 |
| | 77 |
|
| Other consumer loans | 18 |
| | — |
| | — |
| | 18 |
|
| Owner occupied commercial real estate | 1,175 |
| | — |
| | — |
| | 1,175 |
|
| Commercial and industrial | | | | | | | |
| Other commercial and industrial | 440 |
| | — |
| | 45 |
| | 485 |
|
| Commercial lending subsidiaries | 1,278 |
| | — |
| | — |
| | 1,278 |
|
| Total Recoveries | 2,911 |
| | — |
| | 122 |
| | 3,033 |
|
| Net Charge-offs: | (12,837 | ) | | — |
| | (964 | ) | | (13,801 | ) |
| Balance at September 30, 2016 | $ | 151,691 |
| | $ | — |
| | $ | 2,785 |
| | $ | 154,476 |
|
| |
| (1) | Includes charge-offs of $13.5 million related to taxi medallion loans during the six months ended June 30, 2018. |
The following tables showtable shows the distribution of the ALLL broken out between covered and non-covered loans, at the dates indicated (dollars in thousands): |
| | | | | | | | | | | | | | | | | | |
| | September 30, 2017 |
| | | | Covered Loans | | | | |
| | Non-Covered Loans | | ACI Loans | | Non-ACI Loans | | Total | | %(1) |
| Residential and other consumer: | |
| | |
| | |
| | |
| | |
|
| 1 - 4 single family residential | $ | 9,275 |
| | $ | — |
| | $ | 393 |
| | $ | 9,668 |
| | 21.7 | % |
| Home equity loans and lines of credit | 7 |
| | 1,812 |
| | 2,643 |
| | 4,462 |
| | 0.2 | % |
| Other consumer loans | 90 |
| | — |
| | — |
| | 90 |
| | 0.1 | % |
| | 9,372 |
| | 1,812 |
| | 3,036 |
| | 14,220 |
| | 22.0 | % |
| Commercial: | | | | | | | | | |
| Multi-family | 21,706 |
| | — |
| | — |
| | 21,706 |
| | 16.3 | % |
| Non-owner occupied commercial real estate | 39,474 |
| | — |
| | — |
| | 39,474 |
| | 20.4 | % |
| Construction and land | 2,815 |
| | — |
| | — |
| | 2,815 |
| | 1.3 | % |
| Owner occupied commercial real estate | 15,146 |
| | — |
| | — |
| | 15,146 |
| | 9.5 | % |
| Commercial and industrial | | | | | | | | | |
| Taxi medallion loans | 13,117 |
| | — |
| | — |
| | 13,117 |
| | 0.8 | % |
| Other commercial and industrial | 37,239 |
| | — |
| | — |
| | 37,239 |
| | 18.2 | % |
| Commercial lending subsidiaries | 9,856 |
| | — |
| | — |
| | 9,856 |
| | 11.5 | % |
| | 139,353 |
| | — |
| | — |
| | 139,353 |
| | 78.0 | % |
| Unallocated | 5,000 |
| | — |
| | — |
| | 5,000 |
| |
|
|
| | $ | 153,725 |
| | $ | 1,812 |
| | $ | 3,036 |
| | $ | 158,573 |
| | 100.0 | % |
| | | | December 31, 2016 | | | | | | | | | |
| | | | Covered Loans | | | | | June 30, 2019 | | December 31, 2018 |
| | Non-Covered Loans | | ACI Loans | | Non-ACI Loans | | Total | | %(1) | Total | | %(1) | | Total | | %(1) |
| Residential and other consumer: | |
| | |
| | |
| | |
| | |
| | | | | | | |
|
| 1 - 4 single family residential | $ | 9,279 |
| | $ | — |
| | $ | 181 |
| | $ | 9,460 |
| | 20.6 | % | $ | 11,023 |
| | 23.0 | % | | $ | 10,626 |
| | 22.2 | % |
| Home equity loans and lines of credit | 7 |
| | — |
| | 1,919 |
| | 1,926 |
| | 0.3 | % | 2 |
| | 0.1 | % | | 3 |
| | — | % |
| Other consumer loans | 117 |
| | — |
| | — |
| | 117 |
| | 0.1 | % | 211 |
| | — | % | | 159 |
| | 0.1 | % |
| | 9,403 |
| | — |
| | 2,100 |
| | 11,503 |
| | 21.0 | % | 11,236 |
| | 23.1 | % | | 10,788 |
| | 22.3 | % |
| Commercial: | | | | | | | | | | | | | | | | |
| Multi-family | 25,009 |
| | — |
| | — |
| | 25,009 |
| | 19.8 | % | 6,069 |
| | 10.6 | % | | 7,399 |
| | 11.8 | % |
| Non-owner occupied commercial real estate | 35,604 |
| | — |
| | — |
| | 35,604 |
| | 19.3 | % | 33,905 |
| | 21.9 | % | | 30,258 |
| | 21.4 | % |
| Construction and land | 2,824 |
| | — |
| | — |
| | 2,824 |
| | 1.6 | % | 1,800 |
| | 1.1 | % | | 1,378 |
| | 1.0 | % |
| Owner occupied commercial real estate | 11,424 |
| | — |
| | — |
| | 11,424 |
| | 9.0 | % | 7,732 |
| | 9.2 | % | | 9,799 |
| | 9.7 | % |
| Commercial and industrial | | | | | | | | | | 37,703 |
| | 22.9 | % | | 34,316 |
| | 21.9 | % |
| Taxi medallion loans | 10,655 |
| | — |
| | — |
| | 10,655 |
| | 0.9 | % | |
| Other commercial and industrial | 38,067 |
| | — |
| | — |
| | 38,067 |
| | 16.6 | % | |
| Commercial lending subsidiaries | 17,867 |
| | — |
| | — |
| | 17,867 |
| | 11.8 | % | | | | | | | |
| Pinnacle | | 759 |
| | 5.6 | % | | 875 |
| | 6.6 | % |
| Bridge - franchise finance | | 5,451 |
| | 2.6 | % | | 5,560 |
| | 2.4 | % |
| Bridge - equipment finance | | 7,486 |
| | 3.0 | % | | 9,558 |
| | 2.9 | % |
| | 141,450 |
| | — |
| | — |
| | 141,450 |
| | 79.0 | % | 100,905 |
| | 76.9 | % | | 99,143 |
| | 77.7 | % |
| | $ | 150,853 |
| | $ | — |
| | $ | 2,100 |
| | $ | 152,953 |
| | 100.0 | % | $ | 112,141 |
| | 100.0 | % | | $ | 109,931 |
| | 100.0 | % |
| |
| (1) | Represents percentage of loans receivable in each category to total loans receivable. |
The ALLL at September 30, 2017 included $5.4 million related to the impact of Hurricanes Irma and Harvey. The ALLL includes $0.4 million related to loans that were downgraded during the three months ended September 30, 2017 as a result of the hurricanes and a $5.0 million unallocated qualitative allowance.
Excluding the $5.0 million unallocated qualitative allowance relative to the impact of the hurricanes, the balance of the ALLL for non-covered loans at SeptemberJune 30, 2017 decreased slightly as compared to2019 increased $2.2 million from the balance at December 31, 2016. Decreases in quantitative loss factors applied to2018, while the majorityratio of the commercial loan portfolio and net decreases in qualitative factors were substantially offset by the impact of the growth of the loan portfolio and an increase in reserves for criticized and classifiedALLL to total loans including taxi medallion loans.remained consistent at 0.50%. Factors influencing the change in the ALLL related to specific loan types at SeptemberJune 30, 20172019 as compared to December 31, 2016,2018 include:
The ALLL related to non-covered 1-4 single family residential loans did not change significantly. Increases related to growth in the corresponding portfolio were substantially offset by declines in both the applicable quantitative historical loss rate and qualitative reserves.
A decrease of $3.3$1.3 million for multi-family loans was primarily reflects decreasesattributable to a decrease in the balance of loans outstanding and a decrease in quantitative loss factors, the decline in the corresponding portfolio and a net decrease in qualitative loss factors, offset in part by an increase in criticized and classified loans.factors.
An increase of $3.9$3.6 million for non-owner occupied commercial real estate loans was primarily driven by theattributable to increases in certain qualitative loss factors, as well as growth ofin the corresponding portfolio and an increase in criticized and classified loans, partially offset by aportfolio.
A decrease in quantitative loss factors.
An increase of $3.7$2.1 million for owner occupied commercial real estate loans was primarily attributable to increasesa decrease in quantitative and qualitative loss factors, a decrease in the specific reservesreserve for one impaired loansloan relationship and to a lesser extent,decline in the growth of the corresponding portfolio.portfolio balance.
An increase of $2.5$3.4 million for taxi medallion loans reflects the specific reserves recognized at September 30, 2017, as discussed previously. Increases in reserves were limited due to the level of charge-offs recognized during the nine months ended September 30, 2017.
A decrease of $0.8 million for other commercial and industrial loans was primarily driven by a decreaseattributable to loan growth, an increase in specific reserves, for impaired and other classified loans, primarily due to net charge-offs,partially offset by growth in the corresponding portfolio.
A $8.0 million decrease for commercial lending subsidiaries primarily reflectsnet decreases in quantitative loss factors for the municipal finance receivables and decreases in qualitative loss factors related to portfolio growth trends and credit concentrations.factors.
| |
| • | A decrease of $2.1 million for equipment finance loans was primarily attributable to a decrease in the specific reserve for one impaired loan relationship and a decline in qualitative loss factors. |
For additional information about the ALLL, see Note 4 to the consolidated financial statements.
Deposits
Average balances and rates paid on deposits were as follows for the periods indicated (dollars in thousands):
|
| | | | | | | | | | | | | | | | | | | | | | | | | | | |
| | Three Months Ended September 30, | | Nine Months Ended September 30, |
| �� | 2017 | | 2016 | | 2017 | | 2016 |
| | Average
Balance | | Average
Rate Paid | | Average
Balance | | Average
Rate Paid | | Average
Balance | | Average Rate Paid | | Average
Balance | | Average
Rate Paid |
| Demand deposits: | | | | | | | | | |
| | |
| | |
| | |
|
| Non-interest bearing | $ | 3,036,046 |
| | — | % | | $ | 2,981,017 |
| | — | % | | $ | 3,034,682 |
| | — | % | | $ | 2,944,861 |
| | — | % |
| Interest bearing | 1,590,206 |
| | 0.85 | % | | 1,437,677 |
| | 0.62 | % | | 1,564,229 |
| | 0.76 | % | | 1,341,218 |
| | 0.61 | % |
| Money market | 9,590,333 |
| | 0.90 | % | | 7,948,299 |
| | 0.64 | % | | 9,187,225 |
| | 0.80 | % | | 7,778,761 |
| | 0.63 | % |
| Savings | 378,179 |
| | 0.24 | % | | 400,982 |
| | 0.22 | % | | 370,682 |
| | 0.19 | % | | 424,915 |
| | 0.24 | % |
| Time | 6,290,056 |
| | 1.30 | % | | 5,567,909 |
| | 1.13 | % | | 5,988,433 |
| | 1.24 | % | | 5,177,191 |
| | 1.11 | % |
| | $ | 20,884,820 |
| | 0.87 | % | | $ | 18,335,884 |
| | 0.67 | % | | $ | 20,145,251 |
| | 0.80 | % | | $ | 17,666,946 |
| | 0.65 | % |
Total deposits at September 30, 2017 and December 31, 2016 included $2.3 billion and $1.9 billion, respectively, of brokered deposits. |
| | | | | | | | | | | | | | | | | | | | | | | | | | | |
| | Three Months Ended June 30, | | Six Months Ended June 30, |
| | 2019 | | 2018 | | 2019 | | 2018 |
| | Average
Balance | | Average
Rate Paid | | Average
Balance | | Average
Rate Paid | | Average
Balance | | Average
Rate Paid | | Average
Balance | | Average
Rate Paid |
| Demand deposits: | | | | | | | | | | | | | | | |
| Non-interest bearing | $ | 3,932,716 |
| | — | % | | $ | 3,315,851 |
| | — | % | | $ | 3,769,828 |
| | — | % | | $ | 3,306,238 |
| | — | % |
| Interest bearing | 1,773,912 |
| | 1.41 | % | | 1,621,161 |
| | 1.04 | % | | 1,738,393 |
| | 1.38 | % | | 1,610,643 |
| | 1.05 | % |
| Money market | 10,710,550 |
| | 1.95 | % | | 10,260,713 |
| | 1.30 | % | | 10,964,547 |
| | 1.93 | % | | 10,365,109 |
| | 1.21 | % |
| Savings | 214,030 |
| | 0.28 | % | | 292,911 |
| | 0.25 | % | | 223,271 |
| | 0.28 | % | | 310,659 |
| | 0.26 | % |
| Time | 6,944,862 |
| | 2.40 | % | | 6,475,569 |
| | 1.72 | % | | 6,926,041 |
| | 2.34 | % | | 6,395,299 |
| | 1.61 | % |
| | $ | 23,576,070 |
| | 1.70 | % | | $ | 21,966,205 |
| | 1.19 | % | | $ | 23,622,080 |
| | 1.68 | % | | $ | 21,987,948 |
| | 1.12 | % |
The following table shows scheduled maturities of certificates of deposit with denominations greater than or equal to $100,000 as of SeptemberJune 30, 20172019 (in thousands):
| | | Three months or less | $ | 741,235 |
| $ | 815,410 |
|
| Over three through six months | 1,037,771 |
| 533,385 |
|
| Over six through twelve months | 1,351,330 |
| 1,882,466 |
|
| Over twelve months | 931,302 |
| 299,722 |
|
| | $ | 4,061,638 |
| $ | 3,530,983 |
|
FHLB Advances, Notes and Other Borrowings
In addition to deposits, we utilize FHLB advances to fund growth in interest earning assets; the advances provide us with additional flexibility in managing both term and cost of funding. FHLB advances are secured by FHLB stock, qualifying residential first mortgage and commercial real estate and home equity loans, and MBS. At September 30, 2017 and December 31, 2016, outstanding FHLB advances totaled $4.9 billion and $5.2 billion, respectively.
The contractual balance of FHLB advances outstanding at SeptemberJune 30, 20172019 is scheduled to mature as follows (in thousands):
|
| | | |
| Maturing in: | |
|
| 2017—One month or less | $ | 2,395,000 |
|
| 2017—Over one month | 855,000 |
|
| 2018 | 1,396,000 |
|
| 2019 | 100,000 |
|
| 2020 | 125,000 |
|
| Carrying value | $ | 4,871,000 |
|
|
| | | |
| Maturing in: | |
| 2019—One month or less | $ | 2,055,000 |
|
| 2019—Over one month | 1,026,000 |
|
| 2020 | 1,975,000 |
|
| 2021 | 275,000 |
|
| Carrying value | $ | 5,331,000 |
|
The table above reflects contractual maturities of outstanding advances, and does not incorporate the impact that interest rate swaps designated as cash flow hedges have on the duration of borrowings. See Note 7 to the consolidated financial statements for more information about derivative instruments.
Outstanding senior notes payable and other borrowings consisted of the following at the dates indicated (in thousands):
| | | | September 30, 2017 | | December 31, 2016 | June 30, 2019 | | December 31, 2018 |
| Senior notes | $ | 393,564 |
| | $ | 393,092 |
| $ | 394,735 |
| | $ | 394,390 |
|
| Capital lease obligations | 9,264 |
| | 9,717 |
| |
| Finance leases | | 8,926 |
| | 8,359 |
|
| | $ | 402,828 |
| | $ | 402,809 |
| $ | 403,661 |
| | $ | 402,749 |
|
Senior notes have a face amount of $400 million, a fixed coupon rate of 4.875% and mature on November 17, 2025.
The Bank utilizes federal funds purchased to manage the daily cash position. At June 30, 2019, the Company had $99 million in federal funds purchased.
Capital Resources
Pursuant to the FDIA, the federal banking agencies have adopted regulations setting forth a five-tier system for measuring the capital adequacy of the financial institutions they supervise. At SeptemberJune 30, 20172019 and December 31, 2016,2018, BankUnited and the Company had capital levels that exceeded both the regulatory well-capitalized guidelines and all internal capital ratio targets.
Stockholders' equity increasedremained relatively flat compared to $2.6 billion at September 30, 2017, an increase of $205 million, or 8.5%, from December 31, 2016, due primarily to the retention2018. The repurchase of earningscommon shares and the exercisepayment of stock options resulting in proceeds of $61.5 million during the period.
Since our formation, stockholders' equity has been impacted primarilydividends were largely offset by the retention of earnings, and to a lesser extent, proceeds from the issuance of common shares and changes in unrealized gains and losses, net of taxes, on investment securities
available for sale and cash flow hedges. earnings. Our rate of earnings retention is derived by dividing undistributed earnings per common share by earnings per common share. Our retentiondividend payout ratio was 66.0%25.9% and 64.9%28.8% for the three and ninesix months ended SeptemberJune 30, 2017,2019, respectively, compared to 55.7%25.5% and 58.4% 26.2% for the three and ninesix months ended SeptemberJune 30, 2016,2018, respectively.We retain a high percentage
In January 2019 the Board of our earnings to support our planned growth.
We filed a shelf registration statement with the SEC in October 2015 that allowsDirectors of the Company authorized the repurchase of up to periodically offer and sellan additional $150 million in one or more offerings, individually or in any combination, ourshares of its outstanding common stock, preferred stocksubject to any applicable regulatory approvals. Any repurchases will be made in accordance with applicable securities laws from time to time in open market or private transactions. The extent to which the Company repurchases shares, and the timing of such repurchases, will depend upon a variety of factors, including market conditions, the Company’s capital position, regulatory requirements and other non-equity securities. The shelf registration provides us with flexibility in issuing capital instrumentsconsiderations. No time limit was set for the completion of the share repurchase program, and enables us to more readily access the capital markets as needed to pursue future growth opportunities and to ensure continued compliance with regulatory capital requirements. Our ability to issue securities pursuant toprogram may be suspended or discontinued at any time.
During the shelf registration is subject to market conditions.quarter ended June 30, 2019, the Company repurchased approximately 3.0 million shares of its common stock for an aggregate purchase price of approximately $102 million. During the six months ended June 30, 2019, the Company repurchased approximately 4.1 million shares of its common stock for an aggregate purchase price of approximately $142 million, at a weighted average price of $34.44 per share.
The following table provides information regarding regulatory capital for the Company and the Bank as of SeptemberJune 30, 20172019 (dollars in thousands):
|
| | | | | | | | | | | | | | | | | | | | |
| | Actual | | Required to be Considered Well Capitalized | | Required to be Considered Adequately Capitalized |
| | Amount | | Ratio | | Amount | | Ratio | | Amount | | Ratio |
| BankUnited, Inc.: | |
| | |
| | |
| | |
| | |
| | |
|
| Tier 1 leverage | $ | 2,491,853 |
| | 8.56 | % | | N/A (1) |
| | N/A (1) |
| | $ | 1,164,462 |
| | 4.00 | % |
| CET1 risk-based capital | $ | 2,491,853 |
| | 11.91 | % | | $ | 1,359,799 |
| | 6.50 | % | | $ | 941,399 |
| | 4.50 | % |
| Tier 1 risk-based capital | $ | 2,491,853 |
| | 11.91 | % | | $ | 1,673,599 |
| | 8.00 | % | | $ | 1,255,199 |
| | 6.00 | % |
| Total risk based capital | $ | 2,657,784 |
| | 12.70 | % | | $ | 2,091,998 |
| | 10.00 | % | | $ | 1,673,599 |
| | 8.00 | % |
| BankUnited: | |
| | |
| | |
| | |
| | |
| | |
|
| Tier 1 leverage | $ | 2,706,006 |
| | 9.32 | % | | $ | 1,451,814 |
| | 5.00 | % | | $ | 1,161,451 |
| | 4.00 | % |
| CET1 risk-based capital | $ | 2,706,006 |
| | 12.98 | % | | $ | 1,354,884 |
| | 6.50 | % | | $ | 937,997 |
| | 4.50 | % |
| Tier 1 risk-based capital | $ | 2,706,006 |
| | 12.98 | % | | $ | 1,667,550 |
| | 8.00 | % | | $ | 1,250,662 |
| | 6.00 | % |
| Total risk based capital | $ | 2,869,850 |
| | 13.77 | % | | $ | 2,084,437 |
| | 10.00 | % | | $ | 1,667,550 |
| | 8.00 | % |
(1) |
| | | | | | | | | | | | | | | | | | | | | | | | | | | |
| | Actual | | Required to be Considered Well Capitalized | | Required to be Considered Adequately Capitalized | | Required to be Considered
Adequately
Capitalized Including Capital Conservation Buffer |
| | Amount | | Ratio | | Amount | | Ratio | | Amount | | Ratio | | Amount | | Ratio |
| BankUnited, Inc.: | |
| | |
| | |
| | |
| | |
| | |
| | | | |
| Tier 1 leverage | $ | 2,805,540 |
| | 8.61 | % | | N/A (1) |
| | N/A (1) |
| | $ | 1,302,846 |
| | 4.00 | % | | N/A (1) |
| | N/A (1) |
|
| CET1 risk-based capital | $ | 2,805,540 |
| | 11.95 | % | | $ | 1,525,425 |
| | 6.50 | % | | $ | 1,056,063 |
| | 4.50 | % | | $ | 1,642,765 |
| | 7.00 | % |
| Tier 1 risk-based capital | $ | 2,805,540 |
| | 11.95 | % | | $ | 1,877,446 |
| | 8.00 | % | | $ | 1,408,085 |
| | 6.00 | % | | $ | 1,994,787 |
| | 8.50 | % |
| Total risk based capital | $ | 2,920,497 |
| | 12.44 | % | | $ | 2,346,808 |
| | 10.00 | % | | $ | 1,877,446 |
| | 8.00 | % | | $ | 2,464,148 |
| | 10.50 | % |
| BankUnited: | |
| | |
| | |
| | |
| | |
| | |
| | | | |
| Tier 1 leverage | $ | 3,013,135 |
| | 9.28 | % | | $ | 1,623,836 |
| | 5.00 | % | | $ | 1,299,069 |
| | 4.00 | % | | N/A |
| | N/A |
|
| CET1 risk-based capital | $ | 3,013,135 |
| | 12.88 | % | | $ | 1,520,227 |
| | 6.50 | % | | $ | 1,052,465 |
| | 4.50 | % | | $ | 1,637,167 |
| | 7.00 | % |
| Tier 1 risk-based capital | $ | 3,013,135 |
| | 12.88 | % | | $ | 1,871,049 |
| | 8.00 | % | | $ | 1,403,286 |
| | 6.00 | % | | $ | 1,987,989 |
| | 8.50 | % |
| Total risk based capital | $ | 3,128,092 |
| | 13.37 | % | | $ | 2,338,811 |
| | 10.00 | % | | $ | 1,871,049 |
| | 8.00 | % | | $ | 2,455,751 |
| | 10.50 | % |
1) There is no Tier 1 leverage ratio component in the definition of a well-capitalized bank holding company.
Levels of capital required to be well capitalized or adequately capitalized as reflected above do not include a capital conservation buffer that is being phased in beginning in 2016. When fully phased in onBeginning January 1, 2019, the Bank and the Company will haveare required to maintain thisa capital conservation buffer composed of CET1 capital equal to 2.50% of risk-weighted assets above the amounts required to be adequately capitalized as reflected above, in order to avoid limitations on capital distributions, including dividend payments and certain discretionary bonus payments to executive officers. Capital ratios required to be considered well-capitalized exceed the ratios required under the capital conservation buffer requirement at September 30, 2017.
Liquidity
Liquidity involves our ability to generate adequate funds to support planned interest earning asset growth, meet deposit withdrawal requests, maintain reserve requirements, conduct routine operations, pay dividends, service outstanding debt and meet other contractual obligations.
Primary sources ofBankUnited's liquidity includeneeds have been and continue to be met by cash flows from operations, cash generated by the repayment and resolution of covered loans, cash payments received from the FDIC pursuant to the Single Family Shared-Loss Agreement, deposit growth, the available for sale securitiesinvestment portfolio and FHLB advances.
For the ninesix months ended SeptemberJune 30, 20172019 and 2016,2018 net cash provided by operating activities was $231.2$237.8 million and $227.3$229.9 million, respectively. When compared with the six months ended June 30, 2018, operating cash flows were negatively impacted by approximately $143 million as a result of the daily cash settlement of derivative positions. These settlements, which are reported in cash flows from operating activities, are directly affected by changes in market interest rates. Accretion on ACI loans, which is reflected as a non-cash reduction in net income to arrive at operating cash flows, totaled $226.3$33.1 million and $228.5$167.8 million for the ninesix months ended SeptemberJune 30, 20172019 and 2016,2018, respectively. Accretable yield on ACI loans represents the excess of expected future cash flows over the carrying amount of the loans, and is recognized as interest income over the expected lives of the loans. Amounts recorded as accretion are realized in cash as individual loans are paid down or otherwise resolved; however, the timing of cash realization may differ from the timing of income recognition. These cash flows from the repayment or resolution of coveredACI loans, inclusive of amounts that have been accreted through earnings over time, are recognized as cash flows from investing activities in the consolidated statements of cash flows upon receipt. Cash payments from the FDIC in the form of reimbursements of losses related to the
covered loans under the Single Family Shared-Loss Agreement are also characterized as investing cash flows. Cash generated by the repayment and resolution of covered loans and reimbursements from the FDIC totaled $348.5 million and $430.3 million for the nine months ended September 30, 2017 and 2016, respectively. Both cash generated by the repayment and resolution of covered loans and cash payments received from the FDIC have been and are expected to continue to be, although to a lesser extent in the future, consistent and relatively predictable sources of liquidity.
In addition to cash provided by operating activities, the repayment and resolution of covered loans and payments under the Single Family Shared-Loss Agreement from the FDIC, BankUnited’s liquidity needs, particularly liquidity to fund growth of interest earning assets, have been and continue to be met by deposit growth and FHLB advances. The investment portfolio also provides a source of liquidity.
BankUnited has access to additional liquidity through FHLB advances, other collateralized borrowings, wholesale deposits or the sale of available for sale securities. At SeptemberJune 30, 2017,2019, unencumbered investment securities available for sale totaled $4.3$5.8 billion. At SeptemberJune 30, 2017,2019, BankUnited had available borrowing capacity at the FHLB of $3.8$3.6 billion, unused borrowing capacity at the FRB of $544$430 million and unused Federal funds lines of credit totaling $70$161 million. Management also has the ability to exert substantial control over the rate and timing of growth of the non-covered loan portfolio, and resultant requirements for liquidity to fund loans.
Continued runoff of the covered loan portfolio and FDIC indemnification asset and growth of deposits and the non-covered loan portfolioloans are the most significant trends expected to impact the Bank’s liquidity in the near term.
The ALCO policy has established several measures of liquidity which are monitored monthly by the ALCO and quarterly by the Board of Directors. One primary measure of liquidity monitored by management is the 30 day total liquidity ratio, defined as (a) the sum of cash and cash equivalents, pledgeable securities and a measure of funds expected to be generated by operations over the next 30 days; divided by (b) the sum of potential deposit runoff, liabilities maturing within the 30 day time frame and a measure of funds expected to be used in operations over the next 30 days. BankUnited’s liquidity is considered acceptable if the 30 day total liquidity ratio exceeds 100%. At SeptemberJune 30, 2017,2019, BankUnited’s 30 day total liquidity ratio was 172%200%. Management also monitors a one year liquidity ratio, defined as (a) cash and cash equivalents, pledgeable securities, unused borrowing capacity at the FHLB, and loans and non-agency securities maturing within one year; divided by (b) forecasted deposit outflows and borrowings maturing within one year. Forecasted deposit outflows, excluding certificate of deposits, are based on runoff rates derived from the most recent external core deposit analysis obtained by the Company. This ratio allows management to monitor liquidity over a longer time horizon. The acceptable threshold established by the ALCO for this liquidity measure is 100%. At SeptemberJune 30, 2017,2019, BankUnited’s one year liquidity ratio was 158%160%. Additional measures of liquidity regularly monitored by the ALCO include the ratio of wholesale funding to total assets, a measure of available liquidity to volatile liabilities, and the ratio of brokered deposits to total deposits, the ratio of FHLB advances to total funding, the percentage of investment securities backed by the U.S. government and government agencies and concentrations of large deposits. At SeptemberJune 30, 2017,2019, BankUnited was within acceptable limits established by the ALCO and the Board of Directors for each of these measures.
As a holding company, BankUnited, Inc. is a corporation separate and apart from its banking subsidiary, and therefore, provides for its own liquidity. BankUnited, Inc.’s main sources of funds include management fees and dividends from the Bank, access to capital markets and, to a lesser extent, its own available for sale securities portfolio. There are regulatory limitations that affect the ability of the Bank to pay dividends to BankUnited, Inc. Management believes that such limitations will not impact our ability to meet our ongoing near-term cash obligations.
We expect that our liquidity requirements will continue to be satisfied over the next 12 months through the sources of funds described above.
Interest Rate Risk
The principal component of the Company’s risk of loss arising from adverse changes in the fair value of financial instruments, or market risk, is interest rate risk, including the risk that assets and liabilities with similar re-pricing characteristics may not reprice at the same time or to the same degree. A primary objective of the Company’s asset/liability management activities is to maximize net interest income, while maintaining acceptable levels of interest rate risk. The ALCO
is responsible for establishing policies to limit exposure to interest rate risk, and to ensure procedures are established to monitor compliance with these policies. The guidelines established by the ALCO are approved at least annually by the Board of Directors.
Management believes that the simulation of net interest income in different interest rate environments provides the most meaningful measure of interest rate risk. Income simulation analysis is designed to capture not only the potential of all assets and liabilities to mature or reprice, but also the probability that they will do so. Income simulation also attends to the relative interest rate sensitivities of these items, and projects their behavior over an extended period of time. Finally, income simulation
permits management to assess the probable effects on the balance sheet not only of changes in interest rates, but also of proposed strategies for responding to them.
The income simulation model analyzes interest rate sensitivity by projecting net interest income over twelve and twenty-four month periods in a most likely rate scenario based on consensus forward interest rate curves versus net interest income in alternative rate scenarios. Simulations are generated based on both static and dynamic balance sheet assumptions. Management continually reviews and refines its interest rate risk management process in response to changes in the interest rate environment and economic climate. Currently, our model projects ainstantaneous rate shocks of down 200, down 100, plus 100, plus 200, plus 300 and plus 300400 basis point change with rates increasing by the magnitude of the rate ramp evenly over the next 12 monthsshifts as well as flattening and inverted yield curve scenarios and instantaneous rate shocks of down 100, plus 100, plus 200 and plus 300 basis points.scenarios. We continually evaluate the scenarios being modeled with a view toward adapting them to changing economic conditions, expectations and trends.
The Company’s ALCO policy provides that net interest income sensitivity will be considered acceptable if decreases in forecast net interest income based on a dynamic forecasted balance sheet, in specified parallel rate shock scenarios are within specified percentages of forecast net interest income in the most likely rate scenario over the next twelve months and in the second year. Currently, the most likely rate scenario contemplates four 25 basis point rate cuts over the forecast horizon. The following table illustrates the acceptable limits as defined byguidelines set forth in the ALCO policy and the impact on forecasted net interest income of down 100, plus 100, plus 200 and plus 300 basis point rate shockin the indicated simulated scenarios at SeptemberJune 30, 20172019 and December 31, 2016:2018:
| | | | Down 100 | | Plus 100 | | Plus 200 | | Plus 300 | Down 200 | | Down 100 | | Plus 100 | | Plus 200 | | Plus 300 | | Plus 400 |
| Policy Limits: | | | | | | | | |
| Policy Guidelines: | | | | | | | | | | | | |
| In year 1 | (6.0 | )% | | (6.0 | )% | | (10.0 | )% | | (14.0 | )% | (10.0 | )% | | (6.0 | )% | | (6.0 | )% | | (10.0 | )% | | (14.0 | )% | | (18.0 | )% |
| In year 2 | (9.0 | )% | | (9.0 | )% | | (13.0 | )% | | (17.0 | )% | (13.0 | )% | | (9.0 | )% | | (9.0 | )% | | (13.0 | )% | | (17.0 | )% | | (21.0 | )% |
| Model Results at September 30, 2017 - increase (decrease): | | | | | | | | |
| Model Results at June 30, 2019 - increase (decrease): | | | | | | | | | | | | |
| In year 1 | (0.4 | )% | | (0.2 | )% | | (0.6 | )% | | (1.2 | )% | (10.0 | )% | | (3.3 | )% | | 1.9 | % | | 3.8 | % | | 4.3 | % | | 3.7 | % |
| In year 2 | (3.2 | )% | | 1.7 | % | | 3.0 | % | | 4.2 | % | (13.8 | )% | | (5.3 | )% | | 3.2 | % | | 5.2 | % | | 7.1 | % | | 8.0 | % |
| Model Results at December 31, 2016 - increase (decrease): | | | | | | | | |
| Model Results at December 31, 2018 - increase (decrease): | | | | | | | | | | | | |
| In year 1 | (2.0 | )% | | 1.5 | % | | 2.8 | % | | 3.4 | % | (4.3 | )% | | (0.8 | )% | | 0.3 | % | | (0.9 | )% | | (2.4 | )% | | (5.6 | )% |
| In year 2 | (3.7 | )% | | 2.6 | % | | 4.6 | % | | 6.6 | % | (9.7 | )% | | (3.0 | )% | | 3.6 | % | | 4.4 | % | | 4.0 | % | | 3.1 | % |
The main contributor to the variation in results at June 30, 2019 as compared to the results at December 31, 2018 was the change in the path of the forward rate curve in the most likely scenario. At June 30, 2019, modeled results exceeded policy guidelines in the Down 200 scenario for year 2. Management is currently evaluating a variety of strategies that could potentially be employed to address this result, including but not limited to the re-positioning of a portion of its investment portfolio, restructuring of borrowings, or the use of derivatives.
Management also simulates changes in EVE in various interest rate environments. The ALCO policy has established parameters of acceptable risk that are defined in terms of the percentage change in EVE from a base scenario under sixeight rate scenarios, derived by implementing immediate parallel movements of plus and minusdown 100, 200, 300 and 300400 basis points from current rates. We did not simulate decreases in interest rates greater than 100200 basis points at SeptemberJune 30, 20172019 or December 31, 2018 due to the currentrelatively low rate environment.level of market interest rates. The parametersfollowing table illustrates the acceptable guidelines as established by the ALCO stipulate thatand the modeled declinechange in EVE is considered acceptable ifin the decline is less than 9%, 18%indicated scenarios at June 30, 2019 and 27% in plus or minus 100, plus or minus 200 and plus or minus 300 basis point scenarios, respectively. As of September 30, 2017, our simulation for the Company indicated percentage changes from base EVE of 1.7%, (3.6)%, (7.9)% and (12.7)% in down 100, plus 100, plus 200 and plus 300 basis point scenarios, respectively.December 31, 2018:
|
| | | | | | | | | | | | | | | | | |
| | Down 200 | | Down 100 | | Plus 100 | | Plus 200 | | Plus 300 | | Plus 400 |
| Policy Limits | (18.0 | )% | | (9.0 | )% | | (9.0 | )% | | (18.0 | )% | | (27.0 | )% | | (36.0 | )% |
| Model Results at June 30, 2019 - increase (decrease): | (5.7 | )% | | (1.2 | )% | | (1.5 | )% | | (4.4 | )% | | (8.0 | )% | | (12.0 | )% |
| Model Results at December 31, 2018 - increase (decrease): | 0.6 | % | | 2.5 | % | | (3.1 | )% | | (7.5 | )% | | (12.4 | )% | | (17.3 | )% |
These measures fall within an acceptable level of interest rate risk per the policiesguidelines established byin the ALCO and the Board of Directors. In the event the models indicate an unacceptable level of risk, the Company could undertake a number of actions that would reduce this risk, including the sale or re-positioning of a portion of its available for sale investment portfolio, restructuring of borrowings, or the use of derivatives such as interest rate swaps and caps.policy.
Many assumptions were used by the Company to calculate the impact of changes in interest rates, including the change in rates. Actual results may not be similar to the Company’s projections due to several factors including the timing and frequency of rate changes, market conditions, changes in depositor behavior and the shape of the yield curve. Actual results may also differ due to the Company’s actions, if any, in response to changing rates and conditions.
Derivative Financial Instruments
Interest rate swaps are one of the tools we use to manage interest rate risk. These derivative instruments are used to mitigate exposure to changes in interest rates on variable rate borrowings such as FHLB advances and to manage duration of liabilities. These interest rate swaps are designated as cash flow hedging instruments. The fair value of these instruments is included in other assets and other liabilities in our consolidated balance sheets and changes in fair value are reported in accumulated other comprehensive income. At SeptemberJune 30, 2017,2019, outstanding interest rate swaps designated as cash flow hedges had an aggregate notional amount of $2.0$3.1 billion. The aggregate fair value of interest rate swaps designated as cash flow
hedges included in other assets was $1.1 million and the aggregate fair value of interest rate swaps designated as cash flow hedges included in other liabilities was $0.3$1.5 million.
Interest rate swaps and caps not designated as cash flow hedges had an aggregate notional amount of $2.3$2.4 billion at SeptemberJune 30, 2017.2019. The aggregate fair value of these interest rate swaps and caps included in other assets was $27.3$41.4 million and the aggregate fair value included in other liabilities was $26.8$17.8 million. These interest rate swaps and caps were entered into as accommodations to certain of our commercial borrowers.
See Note 7 to the consolidated financial statements for additional information about derivative financial instruments.
Off-Balance Sheet Arrangements
For more information on contractual obligations and commitments, see Note 11 to the consolidated financial statements, the FHLB Advances, Notes and Other Borrowings section of this MD&A and Off-Balance Sheet Arrangements in the MD&A of the Company's 20162018 Annual Report on Form 10-K.
Critical Accounting Policies and Estimates
The Company has made no significant changes in its critical accounting policies and significant estimates from those disclosed in the 20162018 Annual Report on Form 10-K.
Non-GAAP Financial Measures
Tangible book value per common share is a non-GAAP financial measure. Management believes this measure is relevant to understanding the capital position and performance of the Company. Disclosure of this non-GAAP financial measure also provides a meaningful base for comparability to other financial institutions. The following table reconciles the non-GAAP financial measurement of tangible book value per common share to the comparable GAAP financial measurement of book value per common share at SeptemberJune 30, 20172019 (in thousands except share and per share data):
|
| | | |
| Total stockholders' equity | $ | 2,867,910 |
|
| Less: goodwill and other intangible assets | 77,696 |
|
| Tangible stockholders’ equity | $ | 2,790,214 |
|
| | |
| Common shares issued and outstanding | 95,315,633 |
|
| | |
| Book value per common share | $ | 30.09 |
|
| | |
| Tangible book value per common share | $ | 29.27 |
|
Non-loss share diluted earnings per share is a non-GAAP financial measure. Management believes disclosure of this measure provides readers with information that may be useful in understanding the impact of the covered loans and FDIC indemnification asset on the Company’s earnings for periods prior to the termination of the Single Family Shared-Loss Agreement. The following table reconciles this non-GAAP financial measurement to the comparable GAAP financial measurement of diluted earnings per common share for the three months ended June 30, 2018 (in millions except share and per share data, shares in thousands):
|
| | | |
| | |
| Total stockholders’ equity | $ | 2,623,489 |
|
| Less: goodwill and other intangible assets | 77,857 |
|
| Tangible stockholders’ equity | $ | 2,545,632 |
|
| | |
| Common shares issued and outstanding | 106,821,902 |
|
| | |
| Book value per common share | $ | 24.56 |
|
| | |
| Tangible book value per common share | $ | 23.83 |
|
|
| | | |
| | Three Months Ended June 30, 2018 |
| Net Income (GAAP) | $ | 89.9 |
|
| Less Loss Share Contribution | (25.0 | ) |
| Net Income as reported, minus Loss Share Contribution | $ | 64.9 |
|
| Diluted earnings per common share, excluding Loss Share Contribution: | |
| Diluted earnings per common share (GAAP) | $ | 0.82 |
|
| Less: Net impact on diluted earnings per common share of Loss Share Contribution (non-GAAP) | (0.23 | ) |
| Non-loss share diluted earnings per common share (non-GAAP) | $ | 0.59 |
|
| Non-loss share diluted earnings per share: | |
| Loss Share Contribution | $ | 25.0 |
|
| Weighted average shares for diluted earnings per common share (GAAP) | 105,471 |
|
| Impact on diluted earnings per common share of Loss Share Contribution (non-GAAP) | 0.24 |
|
| Impact on diluted earnings per common share of Loss Share Contribution: | |
| Loss Share Contribution, net of tax, allocated to participating securities | (1.0 | ) |
| Weighted average shares for diluted earnings per common share (GAAP) | 105,471 |
|
| Impact on diluted earnings per common share of Loss Share Contribution allocated to participating securities (non-GAAP) | (0.01 | ) |
| Net impact on diluted earnings per common share of Loss Share Contribution (non-GAAP) | $ | 0.23 |
|
Supplemental Calculations
Calculation of Loss Share Contribution and Non-Loss Share Earnings Per Share
Non-Loss Share Earnings are calculated by removing the total Loss Share Contribution from Net Income. The Loss Share Contribution is a hypothetical presentation of the impact of the covered loans and FDIC indemnification asset on earnings for each respective quarter, reflecting the excess of Loss Share Earnings over hypothetical interest income that could have been earned on alternative assets (in millions except share and per share data): |
| | | |
| | Three Months Ended June 30, 2018 (3) |
| Net Income As Reported | $ | 89.9 |
|
| Calculation of Loss Share Contribution: | |
| Interest Income - Covered Loans (Accretion) | $ | 84.2 |
|
| Amortization of FDIC Indemnification Asset | (44.3 | ) |
| Loss Share Earnings | 40.0 |
|
Hypothetical interest income on alternate assets (1) | (5.9 | ) |
| Loss Share Contribution, pre-tax | 34.1 |
|
Income taxes (2) | (9.0 | ) |
| Loss Share Contribution, after tax | $ | 25.0 |
|
| | |
| Net Income as reported, minus Loss Share Contribution | $ | 64.9 |
|
| | |
| Diluted Earnings Per Common Share, as Reported | $ | 0.82 |
|
| Earnings Per Share, Loss Share Contribution | (0.23 | ) |
| Non-Loss Share Diluted Earnings Per Share | $ | 0.59 |
|
| |
| (1) | See section entitled "Supplemental Calculations - Calculation of Hypothetical Interest Income on Alternate Assets" below for calculation of these amounts and underlying assumptions. |
(2) An assumed marginal tax rate of 26.5% was applied.
(3) Calculation variances of $0.1 million in the table above are due to rounding.
Calculation of Hypothetical Interest Income on Alternate Assets
The hypothetical interest income calculated below reflects the estimated income that may have been earned if the average balance of covered loans and the FDIC indemnification asset were liquidated and the proceeds assumed to be invested in securities at the weighted average yield on the Company’s investment securities portfolio as reported. Historically, cash received from the repayment, sale, or other resolution of covered loans and cash payments received from the FDIC under the terms of the Shared Loss Agreement have generally been reinvested in non-covered loans or investment securities. There is no assurance that the hypothetical results illustrated below would have been achieved if the covered loans and FDIC indemnification asset had been liquidated and proceeds reinvested (dollars in millions):
|
| | | |
| | Three Months Ended June 30, 2018 |
Average Balances (1) | |
| Average Covered Loans | $ | 476 |
|
| Average FDIC Indemnification Asset | 231 |
|
| Average Loss Share Asset | $ | 707 |
|
| | |
| Yield | |
Yield on securities - reported (2) | 3.33 | % |
| Hypothetical interest income on alternate assets | $ | 5.9 |
|
| |
| (1) | Calculated as the simple average of beginning and ending balances reported for each period. |
(2) The weighted average yield on the Company’s investment securities as reported for the applicable quarter.
Item 3. Quantitative and Qualitative Disclosures About Market Risk
See the section entitled “Interest Rate Risk” included in Item 2. “Management’s Discussion and Analysis of Financial Condition and Results of Operations.”
Item 4. Controls and Procedures
Evaluation of Disclosure Controls and Procedures
As of the end of the period covered by this Form 10-Q, we carried out an evaluation under the supervision and with the participation of our management, including the Chief Executive Officer and Chief Financial Officer, of the effectiveness of the design and operation of our disclosure controls and procedures as defined in Exchange Act Rules 13a-15(e) and 15d-15(e). Based upon that evaluation, the Chief Executive Officer and the Chief Financial Officer concluded that our disclosure controls and procedures were effective.
During the quarter ended SeptemberJune 30, 2017,2019, there were no changes in the Company’sCompany's internal control over financial reporting that materially affected, or are reasonably likely to materially affect, the Company’sCompany's internal control over financial reporting.
PART II. OTHER INFORMATION
Item 1. Legal Proceedings
The Company is involved as plaintiff or defendant in various legal actions arising in the normal course of business. In the opinion of management, based upon currently available information and the advice of legal counsel, the likelihood is remote that the impact of these proceedings, either individually or in the aggregate, would be material to the Company’s consolidated financial position, results of operations or cash flows.
Item 1A. Risk Factors
ForPossible replacement of the LIBOR benchmark interest rate may have an impact on our business, financial condition and results of operations.
In July 2017, the Financial Conduct Authority, a discussionregulator of financial services firms in the United Kingdom, announced that it intends to stop persuading or compelling banks to submit LIBOR rates after 2021. The announcement indicated that the continuation of LIBOR on the current basis cannot and will not be guaranteed after 2021. At this time, no consensus exists as to what rate or rates may become acceptable alternatives to LIBOR, although alternative reference rates such as SOFR are under consideration, and it is impossible to predict the effect of any such alternatives on the value of LIBOR-based securities and variable rate loans, subordinated debentures, or other securities or financial arrangements, given LIBOR's role in determining market interest rates globally. There is uncertainty with respect to the impact a potential discontinuation of LIBOR may have on credit, securities and derivatives markets broadly. Uncertainty as to the nature of alternative reference rates and as to potential changes or other reforms to LIBOR may adversely affect LIBOR rates and the value of LIBOR-based loans and securities in our portfolio, and may impact the markets in which we lend to customers and the availability and cost of hedging instruments and borrowings. If LIBOR rates are no longer available, and we are required to implement substitute indices for the calculation of interest rates under our loan agreements with our borrowers, we may incur significant expenses in effecting the transition, and may be subject to disputes or litigation with customers over the appropriateness or comparability to LIBOR of the substitute indices, which could have an adverse effect on our results of operations.
Management is in the process of evaluating the impact of the Company's possible transition from LIBOR to an alternative reference rate. To date, the Company has completed a gap assessment, identified the population of its current exposures to LIBOR-indexed instruments and the systems and models that may be impacted by the transition, established a formal governance structure for its LIBOR transition and is in the process of designing a detailed implementation plan.
There have been no material changes in the other risk factors relating to our business, please refer todisclosed by the factors discussed under “Part I-Item 1A - Risk Factors”Company in our 2016its 2018 Annual Report on Form 10-K filed with the Securities and Exchange Commission on February 28, 2017, in addition to the following factor.27, 2019.
A significant portion
Item 2. Unregistered Sales of our loans are to borrowers whose businesses are located in or secured by properties located in the stateEquity Securities and Use of Florida, which was impacted by Hurricane Irma. In addition, the Bank has a limited number of customers and collateral properties located in areas of Texas that were impacted by Hurricane Harvey. The effects of Hurricanes Irma and Harvey and other adverse weather events may negatively affect our geographic markets or disrupt our operations, which could have an adverse impact on our results of operations.Proceeds
Our geographic markets in Florida and other coastal areas are susceptible to severe weather, including hurricanes, flooding and damaging winds. On September 10, 2017, Hurricane Irma made landfall in Florida as a Category 4 hurricane affecting some areas with significant flooding, wind damage and power outages. In addition, the Bank has a limited number of customers and collateral properties located in areas of Texas that were impacted by Hurricane Harvey during August, 2017. Weather events such as Hurricanes Irma and Harvey can disrupt our operations, result in damage to our facilities and negatively affect the local economies in which we operate. These events may lead to a decline in loan originations, reduce or destroy the value of collateral for our loans, particularly real estate, negatively impact the business operations of our customers, and cause an increase in delinquencies, foreclosures and loan losses. These events may also lead to a decline in regional economic conditions and prospects in certain circumstances. Our business or results of operations may be adversely impacted by these and other negative effects of such weather events. |
| | | | | | | | | | | | | | |
| | | Issuer Purchases of Equity Securities |
| Period | | Total number of shares purchased(1) | | Average price paid per share | | Total number of shares purchased as part of publicly announced plans or programs | | Maximum number (or approximate dollar value) of shares that may yet be purchased under the plans or programs(2) |
| April 1 - April 30, 2019 | | — |
| | $ | — |
| | — |
| | $ | 110,025,642 |
|
| May 1 - May 31, 2019 | | 1,312,496 |
| | 34.77 |
| | 1,312,496 |
| | $ | 64,386,442 |
|
| June 1 - June 30, 2019 | | 1,699,496 |
| | 33.22 |
| | 1,699,496 |
| | $ | 7,934,581 |
|
| Total | | 3,011,992 |
| | $ | 33.89 |
| | 3,011,992 |
| | |
We are currently in the process of assessing the impact of Hurricanes Irma and Harvey on our borrowers’ ability to repay their obligations to the Bank and on the value of underlying collateral properties. Although we currently believe the storms did not materially impact the ability of the substantial majority of our borrowers to repay their loans, our impact assessment is ongoing, including with respect to the impact on our loan originations, the value of properties securing our loans or the performance of our loans, the economic condition of our borrowers and their ability to timely repay their obligations, and the overall impacts on regional economic conditions and our business, operations and growth prospects in the affected market areas. As a result, it is premature to conclude with certainty as to the ultimate impact of these hurricanes on our level of loan losses, our business or the results of our operations. The Bank is generally named as a loss payee on hazard and flood insurance policies covering collateral properties and carries casualty and business interruption insurance. These policies could partially mitigate losses that the Bank may sustain due to the effects of these hurricanes; however, the timing and amount of any proceeds that we may recover from insurance policies is uncertain and may not be sufficient to adequately compensate us for losses that we experience due to these hurricanes and other natural disasters. | |
| (1) | The total number of shares purchased during the periods indicated includes shares purchased as part of a publicly announced program. |
| |
| (2) | On January 22, 2019, the Company's Board of Directors authorized a share repurchase program under which the Company may repurchase up to $150 million of its outstanding common stock. No time limit was set for the completion of the share repurchase program. The authorization does not require the Company to acquire any specified number of common shares and may be commenced, suspended or discontinued without prior notice. Under this authorization, $7,934,581 remained available for purchase at June 30, 2019. |
Item 6.
Exhibits
|
| | | | |
Exhibit Number | | Description | | Location |
| | | | | |
| | | | Filed herewith |
| | | | | |
| | | | Filed herewith |
| | | | | |
| | | | Filed herewith |
| | | | | |
| | | | Filed herewith |
| | | | | |
| 101.INS | | The instance document does not appear in the interactive data file because its XBRL Instance Documenttags are embedded within the inline XBRL document | | Filed herewith |
| | | | | |
| 101.SCH | | XBRL Taxonomy Extension Schema | | Filed herewith |
| | | | | |
| 101.CAL | | XBRL Taxonomy Extension Calculation Linkbase | | Filed herewith |
| | | | | |
| 101.DEF | | XBRL Taxonomy Extension Definition Linkbase | | Filed herewith |
| | | | | |
| 101.LAB | | XBRL Taxonomy Extension Label Linkbase | | Filed herewith |
| | | | | |
| 101.PRE | | XBRL Taxonomy Extension Presentation Linkbase | | Filed herewith |
SIGNATURE
Pursuant to the requirements of the Securities Exchange Act of 1934, the registrant has duly caused this report to be signed on its behalf by the undersigned thereunto duly authorized this 8th6th day of November 2017.August 2019.
|
| |
| | /s/ Rajinder P. Singh |
| | Rajinder P. Singh |
| | Chairman, President and Chief Executive Officer |
| | |
| | |
| | /s/ Leslie N. Lunak |
| | Leslie N. Lunak |
| | Chief Financial Officer |