UNITED STATES
SECURITIES AND EXCHANGE COMMISSION
Washington, D.C. 20549
FORM 10-Q
ýQUARTERLY REPORT PURSUANT TO SECTION 13 OR 15(d) OF THE SECURITIES EXCHANGE ACT OF 1934 |
| |
| ☒ | QUARTERLY REPORT PURSUANT TO SECTION 13 OR 15(d) OF THE SECURITIES EXCHANGE ACT OF 1934 |
OR
|
| |
| ☐ | TRANSITION REPORT PURSUANT TO SECTION 13 OR 15(d) OF THE SECURITIES EXCHANGE ACT OF 1934 |
For the quarterly period endedSeptemberJune 30, 20172020
OR
oTRANSITION REPORT PURSUANT TO SECTION 13 OR 15(d) OF THE SECURITIES EXCHANGE ACT OF 1934
For the transition period from to
Commission File Number: 001-35039
BankUnited, Inc.
(Exact name of registrant as specified in its charter)
|
| | |
| Delaware | | 27-0162450 |
(State or other jurisdiction of incorporation or organization) | | (I.R.S. Employer Identification No.) |
|
| | | |
| 14817 Oak Lane | Miami Lakes FL | FL | 33016 |
| (Address of principal executive offices) | | | (Zip Code) |
Registrant’s telephone number, including area code: (305) (305) 569-2000
Indicate by check mark whether the registrant (1) has filed all reports required to be filed by Section 13 or 15(d) of the Securities Exchange Act of 1934 during the preceding 12 months (or for such shorter period that the registrant was required to file such reports), and (2) has been subject to such filing requirements for the past 90 days. Yes ý No o
Indicate by check mark whether the registrant has submitted electronically and posted on its corporate Web site, if any, every Interactive Data File required to be submitted and posted pursuant to Rule 405 of Regulation S-T (§232.405 of this chapter) during the preceding 12 months (or for such shorter period that the registrant was required to submit and post such files). Yes ý No o
Indicate by check mark whether the registrant is a large accelerated filer, an accelerated filer, a non-accelerated filer, or a smaller reporting company, or an emerging growth company. See the definitions of “large accelerated filer,” “accelerated filer” andfiler,” “smaller reporting company”company,” and "emerging growth company" in Rule 12b-2 of the Exchange Act.
|
| | | | | |
Large accelerated filerý | ☒ | Accelerated filer | ☐ | Accelerated filer o
Emerging growth company | ☐ |
Non-accelerated filero | ☐ | Smaller reporting companyo |
| ☐ | | | Emerging growth company o
|
If an emerging growth company, indicate by check mark if the registrant has elected not to use the extended transition period for complying with any new or revised financial accounting standards provided pursuant to Section 13(a) of the Exchange Act o
Indicate by check mark whether the registrant is a shell company (as defined in Rule 12b-2 of the Exchange Act). Yes o☐ No ý☒
Indicate the number of shares outstanding of each of the issuer’s classes of common stock, as of the latest practicable date.
|
| | | | |
| Class | | November 6, 2017Trading Symbol | | Name of Exchange on Which Registered |
| Common Stock, $0.01 Par Value | | 106,820,503BKU | | New York Stock Exchange |
The number of outstanding shares of the registrant common stock, $0.01 par value, as of August 5, 2020 was 92,401,950.
BANKUNITED, INC.
Form 10-Q
For the Quarter Ended SeptemberJune 30, 20172020
TABLE OF CONTENTS
|
| | |
| | | Page |
| | | |
| | | |
| | | |
| PART I. | | |
| | | |
| ITEM 1. | | |
| | | |
| | | |
| | | |
| | | |
| | | |
| | | |
| | | |
| ITEM 2. | | |
| | | |
| ITEM 3. | | |
| | | |
| ITEM 4. | | |
| | | |
| PART II. | | |
| | | |
| ITEM 1. | | |
| | | |
| ITEM 1A. | | |
| | |
| ITEM 2. | | |
| | | |
| ITEM 6. | | |
| | | |
| |
| | | |
GLOSSARY OF DEFINED TERMS
The following acronyms and terms may be used throughout this Form 10-Q, including the consolidated financial statements and related notes.
|
| | |
| ACI | | Loans acquired with evidence of deterioration in credit quality since origination (Acquired Credit Impaired) |
| ACL | | Allowance for credit losses |
| AFS | | Available for sale |
| ALCO | | Asset/Liability Committee |
| ALLL | | Allowance for loan and lease losses |
| AOCI | | Accumulated other comprehensive income |
ARMAPY | | Adjustable rate mortgageAnnual Percentage Yield |
| ASC | | Accounting Standards Codification |
| ASU | | Accounting Standards Update |
| BKU | | BankUnited, Inc. |
| BankUnited | | BankUnited, National Association |
| The Bank | | BankUnited, National Association |
| Bridge | | Bridge Funding Group, Inc. |
| Buyout loans | | FHA and VA insured mortgages from third party servicers who have exercised their right to purchase these loans out of GNMA securitizations |
| CARES Act | | Coronavirus Aid, Relief, and Economic Security Act |
| CDO | | Collateralized debt obligation |
| CECL | | Current expected credit losses |
| CET1 | | Common Equity Tier 1 capital |
CECLCFPB | | Current expected credit lossesConsumer Financial Protection Bureau |
| CLO | | Collateralized loan obligations |
| CMBS | | Commercial mortgage-backed securities |
| CME | | Chicago Mercantile Exchange |
| CMOs | | Collateralized mortgage obligations |
Commercial Shared-Loss AgreementCOVID-19 | | A commercial and other loans shared-loss agreement entered into with the FDIC in connection with the FSB AcquisitionCoronavirus disease of 2019 |
Covered assetsCPR | | Assets covered under the Loss Sharing AgreementsConstant prepayment rate |
Covered loansCUSIP | | Loans covered under the Loss Sharing AgreementsCommittee on Uniform Securities Identification Procedures |
| DIF | | Deposit insurance fund |
| DSCR | | Debt Service Coverage Ratio |
| EPS | | Earnings per common share |
| EVE | | Economic value of equity |
| FASB | | Financial Accounting Standards Board |
| FDIA | | Federal Deposit Insurance Act |
| FDIC | | Federal Deposit Insurance Corporation |
FEMAFHA loan | | Loan guaranteed by the Federal Emergency Management AgencyHousing Administration |
| FHLB | | Federal Home Loan Bank |
| FICO | | Fair Isaac Corporation (credit score) |
| FRB | | Federal Reserve Bank |
FSB Acquisition | | Acquisition of substantially all of the assets and assumption of all of the non-brokered deposits and substantially all of the other liabilities of BankUnited, FSB from the FDIC on May 21, 2009 |
| GAAP | | U.S. generally accepted accounting principles |
| GDP | | Gross Domestic Product |
HAMPGNMA | | Home Affordable Modification ProgramGovernment National Mortgage Association |
| HTM | | Held to maturity |
|
| | |
| IPO | | Initial public offering |
| IRS | | Internal Revenue Service |
| ISDA | | International Swaps and Derivatives Association |
| LGD | | Loss Given Default |
| LIBOR | | London InterBank Offered Rate |
| LIHTC | | Low Income Housing Tax Credits |
Loss Sharing Agreements | | Two loss sharing agreements entered into with the FDIC in connection with the FSB Acquisition |
| LTV | | Loan-to-value |
| MBS | | Mortgage-backed securities |
| MSA | | Metropolitan Statistical Area |
|
| | |
MSRsNRSRO | | Mortgage servicing rightsNationally recognized statistical rating organization |
New Loans | | Loans originated or purchased since the FSB Acquisition |
Non-ACI | | Loans acquired without evidence of deterioration in credit quality since origination |
NSF | | Non-sufficient funds |
NYTLCNYSE | | New York City Taxi and Limousine CommissionStock Exchange |
| OCC | | Office of the Comptroller of the Currency |
| OCI | | Other comprehensive income |
| OREO | | Other real estate owned |
OTTIPCD | | Other-than-temporary impairmentPurchased credit-deteriorated |
| PD | | Probability of default |
| Pinnacle | | Pinnacle Public Finance, Inc. |
| PPNR | | Pre-tax, pre-provision net revenue |
| PPP | | Small Business Administration’s Paycheck Protection Program |
| PPPLF | | FRB Paycheck Protection Program Liquidity Facility |
| Proxy Statement | | Definitive proxy statement for the Company's 2019 annual meeting of stockholders |
| PSU | | Performance Share Unit |
PinnacleQRMs | | Pinnacle Public Finance, Inc.Qualified residential mortgages |
| REIT | | Real Estate Investment Trust |
| ROU Asset | | Right-of-use Asset |
| RSU | | Restricted Share Unit |
| SBA | | U.S. Small Business Administration |
| SBF | | Small Business Finance Unit |
| SEC | | Securities and Exchange Commission |
Single Family Shared-Loss AgreementSOFR | | A single-family loan shared-loss agreement entered into with the FDIC in connection with the FSB AcquisitionSecured Overnight Financing Rate |
| TDR | | Troubled-debt restructuring |
| Tri-State | | New York, New Jersey and Connecticut |
| UPB | | Unpaid principal balance |
2014 PlanUSDA | | 2014 Omnibus Equity Incentive PlanU.S. Department of Agriculture |
| VA loan | | Loan guaranteed by the U.S. Department of Veterans Affairs |
| WARM | | Weighted-average remaining maturity |
PART I - FINANCIAL INFORMATION
Item 1. Financial Statements and Supplementary Data
BANKUNITED, INC. AND SUBSIDIARIES
CONSOLIDATED BALANCE SHEETS - UNAUDITED
(In thousands, except share and per share data) | | | | September 30,
2017 | | December 31,
2016 | June 30,
2020 | | December 31,
2019 |
| ASSETS | |
| | |
| |
| | |
|
| Cash and due from banks: | |
| | |
| |
| | |
|
| Non-interest bearing | $ | 34,883 |
| | $ | 40,260 |
| $ | 10,599 |
| | $ | 7,704 |
|
| Interest bearing | 3,714 |
| | 35,413 |
| 391,632 |
| | 206,969 |
|
| Interest bearing deposits at Federal Reserve Bank | 254,004 |
| | 372,640 |
| |
| Cash and cash equivalents | 292,601 |
| | 448,313 |
| 402,231 |
| | 214,673 |
|
| Investment securities available for sale, at fair value | 6,893,472 |
| | 6,073,584 |
| |
| Investment securities held to maturity | 10,000 |
| | 10,000 |
| |
| Investment securities (including securities recorded at fair value of $8,683,628 and $7,759,237) | | 8,693,628 |
| | 7,769,237 |
|
| Non-marketable equity securities | 270,239 |
| | 284,272 |
| 233,051 |
| | 253,664 |
|
| Loans held for sale | 31,507 |
| | 41,198 |
| 2,623 |
| | 37,926 |
|
| Loans (including covered loans of $537,976 and $614,042) | 20,610,430 |
| | 19,395,394 |
| |
| Allowance for loan and lease losses | (158,573 | ) | | (152,953 | ) | |
| Loans | | 23,834,889 |
| | 23,154,988 |
|
| Allowance for credit losses | | (266,123 | ) | | (108,671 | ) |
| Loans, net | 20,451,857 |
| | 19,242,441 |
| 23,568,766 |
| | 23,046,317 |
|
| FDIC indemnification asset | 349,617 |
| | 515,933 |
| |
| Bank owned life insurance | 248,876 |
| | 239,736 |
| 292,012 |
| | 282,151 |
|
| Equipment under operating lease, net | 588,207 |
| | 539,914 |
| |
| Deferred tax asset, net | 23,910 |
| | 62,940 |
| |
| Operating lease equipment, net | | 689,965 |
| | 698,153 |
|
| Goodwill and other intangible assets | 77,857 |
| | 78,047 |
| 77,652 |
| | 77,674 |
|
| Other assets | 316,688 |
| | 343,773 |
| 785,971 |
| | 491,498 |
|
| Total assets | $ | 29,554,831 |
| | $ | 27,880,151 |
| $ | 34,745,899 |
| | $ | 32,871,293 |
|
| | | | | | | |
| LIABILITIES AND STOCKHOLDERS’ EQUITY | |
| | |
| |
| | |
|
| Liabilities: | |
| | |
| |
| | |
|
| Demand deposits: | |
| | |
| |
| | |
|
| Non-interest bearing | $ | 3,096,492 |
| | $ | 2,960,591 |
| $ | 5,883,362 |
| | $ | 4,294,824 |
|
| Interest bearing | 1,828,809 |
| | 1,523,064 |
| 2,865,944 |
| | 2,130,976 |
|
| Savings and money market | 9,964,242 |
| | 9,251,593 |
| 10,590,315 |
| | 10,621,544 |
|
| Time | 6,333,701 |
| | 5,755,642 |
| 6,730,803 |
| | 7,347,247 |
|
| Total deposits | 21,223,244 |
| | 19,490,890 |
| 26,070,424 |
| | 24,394,591 |
|
| Federal Home Loan Bank advances | 4,871,000 |
| | 5,239,348 |
| |
| Federal funds purchased | | 100,000 |
| | 100,000 |
|
| FHLB and PPPLF borrowings | | 4,650,599 |
| | 4,480,501 |
|
| Notes and other borrowings | 402,828 |
| | 402,809 |
| 722,332 |
| | 429,338 |
|
| Other liabilities | 434,270 |
| | 328,675 |
| 447,491 |
| | 486,084 |
|
| Total liabilities | 26,931,342 |
| | 25,461,722 |
| 31,990,846 |
| | 29,890,514 |
|
| | | | | | | |
| Commitments and contingencies |
|
| |
|
|
|
| |
|
|
| | | | | | | |
| Stockholders' equity: | |
| | |
| |
| | |
|
| Common stock, par value $0.01 per share, 400,000,000 shares authorized; 106,821,902 and 104,166,945 shares issued and outstanding | 1,068 |
| | 1,042 |
| |
| Common stock, par value $0.01 per share, 400,000,000 shares authorized; 92,420,278 and 95,128,231 shares issued and outstanding | | 924 |
| | 951 |
|
| Paid-in capital | 1,492,790 |
| | 1,426,459 |
| 991,509 |
| | 1,083,920 |
|
| Retained earnings | 1,077,042 |
| | 949,681 |
| 1,905,639 |
| | 1,927,735 |
|
| Accumulated other comprehensive income | 52,589 |
| | 41,247 |
| |
| Accumulated other comprehensive loss | | (143,019 | ) | | (31,827 | ) |
| Total stockholders' equity | 2,623,489 |
| | 2,418,429 |
| 2,755,053 |
| | 2,980,779 |
|
| Total liabilities and stockholders' equity | $ | 29,554,831 |
| | $ | 27,880,151 |
| $ | 34,745,899 |
| | $ | 32,871,293 |
|
1
The accompanying notes are an integral part of these consolidated financial statements
BANKUNITED, INC. AND SUBSIDIARIES
CONSOLIDATED STATEMENTS OF INCOME - UNAUDITED
(In thousands, except per share data)
| | | | Three Months Ended September 30, | | Nine Months Ended September 30, | Three Months Ended June 30, | | Six Months Ended June 30, |
| | 2017 | | 2016 | | 2017 | | 2016 | 2020 | | 2019 | | 2020 | | 2019 |
| Interest income: | | | | | |
| | |
| | | | | |
| | |
|
| Loans | $ | 253,815 |
| | $ | 227,233 |
| | $ | 739,586 |
| | $ | 662,439 |
| $ | 213,938 |
| | $ | 249,364 |
| | $ | 448,297 |
| | $ | 489,996 |
|
| Investment securities | 51,851 |
| | 39,712 |
| | 141,624 |
| | 109,963 |
| 50,932 |
| | 72,796 |
| | 106,992 |
| | 149,141 |
|
| Other | 3,777 |
| | 3,036 |
| | 10,606 |
| | 8,850 |
| 2,908 |
| | 5,069 |
| | 6,628 |
| | 9,921 |
|
| Total interest income | 309,443 |
| | 269,981 |
| | 891,816 |
| | 781,252 |
| 267,778 |
| | 327,229 |
| | 561,917 |
| | 649,058 |
|
| Interest expense: | | | | | | | | | | | | | | |
| Deposits | 45,919 |
| | 30,968 |
| | 120,161 |
| | 86,427 |
| 50,187 |
| | 99,987 |
| | 133,009 |
| | 197,408 |
|
| Borrowings | 22,260 |
| | 17,278 |
| | 60,209 |
| | 51,939 |
| 27,254 |
| | 36,359 |
| | 57,995 |
| | 69,866 |
|
| Total interest expense | 68,179 |
| | 48,246 |
| | 180,370 |
| | 138,366 |
| 77,441 |
| | 136,346 |
| | 191,004 |
| | 267,274 |
|
| Net interest income before provision for loan losses | 241,264 |
| | 221,735 |
| | 711,446 |
| | 642,886 |
| |
| Provision for (recovery of) loan losses (including $261, $(445), $2,693 and $(1,119) for covered loans) | 37,854 |
| | 24,408 |
| | 63,573 |
| | 42,449 |
| |
| Net interest income after provision for loan losses | 203,410 |
| | 197,327 |
| | 647,873 |
| | 600,437 |
| |
| Net interest income before provision for credit losses | | 190,337 |
| | 190,883 |
| | 370,913 |
| | 381,784 |
|
| Provision for (recovery of) credit losses | | 25,414 |
| | (2,747 | ) | | 150,842 |
| | 7,534 |
|
| Net interest income after provision for credit losses | | 164,923 |
| | 193,630 |
| | 220,071 |
| | 374,250 |
|
| Non-interest income: | | | | | | | | | | | | | | |
| Income from resolution of covered assets, net | 6,400 |
| | 8,883 |
| | 22,066 |
| | 26,426 |
| |
| Net gain (loss) on FDIC indemnification | (4,838 | ) | | 993 |
| | (14,174 | ) | | (9,410 | ) | |
| Service charges and fees | 4,938 |
| | 5,171 |
| | 15,554 |
| | 14,529 |
| |
| Gain (loss) on sale of loans, net (including $0, $(10,033), $(1,582) and $(14,895) related to covered loans) | 2,447 |
| | (7,947 | ) | | 6,601 |
| | (7,360 | ) | |
| Gain on investment securities available for sale, net | 26,931 |
| | 3,008 |
| | 29,194 |
| | 10,065 |
| |
| Deposit service charges and fees | | 3,701 |
| | 4,290 |
| | 7,887 |
| | 8,120 |
|
| Gain on sale of loans, net | | 4,326 |
| | 2,121 |
| | 7,792 |
| | 5,057 |
|
| Gain on investment securities, net | | 6,836 |
| | 4,116 |
| | 3,383 |
| | 9,901 |
|
| Lease financing | 13,287 |
| | 11,188 |
| | 40,067 |
| | 32,762 |
| 16,150 |
| | 17,005 |
| | 31,631 |
| | 34,191 |
|
| Other non-interest income | 4,161 |
| | 3,779 |
| | 12,055 |
| | 10,118 |
| 7,338 |
| | 7,805 |
| | 10,956 |
| | 14,323 |
|
| Total non-interest income | 53,326 |
| | 25,075 |
| | 111,363 |
| | 77,130 |
| 38,351 |
| | 35,337 |
| | 61,649 |
| | 71,592 |
|
| Non-interest expense: | | | | | | | | | | | | | | |
| Employee compensation and benefits | 58,327 |
| | 55,162 |
| | 178,386 |
| | 166,374 |
| 48,877 |
| | 57,251 |
| | 107,764 |
| | 122,484 |
|
| Occupancy and equipment | 18,829 |
| | 18,867 |
| | 56,689 |
| | 57,199 |
| 11,901 |
| | 13,991 |
| | 24,270 |
| | 27,157 |
|
| Amortization of FDIC indemnification asset | 45,225 |
| | 38,957 |
| | 135,351 |
| | 116,711 |
| |
| Deposit insurance expense | 5,764 |
| | 4,943 |
| | 16,827 |
| | 12,866 |
| 4,806 |
| | 5,027 |
| | 9,209 |
| | 9,068 |
|
| Professional fees | 2,748 |
| | 3,884 |
| | 12,573 |
| | 10,119 |
| 3,131 |
| | 6,937 |
| | 6,335 |
| | 14,808 |
|
| Telecommunications and data processing | 3,452 |
| | 3,746 |
| | 10,481 |
| | 10,800 |
| |
| Depreciation of equipment under operating lease | 8,905 |
| | 6,855 |
| | 25,655 |
| | 20,004 |
| |
| Technology and telecommunications | | 14,025 |
| | 12,013 |
| | 26,621 |
| | 23,181 |
|
| Depreciation of operating lease equipment | | 12,219 |
| | 11,489 |
| | 24,822 |
| | 23,301 |
|
| Other non-interest expense | 13,455 |
| | 15,590 |
| | 37,735 |
| | 40,151 |
| 11,411 |
| | 13,377 |
| | 26,217 |
| | 26,776 |
|
| Total non-interest expense | 156,705 |
| | 148,004 |
| | 473,697 |
| | 434,224 |
| 106,370 |
| | 120,085 |
| | 225,238 |
| | 246,775 |
|
| Income before income taxes | 100,031 |
| | 74,398 |
| | 285,539 |
| | 243,343 |
| 96,904 |
| | 108,882 |
| | 56,482 |
| | 199,067 |
|
| Provision for income taxes | 32,252 |
| | 23,550 |
| | 89,060 |
| | 80,896 |
| 20,396 |
| | 27,431 |
| | 10,925 |
| | 51,644 |
|
| Net income | $ | 67,779 |
| | $ | 50,848 |
| | $ | 196,479 |
| | $ | 162,447 |
| $ | 76,508 |
| | $ | 81,451 |
| | $ | 45,557 |
| | $ | 147,423 |
|
| Earnings per common share, basic (see Note 2) | $ | 0.62 |
| | $ | 0.47 |
| | $ | 1.79 |
| | $ | 1.52 |
| |
| Earnings per common share, diluted (see Note 2) | $ | 0.62 |
| | $ | 0.47 |
| | $ | 1.79 |
| | $ | 1.50 |
| |
| Cash dividends declared per common share | $ | 0.21 |
| | $ | 0.21 |
| | $ | 0.63 |
| | $ | 0.63 |
| |
| Earnings per common share, basic | | $ | 0.80 |
| | $ | 0.81 |
| | $ | 0.47 |
| | $ | 1.46 |
|
| Earnings per common share, diluted | | $ | 0.80 |
| | $ | 0.81 |
| | $ | 0.47 |
| | $ | 1.45 |
|
2
The accompanying notes are an integral part of these consolidated financial statements
BANKUNITED, INC. AND SUBSIDIARIES
CONSOLIDATED STATEMENTS OF COMPREHENSIVE INCOME - UNAUDITED
(In thousands)
| | | | Three Months Ended September 30, | | Nine Months Ended September 30, | Three Months Ended June 30, | | Six Months Ended June 30, |
| | 2017 | | 2016 | | 2017 | | 2016 | 2020 | | 2019 | | 2020 | | 2019 |
| | | | | | | | | | | | | | | |
| Net income | $ | 67,779 |
| | $ | 50,848 |
| | $ | 196,479 |
| | $ | 162,447 |
| $ | 76,508 |
| | $ | 81,451 |
| | $ | 45,557 |
| | $ | 147,423 |
|
| Other comprehensive income (loss), net of tax: | | |
|
| | | | |
| | |
|
| | | | |
|
| Unrealized gains on investment securities available for sale: | | |
|
| | | | |
| |
| Net unrealized holding gain arising during the period | 8,557 |
| | 3,216 |
| | 32,826 |
| | 53,490 |
| |
| Unrealized gains (losses) on investment securities available for sale: | | | |
|
| | | | |
|
| Net unrealized holding gain (loss) arising during the period | | 188,405 |
| | 23,326 |
| | (24,755 | ) | | 44,943 |
|
| Reclassification adjustment for net securities gains realized in income | (16,293 | ) | | (1,820 | ) | | (17,662 | ) | | (6,090 | ) | (4,264 | ) | | (2,877 | ) | | (5,404 | ) | | (6,050 | ) |
| Net change in unrealized gains on securities available for sale | (7,736 | ) | | 1,396 |
| | 15,164 |
| | 47,400 |
| |
| Net change in unrealized gain (loss) on securities available for sale | | 184,141 |
| | 20,449 |
| | (30,159 | ) | | 38,893 |
|
| Unrealized losses on derivative instruments: | | |
|
| | | | |
| | |
|
| | | | |
|
| Net unrealized holding gain (loss) arising during the period | (170 | ) | | 5,055 |
| | (8,337 | ) | | (34,948 | ) | |
| Reclassification adjustment for net losses realized in income | 1,210 |
| | 2,264 |
| | 4,515 |
| | 7,896 |
| |
| Net unrealized holding loss arising during the period | | (11,070 | ) | | (37,218 | ) | | (91,884 | ) | | (57,893 | ) |
| Reclassification adjustment for net (gains) losses realized in income | | 7,502 |
| | (1,241 | ) | | 10,851 |
| | (3,242 | ) |
| Net change in unrealized losses on derivative instruments | 1,040 |
| | 7,319 |
| | (3,822 | ) | | (27,052 | ) | (3,568 | ) | | (38,459 | ) | | (81,033 | ) | | (61,135 | ) |
| Other comprehensive income (loss) | (6,696 | ) | | 8,715 |
| | 11,342 |
| | 20,348 |
| 180,573 |
| | (18,010 | ) | | (111,192 | ) | | (22,242 | ) |
| Comprehensive income | $ | 61,083 |
| | $ | 59,563 |
| | $ | 207,821 |
| | $ | 182,795 |
| |
| Comprehensive income (loss) | | $ | 257,081 |
| | $ | 63,441 |
| | $ | (65,635 | ) | | $ | 125,181 |
|
3
The accompanying notes are an integral part of these consolidated financial statements
BANKUNITED, INC. AND SUBSIDIARIES
CONSOLIDATED STATEMENTS OF CASH FLOWS - UNAUDITED
(In thousands)
| | | | Nine Months Ended September 30, | Six Months Ended June 30, |
| | 2017 | | 2016 | 2020 | | 2019 |
| Cash flows from operating activities: | |
| | |
| |
| | |
|
| Net income | $ | 196,479 |
| | $ | 162,447 |
| $ | 45,557 |
| | $ | 147,423 |
|
| Adjustments to reconcile net income to net cash provided by operating activities: | | | | | | |
| Amortization and accretion, net | (71,111 | ) | | (90,360 | ) | (11,590 | ) | | (22,452 | ) |
| Provision for loan losses | 63,573 |
| | 42,449 |
| |
| Income from resolution of covered assets, net | (22,066 | ) | | (26,426 | ) | |
| Net loss on FDIC indemnification | 14,174 |
| | 9,410 |
| |
| (Gain) loss on sale of loans, net | (6,601 | ) | | 7,360 |
| |
| Increase in cash surrender value of bank owned life insurance | (4,647 | ) | | (2,973 | ) | |
| Gain on investment securities available for sale, net | (29,194 | ) | | (10,065 | ) | |
| Provision for credit losses | | 150,842 |
| | 7,534 |
|
| Gain on sale of loans, net | | (7,792 | ) | | (5,057 | ) |
| Gain on investment securities, net | | (3,383 | ) | | (9,901 | ) |
| Equity based compensation | 14,337 |
| | 13,418 |
| 7,351 |
| | 11,251 |
|
| Depreciation and amortization | 45,204 |
| | 38,971 |
| 35,691 |
| | 35,555 |
|
| Deferred income taxes | 31,625 |
| | 33,958 |
| (769 | ) | | 10,813 |
|
| Proceeds from sale of loans held for sale | 126,778 |
| | 121,968 |
| 369,807 |
| | 209,854 |
|
| Loans originated for sale, net of repayments | (109,588 | ) | | (108,075 | ) | (17,681 | ) | | (51,024 | ) |
| Other: | | | | | | |
| (Increase) decrease in other assets | 15,743 |
| | (9,502 | ) | (23,101 | ) | | 31,897 |
|
| Increase (decrease) in other liabilities | (33,546 | ) | | 44,708 |
| |
| Decrease in other liabilities | | (224,093 | ) | | (128,097 | ) |
| Net cash provided by operating activities | 231,160 |
| | 227,288 |
| 320,839 |
| | 237,796 |
|
| | | | | | | |
| Cash flows from investing activities: | |
| | |
| |
| | |
|
| Purchase of investment securities available for sale | (2,355,872 | ) | | (2,224,174 | ) | |
| Proceeds from repayments and calls of investment securities available for sale | 861,618 |
| | 457,610 |
| |
| Proceeds from sale of investment securities available for sale | 827,353 |
| | 753,756 |
| |
| Purchase of investment securities | | (2,263,847 | ) | | (2,160,715 | ) |
| Proceeds from repayments and calls of investment securities | | 587,139 |
| | 647,214 |
|
| Proceeds from sale of investment securities | | 547,337 |
| | 1,626,250 |
|
| Purchase of non-marketable equity securities | (185,718 | ) | | (178,813 | ) | (128,562 | ) | | (196,137 | ) |
| Proceeds from redemption of non-marketable equity securities | 199,751 |
| | 115,388 |
| 149,175 |
| | 173,400 |
|
| Purchases of loans | (949,294 | ) | | (936,882 | ) | (1,085,437 | ) | | (894,235 | ) |
| Loan originations, repayments and resolutions, net | (192,075 | ) | | (1,389,435 | ) | 68,012 |
| | (51,014 | ) |
| Proceeds from sale of loans, net | 98,404 |
| | 120,537 |
| 11,604 |
| | 9,560 |
|
| Decrease in FDIC indemnification asset for claims filed | 16,768 |
| | 30,829 |
| |
| Acquisition of equipment under operating lease, net | (73,948 | ) | | (52,399 | ) | |
| Proceeds from sale of operating lease equipment | | — |
| | 8,986 |
|
| Acquisition of operating lease equipment | | (19,118 | ) | | (37,122 | ) |
| Other investing activities | (31,718 | ) | | (19,577 | ) | (10,663 | ) | | (24,950 | ) |
| Net cash used in investing activities | (1,784,731 | ) | | (3,323,160 | ) | (2,144,360 | ) | | (898,763 | ) |
| | | | (Continued) |
| | | (Continued) |
|
| | | | | |
| | | | | |
| | | | | |
| | | | | |
| | | | | |
| | | | | |
| | | | | |
| | | | | |
| | | | | |
4
The accompanying notes are an integral part of these consolidated financial statements
BANKUNITED, INC. AND SUBSIDIARIES
CONSOLIDATED STATEMENTS OF CASH FLOWS - UNAUDITED (Continued)
(In thousands)
| | | | Nine Months Ended September 30, | Six Months Ended June 30, |
| | 2017 | | 2016 | 2020 | | 2019 |
| Cash flows from financing activities: | |
| | |
| | | |
| Net increase in deposits | 1,732,354 |
| | 1,897,808 |
| 1,675,833 |
| | 448,177 |
|
| Additions to Federal Home Loan Bank advances | 3,921,000 |
| | 3,360,000 |
| |
| Repayments of Federal Home Loan Bank advances | (4,290,000 | ) | | (2,150,000 | ) | |
| Net decrease in federal funds purchased | | — |
| | (76,000 | ) |
| Additions to FHLB and PPPLF borrowings | | 3,762,336 |
| | 2,456,000 |
|
| Repayments of FHLB and PPPLF borrowings | | (3,596,310 | ) | | (1,921,000 | ) |
| Proceeds from issuance of notes, net | | 293,858 |
| | — |
|
| Dividends paid | (68,583 | ) | | (67,342 | ) | (42,702 | ) | | (42,937 | ) |
| Exercise of stock options | 61,519 |
| | 222 |
| |
| Repurchase of common stock | | (100,972 | ) | | (142,065 | ) |
| Other financing activities | 41,569 |
| | 49,638 |
| 19,036 |
| | (448 | ) |
| Net cash provided by financing activities | 1,397,859 |
| | 3,090,326 |
| 2,011,079 |
| | 721,727 |
|
| Net increase (decrease) in cash and cash equivalents | (155,712 | ) | | (5,546 | ) | |
| Net increase in cash and cash equivalents | | 187,558 |
| | 60,760 |
|
| Cash and cash equivalents, beginning of period | 448,313 |
| | 267,500 |
| 214,673 |
| | 382,073 |
|
| Cash and cash equivalents, end of period | $ | 292,601 |
| | $ | 261,954 |
| $ | 402,231 |
| | $ | 442,833 |
|
| | | | | | | |
| Supplemental disclosure of cash flow information: | | | | | | |
| Interest paid | $ | 169,759 |
| | $ | 132,398 |
| $ | 209,233 |
| | $ | 258,561 |
|
| Income taxes paid, net | $ | 46,320 |
| | $ | 8,168 |
| |
| Income taxes refunded (paid), net | | $ | 4,883 |
| | $ | (4,350 | ) |
| | | | | | | |
| Supplemental schedule of non-cash investing and financing activities: | | | | | | |
| Unsettled sale of loans | | $ | 11,058 |
| | $ | — |
|
| Transfers from loans to other real estate owned and other repossessed assets | $ | 6,738 |
| | $ | 11,679 |
| $ | 4,161 |
| | $ | 2,817 |
|
| Transfers from loans to loans held for sale | | $ | 329,308 |
| | $ | 342,310 |
|
| Transfers from loans held for sale to loans | | $ | 9,055 |
| | $ | — |
|
| Dividends declared, not paid | $ | 23,045 |
| | $ | 22,482 |
| $ | 21,909 |
| | $ | 20,621 |
|
| Unsettled purchases of investment securities available for sale | $ | 107,500 |
| | $ | — |
| |
| Unsettled sales of investment securities | | $ | 177,546 |
| | $ | — |
|
| Unsettled purchases of investment securities | | $ | 2,758 |
| | $ | 21,396 |
|
5
The accompanying notes are an integral part of these consolidated financial statements
BANKUNITED, INC. AND SUBSIDIARIES
CONSOLIDATED STATEMENTS OF STOCKHOLDERS’ EQUITY - UNAUDITED
(In thousands, except share data)
|
| | | | | | | | | | | | | | | | | | | | | | |
| | Common Shares Outstanding | | Common Stock | | Paid-in Capital | | Retained Earnings | | Accumulated Other Comprehensive Income | | Total Stockholders’ Equity |
| Balance at December 31, 2016 | 104,166,945 |
| | $ | 1,042 |
| | $ | 1,426,459 |
| | $ | 949,681 |
| | $ | 41,247 |
| | $ | 2,418,429 |
|
| Comprehensive income | — |
| | — |
| | — |
| | 196,479 |
| | 11,342 |
| | 207,821 |
|
| Dividends | — |
| | — |
| | — |
| | (69,118 | ) | | — |
| | (69,118 | ) |
| Equity based compensation | 618,306 |
| | 6 |
| | 12,103 |
| | — |
| | — |
| | 12,109 |
|
| Forfeiture of unvested shares and shares surrendered for tax withholding obligations | (267,457 | ) | | (3 | ) | | (7,268 | ) | | — |
| | — |
| | (7,271 | ) |
| Exercise of stock options | 2,304,108 |
| | 23 |
| | 61,496 |
| | — |
| | — |
| | 61,519 |
|
| Balance at September 30, 2017 | 106,821,902 |
| | $ | 1,068 |
| | $ | 1,492,790 |
| | $ | 1,077,042 |
| | $ | 52,589 |
| | $ | 2,623,489 |
|
| | | | | | | | | | | | |
| Balance at December 31, 2015 | 103,626,255 |
| | $ | 1,036 |
| | $ | 1,406,786 |
| | $ | 813,894 |
| | $ | 22,182 |
| | $ | 2,243,898 |
|
| Comprehensive income | — |
| | — |
| | — |
| | 162,447 |
| | 20,348 |
| | 182,795 |
|
| Dividends | — |
| | — |
| | — |
| | (67,444 | ) | | — |
| | (67,444 | ) |
| Equity based compensation | 644,888 |
| | 6 |
| | 13,250 |
| | — |
| | — |
| | 13,256 |
|
| Forfeiture of unvested shares and shares surrendered for tax withholding obligations | (139,718 | ) | | (1 | ) | | (483 | ) | | — |
| | — |
| | (484 | ) |
| Exercise of stock options | 10,000 |
| | — |
| | 222 |
| | — |
| | — |
| | 222 |
|
| Tax benefits from dividend equivalents and equity based compensation | — |
| | — |
| | 847 |
| | — |
| | — |
| | 847 |
|
| Balance at September 30, 2016 | 104,141,425 |
| | $ | 1,041 |
| | $ | 1,420,622 |
| | $ | 908,897 |
| | $ | 42,530 |
| | $ | 2,373,090 |
|
|
| | | | | | | | | | | | | | | | | | | | | | |
| | Common Shares Outstanding | | Common Stock | | Paid-in Capital | | Retained Earnings | | Accumulated Other Comprehensive Income (Loss) | | Total Stockholders’ Equity |
| Balance at March 31, 2020 | 92,406,294 |
| | $ | 924 |
| | $ | 987,757 |
| | $ | 1,851,040 |
| | $ | (323,592 | ) | | $ | 2,516,129 |
|
| Comprehensive income | — |
| | — |
| | — |
| | 76,508 |
| | 180,573 |
| | 257,081 |
|
| Dividends ($0.23 per common share) | — |
| | — |
| | — |
| | (21,909 | ) | | — |
| | (21,909 | ) |
| Equity based compensation | 56,688 |
| | 1 |
| | 3,762 |
| | — |
| | — |
| | 3,763 |
|
| Forfeiture of unvested shares and shares surrendered for tax withholding obligations | (42,704 | ) | | (1 | ) | | (10 | ) | | — |
| | — |
| | (11 | ) |
| Balance at June 30, 2020 | 92,420,278 |
| | $ | 924 |
| | $ | 991,509 |
| | $ | 1,905,639 |
| | $ | (143,019 | ) | | $ | 2,755,053 |
|
| | | | | | | | | | | | |
| Balance at March 31, 2019 | 98,404,303 |
| | $ | 984 |
| | $ | 1,179,235 |
| | $ | 1,742,530 |
| | $ | 641 |
| | $ | 2,923,390 |
|
| Comprehensive income | — |
| | — |
| | — |
| | 81,451 |
| | (18,010 | ) | | 63,441 |
|
| Dividends ($0.21 per common share) | — |
| | — |
| | — |
| | (20,621 | ) | | — |
| | (20,621 | ) |
| Equity based compensation | 18,383 |
| | — |
| | 3,967 |
| | — |
| | — |
| | 3,967 |
|
| Forfeiture of unvested shares and shares surrendered for tax withholding obligations | (95,061 | ) | | (1 | ) | | (175 | ) | | — |
| | — |
| | (176 | ) |
| Repurchase of common stock | (3,011,992 | ) | | (30 | ) | | (102,061 | ) | | — |
| | — |
| | (102,091 | ) |
| Balance at June 30, 2019 | 95,315,633 |
| | $ | 953 |
| | $ | 1,080,966 |
| | $ | 1,803,360 |
| | $ | (17,369 | ) | | $ | 2,867,910 |
|
|
| | | | | | | | | | | | | | | | | | | | | | |
| | Common Shares Outstanding | | Common Stock | | Paid-in Capital | | Retained Earnings | | Accumulated Other Comprehensive Income (Loss) | | Total Stockholders’ Equity |
| Balance at December 31, 2019 | 95,128,231 |
| | $ | 951 |
| | $ | 1,083,920 |
| | $ | 1,927,735 |
| | $ | (31,827 | ) | | $ | 2,980,779 |
|
| Impact of adoption of ASU 2016-13 | — |
| | — |
| | — |
| | (23,817 | ) | | — |
| | (23,817 | ) |
| Comprehensive loss | — |
| | — |
| | — |
| | 45,557 |
| | (111,192 | ) | | (65,635 | ) |
| Dividends ($0.46 per common share) | — |
| | — |
| | — |
| | (43,836 | ) | | — |
| | (43,836 | ) |
| Equity based compensation | 743,696 |
| | 8 |
| | 11,428 |
| | — |
| | — |
| | 11,436 |
|
| Forfeiture of unvested shares and shares surrendered for tax withholding obligations | (186,072 | ) | | (3 | ) | | (4,428 | ) | | — |
| | — |
| | (4,431 | ) |
| Exercise of stock options | 60,000 |
| | 1 |
| | 1,528 |
| | — |
| | — |
| | 1,529 |
|
| Repurchase of common stock | (3,325,577 | ) | | (33 | ) | | (100,939 | ) | | — |
| | — |
| | (100,972 | ) |
| Balance at June 30, 2020 | 92,420,278 |
| | $ | 924 |
| | $ | 991,509 |
| | $ | 1,905,639 |
| | $ | (143,019 | ) | | $ | 2,755,053 |
|
| | | | | | | | | | | | |
| Balance at December 31, 2018 | 99,141,374 |
| | $ | 991 |
| | $ | 1,220,147 |
| | $ | 1,697,822 |
| | $ | 4,873 |
| | $ | 2,923,833 |
|
| Comprehensive income | — |
| | — |
| | — |
| | 147,423 |
| | (22,242 | ) | | 125,181 |
|
| Dividends ($0.42 per common share) | — |
| | — |
| | — |
| | (41,885 | ) | | — |
| | (41,885 | ) |
| Equity based compensation | 582,353 |
| | 6 |
| | 9,050 |
| | — |
| | — |
| | 9,056 |
|
| Forfeiture of unvested shares and shares surrendered for tax withholding obligations | (286,927 | ) | | (3 | ) | | (6,251 | ) | | — |
| | — |
| | (6,254 | ) |
| Exercise of stock options | 3,910 |
| | — |
| | 44 |
| | — |
| | — |
| | 44 |
|
| Repurchase of common stock | (4,125,077 | ) | | (41 | ) | | (142,024 | ) | | — |
| | — |
| | (142,065 | ) |
| Balance at June 30, 2019 | 95,315,633 |
| | $ | 953 |
| | $ | 1,080,966 |
| | $ | 1,803,360 |
| | $ | (17,369 | ) | | $ | 2,867,910 |
|
6
The accompanying notes are an integral part of these consolidated financial statements.
6statements
BANKUNITED, INC. AND SUBSIDIARIES
NOTES TO CONSOLIDATED FINANCIAL STATEMENTS - UNAUDITED
SeptemberJune 30, 20172020
Note 1 Basis of Presentation and Summary of Significant Accounting Policies
BankUnited, Inc. is a national bank holding company with one wholly-owned subsidiary, BankUnited, collectively, the Company. BankUnited, a national banking association headquartered in Miami Lakes, Florida, provides a full range of banking and related services to individual and corporate customers through 9074 banking centers located in 1514 Florida counties and 65 banking centers located in the New York metropolitan area at SeptemberJune 30, 2017.2020. The Bank also offers certain commercial lending and deposit products through national platforms.
In connection with the FSB Acquisition, BankUnited entered into two loss sharing agreements with the FDIC. The Loss Sharing Agreements consist of the Single Family Shared-Loss Agreement and the Commercial Shared-Loss Agreement. Assets covered by the Loss Sharing Agreements are referred to as covered assets or, in certain cases, covered loans. The Single Family Shared-Loss Agreement provides for FDIC loss sharing and the Bank’s reimbursement for recoveries to the FDIC through May 21, 2019 for single family residential loans and OREO. Loss sharing under the Commercial Shared-Loss Agreement terminated on May 21, 2014. The Commercial Shared-Loss Agreement continued to provide for the Bank’s reimbursement of recoveries to the FDIC through June 30, 2017 for all other covered assets, including commercial real estate, commercial and industrial and consumer loans, certain investment securities and commercial OREO. Pursuant to the terms of the Loss Sharing Agreements, the covered assets are subject to a stated loss threshold whereby the FDIC will reimburse BankUnited for 80% of losses related to the covered assets up to $4.0 billion and 95% of losses in excess of this amount, beginning with the first dollar of loss incurred.
The accompanying unaudited consolidated financial statements have been prepared in accordance with generally accepted accounting principles for interim financial information and the instructions to Form 10-Q and Article 10 of Regulation S-X of the SEC. Accordingly, theythese do not include all of the information and footnotes required for a fair presentation of financial position, results of operations and cash flows in conformity with GAAP and should be read in conjunction with the Company’s consolidated financial statements and the notes thereto appearing in BKU’s Annual Report on Form 10-K for the year ended December 31, 20162019 filed with the SEC. In the opinion of management, all adjustments, consisting of normal recurring adjustments, considered necessary for a fair presentation have been included. Operating results for the three and ninesix months ended SeptemberJune 30, 20172020 are not necessarily indicative of the results that may be expected in future periods.
Certain amounts presented for prior periods have been reclassified to conform to the current period presentation.
Accounting Estimates
In preparing the consolidated financial statements, management is required to make estimates and assumptions that affect the reported amounts of assets, liabilities, revenues, and expenses and disclosures of contingent assets and liabilities. Actual results could differ significantly from these estimates.
Significant estimates include the ALLL, the amount and timing of expected cash flows from covered assets and the FDIC indemnification asset,allowance for credit losses and the fair values of investment securities and other financial instruments. Management has used information provided by third party valuation specialists to assist in the determination of the fair values of investment securities.
New Accounting Pronouncements Adopted During the Six Months Ended June 30, 2020
ASU No. 2016-09, Compensation - Stock Compensation (Topic 718): Improvements to Employee Share-Based Payment Accounting. The amendments in this ASU simplified several aspects of the accounting for share-based payment transactions. The Company adopted this ASU in the first quarter of 2017. The amendment requiring the recognition of excess tax benefits and deficiencies as income tax benefit or expense in the income statement as opposed to being recognized as additional paid-in-capital was applied prospectively and resulted in the recognition of $0.3 million and $3.2 million in excess tax benefits in the consolidated statement of income line item "Provision for income taxes" for the three and nine months ended September 30, 2017, increasing net income by the same amount in each period. The adoption had no impact on basic and diluted earnings per share for the three months ended September 30, 2017 and increased basic and diluted earnings per share by $0.02 and $0.03, respectively, for the nine months ended September 30, 2017. The Company retrospectively adopted the amendments requiring the classification of excess tax benefits and deficiencies with other income tax cash flows as operating activities and cash paid when directly withholding shares as financing activities in the accompanying consolidated statements of cash flows; the impact was not material. The Company elected to continue its practice of estimating the number of awards expected to vest in determining the amount of compensation cost to be recognized related to share based payment transactions.
BANKUNITED, INC. AND SUBSIDIARIES
NOTES TO CONSOLIDATED FINANCIAL STATEMENTS - UNAUDITED
September 30, 2017
ASU No. 2017-08, Receivables—Nonrefundable Fees and Other Costs (Subtopic 310-20): Premium Amortization on Purchased Callable Debt Securities. The amendments in this ASU require certain premiums on callable debt securities to be amortized to the earliest call date. The amortization period for callable debt securities purchased as a discount will not be impacted. The Company early-adopted this ASU in the first quarter of 2017 with no material impact on the Company's consolidated financial position, results of operations or cash flows.
ASU No. 2016-06, Derivatives and Hedging (Topic 815):Contingent Put and Call Options in Debt Instruments. The amendments in this ASU clarify the requirements for assessing whether contingent call (put) options that can accelerate the payment of principal on debt instruments are clearly and closely related to their debt hosts. A company performing the assessment under these amendments is required to assess the embedded call (put) options solely in accordance with a four-step decision sequence, without also considering whether the contingency is related to interest rates or credit risks. The Company adopted this ASU in the first quarter of 2017 with no impact on its consolidated financial position, results of operations or cash flows.
ASU No. 2017-04, Intangibles—Goodwill and Other (Topic 350): Simplifying the Test for Goodwill Impairment, an amendment to simplify the subsequent quantitative measurement of goodwill by eliminating step two from the goodwill impairment test. As amended, an entity recognizes an impairment charge for the amount by which the carrying amount of a reporting unit exceeds its fair value, not to exceed the total amount of goodwill allocated to the reporting unit. An entity still has the option to perform the qualitative test for a reporting unit to determine if the quantitative impairment test is necessary. The Company early adopted this ASU in the third quarter of 2017, concurrent with performance of its annual goodwill impairment test, with no impact on its consolidated financial position, results of operations or cash flows.
ASU No. 2017-12, Derivatives and Hedging (Topic 815): Targeted Improvements to Accounting for Hedging Activities. The new guidance eliminates the requirement to separately measure and report hedge ineffectiveness after initial qualification. For qualifying cash flow and net investment hedges, this means that the entire change in the fair value of the hedging instrument included in the assessment of hedge effectiveness will be recorded in other comprehensive income (OCI), and amounts deferred in OCI will be reclassified to earnings in the same income statement line item that is used to present the earnings effect of the hedged item when the hedged item affects earnings. The Company will have until the end of the first quarter in which a hedge is designated to perform an initial assessment of a hedge’s effectiveness. The new guidance also permits a qualitative effectiveness assessment for certain hedges instead of a quantitative test, such as a regression analysis, if the company can reasonably support an expectation of high effectiveness throughout the term of the hedge. In addition, in order to better align an entity's risk management activities and financial reporting for hedging relationships, the ASU allows for more hedging strategies to be eligible for hedge accounting. From a disclosure standpoint, to help users of the financial statements better understand the effects of hedge accounting, the guidance requires revised tabular disclosures that focus on the effect of hedge accounting by income statement line, and eliminates today’s requirement to disclose hedge ineffectiveness because this amount is no longer separately measured. The Company early adopted this ASU during the quarter ended September 30, 2017 with no material impact on the Company's consolidated financial position, results of operations or cash flows.
Recent Accounting Pronouncements
In May 2014, the FASB issued ASU No. 2014-09, Revenue from Contracts with Customers (Topic 606), which will supersede the revenue recognition requirements in Topic 605, Revenue Recognition, and most industry-specific revenue recognition guidance throughout the Accounting Standards Codification. The amendments in this update affect any entity that either enters into contracts with customers to transfer goods or services or enters into contracts for the transfer of non-financial assets unless those contracts, including leases and insurance contracts, are within the scope of other standards. The amendments establish a core principle requiring the recognition of revenue to depict the transfer of goods or services to customers in an amount reflecting the consideration to which the entity expects to be entitled in exchange for such goods or services. The amendments also require expanded disclosures concerning the nature, amount, timing and uncertainty of revenues and cash flows arising from contracts with customers. Financial instruments and lease contracts are generally outside the scope of the ASU as are revenues that are in the scope of ASC 860 "Transfers and Servicing", ASC 460 "Guarantees" and ASC 815 "Derivatives and Hedging". The FASB has issued subsequent ASUs to clarify certain aspects of ASU 2014-09, without changing the core principle of the guidance and to defer the effective date of ASU 2014-09 to annual periods and interim periods within fiscal years beginning after December 15, 2017. Although management has not finalized its evaluation of the impact of adoption of this ASU, substantially all of the Company's revenues have historically been, and are expected to continue to be, generated from activities that are outside the scope of the ASU. Therefore, management does not expect adoption to have a material impact on the Company's consolidated financial position, results of operations or cash flows.
BANKUNITED, INC. AND SUBSIDIARIES
NOTES TO CONSOLIDATED FINANCIAL STATEMENTS - UNAUDITED
September 30, 2017
Service charges on deposit accounts, which totaled approximately $9.8 million for the nine months ended September 30, 2017, is the most significant category of revenue identified as within the scope of the ASU; management does not expect the amount and timing of recognition of such revenue to be materially impacted by adoption, which management expects to apply using the modified retrospective approach, whereby the cumulative effect of initially applying the amendments is recognized as an adjustment to opening retained earnings at the date of adoption.
In January 2016, the FASB issued ASU No. 2016-01, Financial Instruments - Overall (Subtopic 825-10): Recognition and Measurement of Financial Assets and Financial Liabilities. The amendments in the ASU that are expected to be most applicable to the Company (1) eliminate the available for sale classification for equity securities and require investments in equity securities (except those accounted for under the equity method of accounting or those that result in consolidation of the investee) to be measured at fair value with changes in fair value recognized in net income, provided that equity investments that do not have readily determinable fair values may be re-measured at fair value upon occurrence of an observable price change or recognition of impairment, (2) eliminate the requirement to disclose the method(s) and significant assumptions used to estimate the fair value that is required to be disclosed for financial instruments measured at amortized cost on the balance sheet, and (3) require public business entities to use the exit price notion when measuring the fair value of financial instruments for disclosure purposes. The amendments also clarify that an entity should evaluate the need for a valuation allowance on a deferred tax asset related to available for sale securities in combination with the entity's other deferred tax assets, which is consistent with the Company's current practice. The amendments in this ASU are effective for the Company for interim and annual periods in fiscal years beginning after December 15, 2017 and will be adopted by means of a cumulative-effect adjustment to the balance sheet, except for amendments related to equity securities without readily determinable fair values, which will be applied prospectively. Although management has not finalized its evaluation of the impact of adoption of this ASU, adoption is not expected to have any impact on the Company's consolidated financial position or cash flows, other than a cumulative effect adjustment to reclassify any unrealized gains or losses related to equity securities from AOCI to retained earnings. The carrying value of equity investments for which fair value changes will be recognized in earnings after adoption totaled $71 million and had unrealized gains of $10.0 million at September 30, 2017. Adoption of the ASU will impact the Company's disclosures about the fair value of certain financial instruments.
In February 2016, the FASB issued ASU No. 2016-02, Leases (Topic 842). The amendments in this ASU require a lessee to recognize in the statement of financial position a liability to make lease payments and a right-of-use asset representing its right to use the underlying asset for leases with terms longer than one year. Accounting applied by lessors is largely unchanged by this ASU. The amendments in this ASU are effective for the Company for interim and annual periods in fiscal years beginning after December 15, 2018. Early adoption is permitted; however, the Company does not intend to early adopt this ASU. Lessees and lessors are required to apply the provisions of the ASU at the beginning of the earliest period presented using a modified retrospective approach. Management has not completed its evaluation of the impact of adoption of this ASU and is not currently able to reasonably estimate the impact of adoption on the consolidated financial statements; however, the most significant impact is expected to be the recognition, as lessee, of new right-of-use assets and lease liabilities on the consolidated balance sheet for real estate leases currently classified as operating leases.
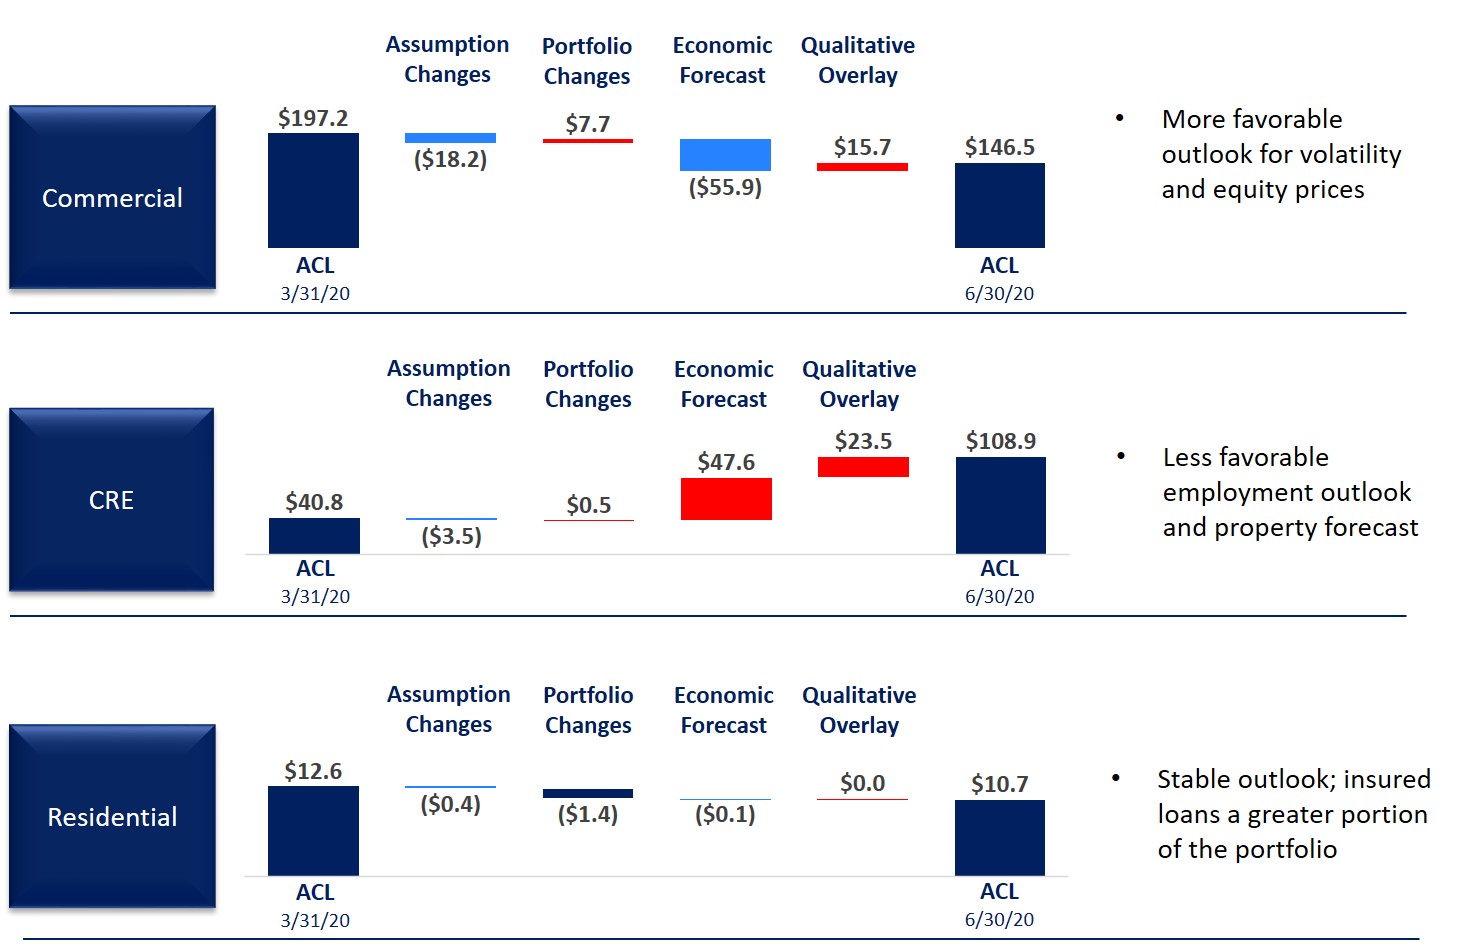
In June 2016, the FASB issued ASU No. 2016-13, FinancialFinancial Instruments - Credit Losses (Topic 326); Measurement of Credit Losses on Financial Instruments. The ASU, introducesalong with subsequent ASUs issued to clarify certain of its provisions, introduced new guidance which makesmade substantive changes to the accounting for credit losses. The ASU introducesintroduced the CECL model which applies to financial assets subject to credit losses and measured at amortized cost, as well as certain off-balance sheet credit exposures. This includes loans, loan commitments, standby letters of credit, net investments in leases recognized by a lessor and held-to-maturityHTM debt securities. The CECL model requires an entity to estimate credit losses expected over the life of an exposure, considering information about historical events, current conditions and reasonable and supportable forecasts.forecasts, and is generally expected to result in earlier recognition of credit losses. The ASU also modifiesmodified certain provisions of the currentprevious OTTI model for available for saleAFS debt securities requiring an estimate of expected credit losses only when the fair value of an available for sale debt security is below its amortized cost.securities. Credit losses on available for saleAFS debt securities will beare now limited to the difference between the security's amortized cost basis and its fair value.value, and should be recognized through an allowance for credit losses rather than as a direct reduction in amortized cost basis. The Company adopted this ASU in the first quarter of 2020 using the modified retrospective transition method for the CECL model and a prospective approach for the AFS debt security model. The Company recorded a cumulative-effect adjustment to retained earnings of $23.8 million, which included $4.8 million related to off -balance sheet credit exposures, on January 1, 2020. No cumulative-effect adjustment was recorded related to AFS debt securities upon adoption. The Company has elected to phase-in the initial impact of the adoption of ASC 326 for regulatory capital purposes, allowing the impact of adoption on regulatory capital to be delayed for two years, followed by a three-year transition period.
BANKUNITED, INC. AND SUBSIDIARIES
NOTES TO CONSOLIDATED FINANCIAL STATEMENTS - UNAUDITED
June 30, 2020
ASU No. 2020-04, Reference Rate Reform (Topic 848): Facilitation of the Effects of Reference Rate Reform on Financial Reporting. The ASU also provides optional relief for a simplifiedlimited period of time to ease the potential accounting modelburden associated with transitioning away from reference rates that are expected to be discontinued. Under this ASU, companies are provided with optional expedients and exceptions for purchased financial assets with more than insignificant credit deterioration sinceapplying generally accepted accounting principles (GAAP) to contract modifications and hedging relationships that currently utilize LIBOR as their origination.benchmark rate, subject to certain criteria being met. The amendments in the ASU also apply to contemporaneous modifications of other contract terms related to the replacement of LIBOR. The amendments in the ASU are effective for all entities as of March 12, 2020 and will only be in effect through December 31, 2022. To date, the impact of adoption of this ASU areon the Company's consolidated financial position, results of operations, and cash flows has not been material.
Accounting Pronouncements Not Yet Adopted
ASU No. 2019-12, Income Taxes (Topic 740): Simplifying the Accounting for Income Taxes. This ASU simplifies the accounting for income taxes by removing certain exceptions stipulated in ASC 740 and making some other targeted changes to the accounting for income taxes. This ASU is effective for the Company for interim and annual periods in fiscal years beginning after December 15, 2019. Management2020. The Company has not yet completedfinalized its evaluation of the impact of adoption on its consolidated financial position, results of this ASUoperations, and cash flows, but the impact is not currently ableexpected to reasonably estimate the impact of adoption on the consolidated financial statements; however, adoption is likely to lead to significant changes in accounting policies related to, and the methods employed in estimating, the ALLL. It is possible that the impact will be materialmaterial.
Updates to the Company's consolidatedSignificant Accounting Policies
Loans
The Company's loan portfolio contains 1-4 single family residential first mortgages, government insured residential mortgages, an insignificant amount of home equity loans and lines of credit and other consumer loans; multi-family, non-owner occupied commercial real estate, construction and land, owner-occupied commercial real estate and commercial and industrial loans, PPP loans, mortgage warehouse lines of credit and sales-type and direct financing leases. Loans are reported at amortized cost basis, net of the ACL.
Interest income is accrued based on the principal amount outstanding. Non-refundable loan origination fees, net of direct costs of originating or acquiring loans, as well as purchase premiums and discounts, are deferred and recognized as adjustments to yield over the contractual lives of the related loans using the level yield method.
Non-accrual loans
Commercial loans are placed on non-accrual status when (i) management has determined that full repayment of all contractual principal and interest is in doubt, or (ii) the loan is past due 90 days or more as to principal or interest unless the loan is well secured and in the process of collection. Residential and other consumer loans, other than government insured residential loans, are generally placed on non-accrual status when they are 90 days past due. When a loan is placed on non-accrual status, uncollected interest accrued is reversed and charged to interest income. Payments received on nonaccrual commercial loans are applied as a reduction of principal. Interest payments are recognized as income on a cash basis on nonaccrual residential loans. Commercial loans are returned to accrual status only after all past due principal and interest has been collected and full repayment of remaining contractual principal and interest is reasonably assured. Residential and consumer loans are generally returned to accrual status when less than 90 days past due. Past due status of loans is determined based on the contractual next payment due date. Loans less than 30 days past due are reported as current.
Contractually delinquent government insured residential loans are not classified as non-accrual due to the nature of the guarantee. Contractually delinquent PCD loans are not classified as non-accrual as long as the Company has a reasonable expectation about amounts expected to be collected.
Troubled Debt Restructurings
In certain situations, due to economic or legal reasons related to a borrower's financial positiondifficulties, the Company may grant a concession to the borrower for other than an insignificant period of time that it would not otherwise consider. At that time, the related loan is classified as a TDR. The concessions granted may include rate reductions, principal forgiveness, payment forbearance, extensions of maturity at rates of interest below that commensurate with the risk profile of the loans, modification of payment terms and resultsother actions intended to minimize economic loss. A TDR is generally placed on non-accrual status at the time of operations.the modification unless the borrower was performing prior to the restructuring.
BANKUNITED, INC. AND SUBSIDIARIES
NOTES TO CONSOLIDATED FINANCIAL STATEMENTS - UNAUDITED
SeptemberJune 30, 20172020
In August 2016,Under recently issued inter-agency and authoritative guidance and consistent with the FASB issued ASU No. 2016-15, StatementCARES Act, short-term (generally periods of Cash Flows (Topic 230): Classificationsix months or less) deferrals or modifications related to COVID-19 will typically not be categorized as TDRs.
Purchased Credit Deteriorated ("PCD") assets
PCD assets are acquired financial assets that, as of Certain Cash Receiptsthe date of acquisition, have experienced a more than insignificant deterioration in credit quality since origination. An assessment is conducted at acquisition to determine whether acquired financial assets meet the criteria to be classified as PCD assets. That assessment may be conducted at the individual asset level, or for a group of assets acquired together that have similar risk characteristics. At acquisition, the ACL related to PCD assets, representing the estimated amount of the UPB of the assets not expected to be collected, is added to the purchase price to determine the amortized cost basis and Cash Payments.any non-credit related discount or premium is allocated to the individual assets acquired. The amendments in this ASU provide guidance on eight specific cash flow classification issues wherenon-credit related discount or premium is accreted or amortized to interest income over the life of the related assets using the level yield method, as long as there has been diversity in practice. The guidanceis a reasonable expectation about amounts expected to be collected. Subsequent changes in the ASUamount of expected credit losses are recognized immediately by adjusting the ACL and reflecting the periodic changes as credit loss expense or reversal of credit loss expense.
Loans previously categorized as ACI loans were categorized as PCD loans on initial adoption of ASC 326. At adoption, an ACL was recognized and a corresponding adjustment was made to the assets' amortized cost basis. Prior to the adoption of ASC 326, ACI loans were accounted for on a pool basis. These pools were not maintained on adoption. The Company did not re-assess whether modifications to individual PCD loans previously accounted for in pools were TDRs at adoption.
Allowance for Credit Losses ("ACL")
AFS Debt Securities
The Company reviews its AFS debt securities for credit loss impairment at the individual security level on at least a quarterly basis. A security is impaired if its fair value is less than its amortized cost basis. A decline in fair value below amortized cost basis represents a credit loss impairment to the extent the Company does not expect to recover the amortized cost basis of the security. Impairment related to credit losses is recorded through the ACL to the extent fair value is less than the amortized cost basis. Declines in fair value that have not been recorded through the ACL are recorded through other comprehensive income, net of applicable taxes.
In assessing whether an impairment is credit loss related, the Company compares the present value of cash flows expected to be collected to the security's amortized cost basis. If the present value of cash flows expected to be collected is less than the amortized cost basis of the security, a credit loss exists and an ACL is recorded. The Company discounts expected cash flows at the effective interest rate implicit in the security at the purchase date, adjusted for expected prepayments. For floating rate securities, the Company uses the floating rate as it changes over the life of the security. In developing estimates about cash flows expected to be collected and determining whether a credit loss exists, the Company considers information about past events, current conditions and reasonable and supportable forecasts. Factors and information that the Company uses in making its assessments include, but are not necessarily limited to, the following:
The extent to which fair value is less than amortized cost;
Adverse conditions specifically related to the security, an industry or geographic area;
Changes in the financial condition of the issuer or underlying loan obligors;
The payment structure and remaining payment terms of the security, including levels of subordination or over-collateralization;
Failure of the issuer to make scheduled payments;
Changes in credit ratings;
Relevant market data;
Estimated prepayments, defaults, and the value and performance of underlying collateral at the individual security level.
BANKUNITED, INC. AND SUBSIDIARIES
NOTES TO CONSOLIDATED FINANCIAL STATEMENTS - UNAUDITED
June 30, 2020
The relative importance assigned to each of these factors varies depending on the facts and circumstances pertinent to the individual security being evaluated.
Timely payment of principal and interest on securities issued by the U.S. Government, U.S. government agencies and U.S. government sponsored entities is explicitly or implicitly guaranteed by the U. S. government. Therefore, the Company expects to recover the amortized cost basis of these securities.
If the Company intends to sell a security in an unrealized loss position, or it is more likely than not that the Company will be required to sell the security before recovery of its amortized cost basis, any allowance for credit losses will be written off and the amortized cost basis will be written down to the debt security’s fair value at the reporting date with any incremental impairment reported in earnings.
Historically, the Company has not experienced credit losses related to AFS securities or uncollectible interest on its AFS securities. However, AFS securities would be charged off to the extent that there was no reasonable expectation of recovery of amortized cost basis. AFS securities would be placed on non-accrual status if the Company did not reasonably expect to receive interest payments in the future and interest accrued would be reversed against interest income. Securities would be returned to accrual status only when collection of interest was reasonably assured.
Loans
The ACL is a valuation account that is deducted from the amortized cost basis of loans to present the net amount expected to be collected. The ACL is adjusted through the provision for credit losses to the amount of amortized cost basis not expected to be collected, or in the case of PCD loans, the amount of UPB not expected to be collected, at the balance sheet date. Amortized cost basis includes UPB, unamortized premiums or discounts and deferred fees and costs, net of amounts previously charged off.
The measurement of expected credit losses encompasses information about historical events, current conditions and reasonable and supportable forecasts. Determining the amount of the ACL is complex and requires extensive judgment by management about matters that are inherently uncertain. Re-evaluation of the ACL estimate in future periods, in light of changes in composition and characteristics of the loan portfolio, changes in the reasonable and supportable forecast and other factors then prevailing may result in material changes in the amount of the ACL and credit loss expense in those future periods.
Loans are charged off against the ACL in the period in which they are deemed uncollectible and recoveries are credited to the ACL when received. Expected recoveries on loans previously charged off, not to exceed the aggregate of amounts previously charged-off and expected to be charged-off, are included in the ACL estimate. For loans secured by residential real estate, an assessment of collateral value is made at no later than 120 days delinquency; any outstanding loan balance in excess of fair value less cost to sell is charged off at no later than 180 days delinquency. Additionally, any outstanding balance in excess of fair value of collateral less cost to sell is charged off (i) within 60 days of receipt of notification of filing from the bankruptcy court, (ii) within 60 days of determination of loss if all borrowers are deceased or (iii) within 90 days of discovery of fraudulent activity. Other consumer loans are typically charged off at 120 days delinquency. Commercial loans are charged off when, in management's judgment, they are considered to be uncollectible.
Expected credit losses are estimated on a collective basis for groups of loans that share similar risk characteristics. Factors that may be considered in aggregating loans for this purpose include but are not necessarily limited to, product or collateral type, industry, geography, internal risk rating, credit characteristics such as credit scores or collateral values, and historical or expected credit loss patterns. For loans that do not share similar risk characteristics with other loans such as collateral dependent loans and TDRs, expected credit losses are estimated on an individual basis.
Expected credit losses are estimated over the contractual terms of the loans, adjusted for expected prepayments. Expected prepayments for commercial loans are generally estimated based on the Company's historical experience. For residential loans, expected prepayments are estimated using a model that incorporates industry prepayment data, calibrated to reflect the Company's experience. The contractual term excludes expected extensions, renewals, and modifications unless either of the following applies: management has a reasonable expectation at the reporting date that a TDR will be executed with an individual borrower or the extension or renewal options are included in the original or modified contract at the reporting date and are not unconditionally cancellable by the Company.
The length of the reasonable and supportable forecast is evaluated at each reporting period and adjusted if deemed necessary. At June 30, 2020, the Company changed from a 5-year to a 2-year reasonable and supportable forecast period in estimating the ACL.
BANKUNITED, INC. AND SUBSIDIARIES
NOTES TO CONSOLIDATED FINANCIAL STATEMENTS - UNAUDITED
June 30, 2020
For the substantial majority of portfolio segments and subsegments, including residential loans other than government insured loans, and most commercial and commercial real estate loans, expected losses are estimated using econometric models. The models employ a factor based methodology, leveraging data sets containing extensive historical loss and recovery information by industry, geography, product type, collateral type and obligor characteristics, to estimate PD and LGD. Measures of PD for commercial loans incorporate current conditions through market cycle or credit cycle adjustments. For residential loans, the models consider FICO and adjusted LTVs. PDs and LGDs are then conditioned on the reasonable and supportable economic forecast. Projected PDs and LGDs are applied to estimated exposure at default, considering the term and payment structure of the loan, to generate estimates of expected loss at the loan level. For criticized or classified loans, PDs may be adjusted to benchmark PDs appropriate to the current risk rating if the most current financial information available is deemed not to be reflective of the borrowers' current financial condition. These loan level estimates are aggregated to generate a collective estimate for groups of loans that share common risk characteristics.
For certain less material portfolios including loans and leases to state and local government entities originated by Pinnacle, small balance commercial loans and consumer loans, the WARM method is used to estimate expected credit losses. For the Pinnacle portfolio, historical loss information is based on municipal historical default and recovery data, segmented by credit rating. For small balance commercial loans, historical loss information is based on the Company's historical loss experience over a five year period. For consumer loans, historical loss information is based on peer data; this portfolio subsegment is not significant. All loss estimates are conditioned as applicable on changes in current conditions and the reasonable and supportable economic forecast. Expected credit losses for mortgage warehouse lines of credit are estimated based primarily on the Company's historical loss experience, conditioned as applicable on changes in current conditions and the reasonable and supportable economic forecast. Generally, given the nature of these loans, losses would be expected to manifest within a very short time period after origination.
The Company expects to collect the amortized cost basis of government insured residential loans and PPP loans due to the nature of the government guarantee, so the quantitative ACL is zero for these loans.
Qualitative factors
Qualitative adjustments are made to the ACL when, based on management’s judgment, there are factors impacting expected credit losses not taken into account by the quantitative calculations. Potential qualitative adjustments are categorized as follows:
Economic factors, including material trends and developments that, in management's judgment, may not have been considered in the reasonable and supportable economic forecast;
Credit policy and staffing, including the nature and level of policy and procedural exceptions or changes in credit policy not reflected in quantitative results, changes in the quality of underwriting and portfolio management and staff and issues identified by credit review, internal audit or regulators that may not be reflected in quantitative results;
Concentrations, considering whether the quantitative estimate adequately accounts for concentration risk in the portfolio;
Model imprecision and model validation findings; and
Other factors not adequately considered in the quantitative estimate or other qualitative categories identified by management that may materially impact the amount of expected credit losses.
Collateral dependent loans
Collateral dependent loans are those for which the borrower is experiencing financial difficulty and repayment is expected to be most applicableprovided substantially through the operation or sale of the collateral. These loans do not typically share similar risk characteristics with other loans and expected credit losses are evaluated on an individual basis. Loans evaluated individually are not included in the collective evaluation. Estimates of expected credit losses for collateral dependent loans, whether or not foreclosure is probable, are based on the fair value of the collateral adjusted for selling costs when repayment depends on sale of the collateral.
BANKUNITED, INC. AND SUBSIDIARIES
NOTES TO CONSOLIDATED FINANCIAL STATEMENTS - UNAUDITED
June 30, 2020
Troubled debt restructurings
For TDRs, or loans for which there is a reasonable expectation that a TDR will be executed, that are not collateral dependent, the credit loss estimate is determined by comparing the net present value of expected cash flows, discounted at the loan’s original effective interest rate, to the Company requires: (1) cash payments for debt prepayment or extinguishment costs to be classified as cash outflows for financing activities, (2) proceeds from settlement of insurance claims to be classified on theamortized cost basis of the natureloan.
Off-balance sheet credit exposures
Expected credit losses related to off-balance sheet credit exposures are estimated over the contractual period for which the Company is exposed to credit risk via a contractual obligation to extend credit, unless that obligation is unconditionally cancellable by the Company. Expected credit losses are estimated using essentially the same methodologies employed to estimate expected credit losses on the amortized cost basis of loans, taking into consideration the likelihood and amount of additional amounts expected to be funded over the terms of the loss and (3) cash proceedscommitments. The liability for credit losses on off-balance sheet credit exposures is presented within other liabilities on the consolidated balance sheets, distinct from settlementthe ACL. Adjustments to the liability are included in the provision for credit losses.
Accrued Interest Receivable
The Company has elected to present accrued interest receivable separate from the amortized cost basis of bank-owned life insurance policiesfinancial assets carried at amortized cost. The Company is applying the practical expedient provided in ASC 326 to be classified as cash flowsexclude accrued interest receivable balances from investing activities. Cash payments for premiumstabular disclosures about financial assets carried at amortized cost. The Company has elected not to estimate an ACL on bank-owned life insurance may be classified as cash flows for investing activities, operating activities or a combination thereof. The amendmentsaccrued interest receivable balances since uncollectible accrued interest is timely written off in this ASU are effective for the Company for interim and annual periods in fiscal years beginning after December 15, 2017 and will be applied retrospectively to each period presented. The provisions of this ASU are generally consistentaccordance with the Company's current practice and adoption is not expected to materially impact the Company's consolidated cash flows.accounting policies for non-accrual loans.
BANKUNITED, INC. AND SUBSIDIARIES
NOTES TO CONSOLIDATED FINANCIAL STATEMENTS - UNAUDITED
June 30, 2020
Note 2 Earnings Per Common Share
The computation of basic and diluted earnings per common share is presented below for the periods indicated (in thousands, except share and per share data):
|
| | | | | | | | | | | | | | | |
| | Three Months Ended June 30, | | Six Months Ended June 30, |
| c | 2020 | | 2019 | | 2020 |
| 2019 |
| Basic earnings per common share: | | | | | |
| | |
| Numerator: | | | | | |
| | |
| Net income | $ | 76,508 |
| | $ | 81,451 |
| | $ | 45,557 |
| | $ | 147,423 |
|
| Distributed and undistributed earnings allocated to participating securities | (3,353 | ) | | (3,382 | ) | | (1,939 | ) | | (6,074 | ) |
| Income allocated to common stockholders for basic earnings per common share | $ | 73,155 |
| | $ | 78,069 |
| | $ | 43,618 |
| | $ | 141,349 |
|
| Denominator: | | | | | | | |
| Weighted average common shares outstanding | 92,409,949 |
| | 97,451,019 |
| | 93,177,243 |
| | 98,150,014 |
|
| Less average unvested stock awards | (1,207,798 | ) | | (1,174,339 | ) | | (1,154,589 | ) | | (1,173,137 | ) |
| Weighted average shares for basic earnings per common share | 91,202,151 |
| | 96,276,680 |
| | 92,022,654 |
| | 96,976,877 |
|
| Basic earnings per common share | $ | 0.80 |
| | $ | 0.81 |
| | $ | 0.47 |
| | $ | 1.46 |
|
| Diluted earnings per common share: | | | | | | | |
| Numerator: | | | | | | | |
| Income allocated to common stockholders for basic earnings per common share | $ | 73,155 |
| | $ | 78,069 |
| | $ | 43,618 |
| | $ | 141,349 |
|
| Adjustment for earnings reallocated from participating securities | — |
| | 9 |
| | — |
| | 13 |
|
| Income used in calculating diluted earnings per common share | $ | 73,155 |
| | $ | 78,078 |
| | $ | 43,618 |
| | $ | 141,362 |
|
| Denominator: | | |
|
| | | | |
| Weighted average shares for basic earnings per common share | 91,202,151 |
| | 96,276,680 |
| | 92,022,654 |
| | 96,976,877 |
|
| Dilutive effect of stock options and certain shared-based awards | 705 |
| | 345,899 |
| | 126,858 |
| | 312,821 |
|
| Weighted average shares for diluted earnings per common share | 91,202,856 |
| | 96,622,579 |
| | 92,149,512 |
| | 97,289,698 |
|
| Diluted earnings per common share | $ | 0.80 |
| | $ | 0.81 |
| | $ | 0.47 |
| | $ | 1.45 |
|
|
| | | | | | | | | | | | | | | |
| | Three Months Ended September 30, | | Nine Months Ended September 30, |
| c | 2017 | | 2016 | | 2017 |
| 2016 |
| Basic earnings per common share: | | | | | |
| | |
| Numerator: | | | | | |
| | |
| Net income | $ | 67,779 |
| | $ | 50,848 |
| | $ | 196,479 |
| | $ | 162,447 |
|
| Distributed and undistributed earnings allocated to participating securities | (2,525 | ) | | (2,031 | ) | | (7,331 | ) | | (6,522 | ) |
| Income allocated to common stockholders for basic earnings per common share | $ | 65,254 |
| | $ | 48,817 |
| | $ | 189,148 |
| | $ | 155,925 |
|
| Denominator: | | | | | | | |
| Weighted average common shares outstanding | 106,809,381 |
| | 104,153,018 |
| | 106,488,396 |
| | 104,077,932 |
|
| Less average unvested stock awards | (1,101,485 | ) | | (1,150,268 | ) | | (1,102,381 | ) | | (1,165,509 | ) |
| Weighted average shares for basic earnings per common share | 105,707,896 |
| | 103,002,750 |
| | 105,386,015 |
| | 102,912,423 |
|
| Basic earnings per common share | $ | 0.62 |
| | $ | 0.47 |
| | $ | 1.79 |
| | $ | 1.52 |
|
| Diluted earnings per common share: | | | | | | | |
| Numerator: | | | | | | | |
| Income allocated to common stockholders for basic earnings per common share | $ | 65,254 |
| | $ | 48,817 |
| | $ | 189,148 |
| | $ | 155,925 |
|
| Adjustment for earnings reallocated from participating securities | 6 |
| | (81 | ) | | 21 |
| | (264 | ) |
| Income used in calculating diluted earnings per common share | $ | 65,260 |
| | $ | 48,736 |
| | $ | 189,169 |
| | $ | 155,661 |
|
| Denominator: | | |
|
| | | | |
| Weighted average shares for basic earnings per common share | 105,707,896 |
| | 103,002,750 |
| | 105,386,015 |
| | 102,912,423 |
|
| Dilutive effect of stock options and executive share-based awards | 365,286 |
| | 558,304 |
| | 479,459 |
| | 699,977 |
|
| Weighted average shares for diluted earnings per common share | 106,073,182 |
| | 103,561,054 |
| | 105,865,474 |
| | 103,612,400 |
|
| Diluted earnings per common share | $ | 0.62 |
| | $ | 0.47 |
| | $ | 1.79 |
| | $ | 1.50 |
|
BANKUNITED, INC. AND SUBSIDIARIES
NOTES TO CONSOLIDATED FINANCIAL STATEMENTS - UNAUDITED
September 30, 2017
Included in participatingParticipating securities above areinclude unvested shares and 3,023,314 dividend equivalent rights outstanding at September 30, 2017 that were issued in conjunction with the IPO of the Company's common stock. These dividend equivalent rights expire in 2021 and participate in dividends on a one-for-one basis.
The following potentiallyPotentially dilutive securitiesunvested shares and share units totaling 1,743,403 and 1,119,641 were outstanding at SeptemberJune 30, 20172020 and 2016,2019, respectively, but excluded from the calculation of diluted earnings per common share for the periods indicated because their inclusion would have been anti-dilutive: anti-dilutive.
|
| | | | | | | | | | | |
| | Three Months Ended September 30, | | Nine Months Ended September 30, |
| | 2017 | | 2016 | | 2017 | | 2016 |
| Unvested shares and share units | 1,111,300 |
| | 1,296,848 |
| | 1,111,300 |
| | 1,296,848 |
|
| Stock options and warrants | 1,850,279 |
| | 1,851,376 |
| | 1,850,279 |
| | 1,851,376 |
|
BANKUNITED, INC. AND SUBSIDIARIES
NOTES TO CONSOLIDATED FINANCIAL STATEMENTS - UNAUDITED
June 30, 2020
Note 3 Investment Securities
Investment securities include investment securities available for sale, marketable equity securities, and investment securities held to maturity. The investment securities portfolio consisted of the following at the dates indicated (in thousands):
| | | | September 30, 2017 | June 30, 2020 |
| | Amortized Cost | | Gross Unrealized | | Fair Value | Amortized Cost | | Gross Unrealized | | Carrying Value (1) |
| | | Gains | | Losses | | | Gains | | Losses | |
| Investment securities available for sale: | | | | | | | | |
| U.S. Treasury securities | $ | 24,969 |
| | $ | — |
| | $ | (12 | ) | | $ | 24,957 |
| $ | 75,217 |
| | $ | 1,963 |
| | $ | — |
| | $ | 77,180 |
|
| U.S. Government agency and sponsored enterprise residential MBS | 2,332,616 |
| | 16,762 |
| | (691 | ) | | 2,348,687 |
| 2,371,729 |
| | 13,309 |
| | (5,198 | ) | | 2,379,840 |
|
| U.S. Government agency and sponsored enterprise commercial MBS | 139,966 |
| | 1,067 |
| | (1,813 | ) | | 139,220 |
| 455,344 |
| | 9,859 |
| | (926 | ) | | 464,277 |
|
| Private label residential MBS and CMOs | 507,381 |
| | 20,812 |
| | (335 | ) | | 527,858 |
| 1,101,390 |
| | 16,670 |
| | (1,974 | ) | | 1,116,086 |
|
| Private label commercial MBS | 1,140,465 |
| | 14,646 |
| | (1,510 | ) | | 1,153,601 |
| 2,075,683 |
| | 16,735 |
| | (48,798 | ) | | 2,043,620 |
|
| Single family rental real estate-backed securities | 566,635 |
| | 6,425 |
| | (112 | ) | | 572,948 |
| 608,019 |
| | 11,381 |
| | (1,193 | ) | | 618,207 |
|
| Collateralized loan obligations | 695,414 |
| | 4,905 |
| | — |
| | 700,319 |
| 1,166,929 |
| | — |
| | (38,176 | ) | | 1,128,753 |
|
| Non-mortgage asset-backed securities | 80,255 |
| | 2,382 |
| | — |
| | 82,637 |
| 255,854 |
| | 6,251 |
| | (574 | ) | | 261,531 |
|
| Preferred stocks | 60,716 |
| | 10,000 |
| | — |
| | 70,716 |
| |
| State and municipal obligations | 666,013 |
| | 14,370 |
| | (3,368 | ) | | 677,015 |
| 239,502 |
| | 19,993 |
| | — |
| | 259,495 |
|
| SBA securities | 572,540 |
| | 14,152 |
| | (17 | ) | | 586,675 |
| 247,914 |
| | 2,286 |
| | (4,258 | ) | | 245,942 |
|
| Other debt securities | 4,056 |
| | 4,783 |
| | — |
| | 8,839 |
| |
| | $ | 6,791,026 |
| | $ | 110,304 |
| | $ | (7,858 | ) | | $ | 6,893,472 |
| 8,597,581 |
| | $ | 98,447 |
| | $ | (101,097 | ) | | 8,594,931 |
|
| Investment securities held to maturity | | 10,000 |
| | | | | | 10,000 |
|
| | | $ | 8,607,581 |
| | | | | | 8,604,931 |
|
| Marketable equity securities | | | | | | | | 88,697 |
|
| | | | | | | | | $ | 8,693,628 |
|
BANKUNITED, INC. AND SUBSIDIARIES
NOTES TO CONSOLIDATED FINANCIAL STATEMENTS - UNAUDITED
SeptemberJune 30, 20172020
| | | | December 31, 2016 | December 31, 2019 |
| | Amortized Cost | | Gross Unrealized | | Fair Value | Amortized Cost | | Gross Unrealized | | Carrying Value (1) |
| | | Gains | | Losses | | | Gains | | Losses | |
| Investment securities available for sale: | | | | | | | | |
| U.S. Treasury securities | $ | 4,999 |
| | $ | 6 |
| | $ | — |
| | $ | 5,005 |
| $ | 70,243 |
| | $ | 219 |
| | $ | (137 | ) | | $ | 70,325 |
|
| U.S. Government agency and sponsored enterprise residential MBS | 1,513,028 |
| | 15,922 |
| | (1,708 | ) | | 1,527,242 |
| 2,018,853 |
| | 9,835 |
| | (6,513 | ) | | 2,022,175 |
|
| U.S. Government agency and sponsored enterprise commercial MBS | 126,754 |
| | 670 |
| | (2,838 | ) | | 124,586 |
| 366,787 |
| | 4,920 |
| | (731 | ) | | 370,976 |
|
| Private label residential MBS and CMOs | 334,167 |
| | 42,939 |
| | (2,008 | ) | | 375,098 |
| 1,001,337 |
| | 11,851 |
| | (1,011 | ) | | 1,012,177 |
|
| Private label commercial MBS | 1,180,386 |
| | 9,623 |
| | (2,385 | ) | | 1,187,624 |
| 1,719,228 |
| | 6,650 |
| | (1,194 | ) | | 1,724,684 |
|
| Single family rental real estate-backed securities | 858,339 |
| | 4,748 |
| | (1,836 | ) | | 861,251 |
| 467,459 |
| | 4,016 |
| | (1,450 | ) | | 470,025 |
|
| Collateralized loan obligations | 487,678 |
| | 868 |
| | (1,250 | ) | | 487,296 |
| 1,204,905 |
| | 322 |
| | (7,861 | ) | | 1,197,366 |
|
| Non-mortgage asset-backed securities | 187,660 |
| | 2,002 |
| | (2,926 | ) | | 186,736 |
| 194,171 |
| | 1,780 |
| | (1,047 | ) | | 194,904 |
|
| Preferred stocks | 76,180 |
| | 12,027 |
| | (4 | ) | | 88,203 |
| |
| State and municipal obligations | 705,884 |
| | 3,711 |
| | (11,049 | ) | | 698,546 |
| 257,528 |
| | 15,774 |
| | — |
| | 273,302 |
|
| SBA securities | 517,129 |
| | 7,198 |
| | (421 | ) | | 523,906 |
| 359,808 |
| | 4,587 |
| | (1,664 | ) | | 362,731 |
|
| Other debt securities | 3,999 |
| | 4,092 |
| | — |
| | 8,091 |
| |
| | $ | 5,996,203 |
| | $ | 103,806 |
| | $ | (26,425 | ) | | $ | 6,073,584 |
| 7,660,319 |
| | $ | 59,954 |
| | $ | (21,608 | ) | | 7,698,665 |
|
| Investment securities held to maturity | | 10,000 |
| |
|
| |
|
| | 10,000 |
|
| | | $ | 7,670,319 |
| | | | | | 7,708,665 |
|
| Marketable equity securities | |
|
| | | | | | 60,572 |
|
| | | | |
|
| |
|
| | $ | 7,769,237 |
|
| |
| (1) | At fair value except for securities held to maturity. |
Investment securities held to maturity at SeptemberJune 30, 20172020 and December 31, 20162019 consisted of one1 State of Israel bond with a carrying value of $10 million. Fair value approximated carrying value at Septembermaturing in 2024. At June 30, 20172020 and December 31, 2016. The bond matures2019, accrued interest receivable on investments totaled $23 million and $28 million, respectively, and is included in 2024.other assets in the accompanying consolidated balance sheets.
At SeptemberJune 30, 2017,2020, contractual maturities of investment securities available for sale, adjusted for anticipated prepayments of mortgage-backed and other pass-through securities,when applicable, were as follows (in thousands):
|
| | | | | | | |
| | Amortized Cost | | Fair Value |
| Due in one year or less | $ | 684,986 |
| | $ | 697,034 |
|
| Due after one year through five years | 3,363,698 |
| | 3,406,609 |
|
| Due after five years through ten years | 2,252,239 |
| | 2,282,220 |
|
| Due after ten years | 429,387 |
| | 436,893 |
|
| Preferred stocks with no stated maturity | 60,716 |
| | 70,716 |
|
| | $ | 6,791,026 |
| | $ | 6,893,472 |
|
Based on the Company’s assumptions, the estimated weighted average life of the investment portfolio as of September 30, 2017 was 4.9 years. The effective duration of the investment portfolio as of September 30, 2017 was 1.7 years. The model results are based on assumptions that may differ from actual results. |
| | | | | | | |
| | Amortized Cost | | Fair Value |
| Due in one year or less | $ | 908,180 |
| | $ | 914,970 |
|
| Due after one year through five years | 4,875,569 |
| | 4,830,499 |
|
| Due after five years through ten years | 2,304,114 |
| | 2,332,121 |
|
| Due after ten years | 509,718 |
| | 517,341 |
|
| | $ | 8,597,581 |
| | $ | 8,594,931 |
|
The carrying value of securities pledged as collateral for FHLB advances, public deposits, interest rate swaps and to secure borrowing capacity at the FRB totaled $2.5$4.8 billion and $1.8$2.4 billion at SeptemberJune 30, 20172020 and December 31, 2016,2019, respectively.
BANKUNITED, INC. AND SUBSIDIARIES
NOTES TO CONSOLIDATED FINANCIAL STATEMENTS - UNAUDITED
SeptemberJune 30, 20172020
The following table provides information about gains and losses on investment securities available for sale for the periods indicated (in thousands):
|
| | | | | | | | | | | | | | | |
| | Three Months Ended June 30, | | Six Months Ended June 30, |
| | 2020 | | 2019 | | 2020 | | 2019 |
| Proceeds from sale of investment securities available for sale | $ | 240,805 |
|
| $ | 850,527 |
| | $ | 547,337 |
| | $ | 1,626,250 |
|
| | | | | | | | |
| Gross realized gains: | | |
|
| | | | |
| Investment securities available for sale | $ | 5,723 |
| | $ | 4,631 |
| | $ | 7,255 |
| | $ | 8,956 |
|
| Gross realized losses: | | |
|
| | | | |
| Investment securities available for sale | — |
| | (716 | ) | | (2 | ) | | (724 | ) |
| Net realized gain | 5,723 |
| | 3,915 |
| | 7,253 |
| | 8,232 |
|
| | | | | | | | |
| Net unrealized gains (losses) on marketable equity securities recognized in earnings | 1,113 |
| | 201 |
| | (3,870 | ) | | 1,669 |
|
| | | | | | | | |
| Gain on investment securities, net | $ | 6,836 |
| | $ | 4,116 |
| | $ | 3,383 |
| | $ | 9,901 |
|
|
| | | | | | | | | | | | | | | |
| | Three Months Ended September 30, | | Nine Months Ended September 30, |
| | 2017 | | 2016 | | 2017 | | 2016 |
| Proceeds from sale of investment securities available for sale | $ | 399,430 |
|
| $ | 259,571 |
| | $ | 827,353 |
| | $ | 753,756 |
|
| | | | | | | | |
| Gross realized gains | $ | 28,261 |
| | $ | 3,471 |
| | $ | 30,553 |
| | $ | 10,528 |
|
| Gross realized losses | (1,330 | ) | | — |
| | (1,359 | ) | | — |
|
| Net realized gain | 26,931 |
| | 3,471 |
| | 29,194 |
| | 10,528 |
|
| OTTI | — |
| | (463 | ) | | — |
| | (463 | ) |
| Gain on investment securities available for sale, net | $ | 26,931 |
| | $ | 3,008 |
| | $ | 29,194 |
| | $ | 10,065 |
|
During the three and nine months ended September 30, 2016, OTTI was recognized on two positions in one private label commercial MBS. These positions were in unrealized loss positions at September 30, 2016 and the Company intended to sell the security before recovery of the amortized cost basis.
The following tables present the aggregate fair value and the aggregate amount by which amortized cost exceeded fair value for investment securities available for sale in unrealized loss positions aggregated by investment category and length of time that individual securities had been in continuous unrealized loss positions at the dates indicated (in thousands):. No ACL was recorded for any investment securities available for sale in an unrealized loss position at June 30, 2020.
| | | | September 30, 2017 | June 30, 2020 |
| | Less than 12 Months | | 12 Months or Greater | | Total | Less than 12 Months | | 12 Months or Greater | | Total |
| | Fair Value | | Unrealized Losses | | Fair Value | | Unrealized Losses | | Fair Value | | Unrealized Losses | Fair Value | | Unrealized Losses | | Fair Value | | Unrealized Losses | | Fair Value | | Unrealized Losses |
| U.S. Treasury securities | $ | 24,957 |
| | $ | (12 | ) | | $ | — |
| | $ | — |
| | $ | 24,957 |
| | $ | (12 | ) | |
| U.S. Government agency and sponsored enterprise residential MBS | 460,806 |
| | (425 | ) | | 9,544 |
| | (266 | ) | | 470,350 |
| | (691 | ) | $ | 604,143 |
| | $ | (895 | ) | | $ | 517,239 |
| | $ | (4,303 | ) | | $ | 1,121,382 |
| | $ | (5,198 | ) |
| U.S. Government agency and sponsored enterprise commercial MBS | 55,152 |
| | (1,783 | ) | | 14,270 |
| | (30 | ) | | 69,422 |
| | (1,813 | ) | 39,892 |
| | (108 | ) | | 73,856 |
| | (818 | ) | | 113,748 |
| | (926 | ) |
| Private label residential MBS and CMOs | 72,557 |
| | (217 | ) | | 5,820 |
| | (118 | ) | | 78,377 |
| | (335 | ) | 205,524 |
| | (1,974 | ) | | — |
| | — |
| | 205,524 |
| | (1,974 | ) |
| Private label commercial MBS | 124,664 |
| | (1,510 | ) | | — |
| | — |
| | 124,664 |
| | (1,510 | ) | 1,302,037 |
| | (45,341 | ) | | 56,875 |
| | (3,457 | ) | | 1,358,912 |
| | (48,798 | ) |
| Single family rental real estate-backed securities | 14,708 |
| | (112 | ) | | — |
| | — |
| | 14,708 |
| | (112 | ) | 184,785 |
| | (1,193 | ) | | — |
| | — |
| | 184,785 |
| | (1,193 | ) |
| State and municipal obligations | 184,082 |
| | (3,368 | ) | | — |
| | — |
| | 184,082 |
| | (3,368 | ) | |
| Collateralized loan obligations | | 591,422 |
| | (15,873 | ) | | 537,331 |
| | (22,303 | ) | | 1,128,753 |
| | (38,176 | ) |
| Non-mortgage asset-backed securities | | 13,857 |
| | (45 | ) | | 13,472 |
| | (529 | ) | | 27,329 |
| | (574 | ) |
| SBA securities | — |
| | — |
| | 18,229 |
| | (17 | ) | | 18,229 |
| | (17 | ) | 35,136 |
| | (326 | ) | | 109,837 |
| | (3,932 | ) | | 144,973 |
| | (4,258 | ) |
| | $ | 936,926 |
| | $ | (7,427 | ) | | $ | 47,863 |
| | $ | (431 | ) | | $ | 984,789 |
| | $ | (7,858 | ) | $ | 2,976,796 |
| | $ | (65,755 | ) | | $ | 1,308,610 |
| | $ | (35,342 | ) | | $ | 4,285,406 |
| | $ | (101,097 | ) |
BANKUNITED, INC. AND SUBSIDIARIES
NOTES TO CONSOLIDATED FINANCIAL STATEMENTS - UNAUDITED
SeptemberJune 30, 20172020
| | | | December 31, 2016 | December 31, 2019 |
| | Less than 12 Months | | 12 Months or Greater | | Total | Less than 12 Months | | 12 Months or Greater | | Total |
| | Fair Value | | Unrealized Losses | | Fair Value | | Unrealized Losses | | Fair Value | | Unrealized Losses | Fair Value | | Unrealized Losses | | Fair Value | | Unrealized Losses | | Fair Value | | Unrealized Losses |
| U.S. Treasury securities | | $ | 20,056 |
| | $ | (137 | ) | | $ | — |
| | $ | — |
| | $ | 20,056 |
| | $ | (137 | ) |
| U.S. Government agency and sponsored enterprise residential MBS | $ | 191,463 |
| | $ | (628 | ) | | $ | 112,391 |
| | $ | (1,080 | ) | | $ | 303,854 |
| | $ | (1,708 | ) | 579,076 |
| | (3,862 | ) | | 243,839 |
| | (2,651 | ) | | 822,915 |
| | (6,513 | ) |
| U.S. Government agency and sponsored enterprise commercial MBS | 89,437 |
| | (2,838 | ) | | — |
| | — |
| | 89,437 |
| | (2,838 | ) | 99,610 |
| | (696 | ) | | 6,477 |
| | (35 | ) | | 106,087 |
| | (731 | ) |
| Private label residential MBS and CMOs | 122,142 |
| | (1,680 | ) | | 8,074 |
| | (328 | ) | | 130,216 |
| | (2,008 | ) | 180,398 |
| | (838 | ) | | 41,636 |
| | (173 | ) | | 222,034 |
| | (1,011 | ) |
| Private label commercial MBS | 169,535 |
| | (2,370 | ) | | 24,985 |
| | (15 | ) | | 194,520 |
| | (2,385 | ) | 648,761 |
| | (1,060 | ) | | 76,302 |
| | (134 | ) | | 725,063 |
| | (1,194 | ) |
| Single family rental real estate-backed securities | 139,867 |
| | (842 | ) | | 176,057 |
| | (994 | ) | | 315,924 |
| | (1,836 | ) | 241,915 |
| | (1,445 | ) | | 5,460 |
| | (5 | ) | | 247,375 |
| | (1,450 | ) |
| Collateralized loan obligations | 69,598 |
| | (402 | ) | | 173,983 |
| | (848 | ) | | 243,581 |
| | (1,250 | ) | 63,310 |
| | (846 | ) | | 682,076 |
| | (7,015 | ) | | 745,386 |
| | (7,861 | ) |
| Non-mortgage asset-backed securities | 139,477 |
| | (2,926 | ) | | — |
| | — |
| | 139,477 |
| | (2,926 | ) | 78,964 |
| | (962 | ) | | 7,883 |
| | (85 | ) | | 86,847 |
| | (1,047 | ) |
| Preferred stocks | 10,087 |
| | (4 | ) | | — |
| | — |
| | 10,087 |
| | (4 | ) | |
| State and municipal obligations | 448,180 |
| | (11,049 | ) | | — |
| | — |
| | 448,180 |
| | (11,049 | ) | |
| SBA securities | 4,204 |
| | (13 | ) | | 20,076 |
| | (408 | ) | | 24,280 |
| | (421 | ) | 10,236 |
| | (2 | ) | | 142,204 |
| | (1,662 | ) | | 152,440 |
| | (1,664 | ) |
| | $ | 1,383,990 |
| | $ | (22,752 | ) | | $ | 515,566 |
| | $ | (3,673 | ) | | $ | 1,899,556 |
| | $ | (26,425 | ) | $ | 1,922,326 |
| | $ | (9,848 | ) | | $ | 1,205,877 |
| | $ | (11,760 | ) | | $ | 3,128,203 |
| | $ | (21,608 | ) |
The Company monitors its investment securities available for sale for OTTIcredit loss impairment on an individual security basis. No securities were determined to be other-than-temporarilycredit loss impaired during the ninethree and six months ended SeptemberJune 30, 2017.2020 or other than temporarily impaired during the three and six months ended June 30, 2019. The Company does not intend to sell securities that are in significant unrealized loss positions at SeptemberJune 30, 20172020 and it is not more likely than not that the Company will be required to sell these securities before recovery of the amortized cost basis, which may be at maturity. In making this determination, the Company considered its current and projected liquidity position, its investment policy as to permissible holdings and concentration limits, regulatory requirements and other relevant factors.
At SeptemberJune 30, 2017, 542020, 224 securities available for sale were in unrealized loss positions. The amount of impairment related to 2064 of these securities was considered insignificant both individually and in the aggregate, totaling approximately $237$398 thousand and no further analysis with respect to these securities was considered necessary.
Unrealized losses at June 30, 2020, particularly in the private label CMBS and CLO asset classes, were primarily attributable to widening spreads, resulting in large part from market response to, and dislocation in the wake of, the COVID-19 pandemic.
The basis for concluding that impairment of the remainingAFS securities were not credit loss impaired and no ACL was not other-than-temporaryconsidered necessary at June 30, 2020 is further described below:discussed below.
U.S. Government agencyAgency and sponsored enterprise residentialMBSand commercial MBSGovernment Sponsored Enterprise Securities
At SeptemberJune 30, 2017, eight2020, NaN U.S. Government agency and sponsored enterprise residential MBS, and four5 U.S. Government agency and sponsored enterprise commercial MBS and 11 SBA securities were in unrealized loss positions. For five fixed rate securities, the impairment was primarily attributable to an increase in medium and long-term market interest rates subsequent to the date of acquisition. For the remaining seven variable rate securities, the amount of impairment was less than 1% of amortized cost. The timely payment of principal and interest on these securities is explicitly or implicitly guaranteed by the U.S. Government. GivenAs such, there is an assumption of zero credit loss and the expectation of timely payment of principal and interest,Company expects to recover the impairments were considered to be temporary.
Private label residentialMBSandCMOs
At September 30, 2017, five private label residential MBS and CMOs were in unrealized loss positions, primarily as a result of an increase in medium and long-term market interest rates subsequent to acquisition. The amount of impairment of each of the individual securities was less than 3% ofentire amortized cost. These securities were assessed for OTTI using credit and prepayment behavioral models that incorporate CUSIP level constant default rates, voluntary prepayment rates and loss severity and delinquency assumptions. The resultscost basis of these assessments were not indicative of credit losses related to any of these securities as of September 30, 2017. Given the limited severity of impairment and the expectation of timely recovery of outstanding principal, the impairments were considered to be temporary.securities.
BANKUNITED, INC. AND SUBSIDIARIES
NOTES TO CONSOLIDATED FINANCIAL STATEMENTS - UNAUDITED
SeptemberJune 30, 20172020
Private Label Securities:
None of the impaired securities had missed principal or interest payments or had been downgraded by a NRSRO at June 30, 2020. The Company performed an analysis comparing the present value of cash flows expected to be collected to the amortized cost basis of impaired securities. This analysis was based on a scenario that we believe to be generally more severe than our reasonable and supportable economic forecast at June 30, 2020, and incorporated assumptions about voluntary prepayment rates, collateral defaults, delinquencies, severity and other relevant factors as described further below. Our analysis also considered the structural characteristics of each security and the level of credit enhancement provided by that structure. Based on the results of this analysis, the Company expects to recover the entire amortized cost basis of its impaired AFS securities at June 30, 2020. No ACL was considered necessary at June 30, 2020.
Private label residential MBS and CMOs
At June 30, 2020,7 private label residential MBS and CMOs were in unrealized loss positions. Our analysis of cash flows expected to be collected on these securities incorporated assumptions about collateral default rates, voluntary prepayment rates, loss severity, delinquencies and recovery lag. In developing those assumptions, we took into account collateral quality measures such as FICO, LTV, documentation, loan type, property type, agency availability criteria and performing status. We also regularly monitor sector data including home price appreciation, forbearance, delinquency and prepay trends as well as other economic data which would indicate further stress in the sector. Our June 30, 2020 analysis projected weighted average collateral losses for this category of 4% compared to weighted average credit support of 17%. As of June 30, 2020, 88% of the impaired securities in this category, based on carrying value, were externally rated AAA, and one security representing 12% of impaired securities in this category was not externally rated; this security was internally rated investment grade.
Private label commercialMBS
At SeptemberJune 30, 2017, four2020, 70 private label commercial MBS were in unrealized loss positions. The amountOur analysis of impairment of each of the individual securities was less than 3% of amortized cost. The unrealized losses were primarily attributable to increases in market interest rates since the purchase of the securities. These securities were assessed for OTTI using credit and prepayment behavioral models incorporating assumptions consistent with the collateral characteristics of each security. The results of this analysis were not indicative ofcash flows expected credit losses. Given the limited severity of impairment and the expectation of timely recovery of outstanding principal, the impairments were considered to be temporary.collected on these securities incorporated assumptions about collateral default rates, voluntary prepayment rates, loss severity, delinquencies and recovery lag. In developing those assumptions, we took into account collateral quality and type, loan size, loan purpose and other qualitative factors. We also regularly monitor collateral watchlists, bankruptcy data, special servicing trends, delinquency and other economic data which would indicate further stress in the sector. Our June 30, 2020 analysis projected weighted average collateral losses for this category of 13% compared to weighted average credit support of 42%. As of June 30, 2020, 83% of impaired securities in this category, based on carrying value were externally rated AAA, 12% were rated AA and 5% were rated A.
Single family rental real estate-backed securities
At SeptemberJune 30, 2017, two2020, 10 single family rental real estate-backed securities were in unrealized loss positions. The unrealizedOur analysis of cash flows expected to be collected on these securities incorporated assumptions about collateral default rates, loss severity, delinquencies and recovery lag. We regularly monitor sector data including home price appreciation, forbearance, delinquency and prepay trends as well as other economic data which would indicate further stress in the sector. Our June 30, 2020 analysis projected weighted average collateral losses were primarily duefor this category of 13% compared to increases in market interest rates since the purchaseweighted average credit support of 49%. As of June 30, 2020, 87% of the securities. The amount of impairment of each of the individualimpaired securities was less than 2% of amortized cost. Management's analysis of the credit characteristics, including loan-to-valuein this category, based on carrying value, were externally rated AAA and debt service coverage ratios, and levels of subordination for each of the securities is not indicative of projected credit losses. Given the limited severity of impairment and the absence of projected credit losses, the impairments13% were considered to be temporary.rated AA.
State and municipalCollateralized loan obligations
At SeptemberJune 30, 2017, 11 state and municipal2020, NaN collateralized loan obligations were in unrealized loss positions. The amount of impairment of each of the individual securities was less than 5% of amortized cost. All of the securities are rated investment grade by nationally recognized statistical ratings organizations. Management's evaluation ofLeveraged loans underlying these securities for OTTI also encompassedhave seen pricing pressure as the reviewmarket looks to evaluate ability of credit scoresborrowers to maintain payments. Uncertainties surrounding the broad economy and analysis provided by a third party firm specializinghow they may translate into rating downgrades and defaults as the COVID-19 crisis plays out have negatively impacted pricing in the leveraged loan market. Our analysis and credit review of municipal securities. Given the absence ofcash flows expected credit losses and management's ability and intent to hold the securities until recovery, the impairments were considered to be temporary.collected on these securities incorporated assumptions about collateral default rates, loss severity, and delinquencies, calibrated to take into account idiosyncratic risks associated with the underlying collateral. In developing those assumptions, we took into account each sector’s performance pre, during and post the 2008 financial crisis. We regularly engage with bond managers to monitor trends in underlying collateral including potential downgrades and subsequent cash flow diversions, liquidity, ratings migration, and any other relevant developments. Our June 30, 2020 analysis projected weighted average collateral losses for this category of 21% compared to weighted average credit support of 41%. As of June 30, 2020, 84% of
BANKUNITED, INC. AND SUBSIDIARIES
NOTES TO CONSOLIDATED FINANCIAL STATEMENTS - UNAUDITED
SeptemberJune 30, 20172020
the impaired securities in this category, based on carrying value, were externally rated AAA, 13% were rated AA and 3% were rated A.
Non-mortgage asset-backed securities
At June 30, 2020, 3 non-mortgage asset-backed securities were in unrealized loss positions. These securities are backed by student loan collateral. Our analysis of cash flows expected to be collected on these securities incorporated assumptions about collateral default rates, loss severity, delinquencies, voluntary prepayment rates and recovery lag. In developing those assumptions, we took into account collateral type, delineated by whether collateral consisted of loans to borrowers in school, refinancing, or a mixture. Our June 30, 2020 analysis projected weighted average collateral losses for this category of 14% compared to weighted average credit support of 25%. As of June 30, 2020, 50% of the impaired securities in this category, based on carrying value, were externally rated AAA and 50% were rated AA.
Note 4 Loans and Allowance for Loan and LeaseCredit Losses
The Company segregates its loan portfolio between covered and non-covered loans. Non-covered loans include loans originated since the FSB acquisition and commercial and consumer loans acquired in the FSB Acquisition for which loss share coverage has terminated. Covered loans are further segregated between ACI loans and non-ACI loans.
Loans consisted of the following at the dates indicated (dollars in thousands):
| | | | September 30, 2017 | | | | | | | | | |
| |
| | Covered Loans | | | | Percent of Total | June 30, 2020 | | December 31, 2019 |
| | Non-Covered Loans | | ACI | | Non-ACI | | Total | | Total | | Percent of Total | | Total | | Percent of Total |
| Residential and other consumer: | |
| | |
| | |
| | |
| | |
| |
| | |
| | |
| | |
|
| 1-4 single family residential | $ | 3,958,205 |
| | $ | 470,300 |
| | $ | 28,589 |
| | $ | 4,457,094 |
| | 21.7 | % | $ | 4,743,866 |
| | 19.9 | % | | $ | 4,953,936 |
| | 21.4 | % |
| Home equity loans and lines of credit | 1,644 |
| | 5,640 |
| | 37,764 |
| | 45,048 |
| | 0.2 | % | |
| Government insured residential | | 826,238 |
| | 3.5 | % | | 698,644 |
| | 3.0 | % |
| Other consumer loans | 20,166 |
| | — |
| | — |
| | 20,166 |
| | 0.1 | % | 7,703 |
| | 0.1 | % | | 8,539 |
| | 0.1 | % |
| | 3,980,015 |
| | 475,940 |
| | 66,353 |
| | 4,522,308 |
| | 22.0 | % | 5,577,807 |
| | 23.5 | % | | 5,661,119 |
| | 24.5 | % |
| Commercial: | | | | | | | | | | | | | | | | |
| Multi-family | 3,358,801 |
| | — |
| | — |
| | 3,358,801 |
| | 16.3 | % | 1,893,753 |
| | 7.9 | % | | 2,217,705 |
| | 9.6 | % |
| Non-owner occupied commercial real estate | 4,183,275 |
| | — |
| | — |
| | 4,183,275 |
| | 20.4 | % | 4,940,531 |
| | 20.7 | % | | 5,030,904 |
| | 21.7 | % |
| Construction and land | 271,994 |
| | — |
| | — |
| | 271,994 |
| | 1.3 | % | 246,609 |
| | 1.0 | % | | 243,925 |
| | 1.1 | % |
| Owner occupied commercial real estate | 1,959,464 |
| | — |
| | — |
| | 1,959,464 |
| | 9.5 | % | 2,041,346 |
| | 8.6 | % | | 2,062,808 |
| | 8.9 | % |
| Commercial and industrial | 3,900,290 |
| | — |
| | — |
| | 3,900,290 |
| | 19.0 | % | 4,691,326 |
| | 19.7 | % | | 4,655,349 |
| | 20.1 | % |
| Commercial lending subsidiaries | 2,374,193 |
| | — |
| | — |
| | 2,374,193 |
| | 11.5 | % | |
| PPP | | 827,359 |
| | 3.5 | % | | — |
| | — | % |
| Pinnacle | | 1,242,506 |
| | 5.1 | % | | 1,202,430 |
| | 5.2 | % |
| Bridge - franchise finance | | 623,139 |
| | 2.6 | % | | 627,482 |
| | 2.6 | % |
| Bridge - equipment finance | | 589,785 |
| | 2.5 | % | | 684,794 |
| | 3.0 | % |
| Mortgage warehouse lending | | 1,160,728 |
| | 4.9 | % | | 768,472 |
| | 3.3 | % |
| | 16,048,017 |
| | — |
| | — |
| | 16,048,017 |
| | 78.0 | % | 18,257,082 |
| | 76.5 | % | | 17,493,869 |
| | 75.5 | % |
| Total loans | 20,028,032 |
| | 475,940 |
| | 66,353 |
| | 20,570,325 |
| | 100.0 | % | 23,834,889 |
| | 100.0 | % | | 23,154,988 |
| | 100.0 | % |
| Premiums, discounts and deferred fees and costs, net | 44,422 |
| | — |
| | (4,317 | ) | | 40,105 |
| | | |
| Loans including premiums, discounts and deferred fees and costs | 20,072,454 |
| | 475,940 |
| | 62,036 |
| | 20,610,430 |
| | | |
| Allowance for loan and lease losses | (153,725 | ) | | (1,812 | ) | | (3,036 | ) | | (158,573 | ) | | | |
| Allowance for credit losses | | (266,123 | ) | | | | (108,671 | ) | | |
| Loans, net | $ | 19,918,729 |
| | $ | 474,128 |
| | $ | 59,000 |
| | $ | 20,451,857 |
| | | $ | 23,568,766 |
| | | | $ | 23,046,317 |
| | |
Premiums, discounts and deferred fees and costs, excluding the non-credit related discount on PCD loans, totaled $25 million and $50 million at June 30, 2020 and December 31, 2019, respectively. The amortized cost basis of residential PCD loans was $134 million and the related amount of non-credit discount was $135 million at June 30, 2020. The ACL related to PCD residential loans was $1.1 million and $1.7 million at June 30, 2020 and January 1, 2020, the date of initial adoption of ASU 2016-13, respectively.
Included in the table above are direct or sales type finance leases totaling $757 million and $733 million at June 30, 2020 and December 31, 2019, respectively. The amount of income recognized from direct or sales type finance leases for the three and six months ended June 30, 2020 and 2019 totaled $5.3 million, $10.7 million, $5.5 million and $10.8 million, respectively and is recorded as interest income on loans in the consolidated statements of income.
BANKUNITED, INC. AND SUBSIDIARIES
NOTES TO CONSOLIDATED FINANCIAL STATEMENTS - UNAUDITED
SeptemberJune 30, 20172020
|
| | | | | | | | | | | | | | | | | | |
| | December 31, 2016 |
| |
| | Covered Loans | | | | Percent of Total |
| | Non-Covered Loans | | ACI | | Non-ACI | | Total | |
| Residential and other consumer: | |
| | |
| | |
| | |
| | |
|
| 1-4 single family residential | $ | 3,422,425 |
| | $ | 532,348 |
| | $ | 36,675 |
| | $ | 3,991,448 |
| | 20.6 | % |
| Home equity loans and lines of credit | 1,120 |
| | 3,894 |
| | 47,629 |
| | 52,643 |
| | 0.3 | % |
| Other consumer loans | 24,365 |
| | — |
| | — |
| | 24,365 |
| | 0.1 | % |
| | 3,447,910 |
| | 536,242 |
| | 84,304 |
| | 4,068,456 |
| | 21.0 | % |
| Commercial: | | | | | | | | | |
| Multi-family | 3,824,973 |
| | — |
| | — |
| | 3,824,973 |
| | 19.8 | % |
| Non-owner occupied commercial real estate | 3,739,235 |
| | — |
| | — |
| | 3,739,235 |
| | 19.3 | % |
| Construction and land | 311,436 |
| | — |
| | — |
| | 311,436 |
| | 1.6 | % |
| Owner occupied commercial real estate | 1,736,858 |
| | — |
| | — |
| | 1,736,858 |
| | 9.0 | % |
| Commercial and industrial | 3,391,614 |
| | — |
| | — |
| | 3,391,614 |
| | 17.5 | % |
| Commercial lending subsidiaries | 2,280,685 |
| | — |
| | — |
| | 2,280,685 |
| | 11.8 | % |
| | 15,284,801 |
| | — |
| | — |
| | 15,284,801 |
| | 79.0 | % |
| Total loans | 18,732,711 |
| | 536,242 |
| | 84,304 |
| | 19,353,257 |
| | 100.0 | % |
| Premiums, discounts and deferred fees and costs, net | 48,641 |
| | — |
| | (6,504 | ) | | 42,137 |
| | |
| Loans including premiums, discounts and deferred fees and costs | 18,781,352 |
| | 536,242 |
| | 77,800 |
| | 19,395,394 |
| | |
| Allowance for loan and lease losses | (150,853 | ) | | — |
| | (2,100 | ) | | (152,953 | ) | | |
| Loans, net | $ | 18,630,499 |
| | $ | 536,242 |
| | $ | 75,700 |
| | $ | 19,242,441 |
| | |
Included in non-covered loans above are $38 million and $47 million at September 30, 2017 and December 31, 2016, respectively, of ACI commercial loans acquired in the FSB Acquisition.
Through two subsidiaries, the Bank provides commercial and municipal equipment and franchise financing utilizing both loan and lease structures. At September 30, 2017 and December 31, 2016, the commercial lending subsidiaries portfolio included a net investment in direct financing leases of $680 million and $643 million, respectively.
During the three and ninesix months ended SeptemberJune 30, 20172020 and 2016,2019, the Company purchased 1-4 single family residential loans totaling $312$582 million, $949 million, $355$1.1 billion, $589 million and $937$894 million, respectively. Purchases for the three and six months ended June 30, 2020 and 2019 included $243 million, $529 million, $151 million and $284 million, respectively, of government insured residential loans.
At SeptemberJune 30, 2017,2020 and December 31, 2019, the Company had pledged real estate loans with UPBa carrying value of approximately $10.5$11.0 billion and recorded investment of approximately $9.9$10.2 billion, respectively, as security for FHLB advances.advances, Federal Reserve discount window capacity and PPPLF borrowings.
At SeptemberJune 30, 20172020 and December 31, 2016,2019, accrued interest receivable on loans totaled $108 million and $83 million, respectively, and is included in other assets in the UPBaccompanying consolidated balance sheets. The amount of ACIinterest income reversed on non-accrual loans was $1.2 billionnot material for the three and $1.5 billion, respectively. The accretable yield on ACI loans represents the amount by which undiscounted expected future cash flows exceed recorded investment. Changessix months ended June 30, 2020.
Allowance for credit losses
Activity in the accretable yield on ACI loansallowance for credit losses is summarized below. The balance at December 31, 2019 and amounts presented for the ninethree and six months ended SeptemberJune 30, 20172019 represent the allowance for loan and leases losses, estimated using an incurred loss methodology. The ACL at June 30, 2020 and activity for the yearthree and six months then ended December 31, 2016 were as followsdetermined using the CECL methodology (in thousands):
|
| | | |
| Balance at December 31, 2015 | $ | 902,565 |
|
| Reclassifications from non-accretable difference | 76,751 |
|
| Accretion | (303,931 | ) |
| Balance at December 31, 2016 | 675,385 |
|
| Reclassifications from non-accretable difference | 72,827 |
|
| Accretion | (226,251 | ) |
| Balance at September 30, 2017 | $ | 521,961 |
|
|
| | | | | | | | | | | | | | | | | | | | | | | |
| | Three Months Ended June 30, |
| | 2020 | | 2019 |
| | Residential and Other Consumer | | Commercial | | Total | | Residential and Other Consumer | | Commercial | | Total |
| Beginning balance | $ | 12,576 |
| | $ | 238,003 |
| | $ | 250,579 |
| | $ | 10,952 |
| | $ | 103,751 |
| | $ | 114,703 |
|
| Provision (recovery) | (1,924 | ) | | 33,508 |
| | 31,584 |
| | 131 |
| | (2,878 | ) | | (2,747 | ) |
| Charge-offs | — |
| | (19,178 | ) | | (19,178 | ) | | — |
| | (1,711 | ) | | (1,711 | ) |
| Recoveries | 43 |
| | 3,095 |
| | 3,138 |
| | 153 |
| | 1,743 |
| | 1,896 |
|
| Ending balance | $ | 10,695 |
| | $ | 255,428 |
| | $ | 266,123 |
| | $ | 11,236 |
| | $ | 100,905 |
| | $ | 112,141 |
|
17 |
| | | | | | | | | | | | | | | | | | | | | | | |
| | Six Months Ended June 30, |
| | 2020 | | 2019 |
| | Residential and Other Consumer | | Commercial | | Total | | Residential and Other Consumer | | Commercial | | Total |
| Beginning balance | $ | 11,154 |
| | $ | 97,517 |
| | $ | 108,671 |
| | $ | 10,788 |
| | $ | 99,143 |
| | $ | 109,931 |
|
| Impact of adoption of ASU 2016-13 | 8,098 |
| | 19,207 |
| | 27,305 |
| | — |
| | — |
| | — |
|
| Provision (recovery) | (8,572 | ) | | 162,021 |
| | 153,449 |
| | 281 |
| | 7,253 |
| | 7,534 |
|
| Charge-offs | (31 | ) | | (26,953 | ) | | (26,984 | ) | | — |
| | (7,844 | ) | | (7,844 | ) |
| Recoveries | 46 |
| | 3,636 |
| | 3,682 |
| | 167 |
| | 2,353 |
| | 2,520 |
|
| Ending balance | $ | 10,695 |
| | $ | 255,428 |
| | $ | 266,123 |
| | $ | 11,236 |
| | $ | 100,905 |
| | $ | 112,141 |
|
BANKUNITED, INC. AND SUBSIDIARIES
NOTES TO CONSOLIDATED FINANCIAL STATEMENTS - UNAUDITED
SeptemberJune 30, 20172020
Covered loan sales
During the periods indicated, the Company sold covered residential loans to third parties on a non-recourse basis. The following table summarizespresents the impactcomponents of these transactions (in thousands):
|
| | | | | | | | | | | |
| | Three Months Ended September 30, | | Nine Months Ended September 30, |
| | 2016 | | 2017 | | 2016 |
| UPB of loans sold | $ | 61,406 |
| | $ | 123,737 |
| | $ | 176,958 |
|
| | | | | | |
| Cash proceeds, net of transaction costs | $ | 37,047 |
| | $ | 98,404 |
| | $ | 120,537 |
|
| Recorded investment in loans sold | 47,080 |
| | 99,986 |
| | 135,432 |
|
| Loss on sale of covered loans, net | $ | (10,033 | ) | | $ | (1,582 | ) | | $ | (14,895 | ) |
| | | | | | |
| Gain on FDIC indemnification, net | $ | 8,026 |
| | $ | 1,266 |
| | $ | 11,958 |
|
There was no sale of covered loansthe provision for the three months ended September 30, 2017.
Allowance for loan and leasecredit losses
Activity in the ALLL is summarized as follows for the periods indicated (in thousands):
|
| | | | | | | |
| | Three Months Ended June 30, 2020 | | Six Months Ended June 30, 2020 |
| Amount related to funded portion of loans | $ | 31,584 |
| | $ | 153,449 |
|
| Amount related to off-balance sheet credit exposures | (6,170 | ) | | (2,607 | ) |
| Provision for credit losses | $ | 25,414 |
| | $ | 150,842 |
|
|
| | | | | | | | | | | | | | | | | | | | | | | | | | | |
| | Three Months Ended September 30, |
| | 2017 | | 2016 |
| | Residential and Other Consumer | | Commercial | | Unallocated | | Total | | Residential and Other Consumer | | Commercial | | Total |
| Beginning balance | $ | 13,550 |
| | $ | 142,098 |
| | $ | — |
| | $ | 155,648 |
| | $ | 12,415 |
| | $ | 123,303 |
| | $ | 135,718 |
|
| Provision for (recovery of) loan losses: | | | | | | | | | | | | | |
| Covered loans | 268 |
| | (7 | ) | | — |
| | 261 |
| | (430 | ) | | (15 | ) | | (445 | ) |
| Non-covered loans | 363 |
| | 32,230 |
| | 5,000 |
| | 37,593 |
| | 1,974 |
| | 22,879 |
| | 24,853 |
|
| Total provision | 631 |
| | 32,223 |
| | 5,000 |
| | 37,854 |
| | 1,544 |
| | 22,864 |
| | 24,408 |
|
| Charge-offs: | | | | | | | | | | | | | |
| Covered loans | — |
| | — |
| | — |
| | — |
| | (247 | ) | | — |
| | (247 | ) |
| Non-covered loans | — |
| | (36,028 | ) | | — |
| | (36,028 | ) | | — |
| | (6,615 | ) | | (6,615 | ) |
| Total charge-offs | — |
| | (36,028 | ) | | — |
| | (36,028 | ) | | (247 | ) | | (6,615 | ) | | (6,862 | ) |
| Recoveries: | | | | | | | | | | | | | |
| Covered loans | 31 |
| | 7 |
| | — |
| | 38 |
| | 9 |
| | 15 |
| | 24 |
|
| Non-covered loans | 8 |
| | 1,053 |
| | — |
| | 1,061 |
| | 5 |
| | 1,183 |
| | 1,188 |
|
| Total recoveries | 39 |
| | 1,060 |
| | — |
| | 1,099 |
| | 14 |
| | 1,198 |
| | 1,212 |
|
| Ending balance | $ | 14,220 |
| | $ | 139,353 |
| | $ | 5,000 |
| | $ | 158,573 |
| | $ | 13,726 |
| | $ | 140,750 |
| | $ | 154,476 |
|
BANKUNITED, INC. AND SUBSIDIARIES
NOTES TO CONSOLIDATED FINANCIAL STATEMENTS - UNAUDITED
September 30, 2017
|
| | | | | | | | | | | | | | | | | | | | | | | | | | | |
| | Nine Months Ended September 30, |
| | 2017 | | 2016 |
| | Residential and Other Consumer | | Commercial | | Unallocated | | Total | | Residential and Other Consumer | | Commercial | | Total |
| Beginning balance | $ | 11,503 |
| | $ | 141,450 |
| | $ | — |
| | $ | 152,953 |
| | $ | 16,211 |
| | $ | 109,617 |
| | $ | 125,828 |
|
| Provision for (recovery of) loan losses: | | | | | | | | | | | | | |
| Covered loans | 2,738 |
| | (45 | ) | | — |
| | 2,693 |
| | (1,074 | ) | | (45 | ) | | (1,119 | ) |
| Non-covered loans | (52 | ) | | 55,932 |
| | 5,000 |
| | 60,880 |
| | (420 | ) | | 43,988 |
| | 43,568 |
|
| Total provision | 2,686 |
| | 55,887 |
| | 5,000 |
| | 63,573 |
| | (1,494 | ) | | 43,943 |
| | 42,449 |
|
| Charge-offs: | | | | | | | | | | | | | |
| Covered loans | (55 | ) | | — |
| | — |
| | (55 | ) | | (1,086 | ) | | — |
| | (1,086 | ) |
| Non-covered loans | — |
| | (61,034 | ) | | — |
| | (61,034 | ) | | — |
| | (15,748 | ) | | (15,748 | ) |
| Total charge-offs | (55 | ) | | (61,034 | ) | | — |
| | (61,089 | ) | | (1,086 | ) | | (15,748 | ) | | (16,834 | ) |
| Recoveries: | | | | | | | | | | | | | |
| Covered loans | 65 |
| | 45 |
| | — |
| | 110 |
| | 77 |
| | 45 |
| | 122 |
|
| Non-covered loans | 21 |
| | 3,005 |
| | — |
| | 3,026 |
| | 18 |
| | 2,893 |
| | 2,911 |
|
| Total recoveries | 86 |
| | 3,050 |
| | — |
| | 3,136 |
| | 95 |
| | 2,938 |
| | 3,033 |
|
| Ending balance | $ | 14,220 |
| | $ | 139,353 |
| | $ | 5,000 |
| | $ | 158,573 |
| | $ | 13,726 |
| | $ | 140,750 |
| | $ | 154,476 |
|
BANKUNITED, INC. AND SUBSIDIARIES
NOTES TO CONSOLIDATED FINANCIAL STATEMENTS - UNAUDITED
September 30, 2017
The following table presents information about the balance of the ALLL and related loans at the dates indicated (in thousands):
|
| | | | | | | | | | | | | | | | | | | | | | | | | | | |
| | September 30, 2017 | | December 31, 2016 |
| | Residential and Other Consumer | | Commercial | | Unallocated | | Total | | Residential and Other Consumer | | Commercial | | Total |
| Allowance for loan and lease losses: | | | | | | | | | |
| | |
| | |
|
| Ending balance | $ | 14,220 |
| | $ | 139,353 |
| | $ | 5,000 |
| | $ | 158,573 |
| | $ | 11,503 |
| | $ | 141,450 |
| | $ | 152,953 |
|
| Covered loans: | | | | | | | | | | | | | |
| Ending balance | $ | 4,848 |
| | $ | — |
| | $ | — |
| | $ | 4,848 |
| | $ | 2,100 |
| | $ | — |
| | $ | 2,100 |
|
| Ending balance: non-ACI loans individually evaluated for impairment | $ | 1,024 |
| | $ | — |
| | $ | — |
| | $ | 1,024 |
| | $ | 529 |
| | $ | — |
| | $ | 529 |
|
| Ending balance: non-ACI loans collectively evaluated for impairment | $ | 2,012 |
| | $ | — |
| | $ | — |
| | $ | 2,012 |
| | $ | 1,571 |
| | $ | — |
| | $ | 1,571 |
|
| Ending balance: ACI loans | $ | 1,812 |
| | $ | — |
| | $ | — |
| | $ | 1,812 |
| | $ | — |
| | $ | — |
| | $ | — |
|
| Non-covered loans: | | | | | | | | | | | | | |
| Ending balance | $ | 9,372 |
| | $ | 139,353 |
| | $ | 5,000 |
| | $ | 153,725 |
| | $ | 9,403 |
| | $ | 141,450 |
| | $ | 150,853 |
|
| Ending balance: new loans individually evaluated for impairment | $ | 71 |
| | $ | 23,902 |
| | $ | — |
| | $ | 23,973 |
| | $ | 12 |
| | $ | 19,229 |
| | $ | 19,241 |
|
| Ending balance: new loans collectively evaluated for impairment | $ | 9,301 |
| | $ | 115,451 |
| | $ | 5,000 |
| | $ | 129,752 |
| | $ | 9,391 |
| | $ | 122,221 |
| | $ | 131,612 |
|
| Ending balance: ACI loans | $ | — |
| | $ | — |
| | $ | — |
| | $ | — |
| | $ | — |
| | $ | — |
| | $ | — |
|
| Loans: | | | | | | | 0 |
| | | | | | |
| Covered loans: | | | | | | | | | | | | | |
| Ending balance | $ | 537,976 |
| | $ | — |
| | $ | — |
| | $ | 537,976 |
| | $ | 614,042 |
| | $ | — |
| | $ | 614,042 |
|
| Ending balance: non-ACI loans individually evaluated for impairment | $ | 11,721 |
| | $ | — |
| | $ | — |
| | $ | 11,721 |
| | $ | 12,396 |
| | $ | — |
| | $ | 12,396 |
|
| Ending balance: non-ACI loans collectively evaluated for impairment | $ | 50,315 |
| | $ | — |
| | $ | — |
| | $ | 50,315 |
| | $ | 65,404 |
| | $ | — |
| | $ | 65,404 |
|
| Ending balance: ACI loans | $ | 475,940 |
| | $ | — |
| | $ | — |
| | $ | 475,940 |
| | $ | 536,242 |
| | $ | — |
| | $ | 536,242 |
|
| Non-covered loans: | | | | | | | | | | | | | |
| Ending balance | $ | 4,033,612 |
| | $ | 16,038,842 |
| | $ | — |
| | $ | 20,072,454 |
| | $ | 3,495,775 |
| | $ | 15,285,577 |
| | $ | 18,781,352 |
|
| Ending balance: new loans individually evaluated for impairment | $ | 911 |
| | $ | 210,364 |
| | $ | — |
| | $ | 211,275 |
| | $ | 561 |
| | $ | 176,932 |
| | $ | 177,493 |
|
| Ending balance: new loans collectively evaluated for impairment | $ | 4,032,701 |
| | $ | 15,790,546 |
| | $ | — |
| | $ | 19,823,247 |
| | $ | 3,495,207 |
| | $ | 15,061,707 |
| | $ | 18,556,914 |
|
| Ending balance: ACI loans | $ | — |
| | $ | 37,932 |
| | $ | — |
| | $ | 37,932 |
| | $ | 7 |
| | $ | 46,938 |
| | $ | 46,945 |
|
The ALLL on residential and other consumer ACI loans at September 30, 2017 represents impairment of one pool of ACI home equity loans and lines of credit.
The ALLL at September 30, 2017 included $5.4 million related to the impact of Hurricanes Irma and Harvey, which made landfall during the three months ended September 30, 2017. The ALLL includes $0.4 million related to commercial loans that were downgraded during the three months ended September 30, 2017 as a result of the hurricanes and a $5.0 million unallocated qualitative allowance.
BANKUNITED, INC. AND SUBSIDIARIES
NOTES TO CONSOLIDATED FINANCIAL STATEMENTS - UNAUDITED
September 30, 2017
Credit quality information
Loans other than ACI loans are considered impaired when, basedThe increase in the ACL from January 1, 2020, the date of initial adoption of ASU 2016-13, to June 30, 2020 was reflective of the estimated impact of the emerging COVID-19 pandemic on current informationthe trajectory of the economy and events, it is probable that the Company will be unable to collect the scheduled payments of principal or interest when due, according to the contractual termson individual borrowers and portfolio sub-segments. The credit quality of the loan agreements. Commercial relationshipsportfolio has been and is likely to continue to be impacted by the developing COVID-19 crisis, its impact on non-accrual status with committed balances greater than or equal to $1.0 million that have internal risk ratingsthe economy broadly and more specifically on the Company's individual borrowers. Significant uncertainty currently exists about the extent of substandard or doubtful,this impact, and the impact is likely not fully reflected in some of the credit quality indicators disclosed below as well as loans that have been modified in TDRs, are individually evaluated for impairment. Other commercial relationships on non-accrual status with committed balances under $1.0 million may also be evaluated individually for impairment, at management's discretion. The likelihood of loss related to loans assigned internal risk ratings of substandard or doubtful is considered elevatedJune 30, 2020, due to their identified credit weaknesses. Factors considered by management in evaluating impairment include payment status, financial conditionthe ongoing impact of the borrower, collateral value,pandemic.
Credit quality of loans held for investment is continuously monitored by dedicated residential credit risk management and other factors impactingcommercial portfolio management functions. The Company also has a workout and recovery department that monitors the probabilitycredit quality of collecting scheduled principalcriticized and interest payments when due.
ACI loans or pools are considered to be impaired when it is probable that the Company will be unable to collect all of the expected cash flows at acquisition (as adjusted for any additional cash flows expected to be collected arising from changes in estimates after acquisition), other than due to changes in interest rate indices and prepayment assumptions.
BANKUNITED, INC. AND SUBSIDIARIES
NOTES TO CONSOLIDATED FINANCIAL STATEMENTS - UNAUDITED
September 30, 2017
The table below presents information about loans or ACI pools identified as impaired at the dates indicated (in thousands):
|
| | | | | | | | | | | | | | | | | | | | | | | |
| | September 30, 2017 | | December 31, 2016 |
| | Recorded Investment | | UPB | | Related Specific Allowance | | Recorded Investment | | UPB | | Related Specific Allowance |
| Non-covered loans: | |
| | |
| | |
| | |
| | |
| | |
|
| With no specific allowance recorded: | |
| | |
| | |
| | |
| | |
| | |
|
| 1-4 single family residential | $ | 27 |
| | $ | 32 |
| | $ | — |
| | $ | — |
| | $ | — |
| | $ | — |
|
| Non-owner occupied commercial real estate | 9,041 |
| | 9,224 |
| | — |
| | 510 |
| | 512 |
| | — |
|
| Construction and land | 1,238 |
| | 1,238 |
| | — |
| | 1,238 |
| | 1,238 |
| | — |
|
| Owner occupied commercial real estate | 16,786 |
| | 16,949 |
| | — |
| | 16,834 |
| | 16,894 |
| | — |
|
Commercial and industrial |
|
| |
|
| |
|
| |
|
| |
|
| | |
| Taxi medallion loans | 20,320 |
| | 20,321 |
| | — |
| | 18,107 |
| | 18,107 |
| | — |
|
| Other commercial and industrial | 1,081 |
| | 1,095 |
| | — |
| | 6,172 |
| | 6,172 |
| | — |
|
| Commercial lending subsidiaries | 12,810 |
| | 12,815 |
| | — |
| | 10,620 |
| | 10,510 |
| | — |
|
| With a specific allowance recorded: | | | | | | | | | | | |
| 1-4 single family residential | 884 |
| | 863 |
| | 71 |
| | 561 |
| | 546 |
| | 12 |
|
| Owner occupied commercial real estate | 3,961 |
| | 3,943 |
| | 2,994 |
| | 491 |
| | 513 |
| | 263 |
|
| Commercial and industrial |
|
| |
|
| |
|
| |
|
| |
|
| |
|
|
| Taxi medallion loans | 100,252 |
| | 100,255 |
| | 13,117 |
| | 73,131 |
| | 73,147 |
| | 5,948 |
|
| Other commercial and industrial | 41,297 |
| | 41,292 |
| | 7,313 |
| | 29,452 |
| | 29,463 |
| | 9,168 |
|
| Commercial lending subsidiaries | 3,578 |
| | 3,553 |
| | 478 |
| | 21,712 |
| | 21,605 |
| | 3,850 |
|
| Total: | | | | | | | | | | | |
| Residential and other consumer | $ | 911 |
| | $ | 895 |
| | $ | 71 |
| | $ | 561 |
| | $ | 546 |
| | $ | 12 |
|
| Commercial | 210,364 |
| | 210,685 |
| | 23,902 |
| | 178,267 |
| | 178,161 |
| | 19,229 |
|
| | $ | 211,275 |
| | $ | 211,580 |
| | $ | 23,973 |
| | $ | 178,828 |
| | $ | 178,707 |
| | $ | 19,241 |
|
| Covered loans: | | | | | | | | | | | |
| Non-ACI loans: | | | | | | | |
| | |
| | |
|
| With no specific allowance recorded: | | | | | | | |
| | |
| | |
|
| 1-4 single family residential | $ | 102 |
| | $ | 118 |
| | $ | — |
| | $ | 1,169 |
| | $ | 1,391 |
| | $ | — |
|
| Home equity loans and lines of credit | 1,312 |
| | 1,324 |
| | — |
| | 2,255 |
| | 2,286 |
| | — |
|
| With a specific allowance recorded: | | | | | | | | | | | |
| 1-4 single family residential | 2,221 |
| | 2,579 |
| | 208 |
| | 1,272 |
| | 1,514 |
| | 181 |
|
| Home equity loans and lines of credit | 8,086 |
| | 8,163 |
| | 816 |
| | 7,700 |
| | 7,804 |
| | 348 |
|
| | $ | 11,721 |
| | $ | 12,184 |
| | $ | 1,024 |
| | $ | 12,396 |
| | $ | 12,995 |
| | $ | 529 |
|
| ACI loans: | | | | | | | |
| | |
| | |
|
| With a specific allowance recorded: | | | | | | | |
| | |
| | |
|
| Home equity loans and lines of credit | $ | 5,640 |
| | $ | 27,731 |
| | $ | 1,812 |
| | $ | — |
| | $ | — |
| | $ | — |
|
Non-covered impaired loans include commercial real estate ACI loans modified in TDRs with a carrying value of $1.3 million as of December 31, 2016. Interest income recognized on impairedclassified loans and poolsan independent internal credit review function.
Credit quality indicators for the three and nine months ended September 30, 2017 was approximately $2.9 million and $8.3 million, respectively. Interest income recognized on impairedresidential loans for the three and nine months ended September 30, 2016 was not material.
BANKUNITED, INC. AND SUBSIDIARIES
NOTES TO CONSOLIDATED FINANCIAL STATEMENTS - UNAUDITED
September 30, 2017
The following tables present the average recorded investment in impaired loans or ACI pools for the periods indicated (in thousands):
|
| | | | | | | | | | | | | | | | | | | | | | | |
| | Three Months Ended September 30, |
| | 2017 | | 2016 |
| | | | Covered Loans | | | | Covered Loans |
| | Non-Covered Loans | | Non-ACI Loans | | ACI Loans | | Non-Covered Loans | | Non-ACI
Loans | | ACI Loans |
| Residential and other consumer: | |
| | |
| | | | | | |
| | |
| 1-4 single family residential | $ | 962 |
| | $ | 2,304 |
| | $ | — |
| | $ | 344 |
| | $ | 3,001 |
| | $ | — |
|
| Home equity loans and lines of credit | — |
| | 9,533 |
| | 5,166 |
| | — |
| | 9,551 |
| | — |
|
| | 962 |
| | $ | 11,837 |
| | $ | 5,166 |
| | 344 |
| | $ | 12,552 |
| | $ | — |
|
| Commercial: | | | | | | | | | | | |
| Multi-family | 1,359 |
| | | | | | — |
| | | | |
| Non-owner occupied commercial real estate | 8,216 |
| | | | | | 506 |
| | | | |
| Construction and land | 2,797 |
| | | | | | 1,285 |
| | | | |
| Owner occupied commercial real estate | 20,579 |
| | | | | | 18,231 |
| | | | |
| Commercial and industrial | | | | | | |
|
| | | | |
| Taxi medallion loans | 123,867 |
| | | | | | 56,125 |
| | | | |
| Other commercial and industrial | 42,479 |
| | | | | | 48,143 |
| | | | |
| Commercial lending subsidiaries | 21,398 |
| | | | | | 13,873 |
| | | | |
| | 220,695 |
| | | | | | 138,163 |
| | | |
|
|
| | $ | 221,657 |
| | | | | | $ | 138,507 |
| | | |
|
|
|
| | | | | | | | | | | | | | | | | | | | | | | |
| | Nine Months Ended September 30, |
| | 2017 | | 2016 |
| | | | Covered Loans | | | | Covered Loans |
| | Non-Covered Loans | | Non-ACI Loans | | ACI Loans | | Non-Covered Loans | | Non-ACI
Loans | | ACI Loans |
| Residential and other consumer: | |
| | |
| | | | | | |
| | |
| 1-4 single family residential | $ | 800 |
| | $ | 2,369 |
| | $ | — |
| | $ | 251 |
| | $ | 3,186 |
| | $ | — |
|
| Home equity loans and lines of credit | — |
| | 9,638 |
| | 4,209 |
| | — |
| | 8,920 |
| | — |
|
| | 800 |
| | $ | 12,007 |
| | $ | 4,209 |
| | 251 |
| | $ | 12,106 |
| | $ | — |
|
| Commercial: | | | | | | | | | | | |
| Multi-family | 1,816 |
| | | | | | — |
| | | | |
| Non-owner occupied commercial real estate | 4,056 |
| | | | | | 776 |
| | | | |
| Construction and land | 3,317 |
| | | | | | 650 |
| | | | |
| Owner occupied commercial real estate | 18,872 |
| | | | | | 13,711 |
| | | | |
| Commercial and industrial | | | | | | |
|
| | | | |
| Taxi medallion loans | 107,529 |
| | | | | | 30,977 |
| | | | |
| Other commercial and industrial | 43,308 |
| | | | | | 41,975 |
| | | | |
| Commercial lending subsidiaries | 27,202 |
| | | | | | 11,293 |
| | | | |
| | 206,100 |
| | | | | | 99,382 |
| | | |
|
|
| | $ | 206,900 |
| | | | | | $ | 99,633 |
| | | |
|
|
BANKUNITED, INC. AND SUBSIDIARIES
NOTES TO CONSOLIDATED FINANCIAL STATEMENTS - UNAUDITED
September 30, 2017
The following table presents the recorded investment in loans on non-accrual status as of the dates indicated (in thousands):
|
| | | | | | | | | | | | | | | |
| | September 30, 2017 | | December 31, 2016 |
| | Non-Covered Loans | | Covered
Non-ACI Loans | | Non-Covered Loans | | Covered Non-ACI Loans |
| Residential and other consumer: | |
| | |
| | |
| | |
|
| 1-4 single family residential | $ | 1,890 |
| | $ | 934 |
| | $ | 566 |
| | $ | 918 |
|
| Home equity loans and lines of credit | — |
| | 2,369 |
| | — |
| | 2,283 |
|
| Other consumer loans | 332 |
| | — |
| | 2 |
| | — |
|
| | 2,222 |
| | $ | 3,303 |
| | 568 |
| | $ | 3,201 |
|
| Commercial: | | | | | |
| | |
|
| Non-owner occupied commercial real estate | 9,930 |
| | | | 559 |
| |
|
|
| Construction and land | 1,238 |
| | | | 1,238 |
| |
|
|
| Owner occupied commercial real estate | 21,455 |
| | | | 19,439 |
| |
|
|
Commercial and industrial | | | | |
|
| |
|
|
| Taxi medallion loans | 120,572 |
| | | | 60,660 |
| | |
| Other commercial and industrial | 27,569 |
| | | | 16,036 |
| | |
| Commercial lending subsidiaries | 16,625 |
| | | | 32,645 |
| |
|
|
| | 197,389 |
| | | | 130,577 |
| |
|
|
| | $ | 199,611 |
| | | | $ | 131,145 |
| |
|
|
Non-covered loans contractually delinquent by 90 days or more and still accruing totaled $0.8 million and $1.6 million at September 30, 2017 and December 31, 2016, respectively. The amount of additional interest income that would have been recognized on non-accrual loans had they performed in accordance with their contractual terms was approximately $1.4 million and $3.7 million for the three and nine months ended September 30, 2017, respectively, and $1.1 million and $2.3 million for the three and nine months ended September 30, 2016, respectively.
Management considers delinquency status to be the most meaningful indicator of the credit quality of 1-4 single family residential home equity and other consumer loans, other than government insured residential loans. Delinquency statistics are updated at least monthly. See "Aging of loans" below for more information on the delinquency status of loans. Original LTV and original FICO scorescores are also important indicators of credit quality for the non-covered 1-4 single family residential portfolio. loans other than government insured loans. FICO scores are generally updated at least annually, and were most recently updated in the fourth quarter of 2019. LTVs are typically at origination since we do not routinely update residential appraisals. Substantially all of the government insured residential loans are government insured buyout loans, which the Company buys out of GNMA securitizations upon default. For these loans, traditional measures of credit quality are not particularly relevant considering the guaranteed nature of the loans and the underlying business model. Factors that impact risk inherent in the residential portfolio segment include national and regional economic conditions such as levels of unemployment and wages, as well as residential property values.
1-4 Single Family Residential credit exposure, excluding government insured residential loans, based on delinquency status:
|
| | | | | | | | | | | | | | | | | | | | | | | | | | | |
| | June 30, 2020 |
| | Amortized Cost By Origination Year | | |
| | 2020 | | 2019 | | 2018 | | 2017 | | 2016 | | Prior | | Total |
| Current | $ | 249,912 |
| | $ | 807,365 |
| | $ | 488,280 |
| | $ | 753,109 |
| | $ | 776,895 |
| | $ | 1,604,423 |
| | $ | 4,679,984 |
|
| 30 - 59 Days Past Due | 5,703 |
| | 11,477 |
| | 3,372 |
| | 2,701 |
| | 7,417 |
| | 18,605 |
| | 49,275 |
|
| 60 - 89 Days Past Due | — |
| | 720 |
| | 75 |
| | 53 |
| | 103 |
| | 1,882 |
| | 2,833 |
|
| 90 Days or More Past Due | — |
| | 807 |
| | 2,293 |
| | — |
| | 484 |
| | 8,190 |
| | 11,774 |
|
| | $ | 255,615 |
| | $ | 820,369 |
| | $ | 494,020 |
| | $ | 755,863 |
| | $ | 784,899 |
| | $ | 1,633,100 |
| | $ | 4,743,866 |
|
BANKUNITED, INC. AND SUBSIDIARIES
NOTES TO CONSOLIDATED FINANCIAL STATEMENTS - UNAUDITED
June 30, 2020
|
| | | | | | | | | | | | | | | | | | | | | | | | | | | |
| | December 31, 2019 |
| | Amortized Cost By Origination Year | | |
| | 2019 | | 2018 | | 2017 | | 2016 | | 2015 | | Prior | | Total |
| Current | $ | 804,913 |
| | $ | 609,814 |
| | $ | 830,710 |
| | $ | 783,318 |
| | $ | 633,833 |
| | $ | 1,225,030 |
| | $ | 4,887,618 |
|
| 30 - 59 Days Past Due | 13,915 |
| | 3,003 |
| | 3,751 |
| | 8,419 |
| | 4,308 |
| | 12,238 |
| | 45,634 |
|
| 60 - 89 Days Past Due | 1,785 |
| | 442 |
| | 137 |
| | 486 |
| | 1,766 |
| | 4,962 |
| | 9,578 |
|
| 90 Days or More Past Due | — |
| | 1,762 |
| | 914 |
| | — |
| | 5,030 |
| | 3,400 |
| | 11,106 |
|
| | $ | 820,613 |
| | $ | 615,021 |
| | $ | 835,512 |
| | $ | 792,223 |
| | $ | 644,937 |
| | $ | 1,245,630 |
| | $ | 4,953,936 |
|
1-4 Single Family Residential credit exposure, excluding government insured residential loans, based on LTV:
|
| | | | | | | | | | | | | | | | | | | | | | | | | | | |
| | June 30, 2020 |
| | Amortized Cost By Origination Year | | |
| LTV | 2020 | | 2019 | | 2018 | | 2017 | | 2016 | | Prior | | Total |
| Less than 61% | $ | 99,728 |
| | $ | 180,025 |
| | $ | 106,359 |
| | $ | 202,355 |
| | $ | 276,035 |
| | $ | 519,410 |
| | $ | 1,383,912 |
|
| 61% - 70% | 62,031 |
| | 192,880 |
| | 110,546 |
| | 136,212 |
| | 184,600 |
| | 394,279 |
| | 1,080,548 |
|
| 71% - 80% | 92,387 |
| | 433,542 |
| | 245,829 |
| | 349,993 |
| | 300,153 |
| | 689,223 |
| | 2,111,127 |
|
| More than 80% | 1,469 |
| | 13,922 |
| | 31,286 |
| | 67,303 |
| | 24,111 |
| | 30,188 |
| | 168,279 |
|
| | $ | 255,615 |
| | $ | 820,369 |
| | $ | 494,020 |
| | $ | 755,863 |
| | $ | 784,899 |
| | $ | 1,633,100 |
| | $ | 4,743,866 |
|
|
| | | | | | | | | | | | | | | | | | | | | | | | | | | |
| | December 31, 2019 |
| | Amortized Cost By Origination Year | | |
| LTV | 2019 | | 2018 | | 2017 | | 2016 | | 2015 | | Prior | | Total |
| Less than 61% | $ | 171,069 |
| | $ | 134,978 |
| | $ | 183,807 |
| | $ | 228,868 |
| | $ | 197,039 |
| | $ | 372,221 |
| | $ | 1,287,982 |
|
| 61% - 70 % | 195,572 |
| | 128,766 |
| | 152,502 |
| | 188,856 |
| | 154,307 |
| | 316,031 |
| | 1,136,034 |
|
| 71% - 80% | 442,311 |
| | 313,779 |
| | 404,743 |
| | 338,000 |
| | 283,202 |
| | 531,377 |
| | 2,313,412 |
|
| More than 80% | 11,661 |
| | 37,498 |
| | 94,460 |
| | 36,499 |
| | 10,389 |
| | 26,001 |
| | 216,508 |
|
| | $ | 820,613 |
| | $ | 615,021 |
| | $ | 835,512 |
| | $ | 792,223 |
| | $ | 644,937 |
| | $ | 1,245,630 |
| | $ | 4,953,936 |
|
1-4 Single Family Residential credit exposure, excluding government insured residential loans, based on FICO score:
|
| | | | | | | | | | | | | | | | | | | | | | | | | | | |
| | June 30, 2020 |
| | Amortized Cost By Origination Year | | |
| FICO | 2020 | | 2019 | | 2018 | | 2017 | | 2016 | | Prior | | Total |
| 760 or greater | $ | 168,920 |
| | $ | 482,818 |
| | $ | 298,650 |
| | $ | 521,199 |
| | $ | 573,011 |
| | $ | 1,093,732 |
| | $ | 3,138,330 |
|
| 720 - 759 | 70,279 |
| | 224,961 |
| | 112,407 |
| | 138,897 |
| | 131,205 |
| | 304,460 |
| | 982,209 |
|
| 719 or less | 16,416 |
| | 112,590 |
| | 82,963 |
| | 95,767 |
| | 80,683 |
| | 234,908 |
| | 623,327 |
|
| | $ | 255,615 |
| | $ | 820,369 |
| | $ | 494,020 |
| | $ | 755,863 |
| | $ | 784,899 |
| | $ | 1,633,100 |
| | $ | 4,743,866 |
|
BANKUNITED, INC. AND SUBSIDIARIES
NOTES TO CONSOLIDATED FINANCIAL STATEMENTS - UNAUDITED
June 30, 2020
|
| | | | | | | | | | | | | | | | | | | | | | | | | | | |
| | December 31, 2019 |
| | Amortized Cost By Origination Year | | |
| FICO | 2019 | | 2018 | | 2017 | | 2016 | | 2015 | | Prior | | Total |
| 760 or greater | $ | 470,057 |
| | $ | 340,716 |
| | $ | 534,017 |
| | $ | 533,804 |
| | $ | 430,706 |
| | $ | 763,807 |
| | $ | 3,073,107 |
|
| 720 - 759 | 242,806 |
| | 185,939 |
| | 200,623 |
| | 178,139 |
| | 141,748 |
| | 307,195 |
| | 1,256,450 |
|
| 719 or less | 107,750 |
| | 88,366 |
| | 100,872 |
| | 80,280 |
| | 72,483 |
| | 174,628 |
| | 624,379 |
|
| | $ | 820,613 |
| | $ | 615,021 |
| | $ | 835,512 |
| | $ | 792,223 |
| | $ | 644,937 |
| | $ | 1,245,630 |
| | $ | 4,953,936 |
|
Credit quality indicators for commercial loans
Factors that impact risk inherent in commercial portfolio segments include but are not limited to levels of economic activity, health of the national and regional economy, industry trends, patterns of and trends in customer behavior that influence demand for our borrowers' products and services, and commercial real estate values. Internal risk ratings are considered the most meaningful indicator of credit quality for commercial loans. Internal risk ratings are generally indicative of the likelihood that a borrower will default, are a key factor in identifyinginfluencing the level and nature of ongoing monitoring of loans that are individually evaluated for impairment and may impact management’s estimates of loss factors used in determining the amountestimation of the ALLL.ACL. Internal risk ratings are updated on a continuous basis. Generally, relationships with balances in excess of defined thresholds, ranging from $1 million to $3 million, are re-evaluated at least annually and more frequently if circumstances indicate that a change in risk rating may be warranted. During the second quarter of 2020, risk ratings were re-evaluated for a substantial portion of the commercial portfolio, with a focus on portfolio segments we identified for enhanced monitoring and loans for which we granted temporary payment deferrals in light of the COVID-19 pandemic. Loans exhibiting potential credit weaknesses that deserve management’s close attention and that if left uncorrected maycould result in deterioration of the repayment capacity of the borrowerprospects at some future date if not checked or corrected are categorized as special mention. Loans with well-defined credit weaknesses, including payment defaults, declining collateral values, frequent overdrafts, operating losses, increasing balance sheet leverage, inadequate cash flow, project cost overruns, unreasonable construction delays, past due real estate taxes or exhausted interest reserves, are assigned an internal risk rating of substandard. A loan with a weakness so severe that collection in full is highly questionable or improbable, but because of certain reasonably specific pending factors has not been charged off, will be assigned an internal risk rating of doubtful.
BANKUNITED, INC. AND SUBSIDIARIES
NOTES TO CONSOLIDATED FINANCIAL STATEMENTS - UNAUDITED
SeptemberJune 30, 20172020
The following tables summarize key indicators of credit quality for the Company's loans at the dates indicated. Amounts include premiums, discounts and deferred fees and costs (in thousands):
1-4 Single Family ResidentialCommercial credit exposure for non-covered loans, based on original LTV and FICO score: internal risk rating:
|
| | | | | | | | | | | | | | | | | | | | |
| | | September 30, 2017 |
| | | FICO |
| LTV | | 720 or less | | 721 - 740 | | 741 - 760 | | 761 or greater | | Total |
| 60% or less | | $ | 94,357 |
| | $ | 111,279 |
| | $ | 185,614 |
| | $ | 819,422 |
| | $ | 1,210,672 |
|
| 60% - 70% | | 93,963 |
| | 102,461 |
| | 140,350 |
| | 586,158 |
| | 922,932 |
|
| 70% - 80% | | 139,923 |
| | 173,808 |
| | 316,544 |
| | 1,091,868 |
| | 1,722,143 |
|
| More than 80% | | 24,725 |
| | 20,610 |
| | 24,981 |
| | 85,781 |
| | 156,097 |
|
| | | $ | 352,968 |
| | $ | 408,158 |
| | $ | 667,489 |
| | $ | 2,583,229 |
| | $ | 4,011,844 |
|
|
| | | | | | | | | | | | | | | | | | | | | | | | | | | | | | | |
| | June 30, 2020 |
| | Amortized Cost By Origination Year | | Revolving Loans | | |
| | 2020 | | 2019 | | 2018 | | 2017 | | 2016 | | Prior | | | Total |
| Multi-Family | | | | | | | | | | | | | | | |
| Pass | $ | 42,877 |
| | $ | 316,733 |
| | $ | 190,227 |
| | $ | 210,681 |
| | $ | 347,973 |
| | $ | 633,791 |
| | $ | 39,607 |
| | $ | 1,781,889 |
|
| Special mention | — |
| | 8,149 |
| | 15,767 |
| | 19,512 |
| | 6,209 |
| | 7,587 |
| | — |
| | 57,224 |
|
| Substandard | — |
| | — |
| | — |
| | 2,845 |
| | 9,801 |
| | 41,994 |
| | — |
| | 54,640 |
|
| Total Multi-Family | $ | 42,877 |
| | $ | 324,882 |
| | $ | 205,994 |
| | $ | 233,038 |
| | $ | 363,983 |
| | $ | 683,372 |
| | $ | 39,607 |
| | $ | 1,893,753 |
|
| | | | | | | | | | | | | | | | |
| Non-owner occupied commercial real estate | | | | | | | | | | | | | | | |
| Pass | $ | 238,451 |
| | $ | 1,202,138 |
| | $ | 736,973 |
| | $ | 509,446 |
| | $ | 590,992 |
| | $ | 814,514 |
| | $ | 107,772 |
| | $ | 4,200,286 |
|
| Special mention | — |
| | 46,971 |
| | 96,563 |
| | 47,930 |
| | 166,139 |
| | 112,887 |
| | — |
| | 470,490 |
|
| Substandard | 4,568 |
| | 32,746 |
| | 5,029 |
| | 437 |
| | 100,748 |
| | 126,227 |
| | — |
| | 269,755 |
|
| Total non-owner occupied commercial real estate | $ | 243,019 |
| | $ | 1,281,855 |
| | $ | 838,565 |
| | $ | 557,813 |
| | $ | 857,879 |
| | $ | 1,053,628 |
| | $ | 107,772 |
| | $ | 4,940,531 |
|
| | | | | | | | | | | | | | | | |
| Construction and Land | | | | | | | | | | | | | | | |
| Pass | $ | 7,208 |
| | $ | 125,429 |
| | $ | 13,619 |
| | $ | 50,020 |
| | $ | 27,336 |
| | $ | 917 |
| | $ | 243 |
| | $ | 224,772 |
|
| Special mention | — |
| | 1,393 |
| | 2,965 |
| | 8,604 |
| | 4,284 |
| | — |
| | — |
| | 17,246 |
|
| Substandard | — |
| | — |
| | 888 |
| | — |
| | 3,357 |
| | 346 |
| | — |
| | 4,591 |
|
| Total Construction and Land | $ | 7,208 |
| | $ | 126,822 |
| | $ | 17,472 |
| | $ | 58,624 |
| | $ | 34,977 |
| | $ | 1,263 |
| | $ | 243 |
| | $ | 246,609 |
|
| | | | | | | | | | | | | | | | |
| Owner occupied commercial real estate | | | | | | | | | | | | | | | |
| Pass | $ | 128,795 |
| | $ | 303,522 |
| | $ | 276,367 |
| | $ | 267,267 |
| | $ | 311,485 |
| | $ | 466,194 |
| | $ | 39,586 |
| | $ | 1,793,216 |
|
| Special mention | 2,635 |
| | 26,410 |
| | 15,528 |
| | 57,102 |
| | 41,321 |
| | 34,201 |
| | 2,108 |
| | 179,305 |
|
| Substandard | — |
| | 8,691 |
| | 17,520 |
| | 12,203 |
| | 2,863 |
| | 18,327 |
| | 9,221 |
| | 68,825 |
|
| Total owner occupied commercial real estate | $ | 131,430 |
| | $ | 338,623 |
| | $ | 309,415 |
| | $ | 336,572 |
| | $ | 355,669 |
| | $ | 518,722 |
| | $ | 50,915 |
| | $ | 2,041,346 |
|
| | | | | | | | | | | | | | | | |
| Commercial and industrial | | | | | | | | | | | | | | | |
| Pass | $ | 356,049 |
| | $ | 940,865 |
| | $ | 344,774 |
| | $ | 295,769 |
| | $ | 204,049 |
| | $ | 64,485 |
| | $ | 1,989,034 |
| | $ | 4,195,025 |
|
| Special mention | 611 |
| | 81,305 |
| | 33,987 |
| | 2,252 |
| | 28,507 |
| | 6,818 |
| | 89,918 |
| | 243,398 |
|
| Substandard | 600 |
| | 46,973 |
| | 43,472 |
| | 33,272 |
| | 18,949 |
| | 53,470 |
| | 56,167 |
| | 252,903 |
|
| Total commercial and industrial | $ | 357,260 |
| | $ | 1,069,143 |
| | $ | 422,233 |
| | $ | 331,293 |
| | $ | 251,505 |
| | $ | 124,773 |
| | $ | 2,135,119 |
| | $ | 4,691,326 |
|
| | | | | | | | | | | | | | | | |
| PPP | | | | | | | | | | | | | | | |
| Pass | $ | 827,359 |
| | $ | — |
| | $ | — |
| | $ | — |
| | $ | — |
| | $ | — |
| | $ | — |
| | $ | 827,359 |
|
| PPP | $ | 827,359 |
| | $ | — |
| | $ | — |
| | $ | — |
| | $ | — |
| | $ | — |
| | $ | — |
| | $ | 827,359 |
|
| | | | | | | | | | | | | | | | |
| Pinnacle | | | | | | | | | | | | | | | |
| Pass | $ | 125,882 |
| | $ | 134,838 |
| | $ | 92,537 |
| | $ | 232,269 |
| | $ | 227,317 |
| | $ | 429,663 |
| | $ | — |
| | $ | 1,242,506 |
|
| Total Pinnacle | $ | 125,882 |
| | $ | 134,838 |
| | $ | 92,537 |
| | $ | 232,269 |
| | $ | 227,317 |
| | $ | 429,663 |
| | $ | — |
| | $ | 1,242,506 |
|
| | | | | | | | | | | | | | | | |
| Bridge - Franchise Finance | | | | | | | | | | | | | | | |
| Pass | $ | 42,004 |
| | $ | 97,036 |
| | $ | 27,760 |
| | $ | 12,666 |
| | $ | 14,456 |
| | $ | 12,357 |
| | $ | — |
| | $ | 206,279 |
|
| Special mention | 42,611 |
| | 154,808 |
| | 73,602 |
| | 37,731 |
| | 11,255 |
| | 7,368 |
| | — |
| | 327,375 |
|
| Substandard | 549 |
| | 15,494 |
| | 45,185 |
| | 5,173 |
| | 17,778 |
| | 4,357 |
| | — |
| | 88,536 |
|
| Doubtful | — |
| | — |
| | — |
| | — |
| | 949 |
| | — |
| | — |
| | 949 |
|
| Total Bridge - Franchise Finance | $ | 85,164 |
| | $ | 267,338 |
| | $ | 146,547 |
| | $ | 55,570 |
| | $ | 44,438 |
| | $ | 24,082 |
| | $ | — |
| | $ | 623,139 |
|
| | | | | | | | | | | | | | | | |
| Bridge - Equipment Finance | | | | | | | | | | | | | | | |
| Pass | $ | 24,349 |
| | $ | 193,227 |
| | $ | 103,434 |
| | $ | 94,667 |
| | $ | 54,544 |
| | $ | 67,486 |
| | $ | — |
| | $ | 537,707 |
|
| Special mention | — |
| | 6,634 |
| | 9,510 |
| | 27,050 |
| | — |
| | — |
| | — |
| | 43,194 |
|
| Substandard | — |
| | 3,608 |
| | 4,128 |
| | — |
| | 1,005 |
| | 143 |
| | — |
| | 8,884 |
|
| Total Bridge - Equipment Finance | $ | 24,349 |
| | $ | 203,469 |
| | $ | 117,072 |
| | $ | 121,717 |
| | $ | 55,549 |
| | $ | 67,629 |
| | $ | — |
| | $ | 589,785 |
|
| | | | | | | | | | | | | | | | |
| Mortgage Warehouse Lending | | | | | | | | | | | | | | | |
| Pass | $ | — |
| | $ | — |
| | $ | — |
| | $ | — |
| | $ | — |
| | $ | — |
| | $ | 1,160,728 |
| | $ | 1,160,728 |
|
| Total Mortgage Warehouse Lending | $ | — |
| | $ | — |
| | $ | — |
| | $ | — |
| | $ | — |
| | $ | — |
| | $ | 1,160,728 |
| | $ | 1,160,728 |
|
|
| | | | | | | | | | | | | | | | | | | | |
| | | December 31, 2016 |
| | | FICO |
| LTV | | 720 or less | | 721 - 740 | | 741 - 760 | | 761 or greater | | Total |
| 60% or less | | $ | 87,035 |
| | $ | 113,401 |
| | $ | 163,668 |
| | $ | 751,291 |
| | $ | 1,115,395 |
|
| 60% - 70% | | 80,694 |
| | 94,592 |
| | 124,180 |
| | 523,970 |
| | 823,436 |
|
| 70% - 80% | | 110,509 |
| | 148,211 |
| | 276,425 |
| | 907,450 |
| | 1,442,595 |
|
| More than 80% | | 22,115 |
| | 9,058 |
| | 15,470 |
| | 42,280 |
| | 88,923 |
|
| | | $ | 300,353 |
| | $ | 365,262 |
| | $ | 579,743 |
| | $ | 2,224,991 |
| | $ | 3,470,349 |
|
BANKUNITED, INC. AND SUBSIDIARIES
NOTES TO CONSOLIDATED FINANCIAL STATEMENTS - UNAUDITED
SeptemberJune 30, 20172020
CommercialAt June 30, 2020, the balance of revolving loans converted to term loans was immaterial.
The following tables summarize the Company's commercial credit exposure based on internal risk rating: rating, in aggregate, at the dates indicated (in thousands):
| | | | September 30, 2017 | | | | | | | | | | | | | | | | | | | | | | | |
| | | | | | | | | | Commercial and Industrial | | | | | June 30, 2020 |
| | Multi-Family | | Non-Owner Occupied Commercial Real Estate | | Construction
and Land | | Owner Occupied Commercial Real Estate | | Taxi Medallion Loans | | Other Commercial and Industrial | | Commercial Lending Subsidiaries | | Total | Multi-Family | | Non-Owner Occupied Commercial Real Estate | | Construction
and Land | | Owner Occupied Commercial Real Estate | | Commercial and Industrial | | PPP | | Pinnacle | | Bridge - Franchise Finance | | Bridge - Equipment Finance | | Mortgage Warehouse Lending | | Total |
| Pass | $ | 3,299,753 |
| | $ | 4,069,749 |
| | $ | 265,921 |
| | $ | 1,890,785 |
| | $ | — |
| | $ | 3,666,227 |
| | $ | 2,313,152 |
| | $ | 15,505,587 |
| $ | 1,781,889 |
| | $ | 4,200,286 |
| | $ | 224,772 |
| | $ | 1,793,216 |
| | $ | 4,195,025 |
| | $ | 827,359 |
| | $ | 1,242,506 |
| | $ | 206,279 |
| | $ | 537,707 |
| | $ | 1,160,728 |
| | $ | 16,169,767 |
|
| Special mention | 32,255 |
| | 12,824 |
| | — |
| | 31,495 |
| | — |
| | 38,389 |
| | 35,936 |
| | 150,899 |
| 57,224 |
| | 470,490 |
| | 17,246 |
| | 179,305 |
| | 243,398 |
| | — |
| | — |
| | 327,375 |
| | 43,194 |
| | — |
| | 1,338,232 |
|
| Substandard | 30,253 |
| | 90,996 |
| | 5,535 |
| | 31,460 |
| | 120,572 |
| | 64,087 |
| | 33,637 |
| | 376,540 |
| |
Substandard(1) | | 54,640 |
| | 269,755 |
| | 4,591 |
| | 68,825 |
| | 252,903 |
| | — |
| | — |
| | 88,536 |
| | 8,884 |
| | — |
| | 748,134 |
|
| Doubtful | — |
| | — |
| | — |
| | 3,009 |
| | — |
| | 2,807 |
| | — |
| | 5,816 |
| — |
| | — |
| | — |
| | — |
| | — |
| | — |
| | — |
| | 949 |
| | — |
| | — |
| | 949 |
|
| | $ | 3,362,261 |
| | $ | 4,173,569 |
| | $ | 271,456 |
| | $ | 1,956,749 |
| | $ | 120,572 |
| | $ | 3,771,510 |
| | $ | 2,382,725 |
| | $ | 16,038,842 |
| $ | 1,893,753 |
| | $ | 4,940,531 |
| | $ | 246,609 |
| | $ | 2,041,346 |
| | $ | 4,691,326 |
| | $ | 827,359 |
| | $ | 1,242,506 |
| | $ | 623,139 |
| | $ | 589,785 |
| | $ | 1,160,728 |
| | $ | 18,257,082 |
|
|
| | | | | | | | | | | | | | | | | | | | | | | | | | | | | | | |
| | December 31, 2016 |
| | | | | | | | | | Commercial and Industrial | | | | |
| | Multi-Family | | Non-Owner Occupied Commercial Real Estate | | Construction and Land | | Owner Occupied Commercial Real Estate | | Taxi Medallion Loans | | Other Commercial and Industrial | | Commercial Lending Subsidiaries | | Total |
| Pass | $ | 3,811,822 |
| | $ | 3,694,931 |
| | $ | 309,675 |
| | $ | 1,672,199 |
| | $ | 40,460 |
| | $ | 3,112,590 |
| | $ | 2,255,444 |
| | $ | 14,897,121 |
|
| Special mention | 12,000 |
| | 7,942 |
| | — |
| | 33,274 |
| | — |
| | 19,009 |
| | — |
| | 72,225 |
|
| Substandard | 5,852 |
| | 28,935 |
| | 1,238 |
| | 30,377 |
| | 138,035 |
| | 68,704 |
| | 31,572 |
| | 304,713 |
|
| Doubtful | — |
| | — |
| | — |
| | — |
| | 178 |
| | 8,162 |
| | 3,178 |
| | 11,518 |
|
| | $ | 3,829,674 |
| | $ | 3,731,808 |
|
| $ | 310,913 |
| | $ | 1,735,850 |
|
| $ | 178,673 |
|
| $ | 3,208,465 |
| | $ | 2,290,194 |
|
| $ | 15,285,577 |
|
| |
| (1) | Includes $561 million of substandard accruing loans at June 30, 2020. |
|
| | | | | | | | | | | | | | | | | | | | | | | | | | | | | | | | | | | | | | | |
| | December 31, 2019 |
| | Multi-Family | | Non-Owner Occupied Commercial Real Estate | | Construction
and Land | | Owner Occupied Commercial Real Estate | | Commercial and Industrial | | Pinnacle | | Bridge - Franchise Finance | | Bridge - Equipment Finance | | Mortgage Warehouse Lending | | Total |
| Pass | $ | 2,184,771 |
| | $ | 4,932,279 |
| | $ | 240,734 |
| | $ | 1,991,556 |
| | $ | 4,508,563 |
| | $ | 1,202,430 |
| | $ | 562,042 |
| | $ | 663,855 |
| | $ | 768,472 |
| | $ | 17,054,702 |
|
| Special mention | — |
| | 5,831 |
| | — |
| | 27,870 |
| | 28,498 |
| | — |
| | 10,682 |
| | — |
| | — |
| | 72,881 |
|
Substandard (1) | 32,934 |
| | 92,794 |
| | 3,191 |
| | 43,382 |
| | 118,288 |
| | — |
| | 54,758 |
| | 20,939 |
| | — |
| | 366,286 |
|
| | $ | 2,217,705 |
| | $ | 5,030,904 |
| | $ | 243,925 |
| | $ | 2,062,808 |
| | $ | 4,655,349 |
| | $ | 1,202,430 |
| | $ | 627,482 |
| | $ | 684,794 |
| | $ | 768,472 |
| | $ | 17,493,869 |
|
| |
| (1) | Includes $180 million of substandard accruing loans at December 31, 2019. |
BANKUNITED, INC. AND SUBSIDIARIES
NOTES TO CONSOLIDATED FINANCIAL STATEMENTS - UNAUDITED
SeptemberJune 30, 20172020
Aging of loans: Past Due and Non-Accrual Loans:
The following table presents an aging of loans at the dates indicated. Amounts include premiums, discounts and deferred fees and costsindicated (in thousands):
|
| | | | | | | | | | | | | | | | | | | | | | | | | | | | | | | | | | | | | | | |
| | June 30, 2020 | | December 31, 2019 |
| | Current | | 30 - 59 Days Past Due | | 60 - 89 Days Past Due | | 90 Days or More Past Due | | Total | | Current | | 30 - 59 Days Past Due | | 60 - 89 Days Past Due | | 90 Days or More Past Due | | Total |
| 1-4 single family residential | $ | 4,679,984 |
| | $ | 49,275 |
| | $ | 2,833 |
| | $ | 11,774 |
| | $ | 4,743,866 |
| | $ | 4,887,618 |
| | $ | 45,634 |
| | $ | 9,578 |
| | $ | 11,106 |
| | $ | 4,953,936 |
|
| Government insured residential | 51,276 |
| | 53,017 |
| | 52,620 |
| | 669,325 |
| | 826,238 |
| | 93,560 |
| | 45,347 |
| | 30,426 |
| | 529,311 |
| | 698,644 |
|
| Home equity loans and lines of credit | 1,478 |
| | 69 |
| | — |
| | — |
| | 1,547 |
| | 1,320 |
| | — |
| | — |
| | — |
| | 1,320 |
|
| Other consumer loans | 6,156 |
| | — |
| | — |
| | — |
| | 6,156 |
| | 7,219 |
| | — |
| | — |
| | — |
| | 7,219 |
|
| Multi-family | 1,858,695 |
| | 29,047 |
| | 6,011 |
| | — |
| | 1,893,753 |
| | 2,217,705 |
| | — |
| | — |
| | — |
| | 2,217,705 |
|
| Non-owner occupied commercial real estate | 4,859,344 |
| | 52,937 |
| | 7,979 |
| | 20,271 |
| | 4,940,531 |
| | 5,015,458 |
| | — |
| | 928 |
| | 14,518 |
| | 5,030,904 |
|
| Construction and land | 246,263 |
| | — |
| | — |
| | 346 |
| | 246,609 |
| | 240,647 |
| | 2,396 |
| | — |
| | 882 |
| | 243,925 |
|
| Owner occupied commercial real estate | 2,020,077 |
| | 1,081 |
| | 3,376 |
| | 16,812 |
| | 2,041,346 |
| | 2,041,352 |
| | 1,336 |
| | 4,420 |
| | 15,700 |
| | 2,062,808 |
|
| Commercial and industrial | 4,593,422 |
| | 20,855 |
| | 22,601 |
| | 54,448 |
| | 4,691,326 |
| | 4,595,847 |
| | 2,313 |
| | 4,301 |
| | 52,888 |
| | 4,655,349 |
|
| PPP | 827,359 |
| | — |
| | — |
| | — |
| | 827,359 |
| | — |
| | — |
| | — |
| | — |
| | — |
|
| Pinnacle | 1,242,506 |
| | — |
| | — |
| | — |
| | 1,242,506 |
| | 1,202,430 |
| | — |
| | — |
| | — |
| | 1,202,430 |
|
| Bridge - franchise finance | 596,136 |
| | — |
| | 625 |
| | 26,378 |
| | 623,139 |
| | 610,315 |
| | 3,840 |
| | 2,501 |
| | 10,826 |
| | 627,482 |
|
| Bridge - equipment finance | 589,785 |
| | — |
| | — |
| | — |
| | 589,785 |
| | 677,089 |
| | 7,705 |
| | — |
| | — |
| | 684,794 |
|
| Mortgage warehouse lending | 1,160,728 |
| | — |
| | — |
| | — |
| | 1,160,728 |
| | 768,472 |
| | — |
| | — |
| | — |
| | 768,472 |
|
| | $ | 22,733,209 |
| | $ | 206,281 |
| | $ | 96,045 |
| | $ | 799,354 |
| | $ | 23,834,889 |
| | $ | 22,359,032 |
| | $ | 108,571 |
| | $ | 52,154 |
| | $ | 635,231 |
| | $ | 23,154,988 |
|
|
| | | | | | | | | | | | | | | | | | | | | | | | | | | | | | | | | | | | | | | |
| | September 30, 2017 | | December 31, 2016 |
| | Current | | 30 - 59 Days Past Due | | 60 - 89 Days Past Due | | 90 Days or More Past Due | | Total | | Current | | 30 - 59 Days Past Due | | 60 - 89 Days Past Due | | 90 Days or More Past Due | | Total |
| Non-covered loans: | |
| | |
| | |
| | |
| | |
| | |
| | |
| | |
| | |
| | |
|
| 1-4 single family residential | $ | 3,994,758 |
| | $ | 13,964 |
| | $ | 444 |
| | $ | 2,678 |
| | $ | 4,011,844 |
| | $ | 3,457,606 |
| | $ | 10,355 |
| | $ | 325 |
| | $ | 2,063 |
| | $ | 3,470,349 |
|
| Home equity loans and lines of credit | 1,623 |
| | 21 |
| | — |
| | — |
| | 1,644 |
| | 1,120 |
| | — |
| | — |
| | — |
| | 1,120 |
|
| Other consumer loans | 19,623 |
| | 500 |
| | — |
| | 1 |
| | 20,124 |
| | 24,306 |
| | — |
| | — |
| | — |
| | 24,306 |
|
| Multi-family | 3,362,261 |
| | — |
| | — |
| | — |
| | 3,362,261 |
| | 3,829,674 |
| | — |
| | — |
| | — |
| | 3,829,674 |
|
| Non-owner occupied commercial real estate | 4,171,880 |
| | — |
| | — |
| | 1,689 |
| | 4,173,569 |
| | 3,730,470 |
| | 754 |
| | — |
| | 584 |
| | 3,731,808 |
|
| Construction and land | 270,218 |
| | — |
| | — |
| | 1,238 |
| | 271,456 |
| | 309,675 |
| | — |
| | — |
| | 1,238 |
| | 310,913 |
|
| Owner occupied commercial real estate | 1,947,728 |
| | 1,261 |
| | 266 |
| | 7,494 |
| | 1,956,749 |
| | 1,726,826 |
| | 1,557 |
| | 797 |
| | 6,670 |
| | 1,735,850 |
|
| Commercial and industrial | | | | | | | | | | | | | | | | | | | |
| Taxi medallion loans | 107,325 |
| | — |
| | 2,803 |
| | 10,444 |
| | 120,572 |
| | 137,856 |
| | 7,037 |
| | 4,563 |
| | 29,217 |
| | 178,673 |
|
| Other commercial and industrial | 3,769,065 |
| | 1,629 |
| | 58 |
| | 758 |
| | 3,771,510 |
| | 3,198,008 |
| | 2,515 |
| | 954 |
| | 6,988 |
| | 3,208,465 |
|
| Commercial lending subsidiaries | 2,382,725 |
| | — |
| | — |
| | — |
| | 2,382,725 |
| | 2,284,435 |
| | 12 |
| | 3,247 |
| | 2,500 |
| | 2,290,194 |
|
| | $ | 20,027,206 |
| | $ | 17,375 |
| | $ | 3,571 |
| | $ | 24,302 |
| | $ | 20,072,454 |
| | $ | 18,699,976 |
| | $ | 22,230 |
| | $ | 9,886 |
| | $ | 49,260 |
| | $ | 18,781,352 |
|
| Covered loans: | | | | | | | | | | | | | | | | | | | |
| Non-ACI loans: | | | | | | | | | | | |
| | |
| | |
| | |
| | |
|
| 1-4 single family residential | $ | 23,002 |
| | $ | 691 |
| | $ | — |
| | $ | 934 |
| | $ | 24,627 |
| | $ | 29,406 |
| | $ | 481 |
| | $ | — |
| | $ | 918 |
| | $ | 30,805 |
|
| Home equity loans and lines of credit | 33,263 |
| | 1,114 |
| | 663 |
| | 2,369 |
| | 37,409 |
| | 43,129 |
| | 1,255 |
| | 534 |
| | 2,077 |
| | 46,995 |
|
| | $ | 56,265 |
| | $ | 1,805 |
| | $ | 663 |
| | $ | 3,303 |
| | $ | 62,036 |
| | $ | 72,535 |
| | $ | 1,736 |
| | $ | 534 |
| | $ | 2,995 |
| | $ | 77,800 |
|
| ACI loans: | | | | | | | | | | | | | | | | | | | |
| 1-4 single family residential | $ | 436,051 |
| | $ | 14,126 |
| | $ | 2,549 |
| | $ | 17,574 |
| | $ | 470,300 |
| | $ | 500,272 |
| | $ | 13,524 |
| | $ | 2,990 |
| | $ | 15,562 |
| | $ | 532,348 |
|
| Home equity loans and lines of credit | 4,876 |
| | 89 |
| | 40 |
| | 635 |
| | 5,640 |
| | 3,460 |
| | 148 |
| | 23 |
| | 263 |
| | 3,894 |
|
| | $ | 440,927 |
| | $ | 14,215 |
| | $ | 2,589 |
| | $ | 18,209 |
| | $ | 475,940 |
| | $ | 503,732 |
| | $ | 13,672 |
| | $ | 3,013 |
| | $ | 15,825 |
| | $ | 536,242 |
|
1-4 single family residential and home equity ACI loans that areLoans contractually delinquent by more than 90 days or more and accounted for in pools that are on accrual status because discount continues to be accretedstill accruing totaled $18$673 million, and $16 million at September 30, 2017 and December 31, 2016, respectively.
Foreclosure of residential real estate
The carrying amount of foreclosed residential real estate properties included in "Other assets" in the accompanying consolidated balance sheets, all of which were covered, totaled $4 million and $5 million at September 30, 2017 and December 31, 2016, respectively. The recorded investment in residential mortgage loans in the process of foreclosure totaled $13 million and $8 million at September 30, 2017 and December 31, 2016, respectively, substantially all of which were covered loans.government insured residential loans at June 30, 2020 and $531 million, of which $529 million were government insured residential loans at December 31, 2019. Substantially all of these loans are government insured pool buyout loans, which the Company buys out of GNMA securitizations upon default.
The following table presents information about loans on non-accrual status at the dates indicated (in thousands):
27 |
| | | | | | | | | | | |
| | June 30, 2020 | | December 31, 2019 |
| | Amortized Cost | | Amortized Cost With No Related Allowance | | Amortized Cost |
| Residential and other consumer | $ | 13,183 |
| | $ | 2,622 |
| | $ | 18,894 |
|
| Commercial: | | | | | |
| Multi-family | 6,011 |
| | 6,011 |
| | 6,138 |
|
| Non-owner occupied commercial real estate | 46,545 |
| | 28,598 |
| | 40,097 |
|
| Construction and land | 3,703 |
| | 3,357 |
| | 3,191 |
|
| Owner occupied commercial real estate | 30,493 |
| | 8,765 |
| | 27,141 |
|
| Commercial and industrial | 67,702 |
| | 7,386 |
| | 74,757 |
|
| Bridge - franchise finance | 32,857 |
| | 1,848 |
| | 13,631 |
|
| Bridge - equipment finance | 1,148 |
| | 537 |
| | 20,939 |
|
| | $ | 201,642 |
| | $ | 59,124 |
| | $ | 204,788 |
|
BANKUNITED, INC. AND SUBSIDIARIES
NOTES TO CONSOLIDATED FINANCIAL STATEMENTS - UNAUDITED
SeptemberJune 30, 20172020
Included in the table above is the guaranteed portion of non-accrual SBA loans totaling $45.7 million at both June 30, 2020 and December 31, 2019, respectively. The amount of additional interest income that would have been recognized on non-accrual loans had they performed in accordance with their contractual terms was approximately $3.0 million and $5.7 million for the three and six months ended June 30, 2020, respectively and $2.5 million and $4.3 million for the three and six months ended June 30, 2019, respectively.
Collateral dependent loans:
The following table presents the amortized cost basis of collateral dependent loans at June 30, 2020 (in thousands):
|
| | | | | | | |
| | Amortized Cost | | Extent to Which Secured by Collateral |
| Residential and other consumer | $ | 3,283 |
| | $ | 3,273 |
|
| Commercial: | | | |
| Multi-family | 6,011 |
| | 6,011 |
|
| Non-owner occupied commercial real estate | 30,980 |
| | 30,980 |
|
| Construction and land | 3,703 |
| | 3,703 |
|
| Owner occupied commercial real estate | 21,025 |
| | 21,025 |
|
| Commercial and industrial | 54,232 |
| | 29,468 |
|
| Bridge - franchise finance | 24,353 |
| | 21,178 |
|
| Bridge - equipment finance | 1,148 |
| | 1,078 |
|
| Total commercial | 141,452 |
| | 113,443 |
|
| | $ | 144,735 |
| | $ | 116,716 |
|
Collateral for the multi-family, non-owner occupied commercial real estate, and owner-occupied commercial real estate loan classes generally consists of commercial real estate. Collateral for construction and land loans is typically residential or commercial real estate. Collateral for commercial and industrial loans generally consists of equipment, accounts receivable, inventory and other business assets; owner-occupied commercial real estate loans may also be collateralized by these types of assets. Bridge franchise finance loans may be collateralized by franchise value or by equipment. Bridge equipment finance loans are secured by the financed equipment. Residential loans are collateralized by residential real estate. There have been no significant changes to the extent to which collateral secures collateral dependent loans during the six months ended June 30, 2020.
Foreclosure of residential real estate
The recorded investment in residential loans in the process of foreclosure was $323 million, of which $315 million was government insured, at June 30, 2020 and $257 million, of which $248 million was government insured, at December 31, 2019. The carrying amount of foreclosed residential real estate included in "Other assets" in the accompanying consolidated balance sheet was insignificant at June 30, 2020 and $6 million at December 31, 2019. In response to the COVID-19 pandemic, new foreclosure actions on residential loans have been temporarily suspended.
BANKUNITED, INC. AND SUBSIDIARIES
NOTES TO CONSOLIDATED FINANCIAL STATEMENTS - UNAUDITED
June 30, 2020
Troubled debt restructurings
The following table summarizes loans that were modified in TDRs during the periods indicated, as well as loans modified during the twelve months preceding SeptemberJune 30, 20172020 and 2016,2019 that experienced payment defaults during the periods indicated (dollars in thousands):
|
| | | | | | | | | | | | | | | | | | | | | | | | | | | |
| | Three Months Ended September 30, |
| | 2017 | | 2016 |
| | Loans Modified in TDRs
During the Period | | TDRs Experiencing Payment
Defaults During the Period | | Loans Modified in TDRs
During the Period | | TDRs Experiencing Payment
Defaults During the Period |
| | Number of
TDRs | | Recorded
Investment | | Number of
TDRs | | Recorded
Investment | | Number of
TDRs | | Recorded
Investment | | Number of
TDRs | | Recorded
Investment |
| Non-covered loans: | |
| | |
| | |
| | |
| | |
| | |
| | |
| | |
|
| 1-4 single family residential | — |
| | $ | — |
| | 2 |
| | $ | 269 |
| | — |
| | $ | — |
| | — |
| | $ | — |
|
| Owner occupied commercial real estate | — |
| | — |
| | — |
| | — |
| | 1 |
| | 491 |
| | — |
| | — |
|
| Commercial and industrial | | | | | | | | | | | | | | | |
| Taxi medallion loans | 15 |
| | 5,439 |
| | 6 |
| | 2,105 |
| | 18 |
| | 29,854 |
| | 8 |
| | 4,104 |
|
| Other commercial and industrial | 1 |
| | 978 |
| | — |
| | — |
| | 2 |
| | 1,646 |
| | — |
| |
|
|
| Commercial lending subsidiaries | — |
| | — |
| | — |
| | — |
| | 5 |
| | 4,433 |
| | 1 |
| | 3,500 |
|
| | 16 |
| | $ | 6,417 |
| | 8 |
| | $ | 2,374 |
| | 26 |
| | $ | 36,424 |
| | 9 |
| | $ | 7,604 |
|
| Covered loans: | | | | | | | | | | | | | | | |
| Non-ACI loans: | | | | | | | | | |
| | |
| | |
| | |
|
| Home equity loans and lines of credit | — |
| | $ | — |
| | 1 |
| | $ | 70 |
| | 10 |
| | $ | 1,671 |
| | — |
| | $ | — |
|
| ACI loans: | | | | | | | | | | | | | | | |
| Owner occupied commercial real estate | — |
| | $ | — |
| | — |
| | $ | — |
| | 1 |
| | $ | 839 |
| | — |
| | $ | — |
|
|
| | | | | | | | | | | | | | | | | | | | | | | | | | | |
| | Three Months Ended June 30, |
| | 2020 | | 2019 |
| | Loans Modified in TDRs
During the Period | | TDRs Experiencing Payment Defaults During the Period | | Loans Modified in TDRs
During the Period | | TDRs Experiencing Payment
Defaults During the Period |
| | Number of
TDRs | | Amortized Cost | | Number of
TDRs | | Amortized Cost | | Number of
TDRs | | Amortized Cost | | Number of
TDRs | | Amortized Cost |
| Government insured residential | 52 |
| | $ | 7,291 |
| | 121 |
| | $ | 19,512 |
| | 34 |
| | $ | 5,164 |
| | 31 |
| | $ | 4,355 |
|
| Non-owner occupied commercial real estate | — |
| | — |
| | 1 |
| | 4,249 |
| | 1 |
| | 12,085 |
| | 1 |
| | 2,772 |
|
| Owner occupied commercial real estate | — |
| | — |
| | — |
| | — |
| | — |
| | — |
| | 3 |
| | 1,878 |
|
| Commercial and industrial | 2 |
| | 1,348 |
| | — |
| | — |
| | 4 |
| | 7,354 |
| | 1 |
| | 1,233 |
|
| Bridge - franchise finance | 1 |
| | 919 |
| | 5 |
| | 18,718 |
| | 1 |
| | 2,073 |
| | — |
| | — |
|
| | 55 |
| | $ | 9,558 |
| | 127 |
| | $ | 42,479 |
| | 40 |
| | $ | 26,676 |
| | 36 |
| | $ | 10,238 |
|
|
| | | | | | | | | | | | | | | | | | | | | | | | | | | |
| | Six Months Ended June 30, |
| | 2020 | | 2019 |
| | Loans Modified in TDRs
During the Period | | TDRs Experiencing Payment
Defaults During the Period | | Loans Modified in TDRs
During the Period | | TDRs Experiencing Payment
Defaults During the Period |
| | Number of
TDRs | | Amortized Cost | | Number of
TDRs | | Amortized Cost | | Number of
TDRs | | Amortized Cost | | Number of
TDRs | | Amortized Cost |
| 1-4 single family residential | 1 |
| | $ | 203 |
| | — |
| | $ | — |
| | 2 |
| | $ | 563 |
| | — |
| | $ | — |
|
| Government insured residential | 86 |
| | 12,183 |
| | 150 |
| | 23,994 |
| | 46 |
| | 6,782 |
| | 32 |
| | 4,517 |
|
| Non-owner occupied commercial real estate | 1 |
| | 4,249 |
| | 1 |
| | 4,249 |
| | 1 |
| | 12,085 |
| | 1 |
| | 2,772 |
|
| Owner occupied commercial real estate | — |
| | — |
| | — |
| | — |
| | 1 |
| | 849 |
| | 3 |
| | 1,878 |
|
| Commercial and industrial | 2 |
| | 1,348 |
| | 3 |
| | 5,448 |
| | 6 |
| | 17,994 |
| | 1 |
| | 1,233 |
|
| Bridge - franchise finance | 9 |
| | 14,666 |
| | 8 |
| | 23,358 |
| | 3 |
| | 3,238 |
| | — |
| | — |
|
| Bridge - equipment finance | — |
| | — |
| | — |
| | — |
| | 1 |
| | 847 |
| | — |
| | — |
|
| | 99 |
| | $ | 32,649 |
| | 162 |
| | $ | 57,049 |
| | 60 |
| | $ | 42,358 |
| | 37 |
| | $ | 10,400 |
|
|
| | | | | | | | | | | | | | | | | | | | | | | | | | | |
| | Nine Months Ended September 30, |
| | 2017 | | 2016 |
| | Loans Modified in TDRs
During the Period | | TDRs Experiencing Payment
Defaults During the Period | | Loans Modified in TDRs
During the Period | | TDRs Experiencing Payment
Defaults During the Period |
| | Number of
TDRs | | Recorded
Investment | | Number of
TDRs | | Recorded
Investment | | Number of
TDRs | | Recorded
Investment | | Number of
TDRs | | Recorded
Investment |
| Non-covered loans: | |
| | |
| | |
| | |
| | |
| | |
| | |
| | |
|
| 1-4 single family residential | 4 |
| | $ | 351 |
| | 2 |
| | $ | 269 |
| | 1 |
| | $ | 107 |
| | — |
| | $ | — |
|
| Non-owner occupied commercial real estate | 1 |
| | 5,389 |
| | — |
| | — |
| | — |
| | — |
| | — |
| | — |
|
| Owner occupied commercial real estate | 2 |
| | 4,522 |
| | — |
| | — |
| | 3 |
| | 5,225 |
| | — |
| | — |
|
| Commercial and industrial | | | | | | | | | | | | |
|
| |
|
|
| Taxi medallion loans | 97 |
| | 48,692 |
| | 8 |
| | 3,509 |
| | 58 |
| | 57,341 |
| | 8 |
| | 4,104 |
|
| Other commercial and industrial | 14 |
| | 20,860 |
| | — |
| | — |
| | 7 |
| | 21,422 |
| | 1 |
| | 3,500 |
|
| Commercial lending subsidiaries | 1 |
| | 12,810 |
| | — |
| | — |
| | 6 |
| | 7,933 |
| | — |
| | — |
|
| | 119 |
| | $ | 92,624 |
| | 10 |
| | $ | 3,778 |
| | 75 |
| | $ | 92,028 |
| | 9 |
| | $ | 7,604 |
|
| Covered loans: | | | | | | | | | | | | | | | |
| Non-ACI loans: | | | | | | | | | |
| | |
| | |
| | |
|
| Home equity loans and lines of credit | 5 |
| | $ | 939 |
| | 1 |
| | $ | 70 |
| | 16 |
| | $ | 2,293 |
| | — |
| | $ | — |
|
| ACI loans: | | | | | | | | | | | | | | | |
| Owner occupied commercial real estate | — |
| | $ | — |
| | — |
| | $ | — |
| | 1 |
| | $ | 839 |
| | — |
| | $ | — |
|
Modifications during the three and ninesix months ended SeptemberJune 30, 20172020 and 20162019 included interest rate reductions, restructuring of the amount and timing of required periodic payments, extensions of maturity and covenant waivers. Included in TDRs are residential loans to borrowers who have not reaffirmed their debt discharged in Chapter 7 bankruptcy. The total amount of such loans is not material. Modified ACI loans accounted for in pools are
Under recently issued inter-agency and authoritative guidance and consistent with the CARES Act, short-term (generally periods of six months or less) deferrals or modifications related to COVID-19 will typically not considered TDRs, are not separated from the pools and are not classifiedbe categorized as impaired loans.TDRs.
BANKUNITED, INC. AND SUBSIDIARIES
NOTES TO CONSOLIDATED FINANCIAL STATEMENTS - UNAUDITED
September 30, 2017
Note 5 FDIC Indemnification Asset
When the Company recognizes gains or losses related to covered assets in its consolidated financial statements, changes in the estimated amount recoverable from the FDIC under the Loss Sharing Agreements with respect to those gains or losses are also reflected in the consolidated financial statements. Covered loans may be resolved through prepayment, short sale of the underlying collateral, foreclosure, sale of the loans or charge-off. For loans resolved through prepayment, short sale or foreclosure, the difference between consideration received in satisfaction of the loans and the carrying value of the loans is recognized in the consolidated statement of income line item “Income from resolution of covered assets, net.” Losses from the resolution of covered loans increase the amount recoverable from the FDIC under the Loss Sharing Agreements. Gains from the resolution of covered loans reduce the amount recoverable from the FDIC under the Loss Sharing Agreements. Similarly, differences in proceeds received on the sale of covered OREO and covered loans and their carrying amounts result in gains or losses and reduce or increase the amount recoverable from the FDIC under the Loss Sharing Agreements. Increases in valuation allowances or impairment charges related to covered assets also increase the amount estimated to be recoverable from the FDIC. These additions to or reductions in amounts recoverable from the FDIC related to transactions in the covered assets are recorded in the consolidated statement of income line item “Net gain (loss) on FDIC indemnification” and reflected as corresponding increases or decreases in the FDIC indemnification asset.
In addition, through June 30, 2017, recoveries2020
Disclosures Prescribed by Legacy GAAP (Before Adoption of previously indemnified losses on assets that were formerly covered under the Commercial Shared-Loss Agreement resulted in reimbursements due to the FDIC. These transactions are included in the tables below. Amounts payable to the FDIC resulting from these transactions are recognized in other liabilities in the accompanying consolidated balance sheet at December 31, 2016.ASU 2016-13) for Prior Periods
The following tables summarizetable presents information about the componentsbalance of the gainsALLL and losses associated with covered assets, along with the related additions to or reductions in the amounts recoverable from the FDIC under the Loss Sharing Agreements,loans as reflected in the consolidated statements of income for the periods indicatedDecember 31, 2019 (in thousands):
|
| | | | | | | | | | | | | | | | | | | | | | | |
| | Three Months Ended September 30, |
| | 2017 | | 2016 |
| | Transaction
Income (Loss) | | Net Loss on FDIC
Indemnification | | Net Impact
on Pre-tax
Earnings | | Transaction
Income (Loss) | | Net Gain on FDIC
Indemnification | | Net Impact
on Pre-tax
Earnings |
| Recovery of (provision for) losses on covered loans | $ | (261 | ) | | $ | 215 |
| | $ | (46 | ) | | $ | 445 |
| | $ | (368 | ) | | $ | 77 |
|
| Income from resolution of covered assets, net | 6,400 |
| | (5,082 | ) | | 1,318 |
| | 8,883 |
| | (7,106 | ) | | 1,777 |
|
| Loss on sale of covered loans | — |
| | — |
| | — |
| | (10,033 | ) | | 8,026 |
| | (2,007 | ) |
| Loss on covered OREO | (35 | ) | | 29 |
| | (6 | ) | | (552 | ) | | 441 |
| | (111 | ) |
| | $ | 6,104 |
| | $ | (4,838 | ) | | $ | 1,266 |
| | $ | (1,257 | ) | | $ | 993 |
| | $ | (264 | ) |
|
| | | | | | | | | | | |
| | Residential and Other Consumer | | Commercial | | Total |
| Allowance for loan and lease losses: | | | | | |
| Ending balance | $ | 11,154 |
| | $ | 97,517 |
| | $ | 108,671 |
|
| Ending balance: loans individually evaluated for impairment | $ | 9 |
| | $ | 20,481 |
| | $ | 20,490 |
|
| Ending balance: loans collectively evaluated for impairment | $ | 11,145 |
| | $ | 77,036 |
| | $ | 88,181 |
|
| Ending balance: ACI loans | $ | — |
| | $ | — |
| | $ | — |
|
| Loans: | | | | | |
| Ending balance | $ | 5,661,119 |
| | $ | 17,493,869 |
| | $ | 23,154,988 |
|
| Ending balance: loans individually evaluated for impairment | $ | 57,117 |
| | $ | 187,788 |
| | $ | 244,905 |
|
| Ending balance: loans collectively evaluated for impairment | $ | 5,454,422 |
| | $ | 17,288,901 |
| | $ | 22,743,323 |
|
| Ending balance: ACI loans | $ | 149,580 |
| | $ | 17,180 |
| | $ | 166,760 |
|
The table below presents information about loans identified as impaired as of December 31, 2019 (in thousands):
|
| | | | | | | | | | | | | | | | | | | | | | | |
| | Nine Months Ended September 30, |
| | 2017 | | 2016 |
| | Transaction
Income (Loss) | | Net Loss on FDIC
Indemnification | | Net Impact
on Pre-tax
Earnings | | Transaction
Income (Loss) | | Net Loss on FDIC
Indemnification | | Net Impact
on Pre-tax
Earnings |
| Recovery of (provision for) losses on covered loans | $ | (2,693 | ) | | $ | 2,095 |
| | $ | (598 | ) | | $ | 1,119 |
| | $ | (1,007 | ) | | $ | 112 |
|
| Income from resolution of covered assets, net | 22,066 |
| | (17,591 | ) | | 4,475 |
| | 26,426 |
| | (21,140 | ) | | 5,286 |
|
| Loss on sale of covered loans | (1,582 | ) | | 1,266 |
| | (316 | ) | | (14,895 | ) | | 11,958 |
| | (2,937 | ) |
| Loss on covered OREO | (65 | ) | | 56 |
| | (9 | ) | | (957 | ) | | 779 |
| | (178 | ) |
| | $ | 17,726 |
| | $ | (14,174 | ) | | $ | 3,552 |
| | $ | 11,693 |
| | $ | (9,410 | ) | | $ | 2,283 |
|
|
| | | | | | | | | | | |
| | Recorded Investment | | UPB | | Related Specific Allowance |
| With no specific allowance recorded: | |
| | |
| | |
|
| 1-4 single family residential | $ | 992 |
| | $ | 989 |
| | $ | — |
|
| Government insured residential | 53,428 |
| | 53,350 |
| | — |
|
| Multi-family | 6,138 |
| | 6,169 |
| | — |
|
| Non-owner occupied commercial real estate | 38,345 |
| | 38,450 |
| | — |
|
| Construction and land | 3,191 |
| | 3,155 |
| | — |
|
| Owner occupied commercial real estate | 17,419 |
| | 17,488 |
| | — |
|
Commercial and industrial | 10,585 |
| | 10,574 |
| | — |
|
| Bridge - franchise finance | 4,115 |
| | 4,117 |
| | — |
|
| Bridge - equipment finance | 6,807 |
| | 6,793 |
| | — |
|
| With a specific allowance recorded: | | | | | |
| 1-4 single family residential | 2,697 |
| | 2,652 |
| | 9 |
|
| Owner occupied commercial real estate | 2,522 |
| | 2,509 |
| | 401 |
|
| Commercial and industrial | 63,531 |
| | 63,709 |
| | 13,992 |
|
| Bridge - franchise finance | 21,011 |
| | 21,050 |
| | 2,953 |
|
| Bridge - equipment finance | 14,124 |
| | 14,024 |
| | 3,135 |
|
| Total: | | | | | |
| Residential and other consumer | $ | 57,117 |
| | $ | 56,991 |
| | $ | 9 |
|
| Commercial | 187,788 |
| | 188,038 |
| | 20,481 |
|
| | $ | 244,905 |
| | $ | 245,029 |
| | $ | 20,490 |
|
BANKUNITED, INC. AND SUBSIDIARIES
NOTES TO CONSOLIDATED FINANCIAL STATEMENTS - UNAUDITED
SeptemberJune 30, 20172020
ChangesThe following table presents the average recorded investment in the FDIC indemnification asset and in the liability to the FDIC for recoveries related to assets previously covered under the Commercial Shared-Loss Agreementimpaired loans for the nine months ended September 30, 2017 and the year ended December 31, 2016, were as follows (in thousands):
|
| | | |
| Balance at December 31, 2015 | $ | 739,843 |
|
| Amortization | (160,091 | ) |
| Reduction for claims filed | (46,083 | ) |
| Net loss on FDIC indemnification | (17,759 | ) |
| Balance at December 31, 2016 | 515,910 |
|
| Amortization | (135,351 | ) |
| Reduction for claims filed | (16,768 | ) |
| Net loss on FDIC indemnification | (14,174 | ) |
| Balance at September 30, 2017 | $ | 349,617 |
|
The balances at September 30, 2017 and December 31, 2016 are reflected in the consolidated balance sheets as followsperiod indicated (in thousands):
|
| | | | | | | |
| | Three Months Ended June 30, 2019 | | Six Months Ended June 30, 2019 |
| Residential and other consumer: | | | |
|
| 1-4 single family residential | $ | 12,732 |
| | $ | 11,011 |
|
| Commercial: | | | |
| Multi-family | 25,066 |
| | 25,248 |
|
| Non-owner occupied commercial real estate | 24,599 |
| | 21,563 |
|
| Construction and land | 9,604 |
| | 9,730 |
|
| Owner occupied commercial real estate | 12,741 |
| | 12,124 |
|
| Commercial and industrial | 32,690 |
| | 30,564 |
|
| Commercial lending subsidiaries | 18,082 |
| | 19,982 |
|
| | 122,782 |
| | 119,211 |
|
| | $ | 135,514 |
| | $ | 130,222 |
|
|
| | | | | | | |
| | September 30, 2017 | | December 31, 2016 |
| FDIC indemnification asset | $ | 349,617 |
| | $ | 515,933 |
|
| Other liabilities | — |
| | (23 | ) |
| | $ | 349,617 |
| | $ | 515,910 |
|
Note 5 Subordinated Notes
On June 11, 2020, the Company issued $300 million of 5.125% subordinated notes. The notes mature on June 11, 2030 with interest payable semiannually. The notes have an effective interest rate of 5.39% after consideration of issuance discount and costs. The notes may be redeemed by the Company, in whole or in part, on or after March 11, 2030 at a redemption price equal to 100% of the principal amount being redeemed plus accrued and unpaid interest, subject to the approval of the Federal Reserve. The notes qualify as Tier 2 capital for regulatory capital purposes, subject to applicable limitations.
Note 6Income Taxes
The Company’s effective income tax rate was 32.2%21.0% and 31.7%19.3% for the three and six months ended SeptemberJune 30, 2017 and 2016,2020, respectively, and 31.2%25.2% and 33.2%25.9% for the ninethree and six months ended SeptemberJune 30, 2017 and 2016,2019, respectively. The effective income tax raterates differed from the statutory federal income tax rate of 35% in all21% for the 2019 periods due primarily to the effectimpact of state income taxes, partially offset by the benefit of income not subject to tax, offset by state income taxes. In addition,federal tax. These factors were largely offsetting for the 2020 periods, when the effective income tax rate fordid not differ materially from the Federal statutory rate of 21%. During the three and ninesix months ended SeptemberJune 30 2017 reflected the impact2020, income not subject to tax was a larger percentage of $0.3 million and $3.2 million, respectively, in excess tax benefits resulting from activity related to vesting of share-based awards and exercise of stock options.
The Company has investments in affordable housing limited partnerships which generate federal Low Income Housing Tax Credits and other tax benefits. The balance of these investments, included in other assets in the accompanying consolidated balance sheet, was $66 million and $71 million at September 30, 2017 and December 31, 2016, respectively. Unfunded commitments for affordable housing investments, included in other liabilities in the accompanying consolidated balance sheet, were $29 million and $53 million at September 30, 2017 and December 31, 2016, respectively. The maximum exposure to loss as a result of the Company's involvement with these limited partnerships at September 30, 2017 was approximately $73 million. While the Company believes the likelihood of potential losses from these investments is remote, the maximum exposure was determined by assuming a scenario where the projects completely fail and do not meet certain government compliance requirements resulting in recapture of the related tax credits. These investments did not have a material impact on income tax expense for the three and nine months ended September 30, 2017 and 2016.pre-tax income.
Note 7 Derivatives and Hedging Activities
The Company uses interest rate swaps to manage interest rate risk related to liabilities that expose the Company to variability in cash flows due to changes in interest rates. The Company enters into LIBOR-based interest rate swaps that are designated as cash flow hedges with the objective of limiting the variability of interest payment cash flows resulting from changes in the benchmark interest rate LIBOR. ChangesThe Company also enters into LIBOR-based interest rate swaps designated as fair value hedges designed to hedge changes in the fair value of interestoutstanding fixed rate swaps designated as cash flow hedging instruments are reported in AOCI and subsequently reclassified into interest expenseborrowings caused by fluctuations in the same period in which the relatedbenchmark interest on the floating-rate debt obligations affects earnings.
BANKUNITED, INC. AND SUBSIDIARIES
NOTES TO CONSOLIDATED FINANCIAL STATEMENTS - UNAUDITED
September 30, 2017
rate.
The Company also enters into interest rate derivative contracts with certain of its commercial borrowers to enable those borrowers to manage their exposure to interest rate fluctuations. To mitigate interest rate risk associated with these derivative contracts, the Company enters into offsetting derivative contract positions with primary dealers. These interest rate derivative contracts are not designated as hedging instruments; therefore, changes in the fair value of these derivatives are recognized immediately in earnings. TheFor the three and six months ended June 30, 2020 and 2019, the impact on earnings, included in "other non-interest income" in the accompanying consolidated statements of income, related to changes in fair value of these derivatives for the three and nine months ended September 30, 2017 and 2016 was not material.
The Company may be exposed to credit risk in the event of non-performance by the counterparties to its interest rate derivative agreements. The Company assesses the credit risk of its financial institution counterparties by monitoring publicly available credit rating and financial information. The Company manages dealer credit risk by entering into interest rate derivatives only with primary and highly rated counterparties, the use of ISDA master agreements, central clearing mechanisms
BANKUNITED, INC. AND SUBSIDIARIES
NOTES TO CONSOLIDATED FINANCIAL STATEMENTS - UNAUDITED
June 30, 2020
and counterparty limits. The agreements contain bilateral collateral arrangements with the amount of collateral to be posted generally governed by the settlement value of outstanding swaps. The Company manages the risk of default by its commercial borrower counterparties through its normal loan underwriting and credit monitoring policies and procedures. The Company does not currently anticipate any significant losses from failure of interest rate derivative counterparties to honor their obligations.
The CME amended its rules effective January 2017 to legally characterizecharacterizes variation margin payments for centrally cleared derivatives as settlements of the derivatives' exposures rather than collateral. As a result, the variation margin payment and the related derivative instruments are considered a single unit of account for accounting and financial reporting purposes. The Company's clearing agent for interest rate derivative contracts centrally cleared through the CME settles the variation margin daily with the CME; therefore, those interest rate derivative contracts the Company clears through the CME are reported at a fair value of approximately zero0 at Septemberboth June 30, 2017.2020 and December 31, 2019.
The following tables set forth certain information concerning the Company’s interest rate contract derivative financial instruments and related hedged items at the dates indicated (dollars in thousands):
| | | | September 30, 2017 | June 30, 2020 |
| | | Weighted Average Pay Rate | | Weighted Average Receive Rate | | Weighted Average Remaining Life in Years | | | | | | Weighted Average Pay Rate | | Weighted Average Receive Rate | | Weighted Average Remaining Life in Years | | | | |
| | | | Notional Amount | | Balance Sheet Location | | Fair Value | | | Notional Amount | | Balance Sheet Location | | Fair Value |
| | Hedged Item | | Asset | | Liability | Hedged Item | | Asset | | Liability |
| Derivatives designated as cash flow hedges: | | | | | | | | | |
| | | | |
| | |
| | | | | | | | | |
| | | | |
| | |
|
| Pay-fixed interest rate swaps | Variability of interest cash flows on variable rate borrowings | | 1.77% | | 3-Month Libor | | 4.6 | | $ | 2,046,000 |
| | Other assets / Other liabilities | | $ | 1,066 |
| | $ | (259 | ) | Variability of interest cash flows on variable rate borrowings | | 2.40% | | 3-Month LIBOR | | 2.8 | | $ | 3,021,000 |
| | Other liabilities | | $ | — |
| | $ | (7,156 | ) |
| Derivatives designated as fair value hedges: | | | | | | | |
| Receive-fixed interest rate swaps | | Variability of fair value of fixed rate borrowings | | 3-Month LIBOR | | 1.55% | | 1.1 | | 250,000 |
| | Other liabilities | | — |
| | — |
|
| Derivatives not designated as hedges: | | | | | | | | | | | | | | |
| Pay-fixed interest rate swaps | | | 3.86% | | Indexed to 1-month Libor | | 6.4 | | 1,000,763 |
| | Other assets / Other liabilities | | 7,605 |
| | (18,311 | ) | | | 3.69% | | Indexed to 1-month LIBOR | | 5.9 | | 1,488,928 |
| | Other assets / Other liabilities | | — |
| | (44,857 | ) |
| Pay-variable interest rate swaps | | | Indexed to 1-month Libor | | 3.86% | | 6.4 | | 1,000,763 |
| | Other assets / Other liabilities | | 19,648 |
| | (8,491 | ) | | | Indexed to 1-month LIBOR | | 3.69% | | 5.9 | | 1,488,928 |
| | Other assets | | 145,802 |
| | — |
|
| Interest rate caps purchased, indexed to 1-month Libor | | 2.80% | | 1.6 | | 145,957 |
| | Other assets | | 15 |
| | — |
| |
| Interest rate caps sold, indexed to 1-month Libor | | 2.80% | | 1.6 | | 145,957 |
| | Other liabilities | | — |
| | (15 | ) | |
| Interest rate caps purchased, indexed to 1-month LIBOR | | | 3.71% | | 0.9 | | 25,989 |
| | Other assets | | — |
| | — |
|
| Interest rate caps sold, indexed to 1-month LIBOR | | | 3.71% | | 0.9 | | 25,989 |
| | Other liabilities | | — |
| | — |
|
| | | | $ | 4,339,440 |
| | $ | 28,334 |
| | $ | (27,076 | ) | | | $ | 6,300,834 |
| | $ | 145,802 |
| | $ | (52,013 | ) |
BANKUNITED, INC. AND SUBSIDIARIES
NOTES TO CONSOLIDATED FINANCIAL STATEMENTS - UNAUDITED
SeptemberJune 30, 20172020
|
| | | | | | | | | | | | | | | | | | | | | |
| | December 31, 2019 |
| | | | Weighted Average Pay Rate | | Weighted Average Receive Rate | | Weighted Average Remaining Life in Years | | | | | | |
| | | | | | | Notional Amount | | Balance Sheet Location | | Fair Value |
| | Hedged Item | | | | | | | Asset | | Liability |
| Derivatives designated as cash flow hedges: | | | | | | | | | |
| | | | |
| | |
|
| Pay-fixed interest rate swaps | Variability of interest cash flows on variable rate borrowings | | 2.37% | | 3-Month LIBOR | | 3.2 | | $ | 3,131,000 |
| | Other liabilities | | $ | — |
| | $ | (1,607 | ) |
| Derivatives not designated as hedges: | | |
| |
| |
| |
|
| | | |
|
| | |
| Receive-fixed interest rate swaps | Variability of interest cash flows on fixed rate borrowings | | 3-Month LIBOR | | 1.55% | | 1.6 | | 250,000 |
| | Other liabilities | | — |
| | — |
|
| Derivatives not designated as hedges | | | | | | | | | | | | | | | |
| Pay-fixed interest rate swaps | | | 3.72% | | Indexed to 1-month LIBOR | | 6.4 | | 1,460,355 |
| | Other assets / Other liabilities | | 876 |
| | (15,307 | ) |
| Pay-variable interest rate swaps | | | Indexed to 1-month LIBOR | | 3.72% | | 6.4 | | 1,460,355 |
| | Other assets / Other liabilities | | 42,810 |
| | (2,115 | ) |
| Interest rate caps purchased, indexed to 1-month LIBOR | | |
| | 3.30% | | 0.6 | | 61,004 |
| | Other assets | | — |
| | — |
|
| Interest rate caps sold, indexed to 1-month LIBOR | | | 3.30% | | | | 0.6 | | 61,004 |
| | Other liabilities | | — |
| | — |
|
| | | | | | | | | | $ | 6,423,718 |
| | | | $ | 43,686 |
| | $ | (19,029 | ) |
|
| | | | | | | | | | | | | | | | | | | | | |
| | December 31, 2016 |
| | | | Weighted Average Pay Rate | | Weighted Average Receive Rate | | Weighted Average Remaining Life in Years | | | | | | |
| | | | | | | Notional Amount | | Balance Sheet Location | | Fair Value |
| | Hedged Item | | | | | | | Asset | | Liability |
| Derivatives designated as cash flow hedges: | | | | | | | | | |
| | | | |
| | |
|
| Pay-fixed interest rate swaps | Variability of interest cash flows on variable rate borrowings | | 1.58% | | 3-Month Libor | | 3.3 | | $ | 1,715,000 |
| | Other assets / Other liabilities | | $ | 19,648 |
| | $ | (3,112 | ) |
| Pay-fixed forward-starting interest rate swaps | Variability of interest cash flows on variable rate borrowings | | 3.43% | | 3-Month Libor | | 10.5 | | 300,000 |
| | Other liabilities | | — |
| | (27,866 | ) |
| Derivatives not designated as hedges: | | |
| |
| |
| |
|
| | | |
|
| | |
| Pay-fixed interest rate swaps | | | 3.77% | | Indexed to 1-month Libor | | 6.8 | | 912,000 |
| | Other assets / Other liabilities | | 9,949 |
| | (20,383 | ) |
| Pay-variable interest rate swaps | | | Indexed to 1-month Libor | | 3.77% | | 6.8 | | 912,000 |
| | Other assets / Other liabilities | | 20,383 |
| | (9,949 | ) |
| Interest rate caps purchased, indexed to 1-month Libor | | |
| | 2.96% | | 2.3 | | 189,057 |
| | Other assets | | 252 |
| | — |
|
| Interest rate caps sold, indexed to 1-month Libor | | | 2.96% | | | | 2.3 | | 189,057 |
| | Other liabilities | | — |
| | (252 | ) |
| | | | | | | | | | $ | 4,217,114 |
| | | | $ | 50,232 |
| | $ | (61,562 | ) |
The following table provides information about the amount of lossgain (loss) related to derivatives designated as cash flow hedges reclassified from AOCI into interest expense for the periods indicated (dollars in(in thousands): |
| | | | | | | | | | | | | | | | | |
| | Amount of Loss Reclassified from AOCI on Derivatives | | |
| | Three Months Ended September 30, | | Nine Months Ended September 30, | | |
| Derivatives in Cash Flow Hedging Relationships | 2017 | | 2016 | | 2017 | | 2016 | | Location of Loss Reclassified from AOCI into Income |
| Interest rate contracts | $ | (2,001 | ) | | $ | (3,741 | ) | | $ | (7,463 | ) | | $ | (13,050 | ) | | Interest expense on borrowings |
|
| | | | | | | | | | | | | | | | | |
| | Three Months Ended June 30, | | Six Months Ended June 30, | | Location of Gain (Loss) Reclassified from AOCI into Income |
| | 2020 | | 2019 | | 2020 | | 2019 | |
| Interest rate contracts | $ | (10,009 | ) | | $ | 1,688 |
| | $ | (14,565 | ) | | $ | 4,411 |
| | Interest expense on borrowings |
During the ninethree and six months ended SeptemberJune 30, 20172020 and 2016,2019, no derivative positions designated as cash flow hedges were discontinued and none of the gains and losses reported in AOCI were reclassified into earnings as a result of the discontinuance of cash flow hedges or because of the early extinguishment of debt. As of SeptemberJune 30, 2017,2020, the amount of net loss expected to be reclassified from AOCI into earnings during the next twelve months was $6.2$60.7 million.
The following table provides information about the amount of gain (loss) related to derivatives designated as fair value hedges recognized in earnings for the periods indicated (in thousands):
|
| | | | | | | | | | | | | | | | | |
| | Three Months Ended June 30, | | Six Months Ended June 30, | | Location of Gain (Loss) in Consolidated Statements of Income |
| | 2020 | | 2019 | | 2020 | | 2019 | |
| Fair value adjustment on derivatives | $ | 8 |
| | $ | — |
| | $ | 4,028 |
| | $ | — |
| | Interest expense on borrowings |
| Fair value adjustment on hedged items | (164 | ) | | — |
| | (4,072 | ) | | — |
| | Interest expense on borrowings |
| Gain recognized on fair value hedges (ineffective portion) | $ | (156 | ) | | $ | — |
| | $ | (44 | ) | | $ | — |
| | |
BANKUNITED, INC. AND SUBSIDIARIES
NOTES TO CONSOLIDATED FINANCIAL STATEMENTS - UNAUDITED
June 30, 2020
The following table provides information about the hedged items related to derivatives designated as fair value hedges at the dates indicated (in thousands):
|
| | | | | | | | | |
| | June 30, 2020 | | December 31, 2019 | | Location in Consolidated Balance Sheets |
Contractual balance outstanding of hedged item | $ | 250,000 |
| | $ | 250,000 |
| | FHLB and PPPLF borrowings |
| Cumulative fair value hedging adjustments | $ | 3,573 |
| | $ | (499 | ) | | FHLB and PPPLF borrowings |
Some of the Company’s ISDA master agreements with financial institution counterparties contain provisions that permit either counterparty to terminate the agreements and require settlement in the event that regulatory capital ratios fall below certain designated thresholds, upon the initiation of other defined regulatory actions or upon suspension or withdrawal of the Bank’s credit rating. Currently, there are no circumstances that would trigger these provisions of the agreements.
BANKUNITED, INC. AND SUBSIDIARIES
NOTES TO CONSOLIDATED FINANCIAL STATEMENTS - UNAUDITED
September 30, 2017
The Company does not offset assets and liabilities under master netting agreements for financial reporting purposes. Information on interest rate swaps subject to these agreements is as follows at the dates indicated (in(dollars in thousands):
| | | | September 30, 2017 | | | | | | | | | | | | | |
| | |
| Gross Amounts Offset in Balance
Sheet |
| Net Amounts Presented in
Balance Sheet |
| Gross Amounts Not Offset in Balance Sheet |
| | June 30, 2020 |
| | Gross Amounts Recognized |
| Derivative Instruments |
| Collateral Pledged |
| Net Amount | |
| Gross Amounts Offset in Balance
Sheet |
| Net Amounts Presented in
Balance Sheet |
| Gross Amounts Not Offset in Balance Sheet |
| |
|
|
|
|
|
|
|
|
|
|
|
|
|
|
|
|
|
| Gross Amounts Recognized |
| Derivative Instruments |
| Collateral Pledged |
| Net Amount |
| Derivative assets | $ | 8,686 |
| | $ | — |
| | $ | 8,686 |
| | $ | (6,814 | ) | | $ | (1,539 | ) | | $ | 333 |
| $ | — |
| | $ | — |
| | $ | — |
| | $ | — |
| | $ | — |
| | $ | — |
|
| Derivative liabilities | (18,570 | ) | | — |
| | (18,570 | ) | | 6,814 |
| | 11,756 |
| | — |
| (52,013 | ) | | — |
| | (52,013 | ) | | — |
| | 51,887 |
| | (126 | ) |
| | $ | (9,884 | ) | | $ | — |
| | $ | (9,884 | ) | | $ | — |
| | $ | 10,217 |
| | $ | 333 |
| $ | (52,013 | ) | | $ | — |
| | $ | (52,013 | ) | | $ | — |
| | $ | 51,887 |
| | $ | (126 | ) |
| | | | December 31, 2016 | | | | | | | | | | | | | |
| | | | Gross Amounts Offset in Balance
Sheet | | Net Amounts Presented in
Balance Sheet | | Gross Amounts Not Offset in Balance Sheet | | | December 31, 2019 |
| | Gross Amounts Recognized | | Derivative Instruments | | Collateral Pledged | | Net Amount | | | Gross Amounts Offset in Balance
Sheet | | Net Amounts Presented in
Balance Sheet | | Gross Amounts Not Offset in Balance Sheet | | |
| | | | | | | | | | | | | Gross Amounts Recognized | | Derivative Instruments | | Collateral Pledged | | Net Amount |
| Derivative assets | $ | 29,849 |
| | $ | — |
| | $ | 29,849 |
| | $ | (27,485 | ) | | $ | — |
| | $ | 2,364 |
| $ | 876 |
| | $ | — |
| | $ | 876 |
| | $ | (876 | ) | | $ | — |
| | $ | — |
|
| Derivative liabilities | (51,362 | ) | | — |
| | (51,362 | ) | | 27,485 |
| | 23,796 |
| | (81 | ) | (16,914 | ) | | — |
| | (16,914 | ) | | 876 |
| | 16,038 |
| | — |
|
| | $ | (21,513 | ) | | $ | — |
| | $ | (21,513 | ) | | $ | — |
| | $ | 23,796 |
| | $ | 2,283 |
| $ | (16,038 | ) | | $ | — |
| | $ | (16,038 | ) | | $ | — |
| | $ | 16,038 |
| | $ | — |
|
The difference between the amounts reported for interest rate swaps subject to master netting agreements and the total fair value of interest rate contract derivative financial instruments reported in the consolidated balance sheets is related to interest rate derivative contracts entered into with borrowers not subject to master netting agreements.
At SeptemberJune 30, 2017,2020, the Company had pledged investment securities available for sale with a carrying amountnet financial collateral of $40 million and cash on deposit of $2$56.0 million as collateral for interest rate swaps in a liability position. $2 million of financial collateral was pledged by counterparties to the Company for interest rate swaps in an asset position.position that are not centrally cleared. The amount of collateral required to be posted varies based on the settlement value of outstanding swaps and in some cases may include initial margin requirements.
BANKUNITED, INC. AND SUBSIDIARIES
NOTES TO CONSOLIDATED FINANCIAL STATEMENTS - UNAUDITED
SeptemberJune 30, 20172020
Note 8 Stockholders’ Equity
Accumulated Other Comprehensive Income
Changes in AOCIother comprehensive income are summarized as follows for the periods indicated (in thousands):
| | | | Three Months Ended September 30, | Three Months Ended June 30, |
| | 2017 | | 2016 | 2020 | | 2019 |
| | Before Tax | | Tax Effect | | Net of Tax | | Before Tax | | Tax Effect | | Net of Tax | Before Tax | | Tax Effect | | Net of Tax | | Before Tax | | Tax Effect | | Net of Tax |
| Unrealized gains on investment securities available for sale: | |
| | |
| | |
| | | | | | | |
| Unrealized gains (losses) on investment securities available for sale: | | |
| | |
| | |
| | | | | | |
| Net unrealized holding gain arising during the period | $ | 14,144 |
| | $ | (5,587 | ) | | $ | 8,557 |
| | $ | 5,316 |
| | $ | (2,100 | ) | | $ | 3,216 |
| $ | 252,893 |
| | $ | (64,488 | ) | | $ | 188,405 |
| | $ | 31,736 |
| | $ | (8,410 | ) | | $ | 23,326 |
|
| Amounts reclassified to gain on investment securities available for sale, net | (26,931 | ) | | 10,638 |
| | (16,293 | ) | | (3,008 | ) | | 1,188 |
| | (1,820 | ) | (5,723 | ) | | 1,459 |
| | (4,264 | ) | | (3,914 | ) | | 1,037 |
| | (2,877 | ) |
| Net change in unrealized gains on investment securities available for sale | (12,787 | ) | | 5,051 |
| | (7,736 | ) | | 2,308 |
| | (912 | ) | | 1,396 |
| |
| Net change in unrealized gains (losses) on investment securities available for sale | | 247,170 |
| | (63,029 | ) | | 184,141 |
| | 27,822 |
| | (7,373 | ) | | 20,449 |
|
| Unrealized losses on derivative instruments: | | | | | | | | | | | | | | | | | | | | | | |
| Net unrealized holding gain (loss) arising during the period | (281 | ) | | 111 |
| | (170 | ) | | 8,356 |
| | (3,301 | ) | | 5,055 |
| |
| Net unrealized holding loss arising during the period | | (12,288 | ) | | 1,218 |
| | (11,070 | ) | | (50,637 | ) | | 13,419 |
| | (37,218 | ) |
| Amounts reclassified to interest expense on borrowings | 2,001 |
| | (791 | ) | | 1,210 |
| | 3,741 |
| | (1,477 | ) | | 2,264 |
| 10,009 |
| | (2,507 | ) | | 7,502 |
| | (1,688 | ) | | 447 |
| | (1,241 | ) |
| Net change in unrealized losses on derivative instruments | 1,720 |
| | (680 | ) | | 1,040 |
| | 12,097 |
| | (4,778 | ) | | 7,319 |
| (2,279 | ) | | (1,289 | ) | | (3,568 | ) | | (52,325 | ) | | 13,866 |
| | (38,459 | ) |
| Other comprehensive income (loss) | $ | (11,067 | ) | | $ | 4,371 |
| | $ | (6,696 | ) | | $ | 14,405 |
| | $ | (5,690 | ) | | $ | 8,715 |
| $ | 244,891 |
| | $ | (64,318 | ) | | $ | 180,573 |
| | $ | (24,503 | ) | | $ | 6,493 |
| | $ | (18,010 | ) |
|
| | | | | | | | | | | | | | | | | | | | | | | |
| | Six Months Ended June 30, |
| | 2020 | | 2019 |
| | Before Tax | | Tax Effect | | Net of Tax | | Before Tax | | Tax Effect | | Net of Tax |
| Unrealized gains (losses) on investment securities available for sale: | |
| | |
| | |
| | | | | | |
| Net unrealized holding gain (loss) arising during the period | $ | (33,743 | ) | | $ | 8,988 |
| | $ | (24,755 | ) | | $ | 61,147 |
| | $ | (16,204 | ) | | $ | 44,943 |
|
| Amounts reclassified to gain on investment securities available for sale, net | (7,253 | ) | | 1,849 |
| | (5,404 | ) | | (8,231 | ) | | 2,181 |
| | (6,050 | ) |
| Net change in unrealized gains (losses) on investment securities available for sale | (40,996 | ) | | 10,837 |
| | (30,159 | ) | | 52,916 |
| | (14,023 | ) | | 38,893 |
|
| Unrealized losses on derivative instruments: | | | | | | | | | | | |
| Net unrealized holding loss arising during the period | (122,239 | ) | | 30,355 |
| | (91,884 | ) | | (78,766 | ) | | 20,873 |
| | (57,893 | ) |
| Amounts reclassified to interest expense on borrowings | 14,565 |
| | (3,714 | ) | | 10,851 |
| | (4,411 | ) | | 1,169 |
| | (3,242 | ) |
| Net change in unrealized losses on derivative instruments | (107,674 | ) | | 26,641 |
| | (81,033 | ) | | (83,177 | ) | | 22,042 |
| | (61,135 | ) |
| Other comprehensive loss | $ | (148,670 | ) | | $ | 37,478 |
| | $ | (111,192 | ) | | $ | (30,261 | ) | | $ | 8,019 |
| | $ | (22,242 | ) |
|
| | | | | | | | | | | | | | | | | | | | | | | |
| | Nine Months Ended September 30, |
| | 2017 | | 2016 |
| | Before Tax | | Tax Effect | | Net of Tax | | Before Tax | | Tax Effect | | Net of Tax |
| Unrealized gains on investment securities available for sale: | |
| | |
| | |
| | | | | | |
| Net unrealized holding gain arising during the period | $ | 54,258 |
| | $ | (21,432 | ) | | $ | 32,826 |
| | $ | 88,413 |
| | $ | (34,923 | ) | | $ | 53,490 |
|
| Amounts reclassified to gain on investment securities available for sale, net | (29,194 | ) | | 11,532 |
| | (17,662 | ) | | (10,065 | ) | | 3,975 |
| | (6,090 | ) |
| Net change in unrealized gains on investment securities available for sale | 25,064 |
| | (9,900 | ) | | 15,164 |
| | 78,348 |
| | (30,948 | ) | | 47,400 |
|
| Unrealized losses on derivative instruments: | | | | | | | | | | | |
| Net unrealized holding loss arising during the period | (13,780 | ) | | 5,443 |
| | (8,337 | ) | | (57,765 | ) | | 22,817 |
| | (34,948 | ) |
| Amounts reclassified to interest expense on borrowings | 7,463 |
| | (2,948 | ) | | 4,515 |
| | 13,050 |
| | (5,154 | ) | | 7,896 |
|
| Net change in unrealized losses on derivative instruments | (6,317 | ) | | 2,495 |
| | (3,822 | ) | | (44,715 | ) | | 17,663 |
| | (27,052 | ) |
| Other comprehensive income | $ | 18,747 |
| | $ | (7,405 | ) | | $ | 11,342 |
| | $ | 33,633 |
| | $ | (13,285 | ) | | $ | 20,348 |
|
BANKUNITED, INC. AND SUBSIDIARIES
NOTES TO CONSOLIDATED FINANCIAL STATEMENTS - UNAUDITED
SeptemberJune 30, 20172020
The categories of AOCI and changes therein are presented below for the periods indicated (in thousands):
|
| | | | | | | | | | | |
| | Unrealized Gains on Investment Securities Available for Sale | | Unrealized Losses on Derivative Instruments | | Total |
| Balance at December 31, 2016 | $ | 47,057 |
| | $ | (5,810 | ) | | $ | 41,247 |
|
| Other comprehensive income | 15,164 |
| | (3,822 | ) | | 11,342 |
|
| Balance at September 30, 2017 | $ | 62,221 |
| | $ | (9,632 | ) | | $ | 52,589 |
|
| | | | | | |
| Balance at December 31, 2015 | $ | 41,535 |
| | $ | (19,353 | ) | | $ | 22,182 |
|
| Other comprehensive income | 47,400 |
| | (27,052 | ) | | 20,348 |
|
| Balance at September 30, 2016 | $ | 88,935 |
| | $ | (46,405 | ) | | $ | 42,530 |
|
|
| | | | | | | | | | | |
| | Unrealized Gain (Loss) on Investment Securities Available for Sale | | Unrealized Gain (Loss) on Derivative Instruments | | Total |
| Balance at December 31, 2019 | $ | 28,185 |
| | (60,012 | ) | | $ | (31,827 | ) |
| Other comprehensive loss | (30,159 | ) | | (81,033 | ) | | (111,192 | ) |
| Balance at June 30, 2020 | $ | (1,974 | ) | | $ | (141,045 | ) | | $ | (143,019 | ) |
| | | | | | |
| Balance at December 31, 2018 | $ | 4,194 |
| | $ | 679 |
| | $ | 4,873 |
|
| Other comprehensive loss | 38,893 |
| | (61,135 | ) | | (22,242 | ) |
| Balance at June 30, 2019 | $ | 43,087 |
| | $ | (60,456 | ) | | $ | (17,369 | ) |
Note 9 Equity Based and Other Compensation Plans
Share Awards
Unvested share awards
During the nine months ended September 30, 2017, the Company granted 618,306A summary of activity related to unvested share awards underfollows for the 2014 Plan. Allperiods indicated:
|
| | | | | | |
| | Number of Share Awards | | Weighted Average Grant Date Fair Value |
| Unvested share awards outstanding, December 31, 2019 | 1,050,455 |
| | $ | 38.24 |
|
| Granted | 644,300 |
| | 29.73 |
|
| Vested | (455,260 | ) | | 39.15 |
|
| Canceled or forfeited | (33,137 | ) | | 36.21 |
|
| Unvested share awards outstanding, June 30, 2020 | 1,206,358 |
| | $ | 33.41 |
|
| | | | |
| Unvested share awards outstanding, December 31, 2018 | 1,186,238 |
| | $ | 38.86 |
|
| Granted | 582,353 |
| | 36.57 |
|
| Vested | (533,125 | ) | | 37.67 |
|
| Canceled or forfeited | (115,825 | ) | | 39.11 |
|
| Unvested share awards outstanding, June 30, 2019 | 1,119,641 |
| | $ | 38.21 |
|
Unvested share awards are generally valued at the closing price of the Company's common stock on the date of grant. All shares granted prior to 2019 vest in equal annual installments over a period of three years from the date of grant. TheAll shares granted were valued atin 2019 and 2020 to Company employees vest in equal annual installments over a period of four years from the date of grant. Shares granted to the Company's Board of Directors vest over a period of one year.
BANKUNITED, INC. AND SUBSIDIARIES
NOTES TO CONSOLIDATED FINANCIAL STATEMENTS - UNAUDITED
June 30, 2020
The following table summarizes the closing price of the Company’s commonCompany's stock on the date of grant ranging from $33.21 to $40.84,for shares granted and had anthe aggregate grant date fair value of $24.9 million. shares vesting for the periods indicated (in thousands, except per share data):
|
| | | | | | | |
| | Six Months Ended June 30, |
| | 2020 | | 2019 |
Closing price on date of grant (1) | $13.99 - $30.90 |
| | $34.23 - $36.65 |
|
| Aggregate grant date fair value of shares vesting | $ | 17,824 |
| | $ | 20,083 |
|
| |
| (1) | During the six months ended June 30, 2020, the Company granted 599,766 and 44,534 shares with a closing price on date of grant of $30.90 and $13.99, respectively. |
The total unrecognized compensation cost of $26.7$29.5 million for all unvested share awards outstanding at SeptemberJune 30, 20172020 will be recognized over a weighted average remaining period of 1.982.75 years.
During the nine months ended September 30, 2016, the Company granted 644,888 unvested share awards under the 2014 Plan. All of the shares vest in equal annual installments over a period of three years from the date of grant. The shares granted were valued at the closing price of the Company’s common stock on the date of grant, ranging from $29.78 to $33.76, and had an aggregate fair value of $20.0 million.
Executive share-based awards
Certain of the Company's executives are eligible to receive annual awards of RSUs and PSUs (collectively, the "share units"). Annual awards of RSUs represent a fixed number of shares and vest on December 31st in equal tranches over three years.years for grants prior to 2019, and over four years for awards issued in 2019 and 2020. PSUs are initially granted based on a target value. The number of PSUs that ultimately vest at the end of a three-yearthe performance measurement period will be based on the achievement of performance criteria pre-established by the Compensation Committee of the Board of Directors. The performance criteria established for the PSUs granted in 2017 and 2016 include both performance and market conditions. Upon vesting, the share units will be converted to common stock on a one-for-one basis, or may be settled in cash at the Company's option. The share units will accumulate dividends declared on the Company's common stock from the date of grant to be paid subsequent to vesting.
The first tranche of RSUs granted vested on December 31, 2016. The Company cash settled these share units in the amount of $0.8 million during the first quarter of 2017. As a result of thisthe majority of previous settlements being in cash, settlement, all RSUs and PSUs have been determined to be liability instruments and will beare remeasured at fair value each reporting period until the awards are settled. The RSUs are valued based on the closing price of the Company's common stock at the reporting date. The PSUs are valued based on the closing price of the Company's common stock at the reporting date net of a discount related to any applicable market conditions, considering the probability of meeting the defined performance conditions. Compensation cost related to PSUs is recognized during the performance period based on the probable outcome of the respective performance conditions.
DuringA summary of activity related to executive share-based awards for the nine months ended September 30, 2017, 47,848 RSUs and 47,848 PSUs were granted. During the nine months ended September 30, 2016, 57,873 RSUs and 57,873 PSUs were granted. period indicatedfollows:
|
| | | | | |
| | RSU | | PSU |
| Unvested executive share-based awards outstanding, December 31, 2019 | 112,116 |
| | 125,088 |
|
| Granted | 106,731 |
| | 106,731 |
|
| Unvested executive share-based awards outstanding, June 30, 2020 | 218,847 |
| | 231,819 |
|
| | | | |
| Unvested executive share-based awards outstanding, December 31, 2018 | 90,612 |
| | 99,874 |
|
| Granted | 73,062 |
| | 73,062 |
|
| Unvested executive share-based awards outstanding, June 30, 2019 | 163,674 |
| | 172,936 |
|
The total liability for the share units was $2.6$2.9 million at SeptemberJune 30, 2017.2020. The total unrecognized compensation cost of $5.3$6.2 million for these share units at SeptemberJune 30, 20172020 will be recognized over a weighted average remaining period of 2.182.45 years.
Incentiveawards
BANKUNITED, INC. AND SUBSIDIARIES
NOTES TO CONSOLIDATED FINANCIAL STATEMENTS - UNAUDITED
September 30, 2017
The618,306 unvested share awards granted during the nine months ended September 30, 2017, as discussed above, included 25,321 unvested share awards granted to certain of the Company's executives based on the achievement of performance criteria pre-established by the Compensation Committee for the year ended December 31, 2016.
Incentiveawards
Beginning in 2017, the Company's annual incentive compensation arrangements for employees other than those eligible for the executive share-based awards discussed above provide for settlement through a combination of cash payments and unvested share awards following the end of the annual performance period. The dollar value of share awards to be granted is based on the achievement of performance criteria established in the incentive arrangements. The number of shares of common stock to be awarded is variable based on the closing price of the Company's stock on the date of grant; therefore, these awards are initially classified as
BANKUNITED, INC. AND SUBSIDIARIES
NOTES TO CONSOLIDATED FINANCIAL STATEMENTS - UNAUDITED
June 30, 2020
liability instruments, with compensation cost recognized from the beginning of the performance period. TheAwards related to performance periods prior to 2019 vest over three years and awards related to the 2019 and 2020 performance periods vest in equal installments over a period of threefour years from the date of grant. These awards are included in the summary of activity related to unvested share awards above. The total liability and unrecognized compensation cost for the incentive share awards for the 2020 performance period was $1.2 million at September 30, 2017.not material. The total unrecognized compensation cost of $5.3 million for these share awards at September 30, 2017 will be recognized over a weighted average remaining period of 3.25 years. The accrued liability and unrecognized compensation cost are based on management's current estimate of the likely outcome of the performance criteria established in the incentive arrangements and may differ from actual results.
The 644,300 unvested share awards granted during the six months ended June 30, 2020, as discussed above, included 114,936 unvested share awards granted under the Company's annual incentive compensation arrangements based on the achievement of established performance criteria for the year ended December 31, 2019.
Option Awards
A summary of activity related to stock option awards for the ninesix months ended SeptemberJune 30, 2017 2020 and 2019follows:
|
| | | | | | |
| | Number of Option Awards | | Weighted Average Exercise Price |
| Option awards outstanding, December 31, 2016 | 3,602,076 |
| | $ | 26.74 |
|
| Exercised | (2,304,108 | ) | | 26.70 |
|
| Option awards outstanding and exercisable, September 30, 2017 | 1,297,968 |
| | $ | 26.81 |
|
|
| | | | | | |
| | Number of Option Awards | | Weighted Average Exercise Price |
| Option awards outstanding, December 31, 2019 | 737,753 |
| | $ | 26.64 |
|
| Exercised | (60,000 | ) | | 25.48 |
|
| Option awards outstanding and exercisable, June 30, 2020 | 677,753 |
| | $ | 26.74 |
|
| | | | |
| Option awards outstanding, December 31, 2018 | 964,840 |
| | $ | 26.53 |
|
| Exercised | (3,910 | ) | | 11.14 |
|
| Canceled or forfeited | (1,960 | ) | | 63.74 |
|
| Option awards outstanding, June 30, 2019 | 958,970 |
| | $ | 26.52 |
|
Activity related to stock option awards for the nine months ended September 30, 2016 was not significant. The intrinsic value of options exercised and the related tax benefitbenefits was $25.3 million and $3.8 million, respectively, duringimmaterial for the ninesix months ended SeptemberJune 30, 2017.2020 and 2019.
Note 10 Fair Value Measurements
Assets and liabilities measured at fair value on a recurring basis
Following is a description of the methodologies used to estimate the fair values of assets and liabilities measured at fair value on a recurring basis and the level within the fair value hierarchy in which those measurements are typically classified.
Investment securities available for sale and marketable equity securities—Fair value measurements are based on quoted prices in active markets when available; these measurements are classified within level 1 of the fair value hierarchy. These securities typically include U.S. Treasury securities and certain preferred stocks. If quoted prices in active markets are not available, fair values are estimated using quoted prices of securities with similar characteristics, quoted prices of identical securities in less active markets, discounted cash flow techniques, or matrix pricing models. These securities are generally classified within level 2 of the fair value hierarchy and include U.S. Government agency securities, U.S. Government agency and sponsored enterprise MBS, preferred stock investments for which level 1 valuations are not available, corporate debt securities, non-mortgage asset-backed securities, single family rental real estate-backed securities, certain private label residential MBS and CMOs, private label commercial MBS, collateralized loan obligations and state and municipal obligations. Pricing of these securities is generally primarily spread driven. Observable inputs that may impact the valuation of these securities include benchmark yield curves, credit spreads, reported trades, dealer quotes, bids, issuer spreads, current rating, historical constant prepayment rates, historical voluntary prepayment rates, structural and waterfall features of individual securities, published collateral data, and for certain securities, historical constant default rates and default severities. Investment securities available for sale generally classified within level 3 of the fair value hierarchy include certain private label MBS and trust preferred securities. The Company typically values these securities using third-party proprietary pricing models, primarily discounted cash flow valuation techniques, which incorporate both observable and unobservable inputs. Unobservable inputs that may impact the valuation of
BANKUNITED, INC. AND SUBSIDIARIES
NOTES TO CONSOLIDATED FINANCIAL STATEMENTS - UNAUDITED
September 30, 2017
these securities include risk adjusted discount rates, projected prepayment rates, projected default rates and projected loss severity.
The Company uses third-party pricing services in determining fair value measurements for investment securities. To obtain an understanding of the methodologies and assumptions used, management reviews written documentation provided by the pricing services, conducts interviews with valuation desk personnel and reviews model results and detailed assumptions used to
BANKUNITED, INC. AND SUBSIDIARIES
NOTES TO CONSOLIDATED FINANCIAL STATEMENTS - UNAUDITED
June 30, 2020
value selected securities as considered necessary. Management has established a robust price challenge process that includes a review by the treasury front office of all prices provided on a monthly basis. Any price evidencing unexpected month over month fluctuations or deviations from expectations is challenged. If considered necessary to resolve any discrepancies, a price will be obtained from an additional independent valuation source. The Company does not typically adjust the prices provided, other than through this established challenge process. The results of price challenges are subject to review by executive management. The Company has also established a quarterly process whereby prices provided by its primary pricing service for a sample of securities are validated. Any price discrepancies are resolved based on careful consideration of the assumptions and inputs employed by each of the pricing sources.
Servicing rights—Commercial servicing rights are valued using a discounted cash flow methodology incorporating contractually specified servicing fees and market based assumptions about prepayments, discount rates, default rates and costs of servicing. Prepayment and default assumptions are based on historical industry data for loans with similar characteristics. Assumptions about costs of servicing are based on market convention. Discount rates are based on rates of return implied by observed trades of underlying loans in the secondary market. Fair value of residential MSRs is estimated using a discounted cash flow technique that incorporates market‑based assumptions including estimated prepayment speeds, contractual servicing fees, cost to service, discount rates, escrow account earnings, ancillary income, and estimated defaults. Due to the natureThese instruments are classified within level 2 of the valuation inputs and the limited availability of market pricing, servicing rights are classified as level 3.fair value hierarchy.
Derivative financial instruments—Fair values of interest rate swaps are determined using widely accepted discounted cash flow modeling techniques. These discounted cash flow models use projections of future cash payments and receipts that are discounted at mid-market rates. Observable inputs that may impact the valuation of these instruments include LIBOR swap rates and LIBOR forward yield curves. These fair value measurements are generally classified within level 2 of the fair value hierarchy.
BANKUNITED, INC. AND SUBSIDIARIES
NOTES TO CONSOLIDATED FINANCIAL STATEMENTS - UNAUDITED
September 30, 2017
The following tables present assets and liabilities measured at fair value on a recurring basis at the dates indicated (in thousands):
| | | | September 30, 2017 | June 30, 2020 |
| | Level 1 | | Level 2 | | Level 3 | | Total | Level 1 | | Level 2 | | Total |
| Investment securities available for sale: | |
| | |
| | |
| | |
| |
| | |
| | |
|
| U.S. Treasury securities | $ | 24,957 |
| | $ | — |
| | $ | — |
| | $ | 24,957 |
| $ | 77,180 |
| | $ | — |
| | $ | 77,180 |
|
| U.S. Government agency and sponsored enterprise residential MBS | — |
| | 2,348,687 |
| | — |
| | 2,348,687 |
| — |
| | 2,379,840 |
| | 2,379,840 |
|
| U.S. Government agency and sponsored enterprise commercial MBS | — |
| | 139,220 |
| | — |
| | 139,220 |
| — |
| | 464,277 |
| | 464,277 |
|
| Private label residential MBS and CMOs | — |
| | 467,061 |
| | 60,797 |
| | 527,858 |
| — |
| | 1,116,086 |
| | 1,116,086 |
|
| Private label commercial MBS | — |
| | 1,153,601 |
| | — |
| | 1,153,601 |
| — |
| | 2,043,620 |
| | 2,043,620 |
|
| Single family rental real estate-backed securities | — |
| | 572,948 |
| | — |
| | 572,948 |
| — |
| | 618,207 |
| | 618,207 |
|
| Collateralized loan obligations | — |
| | 700,319 |
| | — |
| | 700,319 |
| — |
| | 1,128,753 |
| | 1,128,753 |
|
| Non-mortgage asset-backed securities | — |
| | 82,637 |
| | — |
| | 82,637 |
| — |
| | 261,531 |
| | 261,531 |
|
| Preferred stocks | 70,038 |
| | 678 |
| | — |
| | 70,716 |
| |
| State and municipal obligations | — |
| | 677,015 |
| | — |
| | 677,015 |
| — |
| | 259,495 |
| | 259,495 |
|
| SBA securities | — |
| | 586,675 |
| | — |
| | 586,675 |
| — |
| | 245,942 |
| | 245,942 |
|
| Other debt securities | — |
| | 3,815 |
| | 5,024 |
| | 8,839 |
| |
| Marketable equity securities | | 88,697 |
| | — |
| | 88,697 |
|
| Servicing rights | — |
| | — |
| | 30,136 |
| | 30,136 |
| — |
| | 7,291 |
| | 7,291 |
|
| Derivative assets | — |
| | 28,334 |
| | — |
| | 28,334 |
| — |
| | 145,802 |
| | 145,802 |
|
| Total assets at fair value | $ | 94,995 |
| | $ | 6,760,990 |
| | $ | 95,957 |
| | $ | 6,951,942 |
| $ | 165,877 |
| | $ | 8,670,844 |
| | $ | 8,836,721 |
|
| Derivative liabilities | $ | — |
| | $ | 27,076 |
| | $ | — |
| | $ | 27,076 |
| $ | — |
| | $ | (52,013 | ) | | $ | (52,013 | ) |
| Total liabilities at fair value | $ | — |
| | $ | 27,076 |
| | $ | — |
| | $ | 27,076 |
| $ | — |
| | $ | (52,013 | ) | | $ | (52,013 | ) |
BANKUNITED, INC. AND SUBSIDIARIES
NOTES TO CONSOLIDATED FINANCIAL STATEMENTS - UNAUDITED
SeptemberJune 30, 20172020
|
| | | | | | | | | | | |
| | December 31, 2019 |
| | Level 1 | | Level 2 | | Total |
| Investment securities available for sale: | |
| | |
| | |
|
| U.S. Treasury securities | $ | 70,325 |
| | $ | — |
| | $ | 70,325 |
|
| U.S. Government agency and sponsored enterprise residential MBS | — |
| | 2,022,175 |
| | 2,022,175 |
|
| U.S. Government agency and sponsored enterprise commercial MBS | — |
| | 370,976 |
| | 370,976 |
|
| Private label residential MBS and CMOs | — |
| | 1,012,177 |
| | 1,012,177 |
|
| Private label commercial MBS | — |
| | 1,724,684 |
| | 1,724,684 |
|
| Single family rental real estate-backed securities | — |
| | 470,025 |
| | 470,025 |
|
| Collateralized loan obligations | — |
| | 1,197,366 |
| | 1,197,366 |
|
| Non-mortgage asset-backed securities | — |
| | 194,904 |
| | 194,904 |
|
| State and municipal obligations | — |
| | 273,302 |
| | 273,302 |
|
| SBA securities | — |
| | 362,731 |
| | 362,731 |
|
| Marketable equity securities | 60,572 |
| | — |
| | 60,572 |
|
| Servicing rights | — |
| | 7,977 |
| | 7,977 |
|
| Derivative assets | — |
| | 43,686 |
| | 43,686 |
|
| Total assets at fair value | $ | 130,897 |
| | $ | 7,680,003 |
| | $ | 7,810,900 |
|
| Derivative liabilities | $ | — |
| | $ | (19,029 | ) | | $ | (19,029 | ) |
| Total liabilities at fair value | $ | — |
| | $ | (19,029 | ) | | $ | (19,029 | ) |
|
| | | | | | | | | | | | | | | |
| | December 31, 2016 |
| | Level 1 | | Level 2 | | Level 3 | | Total |
| Investment securities available for sale: | |
| | |
| | |
| | |
|
| U.S. Treasury securities | $ | 5,005 |
| | $ | — |
| | $ | — |
| | $ | 5,005 |
|
| U.S. Government agency and sponsored enterprise residential MBS | — |
| | 1,527,242 |
| | — |
| | 1,527,242 |
|
| U.S. Government agency and sponsored enterprise commercial MBS | — |
| | 124,586 |
| | — |
| | 124,586 |
|
| Private label residential MBS and CMOs | — |
| | 254,488 |
| | 120,610 |
| | 375,098 |
|
| Private label commercial MBS | — |
| | 1,187,624 |
| | — |
| | 1,187,624 |
|
| Single family rental real estate-backed securities | — |
| | 861,251 |
| | — |
| | 861,251 |
|
| Collateralized loan obligations | — |
| | 487,296 |
| | — |
| | 487,296 |
|
| Non-mortgage asset-backed securities | — |
| | 186,736 |
| | — |
| | 186,736 |
|
| Preferred stocks | 86,890 |
| | 1,313 |
| | — |
| | 88,203 |
|
| State and municipal obligations | — |
| | 698,546 |
| | — |
| | 698,546 |
|
| SBA securities | — |
| | 523,906 |
| | — |
| | 523,906 |
|
| Other debt securities | — |
| | 3,519 |
| | 4,572 |
| | 8,091 |
|
| Servicing rights | — |
| | — |
| | 27,159 |
| | 27,159 |
|
| Derivative assets | — |
| | 50,232 |
| | — |
| | 50,232 |
|
| Total assets at fair value | $ | 91,895 |
| | $ | 5,906,739 |
| | $ | 152,341 |
| | $ | 6,150,975 |
|
| Derivative liabilities | $ | — |
| | $ | 61,562 |
| | $ | — |
| | $ | 61,562 |
|
| Total liabilities at fair value | $ | — |
| | $ | 61,562 |
| | $ | — |
| | $ | 61,562 |
|
There were no transfers of financial assets between levels of the fair value hierarchy during the nine months ended September 30, 2017.
The following table reconciles changes in the fair value of assets and liabilities measured at fair value on a recurring basis and classified in level 3 of the fair value hierarchy during the periods indicated (in thousands):
|
| | | | | | | | | | | | | | | | | | | | | | | |
| | Three Months Ended September 30, |
| | 2017 | | 2016 |
| | Private Label Residential MBS | | Other Debt Securities | | Servicing Rights | | Private Label Residential MBS | | Other Debt Securities | | Servicing Rights |
| Balance at beginning of period | $ | 108,790 |
| | $ | 4,923 |
| | $ | 29,128 |
| | $ | 131,156 |
| | $ | 4,292 |
| | $ | 24,891 |
|
| Gains (losses) for the period included in: | | | | | | | | | | | |
| Net income | 24,146 |
| | — |
| | (1,330 | ) | | — |
| | — |
| | (2,369 | ) |
| Other comprehensive income | (24,668 | ) | | 101 |
| | — |
| | 337 |
| | 22 |
| | — |
|
| Discount accretion | 2,332 |
| | 59 |
| | — |
| | 1,404 |
| | 36 |
| | — |
|
| Purchases or additions | — |
| | — |
| | 2,338 |
| | — |
| | — |
| | 2,194 |
|
| Sales | (40,732 | ) | | — |
| | — |
| | — |
| | — |
| | — |
|
| Settlements | (9,071 | ) | | (59 | ) | | — |
| | (5,594 | ) | | (26 | ) | | — |
|
| Transfers into level 3 | — |
| | — |
| | — |
| | — |
| | — |
| | — |
|
| Transfers out of level 3 | — |
| | — |
| | — |
| | — |
| | — |
| | — |
|
| Balance at end of period | $ | 60,797 |
| | $ | 5,024 |
| | $ | 30,136 |
| | $ | 127,303 |
| | $ | 4,324 |
| | $ | 24,716 |
|
BANKUNITED, INC. AND SUBSIDIARIES
NOTES TO CONSOLIDATED FINANCIAL STATEMENTS - UNAUDITED
September 30, 2017
|
| | | | | | | | | | | | | | | | | | | | | | | |
| | Nine Months Ended September 30, |
| | 2017 | | 2016 |
| | Private Label Residential MBS | | Other Debt Securities | | Servicing Rights | | Private Label Residential MBS | | Other Debt Securities | | Servicing Rights |
| Balance at beginning of period | $ | 120,610 |
| | $ | 4,572 |
| | $ | 27,159 |
| | $ | 140,883 |
| | $ | 4,532 |
| | $ | 20,017 |
|
| Gains (losses) for the period included in: | | | | | | | | | | | |
| Net income | 24,146 |
| | — |
| | (4,273 | ) | | — |
| | — |
| | (5,983 | ) |
| Other comprehensive income | (25,651 | ) | | 469 |
| | — |
| | (190 | ) | | (245 | ) | | — |
|
| Discount accretion | 5,208 |
| | 248 |
| | — |
| | 4,485 |
| | 88 |
| | — |
|
| Purchases or additions | — |
| | — |
| | 7,250 |
| | — |
| | — |
| | 10,682 |
|
| Sales | (40,732 | ) | | — |
| | — |
| | — |
| | — |
| | — |
|
| Settlements | (22,784 | ) | | (265 | ) | | — |
| | (17,875 | ) | | (51 | ) | | — |
|
| Transfers into level 3 | — |
| | — |
| | — |
| | — |
| | — |
| | — |
|
| Transfers out of level 3 | — |
| | — |
| | — |
| | — |
| | — |
| | — |
|
| Balance at end of period | $ | 60,797 |
| | $ | 5,024 |
| | $ | 30,136 |
| | $ | 127,303 |
| | $ | 4,324 |
| | $ | 24,716 |
|
Gains on private label residential MBS recognized in net income during the three and nine months ended September 30, 2017 are included in the consolidated statement of income line item "Gain on investment securities available for sale, net." Changes in the fair value of servicing rights are included in the consolidated statement of income line item “Other non-interest income.” Changes in fair value include changes due to valuation assumptions, primarily discount rates and prepayment speeds, as well as other changes such as runoff and the passage of time. The amount of net unrealized losses included in earnings for the nine months ended September 30, 2017 and 2016 that were related to servicing rights held at September 30, 2017 and 2016 totaled approximately $0.8 million and $1.7 million, respectively, and were primarily due to changes in discount rates and prepayment speeds.
Securities for which fair value measurements are categorized in level 3 of the fair value hierarchy at September 30, 2017 consisted of pooled trust preferred securities with a fair value of $5 million and private label residential MBS and CMOs with a fair value of $61 million. The trust preferred securities are not material to the Company’s financial statements. Private label residential MBS consisted of senior and mezzanine tranches collateralized by prime fixed rate and hybrid 1-4 single family residential mortgages originated before 2005, some of which contain option-arm features. Substantially all of these securities have variable rate coupons. Weighted average subordination levels at September 30, 2017 were 16.4% and 10.4% for investment grade and non-investment grade securities, respectively.
The following table provides information about the valuation techniques and unobservable inputs used in the valuation of private label residential MBS and CMOs falling within level 3 of the fair value hierarchy as of September 30, 2017 (dollars in thousands):
|
| | | | | | | | | | |
| | | Fair Value at | | Valuation Technique | | Unobservable Input | | Range (Weighted Average) |
| | | September 30, 2017 | | | |
| Investment grade | | $ | 34,245 |
| | Discounted cash flow | | Voluntary prepayment rate | | 6.60% - 25.60% (15.92%) |
| | | | | | | Probability of default | | 0.13% - 4.04% (1.36%) |
| | | | | | | Loss severity | | 15.00% - 75.00% (33.10%) |
| | | | | | | Discount rate | | 1.88% - 7.43% (3.48%) |
| | | | | | | | | |
| Non-investment grade | | $ | 26,552 |
| | Discounted cash flow | | Voluntary prepayment rate | | 1.10% - 29.30% (15.35%) |
| | | | | | | Probability of default | | 0.13% - 4.15% (1.51%) |
| | | | | | | Loss severity | | 15.00% - 95.00% (32.96%) |
| | | | | | | Discount rate | | 1.35% - 9.43% (5.89%) |
The significant unobservable inputs impacting the fair value measurement of private label residential MBS and CMOs include voluntary prepayment rates, probability of default, loss severity given default and discount rates. Generally, increases in
BANKUNITED, INC. AND SUBSIDIARIES
NOTES TO CONSOLIDATED FINANCIAL STATEMENTS - UNAUDITED
September 30, 2017
probability of default, loss severity or discount rates would result in a lower fair value measurement. Alternatively, decreases in probability of default, loss severity or discount rates would result in a higher fair value measurement. For securities with less favorable credit characteristics, decreases in voluntary prepayment speeds may be interpreted as a deterioration in the overall credit quality of the underlying collateral and as such, lead to lower fair value measurements. The fair value measurements of those securities with higher levels of subordination will be less sensitive to changes in these unobservable inputs other than discount rates, while securities with lower levels of subordination will show a higher degree of sensitivity to changes in these unobservable inputs other than discount rates. Generally, a change in the assumption used for probability of default is accompanied by a directionally similar change in the assumption used for loss severity given default and a directionally opposite change in the assumption used for voluntary prepayment rate.
The following table provides information about the valuation techniques and significant unobservable inputs used in the valuation of servicing rights as of September 30, 2017 (dollars in thousands):
|
| | | | | | | | | | |
| | | Fair Value at | | Valuation Technique | | Unobservable Input | | Range (Weighted Average) |
| | | September 30, 2017 | | | |
| Residential MSRs | | $ | 18,006 |
| | Discounted cash flow | | Prepayment rate | | 2.76% - 29.96% (12.88%) |
| | | | | | | Discount rate | | 9.50% - 9.58% (9.51%) |
| | | | | | | | | |
| Commercial servicing rights | | $ | 12,130 |
| | Discounted cash flow | | Prepayment rate | | 0.09% - 9.99% (7.81%) |
| | | | | | | Discount rate | | 8.12% - 14.57% (12.48%) |
Increases in prepayment rates or discount rates would result in lower fair value measurements and decreases in prepayment rates or discount rates would result in higher fair value measurements. Although the prepayment rate and the discount rate are not directly interrelated, they generally move in opposite directions.
Assets and liabilities measured at fair value on a non-recurring basis
Following is a description of the methodologies used to estimate the fair values of assets and liabilities that may be measured at fair value on a non-recurring basis, and the level within the fair value hierarchy in which those measurements are typically classified.
Impaired loans, OREOand other repossessed assets—The carrying amount of collateral dependent impaired loans is typically based on the fair value of the underlying collateral, which may be real estate taxi medallions, or other business assets, less estimated costs to sell.sell when repayment is expected to come from the sale of the collateral. The carrying value of OREO is initially measured based on the fair value of the real estate acquired in foreclosure and subsequently adjusted to the lower of cost or estimated fair value, less estimated cost to sell. Fair values of real estate collateral and OREO are typically based on third-party real estate appraisals which utilize market and income approaches to valuation incorporating both observable and unobservable inputs. When current appraisals are not available, the Company may use brokers’ price opinions, home price indices or other available information about changes in real estate market conditions to adjust the latest appraised value available. These adjustments to appraised values may be subjective and involve significant management judgment. The fair value of repossessed assets other than taxi medallions, or collateral consisting of other business assets may be based on third-party appraisals or internal analyses that use market approaches to valuation incorporating primarilya combination of observable and unobservable inputs.
The fair value of New York City taxi medallions is based primarily on an internal analysis that utilizes an income approach to valuation. This analysis utilizes data obtained from the NYTLC about the fleet in general and in some cases, our portfolio specifically, and management's assumptions, based on external data when available, about revenues, costs and expenses, to estimate the value that can reasonably be supported by the cash flow generating capacity of a medallion. We further discount the results of this analysis in recognition of estimated selling costs and declining trends in medallion values. We also consider prices of recent medallion transfers as published by the NYTLC; however, the market for taxi medallions is illiquid and information about the circumstances underlying observed transfers is unavailable, therefore, information about recent transfers is not considered sufficient to establish a reliable estimate of value. The Company's medallion valuations fall within the range of published transfer prices over the last six months. Taxi medallions in municipalities other than New York City are generally valued based on published information about recent transfer prices; the valuation of these assets did not have a material impact on the Company's consolidated financial statements for any period presented as the taxi medallion portfolio is heavily concentrated in New York City.
BANKUNITED, INC. AND SUBSIDIARIES
NOTES TO CONSOLIDATED FINANCIAL STATEMENTS - UNAUDITED
September 30, 2017
Fair value measurements related to collateral dependent impaired loans, OREO and other repossessed assets are generally classified within level 3 of the fair value hierarchy.
Operating lease equipment—Fair values of impaired operating lease equipment are typically based upon discounted
cash flow analyses, considering expected lease rates and estimated end of life residual values, typically obtained from independent appraisals. These fair value measurements are classified within level 3 of the fair value hierarchy.
BANKUNITED, INC. AND SUBSIDIARIES
NOTES TO CONSOLIDATED FINANCIAL STATEMENTS - UNAUDITED
June 30, 2020
The following tables present the carrying value of assets for which non-recurring changes in fair value have been recorded for the periods indicated (in thousands):
| | | | September 30, 2017 | | Losses from Fair Value Changes | June 30, 2020 | | Losses from Fair Value Changes |
| | Level 1 | | Level 2 | | Level 3 | | Total | | Three Months Ended
September 30, 2017 | | Nine Months Ended
September 30, 2017 | Level 1 | | Level 2 | | Level 3 | | Total | | Three Months Ended
June 30, 2020 | | Six Months Ended June 30, 2020 |
| OREO and repossessed assets | $ | — |
| | $ | — |
| | $ | 5,520 |
| | $ | 5,520 |
| | $ | (515 | ) | | $ | (1,534 | ) | $ | — |
| | $ | — |
| | $ | 4,401 |
| | $ | 4,401 |
| | $ | (243 | ) | | $ | (360 | ) |
| Impaired loans | $ | — |
| | $ | — |
| | $ | 107,173 |
| | $ | 107,173 |
| | $ | (35,106 | ) | | $ | (58,073 | ) | $ | — |
| | $ | — |
| | $ | 101,353 |
| | $ | 101,353 |
| | $ | (23,545 | ) | | $ | (42,221 | ) |
| Operating lease equipment | | $ | — |
| | $ | — |
| | $ | 839 |
| | $ | 839 |
| | $ | — |
| | $ | (691 | ) |
| | | | September 30, 2016 | | Losses from Fair Value Changes | June 30, 2019 | | Losses from Fair Value Changes |
| | Level 1 | | Level 2 | | Level 3 | | Total | | Three Months Ended
September 30, 2016 | | Nine Months Ended
September 30, 2016 | Level 1 | | Level 2 | | Level 3 | | Total | | Three Months Ended
June 30, 2019 | | Six Months Ended
June 30, 2019 |
| OREO and repossessed assets | $ | — |
| | $ | — |
| | $ | 7,923 |
| | $ | 7,923 |
| | $ | (372 | ) | | $ | 740 |
| $ | — |
| | $ | — |
| | $ | 1,557 |
| | $ | 1,557 |
| | $ | (203 | ) | | $ | (221 | ) |
| Impaired loans | $ | — |
| | $ | — |
| | $ | 59,678 |
| | $ | 59,678 |
| | $ | (10,623 | ) | | $ | (18,873 | ) | $ | — |
| | $ | — |
| | $ | 15,385 |
| | $ | 15,385 |
| | $ | (529 | ) | | $ | (279 | ) |
Included in the tables above are impaired taxi medallion loans with carrying values of $90.1 million and $39.6 million at September 30, 2017 and September 30, 2016, respectively, the majority of which were in New York City. Losses of $54.3 million and $10.2 million were recognized on impaired taxi medallion loans during the nine months ended September 30, 2017 and 2016, respectively.
Decreases in the value of medallions are largely driven by decreases in revenues generated from the medallions. Inputs that had the most significant impact on the valuation of New York City taxi medallions at September 30, 2017 are presented below:
|
| | |
| Average Amount |
Average fare per trip | $16.12 |
Number of trips per shift | 15.4 |
|
Days worked per month | 25.6 |
|
BANKUNITED, INC. AND SUBSIDIARIES
NOTES TO CONSOLIDATED FINANCIAL STATEMENTS - UNAUDITED
September 30, 2017
The following table presents the carrying value and fair value of financial instruments and the level within the fair value hierarchy in which those measurements are classified at the dates indicated (dollars in thousands):
|
| | | | | | | | | | | | | | | | | |
| | | | June 30, 2020 | | December 31, 2019 |
| | Level | | Carrying Value | | Fair Value | | Carrying Value | | Fair Value |
| Assets: | | | |
| | |
| | |
| | |
|
| Cash and cash equivalents | 1 | | $ | 402,231 |
| | $ | 402,231 |
| | $ | 214,673 |
| | $ | 214,673 |
|
| Investment securities | 1/2 | | $ | 8,693,628 |
| | $ | 8,694,622 |
| | $ | 7,769,237 |
| | $ | 7,769,949 |
|
| Non-marketable equity securities | 2 | | $ | 233,051 |
| | $ | 233,051 |
| | $ | 253,664 |
| | $ | 253,664 |
|
| Loans held for sale | 2 | | $ | 2,623 |
| | $ | 2,802 |
| | $ | 37,926 |
| | $ | 39,731 |
|
| Loans, net | 3 | | $ | 23,568,766 |
| | $ | 24,024,615 |
| | $ | 23,046,317 |
| | $ | 23,350,684 |
|
| Derivative assets | 2 | | $ | 145,802 |
| | $ | 145,802 |
| | $ | 43,686 |
| | $ | 43,686 |
|
| Liabilities: | | | | | | | | | |
| Demand, savings and money market deposits | 2 | | $ | 19,339,621 |
| | $ | 19,339,621 |
| | $ | 17,047,344 |
| | $ | 17,047,344 |
|
| Time deposits | 2 | | $ | 6,730,803 |
| | $ | 6,762,832 |
| | $ | 7,347,247 |
| | $ | 7,377,301 |
|
| Federal funds purchased | 2 | | $ | 100,000 |
| | $ | 100,000 |
| | $ | 100,000 |
| | $ | 100,000 |
|
| FHLB and PPPLF borrowings | 2 | | $ | 4,650,599 |
| | $ | 4,648,739 |
| | $ | 4,480,501 |
| | $ | 4,500,969 |
|
| Notes and other borrowings | 2 | | $ | 722,332 |
| | $ | 779,966 |
| | $ | 429,338 |
| | $ | 473,327 |
|
| Derivative liabilities | 2 | | $ | 52,013 |
| | $ | 52,013 |
| | $ | 19,029 |
| | $ | 19,029 |
|
|
| | | | | | | | | | | | | | | | | |
| | | | September 30, 2017 | | December 31, 2016 |
| | Level | | Carrying Value | | Fair Value | | Carrying Value | | Fair Value |
| Assets: | | | |
| | |
| | |
| | |
|
| Cash and cash equivalents | 1 | | $ | 292,601 |
| | $ | 292,601 |
| | $ | 448,313 |
| | $ | 448,313 |
|
| Investment securities available for sale | 1/2/3 | | 6,893,472 |
| | 6,893,472 |
| | 6,073,584 |
| | 6,073,584 |
|
| Investment securities held to maturity | 3 | | 10,000 |
| | 10,000 |
| | 10,000 |
| | 10,000 |
|
| Non-marketable equity securities | 2 | | 270,239 |
| | 270,239 |
| | 284,272 |
| | 284,272 |
|
| Loans held for sale | 2 | | 31,507 |
| | 35,113 |
| | 41,198 |
| | 45,833 |
|
| Loans: | | | | | | | | | |
| Covered | 3 | | 533,128 |
| | 997,376 |
| | 611,942 |
| | 1,200,291 |
|
| Non-covered | 3 | | 19,918,729 |
| | 19,906,579 |
| | 18,630,499 |
| | 18,713,495 |
|
| FDIC Indemnification asset | 3 | | 349,617 |
| | 168,415 |
| | 515,933 |
| | 256,691 |
|
| Derivative assets | 2 | | 28,334 |
| | 28,334 |
| | 50,232 |
| | 50,232 |
|
| Liabilities: | | | | | | | | | |
| Demand, savings and money market deposits | 2 | | $ | 14,889,543 |
| | $ | 14,889,543 |
| | $ | 13,735,248 |
| | $ | 13,735,248 |
|
| Time deposits | 2 | | 6,333,701 |
| | 6,335,324 |
| | 5,755,642 |
| | 5,759,787 |
|
| FHLB advances | 2 | | 4,871,000 |
| | 4,876,017 |
| | 5,239,348 |
| | 5,244,188 |
|
| Notes and other borrowings | 2 | | 402,828 |
| | 427,748 |
| | 402,809 |
| | 403,733 |
|
| Derivative liabilities | 2 | | 27,076 |
| | 27,076 |
| | 61,562 |
| | 61,562 |
|
The following methods and assumptions were used to estimate the fair value of each class of financial instruments, other than those described above:
Cash and cash equivalents
The carrying value of cash and cash equivalents approximates fair value due to their short-term nature and generally negligible credit risk.
Investment securities held to maturity
Investment securities held to maturity includes one bond issued by the State of Israel, with fair value obtained from a third party pricing service.
Non-marketable equity securities
Non-marketable equity securities include FHLB and FRB stock. There is no market for these securities, which can be liquidated only by redemption by the issuer. These securities are valued at par, which has historically represented the redemption price and is therefore considered to approximate fair value.
Loans held for sale
The fair value of the portion of small business loans guaranteed by U.S. Government agencies being held for sale is estimated using pricing on recent sales of similar loans by the Company in active markets.
BANKUNITED, INC. AND SUBSIDIARIES
NOTES TO CONSOLIDATED FINANCIAL STATEMENTS - UNAUDITED
September 30, 2017
Covered loans
Fair values are estimated based on a discounted cash flow analysis. Estimates of future cash flows incorporate various factors that may include the type of loan and related collateral, estimated collateral values, estimated voluntary prepayment rates, estimated default probability and loss severity given default, whether the interest rate is fixed or variable, term of loan and whether or not the loan is amortizing. The fair values of loans accounted for in pools are estimated on a pool basis. Discount rates for residential loans are based on observable fixed income market data for products with similar credit characteristics.
Non-covered loans
Fair values of residential loans are estimated using a discounted cash flow analysis with discount rates based on yields at which similar loans are trading in the secondary market, which reflect assumptions about credit risk. Fair values of commercial and consumer loans are estimated using a discounted cash flow analysis with discount rates based on interest rates currently being offered for loans with similar terms to borrowers of similar credit quality. The ALLL related to commercial and consumer loans is considered a reasonable estimate of the required adjustment to fair value to reflect the impact of credit risk. This estimate may not represent an exit value as defined in ASC 820.
FDIC indemnification asset
The fair value of the FDIC indemnification asset has been estimated using a discounted cash flow technique incorporating assumptions about the timing and amount of future projected cash payments from the FDIC related to the resolution of covered assets. The factors that impact estimates of future cash flows are similar to those impacting estimated cash flows from covered loans. The discount rate is determined by adjusting the risk free rate to incorporate uncertainty in the estimate of the timing and amount of future cash flows and illiquidity.
Deposits
The fair value of demand deposits, savings accounts and money market deposits is the amount payable on demand at the reporting date. The fair value of time deposits is estimated using a discounted cash flow technique based on rates currently offered for deposits of similar remaining maturities.
FHLB advances
Fair value is estimated by discounting contractual future cash flows using the current rate at which borrowings with similar terms and remaining maturities could be obtained by the Company.
Senior notes
Fair value is estimated based on quoted prices of identical securities in less active markets.
Note 11 Commitments and Contingencies
The Company issues off-balance sheet financial instruments to meet the financing needs of its customers. These financial instruments include commitments to fund loans, unfunded commitments under existing lines of credit, and commercial and standby letters of credit. These commitments expose the Company to varying degrees of credit and market risk which are essentially the same as those involved in extending loans to customers, and are subject to the same credit policies used in underwriting loans. Collateral may be obtained based on the Company’s credit evaluation of the counterparty. The Company’s maximum exposure to credit loss is represented by the contractual amount of these commitments. Unfunded commitments under lines
BANKUNITED, INC. AND SUBSIDIARIES
NOTES TO CONSOLIDATED FINANCIAL STATEMENTS - UNAUDITED
June 30, 2020
Commitments to fund loans
These are agreements to lend funds to customers as long as there is no violation of any condition established in the contract. Commitments to fund loans generally have fixed expiration dates or other termination clauses and may require payment of a fee. Many of these commitments are expected to expire without being funded and, therefore, the total commitment amounts do not necessarily represent future liquidity requirements.
BANKUNITED, INC. AND SUBSIDIARIES
NOTES TO CONSOLIDATED FINANCIAL STATEMENTS - UNAUDITED
September 30, 2017
Unfunded commitments under lines of credit
Unfunded commitments under lines of credit include commercial, commercial real estate, home equity and consumer lines of credit to existing customers.customers, for many of which additional extensions of credit are subject to borrowing base requirements. Some of these commitments may mature without being fully funded.
Commercial and standby letters of credit
Letters of credit are conditional commitments issued by the Company to guarantee the performance of a customer to a third party. These letters of credit are primarily issued to support trade transactions or guarantee arrangements. The credit risk involved in issuing letters of credit is essentially the same as that involved in extending loan facilities to customers.
Total lending related commitments outstanding at SeptemberJune 30, 20172020 were as follows (in thousands):
|
| | | |
| Commitments to fund loans | $ | 770,860 |
|
| Commitments to purchase loans | 733,451 |
|
| Unfunded commitments under lines of credit | 3,145,104 |
|
| Commercial and standby letters of credit | 88,438 |
|
| | $ | 4,737,853 |
|
|
| | | |
| Commitments to fund loans | $ | 417,943 |
|
| Commitments to purchase loans | 287,302 |
|
| Unfunded commitments under lines of credit | 2,361,922 |
|
| Commercial and standby letters of credit | 83,141 |
|
| | $ | 3,150,308 |
|
Legal Proceedings
The Company is involved as plaintiff or defendant in various legal actions arising in the normal course of business. In the opinion of management, based upon advice of legal counsel, the likelihood is remote that the impact of these proceedings, either individually or in the aggregate, would be material to the Company’s consolidated financial position, results of operations or cash flows.
Item 2. Management's Discussion and Analysis of Financial Condition and Results of Operations
The following discussion and analysis is intended to focus on significant matters impacting and changes in the financial condition and results of operations of the Company during the three and ninesix months ended SeptemberJune 30, 20172020 and should be read in conjunction with the consolidated financial statements and notes hereto included in this Quarterly Report on Form 10-Q and BKU's 20162019 Annual Report on Form 10-K for the year ended December 31, 20162019 (the "2016"2019 Annual Report on Form 10-K”).
Forward-Looking Statements
This Quarterly Report on Form 10-Q contains forward-looking statements within the meaning of the Private Securities Litigation Reform Act of 1995 that reflect the Company’s current views with respect to, among other things, future events and financial performance. Words such as “anticipates,” “expects,” “intends,” “plans,” “believes,” “seeks,” “estimates”“estimates,” "future" and similar expressions identify forward-looking statements. These forward-looking statements are based on the historical performance of the Company or on the Company’s current plans, estimates and expectations. The inclusion of this forward-looking information should not be regarded as a representation by the Company that the future plans, estimates or expectations so contemplated will be achieved. Such forward-looking statements are subject to various risks and uncertainties and assumptions relating to the Company’s operations, financial results, financial condition, business prospects, growth strategy and liquidity.liquidity, including as impacted by the COVID-19 pandemic. If one or more of these or other risks or uncertainties materialize, or if the Company’s underlying assumptions prove to be incorrect, the Company’s actual results may vary materially from those indicated in these statements. A number of important factors could cause actual results to differ materially from those indicated by the forward-looking statements, including, but not limited to, the risk factors described in Part II, Item 1A of this Quarterly Report on Form 10- Q and in Part I, Item 1A of the 20162019 Annual Report on Form 10-K.10-K and any subsequent Quarterly Report on Form 10-Q or Current Report on Form
8-K. The Company does not undertake any obligation to publicly update or review any forward looking statement, whether as a result of new information, future developments or otherwise.
Impact of the COVID-19 Pandemic and Our Response
In March 2020, the World Health Organization declared COVID-19 as a global pandemic. The initial response to the pandemic by governmental authorities included implementation of numerous measures attempting to contain the spread and impact of COVID-19 such as travel bans and restrictions, quarantines, shelter in place orders, and limitations on business activities, including in major markets in which the Company and its clients are located or do business. While many of these restrictions are beginning to ease and economic activity has started to resume, the COVID-19 pandemic and these necessary precautionary measures have negatively impacted the global economy, disrupted global supply chains, created significant volatility and disruption in financial markets and led to sharp declines in GDP and increases in unemployment levels. The response of the U.S. Government to the crisis was swift and broad-based. The government has taken a series of actions to support individuals, households and businesses that have been negatively impacted by the economic disruption caused by the pandemic including enactment of the CARES Act. The Federal Reserve also enacted a suite of facilities using its emergency lending powers designed to support liquidity and the flow of credit. Banking regulators reduced reserve requirements and enacted rules designed to support financial institutions in their efforts to work with customers during this time. The situation continues to evolve, and there remains a high level of uncertainty about the future trajectory of the virus and its impact on the economy.
A summary of the effects the COVID-19 pandemic has had on our Company and of our expectations about how our Company may be impacted in the future follows. These matters are discussed in further detail throughout this Form 10-Q.
Our results of operations and financial condition at and for the three and six months ended June 30, 2020 were impacted by the COVID-19 pandemic.
Deteriorating economic conditions and a worsening forward looking economic forecast led to a higher provision for credit losses and ACL during the six months ended June 30, 2020. There continues to be significant uncertainty as to the impact of the COVID-19 crisis on future credit loss expense and future levels of the ACL, but they may be more volatile and may change materially from current levels.
Levels of criticized and classified assets increased at June 30, 2020, largely as a result of the COVID-19 pandemic. Additionally, a significant number of borrowers have requested relief in the form of temporary payment deferrals. Beginning late in the first quarter of 2020 and continuing through the second quarter, risk ratings were re-evaluated for a substantial portion of the commercial portfolio, with a particular focus on portfolio segments we identified for enhanced monitoring and loans for which we granted temporary payment deferrals in light of the COVID-19 pandemic. At June 30, 2020, we had not experienced an increase in non-performing assets as a result of the pandemic. It is difficult to predict when, if, or to what extent levels of non-performing assets and delinquencies will increase as a result of the pandemic, although they may do so. Similarly, charge-offs may increase. These impacts may manifest in a delayed fashion due to the impact of temporary payment deferrals and various forms of government assistance that our borrowers may receive.
The level of loan origination activity, outside of our participation in the PPP, was lower in the second quarter as a result of the pandemic.
Our share price has been negatively impacted by the COVID-19 crisis. We temporarily suspended our share repurchase program, utilizing our capital to provide support to customers through lending and other services.
We raised $300 million in subordinated debt to strengthen our capital position during this challenging economic environment.
Although we took significant measures to prepare for possible disruptions in liquidity, we have not experienced such disruptions to date and continue to have sufficient levels of available liquidity.
The pandemic has impacted our operations. Currently, the substantial majority of our non-branch employees are working remotely. We did not experience any significant operational difficulties, technology failures or outages, or customer service disruptions in our transition to a remote work environment. 76% of our branches remain open to serve customers via drive-through or lobby appointments, operating with reduced hours. Generally, branch locations without drive-through facilities are temporarily closed. We have focused on insuring that our technology systems and internal controls continue to operate effectively in a remote work environment. We have put mechanisms in place to allow us to evaluate all significant modifications to processes and procedures to insure continued effectiveness of our controls. We have not identified any instances in which our control environment has failed to operate effectively.
Customer demand for our products and services, particularly lending products, may be impacted by the impact of the pandemic on their businesses or by social distancing measures. Potential borrowers impacted by the pandemic may no longer meet our underwriting criteria. We expect loan production in many portfolio segments to be muted in the near term as a result of the pandemic.
In response to the pandemic, we have prioritized risk management and implemented a number of measures to support our customers and employees. Specifically, we have:
Activated and continue to operate under our business continuity plan under the leadership of executive management.
Enhanced liquidity monitoring and management protocols.
Maintained a regular cadence of Board of Directors update calls.
Enhanced the level and frequency of pro-active outreach to borrowers and our portfolio management activities.
Segregated certain segments of the loan portfolio for enhanced monitoring.
Enhanced our workout and recovery staffing and processes.
Enhanced our stress testing framework. Results of internal stress testing indicate that we have sufficient capital to withstand an increase in credit losses materially beyond levels currently expected, and to withstand a severe downturn.
Proactively reached out to our critical third party service providers and evaluated their ability to continue to provide support in the current environment. We have experienced no significant service disruptions.
Expanded certain employee benefits and launched a number of programs to keep our employees healthy and engaged.
Enhanced personal protective measures for employees working at our corporate locations and begun planning for the eventual return to office of a larger percentage of our workforce, when conditions permit. We have not yet set a definite date to begin a phased return to office.
Supported our clients through participating in the Small Business Administration’s PPP, and granting payment deferrals and fee waivers on a case-by-case basis.
Temporarily halted new residential foreclosure actions.
We remain confident in our long-term underlying strength and stability, and our ability to navigate these challenging conditions.
Overview
Quarterly Highlights
In evaluating our financial performance, we consider the level of and trends in net interest income, the net interest margin, the cost of deposits, levels and composition of non-interest income and non-interest expense, performance ratios such as the return on average equity and return on average assets and asset quality ratios, particularly for the non-covered portfolio, including the ratio of non-performing loans to total loans, non-performing assets to total assets, trends in criticized and classified assets and portfolio delinquency and charge-off trends. We consider growth in earning assets and deposits, trends in funding mix and cost of funds. We analyze these ratios and trends against our own historical performance, our budgeted performance and the financial condition and performance of comparable financial institutions.
Quarterly highlights include:
Net income for the quarterthree months ended SeptemberJune 30, 20172020 was $67.8$76.5 million, or $0.62$0.80 per diluted share, compared to $50.8$81.5 million, or $0.81 per diluted share, for the three months ended June 30, 2019. For the six months ended June 30, 2020, net income was $45.6 million, or $0.47 per diluted share, for the quarter ended September 30, 2016. For the nine months ended September 30, 2017, net income was $196.5 million, or $1.79 per diluted share, compared to $162.4$147.4 million,, or $1.50$1.45 per diluted share, for the ninesix months ended SeptemberJune 30, 2016. Earnings2019. Results for the ninesix months ended SeptemberJune 30, 2017 generated an annualized return2020 were negatively impacted by the application of the CECL accounting methodology, including the expected impact of COVID-19 on average stockholders' equity of 10.21% and an annualized return on average assets of 0.92%.
the provision for credit losses.Net interest income increasedPPNR improved by $19.5$37.3 million, or 44%, to $241.3$122.3 million for the quarterthree months ended SeptemberJune 30, 2017 from $221.72020 compared to $85.0 million for the quarter ended September 30, 2016. Interest income increased by $39.5 million, driven by increases in the average balances of loans and investment securities outstanding and an increase in the yield on interest earning assets. Interest expense increased by $19.9 million, driven by increases in average interest bearing liabilities and the cost of those liabilities. For the nineimmediately preceding three months ended September 30, 2017, net interest income increasedMarch 31, 2020 and by $68.6$16.2 million, compared to $711.4 million from $642.9$106.1 million for the ninethree months ended SeptemberJune 30, 2016.2019. For the six months ended June 30, 2020 and 2019, PPNR was $207.3 million and $206.6 million, respectively.
The net interest margin, calculated on a tax-equivalent basis, decreasedincreased to 3.62%2.39% for the quarterthree months ended SeptemberJune 30, 20172020 from 3.69% for the quarter ended September 30, 2016 and 3.76%2.35% for the immediately preceding quarterquarter. The net interest margin was 2.52% for the three months ended June 30, 2017. Significant factors contributing to the decline in the net2019. The yield on interest margin included the continued run-off of high-yielding covered loans and an increase inearnings assets declined by 0.44% while the cost of interest bearing liabilities. The net interest margin, calculated on a tax-equivalent basis, was 3.69%liabilities declined by 0.60% for the ninethree months ended SeptemberJune 30, 20172020 compared to 3.75%the three months ended March 31, 2020.
The average cost of total deposits declined to 0.80% for the ninequarter ended June 30, 2020 compared to 1.70% for the quarter ended June 30, 2019. On a spot basis, the APY on total deposits declined to 0.65% at June 30, 2020.
The provision for credit losses totaled $25.4 million for the three months ended SeptemberJune 30, 2016.
Total interest earning assets increased by $6132020. The provision for credit losses was $150.8 million during for the third quarter of 2017. Non-covered loans and leases, including equipment under operating lease, grew by $384 million during the quarter.six months ended June 30, 2020. For the ninethree and six months ended
June 30, 2019, the Company recorded a provision for (recovery of) loan losses, under the incurred loss model, of $(2.7) million and $7.5 million, respectively.
September 30, 2017, total interest earning assets increased by $1.9 billion and non-covered loans and leasesNon-interest bearing demand deposits grew by $1.3 billion.
billion, or 28%, for the three months ended June 30, 2020, to 23% of total deposits compared to 18% of total deposits at March 31, 2020. Total deposits increased by $445 million$1.1 billion during the three months ended June 30, 2020. Growth in non-interest bearing demand deposits for the quarter ended September 30, 2017 to $21.2 billion. For the ninethree months ended SeptemberJune 30, 2017, total deposits increased2020 was positively impacted by $1.7 billion.proceeds from PPP loans.
At September 30, 2017, 96.7% of the non-covered commercial loan portfolio was rated "pass" and substantially all of the non-covered residential portfolio was current. The ratio of non-performing, non-covered loans to total non-covered loans was 1.00% and the ratio of non-performing, non-covered assets to total assets was 0.69% at September 30, 2017. Non-performing taxi medallion loans comprised 0.60% of total non-covered loans and 0.41% of total assets at September 30, 2017.
| |
| • | Loans and leases, including operating lease equipment, grew by $656 million for the three months ended June 30, 2020. Loan and lease growth for the three months ended June 30, 2020 included growth of $827 million in PPP loans and $308 million in mortgage warehouse outstandings, partially offset by expected declines in certain other portfolio segments. We funded over 3,500 PPP loans totaling $876 million during the three months ended June 30, 2020. |
The provision for loan losses for the quarter and nine months ended September 30, 2017 totaled $37.9 million and $63.6 million, respectively, compared to $24.4 million and $42.4 million, respectively, for the comparable periods of the prior year. The most significant reason for these increases in the provision for loan losses was the provision related to the taxi medallion portfolio as discussed further in the sections entitled "Asset Quality" and "Analysis of the Allowance for Loan and Lease Losses."
Gainnet unrealized loss on sale of investment securities available for sale net totaled $26.9improved to $2.6 million forat June 30, 2020 from $249.8 million at March 31, 2020, in response to both declines in market rates and tightening spreads.
Stockholders' equity increased by $238.9 million during the quarterthree months ended SeptemberJune 30, 2017. Substantially all2020 to $2.8 billion. The increase was driven by the recovery of these gains$180.6 million in accumulated other comprehensive income related to salesthe reduction in unrealized losses on investment securities available for sale and by the retention of securities formerly covered under the Commercial Shared-Loss Agreement.
The Company’s capital ratios exceeded all regulatory “well capitalized” guidelines, with a Tier 1 leverage ratio of 8.6%, CET1 and Tier 1 risk-based capital ratios of 11.9% and a Total risk-based capital ratio of 12.7% at Septemberearnings. At June 30, 2017.
Book value per common share grew to $24.56 at September 30, 2017, a 7.8% increase from September 30, 2016. Tangible2020, book value per common share increased by 8.1% over the same period, to $23.83 at September 30, 2017.
Hurricanes Irma and Harvey
On September 10, 2017, Hurricane Irma made landfall in Florida as a Category 4 hurricane affecting some areas of the state with significant flooding, wind damagetangible book value per common share were $29.81 and power outages. In addition, the Bank has a limited number of customers and collateral properties located in areas of Texas that were impacted by Hurricane Harvey during August, 2017.
Loan and Lease Portfolio
The Company has assessed the potential impact of the hurricanes on the value of collateral underlying our loans and the ability of borrowers to repay their obligations to the Bank. We believe the storms did not materially impact the ability of the substantial majority of our borrowers to repay their loans; however, uncertainty remains as to the ultimate impact of these events on the level of our loan losses and our results of operations.
In order to assess the impact of these hurricanes on our loan and lease portfolio, the Company performed an extensive review of loans with borrowers and/or collateral located in areas impacted by these storms. This analysis entailed the identification of and direct communication with borrowers located in impacted areas to determine the population of borrowers that may have been significantly impacted as well as consideration of factors including but not limited to level and type of insurance coverage, collateral and lien position and the financial condition of the borrower.
Commercial and commercial real estate loans with an aggregate UPB of approximately $7.1 billion at September 30, 2017 were determined to be either made to borrowers that have significant business operations in or secured by collateral in areas that were potentially impacted by the hurricanes. Substantially all of those borrowers had been contacted as of October 3, 2017 and responses were considered in the determination of the ALLL as of September 30, 2017. As of October 31, 2017, commercial loans with an aggregate UPB of $22.2 million had been downgraded to criticized or classified status as a result of this analysis. Residential mortgage and other consumer loans with a carrying value of approximately $977 million at September 30, 2017, of which $315 million are covered loans, were determined to be either made to borrowers living in or secured by collateral in areas potentially impacted by the hurricanes; such loans with a carrying value of approximately $902 million, of which $312 million are covered loans, were determined to be in severely impacted areas, based on FEMA’s designation as “individual assistance” areas (“FEMA designated areas”). As of October 31, 2017, 74% of borrowers in FEMA designated areas had been contacted or property inspections conducted to assist in assessing the extent of potential damage to underlying collateral. During the quarter ended September 30, 2017, the Company recorded a loan loss provision of $5.4 million related to the impact of Hurricanes Irma and Harvey.
Impairment of Other Assets
Management also considered the impact of the hurricanes in our analysis of investment securities for OTTI, as well as our evaluation of potential impairment of our investment in equipment under operating lease, LIHTC partnerships, servicing assets and OREO at September 30, 2017 and determined there was no potentially material impact.
Fees, Operations and Facilities
To help those affected by Hurricane Irma, the Company waived or refunded certain fees such as overdraft, NSF and uncollected fees on consumer deposit accounts and late fees on residential mortgage, consumer and small business loans for consumer and small business customers in FEMA designated disaster areas for the period September 10, 2017 through September 30, 2017. In addition, certain residential mortgage and SBA loan customers impacted by the storm may be eligible for assistance in the form of temporary payment deferrals. Waived and refunded fees were not significant.
The Company’s operations and facilities were not materially impacted by Hurricane Irma. The Company continued operating throughout the storm although all of our Florida branch locations were closed from September 8, 2017 through September 11, 2017. The majority of our Florida branch locations and our Miami Lakes corporate headquarters re-opened on September 12, 2017 and all of our Florida branch locations re-opened prior to September 30, 2017.$28.97, respectively.
During the quarterthree months ended SeptemberJune 30, 2017,2020, the Company recorded expensescompleted an underwritten public offering of $0.6$300 million related primarily to facilities damage and employee relocation and assistance. We do not expect future expenses related to facilities damage to be material to the Company.
Community Assistance
To help with the recovery effortsaggregate principal amount of the communities in which we operate, work and live, BankUnited has made donations totaling $100,000 to non-profit organizations focused on recovery and relief efforts in Florida. These organizations were selected based on their ability to immediately deploy resources directly to targeted affected areas.its 5.125% subordinated notes, augmenting Tier 2 capital.
Results of Operations
Net Interest Income
Net interest income is the difference between interest earned on interest earning assets and interest incurred on interest bearing liabilities and is the primary driver of core earnings. Net interest income is impacted by the relative mix of interest earning assets and interest bearing liabilities, the ratio of interest earning assets to total assets and of interest bearing liabilities to total funding sources, movements in market interest rates, the shape of the yield curve, levels of non-performing assets and pricing pressure from competitors.
The mix of interest earning assets is influenced by loan demand, market and competitive conditions in our primary lending markets, and by management's continual assessment of the rate of return and relative risk associated with various classes of earning assets.assets and liquidity considerations. The mix of interest bearing liabilities is influenced by the Company's liquidity profile, management's assessment of the desire for lower cost funding sources weighed against relationships with customers and growth requirementsexpectations, our ability to attract and is impacted byretain core deposit relationships, competition for deposits in the Company's markets and the availability and pricing of other sources of funds.
Net interest income is also impacted by the accounting for ACI loans acquired in conjunction with the FSB Acquisition. ACI loans were initially recorded at fair value, measured based on the present value of expected cash flows. The excess of expected cash flows over carrying value, known as accretable yield, is recognized as interest income over the lives of the underlying loans. The positive impact of accretion related to ACI loans on the net interest margin and the interest rate spread is expected to continue to decline as ACI loans comprise a declining percentage of total loans. The proportion of total loans represented by ACI loans is declining as the ACI loans are resolved and new loans are added to the portfolio. ACI loans represented 2.5% and 3.0% of total loans, including premiums, discounts and deferred fees and costs, at September 30, 2017 and December 31, 2016, respectively. As this trend continues, assuming an otherwise stable interest rate environment, we would expect our net interest margin and interest rate spread to decrease as covered loans are resolved.
The impact of ACI loan accounting on net interest income makes it difficult to compare our net interest margin and interest rate spread to those reported by other financial institutions.
The following table presents,tables present, for the periods indicated, information about (i) average balances, the total dollar amount of taxable equivalent interest income from earning assets and the resultant average yields; (ii) average balances, the total dollar amount of interest expense on interest bearing liabilities and the resultant average rates; (iii) net interest income; (iv) the interest rate spread; and (v) the net interest margin. Non-accrual and restructured loans are included in the average balances presented in this table; however, interest income foregone on non-accrual loans is not included. Interest income, yields, spread and margin have been calculated on a tax-equivalent basis for loans and investment securities that are exempt from federal income taxes, at a federal tax rate of 35.0%21% (dollars in thousands):
|
| | | | | | | | | | | | | | | | | | | | | |
| | Three Months Ended September 30, |
| | 2017 | | 2016 |
| | Average
Balance | | Interest (1) | | Yield/
Rate (1)(2) | | Average
Balance | | Interest (1) | | Yield/
Rate (1)(2) |
| Assets: | | | | | | | | | | | |
| Interest earning assets: | |
| | |
| | |
| | |
| | |
| | |
|
| Non-covered loans | $ | 19,710,115 |
| | $ | 187,928 |
| | 3.79 | % | | $ | 17,813,925 |
| | $ | 158,963 |
| | 3.56 | % |
| Covered loans | 518,026 |
| | 73,452 |
| | 56.70 | % | | 700,884 |
| | 74,487 |
| | 42.50 | % |
| Total loans | 20,228,141 |
| | 261,380 |
| | 5.15 | % | | 18,514,809 |
| | 233,450 |
| | 5.03 | % |
Investment securities (3) | 7,002,615 |
| | 55,046 |
| | 3.14 | % | | 5,898,382 |
| | 42,262 |
| | 2.87 | % |
| Other interest earning assets | 545,224 |
| | 3,777 |
| | 2.75 | % | | 557,490 |
| | 3,036 |
| | 2.17 | % |
| Total interest earning assets | 27,775,980 |
| | 320,203 |
| | 4.60 | % | | 24,970,681 |
| | 278,748 |
| | 4.45 | % |
| Allowance for loan and lease losses | (160,231 | ) | | | | | | (139,284 | ) | | | | |
| Non-interest earning assets | 1,699,912 |
| | | | | | 1,884,894 |
| | | | |
| Total assets | $ | 29,315,661 |
| | | | | | $ | 26,716,291 |
| | | | |
| Liabilities and Stockholders' Equity: | | | | | | | | | | | |
| Interest bearing liabilities: | | | | | | | | | | | |
| Interest bearing demand deposits | $ | 1,590,206 |
| | 3,415 |
| | 0.85 | % | | $ | 1,437,677 |
| | 2,224 |
| | 0.62 | % |
| Savings and money market deposits | 9,968,512 |
| | 21,964 |
| | 0.87 | % | | 8,349,281 |
| | 12,974 |
| | 0.62 | % |
| Time deposits | 6,290,056 |
| | 20,540 |
| | 1.30 | % | | 5,567,909 |
| | 15,770 |
| | 1.13 | % |
| Total interest bearing deposits | 17,848,774 |
| | 45,919 |
| | 1.02 | % | | 15,354,867 |
| | 30,968 |
| | 0.80 | % |
| FHLB advances | 4,924,325 |
| | 16,946 |
| | 1.37 | % | | 5,143,003 |
| | 11,956 |
| | 0.92 | % |
| Notes and other borrowings | 402,828 |
| | 5,314 |
| | 5.28 | % | | 403,590 |
| | 5,322 |
| | 5.27 | % |
| Total interest bearing liabilities | 23,175,927 |
| | 68,179 |
| | 1.17 | % | | 20,901,460 |
| | 48,246 |
| | 0.92 | % |
| Non-interest bearing demand deposits | 3,036,046 |
| | | | | | 2,981,017 |
| | | | |
| Other non-interest bearing liabilities | 468,735 |
| | | | | | 460,514 |
| | | | |
| Total liabilities | 26,680,708 |
| | | | | | 24,342,991 |
| | | | |
| Stockholders' equity | 2,634,953 |
| | | | | | 2,373,300 |
| | | | |
| Total liabilities and stockholders' equity | $ | 29,315,661 |
| | | | | | $ | 26,716,291 |
| | | | |
| Net interest income | | | $ | 252,024 |
| | | | | | $ | 230,502 |
| | |
| Interest rate spread | | | | | 3.43 | % | | | | | | 3.53 | % |
| Net interest margin | | | | | 3.62 | % | | | | | | 3.69 | % |
|
| | | | | | | | | | | | | | | | | | | | | | | | | | | | | | | | |
| | Three Months Ended June 30, | | Three Months Ended March 31, | | Three Months Ended June 30, |
| | 2020 | | 2020 | | 2019 |
| | Average
Balance | | Interest (1)(2) | | Yield/
Rate (1)(2) | | Average
Balance | | Interest (1)(2) | | Yield/
Rate (1)(2) | | Average
Balance | | Interest (1)(2) | | Yield/
Rate (1)(2) |
| Assets: | | | | | | | | | | | | | | | | | |
| Interest earning assets: | |
| | |
| | |
| | | | | | | | |
| | |
| | |
|
| Loans | $ | 23,534,684 |
| | $ | 217,691 |
| | 3.71 | % | | $ | 22,850,065 |
| | 238,108 |
| | 4.18 | % | | $ | 22,505,138 |
| | $ | 253,766 |
| | 4.52 | % |
Investment securities (3) | 8,325,217 |
| | 51,684 |
| | 2.48 | % | | 8,107,649 |
| | 56,951 |
| | 2.81 | % | | 8,187,518 |
| | 73,867 |
| | 3.61 | % |
| Other interest earning assets | 765,848 |
| | 2,908 |
| | 1.53 | % | | 646,628 |
| | 3,720 |
| | 2.31 | % | | 525,563 |
| | 5,069 |
| | 3.87 | % |
| Total interest earning assets | 32,625,749 |
| | 272,283 |
| | 3.35 | % | | 31,604,342 |
| | 298,779 |
| | 3.79 | % | | 31,218,219 |
| | 332,702 |
| | 4.27 | % |
| Allowance for credit losses | (254,396 | ) | | | | | | (138,842 | ) | | | | | | (117,206 | ) | | | | |
| Non-interest earning assets | 1,976,398 |
| | | | | | 1,749,752 |
| | | | | | 1,589,286 |
| | | | |
| Total assets | $ | 34,347,751 |
| | | | | | $ | 33,215,252 |
| | | | | | $ | 32,690,299 |
| | | | |
| Liabilities and Stockholders' Equity: | | | | | | | | | | | | | | | | | |
| Interest bearing liabilities: | | | | | | | | | | | | | | | | | |
| Interest bearing demand deposits | $ | 2,448,545 |
| | 4,722 |
| | 0.78 | % | | $ | 2,173,628 |
| | 6,959 |
| | 1.29 | % | | $ | 1,773,912 |
| | 6,225 |
| | 1.41 | % |
| Savings and money market deposits | 10,450,310 |
| | 17,447 |
| | 0.67 | % | | 10,412,202 |
| | 37,756 |
| | 1.46 | % | | 10,924,580 |
| | 52,191 |
| | 1.92 | % |
| Time deposits | 7,096,097 |
| | 28,018 |
| | 1.59 | % | | 7,510,070 |
| | 38,107 |
| | 2.04 | % | | 6,944,862 |
| | 41,571 |
| | 2.40 | % |
| Total interest bearing deposits | 19,994,952 |
| | 50,187 |
| | 1.01 | % | | 20,095,900 |
| | 82,822 |
| | 1.66 | % | | 19,643,354 |
| | 99,987 |
| | 2.04 | % |
| Short term borrowings | 119,835 |
| | 32 |
| | 0.11 | % | | 94,066 |
| | 367 |
| | 1.57 | % | | 127,242 |
| | 771 |
| | 2.42 | % |
| FHLB and PPPLF borrowings | 4,961,376 |
| | 21,054 |
| | 1.71 | % | | 4,414,830 |
| | 25,084 |
| | 2.29 | % | | 5,028,418 |
| | 30,263 |
| | 2.41 | % |
| Notes and other borrowings | 493,278 |
| | 6,168 |
| | 5.00 | % | | 429,099 |
| | 5,290 |
| | 4.93 | % | | 405,726 |
| | 5,325 |
| | 5.25 | % |
| Total interest bearing liabilities | 25,569,441 |
| | 77,441 |
| | 1.22 | % | | 25,033,895 |
| | 113,563 |
| | 1.82 | % | | 25,204,740 |
| | 136,346 |
| | 2.17 | % |
| Non-interest bearing demand deposits | 5,313,009 |
| | | | | | 4,368,553 |
| | | | | | 3,932,716 |
| | | | |
| Other non-interest bearing liabilities | 820,439 |
| | | | | | 749,100 |
| | | | | | 601,703 |
| | | | |
| Total liabilities | 31,702,889 |
| | | | | | 30,151,548 |
| | | | | | 29,739,159 |
| | | | |
| Stockholders' equity | 2,644,862 |
| | | | | | 3,063,704 |
| | | | | | 2,951,140 |
| | | | |
| Total liabilities and stockholders' equity | $ | 34,347,751 |
| | | | | | $ | 33,215,252 |
| | | | | | $ | 32,690,299 |
| | | | |
| Net interest income | | | $ | 194,842 |
| | | | | | $ | 185,216 |
| | | | | | $ | 196,356 |
| | |
| Interest rate spread | | | | | 2.13 | % | | | | | | 1.97 | % | | | | | | 2.10 | % |
| Net interest margin | | | | | 2.39 | % | | | | | | 2.35 | % | | | | | | 2.52 | % |
| |
| (1) | On a tax-equivalent basis.basis where applicable. The tax-equivalent adjustment for tax-exempt loans was $7.6$3.8 million and $6.2$4.4 million, and the tax-equivalent adjustment for tax-exempt investment securities was $3.2$0.8 million and $2.6$1.1 million for the three months ended SeptemberJune 30, 20172020 and 2016,2019, respectively. |
| |
| (3) | At fair value except for securities held to maturity. |
|
| | | | | | | | | | | | | | | | | | | | | |
| | Nine Months Ended September 30, |
| | 2017 | | 2016 |
| | Average
Balance | | Interest (1) | | Yield/
Rate (1)(2) | | Average
Balance | | Interest (1) | | Yield/
Rate (1)(2) |
| Assets: | | | | | | | | | | | |
| Interest earning assets: | |
| | |
| | |
| | |
| | |
| | |
|
| Non-covered loans | $ | 19,169,479 |
| | $ | 535,926 |
| | 3.73 | % | | $ | 16,876,786 |
| | $ | 452,525 |
| | 3.58 | % |
| Covered loans | 560,934 |
| | 225,194 |
| | 53.54 | % | | 746,709 |
| | 226,659 |
| | 40.48 | % |
| Total loans | 19,730,413 |
| | 761,120 |
| | 5.15 | % | | 17,623,495 |
| | 679,184 |
| | 5.14 | % |
Investment securities (3) | 6,569,553 |
| | 151,337 |
| | 3.07 | % | | 5,551,249 |
| | 117,478 |
| | 2.82 | % |
| Other interest earning assets | 557,623 |
| | 10,606 |
| | 2.54 | % | | 531,245 |
| | 8,850 |
| | 2.22 | % |
| Total interest earning assets | 26,857,589 |
| | 923,063 |
| | 4.59 | % | | 23,705,989 |
| | 805,512 |
| | 4.53 | % |
| Allowance for loan and lease losses | (157,015 | ) | | | | | | (133,280 | ) | | | | |
| Non-interest earning assets | 1,754,499 |
| | | | | | 1,946,846 |
| | | | |
| Total assets | $ | 28,455,073 |
| | | | | | $ | 25,519,555 |
| | | | |
| Liabilities and Stockholders' Equity: | | | | | | | | | | | |
| Interest bearing liabilities: | | | | | | | | | | | |
| Interest bearing demand deposits | $ | 1,564,229 |
| | 8,913 |
| | 0.76 | % | | $ | 1,341,218 |
| | 6,140 |
| | 0.61 | % |
| Savings and money market deposits | 9,557,907 |
| | 55,741 |
| | 0.78 | % | | 8,203,676 |
| | 37,285 |
| | 0.61 | % |
| Time deposits | 5,988,433 |
| | 55,507 |
| | 1.24 | % | | 5,177,191 |
| | 43,002 |
| | 1.11 | % |
| Total interest bearing deposits | 17,110,569 |
| | 120,161 |
| | 0.94 | % | | 14,722,085 |
| | 86,427 |
| | 0.78 | % |
| FHLB advances | 4,889,578 |
| | 44,262 |
| | 1.21 | % | | 4,698,492 |
| | 35,972 |
| | 1.02 | % |
| Notes and other borrowings | 402,821 |
| | 15,947 |
| | 5.28 | % | | 403,213 |
| | 15,967 |
| | 5.28 | % |
| Total interest bearing liabilities | 22,402,968 |
| | 180,370 |
| | 1.08 | % | | 19,823,790 |
| | 138,366 |
| | 0.93 | % |
| Non-interest bearing demand deposits | 3,034,682 |
| | | | | | 2,944,861 |
| | | | |
| Other non-interest bearing liabilities | 443,430 |
| | | | | | 431,921 |
| | | | |
| Total liabilities | 25,881,080 |
| | | | | | 23,200,572 |
| | | | |
| Stockholders' equity | 2,573,993 |
| | | | | | 2,318,983 |
| | | | |
| Total liabilities and stockholders' equity | $ | 28,455,073 |
| | | | | | $ | 25,519,555 |
| | | | |
| Net interest income | | | $ | 742,693 |
| | | | | | $ | 667,146 |
| | |
| Interest rate spread | | | | | 3.51 | % | | | | | | 3.60 | % |
| Net interest margin | | | | | 3.69 | % | | | | | | 3.75 | % |
|
| | | | | | | | | | | | | | | | | | | | | |
| | Six Months Ended June 30, |
| | 2020 | | 2019 |
| | Average
Balance | | Interest (1)(2) | | Yield/
Rate (1)(2) | | Average
Balance | | Interest (1)(2) | | Yield/
Rate (1)(2) |
| Assets: | | | | | | | | | | | |
| Interest earning assets: | |
| | |
| | |
| | |
| | |
| | |
|
| Loans | $ | 23,192,374 |
| | $ | 455,799 |
| | 3.94 | % | | $ | 22,241,262 |
| | $ | 498,776 |
| | 4.51 | % |
Investment securities (3) | 8,216,433 |
| | 108,635 |
| | 2.64 | % | | 8,353,116 |
| | 151,474 |
| | 3.63 | % |
| Other interest earning assets | 706,238 |
| | 6,628 |
| | 1.89 | % | | 510,933 |
| | 9,921 |
| | 3.91 | % |
| Total interest earning assets | 32,115,045 |
| | 571,062 |
| | 3.57 | % | | 31,105,311 |
| | 660,171 |
| | 4.26 | % |
| Allowance for credit losses | (196,619 | ) | | | | | | (114,157 | ) | | | | |
| Non-interest earning assets | 1,863,074 |
| | | | | | 1,596,565 |
| | | | |
| Total assets | $ | 33,781,500 |
| | | | | | $ | 32,587,719 |
| | | | |
| Liabilities and Stockholders' Equity: | | | | | | | | | | | |
| Interest bearing liabilities: | | | | | | | | | | | |
| Interest bearing demand deposits | $ | 2,311,086 |
| | 11,681 |
| | 1.02 | % | | $ | 1,738,393 |
| | 11,864 |
| | 1.38 | % |
| Savings and money market deposits | 10,431,256 |
| | 55,203 |
| | 1.06 | % | | 11,187,818 |
| | 105,008 |
| | 1.89 | % |
| Time deposits | 7,303,083 |
| | 66,125 |
| | 1.82 | % | | 6,926,041 |
| | 80,536 |
| | 2.34 | % |
| Total interest bearing deposits | 20,045,425 |
| | 133,009 |
| | 1.33 | % | | 19,852,252 |
| | 197,408 |
| | 2.01 | % |
| Short term borrowings | 106,951 |
| | 399 |
| | 0.75 | % | | 132,282 |
| | 1,596 |
| | 2.41 | % |
| FHLB and PPPLF borrowings | 4,688,102 |
| | 46,138 |
| | 1.98 | % | | 4,845,337 |
| | 57,637 |
| | 2.40 | % |
| Notes and other borrowings | 461,188 |
| | 11,458 |
| | 4.97 | % | | 405,547 |
| | 10,633 |
| | 5.24 | % |
| Total interest bearing liabilities | 25,301,666 |
| | 191,004 |
| | 1.52 | % | | 25,235,418 |
| | 267,274 |
| | 2.13 | % |
| Non-interest bearing demand deposits | 4,840,781 |
| | | | | | 3,769,828 |
| | | | |
| Other non-interest bearing liabilities | 784,770 |
| | | | | | 629,123 |
| | | | |
| Total liabilities | 30,927,217 |
| | | | | | 29,634,369 |
| | | | |
| Stockholders' equity | 2,854,283 |
| | | | | | 2,953,350 |
| | | | |
| Total liabilities and stockholders' equity | $ | 33,781,500 |
| | | | | | $ | 32,587,719 |
| | | | |
| Net interest income | | | $ | 380,058 |
| | | | | | $ | 392,897 |
| | |
| Interest rate spread | | | | | 2.05 | % | | | | | | 2.13 | % |
| Net interest margin | | | | | 2.37 | % | | | | | | 2.53 | % |
| |
| (1) | On a tax-equivalent basis.basis where applicable. The tax-equivalent adjustment for tax-exempt loans was $21.5$7.5 million and $16.7$8.8 million, and the tax-equivalent adjustment for tax-exempt investment securities was $9.7$1.6 million and $7.5$2.3 million for the ninesix months ended SeptemberJune 30, 20172020 and 2016,2019, respectively. |
| |
| (3) | At fair value except for securities held to maturity. |
Three months ended SeptemberJune 30, 20172020 compared to the immediately preceding three months ended September 30, 2016March 31, 2020
Net interest income, calculated on a tax-equivalent basis, was $252.0$194.8 million for the three months ended SeptemberJune 30, 20172020 compared to $230.5$185.2 million for the three months ended September 30, 2016,March 31, 2020, an increase of $21.5 million. The increase in net interest income was$9.6 million, comprised of an increasedecreases in tax-equivalent interest income of $41.5 million, offset by an increase inand interest expense of $19.9 million.
$26.5 million and $36.1 million, respectively. The increasedecreases in both tax-equivalent interest income was comprised primarily of a $27.9 million increase inand interest incomeexpense resulted from loans and a $12.8 million increase in interest income from investment securities.
Increased interest income from loans was attributable to a $1.7 billion increase in the average balance outstanding and a 0.12% increase in the tax-equivalent yield to 5.15% for the three months ended September 30, 2017 from 5.03% for the three months ended September 30, 2016. Factors contributing to the increase in the yield on loans included:
The tax-equivalent yield on non-covered loans was 3.79% for the three months ended September 30, 2017 compared to 3.56% for the three months ended September 30, 2016. The most significant factor contributing to the increased yield on non-covered loans was increasesdecreases in market interest rates.
Interest income on covered loans totaled $73.5 million and $74.5 million for the three months ended September 30, 2017 and 2016, respectively. The tax-equivalent yield on those loans increased to 56.70% for the three months ended September 30, 2017 from 42.50% for the three months ended September 30, 2016. The increase in the yield on covered loans resulted primarily from improvements in expected cash flows for ACI loans.
The impact on the overall yield on loans of increased yields on both covered and non-covered loans considered individually was somewhatrates, partially offset by the continued increase in non-covered loans, with yields lower than those on covered loans, as a percentageimpact of total loans.
The average balance of investment securities increased by $1.1 billion for the three months ended September 30, 2017 from the three months ended September 30, 2016 while the tax-equivalent yield increased to 3.14% from 2.87%. The most significant factor contributing to the increase in the tax-equivalent yield were increases in coupon rates on floating-rate securities.
The components of the increase in interest expense for the three months ended September 30, 2017 as compared to the three months ended September 30, 2016 were a $15.0 million increase in interest expense on deposits and a $5.0 million increase in interest expense on FHLB advances.
The increase in interest expense on deposits was attributable to an increase of $2.5 billion in average interest bearing depositsearnings assets and an increase in the average cost of interest bearing deposits of 0.22% to 1.02% for the three months ended September 30, 2017 from 0.80% for the three months ended September 30, 2016. These cost increases were generally driven by growth of deposits in competitive markets and a rising market interest rate environment.
The increase in interest expense on FHLB advances reflected an increase in the average cost of advances of 0.45% to 1.37% for the three months ended September 30, 2017 from 0.92% for the three months ended September 30, 2016. The increase in cost was driven by increased market rates and to a lesser extent, an extension of maturities through interest rate swaps.liabilities.
The net interest margin, calculated on a tax-equivalent basis, was 2.39% for the three months ended SeptemberJune 30, 2017 was 3.62% as2020, compared to 3.69%2.35% for the three months ended September 30, 2016.March 31, 2020. The interest rate spread decreasedincreased to 3.43%2.13% for the quarter ended June 30, 2020 from 1.97% for the three months ended September 30, 2017 from 3.53% for the three months ended September 30, 2016. TheMarch 31, 2020 as declines in net interest margin and interest rate spread resulted primarily from the cost of interest-bearinginterest bearing liabilities increasing by more thanoutpaced declines in the yield on interest earning assets. This difference was driven primarily by
Offsetting factors contributing to the decline in covered loans as a percentage of total loans. Future trendsincrease in the net interest margin will be impacted by changes in market interest rates, including changesfor the three months ended June 30, 2020 compared to the three months ended March 31, 2020 included:
The most significant factor leading to the increase in the shape ofnet interest margin for the yield curve, byquarter ended June 30, 2020 compared to the mix of interest earning assets, includingthree months ended March 31, 2020 was the decline in covered loansthe cost of deposits. The average rate on interest bearing deposits decreased to 1.01% for the three months ended June 30, 2020, from 1.66% for the three months ended March 31, 2020, reflecting initiatives taken to lower rates paid on deposits following actions by the Fed in the fourth quarter of 2019 and first quarter of 2020. We expect the cost of interest bearing deposits to continue to decline.
For the three months ended June 30, 2020, the increase in average non-interest bearing demand deposits as a percentage of average total loans, and by the Company's ability to managedeposits also positively impacted the cost of funds while growing deposits in competitive markets.and the net interest margin.
NineThe average rate paid on borrowings declined to 1.97% for the three months ended SeptemberJune 30, 20172020, from 2.51% for the three months ended March 31, 2020, reflecting declines in rates on overnight and short-term FHLB advances as well as the impact of PPPLF borrowings priced at rates lower than the average rate paid by the Company on its borrowings.
The tax-equivalent yield on loans decreased to 3.71% for the three months ended June 30, 2020, from 4.18% for the three months ended March 31, 2020. The most significant factor contributing to this decrease was the decline in benchmark interest rates, which impacted the level of prepayments of higher rate loans as well as rates earned on both existing floating rate assets and new production. The addition of lower yielding PPP loans to the balance sheet also contributed to the decline in the yield on loans.
The tax-equivalent yield on investment securities decreased to 2.48% for the three months ended June 30, 2020 from 2.81% for the three months ended March 31, 2020. The most significant factor contributing to this decrease was the impact of decreases in benchmark interest rates on both existing floating rate assets and new securities added to the portfolio.
Three and six months ended June 30, 2020 compared to ninethe three and six months ended SeptemberJune 30, 20162019
Net interest income, calculated on a tax-equivalent basis, was $742.7$194.8 million for the ninethree months ended SeptemberJune 30, 20172020 compared to $667.1$196.4 million for the ninethree months ended SeptemberJune 30, 2016, an increase2019, a decrease of $75.5$1.5 million. Net interest income, calculated on a tax-equivalent basis, was $380.1 million for the six months ended June 30, 2020 compared to $392.9 million for the six months ended June 30, 2019, a decrease of $12.8 million. The increasedecreases in net interest income waswere comprised of an increasedecreases in tax-equivalent interest income of $117.6$60.4 million offset by an increaseand $89.1 million and decreases in interest expense of $42.0 million.$58.9 million and $76.3 million for the three and six months ended June 30, 2020, respectively, compared to the three and six months ended June 30, 2019.
The increasedecreases in tax-equivalent interest income was comprised primarily of an $81.9 million increase in interest income from loans and a $33.9 million increase in interest income from investment securities.
Increased interest income from loans was attributable to a $2.1 billion increase in the average balance and a 0.01% increase in the tax-equivalent yield to 5.15% for the nine months ended September 30, 2017 from 5.14% for the nine months ended September 30, 2016. Offsetting factors contributing to the relatively steady yield on loans included:
Although the yield on non-covered loans increased to 3.73% for the nine months ended September 30, 2017 from 3.58% for the nine months ended September 30, 2016, lower-yielding non-covered loans comprised a greater percentage of the portfolio for the nine months ended September 30, 2017 than for the corresponding period in 2016. Non-covered loans represented 97.2% of the average balance of loans outstanding for the nine months ended September 30, 2017 compared to 95.8% for the nine months ended September 30, 2016.
Interest income on covered loans totaled $225.2 million and $226.7 million for the nine months ended September 30, 2017 and 2016, respectively. The tax-equivalent yield on those loans increased to 53.54% for the nine months ended September 30, 2017 from 40.48% for the nine months ended September 30, 2016.
The average balance of investment securities increased by $1.0 billion for the nine months ended September 30, 2017 from the nine months ended September 30, 2016 while the tax-equivalent yield increased to 3.07% from 2.82%.
The components of the increase in interest expense forresulted from decreases in market interest rates, partially offset by the nine months ended September 30, 2017 as compared to the nine months ended September 30, 2016 were a $33.7 million increase in interest expense on deposits and an $8.3 million increase in interest expense on FHLB advances.
The increase in interest expense on deposits was attributable to an increaseimpact of $2.4 billionincreases in average interest bearing depositsearning assets and an increase in the average cost of interest bearing deposits of 0.16% to 0.94% for the nine months ended September 30, 2017 from 0.78% for the nine months ended September 30, 2016. The increase in interest expense on FHLB advances was primarily a result of an increase in the average cost of advances of 0.19% to 1.21% for the nine months ended September 30, 2017 from 1.02% for the nine months ended September 30, 2016.
Factors contributing to the changes in yields and costs for the nine month periods were generally consistent with those for the three month periods discussed above.liabilities.
The net interest margin, calculated on a tax-equivalent basis, was 2.39% for the ninethree months ended SeptemberJune 30, 2017 was 3.69% as2020, compared to 3.75%2.52% for the ninethree months ended SeptemberJune 30, 2016.2019. The interest rate spread decreasedincreased to 3.51%2.13% for the ninequarter ended June 30, 2020 from 2.10% for the three months ended SeptemberJune 30, 2017 from 3.60% for2019 as declines in the nine months ended September 30, 2016. Thecost of interest bearing liabilities outpaced declines in the yield on interest earning assets.
Offsetting factors contributing to the decrease in the net interest margin for the three and six months ended June 30, 2020 compared to comparable periods of the prior year included:
The average rate on interest bearing deposits decreased to 1.01% and 1.33% for the three and six months ended June 30, 2020, from 2.04% and 2.01% for the three and six months ended June 30, 2019, reflecting initiatives taken to decrease the rate spread resultedpaid on deposits.
The average rate on borrowings declined to 1.97% and 2.22%% for the three and six months ended June 30, 2020, from 2.62% and 2.61%% for the three and six months ended June 30, 2019.
The tax-equivalent yield on loans decreased to 3.71% and 3.94% for the three and six months ended June 30, 2020, from 4.52% and 4.51% for the three and six months ended June 30, 2019, due primarily to declines in benchmark interest rates.
The tax-equivalent yield on investment securities decreased to 2.48% and 2.64% for the three and six months ended June 30, 2020 from 3.61% and 3.63% for the three and months ended June 30, 2019. The most significant factors discussed above.
contributing to this decrease were decreases in benchmark interest rates impacting new purchases of investments and re-pricing of variable rate securities, and to a lesser extent, increased prepayment speeds.
Provision for LoanCredit Losses
The provision for loancredit losses is the amount of expense that, based on our judgment, isa charge to earnings required to maintain the ALLLACL at an adequatea level to absorb probableconsistent with management’s estimate of expected credit losses inherent in the loan portfolioon financial assets carried at amortized cost at the balance sheet datedate. The amount of the provision is impacted by changes in current economic conditions as well as in management's reasonable and that,supportable economic forecast, loan originations and runoff, changes in management’s judgment, is appropriate under GAAP.portfolio mix, risk rating migration and portfolio seasoning, the level of charge-offs, changes in specific reserves, changes in expected prepayment speeds and other assumptions. The provision for credit losses also includes an amount related to off-balance sheet credit exposures. The determination of the amount of the ALLLACL is complex and involves a high degree of judgment and subjectivity. Our determination of the amount of the allowance and corresponding provision for loan losses considers ongoing evaluations of the credit quality of and level of credit risk inherent in various segments of the loan portfolio and of individually significant credits, levels of non-performing loans and charge-offs, historical and statistical trends and economic and other relevant factors. See “Analysis of the Allowance for Loan and LeaseCredit Losses” below for more information about how we determine the appropriate level of the allowance.ACL.
The provision for loan losses for the quarter and nine months ended September 30, 2017 included $5.4 million related to the impact of Hurricanes Irma and Harvey. The amount of this provision was determined based on our evaluation of an intensive analysis conducted by our credit teams of the individual loans potentially impacted by these storms, including but not limited to direct contact with borrowers, preliminary assessments of the extent of damage to collateral and impacts on borrowers’ business operations and consideration of the impact of insurance coverage. The amount of the provision related to the impact of these storms is subject to change as individual situations evolve.
For the three and six months ended SeptemberJune 30, 2017 and 2016, we recorded provisions2020, the provision for loan(recovery of) credit losses of $37.6totaled $25.4 million and $24.9$150.8 million, respectively, which included $(6.2) million and $2.6 million, respectively, related to non-covered loans. For the nine months ended September 30, 2017 and 2016, we recorded provisions for loan losses of $60.9 million and $43.6 million, respectively, related to non-covered loans.off-balance sheet credit exposures. The amount of the provision is impacted by loan growth, portfolio mix, historical loss rates, the level of charge-offs and specific reserves for impaired loans, and management's evaluation of qualitative factors in the determination of general reserves.
The most significant reason for the increase in the provision for loancredit losses related to non-covered loans for the quarter ended September 30, 2017 compared to the quarter ended September 30, 2016 was an increase of $28.9 million in the provision related to taxi medallion loans. The provision related to taxi medallion loans totaled $32.7 million for the quarter ended September 30, 2017, compared to $3.9 million for the quarter ended September 30, 2016. A $5.4 million provision recognized in the quarter ended September 30, 2017 related to the impact of hurricanes was more than offset by (i) a net decrease in the relative impact on the provision of changes in quantitative and qualitative loss factors, (ii) the impact of lower loan growth, and (iii) a decrease in provisions for criticized and classified loans.
Factors contributing to the increase in the provision for loan losses related to non-covered loans for the nine months ended September 30, 2017 as compared to the nine months ended September 30, 2016 were generally consistent with those for the three month periods discussed above.
and six months ended June 30, 2020 was determined using the CECL methodology and reflected management's estimate of the expected negative economic impact of the COVID-19 pandemic.
For the three and six months ended SeptemberJune 30, 2017 and 2016, we2019, the Company recorded provisions for (recovery of) loan losses of $0.3 million and $(0.4) million, respectively, related to covered loans. For the nine months ended September 30, 2017 and 2016, we recorded provisions for (recovery of) loan losses of $2.7 million and $(1.1) million, respectively, related to covered loans. The provision for the nine months ended September 30, 2017 related primarily to impairment recognized on an ACI HELOC pool. As discussed below in the section entitled "Non-interest income," the impact on our results of operations of anya provision for (recovery of) loan losses, on covered loans is significantly mitigated byunder the corresponding impact onincurred loss methodology, of $(2.7) million and $7.5 million, respectively.
The evolving COVID-19 situation may lead to increased volatility in the FDIC indemnification asset, recorded in non-interest income.provision for credit losses and if economic forecasts deteriorate further as a result of COVID-19, the provision for credit losses and the ACL will likely increase.
Non-Interest Income
The Company reported non-interest income of $53.3 million and $25.1 million for the three months ended September 30, 2017 and 2016, respectively. Non-interest income was $111.4 million and $77.1 million for the nine months ended September 30, 2017 and 2016, respectively. A significant portion of our non-interest income has historically related to transactions in the covered assets. We have broken out the significant categories of non-interest income that relate to covered assets in the table below, to assist in the comparison of the amount and composition of our non-interest income with that of other financial institutions.
The following table presents a comparison of the categories of non-interest income for the periods indicated (in thousands):
|
| | | | | | | | | | | | | | | |
| | Three Months Ended September 30, | | Nine Months Ended September 30, |
| | 2017 | | 2016 | | 2017 | | 2016 |
| Income from resolution of covered assets, net | $ | 6,400 |
| | $ | 8,883 |
| | $ | 22,066 |
| | $ | 26,426 |
|
| Loss on sale of covered loans, net | — |
| | (10,033 | ) | | (1,582 | ) | | (14,895 | ) |
| Net gain (loss) on FDIC indemnification | (4,838 | ) | | 993 |
| | (14,174 | ) | | (9,410 | ) |
| Other | 237 |
| | 371 |
| | 957 |
| | 623 |
|
| Non-interest income related to the covered assets | 1,799 |
| | 214 |
| | 7,267 |
| | 2,744 |
|
| Service charges and fees | 4,938 |
| | 5,171 |
| | 15,554 |
| | 14,529 |
|
| Gain on sale of non-covered loans | 2,447 |
| | 2,086 |
| | 8,183 |
| | 7,535 |
|
| Gain on investment securities available for sale, net | 26,931 |
| | 3,008 |
| | 29,194 |
| | 10,065 |
|
| Lease financing | 13,287 |
| | 11,188 |
| | 40,067 |
| | 32,762 |
|
| Other non-interest income | 3,924 |
| | 3,408 |
| | 11,098 |
| | 9,495 |
|
| | $ | 53,326 |
| | $ | 25,075 |
| | $ | 111,363 |
| | $ | 77,130 |
|
|
| | | | | | | | | | | | | | | |
| | Three Months Ended June 30, | | Six Months Ended June 30, |
| | 2020 | | 2019 | | 2020 | | 2019 |
| Deposit service charges and fees | $ | 3,701 |
| | $ | 4,290 |
| | $ | 7,887 |
| | $ | 8,120 |
|
| Gain on sale of loans: | | | | | | | |
| Guaranteed portions of SBA loans | 375 |
| | 848 |
| | 1,569 |
| | 2,635 |
|
| GNMA early buyout loans | 3,951 |
| | 1,273 |
| | 6,206 |
| | 2,192 |
|
| Other | — |
| | — |
| | 17 |
| | 230 |
|
| Gain on sale of loans, net | 4,326 |
| | 2,121 |
| | 7,792 |
| | 5,057 |
|
| Gain on investment securities: | | | | | | | |
| Net realized gains on sale of AFS | 5,723 |
| | 3,915 |
| | 7,253 |
| | 8,232 |
|
| Net unrealized gains (losses) on marketable equity securities | 1,113 |
| | 201 |
| | (3,870 | ) | | 1,669 |
|
| Gain on investment securities, net | 6,836 |
| | 4,116 |
| | 3,383 |
| | 9,901 |
|
| Lease financing | 16,150 |
| | 17,005 |
| | 31,631 |
| | 34,191 |
|
| Other non-interest income | 7,338 |
| | 7,805 |
| | 10,956 |
| | 14,323 |
|
| Non-interest income | $ | 38,351 |
| | $ | 35,337 |
| | $ | 61,649 |
| | $ | 71,592 |
|
Non-interest incomeDeposit service charges for the quarter ended June 30, 2020 were impacted by fee waivers related to transactions in thecovered assetsCOVID-19 and to lower levels of activity, also related to COVID-19.
The consolidated financial statements reflect the impact of gains or losses arising from transactionsincrease in the covered assets. The balance of the FDIC indemnification asset is reduced or increased as a result of decreases or increases in cash flows expected to be received from the FDIC related to these gains or losses. When these transaction gains or losses are recorded, we also record an offsetting amount in the consolidated statement of income line item “Net gain (loss) on FDIC indemnification.” This line item includes the significantly mitigating impact of FDIC indemnification related to the following types of transactions in covered assets:
gains or losses from the resolution of covered assets;
provisions for (recoveries of) losses on covered loans;
gains or losses on the sale of covered loans; and
gains or losses on covered OREO.
See Note 5 to the consolidated financial statements for further details about the components of these gains and losses associated with covered assets, along with the related additions to or reductions in the amounts recoverable from the FDIC under the Loss Sharing Agreements, as reflected in the consolidated statements of incomeGNMA early buyout loans for the three and ninesix months ended SeptemberJune 30, 2017 and 2016.2020 compared to the comparable periods of 2019 resulted from an increase in the volume of activity.
CoveredThe decrease in gains on guaranteed portions of SBA loans may be resolved through prepayment, short saleperiod over period is a result of declining origination volume of SBA loans, impacted by our focus on PPP lending during the second quarter of 2020.
The net unrealized loss on marketable equity securities for the six months ended June 30, 2020 was primarily due to a $5.0 million unrealized loss recorded during the first quarter, resulting from the impact on markets of the underlying collateral, foreclosure, saleCOVID-19 crisis; this improved to a gain of $1.1 million for the loans or charge-off. For loans resolved through prepayment, short sale or foreclosure, the difference between consideration received in resolution of the loans and the carrying value of the loans is recorded in the consolidated statement of income line item “Incomequarter ended June 30, 2020.
from resolution of covered assets, net.” Both gains and losses on individual resolutions are included in this line item. Losses from the resolution of covered loans increase the amount recoverable from the FDIC under the Loss Sharing Agreements. Gains from the resolution of covered loans reduce the amount recoverable from the FDIC under the Loss Sharing Agreements. These additions to or reductions in amounts recoverable from the FDIC related to the resolution of covered loans are recorded in non-interest income in the line item “Net gain (loss) on FDIC indemnification” and reflected as corresponding increases or decreases in the FDIC indemnification asset. The amount of income or loss recorded in any period will be impacted by the amount of covered loans resolved, the amount of consideration received, and our ability to accurately project cash flows from ACI loans in future periods.
The following table provides further detail of the components of income from resolution of covered assets, net, for the periods indicated (in thousands):
|
| | | | | | | | | | | | | | | |
| | Three Months Ended September 30, | | Nine Months Ended September 30, |
| | 2017 | | 2016 | | 2017 | | 2016 |
| Payments in full | $ | 6,423 |
| | $ | 9,371 |
| | $ | 22,201 |
| | $ | 26,790 |
|
| Other | (23 | ) | | (488 | ) | | (135 | ) | | (364 | ) |
| Income from resolution of covered assets, net | $ | 6,400 |
| | $ | 8,883 |
| | $ | 22,066 |
| | $ | 26,426 |
|
Under the terms of the Purchase and Assumption Agreement with the FDIC, the Bank may sell up to 2.5% of the covered loans based on UPB at the date of the FSB Acquisition, or approximately $280 million, on an annual basis without prior consent of the FDIC. Any losses incurred from such loan sales are covered under the Single Family Shared-Loss Agreement. Any loan sale in excess of this stipulated annual threshold requires approval from the FDIC to be eligible for loss share coverage. However, if the Bank seeks to sell covered loans in excess of the 2.5% threshold in the nine months prior to the stated termination date of loss share coverage, May 21, 2019, and the FDIC does not consent, the Single Family Shared-Loss Agreement will be extended for two additional years with respect to the loans requested to be included in such sales. The Bank will then have the right to sell all or any portion of such loans without FDIC consent at any time within the nine months prior to the extended termination date, and any losses incurred will be covered under the Single Family Shared-Loss Agreement. This final sale mechanism, if exercised, ensures no residual credit risk in our covered loan portfolio that would otherwise arise from credit losses occurring after the termination date of the Single Family Shared-Loss Agreement.
The following table summarizes the gain (loss) recorded on the sale of covered residential loans and the impact of related FDIC indemnification for the periods indicated (in thousands):
|
| | | | | | | | | | | |
| | Three Months Ended September 30, | | Nine Months Ended September 30, |
| | 2016 | | 2017 | | 2016 |
| Loss on sale of covered loans | $ | (10,033 | ) | | $ | (1,582 | ) | | $ | (14,895 | ) |
| Net gain on FDIC indemnification | 8,026 |
| | 1,266 |
| | 11,958 |
|
| Net impact on pre-tax earnings | $ | (2,007 | ) | | $ | (316 | ) | | $ | (2,937 | ) |
The Bank did not sell covered residential loans in the three months ended September 30, 2017, due to the potential impact of Hurricane Irma on the market for these loans, the collateral for many of which is located in Florida.
Pricing received on the sale of covered loans may vary based on (i) market conditions, including the interest rate environment, the amount of capital seeking investment and the secondary supply of loans with a particular performance history or collateral type, (ii) the type and quality of collateral, (iii) the performance history of loans included in the sale and (iv) whether or not the loans have been modified. We anticipate that we will continue to exercise our right to sell covered residential loans on a quarterly basis in the future.
Other components of non-interest income
Period over period increasesdecrease in income from lease financing corresponded to the growth in the portfolio of equipment under operating lease.
Gains on sale of non-covered loans for the three and ninesix months ended SeptemberJune 30, 2017 and 2016 related primarily2020 compared to sales of loans by SBF.
Gain on sale of investment securities available for sale, net totaled $26.9 million for the quarter ended September 30, 2017. Substantially all of these gains resulted from the sale of securities formerly covered under the Commercial Shared-Loss Agreement and originally acquired at significant discounts in the FSB Acquisition. Other gains on investment securities available for sale for the three and ninesix months ended SeptemberJune 30, 2017 and 2016 related2019, is primarily attributed to sales of securitiesthe increase in the normal course of managing liquidity, portfolio duration and yield.operating lease equipment off-lease.
Non-Interest Expense
The following table presents the components of non-interest expense for the periods indicated (in thousands):
|
| | | | | | | | | | | | | | | |
| | Three Months Ended June 30, | | Six Months Ended June 30, |
| | 2020 | | 2019 | | 2020 | | 2019 |
| Employee compensation and benefits | $ | 48,877 |
| | $ | 57,251 |
| | $ | 107,764 |
| | $ | 122,484 |
|
| Occupancy and equipment | 11,901 |
| | 13,991 |
| | 24,270 |
| | 27,157 |
|
| Deposit insurance expense | 4,806 |
| | 5,027 |
| | 9,209 |
| | 9,068 |
|
| Professional fees | 3,131 |
| | 6,937 |
| | 6,335 |
| | 14,808 |
|
| Technology and telecommunications | 14,025 |
| | 12,013 |
| | 26,621 |
| | 23,181 |
|
| Depreciation of operating lease equipment | 12,219 |
| | 11,489 |
| | 24,822 |
| | 23,301 |
|
| Other non-interest expense | 11,411 |
| | 13,377 |
| | 26,217 |
| | 26,776 |
|
| Total non-interest expense | $ | 106,370 |
| | $ | 120,085 |
| | $ | 225,238 |
| | $ | 246,775 |
|
| Less: | | | | | | | |
| Depreciation of operating lease equipment | (12,219 | ) | | (11,489 | ) | | (24,822 | ) | | (23,301 | ) |
| Loss on debt extinguishment | | | | | — |
| | — |
|
| Costs incurred directly related to implementation of BankUnited 2.0 | (255 | ) | | (6,217 | ) | | (334 | ) |
| (12,109 | ) |
| COVID-19 expenses | (1,519 | ) | | — |
| | (1,519 | ) | | — |
|
Recurring operating expenses (1) | $ | 92,377 |
| | $ | 102,379 |
| | $ | 198,563 |
| | $ | 211,365 |
|
| |
| (1) | Recurring operating expenses is a non-GAAP measure. See section entitled "Non-GAAP Financial Measures" below for reconciliation of non-GAAP financial measurements to their comparable GAAP financial measurements. |
|
| | | | | | | | | | | | | | | |
| | Three Months Ended September 30, | | Nine Months Ended September 30, |
| | 2017 | | 2016 | | 2017 | | 2016 |
| Employee compensation and benefits | $ | 58,327 |
| | $ | 55,162 |
| | $ | 178,386 |
| | $ | 166,374 |
|
| Occupancy and equipment | 18,829 |
| | 18,867 |
| | 56,689 |
| | 57,199 |
|
| Amortization of FDIC indemnification asset | 45,225 |
| | 38,957 |
| | 135,351 |
| | 116,711 |
|
| Deposit insurance expense | 5,764 |
| | 4,943 |
| | 16,827 |
| | 12,866 |
|
| Professional fees | 2,748 |
| | 3,884 |
| | 12,573 |
| | 10,119 |
|
| Telecommunications and data processing | 3,452 |
| | 3,746 |
| | 10,481 |
| | 10,800 |
|
| Depreciation of equipment under operating lease | 8,905 |
| | 6,855 |
| | 25,655 |
| | 20,004 |
|
| Other non-interest expense | 13,455 |
| | 15,590 |
| | 37,735 |
| | 40,151 |
|
| | $ | 156,705 |
| | $ | 148,004 |
| | $ | 473,697 |
| | $ | 434,224 |
|
Annualized non-interest expense as a percentage of average assets was 2.1%Employee compensation and 2.2%benefits declined by $8.4 million and $14.7 million for the three and ninesix months ended SeptemberJune 30, 2017,2020, respectively as compared to the three and 2.2%six months ended June 30, 2019, primarily due to a reduction in headcount related to our BankUnited 2.0 initiative. Lower variable compensation costs and 2.3%the impact of a declining stock price on liability-classified awards also contributed to reduced expense levels.
Professional fees
Professional fees decreased by $3.8 million and $8.5 million for the three and ninesix months ended SeptemberJune 30, 2016, respectively. Excluding amortization of the FDIC indemnification asset, non-interest expense2020, respectively as a percentage of average assets was 1.5% and 1.6% forcompared to the three and ninesix months ended SeptemberJune 30, 2017, respectively, and 1.6% and 1.7% for the three and nine months ended September 30, 2016, respectively.2019. The more significant changes in the components of non-interest expense are discussed below.
Employee compensation and benefits
As is typical for financial institutions, employee compensation and benefits represents the single largest component of recurring non-interest expense. Employee compensation and benefits for the three and nine months ended September 30, 2017 increased by $3.2 million and $12.0 million compareddecrease was primarily due to the corresponding periodsconsulting services in 2016. The increases for the three and nine months ended September 30, 2017 primarily reflected increased headcount and general increases in compensation levels.2019 related to our BankUnited 2.0 initiative.
Amortization of FDIC indemnification asset
Amortization of FDIC indemnification asset totaled $45.2 million and $135.4 million, respectively, for the three and nine months ended September 30, 2017 compared to $39.0 million and $116.7 million, respectively, for the three and nine months ended September 30, 2016.
The FDIC indemnification asset was initially recorded at its estimated fair value, representing the present value of estimated future cash payments from the FDIC for probable losses on covered assets. As projected cash flows from the ACI loans have increased, the yield on the loans has increased accordingly and the estimated future cash payments from the FDIC have decreased. This change in estimated cash flows is recognized prospectively, consistent with the recognition of the increased cash flows from the ACI loans. As a result, the FDIC indemnification asset is being amortized to the amount of the estimated future cash flows. For the three and nine months ended September 30, 2017, the average rate at which the FDIC indemnification asset was amortized was 46.62% and 41.19%, respectively, compared to 25.36% and 23.48%, respectively, during the comparable periods in 2016.
The rate of amortization will increase if estimated future cash payments from the FDIC decrease. The amount of amortization is impacted by both the change in the amortization rate and the decrease in the average balance of the indemnification asset. As we continue to submit claims under the Loss Sharing Agreements and recognize periodic amortization, the balance of the indemnification asset will continue to decline.
See Note 5 to the consolidated financial statements for a rollforward of the FDIC indemnification asset for the nine months ended September 30, 2017 and the year ended December 31, 2016. The entire balance of the FDIC indemnification asset relates
to residential loans and OREO covered under the Single Family Shared-Loss Agreement. The following table presents the carrying value of the FDIC indemnification asset and the estimated future cash flows at the dates indicated (in thousands):
|
| | | | | | | |
| | September 30, 2017 | | December 31, 2016 |
| FDIC indemnification asset | $ | 349,617 |
| | $ | 515,933 |
|
| Less expected amortization | (173,685 | ) | | (245,350 | ) |
| Amount expected to be collected from the FDIC | $ | 175,932 |
| | $ | 270,583 |
|
The amount of expected amortization reflects the impact of improvements in cash flows expected to be collected from the covered loans, as well as the impact of time value resulting from the discounting of the asset when it was initially established. This amount will be amortized to non-interest expense using the effective interest method over the period during which cash flows from the FDIC are expected to be collected, which is limited to the lesser of the contractual term of the Single Family Shared-Loss Agreement and the expected remaining life of the indemnified assets.
Deposit insurance expense
Deposit insurance expense increased $0.8 million and $4.0 million, respectively, for the three and nine months ended September 30, 2017 compared to the corresponding periods in 2016. These increases primarily reflect the growth of the balance sheet, the large bank surcharge imposed by the FDIC, which began in the third quarter of 2016, and increases in certain components of the Bank's assessment rate.
Depreciation of equipment under operating lease
Depreciation of equipment under operating lease increased by $2.1 million and $5.7 million, respectively, for the three and nine months ended September 30, 2017 compared to the corresponding periods in 2016. These increases generally correspond to the growth in the portfolio of equipment under operating lease.
Other non-interest expense
The most significant components of other non-interest expense are advertising, promotion and promotion,business development, costs related to lending activities, loan servicing and deposit generation, OREOinsurance, expenses related expenses, insurance,to workouts and foreclosures, regulatory examination assessments, travel and general office expense. Other
For both the quarter and six months ended June 30, 2020, non-interest expense for the three months ended September 30, 2017 includes $0.6included approximately $1.5 million related primarilydirectly to facilities damageCOVID-19, the most significant of which include technology and employee relocation and assistance due to the impact of Hurricane Irma. We do not expect future expensesconsulting costs related to facilities damageour participation in the PPP, laptops and employee relocationother equipment to be materialfacilitate employees working remotely and costs related to the Company.cleaning, sanitizing and personal protective equipment.
Income Taxes
The Company’s effective income tax rate was 32.2%21.0% and 31.2%19.3% for the three and ninesix months ended SeptemberJune 30, 2017,2020, respectively, compared to 31.7%and 33.2%25.2% and 25.9% for the three and ninesix months ended SeptemberJune 30, 2016,2019, respectively. Significant components included in the reconciliation of the Company's effective income tax rateSee Note 6 to the statutory federal tax rate of 35.0% included the effect of stateconsolidated financial statements for information about income taxes and the impact of income not subject to federal tax for each of the periods presented. In addition, the effective income tax rate for the three and nine months ended September 30, 2017 reflected the impact of $0.3 million and $3.2 million, respectively, in excess tax benefits resulting from activity related to vesting of share-based awards and exercise of stock options.taxes.
Analysis of Financial Condition
Average interest-earning assets increased $3.2$1.0 billion to $26.9$32.1 billion for the ninesix months ended SeptemberJune 30, 20172020 from $23.7$31.1 billion for the ninesix months ended SeptemberJune 30, 2016.2019. This increase was driven by a $2.1 billion$951 million increase in the average balance of outstanding loans, andoffset by a $1.0 billion increase$137 million decrease in the average balance of investment securities. The increase in average loans reflected growth of $2.3 billion in average non-covered loans outstanding, partially offset by a $186 million decrease in the average balance of covered loans. The decrease in average non-interest earning assets period over period primarily reflected a decrease in the FDIC indemnification asset. Growth in interest earning assets, resolution of covered loans and declines in the amount of the FDIC indemnification asset are trends that are expected to continue.
Average interest bearing liabilities increased $2.6 billion to $22.4 billionwas consistent for the ninesix months ended SeptemberJune 30, 2017 from $19.8 billion for2020 compared to the ninesix months ended SeptemberJune 30, 2016, due to increases of $2.4 billion in average interest bearing deposits and $191 million in average FHLB advances.2019. Average non-interest bearing deposits increased by $90 million. We expect growth in average deposits$1.1 billion to continue, corresponding to anticipated growth in interest earning assets.
Average stockholders' equity increased by $255 million, due primarily to$4.8 billion for the retention of earnings, but also reflecting proceeds from the exercise of stock options and an increase in accumulated other comprehensive income.six months ended June 30, 2020.
Investment Securities Available for Sale
The following table shows the amortized cost and carrying value, which, with the exception of investment securities held to maturity, is fair value, of investment securities available for sale as ofat the dates indicated (in thousands):
| | | | September 30, 2017 | | December 31, 2016 | June 30, 2020 | | December 31, 2019 |
| | Amortized Cost | | Fair Value | | Amortized Cost | | Fair Value | Amortized Cost | | Carrying Value | | Amortized Cost | | Carrying Value |
| U.S. Treasury securities | $ | 24,969 |
| | $ | 24,957 |
| | $ | 4,999 |
| | $ | 5,005 |
| $ | 75,217 |
| | $ | 77,180 |
| | $ | 70,243 |
| | $ | 70,325 |
|
| U.S. Government agency and sponsored enterprise residential MBS | 2,332,616 |
| | 2,348,687 |
| | 1,513,028 |
| | 1,527,242 |
| 2,371,729 |
| | 2,379,840 |
| | 2,018,853 |
| | 2,022,175 |
|
| U.S. Government agency and sponsored enterprise commercial MBS | 139,966 |
| | 139,220 |
| | 126,754 |
| | 124,586 |
| 455,344 |
| | 464,277 |
| | 366,787 |
| | 370,976 |
|
| Private label residential MBS and CMOs | 507,381 |
| | 527,858 |
| | 334,167 |
| | 375,098 |
| 1,101,390 |
| | 1,116,086 |
| | 1,001,337 |
| | 1,012,177 |
|
| Private label commercial MBS | 1,140,465 |
| | 1,153,601 |
| | 1,180,386 |
| | 1,187,624 |
| 2,075,683 |
| | 2,043,620 |
| | 1,719,228 |
| | 1,724,684 |
|
| Single family rental real estate-backed securities | 566,635 |
| | 572,948 |
| | 858,339 |
| | 861,251 |
| 608,019 |
| | 618,207 |
| | 467,459 |
| | 470,025 |
|
| Collateralized loan obligations | 695,414 |
| | 700,319 |
| | 487,678 |
| | 487,296 |
| 1,166,929 |
| | 1,128,753 |
| | 1,204,905 |
| | 1,197,366 |
|
| Non-mortgage asset-backed securities | 80,255 |
| | 82,637 |
| | 187,660 |
| | 186,736 |
| 255,854 |
| | 261,531 |
| | 194,171 |
| | 194,904 |
|
| Preferred stocks | 60,716 |
| | 70,716 |
| | 76,180 |
| | 88,203 |
| |
| State and municipal obligations | 666,013 |
| | 677,015 |
| | 705,884 |
| | 698,546 |
| 239,502 |
| | 259,495 |
| | 257,528 |
| | 273,302 |
|
| SBA securities | 572,540 |
| | 586,675 |
| | 517,129 |
| | 523,906 |
| 247,914 |
| | 245,942 |
| | 359,808 |
| | 362,731 |
|
| Other debt securities | 4,056 |
| | 8,839 |
| | 3,999 |
| | 8,091 |
| |
| Investment securities held to maturity | | 10,000 |
| | 10,000 |
| | 10,000 |
| | 10,000 |
|
| | $ | 6,791,026 |
| | $ | 6,893,472 |
| | $ | 5,996,203 |
| | $ | 6,073,584 |
| $ | 8,607,581 |
| | 8,604,931 |
| | $ | 7,670,319 |
| | 7,708,665 |
|
| Marketable equity securities | | | | 88,697 |
| | | | 60,572 |
|
| | | | | $ | 8,693,628 |
| | | | $ | 7,769,237 |
|
Our investment strategy has focused on insuring adequate liquidity, addingmaintaining a suitable balance of high credit quality, diversifyingdiverse assets, to the consolidated balance sheet, managing interest rate risk, and generating acceptable returns given our established risk parameters. We have sought to maintain liquidity by investing a significant portion of the portfolio in high quality liquid securities including U.S. Treasury securities, GNMA securities, SBA securities and U.S. Government agencyAgency MBS. Investment grade municipal securities provide liquidity along with higherand attractive tax-equivalent yields at longer durations than the portfolio in general.yields. We have also invested in highly rated structured products, including private-label commercial and residential MBS, collateralized loan obligations, single family rental real estate-backed securities and non-mortgage asset-backed securities that, while somewhat less liquid, provide us with attractive yields. Relatively short effective portfolio duration helps mitigate interest rate risk arising fromrisk. Based on the currently low level of market interest rates. TheCompany’s assumptions, the estimated weighted average expected life of the investment portfolio as of SeptemberJune 30, 20172020 was 4.9 years and the4.4 years. The effective duration of the investment portfolio as of June 30, 2020 was 1.7 years. 1.3 years . The model results are based on assumptions that may differ from actual results.
The following table shows the scheduled maturities, carrying values and current yields for investment securities available for sale as of September 30, 2017. Scheduled maturities have been adjusted for anticipated prepayments of MBS and other pass through securities. Yields on tax-exempt securities have been calculated on a tax-equivalent basis (dollars in thousands):
|
| | | | | | | | | | | | | | | | | | | | | | | | | | | | | | | | | | |
| | Within One Year | | After One Year Through Five Years | | After Five Years Through Ten Years | | After Ten Years | | Total |
| | Carrying Value | | Weighted Average Yield | | Carrying Value | | Weighted Average Yield | | Carrying Value | | Weighted Average Yield | | Carrying Value | | Weighted Average Yield | | Carrying Value | | Weighted Average Yield |
| U.S. Treasury securities | $ | 24,957 |
| | 1.19 | % | | $ | — |
| | — | % | | $ | — |
| | — | % | | $ | — |
| | — | % | | $ | 24,957 |
| | 1.19 | % |
| U.S. Government agency and sponsored enterprise residential MBS | 355,685 |
| | 2.94 | % | | 860,103 |
| | 2.28 | % | | 893,121 |
| | 2.14 | % | | 239,778 |
| | 2.15 | % | | 2,348,687 |
| | 2.31 | % |
| U.S. Government agency and sponsored enterprise commercial MBS | 5,562 |
| | 3.80 | % | | 11,066 |
| | 3.71 | % | | 83,066 |
| | 2.50 | % | | 39,526 |
| | 3.57 | % | | 139,220 |
| | 2.95 | % |
| Private label residential MBS and CMOs | 113,951 |
| | 4.01 | % | | 284,366 |
| | 3.82 | % | | 101,127 |
| | 4.07 | % | | 28,414 |
| | 4.39 | % | | 527,858 |
| | 3.94 | % |
| Private label commercial MBS | 90,284 |
| | 3.80 | % | | 786,542 |
| | 3.57 | % | | 276,775 |
| | 3.20 | % | | — |
| | — | % | | 1,153,601 |
| | 3.50 | % |
| Single family rental real estate-backed securities | 1,516 |
| | 3.18 | % | | 546,920 |
| | 2.92 | % | | 24,512 |
| | 3.70 | % | | — |
| | — | % | | 572,948 |
| | 2.95 | % |
| Collateralized loan obligations | — |
| | — | % | | 573,474 |
| | 3.32 | % | | 126,845 |
| | 3.52 | % | | — |
| | — | % | | 700,319 |
| | 3.36 | % |
| Non-mortgage asset-backed securities | 11,999 |
| | 3.91 | % | | 70,638 |
| | 3.63 | % | | — |
| | — | % | | — |
| | — | % | | 82,637 |
| | 3.67 | % |
| State and municipal obligations | — |
| | — | % | | 27,509 |
| | 3.00 | % | | 624,758 |
| | 4.46 | % | | 24,748 |
| | 5.60 | % | | 677,015 |
| | 4.45 | % |
| SBA securities | 93,080 |
| | 2.54 | % | | 245,991 |
| | 2.50 | % | | 150,116 |
| | 2.47 | % | | 97,488 |
| | 2.43 | % | | 586,675 |
| | 2.49 | % |
| Other debt securities | — |
| | — | % | | — |
| | — | % | | 1,900 |
| | 9.17 | % | | 6,939 |
| | 9.13 | % | | 8,839 |
| | 9.14 | % |
| | $ | 697,034 |
| | 3.13 | % | | $ | 3,406,609 |
| | 3.04 | % | | $ | 2,282,220 |
| | 3.11 | % | | $ | 436,893 |
| | 2.74 | % | | 6,822,756 |
| | 3.05 | % |
| Preferred stocks with no scheduled maturity | |
| | |
| | |
| | |
| | |
| | |
| | |
| | |
| | 70,716 |
| | 8.66 | % |
| Total investment securities available for sale | |
| | |
| | |
| | |
| | |
| | |
| | |
| | |
| | $ | 6,893,472 |
| | 3.11 | % |
The available for sale investment securities portfolio was in a net unrealized gainloss position of $102.4$2.6 million at SeptemberJune 30, 2017 with aggregate fair value equal to 101.5%2020, having recovered substantially from a net unrealized loss position of amortized cost.$249.8 million at the prior quarter end. Net unrealized gainslosses included $110.3$98.4 million of gross unrealized gains and $7.9$101.1 million of gross unrealized losses. Investment securities available for sale in an unrealized loss position at SeptemberJune 30, 20172020 had an aggregate fair value of $1.0$4.3 billion. At SeptemberThe majority of the unrealized losses at June 30, 2017, 96.7% of investment securities available for sale were backed by2020 related to the U.S. Government, U.S. Government agencies or sponsored enterprises or were rated AAA , AA or A, based on the most recent third-party ratings. Investment securities available for sale totaling $33 million were rated below investment grade or not rated at September 30, 2017, all of which were acquired in the FSB Acquisitionprivate label CMBS and substantially all ofCLO portfolio segments, which were in net unrealized gainloss positions of $32.1 million and $38.2 million, respectively. Comparatively, at SeptemberMarch 31, 2020 the private label CMBS and CLO portfolios were in net unrealized loss positions of $123.8 million and $74.7 million, respectively. Unrealized losses at June 30, 2017.2020 were primarily attributable to widening spreads, resulting in large part from market response to, and dislocation in the wake of, the COVID-19 pandemic. The ratings distribution of our AFS securities portfolio at June 30, 2020 is depicted in the chart below:
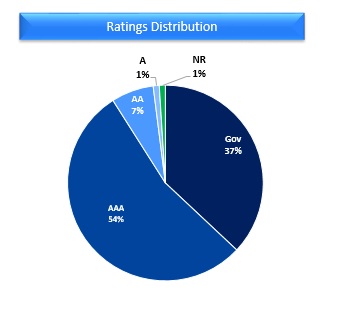
We evaluate the credit quality of individual securities in the portfolio quarterly to determine whether anywe expect to recover the amortized cost basis of the investments in unrealized loss positions are other-than-temporarily impaired.positions. This evaluation considers, but is not necessarily limited to, the following factors, the relative significance of which varies depending on the circumstances pertinent to each individual security:
our intentwhether we intend to holdsell the security until maturity or for a periodprior to recovery of time sufficient for a recovery in value;its amortized cost basis;
whether it is more likely than not that we will be required to sell the security prior to recovery of its amortized cost basis;
the length of time andThe extent to which fair value has beenis less than amortized cost;
adverse changesAdverse conditions specifically related to the security, an industry or geographic area;
Changes in expected cash flows;the financial condition of the issuer or underlying loan obligors;
collateral values and performance;
theThe payment structure and remaining payment terms of the security, including levels of subordination or over-collateralization;
changes in the economic or regulatory environment;
the general market conditionFailure of the geographic area or industry of the issuer;issuer to make scheduled payments;
the issuer’s financial condition, performance and business prospects; and
changesChanges in credit ratings.ratings;
Our evaluationRelevant market data;
Estimated prepayments, defaults, and the value and performance of non-agency impaired securities for OTTI as of September 30, 2017 included consideration of the potential impacts of Hurricanes Irma and Harvey. Our considerations included but were not necessarily limited to (i) observations of market pricing since the hurricanes, (ii) whether a significant portion of the underlying collateral was in anat the individual security level.
impacted area, (iii) whether credit enhancement significantly exceeded the balance of collateral in impacted areas, (iv) for residential mortgage-backed securities, the evaluation of the extent and nature of damage to residential collateral for loans in the Bank’s residential loan portfolio located in the same areas, and (v) discussions with sponsors or managers of individual securities about specific collateral impact.
During the three and nine months ended September 30, 2016, OTTI was recognized on two positions in one private label commercial MBS. These positions were in unrealized loss positions at September 30, 2016 and the Company intended to sell the security before recovery of the amortized cost basis. No securities were determined to be other-than-temporarilycredit loss impaired at September 30, 2017, or during the three and ninesix months then ended.
ended June 30, 2020 or other than temporarily impaired during the six months ended June 30, 2019. We do not intend to sell securities in significant unrealized loss
positions at SeptemberJune 30, 2017.2020. Based on an assessment of our liquidity position and internal and regulatory guidelines for permissible investments and concentrations, it is not more likely than not that we will be required to sell securities in significant unrealized loss positions prior to recovery of amortized cost basis. The severity of impairment of individual securities in the portfolio is generally not material. Unrealized losses in the portfoliobasis, which may be at September 30, 2017 were primarily attributable to an increase in market interest rates subsequent to the date the securities were acquired.maturity.
The timely repaymentpayment of principal and interest on securities issued by the U.S. Treasury,government, U.S. Government agencygovernment agencies and U.S. government sponsored enterprise securities in unrealized loss positionsenterprises is explicitly or implicitly guaranteed by the full faith and credit of the U.S. Government. Management performed projected cash flow analysesAs such, there is an assumption of zero credit loss and the Company expects to recover the entire amortized cost basis of these securities.
None of our impaired private label residential MBSsecurities had missed principal or interest payments or had been downgraded by a NRSRO at June 30, 2020. The Company performed an analysis comparing the present value of cash flows expected to be collected to the amortized cost basis of impaired securities. This analysis was based on a scenario that we believe to be generally more severe than our reasonable and CMOs, private label commercial MBSsupportable economic forecast at June 30, 2020, and non-mortgage asset-backed securities in unrealized loss positions, incorporating CUSIP levelincorporated assumptions consistent withabout voluntary prepayment rates, collateral defaults, delinquencies, severity and other relevant factors. Our analysis also considered the collateralstructural characteristics of each security including collateral default rate, voluntary prepayment rate, severity and delinquency assumptions.the level of credit enhancement provided by that structure. Based on the results of this analysis, nowe expect to recover the entire amortized cost basis of the impaired private label AFS securities. Further information about the portfolio segments evidencing the largest unrealized losses at June 30, 2020, the CMBS and CLO portfolio segments, follows.
For private label CMBS, our analysis of cash flows expected to be collected incorporated assumptions about collateral default rates, voluntary prepayment rates, loss severity, delinquencies and recovery lag. In developing those assumptions, we took into account collateral quality and type, loan size, loan purpose and other qualitative factors. We also regularly monitor collateral watchlists, bankruptcy data, special servicing trends, delinquency and other economic data which would indicate further stress in the sector.
For CLOs, our analysis of cash flows expected to be collected incorporated assumptions about collateral default rates, loss severity, and delinquencies, calibrated to take into account idiosyncratic risks associated with the underlying collateral. In developing those assumptions, we took into account each sector’s performance pre, during and post the 2008 financial crisis. We regularly engage with bond managers to monitor trends in underlying collateral including potential downgrades and subsequent cash flow diversions, liquidity, ratings migration, and any other relevant developments.
The following table presents the distribution of the third-party ratings and subordination levels compared to average stress scenario losses based on our credit losses were projected. Management'sloss impairment analysis of the credit characteristics of individual securitiesCMBS and the underlying collateral and levels of subordination for each of the single family rental real estate-backed securities in unrealized loss positions is not indicative of projected credit losses. Management's analysis of the state and municipal obligations in unrealized loss positions included reviewing the ratings of the securities and the results of credit surveillance performed by an independent third party. Given the expectation of timely repayment of principal and interest and the generally limited severity of impairment, the impairments were considered to be temporary.CLOs at June 30, 2020:
|
| | | | | | | | | | | | | | | | |
| | | | | | Subordination | | Weighted Average Stress Scenario Loss |
| | Rating | | Percent of Total | | Minimum | | Maximum | | Average | |
| Private label CMBS | AAA | | 83.0 | % | | 29.4 | % | | 54.5 | % | | 43.1 | % | | 12.8 | % |
| | AA | | 12.0 | % | | 31.1 | % | | 81.8 | % | | 37.2 | % | | 11.4 | % |
| | A | | 5.0 | % | | 21.5 | % | | 68.7 | % | | 28.8 | % | | 11.9 | % |
| Weighted average | | | 100.0 | % | | 29.2 | % | | 58.5 | % | | 41.6 | % | | 12.6 | % |
| | | | | | | | | | | | |
| CLOs | AAA | | 84.0 | % | | 36.1 | % | | 48.2 | % | | 43.0 | % | | 20.7 | % |
| | AA | | 13.0 | % | | 26.9 | % | | 40.4 | % | | 32.4 | % | | 22.0 | % |
| | A | | 3.0 | % | | 24.9 | % | | 29.5 | % | | 26.7 | % | | 25.0 | % |
| Weighted average | | | 100.0 | % | | 34.5 | % | | 46.6 | % | | 41.1 | % | | 21.0 | % |
For further discussion of our analysis of impaired investment securities AFS for OTTI,credit loss impairment see Note 3 to the consolidated financial statements.
We use third-party pricing services to assist us in estimating the fair value of investment securities. We perform a variety of procedures to ensure that we have a thorough understanding of the methodologies and assumptions used by the pricing services including obtaining and reviewing written documentation of the methods and assumptions employed, conducting interviews with valuation desk personnel and reviewing model results and detailed assumptions used to value selected securities as considered necessary. Our classification of prices within the fair value hierarchy is based on an evaluation of the nature of the significant assumptions impacting the valuation of each type of security in the portfolio. We have established a robust price challenge process that includes a review by our treasury front office of all prices provided on a monthly basis. Any price evidencing unexpected month over month fluctuations or deviations from our expectations based on recent observed trading activity and other information available in the marketplace that would impact the value of the security is challenged. Responses to the price
challenges, which generally include specific information about inputs and assumptions incorporated in the valuation and their sources, are reviewed in detail. If considered necessary to resolve any discrepancies, a price will be obtained from an additional independent valuation specialist.sources. We do not typically adjust the prices provided, other than through this established challenge process. Our primary pricing services utilize observable inputs when available, and employ unobservable inputs and proprietary models only when observable inputs are not available. As a matter of course, the services validate prices by comparison to recent trading activity whenever such activity exists. Quotes obtained from the pricing services are typically non-binding.
We have also establishedhave a quarterly price validation process to assess the propriety of the pricing methodologies utilized by our primary pricing services by independently verifying the prices of a sample of securities in the portfolio. Sample sizes vary based on the type of security being priced, with higher sample sizes applied to more difficult to value security types. Verification procedures may consist of obtaining prices from an additional outside source or internal modeling, generally based on Intex.source. We have established acceptable percentage deviations from the price provided by the initial pricing source. If deviations fall outside the established parameters, we will obtain and evaluate more detailed information about the assumptions and inputs used by each pricing source or, if considered necessary, employ an additional valuation specialistsource to price the security in question. Pricing issues identified through this evaluation are addressed with the applicable pricing service and methodologies or inputs are revised as determined necessary. Depending on the results of the validation process, sample sizes may be extended for particular classes of securities. Results of the validation process are reviewed by the treasury front office and by senior management.
The majority of our investment securities are classified within level 2 of the fair value hierarchy. U.S. Treasury securities and certain preferred stocksmarketable equity securities are classified within level 1 of the hierarchy. At September 30, 2017We continue to monitor the impact of the COVID-19 pandemic on markets, and December 31, 2016, 1.0%on our ability to price securities in our portfolio. While, particularly at the onset of the pandemic, we observed increased volatility and 2.1%, respectively,dislocation, we believe the fiscal and monetary response to the crisis has been effective in supporting liquidity and stabilizing markets. To date, circumstances have not led to a change in the categorization of our investment securities were classifiedfair value estimates within level 3 of the fair value hierarchy. Securities classified within level 3 of the hierarchy at September 30, 2017 included certain private label residential MBS and trust preferred securities. These securities were classified within level 3 of the hierarchy because proprietary assumptions related to voluntary prepayment rates, default probabilities, loss severities and discount rates were considered significant to the valuation. There were no transfers of investment securities between levels of the fair value hierarchy during the nine months ended September 30, 2017 and 2016.
For additional discussion of the fair values of investment securities, see Note 10 to the consolidated financial statements.
The following table shows the scheduled maturities, carrying values and prospective yields for investment securities available for sale as of June 30, 2020, as well as the carrying value and yield of marketable equity securities. Scheduled maturities have been adjusted for anticipated prepayments when applicable. Yields on tax-exempt securities have been calculated on a tax-equivalent basis, based on a federal income tax rate of 21% (dollars in thousands):
|
| | | | | | | | | | | | | | | | | | | | | | | | | | | | | | | | | | |
| | Within One Year | | After One Year Through Five Years | | After Five Years Through Ten Years | | After Ten Years | | Total |
| | Carrying Value | | Weighted Average Yield | | Carrying Value | | Weighted Average Yield | | Carrying Value | | Weighted Average Yield | | Carrying Value | | Weighted Average Yield | | Carrying Value | | Weighted Average Yield |
| U.S. Treasury securities | $ | 77,180 |
| | 1.71 | % | | $ | — |
| | — | % | | $ | — |
| | — | % | | $ | — |
| | — | % | | $ | 77,180 |
| | 1.71 | % |
| U.S. Government agency and sponsored enterprise residential MBS | 229,123 |
| | 1.11 | % | | 1,051,085 |
| | 0.99 | % | | 865,614 |
| | 0.96 | % | | 234,018 |
| | 0.89 | % | | 2,379,840 |
| | 0.98 | % |
| U.S. Government agency and sponsored enterprise commercial MBS | 3,433 |
| | 1.88 | % | | 49,877 |
| | 2.08 | % | | 258,846 |
| | 1.06 | % | | 152,121 |
| | 1.48 | % | | 464,277 |
| | 1.31 | % |
| Private label residential MBS and CMOs | 379,488 |
| | 3.27 | % | | 579,159 |
| | 3.07 | % | | 127,964 |
| | 2.88 | % | | 29,475 |
| | 2.50 | % | | 1,116,086 |
| | 3.10 | % |
| Private label commercial MBS | 75,949 |
| | 3.37 | % | | 1,587,327 |
| | 2.03 | % | | 350,148 |
| | 2.34 | % | | 30,196 |
| | 3.03 | % | | 2,043,620 |
| | 2.15 | % |
| Single family rental real estate-backed securities | 3,788 |
| | 2.96 | % | | 297,246 |
| | 3.10 | % | | 317,173 |
| | 1.51 | % | | — |
| | — | % | | 618,207 |
| | 2.27 | % |
| Collateralized loan obligations | 55,507 |
| | 1.76 | % | | 962,673 |
| | 1.96 | % | | 110,573 |
| | 2.47 | % | | — |
| | — | % | | 1,128,753 |
| | 2.00 | % |
| Non-mortgage asset-backed securities | 32,763 |
| | 2.89 | % | | 158,375 |
| | 2.65 | % | | 68,737 |
| | 2.27 | % | | 1,656 |
| | 2.63 | % | | 261,531 |
| | 2.58 | % |
| State and municipal obligations | 7,219 |
| | 2.53 | % | | 20,647 |
| | 3.77 | % | | 180,309 |
| | 3.99 | % | | 51,320 |
| | 4.08 | % | | 259,495 |
| | 3.95 | % |
| SBA securities | 50,520 |
| | 1.28 | % | | 124,110 |
| | 1.23 | % | | 52,757 |
| | 1.15 | % | | 18,555 |
| | 1.06 | % | | 245,942 |
| | 1.21 | % |
| | $ | 914,970 |
| | 2.37 | % | | $ | 4,830,499 |
| | 1.99 | % | | $ | 2,332,121 |
| | 1.69 | % | | $ | 517,341 |
| | 1.60 | % | | 8,594,931 |
| | 1.92 | % |
| Marketable equity securities with no scheduled maturity | |
| | |
| | |
| | |
| | |
| | |
| | |
| | |
| | 88,697 |
| | 7.13 | % |
| Total investment securities available for sale and marketable equity securities | |
| | |
| | |
| | |
| | |
| | |
| | |
| | |
| | $ | 8,683,628 |
| | 1.98 | % |
Loans Held for Sale
Loans held for sale at SeptemberJune 30, 20172020 included $32$3 million of commercialthe guaranteed portion of SBA loans originated by SBF with the intent to sellheld for sale in the secondary market. CommercialAt December 31, 2019, loans held for sale are comprisedincluded $28.6 million of the portionSBA loans held for sale and $9.3 million of other commercial loans guaranteed by U.S. government agencies. Loanstransferred to held for sale. SBA loans are generally sold with servicing retained. Servicing activity did not have a material impactBecause of our focus on PPP lending in the resultssecond quarter, the origination volume of operations for the three and nine months ended September 30, 2017 and 2016.traditional SBA loans declined.
Loans
The loan portfolio comprises the Company’s primary interest-earning asset. The following tables show the composition of the loan portfolio and the breakdown of the portfolio among non-covered loans, covered ACI loans and covered non-ACI loans at the dates indicated (dollars in thousands):
|
| | | | | | | | | | | | | | | | | | |
| | September 30, 2017 |
| |
| | Covered Loans | | | | Percent of Total |
| | Non-Covered Loans | | ACI | | Non-ACI | | Total | |
| Residential and other consumer: | |
| | |
| | |
| | |
| | |
|
| 1-4 single family residential | $ | 3,958,205 |
| | $ | 470,300 |
| | $ | 28,589 |
| | $ | 4,457,094 |
| | 21.7 | % |
| Home equity loans and lines of credit | 1,644 |
| | 5,640 |
| | 37,764 |
| | 45,048 |
| | 0.2 | % |
| Other consumer loans | 20,166 |
| | — |
| | — |
| | 20,166 |
| | 0.1 | % |
| | 3,980,015 |
| | 475,940 |
| | 66,353 |
| | 4,522,308 |
| | 22.0 | % |
| Commercial: | | | | | | | | | |
| Multi-family | 3,358,801 |
| | — |
| | — |
| | 3,358,801 |
| | 16.3 | % |
| Non-owner occupied commercial real estate | 4,183,275 |
| | — |
| | — |
| | 4,183,275 |
| | 20.4 | % |
| Construction and land | 271,994 |
| | — |
| | — |
| | 271,994 |
| | 1.3 | % |
| Owner occupied commercial real estate | 1,959,464 |
| | — |
| | — |
| | 1,959,464 |
| | 9.5 | % |
| Commercial and industrial | 3,900,290 |
| | — |
| | — |
| | 3,900,290 |
| | 19.0 | % |
| Commercial lending subsidiaries | 2,374,193 |
| | — |
| | — |
| | 2,374,193 |
| | 11.5 | % |
| | 16,048,017 |
| | — |
| | — |
| | 16,048,017 |
| | 78.0 | % |
| Total loans | 20,028,032 |
| | 475,940 |
| | 66,353 |
| | 20,570,325 |
| | 100.0 | % |
| Premiums, discounts and deferred fees and costs, net | 44,422 |
| | — |
| | (4,317 | ) | | 40,105 |
| | |
| Loans including premiums, discounts and deferred fees and costs | 20,072,454 |
| | 475,940 |
| | 62,036 |
| | 20,610,430 |
| | |
| Allowance for loan and lease losses | (153,725 | ) | | (1,812 | ) | | (3,036 | ) | | (158,573 | ) | | |
| Loans, net | $ | 19,918,729 |
| | $ | 474,128 |
| | $ | 59,000 |
| | $ | 20,451,857 |
| | |
|
| | | | | | | | | | | | | | | | | | |
| | December 31, 2016 |
| |
| | Covered Loans | | | | Percent of Total |
| | Non-Covered Loans | | ACI | | Non-ACI | | Total | |
| Residential and other consumer: | |
| | |
| | |
| | |
| | |
|
| 1-4 single family residential | $ | 3,422,425 |
| | $ | 532,348 |
| | $ | 36,675 |
| | $ | 3,991,448 |
| | 20.6 | % |
| Home equity loans and lines of credit | 1,120 |
| | 3,894 |
| | 47,629 |
| | 52,643 |
| | 0.3 | % |
| Other consumer loans | 24,365 |
| | — |
| | — |
| | 24,365 |
| | 0.1 | % |
| | 3,447,910 |
| | 536,242 |
| | 84,304 |
| | 4,068,456 |
| | 21.0 | % |
| Commercial: | | | | | | | | | |
| Multi-family | 3,824,973 |
| | — |
| | — |
| | 3,824,973 |
| | 19.8 | % |
| Non-owner occupied commercial real estate | 3,739,235 |
| | — |
| | — |
| | 3,739,235 |
| | 19.3 | % |
| Construction and land | 311,436 |
| | — |
| | — |
| | 311,436 |
| | 1.6 | % |
| Owner occupied commercial real estate | 1,736,858 |
| | — |
| | — |
| | 1,736,858 |
| | 9.0 | % |
| Commercial and industrial | 3,391,614 |
| | — |
| | — |
| | 3,391,614 |
| | 17.5 | % |
| Commercial lending subsidiaries | 2,280,685 |
| | — |
| | — |
| | 2,280,685 |
| | 11.8 | % |
| | 15,284,801 |
| | — |
| | — |
| | 15,284,801 |
| | 79.0 | % |
| Total loans | 18,732,711 |
| | 536,242 |
| | 84,304 |
| | 19,353,257 |
| | 100.0 | % |
| Premiums, discounts and deferred fees and costs, net | 48,641 |
| | — |
| | (6,504 | ) | | 42,137 |
| | |
| Loans including premiums, discounts and deferred fees and costs | 18,781,352 |
| | 536,242 |
| | 77,800 |
| | 19,395,394 |
| | |
| Allowance for loan and lease losses | (150,853 | ) | | — |
| | (2,100 | ) | | (152,953 | ) | | |
| Loans, net | $ | 18,630,499 |
| | $ | 536,242 |
| | $ | 75,700 |
| | $ | 19,242,441 |
| | |
|
| | | | | | | | | | | | | |
| | June 30, 2020 | | December 31, 2019 |
| | Total | | Percent of Total | | Total | | Percent of Total |
| Residential and other consumer loans | $ | 5,577,807 |
| | 23.5 | % | | $ | 5,661,119 |
| | 24.5 | % |
| Multi-family | 1,893,753 |
| | 7.9 | % | | 2,217,705 |
| | 9.6 | % |
| Non-owner occupied commercial real estate | 4,940,531 |
| | 20.7 | % | | 5,030,904 |
| | 21.7 | % |
| Construction and land | 246,609 |
| | 1.0 | % | | 243,925 |
| | 1.1 | % |
| Owner occupied commercial real estate | 2,041,346 |
| | 8.6 | % | | 2,062,808 |
| | 8.9 | % |
| Commercial and industrial | 4,691,326 |
| | 19.7 | % | | 4,655,349 |
| | 20.1 | % |
| PPP | 827,359 |
| | 3.5 | % | | — |
| | — | % |
| Pinnacle | 1,242,506 |
| | 5.1 | % | | 1,202,430 |
| | 5.2 | % |
| Bridge - franchise finance | 623,139 |
| | 2.6 | % | | 627,482 |
| | 2.6 | % |
| Bridge - equipment finance | 589,785 |
| | 2.5 | % | | 684,794 |
| | 3.0 | % |
| Mortgage warehouse lending | 1,160,728 |
| | 4.9 | % | | 768,472 |
| | 3.3 | % |
| Total loans | 23,834,889 |
| | 100.0 | % | | 23,154,988 |
| | 100.0 | % |
| Allowance for credit losses | (266,123 | ) | | | | (108,671 | ) | | |
| Loans, net | $ | 23,568,766 |
| | | | $ | 23,046,317 |
| | |
Total loans, including premiums, discounts and deferred fees and costs, increased by $1.2 billion to $20.6 billion at SeptemberFor the six months ended June 30, 2017, from $19.4 billion at December 31, 2016. Non-covered2020, total loans grew by $1.3 billion while covered$680 million, primarily driven by $827 million in PPP loans declinedand a $392 million increase in mortgage warehouse outstandings due to increased utilization. The decline in multi-family balances was driven primarily by $76 million from December 31, 2016 to September 30, 2017. Non-covered residential and other consumer loans grew by $538 million and non-covered commercial loans grew by $753 million during the nine months ended September 30, 2017.
Growth in non-covered loans, including premiums, discounts and deferred fees and costs, for the nine months ended September 30, 2017 reflected an increasecontinued runoff of $536 million for the Florida franchise, a decrease of $74 million for the New York franchise and an increase of $829 millionportfolio. Residential activity for the national platforms.
six months ended June 30, 2020 included purchases of approximately $529 million in GNMA early buyout loans, offset by approximately $400 million in re-poolings and paydowns. The following tables show the compositionresidential portfolio, excluding GNMA early buyout loans, experienced a net decline of the non-covered loan portfolio and the breakdown among the Florida and New York franchises and national platforms at the dates indicated. Amounts include premiums, discounts and deferred fees and costs (dollars in thousands):
|
| | | | | | | | | | | | | | | |
| | September 30, 2017 |
| | Florida | | New York | | National | | Total |
| Residential and other consumer | $ | 228,300 |
| | $ | 206,308 |
| | $ | 3,599,004 |
| | $ | 4,033,612 |
|
| Commercial: | | | | | | | |
| Multi-family | 555,193 |
| | 2,807,068 |
| | — |
| | 3,362,261 |
|
| Non-owner occupied commercial real estate | 2,572,743 |
| | 1,501,597 |
| | 99,229 |
| | 4,173,569 |
|
| Construction and land | 123,655 |
| | 134,854 |
| | 12,947 |
| | 271,456 |
|
| Owner occupied commercial real estate | 1,110,581 |
| | 748,339 |
| | 97,829 |
| | 1,956,749 |
|
| Commercial and industrial | 2,509,353 |
| | 891,978 |
| | 490,751 |
| | 3,892,082 |
|
| Commercial lending subsidiaries | — |
| | — |
| | 2,382,725 |
| | 2,382,725 |
|
| | $ | 7,099,825 |
| | $ | 6,290,144 |
| | $ | 6,682,485 |
| | $ | 20,072,454 |
|
| | 35.4 | % | | 31.3 | % | | 33.3 | % | | 100.0 | % |
|
| | | | | | | | | | | | | | | |
| | December 31, 2016 |
| | Florida | | New York | | National | | Total |
| Residential and other consumer: | $ | 254,139 |
| | $ | 226,154 |
| | $ | 3,015,482 |
| | $ | 3,495,775 |
|
| Commercial: | | | | | | | |
| Multi-family | 520,263 |
| | 3,309,411 |
| | — |
| | 3,829,674 |
|
| Non-owner occupied commercial real estate | 2,337,806 |
| | 1,294,231 |
| | 99,771 |
| | 3,731,808 |
|
| Construction and land | 174,494 |
| | 125,983 |
| | 10,436 |
| | 310,913 |
|
| Owner occupied commercial real estate | 1,042,441 |
| | 602,155 |
| | 91,254 |
| | 1,735,850 |
|
| Commercial and industrial | 2,234,393 |
| | 806,660 |
| | 346,085 |
| | 3,387,138 |
|
| Commercial lending subsidiaries | — |
| | — |
| | 2,290,194 |
| | 2,290,194 |
|
| | $ | 6,563,536 |
| | $ | 6,364,594 |
| | $ | 5,853,222 |
| | $ | 18,781,352 |
|
| | 34.9 | % | | 33.9 | % | | 31.2 | % | | 100.0 | % |
The increase in non-owner occupied commercial real estate loans and the decrease in multi-family loansapproximately $212 million driven by higher prepayment speeds in the New York franchise over the nine months ended September 30, 2017 includes the impact of reclassifying $207 million of loans on mixed-use properties from multi-family to non-owner occupied commercial real estate loans, based on the primary source of rental income on those properties.current rate environment.
Residential mortgages and other consumer loans
Residential mortgagesThe following table shows the composition of residential and other consumer loans totaled $4.5 billion, or 22.0% of total loans, at September 30, 2017 and $4.1 billion, or 21.0% of total loans, at December 31, 2016.the dates indicated (in thousands):
|
| | | | | | | |
| | June 30, 2020 | | December 31, 2019 |
| 1-4 single family residential | $ | 4,743,866 |
| | $ | 4,953,936 |
|
| Government insured residential | 826,238 |
| | 698,644 |
|
| Other consumer loans | 7,703 |
| | 8,539 |
|
| | $ | 5,577,807 |
| | $ | 5,661,119 |
|
The non-covered1-4 single family residential loan portfolio, excluding government insured residential loans, is primarily comprised of loans purchased on a national basis through established correspondent channels. The portfolio also includes loans originated through retail channels in our Florida and New York geographic footprint prior to the termination of our retail residential mortgage origination business in early 2016. Non-covered1-4 single family residential mortgage loans are primarily closed-end, first lien jumbo mortgages for the purchase or re-finance of owner occupied property. The loans have terms ranging from 10 to 30 years, with either fixed or adjustable interest rates. At SeptemberJune 30, 2017, $1132020, $507 million or 2.8%11% were secured by investor-owned properties.
The Company acquires non-performing FHA and VA insured mortgages from third party servicers who have exercised their right to purchase these loans out of non-covered residential mortgageGNMA securitizations (collectively, "government insured pool buyout loans" or "buyout loans"). Buyout loans were interest-onlythat re-perform, either through modification or self-cure, may be eligible for re-securitization. The Company and the servicer share in the economics of the sale of these loans substantially allinto new securitizations. The balance of which begin amortizing 10 years after origination.buyout loans totaled $805 million at June 30, 2020. The Company is not the servicer of these loans.
We do not originate or acquire option ARMs, “no-doc” or “reduced-doc” mortgages and do not utilize wholesale mortgage origination channels although the covered loan portfolio contains loans with these characteristics. The Company’s exposure to future losses on these mortgage loans is mitigated by the Single Family Shared-Loss Agreement.
The following charts present the distribution of the
non-covered 1-4 single family residential mortgage portfolio
by interest rate terms and contractual lives at the dates indicated:
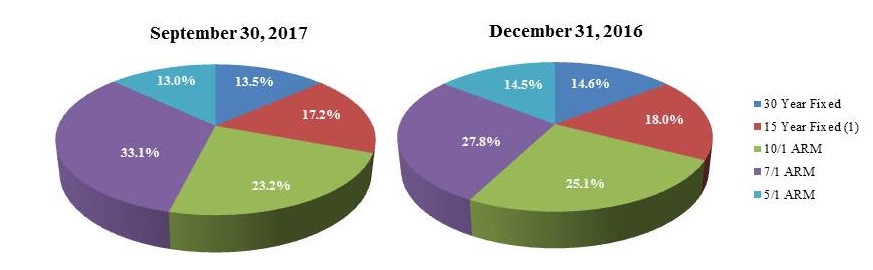
| |
(1) | Fixed-rate loans with contractual terms of 20 years comprise less than 3% of the total at both September 30, 2017 and December 31, 2016, and are reported with 15 year fixed above. |
The following table presents the five states with the largest geographic concentrationconcentrations of the non-covered 1-4 single family residential portfolio is summarized as followsloans, excluding government insured residential loans, at the dates indicated (dollar(dollars in thousands):
|
| | | | | | | | | | | | | |
| | September 30, 2017 | | December 31, 2016 |
| California | $ | 1,052,154 |
| | 26.2 | % | | $ | 904,107 |
| | 26.1 | % |
| New York | 848,123 |
| | 21.1 | % | | 763,824 |
| | 22.0 | % |
| Florida | 530,056 |
| | 13.2 | % | | 487,294 |
| | 14.0 | % |
| District of Columbia | 177,978 |
| | 4.4 | % | | 123,825 |
| | 3.6 | % |
| Virginia | 175,550 |
| | 4.4 | % | | 152,113 |
| | 4.4 | % |
Others (1) | 1,227,983 |
| | 30.7 | % | | 1,039,186 |
| | 29.9 | % |
| | $ | 4,011,844 |
| | 100.0 | % | | $ | 3,470,349 |
| | 100.0 | % |
| |
(1) | No other state represented borrowers with more than 4.0% of non-covered 1-4 single family residential loans outstanding at September 30, 2017 or December 31, 2016. |
Home equity loans and lines of credit are not significant to the non-covered loan portfolio.
Other consumer loans are comprised primarily of consumer installment financing, loans secured by certificates of deposit, unsecured personal lines of credit and demand deposit account overdrafts. |
| | | | | | | | | | | | | |
| | June 30, 2020 | | December 31, 2019 |
| | Total | | Percent of Total | | Total | | Percent of Total |
| California | $ | 1,333,404 |
| | 28.1 | % | | $ | 1,280,243 |
| | 25.8 | % |
| New York | 1,072,564 |
| | 22.6 | % | | 1,057,926 |
| | 21.4 | % |
| Florida | 548,488 |
| | 11.6 | % | | 597,359 |
| | 12.1 | % |
| Virginia | 175,221 |
| | 3.7 | % | | 189,869 |
| | 3.8 | % |
| New Jersey | 172,483 |
| | 3.6 | % | | 189,018 |
| | 3.8 | % |
| Others | 1,441,706 |
| | 30.4 | % | | 1,639,521 |
| | 33.1 | % |
| | $ | 4,743,866 |
| | 100.0 | % | | $ | 4,953,936 |
| | 100.0 | % |
Commercial loans and leases
TheCommercial loans include commercial portfolio segment includesand industrial loans and leases, loans secured by owner-occupied commercial real-estate, multi-family properties loans secured by both owner-occupied and other income-producing non-owner occupied commercial real estate, a limited amount of construction and land loans, commercial and industrialSBA loans, mortgage warehouse lines of credit, PPP loans, municipal loans and direct financing leases.leases originated by Pinnacle and franchise and equipment finance loans and leases originated by Bridge.
Management’s loan origination strategy is heavily focused on
The following charts present the distribution of the commercial loan portfolio segment, which comprised 80.1% and 81.6% of non-covered loans as of September 30, 2017 and December 31, 2016, respectively.at the dates indicated (dollars in millions):
Commercial real estate loans include term loans secured by owner and non-owner occupied income producing properties including rental apartments, mixed-use properties, industrial properties, retail shopping centers, free-standing single-tenant buildings, office buildings, warehouse facilities, and hotels, as well as real estate secured lines of credit.credit, as well as credit facilities to institutional real estate entities such as REITs and commercial real estate investment funds.
The following charts presenttable presents the distribution of non-owner occupied commercial real estate loans by product typesproperty type along with weighted average DSCRs and LTVs at June 30, 2020 (dollars in thousands).
|
| | | | | | | | | | | | |
| | Amortized Cost | | Percent of Total | | Weighted Average DSCR | | Weighted Average LTV |
| Office | $ | 2,079,560 |
| | 29.3 | % | | 2.17 |
| | 59.0 | % |
| Multifamily | 2,010,289 |
| | 28.4 | % | | 1.77 |
| | 56.0 | % |
| Retail | 1,437,681 |
| | 20.3 | % | | 1.61 |
| | 59.3 | % |
| Warehouse/Industrial | 783,387 |
| | 11.1 | % | | 2.52 |
| | 55.5 | % |
| Hotel | 620,673 |
| | 8.8 | % | | 1.59 |
| | 57.1 | % |
| Other | 149,303 |
| | 2.1 | % | | 1.66 |
| | 48.9 | % |
| | $ | 7,080,893 |
| | 100.0 | % | | 1.92 |
| | 57.4 | % |
DSCRs and LTVs in the dates indicated:table above are based on the most recent information available, which may not be fully reflective of the ultimate impact of the COVID-19 pandemic on borrowers' financial condition or property values.
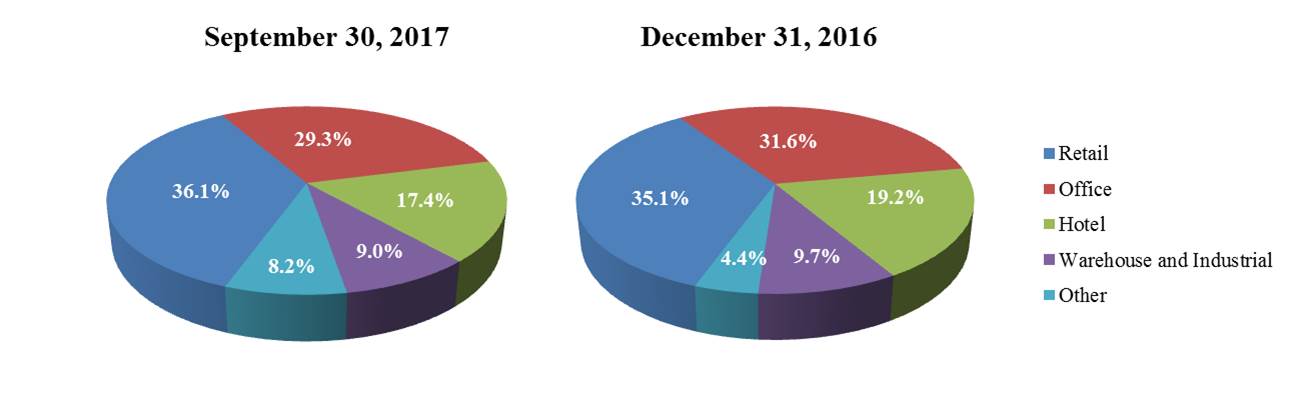
Loans secured byThe Company’s commercial real estate typically have shorter repayment periods and re-price more frequently than 1-4 single family residential loans but may have longer terms and re-price less frequently than commercial and industrial loans. The Company’s underwriting standards generally provide for loan terms of five to tenseven years, with amortization schedules of no more than thirty years. LTV ratios are typically limited to no more than 80%75%. Owner-occupied commercial real estate loans typically have risk profiles more closely aligned with that of commercial and industrial loans than with other types of commercial real estate loans. Construction and land loans, included by property type in the table above, represented only 1.3%1% of the total loan portfolio at SeptemberJune 30, 2017.2020. Construction and land loans are generally made for projects expected to stabilize within eighteen months of completion
in sub-markets with strong fundamentals and, to a lesser extent, for-sale residential projects to experienced developers with a strong cushion between market prices and loan basis. 75% of the commercial real estate portfolio, including 79% and 76% of the retail and hotel segments, respectively, had LTVs less than 65% at June 30, 2020.
The New York legislature has enacted a number of rent regulation reform measures that generally have the impact of limiting landlords' ability to increase rents on stabilized units and to convert stabilized units to market rate units. The following table presents the amount of loans secured by New York multi-family properties in which some or all units are rent regulated at June 30, 2020 (in thousands):
|
| | | |
| Loans secured by stabilized properties subject to rent regulation | $ | 957,439 |
|
| Loans secured by non-stabilized properties subject to rent regulation | 58,333 |
|
| | $ | 1,015,772 |
|
We believe loans secured by non-stabilized properties may present a heightened level of risk as these loans were underwritten to expected cash flows upon stabilization; those expected cash flows may be impacted by the recent rent regulation reform measures.
The following tables present the distribution of stabilized rent-regulated multi-family loans, by DSCR and LTV at June 30, 2020 (in thousands):
|
| | | | | |
| DSCR | | | |
| Less than 1.11 | | | $ | 101,129 |
|
| 1.11 - 1.24 | | | 284,101 |
|
| 1.25 - 1.50 | | | 288,910 |
|
| 1.51 or greater | | | 283,299 |
|
| | | | $ | 957,439 |
|
|
| | | | | |
| LTV | | | |
| Less than 50% | | | $ | 243,997 |
|
| 50% - 65% | | | 610,258 |
|
| 66% - 75% | | | 97,524 |
|
| More than 75% | | | 5,660 |
|
| | | | $ | 957,439 |
|
The LTVs in the table above are based on the most recent appraisal obtained, which may not be fully reflective of changes in valuations that may result from the impact of the rent regulation reforms. Loans with DSCR less than 1.11 may be those with temporary vacancies or those for which expenses, particularly real estate taxes, have increased more rapidly than rents. Substantially all of the loans included in the tables above are current and performing.
Commercial and industrial loans are typically made to small, and middle market and larger corporate businesses and not-for-profit entities and include equipment loans, secured and unsecured working capital facilities, formula-based loans, mortgage warehouse lines, taxi medallion loans,trade finance, SBA product offerings and business acquisition finance credit facilities. These loans may be structured as term loans, typically with maturities of threefive to seven years, or revolving lines of credit which may have multi-year maturities. The Bank also provides financing to state and local governmental entities generally within our geographic markets. Commercial loans includeincluded shared national credits totaling $1.5$2.6 billion at SeptemberJune 30, 2017, typically2020, the majority of which were relationship based loans to borrowers in our geographic footprint.Florida and New York. The Bank makes loans secured by owner-occupied commercial real estate that typically have risk profiles more closely aligned with that of commercial and industrial loans than with other types of commercial real estate loans.
The following table presents the exposure in the commercial and industrial portfolio, including $2.0 billion of owner-occupied commercial real estate loans, by industry at June 30, 2020 (in thousands):
|
| | | | | | |
| | Amortized Cost | | Percent of Total |
| Finance and Insurance | $ | 1,007,480 |
| | 15.1 | % |
| Wholesale Trade | 719,847 |
| | 10.7 | % |
| Educational Services | 640,657 |
| | 9.5 | % |
| Transportation and Warehousing | 507,305 |
| | 7.5 | % |
| Health Care and Social Assistance | 472,793 |
| | 7.0 | % |
| Manufacturing | 375,569 |
| | 5.6 | % |
| Accommodation and Food Services | 358,635 |
| | 5.3 | % |
| Retail Trade | 332,421 |
| | 4.9 | % |
| Information | 298,465 |
| | 4.4 | % |
| Real Estate and Rental and Leasing | 288,045 |
| | 4.3 | % |
| Professional, Scientific, and Technical Services | 277,081 |
| | 4.1 | % |
| Construction | 273,685 |
| | 4.1 | % |
| Public Administration | 244,967 |
| | 3.6 | % |
| Administrative and Support and Waste Management | 239,441 |
| | 3.5 | % |
| Other Services (except Public Administration) | 238,933 |
| | 3.5 | % |
| Arts, Entertainment, and Recreation | 215,999 |
| | 3.2 | % |
| Utilities | 188,808 |
| | 2.8 | % |
| Other | 52,541 |
| | 0.9 | % |
| | $ | 6,732,672 |
| | 100.0 | % |
Through its commercial lending subsidiaries, Pinnacle and Bridge, the Bank provides equipment and franchise financing on a national basis using both loan and lease structures. Pinnacle provides essential use equipment financing to state and local governmental entities directly and through vendor programs and alliances. Pinnacle offers a full array of financing structures including equipment lease purchase agreements and direct (private placement) bond re-fundings and loan agreements. Bridge has two operating divisions. The franchise finance division offers franchise acquisition, expansion and equipment financing, typically to experienced operators in well-established concepts. The franchise finance portfolio is made up primarily of quick service restaurant and fitness concepts comprising 61% and 31% of the portfolio, respectively. The equipment finance division provides primarily transportation equipment financing through a variety of loan and lease structures. The Bank's SBF unit primarily originates SBA guaranteed commercial and commercial real estate loans, generally selling the guaranteed portion in the secondary market and retaining the unguaranteed portion in portfolio. The Bank also engages in mortgage warehouse lending on a national basis.
The Company originated over 3,500 SBA PPP loans totaling $876 million during the quarter ended June 30, 2020. These loans bear interest at 1% and are guaranteed as to principal and interest by the SBA. They have terms of 2 years, and are eligible for earlier forgiveness under the terms of the PPP in prescribed circumstances. The Company also received origination fees associated with these loans; $21 million of these fees remain to be recognized in income as of June 30, 2020.
Geographic Concentrations
The Company's commercial and commercial real estate portfolios are concentrated in Florida and the Tri-state area. Excluding loans originated through our national platforms, 47% and 44% of commercial real estate loans were secured by collateral located in Florida and the Tri-state area, respectively; while 54% and 27% of commercial and industrial and owner-occupied real estate loans were to borrowers in Florida and the Tri-state area, respectively.
The following table presents the recorded investment infive states with the largest concentration of commercial loans and direct finance leases held for investment for each oforiginated through our national commercial lending platforms, including Bridge, Pinnacle, SBF and our mortgage warehouse finance unit at the dates indicated (in thousands):
|
| | | | | | | |
| | September 30, 2017 | | December 31, 2016 |
| Pinnacle | $ | 1,393,965 |
| | $ | 1,317,820 |
|
| Bridge - franchise finance | 421,821 |
| | 426,661 |
|
| Bridge - transportation equipment finance | 566,939 |
| | 545,713 |
|
| SBF | 235,433 |
| | 225,241 |
|
| Mortgage warehouse lending | 465,323 |
| | 322,305 |
|
| | $ | 3,083,481 |
| | $ | 2,837,740 |
|
The geographic concentration of the commercial loans and direct financing leases in the national platforms is summarized as follows at the dates indicated. Amounts include premiums, discounts and deferred fees and costs (dollars in thousands):
|
| | | | | | | | | | | | | |
| | September 30, 2017 | | December 31, 2016 |
| Florida | $ | 593,307 |
| | 19.2 | % | | $ | 543,445 |
| | 19.2 | % |
| California | 464,853 |
| | 15.1 | % | | 421,480 |
| | 14.9 | % |
| Arizona | 171,321 |
| | 5.6 | % | | 133,549 |
| | 4.7 | % |
| Texas | 161,662 |
| | 5.2 | % | | 118,122 |
| | 4.2 | % |
| Iowa | 152,869 |
| | 5.0 | % | | 161,874 |
| | 5.7 | % |
| Virginia | 131,041 |
| | 4.2 | % | | 138,417 |
| | 4.9 | % |
| All others (1) | 1,408,428 |
| | 45.7 | % | | 1,320,853 |
| | 46.4 | % |
| | $ | 3,083,481 |
| | 100.0 | % | | $ | 2,837,740 |
| | 100.0 | % |
|
| | | | | | | | | | | | | |
| | June 30, 2020 | | December 31, 2019 |
| | Total | | Percent of Total | | Total | | Percent of Total |
| California | $ | 650,706 |
| | 16.8 | % | | $ | 585,222 |
| | 16.5 | % |
| Florida | 457,859 |
| | 11.8 | % | | 465,146 |
| | 13.1 | % |
| New Jersey | 339,873 |
| | 8.8 | % | | 178,514 |
| | 5.0 | % |
| North Carolina | 207,298 |
| | 5.3 | % | | 146,146 |
| | 4.1 | % |
| Maryland | 187,639 |
| | 4.8 | % | | 152,663 |
| | 4.3 | % |
| All others | 2,038,326 |
| | 52.5 | % | | 2,018,704 |
| | 57.0 | % |
| | $ | 3,881,701 |
| | 100.0 | % | | $ | 3,546,395 |
| | 100.0 | % |
Operating lease equipment, net | |
(1) | No other state represented borrowers with more than 4.0% of loans outstanding at September 30, 2017 or December 31, 2016. |
Equipment under Operating Lease
Equipment under operating lease increased by $48 million to $588equipment, net of accumulated depreciation totaled $690 million at SeptemberJune 30, 2017, from $5402020, including off-lease equipment, net of accumulated depreciation totaling $89 million. The portfolio consists primarily of railcars, non-commercial aircraft and other transport equipment. We have a total of 5,313 railcars with a carrying value of $409 million at December 31, 2016. The portfolio consisted primarily of 5,424 railcars,June 30, 2020, including hoppers, tank cars, boxcars, auto carriers, center beams and gondolas leased to North American commercial end-users. The portfolio also included non-commercial aircraft and other transport equipment.end users. The largest concentrations of rail cars were 2,2642,411 hopper cars and 1,6831,594 tank cars, primarily used to ship sand and petroleum products, respectively, for the energy industry. Equipment with a
The chart below presents operating lease equipment by type at the dates indicated:
At June 30, 2020, the breakdown of carrying valuevalues of $288 million at September 30, 2017operating lease equipment, excluding equipment off-lease, by the year current leases are scheduled to expire was leased to companies for use in the energy industry.as follows (in thousands):
|
| | | |
| Years Ending December 31: | |
| 2020 | $ | 78,492 |
|
| 2021 | 60,237 |
|
| 2022 | 70,404 |
|
| 2023 | 40,812 |
|
| 2024 | 14,553 |
|
| Thereafter through 2034 | 335,829 |
|
| | $ | 600,327 |
|
Asset Quality
In discussing asset quality, we distinguish between covered loans and non-covered loans. Although the risk profile of covered loans is higher than that of non-covered loans, our exposure to loss related to covered loans is significantly mitigated by the fair value basis recorded in these loans resulting from the application of acquisition accounting and by the Single Family Shared-Loss Agreement. At September 30, 2017, residential loans covered under the Single Family Shared-Loss Agreement totaled $538 million.Commercial Loans
We have established a robust credit risk management framework, put in place an experienced team to lead the workout and recovery process for the commercial and commercial real estate portfolios and implemented a dedicated internal credit review function. WeIn response to the COVID-19 pandemic, we have an experienced resolution team in place for covered residential mortgage loans,further enhanced our workout and have implemented outsourcing arrangements with industry leading firms in certain areas such as OREO resolution.
recovery staffing and processes. Loan performance is monitored by our credit administration and workout and recovery departments. Generally, commercial relationships with balances in excess of defined thresholds are re-evaluated at least annually and more frequently if circumstances indicate that a change in risk rating may be warranted. The defined thresholds range from $1 million to $3 million. Additionally,Homogenous groups of smaller balance commercial loans may be monitored collectively. The credit quality and risk rating of commercial loans as well as our underwriting and portfolio management practices are regularly reviewed by our internal credit review department.
We believe internal risk rating is the best indicator of the credit quality of commercial loans. The Company utilizes a 13 grade internal asset risk classification system as part of its efforts to monitor and maintain commercial asset quality. LoansThe special mention rating is considered a transitional rating for loans exhibiting potential credit weaknesses that deserve management’s close attention and that if left uncorrected maycould result in deterioration of the repayment capacity of the borrower are categorized as special mention.prospects at some future date if not checked or corrected and that deserve management’s close attention. These borrowers may exhibit negative financial trendsdeclining cash flows or erratic financial performance, strained liquidity, marginal collateral coverage, declining industry trendsrevenues or weak management.increasing leverage. Loans with well-defined credit weaknesses that may result in a loss if the deficiencies are not corrected are assigned a risk rating of substandard. These borrowers may exhibit payment defaults, inadequate cash flows, operating losses, increasing balance sheet leverage, project cost overruns, unreasonable construction delays, exhausted interest reserves, declining collateral values, frequent overdrafts or past due real estate taxes. Loans with weaknesses so severe that collection in full is highly questionable or improbable, but because of certain reasonably specific pending factors have not been charged off, are assigned an internal risk rating of doubtful.
Residential mortgage loans and consumer loans are not individually risk rated. Delinquency status is the primary measure we use to monitor the credit quality of these loans. We also consider original LTV and FICO score to be significant indicators of credit quality for the non-covered 1-4 single family residential portfolio.
Although our assessment is ongoing and the results of that assessment are subject to change Beginning late in the future, we do not currently believefirst quarter and throughout the abilitysecond quarter of 2020, risk ratings were re-evaluated for a substantial portion of the substantial majority of our borrowers to repay theircommercial portfolio, with a particular focus on portfolio segments we identified for enhanced monitoring and loans or the valuefor which we granted temporary payment deferrals in light of the collateral securing those loans has been materially impacted by Hurricanes Irma and Harvey.
Non-covered Loans and Leases
Commercial Loans
The ongoing asset quality of significant commercial loans is monitored on an individual basis through our regular credit review and risk rating process. We believe internal risk rating is the best indicator of the credit quality of commercial loans. Homogenous groups of smaller balance commercial loans may be monitored collectively.COVID-19 pandemic.
The following table summarizes the Company's commercial credit exposure, based on internal risk rating, at the dates indicated (dollars in thousands):
|
| | | | | | | | | | | | | | | | | | | | |
| | June 30, 2020 | | March 31, 2020 | | December 31, 2019 |
| | Amortized Cost | | Percent of Commercial Loans | | Amortized Cost | | Percent of Commercial Loans | | Amortized Cost | | Percent of Commercial Loans |
| Pass | $ | 16,169,767 |
| | 88.6 | % | | $ | 16,841,243 |
| | 96.0 | % | | $ | 17,054,702 |
| | 97.5 | % |
| Special mention | 1,338,232 |
| | 7.3 | % | | 288,148 |
| | 1.6 | % | | 72,881 |
| | 0.4 | % |
| Substandard accruing | 560,624 |
| | 3.1 | % | | 238,786 |
| | 1.4 | % | | 180,380 |
| | 1.0 | % |
| Substandard non-accruing | 187,510 |
| | 1.0 | % | | 181,278 |
| | 1.0 | % | | 185,906 |
| | 1.1 | % |
| Doubtful | 949 |
| | — | % | | — |
| | — | % | | — |
| | — | % |
| | $ | 18,257,082 |
| | 100.0 | % | | $ | 17,549,455 |
| | 100.0 | % | | $ | 17,493,869 |
| | 100.0 | % |
It is possible, given the uncertainty surrounding the COVID-19 pandemic and related economic impacts, that the amount of criticized and classified assets could increase further in the future.
Both special mention and substandard accruing loans increased significantly at June 30, 2020 compared to March 31, 2020 and December 31, 2019. We believe the substantial majority of this increase to be directly related to the COVID-19 pandemic, its impact on the economy generally and on borrowers' businesses specifically. Special mention loans increased by $1.1 billion and $1.3 billion during the three and six months ended June 30, 2020, while substandard accruing loans increased by $322 million and $380 million for those same periods. Management has taken what we believe to be a pro-active and objective approach to re-risk rating the commercial loan portfolio based on granular outreach to borrowers since the onset of the pandemic.
The following table provides additional information about special mention and substandard accruing loans, at the dates indicated (in thousands):
|
| | | | | | | | |
| | | September 30, 2017 | | December 31, 2016 |
| Pass | | $ | 15,505,587 |
| | $ | 14,897,121 |
|
| Special mention | | 150,899 |
| | 72,225 |
|
Substandard (1) | | 376,540 |
| | 304,713 |
|
| Doubtful | | 5,816 |
| | 11,518 |
|
| | | $ | 16,038,842 |
| | $ | 15,285,577 |
|
|
| | | | | | | | | | | | | | | | | | | | |
| | June 30, 2020 | | March 31, 2020 | | December 31, 2019 |
| | Amortized Cost | | Percent of Loan Segment | | Amortized Cost | | Percent of Loan Segment | | Amortized Cost | | Percent of Loan Segment |
| Special mention: | | | | | | | | | | | |
| CRE: | | | | | | | | | | | |
| Hotel | $ | 273,877 |
| | 44.1 | % | | $ | 4,201 |
| | 0.7 | % | | $ | 4,227 |
| | 0.6 | % |
| Retail | 172,364 |
| | 12.0 | % | | 4,284 |
| | 0.3 | % | | — |
| | — | % |
| Multi-family | 54,623 |
| | 2.7 | % | | 4,471 |
| | 0.2 | % | | 115 |
| | — | % |
| Office | 29,735 |
| | 1.4 | % | | — |
| | — | % | | — |
| | — | % |
| Industrial | 12,968 |
| | 1.7 | % | | — |
| | — | % | | 1,489 |
| | — | % |
| Other | 1,393 |
| | 0.9 | % | | — |
| | — | % | | — |
| | — | % |
| | 544,960 |
| |
|
| | 12,956 |
| | | | 5,831 |
| | |
| Owner occupied commercial real estate | 179,305 |
| | 8.8 | % | | 26,170 |
| | 1.3 | % | | 27,870 |
| | 1.4 | % |
| Commercial and industrial | 243,398 |
| | 3.6 | % | | 67,173 |
| | 1.1 | % | | 28,498 |
| | 0.5 | % |
| Bridge - franchise finance | 327,375 |
| | 52.5 | % | | 181,049 |
| | 28 | % | | 10,682 |
| | 1.7 | % |
| Bridge - equipment finance | 43,194 |
| | 7.3 | % | | 800 |
| | 0.1 | % | | — |
| | — | % |
| | $ | 1,338,232 |
| | | | $ | 288,148 |
| | | | $ | 72,881 |
| | |
| | | | | | | | | | | | |
| Substandard accruing: | | | | | | | | | | | |
| CRE | | | | | | | | | | | |
| Hotel | $ | 92,066 |
| | 14.8 | % | | $ | 11,296 |
| | 1.8 | % | | $ | 34,645 |
| | 5.3 | % |
| Retail | 63,957 |
| | 4.4 | % | | 20,049 |
| | 1.4 | % | | — |
| | — | % |
| Multi-family | 67,896 |
| | 3.4 | % | | 35,691 |
| | 1.7 | % | | 26,797 |
| | 1.7 | % |
| Office | 28,994 |
| | 1.4 | % | | 6,214 |
| | 0.3 | % | | 8,299 |
| | 0.3 | % |
| Industrial | 19,814 |
| | 2.5 | % | | 9,675 |
| | 1.2 | % | | 9,753 |
| | 1.2 | % |
| Owner occupied commercial real estate | 38,332 |
| | 1.9 | % | | 24,520 |
| | 1.2 | % | | 16,241 |
| | 0.8 | % |
| Commercial and industrial | 185,201 |
| | 3.9 | % | | 77,810 |
| | 1.6 | % | | 43,518 |
| | 0.9 | % |
| Bridge - franchise finance | 56,628 |
| | 9.1 | % | | 53,531 |
| | 8.3 | % | | 41,127 |
| | 6.6 | % |
| Bridge - equipment finance | 7,736 |
| | 1.3 | % | | — |
| | — | % | | — |
| | — | % |
| | $ | 560,624 |
| | | | $ | 238,786 |
| | | | $ | 180,380 |
| | |
The increases in special mention and substandard accruing loans at June 30, 2020 were concentrated in those categories expected to exhibit additional stress in the current environment. Within the commercial real estate portfolio, the most significant increases were in the retail and hotel sub-segments as reflected in the table above. We also saw significant increases in special mention loans in the franchise finance portfolio; of a total increase of $317 million during the six months ended June 30, 2020, $154 million related to restaurant concepts and $163 million related to fitness concepts. In the C&I categories, the largest increases were in the cruise line, retail trade, food services and airport concession areas.
| |
(1) | The balance of substandard loans at September 30, 2017 and December 31, 2016 included $121 million and $138 million, respectively, of taxi medallion finance loans. Criticized and classified loans represented 3.3% of the commercial loan portfolio, of which 0.8% were taxi medallion loans, at September 30, 2017. See Note 4 to the consolidated financial statements for more detailed information about risk rating of commercial loans.Potential problem loans have been identified by management as those commercial loans included in the "substandard accruing" risk rating category. These loans are typically performing, but possess specifically identified credit weaknesses such |
Taxi Medallion
as inadequate debt service coverage or liquidity that, if not remedied, may lead to a downgrade to non-accrual status and identification as impaired in the near-term.
Payment Deferrals
The following table summarizes deferral activity in the commercial portfolio, through July 17, 2020 (dollars in millions).
|
| | | | | | | | | | | | | | | | | | | |
| | First Deferral Granted | | Re-Deferral Requested |
| | Loan Count | | UPB | | % of Portfolio | | Loan Count | | UPB | | % of Portfolio |
| CRE - Property Type: | | | | | | | | | | | |
| Retail | 119 |
| | $ | 769,025 |
| | 53 | % | | 8 |
| | $ | 75,890 |
| | 5 | % |
| Hotel | 93 |
| | 536,826 |
| | 86 | % | | 21 |
| | 298,388 |
| | 48 | % |
| Office | 30 |
| | 372,796 |
| | 18 | % | | 2 |
| | 54,243 |
| | 3 | % |
| Multifamily | 37 |
| | 276,711 |
| | 14 | % | | 2 |
| | 12,083 |
| | 1 | % |
| Industrial | 14 |
| | 97,776 |
| | 13 | % | | — |
| | — |
| | — | % |
| Other | 1 |
| | 1,060 |
| | 1 | % | | — |
| | — |
| | — | % |
| Total CRE - Property Type | 294 |
| | $ | 2,054,194 |
| | 29 | % | | 33 |
| | $ | 440,604 |
| | 6 | % |
| C&I - Industry | | | | | | | | | | | |
| Accommodation and Food Services | 89 |
| | $ | 106,288 |
| | 30 | % | | 21 |
| | $ | 65,729 |
| | 18 | % |
| Retail Trade | 221 |
| | 68,299 |
| | 20 | % | | 4 |
| | 21,575 |
| | 7 | % |
| Health Care and Social Assistance | 126 |
| | 59,305 |
| | 12 | % | | — |
| | — |
| | — | % |
| Manufacturing | 35 |
| | 57,026 |
| | 15 | % | | 1 |
| | 9,066 |
| | 2 | % |
| Other | 265 |
| | 178,512 |
| | 3 | % | | 1 |
| | 4,169 |
| | — | % |
| Total C&I - Industry | 736 |
| | 469,430 |
| | 7 | % | | 27 |
| | 100,539 |
| | 1 | % |
| BFG - Equipment | 35 |
| | 35,278 |
| | 6 | % | | — |
| | — |
| | — | % |
| BFG - Franchise | 362 |
| | 459,590 |
| | 74 | % | | 82 |
| | 155,321 |
| | 25 | % |
| Total Commercial | 1,427 |
| | $ | 3,018,492 |
| | 17 | % | | 142 |
| | $ | 696,464 |
| | 4 | % |
For commercial borrowers, initial payment deferrals were typically deferrals of principal and/or interest payments for 90 days. Re-deferrals usually take the form of additional 90 day extensions, granted on a case by case basis. The deferred payments along with interest accrued during the deferral period are generally due and payable on the maturity date.
We believe deferral rates, and particularly the rate at which borrowers have requested a second deferral, are important indicators of the extent to which borrowers' businesses and financial condition have been impacted by the COVID-19 pandemic. The majority of initial deferrals were granted in late March and April, 2020. Most of those loans have reached, or are now reaching, the end of the initial 90 day deferral period. New initial deferral requests received after June 1 were negligible.
The following table presents additional information about loan portfolio sub-segments that, in light of evolving conditions related to the COVID-19 pandemic, have been identified for enhanced monitoring as of June 30, 2020 (dollars in thousands):
|
| | | | | | | | | | | | | | | | | | |
| | June 30, 2020 |
| | Amortized Cost | | Percent of Total Loans | | Non Performing | | Special Mention | | Substandard Accruing |
| Retail - CRE | $ | 1,437,681 |
| | 6.0 | % | | $ | 10,968 |
| | $ | 172,364 |
| | $ | 63,957 |
|
| Retail - C&I | 332,421 |
| | 1.4 | % | | 4,238 |
| | 54,873 |
| | 20,894 |
|
| BFG - franchise finance | 623,139 |
| | 2.6 | % | | 32,857 |
| | 327,375 |
| | 56,628 |
|
| Hotel | 620,673 |
| | 2.6 | % | | 32,827 |
| | 273,877 |
| | 92,066 |
|
| Airlines and aviation authorities | 163,846 |
| | 0.7 | % | | — |
| | 27,050 |
| | — |
|
| Cruise line | 74,696 |
| | 0.3 | % | | — |
| | 59,886 |
| | — |
|
| Energy | 56,310 |
| | 0.2 | % | | — |
| | — |
| | — |
|
| | $ | 3,308,766 |
| | 13.8 | % | | $ | 80,890 |
| | $ | 915,425 |
| | $ | 233,545 |
|
Retail Exposure in the CRE Portfolio
The predominant collateral types supporting this sub-segment include both anchored and unanchored suburban and urban retail properties, some single tenant properties as well as some mixed-use properties with a significant retail component. We have no significant large shopping mall or "big box" exposure. The weighted average LTV for this sub-segment is 59.3% and 79% has LTVs less than 65%, based on the most recently available information.
Retail Exposure in the C&I Portfolio
This is a well-diversified sub-segment by industry. The largest exposure is to gas stations, generally with convenience stores, representing $99 million, or 29% of the sub-segment. 67% of loans in this sub-segment are collateralized by owner-occupied real estate.
BFG - Franchise Finance
The commercialfollowing table presents the franchise portfolio by concept at June 30, 2020:
|
| | | | | | |
| | Amortized Cost | | Percent of BFG Franchise Finance |
| Restaurant concepts: | | | |
| Burger King | $ | 66,012 |
| | 11.0 | % |
| Dunkin Donuts | 44,737 |
| | 7.0 | % |
| Sonic | 27,586 |
| | 4.0 | % |
| Domino's | 23,370 |
| | 4.0 | % |
| Jimmy Johns | 23,359 |
| | 4.0 | % |
| Other | 193,958 |
| | 31.0 | % |
| | 379,022 |
| | 61.0 | % |
| Non-restaurant concepts: | | | |
| Planet Fitness | 107,303 |
| | 17.0 | % |
| Orange Theory Fitness | 86,654 |
| | 14.0 | % |
| Other | 50,160 |
| | 8.0 | % |
| | 244,117 |
| | 39.0 | % |
| | $ | 623,139 |
| | 100.0 | % |
Restaurant concepts that have established drive-through or delivery models are generally performing well in the current environment. Fitness concepts are beginning to re-open.
Hotel
This sub-segment is experiencing significant disruption in revenue due to social distancing measures arising from the pandemic. The weighted average LTV for this sub-segment is 57% and industrial76% has LTVs less than 65%, based on the most recent information available. The majority of our hotel exposure is in Florida at 75%, followed by 12% in New York. This sub-segment includes $60 million in SBA loans, of which $14 million is guaranteed. Substantially all hotel collateral properties have now re-opened for business.
Airlines and Aviation Authorities
These borrowers have directly benefited from government relief programs enacted in response to the COVID-19 pandemic.
Energy
Recent declines in oil prices have elevated this sub-segment to a level of enhanced monitoring. The Company's energy exposure in the loan portfolio includes exposure to taxi medallion financeis not material; approximately 64% of $121 million at September 30, 2017. The estimated value of underlying taxi medallion collateral and liquidity in the market for sales of medallions, a potential secondary source of repayment, have declined significantly in recent years due to competitive developments in the transportation-for-hire industry. Due to the ongoing trend of declining estimated cash flows from the operation of taxi medallions leading to declines in medallion valuations, the entire taxi medallion portfolio was placed on non-accrual status and risk rated substandard as of September 30, 2017. In addition, partial charge-offs were recognized on all taxi medallionthese loans with carrying values in excess of collateral values, determined using the cash flow template discussed below, to reduce the carrying value of those loans to this estimated collateral value.
We update our analysis of the cash flow generating capacity of the operation of New York City medallions on a regular basis using current available taxi industry data from which taxi medallion values and prospective debt service capacity are estimated. This analysis is based on an extensive data set obtained from the NYTLC and assumptions that we believe are reasonable estimates of fleet utilization and borrower expenses. We update our analysis of estimated medallion valuations on a quarterly basis, based on these cash flow capacity estimates. At September 30, 2017, our estimate of the value of New York City taxi medallions based on our cash flow template and consideration of estimated selling costs and declining trends in medallion values was $351,000 for both corporate and individual medallions. We used this value for purposes of determining the partial charge-offs and the value of repossessed medallions. See Note 10 to the consolidated financial statements for additional information about the valuation of New York City taxi medallions.
The taxi medallion portfolio had the following characteristics at September 30, 2017:
Approximately 97% of the portfolio secured directly by taxi medallions was concentrated in New York City.
Loans delinquent by 30 days or more totaled $13.2 million or 11.0% of the portfolio, compared to $40.8 million or 22.8% of the portfolio at December 31, 2016. Loans delinquent by 90 days or more totaled $10.4 million or 8.7% of the portfolio, compared to $29.2 million or 16.4% of the portfolio at December 31, 2016. The most significant factor contributing to the decrease in delinquencies was one large relationship that was brought current and restructured in the first quarter.
The portfolio included 173 loans modified in TDRs with a recorded investment of $92.4 million.
In the aggregate, the ALLL related to taxi medallion loans was 10.9% of the outstanding balance at September 30, 2017, compared to 6.0% at December 31, 2016. Charge-offs of $35.3 million and $47.1 million were recognized in the three and nine months ended September 30, 2017 related to taxi medallion loans.
We are no longer originating new taxi medallion loans. Our portfolio management strategies include, but are not limited to, working with borrowers experiencing cash flow challenges to provide short term relief and/or extended amortization periods, pro-actively attempting to refinance loans prior to maturity, continuing to monitor industry data and obtaining updated borrower and guarantor financial information. As taxi medallion loans approach maturity or are refinanced, we expect the number and amount of TDRs in this portfolio segment to continue to increase.
Hurricane Impact - Commercial Loans
Commercial loans totaling $1.9 million and $19.4 million had been modified or granted temporary payment deferrals as of September 30, 2017 and October 31, 2017, respectively, related to the recent hurricanes. Of these modifications and deferrals, none were determined to be TDRs due to the generally insignificant nature of the payment delays.
As of September 30 and October 31, 2017, respectively, commercial loans to borrowers that have significant business operations in or are secured by collateral in areas impacted by Hurricanes Irma and Harvey totaling approximately $4.7 million and $21.3 million were more than 30 days past due; $3.7 million of these loans were more than 30 days past due priormarine transport equipment.
Bridge also had exposure to the storms. Approximately $22.2energy industry in the operating lease equipment portfolio totaling $287 million at June 30, 2020, consisting of commercial loans have been downgraded to criticized or classified status through October 31, 2017 as a result of the impact of the storms.$229 million in railcars, $39 million in helicopters and $18 million in vessels.
Equipment Under
If current conditions persist, further deterioration could occur in this sector.
Operating Lease Equipment, net
FourTwo operating lease relationships with a carrying value of assets under lease with a carrying value totaling $81$35 million, all of which $75 million were exposures to the energy industry, were internally risk rated special mention or substandard at SeptemberJune 30, 2017. The present2020. On a quarterly basis, management performs an impairment analysis on assets with indicators of potential impairment. Potential impairment indicators include evidence of changes in residual value, macro-economic conditions, an extended period of remaining lease paymentstime off-lease, criticized or classified status, or management's intention to sell the asset at an amount potentially below its carrying value. At June 30, 2020, there were 22 operating leases for which a triggering event was met. Based on these leases totaled approximately $22a recoverability analysis performed, the Company recognized an impairment charge of $0.7 million at Septemberduring the six months ended June 30, 2017, of which $17 million were exposures to the energy industry. There have been no missed payments2020 related to theone operating lease portfolio to date. One relationship has been restructured to date, with no decrease in total minimum lease payments.relationship; this was not an energy exposure.
The primary risks inherent in the equipment leasing business are asset risk resulting from ownership of the equipment on operating lease and credit risk. Asset risk arises from fluctuations in supply and demand for the underlying leased equipment. Railcars are long-lived equipment with useful lives of approximately 35-50 years. The equipment is leased to commercial end-usersend users with original lease terms generally ranging from 3-9 years at September 30, 2017.three to ten years. We are exposed to the risk that, at the end of the lease term, the value of the asset will be lower than expected, potentially resulting in reduced future lease income over the remaining life of the asset or a lower sale value. Asset risk may also lead to changes in depreciation as a result of changes in the residual values of the operating leaseleased assets or through impairment of asset carrying values.
Asset risk is evaluated and managed by a dedicated internal staff of asset managers, managed by seasoned equipment finance professionals with a broad depth and breadth of experience in the leasing business. Additionally, we have partnered with an industry leading, experienced service provider who provides fleet management and servicing relating to the railcar fleet, including lease administration and reporting, a Regulation Y compliant full service maintenance program and railcar re-marketing. Risk is managed by setting appropriate residual values at inception and systematic reviews of residual values based on independent appraisals, performed at least annually. Additionally, our internal management team and our external service provider closely follow the rail markets, monitoring traffic flows, supply and demand trends and the impact of new technologies and regulatory requirements. Demand for railcars is sensitive to shifts in general and industry specific economic and market trends and shifts in trade flows from specific events such as natural or man-made disasters. We seek to mitigate these risks by leasing to a stable end-userend user base, by maintaining a relatively young and diversified fleet of assets that are expected to maintain stronger and more stable utilization rates despite impacts from unexpected events or cyclical trends and by staggering lease maturities. We regularly monitor the impact of lower oil prices on the estimated residual value of rail cars being used in the petroleum/natural gas extraction sector.
Credit risk in the leased equipment portfolio results from the potential default of lessees, possibly driven by obligor specific or industry-wide conditions, and is economically less significant than asset risk, because in the operating lease business, there is no extension of credit to the obligor. Instead, the lessor deploys a portion of the useful life of the asset. Credit losses, if any, will manifest through reduced rental income due to missed payments, time off lease, or lower rental payments due either to a restructuring or re-leasing of the asset to another obligor. Credit risk in the operating lease portfolio is managed and monitored utilizing credit administration infrastructure, processes and procedures similar to those used to manage and monitor credit risk in the commercial loan portfolio. We also mitigate credit risk in this portfolio by leasing only to high credit quality obligors.
We expect our operating lease portfolio to continue to grow, and we may expand into other asset classes.
Based on our initial analysis of the location and condition of equipment under operating lease, we do not currently believe there has been any significant damage to such equipment or to the ongoing operations of lessees from Hurricanes Irma and Harvey.
Residential and Other Consumer Loans
The majority of our non-coveredOur residential mortgage portfolio, excluding GNMA buyout loans, consists primarily of loans purchased through established correspondent channels. In general, we purchaseMost of our purchases are of performing jumbo mortgage loans which have FICO scores above 700, primarily are owner-occupied and full documentation, and have a current LTV of 80% or less although loans with LTVs higher than 80% may be extended to selected credit-worthy borrowers. We perform due diligence on the purchased loans for credit, compliance, counterparty, payment history and property valuation.
The following tables showWe have a dedicated residential credit risk management function, and the distributionresidential portfolio is monitored by our internal credit review function. Residential mortgage loans and consumer loans are not individually risk rated. Delinquency status is the primary measure we use to monitor the credit quality of non-coveredthese loans. We also consider original LTV and most recently available FICO score to be significant indicators of credit quality for the 1-4 single family residential portfolio, excluding government insured residential loans.
The following charts present information about the 1-4 single family residential portfolio, excluding government insured loans, by original FICO distribution, LTV distribution and LTV asvintage at June 30, 2020:
FICO scores are generally updated at least annually and LTVs are typically based on valuation at origination.
At June 30, 2020, the majority of the dates indicated:
|
| | | | | | | | | | | | | | | |
| | | September 30, 2017 |
| | | FICO |
| LTV | | 720 or less | | 721 - 740 | | 741 - 760 | | 761 or
greater | | Total |
| 60% or less | | 2.4 | % | | 2.8 | % | | 4.6 | % | | 20.4 | % | | 30.2 | % |
| 60% - 70% | | 2.3 | % | | 2.6 | % | | 3.5 | % | | 14.6 | % | | 23.0 | % |
| 70% - 80% | | 3.5 | % | | 4.4 | % | | 7.9 | % | | 27.2 | % | | 43.0 | % |
| More than 80% | | 0.6 | % | | 0.5 | % | | 0.6 | % | | 2.1 | % | | 3.8 | % |
| | | 8.8 | % | | 10.3 | % | | 16.6 | % | | 64.3 | % | | 100.0 | % |
|
| | | | | | | | | | | | | | | |
| | | December 31, 2016 |
| | | FICO |
| LTV | | 720 or less | | 721 - 740 | | 741 - 760 | | 761 or
greater | | Total |
| 60% or less | | 2.5 | % | | 3.2 | % | | 4.7 | % | | 21.7 | % | | 32.1 | % |
| 60% - 70% | | 2.3 | % | | 2.7 | % | | 3.6 | % | | 15.1 | % | | 23.7 | % |
| 70% - 80% | | 3.2 | % | | 4.3 | % | | 8.0 | % | | 26.1 | % | | 41.6 | % |
| More than 80% | | 0.7 | % | | 0.3 | % | | 0.4 | % | | 1.2 | % | | 2.6 | % |
| | | 8.7 | % | | 10.5 | % | | 16.7 | % | | 64.1 | % | | 100.0 | % |
At September 30, 2017, the non-covered 1-4 single family residential loan portfolio, had the following characteristics: substantially all were full documentation with a weighted-average FICO score of 765 and a weighted-average LTV of 66.6%. The majority of this portfolioexcluding government insured residential loans, was owner-occupied, with 87.9%81% primary residence, 8.3%8% second homes and 3.8%11% investment properties. In terms of vintage, 22.2% of the portfolio was originated pre-2014, 13.1% in 2014, 22.2% in 2015, 26.0% in 2016 and 16.5% in 2017.
Non-covered 1-4 single family residential loans, excluding government insured residential loans, past due more than 30 days totaled $17.1$63.9 million and $12.7$66.3 million at SeptemberJune 30, 20172020 and December 31, 2016,2019, respectively. The amount of these loans 90 days or more past due was $2.7$11.8 million and $2.1$11.1 million at SeptemberJune 30, 20172020 and December 31, 2016,2019, respectively.
Hurricane Impact- ResidentialAt June 30, 2020 and December 31, 2019 other consumer loans were all current.
The following table presents information related to 1-4 single familyabout residential mortgages with borrowers and/or collateral locatedloans granted payment deferrals as a result of the COVID-19 pandemic, as of June 30, 2020, excluding government insured residential loans (dollars in areas impacted by Hurricanes Irma and Harvey, at the dates indicated (in thousands)millions):
|
| | | | | | | |
| | September 30, 2017 | | October 31, 2017 |
| Past due more than 30 days: | | | |
| Covered loans | $ | 14,669 |
| | $ | 13,454 |
|
| Total | $ | 20,099 |
| | $ | 21,350 |
|
| Granted temporary payment deferrals: | | | |
| Covered loans | $ | 14,807 |
| | $ | 16,983 |
|
| Total | $ | 24,772 |
| | $ | 25,969 |
|
|
| | | | | | | | | | | | | | | | | | | | |
| | | | | | |
| | Balance | | % of Portfolio | | Balance | | % of Initial Deferrals | | Balance | | % of Portfolio |
| Residential | $ | 594 |
| | 13 | % | | $ | 252 |
| | 42 | % | | $ | 52 |
| | 1 | % |
Other Consumer Loans
Substantially all consumer loans were current at September 30, 2017. At December 31, 2016, there were no delinquent consumer loans.
Covered Loans
At September 30, 2017,For residential ACI loans totaled $476 million and residential non-ACI loans totaled $62 million, including premiums, discounts andborrowers, relief has typically taken the form of 90 day payment deferrals, with deferred fees and costs. All of these loans are covered under the Single Family Shared-Loss Agreement.
Covered residential loans were placed into homogenous poolspayments due at the timeend of the FSB Acquisition and90 day period. At the ongoingend of the 90 day deferral period, residential borrowers may either (i) make all payments due, (ii) be granted an additional deferral period or (iii) enter into a modification or repayment plan. As indicated in the table above, 42% of residential borrowers granted an initial deferral continued to make payments during the deferral period.
Under recently issued regulatory guidance, residential borrowers granted an initial 90 day deferral are automatically granted an additional 90 day deferral period unless they actively "opt out" of the additional deferral.
Note 4 to the consolidated financial statements presents additional information about key credit quality indicators and performancedelinquency status of these loans is monitored on a pool basis. We monitor the pools quarterly to determine whether any changes have occurred in expected cash flows that would be indicative of impairment or necessitate reclassification between non-accretable difference and accretable yield. At September 30, 2017, accretable yield on residential ACI loans totaled $511 million and non-accretable difference related to those loans totaled $227 million.
At September 30, 2017, the recorded investment in non-ACI 1-4 single family residential loans was $24.6 million; $1.6 million or 6.6% of these loans were 30 days or more past due and $0.9 million or 3.8% of these loans were 90 days or more past due. At September 30, 2017, the recorded investment in ACI 1-4 single family residential loans totaled $470.3 million; $34.2 million or 7.3% of these loans were delinquent by 30 days or more and $17.6 million or 3.7% were delinquent by 90 days or more.
At September 30, 2017, non-ACI home equity loans and lines of credit had an aggregate recorded investment of $37.4 million; $4.1 million or 11.1% of these loans were 30 days or more past due and $2.4 million or 6.3% were 90 days or more past due. ACI home equity loans and lines of credit had a carrying amount of $5.6 million at September 30, 2017; 13.5% of these loans were delinquent by 30 days or more.
Home equity lines of credit generally provide that payment terms be reset after an initial contractual period of interest only payments, requiring the pay down of principal through balloon payments or amortization. Additional information regarding ACI and non-ACI home equity lines of credit at September 30, 2017 is summarized as follows:
|
| | | | | |
| | ACI | | Non-ACI |
| Loans resetting from interest only: | |
| | |
|
| Previously reset | 72.3 | % | | 51.5 | % |
| Scheduled to reset within 12 months | 2.5 | % | | 5.5 | % |
| Scheduled to reset after 12 months | 25.2 | % | | 43.0 | % |
| | 100.0 | % | | 100.0 | % |
| Lien position: | |
| | |
|
| First liens | 10.3 | % | | 18.8 | % |
| Second or third liens | 89.7 | % | | 81.2 | % |
| | 100.0 | % | | 100.0 | % |
The Company's exposure to loss related to covered loans is significantly mitigated by the Single Family Shared-Loss Agreement and by the fair value basis recorded in these assets resulting from the application of acquisition accounting. Management regularly evaluates the impact of resets of interest only loans on default rates for the covered home equityloan portfolio.
Impaired Loans and Non-Performing Assets
Non-performing assets generally consist of (i) non-accrual loans, including loans that have been modified in TDRs and placed on non-accrual status, (ii) accruing loans that are more than 90 days contractually past due as to interest or principal, excluding ACIgovernment insured residential loans, and (iii) OREO and repossessed assets. Impaired loans also typically include loans modified in TDRs that are accruing and ACI loans or pools for which expected cash flows at acquisition (as adjusted for any additional cash flows expected to be collected arising from changes in estimates after acquisition) have been revised downward since acquisition, other than due to changes in interest rate indices and prepayment assumptions.
The following tablestable and charts summarize the Company's impairednon-performing loans and non-performing assets at the dates indicated (dollars in thousands):
|
| | | | | | | | | | | | | | | | | | | | | | | |
| | September 30, 2017 | | December 31, 2016 |
| | Covered
Assets | | Non-Covered
Assets | | Total | | Covered Assets | | Non-Covered Assets | | Total |
| Non-accrual loans | | | | | | | | | | | |
| Residential and other consumer: | | | | | | | | | | | |
| 1 - 4 single family residential | $ | 934 |
| | $ | 1,890 |
| | $ | 2,824 |
| | $ | 918 |
| | $ | 566 |
| | $ | 1,484 |
|
| Home equity loans and lines of credit | 2,369 |
| | — |
| | 2,369 |
| | 2,283 |
| | — |
| | 2,283 |
|
| Other consumer loans | — |
| | 332 |
| | 332 |
| | — |
| | 2 |
| | 2 |
|
| Total residential and other consumer loans | 3,303 |
| | 2,222 |
| | 5,525 |
| | 3,201 |
| | 568 |
| | 3,769 |
|
| Commercial: | | | | | | | | | | | |
| Non-owner occupied commercial real estate | — |
| | 9,930 |
| | 9,930 |
| | — |
| | 559 |
| | 559 |
|
| Construction and land | — |
| | 1,238 |
| | 1,238 |
| | — |
| | 1,238 |
| | 1,238 |
|
| Owner occupied commercial real estate | — |
| | 21,455 |
| | 21,455 |
| | — |
| | 19,439 |
| | 19,439 |
|
| Commercial and industrial | | | | | | | | | | |
|
|
| Taxi medallion loans | — |
| | 120,572 |
| | 120,572 |
| | — |
| | 60,660 |
| | 60,660 |
|
| Other commercial and industrial | — |
| | 27,569 |
| | 27,569 |
| | — |
| | 16,036 |
| | 16,036 |
|
| Commercial lending subsidiaries | — |
| | 16,625 |
| | 16,625 |
| | — |
| | 32,645 |
| | 32,645 |
|
| Total commercial loans | — |
| | 197,389 |
| | 197,389 |
| | — |
| | 130,577 |
| | 130,577 |
|
| Total non-accrual loans | 3,303 |
| | 199,611 |
| | 202,914 |
| | 3,201 |
| | 131,145 |
| | 134,346 |
|
| Non-ACI and new loans past due 90 days and still accruing | — |
| | 846 |
| | 846 |
| | — |
| | 1,551 |
| | 1,551 |
|
| Total non-performing loans | 3,303 |
| | 200,457 |
| | 203,760 |
| | 3,201 |
| | 132,696 |
| | 135,897 |
|
| OREO | 4,114 |
| | 1,661 |
| | 5,775 |
| | 4,658 |
| | 4,882 |
| | 9,540 |
|
| Repossessed assets | — |
| | 2,457 |
| | 2,457 |
| | — |
| | 3,551 |
| | 3,551 |
|
| Total non-performing assets | 7,417 |
| | 204,575 |
| | 211,992 |
| | 7,859 |
| | 141,129 |
| | 148,988 |
|
| Impaired ACI loans and pools on accrual status | 5,640 |
| | — |
| | 5,640 |
| | — |
| | 1,335 |
| | 1,335 |
|
| Performing TDRs | | | | | | | | | | |
|
|
| Taxi medallion loans | — |
| | — |
| | — |
| | — |
| | 36,848 |
| | 36,848 |
|
| Other | 10,786 |
| | 19,365 |
| | 30,151 |
| | 11,166 |
| | 26,282 |
| | 37,448 |
|
| Total impaired loans and non-performing assets | $ | 23,843 |
| | $ | 223,940 |
| | $ | 247,783 |
| | $ | 19,025 |
| | $ | 205,594 |
| | $ | 224,619 |
|
| | | | | | | | | | | | |
Non-performing loans to total loans (1) (3) | | | 1.00 | % | | 0.99 | % | | | | 0.71 | % | | 0.70 | % |
Non-performing assets to total assets (2) | | | 0.69 | % | | 0.72 | % | | | | 0.51 | % | | 0.53 | % |
ALLL to total loans (1) | | | 0.77 | % | | 0.77 | % | | | | 0.80 | % | | 0.79 | % |
| ALLL to non-performing loans | | | 76.69 | % | | 77.82 | % | | | | 113.68 | % | | 112.55 | % |
Net charge-offs to average loans (4) (5) | | | 0.40 | % | | 0.39 | % | | | | 0.13 | % | | 0.13 | % |
| | | | | | | | | | | | |
|
| | | | | | | |
| | June 30, 2020 | | December 31, 2019 |
| Non-accrual loans | | | |
| Residential and other consumer: | | | |
| 1-4 single family residential | $ | 11,234 |
| | $ | 18,877 |
|
| Other consumer loans | 1,949 |
| | 17 |
|
| Total residential and other consumer loans | 13,183 |
| | 18,894 |
|
| Commercial: | | | |
| Multi-family | 6,011 |
| | 6,138 |
|
| Non-owner occupied commercial real estate | 46,545 |
| | 40,097 |
|
| Construction and land | 3,703 |
| | 3,191 |
|
| Owner occupied commercial real estate | 30,493 |
| | 27,141 |
|
| Commercial and industrial | 67,702 |
| | 74,757 |
|
| Bridge - franchise finance | 32,857 |
| | 13,631 |
|
| Bridge - equipment finance | 1,148 |
| | 20,939 |
|
| Total commercial loans | 188,459 |
| | 185,894 |
|
| Total non-accrual loans | 201,642 |
| | 204,788 |
|
| Loans past due 90 days and still accruing | 2,606 |
| | — |
|
| Total non-performing loans | 204,248 |
| | 204,788 |
|
| OREO and repossessed assets | 4,956 |
| | 3,897 |
|
| Total non-performing assets | $ | 209,204 |
| | $ | 208,685 |
|
| | | | |
Non-performing loans to total loans (1) | 0.86 | % | | 0.88 | % |
Non-performing assets to total assets (1) | 0.60 | % | | 0.63 | % |
| ACL to total loans | 1.12 | % | | 0.47 | % |
| ACL to non-performing loans | 130.29 | % | | 53.07 | % |
Net charge-offs to average loans (2) | 0.20 | % | | 0.05 | % |
| |
| (1) | TotalNon-performing loans for purposesand assets include the guaranteed portion of calculating these ratios include premiums, discountsnon-accrual SBA loans totaling $45.7 million or 0.19% of total loans and deferred fees0.13% of total assets, at June 30, 2020; compared to $45.7 million or 0.20% of total loans and costs.0.14% of total assets, at December 31, 2019. |
| |
| (2) | Ratio for non-covered assets is calculated as non-performing non-covered assets to total assets. |
| |
(3) | Non-performing taxi medallion loans comprised 0.60% and 0.32% of total non-covered loans at September 30, 2017 and December 31, 2016, respectively. |
| |
(4) | Annualized for SeptemberJune 30, 2017. |
| |
(5) | The annualized ratio of charge-offs of taxi medallion loans to average non-covered loans was 0.33% and 0.06% for the nine months ended September 30, 2017 and the year ended December 31, 2016.2020. |
The increasesfollowing chart presents trends in the non-performing loans to total loans and non-performing assets to total assets ratios at September 30, 2017 compared to December 31, 2016 were primarily attributable toassets:
The following chart presents trends in non-performing loans by portfolio sub-segment (in millions):
The ultimate impact of the increase in non-accrual taxi medallion loans. The decreaserecent and evolving COVID-19 pandemic may not be reflected in the ALLLlevel of non-performing assets reported above. The potential effect on non-performing asset levels may be delayed in the near-term due to non-performing loans ratio at September 30, 2017 compared to December 31, 2016 was primarily attributable to increased charge-offs of taxi medallion loans during the three months ended September 30, 2017.government assistance and loan deferral programs.
Contractually delinquent ACIgovernment insured residential loans with remaining accretable yield are not reflectedexcluded from non-performing loans as non-accrual loans and are not considereddefined in the table above due to be non-performing assets because accretion continues to be recorded in income. Accretion continues to be recorded as long as there is an expectation of future cash flows in excess of carrying amount from these loans.their government guarantee. The carrying value of ACIsuch loans contractually delinquent by more than 90 days but on which income was still being recognized was $18$669 million and $16$529 million at SeptemberJune 30, 20172020 and December 31, 2016,2019, respectively. The increase of ACL to total loans and ACL to non-performing loans ratios at June 30, 2020 from December 31, 2019 is attributable to the adoption of CECL effective January 1, 2020 and the impact on the provision for credit losses recorded during the six months ended June 30, 2020 resulting from changes in economic conditions, our economic forecast and borrower financial performance as a result of COVID-19.
New commercialCommercial loans are placed on non-accrual status when (i) management has determined that full repayment of all contractual principal and interest is in doubt, or (ii) the loan is past due 90 days or more as to principal or interest unless the loan is well secured and in the process of collection. NewResidential and non-ACI residential and consumer loans, other than government insured pool buyout loans, are generally placed on non-accrual status when they are 90 days of interest is due and unpaid.past due. When a loan is placed on non-accrual status, uncollected interest accrued is reversed and charged to interest income. Commercial loans are returned to accrual status only after all past due principal and interest has been collected and full repayment of remaining contractual principal and interest is reasonably assured. Residential loans are generally returned to accrual status when less than 90 days of interest is due and unpaid.past due. Past due status of loans is determined based on the contractual next payment due date. Loans less than 30 days past due are reported as current.
TDRs
A loan modification is considered a TDR if the Company, for economic or legal reasons related to the borrower’s financial difficulties, grants a concession to the borrower that the Company would not otherwise grant. These concessions may take the form of temporarily or permanently reduced interest rates, payment abatement periods, restructuring of payment terms, extensions of maturity at below market terms, or in some cases, partial forgiveness of principal. Under GAAP, modified ACI loans accounted for in pools are not accounted for as TDRs and are not separated from their respective pools when modified. Included in TDRs are residential loans to borrowers who have not reaffirmed their debt discharged in Chapter 7 bankruptcy.
Under recently issued inter-agency and authoritative guidance and consistent with the CARES Act, short-term (generally periods of six months or less) deferrals or modifications related to COVID-19 will typically not be categorized as TDRs. All of the COVID-19 related deferrals the Company has granted to date fall into this category. See the sections entitled "Asset Quality - Commercial Loans - Payment Deferrals" and "Asset Quality - Residential and Other Consumer Loans" " for further discussion.
The following table summarizes loans that have been modified in TDRs at September 30, 2017the dates indicated (dollars in thousands):
|
| | | | | | | | | | | |
| | | Number of TDRs | | Recorded Investment | | Related Specific Allowance |
| Residential and other consumer: | | | | | | |
| Covered | | 59 |
| | $ | 11,721 |
| | $ | 1,024 |
|
| Non-covered | | 9 |
| | 912 |
| | 71 |
|
| Commercial: | | | | | | |
| Taxi medallion loans | | 173 |
| | 92,370 |
| | 10,505 |
|
| Other | | 30 |
| | 72,702 |
| | 10,581 |
|
| | | 271 |
| | $ | 177,705 |
| | $ | 22,181 |
|
|
| | | | | | | | | | | | | | | | | | | | | |
| | June 30, 2020 | | December 31, 2019 |
| | Number of TDRs | | Amortized Cost | | Related Specific Allowance | | Number of TDRs | | Amortized Cost | | Related Specific Allowance |
Residential and other consumer (1) | 248 |
| | $ | 38,736 |
| | $ | 35 |
| | 361 |
| | $ | 57,117 |
| | $ | 12 |
|
| Commercial | 30 |
| | 62,100 |
| | 5,644 |
| | 25 |
| | 56,736 |
| | 6,311 |
|
| | 278 |
| | $ | 100,836 |
| | $ | 5,679 |
| | 386 |
| | $ | 113,853 |
| | $ | 6,323 |
|
Potential problem loans have been identified by management as those commercial loans included | |
| (1) | Includes 232 government insured residential loans modified in TDRs totaling $34.9 million at June 30, 2020; and 346 government insured residential loans modified in TDRs totaling $53.4 million at December 31, 2019. |
See Note 4 to the "substandard accruing" risk rating category. These loans are typically performing, but possess specifically identified credit weaknesses that, if not remedied, may lead to a downgrade to non-accrual status and identification as impaired in the near-term. Substandard accruing commercial loans totaled $185 million at September 30, 2017, substantially all of which were current as to principal and interest at September 30, 2017.consolidated financial statements for additional information about TDRs.
Loss Mitigation Strategies
Criticized or classified commercial loans in excess of certain thresholds are reviewed quarterly by the Criticized Asset Committee, which determinesevaluates the appropriate strategy for collection to mitigate the amount of credit losses. Criticized asset reports for each relationship are presented by the assigned relationship manager and credit officer to the Criticized Asset Committee until such time as the relationships are returned to a satisfactory credit risk rating or otherwise resolved. The Criticized Asset Committee may require the transfer of a loan to our workout and recovery department, which is tasked to effectively manage the loan with the goal of minimizing losses and expenses associated with restructure, collection and/or liquidation of collateral. Commercial loans with a risk rating of substandard;substandard, impaired loans on non-accrual status;status, loans modified as TDRs; taxi medallion loans;TDRs or assets classified as OREO or repossessed assets are usually transferred to workout and recovery. Oversight of the workout and recovery department is provided by the Criticized Asset Recovery Committee.
WeOur servicers evaluate each residential loan in default to determine the most effective loss mitigation strategy, which may be modification, short sale, or foreclosure. Throughforeclosure, and pursue the program's expirationalternative most suitable to the consumer and to mitigate losses to the bank. In response to the COVID-19 pandemic, we have temporarily suspended new residential foreclosure actions.
In response to the COVID-19 pandemic and its potential economic impact to our customers, we implemented a short-term program that complies with the CARES Act under which we are providing temporary relief on a case by case basis to borrowers directly impacted by COVID-19 who were not more than 30 days past due as of December 31, 2016, we offered loan2019. See the sections entitled "Asset Quality - Commercial Loans - Payment Deferrals" and "Asset Quality - Residential and Other Consumer Loans" for further details about COVID-19 related payment deferrals. Under recently issued inter-agency guidance and consistent with the CARES Act, deferrals or modifications underrelated to COVID-19 will generally not be categorized as TDRs. Loans subject to these temporary deferrals or modifications, if in compliance with the HAMP program to eligible borrowers incontractual terms of the residential portfolio. HAMP is a uniform loandeferral or modification process that provides eligible borrowers with sustainable monthly mortgage payments equal to a target 31% of their gross monthly income. We began offering a new modification program in late 2016 modeled afteragreements, will typically not be reported as past due or classified as non-accrual during the FNMA standard modification program.
In addition to the modification programs discussed above, we offer a proprietary Subordinate Lien Modification Program for home equity loans and lines of credit. This provides BankUnited the ability to offer a modification on loans covered under the Single Family Shared-Loss Agreement that are subordinate to either a BankUnited first lien or a first lien from another lender.deferral period.
Analysis of the Allowance for Loan and LeaseCredit Losses
The ALLL relates to (i) new loans, (ii) estimated additional losses arising on non-ACI loans subsequent to the FSB Acquisition, and (iii) impairment recognized as a result of decreases in expected cash flows on ACI loans due to further credit deterioration. The impact of any additional provision for losses on covered loansACL is significantly mitigated by an increase in the FDIC indemnification asset. The determinationmanagement's estimate of the amount of expected credit losses over the ALLLlife of the loan portfolio, or the amount of amortized cost basis not expected to be collected, at the balance sheet date. This estimate encompasses information about historical events, current conditions and reasonable and supportable forecasts. Determining the amount of the ACL is by nature, highly complex and subjective. Future eventsrequires extensive judgment by management about matters that are inherently uncertain could result in material changes to theuncertain. There is currently a high level of uncertainty around the ALLL. Generalimpact the COVID-19 crisis will have on the economy broadly, and on our borrowers specifically. In light of this uncertainty, we believe it is possible that the ACL estimate could change, potentially materially, in future periods. Changes in the ACL may result from changes in current economic conditions, including butour economic forecast, and in loan portfolio composition, as well as circumstances not limitedcurrently known to unemployment rates,us that may impact the levelfinancial condition and operations of business investmentour borrowers, among other factors.
For the substantial majority of the loan portfolio, expected losses are estimated using econometric models that employ a factor based methodology to estimate PD and growth, real estate values, vacancy ratesLGD. Projected PDs and rental rates in our primary market areas, the level of interest rates, and a variety of other factors that affect the ability of borrowers’ businessesLGDs are applied to estimated exposure at default to generate cash flows sufficientestimates of expected loss at the loan level. These loan level estimates are aggregated by portfolio segment and loan class to service their debts will impact the future performancegenerate a collective estimate for groups of the portfolio.
New and non-ACILoans
Residential and other consumer
Dueloans that share common risk characteristics. Qualitative adjustments may also be applied to the lack of similarity between the risk characteristics of new loans and covered loans in the residential and home equity portfolios,incorporate factors that management does not believe it is appropriate to use the historical performance of the covered residential mortgage portfolio as a basis for calculating the ALLL applicable to new loans. The new loan portfolio has not yet developed an observable loss trend. Therefore, the ALLL for new residential loans is based primarily on relevant proxy historical loss rates. The ALLL for new 1-4 single family residential loans is estimated using average annual loss rates on prime residential mortgage securitizations issued between 2003 and 2008 as a proxy. Based on the comparability of FICO scores and LTV ratios between loans included in those securitizations and loanshave been adequately considered in the Bank’s portfolioquantitative estimate. For loans that do not share similar risk characteristics with other loans such as collateral dependent loans and the geographic diversity in the new purchased residential portfolio, we determined that prime residential mortgage securitizations provide an appropriate proxy for incurredTDRs, expected credit losses in this portfolio class. A peer group 16-quarter average net charge-off rate is used to estimate the ALLL for the new home equity and other consumer loan classes. See further discussion of the use of peer group loss factors below. The new home equity and other consumer loan portfolios are not significant components of the overall loan portfolio.
Basedestimated on an analysis of historical performance, OREO and short saleindividual basis. Expected credit losses recent trending data and other internal and external factors, we have concluded that historical performance by portfolio class isare estimated over the best indicator of incurred loss for the non-ACI 1-4 single family residential and home equity portfolio classes. For each of these portfolio classes, a quarterly roll rate matrix is calculated by delinquency bucket to measure the rate at which loans move from one delinquency bucket to the next during a given quarter. An average 16-quarter roll rate matrix is used to estimate the amount within each delinquency bucket expected to roll to 120+ days delinquent. We assume no cure for those loans that are currently 120+ days delinquent. Loss severity given default is estimated based on internal data about OREO sales and short sales from the portfolio. The ALLL calculation incorporates a 100% loss severity assumption for home equity loans that are projected to roll to default. For non-ACI residential loans, the allowance is initially calculated based on UPB. The total of UPB less the calculated allowance is then compared to the carrying amountcontractual term of the loans, net of unamortized creditadjusted for expected prepayments.
See Note 1 to the consolidated financial statements for more detailed information about our ACL methodology and related fair value adjustments established at acquisition. If the calculated balance net of the allowance is less than the carrying amount, an additional allowance is established. Any increase or decrease in the allowance for non-ACI residential loans will result in a corresponding increase or decrease in the FDIC indemnification asset.
Commercial
The allowance is comprised of specific reserves for loans that are individually evaluated and determined to be impaired as well as general reserves for loans that have not been identified as impaired.
Commercial relationships graded substandard or doubtful and on non-accrual status with committed credit facilities greater than or equal to $1.0 million as well as loans modified in TDRs are individually evaluated for impairment. Other commercialaccounting policies.
relationships on non-accrual status with committed balances under $1.0 million may also be evaluated for impairment, at management's discretion. For loans evaluated individually for impairment and determined to be impaired, a specific allowance is established based on the present value of expected cash flows discounted at the loan’s effective interest rate, the estimated fair value of the loan, or the estimated fair value of collateral less costs to sell. We recognized partial charge-offs at September 30, 2017 on taxi medallion loans all of which are risk-rated substandard and on non-accrual status, as necessary to reduce the carrying value of the loans to our estimate of the value of New York City taxi medallions based on our cash flow template. Additionally, a specific allowance was recognized equal to the amount by which each loan exceeded 85% of the estimated value, in recognition of the continued declining trend in cash flows and lower prices observed on certain recent taxi medallion transfers. The amount of this specific allowance was determined based on management's judgment.
We believe that loans rated special mention, substandard or doubtful that are not individually evaluated for impairment exhibit characteristics indicative of a heightened level of credit risk. We apply a quantitative loss factor for loans rated special mention based on average annual probability of default and implied severity, derived from internal and external data. Loss factors for substandard and doubtful loans that are not individually evaluated are determined by using default frequency and severity information applied at the loan level. Estimated default frequencies and severities are based on available industry data. In addition, we apply a floor to these calculated loss factors, based on the loss factor applied to the special mention portfolio.
Since the majority of the new commercial loan portfolio is not yet seasoned enough to exhibit a loss trend, the quantitative loss factors for a majority of pass rated new commercial loans is based on peer group average annual historical net charge-off rates by loan class and the Company’s internal credit risk rating system. Beginning in the first quarter of 2017, we revised the source of quantitative loss factors for certain loans, as follows:
Given the emergence of observable loss trends, the quantitative loss factors for the taxi medallion and Bridge portfolios are based on the Company’s average historical net charge-off rates. Beginning in the third quarter of 2017, all taxi medallion loans are individually evaluated for impairment as described above.
The general quantitative loss factor for municipal finance receivables is based on the portfolio's external ratings and Moody's historical transition matrix, as opposed to the historical cumulative default curve for municipal obligations that was used previously.
For loans that are partially guaranteed by the SBA, the loss factor applied to the non-guaranteed portion of these loans is based on the 16-quarter average charge-off rate published by the SBA for each program
Mortgage warehouse loans have been segregated for the purpose of determining a quantitative loss factor, to better recognize the risk profile of this portfolio segment.
The net impact of these changes on the ALLL was not material.
The peer group used to calculate the average annual historical net charge-off rates that form the basis for our general reserve calculations for the majority of new commercial, home equity and consumer loans is made up of the banks included in the OCC Midsize Bank Group plus two additional banks in the New York region that management believes to be comparable based on size and nature of lending operations. The OCC Midsize Bank Group primarily includes commercial banks with total assets ranging from $10 - $50 billion and included 28 banks at September 30, 2017. Peer bank data is obtained from the Statistics on Depository Institutions Report published by the FDIC for the most recent quarter available. These banks, as a group, are considered by management to be comparable to BankUnited in size, nature of lending operations and loan portfolio composition. We evaluate the composition of the peer group annually, or more frequently if, in our judgment, a more frequent evaluation is necessary. Our internal risk rating system comprises 13 credit grades; grades 1 through 8 are “pass” grades. The risk ratings are driven largely by debt service coverage. Peer group historical loss rates are adjusted upward for loans assigned a lower “pass” rating.
We use a 16-quarter loss experience period to calculate peer group average annual net charge-off rates for commercial loans. We believe this look-back period to be consistent with the range of industry practice and appropriate to capture a sufficient range of observations reflecting the performance of our loans, most of which were originated in the current economic cycle. Prior to the third quarter of 2017, we used a four-quarter loss experience period for the taxi medallion portfolio to recognize the recent deterioration in that portfolio. We use a 14-quarter loss experience period for the Bridge portfolios, reflective of the period over which an observable loss trend began to emerge.
With the exception of the Pinnacle municipal finance portfolio, a four quarter loss emergence period is used in the calculation of general reserves. A twelve quarter loss emergence period is used in the calculation of general reserves for the Pinnacle portfolio.
Qualitative Factors
Qualitative adjustments are made to the ALLL when, based on management’s judgment, there are internal or external factors impacting probable incurred losses not taken into account by the quantitative calculations. Potential qualitative adjustments are categorized as follows:
Portfolio performance trends, including trends in and the levels of delinquencies, non-performing loans and classified loans;
Changes in the nature of the portfolio and terms of the loans, specifically including the volume and nature of policy and procedural exceptions;
Portfolio growth trends;
Changes in lending policies and procedures, including credit and underwriting guidelines;
Economic factors, including unemployment rates and GDP growth rates;
Changes in the value of underlying collateral;
Quality of risk ratings, as evaluated by our independent credit review function;
Credit concentrations;
Changes in and experience levels of credit administration management and staff; and
Other factors identified by management that may impact the level of losses inherent in the portfolio, including but not limited to competition and legal and regulatory considerations.
ACILoans
For ACI loans, a valuation allowance is established when periodic evaluations of expected cash flows reflect a deterioration resulting from credit related factors from the level of cash flows that were estimated to be collected at acquisition plus any additional expected cash flows arising from revisions in those estimates. We perform a quarterly analysis of expected cash flows for ACI loans.
Expected cash flows are estimated on a pool basis for ACI 1-4 single family residential and home equity loans. The analysis of expected pool cash flows incorporates updated pool level expected prepayment rate, default rate, delinquency level and loss severity given default assumptions. Prepayment, delinquency and default curves are derived primarily from roll rates generated from the historical performance of the portfolio over the immediately preceding four quarters. Loss severity given default assumptions are generated from the historical performance of the portfolio over the immediately preceding four quarters, while loss severity from loan sales is generated from historical performance over the immediately preceding twelve quarters. Estimates of default probability and loss severity given default also incorporate updated LTV ratios, at the loan level, based on Case-Shiller Home Price Indices for the relevant MSA. Costs and fees represent an additional component of loss on default and are projected based on historical experience over the last three years. The ACI home equity roll rates include the impact of delinquent, related senior liens and loans to borrowers who have not reaffirmed their debt discharged in Chapter 7 bankruptcy.
Our projected cash flow analysis reflected a decrease in expected cash flows due to credit related factors for the home equity ACI pool; therefore, a provision for loan losses of $1.8 million was recorded for the nine months ended September 30, 2017, along with a corresponding increase in the FDIC indemnification asset of $1.4 million. No ALLL related to 1-4 single family residential ACI pools was recorded at September 30, 2017. No ALLL related to 1-4 single family residential and home equity ACI pools was recorded at December 31, 2016.
The primary assumptions underlying estimates of expected cash flows for ACI commercial loans are default probability and severity of loss given default. Assessments of default probability and severity are based on net realizable value analyses prepared at the individual loan level. Based on our analysis, no ALLL related to ACI commercial loans was recorded at September 30, 2017 or December 31, 2016.
The following tables providetable provides an analysis of the ALLL,ACL, provision for loancredit losses related to the funded portion of loans and net charge-offs for the periods indicated (in thousands):. For the six months ended June 30, 2020, the ACL was estimated using the CECL methodology. For the six months ended June 30, 2019, prior to the adoption of ASU 2016-13, an incurred loss methodology was used.
| | | | Nine Months Ended September 30, 2017 | Six Months Ended June 30, |
| | | | Covered Loans | | | 2020 | | 2019 |
| Balance at beginning of period: | | $ | 108,671 |
| | $ | 109,931 |
|
| Impact of adoption of ASU 2016-13 | | 27,305 |
| | — |
|
| | Non-Covered Loans | | ACI Loans | | Non-ACI Loans | | Total | 135,976 |
| | 109,931 |
|
| Balance at December 31, 2016 | $ | 150,853 |
| | $ | — |
| | $ | 2,100 |
| | $ | 152,953 |
| |
| Provision for (recovery of) loan losses: | | | | | | | | | | |
| 1-4 single family residential | (4 | ) | | — |
| | 212 |
| | 208 |
| (8,538 | ) | | 397 |
|
| Home equity loans and lines of credit | — |
| | 1,812 |
| | 714 |
| | 2,526 |
| (40 | ) | | (150 | ) |
| Other consumer loans | (48 | ) | | — |
| | — |
| | (48 | ) | 6 |
| | 34 |
|
| Multi-family | (3,303 | ) | | — |
| | — |
| | (3,303 | ) | 16,803 |
| | (1,330 | ) |
| Non-owner occupied commercial real estate | 4,032 |
| | — |
| | — |
| | 4,032 |
| 75,109 |
| | 5,309 |
|
| Construction and land | (9 | ) | | — |
| | — |
| | (9 | ) | 766 |
| | 498 |
|
| Owner occupied commercial real estate | 4,884 |
| | — |
| | — |
| | 4,884 |
| 5,205 |
| | (2,611 | ) |
| Commercial and industrial | | | | | | | | 31,735 |
| | 6,481 |
|
| Taxi medallion loans | 49,604 |
| | — |
| | — |
| | 49,604 |
| |
| Other commercial and industrial | 9,338 |
| | — |
| | (45 | ) | | 9,293 |
| |
| Commercial lending subsidiaries | (8,614 | ) | | — |
| | — |
| | (8,614 | ) | |
| Unallocated | 5,000 |
| | — |
| | — |
| | 5,000 |
| |
| Pinnacle | | (173 | ) | | (116 | ) |
| Bridge - franchise finance | | 26,527 |
| | 1,094 |
|
| Bridge - equipment finance | | 6,049 |
| | (2,072 | ) |
| Total Provision | 60,880 |
| | 1,812 |
| | 881 |
| | 63,573 |
| 153,449 |
| | 7,534 |
|
| Charge-offs: | | | | | | | | | | |
| Home equity loans and lines of credit | — |
| | — |
| | (55 | ) | | (55 | ) | |
| 1-4 single family residential | | (31 | ) | | — |
|
| Non-owner occupied commercial real estate | (162 | ) | | — |
| | — |
| | (162 | ) | (552 | ) | | (1,703 | ) |
| Construction and land | | — |
| | (76 | ) |
| Owner occupied commercial real estate | (1,164 | ) | | — |
| | — |
| | (1,164 | ) | (187 | ) | | (174 | ) |
| Commercial and industrial | | | | | | | | (2,933 | ) | | (4,688 | ) |
| Taxi medallion loans | (47,141 | ) | | — |
| | — |
| | (47,141 | ) | |
| Other commercial and industrial | (12,567 | ) | | — |
| | — |
| | (12,567 | ) | |
| Commercial lending subsidiaries | — |
| | — |
| | — |
| | — |
| |
| Bridge - franchise finance | | (16,561 | ) | | (1,203 | ) |
| Bridge - equipment finance | | (6,720 | ) | | — |
|
| Total Charge-offs | (61,034 | ) | | — |
| | (55 | ) | | (61,089 | ) | (26,984 | ) | | (7,844 | ) |
| Recoveries: | | | | | | | | | | |
| Home equity loans and lines of credit | — |
| | — |
| | 65 |
| | 65 |
| 43 |
| | 149 |
|
| Other consumer loans | 21 |
| | — |
| | — |
| | 21 |
| 2 |
| | 18 |
|
| Multi-family | | 2 |
| | — |
|
| Non-owner occupied commercial real estate | | 82 |
| | 41 |
|
| Owner occupied commercial real estate | 2 |
| | — |
| | — |
| | 2 |
| 92 |
| | 718 |
|
| Commercial and industrial | | | | | | | | 3,012 |
| | 1,594 |
|
| Other commercial and industrial | 2,400 |
| | — |
| | 45 |
| | 2,445 |
| |
| Commercial lending subsidiaries | 603 |
| | — |
| | — |
| | 603 |
| |
| Bridge - franchise finance | | 449 |
| | — |
|
| Total Recoveries | 3,026 |
| | — |
| | 110 |
| | 3,136 |
| 3,682 |
| | 2,520 |
|
| Net Charge-offs: | (58,008 | ) | | — |
| | 55 |
| | (57,953 | ) | |
| Balance at September 30, 2017 | $ | 153,725 |
| | $ | 1,812 |
| | $ | 3,036 |
| | $ | 158,573 |
| |
| Net Charge-offs | | (23,302 | ) | | (5,324 | ) |
| Balance at end of period | | $ | 266,123 |
| | $ | 112,141 |
|
|
| | | | | | | | | | | | | | | |
| | Nine Months Ended September 30, 2016 |
| | | | Covered Loans | | |
| | Non-Covered Loans | | ACI Loans | | Non-ACI Loans | | Total |
| Balance at December 31, 2015 | $ | 120,960 |
| | $ | — |
| | $ | 4,868 |
| | $ | 125,828 |
|
| Provision for (recovery of) loan losses: | | | | | | | |
| 1-4 single family residential | (324 | ) | | — |
| | 23 |
| | (301 | ) |
| Home equity loans and lines of credit | 2 |
| | — |
| | (1,097 | ) | | (1,095 | ) |
| Other consumer loans | (98 | ) | | — |
| | — |
| | (98 | ) |
| Multi-family | 1,509 |
| | — |
| | — |
| | 1,509 |
|
| Non-owner occupied commercial real estate | 7,563 |
| | — |
| | — |
| | 7,563 |
|
| Construction and land | (980 | ) | | — |
| | — |
| | (980 | ) |
| Owner occupied commercial real estate | 4,854 |
| | — |
| | — |
| | 4,854 |
|
| Commercial and industrial | | | | | | | |
| Taxi medallion loans | 9,679 |
| | — |
| | — |
| | 9,679 |
|
| Other commercial and industrial | 16,686 |
| | — |
| | (45 | ) | | 16,641 |
|
| Commercial lending subsidiaries | 4,677 |
| | — |
| | — |
| | 4,677 |
|
| Total Provision | 43,568 |
| | — |
| | (1,119 | ) | | 42,449 |
|
| Charge-offs: | | | | | | | |
| 1-4 single family residential | — |
| | — |
| | (312 | ) | | (312 | ) |
| Home equity loans and lines of credit | — |
| | — |
| | (774 | ) | | (774 | ) |
| Non-owner occupied commercial real estate | (128 | ) | | — |
| | — |
| | (128 | ) |
| Construction and land | (93 | ) | | — |
| | — |
| | (93 | ) |
| Owner occupied commercial real estate | (2,615 | ) | | — |
| | — |
| | (2,615 | ) |
| Commercial and industrial | | | | | | | |
| Taxi medallion loans | (4,235 | ) | | — |
| | — |
| | (4,235 | ) |
| Other commercial and industrial | (7,245 | ) | | — |
| | — |
| | (7,245 | ) |
| Commercial lending subsidiaries | (1,432 | ) | | — |
| | — |
| | (1,432 | ) |
| Total Charge-offs | (15,748 | ) | | — |
| | (1,086 | ) | | (16,834 | ) |
| Recoveries: | | | | | | | |
| Home equity loans and lines of credit | — |
| | — |
| | 77 |
| | 77 |
|
| Other consumer loans | 18 |
| | — |
| | — |
| | 18 |
|
| Owner occupied commercial real estate | 1,175 |
| | — |
| | — |
| | 1,175 |
|
| Commercial and industrial | | | | | | | |
| Other commercial and industrial | 440 |
| | — |
| | 45 |
| | 485 |
|
| Commercial lending subsidiaries | 1,278 |
| | — |
| | — |
| | 1,278 |
|
| Total Recoveries | 2,911 |
| | — |
| | 122 |
| | 3,033 |
|
| Net Charge-offs: | (12,837 | ) | | — |
| | (964 | ) | | (13,801 | ) |
| Balance at September 30, 2016 | $ | 151,691 |
| | $ | — |
| | $ | 2,785 |
| | $ | 154,476 |
|
The following tables showtable shows the distribution of the ALLL, broken out between covered and non-covered loans,ACL at the dates indicated (dollars in thousands): |
| | | | | | | | | | | | | | | | | | |
| | September 30, 2017 |
| | | | Covered Loans | | | | |
| | Non-Covered Loans | | ACI Loans | | Non-ACI Loans | | Total | | %(1) |
| Residential and other consumer: | |
| | |
| | |
| | |
| | |
|
| 1 - 4 single family residential | $ | 9,275 |
| | $ | — |
| | $ | 393 |
| | $ | 9,668 |
| | 21.7 | % |
| Home equity loans and lines of credit | 7 |
| | 1,812 |
| | 2,643 |
| | 4,462 |
| | 0.2 | % |
| Other consumer loans | 90 |
| | — |
| | — |
| | 90 |
| | 0.1 | % |
| | 9,372 |
| | 1,812 |
| | 3,036 |
| | 14,220 |
| | 22.0 | % |
| Commercial: | | | | | | | | | |
| Multi-family | 21,706 |
| | — |
| | — |
| | 21,706 |
| | 16.3 | % |
| Non-owner occupied commercial real estate | 39,474 |
| | — |
| | — |
| | 39,474 |
| | 20.4 | % |
| Construction and land | 2,815 |
| | — |
| | — |
| | 2,815 |
| | 1.3 | % |
| Owner occupied commercial real estate | 15,146 |
| | — |
| | — |
| | 15,146 |
| | 9.5 | % |
| Commercial and industrial | | | | | | | | | |
| Taxi medallion loans | 13,117 |
| | — |
| | — |
| | 13,117 |
| | 0.8 | % |
| Other commercial and industrial | 37,239 |
| | — |
| | — |
| | 37,239 |
| | 18.2 | % |
| Commercial lending subsidiaries | 9,856 |
| | — |
| | — |
| | 9,856 |
| | 11.5 | % |
| | 139,353 |
| | — |
| | — |
| | 139,353 |
| | 78.0 | % |
| Unallocated | 5,000 |
| | — |
| | — |
| | 5,000 |
| |
|
|
| | $ | 153,725 |
| | $ | 1,812 |
| | $ | 3,036 |
| | $ | 158,573 |
| | 100.0 | % |
|
| | | | | | | | | | | | | | | | | | |
| | December 31, 2016 |
| | | | Covered Loans | | | | |
| | Non-Covered Loans | | ACI Loans | | Non-ACI Loans | | Total | | %(1) |
| Residential and other consumer: | |
| | |
| | |
| | |
| | |
|
| 1 - 4 single family residential | $ | 9,279 |
| | $ | — |
| | $ | 181 |
| | $ | 9,460 |
| | 20.6 | % |
| Home equity loans and lines of credit | 7 |
| | — |
| | 1,919 |
| | 1,926 |
| | 0.3 | % |
| Other consumer loans | 117 |
| | — |
| | — |
| | 117 |
| | 0.1 | % |
| | 9,403 |
| | — |
| | 2,100 |
| | 11,503 |
| | 21.0 | % |
| Commercial: | | | | | | | | | |
| Multi-family | 25,009 |
| | — |
| | — |
| | 25,009 |
| | 19.8 | % |
| Non-owner occupied commercial real estate | 35,604 |
| | — |
| | — |
| | 35,604 |
| | 19.3 | % |
| Construction and land | 2,824 |
| | — |
| | — |
| | 2,824 |
| | 1.6 | % |
| Owner occupied commercial real estate | 11,424 |
| | — |
| | — |
| | 11,424 |
| | 9.0 | % |
| Commercial and industrial | | | | | | | | | |
| Taxi medallion loans | 10,655 |
| | — |
| | — |
| | 10,655 |
| | 0.9 | % |
| Other commercial and industrial | 38,067 |
| | — |
| | — |
| | 38,067 |
| | 16.6 | % |
| Commercial lending subsidiaries | 17,867 |
| | — |
| | — |
| | 17,867 |
| | 11.8 | % |
| | 141,450 |
| | — |
| | — |
| | 141,450 |
| | 79.0 | % |
| | $ | 150,853 |
| | $ | — |
| | $ | 2,100 |
| | $ | 152,953 |
| | 100.0 | % |
|
| | | | | | | | | | | | | | | | | | | | | | | | | | | |
| | June 30, 2020 | | March 31, 2020 | | January 1, 2020 (1) | | December 31, 2019 |
| | Total | | %(2) | | Total | | %(2) | | Total | | %(2) | | Total | | %(2) |
| Residential portfolio segment | $ | 10,695 |
| | 23.5 | % | | $ | 12,576 |
| | 24.4 | % | | $ | 19,252 |
| | 24.5 | % | | $ | 11,154 |
| | 24.5 | % |
| | | | | | | | | | | | | | | | |
| Multi-family | 21,049 |
| | 7.9 | % | | 13,087 |
| | 8.5 | % | | 4,244 |
| | 9.6 | % | | 5,024 |
| | 9.6 | % |
| Non-owner occupied commercial real estate | 84,436 |
| | 20.7 | % | | 25,078 |
| | 21.5 | % | | 9,798 |
| | 21.7 | % | | 23,240 |
| | 21.7 | % |
| Construction and land | 3,384 |
| | 1.0 | % | | 2,610 |
| | 1.0 | % | | 2,618 |
| | 1.1 | % | | 764 |
| | 1.1 | % |
| CRE portfolio segment | 108,869 |
| | | | 40,775 |
| | | | 16,660 |
| | | | 29,028 |
| | |
| | | | | | | | | | | | | | | | |
| Owner occupied commercial real estate | 36,416 |
| | 8.6 | % | | 50,685 |
| | 8.7 | % | | 31,306 |
| | 8.9 | % | | 8,066 |
| | 8.9 | % |
| Commercial and industrial | 84,142 |
| | 28.1 | % | | 106,964 |
| | 25.3 | % | | 52,326 |
| | 23.4 | % | | 43,485 |
| | 23.4 | % |
| Pinnacle | 238 |
| | 5.1 | % | | 585 |
| | 5.0 | % | | 411 |
| | 5.2 | % | | 720 |
| | 5.2 | % |
| Bridge - franchise finance | 19,446 |
| | 2.6 | % | | 32,910 |
| | 2.8 | % | | 9,030 |
| | 2.6 | % | | 9,163 |
| | 2.6 | % |
| Bridge - equipment finance | 6,317 |
| | 2.5 | % | | 6,084 |
| | 2.8 | % | | 6,991 |
| | 3.0 | % | | 7,055 |
| | 3.0 | % |
| Commercial portfolio segment | 146,559 |
| | | | 197,228 |
| | | | 100,064 |
| | | | 68,489 |
| | |
| | $ | 266,123 |
| | 100.0 | % | | $ | 250,579 |
| | 100.0 | % | | $ | 135,976 |
| | 100.0 | % | | $ | 108,671 |
| | 100.0 | % |
| |
| (1) | Adoption date of ASU 2016-13. |
| |
| (2) | Represents percentage of loans receivable in each category to total loans receivable. |
Changes in the ACL for the first quarter of 2020:
The ALLL at September 30, 2017 included $5.4following chart depicts the changes in the ACL from December 31, 2019 to March 31, 2020 (in millions):
The increase in the ACL from January 1, 2020, the date of initial adoption of ASC 326, to March 31, 2020 was primarily due to changes in our reasonable and supportable economic forecast, in large part resulting from the estimated impact of the emerging COVID-19 pandemic, which added $93.3 million to the ACL. An increase in specific reserves, primarily related to the impact of Hurricanes Irma and Harvey. The ALLL includes $0.4franchise finance portfolio, contributed an additional $16.1 million related to loans that were downgraded duringthe increase in the ACL for the three months ended September 30, 2017March 31, 2020. The ACL for residential and other consumer loans decreased from January 1, 2020 to March 31,2020. This decline was primarily attributable to the introduction of a qualitative loss factor related to model imprecision.
ASU 2016-13 was adopted effective January 1, 2020, increasing the ACL by $27.3 million. In general, the change in methodology resulted in increased reserves due to the transition to a lifetime expected loss model from an incurred loss model. However, as a resultnoted in the table above, there are certain CRE portfolios where the reserve decreased. This was mainly driven by the use of quantitative models to estimate the ACL at the loan level, specific to the Company's portfolio, under CECL, instead of the hurricanes and a $5.0 million unallocated qualitative allowance.
Excludingpeer group historical losses rates utilized under the $5.0 million unallocated qualitative allowance relative to the impact of the hurricanes, the balance of the ALLL for non-covered loans at September 30, 2017 decreased slightly as compared to December 31, 2016. Decreases in quantitativeprior incurred loss factors applied to the majority of the commercial loan portfolio and net decreases inmodel. Certain qualitative factors were substantiallyalso removed, as their impact was captured in the quantitative estimate under CECL.
Changes in the ACL for the second quarter of 2020
The ACL increased by $15.5 million from March 31, 2020 to June 30, 2020. At a high level, increases in the ACL for CRE portfolio segments offset bya decline in the impact ofACL for most other commercial portfolio segments during the growth ofquarter, while the loan portfolio and an increase in reservesACL for criticized and classified loans, including taxi medallion loans. Factors influencingthe residential segment did not change materially. Significant offsetting factors contributing to the change in the ALLLACL for the second quarter are depicted in the chart below (in millions):
The following charts depict the changes in the ACL by major portfolio segment from March 31, 2020 to June 30, 2020 (in millions):
In the aggregate, the ACL for the CRE portfolio segments, including multi-family, non-owner occupied CRE and construction and land, increased by $68.1 million during the quarter ended June 30, 2020. The primary factors contributing to this increase were:
deterioration in current economic conditions and in the economic forecast, particularly unemployment levels and commercial property forecasts; and
a qualitative overlay based on data collected from borrowers reflecting recent deterioration in operating results or financial condition.
In the aggregate, the ACL for the commercial portfolio segments declined by $50.7 million during the quarter ended June 30, 2020. The largest segments in this group are commercial and industrial and owner-occupied CRE; the Bridge and Pinnacle portfolios are also included. The most significant offsetting factors contributing to this decrease were:
an increase related to specific loan types at September 30, 2017 asdeterioration in current economic conditions compared to December 31, 2016, include:
The ALLL related to non-covered 1-4 single family residential loans did not change significantly. Increases related to growth in the corresponding portfolio were substantially offset by declines in both the applicable quantitative historical loss rate and qualitative reserves.
A decrease of $3.3 million for multi-family loans primarily reflects decreases in quantitative loss factors, the decline in the corresponding portfolio and a net decrease in qualitative loss factors, offset in part by an increase in criticized and classified loans.
An increase of $3.9 million for non-owner occupied commercial real estate loans was primarily driven by the growth of the corresponding portfolio and an increase in criticized and classified loans, partiallyprior quarter-end, offset by a decrease related to the forward path of the economic forecast, particularly the path of the volatility index and the S&P 500 index which improved from the prior quarter-end;
a decrease related to changes in quantitative loss factors.
assumptions about expected prepayments; andAnan increase from a qualitative overlay based on data collected from borrowers that reflected recent deterioration in operating results or financial condition.
The ACL for the franchise finance portfolio declined in part due to charge-offs taken during the second quarter.
The econometric models we use to estimate expected credit losses ingest a wide array of $3.7 million for owner occupied commercial real estate loans was primarily attributablenational, regional and MSA level economic variables and data points. Some of the data points informing the reasonable and supportable economic forecast used in estimating the ACL at June 30, 2020 were:
Unemployment rates starting at 13.4% and declining to increases in specific reserves for impaired loans9% by the end of 2020, and to a lesser extent,7% by the growthend of the corresponding portfolio.2021;
An increase of $2.5 million for taxi medallion loans reflects the specific reserves recognized at September 30, 2017, as discussed previously. Increases in reserves were limited due to the level of charge-offs recognized during the nine months ended September 30, 2017.
A decrease of $0.8 million for other commercial and industrial loans was primarily driven by a decrease in reserves for impaired and other classified loans, primarily due to net charge-offs, offset byAnnualized growth in GDP starting at negative (27%) with recovery beginning in the corresponding portfolio.
third quarter of 2020 and returning to pre-recession levels in 2023;A $8.0 million decrease for commercial lending subsidiaries primarily reflects decreases in quantitative loss factors for the municipal finance receivablesVIX trailing average starting at 32, remaining elevated through 2020, and decreases in qualitative loss factors related to portfolio growth trendsthen trending downward; and credit concentrations.
S&P 500 starting at 2900 and declining moderately through 2020 before increasing.
For additional information about the ALLL,ACL, see Note 4 to the consolidated financial statements.
Deposits
Average balances and rates paid on deposits were as follows for the periods indicated (dollars in thousands):
|
| | | | | | | | | | | | | | | | | | | | | | | | | | | |
| | Three Months Ended September 30, | | Nine Months Ended September 30, |
| �� | 2017 | | 2016 | | 2017 | | 2016 |
| | Average
Balance | | Average
Rate Paid | | Average
Balance | | Average
Rate Paid | | Average
Balance | | Average Rate Paid | | Average
Balance | | Average
Rate Paid |
| Demand deposits: | | | | | | | | | |
| | |
| | |
| | |
|
| Non-interest bearing | $ | 3,036,046 |
| | — | % | | $ | 2,981,017 |
| | — | % | | $ | 3,034,682 |
| | — | % | | $ | 2,944,861 |
| | — | % |
| Interest bearing | 1,590,206 |
| | 0.85 | % | | 1,437,677 |
| | 0.62 | % | | 1,564,229 |
| | 0.76 | % | | 1,341,218 |
| | 0.61 | % |
| Money market | 9,590,333 |
| | 0.90 | % | | 7,948,299 |
| | 0.64 | % | | 9,187,225 |
| | 0.80 | % | | 7,778,761 |
| | 0.63 | % |
| Savings | 378,179 |
| | 0.24 | % | | 400,982 |
| | 0.22 | % | | 370,682 |
| | 0.19 | % | | 424,915 |
| | 0.24 | % |
| Time | 6,290,056 |
| | 1.30 | % | | 5,567,909 |
| | 1.13 | % | | 5,988,433 |
| | 1.24 | % | | 5,177,191 |
| | 1.11 | % |
| | $ | 20,884,820 |
| | 0.87 | % | | $ | 18,335,884 |
| | 0.67 | % | | $ | 20,145,251 |
| | 0.80 | % | | $ | 17,666,946 |
| | 0.65 | % |
Total deposits at September 30, 2017 and December 31, 2016 included $2.3 billion and $1.9 billion, respectively, of brokered deposits. |
| | | | | | | | | | | | | | | | | | | | | | | | | | | |
| | Three Months Ended June 30, | | Six Months Ended June 30, |
| | 2020 | | 2019 | | 2020 | | 2019 |
| | Average
Balance | | Average
Rate Paid | | Average
Balance | | Average
Rate Paid | | Average
Balance | | Average
Rate Paid | | Average
Balance | | Average
Rate Paid |
| Demand deposits: | | | | | | | | | | | | | | | |
| Non-interest bearing | $ | 5,313,009 |
| | — | % | | $ | 3,932,716 |
| | — | % | | $ | 4,840,781 |
| | — | % | | $ | 3,769,828 |
| | — | % |
| Interest bearing | 2,448,545 |
| | 0.78 | % | | 1,773,912 |
| | 1.41 | % | | 2,311,086 |
| | 1.02 | % | | 1,738,393 |
| | 1.38 | % |
| Money market | 10,270,027 |
| | 0.68 | % | | 10,710,550 |
| | 1.95 | % | | 10,251,575 |
| | 1.08 | % | | 10,964,547 |
| | 1.93 | % |
| Savings | 180,283 |
| | 0.09 | % | | 214,030 |
| | 0.28 | % | | 179,681 |
| | 0.14 | % | | 223,271 |
| | 0.28 | % |
| Time | 7,096,097 |
| | 1.59 | % | | 6,944,862 |
| | 2.40 | % | | 7,303,083 |
| | 1.82 | % | | 6,926,041 |
| | 2.34 | % |
| | $ | 25,307,961 |
| | 0.80 | % | | $ | 23,576,070 |
| | 1.70 | % | | $ | 24,886,206 |
| | 1.07 | % | | $ | 23,622,080 |
| | 1.68 | % |
The following table shows scheduled maturities of certificates of deposit with denominations greater than or equal to $100,000 as of SeptemberJune 30, 20172020 (in thousands):
| | | Three months or less | $ | 741,235 |
| $ | 833,151 |
|
| Over three through six months | 1,037,771 |
| 967,778 |
|
| Over six through twelve months | 1,351,330 |
| 1,284,607 |
|
| Over twelve months | 931,302 |
| 166,568 |
|
| | $ | 4,061,638 |
| $ | 3,252,104 |
|
FHLB Advances, Notes and Other Borrowings
In addition to deposits, we utilize FHLB advances to fund growth in interest earning assets;as a funding source; the advances provide us with additional flexibility in managing both term and cost of funding.funding and in managing interest rate risk. FHLB advances are secured by FHLB stock, qualifying residential first mortgage and commercial real estate and home equity loans, and MBS. At September 30, 2017
We have utilized the Federal Reserve's PPPLF to fund PPP loans. These borrowings bear interest at 0.35%, are secured by PPP loans, and December 31, 2016, outstandingmature as the underlying PPP loans are repaid. FHLB advances totaled $4.9 billion and $5.2 billion, respectively.PPPLF borrowings consisted of the following at the dates indicated (in thousands):
|
| | | | | | | |
| | June 30, 2020 | | December 31, 2019 |
| FHLB advances, net of hedge accounting fair value adjustments | $ | 3,999,573 |
| | $ | 4,480,501 |
|
| PPPLF borrowings | 651,026 |
| | — |
|
| | $ | 4,650,599 |
| | $ | 4,480,501 |
|
The contractual balance of FHLB advances outstanding at SeptemberJune 30, 20172020 is scheduled to mature as follows (in thousands):
|
| | | |
| Maturing in: | |
|
| 2017—One month or less | $ | 2,395,000 |
|
| 2017—Over one month | 855,000 |
|
| 2018 | 1,396,000 |
|
| 2019 | 100,000 |
|
| 2020 | 125,000 |
|
| Carrying value | $ | 4,871,000 |
|
|
| | | |
| Maturing in: | |
| 2020—One month or less | $ | 1,470,000 |
|
| 2020—Over one month | 2,176,000 |
|
| 2021 | 250,000 |
|
| Thereafter | 100,000 |
|
| Total contractual balance outstanding | 3,996,000 |
|
| Cumulative fair value hedging adjustments | 3,573 |
|
| Carrying value | $ | 3,999,573 |
|
The table above reflects contractual maturities of outstanding FHLB advances, and does not incorporate the impact that interest rate swaps designated as cash flow hedges have on the duration of borrowings. See Note 7 to the consolidated financial statements for more information about derivative instruments.
Outstanding senior notes payable and other borrowings consisted of the following at the dates indicated (in thousands):
|
| | | | | | | |
| | September 30, 2017 | | December 31, 2016 |
| Senior notes | $ | 393,564 |
| | $ | 393,092 |
|
| Capital lease obligations | 9,264 |
| | 9,717 |
|
| | $ | 402,828 |
| | $ | 402,809 |
|
|
| | | | | | | |
| | June 30, 2020 | | December 31, 2019 |
| Senior notes: | | | |
| Principal amount of 4.875% senior notes maturing on November 17, 2025 | $ | 400,000 |
| | $ | 400,000 |
|
| Unamortized discount and debt issuance costs | (4,547 | ) | | (4,910 | ) |
| | 395,453 |
| | 395,090 |
|
| Subordinated notes: | | | |
| Principal amount of 5.125% subordinated notes maturing on June 11, 2030 | 300,000 |
| | — |
|
| Unamortized discount and debt issuance costs | (6,116 | ) | | — |
|
| | 293,884 |
| | — |
|
| Total outstanding notes payable | 689,337 |
| | 395,090 |
|
| Finance leases | 32,995 |
| | 34,248 |
|
| Notes and other borrowings | $ | 722,332 |
| | $ | 429,338 |
|
Senior notes have a face amount of $400 million, a fixed coupon rate of 4.875% and mature on November 17, 2025.
Capital Resources
Pursuant to the FDIA, the federal banking agencies have adopted regulations setting forth a five-tier system for measuring the capital adequacy of the financial institutions they supervise. At SeptemberJune 30, 20172020 and December 31, 2016,2019, BankUnited and the Company had capital levels that exceeded both the regulatory well-capitalized guidelines and all internal capital ratio targets.
Stockholders'
The following table provides information regarding regulatory capital for the Company and the Bank as of June 30, 2020 (dollars in thousands):
|
| | | | | | | | | | | | | | | | | | | | | | | | | | | |
| | Actual | | Required to be Considered Well Capitalized | | Required to be Considered Adequately Capitalized | | Required to be Considered
Adequately
Capitalized Including Capital Conservation Buffer |
| | Amount | | Ratio | | Amount | | Ratio | | Amount | | Ratio | | Amount | | Ratio |
| BankUnited, Inc.: | |
| | |
| | |
| | |
| | |
| | |
| | | | |
| Tier 1 leverage | $ | 2,874,094 |
| | 8.46 | % | | N/A (1) |
| | N/A (1) |
| | $ | 1,359,339 |
| | 4.00 | % | | N/A (1) |
| | N/A (1) |
|
| CET1 risk-based capital | $ | 2,874,094 |
| | 12.19 | % | | $ | 1,533,087 |
| | 6.50 | % | | $ | 1,061,368 |
| | 4.50 | % | | $ | 1,651,017 |
| | 7.00 | % |
| Tier 1 risk-based capital | $ | 2,874,094 |
| | 12.19 | % | | $ | 1,886,876 |
| | 8.00 | % | | $ | 1,415,157 |
| | 6.00 | % | | $ | 2,004,806 |
| | 8.50 | % |
| Total risk based capital | $ | 3,381,536 |
| | 14.34 | % | | $ | 2,358,595 |
| | 10.00 | % | | $ | 1,886,876 |
| | 8.00 | % | | $ | 2,476,525 |
| | 10.50 | % |
| BankUnited: | |
| | |
| | |
| | |
| | |
| | |
| | | | |
| Tier 1 leverage | $ | 3,147,423 |
| | 9.29 | % | | $ | 1,694,528 |
| | 5.00 | % | | $ | 1,355,622 |
| | 4.00 | % | | N/A |
| | N/A |
|
| CET1 risk-based capital | $ | 3,147,423 |
| | 13.42 | % | | $ | 1,524,283 |
| | 6.50 | % | | $ | 1,055,273 |
| | 4.50 | % | | $ | 1,641,535 |
| | 7.00 | % |
| Tier 1 risk-based capital | $ | 3,147,423 |
| | 13.42 | % | | $ | 1,876,040 |
| | 8.00 | % | | $ | 1,407,030 |
| | 6.00 | % | | $ | 1,993,293 |
| | 8.50 | % |
| Total risk based capital | $ | 3,354,864 |
| | 14.31 | % | | $ | 2,345,050 |
| | 10.00 | % | | $ | 1,876,040 |
| | 8.00 | % | | $ | 2,462,303 |
| | 10.50 | % |
(1) There is no Tier 1 leverage ratio component in the definition of a well-capitalized bank holding company.
The Company initially elected to phase-in the initial impact of adopting CECL for regulatory capital purposes, allowing CECL's regulatory capital effects to be phased in at 25 percent per year, beginning in the first year of adoption. As part of its response to the impact of COVID-19, our banking regulators issued an inter-agency interim final rule providing the option to temporarily delay the effects of CECL on regulatory capital for two years, followed by a three-year transition period. The Company has elected to adopt the provisions of this interim final rule.
Total stockholders' equity increaseddecreased by approximately $226 million at June 30, 2020 compared to $2.6 billion at SeptemberDecember 31, 2019. The most significant reason for this decrease was the repurchase of common shares, followed by a comprehensive loss of $66 million for the six months ended June 30, 2017,2020. The comprehensive loss included an increase of $205$111 million or 8.5%, from December 31, 2016, due primarilyin accumulated other comprehensive loss, attributed to an increase in unrealized losses on AFS securities and derivative instruments. See the section of this Management's Discussion and Analysis entitled "Analysis of Financial Condition; Investment Securities" and Note 3 to the retentionconsolidated financial statements for further discussion of unrealized losses on AFS securities. Management expects to recover the entire amortized cost basis of its AFS securities. Unrealized losses on derivative instruments designated as hedging instruments were attributable to reductions in benchmark interest rates. Other factors contributing to the decrease in total stockholders equity were the initial adoption of ASU 2016-13 which impacted retained earnings by $24 million, and dividends in the amount of $44 million.
During the first quarter of 2020, the Company repurchased approximately 3.3 million shares of its common stock for an aggregate purchase price of $101 million, at a weighted average price of $30.36 per share. The Company has temporarily suspended its share repurchase program.
We believe we are well positioned, from a capital perspective, to withstand a severe downturn in the economy. In light of the COVID-19 crisis, uncertainty around its ultimate impact on the economy and, by extension, on our financial condition and results of operations, we have enhanced our stress testing framework. We have increased both the frequency of stress testing and the spectrum of scenarios utilized. One exercise we completed was to stress our March 31, 2020 loan portfolio using both the 2018 DFAST severely adverse scenario and the 2020 DFAST severely adverse scenario. The results of stock options resultingeach of these stress tests projected regulatory capital ratios in proceedsexcess of $61.5 million during the period.
Since our formation, stockholders' equity has been impacted primarily by the retention of earnings, and to a lesser extent, proceeds from the issuance of common shares and changes in unrealized gains and losses, net of taxes, on investment securities
available for sale and cash flow hedges. Our rate of earnings retention is derived by dividing undistributed earnings per common share by earnings per common share. Our retention ratio was 66.0% and 64.9% for the three and nine months ended September 30, 2017, respectively, compared to 55.7% and 58.4% for the three and nine months ended September 30, 2016, respectively. We retain a high percentage of our earnings to support our planned growth.all well capitalized thresholds.
We filed ahave an active shelf registration statement on file with the SEC in October 2015 that allows the Company to periodically offer and sell in one or more offerings, individually or in any combination, our common stock, preferred stock and other non-equity securities. The shelf registration provides us with flexibility in issuing capital instruments and enables us to more readily access the capital markets as needed to pursue future growth opportunities and to ensure continued compliance with regulatory capital requirements. Our ability to issue securities pursuant to the shelf registration is subject to market conditions.
The following table provides information regarding regulatory We successfully accessed the capital for the Company and the Bank as of September 30, 2017 (dollars in thousands):
|
| | | | | | | | | | | | | | | | | | | | |
| | Actual | | Required to be Considered Well Capitalized | | Required to be Considered Adequately Capitalized |
| | Amount | | Ratio | | Amount | | Ratio | | Amount | | Ratio |
| BankUnited, Inc.: | |
| | |
| | |
| | |
| | |
| | |
|
| Tier 1 leverage | $ | 2,491,853 |
| | 8.56 | % | | N/A (1) |
| | N/A (1) |
| | $ | 1,164,462 |
| | 4.00 | % |
| CET1 risk-based capital | $ | 2,491,853 |
| | 11.91 | % | | $ | 1,359,799 |
| | 6.50 | % | | $ | 941,399 |
| | 4.50 | % |
| Tier 1 risk-based capital | $ | 2,491,853 |
| | 11.91 | % | | $ | 1,673,599 |
| | 8.00 | % | | $ | 1,255,199 |
| | 6.00 | % |
| Total risk based capital | $ | 2,657,784 |
| | 12.70 | % | | $ | 2,091,998 |
| | 10.00 | % | | $ | 1,673,599 |
| | 8.00 | % |
| BankUnited: | |
| | |
| | |
| | |
| | |
| | |
|
| Tier 1 leverage | $ | 2,706,006 |
| | 9.32 | % | | $ | 1,451,814 |
| | 5.00 | % | | $ | 1,161,451 |
| | 4.00 | % |
| CET1 risk-based capital | $ | 2,706,006 |
| | 12.98 | % | | $ | 1,354,884 |
| | 6.50 | % | | $ | 937,997 |
| | 4.50 | % |
| Tier 1 risk-based capital | $ | 2,706,006 |
| | 12.98 | % | | $ | 1,667,550 |
| | 8.00 | % | | $ | 1,250,662 |
| | 6.00 | % |
| Total risk based capital | $ | 2,869,850 |
| | 13.77 | % | | $ | 2,084,437 |
| | 10.00 | % | | $ | 1,667,550 |
| | 8.00 | % |
(1) There is no Tier 1 leverage ratio componentmarkets in the definitionsecond quarter of 2020, augmenting our regulatory Tier 2 capital with a well-capitalized bank holding company.$300 million issuance of subordinated notes.Levels of capital required to be well capitalized or adequately capitalized as reflected above do not include a capital conservation buffer that is being phased in beginning in 2016. When fully phased in on January 1, 2019, the Bank and the Company will have to maintain this capital conservation buffer composed of CET1 capital equal to 2.50% of risk-weighted assets above the amounts required to be adequately capitalized, as reflected above, in order to avoid limitations on capital distributions, including dividend payments and certain discretionary bonus payments to executive officers. Capital ratios required to be considered well-capitalized exceed the ratios required under the capital conservation buffer requirement at September 30, 2017.
Liquidity
Liquidity involves our ability to generate adequate funds to support planned interest earning asset growth, meet deposit withdrawal and credit line usage requests, maintain reserve requirements, conduct routine operations, pay dividends, service outstanding debt and meet other contractual obligations.
BankUnited's ongoing liquidity needs have been and continue to be met primarily by cash flows from operations, deposit growth, the investment portfolio and FHLB advances. For the six months ended June 30, 2020 and 2019 net cash provided by operating activities was $320.8 million and $237.8 million, respectively.
The onset of the COVID-19 pandemic led to dislocation and volatility in funding and capital markets and evoked widespread concerns about the ongoing functioning of those markets, the availability of liquidity and the economy generally. In response, the Federal Reserve reduced its benchmark interest rate to a target level of 0 - 0.25% and has maintained it at that level to date, actively adjusted the size of its overnight and term repurchase agreement operations, reduced reserve requirements and the cost of discount window borrowings, encouraged banks to utilize the discount window and committed to purchasing large amounts of U.S. Treasury securities and MBS. The U.S. government has announced an unprecedented variety of additional stimulus and measures to support markets, the flow of credit, and systemic liquidity. These include the Primary Market Corporate Credit Facility, the Secondary Market Corporate Credit Facility, the Term Asset-Backed Securities Loan Facility, the Municipal Liquidity Facility, the Main Street New Loan Facility, the Main Street Expanded Loan Facility, Paycheck Protection Program loans, the Paycheck Protection Program Liquidity Facility (PPPLF), the Commercial Paper Funding Facility, the Primary Dealer Credit Facility, and the Money Market Mutual Fund Liquidity Facility. These actions appear to have been effective in stabilizing market liquidity.
In response to the onset of COVID-19 and potential concerns that might arise about the stability of liquidity, we initially took a number of precautionary measures to ensure adequacy of liquidity. We took steps to optimize available same day liquidity. We increased the level of cash held on balance sheet, to be prepared to meet potential increased demand for deposit withdrawals and line usage, which to date have not materialized. While we took proactive steps to be prepared for disruptions in liquidity, the COVID-19 pandemic has not been a liquidity event; we have not experienced unusual volatility or stress on our liquidity position to date.
At June 30, 2020, available liquidity totaled approximately $9.8 billion, including cash, borrowing capacity at the Federal Home Loan Bank of Atlanta and the Federal Reserve Discount Window, Federal Funds lines of credit, unpledged agency securities and availability under the PPPLF, as depicted in the following chart:
Additional sources of liquidity include cash flows from operations, wholesale deposits, and cash generated by the repayment and resolution of covered loans, cash payments receivedflow from the FDIC pursuant toBank's amortizing securities and loan portfolios. In the Single Family Shared-Loss Agreement, deposit growth, the available for sale securities portfolio and FHLB advances.
For the nine months ended September 30, 2017 and 2016, net cash provided by operating activities was $231.2 million and $227.3 million, respectively. Accretion on ACI loans, which is reflected as a non-cash reduction in net income to arrive at operating cash flows, totaled $226.3 million, and $228.5 million for the nine months ended September 30, 2017 and 2016, respectively. Accretable yield on ACI loans represents the excess of expected future cash flows over the carrying amount of the loans, and is recognized as interest income over the expected lives of the loans. Amounts recorded as accretion are realized in cash as individual loans are paid down or otherwise resolved; however, the timing of cash realization may differ from the timing of income recognition. Thesenear-term, cash flows from the repayment or resolutionloan portfolio may be reduced as a result of covered loans, inclusive of amounts that have been accreted through earnings over time, are recognized as cash flows from investing activities in the consolidated statements of cash flows upon receipt. Cash payments from the FDIC in the form of reimbursements of losses relatedtemporary payment deferrals granted to the
covered loans under the Single Family Shared-Loss Agreement are also characterized as investing cash flows. Cash generated by the repaymentborrowers. This has not to date and resolution of covered loans and reimbursements from the FDIC totaled $348.5 million and $430.3 million for the nine months ended September 30, 2017 and 2016, respectively. Both cash generated by the repayment and resolution of covered loans and cash payments received from the FDIC have been and are expectedwe do not currently expect it to continue to be, although to a lesser extent in the future, consistent and relatively predictable sources of liquidity.
In addition to cash provided by operating activities, the repayment and resolution of covered loans and payments under the Single Family Shared-Loss Agreement from the FDIC, BankUnited’smaterially impact our liquidity needs, particularly liquidity to fund growth of interest earning assets, have been and continue to be met by deposit growth and FHLB advances. The investment portfolio also provides a source of liquidity.
BankUnited has access to additional liquidity through FHLB advances, other collateralized borrowings, wholesale deposits or the sale of available for sale securities. At September 30, 2017, unencumbered investment securities available for sale totaled $4.3 billion. At September 30, 2017, BankUnited had available borrowing capacity at the FHLB of $3.8 billion, unused borrowing capacity at the FRB of $544 million and unused Federal funds lines of credit totaling $70 million.position. Management also has the ability to exert substantial control over the rate and timing of growth of the non-covered loan portfolio, production,
and resultant requirements for liquidity to fund new loans.
Continued runoff Since the onset of the covered loan portfolioCOVID-19 pandemic, we have not experienced unusual deposit outflows or volatility. Credit line usage, which we have monitored regularly since the onset of COVID-19, has not deviated materially from and FDIC indemnification assetis currently below our trailing three year average. Our available liquidity may also change as the FHLB and growth of deposits and the non-covered loan portfolio are the most significant trends expected to impact the Bank’s liquidityFederal Reserve Bank reprice our collateral in the near term.normal course of business based on June 30, 2020 valuations. Based on our initial analysis, we do not expect the impact to be material to our overall liquidity position.
The ALCO policy has established several measures of liquidity which are typically monitored monthly by the ALCO and quarterly by the Board of Directors. OneIn light of the COVID-19 situation, we have enhanced the frequency and extent of liquidity monitoring and reporting to both executive management and the Board of Directors.
The ALCO policy establishes limits for the ratio of available liquidity to volatile liabilities, the ratio of wholesale funding to total assets, the ratio of brokered deposits to total deposits and a government backed securities holding ratio, measured as the ratio of U.S. Government backed securities to total securities. At June 30, 2020 BankUnited was in compliance with all of these ALCO policy limits.
An additional primary measure of liquidity monitored by management is the 30 day30-day total liquidity ratio, defined as (a) the sum of cash and cash equivalents, pledgeable securities and a measure of funds expected to be generated by operations over the next 30 days; divided by (b) the sum of potential deposit runoff, liabilities maturing within the 30 day time frame and a measure of funds expected to be used in operations over the next 30 days. ALCO policy thresholds stipulate that BankUnited’s liquidity is considered acceptable if the 30 day30-day total liquidity ratio exceeds 100%. At SeptemberJune 30, 2017,2020, BankUnited’s 30 day30-day total liquidity ratio was 172%235%. Management also monitors a one yearone-year liquidity ratio, defined as (a) cash and cash equivalents, pledgeable securities, unused borrowing capacity at the FHLB, and loans and non-agency securities maturing within one year; divided by (b) forecasted deposit outflows and borrowings maturing within one year. Forecasted deposit outflows, excluding certificate of deposits, are based on runoff rates derived from the most recent external core deposit analysis obtained by the Company. This ratio allows management to monitor liquidity over a longer time horizon. The acceptable threshold established by the ALCO for this liquidity measure is 100%. At SeptemberJune 30, 2017,2020, BankUnited’s one yearone-year liquidity ratio was 158%207%. Additional measures of liquidity regularly monitored by the ALCO include the ratio of wholesale fundingFHLB advances to total assets,funding, concentrations of large deposits, a measure of on balance sheet available liquidity to volatile liabilities and the ratio of brokerednon-interest bearing deposits to total deposits. At September 30, 2017, BankUnited was within acceptable limits established bydeposits, which is reflective of the ALCOquality and cost, rather than the quantity, of available liquidity. The Company also has a comprehensive contingency liquidity funding plan and conducts a quarterly liquidity stress test, the results of which are reported to the risk committee of the Board of Directors for each of these measures.Directors.
As a holding company, BankUnited, Inc. is a corporation separate and apart from its banking subsidiary, and therefore, provides for its own liquidity. BankUnited, Inc.’s main sources of funds include management fees and dividends from the Bank, access to capital markets and to a lesser extent, its own available for sale securities portfolio. There are regulatory limitations that may affect the ability of the Bank to pay dividends to BankUnited, Inc. Management believes that such limitations will not impact our ability to meet our ongoing near-term cash obligations.
We expect that our liquidity requirements will continue to be satisfied over the next 12 months through the sources of funds described above.
Interest Rate Risk
TheA principal component of the Company’s risk of loss arising from adverse changes in the fair value of financial instruments, or market risk, is interest rate risk, including the risk that assets and liabilities with similar re-pricing characteristics may not reprice at the same time or to the same degree. A primary objective of the Company’s asset/liability management activities is to maximize net interest income, while maintaining acceptable levels of interest rate risk. The ALCO is responsible for establishing policies to limit exposure to interest rate risk, and to ensure procedures are established to monitor compliance with these policies. The guidelinesthresholds established by the ALCO are approved at least annually by the Board of Directors.Directors or its Risk Committee.
Management believes that the simulation of net interest income in different interest rate environments provides the most meaningful measure of interest rate risk. Income simulation analysis is designed to capture not only the potential of all assets and liabilities to mature or reprice, but also the probability that they will do so. Income simulation also attends to the relative interest rate sensitivities of these items, and projects their behavior over an extended period of time. Finally, income simulation
permits management to assess the probable effects on the balance sheet not only of changes in interest rates, but also of proposed strategies for responding to them.
The income simulation model analyzes interest rate sensitivity by projecting net interest income over twelve and twenty-four month periods in a most likely rate scenario based on consensus forward interest rate curves versus net interest income in alternative rate scenarios. Simulations are generated based on both static and dynamic balance sheet assumptions. Management continually reviews and refines its interest rate risk management process in response to changes in the interest rate environment and economic climate. Currently, our model projects a down 100,we are modeling instantaneous rate shocks of plus 100, plus 200, plus 300 and plus 300400 basis point change with rates increasing by the magnitude of the rate ramp evenly over the next 12 monthsshifts as well as flatteninga variety of yield curve scenariosslope, negative rate and instantaneous rate shocks of down 100, plus 100, plus 200 and plus 300 basis points.dynamic
balance sheet scenarios. We continually evaluate the scenarios being modeled with a view toward adapting them to changing economic conditions, expectations and trends.
The Company’s ALCO policy provides that net interest income sensitivity will be considered acceptable if decreases in forecast net interest income based on a dynamic forecasted balance sheet, in specified parallel rate shock scenarios, generally by policy plus and minus 100, 200, 300 and 400 basis points, are within specified percentages of forecast net interest income in the most likely rate scenario over the next twelve months and in the second year. At June 30, 2020, the most likely rate scenario assumes that all indices are floored at 0%. We did not apply the minus rate scenarios at June 30, 2020 due to the low level of current interest rates. The following table illustrates the acceptable limits as defined bythresholds set forth in the ALCO policy and the impact on forecasted net interest income of down 100, plus 100, plus 200 and plus 300 basis point rate shockin the indicated simulated scenarios at SeptemberJune 30, 20172020 and December 31, 2016:2019:
| | | | Down 100 | | Plus 100 | | Plus 200 | | Plus 300 | Down 100 | | Plus 100 | | Plus 200 | | Plus 300 | | Plus 400 |
| Policy Limits: | | | | | | | | |
| Policy Thresholds: | | | | | | | | | | |
| In year 1 | (6.0 | )% | | (6.0 | )% | | (10.0 | )% | | (14.0 | )% | (6.0 | )% | | (6.0 | )% | | (10.0 | )% | | (14.0 | )% | | (18.0 | )% |
| In year 2 | (9.0 | )% | | (9.0 | )% | | (13.0 | )% | | (17.0 | )% | (9.0 | )% | | (9.0 | )% | | (13.0 | )% | | (17.0 | )% | | (21.0 | )% |
| Model Results at September 30, 2017 - increase (decrease): | | | | | | | | |
| Model Results at June 30, 2020 - increase (decrease): | | | | | | | | | | |
| In year 1 | (0.4 | )% | | (0.2 | )% | | (0.6 | )% | | (1.2 | )% | N/A | | 2.6 | % | | 3.7 | % | | 3.5 | % | | 2.5 | % |
| In year 2 | (3.2 | )% | | 1.7 | % | | 3.0 | % | | 4.2 | % | N/A | | 3.0 | % | | 4.9 | % | | 5.3 | % | | 4.7 | % |
| Model Results at December 31, 2016 - increase (decrease): | | | | | | | | |
| Model Results at December 31, 2019 - increase (decrease): | | | | | | | | | | |
| In year 1 | (2.0 | )% | | 1.5 | % | | 2.8 | % | | 3.4 | % | (1.1 | )% | | 1.0 | % | | 0.1 | % | | (2.1 | )% | | (5.1 | )% |
| In year 2 | (3.7 | )% | | 2.6 | % | | 4.6 | % | | 6.6 | % | (4.8 | )% | | 4.6 | % | | 7.2 | % | | 8.7 | % | | 9.4 | % |
Management also simulates changes in EVE in various interest rate environments. The ALCO policy has established parameters of acceptable risk that are defined in terms of the percentage change in EVE from a base scenario under sixeight rate scenarios, derived by implementing immediate parallel movements of plus and minusdown 100, 200, 300 and 300400 basis points from current rates. We did not simulate decreases in interest rates greater than 100 basis points at SeptemberJune 30, 20172020 due to the currentcurrently low rate environment.level of market interest rates. The parametersfollowing table illustrates the acceptable thresholds as established by the ALCO stipulate thatand the modeled declinechange in EVE is considered acceptable ifin the decline is less than 9%, 18%indicated scenarios at June 30, 2020 and 27% in plus or minus 100, plus or minus 200 and plus or minus 300 basis point scenarios, respectively. As of September 30, 2017, our simulation for the Company indicated percentage changes from base EVE of 1.7%, (3.6)%, (7.9)% and (12.7)% in down 100, plus 100, plus 200 and plus 300 basis point scenarios, respectively.December 31, 2019:
|
| | | | | | | | | | | | | | |
| | Down 100 | | Plus 100 | | Plus 200 | | Plus 300 | | Plus 400 |
| Policy Thresholds | (9.0 | )% | | (9.0 | )% | | (18.0 | )% | | (27.0 | )% | | (36.0 | )% |
| Model Results at June 30, 2020 - increase (decrease): | N/A | | 1.4 | % | | (1.2 | )% | | (5.1 | )% | | (9.3 | )% |
| Model Results at December 31, 2019 - increase (decrease): | (1.5 | )% | | (0.7 | )% | | (3.1 | )% | | (6.2 | )% | | (9.7 | )% |
These measures fall within an acceptable level of interest rate risk per the policiesthresholds established byin the ALCO and the Board of Directors. In the event the models indicate an unacceptable level of risk, the Company could undertake a number of actions that would reduce this risk, including the sale or re-positioning of a portion of its available for sale investment portfolio, restructuring of borrowings, or the use of derivatives such as interest rate swaps and caps.policy.
Many assumptions were used by the Company to calculate the impact of changes in interest rates, including the change in rates. Actual results may not be similar to the Company’s projections due to several factors including the timing and frequency of rate changes, market conditions, changes in depositor behavior and loan prepayment speeds and the shape of the yield curve. Actual results may also differ due to the Company’s actions, if any, in response to changing rates and conditions.
Derivative Financial Instruments
Interest rate swaps designated as cash flow or fair value hedging instruments are one of the tools we use to manage interest rate risk. These derivative instruments are used to mitigate exposure to changes in interest ratescash flows on variable rate borrowings suchand to changes in the fair value of fixed rate borrowings, in each case caused by fluctuations in benchmark interest rates, as FHLB advances andwell as to manage duration of liabilities. These interest rate swaps are designated as cash flow hedging instruments. The fair value of thesederivative instruments designated as hedges is included in other assets and other liabilities in our consolidated balance sheets and changessheets. Changes in fair value of derivative instruments designated as cash flow hedges are reported in accumulated other comprehensive income. Changes in the fair value of derivative instruments designated as fair value hedges are recognized in earnings, as is the offsetting gain or loss on the hedged item. At SeptemberJune 30, 2017,2020, outstanding interest rate swaps designated as cash flow hedges had an aggregate notional amount of $2.0 billion. The aggregate fair value of$3.0 billion and outstanding interest rate swaps designated as cash flow
fair value hedges included in other assets was $1.1 million and thehad an aggregate notional amount of $250 million. The aggregate fair value of interest rate swaps designated as cash flow hedges included in other liabilities was $0.3$7.2 million.
Interest rate swaps and caps not designated as cash flow hedges had an aggregate notional amount of $2.3$3.0 billion at SeptemberJune 30, 2017.2020. The aggregate fair value of these interest rate swaps and caps included in other assets was $27.3$145.8 million and the aggregate fair
value included in other liabilities was $26.8$44.9 million. These interest rate swaps and caps were entered into as accommodations to certain of our commercial borrowers. To mitigate interest rate risk associated with these derivatives, the Company enters into offsetting derivative positions with primary dealers.
See Note 7 to the consolidated financial statements for additional information about derivative financial instruments.
Off-Balance Sheet Arrangements
For more information on contractual obligations and commitments, see Note 11 to the consolidated financial statements, the FHLB Advances, Notes and Other Borrowings section of this MD&A and Off-Balance Sheet Arrangements in the MD&A of the Company's 20162019 Annual Report on Form 10-K.
Critical Accounting Policies and Estimates
The Company has made no significant changes in its critical accounting policies and significant estimates from those disclosed in the 2016 Annual Reportreport on Form 10-K.
Non-GAAP Financial Measures
PPNR is a non-GAAP financial measure. Management believes this measure is relevant to understanding the performance of the Company attributable to elements other than the provision for credit losses, particularly in view of the adoption of the CECL accounting methodology, which may impact comparability of operating results to prior periods. This measure also provides a meaningful basis for comparison to other financial institutions and is a measure frequently cited by investors. The following table reconciles the non-GAAP financial measurement of PPNR to the comparable GAAP financial measurement of income before income taxes for the three and six months ended June 30, 2020 and 2019 and the three months ended March 31, 2020 (in thousands): |
| | | | | | | | | | | | | | | | | | | |
| | Three Months Ended June 30, | | Three Months Ended March 31, | | Three Months Ended June 30, | | Six Months Ended June 30, |
| | 2020 | | 2020 | | 2019 | | 2020 | | 2019 |
| Income (loss) before income taxes (GAAP) | $ | 96,904 |
| | $ | (40,422 | ) | | $ | 108,882 |
| | $ | 56,482 |
| | $ | 199,067 |
|
| Plus: Provision for (recovery of) credit losses | 25,414 |
| | 125,428 |
| | (2,747 | ) | | 150,842 |
| | 7,534 |
|
| PPNR (non-GAAP) | $ | 122,318 |
| | $ | 85,006 |
| | $ | 106,135 |
| | $ | 207,324 |
| | $ | 206,601 |
|
Recurring operating expenses is a non-GAAP financial measure. Management believes disclosure of this measure provides readers with information that may be useful in comparing current period results to prior periods and in interpreting trends in operational costs, particularly in light of our BankUnited 2.0 initiative. The following table reconciles the non-GAAP financial measurement of recurring operating expenses to the comparable GAAP financial measurement of total non-interest expense for the three and six months ended June 30, 2020 and 2019 (in thousands):
|
| | | | | | | | | | | | | | | |
| | Three Months Ended June 30, | | Six Months Ended June 30, |
| | 2020 | | 2019 | | 2020 | | 2019 |
| Total non-interest expense (GAAP) | $ | 106,370 |
| | $ | 120,085 |
| | $ | 225,238 |
| | $ | 246,775 |
|
| Less: | | | | | | | |
| Depreciation of operating lease equipment | (12,219 | ) | | (11,489 | ) | | (24,822 | ) | | (23,301 | ) |
| Costs incurred directly related to implementation of BankUnited 2.0 | (255 | ) | | (6,217 | ) | | (334 | ) | | (12,109 | ) |
| COVID-19 expenses | (1,519 | ) | | — |
| | (1,519 | ) | | — |
|
| Recurring operating expenses (non-GAAP) | $ | 92,377 |
| | $ | 102,379 |
| | $ | 198,563 |
| | $ | 211,365 |
|
Tangible book value per common share is a non-GAAP financial measure. Management believes this measure is relevant to understanding the capital position and performance of the Company. Disclosure of this non-GAAP financial measure also provides a meaningful base for comparabilitycomparison to other financial institutions.institutions as it is a metric commonly used in the banking industry. The following table reconciles the non-GAAP financial measurement of tangible book value per common share to the comparable GAAP financial measurement of book value per common share at SeptemberJune 30, 20172020 (in thousands except share and per share data):
| | | | | | | |
| Total stockholders’ equity | $ | 2,623,489 |
| $ | 2,755,053 |
|
| Less: goodwill and other intangible assets | 77,857 |
| 77,652 |
|
| Tangible stockholders’ equity | $ | 2,545,632 |
| $ | 2,677,401 |
|
| | | |
| Common shares issued and outstanding | 106,821,902 |
| 92,420,278 |
|
| | | |
| Book value per common share | $ | 24.56 |
| $ | 29.81 |
|
| | | |
| Tangible book value per common share | $ | 23.83 |
| $ | 28.97 |
|
Item 3. Quantitative and Qualitative Disclosures About Market Risk
See the section entitled “Interest Rate Risk” included in Item 2. “Management’s Discussion and Analysis of Financial Condition and Results of Operations.”
Item 4. Controls and Procedures
Evaluation of Disclosure Controls and Procedures
As of the end of the period covered by this Form 10-Q, we carried out an evaluation under the supervision and with the participation of our management, including the Chief Executive Officer and Chief Financial Officer, of the effectiveness of the design and operation of our disclosure controls and procedures as defined in Exchange Act Rules 13a-15(e) and 15d-15(e). Based upon that evaluation, the Chief Executive Officer and the Chief Financial Officer concluded that our disclosure controls and procedures were effective.
Effective January 1, 2020, the Company adopted ASU 2016-13. The Company designed new controls and modified existing controls as part of its adoption. These additional internal controls over financial reporting included controls over model governance, assumptions, the determination of a reasonable and supportable economic forecast, and expanded controls over loan level data.
During the quarter ended SeptemberJune 30, 2017,2020, there were no changes in the Company’sCompany's internal control over financial reporting, that materially affected, or are reasonably likely to materially affect, the Company’sCompany's internal control over financial reporting. We have focused on insuring that our technology systems and internal controls continue to operate effectively in a remote work environment and have not identified any instances in which our control environment has failed to operate effectively. We are continually monitoring and assessing any impact of the COVID-19 situation on our internal controls to address impacts to their design, implementation and operating effectiveness.
PART II. OTHER INFORMATION
Item 1. Legal Proceedings
The Company is involved as plaintiff or defendant in various legal actions arising in the normal course of business. In the opinion of management, based upon currently available information and the advice of legal counsel, the likelihood is remote that the impact of these proceedings, either individually or in the aggregate, would be material to the Company’s consolidated financial position, results of operations or cash flows.
We received a subpoena from the United States Department of Justice in October 2019 requesting documentation related to the taxi medallion line of business formerly conducted by the Bank. We are cooperating with this investigation.
Item 1A. Risk Factors
ForThe COVID-19 pandemic has caused substantial disruption to the global economy which has adversely affected, and is expected to continue to adversely affect, the Company’s business and results of operations. The future impacts of the COVID-19 pandemic on the global economy and the Company’s business, results of operations and financial condition remains uncertain.
In March 2020, the World Health Organization declared novel coronavirus disease 2019 (COVID-19) as a discussionglobal pandemic. The pandemic has resulted in governmental authorities implementing numerous measures attempting to contain the spread and impact of risk factors relatingCOVID-19 such as travel bans and restrictions, quarantines, shelter in place orders, and limitations on business activities, including in major markets in which the Company and its clients are located or do business. The COVID-19 pandemic, and governmental responses to the pandemic, have severely negatively impacted the global economy, disrupted global supply chains, lowered equity market valuations, created significant volatility and disruption in financial markets, and increased unemployment levels.
This macroeconomic environment has had, and could continue to have, an adverse effect on the Company’s business and operations. Should current economic impacts persist or continue to deteriorate, this macroeconomic environment could have a continued adverse effect on our business please referand operations, including, but not limited to, decreased demand for the Company’s products and services, protracted periods of lower interest rates, loss of income resulting from forbearances, deferrals and fee waivers provided by the Company to its consumer and commercial borrowers, increased credit losses due to deterioration in the financial condition of our consumer and commercial borrowers, including declining asset and collateral values, which may continue to increase our provision for credit losses and net charge-offs and possible constraints on liquidity and capital, whether due to increases in risk-weighted assets related to supporting client activities or to regulatory actions. The business operations of the Company may also be disrupted if significant portions of its workforce or those of vendors or third-party service providers are unable to work effectively, including because of illness, quarantines, government actions, restrictions in connection with the pandemic, and technology limitations and/or disruptions. The Company also faces an increased risk of litigation and governmental and regulatory scrutiny as a result of the effects of the pandemic on market and economic conditions and actions taken by governmental authorities in response to those conditions.
The extent to which the COVID-19 pandemic impacts the Company’s business, results of operations, and financial condition, as well as its regulatory capital and liquidity ratios, will depend on future developments, which are highly uncertain, including the scope and duration of the pandemic and actions taken by governmental authorities and other third parties in response to the factors discussed under “Part I-Item 1A - Riskpandemic. Moreover, the effects of the COVID-19 pandemic may heighten many of the other risks described in the section entitled “Risk Factors” in our 2016most recent Annual Report on Form 10-K and any subsequent Quarterly Report on Form 10-Q or Current Report on Form 8-K including, but not limited to, financial market conditions, economic conditions, credit risk, interest rate risk, risk of security breaches and technology changes.
There have been no material changes in the other risk factors disclosed by the Company in its 2019 Annual Report on Form 10-K filed with the Securities and Exchange Commission on February 28, 2017, in addition to the following factor.2020.
Item 2. Unregistered Sales of our loans are to borrowers whose businesses are located in or secured by properties located in the stateEquity Securities and Use of Florida, which was impacted by Hurricane Irma. In addition, the Bank has a limited number of customers and collateral properties located in areas of Texas that were impacted by Hurricane Harvey. The effects of Hurricanes Irma and Harvey and other adverse weather events may negatively affect our geographic markets or disrupt our operations, which could have an adverse impact on our results of operations.Proceeds
Our geographic markets in Florida and other coastal areas are susceptible to severe weather, including hurricanes, flooding and damaging winds. On September 10, 2017, Hurricane Irma made landfall in Florida as a Category 4 hurricane affecting some areas with significant flooding, wind damage and power outages. In addition, the Bank has a limited number of customers and collateral properties located in areas of Texas that were impacted by Hurricane Harvey during August, 2017. Weather events such as Hurricanes Irma and Harvey can disrupt our operations, result in damage to our facilities and negatively affect the local economies in which we operate. These events may lead to a decline in loan originations, reduce or destroy the value of collateral for our loans, particularly real estate, negatively impact the business operations of our customers, and cause an increase in delinquencies, foreclosures and loan losses. These events may also lead to a decline in regional economic conditions and prospects in certain circumstances. Our business or results of operations may be adversely impacted by these and other negative effects of such weather events.None.
We are currently in the process of assessing the impact of Hurricanes Irma and Harvey on our borrowers’ ability to repay their obligations to the Bank and on the value of underlying collateral properties. Although we currently believe the storms did not materially impact the ability of the substantial majority of our borrowers to repay their loans, our impact assessment is ongoing, including with respect to the impact on our loan originations, the value of properties securing our loans or the performance of our loans, the economic condition of our borrowers and their ability to timely repay their obligations, and the overall impacts on regional economic conditions and our business, operations and growth prospects in the affected market areas. As a result, it is premature to conclude with certainty as to the ultimate impact of these hurricanes on our level of loan losses, our business or the results of our operations. The Bank is generally named as a loss payee on hazard and flood insurance policies covering collateral properties and carries casualty and business interruption insurance. These policies could partially mitigate losses that the Bank may sustain due to the effects of these hurricanes; however, the timing and amount of any proceeds that we may recover from insurance policies is uncertain and may not be sufficient to adequately compensate us for losses that we experience due to these hurricanes and other natural disasters.
Item 6.
Exhibits
|
| | | | |
Exhibit Number | | Description | | Location |
| | | | | |
| | | | Filed herewith |
| | | | | |
| | | | Filed herewith |
| | | | | |
| | | | Filed herewith |
| | | | | |
| | | | Filed herewith |
| | | | | |
| 101.INS | | The instance document does not appear in the interactive data file because its XBRL Instance Documenttags are embedded within the inline XBRL document | | Filed herewith |
| | | | | |
| 101.SCH | | XBRL Taxonomy Extension Schema | | Filed herewith |
| | | | | |
| 101.CAL | | XBRL Taxonomy Extension Calculation Linkbase | | Filed herewith |
| | | | | |
| 101.DEF | | XBRL Taxonomy Extension Definition Linkbase | | Filed herewith |
| | | | | |
| 101.LAB | | XBRL Taxonomy Extension Label Linkbase | | Filed herewith |
| | | | | |
| 101.PRE | | XBRL Taxonomy Extension Presentation Linkbase | | Filed herewith |
SIGNATURE
Pursuant to the requirements of the Securities Exchange Act of 1934, the registrant has duly caused this report to be signed on its behalf by the undersigned thereunto duly authorized this 8th7th day of November 2017.August 2020.
|
| |
| | /s/ Rajinder P. Singh |
| | Rajinder P. Singh |
| | Chairman, President and Chief Executive Officer |
| | |
| | |
| | /s/ Leslie N. Lunak |
| | Leslie N. Lunak |
| | Chief Financial Officer |