UNITED STATES
SECURITIES AND EXCHANGE COMMISSION
Washington, D.C. 20549
FORM 10-Q
|
| |
| ☒ | QUARTERLY REPORT PURSUANT TO SECTION 13 OR 15(d) OF THE SECURITIES EXCHANGE ACT OF 1934 |
For the quarterly period endedSeptember 30, 2019
OR
|
| |
| ☐ | TRANSITION REPORT PURSUANT TO SECTION 13 OR 15(d) OF THE SECURITIES EXCHANGE ACT OF 1934 |
For the transitionquarterly period from toended March 31, 2020
Commission File Number: 001-35039
BankUnited, Inc.
(Exact name of registrant as specified in its charter)
|
| | |
| Delaware | | 27-0162450 |
(State or other jurisdiction of incorporation or organization) | | (I.R.S. Employer Identification No.) |
|
| | | |
| 14817 Oak Lane | Miami Lakes | FL | 33016 |
| (Address of principal executive offices) | | | (Zip Code) |
Registrant’s telephone number, including area code: (305) 569-2000
Indicate by check mark whether the registrant (1) has filed all reports required to be filed by Section 13 or 15(d) of the Securities Exchange Act of 1934 during the preceding 12 months (or for such shorter period that the registrant was required to file such reports), and (2) has been subject to such filing requirements for the past 90 days. Yes ý No o
Indicate by check mark whether the registrant has submitted electronically and posted on its corporate Web site, if any, every Interactive Data File required to be submitted and posted pursuant to Rule 405 of Regulation S-T (§232.405 of this chapter) during the preceding 12 months (or for such shorter period that the registrant was required to submit and post such files). Yes ý No o
Indicate by check mark whether the registrant is a large accelerated filer, an accelerated filer, a non-accelerated filer, a smaller reporting company, or an emerging growth company. See the definitions of “large accelerated filer,” “accelerated filer,” “smaller reporting company,” and "emerging growth company" in Rule 12b-2 of the Exchange Act.
|
| | | | | |
| Large accelerated filer | ☒ | Accelerated filer | ☐ | Emerging growth company | ☐ |
| Non-accelerated filer | ☐ | Smaller reporting company | ☐ |
| | | Emerging growth company | ☐ |
If an emerging growth company, indicate by check mark if the registrant has elected not to use the extended transition period for complying with any new or revised financial accounting standards provided pursuant to Section 13(a) of the Exchange Act o
Indicate by check mark whether the registrant is a shell company (as defined in Rule 12b-2 of the Exchange Act). Yes ☐ No ☒
Indicate the number of shares outstanding of each of the issuer’s classes of common stock, as of the latest practicable date.
|
| | | | |
| Class | | Trading Symbol | | Name of Exchange on Which Registered |
| Common Stock, $0.01 Par Value | | BKU | | New York Stock Exchange |
The number of outstanding shares of the registrant common stock, $0.01 par value, was 94,945,379 as of November 6, 2019.May 5, 2020 was 92,389,643.
BANKUNITED, INC.
Form 10-Q
For the Quarter Ended September 30, 2019March 31, 2020
TABLE OF CONTENTS
|
| | |
| | | Page |
| | | |
| | | |
| | | |
| PART I. | | |
| | | |
| ITEM 1. | | |
| | | |
| | | |
| | | |
| | | |
| | | |
| | | |
| | | |
| ITEM 2. | | |
| | | |
| ITEM 3. | | |
| | | |
| ITEM 4. | | |
| | | |
| PART II. | | |
| | | |
| ITEM 1. | | |
| | | |
| ITEM 1A. | | |
| | | |
| ITEM 2. | | |
| | | |
| ITEM 6. | | |
| | | |
| |
| | | |
GLOSSARY OF DEFINED TERMS
The following acronyms and terms may be used throughout this Form 10-Q, including the consolidated financial statements and related notes.
|
| | |
| ACI | | Loans acquired with evidence of deterioration in credit quality since origination (Acquired Credit Impaired) |
| ACL | | Allowance for credit losses |
| AFS | | Available for sale |
| ALCO | | Asset/Liability Committee |
| ALLL | | Allowance for loan and lease losses |
| AOCI | | Accumulated other comprehensive income |
| ASC | | Accounting Standards Codification |
| ASU | | Accounting Standards Update |
| BKU | | BankUnited, Inc. |
| BankUnited | | BankUnited, National Association |
| The Bank | | BankUnited, National Association |
| Bridge | | Bridge Funding Group, Inc. |
| Buyout loans | | FHA and VA insured mortgages from third party servicers who have exercised their right to purchase these loans out of GNMA securitizations |
| CARES Act | | Coronavirus Aid, Relief, and Economic Security Act |
| CDO | | Collateralized debt obligation |
| CECL | | Current expected credit losses |
| CET1 | | Common Equity Tier 1 capital |
CECLCFPB | | Current expected credit lossConsumer Financial Protection Bureau |
| CLO | | Collateralized loan obligations |
| CMBS | | Commercial mortgage-backed securities |
| CME | | Chicago Mercantile Exchange |
CLOs | | Collateralized loan obligations |
| CMOs | | Collateralized mortgage obligations |
Covered assetsCPR | | Assets covered under the Loss Sharing AgreementsConstant prepayment rate |
Covered loansCUSIP | | Loans covered under the Loss Sharing AgreementsCommittee on Uniform Securities Identification Procedures |
| DIF | | Deposit insurance fund |
| DSCR | | Debt Service Coverage Ratio |
| EPS | | Earnings per common share |
| EVE | | Economic value of equity |
| FASB | | Financial Accounting Standards Board |
| FDIA | | Federal Deposit Insurance Act |
| FDIC | | Federal Deposit Insurance Corporation |
FHLB | | Federal Home Loan Bank |
| FHA loan | | Loan guaranteed by the Federal Housing Administration |
| FHLB | | Federal Home Loan Bank |
| FICO | | Fair Isaac Corporation (credit score) |
| FRB | | Federal Reserve Bank |
FSB Acquisition | | Acquisition of substantially all of the assets and assumption of all of the non-brokered deposits and substantially all of the other liabilities of BankUnited, FSB from the FDIC on May 21, 2009 |
FSB Loans | | 1-4 single family residential loans acquired in the FSB Acquisition that were formally covered by the Single Family Shared-Loss Agreement |
| GAAP | | U.S. generally accepted accounting principles |
| GDP | | Gross Domestic Product |
| GNMA | | Government National Mortgage Association |
| HTM | | Held to maturity |
| IPO | | Initial public offering |
ISDAIRS | | International Swaps and Derivatives Association |
LIBOR | | London InterBank Offered RateInternal Revenue Service |
|
| | |
Loss Sharing AgreementsISDA | | Two loss sharing agreements entered into with the FDIC in connection with the FSB AcquisitionInternational Swaps and Derivatives Association |
| LGD | | Loss Given Default |
| LIBOR | | London InterBank Offered Rate |
| LIHTC | | Low Income Housing Tax Credits |
| LTV | | Loan-to-value |
| MBS | | Mortgage-backed securities |
Non-Covered LoansMSA | | Loans other than those covered under the Loss Sharing AgreementsMetropolitan Statistical Area |
OCINRSRO | | Other comprehensive incomeNationally recognized statistical rating organization |
| NYSE | | New York Stock Exchange |
| OCC | | Office of the Comptroller of the Currency |
| OCI | | Other comprehensive income |
| OREO | | Other real estate owned |
OTTIPCD | | Other-than-temporary impairmentPurchased credit-deteriorated |
| PD | | Probability of default |
| Pinnacle | | Pinnacle Public Finance, Inc. |
| PPP | | Small Business Administration’s Paycheck Protection Program |
| Proxy Statement | | Definitive proxy statement for the Company's 2019 annual meeting of stockholders |
| PSU | | Performance Share Unit |
PinnacleQRMs | | Pinnacle Public Finance, Inc.Qualified residential mortgages |
| REIT | | Real Estate Investment Trust |
| ROU Asset | | Right-of-use Asset |
| RSU | | Restricted Share Unit |
| SBA | | U.S. Small Business Administration |
| SBF | | Small Business Finance Unit |
| SEC | | Securities and Exchange Commission |
Single Family Shared-Loss Agreement | | A single-family loan shared-loss agreement entered into with the FDIC in connection with the FSB Acquisition |
| SOFR | | Secured Overnight Financing Rate |
| TDR | | Troubled-debt restructuring |
| Tri-State | | New York, New Jersey and Connecticut |
| UPB | | Unpaid principal balance |
| USDA | | U.S. Department of Agriculture |
| VA loan | | Loan guaranteed by the U.S. Department of Veterans Affairs |
| WARM | | Weighted-average remaining maturity |
PART I - FINANCIAL INFORMATION
Item 1. Financial Statements and Supplementary Data
BANKUNITED, INC. AND SUBSIDIARIES
CONSOLIDATED BALANCE SHEETS - UNAUDITED
(In thousands, except share and per share data) | | | | September 30,
2019 | | December 31,
2018 | March 31,
2020 | | December 31,
2019 |
| ASSETS | |
| | |
| |
| | |
|
| Cash and due from banks: | |
| | |
| |
| | |
|
| Non-interest bearing | $ | 15,401 |
| | $ | 9,392 |
| $ | 8,905 |
| | $ | 7,704 |
|
| Interest bearing | 214,827 |
| | 372,681 |
| 757,793 |
| | 206,969 |
|
| Cash and cash equivalents | 230,228 |
| | 382,073 |
| 766,698 |
| | 214,673 |
|
| Investment securities (including securities recorded at fair value of $7,960,656 and $8,156,878) | 7,970,656 |
| | 8,166,878 |
| |
| Investment securities (including securities recorded at fair value of $7,864,601 and $7,759,237) | | 7,874,601 |
| | 7,769,237 |
|
| Non-marketable equity securities | 272,789 |
| | 267,052 |
| 281,714 |
| | 253,664 |
|
| Loans held for sale | 46,332 |
| | 36,992 |
| 17,655 |
| | 37,926 |
|
| Loans (including covered loans of $201,376 at December 31, 2018) | 22,855,500 |
| | 21,977,008 |
| |
| Allowance for loan and lease losses | (108,462 | ) | | (109,931 | ) | |
| Loans | | 23,184,278 |
| | 23,154,988 |
|
| Allowance for credit losses | | (250,579 | ) | | (108,671 | ) |
| Loans, net | 22,747,038 |
| | 21,867,077 |
| 22,933,699 |
| | 23,046,317 |
|
| Bank owned life insurance | 280,839 |
| | 263,340 |
| 288,869 |
| | 282,151 |
|
| Operating lease equipment, net | 696,899 |
| | 702,354 |
| 684,563 |
| | 698,153 |
|
| Goodwill and other intangible assets | 77,685 |
| | 77,718 |
| 77,663 |
| | 77,674 |
|
| Other assets | 628,069 |
| | 400,842 |
| 670,209 |
| | 491,498 |
|
| Total assets | $ | 32,950,535 |
| | $ | 32,164,326 |
| $ | 33,595,671 |
| | $ | 32,871,293 |
|
| | | | | | | |
| LIABILITIES AND STOCKHOLDERS’ EQUITY | |
| | |
| |
| | |
|
| Liabilities: | |
| | |
| |
| | |
|
| Demand deposits: | |
| | |
| |
| | |
|
| Non-interest bearing | $ | 4,126,788 |
| | $ | 3,621,254 |
| $ | 4,599,337 |
| | $ | 4,294,824 |
|
| Interest bearing | 1,847,301 |
| | 1,771,465 |
| 2,535,696 |
| | 2,130,976 |
|
| Savings and money market | 10,935,779 |
| | 11,261,746 |
| 10,323,899 |
| | 10,621,544 |
|
| Time | 7,046,560 |
| | 6,819,758 |
| 7,541,839 |
| | 7,347,247 |
|
| Total deposits | 23,956,428 |
| | 23,474,223 |
| 25,000,771 |
| | 24,394,591 |
|
| Federal funds purchased | 175,000 |
| | 175,000 |
| — |
| | 100,000 |
|
| Federal Home Loan Bank advances | 4,930,638 |
| | 4,796,000 |
| 5,144,409 |
| | 4,480,501 |
|
| Notes and other borrowings | 403,832 |
| | 402,749 |
| 428,579 |
| | 429,338 |
|
| Other liabilities | 575,362 |
| | 392,521 |
| 505,783 |
| | 486,084 |
|
| Total liabilities | 30,041,260 |
| | 29,240,493 |
| 31,079,542 |
| | 29,890,514 |
|
| | | | | | | |
| Commitments and contingencies |
|
| |
|
|
|
| |
|
|
| | | | | | | |
| Stockholders' equity: | |
| | |
| |
| | |
|
| Common stock, par value $0.01 per share, 400,000,000 shares authorized; 95,070,399 and 99,141,374 shares issued and outstanding | 951 |
| | 991 |
| |
| Common stock, par value $0.01 per share, 400,000,000 shares authorized; 92,406,294 and 95,128,231 shares issued and outstanding | | 924 |
| | 951 |
|
| Paid-in capital | 1,077,946 |
| | 1,220,147 |
| 987,757 |
| | 1,083,920 |
|
| Retained earnings | 1,859,055 |
| | 1,697,822 |
| 1,851,040 |
| | 1,927,735 |
|
| Accumulated other comprehensive income (loss) | (28,677 | ) | | 4,873 |
| |
| Accumulated other comprehensive loss | | (323,592 | ) | | (31,827 | ) |
| Total stockholders' equity | 2,909,275 |
| | 2,923,833 |
| 2,516,129 |
| | 2,980,779 |
|
| Total liabilities and stockholders' equity | $ | 32,950,535 |
| | $ | 32,164,326 |
| $ | 33,595,671 |
| | $ | 32,871,293 |
|
1
The accompanying notes are an integral part of these consolidated financial statements.
1statements
BANKUNITED, INC. AND SUBSIDIARIES
CONSOLIDATED STATEMENTS OF INCOME - UNAUDITED
(In thousands, except per share data)
| | | | Three Months Ended September 30, | | Nine Months Ended September 30, | Three Months Ended March 31, |
| | 2019 | | 2018 | | 2019 | | 2018 | 2020 | | 2019 |
| Interest income: | | | | | |
| | |
| |
| | |
|
| Loans | $ | 248,770 |
| | $ | 293,543 |
| | $ | 738,766 |
| | $ | 855,807 |
| $ | 234,359 |
| | $ | 240,632 |
|
| Investment securities | 69,413 |
| | 59,319 |
| | 218,554 |
| | 165,396 |
| 56,060 |
| | 76,345 |
|
| Other | 5,219 |
| | 4,855 |
| | 15,140 |
| | 13,145 |
| 3,720 |
| | 4,852 |
|
| Total interest income | 323,402 |
| | 357,717 |
| | 972,460 |
| | 1,034,348 |
| 294,139 |
| | 321,829 |
|
| Interest expense: | | | | | | | | | | |
| Deposits | 99,483 |
| | 75,257 |
| | 296,891 |
| | 196,916 |
| 82,822 |
| | 97,421 |
|
| Borrowings | 38,229 |
| | 30,492 |
| | 108,095 |
| | 82,392 |
| 30,741 |
| | 33,507 |
|
| Total interest expense | 137,712 |
| | 105,749 |
| | 404,986 |
| | 279,308 |
| 113,563 |
| | 130,928 |
|
| Net interest income before provision for loan losses | 185,690 |
| | 251,968 |
| | 567,474 |
| | 755,040 |
| |
| Provision for (recovery of) loan losses (including ($50) and $517 for covered loans for the three and nine months ended September 30, 2018) | 1,839 |
| | 1,200 |
| | 9,373 |
| | 13,342 |
| |
| Net interest income after provision for loan losses | 183,851 |
| | 250,768 |
| | 558,101 |
| | 741,698 |
| |
| Net interest income before provision for credit losses | | 180,576 |
| | 190,901 |
|
| Provision for credit losses | | 125,428 |
| | 10,281 |
|
| Net interest income after provision for credit losses | | 55,148 |
| | 180,620 |
|
| Non-interest income: | | | | | | | | | | |
| Income from resolution of covered assets, net | — |
| | 3,134 |
| | — |
| | 10,689 |
| |
| Net gain (loss) on FDIC indemnification | — |
| | 3,090 |
| | — |
| | (1,925 | ) | |
| Deposit service charges and fees | 4,269 |
| | 3,723 |
| | 12,389 |
| | 10,811 |
| 4,186 |
| | 3,830 |
|
| Gain on sale of loans, net (including $5,037 and $4,739 related to covered loans for the three and nine months ended September 30, 2018) | 5,163 |
| | 8,691 |
| | 10,220 |
| | 12,960 |
| |
| Gain on investment securities, net | 3,835 |
| | 432 |
| | 13,736 |
| | 2,938 |
| |
| Gain on sale of loans, net | | 3,466 |
| | 2,936 |
|
| Gain (loss) on investment securities, net | | (3,453 | ) | | 5,785 |
|
| Lease financing | 18,583 |
| | 14,091 |
| | 52,774 |
| | 45,685 |
| 15,481 |
| | 17,186 |
|
| Other non-interest income | 6,006 |
| | 5,574 |
| | 20,329 |
| | 17,536 |
| 3,618 |
| | 6,518 |
|
| Total non-interest income | 37,856 |
| | 38,735 |
| | 109,448 |
| | 98,694 |
| 23,298 |
| | 36,255 |
|
| Non-interest expense: | | | | | | | | | | |
| Employee compensation and benefits | 57,102 |
| | 65,612 |
| | 179,586 |
| | 198,185 |
| 58,887 |
| | 65,233 |
|
| Occupancy and equipment | 14,673 |
| | 13,812 |
| | 42,477 |
| | 42,355 |
| 12,369 |
| | 13,166 |
|
| Amortization of FDIC indemnification asset | — |
| | 48,255 |
| | — |
| | 132,852 |
| |
| Deposit insurance expense | 3,781 |
| | 5,375 |
| | 12,849 |
| | 14,810 |
| 4,403 |
| | 4,041 |
|
| Professional fees | 2,923 |
| | 5,240 |
| | 17,731 |
| | 10,772 |
| 3,204 |
| | 7,871 |
|
| Technology and telecommunications | 10,994 |
| | 9,262 |
| | 34,175 |
| | 26,121 |
| 12,596 |
| | 11,168 |
|
| Depreciation of equipment under operating lease | 11,582 |
| | 9,870 |
| | 34,883 |
| | 28,662 |
| |
| Loss on debt extinguishment | 3,796 |
| | — |
| | 3,796 |
| | — |
| |
| Depreciation of operating lease equipment | | 12,603 |
| | 11,812 |
|
| Other non-interest expense | 16,455 |
| | 13,372 |
| | 42,584 |
| | 40,105 |
| 14,806 |
| | 13,399 |
|
| Total non-interest expense | 121,306 |
| | 170,798 |
| | 368,081 |
| | 493,862 |
| 118,868 |
| | 126,690 |
|
| Income before income taxes | 100,401 |
| | 118,705 |
| | 299,468 |
| | 346,530 |
| |
| Provision for income taxes | 24,182 |
| | 21,377 |
| | 75,826 |
| | 74,067 |
| |
| Net income | $ | 76,219 |
| | $ | 97,328 |
| | $ | 223,642 |
| | $ | 272,463 |
| |
| Earnings per common share, basic | $ | 0.78 |
| | $ | 0.90 |
| | $ | 2.23 |
| | $ | 2.50 |
| |
| Earnings per common share, diluted | $ | 0.77 |
| | $ | 0.90 |
| | $ | 2.23 |
| | $ | 2.49 |
| |
| Income (loss) before income taxes | | (40,422 | ) | | 90,185 |
|
| Provision (benefit) for income taxes | | (9,471 | ) | | 24,213 |
|
| Net income (loss) | | $ | (30,951 | ) | | $ | 65,972 |
|
| Earnings (loss) per common share, basic | | $ | (0.33 | ) | | $ | 0.65 |
|
| Earnings (loss) per common share, diluted | | $ | (0.33 | ) | | $ | 0.65 |
|
2
The accompanying notes are an integral part of these consolidated financial statements.
2statements
BANKUNITED, INC. AND SUBSIDIARIES
CONSOLIDATED STATEMENTS OF COMPREHENSIVE INCOME - UNAUDITED
(In thousands)
| | | | Three Months Ended September 30, | | Nine Months Ended September 30, | Three Months Ended March 31, |
| | 2019 | | 2018 | | 2019 | | 2018 | 2020 | | 2019 |
| | | | | | | | | | | |
| Net income | $ | 76,219 |
| | $ | 97,328 |
| | $ | 223,642 |
| | $ | 272,463 |
| |
| Other comprehensive loss, net of tax: | | |
|
| | | | |
| |
| Unrealized gains on investment securities available for sale: | | |
|
| | | | |
| |
| Net income (loss) | | $ | (30,951 | ) | | $ | 65,972 |
|
| Other comprehensive income (loss), net of tax: | | | | |
|
| Unrealized gains (losses) on investment securities available for sale: | | | | |
|
| Net unrealized holding gain (loss) arising during the period | 8,358 |
| | (18,147 | ) | | 53,301 |
| | (58,577 | ) | (213,160 | ) | | 21,617 |
|
| Reclassification adjustment for net securities gains realized in income | (2,518 | ) | | (382 | ) | | (8,568 | ) | | (2,974 | ) | (1,140 | ) | | (3,173 | ) |
| Net change in unrealized gain on securities available for sale | 5,840 |
| | (18,529 | ) | | 44,733 |
| | (61,551 | ) | (214,300 | ) | | 18,444 |
|
| Unrealized losses on derivative instruments: | | |
|
| | | | |
| | | |
|
| Net unrealized holding gain (loss) arising during the period | (16,774 | ) | | 10,536 |
| | (74,667 | ) | | 40,175 |
| |
| Reclassification adjustment for net losses realized in income | (374 | ) | | (772 | ) | | (3,616 | ) | | (617 | ) | |
| Net change in unrealized loss on derivative instruments | (17,148 | ) | | 9,764 |
| | (78,283 | ) | | 39,558 |
| |
| Net unrealized holding loss arising during the period | | (80,814 | ) | | (20,675 | ) |
| Reclassification adjustment for net (gains) losses realized in income | | 3,349 |
| | (2,001 | ) |
| Net change in unrealized losses on derivative instruments | | (77,465 | ) | | (22,676 | ) |
| Other comprehensive loss | (11,308 | ) | | (8,765 | ) | | (33,550 | ) | | (21,993 | ) | (291,765 | ) | | (4,232 | ) |
| Comprehensive income | $ | 64,911 |
| | $ | 88,563 |
| | $ | 190,092 |
| | $ | 250,470 |
| |
| Comprehensive income (loss) | | $ | (322,716 | ) | | $ | 61,740 |
|
3
The accompanying notes are an integral part of these consolidated financial statements.
3statements
BANKUNITED, INC. AND SUBSIDIARIES
CONSOLIDATED STATEMENTS OF CASH FLOWS - UNAUDITED
(In thousands)
| | | | Nine Months Ended September 30, | Three Months Ended March 31, |
| | 2019 | | 2018 | 2020 | | 2019 |
| Cash flows from operating activities: | |
| | |
| |
| | |
|
| Net income | $ | 223,642 |
| | $ | 272,463 |
| |
| Adjustments to reconcile net income to net cash provided by operating activities: | | | | |
| Net income (loss) | | $ | (30,951 | ) | | $ | 65,972 |
|
| Adjustments to reconcile net income (loss) to net cash provided by operating activities: | | | | |
| Amortization and accretion, net | (30,550 | ) | | (97,064 | ) | (5,520 | ) | | (11,418 | ) |
| Provision for loan losses | 9,373 |
| | 13,342 |
| |
| Income from resolution of covered assets, net | — |
| | (10,689 | ) | |
| Net loss on FDIC indemnification | — |
| | 1,925 |
| |
| Provision for credit losses | | 125,428 |
| | 10,281 |
|
| Gain on sale of loans, net | (10,220 | ) | | (12,960 | ) | (3,466 | ) | | (2,936 | ) |
| Gain on investment securities, net | (13,736 | ) | | (2,938 | ) | |
| (Gain) loss on investment securities, net | | 3,453 |
| | (5,785 | ) |
| Equity based compensation | 16,967 |
| | 18,045 |
| 3,637 |
| | 6,473 |
|
| Depreciation and amortization | 53,105 |
| | 51,472 |
| 10,319 |
| | 18,171 |
|
| Deferred income taxes | 22,278 |
| | 60,071 |
| 945 |
| | (1,972 | ) |
| Loss on debt extinguishment | 3,796 |
| | — |
| |
| Proceeds from sale of loans held for sale | 317,027 |
| | 182,330 |
| 191,783 |
| | 107,216 |
|
| Loans originated for sale, net of repayments | (68,665 | ) | | (125,509 | ) | (13,036 | ) | | (27,177 | ) |
| Other: | | | | | | |
| (Increase) decrease in other assets | 20,288 |
| | (77,393 | ) | (25,028 | ) | | 293 |
|
| Increase (decrease) in other liabilities | (131,066 | ) | | 130,827 |
| |
| Decrease in other liabilities | | (194,044 | ) | | (70,599 | ) |
| Net cash provided by operating activities | 412,239 |
| | 403,922 |
| 63,520 |
| | 88,519 |
|
| | | | | | | |
| Cash flows from investing activities: | |
| | |
| |
| | |
|
| Purchase of investment securities | (3,176,833 | ) | | (2,557,757 | ) | (945,793 | ) | | (1,169,104 | ) |
| Proceeds from repayments and calls of investment securities | 1,057,043 |
| | 1,134,995 |
| 282,822 |
| | 273,112 |
|
| Proceeds from sale of investment securities | 2,297,121 |
| | 938,555 |
| 306,532 |
| | 775,723 |
|
| Purchase of non-marketable equity securities | (319,387 | ) | | (235,876 | ) | (79,688 | ) | | (88,188 | ) |
| Proceeds from redemption of non-marketable equity securities | 313,650 |
| | 228,438 |
| 51,638 |
| | 78,413 |
|
| Purchases of loans | (1,636,932 | ) | | (913,840 | ) | (502,628 | ) | | (305,354 | ) |
| Loan originations, repayments and resolutions, net | 332,246 |
| | 320,550 |
| 309,963 |
| | (147,435 | ) |
| Proceeds from sale of loans, net | 205,869 |
| | 250,769 |
| 9,332 |
| | 8,334 |
|
| Proceeds from sale of equipment under operating lease | 9,404 |
| | 50,902 |
| |
| Acquisition of equipment under operating lease | (38,312 | ) | | (137,305 | ) | |
| Acquisition of operating lease equipment | | — |
| | (22,400 | ) |
| Other investing activities | (36,409 | ) | | (16,548 | ) | (11,641 | ) | | (12,598 | ) |
| Net cash used in investing activities | (992,540 | ) | | (937,117 | ) | (579,463 | ) | | (609,497 | ) |
| | | | (Continued) |
| | | (Continued) |
|
| | | | | |
| | | | | |
| | | | | |
| | | | | |
| | | | | |
| | | | | |
| | | | | |
| | | | | |
| | | | | |
| | | | | |
4
The accompanying notes are an integral part of these consolidated financial statements
BANKUNITED, INC. AND SUBSIDIARIES
CONSOLIDATED STATEMENTS OF CASH FLOWS - UNAUDITED (Continued)
(In thousands)
|
| | | | | | | |
| | Nine Months Ended September 30, |
| | 2019 | | 2018 |
| Cash flows from financing activities: | |
| | |
|
| Net increase in deposits | 482,205 |
| | 426,811 |
|
| Net increase in federal funds purchased | — |
| | 175,000 |
|
| Additions to Federal Home Loan Bank advances | 3,962,000 |
| | 3,847,000 |
|
| Repayments of Federal Home Loan Bank advances | (3,827,000 | ) | | (3,672,000 | ) |
| Dividends paid | (63,558 | ) | | (68,911 | ) |
| Repurchase of common stock | (150,000 | ) | | (150,000 | ) |
| Other financing activities | 24,809 |
| | 60,512 |
|
| Net cash provided by financing activities | 428,456 |
| | 618,412 |
|
| Net (decrease) increase in cash and cash equivalents | (151,845 | ) | | 85,217 |
|
| Cash and cash equivalents, beginning of period | 382,073 |
| | 194,582 |
|
| Cash and cash equivalents, end of period | $ | 230,228 |
| | $ | 279,799 |
|
| | | | |
| Supplemental disclosure of cash flow information: | | | |
| Interest paid | $ | 391,691 |
| | $ | 269,520 |
|
| Income taxes (refunded) paid, net | $ | (264 | ) | | $ | 21,031 |
|
| | | | |
| Supplemental schedule of non-cash investing and financing activities: | | | |
| Transfers from loans to other real estate owned and other repossessed assets | $ | 3,211 |
| | $ | 9,411 |
|
| Transfers from loans to loans held for sale | $ | 439,525 |
| | $ | 54,322 |
|
| Transfers from loans held for sale to loans | $ | 19,716 |
| | $ | — |
|
| Dividends declared, not paid | $ | 20,524 |
| | $ | 22,394 |
|
| Unsettled sales and purchases of investment securities, net | $ | 88,331 |
| | $ | 146,503 |
|
|
| | | | | | | |
| | Three Months Ended March 31, |
| | 2020 | | 2019 |
| Cash flows from financing activities: | | | |
| Net increase in deposits | 606,180 |
| | 205,060 |
|
| Net (decrease) increase in federal funds purchased | (100,000 | ) | | — |
|
| Additions to Federal Home Loan Bank advances | 1,746,000 |
| | 1,281,000 |
|
| Repayments of Federal Home Loan Bank advances | (1,086,000 | ) | | (1,051,000 | ) |
| Dividends paid | (20,775 | ) | | (21,673 | ) |
| Repurchase of common stock | (100,972 | ) | | (39,974 | ) |
| Other financing activities | 23,535 |
| | 6,943 |
|
| Net cash provided by financing activities | 1,067,968 |
| | 380,356 |
|
| Net (decrease) increase in cash and cash equivalents | 552,025 |
| | (140,622 | ) |
| Cash and cash equivalents, beginning of period | 214,673 |
| | 382,073 |
|
| Cash and cash equivalents, end of period | $ | 766,698 |
| | $ | 241,451 |
|
| | | | |
| Supplemental disclosure of cash flow information: | | | |
| Interest paid | $ | 111,191 |
| | $ | 121,652 |
|
| Income taxes paid, net | $ | 4,891 |
| | $ | 6,104 |
|
| | | | |
| Supplemental schedule of non-cash investing and financing activities: | | | |
| Transfers from loans to other real estate owned and other repossessed assets | $ | 4,096 |
| | $ | — |
|
| Transfers from loans to loans held for sale | $ | 164,293 |
| | $ | 69,559 |
|
| Dividends declared, not paid | $ | 21,927 |
| | $ | 21,264 |
|
| Unsettled sales and purchases of investment securities, net | $ | 43,692 |
| | $ | 50,000 |
|
5
The accompanying notes are an integral part of these consolidated financial statements.
5statements
BANKUNITED, INC. AND SUBSIDIARIES
CONSOLIDATED STATEMENTS OF STOCKHOLDERS’ EQUITY - UNAUDITED
(In thousands, except share data)
|
| | | | | | | | | | | | | | | | | | | | | | |
| | Common Shares Outstanding | | Common Stock | | Paid-in Capital | | Retained Earnings | | Accumulated Other Comprehensive Income (Loss) | | Total Stockholders’ Equity |
| Balance at June 30, 2019 | 95,315,633 |
| | $ | 953 |
| | $ | 1,080,966 |
| | $ | 1,803,360 |
| | $ | (17,369 | ) | | $ | 2,867,910 |
|
| Comprehensive income | — |
| | — |
| | — |
| | 76,219 |
| | (11,308 | ) | | 64,911 |
|
| Dividends ($0.21 per common share) | — |
| | — |
| | — |
| | (20,524 | ) | | — |
| | (20,524 | ) |
| Equity based compensation | 8,219 |
| | — |
| | 4,564 |
| | — |
| | — |
| | 4,564 |
|
| Forfeiture of unvested shares | (38,596 | ) | | — |
| | (145 | ) | | — |
| | — |
| | (145 | ) |
| Exercise of stock options | 22,133 |
| | 1 |
| | 493 |
| | — |
| | — |
| | 494 |
|
| Repurchase of common stock | (236,990 | ) | | (3 | ) | | (7,932 | ) | | — |
| | — |
| | (7,935 | ) |
| Balance at September 30, 2019 | 95,070,399 |
| | $ | 951 |
| | $ | 1,077,946 |
| | $ | 1,859,055 |
| | $ | (28,677 | ) | | $ | 2,909,275 |
|
| | | | | | | | | | | | |
| Balance at June 30, 2018 | 106,241,116 |
| | $ | 1,062 |
| | $ | 1,455,554 |
| | $ | 1,592,157 |
| | $ | 50,660 |
| | $ | 3,099,433 |
|
| Comprehensive income | — |
| | — |
| | — |
| | 97,328 |
| | (8,765 | ) | | 88,563 |
|
| Dividends ($0.21 per common share) | — |
| | — |
| | — |
| | (22,393 | ) | | — |
| | (22,393 | ) |
| Equity based compensation | 11,857 |
| | — |
| | 5,067 |
| | — |
| | — |
| | 5,067 |
|
| Forfeiture of unvested shares and shares surrendered for tax withholding obligations | (27,999 | ) | | — |
| | (181 | ) | | — |
| | — |
| | (181 | ) |
| Repurchase of common stock | (2,431,649 | ) | | (25 | ) | | (95,576 | ) | | — |
| | — |
| | (95,601 | ) |
| Balance at September 30, 2018 | 103,793,325 |
| | $ | 1,037 |
| | $ | 1,364,864 |
| | $ | 1,667,092 |
| | $ | 41,895 |
| | $ | 3,074,888 |
|
| | | | Common Shares Outstanding | | Common Stock | | Paid-in Capital | | Retained Earnings | | Accumulated Other Comprehensive Income (Loss) | | Total Stockholders’ Equity | Common Shares Outstanding | | Common Stock | | Paid-in Capital | | Retained Earnings | | Accumulated Other Comprehensive Income (Loss) | | Total Stockholders’ Equity |
| Balance at December 31, 2018 | 99,141,374 |
| | $ | 991 |
| | $ | 1,220,147 |
| | $ | 1,697,822 |
| | $ | 4,873 |
| | $ | 2,923,833 |
| |
| Comprehensive income | — |
| | — |
| | — |
| | 223,642 |
| | (33,550 | ) | | 190,092 |
| |
| Dividends ($0.63 per common share) | — |
| | — |
| | — |
| | (62,409 | ) | | — |
| | (62,409 | ) | |
| Balance at December 31, 2019 | | 95,128,231 |
| | $ | 951 |
| | $ | 1,083,920 |
| | $ | 1,927,735 |
| | $ | (31,827 | ) | | $ | 2,980,779 |
|
| Impact of adoption of ASU 2016-13 | | — |
| | — |
| | — |
| | (23,817 | ) | | — |
| | (23,817 | ) |
| Comprehensive loss | | — |
| | — |
| | — |
| | (30,951 | ) | | (291,765 | ) | | (322,716 | ) |
| Dividends ($0.23 per common share) | | — |
| | — |
| | — |
| | (21,927 | ) | | — |
| | (21,927 | ) |
| Equity based compensation | 590,572 |
| | 6 |
| | 13,614 |
| | — |
| | — |
| | 13,620 |
| 687,008 |
| | 7 |
| | 7,666 |
| | — |
| | — |
| | 7,673 |
|
| Forfeiture of unvested shares and shares surrendered for tax withholding obligations | (325,523 | ) | | (3 | ) | | (6,396 | ) | | — |
| | — |
| | (6,399 | ) | (143,368 | ) | | (2 | ) | | (4,418 | ) | | — |
| | — |
| | (4,420 | ) |
| Exercise of stock options | 26,043 |
| | 1 |
| | 537 |
| | — |
| | — |
| | 538 |
| 60,000 |
| | 1 |
| | 1,528 |
| | — |
| | — |
| | 1,529 |
|
| Repurchase of common stock | (4,362,067 | ) | | (44 | ) | | (149,956 | ) | | ��� |
| | — |
| | (150,000 | ) | (3,325,577 | ) | | (33 | ) | | (100,939 | ) | | — |
| | — |
| | (100,972 | ) |
| Balance at September 30, 2019 | 95,070,399 |
| | $ | 951 |
| | $ | 1,077,946 |
| | $ | 1,859,055 |
| | $ | (28,677 | ) | | $ | 2,909,275 |
| |
| Balance at March 31, 2020 | | 92,406,294 |
| | $ | 924 |
| | $ | 987,757 |
| | $ | 1,851,040 |
| | $ | (323,592 | ) | | $ | 2,516,129 |
|
| | | | | | | | | | | | | | | | | | | | | | | |
| Balance at December 31, 2017 | 106,848,185 |
| | $ | 1,068 |
| | $ | 1,498,227 |
| | $ | 1,471,781 |
| | $ | 54,986 |
| | $ | 3,026,062 |
| |
| Cumulative effect of adoption of new accounting standards | — |
| | — |
| | — |
| | (8,902 | ) | | 8,902 |
| | — |
| |
| Balance at December 31, 2018 | | 99,141,374 |
| | $ | 991 |
| | $ | 1,220,147 |
| | $ | 1,697,822 |
| | $ | 4,873 |
| | $ | 2,923,833 |
|
| Comprehensive income | — |
| | — |
| | — |
| | 272,463 |
| | (21,993 | ) | | 250,470 |
| — |
| | — |
| | — |
| | 65,972 |
| | (4,232 | ) | | 61,740 |
|
| Dividends ($0.63 per common share) | — |
| | — |
| | — |
| | (68,250 | ) | | — |
| | (68,250 | ) | |
| Dividends ($0.21 per common share) | | — |
| | — |
| | — |
| | (21,264 | ) | | — |
| | (21,264 | ) |
| Equity based compensation | 666,277 |
| | 6 |
| | 15,403 |
| | — |
| | — |
| | 15,409 |
| 563,970 |
| | 6 |
| | 5,083 |
| | — |
| | — |
| | 5,089 |
|
| Forfeiture of unvested shares and shares surrendered for tax withholding obligations | (235,719 | ) | | (2 | ) | | (6,528 | ) | | — |
| | — |
| | (6,530 | ) | (191,866 | ) | | (2 | ) | | (6,076 | ) | | — |
| | — |
| | (6,078 | ) |
| Exercise of stock options | 291,689 |
| | 3 |
| | 7,724 |
| | — |
| | — |
| | 7,727 |
| 3,910 |
| | — |
| | 44 |
| | — |
| | — |
| | 44 |
|
| Repurchase of common stock | (3,777,107 | ) | | (38 | ) | | (149,962 | ) | | — |
| | — |
| | (150,000 | ) | (1,113,085 | ) | | (11 | ) | | (39,963 | ) | | — |
| | — |
| | (39,974 | ) |
| Balance at September 30, 2018 | 103,793,325 |
| | $ | 1,037 |
| | $ | 1,364,864 |
| | $ | 1,667,092 |
| | $ | 41,895 |
| | $ | 3,074,888 |
| |
| Balance at March 31, 2019 | | 98,404,303 |
| | $ | 984 |
| | $ | 1,179,235 |
| | $ | 1,742,530 |
| | $ | 641 |
| | $ | 2,923,390 |
|
6
The accompanying notes are an integral part of these consolidated financial statements.
6statements
BANKUNITED, INC. AND SUBSIDIARIES
NOTES TO CONSOLIDATED FINANCIAL STATEMENTS - UNAUDITED
September 30, 2019March 31, 2020
Note 1 Basis of Presentation and Summary of Significant Accounting Policies
BankUnited, Inc. is a national bank holding company with one wholly-owned subsidiary, BankUnited, collectively, the Company. BankUnited, a national banking association headquartered in Miami Lakes, Florida, provides a full range of banking and related services to individual and corporate customers through 7774 banking centers located in 14 Florida counties and 5 banking centers located in the New York metropolitan area at September 30, 2019.March 31, 2020. The Bank also offers certain commercial lending and deposit products through national platforms.
The accompanying unaudited consolidated financial statements have been prepared in accordance with generally accepted accounting principles for interim financial information and the instructions to Form 10-Q and Article 10 of Regulation S-X of the SEC. Accordingly, these do not include all of the information and footnotes required for a fair presentation of financial position, results of operations and cash flows in conformity with GAAP and should be read in conjunction with the Company’s consolidated financial statements and the notes thereto appearing in BKU’s Annual Report on Form 10-K for the year ended December 31, 20182019 filed with the SEC. In the opinion of management, all adjustments, consisting of normal recurring adjustments, considered necessary for a fair presentation have been included. Operating results for the three and nine months ended September 30, 2019March 31, 2020 are not necessarily indicative of the results that may be expected in future periods.
Certain amounts presented for prior periods have been reclassified to conform to the current period presentation.
Accounting Estimates
In preparing the consolidated financial statements, management is required to make estimates and assumptions that affect the reported amounts of assets, liabilities, revenues, and expenses and disclosures of contingent assets and liabilities. Actual results could differ significantly from these estimates.
Significant estimates include the ALLLallowance for credit losses and the fair values of investment securities and other financial instruments.
New Accounting Pronouncements Adopted During the NineThree Months Ended September 30, 2019March 31, 2020
ASU No. 2016-02, 2016-13, FLeasesinancial Instruments - Credit Losses (Topic 842). 326); Measurement of Credit Losses on Financial Instruments.The amendments in this ASU, along with subsequent ASUs issued to clarify certain of its provisions, introduced new guidance which made substantive changes to the accounting for credit losses. The ASU introduced the CECL model which applies to financial assets subject to credit losses and measured at amortized cost, as well as certain off-balance sheet credit exposures. This includes loans, loan commitments, standby letters of Topic 842, requirecredit, net investments in leases recognized by a lesseelessor and HTM debt securities. The CECL model requires an entity to recognizeestimate credit losses expected over the life of an exposure, considering information about historical events, current conditions and reasonable and supportable forecasts, and is generally expected to result in the statementearlier recognition of financial position a liability to make lease payments and a right-of-use asset representing its right to use the underlying asset for leases with terms longer than one year. Accounting applied by lessors was largely unchanged by this ASU.credit losses. The ASU also requires both qualitative and quantitative disclosures that provide additional information about the amounts recorded in the consolidated financial statements. The amendments in this ASU were effective for the Company for interim and annual periods in fiscal years beginning after December 15, 2018. The most significant impact of adoption was the recognition, as lessee, of new right-of-use assets and lease liabilities on the Consolidated Balance Sheet for real estate leases classified as operating leases. Under a package of practical expedients that the Company elected, as lessee and lessor, the Company did not have to (i) re-assess whether expired or existing contracts contain leases, (ii) re-assess the classification of expired or existing leases, (iii) re-evaluate initial direct costs for existing leases or (iv) separate lease components ofmodified certain contracts from non-lease components. The Company also elected the transition method that allows entities the option of applying the provisions of the ASU atprevious OTTI model for AFS debt securities. Credit losses on AFS debt securities are now limited to the effective date without adjustingdifference between the comparative periods presented.security's amortized cost basis and its fair value, and should be recognized through an allowance for credit losses rather than as a direct reduction in amortized cost basis. The Company adopted this ASU in the first quarter of 20192020 using the modified retrospective transition method.method for the CECL model and a prospective approach for the AFS debt security model. The Company recognizedrecorded a lease liability andcumulative-effect adjustment to retained earnings of $23.8 million, which included $4.8 million related right of use asset of approximately $104 million and $95 million, respectively, upon adoptionto off -balance sheet credit exposures, on January 1, 2019.
ASU No. 2018-16, Derivatives and Hedging (Topic 815): Inclusion2020. No cumulative-effect adjustment was recorded related to AFS debt securities upon adoption. The Company has elected to phase-in the initial impact of the Secured Overnight Financing Rate (SOFR) Overnight Index Swap (OIS) Rate asadoption of ASC 326 for regulatory capital purposes, allowing the impact of adoption on regulatory capital to be delayed for two years, followed by a Benchmark Interest Rate for Hedge Accounting Purposes. The ASU added the OIS rate based on SOFR as a benchmark interest rate for hedge accounting purposes. The ASU was effective for the Company for interim and annual periods in fiscal years beginning after December 15, 2018. The Company adopted this ASU in the first quarter of 2019 with no impact at adoption to its consolidated financial position, results of operations, or cash flows.three-year transition period.
Leases
The Company determines whether a contract is or contains a lease at inception. For leases with terms greater than twelve months under which the Company is lessee, ROU assets and lease liabilities are recorded at the commencement date. Lease liabilities are initially recorded based on the present value of future lease payments over the lease term. ROU assets are initially
BANKUNITED, INC. AND SUBSIDIARIES
NOTES TO CONSOLIDATED FINANCIAL STATEMENTS - UNAUDITED
September 30, 2019March 31, 2020
ASU No. 2020-04, Reference Rate Reform (Topic 848): Facilitation of the Effects of Reference Rate Reform on Financial Reporting. The ASU provides optional relief for a limited period of time to ease the potential accounting burden associated with transitioning away from reference rates that are expected to be discontinued. Under this ASU, companies are provided with optional expedients and exceptions for applying generally accepted accounting principles (GAAP) to contract modifications and hedging relationships that currently utilize LIBOR as their benchmark rate, subject to certain criteria being met. The amendments in the ASU also apply to contemporaneous modifications of other contract terms related to the replacement of LIBOR. The amendments in the ASU are effective for all entities as of March 12, 2020 and will only be in effect through December 31, 2022. To date, the impact of adoption of this ASU on the Company's consolidated financial position, results of operations, and cash flows has not been material.
Accounting Pronouncements Not Yet Adopted
ASU No. 2019-12, Income Taxes (Topic 740): Simplifying the Accounting for Income Taxes. This ASU simplifies the accounting for income taxes by removing certain exceptions stipulated in ASC 740 and making some other targeted changes to the accounting for income taxes. This ASU is effective for the Company for interim and annual periods in fiscal years beginning after December 15, 2020. The Company has not finalized its evaluation of the impact of adoption on its consolidated financial position, results of operations, and cash flows, but the impact is not currently expected to be material.
Updates to the Company's Significant Accounting Policies
Loans
The Company's loan portfolio contains 1-4 single family residential first mortgages, government insured residential mortgages, an insignificant amount of home equity loans and lines of credit and other consumer loans; multi-family, non-owner occupied commercial real estate, construction and land, owner-occupied commercial real estate and commercial and industrial loans, mortgage warehouse lines of credit and sales-type and direct financing leases. Loans are reported at amortized cost basis, net of the ACL.
Interest income is accrued based on the principal amount outstanding. Non-refundable loan origination fees, net of direct costs of originating or acquiring loans, as well as purchase premiums and discounts, are deferred and recognized as adjustments to yield over the contractual lives of the related loans using the level yield method.
Non-accrual loans
Commercial loans are placed on non-accrual status when (i) management has determined that full repayment of all contractual principal and interest is in doubt, or (ii) the loan is past due 90 days or more as to principal or interest unless the loan is well secured and in the process of collection. Residential and other consumer loans, other than government insured residential loans, are generally placed on non-accrual status when they are 90 days past due. When a loan is placed on non-accrual status, uncollected interest accrued is reversed and charged to interest income. Payments received on nonaccrual commercial loans are applied as a reduction of principal. Interest payments are recognized as income on a cash basis on nonaccrual residential loans. Commercial loans are returned to accrual status only after all past due principal and interest has been collected and full repayment of remaining contractual principal and interest is reasonably assured. Residential and consumer loans are generally returned to accrual status when less than 90 days past due. Past due status of loans is determined based on the contractual next payment due date. Loans less than 30 days past due are reported as current.
Contractually delinquent government insured residential loans are not classified as non-accrual due to the nature of the guarantee. Contractually delinquent PCD loans are not classified as non-accrual as long as the Company has a reasonable expectation about amounts expected to be collected.
Troubled Debt Restructurings
In certain situations, due to economic or legal reasons related to a borrower's financial difficulties, the Company may grant a concession to the borrower for other than an insignificant period of time that it would not otherwise consider. At that time, the related loan is classified as a TDR. The concessions granted may include rate reductions, principal forgiveness, payment forbearance, extensions of maturity at rates of interest below that commensurate with the risk profile of the loans, modification of payment terms and other actions intended to minimize economic loss. A TDR is generally placed on non-accrual status at the time of the modification unless the borrower was performing prior to the restructuring.
BANKUNITED, INC. AND SUBSIDIARIES
NOTES TO CONSOLIDATED FINANCIAL STATEMENTS - UNAUDITED
March 31, 2020
Under recently issued inter-agency and authoritative guidance and consistent with the CARES Act, short-term (generally periods of six months or less) deferrals or modifications related to COVID-19 will typically not be categorized as TDRs.
Purchased Credit Deteriorated ("PCD") assets
PCD assets are acquired financial assets that, as of the date of acquisition, have experienced a more than insignificant deterioration in credit quality since origination. An assessment is conducted at acquisition to determine whether acquired financial assets meet the criteria to be classified as PCD assets. That assessment may be conducted at the individual asset level, or for a group of assets acquired together that have similar risk characteristics. At acquisition, the ACL related to PCD assets, representing the estimated amount of the UPB of the assets not expected to be collected, is added to the purchase price to determine the amortized cost basis and any non-credit related discount or premium is allocated to the individual assets acquired. The non-credit related discount or premium is accreted or amortized to interest income over the life of the related assets using the level yield method, as long as there is a reasonable expectation about amounts expected to be collected. Subsequent changes in the amount of expected credit losses are recognized immediately by adjusting the ACL and reflecting the periodic changes as credit loss expense or reversal of credit loss expense.
Loans previously categorized as ACI loans were categorized as PCD loans on initial adoption of ASC 326. At adoption, an ACL was recognized and a corresponding adjustment was made to the assets' amortized cost basis. Prior to the adoption of ASC 326, ACI loans were accounted for on a pool basis. These pools were not maintained on adoption. The Company did not re-assess whether modifications to individual PCD loans previously accounted for in pools were TDRs at adoption.
Allowance for Credit Losses ("ACL")
AFS Debt Securities
The Company reviews its AFS debt securities for credit loss impairment at the individual security level on at least a quarterly basis. A security is impaired if its fair value is less than its amortized cost basis. A decline in fair value below amortized cost basis represents a credit loss impairment to the extent the Company does not expect to recover the amortized cost basis of the security. Impairment related to credit losses is recorded through the ACL to the extent fair value is less than the amortized cost basis. Declines in fair value that have not been recorded through the ACL are recorded through other comprehensive income, net of applicable taxes.
In assessing whether an impairment is credit loss related, the Company compares the present value of cash flows expected to be collected to the security's amortized cost basis. If the present value of cash flows expected to be collected is less than the amortized cost basis of the security, a credit loss exists and an ACL is recorded. The Company discounts expected cash flows at the effective interest rate implicit in the security at the purchase date, adjusted for expected prepayments. For floating rate securities, the Company uses the floating rate as it changes over the life of the security. In developing estimates about cash flows expected to be collected and determining whether a credit loss exists, the Company considers information about past events, current conditions and reasonable and supportable forecasts. Factors and information that the Company uses in making its assessments include, but are not necessarily limited to, the following:
The extent to which fair value is less than amortized cost;
Adverse conditions specifically related to the security, an industry or geographic area;
Changes in the financial condition of the issuer or underlying loan obligors;
The payment structure and remaining payment terms of the security, including levels of subordination or over-collateralization;
Failure of the issuer to make scheduled payments;
Changes in credit ratings;
Relevant market data;
Estimated prepayments, defaults, and the value and performance of underlying collateral at the individual security level.
BANKUNITED, INC. AND SUBSIDIARIES
NOTES TO CONSOLIDATED FINANCIAL STATEMENTS - UNAUDITED
March 31, 2020
The relative importance assigned to each of these factors varies depending on the facts and circumstances pertinent to the individual security being evaluated.
Timely payment of principal and interest on securities issued by the U.S. Government, U.S. government agencies and U.S. government sponsored entities is explicitly or implicitly guaranteed by the U. S. government. Therefore, the Company expects to recover the amortized cost basis of these securities.
If the Company intends to sell a security in an unrealized loss position, or it is more likely than not that the Company will be required to sell the security before recovery of its amortized cost basis, any allowance for credit losses will be written off and the amortized cost basis will be written down to the debt security’s fair value at the reporting date with any incremental impairment reported in earnings.
Historically, the Company has not experienced credit losses related to AFS securities or uncollectible interest on its AFS securities. However, AFS securities would be charged off to the extent that there was no reasonable expectation of recovery of amortized cost basis. AFS securities would be placed on non-accrual status if the Company did not reasonably expect to receive interest payments in the future and interest accrued would be reversed against interest income. Securities would be returned to accrual status only when collection of interest was reasonably assured.
Loans
The ACL is a valuation account that is deducted from the amortized cost basis of loans to present the net amount expected to be collected. The ACL is adjusted through the provision for credit losses to the amount of amortized cost basis not expected to be collected, or in the case of PCD loans, the amount of UPB not expected to be collected, at the balance sheet date. Amortized cost basis includes UPB, unamortized premiums or discounts and deferred fees and costs, net of amounts previously charged off.
The measurement of expected credit losses encompasses information about historical events, current conditions and reasonable and supportable forecasts. Determining the amount of the associated lease liabilities plus prepaid lease paymentsACL is complex and initial direct costs, less any lease incentives received. The costrequires extensive judgment by management about matters that are inherently uncertain. Re-evaluation of short term leases is recognized on a straight line basis over the lease term. The lease term includes options to extend ifACL estimate in future periods, in light of changes in composition and characteristics of the exercise of those options is reasonably certain and includes termination options if there is reasonable certainty the options will not be exercised. Lease payments are discounted using the Company's FHLB borrowing rate for borrowings of a similar term unless an implicit rate is definedloan portfolio, changes in the contract or is determinable, which is generally notreasonable and supportable forecast and other factors then prevailing may result in material changes in the case. Leases are classified as financing or operating leases at commencement; generally, leases are classified as finance leases when effective controlamount of the underlying asset is transferred. The substantial majority of leases under whichACL and credit loss expense in those future periods.
Loans are charged off against the Company is lessee are classified as operating leases. For operating leases, lease cost is recognized in the Consolidated Statements of Income on a straight line basis over the lease terms. For finance leases, interest expense on lease liabilities is recognized on the effective interest method and amortization of ROU assets is recognized on a straight line basis over the lease terms. Variable lease costs are recognizedACL in the period in which they are deemed uncollectible and recoveries are credited to the obligationACL when received. Expected recoveries on loans previously charged off, not to exceed the aggregate of amounts previously charged-off and expected to be charged-off, are included in the ACL estimate. For loans secured by residential real estate, an assessment of collateral value is made at no later than 120 days delinquency; any outstanding loan balance in excess of fair value less cost to sell is charged off at no later than 180 days delinquency. Additionally, any outstanding balance in excess of fair value of collateral less cost to sell is charged off (i) within 60 days of receipt of notification of filing from the bankruptcy court, (ii) within 60 days of determination of loss if all borrowers are deceased or (iii) within 90 days of discovery of fraudulent activity. Other consumer loans are typically charged off at 120 days delinquency. Commercial loans are charged off when, in management's judgment, they are considered to be uncollectible.
Expected credit losses are estimated on a collective basis for those costs is incurred. groups of loans that share similar risk characteristics. Factors that may be considered in aggregating loans for this purpose include but are not necessarily limited to, product or collateral type, industry, geography, internal risk rating, credit characteristics such as credit scores or collateral values, and historical or expected credit loss patterns. For loans that do not share similar risk characteristics with other loans such as collateral dependent loans and TDRs, expected credit losses are estimated on an individual basis.
Expected credit losses are estimated over the contractual terms of the loans, adjusted for expected prepayments. Expected prepayments for commercial loans are generally estimated based on the Company's historical experience. For residential loans, expected prepayments are estimated using a model that incorporates industry prepayment data, calibrated to reflect the Company's experience. The contractual term excludes expected extensions, renewals, and modifications unless either of the following applies: management has a reasonable expectation at the reporting date that a TDR will be executed with an individual borrower or the extension or renewal options are included in the original or modified contract at the reporting date and are not unconditionally cancellable by the Company.
The Company has elected a 5-year reasonable and supportable forecast period, with mean reversion occurring within the credit loss models based on the economic inputs. The length of the reasonable and supportable forecast is evaluated at each reporting period and adjusted if deemed necessary.
BANKUNITED, INC. AND SUBSIDIARIES
NOTES TO CONSOLIDATED FINANCIAL STATEMENTS - UNAUDITED
March 31, 2020
For the substantial majority of portfolio segments and subsegments, including residential loans other than government insured loans, and most commercial and commercial real estate loans, expected losses are estimated using econometric models. The models employ a factor based methodology, leveraging data sets containing extensive historical loss and recovery information by industry, geography, product type, collateral type and obligor characteristics, to estimate PD and LGD. Measures of PD for commercial loans incorporate current conditions through market cycle or credit cycle adjustments. For residential loans, the models consider FICO and adjusted LTVs. PDs and LGDs are then conditioned on the reasonable and supportable economic forecast. Projected PDs and LGDs are applied to estimated exposure at default, considering the term and payment structure of the loan, to generate estimates of expected loss at the loan level. For criticized or classified loans, PDs may be adjusted to industry benchmark PDs appropriate to the current risk rating if the most current financial information available is deemed not to be reflective of the borrowers' current financial condition. These loan level estimates are aggregated to generate a collective estimate for groups of loans that share common risk characteristics.
For certain less material portfolios including loans and leases to state and local government entities originated by Pinnacle, small balance commercial loans and consumer loans, the WARM method is used to estimate expected credit losses. For the Pinnacle portfolio, historical loss information is based on municipal historical default and recovery data, segmented by credit rating. For small balance commercial loans, historical loss information is based on the Company's historical loss experience over a five year period. For consumer loans, historical loss information is based on peer data; this portfolio subsegment is not significant. All loss estimates are conditioned as applicable on changes in current conditions and the reasonable and supportable economic forecast. Expected credit losses for mortgage warehouse lines of credit are estimated based primarily on the Company's historical loss experience, conditioned as applicable on changes in current conditions and the reasonable and supportable economic forecast. Generally, given the nature of these loans, losses would be expected to manifest within a very short time period after origination.
The Company expects to collect the amortized cost basis of government insured residential loans due to the nature of the government guarantee, so the quantitative ACL is zero for these loans.
Qualitative factors
Qualitative adjustments are made to the ACL when, based on management’s judgment, there are factors impacting expected credit losses not taken into account by the quantitative calculations. Potential qualitative adjustments are categorized as follows:
Economic factors, including material trends and developments that, in management's judgment, may not have been considered in the reasonable and supportable economic forecast;
Credit policy and staffing, including the nature and level of policy and procedural exceptions or changes in credit policy not reflected in quantitative results, changes in the quality of underwriting and portfolio management and staff and issues identified by credit review, internal audit or regulators that may not be reflected in quantitative results;
Concentrations, considering whether the quantitative estimate adequately accounts for concentration risk in the portfolio;
Model imprecision and model validation findings; and
Other factors not adequately considered in the quantitative estimate or other qualitative categories identified by management that may materially impact the amount of expected credit losses.
Collateral dependent loans
Collateral dependent loans are those for which the borrower is experiencing financial difficulty and repayment is expected to be provided substantially through the operation or sale of the collateral. These loans do not typically share similar risk characteristics with other loans and expected credit losses are evaluated on an individual basis. Loans evaluated individually are not included in the collective evaluation. Estimates of expected credit losses for collateral dependent loans, whether or not foreclosure is probable, are based on the fair value of the collateral adjusted for selling costs when repayment depends on sale of the collateral.
Troubled debt restructurings
BANKUNITED, INC. AND SUBSIDIARIES
NOTES TO CONSOLIDATED FINANCIAL STATEMENTS - UNAUDITED
March 31, 2020
For TDRs, or loans for which there is a reasonable expectation that a TDR will be executed, that are not collateral dependent, the credit loss estimate is determined by comparing the net present value of expected cash flows, discounted at the loan’s original effective interest rate, to the amortized cost basis of the loan.
Off-balance sheet credit exposures
Expected credit losses related to off-balance sheet credit exposures are estimated over the contractual period for which the Company is exposed to credit risk via a contractual obligation to extend credit, unless that obligation is unconditionally cancellable by the Company. Expected credit losses are estimated using essentially the same methodologies employed to estimate expected credit losses on the amortized cost basis of loans, taking into consideration the likelihood and amount of additional amounts expected to be funded over the terms of the commitments. The liability for credit losses on off-balance sheet credit exposures is presented within other liabilities on the consolidated balance sheets, distinct from the ACL. Adjustments to the liability are included in the provision for credit losses.
Accrued Interest Receivable
The Company has elected to present accrued interest receivable separate lease from non-lease componentsthe amortized cost basis of its lease contracts.financial assets carried at amortized cost. The Company is applying the practical expedient provided in ASC 326 to exclude accrued interest receivable balances from tabular disclosures about financial assets carried at amortized cost and has elected not to estimate an ACL on accrued interest receivable since uncollectible accrued interest is timely written off in accordance with the Company's accounting policies for non-accrual loans.
Note 2 Earnings Per Common Share
The computation of basic and diluted earnings (loss) per common share is presented below for the periods indicated (in thousands, except share and per share data):
|
| | | | | | | | | | | | | | | |
| | Three Months Ended September 30, | | Nine Months Ended September 30, |
| c | 2019 | | 2018 | | 2019 |
| 2018 |
| Basic earnings per common share: | | | | | |
| | |
| Numerator: | | | | | |
| | |
| Net income | $ | 76,219 |
| | $ | 97,328 |
| | $ | 223,642 |
| | $ | 272,463 |
|
| Distributed and undistributed earnings allocated to participating securities | (3,174 | ) | | (3,771 | ) | | (9,247 | ) | | (10,444 | ) |
| Income allocated to common stockholders for basic earnings per common share | $ | 73,045 |
| | $ | 93,557 |
| | $ | 214,395 |
| | $ | 262,019 |
|
| Denominator: | | | | | | | |
| Weighted average common shares outstanding | 95,075,395 |
| | 105,063,770 |
| | 97,113,878 |
| | 105,914,807 |
|
| Less average unvested stock awards | (1,098,509 | ) | | (1,178,982 | ) | | (1,147,988 | ) | | (1,170,209 | ) |
| Weighted average shares for basic earnings per common share | 93,976,886 |
| | 103,884,788 |
| | 95,965,890 |
| | 104,744,598 |
|
| Basic earnings per common share | $ | 0.78 |
| | $ | 0.90 |
| | $ | 2.23 |
| | $ | 2.50 |
|
| Diluted earnings per common share: | | | | | | | |
| Numerator: | | | | | | | |
| Income allocated to common stockholders for basic earnings per common share | $ | 73,045 |
| | $ | 93,557 |
| | $ | 214,395 |
| | $ | 262,019 |
|
| Adjustment for earnings reallocated from participating securities | 7 |
| | 13 |
| | 20 |
| | 37 |
|
| Income used in calculating diluted earnings per common share | $ | 73,052 |
| | $ | 93,570 |
| | $ | 214,415 |
| | $ | 262,056 |
|
| Denominator: | | |
|
| | | | |
| Weighted average shares for basic earnings per common share | 93,976,886 |
| | 103,884,788 |
| | 95,965,890 |
| | 104,744,598 |
|
| Dilutive effect of stock options and certain share-based awards | 285,934 |
| | 499,431 |
| | 303,524 |
| | 512,801 |
|
| Weighted average shares for diluted earnings per common share | 94,262,820 |
| | 104,384,219 |
| | 96,269,414 |
| | 105,257,399 |
|
| Diluted earnings per common share | $ | 0.77 |
| | $ | 0.90 |
| | $ | 2.23 |
| | $ | 2.49 |
|
|
| | | | | | | |
| | Three Months Ended March 31, |
| c | 2020 |
| 2019 |
| Basic earnings per common share: | |
| | |
| Numerator: | |
| | |
| Net income (loss) | $ | (30,951 | ) | | $ | 65,972 |
|
| Distributed and undistributed earnings allocated to participating securities | — |
| | (2,697 | ) |
| Income (loss) allocated to common stockholders for basic earnings per common share | $ | (30,951 | ) | | $ | 63,275 |
|
| Denominator: | | | |
| Weighted average common shares outstanding | 93,944,529 |
| | 98,856,775 |
|
| Less average unvested stock awards | (1,101,370 | ) | | (1,171,921 | ) |
| Weighted average shares for basic earnings (loss) per common share | 92,843,159 |
| | 97,684,854 |
|
| Basic earnings (loss) per common share | $ | (0.33 | ) | | $ | 0.65 |
|
| Diluted earnings (loss) per common share: | | | |
| Numerator: | | | |
| Income (loss) allocated to common stockholders for basic earnings per common share | $ | (30,951 | ) | | $ | 63,275 |
|
| Adjustment for earnings reallocated from participating securities | — |
| | 5 |
|
| Income (loss) used in calculating diluted earnings per common share | $ | (30,951 | ) | | $ | 63,280 |
|
| Denominator: | | | |
| Weighted average shares for basic earnings (loss) per common share | 92,843,159 |
| | 97,684,854 |
|
| Dilutive effect of stock options and certain shared-based awards | — |
| | 279,779 |
|
| Weighted average shares for diluted earnings (loss) per common share | 92,843,159 |
| | 97,964,633 |
|
| Diluted earnings (loss) per common share | $ | (0.33 | ) | | $ | 0.65 |
|
BANKUNITED, INC. AND SUBSIDIARIES
NOTES TO CONSOLIDATED FINANCIAL STATEMENTS - UNAUDITED
September 30, 2019March 31, 2020
Included in participatingParticipating securities above areinclude unvested shares and 3,023,314 dividend equivalent rights outstanding at September 30, 2019 that were issued in conjunction with the IPO of the Company's common stock. These dividend equivalent rights expire in 2021 and participate in dividends on a one-for-one basis. Participating securities have the right to participate in the earnings of the Company, but no contractual obligation to share in losses. As a result, these securities impacted the calculation of earnings per common share for the three months ended March 31, 2019 but did not impact the calculation of loss per common share for the three months ended March 31, 2020.
The following potentiallyPotentially dilutive securitiesunvested shares and share units totaling 1,768,769 and 1,218,840 were outstanding at September 30,March 31, 2020 and 2019, and 2018respectively, but excluded from the calculation of diluted earnings (loss) per common share for the periods indicated because their inclusion would have been anti-dilutive:
|
| | | | | | | | | | | |
| | Three Months Ended September 30, | | Nine Months Ended September 30, |
| | 2019 | | 2018 | | 2019 | | 2018 |
| Unvested shares and share units | 1,078,278 |
| | 1,639,183 |
| | 1,078,278 |
| | 1,639,183 |
|
| Stock options and warrants | — |
| | 1,850,279 |
| | — |
| | 1,850,279 |
|
Note 3 Investment Securities
Investment securities include investment securities available for sale, marketable equity securities, and investment securities held to maturity. The investment securities portfolio consisted of the following at the dates indicated (in thousands):
|
| | | | | | | | | | | | | | | |
| | September 30, 2019 |
| | Amortized Cost | | Gross Unrealized | | Carrying Value (1) |
| | | Gains | | Losses | |
| Investment securities available for sale: | | | | | | | |
| U.S. Treasury securities | $ | 70,219 |
| | $ | 447 |
| | $ | — |
| | $ | 70,666 |
|
| U.S. Government agency and sponsored enterprise residential MBS | 1,961,011 |
| | 13,171 |
| | (5,041 | ) | | 1,969,141 |
|
| U.S. Government agency and sponsored enterprise commercial MBS | 336,608 |
| | 5,075 |
| | (1,093 | ) | | 340,590 |
|
| Private label residential MBS and CMOs | 1,295,234 |
| | 20,505 |
| | (554 | ) | | 1,315,185 |
|
| Private label commercial MBS | 1,622,198 |
| | 10,212 |
| | (312 | ) | | 1,632,098 |
|
| Single family rental real estate-backed securities | 491,728 |
| | 5,319 |
| | (349 | ) | | 496,698 |
|
| Collateralized loan obligations | 1,204,888 |
| | 386 |
| | (7,041 | ) | | 1,198,233 |
|
| Non-mortgage asset-backed securities | 202,098 |
| | 2,595 |
| | (127 | ) | | 204,566 |
|
| State and municipal obligations | 264,108 |
| | 16,678 |
| | (1 | ) | | 280,785 |
|
| SBA securities | 384,677 |
| | 5,452 |
| | (1,889 | ) | | 388,240 |
|
| Other debt securities | 1,338 |
| | 3,133 |
| | — |
| | 4,471 |
|
| | 7,834,107 |
| | $ | 82,973 |
| | $ | (16,407 | ) | | 7,900,673 |
|
| Investment securities held to maturity | 10,000 |
| | | | | | 10,000 |
|
| | $ | 7,844,107 |
| | | | | | 7,910,673 |
|
| Marketable equity securities | | | | | | | 59,983 |
|
| | | | | | | | $ | 7,970,656 |
|
BANKUNITED, INC. AND SUBSIDIARIES
NOTES TO CONSOLIDATED FINANCIAL STATEMENTS - UNAUDITED
September 30, 2019
|
| | | | | | | | | | | | | | | |
| | March 31, 2020 |
| | Amortized Cost | | Gross Unrealized | | Carrying Value (1) |
| | | Gains | | Losses | |
| Investment securities available for sale: | | | | | | | |
| U.S. Treasury securities | $ | 75,238 |
| | $ | 1,092 |
| | $ | (176 | ) | | $ | 76,154 |
|
| U.S. Government agency and sponsored enterprise residential MBS | 2,209,715 |
| | 5,168 |
| | (33,985 | ) | | 2,180,898 |
|
| U.S. Government agency and sponsored enterprise commercial MBS | 369,967 |
| | 7,276 |
| | (751 | ) | | 376,492 |
|
| Private label residential MBS and CMOs | 1,185,539 |
| | 5,081 |
| | (16,740 | ) | | 1,173,880 |
|
| Private label commercial MBS | 1,728,610 |
| | 3,293 |
| | (127,089 | ) | | 1,604,814 |
|
| Single family rental real estate-backed securities | 549,981 |
| | 1,331 |
| | (22,519 | ) | | 528,793 |
|
| Collateralized loan obligations | 1,169,469 |
| | — |
| | (74,676 | ) | | 1,094,793 |
|
| Non-mortgage asset-backed securities | 265,444 |
| | 392 |
| | (10,675 | ) | | 255,161 |
|
| State and municipal obligations | 255,602 |
| | 15,431 |
| | — |
| | 271,033 |
|
| SBA securities | 262,661 |
| | 2,320 |
| | (4,593 | ) | | 260,388 |
|
| | 8,072,226 |
| | $ | 41,384 |
| | $ | (291,204 | ) | | 7,822,406 |
|
| Investment securities held to maturity | 10,000 |
| | | | | | 10,000 |
|
| | $ | 8,082,226 |
| | | | | | 7,832,406 |
|
| Marketable equity securities | | | | | | | 42,195 |
|
| | | | | | | | $ | 7,874,601 |
|
| | | | December 31, 2018 | December 31, 2019 |
| | Amortized Cost | | Gross Unrealized | | Carrying Value (1) | Amortized Cost | | Gross Unrealized | | Carrying Value (1) |
| | | Gains | | Losses | | | Gains | | Losses | |
| Investment securities available for sale: | | | | | | | | | | | | | | |
| U.S. Treasury securities | $ | 39,885 |
| | $ | 2 |
| | $ | (14 | ) | | $ | 39,873 |
| $ | 70,243 |
| | $ | 219 |
| | $ | (137 | ) | | $ | 70,325 |
|
| U.S. Government agency and sponsored enterprise residential MBS | 1,885,302 |
| | 16,580 |
| | (4,408 | ) | | 1,897,474 |
| 2,018,853 |
| | 9,835 |
| | (6,513 | ) | | 2,022,175 |
|
| U.S. Government agency and sponsored enterprise commercial MBS | 374,569 |
| | 1,293 |
| | (1,075 | ) | | 374,787 |
| 366,787 |
| �� | 4,920 |
| | (731 | ) | | 370,976 |
|
| Private label residential MBS and CMOs | 1,539,058 |
| | 10,138 |
| | (14,998 | ) | | 1,534,198 |
| 1,001,337 |
| | 11,851 |
| | (1,011 | ) | | 1,012,177 |
|
| Private label commercial MBS | 1,486,835 |
| | 5,021 |
| | (6,140 | ) | | 1,485,716 |
| 1,719,228 |
| | 6,650 |
| | (1,194 | ) | | 1,724,684 |
|
| Single family rental real estate-backed securities | 406,310 |
| | 266 |
| | (4,118 | ) | | 402,458 |
| 467,459 |
| | 4,016 |
| | (1,450 | ) | | 470,025 |
|
| Collateralized loan obligations | 1,239,355 |
| | 1,060 |
| | (5,217 | ) | | 1,235,198 |
| 1,204,905 |
| | 322 |
| | (7,861 | ) | | 1,197,366 |
|
| Non-mortgage asset-backed securities | 204,372 |
| | 1,031 |
| | (1,336 | ) | | 204,067 |
| 194,171 |
| | 1,780 |
| | (1,047 | ) | | 194,904 |
|
| State and municipal obligations | 398,810 |
| | 3,684 |
| | (4,065 | ) | | 398,429 |
| 257,528 |
| | 15,774 |
| | — |
| | 273,302 |
|
| SBA securities | 514,765 |
| | 6,502 |
| | (1,954 | ) | | 519,313 |
| 359,808 |
| | 4,587 |
| | (1,664 | ) | | 362,731 |
|
| Other debt securities | 1,393 |
| | 3,453 |
| | — |
| | 4,846 |
| |
| | 8,090,654 |
| | $ | 49,030 |
| | $ | (43,325 | ) | | 8,096,359 |
| 7,660,319 |
| | $ | 59,954 |
| | $ | (21,608 | ) | | 7,698,665 |
|
| Investment securities held to maturity | 10,000 |
| |
|
| |
|
| | 10,000 |
| 10,000 |
| |
|
| |
|
| | 10,000 |
|
| | $ | 8,100,654 |
| | | | | | 8,106,359 |
| $ | 7,670,319 |
| | | | | | 7,708,665 |
|
| Marketable equity securities |
|
| | | | | | 60,519 |
|
|
| | | | | | 60,572 |
|
| | | |
|
| |
|
| | $ | 8,166,878 |
| | |
|
| |
|
| | $ | 7,769,237 |
|
| |
| (1) | At fair value except for securities held to maturity. |
Investment securities held to maturity at September 30, 2019March 31, 2020 and December 31, 20182019 consisted of one1 State of Israel bond maturing in 2024. At March 31, 2020 and December 31, 2019, accrued interest receivable on investments totaled $24 million and $28 million, respectively, and is included in other assets in the accompanying consolidated balance sheets.
At September 30, 2019,March 31, 2020, contractual maturities of investment securities available for sale, adjusted for anticipated prepayments when applicable, were as follows (in thousands):
| | | | Amortized Cost | | Fair Value | Amortized Cost | | Fair Value |
| Due in one year or less | $ | 677,040 |
| | $ | 683,994 |
| $ | 864,668 |
| | $ | 857,621 |
|
| Due after one year through five years | 4,298,108 |
| | 4,318,504 |
| 4,498,791 |
| | 4,298,586 |
|
| Due after five years through ten years | 2,438,854 |
| | 2,468,533 |
| 2,289,908 |
| | 2,248,496 |
|
| Due after ten years | 420,105 |
| | 429,642 |
| 418,859 |
| | 417,703 |
|
| | $ | 7,834,107 |
| | $ | 7,900,673 |
| $ | 8,072,226 |
| | $ | 7,822,406 |
|
The carrying value of securities pledged as collateral for FHLB advances, public deposits, interest rate swaps and to secure borrowing capacity at the FRB totaled $2.1$6.8 billion and $2.4 billion at both September 30, 2019March 31, 2020 and December 31, 2018,2019, respectively.
BANKUNITED, INC. AND SUBSIDIARIES
NOTES TO CONSOLIDATED FINANCIAL STATEMENTS - UNAUDITED
September 30, 2019March 31, 2020
The following table provides information about gains and losses on investment securities for the periods indicated (in thousands):
| | | | Three Months Ended September 30, | | Nine Months Ended September 30, | Three Months Ended March 31, |
| | 2019 | | 2018 | | 2019 | | 2018 | 2020 | | 2019 |
| Proceeds from sale of investment securities available for sale | $ | 670,871 |
|
| $ | 102,238 |
| | $ | 2,297,121 |
| | $ | 938,555 |
| $ | 306,532 |
| | $ | 775,723 |
|
| | | | | | | | | | | |
| Gross realized gains: | | |
|
| | | | | | | |
| Investment securities available for sale | $ | 6,094 |
| | $ | 521 |
| | $ | 15,051 |
| | $ | 6,561 |
| $ | 1,532 |
| | $ | 4,325 |
|
| Gross realized losses: | | |
|
| | | | | | | |
| Investment securities available for sale | (2,669 | ) | | — |
| | (3,394 | ) | | (2,514 | ) | (2 | ) | | (8 | ) |
| Net realized gain | 3,425 |
| | 521 |
| | 11,657 |
| | 4,047 |
| 1,530 |
| | 4,317 |
|
| | | | | | | | | | | |
| Net unrealized gains (losses) on marketable equity securities recognized in earnings | 410 |
| | (89 | ) | | 2,079 |
| | (1,109 | ) | (4,983 | ) | | 1,468 |
|
| | | | | | | | | | | |
| Gain on investment securities, net | $ | 3,835 |
| | $ | 432 |
| | $ | 13,736 |
| | $ | 2,938 |
| |
| Gain (loss) on investment securities, net | | $ | (3,453 | ) | | $ | 5,785 |
|
The following tables present the aggregate fair value and the aggregate amount by which amortized cost exceeded fair value for investment securities available for sale in unrealized loss positions aggregated by investment category and length of time that individual securities had been in continuous unrealized loss positions at the dates indicated (in thousands):. No ACL was recorded for any investment securities available for sale in unrealized loss positions at March 31, 2020.
| | | | September 30, 2019 | March 31, 2020 |
| | Less than 12 Months | | 12 Months or Greater | | Total | Less than 12 Months | | 12 Months or Greater | | Total |
| | Fair Value | | Unrealized Losses | | Fair Value | | Unrealized Losses | | Fair Value | | Unrealized Losses | Fair Value | | Unrealized Losses | | Fair Value | | Unrealized Losses | | Fair Value | | Unrealized Losses |
| U.S. Treasury securities | | $ | 20,007 |
| | $ | (176 | ) | | $ | — |
| | $ | — |
| | $ | 20,007 |
| | $ | (176 | ) |
| U.S. Government agency and sponsored enterprise residential MBS | $ | 542,289 |
| | $ | (3,427 | ) | | $ | 162,189 |
| | $ | (1,614 | ) | | $ | 704,478 |
| | $ | (5,041 | ) | 1,351,831 |
| | (19,853 | ) | | 451,047 |
| | (14,132 | ) | | 1,802,878 |
| | (33,985 | ) |
| U.S. Government agency and sponsored enterprise commercial MBS | 98,316 |
| | (1,057 | ) | | 6,477 |
| | (36 | ) | | 104,793 |
| | (1,093 | ) | 77,388 |
| | (376 | ) | | 28,515 |
| | (375 | ) | | 105,903 |
| | (751 | ) |
| Private label residential MBS and CMOs | 119,494 |
| | (205 | ) | | 47,447 |
| | (349 | ) | | 166,941 |
| | (554 | ) | 737,624 |
| | (16,740 | ) | | — |
| | — |
| | 737,624 |
| | (16,740 | ) |
| Private label commercial MBS | 202,545 |
| | (306 | ) | | 2,835 |
| | (6 | ) | | 205,380 |
| | (312 | ) | 1,293,216 |
| | (122,960 | ) | | 44,861 |
| | (4,129 | ) | | 1,338,077 |
| | (127,089 | ) |
| Single family rental real estate-backed securities | 188,568 |
| | (338 | ) | | 8,123 |
| | (11 | ) | | 196,691 |
| | (349 | ) | 460,048 |
| | (22,518 | ) | | 1,967 |
| | (1 | ) | | 462,015 |
| | (22,519 | ) |
| Collateralized loan obligations | 492,347 |
| | (2,205 | ) | | 306,144 |
| | (4,836 | ) | | 798,491 |
| | (7,041 | ) | 572,725 |
| | (34,562 | ) | | 522,068 |
| | (40,114 | ) | | 1,094,793 |
| | (74,676 | ) |
| Non-mortgage asset-backed securities | 89,413 |
| | (127 | ) | | — |
| | — |
| | 89,413 |
| | (127 | ) | 223,395 |
| | (9,292 | ) | | 6,143 |
| | (1,383 | ) | | 229,538 |
| | (10,675 | ) |
| State and municipal obligations | 1,574 |
| | (1 | ) | | — |
| | — |
| | 1,574 |
| | (1 | ) | |
| SBA securities | 57,064 |
| | (740 | ) | | 93,424 |
| | (1,149 | ) | | 150,488 |
| | (1,889 | ) | 48,894 |
| | (498 | ) | | 117,320 |
| | (4,095 | ) | | 166,214 |
| | (4,593 | ) |
| | $ | 1,791,610 |
| | $ | (8,406 | ) | | $ | 626,639 |
| | $ | (8,001 | ) | | $ | 2,418,249 |
| | $ | (16,407 | ) | $ | 4,785,128 |
| | $ | (226,975 | ) | | $ | 1,171,921 |
| | $ | (64,229 | ) | | $ | 5,957,049 |
| | $ | (291,204 | ) |
BANKUNITED, INC. AND SUBSIDIARIES
NOTES TO CONSOLIDATED FINANCIAL STATEMENTS - UNAUDITED
September 30, 2019March 31, 2020
| | | | December 31, 2018 | December 31, 2019 |
| | Less than 12 Months | | 12 Months or Greater | | Total | Less than 12 Months | | 12 Months or Greater | | Total |
| | Fair Value | | Unrealized Losses | | Fair Value | | Unrealized Losses | | Fair Value | | Unrealized Losses | Fair Value | | Unrealized Losses | | Fair Value | | Unrealized Losses | | Fair Value | | Unrealized Losses |
| U.S. Treasury securities | $ | 14,921 |
| | $ | (14 | ) | | $ | — |
| | $ | — |
| | $ | 14,921 |
| | $ | (14 | ) | $ | 20,056 |
| | $ | (137 | ) | | $ | — |
| | $ | — |
| | $ | 20,056 |
| | $ | (137 | ) |
| U.S. Government agency and sponsored enterprise residential MBS | 450,666 |
| | (1,828 | ) | | 87,311 |
| | (2,580 | ) | | 537,977 |
| | (4,408 | ) | 579,076 |
| | (3,862 | ) | | 243,839 |
| | (2,651 | ) | | 822,915 |
| | (6,513 | ) |
| U.S. Government agency and sponsored enterprise commercial MBS | 146,096 |
| | (352 | ) | | 25,815 |
| | (723 | ) | | 171,911 |
| | (1,075 | ) | 99,610 |
| | (696 | ) | | 6,477 |
| | (35 | ) | | 106,087 |
| | (731 | ) |
| Private label residential MBS and CMOs | 759,921 |
| | (7,073 | ) | | 278,108 |
| | (7,925 | ) | | 1,038,029 |
| | (14,998 | ) | 180,398 |
| | (838 | ) | | 41,636 |
| | (173 | ) | | 222,034 |
| | (1,011 | ) |
| Private label commercial MBS | 742,092 |
| | (5,371 | ) | | 39,531 |
| | (769 | ) | | 781,623 |
| | (6,140 | ) | 648,761 |
| | (1,060 | ) | | 76,302 |
| | (134 | ) | | 725,063 |
| | (1,194 | ) |
| Single family rental real estate-backed securities | 234,305 |
| | (1,973 | ) | | 85,282 |
| | (2,145 | ) | | 319,587 |
| | (4,118 | ) | 241,915 |
| | (1,445 | ) | | 5,460 |
| | (5 | ) | | 247,375 |
| | (1,450 | ) |
| Collateralized loan obligations | 749,047 |
| | (5,217 | ) | | — |
| | — |
| | 749,047 |
| | (5,217 | ) | 63,310 |
| | (846 | ) | | 682,076 |
| | (7,015 | ) | | 745,386 |
| | (7,861 | ) |
| Non-mortgage asset-backed securities | 136,100 |
| | (1,336 | ) | | — |
| | — |
| | 136,100 |
| | (1,336 | ) | 78,964 |
| | (962 | ) | | 7,883 |
| | (85 | ) | | 86,847 |
| | (1,047 | ) |
| State and municipal obligations | 208,971 |
| | (3,522 | ) | | 46,247 |
| | (543 | ) | | 255,218 |
| | (4,065 | ) | |
| SBA securities | 215,975 |
| | (1,391 | ) | | 31,481 |
| | (563 | ) | | 247,456 |
| | (1,954 | ) | 10,236 |
| | (2 | ) | | 142,204 |
| | (1,662 | ) | | 152,440 |
| | (1,664 | ) |
| | $ | 3,658,094 |
| | $ | (28,077 | ) | | $ | 593,775 |
| | $ | (15,248 | ) | | $ | 4,251,869 |
| | $ | (43,325 | ) | $ | 1,922,326 |
| | $ | (9,848 | ) | | $ | 1,205,877 |
| | $ | (11,760 | ) | | $ | 3,128,203 |
| | $ | (21,608 | ) |
The Company monitors its investment securities available for sale for OTTIcredit loss impairment on an individual security basis. No securities were determined to be other-than-temporarilycredit loss impaired during the ninethree months ended September 30, 2019March 31, 2020 or 2018.other than temporarily impaired during the three months ended March 31, 2019. The Company does not intend to sell securities that are in significant unrealized loss positions at September 30, 2019March 31, 2020 and it is not more likely than not that the Company will be required to sell these securities before recovery of the amortized cost basis, which may be at maturity. In making this determination, the Company considered its current and projected liquidity position, its investment policy as to permissible holdings and concentration limits, regulatory requirements and other relevant factors.
At September 30, 2019, 115March 31, 2020, 314 securities available for sale were in unrealized loss positions. The amount of impairment related to 4129 of these securities was considered insignificant both individually and in the aggregate, totaling approximately $346$285 thousand and no further analysis with respect to these securities was considered necessary.
Unrealized losses at March 31, 2020 were primarily attributable to widening spreads, resulting in large part from market response to, and dislocation in the wake of, the emerging COVID-19 pandemic. The basis for concluding that impairment of the remainingAFS securities were not credit loss impaired and no ACL was not other-than-temporaryconsidered necessary at March 31, 2020 is described further described below.
U.S. Government, agencyGovernment Agency and sponsored enterprise residential and commercialMBSGovernment Sponsored Enterprise Securities
At September 30, 2019,March 31, 2020, 1 U.S Treasury security, NaN U.S. Government agency and sponsored enterprise residential MBS, and 45 U.S. Government agency and sponsored enterprise commercial MBS and 13 SBA securities were in unrealized loss positions. Impairment of these floating rate securities was primarily attributable to widening spreads. The timely payment of principal and interest on these securities is explicitly or implicitly guaranteed by the U.S. Government. GivenAs such, there is an assumption of zero credit loss and the expectation of timely payment of principal and interestCompany expects to recover the impairments were considered to be temporary.
Private label residentialMBSandCMOs
At September 30, 2019, 6 private label residential MBS and CMOs were in unrealized loss positions, primarily as a result of widening spreads. These securities were assessed for OTTI using credit and prepayment behavioral models that incorporate CUSIP level constant default rates, voluntary prepayment rates and loss severity and delinquency assumptions. The resultsentire amortized cost basis of these assessments were not indicative of credit losses related to any of these securities as of September 30, 2019. Given the expectation of timely recovery of outstanding principal the impairments were considered to be temporary.securities.
Private label commercialMBS
At September 30, 2019, 5 private label commercial MBS were in unrealized loss positions, primarily as a result of widening spreads. These securities were assessed for OTTI using credit and prepayment behavioral models incorporating assumptions consistent with the collateral characteristics of each security. The results of this analysis were not indicative of
BANKUNITED, INC. AND SUBSIDIARIES
NOTES TO CONSOLIDATED FINANCIAL STATEMENTS - UNAUDITED
September 30, 2019
expected credit losses. Given the expectation of timely recovery of outstanding principal the impairments were considered to be temporary.
Single family rental real estate-backed securities
At September 30, 2019, 5 single family rental real estate-backed securities were in unrealized loss positions. The unrealized losses were primarily due to widening spreads. Management's analysis of the credit characteristics, including loan-to-value and debt service coverage ratios, and levels of subordination for each of the securities is not indicative of projected credit losses. Given the absence of projected credit losses the impairments were considered to be temporary.
Collateralized loan obligations:
At September 30, 2019, 17 collateralized loan obligations were in unrealized loss positions, primarily due to widening spreads for this asset class. These securities were assessed for OTTI using credit and prepayment behavioral models incorporating assumptions consistent with the collateral characteristics of each security. The results of this analysis were not indicative of expected credit losses. Given the expectation of timely recovery of outstanding principal, the impairments were considered to be temporary.
Non-mortgage asset-backed securities
At September 30, 2019, 2 non-mortgage asset-backed securities were in unrealized loss positions, due primarily to widening spreads. These securities were assessed for OTTI using a credit and prepayment behavioral model incorporating assumptions consistent with the collateral characteristics of the security. The results of this analysis were not indicative of expected credit losses. Given the expectation of timely recovery of outstanding principal, the impairment was considered to be temporary.
SBA Securities
At September 30, 2019, 8 SBA securities were in unrealized loss positions. These securities were purchased at a premium and the impairment was attributable primarily to increased prepayment speeds. The timely payment of principal and interest on these securities is guaranteed by the SBA. Given the expectation of timely payment of principal and interest, the impairments were considered to be temporary.
BANKUNITED, INC. AND SUBSIDIARIES
NOTES TO CONSOLIDATED FINANCIAL STATEMENTS - UNAUDITED
September 30, 2019
Note 4 Loans and Allowance for Loan and Lease Losses
Loans consisted of the following at the dates indicated (dollars in thousands):
|
| | | | | | | | | | | | | |
| | September 30, 2019 | | December 31, 2018 |
| | Total | | Percent of Total | | Total | | Percent of Total |
| Residential and other consumer: | |
| | |
| | |
| | |
|
| 1-4 single family residential | $ | 5,024,628 |
| | 22.0 | % | | $ | 4,664,920 |
| | 21.2 | % |
| Government insured residential | 536,682 |
| | 2.3 | % | | 266,729 |
| | 1.2 | % |
| Other consumer loans | 9,794 |
| | 0.1 | % | | 17,340 |
| | 0.1 | % |
| | 5,571,104 |
| | 24.4 | % | | 4,948,989 |
| | 22.5 | % |
| Commercial: | | | | | | | |
| Multi-family | 2,221,525 |
| | 9.7 | % | | 2,585,421 |
| | 11.8 | % |
| Non-owner occupied commercial real estate | 4,789,673 |
| | 21.0 | % | | 4,611,573 |
| | 21.0 | % |
| Construction and land | 173,345 |
| | 0.8 | % | | 210,516 |
| | 1.0 | % |
| Owner occupied commercial real estate | 1,936,516 |
| | 8.5 | % | | 2,007,603 |
| | 9.1 | % |
| Commercial and industrial | 4,477,062 |
| | 19.6 | % | | 4,312,213 |
| | 19.6 | % |
| National commercial lending platforms: | | | | | | | |
| Pinnacle | 1,236,121 |
| | 5.3 | % | | 1,462,655 |
| | 6.6 | % |
| Bridge - franchise finance | 605,896 |
| | 2.6 | % | | 517,305 |
| | 2.4 | % |
| Bridge - equipment finance | 682,149 |
| | 3.0 | % | | 636,838 |
| | 2.9 | % |
| Small business finance | 256,490 |
| | 1.1 | % | | 252,221 |
| | 1.1 | % |
| Mortgage warehouse lending | 905,619 |
| | 4.0 | % | | 431,674 |
| | 2.0 | % |
| | 17,284,396 |
| | 75.6 | % | | 17,028,019 |
| | 77.4 | % |
| Total loans | 22,855,500 |
| | 100.0 | % | | 21,977,008 |
| | 100.0 | % |
| Allowance for loan and lease losses | (108,462 | ) | | | | (109,931 | ) | | |
| Loans, net | $ | 22,747,038 |
| | | | $ | 21,867,077 |
| | |
Premiums, discounts and deferred fees and costs totaled $52 million and $44 million at September 30, 2019 and December 31, 2018, respectively.
During the three and nine months ended September 30, 2019 and 2018, the Company purchased 1-4 single family residential loans totaling $743 million, $1.6 billion, $310 million and $914 million, respectively. Purchases for the three and nine months ended September 30, 2019 and 2018 included $288 million, $572 million, $90 million and $201 million, respectively, of government insured residential loans.
At September 30, 2019, the Company had pledged loans with a carrying value of approximately $10.4 billion as security for FHLB advances and Federal Reserve discount window borrowings.
BANKUNITED, INC. AND SUBSIDIARIES
NOTES TO CONSOLIDATED FINANCIAL STATEMENTS - UNAUDITED
September 30, 2019
The following presents the Company's recorded investment in ACI loans, included in the table above, as of the dates indicated (in thousands):
|
| | | | | | | |
| | September 30, 2019 | | December 31, 2018 |
| Residential | $ | 160,632 |
| | $ | 190,223 |
|
| Commercial | 17,361 |
| | 17,925 |
|
| | $ | 177,993 |
| | $ | 208,148 |
|
At September 30, 2019 and December 31, 2018, the UPB of ACI loans was $343 million and $408 million, respectively. The accretable yield on ACI loans represents the amount by which undiscounted expected future cash flows exceed recorded investment. Changes in the accretable yield on ACI loans for the nine months ended September 30, 2019 and the year ended December 31, 2018 were as follows (in thousands):
|
| | | |
| Balance at December 31, 2017 | $ | 455,059 |
|
| Reclassifications from non-accretable difference, net | 128,499 |
|
| Accretion | (369,915 | ) |
Other changes, net (1) | 78,204 |
|
| Balance at December 31, 2018 | 291,847 |
|
| Reclassifications to non-accretable difference, net | (702 | ) |
| Accretion | (49,065 | ) |
Other changes, net (1) | (12,034 | ) |
| Balance at September 30, 2019 | $ | 230,046 |
|
| |
(1) | Represents changes in cash flows expected to be collected due to the impact of changes in prepayment assumptions or changes in benchmark interest rates. |
BANKUNITED, INC. AND SUBSIDIARIES
NOTES TO CONSOLIDATED FINANCIAL STATEMENTS - UNAUDITED
September 30, 2019March 31, 2020
Allowance for loan and lease losses Private Label Securities:
Activity in the ALLL is summarized as follows for the periods indicated (thousands):
|
| | | | | | | | | | | | | | | | | | | | | | | |
| | Three Months Ended September 30, |
| | 2019 | | 2018 |
| | Residential and Other Consumer | | Commercial | | Total | | Residential and Other Consumer | | Commercial | | Total |
| Beginning balance | $ | 11,236 |
| | $ | 100,905 |
| | $ | 112,141 |
| | $ | 10,338 |
| | $ | 124,633 |
| | $ | 134,971 |
|
| Provision | 158 |
| | 1,681 |
| | 1,839 |
| | 240 |
| | 960 |
| | 1,200 |
|
| Charge-offs | — |
| | (6,141 | ) | | (6,141 | ) | | (740 | ) | | (12,340 | ) | | (13,080 | ) |
| Recoveries | 5 |
| | 618 |
| | 623 |
| | 465 |
| | 1,184 |
| | 1,649 |
|
| Ending balance | $ | 11,399 |
| | $ | 97,063 |
| | $ | 108,462 |
| | $ | 10,303 |
| | $ | 114,437 |
| | $ | 124,740 |
|
|
| | | | | | | | | | | | | | | | | | | | | | | |
| | Nine Months Ended September 30, |
| | 2019 | | 2018 |
| | Residential and Other Consumer | | Commercial | | Total | | Residential and Other Consumer | | Commercial | | Total |
| Beginning balance | $ | 10,788 |
| | $ | 99,143 |
| | $ | 109,931 |
| | $ | 10,720 |
| | $ | 134,075 |
| | $ | 144,795 |
|
| Provision | 439 |
| | 8,934 |
| | 9,373 |
| | 334 |
| | 13,008 |
| | 13,342 |
|
| Charge-offs | — |
| | (13,985 | ) | | (13,985 | ) | | (1,244 | ) | | (34,736 | ) | | (35,980 | ) |
| Recoveries | 172 |
| | 2,971 |
| | 3,143 |
| | 493 |
| | 2,090 |
| | 2,583 |
|
| Ending balance | $ | 11,399 |
| | $ | 97,063 |
| | $ | 108,462 |
| | $ | 10,303 |
| | $ | 114,437 |
| | $ | 124,740 |
|
The following table presents information about the balanceNone of the ALLL and related loans at the dates indicated (in thousands):
|
| | | | | | | | | | | | | | | | | | | | | | | |
| | September 30, 2019 | | December 31, 2018 |
| | Residential and Other Consumer | | Commercial | | Total | | Residential and Other Consumer | | Commercial | | Total |
| Allowance for loan and lease losses: | | | | | | | |
| | |
| | |
|
| Ending balance | $ | 11,399 |
| | $ | 97,063 |
| | $ | 108,462 |
| | $ | 10,788 |
| | $ | 99,143 |
| | $ | 109,931 |
|
| Ending balance: loans individually evaluated for impairment | $ | 12 |
| | $ | 9,930 |
| | $ | 9,942 |
| | $ | 134 |
| | $ | 12,143 |
| | $ | 12,277 |
|
| Ending balance: loans collectively evaluated for impairment | $ | 11,387 |
| | $ | 87,133 |
| | $ | 98,520 |
| | $ | 10,654 |
| | $ | 87,000 |
| | $ | 97,654 |
|
| Ending balance: ACI loans | $ | — |
| | $ | — |
| | $ | — |
| | $ | — |
| | $ | — |
| | $ | — |
|
| Loans: | | | | | 0 |
| | | | | | |
| Ending balance | $ | 5,571,104 |
| | $ | 17,284,396 |
| | $ | 22,855,500 |
| | $ | 4,948,989 |
| | $ | 17,028,019 |
| | $ | 21,977,008 |
|
| Ending balance: loans individually evaluated for impairment | $ | 34,527 |
| | $ | 124,248 |
| | $ | 158,775 |
| | $ | 7,690 |
| | $ | 108,841 |
| | $ | 116,531 |
|
| Ending balance: loans collectively evaluated for impairment | $ | 5,375,945 |
| | $ | 17,142,787 |
| | $ | 22,518,732 |
| | $ | 4,751,076 |
| | $ | 16,901,253 |
| | $ | 21,652,329 |
|
| Ending balance: ACI loans | $ | 160,632 |
| | $ | 17,361 |
| | $ | 177,993 |
| | $ | 190,223 |
| | $ | 17,925 |
| | $ | 208,148 |
|
Credit quality information
Loans, other than ACI loans and government insured residential loans, are considered impaired when, based on current information and events, it is probable that the Company will be unable to collect the scheduled payments ofsecurities had missed principal or interest when due, accordingpayments or had been downgraded by a NRSRO at March 31, 2020. The Company performed an analysis comparing the present value of cash flows expected to be collected to the contractual termsamortized cost basis of impaired securities. This analysis was based on a scenario that we believe to be generally more severe than our reasonable and supportable economic forecast at March 31, 2020, and incorporated assumptions about voluntary prepayment rates, collateral defaults, delinquencies, severity and other relevant factors as described further below. Our analysis also considered the structural characteristics of each security and the level of credit enhancement provided by that structure. Based on the results of this analysis, the Company expects to recover the entire amortized cost basis of its impaired AFS securities at March 31, 2020. No ACL was considered necessary at March 31, 2020.
Private label residential MBS and CMOs
At March 31, 2020, 40 private label residential MBS and CMOs were in unrealized loss positions. Our analysis of cash flows expected to be collected on these securities incorporated assumptions about collateral default rates, voluntary prepayment rates, loss severity, delinquencies and recovery lag. In developing those assumptions, we took into account collateral quality measures such as FICO, LTV, documentation, loan type, property type, agency availability criteria and performing status. We also regularly monitor sector data including home price appreciation, forbearance, delinquency and prepay trends as well as other economic data which would indicate further stress in the sector. Our March 31, 2020 analysis projected weighted average collateral losses for this category of 5% compared to weighted average credit support of 21%. 90% of impaired securities in this category were externally rated AAA, 6% were rated AA and one security representing 4% of the category was not externally rated; this security was internally rated investment grade.
Private label commercial MBS
At March 31, 2020, NaN private label commercial MBS were in unrealized loss positions Our analysis of cash flows expected to be collected on these securities incorporated assumptions about collateral default rates, voluntary prepayment rates, loss severity, delinquencies and recovery lag. In developing those assumptions, we took into account collateral quality and type, loan agreements. Commercial relationshipssize, loan purpose and other qualitative factors. We also regularly monitor collateral watchlisted, bankruptcy data, special servicing trends, delinquency and other economic data which would indicate further stress in the sector. Our March 31, 2020 analysis projected weighted average collateral losses for this category of 13% compared to weighted average credit support of 42%. 82% of impaired securities in this category were externally rated AAA, 12% were rated AA and 6% were rated A.
Single family rental real estate-backed securities
At March 31, 2020, NaN single family rental real estate-backed securities were in unrealized loss positions. Our analysis of cash flows expected to be collected on these securities incorporated assumptions about collateral default rates, loss severity, delinquencies and recovery lag. We regularly monitor sector data including home price appreciation, forbearance, delinquency and prepay trends as well as other economic data which would indicate further stress in the sector. Our March 31, 2020 analysis projected weighted average collateral losses for this category of 12% compared to weighted average credit support of 51%. 91% of impaired securities in this category were externally rated AAA and 9% were rated AA.
Collateralized loan obligations
At March 31, 2020, NaN collateralized loan obligations were in unrealized loss positions. Leveraged loans underlying these securities have seen pricing pressure as the market looks to evaluate ability of borrowers to maintain payments. Uncertainties surrounding the broad economy and how they may translate into rating downgrades and defaults as the COVID-19 crisis plays out have negatively impacted pricing in the leveraged loan market. Our analysis of cash flows expected to be collected on these securities incorporated assumptions about collateral default rates, loss severity, and delinquencies, calibrated to take into account idiosyncratic risks associated with committed balancesthe underlying collateral. In developing those assumptions, we took into account each sector’s performance pre, during and post the 2008 financial crisis. We regularly engage with bond managers to monitor trends in underlying collateral including potential downgrades and subsequent cash flow diversions, liquidity, ratings migration, and any other relevant developments. Our March 31, 2020 analysis projected weighted average collateral losses for this category of 21% compared to weighted average credit support of 41%. 84% of impaired securities in this category were externally rated AAA, 13% were rated AA and 3% were rated A.
BANKUNITED, INC. AND SUBSIDIARIES
NOTES TO CONSOLIDATED FINANCIAL STATEMENTS - UNAUDITED
September 30, 2019March 31, 2020
greater than or equal to $1.0 million that have internal risk ratingsNon-mortgage asset-backed securities
At March 31, 2020, 10 non-mortgage asset-backed securities were in unrealized loss positions. These securities are backed by student loan collateral. Our analysis of substandard or doubtful and are on non-accrual status, as well as loans that have been modified in TDRs, are individually evaluated for impairment. Other commercial relationships on non-accrual status with committed balances under $1.0 million may also be evaluated individually for impairment at management's discretion. The likelihood of loss related to loans assigned internal risk ratings of substandard or doubtful is considered elevated due to their identified credit weaknesses. Factors considered by management in evaluating impairment include payment status, financial condition of the borrower, collateral value, and other factors impacting the probability of collecting scheduled principal and interest payments when due.
An ACI pool or loan is considered to be impaired when it is probable that the Company will be unable to collect all the cash flows expected at acquisition, plus additional cash flows expected to be collected arisingon these securities incorporated assumptions about collateral default rates, loss severity, delinquencies, voluntary prepayment rates and recovery lag. In developing those assumptions, we took into account collateral type, delineated by whether collateral consisted of loans to borrowers in school, refinancing, or a mixture. Our March 31, 2020 analysis projected weighted average collateral losses for this category of 8% compared to weighted average credit support of 18%. 94% of impaired securities in this category were externally rated AAA and 6% were rated AA.
Note 4 Loans and Allowance for Credit Losses
Loans consisted of the following at the dates indicated (dollars in thousands):
|
| | | | | | | | | | | | | |
| | March 31, 2020 | | December 31, 2019 |
| | Total | | Percent of Total | | Total | | Percent of Total |
| Residential and other consumer: | |
| | |
| | |
| | |
|
| 1-4 single family residential | $ | 4,843,908 |
| | 20.9 | % | | $ | 4,953,936 |
| | 21.4 | % |
| Government insured residential | 782,060 |
| | 3.4 | % | | 698,644 |
| | 3.0 | % |
| Other consumer loans | 8,855 |
| | 0.1 | % | | 8,539 |
| | 0.1 | % |
| | 5,634,823 |
| | 24.4 | % | | 5,661,119 |
| | 24.5 | % |
| Commercial: | | | | | | | |
| Multi-family | 1,967,578 |
| | 8.5 | % | | 2,217,705 |
| | 9.6 | % |
| Non-owner occupied commercial real estate | 4,987,798 |
| | 21.5 | % | | 5,030,904 |
| | 21.7 | % |
| Construction and land | 222,223 |
| | 1.0 | % | | 243,925 |
| | 1.1 | % |
| Owner occupied commercial real estate | 2,026,510 |
| | 8.7 | % | | 2,062,808 |
| | 8.9 | % |
| Commercial and industrial | 5,008,573 |
| | 21.6 | % | | 4,655,349 |
| | 20.1 | % |
| Pinnacle | 1,187,607 |
| | 5.0 | % | | 1,202,430 |
| | 5.2 | % |
| Bridge - franchise finance | 647,699 |
| | 2.8 | % | | 627,482 |
| | 2.6 | % |
| Bridge - equipment finance | 649,154 |
| | 2.8 | % | | 684,794 |
| | 3.0 | % |
| Mortgage warehouse lending | 852,313 |
| | 3.7 | % | | 768,472 |
| | 3.3 | % |
| | 17,549,455 |
| | 75.6 | % | | 17,493,869 |
| | 75.5 | % |
| Total loans | 23,184,278 |
| | 100.0 | % | | 23,154,988 |
| | 100.0 | % |
| Allowance for credit losses | (250,579 | ) | | | | (108,671 | ) | | |
| Loans, net | $ | 22,933,699 |
| | | | $ | 23,046,317 |
| | |
Premiums, discounts and deferred fees and costs, excluding the non-credit related discount on PCD loans, totaled $47 million and $50 million at March 31, 2020 and December 31, 2019, respectively. The amortized cost basis of residential PCD loans was $140 million and the related amount of non-credit discount was $143 million at March 31, 2020. The ACL related to PCD residential loans was $1.6 million and $1.7 million at March 31, 2020 and January 1, 2020, the date of initial adoption of ASU 2016-13, respectively.
Included in the table above are direct or sales type finance leases totaling $717 million and $733 million at March 31, 2020 and December 31, 2019, respectively. The amount of income recognized from changesdirect or sales type finance leases for the three months ended March 31, 2020 and 2019 totaled $5.5 million and $5.3 million, respectively and is recorded as interest income on loans in estimates after acquisition.the consolidated statements of income.
During the three months ended March 31, 2020 and 2019, the Company purchased 1-4 single family residential loans totaling $503 million and home equity ACI loans accounted for in pools are evaluated collectively for impairment on a pool by pool basis based on expected pool cash flows. Commercial ACI loans are individually evaluated for impairment based on expected cash flows from the individual loans. Discount continues to be accreted on ACI loans or pools as long as there are expected future cash flows in excess of the current carrying amount of the loans or pools.
The table below presents information about loans identified as impaired at the dates indicated (in thousands):
|
| | | | | | | | | | | | | | | | | | | | | | | |
| | September 30, 2019 | | December 31, 2018 |
| | Recorded Investment | | UPB | | Related Specific Allowance | | Recorded Investment | | UPB | | Related Specific Allowance |
| With no specific allowance recorded: | |
| | |
| | |
| | |
| | |
| | |
|
| 1-4 single family residential | $ | 127 |
| | $ | 127 |
| | $ | — |
| | $ | 2,204 |
| | $ | 2,170 |
| | $ | — |
|
| Government insured residential | 29,853 |
| | 29,772 |
| | — |
| | 3,520 |
| | 3,436 |
| | — |
|
| Multi-family | 17,906 |
| | 17,935 |
| | — |
| | 25,560 |
| | 25,592 |
| | — |
|
| Non-owner occupied commercial real estate | 11,790 |
| | 11,779 |
| | — |
| | 1,317 |
| | 1,323 |
| | — |
|
| Construction and land | 3,839 |
| | 3,841 |
| | — |
| | 8,827 |
| | 8,830 |
| | — |
|
| Owner occupied commercial real estate | 3,358 |
| | 3,365 |
| | — |
| | 398 |
| | 399 |
| | — |
|
Commercial and industrial | 3,500 |
| | 3,504 |
| | — |
| | 11,968 |
| | 11,973 |
| | — |
|
| Bridge - franchise finance | 3,902 |
| | 3,907 |
| | — |
| | 3,152 |
| | 3,149 |
| | — |
|
Small business finance (1) | 34,512 |
| | 34,700 |
| | — |
| | 22,227 |
| | 22,152 |
| | — |
|
| With a specific allowance recorded: | | | | | | | | | | | |
| 1-4 single family residential | 4,547 |
| | 4,476 |
| | — |
| | 1,966 |
| | 1,941 |
| | 134 |
|
| Non-owner occupied commercial real estate | — |
| | — |
| | — |
| | 1,666 |
| | 1,667 |
| | 731 |
|
| Owner occupied commercial real estate | — |
| | — |
| | — |
| | 3,316 |
| | 3,322 |
| | 844 |
|
| Commercial and industrial | 23,143 |
| | 23,119 |
| | 5,948 |
| | 10,939 |
| | 10,946 |
| | 3,831 |
|
| Bridge - franchise finance | 13,174 |
| | 13,211 |
| | 1,275 |
| | 2,047 |
| | 2,046 |
| | 1,427 |
|
| Bridge - equipment finance | 9,124 |
| | 9,047 |
| | 2,707 |
| | 17,424 |
| | 17,339 |
| | 5,310 |
|
| Total: | | | | | | | | | | | |
| Residential and other consumer | $ | 34,527 |
| | $ | 34,375 |
| | $ | 12 |
| | $ | 7,690 |
| | $ | 7,547 |
| | $ | 134 |
|
| Commercial | 124,248 |
| | 124,408 |
| | 9,930 |
| | 108,841 |
| | 108,738 |
| | 12,143 |
|
| | $ | 158,775 |
| | $ | 158,783 |
| | $ | 9,942 |
| | $ | 116,531 |
| | $ | 116,285 |
| | $ | 12,277 |
|
| |
(1) | Includes the guaranteed portion of impaired SBA loans totaling $31.2 million and $13.1 million at September 30, 2019 and December 31, 2018, respectively. |
Interest income recognized on impaired loans was immaterial$305 million, respectively. Purchases for the three and nine months ended September 30,March 31, 2020 and 2019 included $286 million and 2018.$133 million, respectively, of government insured residential loans.
BANKUNITED, INC. AND SUBSIDIARIES
NOTES TO CONSOLIDATED FINANCIAL STATEMENTS - UNAUDITED
September 30, 2019March 31, 2020
At March 31, 2020 and December 31, 2019, the Company had pledged loans with a carrying value of approximately $10.5 billion and $10.2 billion, respectively, as security for FHLB advances and Federal Reserve discount window borrowings.
At March 31, 2020 and December 31, 2019, accrued interest receivable on loans totaled $88 million and $83 million, respectively, and is included in other assets in the accompanying consolidated balance sheets. The amount of interest income reversed on non-accrual loans was not material for the three months ended March 31, 2020.
Allowance for credit losses
Activity in the allowance for credit losses is summarized below. The balance at December 31, 2019 and amounts presented for the three months ended March 31, 2019 represent the allowance for loan and leases losses, estimated using an incurred loss methodology. The ACL at March 31, 2020 and activity for the three months then ended were determined using the CECL methodology (in thousands):
|
| | | | | | | | | | | | | | | | | | | | | | | |
| | Three Months Ended March 31, |
| | 2020 | | 2019 |
| | Residential and Other Consumer | | Commercial | | Total | | Residential and Other Consumer | | Commercial | | Total |
| Beginning balance, December 31 | $ | 11,154 |
| | $ | 97,517 |
| | $ | 108,671 |
| | $ | 10,788 |
| | $ | 99,143 |
| | $ | 109,931 |
|
| Impact of adoption of ASU 2016-13 | 8,098 |
| | 19,207 |
| | 27,305 |
| | — |
| | — |
| | — |
|
| Provision (recovery) | (6,648 | ) | | 128,513 |
| | 121,865 |
| | 150 |
| | 10,131 |
| | 10,281 |
|
| Charge-offs | (31 | ) | | (7,775 | ) | | (7,806 | ) | | — |
| | (6,133 | ) | | (6,133 | ) |
| Recoveries | 3 |
| | 541 |
| | 544 |
| | 14 |
| | 610 |
| | 624 |
|
| Ending balance, March 31 | $ | 12,576 |
| | $ | 238,003 |
| | $ | 250,579 |
| | $ | 10,952 |
| | $ | 103,751 |
| | $ | 114,703 |
|
The following table presents the average recorded investment in impaired loanscomponents of the provision for credit losses for the periods indicatedthree months ended March 31, 2020 (in thousands):
|
| | | | | | | | | | | | | | | |
| | Three Months Ended September 30, | | Nine Months Ended September 30, |
| | 2019 | | 2018 | | 2019 | | 2018 |
| Residential and other consumer: | |
| | | | |
| | |
| 1-4 single family residential | $ | 4,685 |
| | $ | 6,097 |
| | $ | 4,639 |
| | $ | 5,415 |
|
| Government insured residential | 19,865 |
| | 1,554 |
| | 10,885 |
| | 977 |
|
| | 24,550 |
| | 7,651 |
| | 15,524 |
| | 6,392 |
|
| | | | | | | | |
| Commercial: | | | | | | | |
| Multi-family | 21,370 |
| | 26,041 |
| | 23,955 |
| | 25,674 |
|
| Non-owner occupied commercial real estate | 11,938 |
| | 2,849 |
| | 10,628 |
| | 2,144 |
|
| Construction and land | 6,188 |
| | 6,631 |
| | 7,854 |
| | 4,225 |
|
| Owner occupied commercial real estate | 3,406 |
| | 3,838 |
| | 3,526 |
| | 8,720 |
|
Commercial and industrial (1) | 27,297 |
| | 104,939 |
| | 27,879 |
| | 107,862 |
|
| National commercial lending platforms | | |
|
| | | | |
| Bridge - franchise finance | 10,879 |
| | 2,672 |
| | 6,559 |
| | 1,095 |
|
| Bridge - equipment finance | 9,732 |
| | 9,890 |
| | 13,632 |
| | 4,303 |
|
| Small business finance | 32,875 |
| | 23,952 |
| | 26,669 |
| | 22,196 |
|
| | 123,685 |
| | 180,812 |
| | 120,702 |
| | 176,219 |
|
| | $ | 148,235 |
| | $ | 188,463 |
| | $ | 136,226 |
| | $ | 182,611 |
|
|
| | | |
| Amount related to funded portion of loans | $ | 121,865 |
|
| Amount related to off-balance sheet credit exposures | 3,563 |
|
| Provision for credit losses | $ | 125,428 |
|
Credit quality information The increase in the ACL from January 1, 2020, the date of initial adoption of ASU 2016-13, to March 31, 2020 included approximately $93 million related to the change in the Company's reasonable and supportable economic forecast, in large part resulting from the emerging COVID-19 pandemic. The increase also reflected an increase in specific reserves of approximately $16 million, the majority of which related to the Bridge franchise finance portfolio. The credit quality of the loan portfolio has been and is likely to continue to be impacted by the developing COVID-19 crisis, its impact on the economy broadly and more specifically on the Company's individual borrowers. Significant uncertainty currently exists about the extent of this impact, and the impact is likely not fully reflected in the credit quality indicators disclosed below as of March 31, 2020, due to the recent emergence of the pandemic.
| |
(1) | Includes average recorded investment in taxi medallion loans totaling $84 million and $93 million during the three and nine months ended September 30, 2018, respectively. |
Credit quality of loans held for investment is continuously monitored by dedicated residential credit risk management and commercial portfolio management functions. The Company also has a workout and recovery department that monitors the credit quality of criticized and classified loans and an independent internal credit review function.
Credit quality indicators for residential loans
Management considers delinquency status to be the most meaningful indicator of the credit quality of residential and other consumer loans, other than government insured residential loans. Delinquency statistics are updated at least monthly. LTV and FICO scores are also important indicators of credit quality for 1-4 single family residential loans other than government insured loans. FICO scores are generally updated at least annually, and were most recently updated in the fourth quarter of 2019. LTVs
BANKUNITED, INC. AND SUBSIDIARIES
NOTES TO CONSOLIDATED FINANCIAL STATEMENTS - UNAUDITED
September 30, 2019March 31, 2020
The following table presents the recorded investment in loans on non-accrual status asare typically at origination since we do not routinely update residential appraisals. Substantially all of the dates indicated (in thousands):government insured residential loans are government insured buyout loans, which the Company buys out of GNMA securitizations upon default. For these loans, traditional measures of credit quality are not particularly relevant considering the guaranteed nature of the loans and the underlying business model. Factors that impact risk inherent in the residential portfolio segment include national and regional economic conditions such as levels of unemployment and wages, as well as residential property values.
1-4 Single Family Residential credit exposure, excluding government insured residential loans, based on delinquency status:
|
| | | | | | | |
| | September 30, 2019 | | December 31, 2018 |
| Residential and other consumer: | |
| | |
|
| 1-4 single family residential | $ | 15,363 |
| | $ | 6,316 |
|
| Other consumer loans | 325 |
| | 288 |
|
| | 15,688 |
| | 6,604 |
|
| Commercial: | | | |
| Multi-family | 17,906 |
| | 25,560 |
|
| Non-owner occupied commercial real estate | 11,902 |
| | 3,102 |
|
| Construction and land | 3,839 |
| | 8,827 |
|
| Owner occupied commercial real estate | 6,043 |
| | 5,221 |
|
Commercial and industrial | 22,092 |
| | 23,088 |
|
| National commercial lending platforms | | | |
| Bridge - franchise finance | 5,275 |
| | 5,308 |
|
| Bridge - equipment finance | 9,133 |
| | 17,425 |
|
Small business finance (1) | 45,767 |
| | 34,108 |
|
| | 121,957 |
| | 122,639 |
|
| | $ | 137,645 |
| | $ | 129,243 |
|
|
| | | | | | | | | | | | | | | | | | | | | | | | | | | |
| | March 31, 2020 |
| | Amortized Cost By Origination Year | | |
| | 2020 | | 2019 | | 2018 | | 2017 | | 2016 | | Prior | | Total |
| Current | $ | 87,016 |
| | $ | 879,031 |
| | $ | 558,853 |
| | $ | 771,877 |
| | 752,364 |
| | $ | 1,735,010 |
| | $ | 4,784,151 |
|
| 30 - 59 Days Past Due | — |
| | 17,524 |
| | 4,282 |
| | 3,974 |
| | 3,357 |
| | 17,003 |
| | 46,140 |
|
| 60 - 89 Days Past Due | — |
| | — |
| | — |
| | — |
| | — |
| | 1,986 |
| | 1,986 |
|
| 90 Days or More Past Due | — |
| | 807 |
| | 1,853 |
| | 177 |
| | 485 |
| | 8,309 |
| | 11,631 |
|
| | $ | 87,016 |
| | $ | 897,362 |
| | $ | 564,988 |
| | $ | 776,028 |
| | $ | 756,206 |
| | $ | 1,762,308 |
| | $ | 4,843,908 |
|
|
| | | | | | | | | | | | | | | | | | | | | | | | | | | |
| | December 31, 2019 |
| | Amortized Cost By Origination Year | | |
| | 2019 | | 2018 | | 2017 | | 2016 | | 2015 | | Prior | | Total |
| Current | $ | 804,913 |
| | $ | 609,814 |
| | $ | 830,710 |
| | $ | 783,318 |
| | $ | 633,833 |
| | $ | 1,225,030 |
| | $ | 4,887,618 |
|
| 30 - 59 Days Past Due | 13,915 |
| | 3,003 |
| | 3,751 |
| | 8,419 |
| | 4,308 |
| | 12,238 |
| | 45,634 |
|
| 60 - 89 Days Past Due | 1,785 |
| | 442 |
| | 137 |
| | 486 |
| | 1,766 |
| | 4,962 |
| | 9,578 |
|
| 90 Days or More Past Due | — |
| | 1,762 |
| | 914 |
| | — |
| | 5,030 |
| | 3,400 |
| | 11,106 |
|
| | $ | 820,613 |
| | $ | 615,021 |
| | $ | 835,512 |
| | $ | 792,223 |
| | $ | 644,937 |
| | $ | 1,245,630 |
| | $ | 4,953,936 |
|
| |
(1) | Includes the guaranteed portion of non-accrual SBA loans totaling $33.1 million and $17.8 million at September 30, 2019 and December 31, 2018, respectively. |
The amount1-4 Single Family Residential credit exposure, excluding government insured residential loans, based on LTV:
|
| | | | | | | | | | | | | | | | | | | | | | | | | | | |
| | March 31, 2020 |
| | Amortized Cost By Origination Year | | |
| LTV | 2020 | | 2019 | | 2018 | | 2017 | | 2016 | | Prior | | Total |
| Less than 61% | $ | 27,741 |
| | $ | 192,928 |
| | $ | 127,117 |
| | $ | 176,768 |
| | 220,664 |
| | $ | 546,673 |
| | $ | 1,291,891 |
|
| 61% - 70% | 16,460 |
| | 211,530 |
| | 118,704 |
| | 140,679 |
| | 179,839 |
| | 433,278 |
| | 1,100,490 |
|
| 71% - 80% | 42,815 |
| | 476,643 |
| | 286,050 |
| | 379,188 |
| | 324,805 |
| | 759,286 |
| | 2,268,787 |
|
| More than 80% | — |
| | 16,261 |
| | 33,117 |
| | 79,393 |
| | 30,898 |
| | 23,071 |
| | 182,740 |
|
| | $ | 87,016 |
| | $ | 897,362 |
| | $ | 564,988 |
| | $ | 776,028 |
| | $ | 756,206 |
| | $ | 1,762,308 |
| | $ | 4,843,908 |
|
BANKUNITED, INC. AND SUBSIDIARIES
NOTES TO CONSOLIDATED FINANCIAL STATEMENTS - UNAUDITED
March 31, 2020
|
| | | | | | | | | | | | | | | | | | | | | | | | | | | |
| | December 31, 2019 |
| | Amortized Cost By Origination Year | | |
| LTV | 2019 | | 2018 | | 2017 | | 2016 | | 2015 | | Prior | | Total |
| Less than 61% | $ | 171,069 |
| | $ | 134,978 |
| | $ | 183,807 |
| | $ | 228,868 |
| | $ | 197,039 |
| | $ | 372,221 |
| | $ | 1,287,982 |
|
| 61% - 70 % | 195,572 |
| | 128,766 |
| | 152,502 |
| | 188,856 |
| | 154,307 |
| | 316,031 |
| | 1,136,034 |
|
| 71% - 80% | 442,311 |
| | 313,779 |
| | 404,743 |
| | 338,000 |
| | 283,202 |
| | 531,377 |
| | 2,313,412 |
|
| More than 80% | 11,661 |
| | 37,498 |
| | 94,460 |
| | 36,499 |
| | 10,389 |
| | 26,001 |
| | 216,508 |
|
| | $ | 820,613 |
| | $ | 615,021 |
| | $ | 835,512 |
| | $ | 792,223 |
| | $ | 644,937 |
| | $ | 1,245,630 |
| | $ | 4,953,936 |
|
1-4 Single Family Residential credit exposure, excluding government insured residential loans, based on FICO score:
|
| | | | | | | | | | | | | | | | | | | | | | | | | | | |
| | March 31, 2020 |
| | Amortized Cost By Origination Year | | |
| FICO | 2020 | | 2019 | | 2018 | | 2017 | | 2016 | | Prior | | Total |
| 760 or greater | $ | 51,040 |
| | $ | 533,109 |
| | $ | 353,758 |
| | $ | 545,124 |
| | 554,866 |
| | $ | 1,206,334 |
| | $ | 3,244,231 |
|
| 720 - 759 | 26,441 |
| | 245,732 |
| | 125,396 |
| | 136,295 |
| | 122,158 |
| | 318,032 |
| | 974,054 |
|
| 719 or less | 9,535 |
| | 118,521 |
| | 85,834 |
| | 94,609 |
| | 79,182 |
| | 237,942 |
| | 625,623 |
|
| | $ | 87,016 |
| | $ | 897,362 |
| | $ | 564,988 |
| | $ | 776,028 |
| | $ | 756,206 |
| | $ | 1,762,308 |
| | $ | 4,843,908 |
|
|
| | | | | | | | | | | | | | | | | | | | | | | | | | | |
| | December 31, 2019 |
| | Amortized Cost By Origination Year | | |
| FICO | 2019 | | 2018 | | 2017 | | 2016 | | 2015 | | Prior | | Total |
| 760 or greater | $ | 470,057 |
| | $ | 340,716 |
| | $ | 534,017 |
| | $ | 533,804 |
| | $ | 430,706 |
| | $ | 763,807 |
| | $ | 3,073,107 |
|
| 720 - 759 | 242,806 |
| | 185,939 |
| | 200,623 |
| | 178,139 |
| | 141,748 |
| | 307,195 |
| | 1,256,450 |
|
| 719 or less | 107,750 |
| | 88,366 |
| | 100,872 |
| | 80,280 |
| | 72,483 |
| | 174,628 |
| | 624,379 |
|
| | $ | 820,613 |
| | $ | 615,021 |
| | $ | 835,512 |
| | $ | 792,223 |
| | $ | 644,937 |
| | $ | 1,245,630 |
| | $ | 4,953,936 |
|
Credit quality indicators for commercial loans
Factors that would have been recognized on non-accrual loans had they performedimpact risk inherent in accordance with their contractual terms was approximately $2.0 million and $6.0 million for the three and nine months ended September 30, 2019, respectively, and $2.1 million and $5.0 million for the three and nine months ended September 30, 2018, respectively.
Management considers delinquency statuscommercial portfolio segments include but are not limited to be the most meaningful indicatorlevels of economic activity, health of the credit qualitynational and regional economy, industry trends, patterns of 1-4 single family residential, home equity and consumer loans. Delinquency statistics are updated at least monthly. See "Aging of loans" belowtrends in customer behavior that influence demand for more information on the delinquency status of loans. Original LTVour borrowers' products and original FICO score are also important indicators of credit quality for 1-4 single family residential loans other than the FSB loansservices, and government insured loans.
commercial real estate values. Internal risk ratings are considered the most meaningful indicator of credit quality for commercial loans. Internal risk ratings are generally indicative of the likelihood that a borrower will default, are a key factor in identifyinginfluencing the level and nature of ongoing monitoring of loans that are individually evaluated for impairment and may impact management’s estimates of loss factors used in determining the amountestimation of the ALLL.ACL. Internal risk ratings are updated on a continuous basis. Generally, relationships with balances in excess of defined thresholds, ranging from $1 million to $3 million, are re-evaluated at least annually and more frequently if circumstances indicate that a change in risk rating may be warranted. Loans exhibiting potential credit weaknesses that deserve management’s close attention and that if left uncorrected may result in deterioration of the repayment capacity of the borrower are categorized as special mention. Loans with well-defined credit weaknesses, including payment defaults, declining collateral values, frequent overdrafts, operating losses, increasing balance sheet leverage, inadequate cash flow, project cost overruns, unreasonable construction delays, past due real estate taxes or exhausted interest reserves, are assigned an internal risk rating of substandard. A loan with a weakness so severe that collection in full is highly questionable or improbable, but because of certain reasonably specific pending factors has not been charged off, will be assigned an internal risk rating of doubtful.
BANKUNITED, INC. AND SUBSIDIARIES
NOTES TO CONSOLIDATED FINANCIAL STATEMENTS - UNAUDITED
September 30, 2019
The following tables summarize key indicators of credit quality for the Company's loans at the dates indicated. Amounts include premiums, discounts and deferred fees and costs (in thousands):
1-4 Single Family Residential credit exposure for loans, excluding FSB loans, based on original LTV and FICO score:
|
| | | | | | | | | | | | | | | | | | | | |
| | | September 30, 2019 |
| | | FICO |
| LTV | | 720 or less | | 721 - 740 | | 741 - 760 | | 761 or
greater | | Total |
| Less than 60% | | $ | 114,847 |
| | $ | 134,444 |
| | $ | 187,415 |
| | $ | 806,492 |
| | $ | 1,243,198 |
|
| 60% - 70% | | 138,248 |
| | 120,618 |
| | 194,154 |
| | 662,916 |
| | 1,115,936 |
|
| 70% - 80% | | 194,742 |
| | 238,208 |
| | 424,120 |
| | 1,410,608 |
| | 2,267,678 |
|
| More than 80% | | 19,750 |
| | 32,265 |
| | 33,748 |
| | 141,652 |
| | 227,415 |
|
| | | $ | 467,587 |
| | $ | 525,535 |
| | $ | 839,437 |
| | $ | 3,021,668 |
| | $ | 4,854,227 |
|
|
| | | | | | | | | | | | | | | | | | | | |
| | | December 31, 2018 |
| | | FICO |
| LTV | | 720 or less | | 721 - 740 | | 741 - 760 | | 761 or
greater | | Total |
| Less than 60% | | $ | 105,812 |
| | $ | 123,877 |
| | $ | 197,492 |
| | $ | 813,944 |
| | $ | 1,241,125 |
|
| 60% - 70% | | 120,982 |
| | 109,207 |
| | 170,531 |
| | 597,659 |
| | 998,379 |
|
| 70% - 80% | | 156,519 |
| | 203,121 |
| | 374,311 |
| | 1,264,491 |
| | 1,998,442 |
|
| More than 80% | | 17,352 |
| | 35,036 |
| | 36,723 |
| | 136,487 |
| | 225,598 |
|
| | | $ | 400,665 |
| | $ | 471,241 |
| | $ | 779,057 |
| | $ | 2,812,581 |
| | $ | 4,463,544 |
|
Commercial credit exposure, based on internal risk rating:
|
| | | | | | | | | | | | | | | | | | | | | | | | | | | | | | | | | | | | | | | | | | | |
| | September 30, 2019 |
| | | | | | | | | | | | National Commercial Lending Platforms | | |
| | Multi-Family | | Non-Owner Occupied Commercial Real Estate | | Construction
and Land | | Owner Occupied Commercial Real Estate | | Commercial and Industrial | | Pinnacle | | Bridge - Franchise Finance | | Bridge - Equipment Finance | | Small Business Finance | | Mortgage Warehouse Lending | | Total |
| Pass | $ | 2,181,847 |
| | $ | 4,718,776 |
| | $ | 169,507 |
| | $ | 1,904,344 |
| | $ | 4,341,662 |
| | $ | 1,236,121 |
| | $ | 535,646 |
| | $ | 660,341 |
| | $ | 192,511 |
| | $ | 905,619 |
| | $ | 16,846,374 |
|
| Special mention | — |
| | 5,253 |
| | — |
| | 11,359 |
| | 47,678 |
| | — |
| | 13,189 |
| | — |
| | 9,363 |
| | — |
| | 86,842 |
|
| Substandard | 39,678 |
| | 65,644 |
| | 3,838 |
| | 20,813 |
| | 87,631 |
| | — |
| | 57,061 |
| | 19,101 |
| | 54,616 |
| | — |
| | 348,382 |
|
| Doubtful | — |
| | — |
| | — |
| | — |
| | 91 |
| | — |
| | — |
| | 2,707 |
| | — |
| | — |
| | 2,798 |
|
| | $ | 2,221,525 |
| | $ | 4,789,673 |
| | $ | 173,345 |
| | $ | 1,936,516 |
| | $ | 4,477,062 |
| | $ | 1,236,121 |
| | $ | 605,896 |
| | $ | 682,149 |
| | $ | 256,490 |
| | $ | 905,619 |
| | $ | 17,284,396 |
|
|
| | | | | | | | | | | | | | | | | | | | | | | | | | | | | | | | | | | | | | | | | | | |
| | December 31, 2018 |
| | | | | | | | | | | | National Commercial Lending Platforms | | |
| | Multi-Family | | Non-Owner Occupied Commercial Real Estate | | Construction
and Land | | Owner Occupied Commercial Real Estate | | Commercial and Industrial | | Pinnacle | | Bridge - Franchise Finance | | Bridge - Equipment Finance | | Small Business Finance | | Mortgage Warehouse Lending | | Total |
| Pass | $ | 2,547,835 |
| | $ | 4,550,422 |
| | $ | 201,689 |
| | $ | 1,993,067 |
| | $ | 4,248,038 |
| | $ | 1,462,655 |
| | $ | 492,853 |
| | $ | 612,968 |
| | $ | 197,819 |
| | $ | 421,188 |
| | $ | 16,728,534 |
|
| Special mention | 2,932 |
| | 14,301 |
| | — |
| | 3,789 |
| | 25,883 |
| | — |
| | 9,232 |
| | 925 |
| | 13,522 |
| | 10,486 |
| | 81,070 |
|
| Substandard | 34,654 |
| | 46,850 |
| | 8,827 |
| | 10,747 |
| | 36,546 |
| | — |
| | 15,220 |
| | 16,302 |
| | 40,880 |
| | — |
| | 210,026 |
|
| Doubtful | — |
| | — |
| | — |
| | — |
| | 1,746 |
| | — |
| | — |
| | 6,643 |
| | — |
| | — |
| | 8,389 |
|
| | $ | 2,585,421 |
| | $ | 4,611,573 |
|
| $ | 210,516 |
| | $ | 2,007,603 |
|
| $ | 4,312,213 |
| | $ | 1,462,655 |
| | $ | 517,305 |
| | $ | 636,838 |
| | $ | 252,221 |
| | $ | 431,674 |
|
| $ | 17,028,019 |
|
BANKUNITED, INC. AND SUBSIDIARIES
NOTES TO CONSOLIDATED FINANCIAL STATEMENTS - UNAUDITED
September 30, 2019March 31, 2020
Aging of loans:
The following table presents an aging of loans at the dates indicated. Amounts include premiums, discounts and deferred fees and costs (in thousands):
|
| | | | | | | | | | | | | | | | | | | | | | | | | | | | | | | | | | | | | | | |
| | September 30, 2019 | | December 31, 2018 |
| | Current | | 30 - 59 Days Past Due | | 60 - 89 Days Past Due | | 90 Days or More Past Due | | Total | | Current | | 30 - 59 Days Past Due | | 60 - 89 Days Past Due | | 90 Days or More Past Due | | Total |
| 1-4 single family residential | $ | 4,981,761 |
| | $ | 26,419 |
| | $ | 5,767 |
| | $ | 10,681 |
| | $ | 5,024,628 |
| | $ | 4,640,771 |
| | $ | 15,070 |
| | $ | 2,126 |
| | $ | 6,953 |
| | $ | 4,664,920 |
|
| Government insured residential | 68,703 |
| | 27,055 |
| | 20,449 |
| | 420,475 |
| | 536,682 |
| | 31,348 |
| | 8,342 |
| | 8,871 |
| | 218,168 |
| | 266,729 |
|
| Home equity loans and lines of credit | 1,304 |
| | 29 |
| | 48 |
| | — |
| | 1,381 |
| | 1,393 |
| | — |
| | — |
| | — |
| | 1,393 |
|
| Other consumer loans | 7,750 |
| | 386 |
| | — |
| | 277 |
| | 8,413 |
| | 15,947 |
| | — |
| | — |
| | — |
| | 15,947 |
|
| Multi-family | 2,221,525 |
| | — |
| | — |
| | — |
| | 2,221,525 |
| | 2,585,421 |
| | — |
| | — |
| | — |
| | 2,585,421 |
|
| Non-owner occupied commercial real estate | 4,789,562 |
| | — |
| | — |
| | 111 |
| | 4,789,673 |
| | 4,611,454 |
| | — |
| | 119 |
| | — |
| | 4,611,573 |
|
| Construction and land | 173,345 |
| | — |
| | — |
| | — |
| | 173,345 |
| | 209,825 |
| | 691 |
| | — |
| | — |
| | 210,516 |
|
| Owner occupied commercial real estate | 1,935,843 |
| | 312 |
| | — |
| | 361 |
| | 1,936,516 |
| | 2,004,781 |
| | 2,326 |
| | 276 |
| | 220 |
| | 2,007,603 |
|
| Commercial and industrial | 4,473,727 |
| | 1,318 |
| | 1,059 |
| | 958 |
| | 4,477,062 |
| | 4,297,911 |
| | 6,373 |
| | 175 |
| | 7,754 |
| | 4,312,213 |
|
| National commercial lending platforms | | | | | | | | | | | | | | | | | | |
|
|
| Pinnacle | 1,236,121 |
| | — |
| | — |
| | — |
| | 1,236,121 |
| | 1,462,655 |
| | — |
| | — |
| | — |
| | 1,462,655 |
|
| Bridge - franchise finance | 597,946 |
| | — |
| | 5,601 |
| | 2,349 |
| | 605,896 |
| | 516,077 |
| | — |
| | — |
| | 1,228 |
| | 517,305 |
|
| Bridge - equipment finance | 682,149 |
| | — |
| | — |
| | — |
| | 682,149 |
| | 636,235 |
| | 603 |
| | — |
| | — |
| | 636,838 |
|
Small business finance (1) | 220,407 |
| | 642 |
| | 2,162 |
| | 33,279 |
| | 256,490 |
| | 230,708 |
| | 4,705 |
| | 2,817 |
| | 13,991 |
| | 252,221 |
|
| Mortgage warehouse lending | 905,619 |
| | — |
| | — |
| | — |
| | 905,619 |
| | 431,674 |
| | — |
| | — |
| | — |
| | 431,674 |
|
| | $ | 22,295,762 |
| | $ | 56,161 |
| | $ | 35,086 |
| | $ | 468,491 |
| | $ | 22,855,500 |
| | $ | 21,676,200 |
| | $ | 38,110 |
| | $ | 14,384 |
| | $ | 248,314 |
| | $ | 21,977,008 |
|
|
| | | | | | | | | | | | | | | | | | | | | | | | | | | | | | | |
| | March 31, 2020 |
| | Amortized Cost By Origination Year | | Revolving Loans | | |
| | 2020 | | 2019 | | 2018 | | 2017 | | 2016 | | Prior | | | Total |
| Multi-Family | | | | | | | | | | | | | | | |
| Pass | $ | 31,968 |
| | $ | 326,309 |
| | $ | 207,696 |
| | $ | 256,990 |
| | $ | 354,655 |
| | $ | 705,420 |
| | $ | 38,481 |
| | $ | 1,921,519 |
|
| Special mention | — |
| | — |
| | — |
| | — |
| | 4,357 |
| | — |
| | — |
| | 4,357 |
|
| Substandard | — |
| | — |
| | — |
| | 2,850 |
| | 6,240 |
| | 32,612 |
| | — |
| | 41,702 |
|
| Total Multi-Family | $ | 31,968 |
| | $ | 326,309 |
| | $ | 207,696 |
| | $ | 259,840 |
| | $ | 365,252 |
| | $ | 738,032 |
| | $ | 38,481 |
| | $ | 1,967,578 |
|
| | | | | | | | | | | | | | | | |
| Non-owner occupied commercial real estate | | | | | | | | | | | | | | | |
| Pass | $ | 184,902 |
| | $ | 1,304,343 |
| | $ | 848,343 |
| | $ | 552,954 |
| | $ | 848,587 |
| | $ | 1,077,415 |
| | $ | 84,238 |
| | $ | 4,900,782 |
|
| Special mention | — |
| | — |
| | — |
| | 4,201 |
| | 114 |
| | — |
| | — |
| | 4,315 |
|
| Substandard | — |
| | 11,202 |
| | 222 |
| | 462 |
| | 22,082 |
| | 48,733 |
| | — |
| | 82,701 |
|
| Total non-owner occupied commercial real estate | $ | 184,902 |
| | $ | 1,315,545 |
| | $ | 848,565 |
| | $ | 557,617 |
| | $ | 870,783 |
| | $ | 1,126,148 |
| | $ | 84,238 |
| | $ | 4,987,798 |
|
| | | | | | | | | | | | | | | | |
| Construction and Land | | | | | | | | | | | | | | | |
| Pass | $ | 6,283 |
| | $ | 94,863 |
| | $ | 18,643 |
| | $ | 63,292 |
| | $ | 27,579 |
| | $ | 2,121 |
| | $ | 831 |
| | $ | 213,612 |
|
| Special mention | — |
| | — |
| | — |
| | — |
| | 4,284 |
| | — |
| | — |
| | 4,284 |
|
| Substandard | — |
| | — |
| | 888 |
| | — |
| | 3,093 |
| | 346 |
| | — |
| | 4,327 |
|
| Total Construction and Land | $ | 6,283 |
| | $ | 94,863 |
| | $ | 19,531 |
| | $ | 63,292 |
| | $ | 34,956 |
| | $ | 2,467 |
| | $ | 831 |
| | $ | 222,223 |
|
| | | | | | | | | | | | | | | | |
| Owner occupied commercial real estate | | | | | | | | | | | | | | | |
| Pass | $ | 36,757 |
| | $ | 340,526 |
| | $ | 305,021 |
| | $ | 324,384 |
| | $ | 341,658 |
| | $ | 571,570 |
| | $ | 29,758 |
| | $ | 1,949,674 |
|
| Special mention | — |
| | — |
| | — |
| | 4,582 |
| | 15,519 |
| | 6,069 |
| | — |
| | 26,170 |
|
| Substandard | — |
| | 3,203 |
| | 12,608 |
| | 11,915 |
| | 2,779 |
| | 10,610 |
| | 9,551 |
| | 50,666 |
|
| Total owner occupied commercial real estate | $ | 36,757 |
| | $ | 343,729 |
| | $ | 317,629 |
| | $ | 340,881 |
| | $ | 359,956 |
| | $ | 588,249 |
| | $ | 39,309 |
| | $ | 2,026,510 |
|
| | | | | | | | | | | | | | | | |
| Commercial and industrial | | | | | | | | | | | | | | | |
| Pass | $ | 105,617 |
| | $ | 1,180,796 |
| | $ | 447,385 |
| | $ | 289,605 |
| | $ | 237,327 |
| | $ | 75,858 |
| | $ | 2,466,871 |
| | $ | 4,803,459 |
|
| Special mention | — |
| | 2,306 |
| | 1,002 |
| | 1,005 |
| | 426 |
| | 665 |
| | 61,769 |
| | 67,173 |
|
| Substandard | — |
| | 10,519 |
| | 18,642 |
| | 25,863 |
| | 23,776 |
| | 43,748 |
| | 15,393 |
| | 137,941 |
|
| Total commercial and industrial | $ | 105,617 |
| | $ | 1,193,621 |
| | $ | 467,029 |
| | $ | 316,473 |
| | $ | 261,529 |
| | $ | 120,271 |
| | $ | 2,544,033 |
| | $ | 5,008,573 |
|
| | | | | | | | | | | | | | | | |
| Pinnacle | | | | | | | | | | | | | | | |
| Pass | $ | 14,982 |
| | $ | 140,375 |
| | $ | 99,903 |
| | $ | 241,039 |
| | $ | 234,526 |
| | $ | 456,782 |
| | $ | — |
| | $ | 1,187,607 |
|
| Total Pinnacle | $ | 14,982 |
| | $ | 140,375 |
| | $ | 99,903 |
| | $ | 241,039 |
| | $ | 234,526 |
| | $ | 456,782 |
| | $ | — |
| | $ | 1,187,607 |
|
| | | | | | | | | | | | | | | | |
| Bridge - Franchise Finance | | | | | | | | | | | | | | | |
| Pass | $ | 73,535 |
| | $ | 137,509 |
| | $ | 69,366 |
| | $ | 47,212 |
| | $ | 25,975 |
| | $ | 21,887 |
| | $ | — |
| | $ | 375,484 |
|
| Special mention | 11,004 |
| | 119,647 |
| | 35,462 |
| | 5,597 |
| | 8,620 |
| | 719 |
| | — |
| | 181,049 |
|
| Substandard | 183 |
| | 11,419 |
| | 59,257 |
| | 6,310 |
| | 11,658 |
| | 2,339 |
| | — |
| | 91,166 |
|
| Total Bridge - Franchise Finance | $ | 84,722 |
| | $ | 268,575 |
| | $ | 164,085 |
| | $ | 59,119 |
| | $ | 46,253 |
| | $ | 24,945 |
| | $ | — |
| | $ | 647,699 |
|
| | | | | | | | | | | | | | | | |
| Bridge - Equipment Finance | | | | | | | | | | | | | | | |
| Pass | $ | 24,544 |
| | $ | 212,004 |
| | $ | 123,552 |
| | $ | 133,612 |
| | $ | 60,226 |
| | $ | 82,855 |
| | $ | — |
| | $ | 636,793 |
|
| Special mention | — |
| | — |
| | 800 |
| | — |
| | — |
| | — |
| | — |
| | 800 |
|
| Substandard | — |
| | — |
| | — |
| | — |
| | 7,693 |
| | 3,868 |
| | — |
| | 11,561 |
|
| Total Bridge - Equipment Finance | $ | 24,544 |
| | $ | 212,004 |
| | $ | 124,352 |
| | $ | 133,612 |
| | $ | 67,919 |
| | $ | 86,723 |
| | $ | — |
| | $ | 649,154 |
|
| | | | | | | | | | | | | | | | |
| Mortgage Warehouse Lending | | | | | | | | | | | | | | | |
| Pass | $ | — |
| | $ | — |
| | $ | — |
| | $ | — |
| | $ | — |
| | $ | — |
| | $ | 852,313 |
| | $ | 852,313 |
|
| Total Mortgage Warehouse Lending | $ | — |
| | $ | — |
| | $ | — |
| | $ | — |
| | $ | — |
| | $ | — |
| | $ | 852,313 |
| | $ | 852,313 |
|
| |
(1) | Includes the guaranteed portion of SBA loans past due by 90 days or more totaling $29.3 million and $8.8 million at September 30, 2019 and December 31, 2018, respectively. |
Loans contractually delinquent by 90 days or more and still accruing totaled $421 million,At March 31, 2020, the balance of which $420 million are government insuredrevolving loans at September 30, 2019 and $219 million, of which $218 million are government insuredconverted to term loans at December 31, 2018.
Foreclosure of residential real estate
The recorded investment in residential loans in the process of foreclosure was $247 million, of which $240 million was government insured, at September 30, 2019 and $85 million, all of which was government insured, at December 31, 2018. The carrying amount of foreclosed residential real estate included in "Other assets" in the accompanying consolidated balance sheet was zero and $6 million at September 30, 2019 and December 31, 2018, respectively.immaterial.
BANKUNITED, INC. AND SUBSIDIARIES
NOTES TO CONSOLIDATED FINANCIAL STATEMENTS - UNAUDITED
September 30, 2019March 31, 2020
The following tables summarizes the Company's commercial credit exposure based on internal risk rating, in aggregate, at the dates indicated (in thousands):
|
| | | | | | | | | | | | | | | | | | | | | | | | | | | | | | | | | | | | | | | |
| | March 31, 2020 |
| | Multi-Family | | Non-Owner Occupied Commercial Real Estate | | Construction
and Land | | Owner Occupied Commercial Real Estate | | Commercial and Industrial | | Pinnacle | | Bridge - Franchise Finance | | Bridge - Equipment Finance | | Mortgage Warehouse Lending | | Total |
| Pass | $ | 1,921,519 |
| | $ | 4,900,782 |
| | $ | 213,612 |
| | $ | 1,949,674 |
| | $ | 4,803,459 |
| | $ | 1,187,607 |
| | $ | 375,484 |
| | $ | 636,793 |
| | $ | 852,313 |
| | $ | 16,841,243 |
|
| Special mention | 4,357 |
| | 4,315 |
| | 4,284 |
| | 26,170 |
| | 67,173 |
| | — |
| | 181,049 |
| | 800 |
| | — |
| | 288,148 |
|
| Substandard | 41,702 |
| | 82,701 |
| | 4,327 |
| | 50,666 |
| | 137,941 |
| | — |
| | 91,166 |
| | 11,561 |
| | — |
| | 420,064 |
|
| | $ | 1,967,578 |
| | $ | 4,987,798 |
| | $ | 222,223 |
| | $ | 2,026,510 |
| | $ | 5,008,573 |
| | $ | 1,187,607 |
| | $ | 647,699 |
| | $ | 649,154 |
| | $ | 852,313 |
| | $ | 17,549,455 |
|
|
| | | | | | | | | | | | | | | | | | | | | | | | | | | | | | | | | | | | | | | |
| | December 31, 2019 |
| | Multi-Family | | Non-Owner Occupied Commercial Real Estate | | Construction
and Land | | Owner Occupied Commercial Real Estate | | Commercial and Industrial | | Pinnacle | | Bridge - Franchise Finance | | Bridge - Equipment Finance | | Mortgage Warehouse Lending | | Total |
| Pass | $ | 2,184,771 |
| | $ | 4,932,279 |
| | $ | 240,734 |
| | $ | 1,991,556 |
| | $ | 4,508,563 |
| | $ | 1,202,430 |
| | $ | 562,042 |
| | $ | 663,855 |
| | $ | 768,472 |
| | $ | 17,054,702 |
|
| Special mention | — |
| | 5,831 |
| | — |
| | 27,870 |
| | 28,498 |
| | — |
| | 10,682 |
| | — |
| | — |
| | 72,881 |
|
| Substandard | 32,934 |
| | 92,794 |
| | 3,191 |
| | 43,382 |
| | 118,288 |
| | — |
| | 54,758 |
| | 20,939 |
| | — |
| | 366,286 |
|
| | $ | 2,217,705 |
| | $ | 5,030,904 |
| | $ | 243,925 |
| | $ | 2,062,808 |
| | $ | 4,655,349 |
| | $ | 1,202,430 |
| | $ | 627,482 |
| | $ | 684,794 |
| | $ | 768,472 |
| | $ | 17,493,869 |
|
Past Due and Non-Accrual Loans:
The following table presents an aging of loans at the dates indicated (in thousands):
|
| | | | | | | | | | | | | | | | | | | | | | | | | | | | | | | | | | | | | | | |
| | March 31, 2020 | | December 31, 2019 |
| | Current | | 30 - 59 Days Past Due | | 60 - 89 Days Past Due | | 90 Days or More Past Due | | Total | | Current | | 30 - 59 Days Past Due | | 60 - 89 Days Past Due | | 90 Days or More Past Due | | Total |
| 1-4 single family residential | $ | 4,784,151 |
| | $ | 46,140 |
| | $ | 1,986 |
| | $ | 11,631 |
| | $ | 4,843,908 |
| | $ | 4,887,618 |
| | $ | 45,634 |
| | $ | 9,578 |
| | $ | 11,106 |
| | $ | 4,953,936 |
|
| Government insured residential | 57,363 |
| | 55,364 |
| | 46,161 |
| | 623,172 |
| | 782,060 |
| | 93,560 |
| | 45,347 |
| | 30,426 |
| | 529,311 |
| | 698,644 |
|
| Home equity loans and lines of credit | 1,439 |
| | 89 |
| | — |
| | — |
| | 1,528 |
| | 1,320 |
| | — |
| | — |
| | — |
| | 1,320 |
|
| Other consumer loans | 5,412 |
| | 1,915 |
| | — |
| | — |
| | 7,327 |
| | 7,219 |
| | — |
| | — |
| | — |
| | 7,219 |
|
| Multi-family | 1,952,228 |
| | 15,350 |
| | — |
| | — |
| | 1,967,578 |
| | 2,217,705 |
| | — |
| | — |
| | — |
| | 2,217,705 |
|
| Non-owner occupied commercial real estate | 4,972,128 |
| | 796 |
| | 904 |
| | 13,970 |
| | 4,987,798 |
| | 5,015,458 |
| | — |
| | 928 |
| | 14,518 |
| | 5,030,904 |
|
| Construction and land | 220,094 |
| | 2,129 |
| | — |
| | — |
| | 222,223 |
| | 240,647 |
| | 2,396 |
| | — |
| | 882 |
| | 243,925 |
|
| Owner occupied commercial real estate | 1,999,110 |
| | 4,135 |
| | 4,619 |
| | 18,646 |
| | 2,026,510 |
| | 2,041,352 |
| | 1,336 |
| | 4,420 |
| | 15,700 |
| | 2,062,808 |
|
| Commercial and industrial | 4,910,789 |
| | 43,070 |
| | 5,206 |
| | 49,508 |
| | 5,008,573 |
| | 4,595,847 |
| | 2,313 |
| | 4,301 |
| | 52,888 |
| | 4,655,349 |
|
| Pinnacle | 1,187,607 |
| | — |
| | — |
| | — |
| | 1,187,607 |
| | 1,202,430 |
| | — |
| | — |
| | — |
| | 1,202,430 |
|
| Bridge - franchise finance | 610,060 |
| | 2,394 |
| | 292 |
| | 34,953 |
| | 647,699 |
| | 610,315 |
| | 3,840 |
| | 2,501 |
| | 10,826 |
| | 627,482 |
|
| Bridge - equipment finance | 636,418 |
| | 12,736 |
| | — |
| | — |
| | 649,154 |
| | 677,089 |
| | 7,705 |
| | — |
| | — |
| | 684,794 |
|
| Mortgage warehouse lending | 852,313 |
| | — |
| | — |
| | — |
| | 852,313 |
| | 768,472 |
| | — |
| | — |
| | — |
| | 768,472 |
|
| | $ | 22,189,112 |
| | $ | 184,118 |
| | $ | 59,168 |
| | $ | 751,880 |
| | $ | 23,184,278 |
| | $ | 22,359,032 |
| | $ | 108,571 |
| | $ | 52,154 |
| | $ | 635,231 |
| | $ | 23,154,988 |
|
Included in the table above is the guaranteed portion of SBA loans past due by 90 days or more totaling $36.2 million and $36.3 million at March 31, 2020 and December 31, 2019, respectively.
Loans contractually delinquent by 90 days or more and still accruing totaled $623 million, all of which were government insured residential loans at March 31, 2020 and $531 million, of which $529 million were government insured residential loans at December 31, 2019. Substantially all of these loans are government insured pool buyout loans, which the Company buys out of GNMA securitizations upon default.
BANKUNITED, INC. AND SUBSIDIARIES
NOTES TO CONSOLIDATED FINANCIAL STATEMENTS - UNAUDITED
March 31, 2020
The following table presents information about loans on non-accrual status at the dates indicated (in thousands):
|
| | | | | | | | | | | |
| | March 31, 2020 | | December 31, 2019 |
| | Amortized Cost | | Amortized Cost With No Related Allowance | | Amortized Cost |
| Residential and other consumer | $ | 16,956 |
| | $ | 2,691 |
| | $ | 18,894 |
|
| Commercial: | | | | | |
| Multi-family | 6,011 |
| | 6,011 |
| | 6,138 |
|
| Non-owner occupied commercial real estate | 36,355 |
| | 31,607 |
| | 40,097 |
|
| Construction and land | 3,439 |
| | 346 |
| | 3,191 |
|
| Owner occupied commercial real estate | 26,147 |
| | 17,766 |
| | 27,141 |
|
| Commercial and industrial | 60,118 |
| | 16,095 |
| | 74,757 |
|
| Bridge - franchise finance | 37,635 |
| | 2,128 |
| | 13,631 |
|
| Bridge - equipment finance | 11,561 |
| | 11,318 |
| | 20,939 |
|
| | $ | 198,222 |
| | $ | 87,962 |
| | $ | 204,788 |
|
Included in the table above is the guaranteed portion of non-accrual SBA loans totaling $49.1 million and $45.7 million at March 31, 2020 and December 31, 2019, respectively. The amount of additional interest income that would have been recognized on non-accrual loans had they performed in accordance with their contractual terms was approximately $3.0 million and $2.0 million for the three months ended March 31, 2020 and 2019, respectively.
Collateral dependent loans:
The following table presents the amortized cost basis of collateral dependent loans at March 31, 2020 (in thousands):
|
| | | | | | | |
| | Amortized Cost | | Extent to Which Secured by Collateral |
| Residential and other consumer | $ | 3,356 |
| | $ | 3,343 |
|
| Commercial: | | | |
| Multi-family | 6,011 |
| | 6,011 |
|
| Non-owner occupied commercial real estate | 20,405 |
| | 20,405 |
|
| Construction and land | 3,439 |
| | 3,411 |
|
| Owner occupied commercial real estate | 19,597 |
| | 19,521 |
|
| Commercial and industrial | 47,278 |
| | 33,078 |
|
| Bridge - franchise finance | 41,388 |
| | 28,765 |
|
| Bridge - equipment finance | 11,570 |
| | 11,559 |
|
| Total commercial | 149,688 |
| | 122,737 |
|
| | $ | 153,044 |
| | $ | 126,080 |
|
Collateral for the multi-family, non-owner occupied commercial real estate, and owner-occupied commercial real estate loan classes generally consists of commercial real estate. Collateral for construction and land loans is typically residential or commercial real estate. Collateral for commercial and industrial loans generally consists of equipment, accounts receivable, inventory and other business assets; owner-occupied commercial real estate loans may also be collateralized by these types of assets. Bridge franchise finance loans may be collateralized by franchise value or by equipment. Bridge equipment finance loans are secured by the financed equipment. Residential loans are collateralized by residential real estate.
Foreclosure of residential real estate
The recorded investment in residential loans in the process of foreclosure was $477 million, of which $467 million was government insured, at March 31, 2020 and $257 million, of which $248 million was government insured, at December 31,
BANKUNITED, INC. AND SUBSIDIARIES
NOTES TO CONSOLIDATED FINANCIAL STATEMENTS - UNAUDITED
March 31, 2020
2019. The carrying amount of foreclosed residential real estate included in "Other assets" in the accompanying consolidated balance sheet was insignificant at March 31, 2020 and $6 million at December 31, 2019. In response to the COVID-19 pandemic, new foreclosure actions on residential loans have been temporarily suspended.
Troubled debt restructurings
The following tables summarizetable summarizes loans that were modified in TDRs during the periods indicated, as well as loans modified during the twelve months preceding September 30,March 31, 2020 and 2019 and 2018 that experienced payment defaults during the periods indicated (dollars in thousands):
|
| | | | | | | | | | | | | | | | | | | | | | | | | | | |
| | Three Months Ended March 31, |
| | 2020 | | 2019 |
| | Loans Modified in TDRs
During the Period | | TDRs Experiencing Payment
Defaults During the Period | | Loans Modified in TDRs
During the Period | | TDRs Experiencing Payment
Defaults During the Period |
| | Number of
TDRs | | Amortized Cost | | Number of
TDRs | | Amortized Cost | | Number of
TDRs | | Amortized Cost | | Number of
TDRs | | Amortized Cost |
| 1-4 single family residential | 1 |
| | $ | 200 |
| | — |
| | $ | — |
| | 2 |
| | $ | 567 |
| | — |
| | $ | — |
|
| Government insured residential | 90 |
| | 14,855 |
| | 25 |
| | 3,628 |
| | 20 |
| | 2,981 |
| | 16 |
| | 1,942 |
|
| Non-owner occupied commercial real estate | 1 |
| | 4,249 |
| | — |
| | — |
| | — |
| | — |
| | 1 |
| | 2,874 |
|
| Owner occupied commercial real estate | — |
| | — |
| | — |
| | — |
| | 1 |
| | 904 |
| | 3 |
| | 1,962 |
|
| Commercial and industrial | — |
| | — |
| | — |
| | — |
| | 3 |
| | 12,720 |
| | 1 |
| | 143 |
|
| Bridge - franchise finance | 11 |
| | 13,872 |
| | 10 |
| | 12,321 |
| | 2 |
| | 1,212 |
| | — |
| | — |
|
| Bridge - equipment finance | — |
| | — |
| | — |
| | — |
| | 1 |
| | 885 |
| | — |
| | — |
|
| | 103 |
| | $ | 33,176 |
| | 35 |
| | $ | 15,949 |
| | 29 |
| | $ | 19,269 |
| | 21 |
| | $ | 6,921 |
|
|
| | | | | | | | | | | | | | | | | | | | | | | | | | | |
| | Three Months Ended September 30, |
| | 2019 | | 2018 |
| | Loans Modified in TDRs
During the Period | | TDRs Experiencing Payment
Defaults During the Period | | Loans Modified in TDRs
During the Period | | TDRs Experiencing Payment
Defaults During the Period |
| | Number of
TDRs | | Recorded
Investment | | Number of
TDRs | | Recorded
Investment | | Number of
TDRs | | Recorded
Investment | | Number of
TDRs | | Recorded
Investment |
| 1-4 single family residential | — |
| | $ | — |
| | — |
| | $ | — |
| | — |
| | $ | — |
| | 2 |
| | $ | 139 |
|
| Government insured residential | 133 |
| | 21,421 |
| | 56 |
| | 8,461 |
| | 11 |
| | 956 |
| | 2 |
| | 172 |
|
| Non-owner occupied commercial real estate | — |
| | — |
| | — |
| | — |
| | 2 |
| | 3,037 |
| | — |
| | — |
|
| Commercial and industrial | 1 |
| | 4,421 |
| | 1 |
| | 395 |
| | 3 |
| | 4,170 |
| | 1 |
| | 215 |
|
| National commercial lending platforms | | | | | | | | | | | | | | | |
| Bridge - franchise finance | 1 |
| | 12,850 |
| | — |
| | — |
| | — |
| | — |
| | — |
| | — |
|
| Small business finance | 2 |
| | 963 |
| | 4 |
| | 2,911 |
| | — |
| | — |
| | — |
| | — |
|
| | 137 |
| | $ | 39,655 |
| | 61 |
| | $ | 11,767 |
| | 16 |
| | $ | 8,163 |
| | 5 |
| | $ | 526 |
|
|
| | | | | | | | | | | | | | | | | | | | | | | | | | | |
| | Nine Months Ended September 30, |
| | 2019 | | 2018 |
| | Loans Modified in TDRs
During the Period | | TDRs Experiencing Payment
Defaults During the Period | | Loans Modified in TDRs
During the Period | | TDRs Experiencing Payment
Defaults During the Period |
| | Number of
TDRs | | Recorded
Investment | | Number of
TDRs | | Recorded
Investment | | Number of
TDRs | | Recorded
Investment | | Number of
TDRs | | Recorded
Investment |
| 1-4 single family residential | 2 |
| | $ | 560 |
| | — |
| | $ | — |
| | 10 |
| | $ | 3,686 |
| | 2 |
| | $ | 139 |
|
| Government insured residential | 171 |
| | 26,992 |
| | 58 |
| | 8,687 |
| | 14 |
| | 1,300 |
| | 3 |
| | 272 |
|
| Non-owner occupied commercial real estate | 1 |
| | 11,791 |
| | — |
| | — |
| | 2 |
| | 3,037 |
| | — |
| | — |
|
| Commercial and industrial | 6 |
| | 21,144 |
| | 1 |
| | 395 |
| | 9 |
| | 5,371 |
| | 1 |
| | 215 |
|
| National commercial lending platforms | | | | | | | | | | | | | | | |
| Bridge - franchise finance | 4 |
| | 15,715 |
| | — |
| | — |
| | — |
| | — |
| | — |
| | — |
|
| Small business finance | 2 |
| | 962 |
| | 6 |
| | 5,872 |
| | 1 |
| | 164 |
| | — |
| | — |
|
| | 186 |
| | $ | 77,164 |
| | 65 |
| | $ | 14,954 |
| | 36 |
| | $ | 13,558 |
| | 6 |
| | $ | 626 |
|
Modifications during the three and nine months ended September 30,March 31, 2020 and 2019 and 2018 included interest rate reductions, restructuring of the amount and timing of required periodic payments, extensions of maturity and covenant waivers. Included in TDRs are residential loans to borrowers who have not reaffirmed their debt discharged in Chapter 7 bankruptcy. The total amount of such loans is not material. Modified ACI loans accounted for in pools are not considered TDRs, are not separated from
Under recently issued inter-agency and authoritative guidance and consistent with the pools and are not classified as impaired loans.
BANKUNITED, INC. AND SUBSIDIARIES
NOTES TO CONSOLIDATED FINANCIAL STATEMENTS - UNAUDITED
September 30, 2019
Note 5 Leases
Leases under which the Company is the lessee
The Company leases branches, office space and a small amount of equipment under either operatingsix months or finance leases with remaining terms ranging from one to 15 years, some of which include extension options.
The following table presents ROU assets and lease liabilities as of September 30, 2019 (in thousands):
|
| | | |
| | September 30, 2019 |
| ROU assets: | |
| Operating leases | $ | 92,797 |
|
| Finance leases | 6,509 |
|
| | $ | 99,306 |
|
| Lease liabilities: | |
| Operating leases | $ | 102,609 |
|
| Finance leases | 8,920 |
|
| | $ | 111,529 |
|
ROU assets and lease liabilities for operating leases are included in "other assets" and "other liabilities", respectively, in the accompanying Consolidated Balance Sheet. ROU assets and lease liabilities for finance leases are included in "other assets" and "notes and other borrowings", respectively.
The weighted average remaining lease term and weighted average discount rate at September 30, 2019 were:
|
| | |
Weighted average remaining lease term: | |
Operating lease | 7.71 years |
|
Finance lease | 6.07 years |
|
Weighted average discount rate: | |
Operating lease | 3.3 | % |
Finance lease | 11.7 | % |
The components of lease expense for the period indicated were (in thousands):
|
| | | | | | | |
| | Three Months Ended September 30, 2019 | | Nine Months Ended September 30, 2019 |
| Operating lease cost: | | | |
| Fixed costs | $ | 5,095 |
| | $ | 15,175 |
|
| Impairment of ROU assets | 631 |
| | 1,278 |
|
| Total operating lease cost | $ | 5,726 |
| | $ | 16,453 |
|
| | | | |
| Finance lease cost: | | | |
| Amortization of ROU assets | $ | 434 |
| | $ | 1,143 |
|
| Interest on lease liabilities | 256 |
| | 761 |
|
| Total finance lease cost | $ | 690 |
| | $ | 1,904 |
|
| | | | |
| Variable lease cost | $ | 1,036 |
| | $ | 3,016 |
|
BANKUNITED, INC. AND SUBSIDIARIES
NOTES TO CONSOLIDATED FINANCIAL STATEMENTS - UNAUDITED
September 30, 2019
Short-term lease cost and sublease income were immaterial for the three and nine months ended September 30, 2019.
Additional informationless) deferrals or modifications related to operating and finance leases for the periods indicated follows (in thousands):
|
| | | | | | | |
| | Three Months Ended September 30, 2019 | | Nine Months Ended September 30, 2019 |
| Cash paid for amounts included in the measurement of lease liabilities: | | | |
| Operating cash flows from finance leases | $ | 256 |
| | $ | 761 |
|
| Operating cash flows from operating leases | 5,225 |
| | 15,584 |
|
| Financing cash flows from finance leases | 579 |
| | 2,040 |
|
| | $ | 6,060 |
| | $ | 18,385 |
|
| | | | |
| Lease liabilities recognized from obtaining ROU assets: | | | |
| Operating lease liabilities recognized upon adoption of ASC 842 | $ | — |
| | $ | 104,064 |
|
| Operating leases | 10,114 |
| | 11,711 |
|
| Finance leases | 317 |
| | 1,838 |
|
| | $ | 10,431 |
| | $ | 117,613 |
|
Future lease payment obligations under leases with terms in excess of one year and a reconciliation to lease liabilitiesCOVID-19 will typically not be categorized as of September 30, 2019 follows (in thousands):
|
| | | | | | | | | | | |
| | Operating Leases | | Finance Leases | | Total |
| Years ending December 31: | | | | | |
| 2019 (excluding the nine months ended September 30, 2019) | $ | 5,190 |
| | $ | 469 |
| | $ | 5,659 |
|
| 2020 | 19,375 |
| | 2,564 |
| | 21,939 |
|
| 2021 | 17,747 |
| | 2,622 |
| | 20,369 |
|
| 2022 | 14,548 |
| | 2,053 |
| | 16,601 |
|
| 2023 | 12,479 |
| | 2,124 |
| | 14,603 |
|
| Thereafter | 47,266 |
| | 2,825 |
| | 50,091 |
|
| Total future minimum lease payments | 116,605 |
| | 12,657 |
| | 129,262 |
|
| Less: interest component | (13,996 | ) | | (3,737 | ) | | (17,733 | ) |
| Lease liabilities | $ | 102,609 |
| | $ | 8,920 |
| | $ | 111,529 |
|
BANKUNITED, INC. AND SUBSIDIARIES
NOTES TO CONSOLIDATED FINANCIAL STATEMENTS - UNAUDITED
September 30, 2019March 31, 2020
At December 31, 2018, future minimum rentals under non-cancelable operating leases with initial or remaining terms in excessDisclosures Prescribed by Legacy GAAP (Before Adoption of one year were as follows (in thousands):
|
| | | |
| Years ending December 31: | |
|
| 2019 | $ | 21,207 |
|
| 2020 | 17,629 |
|
| 2021 | 15,858 |
|
| 2022 | 12,114 |
|
| 2023 | 10,311 |
|
| Thereafter | 42,984 |
|
| | $ | 120,103 |
|
Leases under which the Company is the lessor
Through its commercial lending subsidiaries, Pinnacle and Bridge, the Bank provides equipment financing using a variety of loan and lease structures. Pinnacle provides essential use equipment financing to state and local governmental entities. Bridge provides primarily transportation equipment financing.ASU 2016-13) for Prior Periods
The following table presents information about the componentsbalance of the investment in direct or sales type financing leases, included inALLL and related loans in the Consolidated Balance Sheets, at the dates indicatedas of December 31, 2019 (in thousands):
|
| | | | | | | |
| | September 30, 2019 | | December 31, 2018 |
| Total minimum lease payments to be received | $ | 799,832 |
| | $ | 808,921 |
|
| Estimated unguaranteed residual value of leased assets | 8,471 |
| | 7,355 |
|
| Gross investment in direct or sales type financing leases | 808,303 |
| | 816,276 |
|
| Unearned income | (82,761 | ) | | (81,864 | ) |
| Initial direct costs | 4,484 |
| | 4,833 |
|
| | $ | 730,026 |
| | $ | 739,245 |
|
At September 30, |
| | | | | | | | | | | |
| | Residential and Other Consumer | | Commercial | | Total |
| Allowance for loan and lease losses: | | | | | |
| Ending balance | $ | 11,154 |
| | $ | 97,517 |
| | $ | 108,671 |
|
| Ending balance: loans individually evaluated for impairment | $ | 9 |
| | $ | 20,481 |
| | $ | 20,490 |
|
| Ending balance: loans collectively evaluated for impairment | $ | 11,145 |
| | $ | 77,036 |
| | $ | 88,181 |
|
| Ending balance: ACI loans | $ | — |
| | $ | — |
| | $ | — |
|
| Loans: | | | | | |
| Ending balance | $ | 5,661,119 |
| | $ | 17,493,869 |
| | $ | 23,154,988 |
|
| Ending balance: loans individually evaluated for impairment | $ | 57,117 |
| | $ | 187,788 |
| | $ | 244,905 |
|
| Ending balance: loans collectively evaluated for impairment | $ | 5,454,422 |
| | $ | 17,288,901 |
| | $ | 22,743,323 |
|
| Ending balance: ACI loans | $ | 149,580 |
| | $ | 17,180 |
| | $ | 166,760 |
|
The table below presents information about loans identified as impaired as of December 31, 2019 future minimum lease payments to be received under direct or sales type financing leases were as follows (in thousands):
|
| | | |
| Years Ending December 31: | |
| 2019 (excluding the nine months ended September 30, 2019) | $ | 35,849 |
|
| 2020 | 200,817 |
|
| 2021 | 141,337 |
|
| 2022 | 93,893 |
|
| 2023 | 72,586 |
|
| Thereafter | 255,350 |
|
| | $ | 799,832 |
|
|
| | | | | | | | | | | |
| | Recorded Investment | | UPB | | Related Specific Allowance |
| With no specific allowance recorded: | |
| | |
| | |
|
| 1-4 single family residential | $ | 992 |
| | $ | 989 |
| | $ | — |
|
| Government insured residential | 53,428 |
| | 53,350 |
| | — |
|
| Multi-family | 6,138 |
| | 6,169 |
| | — |
|
| Non-owner occupied commercial real estate | 38,345 |
| | 38,450 |
| | — |
|
| Construction and land | 3,191 |
| | 3,155 |
| | — |
|
| Owner occupied commercial real estate | 17,419 |
| | 17,488 |
| | — |
|
Commercial and industrial | 10,585 |
| | 10,574 |
| | — |
|
| Bridge - franchise finance | 4,115 |
| | 4,117 |
| | — |
|
| Bridge - equipment finance | 6,807 |
| | 6,793 |
| | — |
|
| With a specific allowance recorded: | | | | | |
| 1-4 single family residential | 2,697 |
| | 2,652 |
| | 9 |
|
| Owner occupied commercial real estate | 2,522 |
| | 2,509 |
| | 401 |
|
| Commercial and industrial | 63,531 |
| | 63,709 |
| | 13,992 |
|
| Bridge - franchise finance | 21,011 |
| | 21,050 |
| | 2,953 |
|
| Bridge - equipment finance | 14,124 |
| | 14,024 |
| | 3,135 |
|
| Total: | | | | | |
| Residential and other consumer | $ | 57,117 |
| | $ | 56,991 |
| | $ | 9 |
|
| Commercial | 187,788 |
| | 188,038 |
| | 20,481 |
|
| | $ | 244,905 |
| | $ | 245,029 |
| | $ | 20,490 |
|
BANKUNITED, INC. AND SUBSIDIARIES
NOTES TO CONSOLIDATED FINANCIAL STATEMENTS - UNAUDITED
September 30, 2019March 31, 2020
Equipment under operating lease consists primarily of railcars, non-commercial aircraft and other transportation equipment leased to commercial end users. Original lease terms generally range from three to ten years. Asset risk is evaluated and managed by a dedicated internal staff of seasoned equipment finance professionals with a broad depth and breadth of experience in the leasing business. Additionally, we have partnered with an industry leading, experienced service provider who provides fleet management and servicing relating to the railcar fleet. Residual risk is managed by setting appropriate residual values at inception and systematic reviews of residual values based on independent appraisals, performed at least annually. We endeavor to lease to a stable end-user base, maintain a relatively young and diversified fleet of assets and stagger lease maturities.
At September 30, 2019, scheduled minimum rental payments under operating leases were as follows (in thousands):
|
| | | |
| Years Ending December 31: | |
|
| 2019 (excluding the nine months ended September 30, 2019) | $ | 15,837 |
|
| 2020 | 58,339 |
|
| 2021 | 49,122 |
|
| 2022 | 42,335 |
|
| 2023 | 35,027 |
|
| Thereafter | 107,970 |
|
| | $ | 308,630 |
|
The following table summarizes lease income recognized for operating leases and direct or sales type finance leasespresents the average recorded investment in impaired loans for the periodsperiod indicated (in thousands):
|
| | | | | | | | | |
| | Three Months Ended September 30, 2019 | | Nine Months Ended September 30, 2019 | | Location of Lease Income on Consolidated Statements of Income |
| Operating leases | $ | 18,583 |
| | $ | 52,774 |
| | Non-interest income from lease financing |
| Direct or sales type finance leases | 5,683 |
| | 16,481 |
| | Interest income on loans |
| Total lease income | $ | 24,266 |
| | $ | 69,255 |
| | |
|
| | | |
| | Three Months Ended March 31, 2019 |
| Residential and other consumer: | |
|
| 1-4 single family residential | $ | 9,291 |
|
| Commercial: | |
| Multi-family | 25,429 |
|
| Non-owner occupied commercial real estate | 18,528 |
|
| Construction and land | 9,857 |
|
| Owner occupied commercial real estate | 11,507 |
|
| Commercial and industrial | 28,439 |
|
| Commercial lending subsidiaries | 21,883 |
|
| | 115,643 |
|
| | $ | 124,934 |
|
Note 65 Income Taxes
The Company’s effective income tax rate was 24.1%23.4% and 25.3%26.8% for the three and nine months ended September 30,March 31, 2020 and 2019, respectively, and 18.0% and 21.4% for the three and nine months ended September 30, 2018, respectively. The effective income tax rate differed from the statutory federal income tax rate of 21% for the three and nine months ended September 30,March 31, 2020 and 2019 and 2018 due primarily to the impact of state income taxes, partially offset by the benefit of income not subject to federal tax. The Company considered the impact of the COVID-19 situation in its evaluation of the realizability of deferred tax assets at March 31, 2020. Due primarily to the forecasted reversal of existing temporary differences and tax loss carryback capacity, the Company concluded that the deferred tax asset was realizable.
Note 76 Derivatives and Hedging Activities
The Company uses interest rate swaps to manage interest rate risk related to liabilities that expose the Company to variability in cash flows due to changes in interest rates. The Company enters into LIBOR-based interest rate swaps that are designated as cash flow hedges with the objective of limiting the variability of interest payment cash flows resulting from changes in the benchmark interest rate LIBOR. Changes in the fair value ofThe Company also enters into LIBOR-based interest rate swaps designated as cash flow hedging instruments are reported in AOCI and subsequently reclassified into interest expense in the same period in which the related interest on the floating-rate debt obligations affects earnings.
The Company also enters into interest rate swapsfair value hedges designed to hedge changes in the fair value of outstanding fixed rate borrowings caused by fluctuations in the benchmark interest rates; these instruments are designated as fair value hedges. Changes in the fair value of interest rate swaps designated as fair value hedging instruments as well as changes in the fair value of the hedged items caused by fluctuations in interest rates are recognized in earnings.rate.
The Company also enters into interest rate derivative contracts with certain of its commercial borrowers to enable those borrowers to manage their exposure to interest rate fluctuations. To mitigate interest rate risk associated with these derivative contracts, the Company enters into offsetting derivative contract positions with primary dealers. These interest rate derivative contracts are not designated as hedging instruments; therefore, changes in the fair value of these derivatives are recognized
BANKUNITED, INC. AND SUBSIDIARIES
NOTES TO CONSOLIDATED FINANCIAL STATEMENTS - UNAUDITED
September 30, 2019
immediately in earnings. TheFor the three months ended March 31, 2020 and 2019, the impact on earnings, included in "other non-interest income" in the accompanying consolidated statements of income, related to changes in fair value of these derivatives was $1.3 million and $4.3 million, respectively, for the three and nine months ended September 30, 2019 and $0.5 million and $1.2 million, respectively, for the three and nine months ended September 30, 2018.not material.
The Company may be exposed to credit risk in the event of non-performance by the counterparties to its interest rate derivative agreements. The Company assesses the credit risk of its financial institution counterparties by monitoring publicly available credit rating and financial information. The Company manages dealer credit risk by entering into interest rate derivatives only with primary and highly rated counterparties, the use of ISDA master agreements, central clearing mechanisms and counterparty limits. The agreements contain bilateral collateral arrangements with the amount of collateral to be posted generally governed by the settlement value of outstanding swaps. The Company manages the risk of default by its commercial borrower counterparties through its normal loan underwriting and credit monitoring policies and procedures. The Company does not currently anticipate any losses from failure of interest rate derivative counterparties to honor their obligations.
The CME legally characterizes variation margin payments for centrally cleared derivatives as settlements of the derivatives' exposures rather than collateral. As a result, the variation margin payment and the related derivative instruments are considered a single unit of account for accounting and financial reporting purposes. The Company's clearing agent for interest rate derivative contracts centrally cleared through the CME settles the variation margin daily with the CME; therefore, those
BANKUNITED, INC. AND SUBSIDIARIES
NOTES TO CONSOLIDATED FINANCIAL STATEMENTS - UNAUDITED
March 31, 2020
interest rate derivative contracts the Company clears through the CME are reported at a fair value of approximately 0 at September 30, 2019both March 31, 2020 and December 31, 2018.2019.
The following tables set forth certain information concerning the Company’s interest rate contract derivative financial instruments and related hedged items at the dates indicated (dollars in thousands):
| | | | September 30, 2019 | March 31, 2020 |
| | | Weighted Average Pay Rate | | Weighted Average Receive Rate | | Weighted Average Remaining Life in Years | | | | | | Weighted Average Pay Rate | | Weighted Average Receive Rate | | Weighted Average Remaining Life in Years | | | | |
| | | | Notional Amount | | Balance Sheet Location | | Fair Value | | | Notional Amount | | Balance Sheet Location | | Fair Value |
| | Hedged Item | | Asset | | Liability | Hedged Item | | Asset | | Liability |
| Derivatives designated as cash flow hedges: | | | | | | | | | |
| | | | |
| | |
| | | | | | | | | |
| | | | |
| | |
|
| Pay-fixed interest rate swaps | Variability of interest cash flows on variable rate borrowings | | 2.37% | | 3-Month Libor | | 3.4 | | $ | 3,131,000 |
| | Other liabilities | | $ | — |
| | $ | (2,427 | ) | Variability of interest cash flows on variable rate borrowings | | 2.38% | | 3-Month LIBOR | | 2.9 | | $ | 3,091,000 |
| | Other liabilities | | $ | — |
| | $ | (6,661 | ) |
| Derivatives designated as fair value hedges: | | | | | | | | | | | | |
| Receive-fixed interest rate swaps | Variability of fair value of fixed rate borrowings | | 3-Month Libor | | 1.55% | | 1.8 | | 250,000 |
| | Other liabilities | | — |
| | — |
| Variability of fair value of fixed rate borrowings | | 3-Month LIBOR | | 1.55% | | 1.3 | | 250,000 |
| | Other liabilities | | — |
| | — |
|
| Derivatives not designated as hedges: | | | | | | | | | | | | | | |
| Pay-fixed interest rate swaps | | | 3.99% | | Indexed to 1-month Libor | | 6.0 | | 1,182,804 |
| | Other assets / Other liabilities | | 291 |
| | (21,229 | ) | | | 3.70% | | Indexed to 1-month LIBOR | | 6.2 | | 1,485,199 |
| | Other assets / Other liabilities | | — |
| | (42,312 | ) |
| Pay-variable interest rate swaps | | | Indexed to 1-month Libor | | 3.99% | | 6.0 | | 1,182,804 |
| | Other assets / Other liabilities | | 56,287 |
| | (305 | ) | | | Indexed to 1-month LIBOR | | 3.70% | | 6.2 | | 1,485,199 |
| | Other assets / Other liabilities | | 135,720 |
| | — |
|
| Interest rate caps purchased, indexed to 1-month Libor | | 3.52% | | 0.7 | | 88,221 |
| | Other assets | | 2 |
| | — |
| |
| Interest rate caps sold, indexed to 1-month Libor | | 3.52% | | 0.7 | | 88,221 |
| | Other liabilities | | — |
| | (2 | ) | |
| Interest rate caps purchased, indexed to 1-month LIBOR | | | 3.71% | | 1.2 | | 26,023 |
| | Other assets | | — |
| | — |
|
| Interest rate caps sold, indexed to 1-month LIBOR | | | 3.71% | | 1.2 | | 26,023 |
| | Other liabilities | | — |
| | — |
|
| | | | $ | 5,923,050 |
| | $ | 56,580 |
| | $ | (23,963 | ) | | | $ | 6,363,444 |
| | $ | 135,720 |
| | $ | (48,973 | ) |
BANKUNITED, INC. AND SUBSIDIARIES
NOTES TO CONSOLIDATED FINANCIAL STATEMENTS - UNAUDITED
September 30, 2019March 31, 2020
| | | | December 31, 2018 | December 31, 2019 |
| | | Weighted Average Pay Rate | | Weighted Average Receive Rate | | Weighted Average Remaining Life in Years | | | | | | Weighted Average Pay Rate | | Weighted Average Receive Rate | | Weighted Average Remaining Life in Years | | | | |
| | | | Notional Amount | | Balance Sheet Location | | Fair Value | | | Notional Amount | | Balance Sheet Location | | Fair Value |
| | Hedged Item | | Asset | | Liability | Hedged Item | | Asset | | Liability |
| Derivatives designated as cash flow hedges: | | | | | | | | | |
| | | | |
| | |
| | | | | | | | | |
| | | | |
| | |
|
| Pay-fixed interest rate swaps | Variability of interest cash flows on variable rate borrowings | | 2.38% | | 3-Month Libor | | 4.0 | | $ | 2,846,000 |
| | Other assets / Other liabilities | | $ | 3,405 |
| | $ | — |
| Variability of interest cash flows on variable rate borrowings | | 2.37% | | 3-Month LIBOR | | 3.2 | | $ | 3,131,000 |
| | Other liabilities | | $ | — |
| | $ | (1,607 | ) |
| Derivatives not designated as hedges: | | |
| |
| |
| |
|
| |
|
| | | | |
| |
| |
| |
|
| |
|
| | |
| Receive-fixed interest rate swaps | | Variability of interest cash flows on fixed rate borrowings | | 3-Month LIBOR | | 1.55% | | 1.6 | | 250,000 |
| | Other liabilities | | — |
| | — |
|
| Derivatives not designated as hedges | | | | | | | |
| Pay-fixed interest rate swaps | | | 4.10% | | Indexed to 1-month Libor | | 6.0 | | 1,048,196 |
| | Other assets / Other liabilities | | 14,883 |
| | (6,991 | ) | | | 3.72% | | Indexed to 1-month LIBOR | | 6.4 | | 1,460,355 |
| | Other assets / Other liabilities | | 876 |
| | (15,307 | ) |
| Pay-variable interest rate swaps | | | Indexed to 1-month Libor | | 4.10% | | 6.0 | | 1,048,196 |
| | Other assets / Other liabilities | | 11,318 |
| | (16,874 | ) | | | Indexed to 1-month LIBOR | | 3.72% | | 6.4 | | 1,460,355 |
| | Other assets / Other liabilities | | 42,810 |
| | (2,115 | ) |
| Interest rate caps purchased, indexed to 1-month Libor | |
| | 3.43% | | 1.2 | | 98,407 |
| | Other assets | | 9 |
| | — |
| |
| Interest rate caps sold, indexed to 1-month Libor | | 3.43% | | 1.2 | | 98,407 |
| | Other liabilities | | — |
| | (9 | ) | |
| Interest rate caps purchased, indexed to 1-month LIBOR | | |
| | 3.30% | | 0.6 | | 61,004 |
| | Other assets | | — |
| | — |
|
| Interest rate caps sold, indexed to 1-month LIBOR | | | 3.30% | | 0.6 | | 61,004 |
| | Other liabilities | | — |
| | — |
|
| | | | $ | 5,139,206 |
| | $ | 29,615 |
| | $ | (23,874 | ) | | | $ | 6,423,718 |
| | $ | 43,686 |
| | $ | (19,029 | ) |
The following table provides information about the amount of gain (loss) related to derivatives designated as cash flow hedges reclassified from AOCI into interest expense for the periods indicated (in thousands):
|
| | | | | | | | | | | | | | | | | |
| | Three Months Ended September 30, | | Nine Months Ended September 30, | | Location of Gain Reclassified from AOCI into Income |
| | 2019 | | 2018 | | 2019 | | 2018 | |
| Interest rate contracts | $ | 509 |
| | $ | 1,050 |
| | $ | 4,920 |
| | $ | 839 |
| | Interest expense on borrowings |
|
| | | | | | | | |
| | Three Months Ended March 31, | |
| | 2020 | | 2019 | Location of Gain (Loss) Reclassified from AOCI into Income |
| Interest rate contracts | $ | (4,556 | ) | | $ | 2,723 |
| Interest expense on borrowings |
During the three and nine months ended September 30,March 31, 2020 and 2019, and 2018, no derivative positions designated as cash flow hedges were discontinued and none of the gains and losses reported in AOCI were reclassified into earnings as a result of the discontinuance of cash flow hedges or because of the early extinguishment of debt. As of September 30, 2019,March 31, 2020, the amount of net loss expected to be reclassified from AOCI into earnings during the next twelve months was $17.7$53.2 million.
The following table provides information about the amount of gain (loss) related to derivatives designated as fair value hedges recognized in earnings for the periods indicated (in thousands):
| | | | Three Months Ended September 30, | | Nine Months Ended September 30, | | Location of Loss in Consolidated Statements of Income | Three Months Ended March 31, | |
| | 2019 | | 2018 | | 2019 | | 2018 | | 2020 | | 2019 | Location of Gain (Loss) in Consolidated Statements of Income |
| Fair value adjustment on derivatives | $ | (382 | ) | | $ | — |
| | $ | (382 | ) | | $ | — |
| | Interest expense on borrowings | $ | 4,020 |
| | $ | — |
| Interest expense on borrowings |
| Fair value adjustment on hedged items | 362 |
| | — |
| | 362 |
| | — |
| | Interest expense on borrowings | (3,908 | ) | | — |
| Interest expense on borrowings |
| Loss recognized on fair value hedges (ineffective portion) | $ | (20 | ) | | $ | — |
| | $ | (20 | ) | | $ | — |
| | |
| Gain recognized on fair value hedges (ineffective portion) | | $ | 112 |
| | $ | — |
| |
BANKUNITED, INC. AND SUBSIDIARIES
NOTES TO CONSOLIDATED FINANCIAL STATEMENTS - UNAUDITED
March 31, 2020
The following table provides information about the hedged items related to derivatives designated as fair value hedges at the dates indicated (in thousands):
| | | | September 30, 2019 | | December 31, 2018 | | Location in Consolidated Balance Sheets | March 31, 2020 | | December 31, 2019 | | Location in Consolidated Balance Sheets |
| Carrying value of hedged item | $ | 250,000 |
| | $ | — |
| | Federal Home Loan Bank advances | |
Contractual balance outstanding of hedged item | | $ | 250,000 |
| | $ | 250,000 |
| | Federal Home Loan Bank advances |
| Cumulative fair value hedging adjustments | $ | (362 | ) | | $ | — |
| | Federal Home Loan Bank advances | $ | 3,409 |
| | $ | (499 | ) | | Federal Home Loan Bank advances |
BANKUNITED, INC. AND SUBSIDIARIES
NOTES TO CONSOLIDATED FINANCIAL STATEMENTS - UNAUDITED
September 30, 2019
Some of the Company’s ISDA master agreements with financial institution counterparties contain provisions that permit either counterparty to terminate the agreements and require settlement in the event that regulatory capital ratios fall below certain designated thresholds, upon the initiation of other defined regulatory actions or upon suspension or withdrawal of the Bank’s credit rating. Currently, there are no circumstances that would trigger these provisions of the agreements.
The Company does not offset assets and liabilities under master netting agreements for financial reporting purposes. Information on interest rate swaps subject to these agreements is as follows at the dates indicated (in(dollars in thousands):
| | | | September 30, 2019 | March 31, 2020 |
| | |
| Gross Amounts Offset in Balance
Sheet |
| Net Amounts Presented in
Balance Sheet |
| Gross Amounts Not Offset in Balance Sheet |
| | |
| Gross Amounts Offset in Balance
Sheet |
| Net Amounts Presented in
Balance Sheet |
| Gross Amounts Not Offset in Balance Sheet |
| |
| | Gross Amounts Recognized |
| Derivative Instruments |
| Collateral Pledged |
| Net Amount | Gross Amounts Recognized |
| Derivative Instruments |
| Collateral Pledged |
| Net Amount |
| Derivative assets | $ | 299 |
| | $ | — |
| | $ | 299 |
| | $ | (299 | ) | | $ | — |
| | $ | — |
| $ | — |
| | $ | — |
| | $ | — |
| | $ | — |
| | $ | — |
| | $ | — |
|
| Derivative liabilities | (23,656 | ) | | — |
| | (23,656 | ) | | 299 |
| | 23,441 |
| | 84 |
| (48,973 | ) | | — |
| | (48,973 | ) | | — |
| | 48,548 |
| | (425 | ) |
| | $ | (23,357 | ) | | $ | — |
| | $ | (23,357 | ) | | $ | — |
| | $ | 23,441 |
| | $ | 84 |
| $ | (48,973 | ) | | $ | — |
| | $ | (48,973 | ) | | $ | — |
| | $ | 48,548 |
| | $ | (425 | ) |
| | | | December 31, 2018 | December 31, 2019 |
| | | | Gross Amounts Offset in Balance
Sheet | | Net Amounts Presented in
Balance Sheet | | Gross Amounts Not Offset in Balance Sheet | | | | | Gross Amounts Offset in Balance
Sheet | | Net Amounts Presented in
Balance Sheet | | Gross Amounts Not Offset in Balance Sheet | | |
| | Gross Amounts Recognized | | Derivative Instruments | | Collateral Pledged | | Net Amount | Gross Amounts Recognized | | Derivative Instruments | | Collateral Pledged | | Net Amount |
| Derivative assets | $ | 18,297 |
| | $ | — |
| | $ | 18,297 |
| | $ | (5,264 | ) | | $ | (13,129 | ) | | $ | (96 | ) | $ | 876 |
| | $ | — |
| | $ | 876 |
| | $ | (876 | ) | | $ | — |
| | $ | — |
|
| Derivative liabilities | (6,991 | ) | | — |
| | (6,991 | ) | | 5,264 |
| | 436 |
| | (1,291 | ) | (16,914 | ) | | — |
| | (16,914 | ) | | 876 |
| | 16,038 |
| | — |
|
| | $ | 11,306 |
| | $ | — |
| | $ | 11,306 |
| | $ | — |
| | $ | (12,693 | ) | | $ | (1,387 | ) | $ | (16,038 | ) | | $ | — |
| | $ | (16,038 | ) | | $ | — |
| | $ | 16,038 |
| | $ | — |
|
The difference between the amounts reported for interest rate swaps subject to master netting agreements and the total fair value of interest rate contract derivative financial instruments reported in the consolidated balance sheets is related to interest rate derivative contracts entered into with borrowers not subject to master netting agreements.
At September 30, 2019,March 31, 2020, the Company had pledged net financial collateral of $25.0$53.2 million as collateral for interest rate swaps in a liability position that are not centrally cleared. The amount of collateral required to be posted varies based on the settlement value of outstanding swaps and in some cases may include initial margin requirements.
BANKUNITED, INC. AND SUBSIDIARIES
NOTES TO CONSOLIDATED FINANCIAL STATEMENTS - UNAUDITED
September 30, 2019March 31, 2020
Note 87 Stockholders’ Equity
Accumulated Other Comprehensive Income
Changes in other comprehensive income are summarized as follows for the periods indicated (in thousands):
|
| | | | | | | | | | | | | | | | | | | | | | | |
| | Three Months Ended September 30, |
| | 2019 | | 2018 |
| | Before Tax | | Tax Effect | | Net of Tax | | Before Tax | | Tax Effect | | Net of Tax |
| Unrealized gains on investment securities available for sale: | |
| | |
| | |
| | | | | | |
| Net unrealized holding gain (loss) arising during the period | $ | 11,372 |
| | $ | (3,014 | ) | | $ | 8,358 |
| | $ | (24,690 | ) | | $ | 6,543 |
| | $ | (18,147 | ) |
| Amounts reclassified to gain on investment securities available for sale, net | (3,426 | ) | | 908 |
| | (2,518 | ) | | (520 | ) | | 138 |
| | (382 | ) |
| Net change in unrealized gains on investment securities available for sale | 7,946 |
| | (2,106 | ) | | 5,840 |
| | (25,210 | ) | | 6,681 |
| | (18,529 | ) |
| Unrealized losses on derivative instruments: | | | | | | | | | | | |
| Net unrealized holding gain (loss) arising during the period | (22,822 | ) | | 6,048 |
| | (16,774 | ) | | 14,335 |
| | (3,799 | ) | | 10,536 |
|
| Amounts reclassified to interest expense on borrowings | (509 | ) | | 135 |
| | (374 | ) | | (1,050 | ) | | 278 |
| | (772 | ) |
| Net change in unrealized losses on derivative instruments | (23,331 | ) | | 6,183 |
| | (17,148 | ) | | 13,285 |
| | (3,521 | ) | | 9,764 |
|
| Other comprehensive loss | $ | (15,385 | ) | | $ | 4,077 |
| | $ | (11,308 | ) | | $ | (11,925 | ) | | $ | 3,160 |
| | $ | (8,765 | ) |
| | | | Nine Months Ended September 30, | Three Months Ended March 31, |
| | 2019 | | 2018 | 2020 | | 2019 |
| | Before Tax | | Tax Effect | | Net of Tax | | Before Tax | | Tax Effect | | Net of Tax | Before Tax | | Tax Effect | | Net of Tax | | Before Tax | | Tax Effect | | Net of Tax |
| Unrealized gains on investment securities available for sale: | |
| | |
| | |
| | | | | | | |
| Unrealized gains (losses) on investment securities available for sale: | | |
| | |
| | |
| | | | | | |
| Net unrealized holding gain (loss) arising during the period | $ | 72,519 |
| | $ | (19,218 | ) | | $ | 53,301 |
| | $ | (79,697 | ) | | $ | 21,120 |
| | $ | (58,577 | ) | $ | (286,636 | ) | | $ | 73,476 |
| | $ | (213,160 | ) | | $ | 29,411 |
| | $ | (7,794 | ) | | $ | 21,617 |
|
| Amounts reclassified to gain on investment securities available for sale, net | (11,657 | ) | | 3,089 |
| | (8,568 | ) | | (4,047 | ) | | 1,073 |
| | (2,974 | ) | (1,530 | ) | | 390 |
| | (1,140 | ) | | (4,317 | ) | | 1,144 |
| | (3,173 | ) |
| Net change in unrealized gains on investment securities available for sale | 60,862 |
| | (16,129 | ) | | 44,733 |
| | (83,744 | ) | | 22,193 |
| | (61,551 | ) | |
| Net change in unrealized gains (losses) on investment securities available for sale | | (288,166 | ) | | 73,866 |
| | (214,300 | ) | | 25,094 |
| | (6,650 | ) | | 18,444 |
|
| Unrealized losses on derivative instruments: | | | | | | | | | | | | | | | | | | | | | | |
| Net unrealized holding gain (loss) arising during the period | (101,588 | ) | | 26,921 |
| | (74,667 | ) | | 54,660 |
| | (14,485 | ) | | 40,175 |
| |
| Net unrealized holding loss arising during the period | | (109,951 | ) | | 29,137 |
| | (80,814 | ) | | (28,129 | ) | | 7,454 |
| | (20,675 | ) |
| Amounts reclassified to interest expense on borrowings | (4,920 | ) | | 1,304 |
| | (3,616 | ) | | (839 | ) | | 222 |
| | (617 | ) | 4,556 |
| | (1,207 | ) | | 3,349 |
| | (2,723 | ) | | 722 |
| | (2,001 | ) |
| Net change in unrealized losses on derivative instruments | (106,508 | ) | | 28,225 |
| | (78,283 | ) | | 53,821 |
| | (14,263 | ) | | 39,558 |
| (105,395 | ) | | 27,930 |
| | (77,465 | ) | | (30,852 | ) | | 8,176 |
| | (22,676 | ) |
| Other comprehensive loss | $ | (45,646 | ) | | $ | 12,096 |
| | $ | (33,550 | ) | | $ | (29,923 | ) | | $ | 7,930 |
| | $ | (21,993 | ) | $ | (393,561 | ) | | $ | 101,796 |
| | $ | (291,765 | ) | | $ | (5,758 | ) | | $ | 1,526 |
| | $ | (4,232 | ) |
BANKUNITED, INC. AND SUBSIDIARIES
NOTES TO CONSOLIDATED FINANCIAL STATEMENTS - UNAUDITED
September 30, 2019
The categories of AOCI and changes therein are presented below for the periods indicated (in thousands):
|
| | | | | | | | | | | |
| | Unrealized Gain (Loss) on Investment Securities Available for Sale | | Unrealized Gain (Loss) on Derivative Instruments | | Total |
| Balance at December 31, 2018 | $ | 4,194 |
| | $ | 679 |
| | $ | 4,873 |
|
| Other comprehensive loss | 44,733 |
| | (78,283 | ) | | (33,550 | ) |
| Balance at September 30, 2019 | $ | 48,927 |
| | $ | (77,604 | ) | | $ | (28,677 | ) |
| | | | | | |
| Balance at December 31, 2017 | $ | 56,534 |
| | $ | (1,548 | ) | | $ | 54,986 |
|
| Cumulative effect of adoption of new accounting standards | 9,187 |
| | (285 | ) | | 8,902 |
|
| Other comprehensive loss | (61,551 | ) | | 39,558 |
| | (21,993 | ) |
| Balance at September 30, 2018 | $ | 4,170 |
| | $ | 37,725 |
| | $ | 41,895 |
|
|
| | | | | | | | | | | |
| | Unrealized Gain (Loss) on Investment Securities Available for Sale | | Unrealized Gain (Loss) on Derivative Instruments | | Total |
| Balance at December 31, 2019 | $ | 28,185 |
| | (60,012 | ) | | $ | (31,827 | ) |
| Other comprehensive loss | (214,300 | ) | | (77,465 | ) | | (291,765 | ) |
| Balance at March 31, 2020 | $ | (186,115 | ) | | $ | (137,477 | ) | | $ | (323,592 | ) |
| | | | | | |
| Balance at December 31, 2018 | $ | 4,194 |
| | $ | 679 |
| | $ | 4,873 |
|
| Other comprehensive loss | 18,444 |
| | (22,676 | ) | | (4,232 | ) |
| Balance at March 31, 2019 | $ | 22,638 |
| | $ | (21,997 | ) | | $ | 641 |
|
Other
In January 2019, the Company's Board of Directors authorized a now completed share repurchase program under which the Company repurchased approximately 4.4 million shares of its common stock during the nine months ended September 30, 2019 for an aggregate purchase price of $150 million, at a weighted average price of $34.39 per share.
In September 2019, the Company's Board of Directors authorized a new share repurchase program under which the Company may repurchase up to an additional $150 million in shares of its outstanding common stock. Any repurchases will be made in accordance with applicable securities laws from time to time in open market or private transactions. The extent to which the Company repurchases shares, and the timing of such repurchases, will depend upon a variety of factors, including market conditions, the Company's capital position and amount of retained earnings, regulatory requirements and other considerations. No time limit was set for completion of the share repurchase program and the program may be suspended or discontinued at any time.
Note 98 Equity Based and Other Compensation Plans
Share Awards
Unvested share awards
A summary of activity related to unvested share awards follows for the periods indicated:
|
| | | | | | |
| | Number of Share Awards | | Weighted Average Grant Date Fair Value |
| Unvested share awards outstanding, December 31, 2018 | 1,186,238 |
| | $ | 38.86 |
|
| Granted | 590,572 |
| | 36.50 |
|
| Vested | (548,762 | ) | | 37.57 |
|
| Canceled or forfeited | (149,770 | ) | | 38.99 |
|
| Unvested share awards outstanding, September 30, 2019 | 1,078,278 |
| | $ | 38.21 |
|
| |
|
| |
|
|
| Unvested share awards outstanding, December 31, 2017 | 1,108,477 |
| | $ | 36.06 |
|
| Granted | 652,685 |
| | 40.33 |
|
| Vested | (529,469 | ) | | 34.64 |
|
| Canceled or forfeited | (72,465 | ) | | 38.77 |
|
| Unvested share awards outstanding, September 30, 2018 | 1,159,228 |
| | $ | 38.94 |
|
BANKUNITED, INC. AND SUBSIDIARIES
NOTES TO CONSOLIDATED FINANCIAL STATEMENTS - UNAUDITED
September 30, 2019
|
| | | | | | |
| | Number of Share Awards | | Weighted Average Grant Date Fair Value |
| Unvested share awards outstanding, December 31, 2019 | 1,050,455 |
| | $ | 38.24 |
|
| Granted | 599,766 |
| | 30.90 |
|
| Vested | (430,840 | ) | | 39.36 |
|
| Canceled or forfeited | (3,308 | ) | | 38.58 |
|
| Unvested share awards outstanding, March 31, 2020 | 1,216,073 |
| | $ | 34.22 |
|
| | | | |
| Unvested share awards outstanding, December 31, 2018 | 1,186,238 |
| | 38.86 |
|
| Granted | 563,970 |
| | 36.65 |
|
| Vested | (505,438 | ) | | 37.80 |
|
| Canceled or forfeited | (25,930 | ) | | 39.93 |
|
| Unvested share awards outstanding, March 31, 2019 | 1,218,840 |
| | $ | 38.25 |
|
Unvested share awards are generally valued at the closing price of the Company's common stock on the date of grant. All shares granted prior to 2019 vest in equal annual installments over a period of three years from the date of grant. All shares granted in 2019 and 2020 to Company employees vest in equal annual installments over a period of four years from the date of grant. Shares granted to the Company's Board of Directors vest over a period of one year.
The following table summarizes the closing price of the Company's stock on the date of grant for shares granted and the aggregate grant date fair value of shares vesting for the periods indicated (in thousands, except per share data):
|
| | | | | | | |
| | Nine Months Ended September 30, |
| | 2019 | | 2018 |
| Range of the closing price on date of grant | $31.07 - $36.65 |
| | $39.04 - $42.80 |
|
| Aggregate grant date fair value of shares vesting | $ | 20,616 |
| | $ | 18,341 |
|
|
| | | | | | | |
| | Three Months Ended March 31, |
| | 2020 | | 2019 |
| Closing price on date of grant | $ | 30.90 |
| | $ | 36.65 |
|
| Aggregate grant date fair value of shares vesting | $ | 16,958 |
| | $ | 19,105 |
|
The total unrecognized compensation cost of $27.4$33.0 million for all unvested share awards outstanding at September 30, 2019March 31, 2020 will be recognized over a weighted average remaining period of 2.302.92 years.
Executive share-based awards
Certain of the Company's executives are eligible to receive annual awards of RSUs and PSUs (collectively, the "share units"). Annual awards of RSUs represent a fixed number of shares and vest on December 31st in equal tranches over three years for awards issuedgrants prior to 2019, and over four years for awards issued in 2019.2019 and 2020. PSUs are initially granted based on a target value. The number of PSUs that ultimately vest at the end of the performance measurement period will be based on the achievement of performance criteria pre-established by the Compensation Committee of the Board of Directors. The performance criteria established for the PSUs granted in 2019, 2018 and 2017 include both performance and market conditions. Upon vesting, the share units will be converted to common stock on a one-for-one basis, or may be settled in cash at the Company's option. The share units will accumulate dividends declared on the Company's common stock from the date of grant to be paid subsequent to vesting.
The Company has cash settled all tranches of RSUs and PSUs that have vested through December 31, 2018. As a result of the majority of previous settlements being in cash, settlements, all RSUs and PSUs have been determined to be liability instruments and are remeasured at fair value each reporting period until the awards are settled. The RSUs are valued based on the closing price of the Company's common stock at the reporting date. The PSUs are valued based on the closing price of the
BANKUNITED, INC. AND SUBSIDIARIES
NOTES TO CONSOLIDATED FINANCIAL STATEMENTS - UNAUDITED
March 31, 2020
Company's common stock at the reporting date net of a discount related to any applicable market conditions, considering the probability of meeting the defined performance conditions. Compensation cost related to PSUs is recognized during the performance period based on the probable outcome of the respective performance conditions.
A summary of activity related to executive share-based awards for the periodsperiod indicatedfollows:
|
| | | | | |
| | RSU | | PSU |
| Unvested executive share-based awards outstanding, December 31, 2018 | 90,612 |
| | 99,874 |
|
| Granted | 73,062 |
| | 73,062 |
|
| Unvested executive share-based awards outstanding, September 30, 2019 | 163,674 |
| | 172,936 |
|
| | | | |
| Unvested executive share-based awards outstanding, December 31, 2017 | 91,168 |
| | 105,721 |
|
| Granted | 52,026 |
| | 52,026 |
|
| Unvested executive share-based awards outstanding, September 30, 2018 | 143,194 |
| | 157,747 |
|
|
| | | | | |
| | RSU | | PSU |
| Unvested executive share-based awards outstanding, December 31, 2019 | 112,116 |
| | 125,088 |
|
| Granted | 106,731 |
| | 106,731 |
|
| Unvested executive share-based awards outstanding, March 31, 2020 | 218,847 |
| | 231,819 |
|
| | | | |
| Unvested executive share-based awards outstanding, December 31, 2018 | 90,612 |
| | 99,874 |
|
| Granted | 73,062 |
| | 73,062 |
|
| Unvested executive share-based awards outstanding, March 31, 2019 | 163,674 |
| | 172,936 |
|
The total liability for these executive share-based awardsthe share units was $5.0$2.8 million at September 30, 2019.March 31, 2020. The total unrecognized compensation cost of $6.3$8.2 million for unvested executive share-based awardsthese share units at September 30, 2019March 31, 2020 will be recognized over a weighted average remaining period of 2.182.74 years.
BANKUNITED, INC. AND SUBSIDIARIES
NOTES TO CONSOLIDATED FINANCIAL STATEMENTS - UNAUDITED
September 30, 2019
Incentive awards
The Company's annual incentive compensation arrangements for employees other than those eligible for the executive share-based awards discussed above provide for settlement through a combination of cash payments and unvested share awards following the end of the annual performance period. The dollar value of share awards to be granted is based on the achievement of performance criteria established in the incentive arrangements. The number of shares of common stock to be awarded is variable based on the closing price of the Company's stock on the date of grant; therefore, these awards are initially classified as liability instruments, with compensation cost recognized from the beginning of the performance period. Awards related to performance periods prior to 2019 included in the summary of activity related to unvested share awards above, vest overthree years and awards related to the 2019 and 2020 performance period willperiods vest in equal installments over a period of four years from the date of grant. These awards are included in the summary of activity related to unvested share awards above. The total liability for incentive share awards for the 20192020 performance period was $0.6$0.3 million at September 30, 2019.March 31, 2020. The related total unrecognized compensation cost of $3.4$5.6 million for these incentive share awards at September 30, 2019March 31, 2020 will be recognized over a weighted average remaining period of 4.264.76 years. The accrued liability and unrecognized compensation cost are based on management's current estimate of the likely outcome of the performance criteria established in the incentive arrangements and may differ from actual results.
The 590,572599,766 unvested share awards granted during the ninethree months ended September 30, 2019,March 31, 2020, as discussed above, included 60,290114,936 unvested share awards granted under the Company's annual incentive compensation arrangements based on the achievement of established performance criteria for the year ended December 31, 2018.2019.
BANKUNITED, INC. AND SUBSIDIARIES
NOTES TO CONSOLIDATED FINANCIAL STATEMENTS - UNAUDITED
March 31, 2020
Option Awards
A summary of activity related to stock option awards for the ninethree months ended September 30,March 31, 2020 and 2019 and 2018 follows:
|
| | | | | | |
| | Number of Option Awards | | Weighted Average Exercise Price |
| Option awards outstanding, December 31, 2018 | 964,840 |
| | $ | 26.53 |
|
| Exercised | (26,043 | ) | | 20.63 |
|
| Canceled or forfeited | (1,960 | ) | | 63.74 |
|
| Option awards outstanding and exercisable, September 30, 2019 | 936,837 |
| | $ | 26.62 |
|
| |
|
| |
|
|
| Option awards outstanding, December 31, 2017 | 1,270,688 |
| | $ | 26.93 |
|
| Exercised | (291,689 | ) | | 26.49 |
|
| Option awards outstanding, September 30, 2018 | 978,999 |
| | $ | 27.07 |
|
|
| | | | | | |
| | Number of Option Awards | | Weighted Average Exercise Price |
| Option awards outstanding, December 31, 2019 | 737,753 |
| | $ | 26.64 |
|
| Exercised | (60,000 | ) | | 25.48 |
|
| Option awards outstanding and exercisable, March 31, 2020 | 677,753 |
| | $ | 26.74 |
|
| | | | |
| Option awards outstanding, December 31, 2018 | 964,840 |
| | 26.53 |
|
| Exercised | (3,910 | ) | | 11.14 |
|
| Canceled or forfeited | (1,960 | ) | | 63.74 |
|
| Option awards outstanding, March 31, 2019 | 958,970 |
| | $ | 26.52 |
|
The intrinsic value of options exercised and related tax benefits was $0.4 million and $4.6 million, respectively, duringimmaterial for the ninethree months ended September 30, 2019March 31, 2020 and 2018. The related tax benefit of options exercised was not significant for the nine months ended September 30, 2019 and was $1.1 million for the nine months ended September 30, 2018.2019.
Note 109 Fair Value Measurements
Assets and liabilities measured at fair value on a recurring basis
Following is a description of the methodologies used to estimate the fair values of assets and liabilities measured at fair value on a recurring basis and the level within the fair value hierarchy in which those measurements are typically classified.
Investment securities available for sale and marketable equity securities—Fair value measurements are based on quoted prices in active markets when available; these measurements are classified within level 1 of the fair value hierarchy. These securities typically include U.S. Treasury securities and certain preferred stocks. If quoted prices in active markets are not available, fair values are estimated using quoted prices of securities with similar characteristics, quoted prices of identical securities in less active markets, discounted cash flow techniques, or matrix pricing models. These securities are generally classified within level 2 of the fair value hierarchy and include U.S. Government agency securities, U.S. Government agency and sponsored enterprise MBS, preferred stock investments for which level 1 valuations are not available, corporate debt securities, non-mortgage asset-backed securities, single family rental real estate-backed securities, certain private label
BANKUNITED, INC. AND SUBSIDIARIES
NOTES TO CONSOLIDATED FINANCIAL STATEMENTS - UNAUDITED
September 30, 2019
residential MBS and CMOs, private label commercial MBS, collateralized loan obligations and state and municipal obligations. Pricing of these securities is generally primarily spread driven. Observable inputs that may impact the valuation of these securities include benchmark yield curves, credit spreads, reported trades, dealer quotes, bids, issuer spreads, current rating, historical constant prepayment rates, historical voluntary prepayment rates, structural and waterfall features of individual securities, published collateral data, and for certain securities, historical constant default rates and default severities. Investment securities available for sale generally classified within level 3 of the fair value hierarchy include certain private label MBS and trust preferred securities. The Company typically values these securities using third-party proprietary pricing models, primarily discounted cash flow valuation techniques, which incorporate both observable and unobservable inputs. Unobservable inputs that may impact the valuation of these securities include risk adjusted discount rates, projected prepayment rates, projected default rates and projected loss severity.
The Company uses third-party pricing services in determining fair value measurements for investment securities. To obtain an understanding of the methodologies and assumptions used, management reviews written documentation provided by the pricing services, conducts interviews with valuation desk personnel and reviews model results and detailed assumptions used to value selected securities as considered necessary. Management has established a robust price challenge process that includes a review by the treasury front office of all prices provided on a monthly basis. Any price evidencing unexpected month over month fluctuations or deviations from expectations is challenged. If considered necessary to resolve any discrepancies, a price will be obtained from an additional independent valuation source. The Company does not typically adjust the prices provided, other than through this established challenge process. The results of price challenges are subject to review by executive management. The Company has also established a quarterly process whereby prices provided by its primary pricing service for a sample of securities are validated. Any price discrepancies are resolved based on careful consideration of the assumptions and inputs employed by each of the pricing sources.
Servicing rights—Commercial servicing rights are valued using a discounted cash flow methodology incorporating contractually specified servicing fees and market based assumptions about prepayments, discount rates, default rates and costs of servicing. Prepayment and default assumptions are based on historical industry data for loans with similar characteristics.
Assumptions about costs of servicing are based on market convention. Discount rates are based on rates of return implied by observed trades of underlying loans in the secondary market. These instruments are classified within level 2 of the fair value hierarchy.
Derivative financial instruments—Fair values of interest rate swaps are determined using widely accepted discounted cash flow modeling techniques. These discounted cash flow models use projections of future cash payments and receipts that are discounted at mid-market rates. Observable inputs that may impact the valuation of these instruments include LIBOR swap rates and LIBOR forward yield curves. These fair value measurements are generally classified within level 2 of the fair value hierarchy.
BANKUNITED, INC. AND SUBSIDIARIES
NOTES TO CONSOLIDATED FINANCIAL STATEMENTS - UNAUDITED
September 30, 2019
The following tables present assets and liabilities measured at fair value on a recurring basis at the dates indicated (in thousands):
| | | | September 30, 2019 | March 31, 2020 |
| | Level 1 | | Level 2 | | Level 3 | | Total | Level 1 | | Level 2 | | Total |
| Investment securities available for sale: | |
| | |
| | |
| | |
| |
| | |
| | |
|
| U.S. Treasury securities | $ | 70,666 |
| | $ | — |
| | $ | — |
| | $ | 70,666 |
| $ | 76,154 |
| | $ | — |
| | $ | 76,154 |
|
| U.S. Government agency and sponsored enterprise residential MBS | — |
| | 1,969,141 |
| | — |
| | 1,969,141 |
| — |
| | 2,180,898 |
| | 2,180,898 |
|
| U.S. Government agency and sponsored enterprise commercial MBS | — |
| | 340,590 |
| | — |
| | 340,590 |
| — |
| | 376,492 |
| | 376,492 |
|
| Private label residential MBS and CMOs | — |
| | 1,294,873 |
| | 20,312 |
| | 1,315,185 |
| — |
| | 1,173,880 |
| | 1,173,880 |
|
| Private label commercial MBS | — |
| | 1,632,098 |
| | — |
| | 1,632,098 |
| — |
| | 1,604,814 |
| | 1,604,814 |
|
| Single family rental real estate-backed securities | — |
| | 496,698 |
| | — |
| | 496,698 |
| — |
| | 528,793 |
| | 528,793 |
|
| Collateralized loan obligations | — |
| | 1,198,233 |
| | — |
| | 1,198,233 |
| — |
| | 1,094,793 |
| | 1,094,793 |
|
| Non-mortgage asset-backed securities | — |
| | 204,566 |
| | — |
| | 204,566 |
| — |
| | 255,161 |
| | 255,161 |
|
| State and municipal obligations | — |
| | 280,785 |
| | — |
| | 280,785 |
| — |
| | 271,033 |
| | 271,033 |
|
| SBA securities | — |
| | 388,240 |
| | — |
| | 388,240 |
| — |
| | 260,388 |
| | 260,388 |
|
| Other debt securities | — |
| | — |
| | 4,471 |
| | 4,471 |
| |
| Marketable equity securities | 59,983 |
| | — |
| | — |
| | 59,983 |
| 42,195 |
| | — |
| | 42,195 |
|
| Servicing rights | — |
| | — |
| | 8,631 |
| | 8,631 |
| — |
| | 7,179 |
| | 7,179 |
|
| Derivative assets | — |
| | 56,580 |
| | — |
| | 56,580 |
| — |
| | 135,720 |
| | 135,720 |
|
| Total assets at fair value | $ | 130,649 |
| | $ | 7,861,804 |
| | $ | 33,414 |
| | $ | 8,025,867 |
| $ | 118,349 |
| | $ | 7,889,151 |
| | $ | 8,007,500 |
|
| Derivative liabilities | $ | — |
| | $ | (23,963 | ) | | $ | — |
| | $ | (23,963 | ) | $ | — |
| | $ | (48,973 | ) | | $ | (48,973 | ) |
| Total liabilities at fair value | $ | — |
| | $ | (23,963 | ) | | $ | — |
| | $ | (23,963 | ) | $ | — |
| | $ | (48,973 | ) | | $ | (48,973 | ) |
BANKUNITED, INC. AND SUBSIDIARIES
NOTES TO CONSOLIDATED FINANCIAL STATEMENTS - UNAUDITED
September 30, 2019March 31, 2020
| | | | December 31, 2018 | December 31, 2019 |
| | Level 1 | | Level 2 | | Level 3 | | Total | Level 1 | | Level 2 | | Total |
| Investment securities available for sale: | |
| | |
| | |
| | |
| |
| | |
| | |
|
| U.S. Treasury securities | $ | 39,873 |
| | $ | — |
| | $ | — |
| | $ | 39,873 |
| $ | 70,325 |
| | $ | — |
| | $ | 70,325 |
|
| U.S. Government agency and sponsored enterprise residential MBS | — |
| | 1,897,474 |
| | — |
| | 1,897,474 |
| — |
| | 2,022,175 |
| | 2,022,175 |
|
| U.S. Government agency and sponsored enterprise commercial MBS | — |
| | 374,787 |
| | — |
| | 374,787 |
| — |
| | 370,976 |
| | 370,976 |
|
| Private label residential MBS and CMOs | — |
| | 1,499,514 |
| | 34,684 |
| | 1,534,198 |
| — |
| | 1,012,177 |
| | 1,012,177 |
|
| Private label commercial MBS | — |
| | 1,485,716 |
| | — |
| | 1,485,716 |
| — |
| | 1,724,684 |
| | 1,724,684 |
|
| Single family rental real estate-backed securities | — |
| | 402,458 |
| | — |
| | 402,458 |
| — |
| | 470,025 |
| | 470,025 |
|
| Collateralized loan obligations | — |
| | 1,235,198 |
| | — |
| | 1,235,198 |
| — |
| | 1,197,366 |
| | 1,197,366 |
|
| Non-mortgage asset-backed securities | — |
| | 204,067 |
| | — |
| | 204,067 |
| — |
| | 194,904 |
| | 194,904 |
|
| State and municipal obligations | — |
| | 398,429 |
| | — |
| | 398,429 |
| — |
| | 273,302 |
| | 273,302 |
|
| SBA securities | — |
| | 519,313 |
| | — |
| | 519,313 |
| — |
| | 362,731 |
| | 362,731 |
|
| Other debt securities | — |
| | — |
| | 4,846 |
| | 4,846 |
| |
| Marketable securities | 60,519 |
| | — |
| | — |
| | 60,519 |
| |
| Marketable equity securities | | 60,572 |
| | — |
| | 60,572 |
|
| Servicing rights | — |
| | — |
| | 9,525 |
| | 9,525 |
| — |
| | 7,977 |
| | 7,977 |
|
| Derivative assets | — |
| | 29,615 |
| | — |
| | 29,615 |
| — |
| | 43,686 |
| | 43,686 |
|
| Total assets at fair value | $ | 100,392 |
| | $ | 8,046,571 |
| | $ | 49,055 |
| | $ | 8,196,018 |
| $ | 130,897 |
| | $ | 7,680,003 |
| | $ | 7,810,900 |
|
| Derivative liabilities | $ | — |
| | $ | (23,874 | ) | | $ | — |
| | $ | (23,874 | ) | $ | — |
| | $ | (19,029 | ) | | $ | (19,029 | ) |
| Total liabilities at fair value | $ | — |
| | $ | (23,874 | ) | | $ | — |
| | $ | (23,874 | ) | $ | — |
| | $ | (19,029 | ) | | $ | (19,029 | ) |
BANKUNITED, INC. AND SUBSIDIARIES
NOTES TO CONSOLIDATED FINANCIAL STATEMENTS - UNAUDITED
September 30, 2019
The following table reconciles changes in the fair value of assets and liabilities measured at fair value on a recurring basis and classified in level 3 of the fair value hierarchy during the periods indicated (in thousands):
|
| | | | | | | | | | | | | | | | | | | | | | | |
| | Three Months Ended September 30, |
| | 2019 | | 2018 |
| | Private Label
Residential
MBS | | Other Debt
Securities | | Servicing Rights | | Private Label
Residential
MBS | | Other Debt
Securities | | Servicing Rights |
| Balance at beginning of period | $ | 25,526 |
| | $ | 4,781 |
| | $ | 9,435 |
| | $ | 40,564 |
| | $ | 5,581 |
| | $ | 35,915 |
|
| Gains (losses) for the period included in: | | | | | | | | | | | |
| Net income | 1,667 |
| | — |
| | (1,341 | ) | | — |
| | — |
| | (2,390 | ) |
| Other comprehensive income | (3,505 | ) | | (253 | ) | | — |
| | (1,043 | ) | | 75 |
| | — |
|
| Discount accretion | 1,827 |
| | 221 |
| | — |
| | 701 |
| | 19 |
| | — |
|
| Purchases or additions | — |
| | — |
| | 537 |
| | — |
| | — |
| | 4,088 |
|
| Sales | (3,668 | ) | | — |
| | — |
| | — |
| | — |
| | — |
|
| Settlements | (1,535 | ) | | (278 | ) | |
|
| | (2,820 | ) | | (11 | ) | | — |
|
| Balance at end of period | $ | 20,312 |
| | $ | 4,471 |
| | $ | 8,631 |
| | $ | 37,402 |
| | $ | 5,664 |
| | $ | 37,613 |
|
| Change in unrealized gains or losses included in OCI for assets held at the end of the reporting period | $ | (52 | ) | | $ | (253 | ) | | | | $ | (1,043 | ) | | $ | 75 |
| | |
|
| | | | | | | | | | | | | | | | | | | | | | | |
| | Nine Months Ended September 30, |
| | 2019 | | 2018 |
| | Private Label
Residential
MBS | | Other Debt
Securities | | Servicing Rights | | Private Label
Residential
MBS | | Other Debt
Securities | | Servicing Rights |
| Balance at beginning of period | $ | 34,684 |
| | $ | 4,846 |
| | $ | 9,525 |
| | $ | 52,214 |
| | $ | 5,329 |
| | $ | 30,737 |
|
| Gains (losses) for the period included in: | | | | | | | | | | | |
| Net income | 3,297 |
| | — |
| | (2,489 | ) | | 1,319 |
| | — |
| | (4,011 | ) |
| Other comprehensive income | (7,569 | ) | | (320 | ) | | — |
| | (4,504 | ) | | 362 |
| | — |
|
| Discount accretion | 4,871 |
| | 291 |
| | — |
| | 2,286 |
| | 232 |
| | — |
|
| Purchases or additions | — |
| | — |
| | 1,595 |
| | — |
| | — |
| | 10,887 |
|
| Sales | (9,199 | ) | | — |
| | — |
| | (5,120 | ) | | — |
| | — |
|
| Settlements | (5,772 | ) | | (346 | ) | | — |
| | (8,793 | ) | | (259 | ) | | — |
|
| Balance at end of period | $ | 20,312 |
| | $ | 4,471 |
| | $ | 8,631 |
| | $ | 37,402 |
| | $ | 5,664 |
| | $ | 37,613 |
|
| Change in unrealized gains or losses included in OCI for assets held at the end of the reporting period | $ | (620 | ) | | $ | (319 | ) | | | | $ | (3,035 | ) | | $ | 362 |
| | |
Gains on private label residential MBS recognized in net income during the three and nine months ended September 30, 2019 and 2018 are included in the consolidated statement of income line item "Gain on investment securities, net." Changes in the fair value of servicing rights are included in the consolidated statement of income line item “Other non-interest income.” Changes in fair value include changes due to valuation assumptions, primarily discount rates and prepayment speeds, as well as other changes such as runoff and the passage of time. The amount of net unrealized gains (losses) included in earnings for the nine months ended September 30, 2019 and 2018 that were related to servicing rights held at September 30, 2019 and 2018 was approximately $(0.7) million and $0.4 million, respectively, and were primarily due to changes in discount rates and prepayment speeds.
BANKUNITED, INC. AND SUBSIDIARIES
NOTES TO CONSOLIDATED FINANCIAL STATEMENTS - UNAUDITED
September 30, 2019
Securities for which fair value measurements are categorized in level 3 of the fair value hierarchy at September 30, 2019 consisted of pooled trust preferred securities with a fair value of $4 million and private label residential MBS and CMOs with a fair value of $20 million. The trust preferred securities are not material to the Company’s financial statements. Private label residential MBS consisted of senior and mezzanine tranches collateralized by prime fixed rate and hybrid 1-4 single family residential mortgages originated before 2005. Substantially all of these securities have variable rate coupons. Weighted average subordination levels at September 30, 2019 were 20.0% and 12.8% for investment grade and non-investment grade securities, respectively.
The following table provides information about the valuation techniques and unobservable inputs used in the valuation of private label residential MBS and CMOs falling within level 3 of the fair value hierarchy as of September 30, 2019 (dollars in thousands):
|
| | | | | | | | | | |
| | | Fair Value at | | Valuation Technique | | Unobservable Input | | Range (Weighted Average) |
| | | September 30, 2019 | | | |
| Investment grade | | $ | 12,244 |
| | Discounted cash flow | | Voluntary prepayment rate | | 4.00% - 35.18% (15.37%) |
| | | | | | | Probability of default | | 0.10% - 10.00% (2.01%) |
| | | | | | | Loss severity | | 15.00% - 100.00% (41.93%) |
| | | | | | | Discount rate | | 2.07% - 5.84% (3.08%) |
| | | | | | | | | |
| Non-investment grade | | $ | 8,068 |
| | Discounted cash flow | | Voluntary prepayment rate | | 8.03% - 25.94% (16.24%) |
| | | | | | | Probability of default | | 0.20% - 6.00% (2.15%) |
| | | | | | | Loss severity | | 15.00% - 100.00% (25.38%) |
| | | | | | | Discount rate | | 2.25% - 13.45% (5.10%) |
The significant unobservable inputs impacting the fair value measurement of private label residential MBS and CMOs include voluntary prepayment rates, probability of default, loss severity given default and discount rates. Generally, increases in probability of default, loss severity or discount rates would result in a lower fair value measurement. Alternatively, decreases in probability of default, loss severity or discount rates would result in a higher fair value measurement. For securities with less favorable credit characteristics, decreases in voluntary prepayment speeds may be interpreted as a deterioration in the overall credit quality of the underlying collateral and as such, lead to lower fair value measurements. The fair value measurements of those securities with higher levels of subordination will be less sensitive to changes in these unobservable inputs other than discount rates, while securities with lower levels of subordination will show a higher degree of sensitivity to changes in these unobservable inputs other than discount rates. Generally, a change in the assumption used for probability of default is accompanied by a directionally similar change in the assumption used for loss severity given default and a directionally opposite change in the assumption used for voluntary prepayment rate.
The following table provides information about the valuation techniques and significant unobservable inputs used in the valuation of servicing rights as of September 30, 2019 (dollars in thousands):
|
| | | | | | | | | | |
| | | Fair Value at | | Valuation Technique | | Unobservable Input | | Range (Weighted Average) |
| | | September 30, 2019 | | | |
| Commercial servicing rights | | $ | 8,631 |
| | Discounted cash flow | | Prepayment rate | | 3.16% - 22.13% (14.80%) |
| | | | | | | Discount rate | | 5.24% - 25.99% (13.09%) |
Increases in prepayment rates or discount rates would result in lower fair value measurements and decreases in prepayment rates or discount rates would result in higher fair value measurements. Although the prepayment rate and the discount rate are not directly interrelated, they generally move in opposite directions.
Assets and liabilities measured at fair value on a non-recurring basis
Following is a description of the methodologies used to estimate the fair values of assets and liabilities that may be measured at fair value on a non-recurring basis, and the level within the fair value hierarchy in which those measurements are typically classified.
BANKUNITED, INC. AND SUBSIDIARIES
NOTES TO CONSOLIDATED FINANCIAL STATEMENTS - UNAUDITED
September 30, 2019
Impaired loans, OREO and other repossessed assets—The carrying amount of collateral dependent impaired loans is typically based on the fair value of the underlying collateral, which may be real estate or other business assets, less estimated costs to sell.sell when repayment is expected to come from the sale of the collateral. The carrying value of OREO is initially measured based on the fair value of the real estate acquired in foreclosure and subsequently adjusted to the lower of cost or estimated fair value, less estimated cost to sell. Fair values of real estate collateral and OREO are typically based on third-party real estate appraisals which utilize market and income approaches to valuation incorporating both observable and unobservable inputs. When current appraisals are not available, the Company may use brokers’ price opinions, home price indices or other available information about changes in real estate market conditions to adjust the latest appraised value available. These adjustments to appraised values may be subjective and involve significant management judgment. The fair value of repossessed assets or collateral consisting of other business assets may be based on third-party appraisals or internal analyses that use market approaches to valuation incorporating primarilya combination of observable and unobservable inputs.
Fair value measurements related to collateral dependent impaired loans, OREO and other repossessed assets are generally classified within levels 2 andlevel 3 of the fair value hierarchy.
Operating lease equipment—Fair values of impaired operating lease equipment are typically based upon discounted
cash flow analyses, considering expected lease rates and estimated end of life residual values, typically obtained from independent appraisals. These fair value measurements are classified within level 3 of the fair value hierarchy.
BANKUNITED, INC. AND SUBSIDIARIES
NOTES TO CONSOLIDATED FINANCIAL STATEMENTS - UNAUDITED
March 31, 2020
The following tables present the carrying value of assets for which non-recurring changes in fair value have been recorded for the periods indicated (in thousands):
| | | | September 30, 2019 | | Losses from Fair Value Changes | March 31, 2020 | | Losses from Fair Value Changes |
| | Level 1 | | Level 2 | | Level 3 | | Total | | Three Months Ended
September 30, 2019 | | Nine Months Ended September 30, 2019 | Level 1 | | Level 2 | | Level 3 | | Total | | Three Months Ended
March 31, 2020 |
| OREO and repossessed assets | $ | — |
| | $ | — |
| | $ | 1,638 |
| | $ | 1,638 |
| | $ | (2,376 | ) | | $ | (2,372 | ) | $ | — |
| | $ | — |
| | $ | 4,693 |
| | $ | 4,693 |
| | $ | (4,983 | ) |
| Impaired loans | $ | — |
| | $ | — |
| | $ | 21,104 |
| | $ | 21,104 |
| | $ | (2,351 | ) | | $ | (2,265 | ) | $ | — |
| | $ | — |
| | $ | 146,394 |
| | $ | 146,394 |
| | $ | (8,792 | ) |
| Operating lease equipment | | $ | — |
| | $ | — |
| | $ | 2,110 |
| | $ | 2,110 |
| | $ | (691 | ) |
|
| | | | | | | | | | | | | | | | | | | | | | | |
| | September 30, 2018 | | Losses from Fair Value Changes |
| | Level 1 | | Level 2 | | Level 3 | | Total | | Three Months Ended September 30, 2018 | | Nine Months Ended September 30, 2018 |
| OREO and repossessed assets | $ | — |
| | $ | 1,300 |
| | $ | 651 |
| | $ | 1,951 |
| | $ | (646 | ) | | $ | (2,447 | ) |
| Impaired loans | $ | — |
| | $ | 61,029 |
| | $ | 22,436 |
| | $ | 83,465 |
| | $ | (1,552 | ) | | $ | (14,510 | ) |
Included in the tables above are impaired taxi medallion loans with carrying values of $61.0 million at September 30, 2018. Losses from fair value changes included in the tables above include $11.7 million recognized on impaired taxi medallion loans during the nine months ended September 30, 2018. In addition, OREO and repossessed assets reported above included repossessed taxi medallions with carrying values of $1.3 million at September 30, 2018. Losses of $0.2 million and $0.6 million were recognized on repossessed taxi medallions during the three and nine months ended September 30, 2018, respectively.
BANKUNITED, INC. AND SUBSIDIARIES
NOTES TO CONSOLIDATED FINANCIAL STATEMENTS - UNAUDITED
September 30, 2019
|
| | | | | | | | | | | | | | | | | | | |
| | March 31, 2019 | | Losses from Fair Value Changes |
| | Level 1 | | Level 2 | | Level 3 | | Total | | Three Months Ended
March 31, 2019 |
| OREO and repossessed assets | $ | — |
| | $ | — |
| | $ | 446 |
| | $ | 446 |
| | $ | (18 | ) |
| Impaired loans | $ | — |
| | $ | — |
| | $ | 24,671 |
| | $ | 24,671 |
| | $ | (1,916 | ) |
The following table presents the carrying value and fair value of financial instruments and the level within the fair value hierarchy in which those measurements are classified at the dates indicated (dollars in thousands):
| | | | | September 30, 2019 | | December 31, 2018 | | March 31, 2020 | | December 31, 2019 |
| | Level | | Carrying Value | | Fair Value | | Carrying Value | | Fair Value | Level | | Carrying Value | | Fair Value | | Carrying Value | | Fair Value |
| Assets: | | | |
| | |
| | |
| | |
| | | |
| | |
| | |
| | |
|
| Cash and cash equivalents | 1 | | $ | 230,228 |
| | $ | 230,228 |
| | $ | 382,073 |
| | $ | 382,073 |
| 1 | | $ | 766,698 |
| | $ | 766,698 |
| | $ | 214,673 |
| | $ | 214,673 |
|
| Investment securities | 1/2/3 | | 7,970,656 |
| | 7,971,340 |
| | 8,166,878 |
| | 8,167,127 |
| 1/2 | | $ | 7,874,601 |
| | $ | 7,875,510 |
| | $ | 7,769,237 |
| | $ | 7,769,949 |
|
| Non-marketable equity securities | 2 | | 272,789 |
| | 272,789 |
| | 267,052 |
| | 267,052 |
| 2 | | $ | 281,714 |
| | $ | 281,714 |
| | $ | 253,664 |
| | $ | 253,664 |
|
| Loans held for sale | 2 | | 46,332 |
| | 48,483 |
| | 36,992 |
| | 39,931 |
| 2 | | $ | 17,655 |
| | $ | 18,527 |
| | $ | 37,926 |
| | $ | 39,731 |
|
| Loans | 3 | | 22,747,038 |
| | 23,144,401 |
| | 21,867,077 |
| | 21,868,258 |
| |
| Loans, net | | 3 | | $ | 22,933,699 |
| | $ | 23,109,225 |
| | $ | 23,046,317 |
| | $ | 23,350,684 |
|
| Derivative assets | 2 | | 56,580 |
| | 56,580 |
| | 29,615 |
| | 29,615 |
| 2 | | $ | 135,720 |
| | $ | 135,720 |
| | $ | 43,686 |
| | $ | 43,686 |
|
| Liabilities: | | | | | | | | | | | | | | | | |
| Demand, savings and money market deposits | 2 | | $ | 16,909,868 |
| | $ | 16,909,868 |
| | $ | 16,654,465 |
| | $ | 16,654,465 |
| 2 | | $ | 17,458,932 |
| | $ | 17,458,932 |
| | $ | 17,047,344 |
| | $ | 17,047,344 |
|
| Time deposits | 2 | | 7,046,560 |
| | 7,082,491 |
| | 6,819,758 |
| | 6,820,355 |
| 2 | | $ | 7,541,839 |
| | $ | 7,602,038 |
| | $ | 7,347,247 |
| | $ | 7,377,301 |
|
| Federal funds purchased | 2 | | 175,000 |
| | 175,000 |
| | 175,000 |
| | 175,000 |
| 2 | | $ | — |
| | $ | — |
| | $ | 100,000 |
| | $ | 100,000 |
|
| FHLB advances | 2 | | 4,930,638 |
| | 4,951,142 |
| | 4,796,000 |
| | 4,810,446 |
| 2 | | $ | 5,144,409 |
| | $ | 5,163,091 |
| | $ | 4,480,501 |
| | $ | 4,500,969 |
|
| Notes and other borrowings | 2 | | 403,832 |
| | 445,580 |
| | 402,749 |
| | 416,142 |
| 2 | | $ | 428,579 |
| | $ | 449,023 |
| | $ | 429,338 |
| | $ | 473,327 |
|
| Derivative liabilities | 2 | | 23,963 |
| | 23,963 |
| | 23,874 |
| | 23,874 |
| 2 | | $ | 48,973 |
| | $ | 48,973 |
| | $ | 19,029 |
| | $ | 19,029 |
|
Note 1110 Commitments and Contingencies
The Company issues off-balance sheet financial instruments to meet the financing needs of its customers. These financial instruments include commitments to fund loans, unfunded commitments under existing lines of credit, and commercial and standby letters of credit. These commitments expose the Company to varying degrees of credit and market risk which are essentially the same as those involved in extending loans to customers, and are subject to the same credit policies used in underwriting loans. Collateral may be obtained based on the Company’s credit evaluation of the counterparty. The Company’s maximum exposure to credit loss is represented by the contractual amount of these commitments.
BANKUNITED, INC. AND SUBSIDIARIES
NOTES TO CONSOLIDATED FINANCIAL STATEMENTS - UNAUDITED
March 31, 2020
Commitments to fund loans
These are agreements to lend funds to customers as long as there is no violation of any condition established in the contract. Commitments to fund loans generally have fixed expiration dates or other termination clauses and may require payment of a fee. Many of these commitments are expected to expire without being funded and, therefore, the total commitment amounts do not necessarily represent future liquidity requirements.
Unfunded commitments under lines of credit
Unfunded commitments under lines of credit include commercial, commercial real estate, home equity and consumer lines of credit to existing customers.customers, for many of which additional extensions of credit are subject to borrowing base requirements. Some of these commitments may mature without being fully funded.
Commercial and standby letters of credit
Letters of credit are conditional commitments issued by the Company to guarantee the performance of a customer to a third party. These letters of credit are primarily issued to support trade transactions or guarantee arrangements. The credit risk involved in issuing letters of credit is essentially the same as that involved in extending loan facilities to customers.
BANKUNITED, INC. AND SUBSIDIARIES
NOTES TO CONSOLIDATED FINANCIAL STATEMENTS - UNAUDITED
September 30, 2019
Total lending related commitments outstanding at September 30, 2019March 31, 2020 were as follows (in thousands):
| | | Commitments to fund loans | $ | 713,537 |
| $ | 344,419 |
|
| Commitments to purchase loans | 710,704 |
| 791,759 |
|
| Unfunded commitments under lines of credit | 2,795,181 |
| 2,979,737 |
|
| Commercial and standby letters of credit | 86,356 |
| 85,543 |
|
| | $ | 4,305,778 |
| $ | 4,201,458 |
|
Legal Proceedings
The Company is involved as plaintiff or defendant in various legal actions arising in the normal course of business. In the opinion of management, based upon advice of legal counsel, the likelihood is remote that the impact of these proceedings, either individually or in the aggregate, would be material to the Company’s consolidated financial position, results of operations or cash flows.
Item 2. Management's Discussion and Analysis of Financial Condition and Results of Operations
The following discussion and analysis is intended to focus on significant matters impacting and changes in the financial condition and results of operations of the Company during the ninethree months ended September 30, 2019March 31, 2020 and should be read in conjunction with the consolidated financial statements and notes hereto included in this Quarterly Report on Form 10-Q and BKU's 20182019 Annual Report on Form 10-K for the year ended December 31, 20182019 (the "2018"2019 Annual Report on Form 10-K”).
Forward-Looking Statements
This Quarterly Report on Form 10-Q contains forward-looking statements within the meaning of the Private Securities Litigation Reform Act of 1995 that reflect the Company’s current views with respect to, among other things, future events and financial performance. Words such as “anticipates,” “expects,” “intends,” “plans,” “believes,” “seeks,” “estimates”“estimates,” "future" and similar expressions identify forward-looking statements. These forward-looking statements are based on the historical performance of the Company or on the Company’s current plans, estimates and expectations. The inclusion of this forward-looking information should not be regarded as a representation by the Company that the future plans, estimates or expectations so contemplated will be achieved. Such forward-looking statements are subject to various risks and uncertainties and assumptions relating to the Company’s operations, financial results, financial condition, business prospects, growth strategy and liquidity.liquidity, including as impacted by the COVID-19 pandemic. If one or more of these or other risks or uncertainties materialize, or if the Company’s underlying assumptions prove to be incorrect, the Company’s actual results may vary materially from those indicated in these statements. A number of important factors could cause actual results to differ materially from those indicated by the forward-looking statements, including, but not limited to, the risk factors described in Part I, Item 1A of the 20182019 Annual Report on Form 10-K.10-K and any subsequent Quarterly Report on Form 10-Q or Current Report on Form
8-K. The Company does not undertake any obligation to publicly update or review any forward looking statement, whether as a result of new information, future developments or otherwise.
Impact of the COVID-19 Pandemic and Our Response
In March 2020, the World Health Organization declared novel coronavirus disease 2019 (COVID-19) as a global pandemic. The pandemic has resulted in governmental authorities implementing numerous measures attempting to contain the spread and impact of COVID-19 such as travel bans and restrictions, quarantines, shelter in place orders, and limitations on business activities, including in major markets in which the Company and its clients are located or do business. The COVID-19 pandemic, and governmental responses to the pandemic, have severely negatively impacted the global economy, disrupted global supply chains, lowered equity market valuations, created significant volatility and disruption in financial markets, and increased unemployment levels. This situation is evolving rapidly, and there is a high level of uncertainty about its future effects.
A summary of the effects the COVID-19 pandemic has had on our Company and of our expectations about how our Company may be impacted in the future follows. These matters are discussed in further detail throughout this Form 10Q.
Our results of operations and financial condition at and for the three months ended March 31, 2020 were impacted by the COVID-19 pandemic.
Deteriorating economic conditions and a worsening forward looking economic forecast led to a higher provision for credit losses and ACL; as a result, we reported a net loss for the quarter. There is significant uncertainty as to, and we are not currently able to predict, the impact of the COVID-19 crisis on future credit loss expense and future levels of the ACL, but they may be more volatile and may change materially from current levels.
Unrealized losses on our AFS securities increased substantially as a result of the market response to, and dislocation in the wake of, the emerging pandemic. The increase in unrealized losses negatively impacted total stockholders' equity and our tangible book value at March 31, 2020. Since these unrealized losses are recorded in AOCI, they did not impact our regulatory capital ratios. We currently expect to recover the amortized cost basis of our AFS securities.
Levels of criticized and classified assets increased at March 31, 2020 as a result of the COVID-19 pandemic. Additionally, a significant number of borrowers have requested relief in the form of temporary payment deferrals. Levels of criticized and classified assets are expected to increase further in the near term as a result of impacts of the pandemic on our borrowers. We re-assess the risk ratings of individual commercial credits as we review requests for and grant temporary payment relief, or as other information comes to our attention that would warrant a re-evaluation of the risk rating. At March 31, 2020, we had not experienced an increase in non-performing assets as a result of the pandemic. It is difficult to predict when, if, or to what extent levels of non-performing assets and delinquencies will increase as a result of the pandemic, although they may do so. Similarly, charge-offs may increase. These impacts may manifest in a delayed fashion due to the impact of temporary payment deferrals and various forms of government assistance that our borrowers may receive.
Our share price has been negatively impacted by the COVID-19 crisis.
Although we took significant measures to prepare for possible disruptions in liquidity, we have not experienced such disruptions to date and continue to have sufficient levels of available liquidity.
The pandemic has impacted our operations . Currently, approximately 97% of our non-branch employees are working remotely. We did not experience any significant operational difficulties, technology failures or outages, or customer service disruptions in our transition to a remote work environment. 76% of our branches remain open to serve customers via drive-through or lobby appointments, operating with reduced hours. Generally, branch locations without drive-through facilities are temporarily closed. We have focused on insuring that our technology systems and internal controls continue to operate effectively in a remote work environment. We have put mechanisms in place to allow us to evaluate all significant modifications to processes and procedures to insure continued effectiveness of our controls. We have not identified any instances in which controls have failed to operate effectively.
Customer demand for our products and services, particularly lending products, may be impacted by the impact of the pandemic on their businesses or by social distancing measures. Potential borrowers impacted by the pandemic may no longer meet our underwriting criteria. We expect loan production in many portfolio segments to be muted in the near term as a result of the pandemic.
In response to the pandemic, we have prioritized risk management and implemented a number of measures to support our customers and employees. Specifically, we have:
Activated our business continuity plan under the leadership of executive management.
Activated our contingency funding plan, enhancing daily monitoring and reporting of liquidity trends and deposit flows, and optimized same day available liquidity.
Established a weekly cadence of Board of Directors meetings.
Pro-actively reached out to all of our borrowers with total credit exposure of $5 million or more, and to all borrowers in certain high-risk segments to assess the potential impact of COVID-19.
Segregated certain segments of the loan portfolio for enhanced monitoring.
Enhanced our workout and recovery staffing and processes.
Enhanced our stress testing framework. Results of internal stress testing indicate that we have sufficient capital to withstand an increase in credit losses materially beyond levels currently expected, and to withstand a severe downturn.
Proactively reached out to our critical third party service providers and evaluated their ability to continue to provide support in the current environment. We have experienced no significant service disruptions.
Expanded certain employee benefits and launched a number of programs to keep our employees healthy and engaged.
Enhanced personal protective measures for employees working at our corporate locations.
Supported our clients through participating in the Small Business Administration’s PPP, and granting payment deferrals and fee waivers on a case-by-case basis.
Temporarily halted new residential foreclosure actions.
We remain confident in our long-term underlying strength and stability, and our ability to navigate these challenging conditions.
Overview
Quarterly Highlights
In evaluating our financial performance, we consider the level of and trends in net interest income, the net interest margin, levels and composition of non-interest income and non-interest expense, performance ratios such as the return on average equity and return on average assets and asset quality ratios, including the ratio of non-performing loans to total loans, non-performing assets to total assets, trends in criticized and classified assets and portfolio delinquency and charge-off trends. We consider growth in earning assets and deposits, trends in funding mix and cost of funds. We analyze these ratios and trends against our own historical performance, our budgeted performance and the financial condition and performance of comparable financial institutions.
Quarterly highlights include:
Net income forFor the three months ended September 30, 2019 was $76.2March 31, 2020, the Company reported a net loss of $(31.0) million, or $0.77$(0.33) per diluted share, compared to $97.3net income of $66.0 million,or $0.90$0.65 per diluted share for the three months ended September 30, 2018. Non-loss share diluted earnings per share, as previously reported,March 31, 2019. Results for the quarter ended September 30, 2018 was $0.64. For the ninethree months ended September 30, 2019 net income was $223.6 million, or $2.23 per diluted share, compared to $272.5 million, or
$2.49 per diluted share, forMarch 31, 2020 were negatively impacted by the nine months ended September 30, 2018. Earnings for the nine months ended September 30, 2019 generated an annualized return on average stockholders' equity of 10.2% and an annualized return on average assets of 0.91%.
Loans and leases, including equipment under operating lease, grew by $253 million during the quarter ended September 30, 2019. For the nine months ended September 30, 2019, loans and leases grew by $873 million, netapplication of the saleCECL accounting methodology, including the impact of $168 million in loans fromCOVID-19 on the Pinnacle portfolio duringprovision for credit losses.
The Company and its banking subsidiary exceeded all regulatory guidelines required to be considered well capitalized at March 31, 2020. The Company's and the quarter ended September 30, 2019.Bank's CET1 risk-based capital ratios were 11.8% and 12.9% at March 31, 2020, respectively. The Company's and the Bank's Tier 1 leverage ratios were 8.5% and 9.3% at March 31, 2020, respectively. We believe we have sufficient capital to withstand a severe downturn.
Our liquidity position remains strong. At March 31, 2020, the Bank had total same day available liquidity of approximately $8.5 billion.
Non-interest bearing demand deposits grew by $506$305 million for the ninethree months ended September 30, 2019,March 31, 2020, to 17.2%18.4% of total deposits at September 30, 2019March 31, 2020 compared to 15.4%17.6% of total deposits at December 31, 2018. Non-interest bearing demand2019 and 15.9% of total deposits grew by $27 million during the quarter ended September 30,at March 31, 2019. The majority of this growth was not directly related to line draws. Total deposits grew by $34 million and $482$606 million for the quarter and ninethree months ended September 30,March 31, 2020.
The average cost of total deposits declined to 1.36% for the three months ended March 31, 2020, from 1.48% for the immediately preceding quarter ended December 31, 2019 respectively.and 1.67% for the three months ended March 31, 2019. On a spot basis, the average annual percentage yield on total interest-bearing deposits declined to 1.35% at March 31, 2020
Net interest
from 1.71% at December 31, 2019, and declined further to 1.08% at April 17, 2020. This is a total decline of 0.63% since December 31, 2019, reflecting recent actions taken to reduce the cost of deposits.
The provision for credit losses totaled $125.4 million for the three months ended March 31, 2020, reflecting the application of the CECL methodology and encompassing management's estimate of the expected economic impact of the COVID-19 pandemic. For the three months ended March 31, 2019, the Company recorded a provision for loan losses, under the incurred loss model, of $10.3 million.
The ACL represented our current estimate of expected lifetime credit losses from the loan portfolio and totaled $251 million, or 1.08% of total loans, at March 31, 2020. Upon initial adoption of CECL, at January 1, 2020, the ACL was 0.59% of total loans and at December 31, 2019, calculated under an incurred loss methodology, the ACL was 0.47% of total loans.
Pre-tax, pre-provision income totaled $85.0 million for the three months ended March 31, 2020 compared to $100.5 million for the three months ended March 31, 2019. Pre-tax, pre-provision income for the quarterthree months ended September 30, 2019 decreased by $66.3March 31, 2020 included a $5.0 million unrealized loss on marketable equity securities, resulting from $252.0the impact on markets of the COVID-19 crisis. Inclusive of this $5.0 million unrealized loss, loss on investment securities was $(3.5) million for the three months ended March 31, 2020 compared to a gain on investment securities of $5.8 million for the comparable quarter ended September 30, 2018. of the prior year, a negative variance of $9.2 million. Additional factors contributing to the decline in pre-tax, pre-provision income were a $10.3 million decline in net interest income, discussed further below, partially offset by a $7.8 million decrease in total non-interest expense. Pre-tax, pre-provision income is a non-GAAP financial measure. See section entitled "Non-GAAP Financial Measures" below for reconciliation of non-GAAP financial measurements to their comparable GAAP financial measurements.
The net interest margin, calculated on a tax-equivalent basis, was 2.35% for the three months ended March 31, 2020, compared to 2.41% for the immediately preceding quarter ended September 30,December 31, 2019 compared to 3.51%and 2.54% for the quarterthree months ended September 30, 2018. The most significant reasonMarch 31, 2019. Both yields on interest earning assets and the cost of interest bearing liabilities declined for the decline in net interest income and the net interest margin for the quarterthree months ended September 30, 2019March 31, 2020 as compared to the immediately preceding quarter and to the three months ended September 30, 2018March 31, 2019; however, the repricing of interest bearing liabilities, particularly deposits, lagged the repricing of interest earning assets.
Stockholders' equity was impacted by a decline of $291.8 million in accumulated other comprehensive income for the decreasethree months ended March 31, 2020, attributed to an increase in accretionunrealized losses on formerly covered residential loans.investment securities available for sale and derivative instruments. The Company currently expects to recover the amortized cost basis of its AFS securities portfolio.
| |
• | During the quarter ended September 30, 2019, the Company repurchased approximately 0.2 million shares of its common stock for an aggregate purchase price of approximately $8 million. During the nine months ended September 30, 2019, the Company repurchased approximately 4.4 million shares of its common stock for an aggregate purchase price of $150 million, at a weighted average price of $34.39 per share.
|
Book valueShare repurchases totaling approximately $101 million during the three months ended March 31, 2020 also impacted stockholders' equity. The Company has temporarily suspended its share repurchase program.
The Company increased its quarterly cash dividend by $0.02 to $0.23 per common share, grew to $30.60 at September 30, 2019reflecting a 10% increase from $29.49 at December 31, 2018 while tangible book valuethe previous quarterly cash dividend of $0.21 per common share increased to $29.78 from $28.71 over the same period.
The ratio of non-performing loans to total loans was 0.60% and the ratio of non-performing assets to total assets was 0.43% at September 30, 2019.
Critical Accounting Policies
Our consolidated financial statements are prepared in accordance with GAAP and follow general practices within the banking industry. Application of these principles requires management to make complex and subjective estimates and judgments that affect the amounts reported in the consolidated financial statements and accompanying notes. We base our estimates on historical experience and on various other assumptions that we believe to be reasonable and appropriate under current circumstances. These assumptions form the basis for our judgments about the carrying values of assets and liabilities that are not readily available from independent, objective sources. We evaluate our estimates on an ongoing basis. Use of alternative assumptions may have resulted in significantly different estimates. Actual results may differ from these estimates.
Accounting policies are an integral part of our financial statements. A thorough understanding of these accounting policies is essential when reviewing our reported results of operations and our financial position. Our significant accounting policies are described in Note 1 to the Consolidated Financial Statements in our 2018 Annual Report on Form 10-K and in Note 1 to the Consolidated Financial Statements included in this Form 10-Q. Three of these policies are considered critical because they require management to make difficult, subjective and complex judgments about matters that are inherently uncertain and because materially different amounts might be reported under different conditions or using different assumptions. These policies govern the ALLL, accounting for acquired loans and the indemnification asset and fair value measurements. A discussion of our critical accounting policies can be found in the Critical Accounting Policies section in Management's Discussion and Analysis of Financial Condition and Results of Operations included in the 2018 Annual Report on Form 10-K. There have been no changes in the application of our critical accounting policies since December 31, 2018.
Recent Accounting Pronouncements Not Yet Adopted
In June 2016, the FASB issued ASU No. 2016-13, Financial Instruments - Credit Losses (Topic 326); Measurement of Credit Losses on Financial Instruments. This ASU, along with subsequent ASUs issued to clarify certain of its provisions, introduces new guidance which makes substantive changes to the accounting for credit losses. The ASU introduces the CECL model which applies to financial assets subject to credit losses and measured at amortized cost, as well as certain off-balance sheet credit exposures. This includes loans, loan commitments, standby letters of credit, net investments in leases recognized by a lessor and HTM debt securities. The CECL model requires an entity to estimate credit losses expected over the life of an
exposure, considering information about historical events, current conditions and reasonable and supportable forecasts, and is generally expected to result in earlier recognition of credit losses. The ASU also modifies certain provisions of the current OTTI model for AFS debt securities. Credit losses on AFS debt securities will be limited to the difference between the security's amortized cost basis and its fair value, and will be recognized through an allowance for credit losses rather than as a direct reduction in amortized cost basis. The ASU also provides for a simplified accounting model for purchased financial assets with more than insignificant credit deterioration since their origination. The ASU requires expanded disclosures including, but not limited to, (i) information about the methods and assumptions used to estimate expected credit losses, including changes in the factors that influenced management's estimate and the reasons for those changes, (ii) for financing receivables and net investment in leases measured at amortized cost, further disaggregation of information about the credit quality of those assets and (iii) a rollforward of the allowance for credit losses for AFS and HTM securities.
The Company will adopt this ASU in the first quarter of 2020. At adoption, we will record a cumulative effect adjustment to retained earnings for the amount of the change in our allowance for credit losses. Banking regulators have provided an optional phase-in for the initial impact of adopting the new standard for regulatory capital adequacy purposes which the Company intends to elect, allowing CECL's regulatory capital effects to be phased in at 25 percent per year, beginning in the first quarter of the year of adoption.
The Company has substantially completed the execution of a detailed implementation plan, including establishment of a formal governance structure, the selection and implementation of estimation methodologies and credit loss models for all significant portfolio segments, implementation of a software solution to serve as its CECL platform, and development of processes and controls governing the CECL estimate. We are currently in "parallel run" of the CECL estimation process.
Based on our portfolio mix as of September 30, 2019, the current economic environment, our economic forecast and other assumptions, we expect an increase in the amount of the allowance for credit losses of approximately 15% to 30%, resulting in a ratio of the allowance for credit losses to total loans, measured as of September 30, 2019, ranging from approximately 0.55% to 0.62%, compared to the current 0.47%. The initial impact of CECL on our allowance for credit losses will ultimately depend on the size and composition of our loan portfolio, current economic conditions and our economic forecast at the date of adoption as well as further review and refinement of our models, methodologies and judgments over the course of the fourth quarter. We do not currently expect the impact of CECL with respect to our HTM or AFS securities portfolios to be significant at the date of adoption.share.
Results of Operations
Net Interest Income
Net interest income is the difference between interest earned on interest earning assets and interest incurred on interest bearing liabilities and is the primary driver of core earnings. Net interest income is impacted by the relative mix of interest earning assets and interest bearing liabilities, the ratio of interest earning assets to total assets and of interest bearing liabilities to total funding sources, movements in market interest rates, the shape of the yield curve, levels of non-performing assets and pricing pressure from competitors.
The mix of interest earning assets is influenced by loan demand, market and competitive conditions in our primary lending markets, and by management's continual assessment of the rate of return and relative risk associated with various classes of earning assets.assets and liquidity considerations. The mix of interest bearing liabilities is influenced by the Company's liquidity profile, management's assessment of the desire for lower cost funding sources weighed against relationships with customers and growth expectations, our ability to attract and is impacted byretain core deposit relationships, competition for deposits in the Company's markets and the availability and pricing of other sources of funds.
The following tables present,table presents, for the periods indicated, information about (i) average balances, the total dollar amount of taxable equivalent interest income from earning assets and the resultant average yields; (ii) average balances, the total dollar amount of interest expense on interest bearing liabilities and the resultant average rates; (iii) net interest income; (iv) the interest rate spread; and (v) the net interest margin. Non-accrual and restructured loans are included in the average balances presented in this table; however, interest income foregone on non-accrual loans is not included. Interest income, yields, spread and margin have been calculated on a tax-equivalent basis for loans and investment securities that are exempt from federal income taxes, at a federal tax rate of 21% (dollars in thousands):
|
| | | | | | | | | | | | | | | | | | | | | | |
| | | Three Months Ended September 30, |
| | | 2019 | | 2018 |
| | | Average
Balance | | Interest (1)(2) | | Yield/
Rate (1)(2) | | Average
Balance | | Interest (1)(2) | | Yield/
Rate (1)(2) |
| Assets: | | | | | | | | | | | | |
| Interest earning assets: | | |
| | |
| | |
| | |
| | |
| | |
|
| Non-covered loans | | $ | 22,733,875 |
| | $ | 252,896 |
| | 4.43 | % | | $ | 21,311,706 |
| | $ | 216,746 |
| | 4.05 | % |
| Covered loans | | — |
| | — |
| | — | % | | 408,182 |
| | 81,302 |
| | 79.67 | % |
| Total loans | | 22,733,875 |
| | 252,896 |
| | 4.43 | % | | 21,719,888 |
| | 298,048 |
| | 5.47 | % |
Investment securities (3) | | 8,295,205 |
| | 70,427 |
| | 3.40 | % | | 7,118,626 |
| | 60,677 |
| | 3.41 | % |
| Other interest earning assets | | 573,630 |
| | 5,219 |
| | 3.61 | % | | 507,318 |
| | 4,855 |
| | 3.80 | % |
| Total interest earning assets | | 31,602,710 |
| | 328,542 |
| | 4.14 | % | | 29,345,832 |
| | 363,580 |
| | 4.94 | % |
| Allowance for loan and lease losses | | (112,784 | ) | | | | | | (137,784 | ) | | | | |
| Non-interest earning assets | | 1,652,901 |
| | | | | | 1,859,619 |
| | | | |
| Total assets | | $ | 33,142,827 |
| | | | | | $ | 31,067,667 |
| | | | |
| Liabilities and Stockholders' Equity: | | | | | | | | | | | | |
| Interest bearing liabilities: | | | | | | | | | | | | |
| Interest bearing demand deposits | | $ | 1,872,573 |
| | 6,705 |
| | 1.42 | % | | $ | 1,592,908 |
| | 4,550 |
| | 1.13 | % |
| Savings and money market deposits | | 10,907,317 |
| | 51,229 |
| | 1.86 | % | | 10,483,248 |
| | 38,520 |
| | 1.46 | % |
| Time deposits | | 6,845,643 |
| | 41,549 |
| | 2.41 | % | | 6,728,915 |
| | 32,187 |
| | 1.90 | % |
| Total interest bearing deposits | | 19,625,533 |
| | 99,483 |
| | 2.01 | % | | 18,805,071 |
| | 75,257 |
| | 1.59 | % |
| Short term borrowings | | 115,209 |
| | 670 |
| | 2.31 | % | | 89,218 |
| | 445 |
| | 2.00 | % |
| FHLB advances | | 5,414,963 |
| | 32,252 |
| | 2.36 | % | | 4,772,902 |
| | 24,743 |
| | 2.06 | % |
| Notes and other borrowings | | 403,788 |
| | 5,307 |
| | 5.26 | % | | 402,782 |
| | 5,304 |
| | 5.27 | % |
| Total interest bearing liabilities | | 25,559,493 |
| | 137,712 |
| | 2.14 | % | | 24,069,973 |
| | 105,749 |
| | 1.74 | % |
| Non-interest bearing demand deposits | | 3,963,955 |
| | | | | | 3,369,393 |
| | | | |
| Other non-interest bearing liabilities | | 704,995 |
| | | | | | 520,118 |
| | | | |
| Total liabilities | | 30,228,443 |
| | | | | | 27,959,484 |
| | | | |
| Stockholders' equity | | 2,914,384 |
| | | | | | 3,108,183 |
| | | | |
| Total liabilities and stockholders' equity | | $ | 33,142,827 |
| | | | | | $ | 31,067,667 |
| | | | |
| Net interest income | | | | $ | 190,830 |
| | | | | | $ | 257,831 |
| | |
| Interest rate spread | | | | | | 2.00 | % | | | | | | 3.20 | % |
| Net interest margin | | | | | | 2.41 | % | | | | | | 3.51 | % |
| |
(1) | On a tax-equivalent basis where applicable. The tax-equivalent adjustment for tax-exempt loans was $4.1 million and $4.5 million, and the tax-equivalent adjustment for tax-exempt investment securities was $1.0 million and $1.4 million for the three months ended September 30, 2019 and2018, respectively.
|
| |
(3) | At fair value except for securities held to maturity. |
| | | | | Nine Months Ended September 30, | | Three Months Ended March 31, |
| | | 2019 | | 2018 | | 2020 | | 2019 |
| | | Average
Balance | | Interest (1)(2) | | Yield/
Rate (1)(2) | | Average
Balance | | Interest (1)(2) | | Yield/
Rate (1)(2) | | Average
Balance | | Interest (1)(2) | | Yield/
Rate (1)(2) | | Average
Balance | | Interest (1)(2) | | Yield/
Rate (1)(2) |
| Assets: | | | | | | | | | | | | | | | | | | | | | | | | |
| Interest earning assets: | | |
| | |
| | |
| | |
| | |
| | |
| | |
| | |
| | |
| | |
| | |
| | |
|
| Non-covered loans | | $ | 22,407,271 |
| | $ | 751,672 |
| | 4.48 | % | | $ | 21,073,130 |
| | $ | 622,039 |
| | 3.94 | % | |
| Covered loans | | — |
| | — |
| | — | % | | 460,485 |
| | 246,811 |
| | 71.46 | % | |
| Total loans | | 22,407,271 |
| | 751,672 |
| | 4.48 | % | | 21,533,615 |
| | 868,850 |
| | 5.39 | % | |
| Loans | | | $ | 22,850,065 |
| | $ | 238,108 |
| | 4.18 | % | | $ | 21,974,453 |
| | $ | 245,010 |
| | 4.50 | % |
Investment securities (3) | | 8,333,600 |
| | 221,901 |
| | 3.55 | % | | 6,932,504 |
| | 169,645 |
| | 3.26 | % | | 8,107,649 |
| | 56,951 |
| | 2.81 | % | | 8,520,555 |
| | 77,607 |
| | 3.64 | % |
| Other interest earning assets | | 532,062 |
| | 15,140 |
| | 3.80 | % | | 503,378 |
| | 13,145 |
| | 3.49 | % | | 646,628 |
| | 3,720 |
| | 2.31 | % | | 496,141 |
| | 4,852 |
| | 3.96 | % |
| Total interest earning assets | | 31,272,933 |
| | 988,713 |
| | 4.22 | % | | 28,969,497 |
| | 1,051,640 |
| | 4.85 | % | | 31,604,342 |
| | 298,779 |
| | 3.79 | % | | 30,991,149 |
| | 327,469 |
| | 4.26 | % |
| Allowance for loan and lease losses | | (113,694 | ) | | | | | | (141,047 | ) | | | | | |
| Allowance for credit losses | | | (138,842 | ) | | | | | | (111,074 | ) | | | | |
| Non-interest earning assets | | 1,615,548 |
| | | | | | 1,905,278 |
| | | | | | 1,749,752 |
| | | | | | 1,603,922 |
| | | | |
| Total assets | | $ | 32,774,787 |
| | | | | | $ | 30,733,728 |
| | | | | | $ | 33,215,252 |
| | | | | | $ | 32,483,997 |
| | | | |
| Liabilities and Stockholders' Equity: | | | | | | | | | | | | | | | | | | | | | | | | |
| Interest bearing liabilities: | | | | | | | | | | | | | | | | | | | | | | | | |
| Interest bearing demand deposits | | $ | 1,783,611 |
| | 18,569 |
| | 1.39 | % | | $ | 1,604,666 |
| | 12,902 |
| | 1.07 | % | | $ | 2,173,628 |
| | 6,959 |
| | 1.29 | % | | $ | 1,702,479 |
| | 5,639 |
| | 1.34 | % |
| Savings and money market deposits | | 11,093,290 |
| | 156,236 |
| | 1.88 | % | | 10,610,889 |
| | 100,891 |
| | 1.27 | % | | 10,412,202 |
| | 37,756 |
| | 1.46 | % | | 11,453,980 |
| | 52,817 |
| | 1.87 | % |
| Time deposits | | 6,898,947 |
| | 122,086 |
| | 2.37 | % | | 6,507,726 |
| | 83,123 |
| | 1.71 | % | | 7,510,070 |
| | 38,107 |
| | 2.04 | % | | 6,907,011 |
| | 38,965 |
| | 2.29 | % |
| Total interest bearing deposits | | 19,775,848 |
| | 296,891 |
| | 2.01 | % | | 18,723,281 |
| | 196,916 |
| | 1.41 | % | | 20,095,900 |
| | 82,822 |
| | 1.66 | % | | 20,063,470 |
| | 97,421 |
| | 1.97 | % |
| Short term borrowings | | 127,908 |
| | 2,297 |
| | 2.39 | % | | 30,066 |
| | 445 |
| | 1.97 | % | | 94,066 |
| | 367 |
| | 1.56 | % | | 137,378 |
| | 824 |
| | 2.40 | % |
| FHLB advances | | 5,037,299 |
| | 89,890 |
| | 2.39 | % | | 4,665,799 |
| | 66,028 |
| | 1.89 | % | | 4,414,830 |
| | 25,084 |
| | 2.29 | % | | 4,660,222 |
| | 27,374 |
| | 2.38 | % |
| Notes and other borrowings | | 403,574 |
| | 15,908 |
| | 5.26 | % | | 402,809 |
| | 15,919 |
| | 5.27 | % | | 429,098 |
| | 5,290 |
| | 4.93 | % | | 404,852 |
| | 5,309 |
| | 5.25 | % |
| Total interest bearing liabilities | | 25,344,629 |
| | 404,986 |
| | 2.14 | % | | 23,821,955 |
| | 279,308 |
| | 1.57 | % | | 25,033,894 |
| | 113,563 |
| | 1.82 | % | | 25,265,922 |
| | 130,928 |
| | 2.10 | % |
| Non-interest bearing demand deposits | | 3,835,248 |
| | | | | | 3,327,521 |
| | | | | | 4,368,553 |
| | | | | | 3,605,131 |
| | | | |
| Other non-interest bearing liabilities | | 654,692 |
| | | | | | 498,368 |
| | | | | | 749,101 |
| | | | | | 657,360 |
| | | | |
| Total liabilities | | 29,834,569 |
| | | | | | 27,647,844 |
| | | | | | 30,151,548 |
| | | | | | 29,528,413 |
| | | | |
| Stockholders' equity | | 2,940,218 |
| | | | | | 3,085,884 |
| | | | | | 3,063,704 |
| | | | | | 2,955,584 |
| | | | |
| Total liabilities and stockholders' equity | | $ | 32,774,787 |
| | | �� | | | $ | 30,733,728 |
| | | | | | $ | 33,215,252 |
| | | | | | $ | 32,483,997 |
| | | | |
| Net interest income | | | | $ | 583,727 |
| | | | | | $ | 772,332 |
| | | | | | $ | 185,216 |
| | | | | | $ | 196,541 |
| | |
| Interest rate spread | | | | | | 2.08 | % | | | | | | 3.28 | % | | | | | | 1.97 | % | | | | | | 2.16 | % |
| Net interest margin | | | | | | 2.49 | % | | | | | | 3.56 | % | | | | | | 2.35 | % | | | | | | 2.54 | % |
| |
| (1) | On a tax-equivalent basis where applicable. The tax-equivalent adjustment for tax-exempt loans was $12.9$3.7 million and $13.0$4.4 million, and the tax-equivalent adjustment for tax-exempt investment securities was $3.3$0.9 million and $4.2$1.3 million for the ninethree months ended September 30,March 31, 2020 and 2019, and 2018, respectively. |
| |
| (3) | At fair value except for securities held to maturity. |
Net interest income, calculated on a tax-equivalent basis, was $190.8$185.2 million for the three months ended September 30, 2019March 31, 2020 compared to $257.8$196.5 million for the three months ended September 30, 2018,March 31, 2019, a decrease of $67 million. Net interest income, calculated on a tax-equivalent basis, was $583.7 million for the nine months ended September 30, 2019 compared to $772.3 million for the nine months ended September 30, 2018, a decrease of $188.6$11.3 million. The decreasesdecrease in net interest income werewas comprised of decreasesa decrease in tax-equivalent interest income of $35.0$28.7 million and $62.9 million and increasesa decrease in interest expense of $32.0 million and $125.7$17.4 million for the three and nine months ended September 30, 2019, respectively,March 31, 2020, compared to the three and nine months ended September 30, 2018.March 31, 2019.
The decreasesdecrease in tax-equivalent interest income werewas comprised primarily of (i) decreasesa decrease in interest income from loans of $45.2 million and $117.2$6.9 million for the three and nine months ended September 30, 2019, respectively, relativeMarch 31, 2020 compared to the comparable periods of the prior year; partially offset bythree months ended March 31, 2019; and (ii) increasesa decrease in interest income from investment securities of $9.8 million and $52.3$20.7 million for the three and nine months ended September 30, 2019, respectively, relativeMarch 31, 2020 compared to the comparable periods of the prior year.three months ended March 31, 2019.
The declines innet interest income from loans were mainly the result of the decrease in accretionmargin, calculated on formerly covered residential loans. Interest income on formerly covered residential loans declined by $65.6 million and $198.3 milliona tax-equivalent basis, was 2.35% for the three and nine months ended September 30,March 31, 2020, compared to 2.41% for the immediately preceding quarter ended December 31, 2019 respectively, relativeand 2.54% for the three months ended March 31, 2019. Both yields on interest earning assets and the cost of interest bearing liabilities declined for the three months ended March 31, 2020 as compared to the comparable periodsimmediately preceding quarter and to the three months ended March 31, 2019; however, the repricing of interest bearing liabilities, particularly deposits, lagged the repricing of interest earning assets.
Decreased tax equivalent interest income on loans for the three months ended March 31, 2020 compared to the three months ended March 31, 2019 was attributable to a decrease in the prior year. Bothyield, partially offset by an increase of $876 million in the average balance of and yield on these loans declined. The declines in the average balance resulted from the sale of a substantial portion of the loans during 2018 in anticipation of the termination of the Single Family Shared-Loss Agreement. The declines in the yield were due primarily to changes in assumptions about the remaining period over which accretable yield would be realized, attributable to management's decision to retain certain loans beyond expiration of the Single Family Shared-Loss Agreement.
The following tables present, for the periods indicated, further details of the composition of the tax equivalent yield on loans (dollars in thousands):
|
| | | | | | | | | | | | | | | | | | | | | | |
| | | Three Months Ended September 30, |
| | | 2019 | | 2018 |
| | | Average
Balance | | Interest (1)(2) | | Yield/
Rate (1)(2) | | Average
Balance | | Interest (1)(2) | | Yield/
Rate (1)(2) |
| Loans: | | |
| | |
| | |
| | |
| | |
| | |
|
| Non-covered loans | | $ | 22,556,931 |
| | $ | 237,197 |
| | 4.18 | % | | $ | 21,311,706 |
| | $ | 216,746 |
| | 4.05 | % |
| Formerly covered loans | | 176,944 |
| | 15,699 |
| | 35.49 | % | | 408,182 |
| | 81,302 |
| | 79.67 | % |
| Total loans | | 22,733,875 |
| | 252,896 |
| | 4.43 | % | | 21,719,888 |
| | 298,048 |
| | 5.47 | % |
|
| | | | | | | | | | | | | | | | | | | | | | |
| | | Nine Months Ended September 30, |
| | | 2019 | | 2018 |
| | | Average
Balance | | Interest (1)(2) | | Yield/
Rate (1)(2) | | Average
Balance | | Interest (1)(2) | | Yield/
Rate (1)(2) |
| Loans: | | |
| | |
| | |
| | |
| | |
| | |
|
| Non-covered loans | | $ | 22,217,829 |
| | $ | 703,157 |
| | 4.23 | % | | $ | 21,073,130 |
| | $ | 622,039 |
| | 3.94 | % |
| Formerly covered loans | | 189,442 |
| | 48,515 |
| | 34.15 | % | | 460,485 |
| | 246,811 |
| | 71.46 | % |
| Total loans | | 22,407,271 |
| | 751,672 |
| | 4.48 | % | | 21,533,615 |
| | 868,850 |
| | 5.39 | % |
| |
(1) | On a tax-equivalent basis where applicable. |
Increased interest income on loans, other than formerly covered residential loans, for the three and nine months ended September 30, 2019, respectively, relative to the comparable periods of the prior year was attributable to increases in both the yield on and average balance of thoseoutstanding loans. The tax-equivalent yield increased by 0.13% and 0.29%on loans decreased to 4.18% for the three and nine months ended September 30, 2019, respectively, relative toMarch 31, 2020, from 4.50% for the comparable periods in the prior year.three months ended March 31, 2019. The most significant factor contributing to these increased yieldsthis decrease in yield was the impact of increasesdecreases in benchmark interest rates in 2018. The average balance outstanding increased by $1.2 billion and $1.1 billion for the three and nine months ended September 30, 2019, respectively, relative to the comparable periods of the prior year.rates.
The average balance of investment securities increaseddecreased by $1.2 billion and $1.4 billion for the three and nine months ended September 30, 2019, respectively, relative to the comparable periods in the prior year. The tax-equivalent yield was 3.40%$412.9 million for the three months ended September 30, 2019March 31, 2020 compared to 3.41%the three months ended March 31, 2019. The tax-equivalent yield on investment securities decreased to 2.81% for the three months ended September 30, 2018 and increased to 3.55%March 31, 2020 from 3.64% for the ninethree months ended September 30, 2019 from 3.26% forMarch 31, 2019. The most significant factors contributing to the nine months ended September 30, 2018. The main reason fordecrease in yield were the increase was increasesimpact of decreases in coupon rates.benchmark interest rates and, to a lesser extent, increased prepayment speeds. This decline is reflective of the short duration of the investment portfolio in a falling rate environment.
The primary components of the increasesdecrease in interest expense for the three and nine months ended September 30, 2019 asMarch 31, 2020 compared to the three and nine months ended September 30, 2018March 31, 2019 were increasesa decrease of $24.2$14.6 million and $100.0 million, respectively, in interest expense on deposits;deposits and increasesa decrease of $7.5$2.3 million and $23.9 million, respectively, in interest expense on FHLB advances. The decreases were primarily the result of decreases in the cost of interest bearing liabilities.
The increasedecrease in interest expense on deposits was attributable primarily to increases in average interest bearing deposits of $820 million and $1.1 billion for the three and nine months ended September 30, 2019, respectively, relative to the comparable periods in the prior year and increasesa decrease in the average cost of interest bearing deposits of 0.42% and 0.60%0.31% to 1.66% for the three and nine months ended September 30, 2019, respectively, relative toMarch 31, 2020 from 1.97% for the comparable periods in the prior year. These cost increases werethree months ended March 31, 2019. This decrease was generally driven by the growth of depositsdecreases in competitive markets and a rising short-termmarket interest rate environmentrates in 2018.
The increasedecrease in interest expense on FHLB advances resulted from increasesa decrease in the average cost of advances of 0.30% and 0.50%0.09% to 2.29% for the three and nine months ended September 30, 2019, respectively, relative toMarch 31, 2020 from 2.38% for the comparable periodsthree months ended March 31, 2019. The decrease in the prior year. The increased costs werecost was driven primarily by increased marketdecreases in benchmark interest rates. The impact of declines in benchmark rates on the cost of FHLB advances is muted to an extent by the impact of cash flow hedges put in place to manage overall interest sensitivity of the balance sheet. The average balance of advances also increased.decreased by $245 million for the three months ended March 31, 2020 compared to the three months ended March 31, 2019.
For the three months ended March 31, 2020, the increase in average non-interest bearing demand deposits as a percentage of total deposits positively impacted the net interest margin.
While we currently expect the net interest margin to expand in the second quarter of 2020, primarily as a result of an expected decline in deposit costs, over a longer time horizon, a persistent flat yield curve and a potential increase in non-performing loans attributable to the impact of the COVID-19 pandemic could put pressure on the net interest margin.
Provision for LoanCredit Losses
The provision for loancredit losses is the amount of expense that, based on our judgment, isa charge to earnings required to maintain the ALLLACL at an adequatea level to absorb probableconsistent with management’s estimate of expected credit losses inherent in the loan portfolioon financial assets carried at amortized cost at the balance sheet date and that, in management’s judgment, is appropriate under GAAP.date. The amount of the provision is impacted by changes in management's reasonable and supportable economic forecast, loan growth,originations and runoff, changes in portfolio mix, historical loss rates,risk rating migration and portfolio seasoning, the level of charge-offs, andchanges in specific reserves, changes in expected prepayment speeds and other assumptions. The provision for impaired loans, and management's evaluation of qualitative factors in the determination of general reserves.credit losses also includes an amount related to off-balance sheet credit exposures. The determination of the amount of the ALLLACL is complex and involves a high degree of judgment and subjectivity. Our determination of the amount of the allowance and corresponding provision for loan losses considers ongoing evaluations of the credit quality of and level of credit risk inherent in various segments of the loan portfolio and of individually significant credits, levels of non-performing loans and charge-offs, historical and statistical trends and economic and other relevant factors. See “Analysis of the Allowance for Loan and LeaseCredit Losses” below for more information about how we determine the appropriate level of the allowance.ACL.
For the quartersthree months ended September 30,March 31, 2020, the provision for credit losses totaled $125.4 million, which included $3.6 million related to off-balance sheet credit exposures. The provision for credit losses for the three months ended March 31, 2020 reflected the implementation of the CECL methodology and management's estimate of the expected negative economic impact of the COVID-19 pandemic. The provision included approximately $93 million related to changes in the economic forecast since the initial adoption of CECL on January 1, 2020 and was impacted by an increase of approximately $16 million in specific reserves during the quarter, which we believe was also exacerbated by the COVID-19 pandemic. Most of the increase in specific reserves related to credits in the Bridge franchise finance portfolio segment. The provision for credit losses, excluding the portion related to off-balance sheet credit exposures, was 0.53% of average loans for the three months ended March 31, 2020.
For the three months ended March 31, 2019, and 2018, the Company recorded provisions for loan losses of $1.8 million and $1.2 million, respectively. For the nine months ended September 30, 2019 and 2018, the Company recorded provisions for loan losses of $9.4 million and $13.3 million, respectively. The provision for the quarter and nine months ended September 30, 2018 included a net recovery of $1.8 million and a provision of $12.2 million, respectively, related to taxi medallion loans.
Excluding the net recovery related to taxi medallion loans, the provision for loan losses, decreased by $1.3 million forunder the quarter ended September 30, 2019, as comparedincurred loss methodology, of $10.3 million.
The evolving COVID-19 situation may lead to the quarter ended September 30, 2018. Significant factors contributing to this decreaseincreased volatility in the provision for loancredit losses included (i)and if economic forecasts deteriorate further as a decrease in the provision related to specific reserves; offset by (ii) an increase in the provision related to criticized and classified assets not individually evaluated for impairment.
Factors contributing to the decrease inresult of COVID-19, the provision for loancredit losses forand the nine months ended September 30, 2019, as compared to the nine months ended September 30, 2018 included (i) the reduction in the provision related to taxi medallion loans; (ii) a net decrease in the non-taxi provision related to specific reserves and criticized and classified loans not individually evaluated for impairment; offset by (iii) increases related to the relative impact on the provision of changes in certain quantitative and qualitative loss factors.ACL could increase.
Non-Interest Income
The following table presents a comparison of the categories of non-interest income for the periods indicated (in thousands):
|
| | | | | | | | | | | | | | | |
| | Three Months Ended September 30, | | Nine Months Ended September 30, |
| | 2019 | | 2018 | | 2019 | | 2018 |
| Income from resolution of covered assets, net | $ | — |
| | $ | 3,134 |
| | $ | — |
| | $ | 10,689 |
|
| Net gain (loss) on FDIC indemnification | — |
| | 3,090 |
| | — |
| | (1,925 | ) |
| Gain on sale of covered loans, net | — |
| | 5,037 |
| | — |
| | 4,739 |
|
| Non-interest income related to the impact of transactions in the formerly covered assets | — |
| | 11,261 |
| | — |
| | 13,503 |
|
| | | | | | | | |
| Deposit service charges and fees | 4,269 |
| | 3,723 |
| | 12,389 |
| | 10,811 |
|
| Gain on sale of non-covered loans, net | 5,163 |
| | 3,654 |
| | 10,220 |
| | 8,221 |
|
| Gain on investment securities, net | 3,835 |
| | 432 |
| | 13,736 |
| | 2,938 |
|
| Lease financing | 18,583 |
| | 14,091 |
| | 52,774 |
| | 45,685 |
|
| Other non-interest income | 6,006 |
| | 5,574 |
| | 20,329 |
| | 17,536 |
|
| | 37,856 |
| | 27,474 |
| | 109,448 |
| | 85,191 |
|
| Non-interest income | $ | 37,856 |
| | $ | 38,735 |
| | $ | 109,448 |
| | $ | 98,694 |
|
|
| | | | | | | |
| | Three Months Ended March 31, |
| | 2020 | | 2019 |
| Deposit service charges and fees | $ | 4,186 |
| | $ | 3,830 |
|
| Gain on sale of loans, net | 3,466 |
| | 2,936 |
|
| Gain (loss) on investment securities, net | (3,453 | ) | | 5,785 |
|
| Lease financing | 15,481 |
| | 17,186 |
|
| Other non-interest income | 3,618 |
| | 6,518 |
|
| Non-interest income | $ | 23,298 |
| | $ | 36,255 |
|
Declines in income from resolution of covered assets, net, net gain (loss) on FDIC indemnification andThe gain on sale of covered loans net resulted from the termination of the Single Family Shared-Loss Agreement in February, 2019.
The most significant contributor to the increases in deposit service charges and fees was higher treasury management fee income, beginning to reflect the implementation of our BankUnited 2.0 initiative.
The most significant components of gain on sale of non-covered loans are (i) gains from the sale of Pinnacle loans totaling $2.4 million for both the three and nine months ended September 30, 2019; (ii)March 31, 2020 included gains on sales of the guaranteed portions of SBA loans totaling $1.5$1.2 million and $4.1 million for the three and nine months ended September 30, 2019, respectively, compared to $3.2 million and $7.4 million for the three and nine months ended September 30, 2018, respectively; and (iii) gains on sale of government-insuredgovernment insured residential loans totaling $1.3 million and $3.5 million$2.3 million.
The loss on investment securities for the three and nine months ended September 30, 2019, respectively, compared to $0.4March 31, 2020 included $5.0 million and $0.6of unrealized losses on marketable equity securities, likely resulting from the impact on markets of the COVID-19 pandemic, offset by $1.5 million in realized gains on available for the three and nine months ended September 30, 2018, respectively.
Gainsale securities. The gain on investment securities, net for the three and nine months ended September 30,March 31, 2019 reflected net realized gains of $3.4$4.3 million and $11.7 million, respectively, from the sale of investment securities available for sale and net unrealized gains on marketable equity securities of $0.4 million and $2.1 million, respectively. Sales of securities during the quarter and nine month periods related primarily to ongoing management of the Company's liquidity position and the duration and risk/return profile of the portfolio.$1.5 million.
Period over period increasesThe decrease in income from lease financing generally correspondedfor the three months ended March 31, 2020 compared to the growththree months ended March 31, 2019, is primarily attributed to the increase in the portfolio of operating lease equipment.equipment off-lease.
Non-Interest Expense
The following table presents the components of non-interest expense for the periods indicated (in thousands):
|
| | | | | | | |
| | Three Months Ended March 31, |
| | 2020 | | 2019 |
| Employee compensation and benefits | $ | 58,887 |
| | $ | 65,233 |
|
| Occupancy and equipment | 12,369 |
| | 13,166 |
|
| Deposit insurance expense | 4,403 |
| | 4,041 |
|
| Professional fees | 3,204 |
| | 7,871 |
|
| Technology and telecommunications | 12,596 |
| | 11,168 |
|
| Depreciation of operating lease equipment | 12,603 |
| | 11,812 |
|
| Other non-interest expense | 14,806 |
| | 13,399 |
|
| Total non-interest expense | $ | 118,868 |
| | $ | 126,690 |
|
| Less: | | | |
| Depreciation of operating lease equipment | (12,603 | ) | | (11,812 | ) |
| Costs incurred directly related to implementation of BankUnited 2.0 | (79 | ) |
| (5,892 | ) |
Recurring operating expenses (1) | $ | 106,186 |
| | $ | 108,986 |
|
|
| | | | | | | | | | | | | | | |
| | Three Months Ended September 30, | | Nine Months Ended September 30, |
| | 2019 | | 2018 | | 2019 | | 2018 |
| Employee compensation and benefits | $ | 57,102 |
| | $ | 65,612 |
| | $ | 179,586 |
| | $ | 198,185 |
|
| Occupancy and equipment | 14,673 |
| | 13,812 |
| | 42,477 |
| | 42,355 |
|
| Amortization of FDIC indemnification asset | — |
| | 48,255 |
| | — |
| | 132,852 |
|
| Deposit insurance expense | 3,781 |
| | 5,375 |
| | 12,849 |
| | 14,810 |
|
| Professional fees | 2,923 |
| | 5,240 |
| | 17,731 |
| | 10,772 |
|
| Technology and telecommunications | 10,994 |
| | 9,262 |
| | 34,175 |
| | 26,121 |
|
| Depreciation of equipment under operating lease | 11,582 |
| | 9,870 |
| | 34,883 |
| | 28,662 |
|
| Loss on debt extinguishment | 3,796 |
| | — |
| | 3,796 |
| | — |
|
| Other non-interest expense | 16,455 |
| | 13,372 |
| | 42,584 |
| | 40,105 |
|
| | $ | 121,306 |
| | $ | 170,798 |
| | $ | 368,081 |
| | $ | 493,862 |
|
Amortization of FDIC indemnification asset
The FDIC indemnification asset was amortized to zero during the fourth quarter of 2018 in light of the expected termination of the Single Family Shared-Loss Agreement
| |
| (1) | Recurring operating expenses is a non-GAAP measure. See section entitled "Non-GAAP Financial Measures" below for reconciliation of non-GAAP financial measurements to their comparable GAAP financial measurements. |
Employee compensation and benefits
Employee compensation and benefits declined by $8.5 million and $18.6$6.3 million for the three and nine months ended September 30, 2019 relativeMarch 31, 2020 as compared to the comparable periods of the prior year,three months ended March 31, 2019, primarily due to a reduction in headcount.headcount and a decrease in equity based compensation expense related to the impact of a declining stock price on liability-classified awards.
Professional fees
Professional fees decreased by $2.3$4.7 million for the three months ended September 30, 2019March 31, 2020 as compared to the three months ended September 30, 2018 and increased by $7.0 million during the nine months ended September 30, 2019 comparedMarch 31, 2019. The decrease was primarily due to the nine months ended September 30, 2018. The decreaseconsulting services in professional fees for the three month periods was primarily attributable to fees incurred related to the implementation of CECL and certain technology projects during the third quarter of 2018. Professional fees for the nine months ended September 30, 2019 included $10.7 million in consulting services related to our BankUnited 2.0 initiative.
Technology and telecommunications
Increased technology and telecommunications expense related primarily to investments we are making in cloud technology, our digital platforms, data initiatives and enhancement of some of our risk management capabilities.
Loss on debt extinguishment
The loss on debt extinguishment in the third quarter of 2019 related to the extinguishment of certain higher cost FHLB advances.
Other non-interest expense
The most significant components of other non-interest expense are advertising, promotion and business development, costs related to lending activities, loan servicing and deposit generation, insurance, expenses related to workouts and foreclosures, regulatory examination assessments, travel and general office expense. Other non-interest expense for both
We currently expect to incur near-term costs of approximately $1 million related directly to COVID-19, the quarter and nine months ended September 30, 2019 included a loss on the salemost significant of one commercial OREO property of $2.4 million.
Costs incurred directlywhich include additional software licenses related to our participation in the implementation of our BankUnited 2.0 initiative during the threePPP, laptops and nine months ended September 30, 2019 included professional fees of $0.4 millionother equipment to facilitate employees working remotely and $10.7 million, respectively; branch closure expenses of $1.0 millioncosts related to cleaning, sanitizing and $2.3 million, respectively; and severance costs of $0.6 million and $1.5 million, respectively.personal protective equipment.
Income Taxes
The effective income tax rate was 24.1% and 25.3% for the quarter and nine months ended September 30, 2019. The effective income tax rate differed from the statutory federal income tax rate of 21% for the quarter and nine months ended September 30, 2019 due primarilySee Note 5 to the impact of stateconsolidated financial statements for information about income taxes, partially offset by the benefit of income not subject to federal tax.taxes.
Analysis of Financial Condition
Average interest-earning assets increased $2.3 billion$613 million to $31.3$31.6 billion for the ninethree months ended September 30, 2019March 31, 2020 from $29.0$31.0 billion for the ninethree months ended September 30, 2018.March 31, 2019. This increase was driven by an $874a $876 million increase in the average balance of outstanding loans, andoffset by a $1.4 billion increase$413 million decrease in the average balance of investment securities. A $290 million decrease in average non-interest earning assets was primarily attributed to (i) the decrease in the FDIC indemnification asset, which was amortized to zero during the fourth quarter of 2018 and (ii) a decrease in income taxes receivable related to a discrete income tax benefit recognized during the fourth quarter of 2017, partially offset by (iii) the recognition of the ROU asset subsequent to the adoption of ASU 2016-02 effective January 1, 2019.
Average interest bearing liabilities increased $1.5decreased $232 million to $25.0 billion tofor the three months ended March 31, 2020 from $25.3 billion for the ninethree months ended September 30,March 31, 2019, from $23.8 billion for the nine months ended September 30, 2018, due primarily to decreases in average FHLB advances and short term borrowings of $245 million and $43 million, respectively; offset by an increase of $1.1 billion$32 million in average interest bearing
deposits. Average non-interest bearing deposits increased by $508$763 million to $3.8$4.4 billion for the ninethree months ended September 30, 2019.
Average stockholders' equity decreased by $146 million, due primarily to the repurchase of common stock, partially offset by the retention of earnings.
Investment Securities
The following table shows the amortized cost and carrying value, which, with the exception of investment securities held to maturity, is fair value, of investment securities as ofat the dates indicated (in thousands):
| | | | September 30, 2019 | | December 31, 2018 | March 31, 2020 | | December 31, 2019 |
| | Amortized Cost | | Carrying Value | | Amortized Cost | | Carrying Value | Amortized Cost | | Carrying Value | | Amortized Cost | | Carrying Value |
| U.S. Treasury securities | $ | 70,219 |
| | $ | 70,666 |
| | $ | 39,885 |
| | $ | 39,873 |
| $ | 75,238 |
| | $ | 76,154 |
| | $ | 70,243 |
| | $ | 70,325 |
|
| U.S. Government agency and sponsored enterprise residential MBS | 1,961,011 |
| | 1,969,141 |
| | 1,885,302 |
| | 1,897,474 |
| 2,209,715 |
| | 2,180,898 |
| | 2,018,853 |
| | 2,022,175 |
|
| U.S. Government agency and sponsored enterprise commercial MBS | 336,608 |
| | 340,590 |
| | 374,569 |
| | 374,787 |
| 369,967 |
| | 376,492 |
| | 366,787 |
| | 370,976 |
|
| Private label residential MBS and CMOs | 1,295,234 |
| | 1,315,185 |
| | 1,539,058 |
| | 1,534,198 |
| 1,185,539 |
| | 1,173,880 |
| | 1,001,337 |
| | 1,012,177 |
|
| Private label commercial MBS | 1,622,198 |
| | 1,632,098 |
| | 1,486,835 |
| | 1,485,716 |
| 1,728,610 |
| | 1,604,814 |
| | 1,719,228 |
| | 1,724,684 |
|
| Single family rental real estate-backed securities | 491,728 |
| | 496,698 |
| | 406,310 |
| | 402,458 |
| 549,981 |
| | 528,793 |
| | 467,459 |
| | 470,025 |
|
| Collateralized loan obligations | 1,204,888 |
| | 1,198,233 |
| | 1,239,355 |
| | 1,235,198 |
| 1,169,469 |
| | 1,094,793 |
| | 1,204,905 |
| | 1,197,366 |
|
| Non-mortgage asset-backed securities | 202,098 |
| | 204,566 |
| | 204,372 |
| | 204,067 |
| 265,444 |
| | 255,161 |
| | 194,171 |
| | 194,904 |
|
| State and municipal obligations | 264,108 |
| | 280,785 |
| | 398,810 |
| | 398,429 |
| 255,602 |
| | 271,033 |
| | 257,528 |
| | 273,302 |
|
| SBA securities | 384,677 |
| | 388,240 |
| | 514,765 |
| | 519,313 |
| 262,661 |
| | 260,388 |
| | 359,808 |
| | 362,731 |
|
| Other debt securities | 1,338 |
| | 4,471 |
| | 1,393 |
| | 4,846 |
| |
| Investment securities held to maturity | 10,000 |
| | 10,000 |
| | 10,000 |
| | 10,000 |
| 10,000 |
| | 10,000 |
| | 10,000 |
| | 10,000 |
|
| | $ | 7,844,107 |
| | 7,910,673 |
| | $ | 8,100,654 |
| | 8,106,359 |
| $ | 8,082,226 |
| | 7,832,406 |
| | $ | 7,670,319 |
| | 7,708,665 |
|
| Marketable equity securities | | | 59,983 |
| | | | 60,519 |
| | | 42,195 |
| | | | 60,572 |
|
| | | | $ | 7,970,656 |
| | | | $ | 8,166,878 |
| | | $ | 7,874,601 |
| | | | $ | 7,769,237 |
|
Our investment strategy has focused on insuring adequate liquidity, maintaining a suitable balance of high credit quality, diverse assets, managing interest rate risk, and generating acceptable returns given our established risk parameters. We have sought to maintain liquidity by investing a significant portion of the portfolio in high quality liquid securities including U.S. Treasury securities, GNMA securities, SBA securities and U.S. Government Agency MBS. Investment grade municipal securities provide liquidity and attractive tax-equivalent yields. We have also invested in highly rated structured products, including private-label commercial and residential MBS, collateralized loan obligations, single family rental real estate-backed securities and non-mortgage asset-backed securities that, while somewhat less liquid, provide us with attractive yields. Relatively short effective portfolio duration helps mitigate interest rate risk. Based on the Company’s assumptions, the estimated weighted average life of the investment portfolio as of September 30, 2019March 31, 2020 was 4.64.3 years. The effective duration of the investment portfolio as of September 30, 2019March 31, 2020 was 1.4 years.1.3 years . The model results are based on assumptions that may differ from actual results.
The following table shows the scheduled maturities, carrying values and current yields for investment securities available for sale as of September 30, 2019, as well as the carrying value and yield of marketable equity securities. Scheduled maturities have been adjusted for anticipated prepayments when applicable. Yields on tax-exempt securities have been calculated on a tax-equivalent basis, based on a federal income tax rate of 21% (dollars in thousands):
|
| | | | | | | | | | | | | | | | | | | | | | | | | | | | | | | | | | |
| | Within One Year | | After One Year Through Five Years | | After Five Years Through Ten Years | | After Ten Years | | Total |
| | Carrying Value | | Weighted Average Yield | | Carrying Value | | Weighted Average Yield | | Carrying Value | | Weighted Average Yield | | Carrying Value | | Weighted Average Yield | | Carrying Value | | Weighted Average Yield |
| U.S. Treasury securities | $ | 70,666 |
| | 2.06 | % | | $ | — |
| | — | % | | $ | — |
| | — | % | | $ | — |
| | — | % | | $ | 70,666 |
| | 2.06 | % |
| U.S. Government agency and sponsored enterprise residential MBS | 156,345 |
| | 2.76 | % | | 891,810 |
| | 2.65 | % | | 760,593 |
| | 2.60 | % | | 160,393 |
| | 2.61 | % | | 1,969,141 |
| | 2.64 | % |
| U.S. Government agency and sponsored enterprise commercial MBS | 4,136 |
| | 3.45 | % | | 34,417 |
| | 3.31 | % | | 188,690 |
| | 2.88 | % | | 113,347 |
| | 3.40 | % | | 340,590 |
| | 3.10 | % |
| Private label residential MBS and CMOs | 290,964 |
| | 3.69 | % | | 759,741 |
| | 3.62 | % | | 224,907 |
| | 3.50 | % | | 39,573 |
| | 3.70 | % | | 1,315,185 |
| | 3.63 | % |
| Private label commercial MBS | 51,656 |
| | 3.97 | % | | 1,286,116 |
| | 3.56 | % | | 272,121 |
| | 3.07 | % | | 22,205 |
| | 2.79 | % | | 1,632,098 |
| | 3.48 | % |
| Single family rental real estate-backed securities | 13,695 |
| | 3.00 | % | | 127,371 |
| | 3.16 | % | | 355,632 |
| | 3.05 | % | | — |
| | — | % | | 496,698 |
| | 3.08 | % |
| Collateralized loan obligations | 6,303 |
| | 3.66 | % | | 883,582 |
| | 3.63 | % | | 308,348 |
| | 4.10 | % | | — |
| | — | % | | 1,198,233 |
| | 3.75 | % |
| Non-mortgage asset-backed securities | 15,267 |
| | 4.11 | % | | 116,511 |
| | 3.16 | % | | 72,211 |
| | 2.87 | % | | 577 |
| | 3.22 | % | | 204,566 |
| | 3.13 | % |
| State and municipal obligations | 1,574 |
| | 1.96 | % | | 33,422 |
| | 2.77 | % | | 197,399 |
| | 3.99 | % | | 48,390 |
| | 4.09 | % | | 280,785 |
| | 3.84 | % |
| SBA securities | 73,388 |
| | 3.45 | % | | 185,535 |
| | 3.36 | % | | 88,631 |
| | 3.31 | % | | 40,686 |
| | 3.26 | % | | 388,240 |
| | 3.35 | % |
| Other debt securities | — |
| | — | % | | — |
| | — | % | | — |
| | — | % | | 4,471 |
| | 13.86 | % | | 4,471 |
| | 13.85 | % |
| | $ | 683,994 |
| | 3.29 | % | | $ | 4,318,505 |
| | 3.36 | % | | $ | 2,468,532 |
| | 3.15 | % | | $ | 429,642 |
| | 3.19 | % | | 7,900,673 |
| | 3.28 | % |
| Marketable equity securities with no scheduled maturity | |
| | |
| | |
| | |
| | |
| | |
| | |
| | |
| | 59,983 |
| | 7.24 | % |
| Total investment securities available for sale and marketable equity securities | |
| | |
| | |
| | |
| | |
| | |
| | |
| | |
| | $ | 7,960,656 |
| | 3.31 | % |
The investment securities available for sale portfolio was in a net unrealized gainloss position of $66.6$249.8 million at September 30, 2019March 31, 2020 with aggregate fair value equal to 100.8%96.9% of amortized cost. Net unrealized gainslosses included $83.0$41.4 million of gross unrealized gains and $16.4$291.2 million of gross unrealized losses. Investment securities available for sale in an unrealized loss position at September 30, 2019March 31, 2020 had an aggregate fair value of $2.4$6.0 billion. At September 30, 2019, 98.9%The majority of investment securities available for salethe unrealized losses at March 31, 2020 related to the private label CMBS and CLO portfolio segments, which were backed by the U.S. Government, U.S. Government agencies or sponsored enterprises orin net unrealized loss positions of $123.8 million and $74.7 million, respectively. Unrealized losses at March 31, 2020 were rated AAA, AA or A, based on the most recent third-party ratings. Investment securities available for sale totaling $80 million were not rated at September 30, 2019. These securities have been determined by managementprimarily attributable to be of investment grade quality. Additionally, $8 million of securities acquired at substantial discountswidening spreads, resulting in large part from market response to, and dislocation in the FSB acquisition were rated below investment grade or not ratedwake of, the emerging COVID-19 pandemic. The ratings distribution of our AFS securities portfolio at September 30, 2019, all of which were heldMarch 31, 2020 is depicted in significant unrealized gain positions.the chart below:
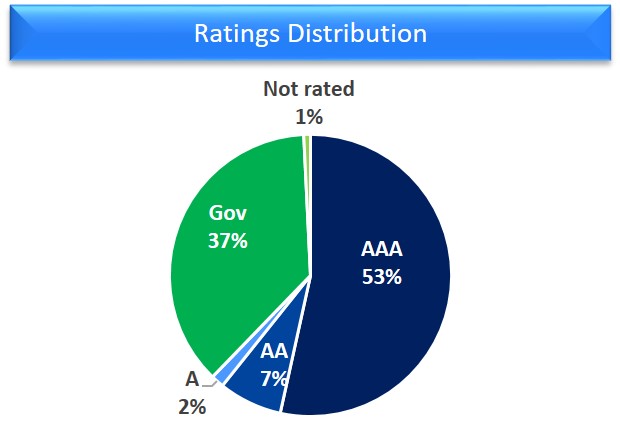
We evaluate the credit quality of individual securities in the portfolio quarterly to determine whether anywe expect to recover the amortized cost basis of the investments in unrealized loss positions are other-than-temporarily impaired.positions. This evaluation considers, but is not necessarily limited to, the following factors, the relative significance of which varies depending on the circumstances pertinent to each individual security:
our intentwhether we intend to holdsell the security until maturity or for a periodprior to recovery of time sufficient for a recovery in value;its amortized cost basis;
whether it is more likely than not that we will be required to sell the security prior to recovery of its amortized cost basis;
the length of time andThe extent to which fair value has beenis less than amortized cost;
adverse changesAdverse conditions specifically related to the security, an industry or geographic area;
Changes in expected cash flows;the financial condition of the issuer or underlying loan obligors;
collateral values and performance;
theThe payment structure and remaining payment terms of the security, including levels of subordination or over-collateralization;
changes in the economic or regulatory environment;
the general market conditionFailure of the geographic area or industry of the issuer;issuer to make scheduled payments;
the issuer’s financial condition, performance and business prospects; and
changesChanges in credit ratings.ratings;
Relevant market data;
Estimated prepayments, defaults, and the value and performance of underlying collateral at the individual security level.
No securities were determined to be other-than-temporarilycredit loss impaired at September 30, 2019 and 2018.
during the three months ended March 31, 2020 or other than temporarily impaired during the three months ended March 31, 2019. We do not intend to sell securities in significant unrealized loss positions at September 30, 2019.March 31, 2020. Based on an assessment of our liquidity position and internal and regulatory guidelines for permissible investments and concentrations, it is not more likely than not that we will be required to sell securities in significant unrealized loss positions prior to recovery of amortized cost basis. Unrealized losses in the portfoliobasis, which may be at September 30, 2019 were primarily attributable to widening spreads and in some cases, increases in market interest rates subsequent to the date the securities were acquired.
At September 30, 2019, 85%, 12% and 3% of CLOs were rated AAA, AA and A, respectively, based on the most recent third-party ratings, with a weighted-average subordination level at 41.1%, ranging from 35.7% to 46.0%. Management performs a thorough analysis prior to purchasing CLOs, including extensive vetting of the asset manager and stress testing of collateral. Management engages an independent third party to perform ongoing credit surveillance of the CLO portfolio, performs periodic stress testing of the portfolio and continuously monitors exposure, default status, and other relevant security characteristics.maturity.
The timely repaymentpayment of principal and interest on SBA securities issued by the U.S. government, U.S. government agencies and U.S. Government agency andgovernment sponsored enterprise securities in unrealized loss positionsenterprises is explicitly or implicitly guaranteed by the full faith and credit of the U.S. Government. Management performed projected cash flow analysesAs such, there is an assumption of zero credit loss and the Company expects to recover the entire amortized cost basis of these securities.
None of our impaired private label residential MBSsecurities had missed principal or interest payments or had been downgraded by a NRSRO at March 31, 2020. The Company performed an analysis comparing the present value of cash flows expected to be collected to the amortized cost basis of impaired securities. This analysis was based on a scenario that we believe to be generally
more severe than our reasonable and CMOs, private label commercial MBS, collateralized loan obligationssupportable economic forecast at March 31, 2020, and non-mortgage asset-backed securities in unrealized loss positions, incorporating CUSIP levelincorporated assumptions consistent withabout voluntary prepayment rates, collateral defaults, delinquencies, severity and other relevant factors. Our analysis also considered the collateralstructural characteristics of each security including collateral default rate, voluntary prepayment rate, severity and delinquency assumptions.the level of credit enhancement provided by that structure. Based on the results of this analysis, nowe expect to recover the entire amortized cost basis of the impaired private label AFS securities. Further information about the portfolio segments evidencing the largest unrealized losses at March 31, 2020, the CMBS and CLO portfolio segments, follows.
For private label CMBS, our analysis of cash flows expected to be collected incorporated assumptions about collateral default rates, voluntary prepayment rates, loss severity, delinquencies and recovery lag. In developing those assumptions, we took into account collateral quality and type, loan size, loan purpose and other qualitative factors. We also regularly monitor collateral watchlisted, bankruptcy data, special servicing trends, delinquency and other economic data which would indicate further stress in the sector.
For CLOs, our analysis of cash flows expected to be collected incorporated assumptions about collateral default rates, loss severity, and delinquencies, calibrated to take into account idiosyncratic risks associated with the underlying collateral. In developing those assumptions, we took into account each sector’s performance pre, during and post the 2008 financial crisis. We regularly engage with bond managers to monitor trends in underlying collateral including potential downgrades and subsequent cash flow diversions, liquidity, ratings migration, and any other relevant developments.
The following table presents the distribution of the third-party ratings and subordination levels compared to average stress scenario losses based on our credit losses were projected. Management'sloss impairment analysis of the credit characteristics of individual securitiesCMBS and the underlying collateral and levels of subordination for each of the single family rental real estate-backed securities in unrealized loss positions is not indicative of projected credit losses.CLOs at March 31, 2020:
|
| | | | | | | | | | | | | | | | |
| | | | | | Subordination | | Weighted Average Stress Scenario Loss |
| | Rating | | Percent of Total | | Minimum | | Maximum | | Average | |
| Private label CMBS | AAA | | 82.0 | % | | 25.7 | % | | 43.5 | % | | 43.1 | % | | 13.5 | % |
| | AA | | 12.0 | % | | 30.4 | % | | 85.9 | % | | 39.5 | % | | 12.3 | % |
| | A | | 6.0 | % | | 21.5 | % | | 73.6 | % | | 34.3 | % | | 12.3 | % |
| Weighted average | | | 100.0 | % | | 26.0 | % | | 50.4 | % | | 42.2 | % | | 13.2 | % |
| | | | | | | | | | | | |
| CLOs | AAA | | 84.0 | % | | 36.0 | % | | 48.1 | % | | 43.2 | % | | 21.0 | % |
| | AA | | 13.0 | % | | 27.8 | % | | 40.3 | % | | 32.8 | % | | 22.3 | % |
| | A | | 3.0 | % | | 25.6 | % | | 29.4 | % | | 27.0 | % | | 23.9 | % |
| Weighted average | | | 100.0 | % | | 34.6 | % | | 46.5 | % | | 41.3 | % | | 21.3 | % |
For further discussion of our analysis of impaired investment securities AFS for OTTI,credit loss impairment see Note 3 to the consolidated financial statements.
Valuations of our investment securities AFS have started to recover subsequent to March 31, 2020. The following table shows the net unrealized loss and carrying value of our AFS securities at the dates indicated:
|
| | | | | | | | | | | | | | | |
| | March 31, 2020 | | April 22, 2020 (1) |
| | Net Unrealized Gain (Loss) | | Carrying Value | | Net Unrealized Gain (Loss) | | Carrying Value |
| U.S. Treasury securities | $ | 916 |
| | $ | 76,154 |
| | $ | 2,048 |
| | $ | 77,285 |
|
| U.S. Government agency and sponsored enterprise residential MBS | (28,817 | ) | | 2,180,898 |
| | (3,101 | ) | | 2,163,922 |
|
| U.S. Government agency and sponsored enterprise commercial MBS | 6,525 |
| | 376,492 |
| | 6,185 |
| | 376,152 |
|
| Private label residential MBS and CMOs | (11,659 | ) | | 1,173,880 |
| | (3,868 | ) | | 1,181,671 |
|
| Private label commercial MBS | (123,796 | ) | | 1,604,814 |
| | (118,430 | ) | | 1,610,180 |
|
| Single family rental real estate-backed securities | (21,188 | ) | | 528,793 |
| | (3,697 | ) | | 546,284 |
|
| Collateralized loan obligations | (74,676 | ) | | 1,094,793 |
| | (70,086 | ) | | 1,099,384 |
|
| Non-mortgage asset-backed securities | (10,283 | ) | | 255,161 |
| | (4,342 | ) | | 261,103 |
|
| State and municipal obligations | 15,431 |
| | 271,033 |
| | 14,437 |
| | 270,039 |
|
| SBA securities | (2,273 | ) | | 260,388 |
| | (2,310 | ) | | 260,350 |
|
| | $ | (249,820 | ) | | $ | 7,822,406 |
| | $ | (183,164 | ) | | $ | 7,846,370 |
|
(1) Investments AFS held at March 31, 2020 valued as of April 22, 2020. We use third-party pricing services to assist us in estimating the fair value of investment securities. We perform a variety of procedures to ensure that we have a thorough understanding of the methodologies and assumptions used by the pricing services including obtaining and reviewing written documentation of the methods and assumptions employed, conducting interviews with valuation desk personnel and reviewing model results and detailed assumptions used to value selected securities as considered necessary. Our classification of prices within the fair value hierarchy is based on an evaluation of the nature of the significant assumptions impacting the valuation of each type of security in the portfolio. We have established a robust price challenge process that includes a review by our treasury front office of all prices provided on a monthly basis. Any price evidencing unexpected month over month fluctuations or deviations from our expectations based on recent observed trading activity and other information available in the marketplace that would impact the value of the security is challenged. Responses to the price challenges, which generally include specific information about inputs and assumptions incorporated in the valuation and their sources, are reviewed in detail. If considered necessary to resolve any discrepancies, a price will be obtained from additional independent valuation sources. We do not typically adjust the prices provided, other than through this established challenge process. Our primary pricing services utilize observable inputs when available, and employ unobservable inputs and proprietary models only when observable inputs are not available. As a matter of course, the services validate prices by comparison to recent trading activity whenever such activity exists. Quotes obtained from the pricing services are typically non-binding.
We have also establishedhave a quarterly price validation process to assess the propriety of the pricing methodologies utilized by our primary pricing services by independently verifying the prices of a sample of securities in the portfolio. Sample sizes vary based on the type of security being priced, with higher sample sizes applied to more difficult to value security types. Verification procedures may consist of obtaining prices from an additional outside source. We have established acceptable percentage deviations from the price provided by the initial pricing source. If deviations fall outside the established parameters, we will obtain and evaluate more detailed information about the assumptions and inputs used by each pricing source or, if considered necessary, employ an additional valuation source to price the security in question. Pricing issues identified through this evaluation are addressed with the applicable pricing service and methodologies or inputs are revised as determined necessary. Depending on the results of the validation process, sample sizes may be extended for particular classes of securities. Results of the validation process are reviewed by the treasury front office and by senior management.
The majority of our investment securities are classified within level 2 of the fair value hierarchy. U.S. Treasury securities and marketable equity securities are classified within level 1 of the hierarchy. At September 30, 2019We are closely monitoring the impact of the COVID-19 pandemic on markets, and 2018, 0.3%on our ability to price securities in our portfolio. While we have observed increased volatility, we believe the fiscal and 0.6%, respectively,monetary response to the crisis has been effective in supporting liquidity and stabilizing markets. To date, circumstances have not led to a change in the categorization of our investment securities were classifiedfair value estimates within level 3 of the fair value hierarchy. Securities classified within level 3 of the hierarchy at September 30, 2019 included certain private label residential MBS and trust preferred securities. These securities were classified within level 3 of the hierarchy because proprietary assumptions related to voluntary prepayment rates,
default probabilities, loss severities and discount rates were considered significant to the valuation. There were no transfers of investment securities between levels of the fair value hierarchy during the nine months ended September 30, 2019 and 2018.
For additional discussion of the fair values of investment securities, see Note 109 to the consolidated financial statements.
The following table shows the scheduled maturities, carrying values and current yields for investment securities available for sale as of March 31, 2020, as well as the carrying value and yield of marketable equity securities. Scheduled maturities have been adjusted for anticipated prepayments when applicable. Yields on tax-exempt securities have been calculated on a tax-equivalent basis, based on a federal income tax rate of 21% (dollars in thousands):
|
| | | | | | | | | | | | | | | | | | | | | | | | | | | | | | | | | | |
| | Within One Year | | After One Year Through Five Years | | After Five Years Through Ten Years | | After Ten Years | | Total |
| | Carrying Value | | Weighted Average Yield | | Carrying Value | | Weighted Average Yield | | Carrying Value | | Weighted Average Yield | | Carrying Value | | Weighted Average Yield | | Carrying Value | | Weighted Average Yield |
| U.S. Treasury securities | $ | 76,154 |
| | 1.71 | % | | $ | — |
| | — | % | | $ | — |
| | — | % | | $ | — |
| | — | % | | $ | 76,154 |
| | 1.71 | % |
| U.S. Government agency and sponsored enterprise residential MBS | 245,599 |
| | 1.43 | % | | 961,575 |
| | 1.64 | % | | 795,467 |
| | 1.59 | % | | 178,257 |
| | 1.60 | % | | 2,180,898 |
| | 1.62 | % |
| U.S. Government agency and sponsored enterprise commercial MBS | 2,753 |
| | 2.36 | % | | 43,245 |
| | 2.55 | % | | 211,451 |
| | 1.78 | % | | 119,043 |
| | 2.43 | % | | 376,492 |
| | 2.07 | % |
| Private label residential MBS and CMOs | 339,172 |
| | 3.49 | % | | 662,488 |
| | 3.30 | % | | 137,380 |
| | 3.04 | % | | 34,840 |
| | 2.77 | % | | 1,173,880 |
| | 3.31 | % |
| Private label commercial MBS | 67,845 |
| | 3.67 | % | | 1,192,461 |
| | 2.53 | % | | 326,299 |
| | 2.63 | % | | 18,209 |
| | 2.78 | % | | 1,604,814 |
| | 2.60 | % |
| Single family rental real estate-backed securities | 6,132 |
| | 3.11 | % | | 221,317 |
| | 2.85 | % | | 301,344 |
| | 2.58 | % | | — |
| | — | % | | 528,793 |
| | 2.69 | % |
| Collateralized loan obligations | 17,103 |
| | 2.72 | % | | 916,875 |
| | 3.01 | % | | 160,815 |
| | 3.60 | % | | — |
| | — | % | | 1,094,793 |
| | 3.10 | % |
| Non-mortgage asset-backed securities | 37,330 |
| | 3.05 | % | | 151,034 |
| | 2.84 | % | | 64,917 |
| | 2.59 | % | | 1,880 |
| | 2.64 | % | | 255,161 |
| | 2.80 | % |
| State and municipal obligations | 11,584 |
| | 2.45 | % | | 18,369 |
| | 3.03 | % | | 195,302 |
| | 3.99 | % | | 45,778 |
| | 4.08 | % | | 271,033 |
| | 3.87 | % |
| SBA securities | 53,949 |
| | 2.57 | % | | 131,222 |
| | 2.52 | % | | 55,521 |
| | 2.47 | % | | 19,696 |
| | 2.38 | % | | 260,388 |
| | 2.51 | % |
| | $ | 857,621 |
| | 2.65 | % | | $ | 4,298,586 |
| | 2.59 | % | | $ | 2,248,496 |
| | 2.38 | % | | $ | 417,703 |
| | 2.29 | % | | 7,822,406 |
| | 2.52 | % |
| Marketable equity securities with no scheduled maturity | |
| | |
| | |
| | |
| | |
| | |
| | |
| | |
| | 42,195 |
| | 7.34 | % |
| Total investment securities available for sale and marketable equity securities | |
| | |
| | |
| | |
| | |
| | |
| | |
| | |
| | $ | 7,864,601 |
| | 2.54 | % |
Loans Held for Sale
Loans held for sale at September 30, 2019March 31, 2020 included $26$18 million of the guaranteed portion of SBA loans held for sale in the secondary marketmarket. At December 31, 2019, loans held for sale included $28.6 million of the SBA loans held for sale and $20$9.3 million of other commercial loans transferred to held for sale. At December 31, 2018, loans held for sale consisted entirely of the guaranteed portion of SBA loans. SBA loans are generally sold with servicing retained.
Loans
The loan portfolio comprises the Company’s primary interest-earning asset. The following tables show the composition of the loan portfolio at the dates indicated. Amounts include premiums, discounts and deferred fees and costsindicated (dollars in thousands):
| | | | | | | | | | | March 31, 2020 | | December 31, 2019 |
| | September 30, 2019 | | December 31, 2018 | Total | | Percent of Total | | Total | | Percent of Total |
| Residential and other consumer loans | $ | 5,571,104 |
| | 24.4 | % | | $ | 4,948,989 |
| | 22.5 | % | $ | 5,634,823 |
| | 24.4 | % | | $ | 5,661,119 |
| | 24.5 | % |
| Multi-family | 2,221,525 |
| | 9.7 | % | | 2,585,421 |
| | 11.8 | % | 1,967,578 |
| | 8.5 | % | | 2,217,705 |
| | 9.6 | % |
| Non-owner occupied commercial real estate | 4,789,673 |
| | 21.0 | % | | 4,611,573 |
| | 21.0 | % | 4,987,798 |
| | 21.5 | % | | 5,030,904 |
| | 21.7 | % |
| Construction and land | 173,345 |
| | 0.8 | % | | 210,516 |
| | 1.0 | % | 222,223 |
| | 1.0 | % | | 243,925 |
| | 1.1 | % |
| Owner occupied commercial real estate | 1,936,516 |
| | 8.5 | % | | 2,007,603 |
| | 9.1 | % | 2,026,510 |
| | 8.7 | % | | 2,062,808 |
| | 8.9 | % |
| Commercial and industrial | 4,477,062 |
| | 19.6 | % | | 4,312,213 |
| | 19.6 | % | 5,008,573 |
| | 21.6 | % | | 4,655,349 |
| | 20.1 | % |
| National commercial lending platforms | | | | | | | | |
| Pinnacle | 1,236,121 |
| | 5.3 | % | | 1,462,655 |
| | 6.6 | % | 1,187,607 |
| | 5.0 | % | | 1,202,430 |
| | 5.2 | % |
| Bridge - franchise finance | 605,896 |
| | 2.6 | % | | 517,305 |
| | 2.4 | % | 647,699 |
| | 2.8 | % | | 627,482 |
| | 2.6 | % |
| Bridge - equipment finance | 682,149 |
| | 3.0 | % | | 636,838 |
| | 2.9 | % | 649,154 |
| | 2.8 | % | | 684,794 |
| | 3.0 | % |
| Small business finance | 256,490 |
| | 1.1 | % | | 252,221 |
| | 1.1 | % | |
| Mortgage warehouse lending | 905,619 |
| | 4.0 | % | | 431,674 |
| | 2.0 | % | 852,313 |
| | 3.7 | % | | 768,472 |
| | 3.3 | % |
| Total loans | 22,855,500 |
| | 100.0 | % | | 21,977,008 |
| | 100.0 | % | 23,184,278 |
| | 100.0 | % | | 23,154,988 |
| | 100.0 | % |
| Allowance for loan and lease losses | (108,462 | ) | | | | (109,931 | ) | | | |
| Allowance for credit losses | | (250,579 | ) | | | | (108,671 | ) | | |
| Loans, net | $ | 22,747,038 |
| | | | $ | 21,867,077 |
| | | $ | 22,933,699 |
| | | | $ | 23,046,317 |
| | |
Total loans increased by $878 million to $22.9 billion at September 30, 2019, from $22.0 billion at DecemberFor the three months ended March 31, 2018.
Residential and other consumer2020, total loans grew by $622$29 million. Commercial and industrial loans grew by $353 million for the nine months ended September 30, 2019, of which $272and mortgage warehouse outstandings increased by $84 million was government insured pool buyout loans. Multi-family loans declined by $364 million for the nine months ended September 30, 2019, primarily due to increased utilization. The majority of this growth was not attributable to draws under existing lines of credit. The decline in multi-family balances was driven primarily by continued run-offrunoff of the New York portfolio, while other categories of commercial real estate loans grew by $141 million. Commercial and industrial loans, inclusive of owner occupied commercial real estate, grew by $94 millionportfolio. Residential activity for the nine months ended September 30, 2019. Growth in the national commercial lending platforms was primarily driven by a $474 million increase in mortgage warehouse outstandings, offset by a decline in Pinnacle resulting from the sale of $168 million in loans during the three months ended September 30, 2019.
IncludedMarch 31, 2020 included purchases of approximately $286 million in multi-familyGNMA early buyout loans, offset by approximately $202 million in re-poolings and non-owner occupied commercial real estatepaydowns. The residential portfolio, excluding GNMA early buyout loans, above were $81experienced a net decline of approximately $111 million and $14 million, respectively,driven by higher prepayment speeds in re-positioning loans at September 30, 2019. These loans, substantially all of which are in New York, provided financing for some level of improvements by the borrower to the underlying collateral to enhance the cash flow generating capacity of the collateral. The primary purpose of these loans was not for construction.
Residential mortgages and other consumer loans
The following table shows the composition of residential and other consumer loans at the dates indicated. Amounts include premiums, discounts and deferred fees and costsindicated (in thousands):
| | | | September 30, 2019 | | December 31, 2018 | March 31, 2020 | | December 31, 2019 |
| 1-4 single family residential | $ | 5,024,628 |
| | $ | 4,664,920 |
| $ | 4,843,908 |
| | $ | 4,953,936 |
|
| Government insured residential | 536,682 |
| | 266,729 |
| 782,060 |
| | 698,644 |
|
| Home equity loans and lines of credits | 1,381 |
| | 1,393 |
| |
| Other consumer loans | 8,413 |
| | 15,947 |
| 8,855 |
| | 8,539 |
|
| | $ | 5,571,104 |
| | $ | 4,948,989 |
| $ | 5,634,823 |
| | $ | 5,661,119 |
|
The 1-4 single family residential loan portfolio, excluding government insured residential loans, is primarily comprised of loans purchased through established correspondent channels. The portfolio also includes loans originated through retail channels prior to the termination of our retail residential mortgage origination business in 2016. 1-4 single family residential mortgage loans are primarily closed-end, first lien jumbo mortgages for the purchase or re-finance of owner occupied property. The loans have terms ranging from 10 to 30 years, with either fixed or adjustable interest rates. At September 30, 2019, $100March 31, 2020, $79 million or 1.8%1.6% of residential mortgage loans were interest-only loans, substantially all of which begin amortizing 10 years after origination. At March 31, 2020, $483 million or 10% were secured by investor-owned properties.
The Company acquires non-performing FHA and VA insured mortgages from third party servicers who have exercised their right to purchase these loans out of GNMA securitizations (collectively, "government insured pool buyout loans" or "buyout loans"). Buyout loans that re-perform, either through modification or self-cure, may be eligible for re-securitization. The Company and the servicer share in the economics of the sale of these loans into new securitizations. The balance of buyout loans totaled $513$760 million at September 30, 2019.March 31, 2020. The Company is not the servicer of these loans.
The following charts present the distribution of the 1-4 single family residential mortgage portfolio at the dates indicated:
The following table presents the five states with the largest geographic concentrations of 1-4 single family residential loans, excluding government insured residential loans, at the dates indicated (dollars in thousands):
| | | | | | | | | | | March 31, 2020 | | December 31, 2019 |
| | September 30, 2019 | | December 31, 2018 | Total | | Percent of Total | | Total | | Percent of Total |
| California | $ | 1,323,089 |
| | 26.3 | % | | $ | 1,177,221 |
| | 25.2 | % | $ | 1,249,564 |
| | 25.8 | % | | $ | 1,280,243 |
| | 25.8 | % |
| New York | 1,041,177 |
| | 20.7 | % | | 977,146 |
| | 20.9 | % | 1,062,712 |
| | 21.9 | % | | 1,057,926 |
| | 21.4 | % |
| Florida | 625,861 |
| | 12.5 | % | | 645,020 |
| | 13.8 | % | 577,494 |
| | 11.9 | % | | 597,359 |
| | 12.1 | % |
| Virginia | 194,268 |
| | 3.9 | % | | 184,756 |
| | 4.0 | % | 187,006 |
| | 3.9 | % | | 189,869 |
| | 3.8 | % |
| DC | 193,080 |
| | 3.8 | % | | 183,211 |
| | 4.0 | % | |
| All others | 1,647,153 |
| | 32.8 | % | | 1,497,566 |
| | 32.1 | % | |
| New Jersey | | 183,749 |
| | 3.8 | % | | 189,018 |
| | 3.8 | % |
| Others | | 1,583,383 |
| | 32.7 | % | | 1,639,521 |
| | 33.1 | % |
| | $ | 5,024,628 |
| | 100.0 | % | | $ | 4,664,920 |
| | 100.0 | % | $ | 4,843,908 |
| | 100.0 | % | | $ | 4,953,936 |
| | 100.0 | % |
Commercial loans and leases
Commercial loans include commercial and industrial loans and leases, loans secured by owner-occupied commercial real-estate, multi-family properties and other income-producing non-owner occupied commercial real estate, and a limited amount of construction and land loans. Management’s loan origination strategy is heavily focused onloans, SBA loans, mortgage warehouse lines of credit, municipal loans and leases originated by Pinnacle and franchise and equipment finance loans and leases originated by Bridge.
The following charts present the distribution of the commercial loan portfolio segment, which comprised 75.6% and 77.5% of loans as of September 30, 2019 and December 31, 2018, respectively.at the dates indicated (dollars in millions):
Commercial real estate loans include term loans secured by owner and non-owner occupied income producing properties including rental apartments, mixed-use properties, industrial properties, retail shopping centers, free-standing single-tenant buildings, office buildings, warehouse facilities, and hotels, as well as real estate secured lines of credit.credit, as well as credit facilities to institutional real estate entities such as REITs and commercial real estate investment funds.
The following charts presenttable presents the distribution of non-owner occupied commercial real estate loans by property type along with weighted average DSCRs and LTVs at March 31, 2020 (dollars in thousands).
|
| | | | | | | | | | | | | |
| | Amortized Cost | | Percent of Total | | Weighted Average DSCR | | Weighted Average LTV |
| Office | $ | 2,074,413 |
| | 28.8 | % | | $ | 1.90 |
| | 58.98 | % |
| Multifamily | 2,072,664 |
| | 28.9 | % | | 1.65 |
| | 56.38 | % |
| Retail | 1,446,599 |
| | 20.2 | % | | 1.76 |
| | 57.47 | % |
| Warehouse/Industrial | 787,842 |
| | 11.0 | % | | 1.92 |
| | 58.14 | % |
| Hotel | 619,482 |
| | 8.6 | % | | 1.90 |
| | 56.98 | % |
| Other | 176,599 |
| | 2.5 | % | | 1.62 |
| | 48.57 | % |
| | $ | 7,177,599 |
| | 100.0 | % | | $ | 1.79 |
| | 57.43 | % |
DSCRs and LTVs in the dates indicated:
The Company’s commercial real estate underwriting standards generally provide for loan terms of five to seven years, with amortization schedules of no more than thirty years. LTV ratios are typically limited to no more than 80%75%. Owner-occupied commercial real estate loans typically have risk profiles more closely aligned with that of commercial and industrial loans than with other types of commercial real estate loans. Construction and land loans, included by property type in the table above, represented only 0.8%1% of the total loan portfolio at September 30, 2019.March 31, 2020. Construction and land loans are generally made for projects expected to stabilize within eighteen months of completion in sub-markets with strong fundamentals and, to a lesser extent, for-sale residential projects to experienced developers with a strong cushion between market prices and loan basis. 79% of the commercial real estate portfolio had LTVs less than 65% at March 31, 2020.
The New York legislature recentlyhas enacted a number of rent regulation reform measures that generally have the impact of limiting landlords' ability to increase rents on stabilized units and to convert stabilized units to market rate units. The following table presents the amount of loans secured by New York multi-family properties in which some or all units are rent regulated at September 30, 2019March 31, 2020 (in thousands):
| | | Loans secured by stabilized properties subject to rent regulation | $ | 1,316,417 |
| $ | 1,036,885 |
|
| Loans secured by non-stabilized properties subject to rent regulation | 64,522 |
| 34,751 |
|
| | $ | 1,380,939 |
| $ | 1,071,636 |
|
We believe loans secured by non-stabilized properties may present a heightened level of risk as these loans were underwritten to expected cash flows upon stabilization; those expected cash flows may be impacted by the recent rent regulation reform measures.
The following tables present the distribution of stabilized rent-regulated multi-family loans, by DSCR and LTV at September 30, 2019March 31, 2020 (in thousands):
| | | DSCR | | | | |
| Less than 1.11 | | $ | 132,614 |
| | $ | 100,281 |
|
| 1.11 - 1.24 | | 389,334 |
| | 318,519 |
|
| 1.25 - 1.50 | | 484,762 |
| | 296,531 |
|
| 1.51 or greater | | 309,707 |
| | 321,554 |
|
| | | $ | 1,316,417 |
| | $ | 1,036,885 |
|
| | | LTV | | | | |
| Less than 50% | | $ | 327,389 |
| | $ | 296,187 |
|
| 50% - 65% | | 697,574 |
| | 577,752 |
|
| 66% - 75% | | 284,832 |
| | 150,722 |
|
| More than 75% | | 6,622 |
| | 12,224 |
|
| | | $ | 1,316,417 |
| | $ | 1,036,885 |
|
The LTVs in the table above are based on the most recent appraisal obtained, which may not be fully reflective of changes in valuations that may result from the impact of the rent regulation reforms. Loans with DSCR less than 1.11 may be those with temporary vacancies or those for which expenses, particularly real estate taxes, have increased more rapidly than rents. All of the loans included in the tables above are current and performing.
Commercial and industrial loans are typically made to small, middle market and larger corporate businesses and not-for-profit entities and include equipment loans, secured and unsecured working capital facilities, formula-based loans, trade finance, mortgage warehouse lines, SBA product offerings and business acquisition finance credit facilities. These loans may be structured as term loans, typically with maturities of five to seven years, or revolving lines of credit which may have multi-year maturities. The Bank also provides financing to state and local governmental entities generally within itsour geographic footprint.markets. Commercial loans included shared national credits totaling $2.2$2.8 billion at September 30, 2019,March 31, 2020, the majority of which arewere relationship based loans to borrowers in Florida and New York. The Bank makes loans secured by owner-occupied commercial real estate that typically have risk profiles more closely aligned with that of commercial and industrial loans than with other types of commercial real estate loans.
The following table present the exposure in the commercial and industrial portfolio, including $2.0 billion of owner-occupied commercial real estate loans, by industry at March 31, 2020 (in thousands):
|
| | | | | | |
| | Amortized Cost | | Percent of Total |
| Finance and Insurance | $ | 1,262,984 |
| | 18.0 | % |
| Wholesale Trade | 805,281 |
| | 11.4 | % |
| Educational Services | 632,826 |
| | 9.0 | % |
| Transportation and Warehousing | 474,716 |
| | 6.7 | % |
| Health Care and Social Assistance | 472,590 |
| | 6.7 | % |
| Manufacturing | 376,761 |
| | 5.4 | % |
| Administrative and Support and Waste Management | 350,105 |
| | 5.0 | % |
| Retail Trade | 346,915 |
| | 4.9 | % |
| Real Estate and Rental and Leasing | 326,027 |
| | 4.6 | % |
| Information | 296,972 |
| | 4.2 | % |
| Professional, Scientific, and Technical Services | 282,398 |
| | 4.0 | % |
| Construction | 277,027 |
| | 3.9 | % |
| Accommodation and Food Services | 240,734 |
| | 3.4 | % |
| Other Services (except Public Administration) | 230,966 |
| | 3.3 | % |
| Arts, Entertainment, and Recreation | 211,786 |
| | 3.0 | % |
| Public Administration | 209,215 |
| | 3.0 | % |
| Utilities | 161,178 |
| | 2.3 | % |
| Other | 76,602 |
| | 1.2 | % |
| | $ | 7,035,083 |
| | 100.0 | % |
Through its commercial lending subsidiaries, Pinnacle and Bridge, the Bank provides equipment and franchise financing on a national basis using both loan and lease structures. Pinnacle provides essential use equipment financing to state and local governmental entities directly and through vendor programs and alliances. Pinnacle offers a full array of financing structures including equipment lease purchase agreements and direct (private placement) bond re-fundings and loan agreements. Bridge has two operating divisions. The franchise finance division offers franchise acquisition, expansion and equipment financing, typically to experienced operators in well-established concepts. The franchise finance portfolio is made up primarily of quick service restaurant and fitness concepts comprising 63%62% and 30%31% of the portfolio, respectively. The equipment finance division
provides primarily transportation equipment financing through a variety of loan and lease structures. The Bank's SBF unit primarily originates SBA guaranteed commercial and commercial real estate loans, generally selling the guaranteed portion in the
secondary market and retaining the unguaranteed portion in portfolio. The Bank also engages in mortgage warehouse lending on a national basis.
Geographic Concentrations
The Company's commercial and commercial real estate portfolios are concentrated in Florida and the Tri-state area. Excluding loans originated through our national platforms, 47% and 44% of commercial real estate loans were secured by collateral located in Florida and the Tri-state area, respectively; while 54% and 28% of commercial and industrial and owner-occupied real estate loans were to borrowers in Florida and the Tri-state area, respectively.
The following table presents the five states with the largest concentration of commercial loans and direct financing leases in theoriginated through our national platforms, including Bridge, Pinnacle, SBF and our mortgage warehouse finance unit at the dates indicated. Amounts include premiums, discounts and deferred fees and costsindicated (dollars in thousands):
|
| | | | | | | | | | | | | |
| | September 30, 2019 | | December 31, 2018 |
| California | $ | 661,737 |
| | 18.0 | % | | $ | 498,842 |
| | 16.8 | % |
| Florida | 440,798 |
| | 12.0 | % | | 595,843 |
| | 20.0 | % |
| New Jersey | 221,374 |
| | 6.0 | % | | 116,060 |
| | 3.9 | % |
| North Carolina | 193,894 |
| | 5.3 | % | | 113,530 |
| | 3.8 | % |
| Virginia | 168,248 |
| | 4.6 | % | | 153,619 |
| | 5.2 | % |
| All others | 2,000,224 |
| | 54.1 | % | | 1,499,955 |
| | 50.3 | % |
| | $ | 3,686,275 |
| | 100.0 | % | | $ | 2,977,849 |
| | 100.0 | % |
At September 30, 2019, 36.2% and 23.3% of commercial loans were originated within the Florida and New York portfolios, respectively. At December 31, 2018, 37.0% and 25.4% of commercial loans were originated within the Florida and New York portfolios, respectively. |
| | | | | | | | | | | | | |
| | March 31, 2020 | | December 31, 2019 |
| | Total | | Percent of Total | | Total | | Percent of Total |
| California | $ | 542,068 |
| | 15.1 | % | | $ | 585,222 |
| | 16.5 | % |
| Florida | 459,960 |
| | 12.8 | % | | 465,146 |
| | 13.1 | % |
| New Jersey | 259,213 |
| | 7.2 | % | | 178,514 |
| | 5.0 | % |
| Maryland | 160,738 |
| | 4.5 | % | | 152,663 |
| | 4.3 | % |
| Virginia | 154,336 |
| | 4.3 | % | | 142,856 |
| | 4.0 | % |
| All others | 2,015,684 |
| | 56.1 | % | | 2,021,994 |
| | 57.1 | % |
| | $ | 3,591,999 |
| | 100.0 | % | | $ | 3,546,395 |
| | 100.0 | % |
Operating lease equipment, net
Operating lease equipment, net of accumulated depreciation totaled $697$685 million at September 30, 2019,March 31, 2020, including off-lease equipment, net of accumulated depreciation totaling $72$76 million. The portfolio consists primarily of railcars, non-commercial aircraft and other transport equipment. We have a total of 5,6275,317 railcars with a carrying value of $436$415 million at September 30, 2019,March 31, 2020, including hoppers, tank cars, boxcars, auto carriers, center beams and gondolas leased to North American commercial end-users.end users. The largest concentrations of rail cars were 2,4202,414 hopper cars and 1,594 tank cars, primarily used to ship sand and petroleum products, respectively, for the energy industry.
Bridge had exposure to the energy industry of $306 million at September 30, 2019, consisting of $261 million in operating lease equipment and $45 million in loans and finance leases.
The chart below presents operating lease equipment by type at the dates indicated:
At March 31, 2020, the breakdown of carrying values of operating lease equipment, excluding equipment off-lease, by the year current leases are scheduled to expire was as follows (in thousands):
|
| | | |
| Years Ending December 31: | |
| 2020 | $ | 80,348 |
|
| 2021 | 61,399 |
|
| 2022 | 72,047 |
|
| 2023 | 41,703 |
|
| 2024 | 31,333 |
|
| Thereafter through 2034 | 322,135 |
|
| | $ | 608,965 |
|
Asset Quality
Commercial Loans
We have a robust credit risk management framework, an experienced team to lead the workout and recovery process for the commercial and commercial real estate portfolios and a dedicated internal credit review function. In response to the COVID-19 pandemic, we have further enhanced our workout and recovery staffing and processes. Loan performance is monitored by our credit administration and workout and recovery departments. Generally, commercial relationships with balances in excess of defined thresholds are re-evaluated at least annually and more frequently if circumstances indicate that a change in risk rating may be warranted. The defined thresholds range from $1 million to $3 million. Homogenous groups of smaller balance commercial loans may be monitored collectively. Additionally,The credit quality and risk rating of commercial loans as well as our underwriting and
portfolio management practices are regularly reviewed by our internal credit review department. The Company utilizes a 13 grade internal asset risk classification system as part of its efforts to monitor and maintain commercial asset quality. Loans exhibiting potential credit weaknesses that deserve management’s close attention and, that if left uncorrected, may result in deterioration of the repayment capacity of the borrower are categorized as special mention. These borrowers may exhibit negative financial trends or erratic financial performance, strained liquidity, marginal collateral coverage, declining industry trends or weak management. Loans with well-defined credit weaknesses that may result in a loss if the deficiencies are not corrected are assigned a risk rating of substandard. These borrowers may exhibit payment defaults, inadequate cash flows, operating losses, increasing balance sheet leverage, project cost overruns, unreasonable construction delays, exhausted interest reserves, declining collateral values, frequent overdrafts or past due real estate taxes. Loans with weaknesses so severe that collection in full is highly questionable or improbable, but because of certain reasonably specific pending factors have not been charged off, are assigned an internal risk rating of doubtful.
We believe internal risk rating is the best indicator of the credit quality of commercial loans. The following table summarizes the Company's commercial credit exposure, based on internal risk rating, at the periods indicated (dollars in thousands):
|
| | | | | | | | | | | | | |
| | March 31, 2020 | | December 31, 2019 |
| | Amortized Cost | | Percent of Commercial Loans | | Amortized Cost | | Percent of Commercial Loans |
| Pass | $ | 16,841,243 |
| | 96.0 | % | | $ | 17,054,702 |
| | 97.5 | % |
| Special mention | 288,148 |
| | 1.6 | % | | 72,881 |
| | 0.4 | % |
| Substandard accruing | 238,786 |
| | 1.4 | % | | 180,380 |
| | 1.0 | % |
| Substandard non-accruing | 181,278 |
| | 1.0 | % | | 185,906 |
| | 1.1 | % |
| | $ | 17,549,455 |
| | 100.0 | % | | $ | 17,493,869 |
| | 100.0 | % |
The charts below present trends in criticized and classified loans from December 31, 2019 to March 31, 2020 (in millions):
Criticized and classified loans increased by $269 million, to 3.1% of total loans at March 31, 2020 from 1.9% of total loans at December 31, 2019. The increase was in the special mention and substandard accruing categories. As reflected in the charts above, the majority of the increase was in the franchise finance portfolio. Approximately 90% of the downgrades in franchise finance during the quarter were directly related to the COVID-19 pandemic. Given the emerging nature of and uncertainty surrounding the COVID-19 crisis, we will likely see further impacts on the risk rating distribution of the loan portfolio in the future.
Potential Problem Loans
Potential problem loans have been identified by management as those commercial loans included in the "substandard accruing" risk rating category. These loans are typically performing, but possess specifically identified credit weaknesses that, if not remedied, may lead to a downgrade to non-accrual status and identification as impaired in the near-term.
The following table summarizes the Company's substandard accruing loans, substantially all of which were current as to principal and interest, at the dates indicated (in thousands):
|
| | | | | | | | | | | | | |
| | September 30, 2019 | | December 31, 2018 |
| | Balance | | Percent of Total | | Balance | | Percent of Total |
| Pass | $ | 16,846,374 |
| | 97.4 | % | | $ | 16,728,534 |
| | 98.2 | % |
| Special mention | 86,842 |
| | 0.5 | % | | 81,070 |
| | 0.5 | % |
| Substandard | 348,382 |
| | 2.0 | % | | 210,026 |
| | 1.2 | % |
| Doubtful | 2,798 |
| | 0.1 | % | | 8,389 |
| | 0.1 | % |
| | $ | 17,284,396 |
| | 100.0 | % | | $ | 17,028,019 |
| | 100.0 | % |
|
| | | | | | | | | | | | | |
| | March 31, 2020 | | December 31, 2019 |
| | Amortized Cost | | Percent of Loan Segment | | Amortized Cost | | Percent of Loan Segment |
| Multi-family | $ | 35,691 |
| | 1.8 | % | | $ | 26,797 |
| | 1.2 | % |
| Non-owner occupied commercial real estate | 46,346 |
| | 0.9 | % | | 52,697 |
| | 1.0 | % |
| Construction and land | 888 |
| | 0.4 | % | | — |
| | — | % |
| Owner occupied commercial real estate | 24,520 |
| | 1.2 | % | | 16,241 |
| | 0.8 | % |
| Commercial and industrial | 77,810 |
| | 1.6 | % | | 43,518 |
| | 0.9 | % |
| Bridge - franchise finance | 53,531 |
| | 8.3 | % | | 41,127 |
| | 6.6 | % |
| | $ | 238,786 |
| | | | $ | 180,380 |
| | |
See Note 4Management closely monitors each of these loans as well as indicators of potential negative trends developing within any particular portfolio segment. The following table presents loan portfolio sub-segments that, in light of evolving conditions related to the Consolidated Financial StatementsCOVID-19 pandemic, have been identified for more information aboutenhanced monitoring as of March 31, 2020 (dollars in thousands):
|
| | | | | | | | | | | | | | |
| | March 31, 2020 |
| | Amortized Cost | | Percent of Total Loans | | Amount Criticized or Classified | | Amount Non-Performing |
| Retail - CRE | $ | 1,446,599 |
| | 6.2 | % | | $ | 35,535 |
| | $ | 11,202 |
|
| Retail - C&I | 346,915 |
| | 1.5 | % | | 6,644 |
| | 4,499 |
|
| BFG - franchise finance | 647,699 |
| | 2.8 | % | | 272,214 |
| | 37,635 |
|
| Hotel | 619,482 |
| | 2.7 | % | | 37,831 |
| | 22,334 |
|
| Airlines | 84,649 |
| | 0.4 | % | | — |
| | — |
|
| Cruise line | 71,374 |
| | 0.3 | % | | — |
| | — |
|
| Energy | 46,348 |
| | 0.2 | % | | — |
| | — |
|
| | $ | 3,263,066 |
| | 14.1 | % | | $ | 352,224 |
| | $ | 75,670 |
|
It is likely that the risk rating distributionamounts of criticized or classified loans and amounts of non-performing loans presented above do not reflect the full impact of the COVID-19 pandemic.
Retail Exposure in the CRE Portfolio
The predominant collateral type supporting this segment is both anchored and un-anchored retail centers, including some mixed-use properties with a significant retail component. We estimate that approximately 60% of this sub-segment is supported by what we consider to be essential or moderately essential businesses in the context of the pandemic. We have no significant large shopping mall or "big box" exposure. The weighted average LTV for this sub-segment is 57.5% and 84% has LTVs less than 65%, based on the most recently available information.
Retail Exposure in the C&I Portfolio
This is a well-diversified sub-segment by industry. The largest exposure is to gas stations, generally with convenience stores, representing $97 million, or 28% of the sub-segment. 63% of loans in this sub-segment are collateralized by owner-occupied real estate.
BFG - Franchise Finance
The following table presents the franchise portfolio by concept at March 31, 2020:
|
| | | | | | |
| | Amortized Cost | | Percentage of BFG Franchise Finance |
| Restaurant concepts: | | | |
| Burger King | $ | 67,087 |
| | 10.3 | % |
| Dunkin Donuts | 39,366 |
| | 6.1 | % |
| Sonic | 27,907 |
| | 4.3 | % |
| Domino's | 26,239 |
| | 4.1 | % |
| Jimmy Johns | 23,436 |
| | 3.6 | % |
| Other | 217,083 |
| | 33.5 | % |
| | 401,118 |
| | 61.9 | % |
| Non-restaurant concepts: | | | |
| Planet Fitness | 107,301 |
| | 16.6 | % |
| Orange Theory Fitness | 86,664 |
| | 13.4 | % |
| Other | 52,616 |
| | 8.1 | % |
| | 246,581 |
| | 38.1 | % |
| | $ | 647,699 |
| | 100.0 | % |
The quick service restaurant sector broadly has been experiencing margin pressure due to rising labor costs and technological disruption in the form of app-based food delivery services. Concepts that have adopted digital ordering, delivery, take-out and drive through models may be better positioned in light of COVID-19 related social distancing measures. Fitness concepts, which have been the better performing group in this portfolio sub-segment may now be under increased stress due to social distancing measures arising from the pandemic.
Hotel
The following chart presents hotel exposure at March 31, 2020:
This sub-segment is experiencing significant disruption in revenue due to social distancing measures arising from the pandemic. The weighted average LTV for this sub-segment is 57% and 78% has LTVs less than 65%, based on the most recent information available. The majority of our hotel exposure is in Florida at 77%, followed by 13% in New York. This sub-segment includes $61 million in SBA loans, of which $16 million is guaranteed.
Airlines
There are three lending relationships in this sub-segment. It is our understanding that these borrowers are expecting to directly benefit from government relief programs enacted in response to the COVID-19 pandemic.
Energy
Recent declines in oil prices have elevated this sub-segment to a level of enhanced monitoring. The Company's commercial loans. Criticizedenergy exposure in the loan portfolio is not material; approximately 84% of these loans are secured by marine transport equipment.
Bridge also had exposure to the energy industry in the operating lease equipment portfolio totaling $291 million at March 31, 2020, consisting of $232 million in railcars, $39 million in helicopters and classified loans as a percentage of total loans was 1.9% at September 30, 2019, compared to 1.4% at December 31, 2018.$19 million in vessels.
If current conditions persist, further deterioration could occur in this sector.
Operating Lease Equipment, net
Two operating lease relationships with a carrying value of assets under lease totaling $24$30 million, all of which $19 million were exposures to the energy industry, were internally risk rated special mention or substandard at September 30, 2019. One relationship had been restructured asMarch 31, 2020. On a quarterly basis, management performs an impairment analysis on assets with indicators of September 30, 2019.potential impairment. Potential impairment indicators include evidence of changes in residual value, macro-economic conditions, an extended period of time off-lease, criticized or classified status, or management's intention to sell the asset at an amount potentially below its carrying value. At March 31, 2020, there were 13 operating leases for which a triggering event was met. Based on a recoverability analysis performed, the Company recognized an impairment charge of $0.7 million during three months ended March 31, 2020 related to one operating lease relationship; this was not an energy exposure.
The primary risks inherent in the equipment leasing business are asset risk resulting from ownership of the equipment on operating lease and credit risk. Asset risk arises from fluctuations in supply and demand for the underlying leased equipment. The equipment is leased to commercial end-usersend users with original lease terms generally ranging from three to ten years. We are exposed to the risk that, at the end of the lease term, the value of the asset will be lower than expected, potentially resulting in reduced future lease income over the remaining life of the asset or a lower sale value. Asset risk may also lead to changes in depreciation as a result of changes in the residual values of the operating leaseleased assets or through impairment of asset carrying values.
Asset risk is evaluated and managed by a dedicated internal staff of asset managers, managed by seasoned equipment finance professionals with a broad depth and breadth of experience in the leasing business. Additionally, we have partnered with an industry leading, experienced service provider who provides fleet management and servicing relating to the railcar fleet, including lease administration and reporting, a Regulation Y compliant full service maintenance program and railcar re-marketing. Risk is managed by setting appropriate residual values at inception and systematic reviews of residual values based on independent appraisals, performed at least annually. Additionally, our internal management team and our external service provider closely follow the rail markets, monitoring traffic flows, supply and demand trends and the impact of new technologies and regulatory requirements. Demand for railcars is sensitive to shifts in general and industry specific economic and market trends and shifts in trade flows from specific events such as natural or man-made disasters. We seek to mitigate these risks by leasing to a stable end-userend user base, by maintaining a relatively young and diversified fleet of assets that are expected to maintain stronger and more stable utilization rates despite impacts from unexpected events or cyclical trends and by staggering lease maturities. We regularly monitor the impact of oil prices on the estimated residual value of rail cars being used in the petroleum/natural gas extraction sector.
Credit risk in the leased equipment portfolio results from the potential default of lessees, possibly driven by obligor specific or industry-wide conditions, and is economically less significant than asset risk, because in the operating lease business, there is no extension of credit to the obligor. Instead, the lessor deploys a portion of the useful life of the asset. Credit
losses, if any, will manifest through reduced rental income due to missed payments, time off lease, or lower rental payments due either to a restructuring or re-leasing of the asset to another obligor. Credit risk in the operating lease portfolio is managed and monitored utilizing credit administration infrastructure, processes and procedures similar to those used to manage and monitor credit risk in the commercial loan portfolio. We also mitigate credit risk in this portfolio by leasing to high credit quality obligors.
Residential and Other Consumer Loans
The majority of ourOur residential mortgage portfolio, excluding GNMA buyout loans, consists primarily of loans purchased through established correspondent channels. Most of our purchases are of performing jumbo mortgage loans which have FICO scores above 700, primarily are owner-occupied and full documentation, and have a current LTV of 80% or less although loans with
LTVs higher than 80% may be extended to selected credit-worthy borrowers. We perform due diligence on the purchased loans for credit, compliance, counterparty, payment history and property valuation.
We have a dedicated residential credit risk management function, and the residential portfolio is monitored by our internal credit review function. Residential mortgage loans and consumer loans are not individually risk rated. Delinquency status is the primary measure we use to monitor the credit quality of these loans. We also consider original LTV and most recently available FICO score to be significant indicators of credit quality for the 1-4 single family residential portfolio, excluding FSB loans and government insured residential loans.
The following tables showcharts present information about the distribution of 1-4 single family residential loans,portfolio, excluding FSB loans and government insured residential loans, by original FICO distribution, LTV distribution and LTV as ofvintage at March 31, 2020:
In the dates indicated:
|
| | | | | | | | | | | | | | | |
| | | September 30, 2019 |
| | | FICO |
| LTV | | 720 or less | | 721 - 740 | | 741 - 760 | | 761 or
greater | | Total |
| Less than 60% | | 2.4 | % | | 2.8 | % | | 3.9 | % | | 16.6 | % | | 25.7 | % |
| 60% - 70% | | 2.8 | % | | 2.5 | % | | 4.0 | % | | 13.7 | % | | 23.0 | % |
| 70% - 80% | | 4.0 | % | | 4.9 | % | | 8.7 | % | | 29.0 | % | | 46.6 | % |
| More than 80% | | 0.4 | % | | 0.7 | % | | 0.7 | % | | 2.9 | % | | 4.7 | % |
| | | 9.6 | % | | 10.9 | % | | 17.3 | % | | 62.2 | % | | 100.0 | % |
|
| | | | | | | | | | | | | | | |
| | | December 31, 2018 |
| | | FICO |
| LTV | | 720 or less | | 721 - 740 | | 741 - 760 | | 761 or
greater | | Total |
| Less than 60% | | 2.4 | % | | 2.8 | % | | 4.4 | % | | 18.2 | % | | 27.8 | % |
| 60% - 70% | | 2.7 | % | | 2.4 | % | | 3.8 | % | | 13.4 | % | | 22.3 | % |
| 70% - 80% | | 3.5 | % | | 4.6 | % | | 8.4 | % | | 28.3 | % | | 44.8 | % |
| More than 80% | | 0.4 | % | | 0.8 | % | | 0.8 | % | | 3.1 | % | | 5.1 | % |
| | | 9.0 | % | | 10.6 | % | | 17.4 | % | | 63.0 | % | | 100.0 | % |
At September 30, 2019,March 31, 2020, the majority of the 1-4 single family residential loan portfolio, excluding FSB loans and government insured residential loans, had the following characteristics: substantially all were full documentation with a weighted-average FICO score of 765 and a weighted-average LTV of 68.2%. The majority of this portfolio was owner-occupied, with 84.2%82.4% primary residence, 7.3%7.6% second homes and 8.5%10.0% investment properties. In terms of vintage, 38.7% of the portfolio was originated pre-2016, 17.1% in 2016, 18.6% in 2017, 14.0% in 2018 and 11.6% in 2019.
1-4 single family residential loans, excluding government insured residential loans, past due more than 30 days totaled $42.9$59.8 million and $23.5$66.3 million at September 30, 2019March 31, 2020 and December 31, 2018,2019, respectively. The amount of these loans 90 days or more past due was $10.7$11.6 million and $7.0$11.1 million at September 30, 2019March 31, 2020 and December 31, 2018,2019, respectively.
Other Consumer Loans
Substantially allAt March 31, 2020, $2 million of other consumer loans was past due more than 30 days and all were current at September 30, 2019 and December 31, 2018.2019.
Impaired Loans and Non-Performing Assets
Non-performing assets generally consist of (i) non-accrual loans, including loans that have been modified in TDRs and placed on non-accrual status, (ii) accruing loans that are more than 90 days contractually past due as to interest or principal, excluding ACI loans and government insured residential loans, and (iii) OREO and repossessed assets. Impaired loans also typically include loans modified in TDRs that are accruing and ACI loans or pools for which expected cash flows at acquisition (as adjusted for any additional cash flows expected to be collected arising from changes in estimates after acquisition) have been revised downward since acquisition, other than due to changes in interest rate indices and prepayment assumptions.
The following table summarizesand charts summarize the Company's impairednon-performing loans and non-performing assets at the dates indicated (dollars in thousands):
|
| | | | | | | |
| | March 31, 2020 | | December 31, 2019 |
| Non-accrual loans | | | |
| Residential and other consumer: | | | |
| 1-4 single family residential | $ | 14,561 |
| | $ | 18,877 |
|
| Other consumer loans | 2,395 |
| | 17 |
|
| Total residential and other consumer loans | 16,956 |
| | 18,894 |
|
| Commercial: | | | |
| Multi-family | 6,011 |
| | 6,138 |
|
| Non-owner occupied commercial real estate | 36,355 |
| | 40,097 |
|
| Construction and land | 3,439 |
| | 3,191 |
|
| Owner occupied commercial real estate | 26,147 |
| | 27,141 |
|
| Commercial and industrial | 60,118 |
| | 74,757 |
|
| Bridge - franchise finance | 37,635 |
| | 13,631 |
|
| Bridge - equipment finance | 11,561 |
| | 20,939 |
|
| Total commercial loans | 181,266 |
| | 185,894 |
|
| Total non-performing loans | 198,222 |
| | 204,788 |
|
| OREO and repossessed assets | 7,712 |
| | 3,897 |
|
| Total non-performing assets | $ | 205,934 |
| | $ | 208,685 |
|
| | | | |
Non-performing loans to total loans (1) | 0.85 | % | | 0.88 | % |
Non-performing assets to total assets (1) | 0.61 | % | | 0.63 | % |
| ACL to total loans | 1.08 | % | | 0.47 | % |
| ACL to non-performing loans | 126.41 | % | | 53.07 | % |
| Provision for credit losses to average loans | 0.53 | % | | 0.04 | % |
Net charge-offs to average loans (2) | 0.13 | % | | 0.05 | % |
|
| | | | | | | |
| | September 30, 2019 | | December 31, 2018 |
| Non-accrual loans | | | |
| Residential and other consumer: | | | |
| 1-4 single family residential | $ | 15,363 |
| | $ | 6,316 |
|
| Other consumer loans | 48 |
| | 288 |
|
| Total residential and other consumer loans | 15,688 |
| | 6,604 |
|
| Commercial: | | | |
| Multi-family | 17,906 |
| | 25,560 |
|
| Non-owner occupied commercial real estate | 11,902 |
| | 3,102 |
|
| Construction and land | 3,839 |
| | 8,827 |
|
| Owner occupied commercial real estate | 6,043 |
| | 5,221 |
|
| Commercial and industrial | 22,092 |
| | 23,088 |
|
| National commercial lending platforms | | | |
| Bridge - franchise finance | 5,275 |
| | 5,308 |
|
| Bridge - equipment finance | 9,133 |
| | 17,425 |
|
| Small business finance | 45,767 |
| | 34,108 |
|
| Total commercial loans | 121,957 |
| | 122,639 |
|
| Total non-accrual loans | 137,645 |
| | 129,243 |
|
| Loans past due 90 days and still accruing | — |
| | 650 |
|
| Total non-performing loans | 137,643 |
| | 129,893 |
|
| OREO and repossessed assets | 4,437 |
| | 9,517 |
|
| Total non-performing assets | 142,080 |
| | 139,410 |
|
| Performing TDRs | 53,074 |
| | 7,898 |
|
| Total impaired loans and non-performing assets | $ | 195,154 |
| | $ | 147,308 |
|
| | | | |
Non-performing loans to total loans (1)(4) | 0.60 | % | | 0.59 | % |
Non-performing assets to total assets (4) | 0.43 | % | | 0.43 | % |
ALLL to total loans (1) | 0.47 | % | | 0.50 | % |
| ALLL to non-performing loans | 78.80 | % | | 84.63 | % |
Net charge-offs to average loans(2)(3) | 0.06 | % | | 0.28 | % |
| | | | |
| |
| (1) | Total loans for purposes of calculating these ratios include premiums, discounts and deferred fees and costs. |
| |
(2) | Annualized for September 30, 2019. |
| |
(3) | The ratio of charge-offs of taxi medallion loans to average total loans was 0.18% for the year ended December 31, 2018. |
| |
(4) | Non-performing loans and assets include the guaranteed portion of non-accrual SBA loans totaling $33.1$49.1 million or 0.14%0.21% of total loans and 0.10%0.15% of total assets, at September 30, 2019;March 31, 2020; compared to $17.8$45.7 million or 0.08%0.20% of total loans and 0.06%0.14% of total assets, at December 31, 2018.2019. |
| |
| (2) | Annualized for March 31, 2020. |
Contractually delinquent ACI
The following chart presents trends in non-performing loans with remaining accretable yield areby non-performing asset ratios:
The following chart presents trends in non-performing loans by portfolio sub-segment (in millions):
The ultimate impact of the recent and evolving COVID-19 pandemic may not be reflected as non-accrual loans and are not considered to bein the level of non-performing assets because accretion continuesreported above. The potential effect on non-performing asset levels may be delayed in the near-term due to be recordedgovernment assistance and loan deferral programs recently put in income. Accretion continues to be recorded as long as there is an expectation of future cash flows in excess of carrying amount from these loans. The carrying value of ACI loans contractually delinquent by more than 90 days but on which income was still being recognized was immaterial at September 30, 2019 and December 31, 2018. place.
Contractually delinquent government insured residential loans are excluded from non-performing loans as defined in the table above due to their government guarantee. The carrying value of such loans contractually delinquent by more than 90 days was $420$623 million and $218$529 million at September 30, 2019March 31, 2020 and December 31, 2018,2019, respectively. The increase of ACL to total loans and ACL to non-performing loans ratios at March 31, 2020 from December 31, 2019 is attributable to the adoption of CECL effective January 1, 2020 and the impact on the provision for credit losses recorded during the first quarter of 2020 resulting from changes to our economic forecast as a result of COVID-19.
Commercial loans, other than ACI loans are placed on non-accrual status when (i) management has determined that full repayment of all contractual principal and interest is in doubt, or (ii) the loan is past due 90 days or more as to principal or interest unless the loan is well secured and in the process of collection. Residential and consumer loans, other than ACI loans and government insured pool buyout loans, are generally placed on non-accrual status when they are 90 days of interest is due and unpaid.past due. When a loan is placed on non-accrual status, uncollected interest accrued is reversed and charged as a reduction to interest income. Commercial loans are returned to accrual status only after all past due principal and interest has been collected and full repayment of remaining contractual principal and interest is reasonably assured. Residential loans are generally returned to accrual status when less than 90 days of interest is due and unpaid.past due. Past due status of loans is determined based on the contractual next payment due date. Loans less than 30 days past due are reported as current.
TDRs
A loan modification is considered a TDR if the Company, for economic or legal reasons related to the borrower’s financial difficulties, grants a concession to the borrower that the Company would not otherwise grant. These concessions may take the form of temporarily or permanently reduced interest rates, payment abatement periods, restructuring of payment terms, extensions of maturity at below market terms, or in some cases, partial forgiveness of principal. Modified ACI loans accounted for in pools are not accounted for as TDRs and are not separated from their respective pools when modified. Included in TDRs are residential loans to borrowers who have not reaffirmed their debt discharged in Chapter 7 bankruptcy.
Under recently issued inter-agency and authoritative guidance and consistent with the CARES Act, short-term (generally periods of six months or less) deferrals or modifications related to COVID-19 will typically not be categorized as TDRs. See the section below entitled "Loss Mitigation Strategies - Impacts of the COVID-19 pandemic" for further discussion.
The following table summarizes loans that have been modified in TDRs at the dates indicated (dollars in thousands):
| | | | September 30, 2019 | | December 31, 2018 | March 31, 2020 | | December 31, 2019 |
| | Number of TDRs | | Recorded Investment | | Related Specific Allowance | | Number of TDRs | | Recorded Investment | | Related Specific Allowance | Number of TDRs | | Amortized Cost | | Related Specific Allowance | | Number of TDRs | | Amortized Cost | | Related Specific Allowance |
Residential and other consumer (1) | 213 |
| | $ | 34,528 |
| | $ | 12 |
| | 47 |
| | $ | 7,690 |
| | $ | 134 |
| 281 |
| | $ | 45,780 |
| | $ | 37 |
| | 361 |
| | $ | 57,117 |
| | $ | 12 |
|
| Commercial | 29 |
| | 72,024 |
| | 6,311 |
| | 23 |
| | 36,150 |
| | 3,595 |
| 33 |
| | 62,387 |
| | 7,710 |
| | 25 |
| | 56,736 |
| | 6,311 |
|
| | 242 |
| | $ | 106,552 |
| | $ | 6,323 |
| | 70 |
| | $ | 43,840 |
| | $ | 3,729 |
| 314 |
| | $ | 108,167 |
| | $ | 7,747 |
| | 386 |
| | $ | 113,853 |
| | $ | 6,323 |
|
| |
| (1) | Includes 265 government insured residential loans modified in TDRs totaling $29.9 million and $3.5$41.9 million at September 30, 2019March 31, 2020; and 346 government insured residential loans modified in TDRs totaling $53.4 million at December 31, 2018, respectively.2019. |
See Note 4 to the Consolidated Financial Statementsconsolidated financial statements for additional information about TDRs.
Potential Problem Loans
Potential problem loans have been identified by management as those commercial loans included in the "substandard accruing" risk rating category. These loans are typically performing, but possess specifically identified credit weaknesses that, if not remedied, may lead to a downgrade to non-accrual status and identification as impaired in the near-term.
The following table summarizes the Company's substandard accruing loans, substantially all of which were current as to principal and interest, at the dates indicated (in thousands):
|
| | | | | | | | | | | |
| | September 30, 2019 | | June 30, 2019 | | December 31, 2018 |
| Multi-family | $ | 21,772 |
| | $ | 22,926 |
| | $ | 9,093 |
|
| Non-owner occupied commercial real estate | 55,585 |
| | 70,918 |
| | 43,690 |
|
| Owner occupied commercial real estate | 12,875 |
| | 4,304 |
| | 5,526 |
|
| Commercial and industrial | 65,630 |
| | 36,827 |
| | 15,729 |
|
| National commercial lending platforms | | | | | |
| Bridge - franchise finance | 51,786 |
| | 21,158 |
| | 9,912 |
|
| Bridge - equipment finance | 12,675 |
| | 16,197 |
| | 5,521 |
|
| Small business finance | 8,849 |
| | 7,883 |
| | 6,324 |
|
| | $ | 229,172 |
| | $ | 180,213 |
| | $ | 95,795 |
|
Management closely monitors each of these loans as well as indicators of potential negative trends developing within any particular portfolio segment. The increase in substandard accruing loans at September 30, 2019 and June 30, 2019 compared to December 31, 2018 does not appear to be concentrated in any one business line, geography, product type or asset class, with the exception of the identification of correlated risk characteristics related to quick service restaurant exposures delivered through Bridge's franchise finance division. This sector comprises approximately 64% of total franchise exposure and approximately 2.26% of the total commercial portfolio. Management has not identified any other specific trends or correlated risk characteristics associated with these downgrades. The majority of the increase in substandard accruing loans in the commercial and industrial category relates to one $42 million loan relationship.
Loss Mitigation Strategies
Criticized or classified commercial loans in excess of certain thresholds are reviewed quarterly by the Criticized Asset Committee, which evaluates the appropriate strategy for collection to mitigate the amount of credit losses. Criticized asset reports for each relationship are presented by the assigned relationship manager and credit officer to the Criticized Asset Committee until such time as the relationships are returned to a satisfactory credit risk rating or otherwise resolved. The Criticized Asset Committee may require the transfer of a loan to our workout and recovery department, which is tasked to effectively manage the loan with the goal of minimizing losses and expenses associated with restructure, collection and/or liquidation of collateral. Commercial loans with a risk rating of substandard;substandard, impaired loans on non-accrual status;status, loans modified as TDRs;TDRs or assets classified as OREO or repossessed assets are usually transferred to workout and recovery. Oversight of the workout and recovery department is provided by the Asset Recovery Committee.
Our servicers evaluate each residential loan in default to determine the most effective loss mitigation strategy, which may be modification, short sale, or foreclosure, and pursue the alternative most suitable to the consumer and to mitigate losses to the bank.
Impacts of the COVID-19 pandemic
In response to the COVID-19 pandemic and its potential economic impact to our customers, we implemented a short-term program that complies with the CARES Act under which we are providing temporary relief on a case by case basis to borrowers directly impacted by COVID-19 who were not more than 30 days past due as of December 31, 2019. For commercial borrowers, this relief typically allows for deferrals of principal and/or interest payments for 90 days, which may be extended, again on a case by case basis, for an additional 90 days, for a maximum of 180 days on a cumulative and successive basis. The deferred payments along with interest accrued during the deferral period are due and payable on the maturity date. For residential borrowers, relief typically takes the form of 90 day payment deferrals, with deferred payments due at the end of the 90 day period. At the end of the 90 day deferral period, residential borrowers may either (i) make all payments due, (ii) be granted an additional deferral period or (iii) enter into a modification or repayment plan. We have also temporarily suspended new residential foreclosure actions.
Through April 20, 2020, we have granted temporary deferrals to borrowers as summarized in the table below (in millions):
|
| | | | | | | | | | | | | | | | | | | |
| | Requests Received | | Approved |
| | Count | | UPB | | % of Portfolio | | Count | | UPB | | % of Portfolio |
| CRE - Property Type: | | | | | | | | | | | |
| Hotel | 30 |
| | $ | 505 |
| | 90 | % | | 30 |
| | $ | 505 |
| | 90 | % |
| Retail | 83 |
| | 576 |
| | 43 | % | | 57 |
| | 372 |
| | 28 | % |
| Office | 15 |
| | 251 |
| | 13 | % | | 9 |
| | 195 |
| | 10 | % |
| Industrial | 8 |
| | 80 |
| | 11 | % | | 7 |
| | 66 |
| | 9 | % |
| Multifamily | 24 |
| | 209 |
| | 11 | % | | 20 |
| | 171 |
| | 9 | % |
| | 160 |
| | 1,621 |
| | 24 | % | | 123 |
| | 1,309 |
| | 19 | % |
| C&I - Industry | | | | | | | | | | | |
| Accommodation and Food Services | 11 |
| | 85 |
| | 38 | % | | 7 |
| | 36 |
| | 16 | % |
| Arts, Entertainment, and Recreation | 6 |
| | 44 |
| | 20 | % | | 5 |
| | 40 |
| | 18 | % |
| Retail Trade | 4 |
| | 51 |
| | 15 | % | | 1 |
| | 7 |
| | 2 | % |
| Manufacturing | 3 |
| | 30 |
| | 9 | % | | 2 |
| | 27 |
| | 7 | % |
| Other | 25 |
| | 138 |
| | <7% |
| | 14 |
| | 74 |
| | <4% |
|
| | 49 |
| | 348 |
| | 5 | % | | 29 |
| | 184 |
| | 3 | % |
| BFG - Equipment | 11 |
| | 67 |
| | 10 | % | | 9 |
| | 66 |
| | 10 | % |
| BFG - Franchise | 146 |
| | 513 |
| | 79 | % | | 144 |
| | 482 |
| | 74 | % |
| Smaller Balance Commercial Loans | 408 |
| | 320 |
| | | | 197 |
| | 112 |
| | |
| Total Commercial | 774 |
| | $ | 2,869 |
| | | | 502 |
| | $ | 2,153 |
| | |
| Residential (excl govt. guaranteed loans) | | | | | | | 974 |
| | $ | 499 |
| | |
The substantial majority of these deferrals were not implemented until after March 31, 2020.
Under recently issued inter-agency guidance and consistent with the CARES Act, these deferrals or modifications will generally not be categorized as TDRs. Loans subject to these temporary deferrals or modifications, if in compliance with the contractual terms of the deferral or modification agreements, will typically not be reported as past due or classified as non-accrual during the deferral period.
We have been active participants in the SBA's PPP, established by the CARES Act to help small and medium-sized businesses remain viable through the COVID-19 crisis. We began accepting intake forms on April 3, 2020, launching our digital portal on April 6, 2020. Through May 6, 2020, we had funded almost 3,500 loans totaling $841 million and helped protect nearly 100,000 jobs.
Analysis of the Allowance for Loan and LeaseCredit Losses
The determinationACL is management's estimate of the amount of expected credit losses over the ALLL is, by nature, highly complex and subjective. Future events that are inherently uncertain could result in material changes to the levellife of the ALLL. General economicloan portfolio, or the amount of amortized cost basis not expected to be collected, at the balance sheet date. This estimate encompasses information about historical events, current conditions including but not limited to unemployment rates, the level of business investment and growth, real estate values, vacancy ratesreasonable and rental rates in our primary market areas, the level of interest rates, and a variety of other factors that affect the ability of borrowers’ businesses to generate cash flows sufficient to service their debts will impact the future performance of the portfolio. Adoption of the CECL model in the first quarter of 2020 will result in significant changes to the methodology employed to determinesupportable forecasts. Determining the amount of the ALLL, and may materially impact the amount of the ALLL recorded in the consolidated financial statements. See the section entitled "Critical Accounting Policies" in this Management's Discussion and Analysis of Financial Condition and Results of Operations for further discussion of the expected impact of CECL.
Commercial loans
The allowanceACL is comprised of specific reserves for loans that are individually evaluated and determined to be impaired as well as general reserves for loans that have not been identified as impaired.
Commercial relationships graded substandard or doubtful and on non-accrual status with committed credit facilities greater than or equal to $1.0 million, as well as loans modified in TDRs, are individually evaluated for impairment. Other commercialcomplex
relationships on non-accrual status with committed balances under $1.0 million may also be evaluated individually for impairment, at management's discretion. For loans evaluated individually for impairment and determined to be impaired,requires extensive judgment by management about matters that are inherently uncertain. There is currently a specific allowance is established basedhigh level of uncertainty around the impact the COVID-19 crisis will have on the present valueeconomy broadly, and on our borrowers specifically. In light of expected cash flows discounted atthis uncertainty, we believe it is possible that the loan’s effective interest rate,ACL estimate could change, potentially materially, in future periods. Changes in the estimated fair valueACL may result from changes in our economic forecast, changes in loan portfolio composition, and circumstances not currently known to us that may impact the financial condition and operations of our borrowers, among other factors.
For the substantial majority of the loan or theportfolio, expected losses are estimated fair valueusing econometric models that employ a factor based methodology to estimate PD and LGD. Projected PDs and LGDs are applied to estimated exposure at default to generate estimates of collateral less costs to sell.
We believe that loans rated special mention, substandard or doubtful that are not individually evaluated for impairment exhibit characteristics indicative of a heightened level of credit risk. We apply a quantitativeexpected loss factor for loans rated special mention based on average annual probability of default and implied severity, derived from internal and external data. Loss factors for substandard and doubtful loans that are not individually evaluated are determined by using default frequency and severity information applied at the loan level. Estimated default frequenciesThese loan level estimates are aggregated by portfolio segment and severities are based on available industry and internal data. In addition, we applyloan class to generate a floor to these calculated loss factors, based on the loss factorcollective estimate for groups of loans that share common risk characteristics. Qualitative adjustments may also be applied to the special mention portfolio.
To the extent,incorporate factors that management does not believe have been adequately considered in management's judgment, commercial portfolio segments have sufficient observable loss history, the quantitative portion of the ALLL is based on the Bank's historical net charge-off rates. These commercial segments include owner-occupied commercial real estateestimate. For loans commercial and industrialthat do not share similar risk characteristics with other loans such as collateral dependent loans and TDRs, expected credit losses are estimated on an individual basis. Expected credit losses are estimated over the Bridge portfolios. For commercial portfolio segments that have not yet exhibited an observable loss trend, the quantitative loss factors are based on peer group average annual historical net charge-off rates by loan class and the Company’s internal credit risk rating system. These commercial segments include multifamily, non-owner occupied commercial real estate and construction and land loans. For Pinnacle, quantitative loss factors are based primarily on historical municipal default data.
Where applicable, the peer group used to calculate average annual historical net charge-off rates used in estimating general reserves is made up of 24 banks included in the OCC Midsize Bank Group plus five additional banks not included in the OCC Midsize Bank Group that management believes to be comparable based on size, geography and nature of lending operations. Peer bank data is obtained from the Statistics on Depository Institutions Report published by the FDIC for the most recent quarter available. These banks, as a group, are considered by management to be comparable to BankUnited in size, nature of lending operations and loan portfolio composition. We evaluate the composition of the peer group annually, or more frequently if, in our judgment, a more frequent evaluation is necessary. Our internal risk rating system comprises 13 credit grades; grades 1 through 8 are “pass” grades. The risk ratings are driven largely by debt service coverage. Peer group historical loss rates are adjusted upward for loans assigned a lower “pass” rating.
For most commercial portfolio segments, we use a 20-quarter look-back period to calculate quantitative loss rates. We believe this look-back period to be consistent with the range of industry practice and appropriate to capture a sufficient range of observations reflecting the performance of our loans, which were originated in the current economic cycle. With the exception of the Pinnacle municipal finance portfolio, a four quarter loss emergence period is used in the calculation of general reserves. A twelve quarter loss emergence period is used in the calculation of general reserves for the Pinnacle portfolio.
Residential and other consumer loans
The residential and other consumer loan portfolio has not yet developed an observable loss trend. Therefore, the ALLL for residential loans is based primarily on relevant proxy historical loss rates. The ALLL for 1-4 single family residential loans, excluding government insured residential loans and ACI loans, is estimated using average annual loss rates on prime residential mortgage securitizations issued between 2003 and 2008 as a proxy. Based on the comparability of FICO scores and LTV ratios between loans included in those securitizations and loans in the Bank’s portfolio and the geographic diversity in the purchased residential portfolio, we determined that prime residential mortgage securitizations provide an appropriate proxy for incurred losses in this portfolio class. A peer group 20-quarter average net charge-off rate is used to estimate the ALLL for the home equity and other consumer loan classes. See further discussion of peer group loss factors above. The home equity and other consumer loan portfolios are not significant components of the overall loan portfolio.
Qualitative Factors
Qualitative adjustments are made to the ALLL when, based on management’s judgment, there are internal or external factors impacting probable incurred losses not taken into account by the quantitative calculations. Potential qualitative adjustments are categorized as follows:
Portfolio performance trends, including trends in and the levels of delinquencies, non-performing loans and classified loans;
Changes in the nature of the portfolio and termscontractual term of the loans, specifically includingadjusted for expected prepayments.
See Note 1 to the volumeconsolidated financial statements for more detailed information about our ACL methodology and nature of policy and procedural exceptions;
Portfolio growth trends;
Changes in lending policies and procedures, including credit and underwriting guidelines and portfolio management practices;
Economic factors, including unemployment rates and GDP growth rates and other factors considered relevant by management;
Changes in the value of underlying collateral;
Quality of risk ratings, as evaluated by our independent credit review function;
Credit concentrations;
Changes in and experience levels of credit administration management and staff; and
Other factors identified by management that may impact the level of losses inherent in the portfolio, including but not limited to competition and legal and regulatory considerations.
ACI Loans
For ACI loans, a valuation allowance is established when periodic evaluations of expected cash flows reflect a deterioration resulting from credit related factors from the level of cash flows that were estimated to be collected at acquisition plus any additional expected cash flows arising from revisions in those estimates. We perform a quarterly analysis of expected cash flows for ACI loans.
Expected cash flows for ACI 1-4 single family residential loans are estimated at the pool level. The analysis of expected cash flows incorporates assumptions about expected prepayment rates, default rates, delinquency levels and loss severity given default.
No ALLL related to 1-4 single family residential ACI pools was recorded at September 30, 2019 or December 31, 2018.
The primary assumptions underlying estimates of expected cash flows for ACI commercial loans are default probability and severity of loss given default. Assessments of default probability and severity are based on net realizable value analyses prepared at the individual loan level. Based on our analysis, no ALLL related to ACI commercial loans was recorded at September 30, 2019 or December 31, 2018. Commercial ACI loans are not a significant portion of the loan portfolio.
The following table provides an analysis of the ALLL,ACL, provision for loancredit losses and net charge-offs for the periods indicated (in thousands):. For the three months ended March 31, 2020, the ACL was estimated using the CECL methodology. For the three months ended March 31,2019, prior to the adoption of ASU 2016-13, an incurred loss methodology was used.
|
| | | | | | | |
| | Nine Months Ended September 30, |
| | 2019 | | 2018 |
| Balance at beginning of period: | $ | 109,931 |
| | $ | 144,795 |
|
| Provision for (recovery of) loan losses: | | | |
| 1-4 single family residential | 704 |
| | (55 | ) |
| Home equity loans and lines of credit | (152 | ) | | (223 | ) |
| Other consumer loans | (113 | ) | | 612 |
|
| Multi-family | (2,265 | ) | | (10,644 | ) |
| Non-owner occupied commercial real estate | (2,029 | ) | | (10,026 | ) |
| Construction and land | (251 | ) | | (1,467 | ) |
| Owner occupied commercial real estate | (2,729 | ) | | 2,490 |
|
Commercial and industrial(1) | 13,682 |
| | 23,944 |
|
| National commercial lending platforms | | | |
| Pinnacle | (135 | ) | | (55 | ) |
| Bridge - franchise finance | 3,582 |
| | 1,400 |
|
| Bridge - equipment finance | (2,599 | ) | | 4,410 |
|
| Small business finance | 476 |
| | 2,899 |
|
| Mortgage warehouse lending | 1,202 |
| | 57 |
|
| Total Provision | 9,373 |
| | 13,342 |
|
| Charge-offs: | | | |
| 1-4 single family residential | — |
| | (979 | ) |
| Other consumer loans | — |
| | (265 | ) |
| Non-owner occupied commercial real estate | (1,626 | ) | | — |
|
| Owner occupied commercial real estate | (89 | ) | | (5,432 | ) |
Commercial and industrial(2) | (9,470 | ) | | (26,342 | ) |
| National commercial lending platforms | | | |
| Bridge - franchise finance | (1,285 | ) | | — |
|
| Small business finance | (1,515 | ) | | (2,969 | ) |
| Total Charge-offs | (13,985 | ) | | (35,987 | ) |
| Recoveries: | | | |
| Home equity loans and lines of credit | 151 |
| | 218 |
|
| Other consumer loans | 21 |
| | 275 |
|
| Non-owner occupied commercial real estate | 82 |
| | 7 |
|
| Owner occupied commercial real estate | 36 |
| | 96 |
|
| Commercial and industrial | 2,032 |
| | 1,695 |
|
| National commercial lending platforms | | | |
| Bridge - franchise finance | — |
| | 2 |
|
| Bridge - equipment finance | 4 |
| | — |
|
| Small business finance | 817 |
| | 297 |
|
| Total Recoveries | 3,143 |
| | 2,590 |
|
| Net Charge-offs: | (10,842 | ) | | (33,397 | ) |
| Balance at end of period | $ | 108,462 |
| | $ | 124,740 |
|
| |
(1) | Includes provision of $12.2 million related to taxi medallion loans during the nine months ended September 30, 2018. |
| |
(2) | Includes charge-offs of $14.2 million related to taxi medallion loans during the nine months ended September 30, 2018. |
|
| | | | | | | |
| | Three Months Ended March 31, |
| | 2020 | | 2019 |
| Balance at beginning of period: | $ | 108,671 |
| | $ | 109,931 |
|
| Impact of adoption of ASU 2016-13 | 27,305 |
| | — |
|
| | 135,976 |
| | 109,931 |
|
| Provision for (recovery of) loan losses: | | | |
| 1-4 single family residential | (6,777 | ) | | 178 |
|
| Home equity loans and lines of credit | 10 |
| | (5 | ) |
| Other consumer loans | 119 |
| | (23 | ) |
| Multi-family | 8,842 |
| | (1,077 | ) |
| Non-owner occupied commercial real estate | 15,792 |
| | 5,288 |
|
| Construction and land | (8 | ) | | 414 |
|
| Owner occupied commercial real estate | 19,358 |
| | (1,729 | ) |
| Commercial and industrial | 56,439 |
| | 7,675 |
|
| Pinnacle | 174 |
| | (7 | ) |
| Bridge - franchise finance | 24,048 |
| | 327 |
|
| Bridge - equipment finance | 3,868 |
| | (760 | ) |
| Total Provision | 121,865 |
| | 10,281 |
|
| Charge-offs: | | | |
| 1-4 single family residential | (31 | ) | | — |
|
| Non-owner occupied commercial real estate | (552 | ) | | (1,703 | ) |
| Owner occupied commercial real estate | (65 | ) | | (42 | ) |
| Commercial and industrial | (2,215 | ) | | (4,388 | ) |
| Bridge - franchise finance | (167 | ) | | — |
|
| Bridge - equipment finance | (4,776 | ) | | — |
|
| Total Charge-offs | (7,806 | ) | | (6,133 | ) |
| Recoveries: | | | |
| Home equity loans and lines of credit | 1 |
| | 2 |
|
| Other consumer loans | 1 |
| | 12 |
|
| Multi-family | 2 |
| | — |
|
| Non-owner occupied commercial real estate | 41 |
| | — |
|
| Owner occupied commercial real estate | 86 |
| | 323 |
|
| Commercial and industrial | 413 |
| | 287 |
|
| Total Recoveries | 544 |
| | 624 |
|
| Net Charge-offs: | (7,262 | ) | | (5,509 | ) |
| Balance at end of period | $ | 250,579 |
| | $ | 114,703 |
|
The following table shows the distribution of the ALLLACL at the dates indicated (dollars in thousands):
| | | | September 30, 2019 | | December 31, 2018 | March 31, 2020 | | January 1, 2020 (1) | | December 31, 2019 |
| | Total | | %(1) | | Total | | %(1) | Total | | %(2) | | Total | | %(2) | | Total | | %(2) |
| Residential and other consumer: | | | | | | | |
| |
| 1 - 4 single family residential | $ | 11,330 |
| | 24.3 | % | | $ | 10,626 |
| | 22.4 | % | |
| Other consumer loans | 69 |
| | 0.1 | % | | 162 |
| | 0.1 | % | |
| | 11,399 |
| | 24.4 | % | | 10,788 |
| | 22.5 | % | |
| Residential and other consumer loans | | 12,576 |
| | 24.4 | % | | 19,252 |
| | 24.5 | % | | 11,154 |
| | 24.5 | % |
| Commercial: | | | | | | | | | | | | | | | | | | |
| Multi-family | 5,134 |
| | 9.7 | % | | 7,399 |
| | 11.8 | % | 13,087 |
| | 8.5 | % | | 4,244 |
| | 9.6 | % | | 5,024 |
| | 9.6 | % |
| Non-owner occupied commercial real estate | 24,940 |
| | 21.0 | % | | 28,512 |
| | 21.0 | % | 25,078 |
| | 21.5 | % | | 9,798 |
| | 21.7 | % | | 23,240 |
| | 21.7 | % |
| Construction and land | 926 |
| | 0.8 | % | | 1,177 |
| | 1.0 | % | 2,610 |
| | 1.0 | % | | 2,618 |
| | 1.1 | % | | 764 |
| | 1.1 | % |
| Owner occupied commercial real estate | 4,013 |
| | 8.5 | % | | 6,795 |
| | 9.1 | % | 50,685 |
| | 8.7 | % | | 31,306 |
| | 8.9 | % | | 8,066 |
| | 8.9 | % |
| Commercial and industrial | 38,233 |
| | 19.6 | % | | 31,991 |
| | 19.6 | % | 106,964 |
| | 25.3 | % | | 52,327 |
| | 23.4 | % | | 43,485 |
| | 23.4 | % |
| National commercial lending platforms | | | | | | | | |
| Pinnacle | 740 |
| | 5.3 | % | | 875 |
| | 6.6 | % | 585 |
| | 5.0 | % | | 411 |
| | 5.2 | % | | 720 |
| | 5.2 | % |
| Bridge - franchise finance | 7,857 |
| | 2.6 | % | | 5,560 |
| | 2.4 | % | 32,910 |
| | 2.8 | % | | 9,030 |
| | 2.6 | % | | 9,163 |
| | 2.6 | % |
| Bridge - equipment finance | 6,963 |
| | 3.0 | % | | 9,558 |
| | 2.9 | % | 6,084 |
| | 2.8 | % | | 6,991 |
| | 3.0 | % | | 7,055 |
| | 3.0 | % |
| Small business finance | 5,967 |
| | 1.1 | % | | 6,189 |
| | 1.1 | % | |
| Mortgage warehouse lending | 2,290 |
| | 4.0 | % | | 1,087 |
| | 2.0 | % | |
| | 97,063 |
| | 75.6 | % | | 99,143 |
| | 77.5 | % | 238,003 |
| | 75.6 | % | | 116,725 |
| | 75.5 | % | | 97,517 |
| | 75.5 | % |
| | $ | 108,462 |
| | 100.0 | % | | $ | 109,931 |
| | 100.0 | % | $ | 250,579 |
| | 100.0 | % | | $ | 135,977 |
| | 100.0 | % | | $ | 108,671 |
| | 100.0 | % |
| |
| (1) | Adoption date of ASU 2016-13. |
| |
| (2) | Represents percentage of loans receivable in each category to total loans receivable. |
The balancefollowing chart depicts the changes in the ACL from December 31, 2019 to March 31, 2020 (in millions):
The increase in the ACL from January 1, 2020, the date of initial adoption of ASC 326, to March 31, 2020 was primarily due to changes in our reasonable and supportable forecast, in large part resulting from the emerging COVID-19 pandemic. The Company based its reasonable and supportable economic forecast used in estimating the ACL at March 31, 2020 on Moody's March Mid-Cycle Baseline forecast dated March 27, 2020. This forecast featured a peak-to-trough drop of approximately 20% in real GDP and a national unemployment rate approaching 9% in the second quarter of 2020, the VIX approaching 60 and year-over-year declines in the S&P 500 index reaching a low of near 30%. The forecast contemplated a recovery beginning in the second half of 2020 with unemployment remaining elevated into 2023. The econometric models we use to estimate
expected credit losses ingest a wide array of national, regional and MSA level economic variables and data points. Some of the ALLL at September 30, 2019 decreased $1.5 million from the balance at December 31, 2018, to 0.47%more impactful include unemployment rates, a market volatility index, a stock price index, real GDP, a variety of total loans from 0.50% of total loans. One factor contributing to this decline is a shift in portfolio mix; at September 30, 2019 theinterest rates and spreads, HPI, and commercial real estate forecast data.
The ACL for residential and mortgage warehouse portfolio segments, which carry lower reserves thanother consumer loans decreased from January 1, 2020 to March 31,2020. This decline was primarily attributable to the portfolio average, constitutedintroduction of a larger percentage of the total loan portfolio. Factors influencing the changequalitative loss factor related to model imprecision. The ACL for residential and other consumer loans included $1.7 million related to PCD loans at March 31, 2020.
Increases in the ALLLACL for the majority of our commercial loan portfolio classes was primarily attributable to changes in the Company's reasonable and supportable economic forecast. The increase also reflected an increase in specific reserves of approximately $16 million summarized as follows:
An increase of $4.3 million in commercial and industrial loans, primarily related to specific loan types at September 30, 2019 as comparedone previously identified $35 million Florida loan.
An increase of $15.2 million in the Bridge franchise finance portfolio, related to December 31, 2018 include:quick service restaurant concepts.
A decrease of $2.3$3.1 million for multi-family loans was primarily attributablein the Bridge equipment finance portfolio.
Changes in the ACL from December 31, 2019 to January 1, 2020 represented the adoption of ASU 2016-13. In general, the change in methodology resulted in increased reserves due to the transition to a decreaselifetime expected loss model from an incurred loss model. However, as noted in the balancetable above, there are certain CRE portfolios where the reserve decreased. This was mainly driven by the use of loans outstanding and a decreasequantitative models to estimate the ACL at the loan level, specific to the Company's portfolio, under CECL, instead of the peer group historical losses rates utilized under the prior incurred loss model. Certain qualitative factors were also removed, as their impact was captured in the quantitative and qualitative loss factors.
A decrease of $3.9 million for non-owner occupied commercial real estate loans was primarily attributable to a decrease in quantitative and qualitative loss factors.
A decrease of $2.8 million for owner occupied commercial real estate loans was primarily attributable to a decrease in quantitative and qualitative loss factors and a decrease in specific reserves.
An increase of $7.5 million for other commercial and industrial loans was primarily attributable to loan growth and increases in specific reserves and classified loans.
An increase of $2.3 million for franchise finance loans was primarily attributable to an increase in classified loans and to a smaller effect, loan growth.
| |
• | A decrease of $2.6 million for equipment finance loans was primarily attributable to a decrease in the specific reserve for one impaired loan relationship and a decline in qualitative loss factors.
|
An increase of $1.2 million for mortgage warehouse lending loans was primarily attributable to an increase in qualitative loss factors.estimate under CECL.
For additional information about the ALLL,ACL, see Note 4 to the consolidated financial statements.
Deposits
Average balances and rates paid on deposits were as follows for the periods indicated (dollars in thousands):
| | | | Three Months Ended September 30, | | Nine Months Ended September 30, | Three Months Ended March 31, |
| | 2019 | | 2018 | | 2019 | | 2018 | 2020 | | 2019 |
| | Average
Balance | | Average
Rate Paid | | Average
Balance | | Average
Rate Paid | | Average
Balance | | Average
Rate Paid | | Average
Balance | | Average
Rate Paid | Average
Balance | | Average
Rate Paid | | Average
Balance | | Average
Rate Paid |
| Demand deposits: | | | | | | | | | | | | | | | | | | | | | | |
| Non-interest bearing | $ | 3,963,955 |
| | — | % | | $ | 3,369,393 |
| | — | % | | $ | 3,835,248 |
| | — | % | | $ | 3,327,521 |
| | — | % | $ | 4,368,553 |
| | — | % | | $ | 3,605,131 |
| | — | % |
| Interest bearing | 1,872,573 |
| | 1.42 | % | | 1,592,908 |
| | 1.13 | % | | 1,783,611 |
| | 1.39 | % | | 1,604,666 |
| | 1.07 | % | 2,173,628 |
| | 1.29 | % | | 1,702,479 |
| | 1.34 | % |
| Money market | 10,710,621 |
| | 1.89 | % | | 10,214,843 |
| | 1.49 | % | | 10,878,975 |
| | 1.91 | % | | 10,314,470 |
| | 1.30 | % | 10,233,123 |
| | 1.48 | % | | 11,221,366 |
| | 1.90 | % |
| Savings | 196,696 |
| | 0.23 | % | | 268,405 |
| | 0.25 | % | | 214,315 |
| | 0.26 | % | | 296,419 |
| | 0.26 | % | 179,079 |
| | 0.19 | % | | 232,614 |
| | 0.28 | % |
| Time | 6,845,643 |
| | 2.41 | % | | 6,728,915 |
| | 1.90 | % | | 6,898,947 |
| | 2.37 | % | | 6,507,726 |
| | 1.71 | % | 7,510,070 |
| | 2.04 | % | | 6,907,011 |
| | 2.29 | % |
| | $ | 23,589,488 |
| | 1.67 | % | | $ | 22,174,464 |
| | 1.35 | % | | $ | 23,611,096 |
| | 1.68 | % | | $ | 22,050,802 |
| | 1.19 | % | $ | 24,464,453 |
| | 1.36 | % | | $ | 23,668,601 |
| | 1.67 | % |
The following table shows scheduled maturities of certificates of deposit with denominations greater than or equal to $100,000 as of September 30, 2019March 31, 2020 (in thousands):
| | | Three months or less | $ | 590,519 |
| $ | 1,080,408 |
|
| Over three through six months | 1,407,226 |
| 729,787 |
|
| Over six through twelve months | 1,132,179 |
| 1,542,955 |
|
| Over twelve months | 215,673 |
| 275,485 |
|
| | $ | 3,345,597 |
| $ | 3,628,635 |
|
FHLB Advances, Notes and Other Borrowings
In addition to deposits, we utilize FHLB advances to fund growth in interest earning assets;as a funding source; the advances provide us with additional flexibility in managing both term and cost of funding.funding and in managing interest rate risk. FHLB advances are secured by FHLB stock, qualifying residential first mortgage and commercial real estate loans, and MBS.
The contractual balance of FHLB advances outstanding at September 30, 2019March 31, 2020 is scheduled to mature as follows (in thousands):
| | | Maturing in: | | |
| 2019—One month or less | $ | 1,275,000 |
| |
| 2019—Over one month | 300,000 |
| |
| 2020 | 3,106,000 |
| |
| 2020—One month or less | | $ | 1,665,000 |
|
| 2020—Over one month | | 3,126,000 |
|
| 2021 | 250,000 |
| 250,000 |
|
| Thereafter | | 100,000 |
|
| Total contractual balance outstanding | 4,931,000 |
| 5,141,000 |
|
| Cumulative fair value hedging adjustments | (362 | ) | 3,409 |
|
| Carrying value | $ | 4,930,638 |
| $ | 5,144,409 |
|
The table above reflects contractual maturities of outstanding advances, and does not incorporate the impact that interest rate swaps designated as hedges have on the duration of borrowings. See Note 76 to the consolidated financial statements for more information about derivative instruments.
Outstanding senior notes payable and other borrowings consisted of the following at the dates indicated (in thousands):
| | | | September 30, 2019 | | December 31, 2018 | March 31, 2020 | | December 31, 2019 |
| Senior notes | $ | 394,912 |
| | $ | 394,390 |
| $ | 395,270 |
| | $ | 395,090 |
|
| Finance leases | 8,920 |
| | 8,359 |
| 33,309 |
| | 34,248 |
|
| | $ | 403,832 |
| | $ | 402,749 |
| $ | 428,579 |
| | $ | 429,338 |
|
Senior notes have a face amount of $400 million, a fixed coupon rate of 4.875% and mature on November 17, 2025.
The Bank utilizes federal funds purchased to manage the daily cash position. At September 30, 2019, the Company had $175 million in federal funds purchased.
Capital Resources
Pursuant to the FDIA, the federal banking agencies have adopted regulations setting forth a five-tier system for measuring the capital adequacy of the financial institutions they supervise. At September 30, 2019March 31, 2020 and December 31, 2018,2019, BankUnited and the Company had capital levels that exceeded both the regulatory well-capitalized guidelines and all internal capital ratio targets.
Stockholders' equity remained relatively flat at September 30, 2019 compared to December 31, 2018. The repurchase of common shares and payment of dividends were largely offset by the retention of earnings. Our dividend payout ratio was 27.0% and 28.2% for the three and nine months ended September 30, 2019, respectively, compared to 23.6% and 25.5% for the three and nine months ended September 30, 2018, respectively.
In January 2019, the Company's Board of Directors authorized a now completed repurchase program under which the Company repurchased approximately 4.4 million shares of its common stock for an aggregate purchase price of $150 million, at a weighted average price of $34.39 per share. In September 2019 the Board of Directors of the Company authorized the repurchase of up to an additional $150 million in shares of its outstanding common stock. The new repurchase program replaces the Company's prior repurchase program. The following table provides information regarding regulatory capital for the Company and the Bank as of September 30, 2019March 31, 2020 (dollars in thousands):
|
| | | | | | | | | | | | | | | | | | | | | | | | | | | |
| | Actual | | Required to be Considered Well Capitalized | | Required to be Considered Adequately Capitalized | | Required to be Considered
Adequately
Capitalized Including Capital Conservation Buffer |
| | Amount | | Ratio | | Amount | | Ratio | | Amount | | Ratio | | Amount | | Ratio |
| BankUnited, Inc.: | |
| | |
| | |
| | |
| | |
| | |
| | | | |
| Tier 1 leverage | $ | 2,858,392 |
| | 8.66 | % | | N/A (1) |
| | N/A (1) |
| | $ | 1,320,013 |
| | 4.00 | % | | N/A (1) |
| | N/A (1) |
|
| CET1 risk-based capital | $ | 2,858,392 |
| | 12.22 | % | | $ | 1,520,940 |
| | 6.50 | % | | $ | 1,052,959 |
| | 4.50 | % | | $ | 1,637,936 |
| | 7.00 | % |
| Tier 1 risk-based capital | $ | 2,858,392 |
| | 12.22 | % | | $ | 1,871,927 |
| | 8.00 | % | | $ | 1,403,945 |
| | 6.00 | % | | $ | 1,988,922 |
| | 8.50 | % |
| Total risk based capital | $ | 2,969,755 |
| | 12.69 | % | | $ | 2,339,908 |
| | 10.00 | % | | $ | 1,871,927 |
| | 8.00 | % | | $ | 2,456,904 |
| | 10.50 | % |
| BankUnited: | |
| | |
| | |
| | |
| | |
| | |
| | | | |
| Tier 1 leverage | $ | 3,010,295 |
| | 9.14 | % | | $ | 1,646,170 |
| | 5.00 | % | | $ | 1,316,936 |
| | 4.00 | % | | N/A |
| | N/A |
|
| CET1 risk-based capital | $ | 3,010,295 |
| | 12.91 | % | | $ | 1,515,958 |
| | 6.50 | % | | $ | 1,049,509 |
| | 4.50 | % | | $ | 1,632,570 |
| | 7.00 | % |
| Tier 1 risk-based capital | $ | 3,010,295 |
| | 12.91 | % | | $ | 1,865,794 |
| | 8.00 | % | | $ | 1,399,345 |
| | 6.00 | % | | $ | 1,982,406 |
| | 8.50 | % |
| Total risk based capital | $ | 3,121,658 |
| | 13.38 | % | | $ | 2,332,242 |
| | 10.00 | % | | $ | 1,865,794 |
| | 8.00 | % | | $ | 2,448,854 |
| | 10.50 | % |
|
| | | | | | | | | | | | | | | | | | | | | | | | | | | |
| | Actual | | Required to be Considered Well Capitalized | | Required to be Considered Adequately Capitalized | | Required to be Considered
Adequately
Capitalized Including Capital Conservation Buffer |
| | Amount | | Ratio | | Amount | | Ratio | | Amount | | Ratio | | Amount | | Ratio |
| BankUnited, Inc.: | |
| | |
| | |
| | |
| | |
| | |
| | | | |
| Tier 1 leverage | $ | 2,813,226 |
| | 8.53 | % | | N/A (1) |
| | N/A (1) |
| | $ | 1,319,509 |
| | 4.00 | % | | N/A (1) |
| | N/A (1) |
|
| CET1 risk-based capital | $ | 2,813,226 |
| | 11.76 | % | | $ | 1,554,389 |
| | 6.50 | % | | $ | 1,076,115 |
| | 4.50 | % | | $ | 1,673,957 |
| | 7.00 | % |
| Tier 1 risk-based capital | $ | 2,813,226 |
| | 11.76 | % | | $ | 1,913,094 |
| | 8.00 | % | | $ | 1,434,820 |
| | 6.00 | % | | $ | 2,032,662 |
| | 8.50 | % |
| Total risk based capital | $ | 3,013,254 |
| | 12.60 | % | | $ | 2,391,367 |
| | 10.00 | % | | $ | 1,913,094 |
| | 8.00 | % | | $ | 2,510,935 |
| | 10.50 | % |
| BankUnited: | |
| | |
| | |
| | |
| | |
| | |
| | | | |
| Tier 1 leverage | $ | 3,064,047 |
| | 9.31 | % | | $ | 1,645,075 |
| | 5.00 | % | | $ | 1,316,060 |
| | 4.00 | % | | N/A |
| | N/A |
|
| CET1 risk-based capital | $ | 3,064,047 |
| | 12.86 | % | | $ | 1,548,966 |
| | 6.50 | % | | $ | 1,072,361 |
| | 4.50 | % | | $ | 1,668,117 |
| | 7.00 | % |
| Tier 1 risk-based capital | $ | 3,064,047 |
| | 12.86 | % | | $ | 1,906,420 |
| | 8.00 | % | | $ | 1,429,815 |
| | 6.00 | % | | $ | 2,025,571 |
| | 8.50 | % |
| Total risk based capital | $ | 3,264,075 |
| | 13.70 | % | | $ | 2,383,025 |
| | 10.00 | % | | $ | 1,906,420 |
| | 8.00 | % | | $ | 2,502,176 |
| | 10.50 | % |
1)(1) There is no Tier 1 leverage ratio component in the definition of a well-capitalized bank holding company.
Beginning January 1,As disclosed in the Company's Form 10-K for the year ended December 31, 2019, the BankCompany had elected to phase-in the initial impact of adopting CECL for regulatory capital purposes, allowing CECL's regulatory capital effects to be phased in at 25 percent per year, beginning in the first year of adoption. As part of its response to the impact of COVID-19, our banking regulators issued an inter-agency interim final rule providing the option to temporarily delay the effects of CECL on regulatory capital for two years, followed by a three-year transition period. The Company has elected to adopt the provisions of this interim final rule.
Total stockholders' equity decreased by approximately $465 million at March 31, 2020 compared to December 31, 2019. The most significant reason for this decrease was a decline of $292 million in accumulated other comprehensive income for the three months ended March 31, 2020, attributed to an increase in unrealized losses on AFS securities and derivative instruments. See the section of this Management's Discussion and Analysis entitled "Analysis of Financial Condition; Investment Securities" and Note 3 to the consolidated financial statements for further discussion of unrealized losses on AFS securities. Management expects to recover the entire amortized cost basis of its AFS securities. Unrealized losses on derivative instruments designated as hedging instruments were attributable to reductions in benchmark interest rates. Other factors contributing to the decrease in total stockholders equity were the repurchase of common shares, the initial adoption of ASU 2016-13 which impacted retained earnings by $24 million, dividends in the amount of $22 million, and the Company$31 million net loss for the quarter.
We believe we are required to maintainwell positioned, from a capital conservation buffer composedperspective, to withstand a severe downturn in the economy. In light of CET1the COVID-19 crisis, uncertainty around its ultimate impact on the economy and, by extension, on our financial condition and results of operations, we have enhanced our stress testing framework. We have increased both the frequency of stress testing and the spectrum of scenarios utilized. One exercise we completed was to stress our March 31, 2020 loan portfolio using both the 2018 DFAST severely adverse scenario and the 2020 DFAST severely adverse scenario. The results of each of these stress tests projected regulatory capital equalratios in excess of all well capitalized thresholds.
During the three months ended March 31, 2020, the Company repurchased approximately 3.3 million shares of its common stock for an aggregate purchase price of $101 million, at a weighted average price of $30.36 per share. The Company has temporarily suspended its share repurchase program.
We have an active shelf registration statement on file with the SEC that allows the Company to 2.50%periodically offer and sell in one or more offerings, individually or in any combination, our common stock, preferred stock and other non-equity securities. The shelf registration provides us with flexibility in issuing capital instruments and enables us to more readily access the capital markets as needed to pursue future growth opportunities and to ensure continued compliance with regulatory capital requirements. Our ability to issue securities pursuant to the shelf registration is subject to market conditions. We believe, based on recent market issuances by other regional banks and our evaluation of risk-weighted assets abovecurrent markets, the amounts requiredCompany would be able to be adequately capitalizedsuccessfully access the capital markets in order to avoid limitations on capital distributions, including dividend payments and certain discretionary bonus payments to executive officers.the current environment.
Liquidity
Liquidity involves our ability to generate adequate funds to support planned interest earning asset growth, meet deposit withdrawal and credit line usage requests, maintain reserve requirements, conduct routine operations, pay dividends, service outstanding debt and meet other contractual obligations.
BankUnited's ongoing liquidity needs have been and continue to be met primarily by cash flows from operations, deposit growth, the investment portfolio and FHLB advances.
The onset of the COVID-19 pandemic led to dislocation and volatility in funding and capital markets and evoked widespread concerns about the ongoing functioning of those markets, the availability of liquidity and the economy generally. In response, the Federal Reserve reduced its benchmark interest rate to a target level of 0 - 0.25%, actively adjusted the size of its overnight and term repurchase agreement operations, reduced reserve requirements and the cost of discount window borrowings, encouraged banks to utilize the discount window and committed to purchasing large amounts of U.S. Treasury securities and MBS. The U.S. government has announced an unprecedented variety of additional stimulus and measures to support markets, the flow of credit, and systemic liquidity. These include the Primary Market Corporate Credit Facility, the Secondary Market Corporate Credit Facility, the Term Asset-Backed Securities Loan Facility, the Municipal Liquidity Facility, the Main Street New Loan Facility, the Main Street Expanded Loan Facility, Paycheck Protection Program loans, the Paycheck Protection Program Lending Facility (PPPLF), the Commercial Paper Funding Facility, the Primary Dealer Credit Facility, and the Money Market Mutual Fund Liquidity Facility. These actions appear to have been effective in stabilizing market liquidity.
In response to the onset of COVID-19 and potential concerns that might arise about the stability of liquidity, we took a number of precautionary measures to ensure adequacy of liquidity. We activated our liquidity contingency funding plan, which called for the implementation of a number of measures to increase the frequency and extent of monitoring and reporting of intraday liquidity, deposit flows and other liquidity trends as well as testing of all of our contingent liquidity sources. We took steps to optimize available same day liquidity. We increased the level of cash held on balance sheet, to be prepared to meet potential increased demand for deposit withdrawals and line usage, which to date have not materialized. We optimized same day available liquidity by pledging additional securities and loans to the FHLB and the discount window to support those sources of contingent liquidity.
At March 31, 2020, same day available liquidity totaled approximately $8.5 billion, including cash, borrowing capacity at the Federal Home Loan Bank of Atlanta and the Federal Reserve Discount Window and Federal Funds lines of credit, as depicted in the following chart:
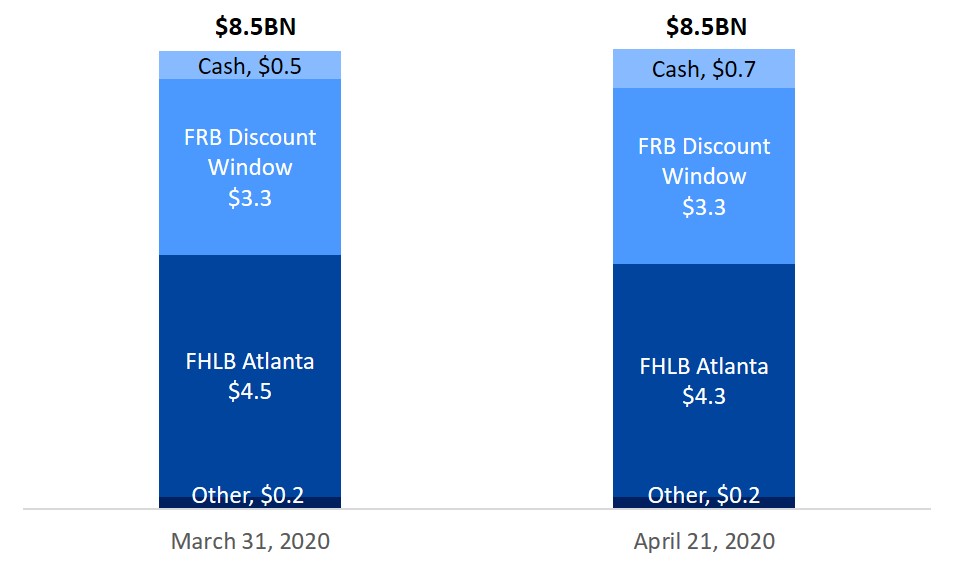
Additional sources of liquidity include cash flows from operations, wholesale deposits, and cash flow from the Bank's amortizing securities and loan portfolios. In the near-term, cash flows from the loan portfolio may be reduced as a result of temporary payment deferrals granted to borrowers. We do not expect this to materially impact our liquidity position. Management also has the ability to exert substantial control over the rate and timing of loan production, and resultant requirements for liquidity to fund new loans. We currently expect the majority of loan production, at least for the remainder of the second quarter, to be related to loans originated under the PPP and potentially the Main Street Lending Facility. Since the onset of the COVID-19 pandemic, we have not experienced unusual deposit outflows or volatility. Credit line usage, which we have monitored daily since the onset of COVID-19, has deviated very little from our trailing three year average. PPP loans will be a near-term demand on liquidity; it is currently our intention to match fund these loans using the PPPLF, which we have successfully accessed. Our available liquidity may also be reduced as the FHLB and Federal Reserve Bank reprice our
collateral in the normal course of business based on March 31, 2020 valuations. Based on our initial analysis, we do not expect the impact to be material to our overall liquidity position.
For the ninethree months ended September 30,March 31, 2020 and 2019 and 2018 net cash provided by operating activities was $412.2$63.5 million and $403.9$88.5 million, respectively. When compared with the ninethree months ended September 30, 2018,March 31, 2019, operating cash flows were negatively impacted by approximately $193$65 million as a result of the daily cash settlement of derivative positions. These settlements, which are reported in cash flows from operating activities, are directly affected by changes in market interest rates. Accretion on ACI loans, which is reflected as a non-cash reduction in net income to arrive at operating cash flows, totaled $49.1 million and $249.6 million for the nine months ended September 30, 2019 and 2018, respectively. Accretable yield on ACI loans represents the excess of expected future cash flows over the carrying amount of the loans, and is recognized as interest income over the expected lives of the loans. Amounts recorded as accretion are realized in cash as individual loans are paid down or otherwise resolved; however, the timing of cash realization may differ from the timing of income recognition. These cash flows from the repayment of ACI loans, inclusive of amounts that have been accreted through earnings over time, are recognized as cash flows from investing activities in the consolidated statements of cash flows upon receipt.
BankUnited has access to additional liquidity through FHLB advances, other collateralized borrowings, wholesale deposits or the sale of available for sale securities. At September 30, 2019, unencumbered investment securities totaled $5.8 billion. At September 30, 2019, BankUnited had available borrowing capacity at the FHLB of $4.0 billion, unused borrowing capacity at the FRB of $476 million and unused Federal funds lines of credit totaling $85 million. Management also has the ability to exert substantial control over the rate and timing of growth of the loan portfolio, and resultant requirements for liquidity to fund loans.
Continued growth of deposits and loans are the most significant trends expected to impact the Bank’s liquidity in the near term.
The ALCO policy has established several measures of liquidity which are typically monitored monthly by the ALCO and quarterly by the Board of Directors. OneIn light of the COVID-19 situation, most of these measures, in addition to same day available liquidity and information about deposit flows, are currently being monitored and reported to executive management daily and to the Board of Directors weekly. The ALCO policy establishes limits for the ratio of available liquidity to volatile liabilities, the ratio of wholesale funding to total assets, the ratio of brokered deposits to total deposits and a government backed securities holding ratio, measured as the ratio of U.S. Government backed securities to total securities. At March 31, 2020 BankUnited was in compliance with all of these ALCO policy limits.
An additional primary measure of liquidity monitored by management is the 30-day total liquidity ratio, defined as (a) the sum of cash and cash equivalents, pledgeable securities and a measure of funds expected to be generated by operations over the next 30 days; divided by (b) the sum of potential deposit runoff, liabilities maturing within the 30 day time frame and a measure of funds expected to be used in operations over the next 30 days. ALCO policy thresholds stipulate that BankUnited’s liquidity is considered acceptable if the 30-day total liquidity ratio exceeds 100%. At September 30, 2019,March 31, 2020, BankUnited’s 30-day total liquidity ratio was 207%141%. Management also monitors a one-year liquidity ratio, defined as (a) cash and cash equivalents, pledgeable securities, unused borrowing capacity at the FHLB, and loans and non-agency securities maturing within one year; divided by (b) forecasted deposit outflows and borrowings maturing within one year. This ratio allows management to monitor liquidity over a longer time horizon. The acceptable threshold established by the ALCO for this liquidity measure is 100%. At September 30, 2019,March 31, 2020, BankUnited’s one-year liquidity ratio was 168%145%. Additional measures of liquidity regularly monitored by the ALCO include the ratio of wholesale funding to total assets, a measure of available liquidity to volatile liabilities, the ratio of brokered deposits to total deposits, the ratio of FHLB advances to total funding, the percentage of investment securities backed by the U.S. government and government agencies and concentrations of large deposits. At September 30, 2019, BankUnited was within acceptable limits established by the ALCOdeposits, a measure of on balance sheet available liquidity and the Boardratio of Directors for eachnon-interest bearing deposits to total deposits, which is reflective of these measures.the quality and cost, rather than the quantity, of available liquidity. The Company also has a comprehensive contingency liquidity funding plan and conducts a quarterly liquidity stress test, the results of which are reported to the risk committee of the Board of Directors.
As a holding company, BankUnited, Inc. is a corporation separate and apart from its banking subsidiary, and therefore, provides for its own liquidity. BankUnited, Inc.’s main sources of funds include management fees and dividends from the Bank, access to capital markets and, to a lesser extent, its own available for sale securities portfolio. There are regulatory limitations that may affect the ability of the Bank to pay dividends to BankUnited, Inc. Management believes that such limitations will not impact our ability to meet our ongoing near-term cash obligations.
We expect that our liquidity requirements will continue to be satisfied over the next 12 months through the sources of funds described above.
Interest Rate Risk
TheA principal component of the Company’s risk of loss arising from adverse changes in the fair value of financial instruments, or market risk, is interest rate risk, including the risk that assets and liabilities with similar re-pricing
characteristics may not reprice at the same time or to the same degree. A primary objective of the Company’s asset/liability management activities is to maximize net interest income, while maintaining acceptable levels of interest rate risk. The ALCO is responsible for establishing policies to limit exposure to interest rate risk, and to ensure procedures are established to monitor compliance with these policies. The guidelinesthresholds established by the ALCO are approved at least annually by the Board of Directors.Directors or its Risk Committee.
Management believes that the simulation of net interest income in different interest rate environments provides the most meaningful measure of interest rate risk. Income simulation analysis is designed to capture not only the potential of all assets and liabilities to mature or reprice, but also the probability that they will do so. Income simulation also attends to the relative interest rate sensitivities of these items, and projects their behavior over an extended period of time. Finally, income simulation permits management to assess the probable effects on the balance sheet not only of changes in interest rates, but also of proposed strategies for responding to them.
The income simulation model analyzes interest rate sensitivity by projecting net interest income over twelve and twenty-four month periods in a most likely rate scenario based on consensus forward interest rate curves versus net interest income in alternative rate scenarios. Simulations are generated based on both static and dynamic balance sheet assumptions. Management continually reviews and refines its interest rate risk management process in response to changes in the interest rate environment
and economic climate. Currently, our model projects instantaneous rate shocks of down 200, down 100, plus 100, plus 200, plus 300 and plus 400 basis point shifts as well as flattening and inverteda variety of yield curve slope scenarios. We continually evaluate the scenarios being modeled with a view toward adapting them to changing economic conditions, expectations and trends.
The Company’s ALCO policy provides that net interest income sensitivity will be considered acceptable if decreases in forecast net interest income in specified parallel rate shock scenarios are within specified percentages of forecast net interest income in the most likely rate scenario over the next twelve months and in the second year. Currently,At March 31, 2020, the most likely rate scenario contemplates three 25 basis point rate cuts over the forecast horizon.assumes that all indices are floored at 0%. The following table illustrates the guidelinesthresholds set forth in the ALCO policy and the impact on forecasted net interest income in the indicated simulated scenarios at September 30, 2019March 31, 2020 and December 31, 2018:2019:
| | | | Down 200 | | Down 100 | | Plus 100 | | Plus 200 | | Plus 300 | | Plus 400 | Down 100 | | Plus 100 | | Plus 200 | | Plus 300 | | Plus 400 |
| Policy Guidelines: | | | | | | | | | | | | |
| Policy Thresholds: | | | | | | | | | | |
| In year 1 | (10.0 | )% | | (6.0 | )% | | (6.0 | )% | | (10.0 | )% | | (14.0 | )% | | (18.0 | )% | (6.0 | )% | | (6.0 | )% | | (10.0 | )% | | (14.0 | )% | | (18.0 | )% |
| In year 2 | (13.0 | )% | | (9.0 | )% | | (9.0 | )% | | (13.0 | )% | | (17.0 | )% | | (21.0 | )% | (9.0 | )% | | (9.0 | )% | | (13.0 | )% | | (17.0 | )% | | (21.0 | )% |
| Model Results at September 30, 2019 - increase (decrease): | | | | | | | | | | | | |
| Model Results at March 31, 2020 - increase (decrease): | | | | | | | | | | |
| In year 1 | (5.0 | )% | | (1.9 | )% | | 0.7 | % | | 0.6 | % | | (0.9 | )% | | (3.4 | )% | (2.4 | )% | | 0.2 | % | | (0.8 | )% | | (2.5 | )% | | (4.7 | )% |
| In year 2 | (9.9 | )% | | (4.8 | )% | | 2.3 | % | | 4.5 | % | | 5.1 | % | | 4.7 | % | (3.8 | )% | | 2.7 | % | | 3.7 | % | | 3.5 | % | | 2.9 | % |
| Model Results at December 31, 2018 - increase (decrease): | | | | | | | | | | | | |
| Model Results at December 31, 2019 - increase (decrease): | | | | | | | | | | |
| In year 1 | (4.3 | )% | | (0.8 | )% | | 0.3 | % | | (0.9 | )% | | (2.4 | )% | | (5.6 | )% | (1.1 | )% | | 1.0 | % | | 0.1 | % | | (2.1 | )% | | (5.1 | )% |
| In year 2 | (9.7 | )% | | (3.0 | )% | | 3.6 | % | | 4.4 | % | | 4.0 | % | | 3.1 | % | (4.8 | )% | | 4.6 | % | | 7.2 | % | | 8.7 | % | | 9.4 | % |
Management also simulates changes in EVE in various interest rate environments. The ALCO policy has established parameters of acceptable risk that are defined in terms of the percentage change in EVE from a base scenario under eight rate scenarios, derived by implementing immediate parallel movements of plus and down 100, 200, 300 and 400 basis points from current rates. We did not simulate decreases in interest rates greater than 200100 basis points at September 30, 2019 or DecemberMarch 31, 20182020 due to the relativelycurrently low level of market interest rates. The following table illustrates the acceptable guidelinesthresholds as established by ALCO and the modeled change in EVE in the indicated scenarios at September 30, 2019March 31, 2020 and December 31, 2018:2019:
|
| | | | | | | | | | | | | | | | | |
| | Down 200 | | Down 100 | | Plus 100 | | Plus 200 | | Plus 300 | | Plus 400 |
| Policy Limits | (18.0 | )% | | (9.0 | )% | | (9.0 | )% | | (18.0 | )% | | (27.0 | )% | | (36.0 | )% |
| Model Results at September 30, 2019 - increase (decrease): | (5.7 | )% | | 0.2 | % | | (2.1 | )% | | (4.9 | )% | | (8.8 | )% | | (13.1 | )% |
| Model Results at December 31, 2018 - increase (decrease): | 0.6 | % | | 2.5 | % | | (3.1 | )% | | (7.5 | )% | | (12.4 | )% | | (17.3 | )% |
|
| | | | | | | | | | | | | | |
| | Down 100 | | Plus 100 | | Plus 200 | | Plus 300 | | Plus 400 |
| Policy Thresholds | (9.0 | )% | | (9.0 | )% | | (18.0 | )% | | (27.0 | )% | | (36.0 | )% |
| Model Results at March 31, 2020 - increase (decrease): | (5.6 | )% | | (0.5 | )% | | (4.0 | )% | | (8.2 | )% | | (12.6 | )% |
| Model Results at December 31, 2019 - increase (decrease): | (1.5 | )% | | (0.7 | )% | | (3.1 | )% | | (6.2 | )% | | (9.7 | )% |
These measures fall within an acceptable level of interest rate risk per the guidelinesthresholds established in the ALCO policy.
Many assumptions were used by the Company to calculate the impact of changes in interest rates, including the change in rates. Actual results may not be similar to the Company’s projections due to several factors including the timing and frequency
of rate changes, market conditions, changes in depositor behavior and loan prepayment speeds and the shape of the yield curve. Actual results may also differ due to the Company’s actions, if any, in response to changing rates and conditions.
Derivative Financial Instruments
Interest rate swaps designated as cash flow or fair value hedging instruments are one of the tools we use to manage interest rate risk. These derivative instruments are used to mitigate exposure to changes in interest cash flows on variable rate borrowings and to hedge changes in the fair value of fixed rate borrowings, in each case caused by fluctuations in benchmark interest rates, as well as to manage duration of liabilities. The fair value of derivative instruments designated as hedges is included in other assets and other liabilities in our consolidated balance sheets. Changes in fair value of derivative instruments designated as cash flow hedges are reported in accumulated other comprehensive income. Changes in the fair value of derivative instruments designated as fair value hedges are recognized in earnings, as is the offsetting gain or loss on the hedged item. At September 30, 2019,March 31, 2020, outstanding interest rate swaps designated as cash flow hedges had an aggregate notional amount of $3.1 billion and outstanding interest rate swaps designated as fair value hedges had an aggregate notional amount of $250 million. The aggregate fair value of interest rate swaps designated as cash flow hedges included in other liabilities was $2.4$6.7 million.
Interest rate swaps and caps not designated as hedges had an aggregate notional amount of $2.5$3.0 billion at September 30, 2019.March 31, 2020. The aggregate fair value of these interest rate swaps and caps included in other assets was $56.6$135.7 million and the aggregate fair
value included in other liabilities was $21.5$42.3 million. These interest rate swaps and caps were entered into as accommodations to certain of our commercial borrowers. To mitigate interest rate risk associated with these derivatives, the Company enters into offsetting derivative positions with primary dealers.
See Note 76 to the consolidated financial statements for additional information about derivative financial instruments.
Off-Balance Sheet Arrangements
For more information on contractual obligations and commitments, see Note 1110 to the consolidated financial statements, the FHLB Advances, Notes and Other Borrowings section of this MD&A and Off-Balance Sheet Arrangements in the MD&A of the Company's 20182019 Annual Reportreport on Form 10-K.
Non-GAAP Financial Measures
Tangible book value per common sharePre-tax, pre-provision income is a non-GAAP financial measure. Management believes this measure is relevant to understanding the capital position and performance of the Company. DisclosureCompany attributable to elements other than the provision for credit losses, particularly in view of this non-GAAP financialthe adoption of the CECL accounting methodology in the current quarter, which may impact comparability of operating results to prior periods. This measure also provides a meaningful basebasis for comparabilitycomparison to other financial institutions. The following table reconciles the non-GAAP financial measurement of tangible book value per common sharepre-tax, pre-provision income to the comparable GAAP financial measurement of book value per common share at September 30,income (loss) before income taxes for the three months ended March 31, 2020 and 2019 (in thousands except share and per share data)thousands):
|
| | | |
| Total stockholders' equity | $ | 2,909,275 |
|
| Less: goodwill and other intangible assets | 77,685 |
|
| Tangible stockholders’ equity | $ | 2,831,590 |
|
| | |
| Common shares issued and outstanding | 95,070,399 |
|
| | |
| Book value per common share | $ | 30.60 |
|
| | |
| Tangible book value per common share | $ | 29.78 |
|
|
| | | | | | | |
| | Three Months Ended March 31, |
| | 2020 | | 2019 |
| Income (loss) before income taxes (GAAP) | $ | (40,422 | ) | | $ | 90,185 |
|
| Plus: Provision for credit losses | 125,428 |
| | 10,281 |
|
| Pre-tax, pre-provision income (non-GAAP) | $ | 85,006 |
| | $ | 100,466 |
|
Non-loss share diluted earnings per shareRecurring operating expenses is a non-GAAP financial measure. Management believes disclosure of this measure provides readers with information that may be useful in understanding the impactcomparing current period results to prior periods and in interpreting trends in operational costs, particularly in light of the covered loans and FDIC indemnification asset on the Company’s earnings for periods prior to the termination of the Single Family Shared-Loss Agreement.our BankUnited 2.0 initiative. The following table reconciles thisthe non-GAAP financial measurement of recurring operating expenses to the comparable GAAP financial measurement of diluted earnings per common sharetotal non-interest expense for the three months ended September 30, 2018March 31, 2020 and 2019 (in millions except share and per share data, shares in thousands):
|
| | | |
| | Three Months Ended September 30, 2018 |
| Net Income (GAAP) | $ | 97.3 |
|
| Less Loss Share Contribution | (28.3 | ) |
| Net Income as reported, minus Loss Share Contribution | $ | 69.0 |
|
| Diluted earnings per common share, excluding Loss Share Contribution: | |
| Diluted earnings per common share (GAAP) | $ | 0.90 |
|
| Less: Net impact on diluted earnings per common share of Loss Share Contribution (non-GAAP) | (0.26 | ) |
| Non-loss share diluted earnings per common share (non-GAAP) | $ | 0.64 |
|
| Non-loss share diluted earnings per share: | |
| Loss Share Contribution | $ | 28.3 |
|
| Weighted average shares for diluted earnings per common share (GAAP) | 104,384 |
|
| Impact on diluted earnings per common share of Loss Share Contribution (non-GAAP) | 0.27 |
|
| Impact on diluted earnings per common share of Loss Share Contribution: | |
| Loss Share Contribution, net of tax, allocated to participating securities | (1.0 | ) |
| Weighted average shares for diluted earnings per common share (GAAP) | 104,384 |
|
| Impact on diluted earnings per common share of Loss Share Contribution allocated to participating securities (non-GAAP) | (0.01 | ) |
| Net impact on diluted earnings per common share of Loss Share Contribution (non-GAAP) | $ | 0.26 |
|
Supplemental Calculations
Calculation of Loss Share Contribution and Non-Loss Share Earnings Per Share
Non-Loss Share Earnings are calculated by removing the total Loss Share Contribution from Net Income. The Loss Share Contribution is a hypothetical presentation of the impact of the covered loans and FDIC indemnification asset on earnings for each respective quarter, reflecting the excess of Loss Share Earnings over hypothetical interest income that could have been earned on alternative assets (in millions except share and per share data):
|
| | | |
| | Three Months Ended September 30, 2018 |
| Net Income As Reported | $ | 97.3 |
|
| Calculation of Loss Share Contribution: | |
| Interest Income - Covered Loans (Accretion) | $ | 81.3 |
|
| Net impact of sale of covered loans | 10.4 |
|
| Amortization of FDIC Indemnification Asset | (48.3 | ) |
| Loss Share Earnings | 43.4 |
|
Hypothetical interest income on alternate assets (1) | (4.9 | ) |
| Loss Share Contribution, pre-tax | 38.5 |
|
Income taxes (2) | (10.2 | ) |
| Loss Share Contribution, after tax | $ | 28.3 |
|
| | |
| Net Income as reported, minus Loss Share Contribution | $ | 69.0 |
|
| | |
| Diluted Earnings Per Common Share, as Reported | $ | 0.90 |
|
| Earnings Per Share, Loss Share Contribution | (0.26 | ) |
| Non-Loss Share Diluted Earnings Per Share | $ | 0.64 |
|
| |
(1) | See section entitled "Supplemental Calculations - Calculation of Hypothetical Interest Income on Alternate Assets" below for calculation of these amounts and underlying assumptions. |
(2) An assumed marginal tax rate of 26.5% was applied.
Calculation of Hypothetical Interest Income on Alternate Assets
The hypothetical interest income calculated below reflects the estimated income that may have been earned if the average balance of covered loans and the FDIC indemnification asset were liquidated and the proceeds assumed to be invested in securities at the weighted average yield on the Company’s investment securities portfolio as reported. Historically, cash received from the repayment, sale, or other resolution of covered loans and cash payments received from the FDIC under the terms of the Shared Loss Agreement have generally been reinvested in non-covered loans or investment securities. There is no assurance that the hypothetical results illustrated below would have been achieved if the covered loans and FDIC indemnification asset had been liquidated and proceeds reinvested (dollars in millions):
|
| | | |
| | Three Months Ended September 30, 2018 |
Average Balances (1) | |
| Average Covered Loans | $ | 408 |
|
| Average FDIC Indemnification Asset | 170 |
|
| Average Loss Share Asset | $ | 578 |
|
| | |
| Yield | |
Yield on securities - reported (2) | 3.41 | % |
| Hypothetical interest income on alternate assets | $ | 4.9 |
|
| |
(1) | Calculated as the simple average of beginning and ending balances reported for each period. |
(2) The weighted average yield on the Company’s investment securities as reported for the applicable quarter. |
| | | | | | | |
| | Three Months Ended March 31, |
| | 2020 | | 2019 |
| Total non-interest expense (GAAP) | $ | 118,868 |
| | $ | 126,690 |
|
| Less: | | | |
| Depreciation of operating lease equipment | (12,603 | ) | | (11,812 | ) |
| Costs incurred directly related to implementation of BankUnited 2.0 | (79 | ) | | (5,892 | ) |
| Recurring operating expenses (non-GAAP) | $ | 106,186 |
| | $ | 108,986 |
|
Item 3. Quantitative and Qualitative Disclosures About Market Risk
See the section entitled “Interest Rate Risk” included in Item 2. “Management’s Discussion and Analysis of Financial Condition and Results of Operations.”
Item 4. Controls and Procedures
Evaluation of Disclosure Controls and Procedures
As of the end of the period covered by this Form 10-Q, we carried out an evaluation under the supervision and with the participation of our management, including the Chief Executive Officer and Chief Financial Officer, of the effectiveness of the design and operation of our disclosure controls and procedures as defined in Exchange Act Rules 13a-15(e) and 15d-15(e). Based upon that evaluation, the Chief Executive Officer and the Chief Financial Officer concluded that our disclosure controls and procedures were effective.
Effective January 1, 2020, the Company adopted ASU 2016-13. The Company designed new controls and modified existing controls as part of its adoption. These additional internal controls over financial reporting included controls over model governance, assumptions, the determination of a reasonable and supportable economic forecast, and expanded controls over loan level data.
During the quarter ended September 30, 2019,March 31, 2020, there were no changes in the Company's internal control over financial reporting, other than those discussed above, that materially affected, or are reasonably likely to materially affect, the Company's internal control over financial reporting. We have focused on insuring that our technology systems and internal controls continue to operate effectively in a remote work environment and have not identified any instances in which controls have failed to operate effectively. We are continually monitoring and assessing the COVID-19 situation on our internal controls to address impacts to their design, implementation and operating effectiveness.
PART II. OTHER INFORMATION
Item 1. Legal Proceedings
The Company is involved as plaintiff or defendant in various legal actions arising in the normal course of business. In the opinion of management, based upon currently available information and the advice of legal counsel, the likelihood is remote that the impact of these proceedings, either individually or in the aggregate, would be material to the Company’s consolidated financial position, results of operations or cash flows.
We received a subpoena from the United States Department of Justice in October 2019 requesting documentation related to the taxi medallion line of business formerly conducted by the Bank. We are cooperating with this investigation.
Item 1A. Risk Factors
Possible replacement ofThe COVID-19 pandemic has caused substantial disruption to the LIBOR benchmark interest rate may have an impact on ourglobal economy which has adversely affected, and is expected to continue to adversely affect, the Company’s business financial condition and results of operations. The future impacts of the COVID-19 pandemic on the global economy and the Company’s business, results of operations and financial condition remains uncertain.
In July 2017,March 2020, the Financial Conduct Authority,World Health Organization declared novel coronavirus disease 2019 (COVID-19) as a regulatorglobal pandemic. The pandemic has resulted in governmental authorities implementing numerous measures attempting to contain the spread and impact of financial services firms in the United Kingdom, announced that it intends to stop persuading or compelling banks to submit LIBOR rates after 2021. The announcement indicated that the continuation of LIBOR on the current basis cannot and will not be guaranteed after 2021. At this time, no final consensus exists as to what rate or rates may become acceptable alternatives to LIBOR, although alternative reference ratesCOVID-19 such as SOFR are under consideration,travel bans and it is impossible to predict the effect of any such alternativesrestrictions, quarantines, shelter in place orders, and limitations on the value of LIBOR-based securities and variable rate loans, subordinated debentures, or other securities or financial arrangements, given LIBOR's rolebusiness activities, including in determining market interest rates globally. There is uncertainty with respect to the impact a potential discontinuation of LIBOR may have on credit, securities and derivatives markets broadly. Uncertainty as to the nature of alternative reference rates and as to potential changes or other reforms to LIBOR may adversely affect LIBOR rates and the value of LIBOR-based loans and securities in our portfolio, and may impact themajor markets in which we lendthe Company and its clients are located or do business. The COVID-19 pandemic, and governmental responses to customersthe pandemic, have severely negatively impacted the global economy, disrupted global supply chains, lowered equity market valuations, created significant volatility and the availabilitydisruption in financial markets, and cost of hedging instrumentsincreased unemployment levels.
This macroeconomic environment has had, and borrowings. If LIBOR rates are no longer available, and we are requiredcould continue to implement substitute indices for the calculation of interest rates under our loan agreements with our borrowers, we may incur significant expenses in effecting the transition, and may be subject to disputes or litigation with customers over the appropriateness or comparability to LIBOR of the substitute indices, which could have, an adverse effect on the Company’s business and operations. Should current economic impacts persist or continue to deteriorate, this macroeconomic environment could have a continued adverse effect on our resultsbusiness and operations, including, but not limited to, decreased demand for the Company’s products and services, protracted periods of operations.
Management islower interest rates, loss of income resulting from forbearances, deferrals and fee waivers provided by the Company to its consumer and commercial borrowers, increased credit losses due to deterioration in the processfinancial condition of evaluating the impactour consumer and commercial borrowers, including declining asset and collateral values, which may continue to increase our provision for credit losses and net charge-offs and possible constraints on liquidity and capital, whether due to increases in risk-weighted assets related to supporting client activities or to regulatory actions. The business operations of the Company's possible transition from LIBOR to an alternative reference rate. To date, the Company has completed a gap assessment, identified the populationmay also be disrupted if significant portions of its current exposuresworkforce or those of vendors or third-party service providers are unable to LIBOR-indexed instrumentswork effectively, including because of illness, quarantines, government actions, restrictions in connection with the pandemic, and technology limitations and/or disruptions. The Company also faces an increased risk of litigation and governmental and regulatory scrutiny as a result of the systemseffects of the pandemic on market and models that may be impactedeconomic conditions and actions taken by the transition, established a formal governance structure for its LIBOR transition, updated the standard fall-back language incorporatedgovernmental authorities in new bilateral loan agreements, and has prepared and is in the process of executing a detailed implementation plan.response to those conditions.
The extent to which the COVID-19 pandemic impacts the Company’s business, results of operations, and financial condition, as well as its regulatory capital and liquidity ratios, will depend on future developments, which are highly uncertain, including the scope and duration of the pandemic and actions taken by governmental authorities and other third parties in response to the pandemic. Moreover, the effects of the COVID-19 pandemic may heighten many of the other risks described in the section entitled “Risk Factors” in our most recent Annual Report on Form 10-K and any subsequent Quarterly Report on Form 10-Q or Current Report on Form 8-K including, but not limited to, financial market conditions, economic conditions, credit risk, interest rate risk, risk of security breaches and technology changes.
There have been no material changes in the other risk factors disclosed by the Company in its 20182019 Annual Report on Form 10-K filed with the Securities and Exchange Commission on February 27, 2019.28, 2020.
Item 2. Unregistered Sales of Equity Securities and Use of Proceeds
|
| | | | | | | | | | | | | | |
| | | Issuer Purchases of Equity Securities |
| Period | | Total number of shares purchased(1) | | Average price paid per share | | Total number of shares purchased as part of publicly announced plans or programs | | Maximum number (or approximate dollar value) of shares that may yet be purchased under the plans or programs(2) |
| July 1 - July 31, 2019 | | 236,990 |
| | $ | 33.48 |
| | 236,990 |
| | $ | — |
|
| August 1 - August 31, 2019 | | — |
| | — |
| | — |
| | $ | — |
|
| September 1 - September 30, 2019 | | — |
| | — |
| | — |
| | $ | 150,000,000 |
|
| Total | | 236,990 |
| | $ | 33.48 |
| | 236,990 |
| | |
|
| | | | | | | | | | | | | | |
| | | Issuer Purchases of Equity Securities |
| Period | | Total number of shares purchased(1) | | Average price paid per share | | Total number of shares purchased as part of publicly announced plans or programs | | Maximum number (or approximate dollar value) of shares that may yet be purchased under the plans or programs(2) |
| January 1 - January 31, 2020 | | 418,852 |
| | $ | 34.07 |
| | 418,852 |
| | $ | 131,697,572 |
|
| February 1 - February 29, 2020 | | 1,312,616 |
| | 32.47 |
| | 1,312,616 |
| | $ | 89,070,779 |
|
| March 1 - March 31, 2020 | | 1,594,109 |
| | 27.65 |
| | 1,594,109 |
| | $ | 44,997,312 |
|
| Total | | 3,325,577 |
| | $ | 30.36 |
| | 3,325,577 |
| | |
| |
| (1) | The total number of shares purchased during the periods indicated includes shares purchased as part of a publicly announced program. |
| |
| (2) | On September 12, 2019, the Company's Board of Directors authorized a share repurchase program under which the Company may repurchase up to $150 million of its outstanding common stock. No time limit was set for the completion of the share repurchase program. The authorization does not require the Company to acquire any specified number of common shares and may be commenced, suspended or discontinued without prior notice. Under this authorization, $150,000,000$44,997,312 remained available for purchase at September 30, 2019.March 31, 2020. On March 13, 2020, we announced the temporary suspension of the share repurchase program in light of the challenges presented by COVID-19 and surrounding events. |
Item 6.
Exhibits
|
| | | | |
Exhibit Number | | Description | | Location |
| | | | | |
| | | | Filed herewith |
| | | | | |
| | | | Filed herewith |
| | | | | |
| | | | Filed herewith |
| | | | | |
| | | | Filed herewith |
| | | | | |
| 101.INS | | The instance document does not appear in the interactive data file because its XBRL tags are embedded within the inline XBRL document | | Filed herewith |
| | | | | |
| 101.SCH | | XBRL Taxonomy Extension Schema | | Filed herewith |
| | | | | |
| 101.CAL | | XBRL Taxonomy Extension Calculation Linkbase | | Filed herewith |
| | | | | |
| 101.DEF | | XBRL Taxonomy Extension Definition Linkbase | | Filed herewith |
| | | | | |
| 101.LAB | | XBRL Taxonomy Extension Label Linkbase | | Filed herewith |
| | | | | |
| 101.PRE | | XBRL Taxonomy Extension Presentation Linkbase | | Filed herewith |
SIGNATURE
Pursuant to the requirements of the Securities Exchange Act of 1934, the registrant has duly caused this report to be signed on its behalf by the undersigned thereunto duly authorized this 8th day of November 2019.May 2020.
|
| |
| | /s/ Rajinder P. Singh |
| | Rajinder P. Singh |
| | Chairman, President and Chief Executive Officer |
| | |
| | |
| | /s/ Leslie N. Lunak |
| | Leslie N. Lunak |
| | Chief Financial Officer |