VEREIT, INC.
CONSOLIDATED STATEMENTS OF CHANGES IN EQUITY
(In thousands, except for share data) (Unaudited)
| Preferred Stock | Common Stock | |||||||||||||||||||||||||||||||||||||||||||||||||||||||||||||
| Number of Shares | Par Value | Number of Shares | Par Value | Additional Paid-In Capital | Accumulated Other Comprehensive Income | Accumulated Deficit | Total Stock-holders’ Equity | Non-Controlling Interests | Total Equity | |||||||||||||||||||||||||||||||||||||||||||||||||||||
| Balance, January 1, 2021 | 18,871,246 | $ | 189 | 228,881,547 | $ | 2,289 | $ | 13,449,412 | $ | 536 | $ | (6,617,380) | $ | 6,835,046 | $ | 7,170 | $ | 6,842,216 | ||||||||||||||||||||||||||||||||||||||||||||
| Issuance of Common Stock, net | — | — | 35,710 | — | — | — | — | — | — | — | ||||||||||||||||||||||||||||||||||||||||||||||||||||
| Redemption of Series F Preferred Stock | (4,000,000) | (40) | — | — | (99,960) | — | — | (100,000) | — | (100,000) | ||||||||||||||||||||||||||||||||||||||||||||||||||||
| Repurchases of Common Stock to settle tax obligation | — | — | (49,237) | — | (1,681) | — | — | (1,681) | — | (1,681) | ||||||||||||||||||||||||||||||||||||||||||||||||||||
| Equity-based compensation, net | — | — | 261,934 | 2 | 2,890 | — | — | 2,892 | — | 2,892 | ||||||||||||||||||||||||||||||||||||||||||||||||||||
| Distributions declared on Common Stock — $0.4620 per common share | — | — | — | — | — | — | (105,858) | (105,858) | — | (105,858) | ||||||||||||||||||||||||||||||||||||||||||||||||||||
| Distributions to non-controlling interest holders | — | — | — | — | — | — | — | — | (70) | (70) | ||||||||||||||||||||||||||||||||||||||||||||||||||||
| Dividend equivalents on awards granted under the Equity Plan | — | — | — | — | — | — | (1,581) | (1,581) | — | (1,581) | ||||||||||||||||||||||||||||||||||||||||||||||||||||
| Distributions to preferred shareholders and unitholders | — | — | — | — | — | — | (6,506) | (6,506) | (19) | (6,525) | ||||||||||||||||||||||||||||||||||||||||||||||||||||
| Net income | — | — | — | — | — | — | 120,647 | 120,647 | 76 | 120,723 | ||||||||||||||||||||||||||||||||||||||||||||||||||||
| Other comprehensive income | — | — | — | — | — | 98 | — | 98 | — | 98 | ||||||||||||||||||||||||||||||||||||||||||||||||||||
| Balance, March 31, 2021 | 14,871,246 | $ | 149 | 229,129,954 | $ | 2,291 | $ | 13,350,661 | $ | 634 | $ | (6,610,678) | $ | 6,743,057 | $ | 7,157 | $ | 6,750,214 | ||||||||||||||||||||||||||||||||||||||||||||
| Preferred Stock | Common Stock | |||||||||||||||||||||||||||||||||||||||||||||||||||||||||||||
| Number of Shares | Par Value | Number of Shares | Par Value | Additional Paid-In Capital | Accumulated Other Comprehensive Income | Accumulated Deficit | Total Stock-holders’ Equity | Non-Controlling Interests | Total Equity | |||||||||||||||||||||||||||||||||||||||||||||||||||||
| Balance, January 1, 2020 | 30,871,246 | $ | 309 | 215,369,197 | $ | 2,153 | $ | 13,260,577 | $ | (27,670) | $ | (6,372,711) | $ | 6,862,658 | $ | 7,535 | $ | 6,870,193 | ||||||||||||||||||||||||||||||||||||||||||||
| Conversion of OP Units to Common Stock | — | — | 910 | — | 45 | — | — | 45 | (45) | 0 | ||||||||||||||||||||||||||||||||||||||||||||||||||||
| Redemption of Series F Preferred Stock | — | — | — | — | (27) | — | — | (27) | — | (27) | ||||||||||||||||||||||||||||||||||||||||||||||||||||
| Repurchases of Common Stock to settle tax obligation | — | — | (48,218) | — | (2,378) | — | — | (2,378) | — | (2,378) | ||||||||||||||||||||||||||||||||||||||||||||||||||||
| Equity-based compensation, net | — | — | 234,408 | 2 | 2,853 | — | — | 2,855 | — | 2,855 | ||||||||||||||||||||||||||||||||||||||||||||||||||||
| Distributions declared on Common Stock — $0.6875 per common share | — | — | — | — | — | — | (148,194) | (148,194) | — | (148,194) | ||||||||||||||||||||||||||||||||||||||||||||||||||||
| Distributions to non-controlling interest holders | — | — | — | — | — | — | — | — | (105) | (105) | ||||||||||||||||||||||||||||||||||||||||||||||||||||
| Dividend equivalents on awards granted under the Equity Plan | — | — | — | — | — | — | (1,628) | (1,628) | — | (1,628) | ||||||||||||||||||||||||||||||||||||||||||||||||||||
| Distributions to preferred shareholders and unitholders | — | — | — | — | — | — | (12,928) | (12,928) | (19) | (12,947) | ||||||||||||||||||||||||||||||||||||||||||||||||||||
| Net income | — | — | — | — | — | — | 86,808 | 86,808 | 55 | 86,863 | ||||||||||||||||||||||||||||||||||||||||||||||||||||
| Other comprehensive loss | — | — | — | — | — | (76,547) | — | (76,547) | (55) | (76,602) | ||||||||||||||||||||||||||||||||||||||||||||||||||||
| Balance, March 31, 2020 | 30,871,246 | $ | 309 | 215,556,297 | $ | 2,155 | $ | 13,261,070 | $ | (104,217) | $ | (6,448,653) | $ | 6,710,664 | $ | 7,366 | $ | 6,718,030 | ||||||||||||||||||||||||||||||||||||||||||||
| Preferred Stock | Common Stock | ||||||||||||||||||||||||||||||||||||||||||||||
| Number of Shares | Par Value | Number of Shares | Par Value | Additional Paid-In Capital | Accumulated Other Comprehensive Income | Accumulated Deficit | Total Stock-holders’ Equity | Non-Controlling Interests | Total Equity | ||||||||||||||||||||||||||||||||||||||
| Balance, January 1, 2020 | 30,871,246 | $ | 309 | 1,076,845,984 | $ | 10,768 | $ | 13,251,962 | $ | (27,670 | ) | $ | (6,399,626 | ) | $ | 6,835,743 | $ | 7,535 | $ | 6,843,278 | |||||||||||||||||||||||||||
| Conversion of OP Units to Common Stock | — | — | 4,549 | 1 | 44 | — | — | 45 | (45 | ) | — | ||||||||||||||||||||||||||||||||||||
| Redemption of Series F Preferred Stock | — | — | — | — | (27 | ) | — | — | (27 | ) | — | (27 | ) | ||||||||||||||||||||||||||||||||||
| Repurchases of Common Stock to settle tax obligation | — | — | (241,092 | ) | (2 | ) | (2,376 | ) | — | — | (2,378 | ) | — | (2,378 | ) | ||||||||||||||||||||||||||||||||
| Equity-based compensation, net | — | — | 1,172,038 | 11 | 2,844 | — | — | 2,855 | — | 2,855 | |||||||||||||||||||||||||||||||||||||
| Distributions declared on Common Stock — $0.1375 per common share | — | — | — | — | — | — | (148,194 | ) | (148,194 | ) | — | (148,194 | ) | ||||||||||||||||||||||||||||||||||
| Distributions to non-controlling interest holders | — | — | — | — | — | — | — | — | (105 | ) | (105 | ) | |||||||||||||||||||||||||||||||||||
| Dividend equivalents on awards granted under the Equity Plan | — | — | — | — | — | — | (1,628 | ) | (1,628 | ) | — | (1,628 | ) | ||||||||||||||||||||||||||||||||||
| Distributions to preferred shareholders and unitholders | — | — | — | — | — | — | (12,928 | ) | (12,928 | ) | (19 | ) | (12,947 | ) | |||||||||||||||||||||||||||||||||
| Net income | — | — | — | — | — | — | 86,808 | 86,808 | 55 | 86,863 | |||||||||||||||||||||||||||||||||||||
| Other comprehensive loss | — | — | — | — | — | (76,547 | ) | — | (76,547 | ) | (55 | ) | (76,602 | ) | |||||||||||||||||||||||||||||||||
| Balance, March 31, 2020 | 30,871,246 | $ | 309 | 1,077,781,479 | $ | 10,778 | $ | 13,252,447 | $ | (104,217 | ) | $ | (6,475,568 | ) | $ | 6,683,749 | $ | 7,366 | $ | 6,691,115 | |||||||||||||||||||||||||||
| Redemption of Series F Preferred Stock | — | — | — | — | (25 | ) | — | — | (25 | ) | — | (25 | ) | ||||||||||||||||||||||||||||||||||
| Equity-based compensation, net | — | — | 67,075 | 1 | 4,070 | — | — | 4,071 | — | 4,071 | |||||||||||||||||||||||||||||||||||||
| Distributions declared on Common Stock — $0.077 per common share | — | — | — | — | — | — | (82,997 | ) | (82,997 | ) | — | (82,997 | ) | ||||||||||||||||||||||||||||||||||
| Distributions to non-controlling interest holders | — | — | — | — | — | — | — | — | (61 | ) | (61 | ) | |||||||||||||||||||||||||||||||||||
| Dividend equivalents on awards granted under the Equity Plan | — | — | — | — | — | — | (18 | ) | (18 | ) | — | (18 | ) | ||||||||||||||||||||||||||||||||||
| Distributions to preferred shareholders and unitholders | — | — | — | — | — | — | (12,928 | ) | (12,928 | ) | (20 | ) | (12,948 | ) | |||||||||||||||||||||||||||||||||
| Repurchase of convertible notes | — | — | — | — | — | — | — | — | (204 | ) | — | — | — | — | — | (204 | ) | — | — | — | (204 | ) | |||||||||||||||||||||||||
| Net income | — | — | — | — | — | — | 54,208 | 54,208 | 31 | 54,239 | |||||||||||||||||||||||||||||||||||||
| Other comprehensive loss | — | — | — | — | — | (1,892 | ) | — | (1,892 | ) | (1 | ) | (1,893 | ) | |||||||||||||||||||||||||||||||||
| Balance, June 30, 2020 | 30,871,246 | $ | 309 | 1,077,848,554 | $ | 10,779 | $ | 13,256,288 | $ | (106,109 | ) | $ | (6,517,303 | ) | $ | 6,643,964 | $ | 7,315 | $ | 6,651,279 | |||||||||||||||||||||||||||
| Preferred Stock | Common Stock | |||||||||||||||||||||||||||||||||||||
| Number of Shares | Par Value | Number of Shares | Par Value | Additional Paid-In Capital | Accumulated Other Comprehensive Income | Accumulated Deficit | Total Stock-holders’ Equity | Non-Controlling Interests | Total Equity | |||||||||||||||||||||||||||||
| Balance, January 1, 2019 | 42,834,138 | $ | 428 | 967,515,165 | $ | 9,675 | $ | 12,615,472 | $ | (1,280 | ) | $ | (5,467,236 | ) | $ | 7,157,059 | $ | 143,085 | $ | 7,300,144 | ||||||||||||||||||
| Issuance of Common Stock, net | — | — | 3,309,808 | 33 | 27,511 | — | — | 27,544 | — | 27,544 | ||||||||||||||||||||||||||||
| Conversion of OP Units to Common Stock | — | — | — | — | (26 | ) | — | — | (26 | ) | 26 | — | ||||||||||||||||||||||||||
| Conversion of Series F Preferred Units to Series F Preferred Stock | 37,108 | 1 | — | — | 922 | — | — | 923 | (923 | ) | — | |||||||||||||||||||||||||||
| Repurchases of Common Stock to settle tax obligation | — | — | (199,083 | ) | (2 | ) | (1,593 | ) | — | — | (1,595 | ) | — | (1,595 | ) | |||||||||||||||||||||||
| Equity-based compensation, net | — | — | 950,487 | 10 | 2,862 | — | — | 2,872 | — | 2,872 | ||||||||||||||||||||||||||||
| Contributions from non-controlling interest holders | — | — | — | — | — | — | — | — | 64 | 64 | ||||||||||||||||||||||||||||
| Distributions declared on Common Stock — $0.1375 per common share | — | — | — | — | — | — | (133,480 | ) | (133,480 | ) | — | (133,480 | ) | |||||||||||||||||||||||||
| Distributions to non-controlling interest holders | — | — | — | — | — | — | — | — | (3,262 | ) | (3,262 | ) | ||||||||||||||||||||||||||
| Dividend equivalents on awards granted under the Equity Plan | — | — | — | — | — | — | (1,222 | ) | (1,222 | ) | — | (1,222 | ) | |||||||||||||||||||||||||
| Distributions to preferred shareholders and unitholders | — | — | — | — | — | — | (17,940 | ) | (17,940 | ) | (33 | ) | (17,973 | ) | ||||||||||||||||||||||||
| Net income | — | — | — | — | — | — | 69,304 | 69,304 | 1,667 | 70,971 | ||||||||||||||||||||||||||||
| Other comprehensive loss | — | — | — | — | — | (10,922 | ) | — | (10,922 | ) | (267 | ) | (11,189 | ) | ||||||||||||||||||||||||
| Balance, March 31, 2019 | 42,871,246 | $ | 429 | 971,576,377 | $ | 9,716 | $ | 12,645,148 | $ | (12,202 | ) | $ | (5,550,574 | ) | $ | 7,092,517 | $ | 140,357 | $ | 7,232,874 | ||||||||||||||||||
| Issuance of Common Stock, net | — | — | 1,773,456 | 18 | 14,516 | — | — | 14,534 | — | 14,534 | ||||||||||||||||||||||||||||
| Repurchases of Common Stock to settle tax obligation | — | — | — | — | (9 | ) | — | — | (9 | ) | — | (9 | ) | |||||||||||||||||||||||||
| Equity-based compensation, net | — | — | 36,066 | — | 3,883 | — | — | 3,883 | — | 3,883 | ||||||||||||||||||||||||||||
| Distributions declared on Common Stock — $0.1375 per common share | — | — | — | — | — | — | (133,841 | ) | (133,841 | ) | — | (133,841 | ) | |||||||||||||||||||||||||
| Distributions to non-controlling interest holders | — | — | — | — | — | — | — | — | (3,264 | ) | (3,264 | ) | ||||||||||||||||||||||||||
| Dividend equivalents on awards granted under the Equity Plan | — | — | — | — | — | — | (44 | ) | (44 | ) | — | (44 | ) | |||||||||||||||||||||||||
| Distributions to preferred shareholders and unitholders | — | — | — | — | — | — | (17,958 | ) | (17,958 | ) | (15 | ) | (17,973 | ) | ||||||||||||||||||||||||
| Distributions payable relinquished | — | — | — | — | — | — | — | — | 6,429 | 6,429 | ||||||||||||||||||||||||||||
| Surrender of Limited Partner OP Units | — | — | — | — | (8,520 | ) | — | — | (8,520 | ) | (18,017 | ) | (26,537 | ) | ||||||||||||||||||||||||
| Net income | — | — | — | — | — | — | 285,658 | 285,658 | 6,626 | 292,284 | ||||||||||||||||||||||||||||
| Other comprehensive loss | — | — | — | — | — | (15,824 | ) | — | (15,824 | ) | (385 | ) | (16,209 | ) | ||||||||||||||||||||||||
| Balance, June 30, 2019 | 42,871,246 | $ | 429 | 973,385,899 | $ | 9,734 | $ | 12,655,018 | $ | (28,026 | ) | $ | (5,416,759 | ) | $ | 7,220,396 | $ | 131,731 | $ | 7,352,127 | ||||||||||||||||||
The accompanying notes are an integral part of these statements.
7
| Three Months Ended March 31, | ||||||||||||||||||||||||||||||||
| 2021 | 2020 | |||||||||||||||||||||||||||||||
| Cash flows from operating activities: | ||||||||||||||||||||||||||||||||
| Net income | $ | 120,723 | $ | 86,863 | ||||||||||||||||||||||||||||
| Adjustments to reconcile net income to net cash provided by operating activities: | ||||||||||||||||||||||||||||||||
| Depreciation and amortization | 112,265 | 126,980 | ||||||||||||||||||||||||||||||
| Gain on real estate assets, net | (78,177) | (25,508) | ||||||||||||||||||||||||||||||
| Impairments | 31,849 | 8,380 | ||||||||||||||||||||||||||||||
| Equity-based compensation | 2,892 | 2,855 | ||||||||||||||||||||||||||||||
| Equity in income of unconsolidated entities | (447) | (246) | ||||||||||||||||||||||||||||||
| Distributions from unconsolidated entities | 447 | 259 | ||||||||||||||||||||||||||||||
| (Gain) loss on other investments | (695) | 541 | ||||||||||||||||||||||||||||||
| Loss on extinguishment and forgiveness of debt, net | 2,132 | 1,280 | ||||||||||||||||||||||||||||||
| Changes in assets and liabilities: | ||||||||||||||||||||||||||||||||
| Investment in direct financing leases | 366 | 364 | ||||||||||||||||||||||||||||||
| Rent and tenant receivables, operating lease right-of-use and other assets, net | (2,000) | (4,462) | ||||||||||||||||||||||||||||||
| Accounts payable and accrued expenses | (7,019) | (2,749) | ||||||||||||||||||||||||||||||
| Deferred rent, operating lease and other liabilities | (2,245) | (22,546) | ||||||||||||||||||||||||||||||
| Net cash provided by operating activities | 180,091 | 172,011 | ||||||||||||||||||||||||||||||
| Cash flows from investing activities: | ||||||||||||||||||||||||||||||||
| Investments in real estate assets | (139,964) | (147,121) | ||||||||||||||||||||||||||||||
| Capital expenditures and leasing costs | (4,500) | (9,502) | ||||||||||||||||||||||||||||||
| Real estate developments | (3,553) | (3,231) | ||||||||||||||||||||||||||||||
| Investments in unconsolidated entities | 0 | (2,669) | ||||||||||||||||||||||||||||||
| Return of investment from unconsolidated entities | 1,124 | 257 | ||||||||||||||||||||||||||||||
| Proceeds from disposition of real estate | 253,503 | 140,428 | ||||||||||||||||||||||||||||||
| Investment in leasehold improvements and other assets | 36 | (87) | ||||||||||||||||||||||||||||||
| Deposits for real estate assets | (3,171) | (895) | ||||||||||||||||||||||||||||||
| Uses and refunds of deposits for real estate assets | 2,454 | 3,130 | ||||||||||||||||||||||||||||||
| Proceeds from the settlement of property-related insurance claims | 713 | 38 | ||||||||||||||||||||||||||||||
| Net cash provided by (used in) investing activities | 106,642 | (19,652) | ||||||||||||||||||||||||||||||
| Cash flows from financing activities: | ||||||||||||||||||||||||||||||||
| Proceeds from mortgage notes payable | 0 | 913 | ||||||||||||||||||||||||||||||
| Payments on mortgage notes payable and other debt, including debt extinguishment costs | (295,869) | (123,574) | ||||||||||||||||||||||||||||||
| Proceeds from credit facility | 0 | 831,313 | ||||||||||||||||||||||||||||||
| Payments on credit facility, including swap termination payments | 0 | (110,000) | ||||||||||||||||||||||||||||||
| Extinguishment costs related to the redemption of corporate bonds | 0 | (26) | ||||||||||||||||||||||||||||||
| Extinguishment costs related to the repurchases of convertible notes | 0 | (13) | ||||||||||||||||||||||||||||||
| Payments of deferred financing costs | (356) | (35) | ||||||||||||||||||||||||||||||
| Refunds of deferred financing costs | 280 | 0 | ||||||||||||||||||||||||||||||
| Repurchases of Common Stock to settle tax obligations | (1,681) | (2,378) | ||||||||||||||||||||||||||||||
| Proceeds from the issuance of Common Stock, net of underwriters’ discount and offering expenses | 1,336 | 0 | ||||||||||||||||||||||||||||||
| Redemption of Series F Preferred Stock | (100,000) | (27) | ||||||||||||||||||||||||||||||
| Distributions paid | (96,559) | (162,747) | ||||||||||||||||||||||||||||||
| Net cash (used in) provided by financing activities | (492,849) | 433,426 | ||||||||||||||||||||||||||||||
| Net change in cash and cash equivalents and restricted cash | $ | (206,116) | $ | 585,785 | ||||||||||||||||||||||||||||
8
| Six Months Ended June 30, | ||||||||
| 2020 | 2019 | |||||||
| Cash flows from operating activities: | ||||||||
| Net income | $ | 141,102 | $ | 363,255 | ||||
| Adjustments to reconcile net income to net cash provided by operating activities: | ||||||||
| Depreciation and amortization | 240,902 | 260,771 | ||||||
| Gain on real estate assets, net | (34,303 | ) | (232,597 | ) | ||||
| Impairments | 20,474 | 20,296 | ||||||
| Equity-based compensation | 6,926 | 6,755 | ||||||
| Equity in income of unconsolidated entities | (1,743 | ) | (1,005 | ) | ||||
| Distributions from unconsolidated entities | 861 | — | ||||||
| Loss on investments | 683 | 464 | ||||||
| Loss on derivative instruments | — | 58 | ||||||
| Non-cash restructuring expense | — | 4,048 | ||||||
| Loss on extinguishment and forgiveness of debt, net | 1,480 | 1,472 | ||||||
| Surrender of Limited Partner OP Units | — | (26,536 | ) | |||||
| Changes in assets and liabilities: | ||||||||
| Investment in direct financing leases | 736 | 821 | ||||||
| Rent and tenant receivables, operating lease right-of-use and other assets, net | (30,158 | ) | (9,596 | ) | ||||
| Accounts payable and accrued expenses | (13,870 | ) | (13,104 | ) | ||||
| Deferred rent, operating lease and other liabilities | (12,138 | ) | (27,084 | ) | ||||
| Net cash provided by operating activities | 320,952 | 348,018 | ||||||
| Cash flows from investing activities: | ||||||||
| Investments in real estate assets | (147,121 | ) | (191,550 | ) | ||||
| Capital expenditures and leasing costs | (15,665 | ) | (19,695 | ) | ||||
| Real estate developments | (6,469 | ) | (10,537 | ) | ||||
| Principal repayments received on mortgage notes receivable | — | 88 | ||||||
| Investments in unconsolidated entities | (10,066 | ) | (2,767 | ) | ||||
| Return of investment from unconsolidated entities | 970 | — | ||||||
| Proceeds from disposition of real estate | 204,114 | 739,873 | ||||||
| Investment in leasehold improvements and other assets | (314 | ) | (798 | ) | ||||
| Deposits for real estate assets | (1,420 | ) | (3,072 | ) | ||||
| Investments in mezzanine position | (9,959 | ) | — | |||||
| Proceeds from sale of investments and other assets | — | 8,199 | ||||||
| Uses and refunds of deposits for real estate assets | 4,036 | 2,946 | ||||||
| Proceeds from the settlement of property-related insurance claims | 48 | 334 | ||||||
| Net cash provided by investing activities | 18,154 | 523,021 | ||||||
| Cash flows from financing activities: | ||||||||
| Proceeds from mortgage notes payable | 1,032 | — | ||||||
| Payments on mortgage notes payable and other debt, including debt extinguishment costs | (135,036 | ) | (175,962 | ) | ||||
| Proceeds from credit facility | 902,000 | 1,034,000 | ||||||
| Payments on credit facility | (1,052,000 | ) | (537,000 | ) | ||||
| Proceeds from corporate bonds | 594,864 | — | ||||||
| Redemptions of corporate bonds, including extinguishment costs | (26 | ) | (750,000 | ) | ||||
| Repurchases of convertible notes, including extinguishment costs | (50,326 | ) | — | |||||
| Payments of deferred financing costs | (6,946 | ) | (182 | ) | ||||
| Repurchases of Common Stock to settle tax obligations | (2,378 | ) | (1,604 | ) | ||||
| Proceeds from the issuance of Common Stock, net of underwriters’ discount and offering expenses | — | 42,078 | ||||||
| Series F Preferred Stock redemption expenses | (52 | ) | — | |||||
| Contributions from non-controlling interest holders | — | 64 | ||||||
| Distributions paid | (324,032 | ) | (303,894 | ) | ||||
| Net cash used in financing activities | (72,900 | ) | (692,500 | ) | ||||
| Net change in cash and cash equivalents and restricted cash | $ | 266,206 | $ | 178,539 | ||||
VEREIT, INC.
CONSOLIDATED STATEMENTS OF CASH FLOWS – (Continued)
(In thousands) (Unaudited)
| Three Months Ended March 31, | ||||||||||||||||||||||||||||||||
| 2021 | 2020 | |||||||||||||||||||||||||||||||
| Cash and cash equivalents and restricted cash, beginning of period | $ | 537,381 | $ | 33,880 | ||||||||||||||||||||||||||||
| Cash and cash equivalents and restricted cash, end of period | $ | 331,265 | $ | 619,665 | ||||||||||||||||||||||||||||
| Reconciliation of Cash and Cash Equivalents and Restricted Cash | ||||||||||||||||||||||||||||||||
| Cash and cash equivalents at beginning of period | $ | 523,539 | $ | 12,921 | ||||||||||||||||||||||||||||
| Restricted cash at beginning of period | 13,842 | 20,959 | ||||||||||||||||||||||||||||||
| Cash and cash equivalents and restricted cash at beginning of period | 537,381 | 33,880 | ||||||||||||||||||||||||||||||
| Cash and cash equivalents at end of period | 318,561 | 600,945 | ||||||||||||||||||||||||||||||
| Restricted cash at end of period | 12,704 | 18,720 | ||||||||||||||||||||||||||||||
| Cash and cash equivalents and restricted cash at end of period | $ | 331,265 | $ | 619,665 | ||||||||||||||||||||||||||||
| Six Months Ended June 30, | ||||||||
| 2020 | 2019 | |||||||
| Cash and cash equivalents and restricted cash, beginning of period | $ | 33,880 | $ | 53,663 | ||||
| Cash and cash equivalents and restricted cash, end of period | $ | 300,086 | $ | 232,202 | ||||
| Reconciliation of Cash and Cash Equivalents and Restricted Cash | ||||||||
| Cash and cash equivalents at beginning of period | $ | 12,921 | $ | 30,758 | ||||
| Restricted cash at beginning of period | 20,959 | 22,905 | ||||||
| Cash and cash equivalents and restricted cash at beginning of period | 33,880 | 53,663 | ||||||
| Cash and cash equivalents at end of period | 278,883 | 211,510 | ||||||
| Restricted cash at end of period | 21,203 | 20,692 | ||||||
| Cash and cash equivalents and restricted cash at end of period | $ | 300,086 | $ | 232,202 | ||||
The accompanying notes are an integral part of these statements.
9
VEREIT OPERATING PARTNERSHIP, L.P.
CONSOLIDATED BALANCE SHEETS
(In thousands, except for unit data) (Unaudited)
| March 31, 2021 | December 31, 2020 | |||||||||||||
| ASSETS | ||||||||||||||
| Real estate investments, at cost: | ||||||||||||||
| Land | $ | 2,698,232 | $ | 2,699,110 | ||||||||||
| Buildings, fixtures and improvements | 9,941,903 | 10,032,055 | ||||||||||||
| Intangible lease assets | 1,883,826 | 1,872,461 | ||||||||||||
| Total real estate investments, at cost | 14,523,961 | 14,603,626 | ||||||||||||
| Less: accumulated depreciation and amortization | 3,861,411 | 3,833,084 | ||||||||||||
| Total real estate investments, net | 10,662,550 | 10,770,542 | ||||||||||||
| Operating lease right-of-use assets | 191,443 | 195,518 | ||||||||||||
| Investment in unconsolidated entities | 80,513 | 81,639 | ||||||||||||
| Cash and cash equivalents | 318,561 | 523,539 | ||||||||||||
| Restricted cash | 12,704 | 13,842 | ||||||||||||
| Rent and tenant receivables and other assets, net | 368,926 | 366,620 | ||||||||||||
| Goodwill | 1,337,773 | 1,337,773 | ||||||||||||
| Real estate assets held for sale, net | 4,888 | 65,583 | ||||||||||||
| Total assets | $ | 12,977,358 | $ | 13,355,056 | ||||||||||
| LIABILITIES AND EQUITY | ||||||||||||||
| Mortgage notes payable, net | $ | 1,035,328 | $ | 1,328,835 | ||||||||||
| Corporate bonds, net | 4,586,252 | 4,584,230 | ||||||||||||
| Below-market lease liabilities, net | 117,121 | 120,938 | ||||||||||||
| Accounts payable and accrued expenses | 116,486 | 117,015 | ||||||||||||
| Deferred rent and other liabilities | 62,944 | 63,204 | ||||||||||||
| Distributions payable | 106,989 | 89,514 | ||||||||||||
| Operating lease liabilities | 202,024 | 209,104 | ||||||||||||
| Total liabilities | 6,227,144 | 6,512,840 | ||||||||||||
| Commitments and contingencies (Note 10) | 0 | 0 | ||||||||||||
| General Partner's preferred equity, 14,871,246 and 18,871,246 General Partner Series F Preferred Units issued and outstanding as of March 31, 2021 and December 31, 2020, respectively | 147,788 | 254,294 | ||||||||||||
| General Partner's common equity, 229,129,954 and 228,881,547 General Partner OP Units issued and outstanding as of March 31, 2021 and December 31, 2020, respectively | 6,595,269 | 6,580,752 | ||||||||||||
| Limited Partner's preferred equity, 49,766 Limited Partner Series F Preferred Units issued and outstanding as of each of March 31, 2021 and December 31, 2020, respectively | 1,768 | 1,787 | ||||||||||||
| Limited Partner's common equity, 152,033 Limited Partner OP Units issued and outstanding as of each of March 31, 2021 and December 31, 2020, respectively | 4,218 | 4,209 | ||||||||||||
| Total partners’ equity | 6,749,043 | 6,841,042 | ||||||||||||
| Non-controlling interests | 1,171 | 1,174 | ||||||||||||
| Total equity | 6,750,214 | 6,842,216 | ||||||||||||
| Total liabilities and equity | $ | 12,977,358 | $ | 13,355,056 | ||||||||||
| June 30, 2020 | December 31, 2019 | |||||||
| ASSETS | ||||||||
| Real estate investments, at cost: | ||||||||
| Land | $ | 2,705,149 | $ | 2,738,679 | ||||
| Buildings, fixtures and improvements | 10,117,636 | 10,200,550 | ||||||
| Intangible lease assets | 1,891,831 | 1,904,641 | ||||||
| Total real estate investments, at cost | 14,714,616 | 14,843,870 | ||||||
| Less: accumulated depreciation and amortization | 3,756,132 | 3,594,247 | ||||||
| Total real estate investments, net | 10,958,484 | 11,249,623 | ||||||
| Operating lease right-of-use assets | 208,037 | 215,227 | ||||||
| Investment in unconsolidated entities | 86,300 | 68,825 | ||||||
| Cash and cash equivalents | 278,883 | 12,921 | ||||||
| Restricted cash | 21,203 | 20,959 | ||||||
| Rent and tenant receivables and other assets, net | 382,409 | 348,395 | ||||||
| Goodwill | 1,337,773 | 1,337,773 | ||||||
| Real estate assets held for sale, net | 48,093 | 26,957 | ||||||
| Total assets | $ | 13,321,182 | $ | 13,280,680 | ||||
| LIABILITIES AND EQUITY | ||||||||
| Mortgage notes payable, net | $ | 1,393,652 | $ | 1,528,134 | ||||
| Corporate bonds, net | 3,404,935 | 2,813,739 | ||||||
| Convertible debt, net | 270,152 | 318,183 | ||||||
| Credit facility, net | 896,314 | 1,045,669 | ||||||
| Below-market lease liabilities, net | 130,208 | 143,583 | ||||||
| Accounts payable and accrued expenses | 112,551 | 126,320 | ||||||
| Derivative, deferred rent and other liabilities | 161,538 | 90,349 | ||||||
| Distributions payable | 85,231 | 150,364 | ||||||
| Operating lease liabilities | 215,322 | 221,061 | ||||||
| Total liabilities | 6,669,903 | 6,437,402 | ||||||
| Commitments and contingencies (Note 10) | ||||||||
| General Partner's preferred equity, 30,871,246 General Partner Series F Preferred Units issued and outstanding as of each of June 30, 2020 and December 31, 2019, respectively | 434,596 | 460,504 | ||||||
| General Partner's common equity, 1,077,848,554 and 1,076,845,984 General Partner OP Units issued and outstanding as of June 30, 2020 and December 31, 2019, respectively | 6,209,368 | 6,375,239 | ||||||
| Limited Partner's preferred equity, 49,766 Limited Partner Series F Preferred Units issued and outstanding as of each of June 30, 2020 and December 31, 2019, respectively | 1,830 | 1,869 | ||||||
| Limited Partner's common equity, 782,170 and 786,719 Limited Partner OP Units issued and outstanding as of June 30, 2020 and December 31, 2019, respectively | 4,267 | 4,433 | ||||||
| Total partners’ equity | 6,650,061 | 6,842,045 | ||||||
| Non-controlling interests | 1,218 | 1,233 | ||||||
| Total equity | 6,651,279 | 6,843,278 | ||||||
| Total liabilities and equity | $ | 13,321,182 | $ | 13,280,680 | ||||
The accompanying notes are an integral part of these statements.
10
VEREIT OPERATING PARTNERSHIP, L.P.
CONSOLIDATED STATEMENTS OF OPERATIONS
(In thousands, except for per unit data) (Unaudited)
| Three Months Ended March 31, | ||||||||||||||||||||||||||||||||
| 2021 | 2020 | |||||||||||||||||||||||||||||||
| Revenues: | ||||||||||||||||||||||||||||||||
| Rental | $ | 290,309 | $ | 298,586 | ||||||||||||||||||||||||||||
| Fees from managed partnerships | 500 | 596 | ||||||||||||||||||||||||||||||
| Total revenues | 290,809 | 299,182 | ||||||||||||||||||||||||||||||
| Operating expenses: | ||||||||||||||||||||||||||||||||
| Acquisition-related | 1,354 | 1,523 | ||||||||||||||||||||||||||||||
| Litigation and non-routine costs, net | 68 | (8,564) | ||||||||||||||||||||||||||||||
| Property operating | 30,605 | 30,490 | ||||||||||||||||||||||||||||||
| General and administrative | 14,526 | 15,056 | ||||||||||||||||||||||||||||||
| Depreciation and amortization | 108,075 | 124,080 | ||||||||||||||||||||||||||||||
| Impairments | 31,849 | 8,380 | ||||||||||||||||||||||||||||||
| Total operating expenses | 186,477 | 170,965 | ||||||||||||||||||||||||||||||
| Other income (expense): | ||||||||||||||||||||||||||||||||
| Interest expense | (60,736) | (64,696) | ||||||||||||||||||||||||||||||
| Loss on extinguishment and forgiveness of debt, net | (2,132) | (1,280) | ||||||||||||||||||||||||||||||
| Other income, net | 3,666 | 175 | ||||||||||||||||||||||||||||||
| Equity in income of unconsolidated entities | 447 | 246 | ||||||||||||||||||||||||||||||
| Gain on disposition of real estate and real estate assets held for sale, net | 76,074 | 25,249 | ||||||||||||||||||||||||||||||
| Total other income (expense), net | 17,319 | (40,306) | ||||||||||||||||||||||||||||||
| Income before taxes | 121,651 | 87,911 | ||||||||||||||||||||||||||||||
| Provision for income taxes | (928) | (1,048) | ||||||||||||||||||||||||||||||
| Net income | 120,723 | 86,863 | ||||||||||||||||||||||||||||||
Net loss attributable to non-controlling interests (1) | 3 | 7 | ||||||||||||||||||||||||||||||
| Net income attributable to the OP | $ | 120,726 | $ | 86,870 | ||||||||||||||||||||||||||||
Basic and diluted net income per unit attributable to common unitholders | $ | 0.50 | $ | 0.34 | ||||||||||||||||||||||||||||
(1)Represents net loss attributable to a consolidated joint venture partner.
| Three Months Ended June 30, | Six Months Ended June 30, | |||||||||||||||
| 2020 | 2019 | 2020 | 2019 | |||||||||||||
| Revenues: | ||||||||||||||||
| Rental | $ | 278,576 | $ | 312,043 | $ | 577,162 | $ | 628,886 | ||||||||
| Fees from managed partnerships | 421 | 145 | 1,017 | 182 | ||||||||||||
| Total revenues | 278,997 | 312,188 | 578,179 | 629,068 | ||||||||||||
| Operating expenses: | ||||||||||||||||
| Acquisition-related | 1,169 | 985 | 2,692 | 1,970 | ||||||||||||
| Litigation and non-routine costs, net | (118 | ) | (3,769 | ) | (8,682 | ) | (25,261 | ) | ||||||||
| Property operating | 29,098 | 32,503 | 59,588 | 64,881 | ||||||||||||
| General and administrative | 16,120 | 16,416 | 31,176 | 31,262 | ||||||||||||
| Depreciation and amortization | 110,599 | 118,022 | 234,679 | 254,577 | ||||||||||||
| Impairments | 12,094 | 8,308 | 20,474 | 20,296 | ||||||||||||
| Restructuring | — | 290 | — | 9,366 | ||||||||||||
| Total operating expenses | 168,962 | 172,755 | 339,927 | 357,091 | ||||||||||||
| Other (expenses) income: | ||||||||||||||||
| Interest expense | (65,613 | ) | (69,803 | ) | (130,309 | ) | (141,057 | ) | ||||||||
| Loss on extinguishment and forgiveness of debt, net | (200 | ) | (1,472 | ) | (1,480 | ) | (1,472 | ) | ||||||||
| Other income, net | 778 | 3,030 | 953 | 2,591 | ||||||||||||
| Equity in income of unconsolidated entities | 1,497 | 505 | 1,743 | 1,005 | ||||||||||||
| Gain on disposition of real estate and real estate assets held for sale, net | 8,795 | 221,755 | 34,044 | 232,586 | ||||||||||||
| Total other (expenses) income, net | (54,743 | ) | 154,015 | (95,049 | ) | 93,653 | ||||||||||
| Income before taxes | 55,292 | 293,448 | 143,203 | 365,630 | ||||||||||||
| Provision for income taxes | (1,053 | ) | (1,164 | ) | (2,101 | ) | (2,375 | ) | ||||||||
| Net income | 54,239 | 292,284 | 141,102 | 363,255 | ||||||||||||
Net loss attributable to non-controlling interests (1) | 8 | 30 | 15 | 58 | ||||||||||||
| Net income attributable to the OP | $ | 54,247 | $ | 292,314 | $ | 141,117 | $ | 363,313 | ||||||||
Basic and diluted net income per unit attributable to common unitholders | $ | 0.04 | $ | 0.27 | $ | 0.11 | $ | 0.33 | ||||||||
The accompanying notes are an integral part of these statements.
11
VEREIT OPERATING PARTNERSHIP, L.P.
CONSOLIDATED STATEMENTS OF COMPREHENSIVE INCOME (LOSS)
(In thousands) (Unaudited)
| Three Months Ended June 30, | Six Months Ended June 30, | Three Months Ended March 31, | ||||||||||||||||||||||||||||||||||
| 2020 | 2019 | 2020 | 2019 | 2021 | 2020 | |||||||||||||||||||||||||||||||
| Net income | $ | 54,239 | $ | 292,284 | $ | 141,102 | $ | 363,255 | Net income | $ | 120,723 | $ | 86,863 | |||||||||||||||||||||||
| Total other comprehensive loss | ||||||||||||||||||||||||||||||||||||
| Unrealized loss on interest rate derivatives | (6,497 | ) | (16,308 | ) | (85,047 | ) | (27,594 | ) | ||||||||||||||||||||||||||||
| Total other comprehensive income (loss) | Total other comprehensive income (loss) | |||||||||||||||||||||||||||||||||||
| Unrealized gain (loss) on interest rate derivatives | Unrealized gain (loss) on interest rate derivatives | 0 | (78,550) | |||||||||||||||||||||||||||||||||
| Reclassification of previous unrealized loss on interest rate derivatives into net income | 4,604 | 99 | 6,552 | 196 | Reclassification of previous unrealized loss on interest rate derivatives into net income | 98 | 1,948 | |||||||||||||||||||||||||||||
| Total other comprehensive loss | (1,893 | ) | (16,209 | ) | (78,495 | ) | (27,398 | ) | ||||||||||||||||||||||||||||
| Total other comprehensive income (loss) | Total other comprehensive income (loss) | 98 | (76,602) | |||||||||||||||||||||||||||||||||
| Total comprehensive income | 52,346 | 276,075 | 62,607 | 335,857 | Total comprehensive income | 120,821 | 10,261 | |||||||||||||||||||||||||||||
Comprehensive loss attributable to non-controlling interests(1) | 8 | 30 | 15 | 58 | Comprehensive loss attributable to non-controlling interests (1) | 3 | 7 | |||||||||||||||||||||||||||||
| Total comprehensive income attributable to the OP | $ | 52,354 | $ | 276,105 | $ | 62,622 | $ | 335,915 | Total comprehensive income attributable to the OP | $ | 120,824 | $ | 10,268 | |||||||||||||||||||||||
(1)Represents comprehensive loss attributable to a consolidated joint venture partner.
The accompanying notes are an integral part of these statements.
12
VEREIT OPERATING PARTNERSHIP, L.P.
CONSOLIDATED STATEMENTS OF CHANGES IN EQUITY
(In thousands, except for unit data) (Unaudited)
| Preferred Units | Common Units | |||||||||||||||||||||||||||||||||||||||||||||||||||||||||||||||||||
| General Partner | Limited Partner | General Partner | Limited Partner | |||||||||||||||||||||||||||||||||||||||||||||||||||||||||||||||||
| Number of Units | Capital | Number of Units | Capital | Number of Units | Capital | Number of Units | Capital | Total Partners' Capital | Non-Controlling Interests | Total Capital | ||||||||||||||||||||||||||||||||||||||||||||||||||||||||||
| Balance, January 1, 2021 | 18,871,246 | $ | 254,294 | 49,766 | $ | 1,787 | 228,881,547 | $ | 6,580,752 | 152,033 | $ | 4,209 | $ | 6,841,042 | $ | 1,174 | $ | 6,842,216 | ||||||||||||||||||||||||||||||||||||||||||||||||||
| Issuance of common OP Units, net | — | — | — | — | 35,710 | — | — | — | — | — | — | |||||||||||||||||||||||||||||||||||||||||||||||||||||||||
| Redemption of Series F Preferred Stock | (4,000,000) | (100,000) | — | — | — | — | — | — | (100,000) | — | (100,000) | |||||||||||||||||||||||||||||||||||||||||||||||||||||||||
| Repurchases of common OP Units to settle tax obligation | — | — | — | — | (49,237) | (1,681) | — | — | (1,681) | — | (1,681) | |||||||||||||||||||||||||||||||||||||||||||||||||||||||||
| Equity-based compensation, net | — | — | — | — | 261,934 | 2,892 | — | — | 2,892 | — | 2,892 | |||||||||||||||||||||||||||||||||||||||||||||||||||||||||
| Distributions to Common OP Units and non-controlling interests —$0.4620 per common unit | — | — | — | — | — | (105,858) | — | (70) | (105,928) | — | (105,928) | |||||||||||||||||||||||||||||||||||||||||||||||||||||||||
| Dividend equivalents on awards granted under the Equity Plan | — | — | — | — | — | (1,581) | — | — | (1,581) | — | (1,581) | |||||||||||||||||||||||||||||||||||||||||||||||||||||||||
| Distributions to Series F Preferred Units | — | (6,506) | — | (19) | — | — | — | — | (6,525) | — | (6,525) | |||||||||||||||||||||||||||||||||||||||||||||||||||||||||
| Net income (loss) | — | — | — | — | — | 120,647 | — | 79 | 120,726 | (3) | 120,723 | |||||||||||||||||||||||||||||||||||||||||||||||||||||||||
| Other comprehensive income | — | — | — | — | — | 98 | — | — | 98 | — | 98 | |||||||||||||||||||||||||||||||||||||||||||||||||||||||||
| Balance, March 31, 2021 | 14,871,246 | $ | 147,788 | 49,766 | $ | 1,768 | 229,129,954 | $ | 6,595,269 | 152,033 | $ | 4,218 | $ | 6,749,043 | $ | 1,171 | $ | 6,750,214 | ||||||||||||||||||||||||||||||||||||||||||||||||||
| Preferred Units | Common Units | |||||||||||||||||||||||||||||||||||||||||||||||||||||||||||||||||||
| General Partner | Limited Partner | General Partner | Limited Partner | |||||||||||||||||||||||||||||||||||||||||||||||||||||||||||||||||
| Number of Units | Capital | Number of Units | Capital | Number of Units | Capital | Number of Units | Capital | Total Partners' Capital | Non-Controlling Interests | Total Capital | ||||||||||||||||||||||||||||||||||||||||||||||||||||||||||
| Balance, January 1, 2020 | 30,871,246 | $ | 460,504 | 49,766 | $ | 1,869 | 215,369,197 | $ | 6,402,154 | 157,343 | $ | 4,433 | $ | 6,868,960 | $ | 1,233 | $ | 6,870,193 | ||||||||||||||||||||||||||||||||||||||||||||||||||
| Conversion of Limited Partners' Common OP Units to General Partner's Common OP Units | — | — | — | — | 910 | 45 | (910) | (45) | — | — | 0 | |||||||||||||||||||||||||||||||||||||||||||||||||||||||||
| Redemption of Series F Preferred Stock | — | (27) | — | — | — | — | — | — | (27) | — | (27) | |||||||||||||||||||||||||||||||||||||||||||||||||||||||||
| Repurchases of common OP Units to settle tax obligation | — | — | — | — | (48,218) | (2,378) | — | — | (2,378) | — | (2,378) | |||||||||||||||||||||||||||||||||||||||||||||||||||||||||
| Equity-based compensation, net | — | — | — | — | 234,408 | 2,855 | — | — | 2,855 | — | 2,855 | |||||||||||||||||||||||||||||||||||||||||||||||||||||||||
| Distributions to Common OP Units and non-controlling interests —$0.6875 per common unit | — | — | — | — | — | (148,194) | — | (105) | (148,299) | — | (148,299) | |||||||||||||||||||||||||||||||||||||||||||||||||||||||||
| Dividend equivalents on awards granted under the Equity Plan | — | — | — | — | — | (1,628) | — | — | (1,628) | — | (1,628) | |||||||||||||||||||||||||||||||||||||||||||||||||||||||||
| Distributions to Series F Preferred Units | — | (12,928) | — | (19) | — | — | — | — | (12,947) | — | (12,947) | |||||||||||||||||||||||||||||||||||||||||||||||||||||||||
| Net income (loss) | — | — | — | — | — | 86,808 | — | 62 | 86,870 | (7) | 86,863 | |||||||||||||||||||||||||||||||||||||||||||||||||||||||||
| Other comprehensive loss | — | — | — | — | — | (76,547) | — | (55) | (76,602) | — | (76,602) | |||||||||||||||||||||||||||||||||||||||||||||||||||||||||
| Balance, March 31, 2020 | 30,871,246 | $ | 447,549 | 49,766 | $ | 1,850 | 215,556,297 | $ | 6,263,115 | 156,433 | $ | 4,290 | $ | 6,716,804 | $ | 1,226 | $ | 6,718,030 | ||||||||||||||||||||||||||||||||||||||||||||||||||
| Preferred Units | Common Units | |||||||||||||||||||||||||||||||||||||||
| General Partner | Limited Partner | General Partner | Limited Partner | |||||||||||||||||||||||||||||||||||||
| Number of Units | Capital | Number of Units | Capital | Number of Units | Capital | Number of Units | Capital | Total Partners' Capital | Non-Controlling Interests | Total Capital | ||||||||||||||||||||||||||||||
| Balance, January 1, 2020 | 30,871,246 | $ | 460,504 | 49,766 | $ | 1,869 | 1,076,845,984 | $ | 6,375,239 | 786,719 | $ | 4,433 | $ | 6,842,045 | $ | 1,233 | $ | 6,843,278 | ||||||||||||||||||||||
| Conversion of Limited Partners' Common OP Units to General Partner's Common OP Units | — | — | — | — | 4,549 | 45 | (4,549 | ) | (45 | ) | — | — | — | |||||||||||||||||||||||||||
| Redemption of Series F Preferred Stock | — | (27 | ) | — | — | — | — | — | — | (27 | ) | — | (27 | ) | ||||||||||||||||||||||||||
| Repurchases of common OP Units to settle tax obligation | — | — | — | — | (241,092 | ) | (2,378 | ) | — | — | (2,378 | ) | — | (2,378 | ) | |||||||||||||||||||||||||
| Equity-based compensation, net | — | — | — | — | 1,172,038 | 2,855 | — | — | 2,855 | — | 2,855 | |||||||||||||||||||||||||||||
| Distributions to Common OP Units and non-controlling interests —$0.1375 per common unit | — | — | — | — | — | (148,194 | ) | — | (105 | ) | (148,299 | ) | — | (148,299 | ) | |||||||||||||||||||||||||
| Dividend equivalents on awards granted under the Equity Plan | — | — | — | — | — | (1,628 | ) | — | — | (1,628 | ) | — | (1,628 | ) | ||||||||||||||||||||||||||
| Distributions to Series F Preferred Units | — | (12,928 | ) | — | (19 | ) | — | — | — | — | (12,947 | ) | — | (12,947 | ) | |||||||||||||||||||||||||
| Net income (loss) | — | — | — | — | — | 86,808 | — | 62 | 86,870 | (7 | ) | 86,863 | ||||||||||||||||||||||||||||
| Other comprehensive loss | — | — | — | — | — | (76,547 | ) | — | (55 | ) | (76,602 | ) | — | (76,602 | ) | |||||||||||||||||||||||||
| Balance, March 31, 2020 | 30,871,246 | $ | 447,549 | 49,766 | $ | 1,850 | 1,077,781,479 | $ | 6,236,200 | 782,170 | $ | 4,290 | $ | 6,689,889 | $ | 1,226 | $ | 6,691,115 | ||||||||||||||||||||||
| Redemption of Series F Preferred Stock | — | (25 | ) | — | — | — | — | — | — | (25 | ) | — | (25 | ) | ||||||||||||||||||||||||||
| Equity-based compensation, net | — | — | — | — | 67,075 | 4,071 | — | — | 4,071 | — | 4,071 | |||||||||||||||||||||||||||||
| Distributions to Common OP Units and non-controlling interests —$0.077 per common unit | — | — | — | — | — | (82,997 | ) | — | (61 | ) | (83,058 | ) | — | (83,058 | ) | |||||||||||||||||||||||||
| Dividend equivalents on awards granted under the Equity Plan | — | — | — | — | — | (18 | ) | — | — | (18 | ) | — | (18 | ) | ||||||||||||||||||||||||||
| Distributions to Series F Preferred Units | — | (12,928 | ) | — | (20 | ) | — | — | — | — | (12,948 | ) | — | (12,948 | ) | |||||||||||||||||||||||||
| Repurchase of convertible notes | — | — | — | — | — | (204 | ) | — | — | (204 | ) | — | (204 | ) | ||||||||||||||||||||||||||
| Net income (loss) | — | — | — | — | — | 54,208 | — | 39 | 54,247 | (8 | ) | 54,239 | ||||||||||||||||||||||||||||
| Other comprehensive loss | — | — | — | — | — | (1,892 | ) | — | (1 | ) | (1,893 | ) | — | (1,893 | ) | |||||||||||||||||||||||||
| Balance, June 30, 2020 | 30,871,246 | $ | 434,596 | 49,766 | $ | 1,830 | 1,077,848,554 | $ | 6,209,368 | 782,170 | $ | 4,267 | $ | 6,650,061 | $ | 1,218 | $ | 6,651,279 | ||||||||||||||||||||||
| Preferred Units | Common Units | |||||||||||||||||||||||||||||||||||||||
| General Partner | Limited Partner | General Partner | Limited Partner | |||||||||||||||||||||||||||||||||||||
| Number of Units | Capital | Number of Units | Capital | Number of Units | Capital | Number of Units | Capital | Total Partners' Capital | Non-Controlling Interests | Total Capital | ||||||||||||||||||||||||||||||
| Balance, January 1, 2019 | 42,834,138 | $ | 710,325 | 86,874 | $ | 2,883 | 967,515,165 | $ | 6,446,734 | 23,715,908 | $ | 138,931 | $ | 7,298,873 | $ | 1,271 | $ | 7,300,144 | ||||||||||||||||||||||
| Issuance of common OP Units, net | — | — | — | — | 3,309,808 | 27,544 | — | — | 27,544 | — | 27,544 | |||||||||||||||||||||||||||||
| Conversion of Limited Partners' Common OP Units to General Partner's Common OP Units | — | — | — | — | — | (26 | ) | — | 26 | — | — | — | ||||||||||||||||||||||||||||
| Conversion of Limited Partner Series F Preferred Units to Series F Preferred Stock | 37,108 | 923 | (37,108 | ) | (923 | ) | — | — | — | — | — | — | — | |||||||||||||||||||||||||||
| Repurchases of common OP Units to settle tax obligation | — | — | — | — | (199,083 | ) | (1,595 | ) | — | — | (1,595 | ) | — | (1,595 | ) | |||||||||||||||||||||||||
| Equity-based compensation, net | — | — | — | — | 950,487 | 2,872 | — | — | 2,872 | — | 2,872 | |||||||||||||||||||||||||||||
| Contributions from non-controlling interest holders | — | — | — | — | — | — | — | — | — | 64 | 64 | |||||||||||||||||||||||||||||
| Distributions to Common OP Units and non-controlling interests —$0.1375 per common unit | — | — | — | — | — | (133,480 | ) | — | (3,262 | ) | (136,742 | ) | — | (136,742 | ) | |||||||||||||||||||||||||
| Dividend equivalents on awards granted under the Equity Plan | — | — | — | — | — | (1,222 | ) | — | — | (1,222 | ) | — | (1,222 | ) | ||||||||||||||||||||||||||
| Distributions to Series F Preferred Units | — | (17,940 | ) | — | (33 | ) | — | — | — | — | (17,973 | ) | — | (17,973 | ) | |||||||||||||||||||||||||
| Net income (loss) | — | — | — | — | — | 69,304 | — | 1,695 | 70,999 | (28 | ) | 70,971 | ||||||||||||||||||||||||||||
| Other comprehensive loss | — | — | — | — | — | (10,922 | ) | — | (267 | ) | (11,189 | ) | — | (11,189 | ) | |||||||||||||||||||||||||
| Balance, March 31, 2019 | 42,871,246 | $ | 693,308 | 49,766 | $ | 1,927 | 971,576,377 | $ | 6,399,209 | 23,715,908 | $ | 137,123 | $ | 7,231,567 | $ | 1,307 | $ | 7,232,874 | ||||||||||||||||||||||
| Issuance of common OP Units, net | — | — | — | — | 1,773,456 | 14,534 | — | — | 14,534 | — | 14,534 | |||||||||||||||||||||||||||||
| Repurchases of common OP Units to settle tax obligation | — | — | — | — | — | (9 | ) | — | — | (9 | ) | — | (9 | ) | ||||||||||||||||||||||||||
| Equity-based compensation, net | — | — | — | — | 36,066 | 3,883 | — | — | 3,883 | — | 3,883 | |||||||||||||||||||||||||||||
| Distributions to Common OP Units and non-controlling interests —$0.1375 per common unit | — | — | — | — | — | (133,841 | ) | — | (3,264 | ) | (137,105 | ) | — | (137,105 | ) | |||||||||||||||||||||||||
| Dividend equivalents on awards granted under the Equity Plan | — | — | — | — | — | (44 | ) | — | — | (44 | ) | — | (44 | ) | ||||||||||||||||||||||||||
| Distributions to Series F Preferred Units | — | (17,958 | ) | — | (15 | ) | — | — | — | — | (17,973 | ) | — | (17,973 | ) | |||||||||||||||||||||||||
| Distributions payable relinquished | — | — | — | — | — | — | — | 6,429 | 6,429 | — | 6,429 | |||||||||||||||||||||||||||||
| Surrender of Limited Partner OP Units | — | — | — | — | — | (8,520 | ) | (2,922,445 | ) | (18,017 | ) | (26,537 | ) | — | (26,537 | ) | ||||||||||||||||||||||||
| Net income (loss) | — | — | — | — | — | 285,658 | — | 6,656 | 292,314 | (30 | ) | 292,284 | ||||||||||||||||||||||||||||
| Other comprehensive loss | — | — | — | — | — | (15,824 | ) | — | (385 | ) | (16,209 | ) | — | (16,209 | ) | |||||||||||||||||||||||||
| Balance, June 30, 2019 | 42,871,246 | $ | 675,350 | 49,766 | $ | 1,912 | 973,385,899 | $ | 6,545,046 | 20,793,463 | $ | 128,542 | $ | 7,350,850 | $ | 1,277 | $ | 7,352,127 | ||||||||||||||||||||||
The accompanying notes are an integral part of these statements.
13
VEREIT OPERATING PARTNERSHIP, L.P.
CONSOLIDATED STATEMENTS OF CASH FLOWS
(In thousands) (Unaudited)
| Three Months Ended March 31, | ||||||||||||||||||||||||||||||||
| 2021 | 2020 | |||||||||||||||||||||||||||||||
| Cash flows from operating activities: | ||||||||||||||||||||||||||||||||
| Net income | $ | 120,723 | $ | 86,863 | ||||||||||||||||||||||||||||
| Adjustments to reconcile net income to net cash provided by operating activities: | ||||||||||||||||||||||||||||||||
| Depreciation and amortization | 112,265 | 126,980 | ||||||||||||||||||||||||||||||
| Gain on real estate assets, net | (78,177) | (25,508) | ||||||||||||||||||||||||||||||
| Impairments | 31,849 | 8,380 | ||||||||||||||||||||||||||||||
| Equity-based compensation | 2,892 | 2,855 | ||||||||||||||||||||||||||||||
| Equity in income of unconsolidated entities | (447) | (246) | ||||||||||||||||||||||||||||||
| Distributions from unconsolidated entities | 447 | 259 | ||||||||||||||||||||||||||||||
| (Gain) loss on other investments | (695) | 541 | ||||||||||||||||||||||||||||||
| Loss on extinguishment and forgiveness of debt, net | 2,132 | 1,280 | ||||||||||||||||||||||||||||||
| Changes in assets and liabilities: | ||||||||||||||||||||||||||||||||
| Investment in direct financing leases | 366 | 364 | ||||||||||||||||||||||||||||||
| Rent and tenant receivables, operating lease right-of-use and other assets, net | (2,000) | (4,462) | ||||||||||||||||||||||||||||||
| Accounts payable and accrued expenses | (7,019) | (2,749) | ||||||||||||||||||||||||||||||
| Deferred rent, operating lease and other liabilities | (2,245) | (22,546) | ||||||||||||||||||||||||||||||
| Net cash provided by operating activities | 180,091 | 172,011 | ||||||||||||||||||||||||||||||
| Cash flows from investing activities: | ||||||||||||||||||||||||||||||||
| Investments in real estate assets | (139,964) | (147,121) | ||||||||||||||||||||||||||||||
| Capital expenditures and leasing costs | (4,500) | (9,502) | ||||||||||||||||||||||||||||||
| Real estate developments | (3,553) | (3,231) | ||||||||||||||||||||||||||||||
| Investments in unconsolidated entities | 0 | (2,669) | ||||||||||||||||||||||||||||||
| Return of investment from unconsolidated entities | 1,124 | 257 | ||||||||||||||||||||||||||||||
| Proceeds from disposition of real estate | 253,503 | 140,428 | ||||||||||||||||||||||||||||||
| Investment in leasehold improvements and other assets | 36 | (87) | ||||||||||||||||||||||||||||||
| Deposits for real estate assets | (3,171) | (895) | ||||||||||||||||||||||||||||||
| Uses and refunds of deposits for real estate assets | 2,454 | 3,130 | ||||||||||||||||||||||||||||||
| Proceeds from the settlement of property-related insurance claims | 713 | 38 | ||||||||||||||||||||||||||||||
| Net cash provided by (used in) investing activities | 106,642 | (19,652) | ||||||||||||||||||||||||||||||
| Cash flows from financing activities: | ||||||||||||||||||||||||||||||||
| Proceeds from mortgage notes payable | 0 | 913 | ||||||||||||||||||||||||||||||
| Payments on mortgage notes payable and other debt, including debt extinguishment costs | (295,869) | (123,574) | ||||||||||||||||||||||||||||||
| Proceeds from credit facility | 0 | 831,313 | ||||||||||||||||||||||||||||||
| Payments on credit facility, including swap termination payments | 0 | (110,000) | ||||||||||||||||||||||||||||||
| Extinguishment costs related to the redemption of corporate bonds | 0 | (26) | ||||||||||||||||||||||||||||||
| Extinguishment costs related to the repurchases of convertible notes | 0 | (13) | ||||||||||||||||||||||||||||||
| Payments of deferred financing costs | (356) | (35) | ||||||||||||||||||||||||||||||
| Refunds of deferred financing costs | 280 | 0 | ||||||||||||||||||||||||||||||
| Repurchases of Common Stock to settle tax obligations | (1,681) | (2,378) | ||||||||||||||||||||||||||||||
| Proceeds from the issuance of Common Stock, net of underwriters’ discount and offering expenses | 1,336 | 0 | ||||||||||||||||||||||||||||||
| Redemption of Series F Preferred Stock | (100,000) | (27) | ||||||||||||||||||||||||||||||
| Distributions paid | (96,559) | (162,747) | ||||||||||||||||||||||||||||||
| Net cash (used in) provided by financing activities | (492,849) | 433,426 | ||||||||||||||||||||||||||||||
| Net change in cash and cash equivalents and restricted cash | $ | (206,116) | $ | 585,785 | ||||||||||||||||||||||||||||
14
| Six Months Ended June 30, | ||||||||
| 2020 | 2019 | |||||||
| Cash flows from operating activities: | ||||||||
| Net income | $ | 141,102 | $ | 363,255 | ||||
| Adjustments to reconcile net income to net cash provided by operating activities: | ||||||||
| Depreciation and amortization | 240,902 | 260,771 | ||||||
| Gain on real estate assets, net | (34,303 | ) | (232,597 | ) | ||||
| Impairments | 20,474 | 20,296 | ||||||
| Equity based compensation | 6,926 | 6,755 | ||||||
| Equity in income of unconsolidated entities | (1,743 | ) | (1,005 | ) | ||||
| Distributions from unconsolidated entities | 861 | — | ||||||
| Loss on investments | 683 | 464 | ||||||
| Loss on derivative instruments | — | 58 | ||||||
| Non-cash restructuring expense | — | 4,048 | ||||||
| Loss on extinguishment and forgiveness of debt, net | 1,480 | 1,472 | ||||||
| Surrender of Limited Partner OP Units | — | (26,536 | ) | |||||
| Changes in assets and liabilities: | ||||||||
| Investment in direct financing leases | 736 | 821 | ||||||
| Rent and tenant receivables, operating lease right-of-use and other assets, net | (30,158 | ) | (9,596 | ) | ||||
| Accounts payable and accrued expenses | (13,870 | ) | (13,104 | ) | ||||
| Deferred rent, operating lease and other liabilities | (12,138 | ) | (27,084 | ) | ||||
| Net cash provided by operating activities | 320,952 | 348,018 | ||||||
| Cash flows from investing activities: | ||||||||
| Investments in real estate assets | (147,121 | ) | (191,550 | ) | ||||
| Capital expenditures and leasing costs | (15,665 | ) | (19,695 | ) | ||||
| Real estate developments | (6,469 | ) | (10,537 | ) | ||||
| Principal repayments received on mortgage notes receivable | — | 88 | ||||||
| Investments in unconsolidated entities | (10,066 | ) | (2,767 | ) | ||||
| Return of investment from unconsolidated entities | 970 | — | ||||||
| Proceeds from disposition of real estate | 204,114 | 739,873 | ||||||
| Investment in leasehold improvements and other assets | (314 | ) | (798 | ) | ||||
| Deposits for real estate assets | (1,420 | ) | (3,072 | ) | ||||
| Investments in mezzanine position | (9,959 | ) | — | |||||
| Proceeds from sale of investments and other assets | — | 8,199 | ||||||
| Uses and refunds of deposits for real estate assets | 4,036 | 2,946 | ||||||
| Proceeds from the settlement of property-related insurance claims | 48 | 334 | ||||||
| Net cash provided by investing activities | 18,154 | 523,021 | ||||||
| Cash flows from financing activities: | ||||||||
| Proceeds from mortgage notes payable | 1,032 | — | ||||||
| Payments on mortgage notes payable and other debt, including debt extinguishment costs | (135,036 | ) | (175,962 | ) | ||||
| Proceeds from credit facility | 902,000 | 1,034,000 | ||||||
| Payments on credit facility | (1,052,000 | ) | (537,000 | ) | ||||
| Proceeds from corporate bonds | 594,864 | — | ||||||
| Redemptions of corporate bonds, including extinguishment costs | (26 | ) | (750,000 | ) | ||||
| Repurchases of convertible notes, including extinguishment costs | (50,326 | ) | — | |||||
| Payments of deferred financing costs | (6,946 | ) | (182 | ) | ||||
| Repurchases of Common Stock to settle tax obligations | (2,378 | ) | (1,604 | ) | ||||
| Proceeds from the issuance of Common Stock, net of underwriters’ discount and offering expenses | — | 42,078 | ||||||
| Series F Preferred Stock redemption expenses | (52 | ) | — | |||||
| Contributions from non-controlling interest holders | — | 64 | ||||||
| Distributions paid | (324,032 | ) | (303,894 | ) | ||||
| Net cash used in financing activities | (72,900 | ) | (692,500 | ) | ||||
| Net change in cash and cash equivalents and restricted cash | $ | 266,206 | $ | 178,539 | ||||
VEREIT OPERATING PARTNERSHIP, L.P.
CONSOLIDATED STATEMENTS OF CASH FLOWS – (Continued)
(In thousands) (Unaudited)
| Three Months Ended March 31, | ||||||||||||||||||||||||||||||||
| 2021 | 2020 | |||||||||||||||||||||||||||||||
| Cash and cash equivalents and restricted cash, beginning of period | $ | 537,381 | $ | 33,880 | ||||||||||||||||||||||||||||
| Cash and cash equivalents and restricted cash, end of period | $ | 331,265 | $ | 619,665 | ||||||||||||||||||||||||||||
| Reconciliation of Cash and Cash Equivalents and Restricted Cash | ||||||||||||||||||||||||||||||||
| Cash and cash equivalents at beginning of period | $ | 523,539 | $ | 12,921 | ||||||||||||||||||||||||||||
| Restricted cash at beginning of period | 13,842 | 20,959 | ||||||||||||||||||||||||||||||
| Cash and cash equivalents and restricted cash at beginning of period | 537,381 | 33,880 | ||||||||||||||||||||||||||||||
| Cash and cash equivalents at end of period | 318,561 | 600,945 | ||||||||||||||||||||||||||||||
| Restricted cash at end of period | 12,704 | 18,720 | ||||||||||||||||||||||||||||||
| Cash and cash equivalents and restricted cash at end of period | $ | 331,265 | $ | 619,665 | ||||||||||||||||||||||||||||
| Six Months Ended June 30, | ||||||||
| 2020 | 2019 | |||||||
| Cash and cash equivalents and restricted cash, beginning of period | $ | 33,880 | $ | 53,663 | ||||
| Cash and cash equivalents and restricted cash, end of period | $ | 300,086 | $ | 232,202 | ||||
| Reconciliation of Cash and Cash Equivalents and Restricted Cash | ||||||||
| Cash and cash equivalents at beginning of period | $ | 12,921 | $ | 30,758 | ||||
| Restricted cash at beginning of period | 20,959 | 22,905 | ||||||
| Cash and cash equivalents and restricted cash at beginning of period | 33,880 | 53,663 | ||||||
| Cash and cash equivalents at end of period | 278,883 | 211,510 | ||||||
| Restricted cash at end of period | 21,203 | 20,692 | ||||||
| Cash and cash equivalents and restricted cash at end of period | $ | 300,086 | $ | 232,202 | ||||
The accompanying notes are an integral part of these statements.
15
VEREIT, INC. and VEREIT OPERATING PARTNERSHIP, L.P.
NOTES TO CONSOLIDATED FINANCIAL STATEMENTS
Note 1 – Organization
VEREIT is a Maryland corporation, incorporated on December 2, 2010, that qualified as a real estate investment trust (“REIT”) for U.S. federal income tax purposes beginning in the taxable year ended December 31, 2011. The OP is a Delaware limited partnership of which the General Partner is the sole general partner. VEREIT’s common stock, par value $0.01 per share (“Common Stock”), and its 6.70% Series F Cumulative Redeemable Preferred Stock, par value $0.01 per share (“Series F Preferred Stock”) trade on the New York Stock Exchange (“NYSE”) under the trading symbols, “VER” and “VER“VER PRF,,” respectively. As used herein, the terms the “Company,” “we,” “our” and “us” refer to VEREIT, together with its consolidated subsidiaries, including the OP.
VEREIT is a full-service real estate operating company which owns and manages one of the largest portfolios of single-tenant commercial properties in the U.S. VEREIT’s business model provides equity capital to creditworthy corporations in return for long-term leases on their properties. The Company actively manages its portfolio considering a number of metrics including property type, concentration and key economic factors for appropriate balance and diversity.
Substantially all of the Company’s operations are conducted through the OP. VEREIT is the sole general partner and holder of 99.9% of the common equity interests in the OP as of June 30, 2020.March 31, 2021. Under the limited partnership agreement of the OP, as amended (the “LPA”), after holding common units of limited partner interests in the OP (“OP Units”) or Series F Preferred Units of limited partnership interests in the OP (“Series F Preferred Units”), for a period of one year and meeting the other requirements in the LPA, unless we otherwise consent to an earlier redemption, holders have the right to redeem the units for the cash value of a corresponding number of shares of Common Stock or Series F Preferred Stock, as applicable, or, at our option, a corresponding number of shares of Common Stock or Series F Preferred Stock, as applicable, subject to adjustment pursuant to the terms of the LPA. The remaining rights of the holders of OP Units are limited, however, and do not include the ability to replace the General Partner or to approve the sale, purchase or refinancing of the OP’s assets.
The actions of the OP and its relationship with the General Partner are governed by the LPA. The General Partner does not have any significant assets other than its investment in the OP. Therefore, the assets and liabilities of the General Partner and the OP are the same. Additionally, pursuant to the LPA, all administrative expenses and expenses associated with the formation, continuity, existence and operation of the General Partner incurred by the General Partner on the OP’s behalf shall be treated as expenses of the OP. Further, when the General Partner issues any equity instrument that has been approved by the General Partner’s Board of Directors, the LPA requires the OP to issue to the General Partner equity instruments with substantially similar terms, to protect the integrity of the Company’s umbrella partnership REIT structure, pursuant to which each holder of interests in the OP has a proportionate economic interest in the OP reflecting its capital contributions thereto. OP Units and Series F Preferred Units issued to the General Partner are referred to as “General Partner OP Units” and “General Partner Series F Preferred Units,” respectively. OP Units and Series F Preferred Units issued to parties other than the General Partner are referred to as “Limited Partner OP Units” and “Limited Partner Series F Preferred Units,” respectively. The LPA also provides that the OP issue debt with terms and provisions consistent with debt issued by the General Partner. The LPA will be amended to provide for the issuance of any additional class of equivalent equity instruments to the extent the General Partner’s Board of Directors authorizes the issuance of any new class of equity securities.
Note 2 – Summary of Significant Accounting Policies
Basis of Accounting
The consolidated financial statements of the Company presented herein include the accounts of the General Partner and its consolidated subsidiaries, including the OP. All intercompany transactions have been eliminated upon consolidation. The financial statements are prepared on the accrual basis of accounting in accordance with generally accepted accounting principles in the United States (“U.S. GAAP”). The information furnished includes all adjustments and accruals of a normal recurring nature, which, in the opinion of management, are necessary for a fair presentation of results for the interim periods. The results of operations for the three and six months ended June 30, 2020March 31, 2021 are not necessarily indicative of the results for the entire year or any subsequent interim period.
These consolidated financial statements should be read in conjunction with the audited consolidated financial statements and notes thereto as of and for the year ended December 31, 20192020 of the Company, which are included in the Company’s Annual Report on Form 10-K filed on February 26, 2020.24, 2021. Information and footnote disclosures normally included in financial statements have been condensed or omitted pursuant to the rules and regulations of the U.S. Securities and Exchange Commission (the “SEC”) and U.S. GAAP.
16
VEREIT, INC. and VEREIT OPERATING PARTNERSHIP, L.P.
NOTES TO CONSOLIDATED FINANCIAL STATEMENTS
Principles of Consolidation and Basis of Presentation
The consolidated financial statements include the accounts of the Company and its consolidated subsidiaries and a consolidated joint venture. The portion of the consolidated joint venture not owned by the Company is presented as non-controlling interest in VEREIT’s and the OP’s consolidated balance sheets, statements of operations, statements of comprehensive income (loss) and statements of changes in equity. In addition, certain third parties have been issued OP Units and Series F Preferred Units. Holders of OP Units are considered to be non-controlling interest holders in the OP and their ownership interest in the limited partner’s share is presented as non-controlling interests in VEREIT’s consolidated balance sheets, statements of operations, statements of comprehensive income (loss) and statements of changes in equity. Further, a portion of the earnings and losses of the OP are allocated to non-controlling interest holders based on their respective ownership percentages. Equity is reallocated between controlling and noncontrolling interests in the OP upon a change in ownership. At the end of each annual reporting period, noncontrolling interests in the OP are adjusted to reflect their ownership percentage in the OP through a reallocation between controlling and noncontrolling interests in the OP, as applicable. As of each of June 30, 2020March 31, 2021 and December 31, 2019,2020, there were approximately 0.80.2 million Limited Partner OP Units issued and outstanding, respectively. As of each of March 31, 2021 and December 31, 2020, there were 49,766 Limited Partner Series F Preferred Units issued and outstanding.outstanding, respectively.
For legal entities being evaluated for consolidation, the Company must first determine whether the interests that it holds and fees it receives qualify as variable interests in the entity. A variable interest is an investment or other interest that will absorb portions of an entity’s expected losses or receive portions of the entity’s expected residual returns. The Company’s evaluation includes consideration of fees paid to the Company where the Company acts as a decision maker or service provider to the entity being evaluated. If the Company determines that it holds a variable interest in an entity, it evaluates whether that entity is a variable interest entity (“VIE”). VIEs are entities where investors lack sufficient equity at risk for the entity to finance its activities without additional subordinated financial support or where equity investors, as a group, lack one of the following characteristics: (a) the power to direct the activities that most significantly impact the entity’s economic performance, (b) the obligation to absorb the expected losses of the entity, or (c) the right to receive the expected returns of the entity. The Company consolidates entities that are not VIEs if it has a majority voting interest or other rights that result in effectively controlling the entity.
The Company then qualitatively assesses whether it is (or is not) the primary beneficiary of a VIE, which is generally defined as the party who has a controlling financial interest in the VIE. Consideration of various factors include, but are not limited to, the Company’s ability to direct the activities that most significantly impact the entity’s economic performance and its obligation to absorb losses from or right to receive benefits of the VIE that could potentially be significant to the VIE. The Company consolidates any VIEs when the Company is determined to be the primary beneficiary of the VIE and the difference between consolidating the VIE and accounting for it using the equity method could be material to the Company’s consolidated financial statements. The Company continually evaluates the need to consolidate these VIEs based on standards set forth in U.S. GAAP.
The fees from managed partnerships, which are fees earned fromCompany effected a one-for-five reverse stock split of Common Stock after markets closed on December 17, 2020, whereby every five shares of VEREIT's issued and outstanding shares of Common Stock, $0.01 par value per share, were converted into one share of Common Stock, $0.01 par value per share. A corresponding reverse split of the outstanding OP Units also took effect on December 17, 2020. Certain prior period amounts have been updated to reflect the reverse stock split including stock/unit and per share/unit amounts, additional paid-in capital, common stock and dividends on the consolidated statements of operations, consolidated balance sheets, consolidated statements of equity and notes to the financial statements. The reverse stock split did not affect the Company’s unconsolidated joint venture entities, previously includedtotal stockholder’s equity, the common stock par value per share or the Company’s authorized shares of common stock. NaN fractional shares of common stock were issued as fractional shares were settled in other income (loss), net have been presentedcash.
Prior Period Correction
Subsequent to the issuance of the Company’s consolidated financial statements for the year ended December 31, 2020, the Company identified an overstatement in its own line item for prior periods presentedamounts recorded to be consistent withdepreciation expense. As a result, the current year presentation.
17
VEREIT, INC. and VEREIT OPERATING PARTNERSHIP, L.P.
NOTES TO CONSOLIDATED FINANCIAL STATEMENTS
Revenue Recognition
Rental Revenue
The Company continually reviews receivables related to rent, straight-line rent and property operating expense reimbursements and determines collectability by taking into consideration the tenant’s payment history, the financial condition of the tenant, business conditions in the industry in which the tenant operates and economic conditions in the area in which the property is located. The review includes a binary assessment of whether or not substantially all of the amounts due under a tenant’s lease agreement are probable of collection. For leases that are deemed probable of collection, revenue continues to be recorded on a straight-line basis over the lease term and the Company recognizes a general allowance on a portfolio-wide basis. For leases that are deemed not probable of collection, revenue is recorded as cash is received and the Company reduces rental revenue for any straight-line rent receivables. The Company recognizes all changes in the collectability assessment for an operating lease as an adjustment to rental revenue. During the three and six months ended June 30,March 31, 2021 and 2020, rental revenue was reduced by $13.2$1.8 million and $18.5$5.3 million, respectively, which included (i) $2.1 million and $1.5 million, respectively, of an increase tobased on the general allowance, (ii) $7.4 million and $9.4 million, respectively, for amounts not probable of collection, and (iii) $3.7 million and $7.6 million, respectively, for straight-line rent receivables. Of the $13.2 million reduction to rental revenue for the three months ended June 30, 2020, $8.4 million was related to the impact of the novel coronavirus (“COVID-19”) pandemic, of which $0.9 million represented an increase to the general allowance, $3.8 million represented amounts not probable of collection, and $3.7 million was for straight-line rent receivables.collectability assessment.
Rental revenue also includes lease termination income collected from tenants to allow for the tenant to vacate their space prior to their scheduled termination dates, as well as amortization of above and below-market leases.
Litigation and non-routine costs, net
The Company has incurred legal fees and other costs associated with litigations and investigations resulting from the Audit Committee Investigation (defined below), and other corporate matters which are considered non-routine. The Company’s insurance carriers have paid certain defense costs subject to standard reservation of rights under the respective policies.
Litigation and non-routine costs, net include the following costs and recoveries (in thousands):
| Three Months Ended March 31, | ||||||||||||||||||||||||||||||||
| 2021 | 2020 | |||||||||||||||||||||||||||||||
| Litigation and non-routine costs, net: | ||||||||||||||||||||||||||||||||
Legal fees, costs and settlements (1) (2) | $ | 68 | $ | (6,093) | ||||||||||||||||||||||||||||
| Insurance recoveries | 0 | (2,471) | ||||||||||||||||||||||||||||||
| Total | $ | 68 | $ | (8,564) | ||||||||||||||||||||||||||||
| Three Months Ended June 30, | Six Months Ended June 30, | |||||||||||||||
| 2020 | 2019 | 2020 | 2019 | |||||||||||||
| Litigation and non-routine costs, net: | ||||||||||||||||
Audit Committee Investigation and related matters (1) (2) | $ | (118 | ) | $ | 22,767 | $ | (6,211 | ) | $ | 37,458 | ||||||
| Legal fees and expenses | — | — | — | 2 | ||||||||||||
| Litigation settlements | — | — | — | 12,235 | ||||||||||||
| Total costs | (118 | ) | 22,767 | (6,211 | ) | 49,695 | ||||||||||
| Insurance recoveries | — | — | (2,471 | ) | (48,420 | ) | ||||||||||
Other recoveries (3) | — | (26,536 | ) | — | (26,536 | ) | ||||||||||
| Total | $ | (118 | ) | $ | (3,769 | ) | $ | (8,682 | ) | $ | (25,261 | ) | ||||
(2)The negative balance for the three months ended March 31, 2020 is a result of estimated costs accrued in prior periods that exceeded actual expenses incurred. |
Equity-based Compensation
The Company has an equity-based incentive award plan (the “Equity Plan”) for non-executive directors, officers, other employees and advisors or consultants who provide services to the Company, as applicable, and a non-executive director restricted share plan, which are accounted for under U.S. GAAP for share-based payments. The expense for such awards is recognized over the vesting period or when the requirements for exercise of the award have been met. As of June 30, 2020,March 31, 2021, the General Partner had cumulatively awarded under its Equity Plan approximately 18.04.0 million shares of Common Stock, which was comprised of 4.00.8 million restricted share awards (“Restricted Shares”), net of the forfeiture of 3.70.7 million Restricted Shares through that date, 7.91.9 million restricted stock units (“Restricted Stock Units”), net of the forfeiture/cancellation of 2.00.4 million Restricted Stock Units through that date, 0.80.2 million deferred stock units (“Deferred Stock Units”), and 5.31.1 million stock options (“Stock Options”), net of forfeiture/cancellation of 0.30.1 million Stock Options through that date. Accordingly, as of such date, approximately 95.120.0 million additional shares were available for future issuance, excluding the effect of the 5.31.1 million Stock Options. At June 30, 2020,As of March 31, 2021, a total of 45,0009,000 shares were awarded under the non-executive director restricted share plan out of the 99,00019,800 shares reserved for issuance.
| Three Months Ended June 30, | Six Months Ended June 30, | |||||||||||||||
| 2020 | 2019 | 2020 | 2019 | |||||||||||||
| Restricted Shares | $ | — | $ | — | $ | — | $ | 77 | ||||||||
Time-Based Restricted Stock Units (1) | 1,397 | 1,234 | 2,782 | 2,484 | ||||||||||||
| Long-Term Incentive-Based Restricted Stock Units | 1,401 | 1,383 | 2,500 | 2,612 | ||||||||||||
| Deferred Stock Units | 947 | 947 | 1,019 | 1,018 | ||||||||||||
| Stock Options | 326 | 319 | 625 | 564 | ||||||||||||
| Total | $ | 4,071 | $ | 3,883 | $ | 6,926 | $ | 6,755 | ||||||||
18
VEREIT, INC. and VEREIT OPERATING PARTNERSHIP, L.P.
NOTES TO CONSOLIDATED FINANCIAL STATEMENTS
| Three Months Ended March 31, | ||||||||||||||||||||||||||||||||
| 2021 | 2020 | |||||||||||||||||||||||||||||||
Time-Based Restricted Stock Units (1) | $ | 1,438 | $ | 1,386 | ||||||||||||||||||||||||||||
| Long-Term Incentive-Based Restricted Stock Units | 1,115 | 1,098 | ||||||||||||||||||||||||||||||
| Deferred Stock Units | 85 | 72 | ||||||||||||||||||||||||||||||
| Stock Options | 254 | 299 | ||||||||||||||||||||||||||||||
| Total | $ | 2,892 | $ | 2,855 | ||||||||||||||||||||||||||||
(1)Includes stock compensation expense attributable to awards for which the six months ended June 30, 2019,requisite service period begins prior to the Company’s obligation to provide certain transition services for CCA Acquisition, LLC (the “Cole Purchaser”) terminated in accordance with the termsassumed future grant date.
As of a services agreement (the “Services Agreement”) with the Cole Purchaser and the Company recorded $9.4 million of restructuring expensesMarch 31, 2021, total unrecognized compensation expense related to the reorganizationthese awards was approximately $27.3 million, with an aggregate weighted-average remaining term of its business.2.7 years.
Recent Accounting Pronouncements
Reference Rate Reform
During the first quarter of 2020, the Financial Accounting Standards Board (the “FASB”)FASB issued ASU 2020-04, Reference Rate Reform (Topic 848). ASU 2020-04 contains practical expedients for reference rate reform related activities that impact debt, leases, derivatives and other contracts. The guidance in ASU 2020-04 is optional and may be elected over time as reference rate reform activities occur. During the first quarter of 2020, the Company elected to apply the hedge accounting expedients related to probability and the assessments of effectiveness for future London Inter-Bank Offer Rate (“LIBOR”)-indexed cash flows to assume that the index upon whichapplicable to future hedged transactions will be based matchesmatched the index on the corresponding derivatives. ApplicationDuring the fourth quarter of these expedients preserves2020, the presentationCompany terminated its interest rate swap agreements with an aggregate $900.0 million notional amount and terminated its forward starting interest rate swaps with a total notional amount of derivatives consistent$400.0 million, both of which were designated as cash flow hedges, in connection with past presentation.the early repayment of borrowings under the Credit Facility Term Loan (as defined in Note 6 – Debt), as discussed in Note 7 –Derivatives and Hedging Activities. The Company continues to evaluate the impact of the guidance and may apply other elections as applicable as additional changes in the market occur.
Note 3 –Real Estate Investments and Related Intangibles
Property Acquisitions
During the sixthree months ended June 30,March 31, 2021, the Company acquired controlling financial interests in 54 commercial properties for an aggregate purchase price of $140.1 million (the “2021 Acquisitions”), which includes $1.6 million of external acquisition-related expenses that were capitalized.
During the three months ended March 31, 2020, the Company acquired controlling financial interests in 25 commercial properties for an aggregate purchase price of $147.1 million (the “2020 Acquisitions”), which includes 1 land parcel for build-to-suit development, further discussed below and $0.9 million of external acquisition-related expenses that were capitalized.
The following table presents the allocation of the fair values of the assets acquired and liabilities assumed during the periods presented (in thousands):
| Three Months Ended March 31, | ||||||||||||||||||||
| 2021 | 2020 | |||||||||||||||||||
| Real estate investments, at cost: | ||||||||||||||||||||
| Land | $ | 19,729 | $ | 19,953 | ||||||||||||||||
| Buildings, fixtures and improvements | 79,257 | 95,728 | ||||||||||||||||||
| Total tangible assets | 98,986 | 115,681 | ||||||||||||||||||
| Six Months Ended June 30, | ||||||||
| 2020 | 2019 | |||||||
| Real estate investments, at cost: | ||||||||
| Land | $ | 19,953 | $ | 40,460 | ||||
| Buildings, fixtures and improvements | 95,728 | 135,182 | ||||||
| Total tangible assets | 115,681 | 175,642 | ||||||
| Acquired intangible assets: | ||||||||
In-place leases and other intangibles (1) | 15,739 | 24,817 | ||||||
Above-market leases (2) | 15,701 | — | ||||||
| Total purchase price of assets acquired | $ | 147,121 | $ | 200,459 | ||||
19
VEREIT, INC. and VEREIT OPERATING PARTNERSHIP, L.P.
NOTES TO CONSOLIDATED FINANCIAL STATEMENTS
March 31, 2021 (Unaudited) – (Continued)
| Three Months Ended March 31, | ||||||||||||||||||||
| 2021 | 2020 | |||||||||||||||||||
| Acquired intangible assets: | ||||||||||||||||||||
In-place leases and other intangibles (1) | 12,090 | 15,739 | ||||||||||||||||||
Above-market leases (2) | 29,008 | 15,701 | ||||||||||||||||||
| Total purchase price of assets acquired | $ | 140,084 | $ | 147,121 | ||||||||||||||||
(1)The weighted average amortization period for acquired in-place leases and other intangibles is 16.2 years and 18.1 years for 2021 Acquisitions and 2020 Acquisitions, respectively.
(2)The weighted average amortization period for acquired above-market leases is 19.0 years and 20.1 years for 2021 Acquisitions and 2020 Acquisitions, respectively.
As of June 30, 2020,March 31, 2021, the Company invested $23.4$37.3 million, including $0.3$0.7 million of external acquisition-related expenses and interest that were capitalized, in 1 build-to-suit development project. The Company’s estimated remaining committed investment is $21.4$7.9 million, and the project is expected to be completed within the next 12 months.
Property Dispositions and Real Estate Assets Held for Sale
During the sixthree months ended June 30, 2020,March 31, 2021, the Company disposed of 4730 properties, including the sale of 2 consolidated properties to the office partnership, for an aggregate gross sales price of $219.2 million, of which our share was $216.7 million after the profit participation payments related to the disposition of 3 Red Lobster properties.$261.0 million. The dispositions resulted in proceeds of $204.1$253.5 million after closing costs, including proceeds from the contribution of properties to the office partnership.costs. The Company recorded a gain of $34.2$76.1 million related to the dispositions, which is included in gain on disposition of real estate and real estate assets held for sale, net in the accompanying consolidated statements of operations.
During the sixthree months ended June 30, 2019,March 31, 2020, the Company disposed of 7530 properties, including the sale of 62 consolidated properties to the industrialoffice partnership, for an aggregate gross sales price of $809.2$152.2 million, of which our share was $796.4$150.5 million after the profit participation paymentpayments related to the disposition of 232 Red Lobster properties. The dispositions resulted in proceeds of $739.9$140.4 million after closing costs, and contributionsincluding proceeds from the contribution of properties to the industrialoffice partnership. The Company recorded a gain of $233.4$25.2 million related to the sales which is included in gain on disposition of real estate and real estate assets held for sale, net in the accompanying consolidated statements of operations.
As of June 30, 2020,March 31, 2021, there were 84 properties classified as held for sale with a carrying value of $48.1$4.9 million, included in real estate assets held for sale, net, primarily comprised of land of $2.5$1.8 million and building, fixtures and improvements, net of $41.7$3.0 million, in the accompanying consolidated balance sheets, and are expected to be sold in the next 12 months as part of the Company’s portfolio management strategy. As of December 31, 2019, there were 5 properties classified as held for sale. During the sixthree months ended June 30, 2020,March 31, 2021, the Company recorded a loss of $0.2$0.1 million related to held for sale properties. During the sixthree months ended June 30, 2019March 31, 2020, the Company recorded a loss of $0.8 milliondid 0t record any losses related to held for sale properties.
Intangible Lease Assets and Liabilities
Intangible lease assets and liabilities of the Company consisted of the following as of June 30, 2020March 31, 2021 and December 31, 20192020 (amounts in thousands, except weighted-average useful life):
| Weighted-Average Useful Life | March 31, 2021 | December 31, 2020 | ||||||||||||||||||
| Intangible lease assets: | ||||||||||||||||||||
| In-place leases and other intangibles, net of accumulated amortization of $815,131 and $810,597, respectively | 17.0 | $ | 723,695 | $ | 745,026 | |||||||||||||||
| Leasing commissions, net of accumulated amortization of $8,013 and $7,565, respectively | 9.2 | 16,536 | 16,042 | |||||||||||||||||
| Above-market lease assets and deferred lease incentives, net of accumulated amortization of $128,850 and $125,455, respectively | 23.6 | 191,601 | 167,776 | |||||||||||||||||
| Total intangible lease assets, net | $ | 931,832 | $ | 928,844 | ||||||||||||||||
| Intangible lease liabilities: | ||||||||||||||||||||
| Below-market leases, net of accumulated amortization of $108,537 and $106,504, respectively | 19.8 | $ | 117,121 | $ | 120,938 | |||||||||||||||
| Weighted-Average Useful Life | June 30, 2020 | December 31, 2019 | ||||||||
| Intangible lease assets: | ||||||||||
| In-place leases and other intangibles, net of accumulated amortization of $787,231 and $748,689, respectively | 16.1 | $ | 788,686 | $ | 854,196 | |||||
| Leasing commissions, net of accumulated amortization of $6,409 and $6,027, respectively | 7.5 | 18,790 | 17,808 | |||||||
| Above-market lease assets and deferred lease incentives, net of accumulated amortization of $120,510 and $112,438, respectively | 16.8 | 170,205 | 165,483 | |||||||
| Total intangible lease assets, net | $ | 977,681 | $ | 1,037,487 | ||||||
| Intangible lease liabilities: | ||||||||||
| Below-market leases, net of accumulated amortization of $106,116 and $99,315, respectively | 19.2 | $ | 130,208 | $ | 143,583 | |||||
20
VEREIT, INC. and VEREIT OPERATING PARTNERSHIP, L.P.
NOTES TO CONSOLIDATED FINANCIAL STATEMENTS
March 31, 2021 (Unaudited) – (Continued)
The aggregate amount of amortization of above‑above-market and below-market leases and deferred lease incentives included as a net decrease to rental revenue was $1.5 million and $1.3$0.7 million for the sixthree months ended June 30,March 31, 2021 and 2020, and 2019, respectively. The aggregate amount of in-place leases, leasing commissions and other lease intangibles amortized and included in depreciation and amortization expense was $73.3$29.2 million and $65.8$43.0 million for the sixthree months ended June 30,March 31, 2021 and 2020, and 2019, respectively.
The following table provides the projected amortization expense and adjustments to rental revenue related to the intangible lease assets and liabilities for the next five years as of June 30, 2020March 31, 2021 (in thousands):
| Remainder of 2020 | 2021 | 2022 | 2023 | 2024 | 2025 | |||||||||||||||||||
| In-place leases and other intangibles: | ||||||||||||||||||||||||
| Total projected to be included in amortization expense | $ | 57,571 | $ | 107,490 | $ | 93,814 | $ | 83,671 | $ | 73,403 | $ | 61,429 | ||||||||||||
| Leasing commissions: | ||||||||||||||||||||||||
| Total projected to be included in amortization expense | 1,317 | 2,461 | 2,360 | 2,085 | 1,867 | 1,599 | ||||||||||||||||||
| Above-market lease assets and deferred lease incentives: | ||||||||||||||||||||||||
| Total projected to be deducted from rental revenue | 9,962 | 19,519 | 18,708 | 17,764 | 16,393 | 14,921 | ||||||||||||||||||
| Below-market lease liabilities: | ||||||||||||||||||||||||
| Total projected to be included in rental revenue | 8,320 | 14,947 | 13,255 | 12,533 | 10,686 | 9,467 | ||||||||||||||||||
| Remainder of 2021 | 2022 | 2023 | 2024 | 2025 | 2026 | |||||||||||||||||||||||||||||||||
| In-place leases and other intangibles: | ||||||||||||||||||||||||||||||||||||||
| Total projected to be included in amortization expense | $ | 79,608 | $ | 93,873 | $ | 84,023 | $ | 74,892 | $ | 62,809 | $ | 56,470 | ||||||||||||||||||||||||||
| Leasing commissions: | ||||||||||||||||||||||||||||||||||||||
| Total projected to be included in amortization expense | 2,015 | 2,485 | 2,194 | 1,979 | 1,721 | 1,498 | ||||||||||||||||||||||||||||||||
| Above-market lease assets and deferred lease incentives: | ||||||||||||||||||||||||||||||||||||||
| Total projected to be deducted from rental revenue | 15,679 | 20,388 | 19,449 | 18,055 | 16,488 | 14,413 | ||||||||||||||||||||||||||||||||
| Below-market lease liabilities: | ||||||||||||||||||||||||||||||||||||||
| Total projected to be included in rental revenue | 10,480 | 13,108 | 12,388 | 10,591 | 9,372 | 8,848 | ||||||||||||||||||||||||||||||||
Consolidated Joint Venture
The Company had an interest in 1 consolidated joint venture that owned 1 property as of June 30, 2020March 31, 2021 and December 31, 2019.2020. As of June 30, 2020March 31, 2021 and December 31, 2019,2020, the consolidated joint venture had total assets of $33.6$32.6 million and $32.5$33.0 million, respectively, of which $30.0$28.7 million and $29.6$29.1 million, respectively, were real estate investments, net of accumulated depreciation and amortization at each of the respective dates. The property is secured by a mortgage note payable, which is non-recourse to the Company and had a balance of $15.2$15.0 million and $14.3$14.8 million as of June 30, 2020March 31, 2021 and December 31, 2019,2020, respectively. The Company has the ability to control operating and financing policies of the consolidated joint venture. There are restrictions on the use of these assets as the Company is generally required to obtain the approval of the joint venture partner in accordance with the joint venture agreement for any major transactions. The Company and the joint venture partner are subject to the provisions of the joint venture agreement, which includes provisions for when additional contributions may be required to fund certain cash shortfalls.
The following is a summary of the Company’s investments in unconsolidated entities as of March 31, 2021 and December 31, 2020 and for the three months ended March 31, 2021 and 2020 (dollar amounts in thousands):
Ownership % (1) | Number of Properties | Carrying Amount of Investment | Equity in Income | |||||||||||||||||||||||||||||||||||||||||
| Three Months Ended | ||||||||||||||||||||||||||||||||||||||||||||
| Investment | March 31, 2021 | March 31, 2021 | December 31, 2020 | March 31, 2021 | March 31, 2020 | |||||||||||||||||||||||||||||||||||||||
| Industrial Partnership | 20% | 7 | $ | 44,570 | $ | 45,378 | $ | 245 | 180 | |||||||||||||||||||||||||||||||||||
| Office Partnership | 20% | 4 | 13,117 | 13,435 | 202 | 73 | ||||||||||||||||||||||||||||||||||||||
Faison JV Bethlehem GA (2) | 0% | 0 | 0 | 0 | 0 | (7) | ||||||||||||||||||||||||||||||||||||||
| Total unconsolidated joint ventures | $ | 57,687 | $ | 58,813 | $ | 447 | $ | 246 | ||||||||||||||||||||||||||||||||||||
Preferred equity (3) | 22,826 | 22,826 | — | — | ||||||||||||||||||||||||||||||||||||||||
| Total investment in unconsolidated entities | $ | 80,513 | $ | 81,639 | $ | 447 | $ | 246 | ||||||||||||||||||||||||||||||||||||
(1)The Company’s ownership interest reflects its legal ownership interest. Legal ownership may, at times, not equal the Company’s economic interest in the listed properties because of various provisions in certain joint venture agreements regarding capital contributions, distributions of cash flow based on capital account balances, allocations of profits and losses and payments of preferred returns. As a result, the Company’s actual economic interest (as
21
VEREIT, INC. and VEREIT OPERATING PARTNERSHIP, L.P.
NOTES TO CONSOLIDATED FINANCIAL STATEMENTS
(2)During the three months ended March 31, 2020, the Company had a 90% ownership interest in unconsolidated joint ventures as of June1 property. On October 30, 2020, and December 31, 2019 and for the six months ended June 30, 2020 and 2019 (dollar amountsCompany closed on the purchase of the joint venture partner’s 10% ownership interest.
(3)Represents a preferred equity interest in thousands):the development of 1 distribution center in which the Company is entitled to receive a cumulative preferred return of 9% per year on its contributions of $22.8 million. The Company has no further obligation to make additional contributions.
Carrying Amount of Investment | Equity in Income | |||||||||||||||||||
| Six Months Ended | ||||||||||||||||||||
| Investment | Ownership % (1) | Number of Properties | June 30, 2020 | December 31, 2019 | June 30, 2020 | June 30, 2019 | ||||||||||||||
Faison JV Bethlehem GA (2) | 90% | 1 | $ | 41,076 | $ | 40,416 | $ | 1,197 | $ | 1,035 | ||||||||||
Industrial Partnership (3) | 20% | 6 | 35,257 | 28,409 | 347 | (30 | ) | |||||||||||||
Office Partnership (4) | 20% | 3 | 9,967 | — | 199 | — | ||||||||||||||
| The |
The Company and the respective unconsolidated joint venture partners are subject to the provisions of the applicable joint venture agreements, which include provisions for when additional contributions may be required to fund certain cash shortfalls, including the Company’s share of expansion project capital expenditures.shortfalls.
Note 4 – Rent and Tenant Receivables and Other Assets, Net
Rent and tenant receivables and other assets, net consisted of the following as of June 30, 2020March 31, 2021 and December 31, 20192020 (in thousands):
| March 31, 2021 | December 31, 2020 | |||||||||||||
| Straight-line rent receivable, net | $ | 278,871 | $ | 278,831 | ||||||||||
| Accounts receivable, net | 52,000 | 53,051 | ||||||||||||
Deferred costs, net (1) | 4,339 | 5,185 | ||||||||||||
| Investment in direct financing leases, net | 6,181 | 6,547 | ||||||||||||
Investment in Retained REITs (2) | 7,951 | 7,255 | ||||||||||||
| Prepaid expenses | 7,633 | 3,850 | ||||||||||||
Leasehold improvements, property and equipment, net (3) | 3,740 | 3,991 | ||||||||||||
| Other assets, net | 8,211 | 7,910 | ||||||||||||
| Total | $ | 368,926 | $ | 366,620 | ||||||||||
| June 30, 2020 | December 31, 2019 | |||||||
| Straight-line rent receivable | $ | 266,823 | $ | 266,195 | ||||
| Accounts receivable | 64,791 | 41,556 | ||||||
| Mezzanine position | 9,959 | — | ||||||
Deferred costs, net (1) | 6,927 | 7,208 | ||||||
| Investment in direct financing leases, net | 8,579 | 9,341 | ||||||
Investment in Cole REITs (2) | 6,867 | 7,552 | ||||||
| Prepaid expenses | 6,538 | 3,453 | ||||||
Leasehold improvements, property and equipment, net (3) | 4,317 | 4,809 | ||||||
| Other assets, net | 7,608 | 8,281 | ||||||
| Total | $ | 382,409 | $ | 348,395 | ||||
(3)– (Continued)Amortization expense for leasehold improvements totaled $0.1 million for each of the three months ended March 31, 2021 and 2020, with 0 related write-offs. Accumulated amortization was $3.5 million and $3.4 million as of March 31, 2021 and December 31, 2020, respectively. Depreciation expense for property and equipment totaled $0.2 million and $0.3 million for the three months ended March 31, 2021 and 2020, respectively. Accumulated depreciation was $6.7 million and $6.5 million as of March 31, 2021 and December 31, 2020, respectively.
Note 5 – Fair Value Measures
The Company determines fair value based on quoted prices when available or through the use of alternative approaches, such as discounting the expected cash flows using market interest rates commensurate with the credit quality and duration of the investment. U.S. GAAP guidance defines three levels of inputs that may be used to measure fair value:
Level 1 – Quoted prices in active markets for identical assets and liabilities that the reporting entity has the ability to access at the measurement date.
Level 2 – Inputs other than quoted prices included within Level 1 that are observable for the asset and liability or can be corroborated with observable market data for substantially the entire contractual term of the asset or liability.
Level 3 – Unobservable inputs reflect the entity’s own assumptions about the assumptions that market participants would use in the pricing of the asset or liability and are consequently not based on market activity, but rather through particular valuation techniques.
22
VEREIT, INC. and VEREIT OPERATING PARTNERSHIP, L.P.
NOTES TO CONSOLIDATED FINANCIAL STATEMENTS
March 31, 2021 (Unaudited) – (Continued)
The determination of where an asset or liability falls in the hierarchy requires significant judgment and considers factors specific to the asset or liability. In instances where the determination of the fair value measurement is based on inputs from different levels of the fair value hierarchy, the level in the fair value hierarchy within which the entire fair value measurement falls is based on the lowest level input that is significant to the fair value measurement in its entirety. The Company evaluates its hierarchy disclosures each quarter and depending on various factors, it is possible that an asset or liability may be classified differently from quarter to quarter. Changes in the type of inputs may result in a reclassification for certain assets. The Company does not expect that changes in classifications between levels will be frequent.
Items Measured at Fair Value on a Recurring Basis
The following tables present information about the Company’s assets and liabilities measured at fair value on a recurring basisof the Investment in Retained REITs was $8.0 million and $7.3 million as of June 30, 2020March 31, 2021 and December 31, 2019, aggregated by the level in the fair value hierarchy within which those instruments fall (in thousands):
| Level 1 | Level 2 | Level 3 | Balance as of June 30, 2020 | |||||||||||||
| Assets: | ||||||||||||||||
| Investment in Cole REITs | $ | — | $ | — | $ | 6,867 | $ | 6,867 | ||||||||
| Liabilities: | ||||||||||||||||
| Derivative liabilities | $ | — | $ | (106,520 | ) | $ | — | $ | (106,520 | ) | ||||||
| Level 1 | Level 2 | Level 3 | Balance as of December 31, 2019 | |||||||||||||
| Assets: | ||||||||||||||||
| Derivative assets | $ | — | $ | 250 | $ | — | $ | 250 | ||||||||
| Investment in Cole REITs | — | — | 7,552 | 7,552 | ||||||||||||
| Total assets | $ | — | $ | 250 | $ | 7,552 | $ | 7,802 | ||||||||
| Liabilities: | ||||||||||||||||
| Derivative liabilities | $ | — | $ | (28,081 | ) | $ | — | $ | (28,081 | ) | ||||||
The following are reconciliations of the changes in assets and liabilities with Level 3 inputs in the fair value hierarchy for the sixthree months ended June 30,March 31, 2021 and 2020 and 2019 (in thousands):
| Investment in Cole REITs | ||||
| Beginning balance, January 1, 2020 | $ | 7,552 | ||
| Unrealized loss included in other income, net | (685 | ) | ||
| Ending Balance, June 30, 2020 | $ | 6,867 | ||
| Beginning balance, January 1, 2019 | $ | 7,844 | ||
| Unrealized loss included in other income, net | (292 | ) | ||
| Ending Balance, June 30, 2019 | $ | 7,552 | ||
| Investment in Retained REITs | ||||||||||||||
| Beginning balance, January 1, 2021 | $ | 7,255 | ||||||||||||
| Unrealized gain included in other income (loss), net | 696 | |||||||||||||
| Ending Balance, March 31, 2021 | $ | 7,951 | ||||||||||||
| Beginning balance, January 1, 2020 | $ | 7,552 | ||||||||||||
| Unrealized loss included in other income (loss), net | (543) | |||||||||||||
| Ending Balance, March 31, 2020 | $ | 7,009 | ||||||||||||
Items Measured at Fair Value on a Non-Recurring Basis
Certain financial and nonfinancial assets and liabilities are measured at fair value on a non-recurring basis and are subject to fair value adjustments in certain circumstances, such as when there is evidence of impairment.
Real Estate and Other Investments – The Company performs quarterly impairment review procedures for real estate investments, leasehold improvements and property and equipment, right of use assets and investments in unconsolidated entities, primarily through continuous monitoring of events and changes in circumstances that could indicate the carrying value of its real estate assetsthese investments may not be recoverable.
As part of the Company’s quarterly impairment review procedures, net real estate assets representing 3819 properties were deemed to be impaired resulting in impairment charges of $20.5$31.8 million during the sixthree months ended June 30, 2020.March 31, 2021 that relate to certain office, retail and restaurant properties which, during the three months ended March 31, 2021, were identified by management for potential sale or were determined would not be re-leased by the tenant. There were 0 impairment charges directly attributable to the COVID-19 pandemic during the three months ended March 31, 2021.
During the three months ended March 31, 2020, net real estate assets related to 16 properties, were deemed to be impaired resulting in impairment charges of $8.4 million. The impairment charges relate to certain retail and restaurant properties whose tenants filed for Chapter 11 bankruptcy during the six months ended June 30,first quarter of 2020, were identified by management for potential sale or were determined would not be re-leased by the tenant.
The Company estimates fair values using Level 3 inputs and uses a combined income and market approach, specifically using discounted cash flow analysis and recent comparable sales transactions. The evaluation of real estate assets for potential impairment requires the Company’s management to exercise significant judgment and make certain key assumptions, including, but not limited to, the following: (1) capitalization rate; (2) discount rates; (3) number of years property will be held; (4) property operating expenses; and (5) re-leasing assumptions including number of months to re-lease, market rental revenue and required tenant improvements. There are inherent uncertainties in making these estimates such as market conditions and performance and sustainability of the Company’s tenants. For the Company’s impairment tests for the real estate assets during the sixthree months ended June 30, 2020,March 31, 2021, the Company used a range of discount rates from 7.9% to 8.4%8.6% with a weighted-average rate of 8.2%8.5% and capitalization rates from 7.4% to 7.9%8.1% with a weighted-average rate of 7.7%8.0%.
23
VEREIT, INC. and VEREIT OPERATING PARTNERSHIP, L.P.
NOTES TO CONSOLIDATED FINANCIAL STATEMENTS
March 31, 2021 (Unaudited) – (Continued)
Goodwill – The Company evaluates goodwill for impairment annually or more frequently when an event occurs or circumstances change that indicate the carrying value may not be recoverable.
Fair Value of Financial Instruments
The fair value of short-term financial instruments such as cash and cash equivalents, restricted cash and accounts payable approximate their carrying value in the accompanying consolidated balance sheets due to their short-term nature and are classified as Level 1 under the fair value hierarchy. The fair values of the Company’s financial instruments are reported below (dollar amounts in thousands):
| Level | Carrying Amount at March 31, 2021 | Fair Value at March 31, 2021 | Carrying Amount at December 31, 2020 | Fair Value at December 31, 2020 | ||||||||||||||||||||||||||||
Liabilities (1): | ||||||||||||||||||||||||||||||||
| Mortgage notes payable and other debt, net | 2 | $ | 1,040,386 | $ | 1,096,403 | $ | 1,334,689 | $ | 1,384,490 | |||||||||||||||||||||||
| Corporate bonds, net | 2 | 4,623,698 | 4,925,246 | 4,622,951 | 5,123,588 | |||||||||||||||||||||||||||
| Total liabilities | $ | 5,664,084 | $ | 6,021,649 | $ | 5,957,640 | $ | 6,508,078 | ||||||||||||||||||||||||
| Level | Carrying Amount at June 30, 2020 | Fair Value at June 30, 2020 | Carrying Amount at December 31, 2019 | Fair Value at December 31, 2019 | ||||||||||||||
Liabilities (1): | ||||||||||||||||||
| Mortgage notes payable and other debt, net | 2 | $ | 1,400,317 | $ | 1,446,194 | $ | 1,535,918 | $ | 1,590,915 | |||||||||
| Corporate bonds, net | 2 | 3,435,016 | 3,575,898 | 2,839,581 | 3,022,087 | |||||||||||||
| Convertible debt, net | 2 | 270,872 | 269,512 | 319,947 | 327,237 | |||||||||||||
| Credit facility | 2 | 900,000 | 900,000 | 1,050,000 | 1,050,000 | |||||||||||||
| Total liabilities | $ | 6,006,205 | $ | 6,191,604 | $ | 5,745,446 | $ | 5,990,239 | ||||||||||
Debt – The fair value is estimated by an independent third party using a discounted cash flow analysis, based on management’s estimates of observable market interest rates. Corporate bonds and convertible debt are valued using quoted market prices in active markets with limited trading volume when available.
Note 6 – Debt
As of March 31, 2021, the Company had $5.6 billion of debt outstanding, including net premiums (discounts) and net deferred financing costs, with a weighted-average years to maturity of 6.0 years and a weighted-average interest rate of 3.90%. The following table summarizes the carrying value of debt as of March 31, 2021 and December 31, 2020, and the debt activity for the three months ended March 31, 2021 (in thousands):
| Three Months Ended March 31, 2021 | |||||||||||||||||||||||||||||||||||
| Balance as of December 31, 2020 | Debt Issuances | Repayments, Extinguishment and Assumptions | Accretion and Amortization | Balance as of March 31, 2021 | |||||||||||||||||||||||||||||||
| Mortgage notes payable: | |||||||||||||||||||||||||||||||||||
| Outstanding balance | $ | 1,333,195 | $ | 0 | $ | (292,806) | $ | — | $ | 1,040,389 | |||||||||||||||||||||||||
Net premiums (discounts) (1) | 1,495 | — | (1,005) | (493) | (3) | ||||||||||||||||||||||||||||||
| Deferred costs | (5,855) | 0 | 353 | 444 | (5,058) | ||||||||||||||||||||||||||||||
| Mortgage notes payable, net | 1,328,835 | 0 | (293,458) | (49) | 1,035,328 | ||||||||||||||||||||||||||||||
| Corporate bonds: | |||||||||||||||||||||||||||||||||||
| Outstanding balance | 4,650,000 | 0 | — | — | 4,650,000 | ||||||||||||||||||||||||||||||
Discount (2) | (27,049) | 0 | — | 747 | (26,302) | ||||||||||||||||||||||||||||||
| Deferred costs | (38,721) | 0 | — | 1,275 | (37,446) | ||||||||||||||||||||||||||||||
| Corporate bonds, net | 4,584,230 | 0 | — | 2,022 | 4,586,252 | ||||||||||||||||||||||||||||||
| Total debt | $ | 5,913,065 | $ | 0 | $ | (293,458) | $ | 1,973 | $ | 5,621,580 | |||||||||||||||||||||||||
(1)Net premiums (discounts) on mortgage notes payable were recorded upon the assumption of the respective mortgage notes in relation to the various mergers and acquisitions. Amortization of these net premiums is recorded as a reduction to interest expense over the remaining term of the respective mortgage notes using the effective-interest method.
(2)Discounts on the corporate bonds were recorded based upon the fair value of the respective debt instruments as of the respective issuance dates. Amortization of these discounts is recorded as an increase to interest expense over the remaining term of the respective debt instruments using the effective-interest method.
24
VEREIT, INC. and VEREIT OPERATING PARTNERSHIP, L.P.
NOTES TO CONSOLIDATED FINANCIAL STATEMENTS
| Six Months Ended June 30, 2020 | |||||||||||||||||||||
| Balance as of December 31, 2019 | Debt Issuances | Repayments, Extinguishment and Assumptions | Accretion and Amortization | Balance as of June 30, 2020 | |||||||||||||||||
| Mortgage notes payable: | |||||||||||||||||||||
| Outstanding balance | $ | 1,529,057 | $ | 1,032 | $ | (133,657 | ) | $ | — | $ | 1,396,432 | ||||||||||
Net premiums (1) | 6,861 | — | (216 | ) | (2,760 | ) | 3,885 | ||||||||||||||
| Deferred costs | (7,784 | ) | — | 65 | 1,054 | (6,665 | ) | ||||||||||||||
| Mortgages notes payable, net | 1,528,134 | 1,032 | (133,808 | ) | (1,706 | ) | 1,393,652 | ||||||||||||||
| Corporate bonds: | |||||||||||||||||||||
| Outstanding balance | 2,850,000 | 600,000 | — | — | 3,450,000 | ||||||||||||||||
Discount (2) | (10,419 | ) | (5,136 | ) | — | 571 | (14,984 | ) | |||||||||||||
| Deferred costs | (25,842 | ) | (5,908 | ) | — | 1,669 | (30,081 | ) | |||||||||||||
| Corporate bonds, net | 2,813,739 | 588,956 | — | 2,240 | 3,404,935 | ||||||||||||||||
| Convertible debt: | |||||||||||||||||||||
| Outstanding balance | 321,802 | — | (50,169 | ) | — | 271,633 | |||||||||||||||
Discount (2) | (1,855 | ) | — | 140 | 954 | (761 | ) | ||||||||||||||
| Deferred costs | (1,764 | ) | — | 133 | 911 | (720 | ) | ||||||||||||||
| Convertible debt, net | 318,183 | — | (49,896 | ) | 1,865 | 270,152 | |||||||||||||||
| Credit facility: | |||||||||||||||||||||
| Outstanding balance | 1,050,000 | 902,000 | (1,052,000 | ) | — | 900,000 | |||||||||||||||
Deferred costs (3) | (4,331 | ) | — | — | 645 | (3,686 | ) | ||||||||||||||
| Credit facility, net | 1,045,669 | 902,000 | (1,052,000 | ) | 645 | 896,314 | |||||||||||||||
| Total debt | $ | 5,705,725 | $ | 1,491,988 | $ | (1,235,704 | ) | $ | 3,044 | $ | 5,965,053 | ||||||||||
Mortgage Notes Payable
The Company’s mortgage notes payable consisted of the following as of June 30, 2020March 31, 2021 (dollar amounts in thousands):
| Encumbered Properties | Net Carrying Value of Collateralized Properties (1) | Outstanding Balance | Weighted-Average Interest Rate (2) | Weighted-Average Years to Maturity (3) | ||||||||||||
| Fixed-rate debt | 313 | $ | 1,877,744 | $ | 1,381,184 | 5.02 | % | 2.5 | ||||||||
| Variable-rate debt | 1 | 30,018 | 15,248 | 3.50 | % | (4) | 0.1 | |||||||||
Total (5) | 314 | $ | 1,907,762 | $ | 1,396,432 | 5.00 | % | 2.5 | ||||||||
| Encumbered Properties | Net Carrying Value of Collateralized Properties (1) | Outstanding Balance | Weighted-Average Interest Rate (2) | Weighted-Average Years to Maturity (3) | ||||||||||||||||||||||||||||
| Fixed-rate debt | 218 | $ | 1,239,657 | $ | 1,025,413 | 4.89 | % | 2.3 | ||||||||||||||||||||||||
| Variable-rate debt | 1 | 28,698 | 14,976 | 3.75 | % | (4) | 0.4 | |||||||||||||||||||||||||
Total (5) | 219 | $ | 1,268,355 | $ | 1,040,389 | 4.87 | % | 2.3 | ||||||||||||||||||||||||
(1)Net carrying value is real estate assets, including investment in direct financing leases, net of real estate liabilities.
(2)Weighted average interest rate is computed using the interest rate in effect until the anticipated repayment date. Should the loan not be repaid at the anticipated repayment date, the applicable interest rate will increase as specified in the respective loan agreement until the extended maturity date.
(3)Weighted average years remaining to maturity is computed using the anticipated repayment date as specified in each loan agreement, where applicable.
(4)Weighted-average interest rate for variable-rate debt represents the interest rate in effect as of March 31, 2021.
(5)The table above does not include mortgage notes associated with unconsolidated joint ventures and preferred equity investments of $591.0 million, which are non-recourse to the Company.
The Company’s mortgage loan agreements generally restrict corporate guarantees and require the maintenance of financial covenants, including maintenance of certain financial ratios (such as debt service coverage ratios and minimum net operating income). The mortgage loan agreements contain no dividend restrictions except in the event of default or when a distribution would drive liquidity below the applicable thresholds. At June 30, 2020,March 31, 2021, the Company believes that it was in compliance with the financial covenants under the mortgage loan agreements and had no restrictions on the payment of dividends.
The following table summarizes the scheduled aggregate principal repayments due on mortgage notes subsequent to June 30, 2020March 31, 2021 (in thousands):
| Total | ||||
| July 1, 2020 - December 31, 2020 | $ | 78,261 | ||
| 2021 | 299,015 | |||
| 2022 | 266,951 | |||
| 2023 | 124,217 | |||
| 2024 | 621,021 | |||
| 2025 | 1,078 | |||
| Thereafter | 5,889 | |||
| Total | $ | 1,396,432 | ||
| Total | ||||||||
| April 1, 2021 - December 31, 2021 | $ | 48,985 | ||||||
| 2022 | 239,201 | |||||||
| 2023 | 124,217 | |||||||
| 2024 | 621,021 | |||||||
| 2025 | 1,078 | |||||||
| 2026 | 1,138 | |||||||
| Thereafter | 4,749 | |||||||
| Total | $ | 1,040,389 | ||||||
Corporate Bonds
As of June 30, 2020,March 31, 2021, the OP had $3.45$4.65 billion aggregate principal amount of senior unsecured notes (the “Senior Notes”) outstanding comprised of the following (dollar amounts in thousands):
| Outstanding Balance June 30, 2020 | Interest Rate | Maturity Date | |||||||
| 2024 Senior Notes | $ | 500,000 | 4.600 | % | February 6, 2024 | ||||
| 2025 Senior Notes | 550,000 | 4.625 | % | November 1, 2025 | |||||
| 2026 Senior Notes | 600,000 | 4.875 | % | June 1, 2026 | |||||
| 2027 Senior Notes | 600,000 | 3.950 | % | August 15, 2027 | |||||
| 2028 Senior Notes | 600,000 | 3.400 | % | January 15, 2028 | |||||
| 2029 Senior Notes | 600,000 | 3.100 | % | December 15, 2029 | |||||
| Total balance and weighted-average interest rate | $ | 3,450,000 | 4.069 | % | |||||
| Outstanding Balance March 31, 2021 | Interest Rate | Maturity Date | ||||||||||||||||||
| Senior Notes due 2024 | $ | 500,000 | 4.600 | % | February 6, 2024 | |||||||||||||||
| Senior Notes due 2025 | 550,000 | 4.625 | % | November 1, 2025 | ||||||||||||||||
| Senior Notes due 2026 | 600,000 | 4.875 | % | June 1, 2026 | ||||||||||||||||
| Senior Notes due 2027 | 600,000 | 3.950 | % | August 15, 2027 | ||||||||||||||||
| Senior Notes due January, 2028 | 600,000 | 3.400 | % | January 15, 2028 | ||||||||||||||||
| Senior Notes due June, 2028 | 500,000 | 2.200 | % | June 15, 2028 | ||||||||||||||||
| Senior Notes due 2029 | 600,000 | 3.100 | % | December 15, 2029 | ||||||||||||||||
| Senior Notes due 2032 | 700,000 | 2.850 | % | December 15, 2032 | ||||||||||||||||
| Total balance and weighted-average interest rate | $ | 4,650,000 | 3.685 | % | ||||||||||||||||
25
VEREIT, INC. and VEREIT OPERATING PARTNERSHIP, L.P.
NOTES TO CONSOLIDATED FINANCIAL STATEMENTS
The Senior Notes are guaranteed by the General Partner. The OP may redeem all or a part of any series of the Senior Notes at any time, at its option, for the redemption prices set forth in the indenture governing the Senior Notes. If the redemption date isGenerally, 60 or fewerto 90 days prior to the maturity, date with respect to the 2025 Senior Notes, 90 or fewer days prior to the maturity date with respect to the 2024 Senior Notes, the 2026 Senior Notes, the 2027 Senior Notes and the 2029 Senior Notes, or on or after November 15, 2027, with respect to the 2028 Senior Notes, the redemption price will be equal to 100% of the principal amount of the Senior Notes of the applicable series to be redeemed, plus accrued and unpaid interest on the amount being redeemed to, but excluding, the applicable redemption date.Notes. The Senior Notes are registered under the Securities Act of 1933, as amended (the “Securities Act”) and are freely transferable.
The indenture governing our Senior Notes requires us to maintain financial ratios which include maintaining (i) a maximum limitation on incurrence of total debt less than or equal to 65% of Total Assets (as defined in the indenture), (ii) maximum limitation on incurrence of secured debt less than or equal to 40% of Total Assets (as defined in the indenture), (iii) a minimum debt service coverage ratio of at least 1.5x and (iv) a minimum unencumbered asset value of at least 150% of the aggregate principal amount of all of the outstanding Unsecured Debt (as defined in the indenture). As of June 30, 2020,March 31, 2021, the Company believes that it was in compliance with the financial covenants of our Senior Notes based on the covenant limits and calculations in place at that time.
Credit Facility
On May 23, 2018, the General Partner, as guarantor, and the OP, as borrower, entered into a credit agreement with Wells Fargo Bank, National Association as administrative agent and other lenders party thereto (the “Credit Agreement”). The Credit Agreement provided for maximum borrowings of $2.9 billion, originally consisting of a $2.0 billion unsecured revolving credit facility (the “Revolving Credit Facility”) and a $900.0 million unsecured term loan facility (the “Credit Facility Term Loan,” together with the Revolving Credit Facility, the “Credit Facility”). Effective December 27, 2019, the Company reduced the amount available under its Revolving Credit Facility from $2.0 billion to $1.5 billion. On May 27, 2020, the Operating Partnership and the Company, entered into Amendment No. 1 to the Credit Agreement (the “Amendment”) which, among other things, modifiesmodified the measurement period for certain financial covenants (and relevant associated definitions) from either the prior quarterly period annualized or the prior six month period to the four consecutive fiscal quarter period most recently ending. During the fourth quarter of 2020, the Company repaid the outstanding balance of $900.0 million on the Credit Facility Term Loan in connection with the termination of the related interest rate swap agreements discussed in Note 7 – Derivatives and Hedging Activities.
As of June 30, 2020,March 31, 2021, 0 amounts were outstanding under the Revolving Credit Facility and the full $900.0 million was drawn on the Credit Facility Term Loan.Facility. The maximum aggregate dollar amount of letters of credit that may be outstanding at any one time under the Credit Facility is $50.0 million. As of June 30, 2020,March 31, 2021, there were 0$2.6 million of letters of credit outstanding.
The Revolving Credit Facility generally bears interest at an annual rate of LIBOR plus 0.775% to 1.55% or Base Rate plus 0.00% to 0.55% (based upon the General Partner’s then current credit rating). “Base Rate” is defined as the highest of the prime rate, the federal funds rate plus 0.50% or a floating rate based on one month LIBOR plus 1.0%, determined on a daily basis. The Credit Facility Term Loan generally bearsbore interest at an annual rate of LIBOR plus 0.85% to 1.75%, or Base Rate plus 0.00% to 0.75% (based upon the General Partner’s then current credit rating). In addition, the Credit Agreement provides the flexibility for interest rate auctions, pursuant to which, at the Company’s election, the Company may request that lenders make competitive bids to provide revolving loans, which competitive bids may be at pricing levels that differ from the foregoing interest rates. The Credit Facility Term Loan interest rate was 3.59% as of June 30, 2020, pursuant to the terms of the related swap agreements discussed in Note 7 –Derivatives and Hedging Activities.
In the event of default, at the election of a majority of the lenders (or automatically upon a bankruptcy event of default with respect to the OP or the General Partner), the commitments of the lenders under the Credit Facility will terminate, and payment of any unpaid amounts in respect of the Credit Facility will be accelerated. The Revolving Credit Facility terminates on May 23, 2022, unless extended in accordance with the terms of the Credit Agreement. The Credit Agreement provides for 2 six-month extension options with respect to the Revolving Credit Facility, exercisable at the OP’s election and subject to certain customary conditions, as well as certain customary “amend and extend” provisions. The outstanding Credit Facility Term Loan matures on May 23, 2023. At any time, upon timely notice by the OP and subject to any breakage fees, the OP may prepay borrowings under the Credit Facility (subject to certain limitations applicable to the prepayment of any loans obtained through an interest rate auction, as described above). The OP incurs a facility fee equal to 0.10% to 0.30% per annum (based upon the General Partner’s then current credit rating) multiplied by the commitments (whether or not utilized) in respect of the Revolving Credit Facility. The OP also incurs customary administrative agent, letter of credit issuance, letter of credit fronting, extension and other fees.
26
VEREIT, INC. and VEREIT OPERATING PARTNERSHIP, L.P.
NOTES TO CONSOLIDATED FINANCIAL STATEMENTS
March 31, 2021 (Unaudited) – (Continued)
The Credit Facility requires restrictions on corporate guarantees, as well as the maintenance of financial covenants, including the maintenance of certain financial ratios (such as specified debt to equity and debt service coverage ratios). The key financial covenants in the Credit Facility, as defined and calculated per the terms of the Credit Agreement, include maintaining (i) a maximum leverage ratio less than or equal to 60%, (ii) a minimum fixed charge coverage ratio of at least 1.5x, (iii) a secured leverage ratio less than or equal to 45%, (iv) a total unencumbered asset value ratio less than or equal to 60% and (v) a minimum unencumbered interest coverage ratio of at least 1.75x. The Company believes that it was in compliance with the financial covenants pursuant to the Credit Agreement and is not restricted from accessing any borrowing availability under the Credit Facility as of June 30, 2020.March 31, 2021.
Note 7 –Derivatives and Hedging Activities
Cash Flow Hedges of Interest Rate Risk
The Company hashad interest rate swap agreements with an aggregate $900.0 million notional amount, which were designated as cash flow hedges. The Company also hashad forward starting interest rate swaps with a total notional amount of $400.0 million, which were designated as cash flow hedges to hedge the risk of changes in the interest-related cash outflows associated with the anticipated issuance of long-term debt.
| Derivatives Designated as Hedging Instruments | Balance Sheet Location | June 30, 2020 | December 31, 2019 | |||||||
| Interest rate swaps | Rent and tenant receivables and other assets, net | $ | — | $ | 250 | |||||
| Interest rate swaps | Derivative, deferred rent and other liabilities | $ | (106,520 | ) | $ | (28,081 | ) | |||
During the three and six months ended June 30,March 31, 2020, the Company recorded unrealized losses of $6.5$78.6 million and $85.0 million, respectively, and losses of $16.3 million and $27.6 million, respectively, for the three and six months ended June 30, 2019 for changes in the fair value of the cash flow hedges in accumulated other comprehensive income. There were 0 such gains or losses recorded during the three months ended March 31, 2021.
The Company reclassified previous losses of $4.6$0.1 million and $6.6$1.9 million for the three and six months ended June 30,March 31, 2021 and 2020, respectively, and losses of $0.1 million and $0.2 million for the three and six months ended June 30, 2019, respectively, from accumulated other comprehensive income (loss) into interest expense as a result of the hedged transactions impacting earnings.
During the next twelve months, the Company estimates that an additional $24.4$0.4 million will be reclassified from other comprehensive income (loss) as an increase to interest expense.
| Offsetting of Derivative Assets and Liabilities | ||||||||||||||||||||||||||||||||
| Gross Amounts of Recognized Assets | Gross Amounts of Recognized Liabilities | Gross Amounts Offset in the Consolidated Balance Sheets | Net Amounts of Assets Presented in the Consolidated Balance Sheets | Net Amounts of Liabilities Presented in the Consolidated Balance Sheets | Financial Instruments | Cash Collateral Received | Net Amount | |||||||||||||||||||||||||
| June 30, 2020 | $ | — | $ | (106,520 | ) | $ | — | $ | — | $ | (106,520 | ) | $ | — | $ | — | $ | (106,520 | ) | |||||||||||||
| December 31, 2019 | $ | 250 | $ | (28,081 | ) | $ | — | $ | 250 | $ | (28,081 | ) | $ | — | $ | — | $ | (27,831 | ) | |||||||||||||
Note 8 – Supplemental Cash Flow Disclosures
Supplemental cash flow information was as follows for the sixthree months ended June 30,March 31, 2021 and 2020 and 2019 (in thousands):
| Three Months Ended March 31, | ||||||||||||||||||||||||||||||||
| 2021 | 2020 | |||||||||||||||||||||||||||||||
| Supplemental disclosures: | ||||||||||||||||||||||||||||||||
| Cash paid for interest | $ | 51,169 | $ | 50,638 | ||||||||||||||||||||||||||||
| Cash paid for income taxes | $ | 456 | $ | 1,404 | ||||||||||||||||||||||||||||
| Non-cash investing and financing activities: | ||||||||||||||||||||||||||||||||
| Accrued capital expenditures, tenant improvements and real estate developments | $ | 7,030 | $ | 14,856 | ||||||||||||||||||||||||||||
| Accrued deferred financing costs | $ | 0 | $ | 345 | ||||||||||||||||||||||||||||
| Real estate contributions to industrial partnership and office partnership | $ | 0 | $ | 7,494 | ||||||||||||||||||||||||||||
| Distributions declared and unpaid | $ | 106,989 | $ | 150,493 | ||||||||||||||||||||||||||||
| Real estate investments received from lease related transactions | $ | 2,103 | $ | 259 | ||||||||||||||||||||||||||||
| Note receivable for disposal of real estate investments | $ | 4,500 | $ | 0 | ||||||||||||||||||||||||||||
| Six Months Ended June 30, | ||||||||
| 2020 | 2019 | |||||||
| Supplemental disclosures: | ||||||||
| Cash paid for interest | $ | 126,173 | $ | 147,317 | ||||
| Cash paid for income taxes | $ | 3,885 | $ | 3,962 | ||||
| Non-cash investing and financing activities: | ||||||||
| Accrued capital expenditures, tenant improvements and real estate developments | $ | 13,513 | $ | 8,551 | ||||
| Real estate contributions to industrial partnership and office partnership | $ | 7,494 | $ | 29,577 | ||||
| Distributions declared and unpaid | $ | 85,231 | $ | 143,306 | ||||
| Distributions payable relinquished | $ | — | $ | 6,429 | ||||
| Real estate investments received from lease related transactions | $ | 259 | $ | — | ||||
| Exchange of real estate investments | $ | — | $ | 8,900 | ||||
27
NOTES TO CONSOLIDATED FINANCIAL STATEMENTS
March 31, 2021 (Unaudited) – (Continued)
Note 9 – Accounts Payable and Accrued Expenses
Accounts payable and accrued expenses consisted of the following as of June 30, 2020March 31, 2021 and December 31, 20192020 (in thousands):
| June 30, 2020 | December 31, 2019 | |||||||
| Accrued interest | $ | 31,695 | $ | 31,925 | ||||
| Accrued real estate and other taxes | 28,174 | 25,320 | ||||||
| Accrued legal fees and litigation settlements | 8,586 | 25,571 | ||||||
| Accounts payable | 5,697 | 1,779 | ||||||
| Accrued other | 38,399 | 41,725 | ||||||
| Total | $ | 112,551 | $ | 126,320 | ||||
| March 31, 2021 | December 31, 2020 | |||||||||||||
| Accrued interest | $ | 51,813 | $ | 44,164 | ||||||||||
| Accrued real estate and other taxes | 25,914 | 27,689 | ||||||||||||
| Accrued legal fees and litigation settlements | 5,604 | 11,245 | ||||||||||||
| Accounts payable | 1,454 | 1,895 | ||||||||||||
| Accrued other | 31,701 | 32,022 | ||||||||||||
| Total | $ | 116,486 | $ | 117,015 | ||||||||||
Note 10 – Commitments and Contingencies
The Company is involved inparty to various routine legal proceedings which it believes are routine in nature and claims incidental to the ordinary courseoperation of its business. ThereThe Company does not believe that any of these outstanding claims against it are noexpected to have a material legal proceedings pending against the Company, except as follows:
Purchase Commitments
In the normal course of business, the Company enters into various types of commitments to purchase real estate properties. These commitments are generally subject to the Company’s customary due diligence process and, accordingly, a number of specific conditions must be met before the Company is obligated to purchase the properties.
Environmental Matters
In connection with the ownership and operation of real estate, the Company may potentially be liable for costs and damages related to environmental matters. The Company has not been notified by any governmental authority of any non-compliance, liability or other claim, and is not aware of any other environmental condition, in each case, that it believes will have a material adverse effect on the results of operations.
Note 11 – Leases
Lessor
The Company is the lessor for its 3,8363,855 retail, restaurant, office and industrial properties. The Company’s operating and direct financing leases have non-cancelable lease terms of 0.03 years to 24.625.0 years. Certain leases with tenants include options to extend or terminate the lease agreements or to purchase the underlying asset. Lease agreements may also contain rent increases that are based on an index or rate (e.g., the consumer price index (“CPI”) or LIBOR). The Company believes the residual value risk is not a primary risk because of the long-lived nature of the assets.
28
VEREIT, INC. and VEREIT OPERATING PARTNERSHIP, L.P.
NOTES TO CONSOLIDATED FINANCIAL STATEMENTS
March 31, 2021 (Unaudited) – (Continued)
The components of rental revenue from the Company’s operating and direct financing leases were as follows (in thousands):
| Three Months Ended March 31, | ||||||||||||||||||||||||||||||||
| 2021 | 2020 | |||||||||||||||||||||||||||||||
| Fixed: | ||||||||||||||||||||||||||||||||
Cash rent | $ | 263,342 | $ | 269,583 | ||||||||||||||||||||||||||||
Straight-line rent | 4,219 | 2,055 | ||||||||||||||||||||||||||||||
| Lease intangible amortization | (1,547) | (748) | ||||||||||||||||||||||||||||||
| Property operating cost reimbursements | 1,387 | 1,428 | ||||||||||||||||||||||||||||||
Sub-lease (1) | 4,969 | 5,263 | ||||||||||||||||||||||||||||||
| Total fixed | 272,370 | 277,581 | ||||||||||||||||||||||||||||||
Variable (2) | 17,806 | 20,815 | ||||||||||||||||||||||||||||||
| Income from direct financing leases | 133 | 190 | ||||||||||||||||||||||||||||||
| Total rental revenue | $ | 290,309 | $ | 298,586 | ||||||||||||||||||||||||||||
| Three Months Ended June 30, | Six Months Ended June 30, | |||||||||||||||
| 2020 | 2019 | 2020 | 2019 | |||||||||||||
| Fixed: | ||||||||||||||||
Cash rent (1) | $ | 253,117 | $ | 277,324 | $ | 522,702 | $ | 559,899 | ||||||||
Straight-line rent (2) | 3,404 | 8,043 | 5,458 | 15,455 | ||||||||||||
| Lease intangible amortization | (788 | ) | (611 | ) | (1,536 | ) | (1,342 | ) | ||||||||
| Property operating cost reimbursements | 1,363 | 1,422 | 2,791 | 2,886 | ||||||||||||
Sub-lease (3) | 5,279 | 5,282 | 10,543 | 10,771 | ||||||||||||
| Total fixed | 262,375 | 291,460 | 539,958 | 587,669 | ||||||||||||
Variable (4) | 16,039 | 20,372 | 36,852 | 40,789 | ||||||||||||
| Income from direct financing leases | 162 | 211 | 352 | 428 | ||||||||||||
| Total rental revenue | $ | 278,576 | $ | 312,043 | $ | 577,162 | $ | 628,886 | ||||||||
| The Company’s tenants are generally sub-tenants under certain ground leases |
The following table presents future minimum operating lease payments due to the Company over the next five years and thereafter as of June 30, 2020March 31, 2021 (in thousands). These amounts exclude contingent rent payments, as applicable, that may be collected from certain tenants based on provisions related to sales thresholds and increases in annual rent based on exceeding certain economic indexes.
| Future Minimum Operating Lease Payments | Future Minimum Direct Financing Lease Payments (1) | |||||||||||||||||||||
Future Minimum Operating Lease Payments | Future Minimum Direct Financing Lease Payments (1) | |||||||||||||||||||||
| July 1, 2020 - December 31, 2020 | $ | 509,142 | $ | 1,068 | ||||||||||||||||||
| 2021 | 1,046,102 | 2,014 | ||||||||||||||||||||
| April 1, 2021 - December 31, 2021 | April 1, 2021 - December 31, 2021 | $ | 772,883 | $ | 1,501 | |||||||||||||||||
| 2022 | 984,711 | 1,925 | 2022 | 990,905 | 1,925 | |||||||||||||||||
| 2023 | 920,421 | 1,565 | 2023 | 929,394 | 1,565 | |||||||||||||||||
| 2024 | 848,833 | 510 | 2024 | 860,798 | 510 | |||||||||||||||||
| 2025 | 743,217 | 169 | 2025 | 756,324 | 169 | |||||||||||||||||
| 2026 | 2026 | 694,793 | 171 | |||||||||||||||||||
| Thereafter | 4,556,368 | 655 | Thereafter | 4,177,260 | 484 | |||||||||||||||||
| Total | $ | 9,608,794 | $ | 7,906 | Total | $ | 9,182,357 | $ | 6,325 | |||||||||||||
(1)Related to 18 properties which are subject to direct financing leases and, therefore, revenue is recognized as rental income on the discounted cash flows of the lease payments. Amounts reflect undiscounted cash flows to be received by the Company under the lease agreements on these respective properties. |
Lessee
The Company is the lessee under ground lease arrangements and corporate office leases. All leases for which the Company is the lessee meet the criteria of an operating lease. The Company’s leases have remaining lease terms of 0.10.4 years to 79.178.4 years, some of which include options to extend. The weighted average remaining lease term for the Company’s operating leases was 16.115.9 years as of June 30, 2020.March 31, 2021. Under certain ground lease arrangements, the Company pays variable costs, including property operating expenses and common area maintenance, which are generally reimbursed by the ground lease sub-tenants. The weighted average discount rate for the Company’s operating leases was 4.99%4.92% as of June 30, 2020.March 31, 2021. As the Company’s leases do not provide an implicit rate, the Company used an estimated incremental borrowing rate based on the information available at the adoption date in determining the present value of lease payments.
The Company incorporated renewal periods in the calculation of the majority of ground lease right-of-use assets and lease liabilities. Pursuant to certain leases, the Company is required to execute renewal options available under the ground lease through the building lease term. No renewals were incorporated in the calculation of the corporate lease right-of-use assets and liabilities, as it is not reasonably certain that the Company will exercise the options. The Company’s lease agreements do not
29
VEREIT, INC. and VEREIT OPERATING PARTNERSHIP, L.P.
NOTES TO CONSOLIDATED FINANCIAL STATEMENTS
March 31, 2021 (Unaudited) – (Continued)
contain any material residual value guarantees or material restrictive covenants.
The following table presents the lease expense components for the three and six months ended June 30,March 31, 2021 and 2020 and 2019 (in thousands):
| Three Months Ended March 31, | ||||||||||||||||||||||||||
| 2021 | 2020 | |||||||||||||||||||||||||
Operating lease cost (1) | $ | 5,750 | $ | 7,575 | ||||||||||||||||||||||
Sublease income (2) | $ | (4,969) | $ | (5,263) | ||||||||||||||||||||||
| Three Months Ended June 30, | Six Months Ended June 30, | |||||||||||||||
| 2020 | 2019 | 2020 | 2019 | |||||||||||||
Operating lease cost (1) | $ | 6,135 | $ | 5,418 | $ | 13,710 | $ | 12,396 | ||||||||
Sublease income (2) | $ | (5,279 | ) | $ | (5,282 | ) | $ | (10,543 | ) | $ | (10,771 | ) | ||||
(2)The Company’s tenants are generally sub-tenants under certain ground leases |
During the three months ended March 31, 2021, the Company reduced the right-of-use assets by $2.8 million and operating lease liabilities by $3.1$0.9 million and $4.4 million, respectively. The Company reduced the right-of-use assets and operating lease liabilities each by $0.6 million, for non-cash activity related to dispositions and lease modifications during the sixthree months ended June 30, 2019. During the six months ended June 30, 2020, the Company increased the right-of-use assets and operating lease liabilities each by less than $0.1 million.
The following table reflects the future minimum lease payments due from the Company over the next five years and thereafter for ground lease obligations, which are substantially reimbursable by our tenants, and office lease obligations as of June 30, 2020March 31, 2021 (in thousands).
| Future Minimum Lease Payments | ||||
| July 1, 2020 - December 31, 2020 | $ | 10,751 | ||
| 2021 | 22,092 | |||
| 2022 | 21,936 | |||
| 2023 | 21,590 | |||
| 2024 | 21,048 | |||
| 2025 | 20,569 | |||
| Thereafter | 206,547 | |||
| Total | 324,533 | |||
| Less: imputed interest | 109,211 | |||
| Total | $ | 215,322 | ||
| Future Minimum Lease Payments | ||||||||
| April 1, 2021 - December 31, 2021 | $ | 16,140 | ||||||
| 2022 | 21,016 | |||||||
| 2023 | 20,601 | |||||||
| 2024 | 19,973 | |||||||
| 2025 | 19,659 | |||||||
| 2026 | 18,229 | |||||||
| Thereafter | 187,189 | |||||||
| Total | 302,807 | |||||||
| Less: imputed interest | 100,783 | |||||||
| Total | $ | 202,024 | ||||||
Note 12 – Equity
Reverse Stock Split
The Company’s one-for-five reverse stock split of its Common Stock took effect after markets closed on December 17, 2020, following the filing of amendments to its charter with the Maryland State Department of Assessments and Taxation whereby every five shares of VEREIT's issued and outstanding shares of Common Stock, $0.01 par value per share, were converted into one share of Common Stock, $0.01 par value per share. VEREIT’s Common Stock began trading on the NYSE on a split-adjusted basis beginning December 18, 2020. Fractional shares resulting from the reverse stock split were paid in cash based on the trailing average closing price of VEREIT’s Common Stock on the NYSE for a period of three days prior to the effective date. The reverse stock split affected all record holders of VEREIT’s Common Stock uniformly and did not affect any record holder’s percentage ownership interest, except for de minimus changes as a result of the elimination of fractional shares. Trading in the Common Stock continued on the NYSE under the symbol “VER” but the Common Stock was assigned a new CUSIP number. The reverse stock split reduced the number of shares of Common Stock outstanding but did not affect the number of VEREIT’s authorized shares of Common Stock. A corresponding reverse split of the outstanding OP Units also took effect on December 17, 2020.
Common Stock and General Partner OP Units
The General Partner is authorized to issue up to 1.5 billion shares of Common Stock.
30
VEREIT, INC. and VEREIT OPERATING PARTNERSHIP, L.P.
NOTES TO CONSOLIDATED FINANCIAL STATEMENTS
March 31, 2021 (Unaudited) – (Continued)
As of June 30, 2020,March 31, 2021, the General Partner had approximately 1.1 billion229.1 million shares of Common Stock issued and outstanding. Additionally, the Operating Partnership had approximately 1.1 billion229.1 million General Partner OP Units issued and outstanding as of June 30, 2020,March 31, 2021, corresponding to the General Partner’s outstanding shares of Common Stock.
Common Stock Continuous Offering Program
The New ATM Program replaced the Company’s prior continuous equity offering program, which was effective April 15, 2019 (the “Prior ATM Program” and collectively with the New ATM Program, the “ATM Program”). The proceeds from any sale of shares under the ATM Program have been orand will be used for general corporate purposes, which may include funding potential acquisitions and repurchasing or repaying outstanding indebtedness.
Series F Preferred Stock and Series F Preferred OP Units
The Series F Preferred Stock pays cumulative cash dividends at the rate of 6.70% per annum on their liquidation preference of $25.00 per share (equivalent to $1.675 per share on an annual basis). The General Partner may, at its option, redeem shares of the Series F Preferred Stock, in whole or from time to time in part, at a redemption price of $25.00 per share plus, subject to exceptions, any accrued and unpaid dividends thereon to the date fixed for redemption. The shares of Series F Preferred Stock have no stated maturity, are not subject to any sinking fund or mandatory redemption and will remain outstanding indefinitely unless the General Partner redeems or otherwise repurchases them or they become convertible and are converted into Common Stock (or, if applicable, alternative consideration). The Series F Preferred Stock trades on the NYSE under the symbol VER PRF. The Series F Preferred Units contain the same terms as the Series F Preferred Stock.
During the three months ended March 31, 2021, the Company redeemed a total of 4.0 million shares of Series F Preferred Stock, representing approximately 21.20% of the issued and outstanding shares of Series F Preferred Stock as of the beginning of 2021. The shares of Series F Preferred Stock were redeemed at a redemption price of $25.00 per share. As of June 30, 2020,March 31, 2021, there were approximately 30.914.9 million shares of Series F Preferred Stock, approximately 30.914.9 million corresponding General Partner Series F Preferred Units and 49,766 Limited Partner Series F Preferred Units issued and outstanding. On June 22, 2020, the Company issued notice that it would redeem $150.0 million of Series F Preferred Stock, plus accrued and unpaid dividends thereon.
Common Stock Dividends
On May 18, 2020,February 23, 2021, the Company’s Board of Directors declared a quarterly cash dividend for the first quarter of $0.0772021 of $0.462 per share of Common Stock. The dividend was paid on April 15, 2021 to Common Stock for the second quarter of 2020 to stockholders of record as of June 30, 2020, which was paid on July 15, 2020.March 31, 2021. An equivalent distribution by the Operating Partnership is applicable per OP Unit.
Share Repurchase Program
The Company has a share repurchase program (the “2019 Share“Share Repurchase Program”), that permits the Company to repurchase up to $200.0 million of its outstanding Common Stock through May 6, 2022. Under the 2019 Share Repurchase Program, repurchases can be made through open market purchases, privately negotiated transactions, structured or derivative transactions, including accelerated stock repurchase transactions, or other methods of acquiring shares in accordance with applicable securities laws and other legal requirements. The 2019 Share Repurchase Program does not obligate the Company to make any repurchases at a specific time or in a specific situation and repurchases are influenced by prevailing market conditions, the trading price of the Common Stock, the Company’s financial performance and other conditions. Shares of Common Stock repurchased by the Company under the 2019 Share Repurchase Program, if any, will be returned to the status of authorized but unissued shares of Common Stock.
31
VEREIT, INC. and VEREIT OPERATING PARTNERSHIP, L.P.
NOTES TO CONSOLIDATED FINANCIAL STATEMENTS
March 31, 2021 (Unaudited) – (Continued)
Note 13 –Net Income (Loss) Per Share/Unit
Net Income (Loss) Per Share
The following is a summary of the basic and diluted net income (loss) per share computation for the General Partner for the three and six months ended June 30,March 31, 2021 and 2020 and 2019 (dollar amounts in thousands):
| Three Months Ended June 30, | Six Months Ended June 30, | |||||||||||||||
| 2020 | 2019 | 2020 | 2019 | |||||||||||||
| Net income | $ | 54,239 | $ | 292,284 | $ | 141,102 | $ | 363,255 | ||||||||
| Net income attributable to non-controlling interests | (31 | ) | (6,626 | ) | (86 | ) | (8,293 | ) | ||||||||
| Net income attributable to the General Partner | 54,208 | 285,658 | 141,016 | 354,962 | ||||||||||||
| Dividends to preferred shares and units | (12,948 | ) | (17,973 | ) | (25,896 | ) | (35,946 | ) | ||||||||
| Net income available to common stockholders used in basic net income per share | 41,260 | 267,685 | 115,120 | 319,016 | ||||||||||||
| Income attributable to limited partners | 39 | 6,656 | 101 | 8,351 | ||||||||||||
| Net income used in diluted net income per share | $ | 41,299 | $ | 274,341 | $ | 115,221 | $ | 327,367 | ||||||||
| Weighted average number of Common Stock outstanding - basic | 1,078,366,566 | 973,723,139 | 1,078,152,183 | 971,106,256 | ||||||||||||
| Effect of Limited Partner OP Units and dilutive securities | 1,186,500 | 26,054,596 | 1,370,957 | 25,636,664 | ||||||||||||
| Weighted average number of common shares - diluted | 1,079,553,066 | 999,777,735 | 1,079,523,140 | 996,742,920 | ||||||||||||
| Basic and diluted net income per share attributable to common stockholders | $ | 0.04 | $ | 0.27 | $ | 0.11 | $ | 0.33 | ||||||||
| Three Months Ended March 31, | ||||||||||||||||||||||||||||||||
| 2021 | 2020 | |||||||||||||||||||||||||||||||
| Net income | $ | 120,723 | $ | 86,863 | ||||||||||||||||||||||||||||
| Net income attributable to non-controlling interests | (76) | (55) | ||||||||||||||||||||||||||||||
| Net income attributable to the General Partner | 120,647 | 86,808 | ||||||||||||||||||||||||||||||
| Dividends to preferred shares and units | (6,525) | (12,948) | ||||||||||||||||||||||||||||||
| Net income available to common stockholders used in basic net income per share | 114,122 | 73,860 | ||||||||||||||||||||||||||||||
| Income attributable to limited partners | 79 | 62 | ||||||||||||||||||||||||||||||
| Net income used in diluted net income per share | $ | 114,201 | $ | 73,922 | ||||||||||||||||||||||||||||
| Weighted average number of Common Stock outstanding - basic | 229,159,472 | 215,587,560 | ||||||||||||||||||||||||||||||
| Effect of Limited Partner OP Units and dilutive securities | 270,395 | 362,688 | ||||||||||||||||||||||||||||||
| Weighted average number of common shares - diluted | 229,429,867 | 215,950,248 | ||||||||||||||||||||||||||||||
| Basic and diluted net income per share attributable to common stockholders | $ | 0.50 | $ | 0.34 | ||||||||||||||||||||||||||||
Net Income (Loss) Per Unit
The following is a summary of the basic and diluted net income (loss) per unit attributable to common unitholders, which includes all common General Partner unitholders and limited partner unitholders, for the three and six months ended June 30,March 31, 2021 and 2020 and 2019 (dollar amounts in thousands):
| Three Months Ended March 31, | ||||||||||||||||||||||||||||||||
| 2021 | 2020 | |||||||||||||||||||||||||||||||
| Net income | $ | 120,723 | $ | 86,863 | ||||||||||||||||||||||||||||
| Net loss attributable to non-controlling interests | 3 | 7 | ||||||||||||||||||||||||||||||
| Net income attributable to the Operating Partnership | 120,726 | 86,870 | ||||||||||||||||||||||||||||||
| Dividends to preferred units | (6,525) | (12,948) | ||||||||||||||||||||||||||||||
| Net income used in basic and diluted net income per unit | $ | 114,201 | $ | 73,922 | ||||||||||||||||||||||||||||
| Weighted average number of common units outstanding - basic | 229,311,506 | 215,744,224 | ||||||||||||||||||||||||||||||
| Effect of dilutive securities | 118,361 | 206,024 | ||||||||||||||||||||||||||||||
| Weighted average number of common units - diluted | 229,429,867 | 215,950,248 | ||||||||||||||||||||||||||||||
| Basic and diluted net income per unit attributable to common unitholders | $ | 0.50 | $ | 0.34 | ||||||||||||||||||||||||||||
| Three Months Ended June 30, | Six Months Ended June 30, | |||||||||||||||
| 2020 | 2019 | 2020 | 2019 | |||||||||||||
| Net income | $ | 54,239 | $ | 292,284 | $ | 141,102 | $ | 363,255 | ||||||||
| Net loss attributable to non-controlling interests | 8 | 30 | 15 | 58 | ||||||||||||
| Net income attributable to the Operating Partnership | 54,247 | 292,314 | 141,117 | 363,313 | ||||||||||||
| Dividends to preferred units | (12,948 | ) | (17,973 | ) | (25,896 | ) | (35,946 | ) | ||||||||
| Net income used in basic and diluted net income per unit | $ | 41,299 | $ | 274,341 | $ | 115,221 | $ | 327,367 | ||||||||
| Weighted average number of common units outstanding - basic | 1,079,148,736 | 997,406,933 | 1,078,934,928 | 994,806,018 | ||||||||||||
| Effect of dilutive securities | 404,330 | 2,370,802 | 588,212 | 1,936,902 | ||||||||||||
| Weighted average number of common units - diluted | 1,079,553,066 | 999,777,735 | 1,079,523,140 | 996,742,920 | ||||||||||||
| Basic and diluted net income per unit attributable to common unitholders | $ | 0.04 | $ | 0.27 | $ | 0.11 | $ | 0.33 | ||||||||
Note 14 – Subsequent Events
32
VEREIT, INC. and VEREIT OPERATING PARTNERSHIP, L.P.
NOTES TO CONSOLIDATED FINANCIAL STATEMENTS
March 31, 2021 (Unaudited) – (Continued)
Pursuant to the terms and subject to the conditions of the Merger Agreement, each share of Common Stock will be converted into 0.705 of a newly issued share of common stock, par value $0.01 per share, of $1.1 million asRealty Income (the “Realty Income Common Stock”). Immediately prior to the Merger, the Company will issue a notice of June 30, 2020, and an estimated lossredemption with respect to all of $0.4 million.
the outstanding shares of the Series F Preferred Stock Redemptionwith a redemption date as set forth therein, and Realty Income will cause funds to be deposited in escrow to pay the redemption price of $25.00 plus all accrued and unpaid dividends up to and including the redemption date set forth in the notice.
In connection with the Merger, the Company and Realty Income intend to contribute some or all of our office real properties to a redemption pricenewly formed, wholly owned subsidiary ("OfficeCo"), and, following the Merger, Realty Income intends to distribute the outstanding voting shares of $25.00 per share plus accruedcommon stock in OfficeCo to the shareholders of the combined company on a pro rata basis (the "Spin-Off"). Following the consummation of the Spin-Off, the Company and unpaid dividends.Realty Income intend for OfficeCo to operate as a separate, publicly-traded REIT. Subject to the terms and conditions of the Merger Agreement, the Company and Realty Income may also seek to sell some or all of the OfficeCo business in connection with the closing of the Merger.
The Merger Agreement contains customary representations, warranties and covenants by each party. The Merger is subject to certain conditions which are set forth in the Merger Agreement, including the approval of both companies’ shareholders. The boards of directors of the Company and Realty Income have unanimously approved the Merger Agreement. The Merger is expected to close during the fourth quarter of 2021.
Common Stock Dividend
On August 5, 2020,May 4, 2021, the Company’s Board of Directors declared a quarterly cash dividend of $0.077$0.462 per share of Common Stock (equaling an annualized dividend rate of $1.848 per share) for the thirdsecond quarter of 20202021 to stockholders of record as of SeptemberJune 30, 2020,2021, which will be paid on OctoberJuly 15, 2020.2021. An equivalent distribution by the Operating Partnership is applicable per OP Unit.
Preferred Stock Dividend
On August 5, 2020,May 4, 2021, the Company’s Board of Directors declared a monthly cash dividend to holders of the Series F Preferred Stock for October 2020July 2021 through December 2020September 2021 with respect to the periods included in the table below. The corresponding record and payment dates for each month's Series F Preferred Stock dividend are also shown in the table below. The dividend for the Series F Preferred Stock accrues daily on a 360-day annual basis equal to an annualized dividend rate of $1.675 per share, or $0.1395833 per 30-day month.
| Period | Record Date | Payment Date | ||||||||||||||||
| June 15, 2021 - July 14, 2021 | July 1, 2021 | July 15, 2021 | ||||||||||||||||
| July 15, 2021 - August 14, 2021 | August 1, 2021 | August 16, 2021 | ||||||||||||||||
| August 15, 2021 - September 14, 2021 | September 1, 2021 | September 15, | ||||||||||||||||
33
Item 2. Management’s Discussion and Analysis of Financial Condition and Results of Operations.
The following discussion and analysis should be read in conjunction with the accompanying consolidated financial statements and notes thereto appearing elsewhere in this Quarterly Report on Form 10-Q. We make statements in this section that are forward-looking statements. Certain risks may cause our actual results, performance or achievements to differ materially from those expressed or implied by the following discussion. For a complete discussion of such risk factors, see "Risk Factors" in Part I, Item 1A. of the Company’s Annual Report on Form 10-K for the year ended December 31, 2019, as supplemented in Part II, Item 1A. of this Quarterly Report on Form 10-Q.2020. Capitalized terms used herein, but not otherwise defined, shall have the meaning ascribed to those terms in the “Part I – Financial Information,” including the notes to the consolidated financial statements contained therein.
Forward-Looking Statements
This Quarterly Report on Form 10-Q includes “forward-looking statements” which reflect our expectations and projections regarding future events and plans, future financial condition, results of operations, liquidity and business, including leasing and occupancy, acquisitions, dispositions, rent receipts, rent relief requests, and rent relief granted, debt levels, maturities and refinancings, liquidity, the payment of future dividends, and the impact of the coronavirus (COVID-19) on our business.business, the Merger, the Spin-Off and the redemption of the Series F Preferred Stock and the Series F Preferred Units. Generally, the words “anticipates,” “assumes,” “believes,” “continues,” “could,” “estimates,” “expects,” “goals,” “intends,” “may,” “plans,” “projects,” “seeks,” “should,” “targets,” “will,” and variations of such words and similar expressions identify forward-looking statements. These forward-looking statements are based on information currently available to us and involve a number of known and unknown assumptions and risks, uncertainties and other factors, which may be difficult to predict and beyond the Company’s control, that could cause actual events and plans or could cause our business, financial condition, liquidity and results of operations to differ materially from those expressed or implied in the forward-looking statements. Further, informationThese factors include, among other things, those discussed below. Information regarding historical rent collections should not serve as an indication of future rent collection. These factors include, among other things, those discussed below. We disclaim any obligation to publicly update or revise any forward-looking statements, whether as a result of changes in underlying assumptions or factors, new information, future events or otherwise, except as may be required by law.
The following are some, but not all, of the assumptions, risks, uncertainties and other factors that could cause our actual results to differ materially from those presented in our forward-looking statements:
•Our ability to consummate the proposed Merger and the timing of the closing of the proposed Merger.
•The potential impact of the announcement of the proposed transactions or consummation of the proposed transactions on business relationships, including with tenants, clients, employees, customers and competitors.
•Potential litigation associated with the Merger.
•Costs, fees, expenses and charges related to the proposed transactions.
•We may be subject to risks as a result of restrictions imposed by operating covenants contained in the Merger Agreement restricting us generally from issuing equity, incurring or pre-paying debt and limitations on the use of our Revolving Credit Facility.
•The uncertain duration and extent of the impact of COVID-19 on our business and the businesses of our tenants (including their ability to timely make rental payments) and the economy generally.
•Federal, state or local legislation or regulation that could impact the timely payment of rent by tenants in light of COVID-19.
•We may be unable to renew leases, lease vacant space or re-lease space as leases expire on favorable terms or at all.
•We are subject to risks associated with tenant, geographic and industry concentrations with respect to our properties.
•We may be subject to risks accompanying the management of our industrial and office partnerships.partnerships, in each of which we hold a non-controlling ownership interest.
•Our properties may be subject to impairment charges.
•We could be subject to unexpected costs or liabilities that may arise from potential dispositions, including related to limited partnership, tenant-in-common and Delaware statutory trust real estate programs (“1031 real estate programs”) and our management of such programs.
•We are subject to competition in the acquisition and disposition of properties and in the leasing of our properties including that we may be unable to acquire, dispose of, or lease properties on advantageous terms or at all.
•We are subject to risks associated with bankruptcies or insolvencies of tenants, from tenant defaults generally or from the unpredictability of the business plans and financial condition of our tenants, which are heightened as a result of the COVID-19 pandemic.
34
•We have substantial indebtedness, which may affect our ability to pay dividends, and expose us to interest rate fluctuation risk and the risk of default under our debt obligations.
•We may be subject to increases in our borrowing costs as a result of changes in interest rates and other factors, including the potential phasing out of the London Inter-Bank OfferOffered Rate (“LIBOR”) after 2021.
•Our overall borrowing and operating flexibility may be adversely affected by the terms and restrictions within the indenture governing the senior unsecured notes (the “Senior Notes”), and the Credit Agreement governing the terms of the Credit Facility (as both terms are defined in Liquidity and Capital Resources), and compliance with such covenants and/or our ability to access capital markets (including on attractive terms) may be more difficult as a result of the impact of COVID-19.
•Our access to capital and terms of future financings may be affected by adverse changes to our credit rating.
•We may not generate cash flows sufficient to pay our dividends to stockholders or meet our debt service obligations.
•We may be affected by risks resulting from losses in excess of insured limits.
•We may fail to remain qualified as a real estate investment trust (“REIT”) for U.S. federal income tax purposes.
•Compliance with the REIT annual distribution requirements may limit our operating flexibility.
•We may be unable to retain or hire key personnel.
•We may be impacted by the continuation or deterioration of current market conditions.
All forward-looking statements should be read in light of the risks identified in Part I, Item 1A. Risk Factors within our Annual Report on Form 10-K for the year ended December 31, 2019, as supplemented in2020 and Part II, Item 1A. ofRisk Factors within this Quarterly Report on Form 10-Q.
We use certain defined terms throughout this Quarterly Report on Form 10-Q that have the following meanings:
When we refer to “annualized rental income,” we mean the rental revenue under our leases on operating properties on a straight-line basis, which includes the effect of rent escalations and any tenant concessions, such as free rent, and our pro rata share of such revenues from properties owned by unconsolidated joint ventures. Annualized rental income excludes any adjustments to rental income due to changes in the collectability assessment, contingent rent, such as percentage rent, and operating expense reimbursements. Management uses annualized rental income as a basis for tenant, industry and geographic concentrations and other metrics within the portfolio. Annualized rental income is not indicative of future performance.
When we refer to a “creditworthy tenant,” we mean a tenant that has entered into a lease that we determine is creditworthy and may include tenants with an investment grade or below investment grade credit rating, as determined by major credit rating agencies, or unrated tenants. To the extent we determine that a tenant is a “creditworthy tenant” even though it does not have an investment grade credit rating, we do so based on our management’s determination that a tenant should have the financial wherewithal to honor its obligations under its lease with us. As explained further below, this determination is based on our management’s substantial experience performing credit analysis and is made after evaluating a tenant’s due diligence materials that are made available to us, including financial statements and operating data.
When we refer to a “direct financing lease,” we mean a lease that requires specific treatment due to the significance of the lease payments from the inception of the lease compared to the fair value of the property, term of the lease, a transfer of ownership, or a bargain purchase option. These leases are recorded as a net asset on the balance sheet. The amount recorded is calculated as the fair value of the remaining lease payments on the leases and the estimated fair value of any expected residual property value at the end of the lease term.
When we refer to properties that are net leased on a “long term basis,” we mean properties with remaining primary lease terms of generally seven to 10 years or longer on average, depending on property type.
Under a “net lease,” the tenant occupying the leased property (usually as a single tenant) does so in much the same manner as if the tenant were the owner of the property. There are various forms of net leases, most typically classified as triple net or double net. Triple net leases typically require that the tenant pay all expenses associated with the property (e.g., real estate taxes, insurance, maintenance and repairs). Double net leases typically require that the tenant pay all operating expenses associated with the property (e.g., real estate taxes, insurance and maintenance), but excludes some or all major repairs (e.g., roof, structure and parking lot). Accordingly, the owner receives the rent “net” of these expenses, rendering the cash flow associated with the lease predictable for the term of the lease. Under a net lease, the tenant generally agrees to lease the property for a significant term and agrees that it will either have no ability or only limited ability to terminate the lease or abate rent prior
35
to the expiration of the term of the lease as a result of real estate driven events such as casualty, condemnation or failure by the landlord to fulfill its obligations under the lease.
Overview
VEREIT is a full-service real estate operating company which owns and manages one of the impact on prior period metrics was immaterial.
largest portfolios of single-tenant commercial properties in the U.S. As of June 30, 2020,March 31, 2021, our portfolio was comprised of 3,8363,855 retail, restaurant, office and industrial real estate properties with an aggregate 89.289.0 million square feet, of which 98.7%97.8% was leased, with a weighted-average remaining lease term of 8.58.4 years. Omitting the square feet of one redevelopment property and including the pro rata share of square feet and annualized rental income from the Company’s unconsolidated joint ventures, we owned an aggregate of 88.988.7 million square feet, of which 98.8%98.0% was leased, with a weighted-average remaining lease term of 8.58.4 years as of June 30, 2020.March 31, 2021.
On April 29, 2021, the Company and the OP entered into a Merger Agreement with Realty Income, Merger Sub 1, and Merger Sub 2 whereby Merger Sub 2 will be merged with and into the OP, with the OP continuing as the surviving entity and, immediately thereafter, VEREIT is a full-service real estate operating company which ownswill be merged with and manages oneinto Merger Sub 1, with Merger Sub 1 continuing as the surviving corporation. Pursuant to the terms and subject to the conditions of the largest portfoliosMerger Agreement, each share of single-tenant commercial propertiesCommon Stock and Limited Partner OP Unit will be converted into 0.705 of a newly issued share of Realty Income Common Stock. The Merger Agreement contains customary representations, warranties and covenants by each party. The Merger is subject to certain conditions set forth in the U.S.Merger Agreement, including the approval of both companies’ shareholders. The boards of directors of the Company has 3,836 retail, restaurant, office and industrial operating properties with an aggregate 88.9 million rentable square feet,Realty Income have unanimously approved the Merger Agreement. The Merger is expected to close during the fourth quarter of which 98.8% was leased as2021.
36
Operating Highlights and Key Performance Indicators
Activity through June 30, 2020March 31, 2021
Operations
•Acquired controlling financial interests in 2554 commercial properties for an aggregate purchase price of $147.1$140.1 million, which includes one land parcel for build-to-suit development and $0.9$1.6 million of external acquisition-related expenses that were capitalized. During the three months ended June 30, 2020, the Company acquired a mezzanine position in two last-mile distribution facilities for $10.0 million.
•Disposed of 4730 properties, including the sale of two consolidated properties to the office partnership, for an aggregate gross sales price of $219.2$261.0 million, of which our share was $216.7 million, resulting in proceeds10 were office properties disposed of $204.1 million after closing costs and contributions to the office partnership.for an aggregate sales price of $235.5 million. The Company recorded a gain of $34.2$76.1 million related to the sales.
Debt
•Total secured debt decreased by$292.8 million, from $1.3 billion to $1.0 billion, which includes prepayment of $213.1 million of mortgage notes during the first quarter of 2021. |
Equity
•Issued notice that we would redeem $150.0an aggregate of 35,710 shares under the Prior ATM Program (as defined in Liquidity and Capital Resources), at a weighted average price per share of $37.90, for gross proceeds of $1.4 million. The weighted average price per share, net of commissions, was $37.42, for net proceeds of $1.3 million.
•Redeemed a total of 4.0 million shares of Series F Preferred Stock, on July 22, 2020,representing approximately 21.20% of the issued and outstanding preferred shares as of the beginning of the year. The shares of Series F Preferred Stock were redeemed at a redemption price of $25.00 per share plus all accrued and unpaid dividends thereon.dividends.
•Declared a quarterly dividend of $0.077$0.462 per share of Common Stock for the secondfirst quarter of 2020.2021.
37
Real Estate Portfolio Metrics
In managing our portfolio, we are committed to diversification by property type, tenant, geography and industry. Below is a summary of our operating property type diversification and our top ten concentrations as of June 30, 2020,March 31, 2021, based on annualized rental income of $1.1 billion.
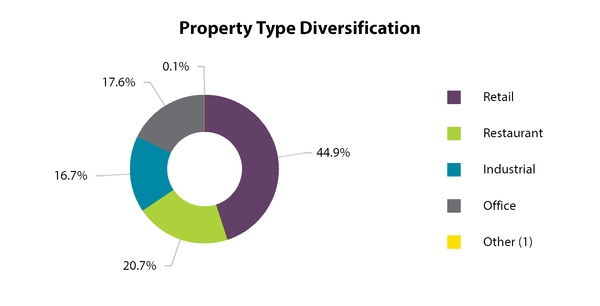
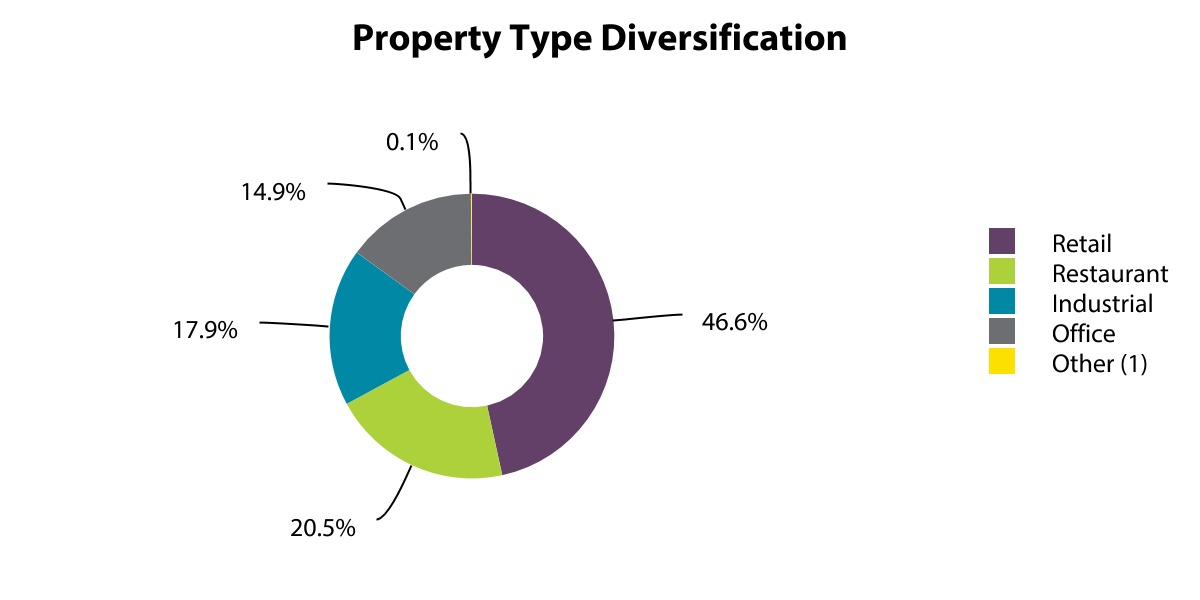
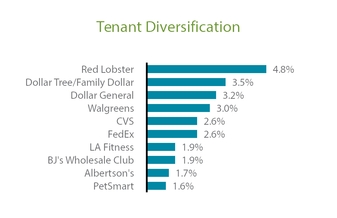
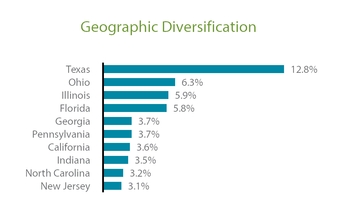
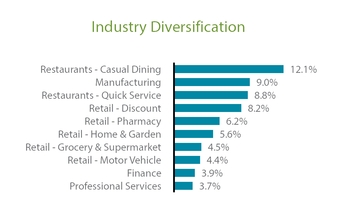
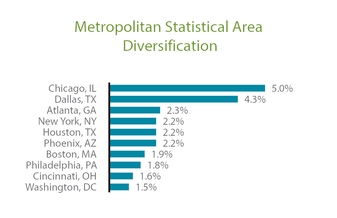
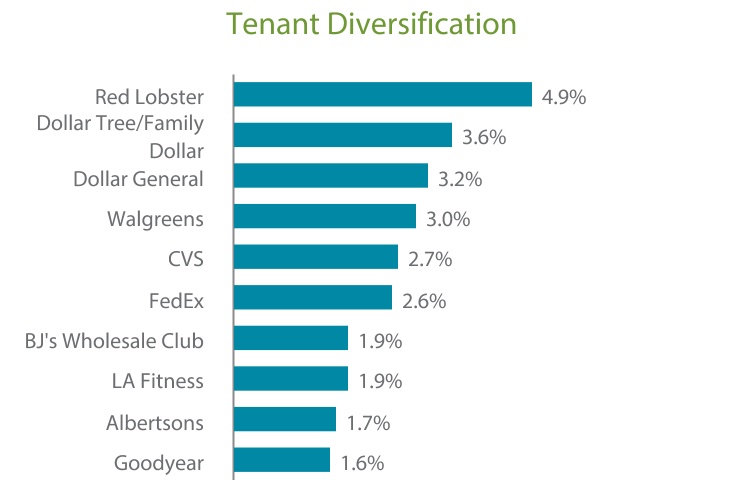
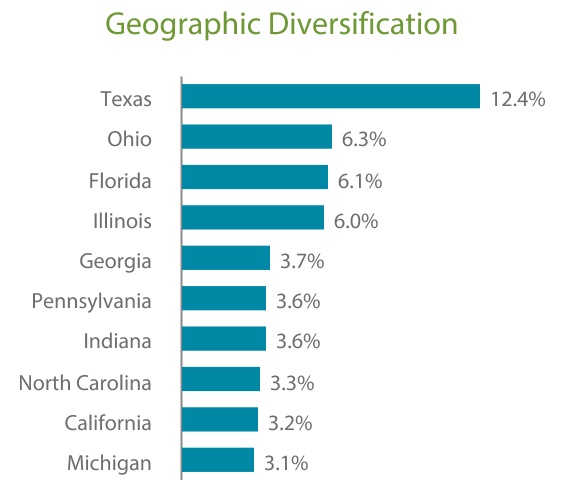
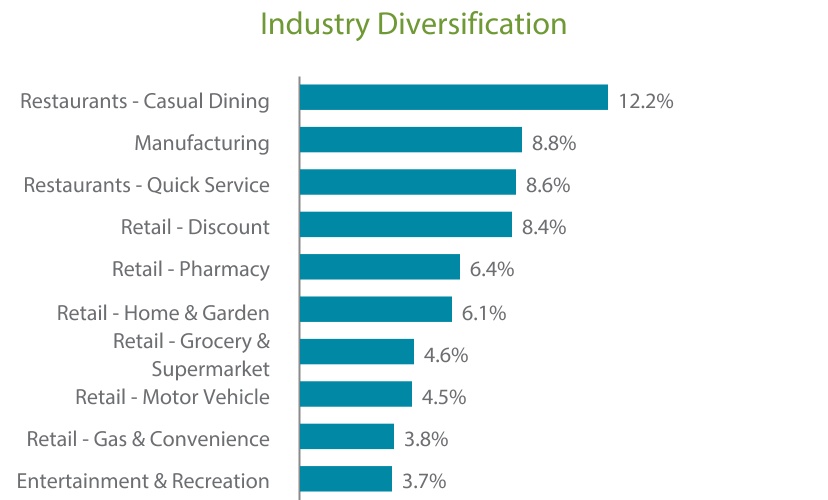
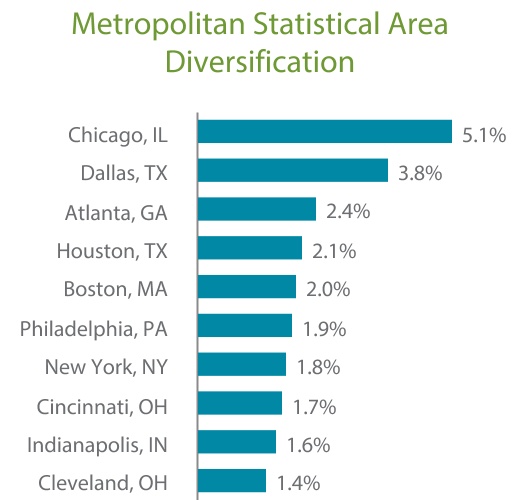
38
Our financial performance is influenced by the timing of acquisitions and dispositions and the operating performance of our operating properties. The following table shows the property statistics of our operating properties as of June 30, 2020March 31, 2021 and 2019:2020:
| June 30, 2020 | June 30, 2019 | |||
| Portfolio Metrics | ||||
| Operating properties | 3,836 | 3,950 | ||
Rentable square feet (in millions) (1) | 88.9 | 90.6 | ||
Economic occupancy rate (1)(2) | 98.8% | 99.0% | ||
Investment-grade tenants (1)(3) | 37.0% | 39.6% | ||
| March 31, 2021 | March 31, 2020 | |||||||||||||
| Portfolio Metrics | ||||||||||||||
| Operating properties | 3,855 | 3,853 | ||||||||||||
Rentable square feet (in millions) | 88.7 | 89.5 | ||||||||||||
Economic occupancy rate (1) | 98.0% | 99.1% | ||||||||||||
Investment-grade tenants (2) | 37.8% | 36.7% | ||||||||||||
| Weighted-average lease term (in years) | 8.4 | 8.3 | ||||||||||||
Lease rollover: (3) | ||||||||||||||
| Annual average | 6.5% | 6.6% | ||||||||||||
| Maximum for a single year | 11.1% | 10.9% | ||||||||||||
(1)Economic occupancy rate equals the sum of square feet leased (including space subject to month-to-month agreements) divided by rentable square feet. (2)Based on annualized rental income |
(3)Through the end of the next five years as of the respective reporting date.
| June 30, 2020 | June 30, 2019 | |||
| Economic Metrics | ||||
| Weighted-average lease term (in years) | 8.5 | 8.6 | ||
Lease rollover: (1) | ||||
| Annual average | 6.0% | 5.8% | ||
| Maximum for a single year | 10.9% | 7.7% | ||
Operating Performance
In addition, management uses the following financial metrics to assess our operating performance (dollar amounts in thousands, except per share amounts).
| Three Months Ended March 31, | ||||||||||||||||||||||||||
| 2021 | 2020 | |||||||||||||||||||||||||
| Financial Metrics | ||||||||||||||||||||||||||
| Total revenues | $ | 290,809 | $ | 299,182 | ||||||||||||||||||||||
| Net income | $ | 120,723 | $ | 86,863 | ||||||||||||||||||||||
| Basic and diluted net income per share attributable to common stockholders | $ | 0.50 | $ | 0.34 | ||||||||||||||||||||||
FFO attributable to common stockholders and limited partners (1) | $ | 178,988 | $ | 181,822 | ||||||||||||||||||||||
AFFO attributable to common stockholders and limited partners (1) | $ | 183,047 | $ | 180,974 | ||||||||||||||||||||||
AFFO attributable to common stockholders and limited partners per diluted share (1) | $ | 0.80 | $ | 0.84 | ||||||||||||||||||||||
(1)See the Non-GAAP Measures section below for descriptions of our non-GAAP measures and reconciliations to the most comparable measure in accordance with generally accepted accounting principles in the United States (“U.S. GAAP”).
39
| Three Months Ended June 30, | Six Months Ended June 30, | |||||||||||||||
| 2020 | 2019 | 2020 | 2019 | |||||||||||||
| Financial Metrics | ||||||||||||||||
| Total revenues | $ | 278,997 | $ | 312,188 | $ | 578,179 | $ | 629,068 | ||||||||
| Net income | $ | 54,239 | $ | 292,284 | $ | 141,102 | $ | 363,255 | ||||||||
| Basic and diluted net income per share attributable to common stockholders | $ | 0.04 | $ | 0.27 | $ | 0.11 | $ | 0.33 | ||||||||
FFO attributable to common stockholders and limited partners (1) | $ | 155,943 | $ | 179,038 | $ | 337,765 | $ | 369,342 | ||||||||
AFFO attributable to common stockholders and limited partners (1) | $ | 161,083 | $ | 177,099 | $ | 342,057 | $ | 355,502 | ||||||||
AFFO attributable to common stockholders and limited partners per diluted share (1) | $ | 0.15 | $ | 0.18 | $ | 0.32 | $ | 0.36 | ||||||||
Results of Operations
| April | May | June | July (1) | ||||
| Rent collection | 86% | 85% | 86% | 91% | |||
The table below sets forth, for the periods presented, revenue information and the dollar amount change year over year (in thousands):
| Three Months Ended June 30, | Six Months Ended June 30, | Three Months Ended March 31, | ||||||||||||||||||||||||||||||||||||||||||||||||||||||||||||
| 2020 | 2019 | 2020 vs 2019 Increase/(Decrease) | 2020 | 2019 | 2020 vs 2019 Increase/(Decrease) | 2021 | 2020 | 2021 vs 2020 Increase/(Decrease) | ||||||||||||||||||||||||||||||||||||||||||||||||||||||
| Revenues: | Revenues: | |||||||||||||||||||||||||||||||||||||||||||||||||||||||||||||
| Rental | $ | 278,576 | $ | 312,043 | $ | (33,467 | ) | $ | 577,162 | $ | 628,886 | $ | (51,724 | ) | Rental | $ | 290,309 | $ | 298,586 | $ | (8,277) | |||||||||||||||||||||||||||||||||||||||||
| Fees from managed partnerships | 421 | 145 | 276 | 1,017 | 182 | 835 | Fees from managed partnerships | 500 | 596 | (96) | ||||||||||||||||||||||||||||||||||||||||||||||||||||
| Total revenues | $ | 278,997 | $ | 312,188 | $ | (33,191 | ) | $ | 578,179 | $ | 629,068 | $ | (50,889 | ) | Total revenues | $ | 290,809 | $ | 299,182 | $ | (8,373) | |||||||||||||||||||||||||||||||||||||||||
Rental
The decrease in rental revenue of $33.5 million and $51.7$8.3 million during the three and six months ended June 30, 2020, respectively,March 31, 2021 as compared to the same periodsperiod in 20192020 was primarily due to real estate dispositions and rent abatementslease amendments, expirations and reserves related to COVID-19,terminations, partially offset by real estate acquisitions. Subsequent to January 1, 2019,2020, the Company acquired 91105 occupied properties for an aggregate purchase price of $550.7 million$0.5 billion and disposed of 248107 consolidated properties for an aggregate sales price of $1.4$0.7 billion.
Fees from Managed Partnerships
Fees from managed partnerships consist of fees earned for providing various services to the Company’s unconsolidated joint venture entities. The increase of $0.3 million and $0.8 millionFees from managed partnerships remained relatively constant during the three and six months ended June 30, 2020, respectively,March 31, 2021, as compared to the same periodsperiod in 2019 was due to fees earned from the industrial partnership and office partnership, which were formed subsequent to January 1, 2019.2020.
Operating Expenses
The table below sets forth, for the periods presented, certain operating expense information and the dollar amount change year over year (in thousands):
| Three Months Ended June 30, | Six Months Ended June 30, | Three Months Ended March 31, | |||||||||||||||||||||||||||||||||||||||||||||||||||||||||||||||||||||
| 2020 | 2019 | 2020 vs 2019 Increase/(Decrease) | 2020 | 2019 | 2020 vs 2019 Increase/(Decrease) | 2021 | 2020 | 2021 vs 2020 Increase/(Decrease) | |||||||||||||||||||||||||||||||||||||||||||||||||||||||||||||||
| Acquisition-related | $ | 1,169 | $ | 985 | $ | 184 | $ | 2,692 | $ | 1,970 | $ | 722 | Acquisition-related | $ | 1,354 | $ | 1,523 | $ | (169) | ||||||||||||||||||||||||||||||||||||||||||||||||||||
| Litigation and non-routine costs, net | (118 | ) | (3,769 | ) | 3,651 | (8,682 | ) | (25,261 | ) | 16,579 | Litigation and non-routine costs, net | 68 | (8,564) | 8,632 | |||||||||||||||||||||||||||||||||||||||||||||||||||||||||
| Property operating | 29,098 | 32,503 | (3,405 | ) | 59,588 | 64,881 | (5,293 | ) | Property operating | 30,605 | 30,490 | 115 | |||||||||||||||||||||||||||||||||||||||||||||||||||||||||||
| General and administrative | 16,120 | 16,416 | (296 | ) | 31,176 | 31,262 | (86 | ) | General and administrative | 14,526 | 15,056 | (530) | |||||||||||||||||||||||||||||||||||||||||||||||||||||||||||
| Depreciation and amortization | 110,599 | 118,022 | (7,423 | ) | 234,679 | 254,577 | (19,898 | ) | Depreciation and amortization | 108,075 | 124,080 | (16,005) | |||||||||||||||||||||||||||||||||||||||||||||||||||||||||||
| Impairments | 12,094 | 8,308 | 3,786 | 20,474 | 20,296 | 178 | Impairments | 31,849 | 8,380 | 23,469 | |||||||||||||||||||||||||||||||||||||||||||||||||||||||||||||
| Restructuring | — | 290 | (290 | ) | — | 9,366 | (9,366 | ) | |||||||||||||||||||||||||||||||||||||||||||||||||||||||||||||||
| Total operating expenses | $ | 168,962 | $ | 172,755 | $ | (3,793 | ) | $ | 339,927 | $ | 357,091 | $ | (17,164 | ) | Total operating expenses | $ | 186,477 | $ | 170,965 | $ | 15,512 | ||||||||||||||||||||||||||||||||||||||||||||||||||
Acquisition-Related Expenses
Acquisition-related expenses consist of allocated internal salaries related to time spent on acquiring commercial properties and costs associated with unconsummated deals. Acquisition-related expenses remained relatively constant during the three months ended March 31, 2021, as compared to the same period in 2020.
Litigation and Non-Routine Costs, Net
Litigation and non-routine costs, net increased $3.7$8.6 million during the three months ended June 30, 2020,March 31, 2021, as compared to the same period in 2019.2020. During the three months ended June 30,March 31, 2020, the Company reversed $6.7 million of prior period estimated costs accruedrecorded in 2019 which exceeded actual expenses incurred.incurred and recorded $2.5 million of insurance recoveries and $0.6 million of litigation costs. During the three months ended June 30, 2019,same period in 2021, the Company recorded $26.5 million of other recoveries related to the surrender of Limited Partner OP Units by principals of the Company’s former external manager, offset by $22.8$0.1 million of fees and costs associated with litigations.
40
Property Operating Expenses
Property operating expenses such as taxes, insurance, ground rent and maintenance include both reimbursable and non-reimbursable property expenses. The decrease in propertyProperty operating expenses of $3.4 million and $5.3 millionremained relatively constant during the three and six months ended June 30, 2020, respectively,March 31, 2021, as compared to the same periodsperiod in 2019 was primarily due to the impact of property dispositions.2020.
General and Administrative Expenses
General and administrative expenses remained relatively constant during the three and six months ended June 30, 2020March 31, 2021, as compared to the same periodsperiod in 2019.
2020.
Depreciation and Amortization Expenses
The decrease in depreciation and amortization expenses of $7.4 million and $19.9$16.0 million during the three and six months ended June 30, 2020, respectively,March 31, 2021 as compared to the same periodsperiod in 20192020 was primarily due to real estate dispositions and furniture and fixtures that were fully depreciatedthe write off of intangible lease assets related to certain properties whose tenants filed for Chapter 11 bankruptcy during 2019, as they had reached the end of their useful lives, partially offset by real estate acquisitions.three months ended March 31, 2020.
Impairments
Impairments of $12.1$31.8 million and $8.3$8.4 million were recorded during the three months ended June 30,March 31, 2021 and 2020, and 2019, respectively. Impairments of $20.5 million and $20.3 million were recorded during the six months ended June 30, 2020 and 2019, respectively. During the three and six months ended June 30, 2020,March 31, 2021, the impairment charges primarily related to certain office, retail and restaurant properties whose tenants filed for Chapter 11 bankruptcywhich were identified by management for potential sale or were determined would not be re-leased by the tenant.
Other (Expense) Income and Provision for Income Taxes
The table below sets forth, for the periods presented, certain financial information and the dollar amount change year over year (in thousands):
| Three Months Ended June 30, | Six Months Ended June 30, | Three Months Ended March 31, | ||||||||||||||||||||||||||||||||||||||||||||||||||||||||||||
| 2020 | 2019 | 2020 vs 2019 Increase/(Decrease) | 2020 | 2019 | 2020 vs 2019 Increase/(Decrease) | 2021 | 2020 | 2021 vs 2020 Increase/(Decrease) | ||||||||||||||||||||||||||||||||||||||||||||||||||||||
| Interest expense | $ | (65,613 | ) | $ | (69,803 | ) | $ | (4,190 | ) | $ | (130,309 | ) | $ | (141,057 | ) | $ | (10,748 | ) | Interest expense | $ | (60,736) | $ | (64,696) | $ | (3,960) | |||||||||||||||||||||||||||||||||||||
| Loss on extinguishment and forgiveness of debt, net | $ | (200 | ) | $ | (1,472 | ) | $ | (1,272 | ) | $ | (1,480 | ) | $ | (1,472 | ) | $ | 8 | Loss on extinguishment and forgiveness of debt, net | $ | (2,132) | $ | (1,280) | $ | 852 | ||||||||||||||||||||||||||||||||||||||
| Other income, net | $ | 778 | $ | 3,030 | $ | (2,252 | ) | $ | 953 | $ | 2,591 | $ | (1,638 | ) | Other income, net | $ | 3,666 | $ | 175 | $ | 3,491 | |||||||||||||||||||||||||||||||||||||||||
| Equity in income of unconsolidated entities | $ | 1,497 | $ | 505 | $ | 992 | $ | 1,743 | $ | 1,005 | $ | 738 | Equity in income of unconsolidated entities | $ | 447 | $ | 246 | $ | 201 | |||||||||||||||||||||||||||||||||||||||||||
| Gain on disposition of real estate and real estate assets held for sale, net | $ | 8,795 | $ | 221,755 | $ | (212,960 | ) | $ | 34,044 | $ | 232,586 | $ | (198,542 | ) | Gain on disposition of real estate and real estate assets held for sale, net | $ | 76,074 | $ | 25,249 | $ | 50,825 | |||||||||||||||||||||||||||||||||||||||||
| Provision for income taxes | $ | (1,053 | ) | $ | (1,164 | ) | $ | (111 | ) | $ | (2,101 | ) | $ | (2,375 | ) | $ | (274 | ) | Provision for income taxes | $ | (928) | $ | (1,048) | $ | (120) | |||||||||||||||||||||||||||||||||||||
Interest Expense
The decrease in interest expense of $4.2 million and $10.7$4.0 million during the three and six months ended June 30, 2020, respectively,March 31, 2021 as compared to the same periodsperiod in 20192020 was primarily due to decreasesa decrease in average debt outstanding and weighted average interest rates. At June 30, 2020,March 31, 2021, the Company had $5.6 billion of debt outstanding with a weighted average interest rate was 4.20%of 3.90%, as compared to 4.52%$6.3 billion of debt outstanding with a weighted average interest rate of 3.96% at June 30, 2019.March 31, 2020.
Loss on Extinguishment and Forgiveness of Debt, Net
Other Income, Net
The decreaseincrease of $2.3 million and $1.6$3.5 million in other income, net during the three and six months ended June 30, 2020, respectively,March 31, 2021 as compared to the same periodsperiod in 20192020 was primarily due to a $2.5gain of $2.0 million paymentrecorded for real estate investments received from lease related transactions in 2019 related to the Company’s bankruptcy claim related to a prior tenant,2021, with no comparable payments received during the same period in 2020.
Equity in Income of Unconsolidated Entities
The increase in equity in income of $1.0 million and $0.7 million during the three and six months ended June 30, 2020, respectively, as compared to the same periods in 2019, was primarily due to increased equitythe acquisition of one property in income fromeach of the industrial partnership and office partnership.partnerships subsequent to March 31, 2020.
41
Gain on Disposition of Real Estate and Real Estate Assets Held for Sale, Net
The decreaseincrease in gain on disposition of real estate and real estate assets held for sale, net of $213.0$50.8 million during the three months ended June 30, 2020,March 31, 2021, as compared to the same period in 20192020 was due to the Company’s disposition of 1730 properties for an aggregate sales price of $67.0$261.0 million which resulted in a gain of $9.0$76.1 million during the three months ended June 30, 2020,March 31, 2021, as compared to the disposition of 5330 properties for an aggregate sales price of $743.2$152.2 million during the same period in 2019,2020, which resulted in a gain of $222.5$25.2 million. During the three months ended June 30, 2020, the Company also recorded $0.2 million of losses related to held for sale properties, as compared to $0.8 million of losses during the same period in 2019.
Provision for Income Taxes
The provision for income taxes consists of certain state and local income and franchise taxes. The provision for income taxes remained relatively constant during the three months ended March 31, 2021, as compared to the same period in 2020.
42
Non-GAAP Measures
Our results are presented in accordance with U.S. GAAP. We also disclose certain non-GAAP measures, as discussed further below. Management uses these non-GAAP financial measures in our internal analysis of results and believes these measures are useful to investors for the reasons explained below. These non-GAAP financial measures should not be considered as substitutes for any measures derived in accordance with U.S. GAAP.
Funds from Operations and Adjusted Funds from Operations
Due to certain unique operating characteristics of real estate companies, as discussed below, the National Association of Real Estate Investment Trusts, Inc. (“Nareit”), an industry trade group, has promulgated a supplemental performance measure known as funds from operations (“FFO”), which we believe to be an appropriate supplemental performance measure to reflect the operating performance of a REIT. FFO is not equivalent to our net income or loss as determined under U.S. GAAP.
Nareit defines FFO as net income or loss computed in accordance with U.S. GAAP adjusted for gains or losses from disposition of property, depreciation and amortization of real estate assets, impairment write-downs on real estate, and our pro rata share of FFO adjustments related to unconsolidated partnerships and joint ventures. We calculate FFO in accordance with Nareit’s definition described above.
In addition to FFO, we use adjusted funds from operations (“AFFO”) as a non-GAAP supplemental financial performance measure to evaluate the operating performance of the Company. AFFO, as defined by the Company, excludes from FFO non-routine items such as acquisition-related expenses, litigation and non-routine costs, net net revenue or expense earned or incurred that is related to the services agreement associated with a discontinued operation,and gains or losses on sale of investment securities or mortgage notes receivable, payments on fully reserved loan receivables and restructuring expenses.receivable. We also exclude certain non-cash items such as impairments of goodwill, intangible and intangibleright of use assets, straight-line rent, net direct financing lease adjustments, gains or losses on derivatives, reserves for loan loss, gains or losses on the extinguishment or forgiveness of debt, non-current portion of the tax benefit or expense, equity-based compensation and amortization of intangible assets, deferred financing costs, premiums and discounts on debt and investments, above-market lease assets and below-market lease liabilities. We omit the impact of the Excluded Properties and related non-recourse mortgage notes from FFO to calculate AFFO. Management believes that excluding these costsitems from FFO provides investors with supplemental performance information that is consistent with the performance models and analysis used by management, and provides investors a view of the performance of our portfolio over time. AFFO allows for a comparison of the performance of our operations with other publicly-traded REITs, as AFFO, or an equivalent measure, is routinely reported by publicly-traded REITs, and we believe often used by analysts and investors for comparison purposes.
For all of these reasons, we believe FFO and AFFO, in addition to net income (loss), as defined by U.S. GAAP, are helpful supplemental performance measures and useful in understanding the various ways in which our management evaluates the performance of the Company over time. However, not all REITs calculate FFO and AFFO the same way, so comparisons with other REITs may not be meaningful. FFO and AFFO should not be considered as alternatives to net income (loss) and are not intended to be used as a liquidity measure indicative of cash flow available to fund our cash needs. Neither the U.S. Securities and Exchange Commission (the “SEC”), Nareit, nor any other regulatory body has evaluated the acceptability of the exclusions used to adjust FFO in order to calculate AFFO and its use as a non-GAAP financial performance measure.
43
The table below presents FFO and AFFO for the three and six months ended June 30,March 31, 2021 and 2020 and 2019 (in thousands, except share and per share data):
| Three Months Ended June 30, | Six Months Ended June 30, | Three Months Ended March 31, | ||||||||||||||||||||||||||||||||||||||||||||||
| 2020 | 2019 | 2020 | 2019 | 2021 | 2020 | |||||||||||||||||||||||||||||||||||||||||||
| Net income | $ | 54,239 | $ | 292,284 | $ | 141,102 | $ | 363,255 | Net income | $ | 120,723 | $ | 86,863 | |||||||||||||||||||||||||||||||||||
| Dividends on Series F Preferred Stock | (12,948 | ) | (17,973 | ) | (25,896 | ) | (35,946 | ) | Dividends on Series F Preferred Stock | (6,525) | (12,948) | |||||||||||||||||||||||||||||||||||||
| Gain on disposition of real estate assets and interests in unconsolidated joint ventures, net | (8,795 | ) | (221,762 | ) | (34,044 | ) | (232,593 | ) | Gain on disposition of real estate assets and interests in unconsolidated joint ventures, net | (76,074) | (25,249) | |||||||||||||||||||||||||||||||||||||
| Depreciation and amortization of real estate assets | 110,207 | 117,616 | 233,852 | 253,477 | Depreciation and amortization of real estate assets | 107,700 | 123,645 | |||||||||||||||||||||||||||||||||||||||||
| Impairment of real estate | 12,094 | 8,308 | 20,474 | 20,296 | Impairment of real estate | 31,849 | 8,380 | |||||||||||||||||||||||||||||||||||||||||
| Proportionate share of adjustments for unconsolidated entities | 1,146 | 565 | 2,277 | 853 | Proportionate share of adjustments for unconsolidated entities | 1,315 | 1,131 | |||||||||||||||||||||||||||||||||||||||||
| FFO attributable to common stockholders and limited partners | 155,943 | 179,038 | 337,765 | 369,342 | FFO attributable to common stockholders and limited partners | 178,988 | 181,822 | |||||||||||||||||||||||||||||||||||||||||
| Acquisition-related expenses | 1,169 | 985 | 2,692 | 1,970 | Acquisition-related expenses | 1,354 | 1,523 | |||||||||||||||||||||||||||||||||||||||||
| Litigation and non-routine costs, net | (118 | ) | (3,769 | ) | (8,682 | ) | (25,261 | ) | Litigation and non-routine costs, net | 68 | (8,564) | |||||||||||||||||||||||||||||||||||||
| Loss (gain) on investments | 142 | (5 | ) | 683 | 465 | |||||||||||||||||||||||||||||||||||||||||||
| Loss on derivative instruments, net | — | 24 | — | 58 | ||||||||||||||||||||||||||||||||||||||||||||
| Amortization of premiums and discounts on debt and investments, net | (362 | ) | (1,392 | ) | (1,051 | ) | (2,656 | ) | ||||||||||||||||||||||||||||||||||||||||
| (Gain) loss on investments | (Gain) loss on investments | (695) | 541 | |||||||||||||||||||||||||||||||||||||||||||||
| Amortization of premiums (discounts) on debt and investments, net | Amortization of premiums (discounts) on debt and investments, net | 87 | (689) | |||||||||||||||||||||||||||||||||||||||||||||
| Amortization of above-market lease assets and deferred lease incentives, net of amortization of below-market lease liabilities | 788 | 611 | 1,536 | 1,342 | Amortization of above-market lease assets and deferred lease incentives, net of amortization of below-market lease liabilities | 1,547 | 748 | |||||||||||||||||||||||||||||||||||||||||
| Net direct financing lease adjustments | 372 | 410 | 737 | 819 | Net direct financing lease adjustments | 366 | 365 | |||||||||||||||||||||||||||||||||||||||||
| Amortization and write-off of deferred financing costs | 2,898 | 3,346 | 5,739 | 6,840 | Amortization and write-off of deferred financing costs | 2,555 | 2,841 | |||||||||||||||||||||||||||||||||||||||||
| Loss on extinguishment and forgiveness of debt, net | 200 | 1,472 | 1,480 | 1,472 | Loss on extinguishment and forgiveness of debt, net | 2,132 | 1,280 | |||||||||||||||||||||||||||||||||||||||||
| Straight-line rent | (3,404 | ) | (8,043 | ) | (5,458 | ) | (15,455 | ) | Straight-line rent | (4,219) | (2,054) | |||||||||||||||||||||||||||||||||||||
| Equity-based compensation | 3,857 | 3,706 | 6,459 | 6,393 | Equity-based compensation | 2,669 | 2,602 | |||||||||||||||||||||||||||||||||||||||||
| Restructuring expenses | — | 290 | — | 9,366 | ||||||||||||||||||||||||||||||||||||||||||||
| Other adjustments, net | 441 | 617 | 669 | 1,186 | Other adjustments, net | (1,661) | 228 | |||||||||||||||||||||||||||||||||||||||||
| Proportionate share of adjustments for unconsolidated entities | (843 | ) | (196 | ) | (512 | ) | (384 | ) | Proportionate share of adjustments for unconsolidated entities | (144) | 331 | |||||||||||||||||||||||||||||||||||||
| Adjustments for Excluded Properties | — | 5 | — | 5 | ||||||||||||||||||||||||||||||||||||||||||||
AFFO attributable to common stockholders and limited partners (1) | $ | 161,083 | $ | 177,099 | $ | 342,057 | $ | 355,502 | ||||||||||||||||||||||||||||||||||||||||
| AFFO attributable to common stockholders and limited partners | AFFO attributable to common stockholders and limited partners | $ | 183,047 | $ | 180,974 | |||||||||||||||||||||||||||||||||||||||||||
| Weighted-average shares of Common Stock outstanding - basic | 1,078,366,566 | 973,723,139 | 1,078,152,183 | 971,106,256 | Weighted-average shares of Common Stock outstanding - basic | 229,159,472 | 215,587,560 | |||||||||||||||||||||||||||||||||||||||||
Effect of weighted-average Limited Partner OP Units and dilutive securities (2) | 1,186,500 | 26,054,596 | 1,370,957 | 25,636,664 | ||||||||||||||||||||||||||||||||||||||||||||
Weighted-average shares of Common Stock outstanding - diluted (3) | 1,079,553,066 | 999,777,735 | 1,079,523,140 | 996,742,920 | ||||||||||||||||||||||||||||||||||||||||||||
Effect of weighted-average Limited Partner OP Units and dilutive securities (1) | Effect of weighted-average Limited Partner OP Units and dilutive securities (1) | 270,395 | 362,688 | |||||||||||||||||||||||||||||||||||||||||||||
Weighted-average shares of Common Stock outstanding - diluted (2) | Weighted-average shares of Common Stock outstanding - diluted (2) | 229,429,867 | 215,950,248 | |||||||||||||||||||||||||||||||||||||||||||||
| AFFO attributable to common stockholders and limited partners per diluted share | $ | 0.15 | $ | 0.18 | $ | 0.32 | $ | 0.36 | AFFO attributable to common stockholders and limited partners per diluted share | $ | 0.80 | $ | 0.84 | |||||||||||||||||||||||||||||||||||
(1) | (2)Weighted-average shares for all periods presented exclude the effect of the convertible debt, which was fully repaid in cash as of December 31, 2020 and the underlying Restricted Stock Units that would not have met the vesting criteria based on certain performance targets as of the end of the respective reporting period. 44 |
Liquidity and Capital Resources
General
Our principal liquidity needs for the next twelve months and beyond are to:
•fund normal operating expenses;
•fund potential capital expenditures, tenant improvements and leasing costs;
•meet debt service and principal repayment obligations, including balloon payments on maturing debt;
•pay dividends; and
•fund property acquisitions.
We expect to be able to satisfy these obligations using one or more of the following sources:
•cash flow from operations;
•proceeds from real estate dispositions;
•utilization of the existing Revolving Credit Facility; and
•cash and cash equivalents balance; and
COVID-19
Disposition Activity
As part of our effort to optimize our real estate portfolio by focusing on holding core assets, during the sixthree months ended June 30, 2020,March 31, 2021, the Company disposed of 4730 properties including the sale of two consolidated properties to the office partnership, for an aggregate gross sales price of $219.2 million, of which our share was $216.7 million, resulting in proceeds of $204.1 million after closing costs and contributions to the office partnership.$261.0 million. We expect to continue to explore opportunities to sell additional properties to provide further financial flexibility, however, due to current economic circumstances, we may not be able to dispose of properties on advantageous terms or at all.
Credit Facility
Summary and Obligations
On May 23, 2018, the General Partner, as guarantor, and the OP, as borrower, entered into a credit agreement with Wells Fargo Bank, National Association as administrative agent and other lenders party thereto (the “Credit Agreement”). The Credit Agreement provided for maximum borrowings of $2.9 billion, originally consisting of a $2.0 billion unsecured revolving credit facility (the “Revolving Credit Facility”) and a $900.0 million unsecured term loan facility (the “Credit Facility Term Loan,” together with the Revolving Credit Facility, the “Credit Facility”). Effective December 27, 2019, the Company reduced the amount available under its Revolving Credit Facility from $2.0 billion to $1.5 billion. On May 27, 2020, the Operating Partnership and the Company, entered into Amendment No. 1 to the Credit Agreement (the “Amendment”) which, among other things, modifiesmodified the measurement period for certain financial covenants (and relevant associated definitions) from either the prior quarterly period annualized or the prior six month period to the four consecutive fiscal quarter period most recently ending. During the fourth quarter of 2020, the Company repaid the outstanding balance of $900.0 million on the Credit Facility Term Loan in connection with the termination of the related interest rate swap agreements discussed in Note 7 – Derivatives and Hedging Activities.
As of June 30, 2020,March 31, 2021, no amounts were outstanding under the Revolving Credit Facility and the full $900.0 million was drawn on the Credit Facility Term Loan.Facility. The maximum aggregate dollar amount of letters of credit that may be outstanding at any one time under the Credit Facility is $50.0 million. As of June 30, 2020,March 31, 2021, there were no$2.6 million of letters of credit outstanding.
45
The Revolving Credit Facility generally bears interest at an annual rate of LIBOR plus 0.775% to 1.55% or Base Rate plus 0.00% to 0.55% (based upon the General Partner’s then current credit rating). “Base Rate” is defined as the highest of the prime rate, the federal funds rate plus 0.50% or a floating rate based on one month LIBOR plus 1.0%, determined on a daily basis. The Credit Facility Term Loan generally bearsbore interest at an annual rate of LIBOR plus 0.85% to 1.75%, or Base Rate plus 0.00% to 0.75% (based upon the General Partner’s then current credit rating). In addition, the Credit Agreement provides the flexibility for interest rate auctions, pursuant to which, at the Company’s election, the Company may request that lenders make competitive bids to provide revolving loans, which competitive bids may be at pricing levels that differ from the foregoing interest rates.
Credit Facility Covenants
The Credit Facility requires restrictions on corporate guarantees, as well as the maintenance of certain financial covenants. The key financial covenants in the Credit Facility, as defined and calculated per the terms of the Credit Agreement include maintaining the following:
| Unsecured Credit Facility Key Covenants | Required | |||||||||||||
| Ratio of total indebtedness to total asset value | ≤ 60% | |||||||||||||
| Ratio of adjusted EBITDA to fixed charges | ≥ 1.5x | |||||||||||||
| Ratio of secured indebtedness to total asset value | ≤ 45% | |||||||||||||
| Ratio of unsecured indebtedness to unencumbered asset value | ≤ 60% | |||||||||||||
| Ratio of unencumbered adjusted NOI to unsecured interest expense | ≥ 1.75x | |||||||||||||
The Company believes that it was in compliance with the financial covenants pursuant to the Credit Agreement and is not restricted from accessing any borrowing availability under the Credit Facility as of June 30, 2020.March 31, 2021.
Corporate Bonds
Summary and Obligations
As of June 30, 2020,March 31, 2021, the Operating Partnership had $3.45$4.65 billion aggregate principal amount of Senior Notes outstanding. The indenture governing the Senior Notes requires that the Company be in compliance with certain key financial covenants, including maintaining the following:
| Corporate Bond Key Covenants | Required | |||||||||||||
| Limitation on incurrence of total debt | ≤ 65% | |||||||||||||
| Limitation on incurrence of secured debt | ≤ 40% | |||||||||||||
| Debt service coverage ratio | ≥ 1.5x | |||||||||||||
| Maintenance of total unencumbered assets | ≥ 150% | |||||||||||||
As of June 30, 2020,March 31, 2021, the Company believes that it was in compliance with these financial covenants based on the covenant limits and calculations in place at that time.
Mortgage Notes Payable
Summary and Obligations
As of June 30, 2020,March 31, 2021, the Company had mortgage notes payable of $1.4$1.0 billion, which was collateralized by 314219 properties, reflecting a decrease from December 31, 20192020 of $132.6$292.8 million during the sixthree months ended June 30, 2020,March 31, 2021, primarily related to prepayments of mortgage notes payable. Our mortgage indebtedness bore interest at the weighted-average rate of 5.00%4.87% per annum and had a weighted-average maturity of 2.52.3 years. We may in the future incur additional mortgage debt on the properties we currently own or use long-term non-recourse financing to acquire additional properties.
The payment terms of our loan obligations vary. In general, only interest amounts are payable monthly with all unpaid principal and interest due at maturity. Some of our loan agreements require that we comply with specific reporting and financial covenants mainly related to debt coverage ratios and loan-to-value ratios. Each loan that has these requirements has specific ratio thresholds that must be met.
46
Restrictions on Loan Covenants
Our mortgage loan obligations generally restrict corporate guarantees and require the maintenance of financial covenants, including maintenance of certain financial ratios (such as specified debt to equity and debt service coverage ratios), as well as the maintenance of a minimum net worth. The mortgage loan agreements contain no dividend restrictions except in the event of default or when a distribution would drive liquidity below the applicable thresholds. The Company believes that it was in compliance with the financial covenants under the mortgage loan agreements and had no restrictions on the payment of dividends as of June 30, 2020.March 31, 2021.
Dividends
On May 18, 2020,February 23, 2021, the Company’s Board of Directors reduced thedeclared a quarterly cash dividend infor the secondfirst quarter of 2020 to $0.0772021 of $0.462 per share of Common Stock to stockholders of record as of June 30, 2020,March 31, 2021, which was paid on JulyApril 15, 2020 in an effort to minimize debt due to current economic uncertainty.2021. An equivalent distribution by the Operating Partnership is applicable per OP Unit.
Our Series F Preferred Stock, as discussed in Note 12 – Equity to our consolidated financial statements, will pay cumulative cash dividends at the rate of 6.70% per annum on their liquidation preference of $25.00 per share (equivalent to $1.675 per share on an annual basis).
On May 4, 2021, the Company’s Board of Directors declared a quarterly cash dividend for the second quarter of 2021 of $0.462 per share of Common Stock consistent with last quarter’s dividend. The dividend will be paid on July 15, 2021 to Common Stock stockholders of record as of June 30, 2021. An equivalent distribution by the Operating Partnership is applicable per OP Unit.
Partial Redemptions of Series F Preferred Stock and Series F Preferred OP Units
During the three months ended March 31, 2021, the Company redeemed a total of 4.0 million shares of Series F Preferred Stock, representing approximately 21.20% of the issued and outstanding shares of Series F Preferred Stock as of the beginning of 2021. The shares of Series F Preferred Stock were redeemed at a redemption price of $25.00 per share. As of March 31, 2021, there were approximately 14.9 million shares of Series F Preferred Stock, approximately 14.9 million corresponding General Partner Series F Preferred Units and 49,766 Limited Partner Series F Preferred Units issued and outstanding.
Common Stock Continuous Offering Program
The New ATM Program replaced the Company’s prior continuous equity offering program, which was effective April 15, 2019 (the “Prior ATM Program” and collectively with the New ATM Program, the “ATM Program”). The proceeds from any sale of shares under the ATM Program have been orand will be used for general corporate purposes, which may include funding potential acquisitions and repurchasing or repaying outstanding indebtedness.
Share Repurchase Program
The Company has a share repurchase program (the “2019 Share“Share Repurchase Program”) that permits the Company to repurchase up to $200.0 million of its outstanding Common Stock through May 6, 2022. Under the 2019 Share Repurchase Program, repurchases can be made through open market purchases, privately negotiated transactions, structured or derivative transactions, including accelerated stock repurchase transactions, or other methods of acquiring shares in accordance with applicable securities laws and other legal requirements. The 2019 Share Repurchase Program program does not obligate the Company to make any repurchases at a specific time or in a specific situation and repurchases are influenced by prevailing market conditions, the trading price of the Common Stock, the Company’s financial performance and other conditions. Shares of Common Stock repurchased by the Company under the 2019 Share Repurchase Program, program, if any, will be returned to the status of authorized but unissued shares of Common Stock.
47
Contractual Obligations
The following is a summary of our contractual obligations as of June 30, 2020March 31, 2021 (in thousands):
| Payments due by period | ||||||||||||||||||||||||||||||||
| Total | Less than 1 year | 1-3 years | 4-5 years | More than 5 years | ||||||||||||||||||||||||||||
| Principal payments - mortgage notes | $ | 1,040,389 | $ | 48,985 | $ | 984,439 | $ | 2,216 | $ | 4,749 | ||||||||||||||||||||||
Interest payments - mortgage notes (1) | 114,468 | 37,219 | 76,122 | 640 | 487 | |||||||||||||||||||||||||||
| Principal payments - corporate bonds | 4,650,000 | — | 500,000 | 1,150,000 | 3,000,000 | |||||||||||||||||||||||||||
| Interest payments - corporate bonds | 1,097,662 | 128,503 | 493,250 | 249,936 | 225,973 | |||||||||||||||||||||||||||
| Operating and ground lease commitments | 302,807 | 16,140 | 61,590 | 37,888 | 187,189 | |||||||||||||||||||||||||||
Other commitments (2) | 10,426 | 10,426 | — | — | — | |||||||||||||||||||||||||||
| Total | $ | 7,215,752 | $ | 241,273 | $ | 2,115,401 | $ | 1,440,680 | $ | 3,418,398 | ||||||||||||||||||||||
| Payments due by period | ||||||||||||||||||||
| Total | Less than 1 year | 1-3 years | 4-5 years | More than 5 years | ||||||||||||||||
| Principal payments - mortgage notes | $ | 1,396,432 | $ | 78,261 | $ | 565,966 | $ | 745,238 | $ | 6,967 | ||||||||||
Interest payments - mortgage notes (1) | 170,026 | 35,200 | 100,545 | 33,154 | 1,127 | |||||||||||||||
| Principal payments - Credit Facility | 900,000 | — | — | 900,000 | — | |||||||||||||||
Interest payments - Credit Facility (1) (2) | 88,217 | 16,504 | 65,479 | 6,234 | — | |||||||||||||||
| Principal payments - corporate bonds | 3,450,000 | — | — | 500,000 | 2,950,000 | |||||||||||||||
| Interest payments - corporate bonds | 890,167 | 70,194 | 280,776 | 260,012 | 279,185 | |||||||||||||||
| Principal payments - convertible debt | 271,633 | 271,633 | — | — | — | |||||||||||||||
| Interest payments - convertible debt | 4,640 | 4,640 | — | — | — | |||||||||||||||
| Operating and ground lease commitments | 324,533 | 10,751 | 44,028 | 42,638 | 227,116 | |||||||||||||||
| Build-to-suit commitments | 21,421 | 21,421 | — | — | — | |||||||||||||||
| Total | $ | 7,517,069 | $ | 508,604 | $ | 1,056,794 | $ | 2,487,276 | $ | 3,464,395 | ||||||||||
(2)Includes the Company’s build-to-suit development project and letters of credit outstanding.
48
Cash Flow Analysis for the sixthree months ended June 30, 2020March 31, 2021
Operating Activities – During the sixthree months ended June 30, 2020,March 31, 2021, net cash provided by operating activities, decreased $27.0remained relatively constant, increasing $8.1 million to $321.0$180.1 million from $348.0$172.0 million during the same period in 2019. The decrease was primarily due to a decrease in cash insurance recoveries received of $45.9 million, an increase of $23.2 million in tenant receivables, net of reserves and the abatement of $11.2 million of rental revenue, offset by a decrease in cash interest payments of $21.1 million, a decrease in litigation settlement payments of $27.9 million and a decrease in restructuring expenses paid of $5.3 million during the six months ended June 30, 2020.
Investing Activities – Net cash provided by investing activities for the sixthree months ended June 30, 2020 decreased $504.8March 31, 2021 increased $126.3 million to $18.2$106.6 million from $523.0$19.7 million net cash used in investing activities during the same period in 2019.2020. The decreaseincrease was primarily related to a decreasean increase in cash proceeds from dispositions of real estate and joint ventures of $535.8$113.1 million offset by an increaseand a decrease in cash used for investments in real estate assets of $44.4$7.2 million.
Financing Activities – Net cash used in financing activities of $72.9$492.8 million decreased $619.6increased $926.2 million during the sixthree months ended June 30, 2020March 31, 2021 from $692.5$433.4 million net cash provided by financing activities during the same period in 2019. The decrease was primarily due to2020. During the issuance of $600.0three months ended March 31, 2021, the Company repaid $295.9 million of Senior Notes duringmortgage notes payable, redeemed $100.0 million of Series F Preferred Stock and paid $96.6 million of distributions. During the sixthree months ended June 30, 2020.March 31, 2020, the Company received $721.3 million net proceeds from the Credit Facility, repaid $123.6 million of mortgage notes payable and paid $162.7 million of distributions.
Election as a REIT
The General Partner elected to be taxed as a REIT for U.S. federal income tax purposes under Sections 856 through 860 of the Internal Revenue Code of 1986, as amended, commencing with the taxable year ended December 31, 2011. As a REIT, except as discussed below, the General Partner generally is not subject to federal income tax on taxable income that it distributes to its stockholders so long as it distributes at least 90% of its annual taxable income (computed without regard to the deduction for dividends paid and excluding net capital gains). REITs are subject to a number of other organizational and operational requirements. Even if the General Partner maintains its qualification for taxation as a REIT, it may be subject to certain state and local taxes on its income and property, federal income taxes on certain income and excise taxes on its undistributed income. We believe we are organized and operating in such a manner as to qualify to be taxed as a REIT for the taxable year ended December 31, 2020.2021.
The Operating Partnership is classified as a partnership for U.S. federal income tax purposes. As a partnership, the Operating Partnership is not a taxable entity for U.S. federal income tax purposes. Instead, each partner in the Operating Partnership is required to take into account its allocable share of the Operating Partnership’s income, gains, losses, deductions and credits for each taxable year. However, the Operating Partnership may be subject to certain state and local taxes on its income and property. Under the limited partnership agreement of the OP, as amended (the “LPA”), the Operating Partnership is required to conduct business in such a manner as to permit the General Partner at all times to qualify as a REIT.
The Company conducts all of its business in the United States and Puerto Rico and, as a result, it files income tax returns in the U.S. federal jurisdiction, Puerto Rico, and various state and local jurisdictions. Certain of the Company’s inter-company transactions that have been eliminated in consolidation for financial accounting purposes are also subject to taxation.
Inflation
We may be adversely impacted by inflation on any leases that do not contain indexed escalation provisions. However, net leases that require the tenant to pay its allocable share of operating expenses, including common area maintenance costs, real estate taxes and insurance, may reduce our exposure to increases in costs and operating expenses resulting from inflation.
Off-Balance Sheet Arrangements
We have no material off-balance sheet arrangements that have had or are reasonably likely to have a current or future effect on our financial condition, changes in financial condition, revenues or expenses, results of operations, liquidity, capital expenditures or capital resources.
49
Critical Accounting Policies and Significant Accounting Estimates
Our accounting policies have been established to conform with U.S. GAAP. The preparation of financial statements in conformity with U.S. GAAP requires us to use judgment in the application of accounting policies, including making estimates and assumptions. These judgments affect the reported amounts of assets and liabilities and disclosure of contingent assets and liabilities at the dates of the financial statements and the reported amounts of revenue and expenses during the reporting periods. Management believes that we have made these estimates and assumptions in an appropriate manner and in a way that accurately reflects our financial condition. We continually test and evaluate these estimates and assumptions using our historical knowledge of the business, as well as other factors, to ensure that they are reasonable for reporting purposes. However, actual results may differ from these estimates and assumptions. If our judgment or interpretation of the facts and circumstances relating to the various transactions had been different, it is possible that different accounting policies would have been applied, thus resulting in a different presentation of the financial statements. Additionally, other companies may utilize different assumptions or estimates that may impact comparability of our results of operations to those of companies in similar businesses. We believe the following critical accounting policies govern the significant judgments and estimates used in the preparation of our financial statements, which should be read in conjunction with the more complete discussion of our accounting policies and procedures included in our Annual Report on Form 10-K for the year ended December 31, 2019:2020:
•Goodwill Impairment;
•Real Estate Investment Impairment; and
•Allocation of Purchase Price of Real Estate Assets
Item 3. Quantitative and Qualitative Disclosures About Market Risk.
Market Risk
The market risk associated with financial instruments and derivative financial instruments is the risk of loss from adverse changes in market prices or interest rates. Our market risk arises primarily from interest rate risk relating to variable-rate borrowings. To meet our short and long-term liquidity requirements, we borrow funds at a combination of fixed and variable rates. Our interest rate risk management objectives are to limit the impact of interest rate changes on earnings and cash flows and to manage our overall borrowing costs. To achieve these objectives, from time to time, we may enter into interest rate hedge contracts such as swaps, caps, collars, treasury locks, options and forwards in order to mitigate our interest rate risk with respect to various debt instruments. We would not hold or issue these derivative contracts for trading or speculative purposes.
Interest Rate Risk
As of June 30, 2020,March 31, 2021, our debt included fixed-rate debt, including debt that has interest rates that are fixed with the use of derivative instruments, with a fair value and carrying value of $6.2$6.0 billion and $6.0$5.6 billion, respectively. Changes in market interest rates on our fixed rate debt impact the fair value of the debt, but they have no impact on interest incurred or cash flow. For instance, if interest rates rise 100 basis points, and the fixed rate debt balance remains constant, we expect the fair value of our debt to decrease, the same way the price of a bond declines as interest rates rise. The sensitivity analysis related to our fixed-rate debt assumes an immediate 100 basis point move in interest rates from their June 30, 2020March 31, 2021 levels, with all other variables held constant. A 100 basis point increase in market interest rates would result in a decrease in the fair value of our fixed rate debt of $231.2$305.4 million. A 100 basis point decrease in market interest rates would result in an increase in the fair value of our fixed-rate debt of $247.0$329.0 million.
As of June 30, 2020,March 31, 2021, our debt included variable-rate debt with a fair value and carrying value of $15.3$15.1 million and $15.2
$15.0 million, respectively. The sensitivity analysis related to our variable-rate debt assumes an immediate 100 basis point move in interest rates from their June 30, 2020March 31, 2021 levels, with all other variables held constant. A 100 basis point increase or decrease in variable interest rates on our variable-rate debt would increase or decrease our interest expense by $0.2 million annually. See Note 6 –Debt to our consolidated financial statements.
As the information presented above includes only those exposures that existed as of June 30, 2020,March 31, 2021, it does not consider exposures or positions arising after that date. The information presented herein has limited predictive value. Future actual realized gains or losses with respect to interest rate fluctuations will depend on cumulative exposures, hedging strategies employed and the magnitude of the fluctuations.
These amounts were determined by considering the impact of hypothetical interest rate changes on our borrowing costs and assume no other changes in our capital structure.
50
In July 2017, the Financial Conduct Authority (“FCA”) announced it intends to stop compelling banks to submit rates for the calculation of LIBOR after 2021. The Company is not able to predict when LIBOR will cease to be available or when there will be sufficient liquidity in the Secured Overnight Financing Rate (“SOFR”) markets. The Company has contracts that are indexed to LIBOR and is monitoring and evaluating the related risks, which include interest amounts on our variable rate debt as discussed in Note 6 –Debt and the swap rate for our interest rate swaps, as discussed in Note 7 –Derivatives and Hedging Activities. Debt. See Item 1A. Risk Factors included in the Company’s Annual Report on Form 10-K for further discussion on risks related to changes in LIBOR reporting practices, the method in which LIBOR is determined, or the use of alternative reference rates.
Credit Risk
Concentrations of credit risk arise when a number of tenants are engaged in similar business activities, or activities in the same geographic region, or have similar economic features that would cause their ability to meet contractual obligations, including those to the Company, to be similarly affected by changes in economic conditions. The Company is subject to tenant, geographic and industry concentrations. Any downturn of the economic conditions in one or more of these tenants, geographies or industries could result in a material reduction of our cash flows or material losses to us.
The factors considered in determining the credit risk of our tenants include, but are not limited to: payment history; credit status and change in status (credit ratings for public companies are used as a primary metric); change in tenant space needs (i.e., expansion/downsize); tenant financial performance; economic conditions in a specific geographic region; and industry specific credit considerations. We believe that the credit risk of our portfolio is reduced by the high quality and diversity of our existing tenant base, reviews of prospective tenants’ risk profiles prior to lease execution and consistent monitoring of our portfolio to identify potential problem tenants. However, we continue to monitor this in lightthe credit risk of the effectsour portfolio.
51
Item 4.4. Controls and Procedures.
I. Discussion of Controls and Procedures of the General Partner
Evaluation of Disclosure Controls and Procedures
We maintain disclosure controls and procedures (as defined in Rules 13a-15(e) and 15d-15(e) of the Exchange Act of 1934, as amended (the “Exchange Act”)) that are designed to provide reasonable assurance that information required to be disclosed in our Exchange Act reports is recorded, processed, summarized and reported within the time periods specified in the SEC’s rules and forms, and that such information is accumulated and communicated to our management, including our Chief Executive Officer and Chief Financial Officer, as appropriate, to allow timely decisions regarding required disclosure. In designing and evaluating the disclosure controls and procedures, we recognize that no controls and procedures, no matter how well designed and operated, can provide absolute assurance of achieving the desired control objectives.
In accordance with Rules 13a-15(b) and 15d-15(b) of the Exchange Act, management, under the supervision and with the participation of our Chief Executive Officer and Chief Financial Officer, carried out an evaluation of the effectiveness of our disclosure controls and procedures as of June 30, 2020March 31, 2021 and determined that the disclosure controls and procedures were effective at a reasonable assurance level as of that date.
Changes in Internal Control Over Financial Reporting
No change occurred in our internal control over financial reporting (as defined in Rules 13a-15(f) and 15d -15(f) of the Exchange Act) during the three months ended June 30, 2020March 31, 2021 that has materially affected, or is reasonably likely to materially affect, our internal control over financial reporting.
II. Discussion of Controls and Procedures of the Operating Partnership
Evaluation of Disclosure Controls and Procedures
We maintain disclosure controls and procedures (as defined in Rules 13a-15(e) and 15d-15(e) of the Exchange Act) that are designed to provide reasonable assurance that information required to be disclosed in our Exchange Act reports is recorded, processed, summarized and reported within the time periods specified in the SEC’s rules and forms, and that such information is accumulated and communicated to our management, including our Chief Executive Officer and Chief Financial Officer, as appropriate, to allow timely decisions regarding required disclosure. In designing and evaluating the disclosure controls and procedures, we recognize that no controls and procedures, no matter how well designed and operated, can provide absolute assurance of achieving the desired control objectives.
In accordance with Rules 13a-15(b) and 15d-15(b) of the Exchange Act, management, under the supervision and with the participation of our Chief Executive Officer and Chief Financial Officer, carried out an evaluation of the effectiveness of our disclosure controls and procedures as of June 30, 2020March 31, 2021 and determined that the disclosure controls and procedures were effective at a reasonable assurance level as of that date.
Changes in Internal Control Over Financial Reporting
No change occurred in our internal control over financial reporting (as defined in Rules 13a-15(f) and 15d -15(f) of the Exchange Act) during the three months ended June 30, 2020March 31, 2021 that has materially affected, or is reasonably likely to materially affect, our internal control over financial reporting.
52
PART II — OTHER INFORMATION
Item 1.1. Legal Proceedings.
The information contained under the heading “Litigation” in Note 10 – Commitments and Contingencies to our consolidated financial statements contained herein is incorporated by reference into this Part II, Item 1. Except as set forth therein, as of the end of the period covered by this Quarterly Report on Form 10-Q, we are not a party to, and none of our properties are subject to, any material pending legal proceedings.
Item 1A. Risk Factors.
The Company is supplementing the risk factors previously disclosed in Part I, Item 1A. “Risk Factors” of the Company’s Annual Report on Form 10-K for the year ended December 31, 20192020 with the following risk factor,factors, which should be read in conjunction with the other risk factors presented in the Annual Report on Form 10-K:
The ongoing pandemicannouncement and pendency of the novel coronavirus (COVID-19) has negatively affected and will likely continue to negatively affect our business, financial condition, liquidity and results of operations and those of our tenants.
On April 29, 2021, the Company and the OP entered into a Merger Agreement with Realty Income, Merger Sub 1 and Merger Sub 2 whereby Merger Sub 2 will be merged with and into the OP, with the OP continuing as the surviving entity and, immediately thereafter, the Company will be merged with and into Merger Sub 1, with Merger Sub 1 continuing as the surviving corporation.
The announcement and pendency of the Merger could cause disruption in our business, including the potential loss or disruption of commercial relationships prior to the completion of the Merger. For example, some of our tenants, prospective tenants or vendors may delay or defer decisions, which could negatively affect our revenues, earnings, cash flows and expenses, regardless of whether the Merger is completed. Similarly, our current and prospective employees may experience uncertainty about their future roles with the combined company following the Merger, which may adversely affect our ability to attract and retain key personnel during the pendency of the Merger.
The Merger Agreement generally requires us to use commercially reasonable efforts to operate our business in the ordinary course of business pending consummation of the Merger, but includes certain contractual restrictions on the conduct of our business prior to completion of the Merger. Due to these operating restrictions, during the pendency of the Merger Agreement we may be unable to pursue strategic transactions, undertake significant capital projects, undertake certain financing transactions and otherwise pursue other actions, even if such actions would prove beneficial.
The Merger Agreement also contains provisions that limit our ability to pursue alternatives to the Merger and that could discourage a potential competing acquirer of us from making a favorable alternative transaction proposal. In addition, matters relating to the Merger (including integration planning) will require substantial commitments of time and resources by our management, which could divert their time and attention. We have also incurred, and will continue to incur, significant non-recurring costs in connection with the Merger that we may be unable to recover. Further, the Merger Agreement requires us to pay a substantial termination fee to Realty Income in certain circumstances and if our stockholders do not approve the transaction, we must pay Realty Income an expense reimbursement fee.
The risk, and adverse effect, of any disruption could be exacerbated by a delay in completion of the Merger or termination of the Merger Agreement.
Completion of the Merger is subject to the satisfaction or waiver of certain conditions.
Completion of the Merger is subject to the satisfaction or waiver of certain conditions, including: (1) adoption and approval by the Company’s stockholders of the Merger Agreement and approval by Realty Income’s shareholders of the issuance of shares of Realty Income Common Stock pursuant to the Merger Agreement; (2) the effectiveness of the registration statement on Form S-4 to be filed with the SEC by Realty Income in connection with the transactions contemplated by the Merger Agreement; (3) approval for listing on the NYSE of the shares of Realty Income’s Common Stock to be issued in the Merger or reserved for issuance in connection therewith; (4) no injunction or law prohibiting the Merger; (5) accuracy of each party’s representations, subject in most cases to materiality or material adverse effect qualifications; (6) material compliance with each party’s covenants; (7) receipt by each of Realty Income and us of an opinion to the effect that the Merger will qualify as a “reorganization” within the meaning of Section 368(a) of the Internal Revenue Code of 1986, as amended, or the Code, and (8) receipt by each of Realty Income and us of an opinion that the other party qualifies as a REIT under the Code.
53
In addition, Realty Income will not be obligated to consummate the Merger before January 29, 2022 unless the Spin-Off is ready, in all respects, to be consummated contemporaneously with the closing of the Merger. If this condition is not satisfied or waived by Realty Income by January 29, 2022, and all other conditions to closing have been satisfied, the parties will be obligated to close the Merger, regardless of whether the Spin-Off is ready to be consummated.
We cannot provide assurance that these conditions to completing the Merger will be satisfied or waived, and accordingly, that our pending Merger with Realty Income will be completed on the timeline that we anticipate or at all. Failure to complete the Merger could negatively affect our stock price and our future business and financial results.
An adverse outcome in any litigation or other legal proceedings relating to the businesses of our tenants. The full extent of theMerger Agreement could have a material adverse impact on our results of operations, liquidity (including our ability to access capital markets),business and our ability to acquire, disposeconsummate the transactions contemplated by the Merger Agreement.
Transactions like the Merger are frequently the subject of or lease properties for our portfolio, our joint venture partners’ portfolios and/or for the tenant-in-common and Delaware statutory trust real estate programs’ properties that we manage is unknown and will depend on future developments, which are highly uncertain and cannot be predicted. Our results of operations, liquidity and cash flows could be materially affected.
The exchange ratio will not be adjusted in the event of any change in the stock prices of either us or Realty Income.
Upon the consummation of the Merger, each outstanding share of our Common Stock will be converted automatically into the right to receive 0.705 shares of Realty Income common stock, with cash paid in lieu of any fractional shares, without interest. The exchange ratio of 0.705 will not be adjusted for changes in the market prices of either shares of our Common Stock or shares of Realty Income common stock. Changes in the market price of shares of Realty Income common stock prior to the effective time of the Merger will affect the market value of the merger consideration that our stockholders will receive on the closing date of the Merger. Stock price changes may result from a variety of factors (many of which are beyond our or Realty Income’s control), including the following factors:
•market reaction to the announcement of the Merger and the prospects of the combined company;
•changes in the respective businesses, operations, assets, liabilities and prospects of us and Realty Income;
•changes in market assessments of the business, operations, financial position and prospects of either company or the businesscombined company;
•market assessments of the likelihood that the Merger will be completed;
•interest rates, general market and economic conditions and other factors generally affecting the market prices of our tenants. In lightCommon Stock and Realty Income Common Stock;
•federal, state and local legislation, governmental regulation and legal developments in the businesses in which we and Realty Income operate; and
•other factors beyond the control of us and Realty Income, including those described or referred to in this “Risk Factors” section.
The market price of shares of Realty Income common stock at the closing of the spreadMerger may vary from its price on the date the Merger Agreement was executed, on the date of COVID-19the proxy statement/prospectus and on the date of our special meeting. As a result, the market value of the merger consideration represented by the exchange ratio will also vary.
If the market price of shares of Realty Income common stock increases between the date the Merger Agreement was signed, the date of the proxy statement/prospectus or the date of our special meeting and the resulting economic downturn, tenantsclosing of the Merger, our stockholders could receive shares of Realty Income common stock that have a market value upon completion of the Merger that is greater than the market value of such shares calculated pursuant to the exchange ratio on the date the Merger Agreement was signed, the date of the proxy statement/prospectus or on the date of the special meeting, respectively. Alternatively, if the market price of shares of Realty Income common stock declines between the date the Merger Agreement was signed, the date of the proxy statement/prospectus or the date of our special meeting and may in the future, request rent deferrals, rent abatementclosing of the Merger, our stockholders could
54
receive shares of Realty Income common stock that have a market value upon completion of the Merger that is less than the market value of such shares calculated pursuant to the exchange ratio on the date the Merger Agreement was signed, the date of the proxy statement/prospectus or early terminationon the date of their leases as well as may be forced to temporarily or permanently close or declare bankruptcy which could reduce our cash flows and negatively affect our ability to pay dividends at current levels or at all. Specifically, as a result of COVID-19 and various governmental orders currently in place or reinstituted, athe special meeting, respectively.
Therefore, while the number of shares of Realty Income common stock to be issued per share of our tenants have closed their businesses, are operating with limited operations and/or have submitted requests for rent relief or failed to pay rent. While the Company has worked with tenants requesting rent relief, there can be no guarantee that future rent collections will be received at the same level as historical rent collections. In addition, state, local or industry-initiated efforts, such as tenant rent freezes or suspension of a landlord’s ability to enforce evictions, may continue to affectCommon Stock is fixed, our ability to collect rent or enforce remedies for the failure to pay rent. We believe our tenants generally do not have a clear contractual right to cease paying rent due to government-mandated closures and we intend to enforce our rights under the lease agreements. However, the ongoing COVID-19 pandemic and the related governmental orders continue to present novel situations for which the ultimate legal outcomestockholders cannot be assured and it is possible future governmental action could impact our rights under the lease agreements. The extent of tenant requests and actions and the impact to the Company’s results of operations and cash flows is uncertain and cannot be predicted.
Item 2. Unregistered Sales of Equity Securities and Use of Proceeds.
Repurchases of Equity Securities
| Period | Total Number of Shares/ Units Redeemed (1) | Redemption Price Per Share/Unit | ||||||||||||
| January 1, 2021 - January 31, 2021 | 4,000,000 | $ | 25.00 | |||||||||||
| February 1, 2021 - February 28, 2021 | — | — | ||||||||||||
| March 1, 2021 - March 31, 2021 | — | — | ||||||||||||
| Total | 4,000,000 | $ | 25.00 | |||||||||||
(1) During the three months ended March 31, 2021, the Company redeemed an aggregate of 4.0 million shares of its Series F Preferred Stock.
We are authorized to repurchase shares of the General Partner’s Common Stock to satisfy employee withholding tax obligations related to stock-based compensation. During the secondfirst quarter of 2020,2021, there were no repurchased shares of Common Stock or corresponding OP Units made in order to satisfy the minimum tax withholding obligation for state and federal payroll taxes. There were also no share repurchases under the 2019 Share Repurchase Program.Program during the first quarter of 2021. See Note 12 – Equity for further discussion.
Item 3. Defaults Upon Senior Securities.
None.
Item 4. Mine Safety Disclosures.
Not applicable.
Item 5. Other Information.
None.
55
Item 6. Exhibits
The following exhibits are included, or incorporated by reference, in this Quarterly Report on Form 10-Q for the quarter ended June 30, 2020March 31, 2021 (and are numbered in accordance with Item 601 of Regulation S-K):
| Exhibit No. | Description | |||||||||
| 3.1 | ||||||||||
| 3.2 | ||||||||||
| 3.3 | ||||||||||
| 3.4 | ||||||||||
| 3.5 | ||||||||||
| 3.6 | ||||||||||
| 3.7 | ||||||||||
| 3.8 | ||||||||||
| 3.9 | ||||||||||
| 3.10 | ||||||||||
| 3.11 | ||||||||||
| 3.12 | ||||||||||
| 3.13 | ||||||||||
| 3.15 | ||||||||||
| 4.1 | ||||||||||
| 4.2 | ||||||||||
| 4.3 | ||||||||||
| 4.4 | ||||||||||
56
| Exhibit No. | Description | |||||||
| 4.5 | ||||||||
| 4.7 | ||||||||
| 4.8 | ||||||||
| 4.21 | ||||||||
57
| Exhibit No. | Description | |||||||
| 31.1* | ||||||||
| 31.2* | ||||||||
| 31.3* | ||||||||
| 31.4* | ||||||||
| 32.1** | ||||||||
| 32.2** | ||||||||
| 32.3** | ||||||||
| 32.4** | ||||||||
| 101.SCH* | Inline XBRL Taxonomy Extension Schema Document. | |||||||
| 101.CAL* | Inline XBRL Taxonomy Extension Calculation Linkbase Document. | |||||||
| 101.DEF* | Inline XBRL Taxonomy Extension Definition Linkbase Document. | |||||||
| 101.LAB* | Inline XBRL Taxonomy Extension Label Linkbase Document. | |||||||
| 101.PRE* | Inline XBRL Taxonomy Extension Presentation Linkbase Document. | |||||||
| 104* | Cover Page Interactive Data File (formatted as Inline XBRL with applicable taxonomy extension information contained in Exhibits 101.*). | |||||||
_____________________________
| * Filed herewith |
58
SIGNATURES
Pursuant to the requirements of the Securities Exchange Act of 1934, as amended, each registrant has duly caused this Quarterly Report on Form 10-Q to be signed on its behalf by the undersigned thereunto duly authorized.
| VEREIT, INC. | ||||||||
| By: | /s/ Michael J. Bartolotta | |||||||
| Michael J. Bartolotta | ||||||||
Executive Vice President and Chief Financial Officer (Principal Financial Officer) | ||||||||
| VEREIT OPERATING PARTNERSHIP, L.P. | ||||||||
| By: VEREIT, Inc., its sole general partner | ||||||||
| By: | /s/ Michael J. Bartolotta | |||||||
| Michael J. Bartolotta | ||||||||
Executive Vice President and Chief Financial Officer (Principal Financial Officer) | ||||||||
Dated: AugustMay 5, 2020
59