UNITED STATES
SECURITIES AND EXCHANGE COMMISSION
Washington, D.C. 20549
FORM 10-Q
(Mark One)
|
| |
x☒ | QUARTERLY REPORT PURSUANT TO SECTION 13 OR 15(d) OF THE SECURITIES EXCHANGE ACT OF 1934 |
For the quarterly period endedMarch 31,June 30, 2019
OR
|
| |
¨☐ | TRANSITION REPORT PURSUANT TO SECTION 13 OR 15(d) OF THE SECURITIES EXCHANGE ACT OF 1934 |
For the transition period from to
Commission file number001-35054
Marathon Petroleum Corporation
(Exact name of registrant as specified in its charter)
|
| | |
| Delaware | | 27-1284632 |
(State or other jurisdiction of incorporation or organization) | | (I.R.S. Employer Identification No.) |
| | | |
539 South Main Street, Findlay, Ohio | | 45840-3229 |
(Address of principal executive offices) | | (Zip code) |
(419) 539 South Main Street, Findlay, Ohio45840-3229
(Address of principal executive offices) (Zip code)
(419) 422-2121
(Registrant’s telephone number, including area code)
|
| | |
| Securities registered pursuant to Section 12(b) of the Act |
| Title of each class | Trading Symbol(s) | Name of each exchange on which registered |
| Common Stock, par value $.01 | MPC | New York Stock Exchange |
Indicate by check mark whether the registrant (1) has filed all reports required to be filed by Section 13 or 15(d) of the Securities Exchange Act of 1934 during the preceding 12 months (or for such shorter period that the registrant was required to file such reports), and (2) has been subject to such filing requirements for the past 90 days. Yesx☑ No ¨☐
Indicate by check mark whether the registrant has submitted electronically every Interactive Data File required to be submitted pursuant to Rule 405 of Regulation S-T (§232.405 of this chapter) during the preceding 12 months (or for such shorter period that the registrant was required to submit such files.) Yesx☑ No ¨☐
Indicate by check mark whether the registrant is a large accelerated filer, an accelerated filer, a non-accelerated filer, a smaller reporting company, or an emerging growth company. See the definitions of “large accelerated filer,” “accelerated filer,” “smaller reporting company,” and “emerging growth company” in Rule 12b-2 of the Exchange Act.
Large Accelerated Filer☑ Accelerated Filer ☐ Non-accelerated Filer ☐ Smaller reporting company ☐ |
| | | | | | |
Large accelerated filer | | x | | Accelerated filer | | ¨ |
| | | | | | |
Non-accelerated filer | | ¨
| | Smaller reporting company | | ¨ |
| | | | | | |
| | | | Emerging growth company | | ¨ |
Emerging growth company ☐
If an emerging growth company, indicate by check mark if the registrant has elected not to use the extended transition period for complying with any new or revised financial accounting standards provided pursuant to Section 13(a) of the Exchange Act. ¨☐
Indicate by check mark whether the registrant is a shell company (as defined in Rule 12b-2 of the Exchange Act) Yes ¨☐ No x☑
|
| | |
Securities registered pursuant to Section 12(b) of the Act |
Title of each class | Trading
symbol(s) | Name of each exchange on which registered |
Common Stock, par value $.01 | MPC | New York Stock Exchange |
There were 662,618,001658,319,324 shares of Marathon Petroleum Corporation common stock outstanding as of May 3,July 31, 2019.
MARATHON PETROLEUM CORPORATION
FORM 10-Q
FOR THE QUARTERLY PERIOD ENDED MARCH 31,JUNE 30, 2019
TABLE OF CONTENTS
Unless otherwise stated or the context otherwise indicates, all references in this Form 10-Q to “MPC,” “us,” “our,” “we” or “the Company” mean Marathon Petroleum Corporation and its consolidated subsidiaries.
GLOSSARY OF TERMS
Throughout this report, the following company or industry specific terms and abbreviations are used:
|
| |
| ANS | Alaskan North Slope crude oil, an oil index benchmark price |
| ASC | Accounting Standards Codification |
| ASU | Accounting Standards Update |
| barrel | One stock tank barrel, or 42 United States gallons liquid volume, used in reference to crude oil or other liquid hydrocarbons |
bcf/d | One billion cubic feet per day |
| CARB | California Air Resources Board |
| CARBOB | California Reformulated Gasoline Blendstock for Oxygenate Blending |
| CBOB | Conventional Blending for Oxygenate Blending |
| EBITDA (a non-GAAP financial measure) | Earnings Before Interest, Tax, Depreciation and Amortization |
| EPA | United States Environmental Protection Agency |
| FASB | Financial Accounting Standards Board |
| GAAP | Accounting principles generally accepted in the United States |
| IDR | Incentive Distribution Right |
| LCM | Lower of cost or market |
| LIFO | Last in, first out, an inventory costing method |
| LLS | Louisiana Light Sweet crude oil, an oil index benchmark price |
| mbpd | Thousand barrels per day |
| MMBtu | One million British thermal units, an energy measurement |
| MMcf/d | One million cubic feet of natural gas per day |
| NGL | Natural gas liquids, such as ethane, propane, butanes and natural gasoline |
| NYMEX | New York Mercantile Exchange |
| OPEC | Organization of Petroleum Exporting Countries |
| OTC | Over-the-Counter |
| ppm | Parts per million |
| RIN | Renewable Identification Number |
| SEC | United States Securities and Exchange Commission |
| ULSD | Ultra-low sulfur diesel |
| USGC | U.S. Gulf Coast |
| VIE | Variable interest entity |
| WTI | West Texas Intermediate crude oil, an oil index benchmark price |
PART I – FINANCIAL INFORMATION
ITEM 1. FINANCIAL STATEMENTS
MARATHON PETROLEUM CORPORATION
CONSOLIDATED STATEMENTS OF INCOME
(Unaudited)
|
| | | | | | | | | | | | | | | |
| | Three Months Ended
June 30, | | Six Months Ended
June 30, |
| (Millions, except per share data) | 2019 | | 2018 | | 2019 | | 2018 |
| Revenues and other income: | | | | | | | |
| Sales and other operating revenues | $ | 33,547 |
| | $ | 22,317 |
| | $ | 61,814 |
| | $ | 41,183 |
|
| Income from equity method investments | 107 |
| | 80 |
| | 206 |
| | 166 |
|
| Net gain on disposal of assets | 4 |
| | 3 |
| | 218 |
| | 5 |
|
| Other income | 30 |
| | 45 |
| | 65 |
| | 75 |
|
| Total revenues and other income | 33,688 |
| | 22,445 |
| | 62,303 |
| | 41,429 |
|
| Costs and expenses: | | | | | | | |
| Cost of revenues (excludes items below) | 29,682 |
| | 19,655 |
| | 55,642 |
| | 37,166 |
|
| Depreciation and amortization | 886 |
| | 533 |
| | 1,805 |
| | 1,061 |
|
| Selling, general and administrative expenses | 904 |
| | 424 |
| | 1,785 |
| | 826 |
|
| Other taxes | 174 |
| | 122 |
| | 360 |
| | 225 |
|
| Total costs and expenses | 31,646 |
| | 20,734 |
| | 59,592 |
| | 39,278 |
|
| Income from operations | 2,042 |
| | 1,711 |
| | 2,711 |
| | 2,151 |
|
| Net interest and other financial costs | 322 |
| | 195 |
| | 628 |
| | 378 |
|
| Income before income taxes | 1,720 |
| | 1,516 |
| | 2,083 |
| | 1,773 |
|
| Provision for income taxes | 353 |
| | 281 |
| | 457 |
| | 303 |
|
| Net income | 1,367 |
| | 1,235 |
| | 1,626 |
| | 1,470 |
|
| Less net income attributable to: | | | | | | | |
| Redeemable noncontrolling interest | 21 |
| | 20 |
| | 41 |
| | 36 |
|
| Noncontrolling interests | 240 |
| | 160 |
| | 486 |
| | 342 |
|
| Net income attributable to MPC | $ | 1,106 |
| | $ | 1,055 |
| | $ | 1,099 |
| | $ | 1,092 |
|
| Per Share Data (See Note 7) | | | | | | | |
| Basic: | | | | | | | |
| Net income attributable to MPC per share | $ | 1.67 |
| | $ | 2.30 |
| | $ | 1.65 |
| | $ | 2.34 |
|
| Weighted average shares outstanding | 662 |
| | 459 |
| | 667 |
| | 467 |
|
| Diluted: | | | | | | | |
| Net income attributable to MPC per share | $ | 1.66 |
| | $ | 2.27 |
| | $ | 1.63 |
| | $ | 2.31 |
|
| Weighted average shares outstanding | 666 |
| | 464 |
| | 672 |
| | 472 |
|
|
| | | | | | | | |
| | | Three Months Ended
March 31, |
| (Millions of dollars, except per share data) | | 2019 | | 2018 |
| Revenues and other income: | | | | |
| Sales and other operating revenues | | $ | 28,081 |
| | $ | 18,694 |
|
| Sales to related parties | | 186 |
| | 172 |
|
| Income from equity method investments | | 99 |
| | 86 |
|
| Net gain on disposal of assets | | 214 |
| | 2 |
|
| Other income | | 35 |
| | 30 |
|
| Total revenues and other income | | 28,615 |
| | 18,984 |
|
| Costs and expenses: | | | | |
| Cost of revenues (excludes items below) | | 25,756 |
| | 17,370 |
|
| Purchases from related parties | | 204 |
| | 141 |
|
| Depreciation and amortization | | 919 |
| | 528 |
|
| Selling, general and administrative expenses | | 881 |
| | 402 |
|
| Other taxes | | 186 |
| | 103 |
|
| Total costs and expenses | | 27,946 |
| | 18,544 |
|
| Income from operations | | 669 |
| | 440 |
|
| Net interest and other financial costs | | 306 |
| | 183 |
|
| Income before income taxes | | 363 |
| | 257 |
|
| Provision for income taxes | | 104 |
| | 22 |
|
| Net income | | 259 |
| | 235 |
|
| Less net income attributable to: | | | | |
| Redeemable noncontrolling interest | | 20 |
| | 16 |
|
| Noncontrolling interests | | 246 |
| | 182 |
|
| Net income (loss) attributable to MPC | | $ | (7 | ) | | $ | 37 |
|
| Per Share Data (See Note 7) | | | | |
| Basic: | | | | |
| Net income (loss) attributable to MPC per share | | $ | (0.01 | ) | | $ | 0.08 |
|
| Weighted average shares outstanding | | 673 |
| | 476 |
|
| Diluted: | | | | |
| Net income (loss) attributable to MPC per share | | $ | (0.01 | ) | | $ | 0.08 |
|
| Weighted average shares outstanding | | 673 |
| | 480 |
|
The accompanying notes are an integral part of these consolidated financial statements.
MARATHON PETROLEUM CORPORATION
CONSOLIDATED STATEMENTS OF COMPREHENSIVE INCOME
(Unaudited)
| | | | | Three Months Ended
March 31, | Three Months Ended
June 30, | | Six Months Ended
June 30, |
| (Millions of dollars) | | 2019 | | 2018 | 2019 | | 2018 | | 2019 | | 2018 |
| Net income | | $ | 259 |
| | $ | 235 |
| $ | 1,367 |
| | $ | 1,235 |
| | $ | 1,626 |
| | $ | 1,470 |
|
| Other comprehensive income (loss): | | | | | | | | | | | |
| Defined benefit postretirement and post-employment plans: | | | | | |
| Actuarial changes, net of tax of $6 and $3, respectively | | (3 | ) | | 7 |
| |
| Prior service costs, net of tax of ($8) and ($2), respectively | | (3 | ) | | (7 | ) | |
| Other, net of tax of $0 and ($1), respectively | | (1 | ) | | (2 | ) | |
| Other comprehensive loss | | (7 | ) | | (2 | ) | |
| Defined benefit plans: | | | | | | | | |
| Actuarial changes, net of tax of $0, $2, $6 and $5, respectively | | (1 | ) | | 7 |
| | (4 | ) | | 14 |
|
| Prior service costs, net of tax of ($3), ($2), ($11) and ($4), respectively | | (8 | ) | | (7 | ) | | (11 | ) | | (14 | ) |
| Other, net of tax of ($1), $0, ($1) and ($1), respectively | | (1 | ) | | — |
| | (2 | ) | | (2 | ) |
| Other comprehensive income (loss) | | (10 | ) | | — |
| | (17 | ) | | (2 | ) |
| Comprehensive income | | 252 |
| | 233 |
| 1,357 |
| | 1,235 |
| | 1,609 |
| | 1,468 |
|
| Less comprehensive income attributable to: | | | | | | | | | | | |
| Redeemable noncontrolling interest | | 20 |
| | 16 |
| 21 |
| | 20 |
| | 41 |
| | 36 |
|
| Noncontrolling interests | | 246 |
| | 182 |
| 240 |
| | 160 |
| | 486 |
| | 342 |
|
| Comprehensive income (loss) attributable to MPC | | $ | (14 | ) | | $ | 35 |
| |
| Comprehensive income attributable to MPC | | $ | 1,096 |
| | $ | 1,055 |
| | $ | 1,082 |
| | $ | 1,090 |
|
The accompanying notes are an integral part of these consolidated financial statements.
MARATHON PETROLEUM CORPORATION
CONSOLIDATED BALANCE SHEETS
(Unaudited)
| | | (Millions of dollars, except share data) | March 31,
2019 | | December 31,
2018 | June 30,
2019 | | December 31,
2018 |
| Assets | | | | | | |
| Current assets: | | | | | | |
| Cash and cash equivalents | $ | 877 |
| | $ | 1,687 |
| $ | 1,247 |
| | $ | 1,687 |
|
| Receivables, less allowance for doubtful accounts of $9 and $9, respectively | 6,893 |
| | 5,853 |
| |
| Receivables, less allowance for doubtful accounts of $10 and $9, respectively | | 7,603 |
| | 5,853 |
|
| Inventories | 9,833 |
| | 9,837 |
| 9,088 |
| | 9,837 |
|
| Other current assets | 548 |
| | 646 |
| 458 |
| | 646 |
|
| Total current assets | 18,151 |
| | 18,023 |
| 18,396 |
| | 18,023 |
|
| Equity method investments | 6,558 |
| | 5,898 |
| 6,729 |
| | 5,898 |
|
| Property, plant and equipment, net | 45,091 |
| | 45,058 |
| 45,335 |
| | 45,058 |
|
| Goodwill | 20,229 |
| | 20,184 |
| 20,277 |
| | 20,184 |
|
| Right of use assets | 2,680 |
| | — |
| 2,588 |
| | — |
|
| Other noncurrent assets | 3,727 |
| | 3,777 |
| 3,571 |
| | 3,777 |
|
| Total assets | $ | 96,436 |
| | $ | 92,940 |
| $ | 96,896 |
| | $ | 92,940 |
|
| Liabilities | | | | | | |
| Current liabilities: | | | | | | |
| Accounts payable | $ | 10,568 |
| | $ | 9,366 |
| $ | 10,905 |
| | $ | 9,366 |
|
| Payroll and benefits payable | 958 |
| | 1,152 |
| 778 |
| | 1,152 |
|
| Accrued taxes | 1,529 |
| | 1,446 |
| 1,223 |
| | 1,446 |
|
| Debt due within one year | 550 |
| | 544 |
| 554 |
| | 544 |
|
| Operating lease liabilities | 613 |
| | — |
| 615 |
| | — |
|
| Other current liabilities | 929 |
| | 708 |
| 815 |
| | 708 |
|
| Total current liabilities | 15,147 |
| | 13,216 |
| 14,890 |
| | 13,216 |
|
| Long-term debt | 27,565 |
| | 26,980 |
| 27,853 |
| | 26,980 |
|
| Deferred income taxes | 5,011 |
| | 4,864 |
| 5,235 |
| | 4,864 |
|
| Defined benefit postretirement plan obligations | 1,567 |
| | 1,509 |
| 1,610 |
| | 1,509 |
|
| Long-term operating lease liabilities | 2,153 |
| | — |
| 2,068 |
| | — |
|
| Deferred credits and other liabilities | 1,131 |
| | 1,318 |
| 1,174 |
| | 1,318 |
|
| Total liabilities | 52,574 |
| | 47,887 |
| 52,830 |
| | 47,887 |
|
| Commitments and contingencies (see Note 24) |
| |
| |
| Commitments and contingencies (see Note 23) | |
| |
|
| Redeemable noncontrolling interest | 1,004 |
| | 1,004 |
| 1,005 |
| | 1,004 |
|
| Equity | | | | | | |
| MPC stockholders’ equity: | | | | | | |
| Preferred stock, no shares issued and outstanding (par value $0.01 per share, 30 million shares authorized) | — |
| | — |
| — |
| | — |
|
| Common stock: | | | | | | |
| Issued – 976 million and 975 million shares (par value $0.01 per share, 2 billion shares authorized) | 10 |
| | 10 |
| |
| Held in treasury, at cost – 309 million and 295 million shares | (14,063 | ) | | (13,175 | ) | |
| Issued – 978 million and 975 million shares (par value $0.01 per share, 2 billion shares authorized) | | 10 |
| | 10 |
|
| Held in treasury, at cost – 318 million and 295 million shares | | (14,573 | ) | | (13,175 | ) |
| Additional paid-in capital | 33,764 |
| | 33,729 |
| 33,785 |
| | 33,729 |
|
| Retained earnings | 14,391 |
| | 14,755 |
| 15,146 |
| | 14,755 |
|
| Accumulated other comprehensive loss | (151 | ) | | (144 | ) | (161 | ) | | (144 | ) |
| Total MPC stockholders’ equity | 33,951 |
| | 35,175 |
| 34,207 |
| | 35,175 |
|
| Noncontrolling interests | 8,907 |
| | 8,874 |
| 8,854 |
| | 8,874 |
|
| Total equity | 42,858 |
| | 44,049 |
| 43,061 |
| | 44,049 |
|
| Total liabilities, redeemable noncontrolling interest and equity | $ | 96,436 |
| | $ | 92,940 |
| $ | 96,896 |
| | $ | 92,940 |
|
MARATHON PETROLEUM CORPORATION
CONSOLIDATED STATEMENTS OF CASH FLOWS
(Unaudited)
| | | | Three Months Ended
March 31, | Six Months Ended
June 30, |
| (Millions of dollars) | 2019 | | 2018 | 2019 | | 2018 |
| Operating activities: | | | | | | |
| Net income | $ | 259 |
| | $ | 235 |
| $ | 1,626 |
| | $ | 1,470 |
|
| Adjustments to reconcile net income to net cash provided by operating activities: | | | | | | |
| Amortization of deferred financing costs and debt discount | — |
| | 18 |
| 9 |
| | 35 |
|
| Depreciation and amortization | 919 |
| | 528 |
| 1,805 |
| | 1,061 |
|
| Pension and other postretirement benefits, net | 52 |
| | 32 |
| 86 |
| | 65 |
|
| Deferred income taxes | 127 |
| | (19 | ) | 360 |
| | 2 |
|
| Net gain on disposal of assets | (214 | ) | | (2 | ) | (218 | ) | | (5 | ) |
| Income from equity method investments | (99 | ) | | (86 | ) | (206 | ) | | (166 | ) |
| Distributions from equity method investments | 148 |
| | 89 |
| 310 |
| | 217 |
|
| Changes in the fair value of derivative instruments | 29 |
| | (14 | ) | (27 | ) | | 1 |
|
| Changes in operating assets and liabilities, net of effects of businesses acquired: | | | | | | |
| Current receivables | (1,037 | ) | | 96 |
| (1,750 | ) | | (225 | ) |
| Inventories | (4 | ) | | 440 |
| 740 |
| | 66 |
|
| Current accounts payable and accrued liabilities | 1,483 |
| | (1,455 | ) | 1,297 |
| | (231 | ) |
| Right of use assets/operating leases | (1 | ) | | — |
| |
| Right of use assets and operating lease liabilities, net | | 9 |
| | — |
|
| All other, net | (39 | ) | | 1 |
| 204 |
| | (41 | ) |
| Net cash provided by (used in) operating activities | 1,623 |
| | (137 | ) | |
| Net cash provided by operating activities | | 4,245 |
| | 2,249 |
|
| Investing activities: | | | | | | |
| Additions to property, plant and equipment | (1,241 | ) | | (755 | ) | (2,419 | ) | | (1,466 | ) |
| Acquisitions, net of cash acquired | 1 |
| | — |
| 6 |
| | — |
|
| Disposal of assets | 24 |
| | 7 |
| 33 |
| | 14 |
|
| Investments – acquisitions, loans and contributions | (325 | ) | | (41 | ) | (595 | ) | | (118 | ) |
| – redemptions, repayments and return of capital | 2 |
| | — |
| 58 |
| | 15 |
|
| All other, net | 19 |
| | 11 |
| 37 |
| | 37 |
|
| Net cash used in investing activities | (1,520 | ) | | (778 | ) | (2,880 | ) | | (1,518 | ) |
| Financing activities: | | | | | | |
| Long-term debt – borrowings | 2,604 |
| | 9,610 |
| 7,964 |
| | 9,610 |
|
| – repayments | (2,031 | ) | | (5,264 | ) | (7,116 | ) | | (5,270 | ) |
| Debt issuance costs | — |
| | (53 | ) | — |
| | (53 | ) |
| Issuance of common stock | 2 |
| | 12 |
| 3 |
| | 21 |
|
| Common stock repurchased | (885 | ) | | (1,327 | ) | (1,385 | ) | | (2,212 | ) |
| Dividends paid | (354 | ) | | (219 | ) | (706 | ) | | (430 | ) |
| Distributions to noncontrolling interests | (325 | ) | | (195 | ) | (640 | ) | | (394 | ) |
| Contributions from noncontrolling interests | 95 |
| | 1 |
| 95 |
| | 5 |
|
| All other, net | (26 | ) | | (8 | ) | (56 | ) | | (19 | ) |
| Net cash provided by (used in) financing activities | (920 | ) | | 2,557 |
| (1,841 | ) | | 1,258 |
|
| Net increase (decrease) in cash, cash equivalents and restricted cash | (817 | ) | | 1,642 |
| (476 | ) | | 1,989 |
|
| Cash, cash equivalents and restricted cash at beginning of period | 1,725 |
| | 3,015 |
| 1,725 |
| | 3,015 |
|
| Cash, cash equivalents and restricted cash at end of period | $ | 908 |
| | $ | 4,657 |
| $ | 1,249 |
| | $ | 5,004 |
|
The accompanying notes are an integral part of these consolidated financial statements.
MARATHON PETROLEUM CORPORATION
CONSOLIDATED STATEMENTS OF EQUITY AND REDEEMBALE NONCONTROLLING INTEREST
(Unaudited)
| | | | MPC Stockholders’ Equity | | | | | | | MPC Stockholders’ Equity | | | | | | |
| | Common Stock | | Treasury Stock | | Additional Paid-in Capital | | Retained Earnings | | Accumulated Other Comprehensive Income (Loss) | | Non-controlling Interests | | Total Equity | | Redeemable Non-controlling Interest | Common Stock | | Treasury Stock | | Additional Paid-in Capital | | Retained Earnings | | Accumulated Other Comprehensive Income (Loss) | | Non-controlling Interests | | Total Equity | | Redeemable Non-controlling Interest |
(Shares in millions; amounts in millions of dollars) | Shares | | Amount | | Shares | | Amount | | | |
| (In millions) | | Shares | | Amount | | Shares | | Amount | | Additional Paid-in Capital | | Retained Earnings | | Accumulated Other Comprehensive Income (Loss) | | Non-controlling Interests | | Total Equity | | Redeemable Non-controlling Interest |
| Balance as of December 31, 2018 | 975 |
| | $ | 10 |
| | (295 | ) | | $ | (13,175 | ) | | $ | 33,729 |
| | $ | 14,755 |
| | $ | (144 | ) | | $ | 8,874 |
| | $ | 44,049 |
| | $ | 1,004 |
| 975 |
| | $ | 10 |
| | (295 | ) | | $ | (13,175 | ) | |
| Net income (loss) | — |
| | — |
| | — |
| | — |
| | — |
| | (7 | ) | | — |
| | 246 |
| | 239 |
| | 20 |
| — |
| | — |
| | — |
| | — |
| | — |
| | (7 | ) | | — |
| | 246 |
| | 239 |
| | 20 |
|
| Dividends declared on common stock ($0.53 per share) | — |
| | — |
| | — |
| | — |
| | — |
| | (357 | ) | | — |
| | — |
| | (357 | ) | | — |
| — |
| | — |
| | — |
| | — |
| | — |
| | (357 | ) | | — |
| | — |
| | (357 | ) | | — |
|
| Distributions to noncontrolling interests | — |
| | — |
| | — |
| | — |
| | — |
| | — |
| | — |
| | (305 | ) | | (305 | ) | | (20 | ) | — |
| | — |
| | — |
| | — |
| | — |
| | — |
| | — |
| | (305 | ) | | (305 | ) | | (20 | ) |
| Contributions from noncontrolling interests | — |
| | — |
| | — |
| | — |
| | — |
| | — |
| | — |
| | 95 |
| | 95 |
| | — |
| — |
| | — |
| | — |
| | — |
| | — |
| | — |
| | — |
| | 95 |
| | 95 |
| | — |
|
| Other comprehensive loss | — |
| | — |
| | — |
| | — |
| | — |
| | — |
| | (7 | ) | | — |
| | (7 | ) | | — |
| — |
| | — |
| | — |
| | — |
| | — |
| | — |
| | (7 | ) | | — |
| | (7 | ) | | — |
|
| Shares repurchased | — |
| | — |
| | (14 | ) | | (885 | ) | | — |
| | — |
| | — |
| | — |
| | (885 | ) | | — |
| — |
| | — |
| | (14 | ) | | (885 | ) | | — |
| | — |
| | — |
| | — |
| | (885 | ) | | — |
|
| Stock based compensation | 1 |
| | — |
| | — |
| | (3 | ) | | 32 |
| | — |
| | — |
| | (1 | ) | | 28 |
| | — |
| 1 |
| | — |
| | — |
| | (3 | ) | | 32 |
| | — |
| | — |
| | (1 | ) | | 28 |
| | — |
|
| Impact from equity transactions of MPLX & ANDX | — |
| | — |
| | — |
| | — |
| | 3 |
| | — |
| | — |
| | (1 | ) | | 2 |
| | — |
| — |
| | — |
| | — |
| | — |
| | 3 |
| | — |
| | — |
| | (1 | ) | | 2 |
| | — |
|
| Other | — |
| | — |
| | — |
| | — |
| | — |
| | — |
| | — |
| | (1 | ) | | (1 | ) | | — |
| — |
| | — |
| | — |
| | — |
| | — |
| | — |
| | — |
| | (1 | ) | | (1 | ) | | — |
|
| Balance as of March 31, 2019 | 976 |
| | $ | 10 |
| | (309 | ) | | $ | (14,063 | ) | | $ | 33,764 |
| | $ | 14,391 |
| | $ | (151 | ) | | $ | 8,907 |
| | $ | 42,858 |
| | $ | 1,004 |
| 976 |
| | $ | 10 |
| | (309 | ) | | $ | (14,063 | ) | | $ | 33,764 |
| | $ | 14,391 |
| | $ | (151 | ) | | $ | 8,907 |
| | $ | 42,858 |
| | $ | 1,004 |
|
| | | | | | | | | | | | | | | | | | | | | |
| Balance as of December 31, 2017 | 734 |
| | $ | 7 |
| | (248 | ) | | $ | (9,869 | ) | | $ | 11,262 |
| | $ | 12,864 |
| | $ | (231 | ) | | $ | 6,795 |
| | $ | 20,828 |
| | $ | 1,000 |
| |
| Cumulative effect of adopting new accounting standards | — |
| | — |
| | — |
| | — |
| | — |
| | 63 |
| | — |
| | 1 |
| | 64 |
| | — |
| |
| Net income | — |
| | — |
| | — |
| | — |
| | — |
| | 37 |
| | — |
| | 182 |
| | 219 |
| | 16 |
| — |
| | — |
| | — |
| | — |
| | — |
| | 1,106 |
| | — |
| | 240 |
| | 1,346 |
| | 21 |
|
| Dividends declared on common stock ($0.46 per share) | — |
| | — |
| | — |
| | — |
| | — |
| | (219 | ) | | — |
| | — |
| | (219 | ) | | — |
| |
| Dividends declared on common stock ($0.53 per share) | | — |
| | — |
| | — |
| | — |
| | — |
| | (351 | ) | | — |
| | — |
| | (351 | ) | | — |
|
| Distributions to noncontrolling interests | — |
| | — |
| | — |
| | — |
| | — |
| | — |
| | — |
| | (179 | ) | | (179 | ) | | (16 | ) | — |
| | — |
| | — |
| | — |
| | — |
| | — |
| | — |
| | (295 | ) | | (295 | ) | | (20 | ) |
| Contributions from noncontrolling interests | — |
| | — |
| | — |
| | — |
| | — |
| | — |
| | — |
| | 1 |
| | 1 |
| | — |
| |
| Other comprehensive loss | — |
| | — |
| | — |
| | — |
| | — |
| | — |
| | (2 | ) | | — |
| | (2 | ) | | — |
| — |
| | — |
| | — |
| | — |
| | — |
| | — |
| | (10 | ) | | — |
| | (10 | ) | | — |
|
| Shares repurchased | — |
| | — |
| | (19 | ) | | (1,327 | ) | | — |
| | — |
| | — |
| | — |
| | (1,327 | ) | | — |
| — |
| | — |
| | (9 | ) | | (500 | ) | | — |
| | — |
| | — |
| | — |
| | (500 | ) | | — |
|
| Stock based compensation | — |
| | — |
| | — |
| | (4 | ) | | 27 |
| | — |
| | — |
| | 1 |
| | 24 |
| | — |
| 2 |
| | — |
| | — |
| | (10 | ) | | 19 |
| | — |
| | — |
| | 2 |
| | 11 |
| | — |
|
| Impact from equity transactions of MPLX & ANDX | — |
| | — |
| | — |
| | — |
| | 2,380 |
| | — |
| | — |
| | (2,926 | ) | | (546 | ) | | — |
| — |
| | — |
| | — |
| | — |
| | 2 |
| | — |
| | — |
| | (1 | ) | | 1 |
| | — |
|
| Balance as of March 31, 2018 | 734 |
| | $ | 7 |
| | (267 | ) | | $ | (11,200 | ) | | $ | 13,669 |
| | $ | 12,745 |
| | $ | (233 | ) | | $ | 3,875 |
| | $ | 18,863 |
| | $ | 1,000 |
| |
| Other | | — |
| | — |
| | — |
| | — |
| | — |
| | — |
| | — |
| | 1 |
| | 1 |
| | — |
|
| Balance as of June 30, 2019 | | 978 |
| | $ | 10 |
| | (318 | ) | | $ | (14,573 | ) | | $ | 33,785 |
| | $ | 15,146 |
| | $ | (161 | ) | | $ | 8,854 |
| | $ | 43,061 |
| | $ | 1,005 |
|
The accompanying notes are an integral part of these consolidated financial statements.
MARATHON PETROLEUM CORPORATION
CONSOLIDATED STATEMENTS OF EQUITY AND REDEEMBALE NONCONTROLLING INTEREST
(Unaudited)
|
| | | | | | | | | | | | | | | | | | | | | | | | | | | | | | | | | | | | | |
| | MPC Stockholders’ Equity | | | | | | |
| | Common Stock | | Treasury Stock | | Additional Paid-in Capital | | Retained Earnings | | Accumulated Other Comprehensive Income (Loss) | | Non-controlling Interests | | Total Equity | | Redeemable Non-controlling Interest |
(Shares in millions; amounts in millions of dollars) | Shares | | Amount | | Shares | | Amount | | | | | | |
| Balance as of December 31, 2017 | 734 |
| | $ | 7 |
| | (248 | ) | | $ | (9,869 | ) | | $ | 11,262 |
| | $ | 12,864 |
| | $ | (231 | ) | | $ | 6,795 |
| | $ | 20,828 |
| | $ | 1,000 |
|
| Cumulative effect of adopting new accounting standards | — |
| | — |
| | — |
| | — |
| | — |
| | 63 |
| | — |
| | 1 |
| | 64 |
| | — |
|
| Net income | — |
| | — |
| | — |
| | — |
| | — |
| | 37 |
| | — |
| | 182 |
| | 219 |
| | 16 |
|
| Dividends declared on common stock ($0.46 per share) | — |
| | — |
| | — |
| | — |
| | — |
| | (219 | ) | | — |
| | — |
| | (219 | ) | | — |
|
| Distributions to noncontrolling interests | — |
| | — |
| | — |
| | — |
| | — |
| | — |
| | — |
| | (179 | ) | | (179 | ) | | (16 | ) |
| Contributions from noncontrolling interests | — |
| | — |
| | — |
| | — |
| | — |
| | — |
| | — |
| | 1 |
| | 1 |
| | — |
|
| Other comprehensive loss | — |
| | — |
| | — |
| | — |
| | — |
| | — |
| | (2 | ) | | — |
| | (2 | ) | | — |
|
| Shares repurchased | — |
| | — |
| | (19 | ) | | (1,327 | ) | | — |
| | — |
| | — |
| | — |
| | (1,327 | ) | | — |
|
| Stock based compensation | — |
| | — |
| | — |
| | (4 | ) | | 27 |
| | — |
| | — |
| | 1 |
| | 24 |
| | — |
|
| Impact from equity transactions of MPLX & ANDX | — |
| | — |
| | — |
| | — |
| | 2,380 |
| | — |
| | — |
| | (2,926 | ) | | (546 | ) | | — |
|
| Balance as of March 31, 2018 | 734 |
| | $ | 7 |
| | (267 | ) | | $ | (11,200 | ) | | $ | 13,669 |
| | $ | 12,745 |
| | $ | (233 | ) | | $ | 3,875 |
| | $ | 18,863 |
| | $ | 1,000 |
|
| Net income | — |
| | — |
| | — |
| | — |
| | — |
| | 1,055 |
| | — |
| | 160 |
| | 1,215 |
| | 20 |
|
| Dividends declared on common stock ($0.46 per share) | — |
| | — |
| | — |
| | — |
| | — |
| | (211 | ) | | — |
| | — |
| | (211 | ) | | — |
|
| Distributions to noncontrolling interests | — |
| | — |
| | — |
| | — |
| | — |
| | — |
| | — |
| | (182 | ) | | (182 | ) | | (17 | ) |
| Contributions from noncontrolling interests | — |
| | — |
| | — |
| | — |
| | — |
| | — |
| | — |
| | 4 |
| | 4 |
| | — |
|
| Other comprehensive loss | — |
| | — |
| | — |
| | — |
| | — |
| | — |
| | — |
| | — |
| | — |
| | — |
|
| Shares repurchased | — |
| | — |
| | (12 | ) | | (885 | ) | | — |
| | — |
| | — |
| | — |
| | (885 | ) | | — |
|
| Stock based compensation | 1 |
| | — |
| | — |
| | (8 | ) | | 18 |
| | — |
| | — |
| | 4 |
| | 14 |
| | — |
|
| Impact from equity transactions of MPLX & ANDX | — |
| | — |
| | — |
| | — |
| | 1 |
| | — |
| | — |
| | (1 | ) | | — |
| | — |
|
| Balance as of June 30, 2018 | 735 |
| | $ | 7 |
| | (279 | ) | | $ | (12,093 | ) | | $ | 13,688 |
| | $ | 13,589 |
| | $ | (233 | ) | | $ | 3,860 |
| | $ | 18,818 |
| | $ | 1,003 |
|
The accompanying notes are an integral part of these consolidated financial statements.
NOTES TO CONSOLIDATED FINANCIAL STATEMENTS (UNAUDITED)
1. DESCRIPTION OF THE BUSINESS AND BASIS OF PRESENTATION
Description of the Business
We are a leading, integrated, downstream energy company headquartered in Findlay, Ohio. We operate the nation's largest refining system with more than 3 million barrels per day of crude oil capacity across 16 refineries. We sell refined products to wholesale marketing customers domestically and internationally, to buyers on the spot market, to consumers through our Retail business segment and to independent entrepreneurs who operate approximately 6,9007,000 branded outlets. Our retail operations own and operate approximately 3,9203,910 retail transportation fuel and convenience stores across the United States and also sell transportation fuel to consumers through approximately 1,060 direct dealer locations under long-term supply contracts. MPC’s midstream operations are primarily conducted through MPLX LP (“MPLX”) and Andeavor Logistics LP (“ANDX”), which own and operate crude oil and light product transportation and logistics infrastructure as well as gathering, processing, and fractionation assets. We own the general partner and majority limited partner interestinterests in these two midstream companies.
Refer to Note 4 for further information on the Andeavor acquisition, which closed on October 1, 2018, and to Notes 3 and 9 for additional information about our operations.
Basis of Presentation
All significant intercompany transactions and accounts have been eliminated.
These interim consolidated financial statements are unaudited; however, in the opinion of our management, these statements reflect all adjustments necessary for a fair statement of the results for the periods reported. All such adjustments are of a normal, recurring nature unless otherwise disclosed. These interim consolidated financial statements, including the notes, have been prepared in accordance with the rules of the SEC applicable to interim period financial statements and do not include all of the information and disclosures required by GAAP for complete financial statements.
These interim consolidated financial statements should be read in conjunction with the audited consolidated financial statements and notes thereto included in our Annual Report on Form 10-K for the year ended December 31, 2018. The results of operations for the three and six months ended March 31,June 30, 2019 are not necessarily indicative of the results to be expected for the full year.
2. ACCOUNTING STANDARDS
Recently Adopted
ASU 2016-02, Leases
We adopted ASU No. 2016-02, Leases (��(“ASC 842”), as of January 1, 2019, electing the transition method which permits entities to adopt the provisions of the standard using the modified retrospective approach without adjusting comparative periods. We also elected the package of practical expedients permitted under the transition guidance within the new standard, which among other things, allowed us to grandfather the historical accounting conclusions until a reassessment event is present. We have also elected the practical expedient to not recognize short-term leases on the balance sheet, the practical expedient related to right of way permits and land easements which allows us to carry forward our accounting treatment for those existing agreements, and the practical expedient to combine lease and non-lease components for the majority of our underlying classes of assets except for our third-party contractor service and equipment agreements and boat and barge equipment agreements in which we are the lessee. We did not elect the practical expedient to combine lease and non-lease components for arrangements in which we are the lessor. In instances where the practical expedient was not elected, lease and non-lease consideration is allocated based on relative standalone selling price.
Right of use (“ROU”) assets represent our right to use an underlying asset in which we obtain substantially all of the economic benefits and the right to direct the use of the asset during the lease term. Lease liabilities represent our obligation to make lease payments arising from the lease. Operating lease ROU assets and lease liabilities are recognized at commencement date based on the present value of lease payments over the lease term. We recognize ROU assets and lease liabilities on the balance sheet for leases with a lease term of greater than one year. Payments that are not fixed at the commencement of the lease are considered variable and are excluded from the ROU asset and lease liability calculations. In the measurement of our ROU assets and lease liabilities, the fixed lease payments in the agreement are discounted using a secured incremental borrowing rate for a term similar to the duration of the lease, as our leases do not provide implicit rates. Operating lease expense is recognized on a straight-line basis over the lease term.
Adoption of the new standard resulted in the recording of ROU assets and lease liabilities of approximately $2.79$2.81 billion and $2.88$2.90 billion, respectively, as of January 1, 2019. The standard did not materially impact our consolidated statements of income, cash flows or equity as a result of adoption.
As a lessor under ASC 842, MPLX may be required to re-classify existing operating leases to sales-type leases upon modification and related reassessment of the leases. If such a modification were to occur, it may result in the de-recognition of existing assets, recognition of a receivable in the amount of the present value of fixed payments expected to be received by MPLX under the lease, and recognition of a corresponding gain or loss in the period of change. MPLX will evaluate the impact of a lease reassessment as modifications occur.
We also adopted the following ASUs during the first threesix months of 2019, none of which had a material impact to our financial statements or financial statement disclosures:
|
| | | |
| ASU | | | Effective Date |
| 2018-02 | Reporting Comprehensive Income - Reclassification of Certain Tax Effects from Accumulated Other Comprehensive Income | | January 1, 2019 |
| 2017-12 | Derivatives and Hedging - Targeted Improvements to Accounting for Hedging Activities | | January 1, 2019 |
Not Yet Adopted
ASU 2017-04, Intangibles - Goodwill and Other - Simplifying the Test for Goodwill Impairment
In January 2017, the FASB issued an ASU which simplifies the subsequent measurement of goodwill by eliminating Step 2 from the goodwill impairment test. Under the new guidance, the recognition of an impairment charge is calculated based on the amount by which the carrying amount exceeds the reporting unit’s fair value, which could be different from the amount calculated under the current method using the implied fair value of the goodwill; however, the loss recognized should not exceed the total amount of goodwill allocated to that reporting unit. The guidance should be applied on a prospective basis and is effective for annual or any interim goodwill impairment tests in fiscal years beginning after December 15, 2019.
ASU 2016-13, Credit Losses - Measurement of Credit Losses on Financial Instruments
In June 2016, the FASB issued an ASU related to the accounting for credit losses on certain financial instruments. The guidance requires that for most financial assets, losses be based on an expected loss approach which includes estimates of losses over the life of exposure that considers historical, current and forecasted information. Expanded disclosures related to the methods used to estimate the losses as well as a specific disaggregation of balances for financial assets are also required. The change is effective for fiscal years beginning after December 15, 2019, and interim periods within those fiscal years, with early adoption permitted for fiscal years beginning after December 15, 2018, and interim periods within those fiscal years. We do not expect application of this ASU to have a material impact on our consolidated financial statements.
3. MASTER LIMITED PARTNERSHIPS
MPLX
We own the general partner and majority limited partner interests in two midstream companies, MPLX is a diversified, large-cap publicly traded limited partnership formed by us toand ANDX, which own and operate developgathering, processing, and acquire midstream energy infrastructure assets. MPLX is engaged in the transportation, storage and distribution offractionation assets, as well as crude oil and refined petroleum products; gathering, processinglight product transportation and transportation of natural gas; and the gathering, transportation, fractionation, storage and marketing of NGLs.logistics infrastructure. As of March 31,June 30, 2019, we owned 64 percent of the outstanding MPLX common units of both MPLX and weANDX. We control both MPLX and ANDX through our ownership of the general partner interest.
As described in Notes 4 and 5, we have consolidated ANDX since October 1, 2018 in accordance with ASC 810 and previously recorded ANDX’s assets and liabilities to our balance sheet at preliminary fair values as of MPLX.the Andeavor acquisition date of October 1, 2018.
On July 30, 2019, MPLX completed its acquisition of ANDX. At the effective time of the ANDX acquisition, each common unit held by ANDX’s public unitholders was converted into the right to receive 1.135 MPLX common units. ANDX common units held by MPC were converted into the right to receive 1.0328 MPLX common units. ANDX common unitholders will not receive any future distributions from ANDX, but instead will receive a second quarter 2019 distribution as and when declared by the Board of Directors of MPLX with respect to the MPLX common units issued in connection with the acquisition. Additionally, the ANDX Series A Preferred unitholders will not receive any future distributions from ANDX, but instead will receive the semi-annual distributions payable August 15, 2019 on MPLX Series B Preferred units issued in connection with the acquisition. As of July 30, 2019, MPC will account for this transaction as a common control transaction, as defined by ASC 805, which will result in adjustments to our noncontrolling interest and additional paid-in capital balances.
Dropdowns to MPLX and GP/IDR Exchange
On February 1, 2018, we contributed refining logistics assets and fuels distribution services to MPLX in exchange for $4.1 billion in cash and approximately 112 million common units and 2 million general partner units from MPLX. MPLX financed the cash portion of the transaction with its $4.1 billion 364-day term loan facility, which was entered into on January 2, 2018. We agreed to waive approximately one-third of the first quarter 2018 distributions on the common units issued in connection with this transaction. The contributions of these assets were accounted for as transactions between entities under common control and we did not record a gain or loss.
Immediately following the February 1, 2018 dropdown to MPLX, our IDRs were cancelled and our economic general partner interest was converted into a non-economic general partner interest, all in exchange for 275 million newly issued MPLX common units (“GP/IDR Exchange”). As a result of this transaction, the general partner units and IDRs were eliminated, are no longer outstanding and no longer participate in distributions of cash from MPLX.
Agreements
We have various long-term, fee-based commercial agreements with MPLX.MPLX and ANDX. Under these agreements, MPLX providesand ANDX provide transportation, storage, distribution and marketing services to us. Under certain agreements, we commit to provide MPLX with minimum throughput and distribution volumes of crude oil and refined products and minimum storage volumes of crude oil, refined products and butane. Under certain other agreements, we commit to pay for substantially all of the available capacity for certain marine transportation and refining logistics assets. These transactions are eliminated in consolidation, but are reflected as intersegment transactions between our Refining & Marketing and Midstream segments. We also have agreements with MPLX that establish fees for operational and management services provided between us and MPLX and for executive management services and certain general and administrative services provided by us to MPLX. These transactions are eliminated in consolidation, but are reflected as intersegment transactions between our Corporate and Midstream segments.
ANDX
Through the Andeavor acquisition, we acquired control of ANDX, which is a publicly traded limited partnership that was formed to own, operate, develop and acquire logistics assets. Its assets are integral to the success of our refining and marketing operations and are used to gather crude oil, natural gas, and water, process natural gas and distribute, transport and store crude oil and refined products. ANDX provides us with various pipeline transportation, trucking, terminal distribution, storage and petroleum-coke handling services under long-term, fee-based commercial agreements. With certain exceptions, these agreements generally contain minimum volume commitments. These transactions are eliminated in consolidation but are reflected as intersegment transactions between our Refining & Marketing and Midstream segments. We also have agreements with MPLX and ANDX that establish fees for operational and management services provided between us and MPLX and ANDX and for executive management services and certain general and administrative services provided by us to MPLX and ANDX. These transactions are eliminated in consolidation but are reflected as intersegment transactions between our Corporate and Midstream segments.
As of March 31, 2019, we owned 64 percent of the outstanding ANDX common units. We also hold 80,000 ANDX TexNew Mex Units as of March 31, 2019 and control ANDX through our ownership of the general partner of ANDX.
Noncontrolling Interest
As a result of equity transactions of MPLX and ANDX, we are required to adjust non-controlling interest and additional paid-in capital. Changes in MPC’s additional paid-in capital resulting from changes in its ownership interests in MPLX and ANDX were as follows:
|
| | | | | | | |
| | Six Months Ended
June 30, |
| (In millions) | 2019 | | 2018 |
| Increase due to the issuance of MPLX common units and general partner units to MPC | $ | — |
| | $ | 1,114 |
|
| Increase due to GP/IDR Exchange | — |
| | 1,808 |
|
| Increase due to the issuance of MPLX & ANDX common units | 7 |
| | 5 |
|
| Increase in MPC's additional paid-in capital | 7 |
| | 2,927 |
|
| Tax impact | (2 | ) | | (546 | ) |
| Increase in MPC's additional paid-in capital, net of tax | $ | 5 |
| | $ | 2,381 |
|
|
| | | | | | | |
| | Three Months Ended
March 31, |
| (In millions) | 2019 | | 2018 |
| Increase due to the issuance of MPLX common units and general partner units to MPC | $ | — |
| | $ | 1,114 |
|
| Increase due to GP/IDR Exchange | — |
| | 1,808 |
|
| Increase due to the issuance of MPLX & ANDX common units | 4 |
| | 4 |
|
| Increase in MPC's additional paid-in capital | 4 |
| | 2,926 |
|
| Tax impact | (1 | ) | | (546 | ) |
| Increase in MPC's additional paid-in capital, net of tax | $ | 3 |
| | $ | 2,380 |
|
4. ACQUISITIONS
Acquisition of Andeavor
On October 1, 2018, we acquired all the outstanding shares of Andeavor. The total value of consideration transferred was $23.46 billion, consisting of $19.97 billion in equity and $3.49 billion in cash. The cash portion of the purchase price was funded using cash on hand. Our financial results reflect the results of Andeavor from the date of the acquisition.
We accounted for the Andeavor acquisition using the acquisition method of accounting, which requires Andeavor assets and liabilities to be recorded to our balance sheet at fair value as of the acquisition date. We will complete a final determination of the fair value of certain assets and liabilities within the one year measurement period from the date of the acquisition as required by FASB ASC Topic 805, “Business Combinations”.805. Due to the level of effort required to develop fair value measurements, the valuation studies necessary to determine the fair value of assets acquired and liabilities assumed are preliminary, including the underlying cash flows used to determine the fair value of identified intangible assets and economic obsolescence adjustments to property, plant and equipment. The size and the breadth of the Andeavor acquisition necessitates the use of the one year measurement period to fully analyze all the factors used in establishing the asset and liability fair values as of the acquisition date, including, but not limited to, property, plant and equipment, intangible assets, real property, leases,
environmental and asset retirement obligations and the related tax impacts of any changes made. Any potential adjustments made could be material in relation to the preliminary values.
During the threesix months ended March 31,June 30, 2019, we recorded adjustments to the preliminary fair value estimates of assets acquired and liabilities assumed as of the acquisition date as noted in the table below.
| | | (In millions) | As originally reported | | Adjustments | | As adjusted | As originally reported | | Adjustments | | As adjusted |
| Cash and cash equivalents | $ | 382 |
| | $ | — |
| | $ | 382 |
| $ | 382 |
| | $ | — |
| | $ | 382 |
|
| Receivables | 2,744 |
| | (2 | ) | | 2,742 |
| 2,744 |
| | (2 | ) | | 2,742 |
|
| Inventories | 5,204 |
| | (8 | ) | | 5,196 |
| 5,204 |
| | (9 | ) | | 5,195 |
|
| Other current assets | 378 |
| | — |
| | 378 |
| 378 |
| | — |
| | 378 |
|
| Equity method investments | 865 |
| | — |
| | 865 |
| 865 |
| | 37 |
| | 902 |
|
| Property, plant and equipment, net | 16,545 |
| | (1 | ) | | 16,544 |
| 16,545 |
| | (78 | ) | | 16,467 |
|
Other noncurrent assets(a) | 3,086 |
| | — |
| | 3,086 |
| 3,086 |
| | (1 | ) | | 3,085 |
|
| Total assets acquired | 29,204 |
| | (11 | ) | | 29,193 |
| 29,204 |
| | (53 | ) | | 29,151 |
|
| Accounts payable | 4,003 |
| | — |
| | 4,003 |
| 4,003 |
| | (4 | ) | | 3,999 |
|
| Payroll and benefits payable | 348 |
| | — |
| | 348 |
| 348 |
| | — |
| | 348 |
|
| Accrued taxes | 590 |
| | — |
| | 590 |
| 590 |
| | — |
| | 590 |
|
| Debt due within one year | 34 |
| | — |
| | 34 |
| 34 |
| | — |
| | 34 |
|
| Other current liabilities | 392 |
| | 23 |
| | 415 |
| 392 |
| | 30 |
| | 422 |
|
| Long-term debt | 8,875 |
| | 1 |
| | 8,876 |
| 8,875 |
| | 1 |
| | 8,876 |
|
| Deferred income taxes | 1,609 |
| | 22 |
| | 1,631 |
| 1,609 |
| | 16 |
| | 1,625 |
|
| Defined benefit postretirement plan obligations | 432 |
| | — |
| | 432 |
| 432 |
| | — |
| | 432 |
|
| Deferred credit and other liabilities | 714 |
| | 6 |
| | 720 |
| 714 |
| | 15 |
| | 729 |
|
| Noncontrolling interests | 5,059 |
| | 3 |
| | 5,062 |
| 5,059 |
| | 3 |
| | 5,062 |
|
| Total liabilities and noncontrolling interest assumed | 22,056 |
| | 55 |
| | 22,111 |
| 22,056 |
| | 61 |
| | 22,117 |
|
| Net assets acquired excluding goodwill | 7,148 |
| | (66 | ) | | 7,082 |
| 7,148 |
| | (114 | ) | | 7,034 |
|
| Goodwill | 16,314 |
| | 66 |
| | 16,380 |
| 16,314 |
| | 114 |
| | 16,428 |
|
| Net assets acquired | $ | 23,462 |
| | $ | — |
| | $ | 23,462 |
| $ | 23,462 |
| | $ | — |
| | $ | 23,462 |
|
| |
(a) | Includes intangible assets. |
The preliminary purchase consideration allocation resulted in the recognition of $16.38$16.43 billion in goodwill, of which $893 million is tax deductible due to a carryover basis from Andeavor. Our Refining & Marketing, Midstream and Retail segments recognized $4.78$4.82 billion, $7.72 billion and $3.88$3.89 billion of preliminary goodwill.goodwill, respectively. The recognized goodwill represents the value expected to be created by further optimization of crude supply, a nationwide retail and marketing platform, diversification of our refining and midstream footprints and optimization of information systems and business processes.
Pro Forma Financial Information
The following unaudited pro forma financial information presents consolidated results assuming the Andeavor acquisition occurred on January 1, 2017. The unaudited pro forma information does not give effect to potential synergies that could result from the transaction and is not necessarily indicative of the results of future operations.
|
| | | | | | | | |
| | | Three Months Ended
June 30, | | Six Months Ended
June 30, |
| (In millions) | | 2018 | | 2018 |
| Sales and other operating revenues | | $ | 34,959 |
| | $ | 64,338 |
|
| Net income attributable to MPC | | 1,452 |
| | 1,478 |
|
|
| | | |
| | Three Months Ended
March 31, |
| (In millions) | 2018 |
| Sales and other operating revenues | $ | 29,206 |
|
| Net income attributable to MPC | 26 |
|
The pro forma information includes adjustments to align accounting policies, including our policy to expense refinery turnarounds when they occur, an adjustment to depreciation expense to reflect the increased fair value of property, plant and equipment, increased amortization expense related to identifiable intangible assets and the related income tax effects.
Acquisition of Express Mart
During the fourth quarter of 2018, Speedway acquired 78 transportation fuel and convenience store locations from Petr-All Petroleum Consulting Corporation for total consideration of $266 million. These stores are located primarily in the Syracuse, Rochester and Buffalo markets in New York and had been operated under the Express Mart brand.
Based on the final fair value estimates of assets acquired and liabilities assumed at the acquisition date, $97 million of the purchase price was allocated to property, plant and equipment, $9 million to inventory, $2 million to intangibles and $158 million to goodwill. Goodwill is tax deductible and represents the value expected to be created by geographically expanding our retail platform and the assembled workforce. These operations are accounted for within the Retail segment.
Acquisition of Mt. Airy Terminal
On September 26, 2018, MPLX acquired an eastern U.S. Gulf Coast export terminal (“Mt. Airy Terminal”) from Pin Oak Holdings, LLC for total consideration of $451 million. At the time of the acquisition, the terminal included tanks with 4 million barrels of third-party leased storage capacity and a dock with 120 mbpd of capacity. The Mt. Airy Terminal is located on the Mississippi River between New Orleans and Baton Rouge, near several Gulf Coast refineries, including our Garyville Refinery, and numerous rail lines and pipelines. The Mt. Airy Terminal is accounted for within the Midstream segment. In the first quarter of 2019, an adjustment to the initial purchase price was made for approximately $5 million related to the final settlement of the acquisition. This reduced the total purchase price to $446 million and resulted in $336 million of property, plant and equipment, $121 million of goodwill and the remainder being attributable to net liabilities assumed.
Goodwill represents the significant growth potential of the terminal due to the multiple pipelines and rail lines which cross the property, the terminal’s position as an aggregation point for liquids growth in the region for both ocean-going vessels and inland barges, the proximity of the terminal to MPC’s Garyville refinery and other refineries in the region as well as the opportunity to construct an additional dock at the site. All of the goodwill recognized related to this transaction is tax deductible.
Assuming the acquisitions of Express Mart and Mt. Airy Terminal had occurred on January 1, 2017, the consolidated pro forma results would not have been materially different from the reported results.
5. VARIABLE INTEREST ENTITIES
Consolidated VIEs
We control MPLX and ANDX through our ownership of the general partner of both entities. MPLX and ANDX are VIEs because the limited partners do not have substantive kick-out or substantive participating rights over the general partner.partners. We are the primary beneficiary of both MPLX and ANDX because in addition to our significant economic interest, we also have the ability, through our ownership of the general partner,partners, to control the decisions that most significantly impact MPLX and ANDX. We therefore consolidate MPLX and ANDX and record a noncontrolling interest for the interest owned by the public. We also record a redeemable noncontrolling interest related to MPLX’s preferred units.
The creditors of MPLX and ANDX do not have recourse to MPC’s general credit through guarantees or other financial arrangements, except as noted. MPC has effectively guaranteed certain indebtedness of LOOP LLC (“LOOP”) and LOCAP LLC (“LOCAP”), in which MPLX holds an interest. See Note 2423 for more information. Western Refining Southwest, Inc., a wholly-owned subsidiary of MPC and unitholder of ANDX, has guaranteed certain outstanding borrowings under the ANDX dropdown credit facility that were made in connection with the August 2018 dropdown transaction.
The assets of MPLX and ANDX can only be used to settle their own obligations and their creditors have no recourse to our assets, except as noted above. The following table presentpresents balance sheet information for the assets and liabilities of MPLX and ANDX, which are included in our balance sheets.
| | | | March 31,
2019 | | December 31,
2018 | June 30,
2019 | | December 31,
2018 |
| (In millions) | MPLX | | ANDX(a) | | MPLX | | ANDX(a) | MPLX | | ANDX(a) | | MPLX | | ANDX(a) |
| Assets | | | | | | | | | | | | | | |
| Cash and cash equivalents | $ | 93 |
| | $ | 29 |
| | $ | 68 |
| | $ | 10 |
| $ | 7 |
| | $ | 25 |
| | $ | 68 |
| | $ | 10 |
|
| Receivables, less allowance for doubtful accounts | 372 |
| | 248 |
| | 425 |
| | 199 |
| 345 |
| | 202 |
| | 425 |
| | 199 |
|
| Inventories | 74 |
| | 21 |
| | 77 |
| | 22 |
| 77 |
| | 22 |
| | 77 |
| | 22 |
|
| Other current assets | 34 |
| | 37 |
| | 45 |
| | 57 |
| 34 |
| | 42 |
| | 45 |
| | 57 |
|
| Equity method investments | 4,270 |
| | 602 |
| | 4,174 |
| | 602 |
| 4,409 |
| | 605 |
| | 4,174 |
| | 602 |
|
| Property, plant and equipment, net | 14,816 |
| | 6,882 |
| | 14,639 |
| | 6,845 |
| 15,021 |
| | 6,929 |
| | 14,639 |
| | 6,845 |
|
| Goodwill | 2,581 |
| | 1,052 |
| | 2,586 |
| | 1,051 |
| 2,581 |
| | 1,052 |
| | 2,586 |
| | 1,051 |
|
| Right of use assets | 262 |
| | 122 |
| | — |
| | — |
| 255 |
| | 121 |
| | — |
| | — |
|
| Other noncurrent assets | 448 |
| | 1,235 |
| | 458 |
| | 1,242 |
| 441 |
| | 1,234 |
| | 458 |
| | 1,242 |
|
| Liabilities | | | | | | | | | | | | | | |
| Accounts payable | $ | 583 |
| | $ | 177 |
| | $ | 776 |
| | $ | 215 |
| $ | 532 |
| | $ | 290 |
| | $ | 776 |
| | $ | 215 |
|
| Payroll and benefits payable | 4 |
| | 1 |
| | 2 |
| | 10 |
| 5 |
| | 1 |
| | 2 |
| | 10 |
|
| Accrued taxes | 40 |
| | 20 |
| | 48 |
| | 23 |
| 57 |
| | 19 |
| | 48 |
| | 23 |
|
| Debt due within one year | 1 |
| | 503 |
| | 1 |
| | 504 |
| 6 |
| | 503 |
| | 1 |
| | 504 |
|
| Operating lease liabilities | 46 |
| | 12 |
| | — |
| | — |
| 47 |
| | 12 |
| | — |
| | — |
|
| Other current liabilities | 189 |
| | 117 |
| | 177 |
| | 77 |
| 204 |
| | 88 |
| | 177 |
| | 77 |
|
| Long-term debt | 13,832 |
| | 4,629 |
| | 13,392 |
| | 4,469 |
| 14,030 |
| | 4,726 |
| | 13,392 |
| | 4,469 |
|
| Deferred income taxes | 12 |
| | 1 |
| | 13 |
| | 1 |
| 11 |
| | 1 |
| | 13 |
| | 1 |
|
| Long-term operating lease liabilities | 216 |
| | 109 |
| | — |
| | — |
| 209 |
| | 108 |
| | — |
| | — |
|
| Deferred credits and other liabilities | 289 |
| | 66 |
| | 276 |
| | 68 |
| 303 |
| | 78 |
| | 276 |
| | 68 |
|
| |
(a) | The balances reflected here are ANDX’s historical balances as the preliminary purchase accounting adjustments related to ANDX’s assets and liabilities in connection with the Andeavor acquisition and reflected on our consolidated balance sheets as of June 30, 2019 and December 31, 2018 and March 31, 2019 have not yet been pushed down to this subsidiary. |
6. RELATED PARTY TRANSACTIONS
Transactions with related parties were as follows: |
| | | | | | | | | | | | | | | |
| | Three Months Ended
June 30, | | Six Months Ended
June 30, |
| (In millions) | 2019 | | 2018 | | 2019 | | 2018 |
Sales to related parties(a) | $ | 186 |
| | $ | 199 |
| | $ | 372 |
| | $ | 371 |
|
Purchases from related parties(b) | 183 |
| | 138 |
| | 387 |
| | 279 |
|
|
| | | | | | | |
| | Three Months Ended
March 31, |
| (In millions) | 2019 | | 2018 |
Sales to related parties(a) | $ | 186 |
| | $ | 172 |
|
Purchases from related parties(b) | 204 |
| | 141 |
|
| |
(a) | Sales to related parties, consistswhich are included in sales and other operating revenues, consist primarily of sales of refined products to PFJ Southeast, an equity affiliate which owns and operates travel plazas primarily in the Southeast region of the United States. |
| |
(b) | Purchases from related parties are included in cost of revenues. We obtain utilities, transportation services and purchase ethanol from certain of our equity affiliates. |
Summarized financial information, in the aggregate, for our significant equity method investments on a 100 percent basis were as follows:
|
| | | | | | | |
| | Three Months Ended
March 31, |
| (In millions) | 2019 | | 2018 |
| Revenues and other income | $ | 1,628 |
| | $ | 1,503 |
|
| Income from operations | 336 |
| | 254 |
|
| Net income | 314 |
| | 274 |
|
7. INCOME (LOSS)EARNINGS PER COMMON SHARE
We compute basic earnings per share by dividing net income attributable to MPC less income allocated to participating securities by the weighted average number of shares of common stock outstanding. Since MPC grants certain incentive compensation awards to employees and non-employee directors that are considered to be participating securities, we have calculated our earnings per share using the two-class method. Diluted income per share assumes exercise of certain stock-based compensation awards, provided the effect is not anti-dilutive.
|
| | | | | | | |
| | Three Months Ended
March 31, |
| (In millions, except per share data) | 2019 | | 2018 |
| Basic earnings (loss) per share: | | | |
| Allocation of earnings: | | | |
| Net income (loss) attributable to MPC | $ | (7 | ) | | $ | 37 |
|
| Income allocated to participating securities | — |
| | — |
|
| Income (loss) available to common stockholders – basic | $ | (7 | ) | | $ | 37 |
|
| Weighted average common shares outstanding | 673 |
| | 476 |
|
| Basic earnings (loss) per share | $ | (0.01 | ) | | $ | 0.08 |
|
| Diluted earnings (loss) per share: | | | |
| Allocation of earnings: | | | |
| Net income (loss) attributable to MPC | $ | (7 | ) | | $ | 37 |
|
| Income allocated to participating securities | — |
| | — |
|
| Income (loss) available to common stockholders – diluted | $ | (7 | ) | | $ | 37 |
|
| Weighted average common shares outstanding | 673 |
| | 476 |
|
| Effect of dilutive securities | — |
| | 4 |
|
| Weighted average common shares, including dilutive effect | 673 |
| | 480 |
|
| Diluted earnings (loss) per share | $ | (0.01 | ) | | $ | 0.08 |
|
|
| | | | | | | | | | | | | | | |
| | Three Months Ended
June 30, | | Six Months Ended
June 30, |
| (In millions, except per share data) | 2019 | | 2018 | | 2019 | | 2018 |
| Basic earnings per share: | | | | | | | |
| Allocation of earnings: | | | | | | | |
| Net income attributable to MPC | $ | 1,106 |
| | $ | 1,055 |
| | $ | 1,099 |
| | $ | 1,092 |
|
| Income allocated to participating securities | — |
| | 1 |
| | 1 |
| | 1 |
|
| Income available to common stockholders – basic | $ | 1,106 |
| | $ | 1,054 |
| | $ | 1,098 |
| | $ | 1,091 |
|
| Weighted average common shares outstanding | 662 |
| | 459 |
| | 667 |
| | 467 |
|
| Basic earnings per share | $ | 1.67 |
| | $ | 2.30 |
| | $ | 1.65 |
| | $ | 2.34 |
|
| Diluted earnings per share: | | | | | | | |
| Allocation of earnings: | | | | | | | |
| Net income attributable to MPC | $ | 1,106 |
| | $ | 1,055 |
| | $ | 1,099 |
| | $ | 1,092 |
|
| Income allocated to participating securities | — |
| | 1 |
| | 1 |
| | 1 |
|
| Income available to common stockholders – diluted | $ | 1,106 |
| | $ | 1,054 |
| | $ | 1,098 |
| | $ | 1,091 |
|
| Weighted average common shares outstanding | 662 |
| | 459 |
| | 667 |
| | 467 |
|
| Effect of dilutive securities | 4 |
| | 5 |
| | 5 |
| | 5 |
|
| Weighted average common shares, including dilutive effect | 666 |
| | 464 |
| | 672 |
| | 472 |
|
| Diluted earnings per share | $ | 1.66 |
| | $ | 2.27 |
| | $ | 1.63 |
| | $ | 2.31 |
|
The following table summarizes the shares that were anti-dilutive and, therefore, were excluded from the diluted share calculation.
|
| | | | | | | | | | | |
| | Three Months Ended
June 30, | | Six Months Ended
June 30, |
| (In millions) | 2019 | | 2018 | | 2019 | | 2018 |
| Shares issuable under stock-based compensation plans | 4 |
| | 1 |
| | 3 |
| | 1 |
|
|
| | | | | |
| | Three Months Ended
March 31, |
| (In millions) | 2019 | | 2018 |
| Shares issuable under stock-based compensation plans | 7 |
| | — |
|
8. EQUITY
As of March 31,June 30, 2019, we had $4.02$3.52 billion of share repurchase authorization remaining under authorizations from our board of directors. We may utilize various methods to effect the repurchases, which could include open market repurchases, negotiated block transactions, accelerated share repurchases or open market solicitations for shares, some of which may be effected through Rule 10b5-1 plans. The timing and amount of future repurchases, if any, will depend upon several factors, including market and business conditions, and such repurchases may be discontinued at any time.
Total share repurchases were as follows:
|
| | | | | | | | | | | | | | | |
| | Three Months Ended
June 30, | | Six Months Ended
June 30, |
| (In millions, except per share data) | 2019 | | 2018 | | 2019 | | 2018 |
| Number of shares repurchased | 9 |
| | 12 |
| | 23 |
| | 31 |
|
| Cash paid for shares repurchased | $ | 500 |
| | $ | 885 |
| | $ | 1,385 |
| | $ | 2,212 |
|
| Average cost per share | $ | 57.18 |
| | $ | 76.30 |
| | $ | 60.75 |
| | $ | 71.58 |
|
|
| | | | | | | |
| | Three Months Ended
March 31, |
| (In millions, except per share data) | 2019 | | 2018 |
| Number of shares repurchased | 14 |
| | 19 |
|
| Cash paid for shares repurchased | $ | 885 |
| | $ | 1,327 |
|
| Average cost per share | $ | 62.98 |
| | $ | 68.74 |
|
As of March 31,June 30, 2019, we had agreements to acquire 493,625109,200 common shares for $30$6 million, which settled in early AprilJuly 2019.
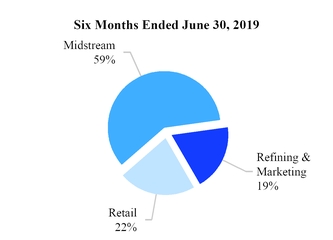
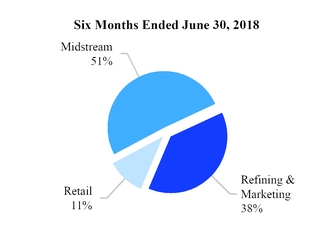
9. SEGMENT INFORMATION
We have three reportable segments: Refining & Marketing; Retail; and Midstream. Each of these segments is organized and managed based upon the nature of the products and services it offers.
| |
| • | Refining & Marketing – refines crude oil and other feedstocks at our 16 refineries in the WestGulf Coast, Mid-Continent and GulfWest Coast regions of the United States, purchases refined products and ethanol for resale and distributes refined products through transportation, storage, distribution and marketing services provided largely by our Midstream segment. We sell refined products to wholesale marketing customers domestically and internationally, to buyers on the spot market, to our Retail business segment and to independent entrepreneurs who operate primarily Marathon® branded outlets. |
| |
| • | Retail – sells transportation fuels and convenience products in the retail market across the United States through company-owned and operated convenience stores, primarily under the Speedway® brand, and long-term fuel supply contracts with direct dealers who operate locations primarily under the ARCO® brand. |
Midstream – transports, stores, distributes and markets crude oil and refined products principally for the Refining & Marketing segment via refining logistics assets, pipelines, terminals, towboats and barges; gathers, processes and transports natural gas; and gathers, transports, fractionates, stores and markets NGLs. The Midstream segment primarily reflects the results of MPLX and ANDX, our sponsored master limited partnerships.ANDX.
Segment income represents income from operations attributable to the reportable segments. Corporate administrative expenses, except for those attributable to MPLX and ANDX, and costs related to certain non-operating assets are not allocated to the Refining & Marketing and Retail segments. In addition, certain items that affect comparability (as determined by the chief operating decision maker) are not allocated to the reportable segments.
| | | (In millions) | Refining & Marketing | | Retail | | Midstream | | Total | Refining & Marketing | | Retail | | Midstream | | Total |
| Three Months Ended March 31, 2019 | | | | | | | | |
| Three Months Ended June 30, 2019 | | | | | | | | |
| Revenues: | | | | | | | | | | | | | | |
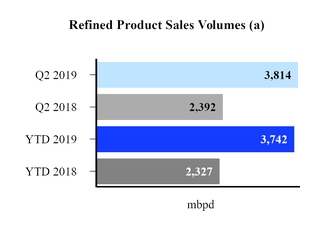
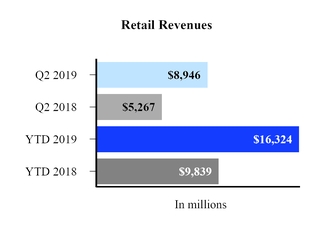
Third party | $ | 19,751 |
| | $ | 7,373 |
| | $ | 957 |
| | $ | 28,081 |
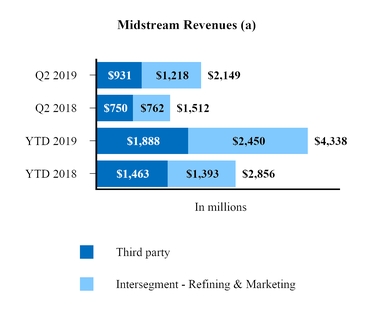
| $ | 23,672 |
| | $ | 8,944 |
| | $ | 931 |
| | $ | 33,547 |
|
| Intersegment | 4,429 |
| | 2 |
| | 1,232 |
| | 5,663 |
| 5,482 |
| | 2 |
| | 1,218 |
| | 6,702 |
|
| Related party | 183 |
| | 3 |
| | — |
| | 186 |
| |
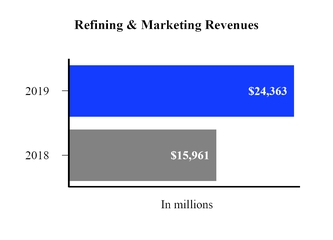
| Segment revenues | $ | 24,363 |
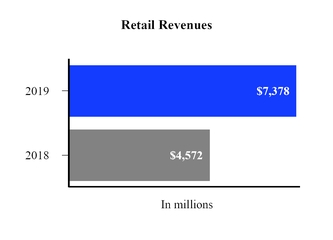
| | $ | 7,378 |
| | $ | 2,189 |
| | $ | 33,930 |
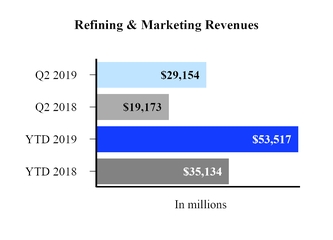
| $ | 29,154 |
| | $ | 8,946 |
| | $ | 2,149 |
| | $ | 40,249 |
|
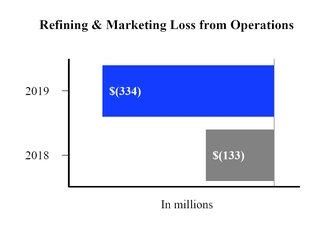
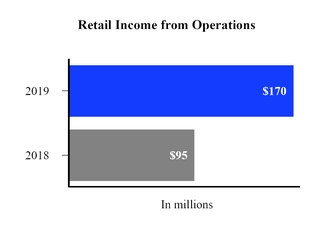
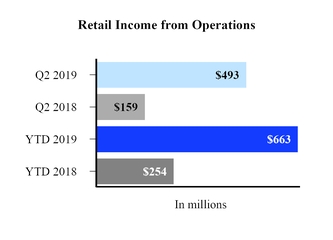
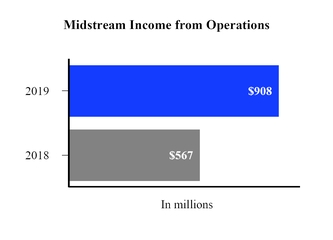
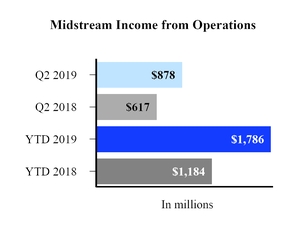
| Segment income (loss) from operations | $ | (334 | ) | | $ | 170 |
| | $ | 908 |
| | $ | 744 |
| |
| Income from equity method investments | 1 |
| | 17 |
| | 81 |
| | 99 |
| |
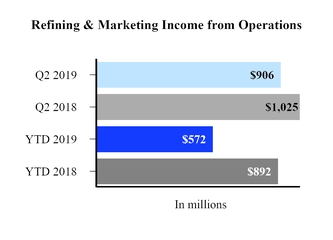
| Segment income from operations | | $ | 906 |
| | $ | 493 |
| | $ | 878 |
| | $ | 2,277 |
|
| | | | | | | | | |
| Supplemental Data | | | | | | | | |
Depreciation and amortization(a)(b) | 427 |
| | 126 |
| | 307 |
| | 860 |
| $ | 411 |
| | $ | 130 |
| | $ | 318 |
| | $ | 859 |
|
Capital expenditures and investments(b)(c) | 394 |
| | 73 |
| | 823 |
| | 1,290 |
| 430 |
| | 120 |
| | 814 |
| | 1,364 |
|
| | | (In millions) | Refining & Marketing | | Retail | | Midstream | | Total | Refining & Marketing | | Retail | | Midstream | | Total |
| Three Months Ended March 31, 2018 | | | | | | | | |
| Three Months Ended June 30, 2018 | | | | | | | | |
| Revenues: | | | | | | | | | | | | | | |
Third party | $ | 13,412 |
| | $ | 4,569 |
| | $ | 713 |
| | $ | 18,694 |
| $ | 16,302 |
| | $ | 5,265 |
| | $ | 750 |
| | $ | 22,317 |
|
| Intersegment | 2,379 |
| | 1 |
| | 631 |
| | 3,011 |
| 2,871 |
| | 2 |
| | 762 |
| | 3,635 |
|
| Related party | 170 |
| | 2 |
| | — |
| | 172 |
| |
| Segment revenues | $ | 15,961 |
| | $ | 4,572 |
| | $ | 1,344 |
| | $ | 21,877 |
| $ | 19,173 |
| | $ | 5,267 |
| | $ | 1,512 |
| | $ | 25,952 |
|
| Segment income (loss) from operations | $ | (133 | ) | | $ | 95 |
| | $ | 567 |
| | $ | 529 |
| |
| Income from equity method investments | 3 |
| | 14 |
| | 69 |
| | 86 |
| |
| Segment income from operations | | $ | 1,025 |
| | $ | 159 |
| | $ | 617 |
| | $ | 1,801 |
|
| | | | | | | | | |
| Supplemental Data | | | | | | | | |
Depreciation and amortization(a)(b) | 252 |
| | 79 |
| | 181 |
| | 512 |
| $ | 252 |
| | $ | 73 |
| | $ | 191 |
| | $ | 516 |
|
Capital expenditures and investments(b)(c) | 191 |
| | 39 |
| | 482 |
| | 712 |
| 196 |
| | 88 |
| | 601 |
| | 885 |
|
|
| | | | | | | | | | | | | | | |
| (In millions) | Refining & Marketing | | Retail | | Midstream | | Total |
| Six Months Ended June 30, 2019 | | | | | | | |
| Revenues: | | | | | | | |
Third party(a) | $ | 43,606 |
| | $ | 16,320 |
| | $ | 1,888 |
| | $ | 61,814 |
|
| Intersegment | 9,911 |
| | 4 |
| | 2,450 |
| | 12,365 |
|
| Segment revenues | $ | 53,517 |
| | $ | 16,324 |
| | $ | 4,338 |
| | $ | 74,179 |
|
| Segment income from operations | $ | 572 |
| | $ | 663 |
| | $ | 1,786 |
| | $ | 3,021 |
|
| | | | | | | | |
| Supplemental Data | | | | | | | |
Depreciation and amortization(b) | $ | 838 |
| | $ | 256 |
| | $ | 625 |
| | $ | 1,719 |
|
Capital expenditures and investments(c) | 824 |
| | 193 |
| | 1,637 |
| | 2,654 |
|
|
| | | | | | | | | | | | | | | |
| (In millions) | Refining & Marketing | | Retail | | Midstream | | Total |
| Six Months Ended June 30, 2018 | | | | | | | |
| Revenues: | | | | | | | |
Third party(a) | $ | 29,884 |
| | $ | 9,836 |
| | $ | 1,463 |
| | $ | 41,183 |
|
| Intersegment | 5,250 |
| | 3 |
| | 1,393 |
| | 6,646 |
|
| Segment revenues | $ | 35,134 |
| | $ | 9,839 |
| | $ | 2,856 |
| | $ | 47,829 |
|
| Segment income from operations | $ | 892 |
| | $ | 254 |
| | $ | 1,184 |
| | $ | 2,330 |
|
| | | | | | | | |
| Supplemental Data | | | | | | | |
Depreciation and amortization(b) | $ | 504 |
| | $ | 152 |
| | $ | 372 |
| | $ | 1,028 |
|
Capital expenditures and investments(c) | 387 |
| | 127 |
| | 1,083 |
| | 1,597 |
|
| |
(a) | Includes related party sales. See Note 6 for additional information. |
| |
(b) | Differences between segment totals and MPC consolidated totals represent amounts related to corporate and other unallocated items and are included in items not allocated to segments in the reconciliation below. |
| |
(b)(c)
| Capital expenditures include changes in capital accruals and investments in affiliates. See reconciliation from segment totals to MPC consolidated total capital expenditures below. |
The following reconciles segment income from operations to income before income taxes as reported in the consolidated statements of income:
| | | | Three Months Ended
March 31, | Three Months Ended
June 30, | | Six Months Ended
June 30, |
| (In millions) | 2019 | | 2018 | 2019 | | 2018 | | 2019 | | 2018 |
| Segment income from operations | $ | 744 |
| | $ | 529 |
| $ | 2,277 |
| | $ | 1,801 |
| | $ | 3,021 |
| | $ | 2,330 |
|
| Items not allocated to segments: | | | | | | | | | | |
Corporate and other unallocated items(a) | (191 | ) | | (89 | ) | (179 | ) | | (81 | ) | | (370 | ) | | (170 | ) |
Capline restructuring gain(b) | 207 |
| | — |
| — |
| | �� |
| | 207 |
| | — |
|
Transaction-related costs(c) | (91 | ) | | — |
| (34 | ) | | (10 | ) | | (125 | ) | | (10 | ) |
| Litigation | | (22 | ) | | — |
| | (22 | ) | | — |
|
| Impairments | | — |
| | 1 |
| | — |
| | 1 |
|
| Income from operations | 669 |
| | 440 |
| 2,042 |
| | 1,711 |
| | 2,711 |
| | 2,151 |
|
| Net interest and other financial costs | 306 |
| | 183 |
| 322 |
| | 195 |
| | 628 |
| | 378 |
|
| Income before income taxes | $ | 363 |
| | $ | 257 |
| $ | 1,720 |
| | $ | 1,516 |
| | $ | 2,083 |
| | $ | 1,773 |
|
| |
(a) | Corporate and other unallocated items consistsconsist primarily of MPC’s corporate administrative expenses and costs related to certain non-operating assets, except for corporate overhead expenses attributable to MPLX and ANDX, which are included in the Midstream segment. Corporate overhead expenses are not allocated to the Refining & Marketing and Retail segments. |
| |
(c) | The transaction-related costs recognized in the first quarter largely relate to2019 year-to-date period include the recognition of an obligation for vacationemployee benefits provided to former Andeavor employees. |
The following reconciles segment capital expenditures and investments to total capital expenditures:
|
| | | | | | | | | | | | | | | |
| | Three Months Ended
June 30, | | Six Months Ended
June 30, |
| (In millions) | 2019 | | 2018 | | 2019 | | 2018 |
| Segment capital expenditures and investments | $ | 1,364 |
| | $ | 885 |
| | $ | 2,654 |
| | $ | 1,597 |
|
| Less investments in equity method investees | 270 |
| | 77 |
| | 595 |
| | 118 |
|
| Plus items not allocated to segments: | | | | | | | |
| Corporate | 4 |
| | 17 |
| | 14 |
| | 35 |
|
| Capitalized interest | 34 |
| | 16 |
| | 65 |
| | 34 |
|
Total capital expenditures(a) | $ | 1,132 |
| | $ | 841 |
| | $ | 2,138 |
| | $ | 1,548 |
|
|
| | | | | | | |
| | Three Months Ended
March 31, |
| (In millions) | 2019 | | 2018 |
| Segment capital expenditures and investments | $ | 1,290 |
| | $ | 712 |
|
| Less investments in equity method investees | 325 |
| | 41 |
|
| Plus items not allocated to segments: | | | |
| Corporate | 10 |
| | 18 |
|
| Capitalized interest | 31 |
| | 18 |
|
Total capital expenditures(a) | $ | 1,006 |
| | $ | 707 |
|
| |
(a) | Capital expenditures include changes in capital accruals. See Note 19 for a reconciliation of total capital expenditures to additions to property, plant and equipment for the six months ended June 30, 2019 and 2018 as reported in the consolidated statements of cash flows. |
10. NET INTEREST AND OTHER FINANCIAL COSTS
Net interest and other financial costs were as follows:
|
| | | | | | | | | | | | | | | |
| | Three Months Ended
June 30, | | Six Months Ended
June 30, |
| (In millions) | 2019 | | 2018 | | 2019 | | 2018 |
| Interest income | $ | (9 | ) | | $ | (25 | ) | | $ | (18 | ) | | $ | (45 | ) |
| Interest expense | 350 |
| | 229 |
| | 690 |
| | 442 |
|
| Interest capitalized | (35 | ) | | (16 | ) | | (67 | ) | | (34 | ) |
Pension and other postretirement non-service costs(a) | 3 |
| | 2 |
| | — |
| | 2 |
|
| Loss on extinguishment of debt | — |
| | — |
| | — |
| | 4 |
|
| Other financial costs | 13 |
| | 5 |
| | 23 |
| | 9 |
|
| Net interest and other financial costs | $ | 322 |
| | $ | 195 |
| | $ | 628 |
| | $ | 378 |
|
|
| | | | | | | |
| | Three Months Ended
March 31, |
| (In millions) | 2019 | | 2018 |
| Interest income | $ | (9 | ) | | $ | (20 | ) |
| Interest expense | 340 |
| | 213 |
|
| Interest capitalized | (32 | ) | | (18 | ) |
Pension and other postretirement non-service costs(a) | (3 | ) | | — |
|
| Loss on extinguishment of debt | — |
| | 4 |
|
| Other financial costs | 10 |
| | 4 |
|
| Net interest and other financial costs | $ | 306 |
| | $ | 183 |
|
11. INCOME TAXES
The combined federal, state and foreign income tax rate was 2921 percent and 919 percent for the three months ended March 31,June 30, 2019 and 2018, respectively, and 22 percent and 17 percent for the six months ended June 30, 2019 and 2018, respectively. The effective tax rate for the three months ended March 31,June 30, 2019 was equal to the U.S. statutory rate of 21 percent primarily due to certain permanent tax differences related to net income attributable to noncontrolling interests offset by equity compensation and state and local tax expense. The effective tax rate for the six months ended June 30, 2019 was greater than the U.S. statutory rate of 21 percent primarily due to $36 million of state deferred tax expense recorded as an out of period adjustment, partially offset by permanent tax differences related to net income attributable to noncontrolling interests. The effective tax rate for the three and six months ended March 31,June 30, 2018 was less than the U.S. statutory rate primarily due to certain permanent tax differences related to net income attributable to noncontrolling interests and equity compensation offset by state and local deferred tax benefits primarily resulting from the February 1 dropdown and GP/IDR Exchange and equity compensation.expense.
During the first quarter of 2019, MPC’s deferred tax liabilities increased $68 million with an offsetting increase to goodwill and the provision for income taxes of $32$32 million and $36 million, respectively for an out of period adjustment to correct the tax effects recorded in 2018 related to the Andeavor acquisition. The impact of the adjustment was not material to any previous period.
We are continuously undergoing examination of our income tax returns, which have been completed through the 20052006 tax year for state returns and the 2008 tax year for our U.S. federal return. As of March 31,June 30, 2019, we had $231$202 million of unrecognized tax benefits.
Prior to its spinoff on June 30, 2011, Marathon Petroleum Corporation was included in the Marathon Oil Corporation (“Marathon Oil”) U.S. federal income tax returns for all applicable years. During the third quarter of 2017, Marathon Oil received a notice of Final Partnership Administrative Adjustment (“FPAA”) from the U.S. Internal Revenue Service for taxable year 2010, relating to certain partnership transactions. Marathon Oil filed a U.S. Tax Court petition disputing these adjustments during the fourth quarter of 2017. We received an FPAA for taxable years 2011-2014 for items resulting from this matter and filed a U.S. Tax Court petition for tax years 2011-2014 to dispute these corollary adjustments in the fourth quarter of 2017. We continue to believe that the issue in dispute is more likely than not to be fully sustained and, therefore, no liability has been accrued for this matter.
Pursuant to our tax sharing agreement with Marathon Oil, the unrecognized tax benefits related to pre-spinoff operations for which Marathon Oil was the taxpayer remain the responsibility of Marathon Oil and we have indemnified Marathon Oil accordingly. See Note 2423 for indemnification information.
12. INVENTORIES
|
| | | | | | | |
| (In millions) | June 30,
2019 | | December 31,
2018 |
| Crude oil and refinery feedstocks | $ | 3,468 |
| | $ | 3,655 |
|
| Refined products | 4,601 |
| | 5,234 |
|
| Materials and supplies | 801 |
| | 720 |
|
| Merchandise | 218 |
| | 228 |
|
| Total | $ | 9,088 |
| | $ | 9,837 |
|
|
| | | | | | | |
| (In millions) | March 31,
2019 | | December 31,
2018 |
| Crude oil and refinery feedstocks | $ | 3,689 |
| | $ | 3,655 |
|
| Refined products | 5,186 |
| | 5,234 |
|
| Materials and supplies | 744 |
| | 720 |
|
| Merchandise | 214 |
| | 228 |
|
| Total | $ | 9,833 |
| | $ | 9,837 |
|
Inventories are carried at the lower of cost or market value. The cost of inventories of crude oil and refinery feedstocks, refined products and merchandise is determined primarily under the LIFO method. There were no LIFO inventory liquidations recognized for the threesix months ended March 31,June 30, 2019.
13. EQUITY METHOD INVESTMENTS
During the three months ended March 31, 2019, we executed agreements with Capline Pipeline Company LLC (“Capline LLC”) to contribute our 33 percent undivided interest in Capline pipeline system in exchange for a 33 percent ownership interest in Capline LLC. Concurrent with our execution of these agreements, Capline LLC initiated a binding open season for southbound service from Patoka, IL to St. James, LA or Liberty, MS, with an additional origination point at Cushing, OK. Service from Cushing, OK is part of a joint tariff with Diamond pipeline. Crude oil service is expected to begin in the third quarter of 2020.
In accordance with ASC 810, “Consolidation���, we derecognized our undivided interest amounting to $143 million of net assets and recognized the Capline LLC ownership interest we received at fair value. We used an income approach to determine the fair value of our ownership interest under a Monte Carlo simulation method. We determinedestimated the fair value of our ownership interest was estimated to be $350 million as of January 30, 2019. This is a nonrecurring fair value measurement and is categorized in level 3 of the fair value hierarchy. The Monte Carlo simulation inputs include ranges of tariff rates, operating
volumes, operating cost and capital expenditure assumptions. The estimated cash flows were discounted using a Monte Carlo market participant weighted average cost of capital estimate. None of the inputs to the Monte Carlo simulation are individually significant. The excess of the estimated fair value of our ownership interest over the carrying value of the derecognized net assets resulted in a $207 million non cashnon-cash net gain recorded as a net gain on disposal of assets in the accompanying consolidated statements of income.
As the Capline system is currently idled, Capline LLC is unable to fund its operations without financial support from its equity owners and is a VIE. MPC is not deemed to be the primary beneficiary, due to our inability to unilaterally control significant decision-making rights. Our maximum exposure to loss as a result of our involvement with Capline LLC includes our equity investment, any additional capital contribution commitments and any operating expenses incurred by Capline LLC in excess of compensation received for performance of the operating services.
14. PROPERTY, PLANT AND EQUIPMENT
|
| | | | | | | |
| (In millions) | June 30,
2019 | | December 31,
2018 |
| Refining & Marketing | $ | 28,429 |
| | $ | 27,590 |
|
| Retail | 6,767 |
| | 6,637 |
|
| Midstream | 26,472 |
| | 25,692 |
|
| Corporate and Other | 1,234 |
| | 1,294 |
|
| Total | 62,902 |
| | 61,213 |
|
| Less accumulated depreciation | 17,567 |
| | 16,155 |
|
| Property, plant and equipment, net | $ | 45,335 |
| | $ | 45,058 |
|
|
| | | | | | | |
| (In millions) | March 31,
2019 | | December 31,
2018 |
| Refining & Marketing | $ | 27,968 |
| | $ | 27,590 |
|
| Retail | 6,681 |
| | 6,637 |
|
| Midstream | 25,929 |
| | 25,692 |
|
| Corporate and Other | 1,304 |
| | 1,294 |
|
| Total | 61,882 |
| | 61,213 |
|
| Less accumulated depreciation | 16,791 |
| | 16,155 |
|
| Property, plant and equipment, net | $ | 45,091 |
| | $ | 45,058 |
|
15. FAIR VALUE MEASUREMENTS
Fair Values—Recurring
The following tables present assets and liabilities accounted for at fair value on a recurring basis as of March 31,June 30, 2019 and December 31, 2018 by fair value hierarchy level. We have elected to offset the fair value amounts recognized for multiple derivative contracts executed with the same counterparty, including any related cash collateral as shown below; however, fair value amounts by hierarchy level are presented on a gross basis in the following tables.
| | | | March 31, 2019 | June 30, 2019 |
| | Fair Value Hierarchy | | | | | | | Fair Value Hierarchy | | | | | | |
| (In millions) | Level 1 | | Level 2 | | Level 3 | | Netting and Collateral(a) | | Net Carrying Value on Balance Sheet(b) | | Collateral Pledged Not Offset | Level 1 | | Level 2 | | Level 3 | | Netting and Collateral(a) | | Net Carrying Value on Balance Sheet(b) | | Collateral Pledged Not Offset |
| Assets: | | | | | | | | | | | | | | | | | | | | | | |
| Commodity contracts | $ | 122 |
| | $ | 18 |
| | $ | — |
| | $ | (128 | ) | | $ | 12 |
| | $ | 42 |
| $ | 227 |
| | $ | 12 |
| | $ | — |
| | $ | (200 | ) | | $ | 39 |
| | $ | 68 |
|
| Liabilities: | | | | | | | | | | | | | | | | | | | | | | |
| Commodity contracts | $ | 142 |
| | $ | 24 |
| | $ | — |
| | $ | (161 | ) | | $ | 5 |
| | $ | — |
| $ | 193 |
| | $ | 12 |
| | $ | — |
| | $ | (203 | ) | | $ | 2 |
| | $ | — |
|
| Embedded derivatives in commodity contracts | — |
| | — |
| | 65 |
| | — |
| | 65 |
| | — |
| — |
| | — |
| | 65 |
| | — |
| | 65 |
| | — |
|
|
| | | | | | | | | | | | | | | | | | | | | | | |
| | December 31, 2018 |
| | Fair Value Hierarchy | | | | | | |
| (In millions) | Level 1 | | Level 2 | | Level 3 | | Netting and Collateral(a) | | Net Carrying Value on Balance Sheet(b) | | Collateral Pledged Not Offset |
| Assets: | | | | | | | | | | | |
| Commodity contracts | $ | 370 |
| | $ | 31 |
| | $ | — |
| | $ | (323 | ) | | $ | 78 |
| | $ | 2 |
|
| Liabilities: | | | | | | | | | | | |
| Commodity contracts | $ | 255 |
| | $ | 37 |
| | $ | — |
| | $ | (284 | ) | | $ | 8 |
| | $ | — |
|
| Embedded derivatives in commodity contracts | — |
| | — |
| | 61 |
| | — |
| | 61 |
| | — |
|
| |
(a) | Represents the impact of netting assets, liabilities and cash collateral when a legal right of offset exists. As of March 31,June 30, 2019, cash collateral of $33$3 million was netted with the mark-to-market derivative liabilities. As of December 31, 2018, cash collateral of $52 million was netted with mark-to-market derivative assets and $13 million was netted with mark-to-market derivative liabilities. |
| |
(b) | We have no derivative contracts that are subject to master netting arrangements reflected gross on the balance sheet. |
Commodity derivatives in Level 1 are exchange-traded contracts for crude oil and refined products measured at fair value with a market approach using the close-of-day settlement prices for the market. Commodity derivatives are covered under master netting agreements with an unconditional right to offset. Collateral deposits in futures commission merchant accounts covered by master netting agreements related to Level 1 commodity derivatives are classified as Level 1 in the fair value hierarchy.
Level 2 instruments are valued based on quoted prices for similar assets and liabilities in active markets, and inputs other than quoted prices, such as liquidity, that are observable for the asset or liability. Commodity derivatives in Level 2 are OTC contracts, which are valued using market quotations from independent price reporting agencies, third-party brokers and commodity exchange price curves that are corroborated with market data.
Level 3 instruments are OTC NGL contracts and embedded derivatives in commodity contracts. The embedded derivative liability relates to a natural gas purchase agreement embedded in a keep‑whole processing agreement. The fair value calculation for these Level 3 instruments at March 31,June 30, 2019 used significant unobservable inputs including: (1) NGL prices interpolated and extrapolated due to inactive markets ranging from $0.60$0.46 to $1.25$1.14 per gallon and (2) the probability of renewal of 9192 percent for the first five-year termfive-term and 82 percent for the second five-year termfive-term of the natural gas purchase agreement and the related keep-whole processing agreement. For these contracts, increases in forward NGL prices result in a decrease in the fair value of the derivative assets and an increase in the fair value of the derivative liabilities. Increases or decreases in the fractionation spread result in an increase or decrease in the fair value of the embedded derivative liability. An increase in the probability of renewal would result in an increase in the fair value of the related embedded derivative liability.
The following is a reconciliation of the beginning and ending balances recorded for net liabilities classified as Level 3 in the fair value hierarchy.
|
| | | | | | | | | | | | | | | |
| | Three Months Ended
June 30, | | Six Months Ended
June 30, |
| (In millions) | 2019 | | 2018 | | 2019 | | 2018 |
| Beginning balance | $ | 65 |
| | $ | 60 |
| | $ | 61 |
| | $ | 66 |
|
| Unrealized and realized losses included in net income | 1 |
| | 12 |
| | 7 |
| | 9 |
|
| Settlements of derivative instruments | (1 | ) | | (4 | ) | | (3 | ) | | (7 | ) |
| Ending balance | $ | 65 |
| | $ | 68 |
| | $ | 65 |
| | $ | 68 |
|
| | | | | | | | |
| The amount of total losses for the period included in earnings attributable to the change in unrealized losses relating to assets still held at the end of period: | $ | 2 |
| | $ | 11 |
| | $ | 5 |
| | $ | 5 |
|
|
| | | | | | | |
| | Three Months Ended
March 31, |
| (In millions) | 2019 | | 2018 |
| Beginning balance | $ | 61 |
| | $ | 66 |
|
| Unrealized and realized losses included in net income | 6 |
| | (3 | ) |
| Settlements of derivative instruments | (2 | ) | | (3 | ) |
| Ending balance | $ | 65 |
| | $ | 60 |
|
| | | | |
| The amount of total losses for the period included in earnings attributable to the change in unrealized losses relating to assets still held at the end of period: | $ | 5 |
| | $ | (3 | ) |
Fair Values – Reported
We believe the carrying value of our other financial instruments, including cash and cash equivalents, receivables, accounts payable and certain accrued liabilities, approximate fair value. Our fair value assessment incorporates a variety of considerations, including the short-term duration of the instruments and the expected insignificance of bad debt expense, which includes an evaluation of counterparty credit risk. The borrowings under our revolving credit facilities, which include variable interest rates, approximate fair value. The fair value of our fixed rate long-term debt is based on prices from recent trade activity and is categorized in level 3 of the fair value hierarchy. The carrying and fair values of our debt were approximately $27.6$27.9 billion and $28.5$29.4 billion at March 31,June 30, 2019, respectively, and approximately $27.0 billion and $26.5 billion at
December 31, 2018, respectively. These carrying and fair values of our debt exclude the unamortized issuance costs which are netted against our total debt.
16. DERIVATIVES
For further information regarding the fair value measurement of derivative instruments, including any effect of master netting agreements or collateral, see Note 15. We do not designate any of our commodity derivative instruments as hedges for accounting purposes.
Derivatives that are not designated as accounting hedges may include commodity derivatives used to hedge price risk on (1) inventories, (2) fixed price sales of refined products, (3) the acquisition of foreign-sourced crude oil, (4) the acquisition of ethanol for blending with refined products, (5) the sale of NGLs and (6) the purchase of natural gas.
The following table presents the fair value of derivative instruments as of March 31,June 30, 2019 and December 31, 2018 and the line items in the balance sheets in which the fair values are reflected. The fair value amounts below are presented on a gross basis and do not reflect the netting of asset and liability positions permitted under the terms of our master netting arrangements including cash collateral on deposit with, or received from, brokers. We offset the recognized fair value amounts for multiple derivative instruments executed with the same counterparty in our financial statements when a legal right of offset exists. As a result, the asset and liability amounts below will not agree with the amounts presented in our consolidated balance sheets.
| | | (In millions) | March 31, 2019 | June 30, 2019 |
| Balance Sheet Location | Asset | | Liability | Asset | | Liability |
| Commodity derivatives | | | | | | |
| Other current assets | $ | 139 |
| | $ | 160 |
| $ | 237 |
| | $ | 201 |
|
Other current liabilities(a) | 1 |
| | 14 |
| 2 |
| | 11 |
|
Deferred credits and other liabilities(a) | — |
| | 57 |
| — |
| | 58 |
|
|
| | | | | | | |
| (In millions) | December 31, 2018 |
| Balance Sheet Location | Asset | | Liability |
| Commodity derivatives | | | |
| Other current assets | $ | 400 |
| | $ | 283 |
|
Other current liabilities(a) | 1 |
| | 16 |
|
Deferred credits and other liabilities(a) | — |
| | 54 |
|
| |
(a) | Includes embedded derivatives. |
The table below summarizes open commodity derivative contracts for crude oil, refined products and blending products as of March 31,June 30, 2019.
| | | | Percentage of contracts that expire next quarter | | Position | Percentage of contracts that expire next quarter | | Position |
| (Units in thousands of barrels) | | Long | | Short | | Long | | Short |
Exchange-traded(a) | | | | | | | | |
| Crude oil | 82.6% | | 49,844 |
| | 58,466 |
| 77.3% | | 44,617 |
| | 54,420 |
|
| Refined products | 89.4% | | 11,373 |
| | 9,945 |
| 91.4% | | 20,300 |
| | 8,703 |
|
| Blending products | 77.3% | | 4,688 |
| | 4,866 |
| 74.1% | | 1,521 |
| | 4,416 |
|
| OTC | | | | | | | | |
| Crude oil | —% | | 640 |
| | — |
| —% | | 400 |
| | — |
|
| Blending products | —% | | 1,676 |
| | 1,444 |
| 4.5% | | 1,156 |
| | 1,156 |
|
| |
(a) | Included in exchange-traded are spread contracts in thousands of barrels: Crude oil - 11,9992,910 long and 3,9802,310 short; Refined products - 3001,450 long and 300275 short; Blending products - 2,603961 long and 2,506831 short |
The following table summarizes the effect of all commodity derivative instruments in our consolidated statements of income:
|
| | | | | | | | | | | | | | | |
| (In millions) | Three Months Ended June 30, | | Six Months Ended June 30, |
| Income Statement Location | 2019 | | 2018 | | 2019 | | 2018 |
| Sales and other operating revenues | $ | 3 |
| | $ | (1 | ) | | $ | (17 | ) | | $ | (2 | ) |
| Cost of revenues | 15 |
| | (56 | ) | | (65 | ) | | (83 | ) |
| Total | $ | 18 |
| | $ | (57 | ) | | $ | (82 | ) | | $ | (85 | ) |
|
| | | | | | | |
| | Loss |
| (In millions) | Three Months Ended March 31, |
| Income Statement Location | 2019 | | 2018 |
| Sales and other operating revenues | $ | (20 | ) | | $ | (1 | ) |
| Cost of revenues | (80 | ) | | (27 | ) |
| Total | $ | (100 | ) | | $ | (28 | ) |
17. DEBT
Our outstanding borrowings at March 31,June 30, 2019 and December 31, 2018 consisted of the following:
|
| | | | | | | |
| (In millions) | June 30,
2019 | | December 31,
2018 |
| Marathon Petroleum Corporation | $ | 9,119 |
| | $ | 9,114 |
|
| MPLX LP | 14,473 |
| | 13,856 |
|
| ANDX LP | 5,263 |
| | 5,010 |
|
| Total debt | $ | 28,855 |
| | $ | 27,980 |
|
| Unamortized debt issuance costs | (124 | ) | | (128 | ) |
| Unamortized discount | (324 | ) | | (328 | ) |
| Amounts due within one year | (554 | ) | | (544 | ) |
| Total long-term debt due after one year | $ | 27,853 |
| | $ | 26,980 |
|
|
| | | | | | | |
| (In millions) | March 31,
2019 | | December 31,
2018 |
| Marathon Petroleum Corporation | $ | 9,120 |
| | $ | 9,114 |
|
| MPLX LP | 14,283 |
| | 13,856 |
|
| ANDX LP | 5,168 |
| | 5,010 |
|
| Total debt | $ | 28,571 |
| | $ | 27,980 |
|
| Unamortized debt issuance costs | (126 | ) | | (128 | ) |
| Unamortized discount | (330 | ) | | (328 | ) |
| Amounts due within one year | (550 | ) | | (544 | ) |
| Total long-term debt due after one year | $ | 27,565 |
| | $ | 26,980 |
|
Available Capacity under our Facilities
| | | (Dollars in millions) | | Total Capacity | | Outstanding Borrowings | | Outstanding Letters of Credit | | Available Capacity | | Weighted Average Interest Rate | | Expiration | | Total Capacity | | Outstanding Borrowings | | Outstanding Letters of Credit | | Available Capacity | | Weighted Average Interest Rate | | Expiration |
| MPC 364-day bank revolving credit facility | | $ | 1,000 |
| | $ | — |
| | $ | — |
| | $ | 1,000 |
| | — |
| | September 2019 | | $ | 1,000 |
| | $ | — |
| | $ | — |
| | $ | 1,000 |
| | — |
| | September 2019 |
| MPC bank revolving credit facility | | 5,000 |
| | — |
| | 32 |
| | 4,968 |
| | — |
| | October 2023 | | 5,000 |
| | — |
| | 32 |
| | 4,968 |
| | — |
| | October 2023 |
| MPC trade receivables securitization facility | | | 750 |
| | — |
| | — |
| | 750 |
| | — |
| | July 2019 |
| MPLX bank revolving credit facility | | 2,250 |
| | 425 |
| | 3 |
| | 1,822 |
| | 3.92 | % | | July 2022 | | 2,250 |
| | 615 |
| | 3 |
| | 1,632 |
| | 3.80 | % | | July 2022 |
ANDX revolving & dropdown credit facilities(a) | | 2,100 |
| | 1,404 |
| | — |
| | 696 |
| | 4.32 | % | | January 2021 | | 2,100 |
| | 1,500 |
| | — |
| | 600 |
| | 3.90 | % | | January 2021 |
| Trade receivables securitization facility | | 750 |
| | — |
| | — |
| | 750 |
| | — |
| | July 2019 | |
| | | $ | 11,100 |
| | $ | 1,829 |
| | $ | 35 |
| | $ | 9,236 |
| | | | | $ | 11,100 |
| | $ | 2,115 |
| | $ | 35 |
| | $ | 8,950 |
| | | |
| |
(a) | Western Refining Southwest, Inc., a wholly-owned subsidiary of MPC and unitholder of ANDX, has guaranteed certain outstanding borrowings under the ANDX dropdown credit facility that were made in connection with the August 2018 dropdown transaction. |
MPC 364-Day Bank Revolving Credit Facility
On July 26, 2019, we entered into a new $1 billion 364-day revolving credit facility with a syndicate of banks that will, subject to the satisfaction of customary conditions, become effective upon the expiration of our existing $1 billion 364-day revolving credit facility in September 2019. The new 364-day revolving credit facility contains substantially the same terms and conditions as our existing 364-day revolving credit facility and will expire in September 2020.
MPC Trade Receivables Securitization Facility
On July 19, 2019, we amended our $750 million trade receivables securitization facility to extend the maturity date to July 16, 2021.
MPLX Credit Agreement
Upon the completion of the merger of MPLX and ANDX on July 30, 2019, the MPLX bank revolving credit facility was amended and restated to increase the borrowing capacity to $3.5 billion and to extend the maturity date to July 30, 2024. The ANDX revolving and dropdown credit facilities were terminated and all outstanding balances were repaid and funded with the new $3.5 billion bank revolving credit facility.
18. REVENUE
The following table presents our revenues disaggregated by product line. |
| | | | | | | | | | | | | | | |
| | Three Months Ended
June 30, | | Six Months Ended
June 30, |
| (In millions) | 2019 | | 2018 | | 2019 | | 2018 |
| Refined products | $ | 29,668 |
| | $ | 19,489 |
| | $ | 54,504 |
| | $ | 35,816 |
|
| Merchandise | 1,601 |
| | 1,286 |
| | 3,065 |
| | 2,416 |
|
| Crude oil and refinery feedstocks | 1,669 |
| | 978 |
| | 3,036 |
| | 1,861 |
|
| Midstream services, transportation and other | 609 |
| | 564 |
| | 1,209 |
| | 1,090 |
|
| Sales and other operating revenues | $ | 33,547 |
| | $ | 22,317 |
| | $ | 61,814 |
| | $ | 41,183 |
|
|
| | | | | | | |
| | Three Months Ended
March 31, |
| (In millions) | 2019 | | 2018 |
| Refined products | $ | 24,653 |
| | $ | 16,158 |
|
| Merchandise | 1,464 |
| | 1,130 |
|
| Crude oil and refinery feedstocks | 1,367 |
| | 883 |
|
| Midstream services, transportation and other | 597 |
| | 523 |
|
| Sales and other operating revenues | $ | 28,081 |
| | $ | 18,694 |
|
Practical Expedients
On January 1, 2018, we adopted ASU 2014-09, Revenue - Revenue from Contracts with Customers (“ASC 606”). We elected the completed contract practical expedient and only applied ASC 606 to contracts that were not completed as of January 1, 2018.
We do not disclose information on the future performance obligations for any contract with expected duration of one year or less at inception. As of March 31,June 30, 2019, we do not have future performance obligations that are material to future periods.
Receivables
On the accompanying consolidated balance sheets, receivables, less allowance for doubtful accounts primarily consists of customer receivables. Significant, non-customer balances included in our receivables at March 31,June 30, 2019 include matching buy/sell receivables of $1.98 billion and income tax receivables of $76 million.$2.21 billion.
19. SUPPLEMENTAL CASH FLOW INFORMATION | | | | Three Months Ended
March 31, | Six Months Ended
June 30, |
| (In millions) | 2019 | | 2018 | 2019 | | 2018 |
| Net cash provided by operating activities included: | | | | | | |
| Interest paid (net of amounts capitalized) | $ | 269 |
| | $ | 212 |
| $ | 579 |
| | $ | 279 |
|
| Net income taxes paid to taxing authorities | 42 |
| | 6 |
| 362 |
| | 40 |
|
| Cash paid for amounts included in the measurement of lease liabilities | | | | | | |
Payments on operating leases | 189 |
| | — |
| 380 |
| | — |
|
Interest payments under finance lease obligations | 8 |
| | — |
| 15 |
| | — |
|
| Net cash provided by financing activities included: | | | | | | |
Principal payments under finance lease obligations | 10 |
| | — |
| 21 |
| | — |
|
| Non-cash investing and financing activities: | | | | | | |
Right of use assets obtained in exchange for new operating lease obligations | 31 |
| | — |
| 114 |
| | — |
|
Right of use assets obtained in exchange for new finance lease obligations | 15 |
| | — |
| 22 |
| | — |
|
Contribution of net assets to Capline LLC(a)(b) | 143 |
| | — |
| 143 |
| | — |
|
Recognition of Capline LLC equity method investment(a)(b) | 350 |
| | — |
| 350 |
| | — |
|
| |
(a) | Disclosure added in 2019 following the adoption of ASC 842. |
| | | (In millions) | March 31,
2019 | | December 31,
2018 | June 30,
2019 | | December 31,
2018 |
| Cash and cash equivalents | $ | 877 |
| | $ | 1,687 |
| $ | 1,247 |
| | $ | 1,687 |
|
Restricted cash(a) | 31 |
| | 38 |
| 2 |
| | 38 |
|
| Cash, cash equivalents and restricted cash | $ | 908 |
| | $ | 1,725 |
| $ | 1,249 |
| | $ | 1,725 |
|
| |
(a) | The restricted cash balance is included within other current assets on the consolidated balance sheets. |
The consolidated statements of cash flows exclude changes to the consolidated balance sheets that did not affect cash. The following is a reconciliation of additions to property, plant and equipment to total capital expenditures:
|
| | | | | | | |
| | Six Months Ended
June 30, |
| (In millions) | 2019 | | 2018 |
| Additions to property, plant and equipment per the consolidated statements of cash flows | $ | 2,419 |
| | $ | 1,466 |
|
| Asset retirement expenditures | — |
| | 5 |
|
| Increase (decrease) in capital accruals | (281 | ) | | 77 |
|
| Total capital expenditures | $ | 2,138 |
| | $ | 1,548 |
|
|
| | | | | | | |
| | Three Months Ended
March 31, |
| (In millions) | 2019 | | 2018 |
| Additions to property, plant and equipment per the consolidated statements of cash flows | $ | 1,241 |
| | $ | 755 |
|
| Asset retirement expenditures | — |
| | 1 |
|
| Decrease in capital accruals | (235 | ) | | (49 | ) |
| Total capital expenditures | $ | 1,006 |
| | $ | 707 |
|
20. ACCUMULATED OTHER COMPREHENSIVE LOSS
The following table shows the changes in accumulated other comprehensive loss by component. Amounts in parentheses indicate debits.
| | | (In millions) | Pension Benefits | | Other Benefits | | Gain on Cash Flow Hedge | | Workers Compensation | | Total | Pension Benefits | | Other Benefits | | Gain on Cash Flow Hedge | | Workers Compensation | | Total |
| Balance as of December 31, 2017 | $ | (190 | ) | | $ | (48 | ) | | $ | 4 |
| | $ | 3 |
| | $ | (231 | ) | $ | (190 | ) | | $ | (48 | ) | | $ | 4 |
| | $ | 3 |
| | $ | (231 | ) |
| Other comprehensive loss before reclassifications | — |
| | — |
| | (2 | ) | | — |
| | (2 | ) | |
| Other comprehensive income (loss) before reclassifications | | 2 |
| | (1 | ) | | (2 | ) | | — |
| | (1 | ) |
| Amounts reclassified from accumulated other comprehensive loss: | | | | | | | | | | | | | | | | | | |
Amortization – prior service credit(a) | (8 | ) | | (1 | ) | | — |
| | — |
| | (9 | ) | (16 | ) | | (2 | ) | | — |
| | — |
| | (18 | ) |
– actuarial loss(a) | 9 |
| | — |
| | — |
| | — |
| | 9 |
| 17 |
| | — |
| | — |
| | — |
| | 17 |
|
– settlement loss(a) | 1 |
| | — |
| | — |
| | — |
| | 1 |
| 2 |
| | — |
| | — |
| | — |
| | 2 |
|
| Other | — |
| | — |
| | — |
| | — |
| | — |
| — |
| | — |
| | — |
| | (2 | ) | | (2 | ) |
| Tax effect | (1 | ) | | — |
| | — |
| | — |
| | (1 | ) | (1 | ) | | 1 |
| | — |
| | — |
| | — |
|
| Other comprehensive income (loss) | 1 |
| | (1 | ) | | (2 | ) | | — |
| | (2 | ) | 4 |
| | (2 | ) | | (2 | ) | | (2 | ) | | (2 | ) |
| Balance as of March 31, 2018 | $ | (189 | ) | | $ | (49 | ) | | $ | 2 |
| | $ | 3 |
| | $ | (233 | ) | |
| Balance as of June 30, 2018 | | $ | (186 | ) | | $ | (50 | ) | | $ | 2 |
| | $ | 1 |
| | $ | (233 | ) |
| | | (In millions) | Pension Benefits | | Other Benefits | | Gain on Cash Flow Hedge | | Workers Compensation | | Total | Pension Benefits | | Other Benefits | | Gain on Cash Flow Hedge | | Workers Compensation | | Total |
| Balance as of December 31, 2018 | $ | (132 | ) | | $ | (23 | ) | | $ | 2 |
| | $ | 9 |
| | $ | (144 | ) | $ | (132 | ) | | $ | (23 | ) | | $ | 2 |
| | $ | 9 |
| | $ | (144 | ) |
| Other comprehensive loss before reclassifications | (1 | ) | | — |
| | — |
| | — |
| | (1 | ) | |
| Other comprehensive income (loss) before reclassifications | | (7 | ) | | 1 |
| | — |
| | — |
| | (6 | ) |
| Amounts reclassified from accumulated other comprehensive loss: | | | | | | | | | | | | | | | | | | |
Amortization – prior service credit(a) | (11 | ) | | — |
| | — |
| | — |
| | (11 | ) | (23 | ) | | — |
| | — |
| | — |
| | (23 | ) |
– actuarial loss(a) | 4 |
| | — |
| | — |
| | — |
| | 4 |
| 11 |
| | (1 | ) | | — |
| | — |
| | 10 |
|
– settlement loss(a) | — |
| | — |
| | — |
| | — |
| | — |
| 2 |
| | — |
| | — |
| | — |
| | 2 |
|
| Other | — |
| | — |
| | — |
| | (1 | ) | | (1 | ) | — |
| | — |
| | — |
| | (2 | ) | | (2 | ) |
| Tax effect | 2 |
| | — |
| | — |
| | — |
| | 2 |
| 2 |
| | — |
| | — |
| | — |
| | 2 |
|
| Other comprehensive loss | (6 | ) | | — |
| | — |
| | (1 | ) | | (7 | ) | (15 | ) | | — |
| | — |
| | (2 | ) | | (17 | ) |
| Balance as of March 31, 2019 | $ | (138 | ) | | $ | (23 | ) | | $ | 2 |
| | $ | 8 |
| | $ | (151 | ) | |
| Balance as of June 30, 2019 | | $ | (147 | ) | | $ | (23 | ) | | $ | 2 |
| | $ | 7 |
| | $ | (161 | ) |
| |
(a) | These accumulated other comprehensive loss components are included in the computation of net periodic benefit cost. See Note 21. |
21. DEFINED BENEFIT PENSION AND OTHER POSTRETIREMENT PLANSBENEFITS
The following summarizes the components of net periodic benefit costs:
|
| | | | | | | | | | | | | | | |
| | Three Months Ended June 30, 2019 |
| | Pension Benefits | | Other Benefits |
| (In millions) | 2019 | | 2018 | | 2019 | | 2018 |
| Components of net periodic benefit cost: | | | | | | | |
| Service cost | $ | 60 |
| | $ | 35 |
| | $ | 8 |
| | $ | 8 |
|
| Interest cost | 27 |
| | 18 |
| | 10 |
| | 8 |
|
| Expected return on plan assets | (31 | ) | | (24 | ) | | — |
| | — |
|
| Amortization – prior service credit | (12 | ) | | (8 | ) | | — |
| | (1 | ) |
| – actuarial loss | 7 |
| | 8 |
| | (1 | ) | | — |
|
| – settlement loss | 2 |
| | 1 |
| | — |
| | — |
|
| Net periodic benefit cost | $ | 53 |
| | $ | 30 |
| | $ | 17 |
| | $ | 15 |
|
| | | | Three Months Ended March 31, | Six Months Ended June 30, |
| | Pension Benefits | | Other Benefits | Pension Benefits | | Other Benefits |
| (In millions) | 2019 | | 2018 | | 2019 | | 2018 | 2019 | | 2018 | | 2019 | | 2018 |
| Components of net periodic benefit cost: | | | | | | | | | | | | | | |
| Service cost | $ | 58 |
| | $ | 36 |
| | $ | 8 |
| | $ | 7 |
| $ | 118 |
| | $ | 71 |
| | $ | 16 |
| | $ | 15 |
|
| Interest cost | 28 |
| | 18 |
| | 9 |
| | 7 |
| 55 |
| | 36 |
| | 19 |
| | 15 |
|
| Expected return on plan assets | (32 | ) | | (26 | ) | | — |
| | — |
| (63 | ) | | (50 | ) | | — |
| | — |
|
| Amortization – prior service credit | (11 | ) | | (8 | ) | | — |
| | (1 | ) | (23 | ) | | (16 | ) | | — |
| | (2 | ) |
| – actuarial loss | 4 |
| | 9 |
| | — |
| | — |
| 11 |
| | 17 |
| | (1 | ) | | — |
|
| – settlement loss | — |
| | 1 |
| | — |
| | — |
| 2 |
| | 2 |
| | — |
| | — |
|
| Net periodic benefit cost | $ | 47 |
| | $ | 30 |
| | $ | 17 |
| | $ | 13 |
| $ | 100 |
| | $ | 60 |
| | $ | 34 |
| | $ | 28 |
|
The components of net periodic benefit cost other than the service cost component are included in net interest and other financial costs on the consolidated statements of income.
During the threesix months ended March 31,June 30, 2019, we made no contributionsa $16 million contribution to our funded pension plans. Benefit payments related to unfunded pension and other postretirement benefit plans were $3$9 million and $11$23 million, respectively, during the threesix months ended March 31,June 30, 2019.
22. STOCK-BASED COMPENSATION PLANS
Stock Option Awards
The following table presents a summary of our stock option award activity for the three months ended March 31, 2019:
|
| | | | | | |
| | Number of Shares | | Weighted Average Exercise Price |
| Outstanding at December 31, 2018 | 8,724,595 |
| | $ | 37.07 |
|
| Granted | 1,037,671 |
| | 62.68 |
|
| Exercised | (229,169 | ) | | 10.62 |
|
| Forfeited or expired | — |
| | — |
|
| Outstanding at March 31, 2019 | 9,533,097 |
| | 40.49 |
|
The grant date fair value of stock option awards granted during the three months ended March 31, 2019 was $14.34 per share. The fair value of stock options granted to our employees is estimated on the date of the grant using the Black Scholes option-pricing model, which employs various assumptions.
Restricted Stock and Restricted Stock Unit Awards
The following table presents a summary of restricted stock and restricted stock unit award activity for the three months ended March 31, 2019:
|
| | | | | | | | | | | | | |
| | Restricted Stock | | Restricted Stock Units |
| | Number of Shares | | Weighted Average Grant Date Fair Value | | Number of Units | | Weighted Average Grant Date Fair Value |
| Outstanding at December 31, 2018 | 990,700 |
| | $ | 57.23 |
| | 4,226,856 |
| | $ | 80.96 |
|
| Granted | 158,120 |
| | 62.66 |
| | 8,050 |
| | 59.56 |
|
| Vested | (114,136 | ) | | 49.58 |
| | (1,110,705 | ) | | 82.43 |
|
| Forfeited | (12,622 | ) | | 56.84 |
| | (46,923 | ) | | 82.43 |
|
| Outstanding at March 31, 2019 | 1,022,062 |
| | 58.93 |
| | 3,077,278 |
| | 80.35 |
|
Performance Unit Awards
The following table presents a summary of the activity for performance unit awards to be settled in shares for the three months ended March 31, 2019:
|
| | | | | | |
| | Number of Units | | Weighted Average Grant Date Fair Value |
| Outstanding at December 31, 2018 | 8,618,583 |
| | $ | 0.79 |
|
| Granted | 6,200,000 |
| | 0.72 |
|
| Vested | (2,280,333 | ) | | 0.57 |
|
| Forfeited | (120,000 | ) | | 0.84 |
|
| Outstanding at March 31, 2019 | 12,418,250 |
| | 0.79 |
|
The performance unit awards granted during the three months ended March 31, 2019 have a grant date fair value of $0.72 per unit, as calculated using a Monte Carlo valuation model.
MPLX and ANDX Awards
Compensation expense for MPLX and ANDX equity awards was not material to our consolidated financial statements for the three months ended March 31, 2019.
23. LEASES
For further information regarding the adoption of ASC 842, including the method of adoption and practical expedients elected, see Note 2.
Lessee
We lease a wide variety of facilities and equipment including land and building space, office and field equipment, storage facilities and transportation equipment. Our remaining lease terms range from less than one year to 60 years. Most long-term leases include renewal options ranging from less than one year to 49 years and, in certain leases, also include purchase options. The lease term included in the measurement of right of use assets and lease liabilities includes options to extend or terminate our leases that we are reasonably certain to exercise. Options were included in the lease term primarily for retail store sites where we constructed property, plant and equipment on leased land that is expected to exist beyond the initial lease term.
Under ASC 842, the components of lease cost were as follows:
|
| | | | | | | |
| | Three Months Ended
June 30, | | Six Months Ended
June 30, |
| (In millions) | 2019 | | 2019 |
| Finance lease cost: | | | |
| Amortization of right of use assets | $ | 15 |
| | $ | 29 |
|
| Interest on lease liabilities | 9 |
| | 20 |
|
| Operating lease cost | 198 |
| | 388 |
|
| Variable lease cost | 29 |
| | 43 |
|
| Short-term lease cost | 162 |
| | 314 |
|
| Total lease cost | $ | 413 |
| | $ | 794 |
|
|
| | | |
| | Three Months Ended
March 31, |
| (In millions) | 2019 |
| Finance lease cost: | |
| Amortization of right of use assets | $ | 14 |
|
| Interest on lease liabilities | 10 |
|
| Operating lease cost | 190 |
|
| Variable lease cost | 15 |
|
| Short-term lease cost | 152 |
|
| Total lease cost | $ | 381 |
|
Supplemental balance sheet data related to leases were as follows:
|
| | | |
| (In millions) | June 30, 2019 |
| Operating leases | |
| Assets | |
| Right of use assets | $ | 2,588 |
|
| Liabilities | |
| Operating lease liabilities | $ | 615 |
|
| Long-term operating lease liabilities | 2,068 |
|
| Total operating lease liabilities | $ | 2,683 |
|
| Weighted average remaining lease term (in years) | 6.4 |
|
| Weighted average discount rate | 4.12 | % |
| | |
| Finance leases | |
| Assets | |
| Property, plant and equipment, gross | $ | 786 |
|
| Accumulated depreciation | 243 |
|
| Property, plant and equipment, net | $ | 543 |
|
| Liabilities | |
| Debt due within one year | $ | 51 |
|
| Long-term debt | 604 |
|
| Total finance lease liabilities | $ | 655 |
|
| Weighted average remaining lease term (in years) | 12.8 |
|
| Weighted average discount rate | 6.04 | % |
|
| | | |
| (In millions) | March 31, 2019 |
| Operating leases | |
| Assets | |
| Right of use assets | $ | 2,680 |
|
| Liabilities | |
| Operating lease liabilities | $ | 613 |
|
| Long-term operating lease liabilities | 2,153 |
|
| Total operating lease liabilities | $ | 2,766 |
|
| Weighted average remaining lease term | 6.5 years |
|
| Weighted average discount rate | 4.13 | % |
| | |
| Finance leases | |
| Assets | |
| Property, plant and equipment, gross | $ | 760 |
|
| Accumulated depreciation | 206 |
|
| Property, plant and equipment, net | $ | 554 |
|
| Liabilities | |
| Debt due within one year | $ | 45 |
|
| Long-term debt | 612 |
|
| Total finance lease liabilities | $ | 657 |
|
| Weighted average remaining lease term | 13.2 years |
|
| Weighted average discount rate | 6.02 | % |
As of March 31,June 30, 2019, maturities of lease liabilities for operating lease obligations and finance lease obligations having initial or remaining non-cancellable lease terms in excess of one year are as follows:
|
| | | | | | | |
| (In millions) | Operating | | Finance |
| 2019 | $ | 381 |
| | $ | 39 |
|
| 2020 | 650 |
| | 78 |
|
| 2021 | 562 |
| | 70 |
|
| 2022 | 383 |
| | 77 |
|
| 2023 | 273 |
| | 83 |
|
| 2024 and thereafter | 837 |
| | 600 |
|
| Gross lease payments | 3,086 |
| | 947 |
|
| Less: imputed interest | 403 |
| | 292 |
|
| Total lease liabilities | $ | 2,683 |
| | $ | 655 |
|
|
| | | | | | | |
| (In millions) | Operating | | Finance |
| 2019 | $ | 554 |
| | $ | 57 |
|
| 2020 | 629 |
| | 76 |
|
| 2021 | 545 |
| | 69 |
|
| 2022 | 370 |
| | 76 |
|
| 2023 | 262 |
| | 83 |
|
| 2024 and thereafter | 832 |
| | 596 |
|
| Gross lease payments | 3,192 |
| | 957 |
|
| Less: imputed interest | 426 |
| | 300 |
|
| Total lease liabilities | $ | 2,766 |
| | $ | 657 |
|
Presented in accordance with ASC 840, future minimum commitments as of December 31, 2018 for operating lease obligations and capital lease obligations having initial or remaining non-cancellable lease terms in excess of one year were as follows:
|
| | | | | | | |
| (In millions) | Operating | | Capital |
| 2019 | $ | 709 |
| | $ | 70 |
|
| 2020 | 619 |
| | 71 |
|
| 2021 | 553 |
| | 66 |
|
| 2022 | 389 |
| | 75 |
|
| 2023 | 295 |
| | 82 |
|
| 2024 and thereafter | 858 |
| | 586 |
|
| Total minimum lease payments | $ | 3,423 |
| | 950 |
|
| Less: imputed interest costs | | | 301 |
|
| Present value of net minimum lease payments | | | $ | 649 |
|
|
| | | | | | | |
| (In millions) | Operating | | Capital |
| 2019 | $ | 709 |
| | $ | 70 |
|
| 2020 | 619 |
| | 71 |
|
| 2021 | 553 |
| | 66 |
|
| 2022 | 389 |
| | 75 |
|
| 2023 | 295 |
| | 82 |
|
| 2024 and thereafter | 858 |
| | 586 |
|
| Total minimum lease payments | $ | 3,423 |
| | 950 |
|
| Less: imputed interest costs | | | 301 |
|
| Present value of net minimum lease payments | | | $ | 649 |
|
Lessor
MPLX has certain natural gas gathering, transportation and processing agreements in which it is considered to be the lessor under several implicit operating lease arrangements in accordance with GAAP. MPLX’s primary implicit lease operations relate to a natural gas gathering agreement in the Marcellus region for which it earns a fixed-fee for providing gathering services to a single producer using a dedicated gathering system. As the gathering system is expanded, the fixed-fee charged to the producer is adjusted to include the additional gathering assets in the lease. The primary term of the natural gas gathering arrangement expires in 2038 and will continue thereafter on a year-to-year basis until terminated by either party. Other significant implicit leases relate to a natural gas processing agreement in the Marcellus region and a natural gas processing agreement in the Southern Appalachia region for which MPLX earns minimum monthly fees for providing processing services to a single producer using a dedicated processing plant. The primary term of these natural gas processing agreements expire during 2023 and 2033.
MPLX did not elect to use the practical expedient to combine lease and non-lease components for lessor arrangements. The tables below represent the portion of the contract allocated to the lease component based on relative standalone selling price. Lessor agreements are currently deemed operating, as we elected the practical expedient to grandfather in old conclusions. We are still determining the impact of the new standard on these arrangements if and when a modification occurs and they are required to be assessed underhistorical ASC 842.840 lease classifications. MPLX may be required to re-classify existing operating leases to sales-type leases upon modification and related reassessment of the leases.
Our revenue from implicit lease arrangements, excluding executory costs, totaled approximately $60$63 million inand $123 million for the three and six months ended March 31, 2019.June 30, 2019, respectively. The implicit lease arrangements related to the processing facilities contain contingent rental provisions whereby we receive additional fees if the producer customer exceeds the monthly minimum processed volumes. During the three and six months ended March 31,June 30, 2019, MPLX did not receive any material contingent lease payments. The following is a schedule of minimum future rentals on the non‑cancellable operating leases as of March 31,June 30, 2019:
|
| | | |
| (In millions) | |
| 2019 | $ | 90 |
|
| 2020 | 178 |
|
| 2021 | 169 |
|
| 2022 | 166 |
|
| 2023 | 161 |
|
| 2024 and thereafter | 1,264 |
|
| Total minimum future rentals | $ | 2,028 |
|
|
| | | |
| (In millions) | |
| 2019 | $ | 144 |
|
| 2020 | 168 |
|
| 2021 | 162 |
|
| 2022 | 160 |
|
| 2023 | 154 |
|
| 2024 and thereafter | 1,205 |
|
| Total minimum future rentals | $ | 1,993 |
|
The following schedule summarizes our investment in assets held for operating lease by major classes as of March 31,June 30, 2019:
|
| | | |
| (In millions) | June 30, 2019 |
| Natural gas gathering and NGL transportation pipelines and facilities | $ | 1,039 |
|
| Natural gas processing facilities | 633 |
|
| Terminal and related assets | 111 |
|
| Land, building, office equipment and other | 44 |
|
| Property, plant and equipment | 1,827 |
|
| Less accumulated depreciation | 284 |
|
| Property, plant and equipment, net | $ | 1,543 |
|
|
| | | |
| (In millions) | March 31, 2019 |
| Natural gas gathering and NGL transportation pipelines and facilities | $ | 1,036 |
|
| Natural gas processing facilities | 642 |
|
| Terminal and related assets | 112 |
|
| Land, building, office equipment and other | 41 |
|
| Property, plant and equipment | 1,831 |
|
| Less accumulated depreciation | 261 |
|
| Property, plant and equipment, net | $ | 1,570 |
|
24.23. COMMITMENTS AND CONTINGENCIES
We are the subject of, or a party to, a number of pending or threatened legal actions, contingencies and commitments involving a variety of matters, including laws and regulations relating to the environment. Some of these matters are discussed below. For matters for which we have not recorded a liability, we are unable to estimate a range of possible loss because the issues involved have not been fully developed through pleadings, discovery or court proceedings. However, the ultimate resolution of some of these contingencies could, individually or in the aggregate, be material.
Environmental Matters
We are subject to federal, state, local and foreign laws and regulations relating to the environment. These laws generally provide for control of pollutants released into the environment and require responsible parties to undertake remediation of hazardous waste disposal sites and certain other locations including presently or formerly owned or operated retail marketing sites. Penalties may be imposed for noncompliance.
At March 31,June 30, 2019 and December 31, 2018, accrued liabilities for remediation totaled $451$449 million and $455 million, respectively. It is not presently possible to estimate the ultimate amount of all remediation costs that might be incurred or the penalties, if any, that may be imposed. Receivables for recoverable costs from certain states, under programs to assist companies in clean-up efforts related to underground storage tanks at presently or formerly owned or operated retail marketing sites, were $33$35 million and $35 million at March 31,June 30, 2019 and December 31, 2018, respectively.
Governmental and other entities in California, New York, Maryland and Rhode Island have filed lawsuits against coal, gas, oil and petroleum companies, including the Company. The lawsuits allege damages as a result of climate change and the plaintiffs are seeking unspecified damages and abatement under various tort theories. Similar lawsuits may be filed in other jurisdictions. At this early stage, the ultimate outcome of these matters remainremains uncertain, and neither the likelihood of an unfavorable outcome nor the ultimate liability, if any, can be determined.
We are involved in a number of environmental enforcement matters arising in the ordinary course of business. While the outcome and impact on us cannot be predicted with certainty, management believes the resolution of these environmental matters will not, individually or collectively, have a material adverse effect on our consolidated results of operations, financial position or cash flows.
Lawsuits
In May 2015, the Kentucky attorney general filed a lawsuit against our wholly-owned subsidiary, Marathon Petroleum Company LP (“MPC LP”), in the United States District Court for the Western District of Kentucky asserting claims under federal and state antitrust statutes, the Kentucky Consumer Protection Act, and state common law. The complaint, as amended in July 2015, alleges that MPC LP used deed restrictions, supply agreements with customers and exchange agreements with competitors to unreasonably restrain trade in areas within Kentucky and seeks declaratory relief, unspecified damages, civil penalties, restitution and disgorgement of profits. At this stage, the ultimate outcome of this litigation remains uncertain, and neither the likelihood of an unfavorable outcome nor the ultimate liability, if any, can be determined, and we are unable to estimate a reasonably possible loss (or range of loss) for this matter. We intend to vigorously defend ourselves in this matter.
In May 2007, the Kentucky attorney general filed a lawsuit against us and Marathon Oil in state court in Franklin County, Kentucky for alleged violations of Kentucky’s emergency pricing and consumer protection laws following Hurricanes Katrina and Rita in 2005. The lawsuit allegesalleged that we overcharged customers by $89 million during September and October 2005. The complaint seekssought disgorgement of these sums, as well as penalties, under Kentucky’s emergency pricing and consumer protection laws. We are vigorously defending this litigation. We believe that this is the first lawsuit for damages and injunctive relief under the Kentucky emergency pricing laws to progress this far and it contains many novel issues. In May 2011, the Kentucky attorney general amended his complaint to include a request for immediate injunctive relief as well as unspecified damages and penalties related to our wholesale gasoline pricing in April and May 2011 under statewide price controls that were activated by the Kentucky governor on April 26, 2011 and which have since expired. The court denied the attorney general’s request for immediate injunctive relief,relief. In July 2019, MPC and the remainder of the 2011 claims likelyattorney general reached a settlement to resolve this litigation. This resolution will be resolved along with those dating from 2005. If the lawsuit is resolved unfavorably in its entirety, it could materially impact our consolidated results of operations, financial position or cash flows. However, management does not believe the ultimate resolution of this litigation will have a material adverse effect on our consolidated financial position, results of operations or cash flows.
We are also a party to a number of other lawsuits and other proceedings arising in the ordinary course of business. While the ultimate outcome and impact to us cannot be predicted with certainty, we believe that the resolution of these other lawsuits and proceedings will not have a material adverse effect on our consolidated financial position, results of operations or cash flows.
Guarantees
We have provided certain guarantees, direct and indirect, of the indebtedness of other companies. Under the terms of most of these guarantee arrangements, we would be required to perform should the guaranteed party fail to fulfill its obligations under the specified arrangements. In addition to these financial guarantees, we also have various performance guarantees related to specific agreements.
Guarantees related to indebtedness of equity method investees—MPC and MPLX hold interests in an offshore oil port, LOOP, and MPLX holds an interest in a crude oil pipeline system, LOCAP. Both LOOP and LOCAP have secured various project financings with throughput and deficiency agreements. Under the agreements, MPC, as a shipper, is required to advance funds if the investees are unable to service their debt. Any such advances are considered prepayments of future transportation charges. The duration of the agreements vary but tend to follow the terms of the underlying debt, which extend through 2037. Our maximum potential undiscounted payments under these agreements for the debt principal totaled $171 million as of March 31,June 30, 2019.
In connection with our 25 percent interest in Gray Oak Pipeline, LLC (“Gray Oak Pipeline”), we have entered into an Equity Contribution Agreement obligating us to make certain equity contributions to Gray Oak Pipeline to support its obligations under a construction loan facility. Gray Oak Pipeline is constructing the Gray Oak oil pipeline, a crude oil transportation system from West Texas and the Eagle Ford formation to destinations in the Ingleside, Corpus Christi and Sweeney, Texas markets. Gray Oak Pipeline has entered into the construction loan facility with a syndicate of banks to finance a portion of the construction costs of the pipeline project.
The Equity Contribution Agreement requires us to contribute our pro rata share of any amounts necessary to allow Gary Oak Pipeline to cure any payment defaults under the construction loan facility or to repay all amounts outstanding under the facility, including principal, accrued interest, fees and expenses, in certain circumstances, including the abandonment of the Gray Oak pipeline project prior to completion or the failure of Gray Oak Pipeline to repay or refinance the construction loan facility prior to its scheduled maturity date of June 3, 2022. Gray Oak may borrow up to $1.43 billion under the construction loan facility (after giving effect to the exercise of all options to increase its borrowing capacity). As of June 30, 2019, our maximum potential undiscounted payments under the Equity Contribution Agreement for the debt principal totaled $138 million.
In connection with MPLX’s approximate nine percent indirect interest in a joint venture that owns and operates the Dakota Access Pipeline and Energy Transfer Crude Oil Pipeline projects, collectively referred to as the Bakken Pipeline system, MPLX has entered into a Contingent Equity Contribution Agreement. MPLX, along with the other joint venture owners in the Bakken Pipeline system, have agreed to make equity contributions to the joint venture upon certain events occurring to allow the entities that own and operate the Bakken Pipeline system to satisfy their senior note payment obligations. The senior notes were issued to repay amounts owed by the pipeline companies to fund the cost of construction of the Bakken Pipeline system.
As of March 31,June 30, 2019, our maximum potential undiscounted payments under the Contingent Equity Contribution Agreement was approximately $230 million.
In connection with our 50 percent indirect interest in Crowley Ocean Partners LLC, we have agreed to conditionally guarantee our portion of the obligations of the joint venture and its subsidiaries under a senior secured term loan agreement. The term loan agreement provides for loans of up to $325 million to finance the acquisition of four product tankers. MPC’s liability under the guarantee for each vessel is conditioned upon the occurrence of certain events, including if we cease to maintain an investment grade credit rating or the charter for the relevant product tanker ceases to be in effect and is not replaced by a charter with an investment grade company on certain defined commercial terms. As of March 31,June 30, 2019, our maximum potential undiscounted payments under this agreement for debt principal totaled $135$125 million.
In connection with our 50 percent indirect interest in Crowley Blue Water Partners LLC, we have agreed to provide a conditional guarantee of up to 50 percent of its outstanding debt balance in the event there is no charter agreement in place with an investment grade customer for the entity’s three vessels as well as other financial support in certain circumstances. As of March 31,June 30, 2019, our maximum potential undiscounted payments under this arrangement was $125 million .million.
Marathon Oil indemnifications—In conjunction with our spinoff from Marathon Oil, we have entered into arrangements with Marathon Oil providing indemnities and guarantees with recorded values of $1 million as of March 31,June 30, 2019, which consist of unrecognized tax benefits related to MPC, its consolidated subsidiaries and the refining, marketing and transportation business operations prior to our spinoff which are not already reflected in the unrecognized tax benefits described in Note 11, and other contingent liabilities Marathon Oil may incur related to taxes. Furthermore, the separation and distribution agreement and other agreements with Marathon Oil to effect our spinoff provide for cross-indemnities between Marathon Oil and us. In general, Marathon Oil is required to indemnify us for any liabilities relating to Marathon Oil’s historical oil and gas exploration and production operations, oil sands mining operations and integrated gas operations, and we are required to indemnify Marathon Oil for any liabilities relating to Marathon Oil’s historical refining, marketing and transportation operations. The terms of these indemnifications are indefinite and the amounts are not capped.
Other guarantees—We have entered into other guarantees with maximum potential undiscounted payments totaling $123 million as of March 31,June 30, 2019, which primarily consist of a commitment to contribute cash to an equity method investee for certain catastrophic events, in lieu of procuring insurance coverage, a commitment to fund a share of the bonds issued by a government entity for construction of public utilities in the event that other industrial users of the facility default on their utility payments and leases of assets containing general lease indemnities and guaranteed residual values. See Note 5 for information regarding our guarantee of certain borrowings under the ANDX dropdown credit facility.
General guarantees associated with dispositions—Over the years, we have sold various assets in the normal course of our business. Certain of the related agreements contain performance and general guarantees, including guarantees regarding inaccuracies in representations, warranties, covenants and agreements, and environmental and general indemnifications that require us to perform upon the occurrence of a triggering event or condition. These guarantees and indemnifications are part of the normal course of selling assets. We are typically not able to calculate the maximum potential amount of future payments that could be made under such contractual provisions because of the variability inherent in the guarantees and indemnities. Most often, the nature of the guarantees and indemnities is such that there is no appropriate method for quantifying the exposure because the underlying triggering event has little or no past experience upon which a reasonable prediction of the outcome can be based.
Contractual Commitments and Contingencies
At March 31,June 30, 2019, our contractual commitments to acquire property, plant and equipment and advance funds to equity method investees totaled $1.06$1.15 billion.
Certain natural gas processing and gathering arrangements require us to construct natural gas processing plants, natural gas gathering pipelines and NGL pipelines and contain certain fees and charges if specified construction milestones are not achieved for reasons other than force majeure. In certain cases, certain producer customers may have the right to cancel the processing arrangements with us if there are significant delays that are not due to force majeure.
25. SUBSEQUENT EVENT
On May 8, 2019, MPC, MPLX and ANDX announced that MPLX and ANDX have entered into a definitive merger agreement whereby MPLX will acquire ANDX in a unit-for-unit transaction. Under the terms of the merger agreement, ANDX public unitholders will receive 1.135 MPLX common units for each ANDX common unit held and MPC will receive 1.0328 MPLX common units for each ANDX common unit held. As described in Notes 4 and 5, we consolidate ANDX in accordance with ASC 810 and previously recorded ANDX’s assets and liabilities to our balance sheet at preliminary fair values as of the Andeavor acquisition date of October 1, 2018. Upon closing of this merger, we will account for the unit-for-unit transaction as a common control transaction, which will result in a change in our noncontrolling interest and additional paid-in capital.
The transaction has been approved by MPLX’s and ANDX’s respective Conflicts Committees and both Boards of Directors. Subject to the satisfaction of customary closing conditions and receipt of regulatory approvals, the transaction is expected to close in the second half of 2019.
ITEM 2. MANAGEMENT’S DISCUSSION AND ANALYSIS OF FINANCIAL CONDITION AND RESULTS OF OPERATIONS
This section should also be read in conjunction with the unaudited consolidated financial statements and accompanying footnotes included under Item 1. Financial Statements and in conjunction with our Annual Report on Form 10-K for the year ended December 31, 2018.
All statements in this section, other than statements of historical fact, are forward-looking statements that are inherently uncertain. You can identify our forward-looking statements by words such as “anticipate,” “believe,” “could,” “design,” “estimate,” “expect,” “forecast,” “goal,” “guidance,” “imply,” “intend,” “may,” “objective,” “opportunity,” “outlook,” “plan,” “position,” “potential,” “predict,” “project,” “prospective,” “pursue,” “seek,” “should,” “strategy,” “target,” “will,” “would” or other similar expressions that convey the uncertainty of future events or outcomes. In accordance with “safe harbor” provisions of the Private Securities Litigation Reform Act of 1995, these statements are accompanied by cautionary language identifying important factors, though not necessarily all such factors, that could cause future outcomes to differ materially from those set forth in the forward-looking statements.
Forward-looking statements include, but are not limited to, statements that relate to, or statements that are subject to risks, contingencies or uncertainties that relate to:
the risk that the cost savings and any other synergies from the Andeavor acquisition may not be fully realized or may take longer to realize than expected;
disruption from the Andeavor acquisition making it more difficult to maintain relationships with customers, employees or suppliers;
risks relating to any unforeseen liabilities of Andeavor;
the proposed transaction between MPLX LP and Andeavor Logistics LP;LP, including the risk that anticipated opportunities and any other synergies from or anticipated benefits of the transaction may not be fully realized or may take longer to realize than expected, including whether the transaction will be accretive within the expected timeframe or at all, or disruption from the transaction making it more difficult to maintain relationships with customers, employees or suppliers;
the ability to complete any divestitures on commercially reasonable terms and/or within the expected timeframe;
future levels of revenues, refining and marketing margins, operating costs, retail gasoline and distillate margins, merchandise margins, income from operations, net income or earnings per share;
the regional, national and worldwide availability and pricing of refined products, crude oil, natural gas, NGLs and other feedstocks;
consumer demand for refined products;
our ability to manage disruptions in credit markets or changes to our credit rating;
future levels of capital, environmental or maintenance expenditures, general and administrative and other expenses;
the success or timing of completion of ongoing or anticipated capital or maintenance projects;
the reliability of processing units and other equipment;
business strategies, growth opportunities and expected investments;
share repurchase authorizations, including the timing and amounts of any common stock repurchases;
the adequacy of our capital resources and liquidity, including but not limited to, availability of sufficient cash flow to execute our business plan and to effect any share repurchases or dividend increases, including within the expected timeframe;
the effect of restructuring or reorganization of business components;
the potential effects of judicial or other proceedings on our business, financial condition, results of operations and cash flows;
continued or further volatility in and/or degradation of general economic, market, industry or business conditions;
compliance with federal and state environmental, economic, health and safety, energy and other policies and regulations, including the cost of compliance with the Renewable Fuel Standard, and/or enforcement actions initiated thereunder; and
the anticipated effects of actions of third parties such as competitors, activist investors or federal, foreign, state or local regulatory authorities or plaintiffs in litigation.
Our forward-looking statements are not guarantees of future performance, and you should not rely unduly on them, as they involve risks, uncertainties and assumptions that we cannot predict. Material differences between actual results and any future performance suggested in our forward-looking statements could result from a variety of factors, including the following:
volatility or degradation in general economic, market, industry or business conditions;
availability and pricing of domestic and foreign supplies of natural gas, NGLs and crude oil and other feedstocks;
the ability of the members of the OPEC to agree on and to influence crude oil price and production controls;
availability and pricing of domestic and foreign supplies of refined products such as gasoline, diesel fuel, jet fuel, home heating oil and petrochemicals;
foreign imports and exports of crude oil, refined products, natural gas and NGLs;
refining industry overcapacity or under capacity;
changes in producer customers’ drilling plans or in volumes of throughput of crude oil, natural gas, NGLs, refined products or other hydrocarbon-based products;
changes in the cost or availability of third-party vessels, pipelines, railcars and other means of transportation for crude oil, natural gas, NGLs, feedstocks and refined products;
changes to our capital budget, expected construction costs and timing of projects;
the price, availability and acceptance of alternative fuels and alternative-fuel vehicles and laws mandating such fuels or vehicles;
fluctuations in consumer demand for refined products, natural gas and NGLs, including seasonal fluctuations;
political and economic conditions in nations that consume refined products, natural gas and NGLs, including the United States, and in crude oil producing regions, including the Middle East, Africa, Canada and South America;
actions taken by our competitors, including pricing adjustments, expansion of retail activities, the expansion and retirement of refining capacity and the expansion and retirement of pipeline capacity, processing, fractionation and treating facilities in response to market conditions;
completion of pipeline projects within the United States;
changes in fuel and utility costs for our facilities;
failure to realize the benefits projected for capital projects, or cost overruns associated with such projects;
modifications to MPLX and ANDX earnings and distribution growth objectives;
the ability to successfully implement growth opportunities, including strategic initiatives and actions;
risks and uncertainties associated with intangible assets, including any future goodwill or intangible assets impairment charges;
the ability to realize the strategic benefits of joint venture opportunities;
accidents or other unscheduled shutdowns affecting our refineries, machinery, pipelines, processing, fractionation and treating facilities or equipment, or those of our suppliers or customers;
unusual weather conditions and natural disasters, which can unforeseeably affect the price or availability of crude oil and other feedstocks and refined products;
acts of war, terrorism or civil unrest that could impair our ability to produce refined products, receive feedstocks or to gather, process, fractionate or transport crude oil, natural gas, NGLs or refined products;
state and federal environmental, economic, health and safety, energy and other policies and regulations, including the cost of compliance with the renewable fuel standard program;
adverse changes in laws including with respect to tax and regulatory matters;
rulings, judgments or settlements and related expenses in litigation or other legal, tax or regulatory matters, including unexpected environmental remediation costs, in excess of any reserves or insurance coverage;
political pressure and influence of environmental groups upon policies and decisions related to the production, gathering, refining, processing, fractionation, transportation and marketing of crude oil or other feedstocks, refined products, natural gas, NGLs or other hydrocarbon-based products;
labor and material shortages;
the maintenance of satisfactory relationships with labor unions and joint venture partners;
the ability and willingness of parties with whom we have material relationships to perform their obligations to us;
the market price of our common stock and its impact on our share repurchase authorizations;
changes in the credit ratings assigned to our debt securities and trade credit, changes in the availability of unsecured credit, changes affecting the credit markets generally and our ability to manage such changes;
capital market conditions and our ability to raise adequate capital to execute our business plan;
the costs, disruption and diversion of management’s attention associated with campaigns commenced by activist investors; and
the other factors described in Item 1A. Risk Factors in our Annual Report on Form 10-K for the year ended December 31, 2018.
We undertake no obligation to update any forward-looking statements except to the extent required by applicable law.
CORPORATE OVERVIEW
We are a leading, integrated, downstream energy company. We own and operate the nation’s largest refining system with more than 3 million barrels per calendar day of crude oil capacity across 16 refineries, located in the WestGulf Coast, Mid-Continent and GulfWest Coast regions of the United States. Our refineries supply refined products to wholesale marketing customers domestically and internationally, to buyers on the spot market, to consumers through our Retail business segment and to independent entrepreneurs who operate branded outlets. We believe we are one of the largest wholesale suppliers of gasoline and distillates to resellers in the United States.
We have three strong brands: Marathon®, Speedway® and ARCO®. Approximately 6,9007,000 branded outlets, primarily carrying the Marathon brand name, are operated by independent entrepreneurs in 35 states, the District of Columbia and Mexico. We believe our Retail segment operates the second largest chain of company-owned and operated retail transportation fuel and convenience stores in the United States, with approximately 3,9203,910 convenience stores. Our Retail segment also sells transportation fuel to consumers through approximately 1,060 direct dealer locations. Our company-owned and operated locations primarily carry the Speedway® brand name and the direct dealer locations carry primarily the ARCO® brand name.
We are one of the largest midstream operators in North America. We primarily conduct our midstream operations through our ownership interestsinterest in MPLX, which owns and ANDX, which own and operateoperates crude oil and light product transportation and logistics infrastructure as well as gathering, processing, and fractionation assets. On July 30, 2019, MPLX acquired ANDX, as discussed below, to create a leading, large-scale diversified midstream company. As of March 31,June 30, 2019, we owned, leased or had ownership interests in approximately 16,600 miles of crude oil and refined product pipelines to deliver crude oil to ourrefineries and other locations and refined products to wholesale and retail market areas. We distribute our refined products through one of the largest terminal operations in the United States and one of the largest private domestic fleets of inland petroleum product barges. Our integrated midstream gathering and processing network links producers of natural gas and NGLs from some of the largest supply basins in the United States to domestic and international markets. Our midstream gathering and processing operations include: natural gas gathering, processing and transportation; and NGL gathering, transportation, fractionation, storage and marketing. As of March 31, 2019, our assets include approximately 9.9 bcf/d of gathering capacity, 11.1 bcf/d of natural gas processing capacity and 790 mbpd of fractionation capacity.
At March 31,June 30, 2019, our operations consisted of three reportable segments: Refining & Marketing; Retail; and Midstream. Each of these segments is organized and managed based upon the nature of the products and services it offers.
| |
| • | Refining & Marketing – refines crude oil and other feedstocks at our 16 refineries in the WestGulf Coast, Mid-Continent and GulfWest Coast regions of the United States, purchases refined products and ethanol for resale and distributes refined products through transportation, storage, distribution and marketing services provided largely by our Midstream segment. We sell refined products to wholesale marketing customers domestically and internationally, to buyers on the spot market, to our Retail business segment and to independent entrepreneurs who operate primarily Marathon® branded outlets. |
| |
| • | Retail – sells transportation fuels and convenience products in the retail market across the United States through company-owned and operated convenience stores, primarily under the Speedway® brand, and long-term fuel supply contracts with direct dealers who operate locations primarily under the ARCO® brand. |
Midstream – transports, stores, distributes and markets crude oil and refined products principally for the Refining & Marketing segment via refining logistics assets, pipelines, terminals, towboats and barges; gathers, processes and transports natural gas; and gathers, transports, fractionates, stores and markets NGLs. The Midstream segment primarily reflects the results of MPLX and ANDX, our sponsored master limited partnerships.
| |
| • | Midstream – transports, stores, distributes and markets crude oil and refined products principally for the Refining & Marketing segment via refining logistics assets, pipelines, terminals, towboats and barges; gathers, processes and transports natural gas; and gathers, transports, fractionates, stores and markets NGLs. The Midstream segment primarily reflects the results of MPLX and ANDX. |
Recent Developments
On May 8, 2019, MPC, MPLX and ANDX announced that MPLX and ANDX have entered into a definitive merger agreement whereby MPLX will acquire ANDX in a unit-for-unit transaction at a blended exchange ratio of 1.07x. Under the terms of the merger agreement, ANDX public unitholders will receive 1.135 MPLX common units for each ANDX common unit held, representing a premium of 7.3 percent, and MPC will receive 1.0328 MPLX common units for each ANDX common unit held, representing a 2.4 percent discount, based on May 2, 2019 closing prices. As described in Notes 4 and 5 to the unaudited consolidated financial statements, we consolidatehave consolidated ANDX since October 1, 2018 in accordance with ASC 810 and previously recorded ANDX’s assets and liabilities to our balance sheet at preliminary fair values as of the Andeavor acquisition date of October 1, 2018. Upon closing
On July 30, 2019, MPLX completed its acquisition of this merger, weANDX. At the effective time of the ANDX acquisition, each common unit held by ANDX’s public unitholders was converted into the right to receive 1.135 MPLX common units. ANDX common units held by MPC were converted into the right to receive 1.0328 MPLX common units. ANDX common unitholders will not receive any future distributions from ANDX but instead will receive a second quarter 2019 distribution as and when declared by the Board of Directors of MPLX with respect to the MPLX common units issued in connection with the acquisition. Additionally, the ANDX Series A Preferred unitholders will not receive any future distributions from ANDX, but instead will receive the semi-annual distributions payable August 15, 2019 on MPLX Series B Preferred units issued in connection with the acquisition. As of July 30, 2019, MPC will account for the unit-for-unitthis transaction as a common control transaction, as defined by ASC 805, which will result in a change inadjustments to our noncontrolling interest and additional paid-in capital.capital balances.
The anticipated transaction simplifies MPLX and ANDX into a single listed entity to create a leading, large-scale, diversified midstream company anchored by fee-based cash flows. The combined entity will have an expanded geographic footprint that is expected to enhance its long-term growth opportunities and the sustainable cash flow profile of the business.
The transaction has been approved by MPLX’s and ANDX’s respective Conflicts Committees and both Boards of Directors. Subject to the satisfaction of customary closing conditions and receipt of regulatory approvals, the transaction is expected to closeOn August 1, 2019, we highlighted our continued focus on portfolio optimization, which could include asset divestitures. Proceeds from any divestitures would be used for general purposes, such as investments in the second half of 2019.high-return projects as well as debt reduction.
The above discussion contains forward-looking statements with respect to the proposed transaction between MPLX and ANDX. Factors that could affect the proposed transaction between MPLX and ANDX include, but are not limited to, the ability to complete the proposed transaction between MPLX and ANDX on the proposed terms and timetable; the ability to satisfy various conditions to the closing of the transaction contemplated by the merger agreement; the ability to obtain regulatory approvals for the proposed transaction on the proposed terms and schedule, and any conditions imposed on the combined entity in connection with the consummation of the proposed transaction; the risk that anticipated opportunities and any other synergies from or anticipated benefits of the proposed transaction may not be fully realized or may take longer to realize than expected, including whether the proposed transaction will be accretive within the expected timeframe or at all; disruption from the proposed transaction making it more difficult to maintain relationships with customers, employees or suppliers; other risk factors inherent to MPLX’s and ANDX’s industry; and risks related to MPC. For additional information on forward-looking statements and risks that can affect our business, see “Disclosures Regarding Forward-Looking Statements” and “Risk Factors” herein, together with Item 1A. Risk Factors in our Annual Report on Form 10-K for the year ended December 31, 2018.
EXECUTIVE SUMMARY
Results
Select results are reflected in the following table. Our results include the results of Andeavor from the October 1, 2018 acquisition date forward. | | | | | Three Months Ended
March 31, | | Three Months Ended
June 30, | | Six Months Ended
June 30, |
| (In millions, except per share data) | | 2019 | | 2018 | | 2019 | | 2018 | | 2019 | | 2018 |
| Income (loss) from operations by segment | | | | |
| Income from operations by segment | | Income from operations by segment | | | | | | | |
| Refining & Marketing | Refining & Marketing | $ | (334 | ) | | $ | (133 | ) | Refining & Marketing | $ | 906 |
| | $ | 1,025 |
| | $ | 572 |
| | $ | 892 |
|
| Retail | Retail | 170 |
| | 95 |
| Retail | 493 |
| | 159 |
| | 663 |
| | 254 |
|
| Midstream | Midstream | 908 |
| | 567 |
| Midstream | 878 |
| | 617 |
| | 1,786 |
| | 1,184 |
|
| Items not allocated to segments | Items not allocated to segments | (75 | ) | | (89 | ) | Items not allocated to segments | (235 | ) | | (90 | ) | | (310 | ) | | (179 | ) |
| Income from operations | Income from operations | $ | 669 |
| | $ | 440 |
| Income from operations | $ | 2,042 |
| | $ | 1,711 |
| | $ | 2,711 |
| | $ | 2,151 |
|
| Net income (loss) attributable to MPC | $ | (7 | ) | | $ | 37 |
| |
| Net income (loss) attributable to MPC per diluted share | $ | (0.01 | ) | | $ | 0.08 |
| |
| Net income attributable to MPC | | Net income attributable to MPC | $ | 1,106 |
| | $ | 1,055 |
| | $ | 1,099 |
| | $ | 1,092 |
|
| Net income attributable to MPC per diluted share | | Net income attributable to MPC per diluted share | $ | 1.66 |
| | $ | 2.27 |
| | $ | 1.63 |
| | $ | 2.31 |
|
Net income (loss) attributable to MPC was $(7) million,$1.11 billion, or $(0.01)$1.66 per diluted share, in the second quarter of 2019 compared to $1.06 billion, or $2.27 per diluted share, for the second quarter of 2018. Net income attributable to MPC was $1.10 billion, or $1.63 per diluted share, in the first quartersix months of 2019 compared to $37 million,$1.09 billion, or $0.08$2.31 per diluted share, for the first quartersix months of 2018. IncreasedIn both periods of 2019, increased income from operations was more thanpartially offset by increased net interest and other financial costs, provision for income taxes and net income attributable to noncontrolling interests.
Refer to the Results of Operations section for a discussion of consolidated financial results and segment results for the firstsecond quarter of 2019 as compared to the second quarter of 2018 and the first quartersix months of 2019 as compared to the first six months of 2018.
Andeavor Acquisition
On October 1, 2018, we completed the Andeavor acquisition. Andeavor stockholders received in the aggregate approximately 239.8 million shares of MPC common stock valued at $19.8 billion and approximately $3.5 billion in cash in connection with the Andeavor acquisition.
Andeavor was a highly integrated marketing, logistics and refining company operating primarily in the Western and Mid-Continent United States. Andeavor’s operations included procuring crude oil from its source or from other third parties, transporting the crude oil to one of its 10 refineries, and producing, marketing and distributing refined products. Its marketing system included more than 3,300 stations marketed under multiple well-known fuel brands including ARCO®. Also, we acquired the general partner and 156 million common units of ANDX, which is a publicly traded limited partnership that was formed to own, operate, develop and acquire logistics assets. Its assets are integral to the success of our refining and marketing operations and are used to gather crude oil, natural gas, and water, process natural gas and distribute, transport and store crude oil and refined products.
This transaction combined two strong, complementary companies to create a leading nationwide U.S. downstream energy company. The acquisition substantially increasesincreased our geographic diversification and scale and strengthensstrengthened each of our operating segments by diversifying our refining portfolio into attractive markets and increasing access to advantaged feedstocks, enhancing our midstream footprint in the Permian Basin, and creating a nationwide retail and marketing portfolio all of which is expected to substantially improve efficiencies and our ability to serve customers. We expect the combination to generate up to approximately $1.4 billion in gross run-rate synergies within the first three years, significantly enhancing our long-term cash flow generation profile.
MPLX and ANDX
On February 1, 2018, we contributed refining logistics assets and fuels distribution services to MPLX in exchange for $4.1 billion in cash and approximately 114 million newly issued MPLX units. Immediately following the dropdown, our IDRs were cancelled and our economic general partner interest was converted into a non-economic general partner interest, all in exchange for 275 million newly issued MPLX common units. MPLX financed the cash portion of the February 1, 2018 dropdown with its $4.1 billion 364-day term loan facility, which was entered into on January 2, 2018. On February 8, 2018, MPLX issued $5.5 billion in aggregate principal amount of senior notes in a public offering. MPLX used $4.1 billion of the net proceeds of the offering to repay the 364-day term-loan facility. The remaining proceeds were used to repay outstanding borrowings under MPLX’s revolving credit facility and intercompany loan agreement with us and for general partnership purposes.
MPLX and ANDX
We owned approximately 505 million MPLX common units at June 30, 2019 with a market value of $16.25 billion based on the June 28, 2019 closing price of $32.19 per common unit. On July 22, 2019, MPLX declared a quarterly cash distribution of $0.6675 per common unit payable on August 14, 2019. As a result, MPLX will make distributions totaling $692 million to its common unitholders, which includes $94 million to former ANDX common unitholders. MPC’s portion of these distributions is approximately $431 million.
We owned approximately 156 million ANDX common units at June 30, 2019 with a market value of $5.67 billion based on the June 28, 2019 closing price of $36.33 per common unit. Subsequent to MPLX’s acquisition of ANDX, as previously discussed, ANDX common unitholders will not receive any future distributions from ANDX but instead will receive a second quarter 2019 distribution noted above with respect to the MPLX common units issued in connection with the merger. Additionally, the ANDX Series A Preferred unitholders will not receive any future distributions from ANDX, but instead will receive the semi-annual distribution payable August 15, 2019 on MPLX Series B Preferred units issued in connection with the merger.
The following table summarizes the MPLX distributions we received in the threesix months ended March 31,June 30, 2019 and 2018 and ANDX distributions we received in the threesix months ended March 31,June 30, 2019.
|
| | | | | | | | |
| | | Three Months Ended
March 31, |
| (In millions) | | 2019 | | 2018 |
| Cash distributions received: | | | |
| Limited partner distributions - MPLX | $ | 327 |
| | $ | 171 |
|
| Limited partner distributions - ANDX | 146 |
| | — |
|
| Total | $ | 473 |
| | $ | 171 |
|
We owned approximately 505 million MPLX common units at March 31, 2019 with a market value of $16.60 billion based on the March 29, 2019 closing price of $32.89 per common unit. On April 29, 2019, MPLX declared a quarterly cash distribution of $0.6575 per common unit payable on May 15, 2019. As a result, MPLX will make distributions totaling $523 million to its common unitholders. MPC’s portion of these distributions is approximately $332 million.
We owned approximately 156 million ANDX common units at March 31, 2019 with a market value of $5.51 billion based on the March 29, 2019 closing price of $35.26 per common unit. On April 29, 2019, ANDX declared a quarterly cash distribution of $1.03 per common unit payable on May 15, 2019. As a result, ANDX will make distributions totaling $240 million to its common unitholders. MPC’s portion of this distribution is approximately $148 million, which is net of a $12.5 million quarterly waiver. This quarterly distribution waiver is scheduled to remain in effect through the quarter ending December 31, 2019. |
| | | | | | | | |
| | | Six Months Ended
June 30, |
| (In millions) | | 2019 | | 2018 |
| Cash distributions received: | | | |
| Limited partner distributions - MPLX | $ | 659 |
| | $ | 459 |
|
| Limited partner distributions - ANDX | 294 |
| | — |
|
| Total | $ | 953 |
| | $ | 459 |
|
See Note 3 to the unaudited consolidated financial statements for additional information on MPLX and ANDX.
Share Repurchases
During the threesix months ended March 31,June 30, 2019, we returned $885 million$1.39 billion to our shareholders through repurchases of approximately 1423 million shares of common stock at an average price per share of $62.98.$60.75.
Since January 1, 2012, our board of directors has approved $18.0 billion in total share repurchase authorizations and we have repurchased a total of $13.98$14.48 billion of our common stock, leaving $4.02$3.52 billion available for repurchases as of March 31,June 30, 2019. See Note 8 to the unaudited consolidated financial statements.
Liquidity
As of March 31,June 30, 2019, we had cash and cash equivalents of approximately $755 million,$1.22 billion, excluding MPLX and ANDX cash and cash equivalents of $93$7 million and $29$25 million, respectively, no borrowings and $32 million in letters of credit outstanding under our $6.0 billion bank revolving credit facilities and no borrowings outstanding under our $750 million trade receivables facility, resulting in cash and available liquidity of almost $7.5$7.93 billion. As of March 31,June 30, 2019, MPLX had approximately $1.82$1.63 billion available through its bank revolving credit agreement and $1 billion$956 million available through its intercompany credit facility with MPC. As of March 31,June 30, 2019, ANDX had approximately $696$600 million available through its bank revolving credit agreements and $500 million available through its intercompany credit facility with MPC.
Upon the completion of the merger of MPLX and ANDX on July 30, 2019, the MPLX bank revolving credit facility was amended and restated to increase the borrowing capacity to $3.5 billion and to extend the maturity date to July 30, 2024. The ANDX revolving and dropdown credit facilities were terminated and all outstanding balances were repaid and funded with the new $3.5 billion bank revolving credit facility.
On July 31, 2019, in connection with the closing of the ANDX merger, we amended and restated the existing intercompany loan agreement with MPLX to, among other things, increase MPLX’s borrowing capacity thereunder from $1.0 billion to $1.5 billion in loans at any one time outstanding and to extend the term of the intercompany loan agreement to July 31, 2024.
On July 26, 2019, we entered into a new $1 billion 364-day revolving credit facility with a syndicate of banks that will, subject to the satisfaction of customary conditions, become effective upon the expiration of our existing $1 billion 364-day revolving facility in September 2019. The new 364-day revolving credit facility contains substantially the same terms and conditions as our existing 364-day revolving credit facility and will expire in September 2020.
On July 19, 2019, we amended our $750 million trade receivables securitization facility to extend the maturity date to July 16, 2021.
OVERVIEW OF SEGMENTS
Refining & Marketing
Refining & Marketing segment income from operations depends largely on our Refining & Marketing margin and refinery throughputs.
Our Refining & Marketing margin is the difference between the prices of refined products sold and the costs of crude oil and other charge and blendstocks refined, including the costs to transport these inputs to our refineries and the costs of products purchased for resale. The crack spread is a measure of the difference between market prices for refined products and crude oil, commonly used by the industry as a proxy for the refining margin. Crack spreads can fluctuate significantly, particularly when prices of refined products do not move in the same relationship as the cost of crude oil. As a performance benchmark and a comparison with other industry participants, we calculate WestGulf Coast, Mid-Continent and GulfWest Coast 3-2-1 crack spreads that we believe most closely track our operations and slate of products. The following are used for these crack-spread calculations:
The WestGulf Coast crack spread uses three barrels of ANSLLS crude producing two barrels of LA CARBOBUSGC CBOB gasoline and one barrel of LA CARB Diesel;
USGC ULSD;
The Mid-Continent crack spread uses three barrels of WTI crude producing two barrels of Chicago CBOB gasoline and one barrel of Chicago ULSD; and
The GulfWest Coast crack spread uses three barrels of LLSANS crude producing two barrels of USGC CBOB gasolineLA CARBOB and one barrel of USGC ULSD.LA CARB Diesel.
Our refineries can process significant amounts of sweet and sour crude oil, which typically can be purchased at a discount to crude oil referenced in these crack spreads. The amount of these discounts, the sweet and sour differentials, can vary significantly, causing our Refining & Marketing margin to differ from crack spreads. In general, larger sweet and sour differentials will enhance our Refining & Marketing margin.
Future crude oil differentials will be dependent on a variety of market and economic factors, as well as U.S. energy policy.
The following table provides sensitivities showing an estimated change in annual net income due to potential changes in market conditions. |
| | | | |
| (In millions, after-tax) | | |
Blended crack spread sensitivity(a) (per $1.00/barrel change) | $ | 900 |
|
Sour differential sensitivity(b) (per $1.00/barrel change) | 450 |
|
Sweet differential sensitivity(c) (per $1.00/barrel change) | 370 |
|
Natural gas price sensitivity(d) (per $1.00/MMBtu) | 300 |
|
| |
(a) | Crack spread based on 38 percent WTI,LLS, 38 percent LLSWTI and 24 percent ANS with Mid-Continent, Gulf Coast, Mid-Continent and West Coast product pricing, respectively, and assumes all other differentials and pricing relationships remain unchanged. |
| |
(b) | Sour crude oil basket consists of the following crudes: ANS, Argus Sour Crude Index, Maya and Western Canadian Select |
| |
(c) | Sweet crude oil basket consists of the following crudes: Bakken, Brent, LLS, WTI-Cushing and WTI-Midland |
| |
(d) | This is consumption based exposure for our Refining & Marketing segment and does not include the the effects to our Midstream segment. |
In addition to the market changes indicated by the crack spreads, the sour differential and the sweet differential, our Refining & Marketing margin is impacted by factors such as:
the selling prices realized for and the mix of refined products as compared to the assumptions used to calculate the market crack spreads;
the types of crude oil and other charge and blendstocks processed as compared to the assumptions used to calculate the market crack spreads;
our refinery yields;
the cost of products purchased for resale;
the impact of commodity derivative instruments used to hedge price risk; and
the potential impact of LCM adjustments to inventories in periods of declining prices.
Inventories are stated at the lower of cost or market. Costs of crude oil, refinery feedstocks and refined products are stated under the LIFO inventory costing method and aggregated on a consolidated basis for purposes of assessing if the cost basis of these inventories may have to be written down to market values.
Refining & Marketing segment income from operations is also affected by changes in refinery direct operating costs, which include turnaround and major maintenance, depreciation and amortization and other manufacturing expenses. Changes in manufacturing costs are primarily driven by the cost of energy used by our refineries, including purchased natural gas, and the level of maintenance costs. Planned major maintenance activities, or turnarounds, requiring temporary shutdown of certain refinery operating units, are periodically performed at each refinery. Costs for planned turnaround, major maintenance and engineering projects are expensed in the period incurred.
We have various long-term, fee-based commercial agreements with MPLX and ANDX. Under these agreements, MPLX and ANDX, which are reported in our Midstream segment, provide transportation, storage, distribution and marketing services to our Refining & Marketing segment. Certain of these agreements include commitments for minimum quarterly throughput and distribution volumes of crude oil and refined products and minimum storage volumes of crude oil, refined products and other products. Certain other agreements include commitments to pay for 100 percent of available capacity for certain marine transportation and refining logistics assets.
Retail
Retail segment profitability is impacted by fuel and merchandise margin. Fuel margin for gasoline and distillate is the price paid by consumers or direct dealers less the cost of refined products, including transportation, consumer excise taxes and bankcard processing fees (where applicable). Gasoline and distillate prices are volatile and are impacted by changes in supply
and demand in the regions where we operate. Numerous factors impact gasoline and distillate demand throughout the year, including local competition, seasonal demand fluctuations, the available wholesale supply, the level of economic activity in our marketing areas and weather conditions.
The margin on merchandise sold at our convenience stores historically has been less volatile and has contributed substantially to our Retail segment margin. Our Retail convenience stores offer a wide variety of merchandise, including prepared foods, beverages and non-food items.
Inventories are carried at the lower of cost or market value. Costs of refined products and merchandise are stated under the LIFO inventory costing method and aggregated on a consolidated basis for purposes of assessing if the cost basis of these inventories may have to be written down to market values.
Midstream
Our Midstream segment transports, stores, distributes and markets crude oil and refined products, principally for our Refining & Marketing segment. The profitability of our pipeline transportation operations primarily depends on tariff rates and the volumes shipped through the pipelines. The profitability of our marine operations primarily depends on the quantity and availability of our vessels and barges. The profitability of our light product terminal operations primarily depends on the throughput volumes at these terminals. The profitability of our fuels distribution services primarily depends on the sales volumes of certain refined products. The profitability of our refining logistics operations depends on the quantity and availability of our refining logistics assets. A majority of the crude oil and refined product shipments on our pipelines and marine vessels and the refined product throughput at our terminals serve our Refining & Marketing segment and our refining logistics assets and fuels distribution services are used solely by our Refining & Marketing segment. As discussed above in the Refining & Marketing section, MPLX and ANDX, which are reported in our Midstream segment, have various long-term, fee-based commercial agreements related to services provided to our Refining & Marketing segment. Under these agreements, MPLX and ANDX have received various commitments of minimum throughput, storage and distribution volumes as well as commitments to pay for all available capacity of certain assets. The volume of crude oil that we transport is directly affected by the supply of, and refiner demand for, crude oil in the markets served directly by our crude oil pipelines, terminals and marine operations. Key factors in this supply and demand balance are the production levels of crude oil by producers in various regions or fields, the availability and cost of alternative modes of transportation, the volumes of crude oil processed at refineries and refinery and transportation system maintenance levels. The volume of refined products that we transport, store, distribute and market is directly affected by the production levels of, and user demand for, refined products in the markets served by our refined product pipelines and marine operations. In most of our markets, demand for gasoline and distillate peaks during the summer driving season, which extends from May through September of each year, and declines during the fall and winter months. As with crude oil, other transportation alternatives and system maintenance levels influence refined product movements.
Our Midstream segment also gathers and processes natural gas and NGLs. NGL and natural gas prices are volatile and are impacted by changes in fundamental supply and demand, as well as market uncertainty, availability of NGL transportation and fractionation capacity and a variety of additional factors that are beyond our control. Our Midstream segment profitability is affected by prevailing commodity prices primarily as a result of processing at our own or third‑party processing plants, purchasing and selling or gathering and transporting volumes of natural gas at index‑related prices and the cost of third‑party transportation and fractionation services. To the extent that commodity prices influence the level of natural gas drilling by our producer customers, such prices also affect profitability.
RESULTS OF OPERATIONS
The following discussion includes comments and analysis relating to our results of operations. Our results include the results of Andeavor from the October 1, 2018 acquisition date forward. This discussion should be read in conjunction with Item 1. Financial Statements and is intended to provide investors with a reasonable basis for assessing our historical operations, but should not serve as the only criteria for predicting our future performance.
Consolidated Results of Operations
| | | | | Three Months Ended
March 31, | | Three Months Ended
June 30, | | Six Months Ended
June 30, |
| (In millions) | | 2019 | | 2018 | | Variance | | 2019 | | 2018 | | Variance | | 2019 | | 2018 | | Variance |
| Revenues and other income: | Revenues and other income: | | | | | | Revenues and other income: | | | | | | | | | | | |
| Sales and other operating revenues | Sales and other operating revenues | $ | 28,081 |
| | $ | 18,694 |
| | $ | 9,387 |
| Sales and other operating revenues | $ | 33,547 |
| | $ | 22,317 |
| | $ | 11,230 |
| | $ | 61,814 |
| | $ | 41,183 |
| | $ | 20,631 |
|
| Sales to related parties | 186 |
| | 172 |
| | 14 |
| |
| Income from equity method investments | Income from equity method investments | 99 |
| | 86 |
| | 13 |
| Income from equity method investments | 107 |
| | 80 |
| | 27 |
| | 206 |
| | 166 |
| | 40 |
|
| Net gain on disposal of assets | Net gain on disposal of assets | 214 |
| | 2 |
| | 212 |
| Net gain on disposal of assets | 4 |
| | 3 |
| | 1 |
| | 218 |
| | 5 |
| | 213 |
|
| Other income | Other income | 35 |
| | 30 |
| | 5 |
| Other income | 30 |
| | 45 |
| | (15 | ) | | 65 |
| | 75 |
| | (10 | ) |
| Total revenues and other income | Total revenues and other income | 28,615 |
| | 18,984 |
| | 9,631 |
| Total revenues and other income | 33,688 |
| | 22,445 |
| | 11,243 |
| | 62,303 |
| | 41,429 |
| | 20,874 |
|
| Costs and expenses: | Costs and expenses: | | | | | | Costs and expenses: | | | | | | | | | | | |
| Cost of revenues (excludes items below) | Cost of revenues (excludes items below) | 25,756 |
| | 17,370 |
| | 8,386 |
| Cost of revenues (excludes items below) | 29,682 |
| | 19,655 |
| | 10,027 |
| | 55,642 |
| | 37,166 |
| | 18,476 |
|
| Purchases from related parties | 204 |
| | 141 |
| | 63 |
| |
| Depreciation and amortization | Depreciation and amortization | 919 |
| | 528 |
| | 391 |
| Depreciation and amortization | 886 |
| | 533 |
| | 353 |
| | 1,805 |
| | 1,061 |
| | 744 |
|
| Selling, general and administrative expenses | Selling, general and administrative expenses | 881 |
| | 402 |
| | 479 |
| Selling, general and administrative expenses | 904 |
| | 424 |
| | 480 |
| | 1,785 |
| | 826 |
| | 959 |
|
| Other taxes | Other taxes | 186 |
| | 103 |
| | 83 |
| Other taxes | 174 |
| | 122 |
| | 52 |
| | 360 |
| | 225 |
| | 135 |
|
| Total costs and expenses | Total costs and expenses | 27,946 |
| | 18,544 |
| | 9,402 |
| Total costs and expenses | 31,646 |
| | 20,734 |
| | 10,912 |
| | 59,592 |
| | 39,278 |
| | 20,314 |
|
| Income from operations | Income from operations | 669 |
| | 440 |
| | 229 |
| Income from operations | 2,042 |
| | 1,711 |
| | 331 |
| | 2,711 |
| | 2,151 |
| | 560 |
|
| Net interest and other financial costs | Net interest and other financial costs | 306 |
| | 183 |
| | 123 |
| Net interest and other financial costs | 322 |
| | 195 |
| | 127 |
| | 628 |
| | 378 |
| | 250 |
|
| Income before income taxes | Income before income taxes | 363 |
| | 257 |
| | 106 |
| Income before income taxes | 1,720 |
| | 1,516 |
| | 204 |
| | 2,083 |
| | 1,773 |
| | 310 |
|
| Provision for income taxes | Provision for income taxes | 104 |
| | 22 |
| | 82 |
| Provision for income taxes | 353 |
| | 281 |
| | 72 |
| | 457 |
| | 303 |
| | 154 |
|
| Net income | Net income | 259 |
| | 235 |
| | 24 |
| Net income | 1,367 |
| | 1,235 |
| | 132 |
| | 1,626 |
| | 1,470 |
| | 156 |
|
| Less net income attributable to: | Less net income attributable to: | | | | | | Less net income attributable to: | | | | | | | | | | | |
| Redeemable noncontrolling interest | Redeemable noncontrolling interest | 20 |
| | 16 |
| | 4 |
| Redeemable noncontrolling interest | 21 |
| | 20 |
| | 1 |
| | 41 |
| | 36 |
| | 5 |
|
| Noncontrolling interests | Noncontrolling interests | 246 |
| | 182 |
| | 64 |
| Noncontrolling interests | 240 |
| | 160 |
| | 80 |
| | 486 |
| | 342 |
| | 144 |
|
| Net income (loss) attributable to MPC | $ | (7 | ) | | $ | 37 |
| | $ | (44 | ) | |
| Net income attributable to MPC | | Net income attributable to MPC | $ | 1,106 |
| | $ | 1,055 |
| | $ | 51 |
| | $ | 1,099 |
| | $ | 1,092 |
| | $ | 7 |
|
Second Quarter 2019 Compared to Second Quarter 2018
Net income (loss) attributable to MPC decreased $44increased $51 million in the firstsecond quarter of 2019 compared to the firstsecond quarter of 2018 primarily due to an increase in income from operations, morepartially offset by increases in net interest and other financial costs, net income attributable to noncontrolling interests and provision for income taxes.
Revenues and other income increased $11.24 billion. Sales and other operating revenues increased $11.23 billion primarily due to increased Refining & Marketing segment refined product sales volumes, which increased 1,422 mbpd, largely due to the Andeavor acquisition on October 1, 2018.
Costs and expenses increased $10.91 billion primarily due to:
increased cost of revenues of $10.03 billion mainly due to the inclusion of costs related to the Andeavor operations following the acquisition;
increased depreciation and amortization of $353 million primarily due to the depreciation of the fair value of assets acquired in connection with the Andeavor acquisition;
increased selling, general and administrative expenses of $480 million largely due to the inclusion of costs related to Andeavor operations and reflecting MPC’s classification of costs and expenses; and
increased other taxes of $52 million primarily due to the inclusion of other taxes related to the acquired Andeavor operations.
Net interest and other financial costs increased $127 million mainly due to debt assumed in the acquisition of Andeavor and increased MPLX borrowings.
Provision for income taxes increased $72 million primarily due to increased income before income taxes of $204 million. The combined federal, state and foreign income tax rate was 21 percent and 19 percent for the three months ended June 30, 2019 and 2018, respectively. The effective tax rate for the three months ended June 30, 2019 was equal to the U.S. statutory rate of 21 percent primarily due to certain permanent tax differences related to net income attributable to noncontrolling interests offset by equity compensation and state and local tax expense. The effective tax rate for the three months ended June 30, 2018 was less than the U.S. statutory rate of 21 percent primarily due to certain permanent tax differences related to net income attributable to noncontrolling interests and equity compensation offset by state and local tax expense.
Net income attributable to noncontrolling interests increased $80 million primarily due to net income attributable to noncontrolling interest in ANDX.
Six Months Ended June 30, 2019 Compared to Six Months Ended June 30, 2018
Net income attributable to MPC increased $7 million in the first six months of 2019 compared to the first six months of 2018 primarily due to an increase in income from operations, partially offset by increases in net interest and other financial costs, provision for income taxes and net income attributable to noncontrolling interests.
First Quarter 2019 Compared to First Quarter 2018
Revenues and other income increased $9.63$20.87 billion primarily due to:
increased sales and other operating revenues of $9.39$20.63 billion primarily due to increased Refining & Marketing segment refined product sales volumes, which increased 1,4081,415 mbpd, largely due to the Andeavor acquisition on October 1, 2018; and
increased net gain on disposal of assets of $212$213 million primarily mainly due to a $207 million gain recognized in connection with MPC’s exchange of its undivided interest in the Capline pipeline system for an equity ownership in Capline LLC.
Costs and expenses increased $9.40$20.31 billion primarily due to:
increased cost of revenues of $8.39$18.48 billion primarily due to the inclusion of costs related to the Andeavor operations following the acquisition;
increased depreciation and amortization of $391$744 million primarilylargely due to the depreciation of the fair value of assets acquired in connection with the Andeavor acquisition;
increased selling, general and administrative expenses of $479$959 million primarilymainly due to increasedthe inclusion of costs of the combined company subsequentrelated to the acquisition of Andeavor operations and reflectsreflecting MPC’s classification of costs and expenses; and
increased other taxes of $83$135 million primarily due to the inclusion of other taxes related to the acquired Andeavor operations.
Net interest and other financial costs increased $123$250 million primarilylargely due to debt assumed in the acquisition of Andeavor and increased MPLX borrowings.
Provision for income taxes increased $82$154 million primarily due to increased income before income taxes of $106$310 million and $36 million of state deferred tax expense recorded as an out of period adjustment related to the Andeavor acquisition. The combined federal, state and foreign income tax rate was 2922 percent and 917 percent for the threesix months ended March 31,June 30, 2019 and 2018, respectively. The effective tax rate for the threesix months ended March 31,June 30, 2019 was greater than the U.S. statutory rate of 21 percent primarily due to $36 million of state deferred tax expense recorded as an out of period adjustment, partially offset by permanent tax differences related to net income attributable to noncontrolling interests. The effective tax rate for the threesix months ended March 31,June 30, 2018 was less than the U.S. statutory rate of 21 percent primarily due to certain permanent tax differences related to net income attributable to noncontrolling interests and equity compensation offset by state and local deferred tax benefits primarily resulting from the February 1, 2018 dropdown and GP/IDR Exchange and equity compensation.expense.
Net income attributable to noncontrolling interests increased $64$144 million primarily due to net income attributable to noncontrolling interest in ANDX.
Segment Results
Our segment income from operations was approximately $3.02 billion and $2.33 billion for the six months ended June 30, 2019 and 2018, respectively. The following shows the percentage of segment income from operations by segment for these periods.
Refining & Marketing
The following includes key financial and operating data for the firstsecond quarter of 2019 compared to the firstsecond quarter of 2018.2018 and the six months ended June 30, 2019 compared to the six months ended June 30, 2018. Our results include the results of Andeavor from the October 1, 2018 acquisition date forward.
We revised our Refining & Marketing segment supplemental reporting in the second quarter as shown in the table on page 42. Costs formerly included in MPC’s direct operating costs category are now presented in three categories: refining operating costs, refining planned turnaround costs and depreciation and amortization. We also present distribution costs, formerly referred to as other operating expenses, which are primarily related to transportation and marketing of refined products, including fees paid to MPLX and ANDX.
| |
(a) | Includes intersegment sales and sales destined for export. |
|
| | | | | | | | | | | | | | | | |
| | | Three Months Ended
June 30, | | Six Months Ended
June 30, |
| | | 2019 | | 2018 | | 2019 | | 2018 |
| Refining & Marketing Operating Statistics | | | | | | | | |
Total refinery throughputs (mbpd) | | 3,135 |
| | 2,038 |
| | 3,109 |
| | 1,972 |
|
Refining & Marketing margin per barrel(a)(b) | | $ | 15.24 |
| | $ | 15.40 |
| | $ | 13.23 |
| | $ | 13.08 |
|
| Less: | | | | | | | | |
Refining operating costs per barrel(c) | | 5.35 |
| | 4.19 |
| | 5.47 |
| | 4.72 |
|
Distribution costs per barrel(d) | | 4.48 |
| | 4.17 |
| | 4.56 |
| | 3.93 |
|
Other per barrel(e) | | (0.04 | ) | | (0.18 | ) | | (0.06 | ) | | (0.14 | ) |
| Refining planned turnaround costs per barrel | | 0.83 |
| | 0.33 |
| | 0.75 |
| | 0.66 |
|
| Depreciation and amortization per barrel | | 1.44 |
| | 1.36 |
| | 1.49 |
| | 1.41 |
|
| Refining & Marketing segment income per barrel | | $ | 3.18 |
| | $ | 5.53 |
| | $ | 1.02 |
| | $ | 2.50 |
|
| |
(b)(a)
| Sales revenue less cost of refinery inputs and purchased products, divided by total refinery throughputs. |
| |
(c)(b)
| See “Non-GAAP Measures” section for reconciliation and further information regarding this non-GAAP measure. |
| |
(d)(c)
| Per barrel of total refinery throughputs.Includes refining major maintenance and operating costs. Excludes turnaround and depreciation and amortization expense. |
| |
(e)(d)
| Includes utilities, labor, routine maintenancefees paid to MPLX and other operating costs.ANDX. On a per barrel throughput basis, these fees were $2.80 and $3.21 for the three months ended June 30, 2019 and 2018, respectively, and $2.81 and $3.01 for the six months ended June 30, 2019 and 2018, respectively. Excludes depreciation and amortization expense. |
| |
(f)(e)
| Primarily related to refined product distribution costs, including fees paid to our two sponsored master limited partnerships, MPLXIncludes income from equity method investments, net gain on disposal of assets and ANDX.other income. |
The following table presents certain benchmark prices in our marketing areas and market indicators that we believe are helpful in understanding the results of our Refining & Marketing segment. Following the acquisition of Andeavor in October 2018, we expanded the benchmark prices included in these tables to include market information for the West Coast region of the United States, including LA CARBOB and LA CARB diesel spot prices, ANS crude prices and a West Coast ANS 3-2-1 crack spread. However, since the results of the Andeavor businesses are only included in our results from October 1, 2018 forward, these market indicators did not affect our results for the second quarter and first quartersix months of 2018. The benchmark crack spreads below do not reflect the market cost of RINs necessary to meet EPA renewable volume obligations for attributable products under the Renewable Fuel Standard. | | | | | Three Months Ended
March 31, | | Three Months Ended
June 30, | | Six Months Ended
June 30, |
Benchmark Spot Prices (dollars per gallon) | | 2019 | | 2018 | | 2019 | | 2018 | | 2019 | | 2018 |
| Chicago CBOB unleaded regular gasoline | Chicago CBOB unleaded regular gasoline | $ | 1.51 |
| | $ | 1.74 |
| Chicago CBOB unleaded regular gasoline | $ | 1.94 |
| | $ | 2.02 |
| | $ | 1.73 |
| | $ | 1.88 |
|
| Chicago ULSD | Chicago ULSD | 1.84 |
| | 1.94 |
| Chicago ULSD | 1.94 |
| | 2.12 |
| | 1.89 |
| | 2.03 |
|
| USGC CBOB unleaded regular gasoline | USGC CBOB unleaded regular gasoline | 1.52 |
| | 1.77 |
| USGC CBOB unleaded regular gasoline | 1.79 |
| | 1.96 |
| | 1.66 |
| | 1.87 |
|
| USGC ULSD | USGC ULSD | 1.88 |
| | 1.93 |
| USGC ULSD | 1.94 |
| | 2.11 |
| | 1.91 |
| | 2.02 |
|
| LA CARBOB | | 1.82 |
| | 1.98 |
| | 2.18 |
| | 2.21 |
| | 2.00 |
| | 2.10 |
|
| LA CARB diesel | | 1.92 |
| | 2.01 |
| | 2.13 |
| | 2.21 |
| | 2.02 |
| | 2.11 |
|
| | | | | | | | | | | | | |
Market Indicators (dollars per barrel) | | | | | | | | | | | | |
| LLS | | $ | 62.34 |
| | $ | 65.82 |
| | $ | 67.15 |
| | $ | 73.03 |
| | $ | 64.79 |
| | $ | 69.51 |
|
| WTI | | 54.90 |
| | 62.89 |
| | 59.91 |
| | 67.91 |
| | 57.45 |
| | 65.46 |
|
| ANS | | 64.48 |
| | 67.00 |
| | 68.28 |
| | 74.14 |
| | 66.41 |
| | 70.65 |
|
| Crack Spreads: | | | | | | | | | | | | |
| Mid-Continent WTI 3-2-1 | Mid-Continent WTI 3-2-1 | $ | 11.70 |
| | $ | 9.89 |
| Mid-Continent WTI 3-2-1 | $ | 20.43 |
| | $ | 16.58 |
| | $ | 16.15 |
| | 13.35 |
|
| USGC LLS 3-2-1 | USGC LLS 3-2-1 | 5.23 |
| | 7.88 |
| USGC LLS 3-2-1 | 8.98 |
| | 9.69 |
| | 7.14 |
| | 8.81 |
|
| West Coast ANS 3-2-1 | West Coast ANS 3-2-1 | 11.91 |
| | 13.77 |
| West Coast ANS 3-2-1 | 21.78 |
| | 17.03 |
| | 16.93 |
| | 15.45 |
|
Blended 3-2-1(a) | Blended 3-2-1(a) | 9.29 |
| | 8.69 |
| Blended 3-2-1(a) | 16.41 |
| | 14.07 |
| | 12.91 |
| | 10.63 |
|
| Crude Oil Differentials: | Crude Oil Differentials: | | | | Crude Oil Differentials: | | | | | | | |
| Sweet | Sweet | $ | (3.30 | ) | | $ | (0.59 | ) | Sweet | $ | (2.62 | ) | | $ | (3.27 | ) | | $ | (2.95 | ) | | $ | (1.90 | ) |
| Sour | Sour | (3.13 | ) | | (6.35 | ) | Sour | (2.04 | ) | | (7.86 | ) | | (2.58 | ) | | (6.87 | ) |
| |
(a) | Blended 3-2-1 Mid-Continent/USGC/West Coast crack spread is 38/38/24 percent in 2019 and Blended 3-2-1 Mid-Continent/USGC crack spread is 40/60 percent in 2018, which reflects MPC’s capacity prior to the Andeavor acquisition. These blends are based on our refining capacity by region in each period. |
FirstSecond Quarter 2019 Compared to FirstSecond Quarter 2018
Refining & Marketing segment revenues increased $8.40$9.98 billion primarily due to higher refined product sales volumes, which increased 1,4081,422 mbpd mainly due to the Andeavor acquisition on October 1, 2018, partially offset by decreased average refined product sales prices of $0.08$0.07 per gallon.
Refinery crude oil capacity utilization was 97 percent during the second quarter of 2019 and total refinery throughputs increased 1,097 mbpd primarily due to the refineries acquired from Andeavor.
Refining & Marketing segment lossincome from operations increased $201decreased $119 million primarily driven by narrower crude discounts across our mediumhigher Refining & Marketing margin, which was more than offset by higher operating, distribution and heavy crude slate. Additionally, high industry gasoline inventoriesplanned turnaround costs as well as higher depreciation and amortization. The increases in Refining & Marketing margin and costs and expenses were primarily due to increased sales and production volumes following the fourth quarter’s strong production environment resulted in weaker gasoline margins particularly in JanuaryAndeavor acquisition.
Refining & Marketing margin was $15.24 per barrel for the second quarter of 2019.
Based on2019 compared to $15.40 per barrel for the changes insecond quarter of 2018. Refining & Marketing margin is affected by the market indicators shown above,earlier, which use spot market values and an estimated mix of crude purchases and product sales,sales. Based on the market indicators and our crude oil throughput, we estimate a net positive impact of $1.41approximately $2.1 billion on Refining & Marketing margin for the second quarter of 2019 compared to the second quarter of 2018, primarily due to an approximate $2.0 billion benefit from increased throughput volume, mainly attributed to the Andeavor acquisition, partially offset by narrower crude oil differentials. Our reported Refining & Marketing margin differs from market indicators due to the mix of crudes purchased and their costs, the
effect of market structure on our crude oil acquisition prices, the effect of RIN prices on the crack spread, and other items like refinery yields and other feedstock variances. These factors had an estimated negative effect of $600 million on Refining & Marketing segment income in the second quarter of 2019 compared to the second quarter of 2018.
Refining operating costs, excluding depreciation and amortization, increased $1.16 per barrel, refining planned turnaround costs increased $0.50 per barrel and distribution costs, excluding depreciation and amortization, increased $0.31 per barrel. All of these increases were primarily due to the inclusion of costs for the refining operations acquired from Andeavor and the timing of turnaround activity. The per barrel cost increases, among other items, reflect the addition of Andeavor’s West Coast refineries, which generally have higher operating costs than the other regions in which we operate due to specific geographical location and regulatory factors. Distribution costs, excluding depreciation and amortization, include fees paid to MPLX and ANDX of $798 million and $596 million for the second quarter of 2019 and 2018, respectively. Depreciation and amortization per barrel increased by $0.08, primarily due to the $0.07 increase for intangible asset amortization related to the fair value of assets acquired from Andeavor as of October 1, 2018.
Six Months Ended June 30, 2019 Compared to Six Months Ended June 30, 2018
Refining & Marketing segment revenues increased $18.38 billion primarily due to higher refined product sales volumes, which increased 1,415 mbpd mainly due to the Andeavor acquisition on October 1, 2018, partially offset by decreased average refined product sales prices of $0.07 per gallon.
Refinery crude oil capacity utilization was 96 percent in the first six months of 2019 and total refinery throughputs increased 1,137 mbpd primarily due to the refineries acquired from Andeavor.
Refining & Marketing segment income from operations largelydecreased $320 million primarily driven by higher Refining & Marketing margin, more than offset by higher operating, distribution, planned turnaround and depreciation costs. The increases in Refining & Marketing margin and operating, distribution, planned turnaround and depreciation costs are primarily due to increased sales and production volumes following the Andeavor acquisition.
Refining & Marketing margin was $13.23 per barrel for the first six months 2019 compared to $13.08 per barrel for the first six months of 2018. Refining & Marketing margin is affected by the market indicators shown earlier, which use spot market values and an estimated mix of crude purchases and product sales. Based on the market indicators and our crude oil throughput, we estimate a $1.54net positive impact of approximately $3.5 billion on Refining & Marketing margin for the first six months of 2019 compared to the first six months of 2018, primarily due to an approximate $3.2 billion benefit from increases in sales volume. Differences in our results comparedincreased throughput volume, mainly attributed to thesethe Andeavor acquisition, and wider sweet crude oil differentials, partially offset by narrowing sour crude oil differentials.Our reported Refining & Marketing margin differs from market indicators including the effects of product price realizations,due to the mix of crudes purchased and their costs, market structure on our crude oil acquisition prices, RIN prices on the crack spread, and other items like refinery yields and other feedstock variances,variances. These factors had an estimated negative effect of $120approximately $700 million on Refining & Marketing segment income in the first quartersix months of 2019 compared to the first quartersix months of 2018.
Refinery capacity utilization was 95 percent inclusiveRefining operating costs, excluding depreciation and amortization, increased $0.75 per barrel, refining planned turnaround costs increased $0.09 per barrel and distribution costs, excluding depreciation and amortization, increased $0.63 per barrel. All of turnaround activity during the first quarter of 2019 and crude oil throughputs increased 1,124 mbpdthese increases were primarily due to the refineriesinclusion of costs for the refining operations acquired from Andeavor.
Refining & Marketing margin was $11.17turnaround activity. The per barrel forcost increases, among other items, reflect the first quarteraddition of 2019 compared to $10.58 per barrel for the first quarter of 2018. Refinery directAndeavor’s West Coast refineries, which generally have higher operating costs decreased $0.02 per barrel. Inthan the first quarter of 2019, planned turnaround and major maintenance costs decreased $0.99 per barrel, largely attributable to lower turnaround costs at our Galveston Bay refinery partially offset by higher turnaround costs at our Los Angeles and Robinson refineries. In the first quarter of 2019, other manufacturing costs were $0.94 per barrel higher primarilyregions in which we operate due to the refineries acquired in the Andeavor acquisition. Higher crude throughputs during the first three months of 2019 also reduced refinery direct operatingspecific geographical location and regulatory factors. Distribution costs, per barrel.
Other operating expenses totaled $1,308 million for the first quarter of 2019 as compared to $630 million for the first quarter of 2018. These costs are primarily related to refined product distribution costs, including fees paid to our two sponsored master limited partnerships, MPLXexcluding depreciation and ANDX. Included in these costs wereamortization, include fees paid to MPLX and ANDX of $609 million$1.58 billion and $478 million$1.07 billion for the first quarterssix months ended of 2019 and 2018, respectively. The higher fees charged by MPLX were primarilyfirst six months of 2019 also increased due to one additional month of fixed fee services provided by MPLX due to timing of dropdown transactions in 2018. Depreciation and amortization per barrel increased by $0.08, primarily due to the Refining & Marketing segment in$0.07 increase for intangible asset amortization related to the first quarterfair value of 2019 following the February 1, 2018 dropdown of refining logistic assets and fuels distribution services to MPLX. The balance of the increase was mainly driven by the inclusion of other operating expenses for the refining and marketing operations acquired from Andeavor.Andeavor as of October 1, 2018.
Supplemental Refining & Marketing Statistics
| | | | Three Months Ended
March 31, | Three Months Ended
June 30, | | Six Months Ended
June 30, |
| | 2019 | | 2018 | 2019 | | 2018 | | 2019 | | 2018 |
| Refining & Marketing Operating Statistics | | | | | | | | | | |
Refined product export sales volumes (mbpd)(a) | 430 |
| | 265 |
| 408 |
| | 311 |
| | 420 |
| | 292 |
|
Crude oil capacity utilization percent(b) | 95 |
| | 93 |
| 97 |
| | 100 |
| | 96 |
| | 96 |
|
Refinery throughputs (mbpd):(c) | | | | | | | | | | |
| Crude oil refined | 2,869 |
| | 1,745 |
| 2,937 |
| | 1,878 |
| | 2,902 |
| | 1,812 |
|
| Other charge and blendstocks | 215 |
| | 160 |
| 198 |
| | 160 |
| | 207 |
| | 160 |
|
| Total | 3,084 |
| | 1,905 |
| 3,135 |
| | 2,038 |
| | 3,109 |
| | 1,972 |
|
| Sour crude oil throughput percent | 52 |
| | 52 |
| 47 |
| | 55 |
| | 49 |
| | 53 |
|
| Sweet crude oil throughput percent | 48 |
| | 48 |
| 53 |
| | 45 |
| | 51 |
| | 47 |
|
Refined product yields (mbpd):(c) | | | | | | | | | | |
| Gasoline | 1,533 |
| | 917 |
| 1,528 |
| | 970 |
| | 1,531 |
| | 943 |
|
| Distillates | 1,091 |
| | 609 |
| 1,080 |
| | 691 |
| | 1,086 |
| | 651 |
|
| Propane | 53 |
| | 31 |
| 57 |
| | 40 |
| | 55 |
| | 35 |
|
| Feedstocks and petrochemicals | 330 |
| | 287 |
| 370 |
| | 278 |
| | 350 |
| | 283 |
|
| Heavy fuel oil | 45 |
| | 34 |
| 51 |
| | 27 |
| | 48 |
| | 31 |
|
| Asphalt | 80 |
| | 58 |
| 83 |
| | 72 |
| | 81 |
| | 65 |
|
| Total | 3,132 |
| | 1,936 |
| 3,169 |
| | 2,078 |
| | 3,151 |
| | 2,008 |
|
| |
(a) | Represents fully loaded export cargoes for each time period. These sales volumes are included in the total sales volume amounts. |
| |
(b) | Based on calendar-day capacity, which is an annual average that includes down time for planned maintenance and other normal operating activities. |
| |
(c) | Excludes inter-refinery volumes which totaled 76102 mbpd and 4264 mbpd for the three months ended March 31,June 30, 2019 and 2018, respectively, and 88 mbpd and 53 mbpd for the six months ended June 30, 2019 and 2018, respectively. |
Retail
The following includes key financial and operating data for the firstsecond quarter of 2019 compared to the firstsecond quarter of 2018.2018 and the six months ended June 30, 2019 compared to the six months ended June 30, 2018. Our results include the results of Andeavor from the October 1, 2018 acquisition date forward.
| |
(a) | The price paid by consumers or direct dealers less the cost of refined products, including transportation, consumer excise taxes and bankcard processing fees (where applicable), divided by gasoline and distillate sales volume. Excludes LCM inventory valuation adjustments. |
| |
(b) | See “Non-GAAP Measures” section for reconciliation and further information regarding this non-GAAP measure. |
| | | | | Three Months Ended
March 31, | | Three Months Ended
June 30, | Six Months Ended
June 30, |
| Key Financial and Operating Data | | 2019 | | 2018 | | 2019 | | 2018 | 2019 | | 2018 |
Average fuel sales prices (dollars per gallon) | Average fuel sales prices (dollars per gallon) | $ | 2.58 |
| | $ | 2.52 |
| Average fuel sales prices (dollars per gallon) | $ | 2.67 |
| | $ | 2.79 |
| $ | 2.62 |
| | $ | 2.66 |
|
Merchandise sales (in millions) | | $ | 1,413 |
| | $ | 1,129 |
| | $ | 1,620 |
| | $ | 1,285 |
| $ | 3,033 |
| | $ | 2,414 |
|
Merchandise margin (in millions)(a)(b) | Merchandise margin (in millions)(a)(b) | $ | 407 |
| | $ | 319 |
| Merchandise margin (in millions)(a)(b) | $ | 471 |
| | $ | 366 |
| $ | 878 |
| | $ | 685 |
|
Same store gasoline sales volume (period over period)(c) | Same store gasoline sales volume (period over period)(c) | (3.2 | %) | | (1.5 | %) | Same store gasoline sales volume (period over period)(c) | (2.4 | %) | | (2.6 | %) | (2.8 | )% | | (2.1 | )% |
Same store merchandise sales (period over period)(c)(d) | Same store merchandise sales (period over period)(c)(d) | 5.4 | % | | 2.3 | % | Same store merchandise sales (period over period)(c)(d) | 6.3 | % | | 2.9 | % | 5.9 | % | | 2.6 | % |
| Convenience stores at period-end | | 3,918 |
| | 2,742 |
| | 3,913 |
| | 2,744 |
| | | |
| Direct dealer locations at period-end | Direct dealer locations at period-end | 1,062 |
| | — |
| Direct dealer locations at period-end | 1,062 |
| | — |
| | | |
| |
(a) | The price paid by the consumers less the cost of merchandise. |
| |
(b) | See “Non-GAAP Measures” section for reconciliation and further information regarding this non-GAAP measure. |
| |
(c) | Same store comparison includes only locations owned at least 13 months. |
FirstSecond Quarter 2019 Compared to FirstSecond Quarter 2018
Retail segment revenues increased $2.81$3.68 billion primarily due to increased fuel and merchandise sales resulting from the Andeavor acquisition on October 1, 2018. The Andeavor acquisition added approximately 1,100 company-owned and operated locations along with long-term supply contracts for approximately 1,060 direct dealersdealer locations. FuelIncreased fuel sales volumes increased 1.11of 1.15 billion gallons, almost all of which was related to the acquisition, andwere partially offset by decreased average fuel sales prices increased $0.06of $0.12 per gallon. Merchandise sales increased $284$335 million resulting from the contributions of the acquired businesses.
Retail segment income from operations increased $75$334 million largely related to the addition of the legacy Andeavor retail operations as well as a $59 million year-over-year increase in MPC's legacy Speedway segment earnings driven by higher fuel margins and merchandise sales. These increases were partially offset by increases in operating expenses and depreciation primarily resulting from the locations acquired from Andeavor. The Retail fuel margin increased to 26.66 cents per gallon in the second quarter of 2019 compared with 16.45 cents per gallon in the second quarter of 2018 and the merchandise margin increased $105 million.
Six Months Ended June 30, 2019 Compared to Six Months Ended June 30, 2018
Retail segment revenues increased $6.49 billion primarily due increased fuel and merchandise sales resulting from the Andeavor acquisition on October 1, 2018. Fuel sales volumes increased 2.26 billion gallons, almost all of which was related to
the acquisition, and average fuel sales prices decreased $0.04 per gallon. Merchandise sales increased $619 million resulting from the contributions of the acquired businesses.
Retail segment income from operations increased $409 million primarily due to higher light product and merchandise margins largely related to the addition of the legacy Andeavor retail operations as well as a $24an $83 million year-over-year increase in MPC's legacy Speedway segment earnings. These increases were partially offset by an increaseincreases in operating expenses and depreciation primarily resulting from the locations acquired from Andeavor. The Retail fuel margin increased to 17.1522.00 cents per gallon in the first quartersix months of 2019 compared with 15.6116.04 cents per gallon in the first quartersix months of 2018 and the merchandise margin increased $88$193 million.
Midstream
The following includes key financial and operating data for the firstsecond quarter of 2019 compared to the firstsecond quarter of 2018.2018 and the six months ended June 30, 2019 compared to the six months ended June 30, 2018. Our results include the results of Andeavor from the October 1, 2018 acquisition date forward.
| |
(a) | On owned common-carrier pipelines, excluding equity method investments. |
| |
(b) | Includes amounts related to unconsolidated equity method investments on a 100 percent basis. |
| | | | | Three Months Ended
March 31, | | Three Months Ended
June 30, | | Six Months Ended
June 30, |
| Benchmark Prices | | 2019 | | 2018 | | 2019 | | 2018 | | 2019 | | 2018 |
Natural Gas NYMEX HH ($ per MMBtu) | Natural Gas NYMEX HH ($ per MMBtu) | $ | 2.87 |
| | $ | 2.85 |
| Natural Gas NYMEX HH ($ per MMBtu) | $ | 2.51 |
| | $ | 2.83 |
| | $ | 2.69 |
| | $ | 2.84 |
|
C2 + NGL Pricing ($ per gallon)(a) | C2 + NGL Pricing ($ per gallon)(a) | $ | 0.62 |
| | $ | 0.73 |
| C2 + NGL Pricing ($ per gallon)(a) | $ | 0.52 |
| | $ | 0.78 |
| | $ | 0.57 |
| | $ | 0.76 |
|
| |
(a) | C2 + NGL pricing based on Mont Belvieu prices assuming an NGL barrel of approximately 35 percent ethane, 35 percent propane, 6 percent Iso-Butane, 12 percent normal butane and 12 percent natural gasoline. |
FirstSecond Quarter 2019 Compared to FirstSecond Quarter 2018
Midstream segment revenue increased $637 million primarily due to the inclusion of ANDX revenues subsequent to the Andeavor acquisition on October 1, 2018.
Midstream segment income from operations increased $261 million largely due to contributions of $223 million from ANDX and a $38 million increase in Midstream segment results driven primarily by growth across MPLX’s businesses.
Six Months Ended June 30, 2019 Compared to Six Months Ended June 30, 2018
On February 1, 2018, we completed the dropdown of refining logistics assets and fuels distribution services to MPLX, which is reported in our Midstream segment. These new businesses were reported in the Midstream segment prospectively from February 1, 2018.
Midstream segment revenue increased $845 million$1.48 billion primarily due to the inclusion of ANDX revenues subsequent to the Andeavor acquisition on October 1, 2018. In addition, the first quartersix months of 2019 reflects a full quarteran extra month of fees charged for fuels distribution and refining logistics services provided to Refining & Marketing as compared to only two months of fees in the first quarter of 2018 following the February 1, 2018 dropdown to MPLX.
Midstream segment income from operations increased $341$602 million largely due to contributions of $220$443 million from ANDX and a $121$159 million increase in Midstream segment results driven primarily by growth across MPLX’s businesses.
Items not Allocated to Segments
| | Key Financial Information (in millions) | | Three Months Ended
March 31, | | Three Months Ended
June 30, | | Six Months Ended
June 30, |
| | | 2019 | | 2018 | | 2019 | | 2018 | | 2019 | | 2018 |
| Items not allocated to segments: | Items not allocated to segments: | | | | Items not allocated to segments: | | | | | | | |
Corporate and other unallocated items(a) | Corporate and other unallocated items(a) | $ | (191 | ) | | $ | (89 | ) | Corporate and other unallocated items(a) | $ | (179 | ) | | $ | (81 | ) | | (370 | ) | | (170 | ) |
| Capline restructuring gain | Capline restructuring gain | 207 |
| | — |
| Capline restructuring gain | — |
| | — |
| | 207 |
| | — |
|
| Transaction-related costs | Transaction-related costs | (91 | ) | | — |
| Transaction-related costs | (34 | ) | | (10 | ) | | (125 | ) | | (10 | ) |
| Litigation | | Litigation | (22 | ) | | — |
| | (22 | ) | | — |
|
| Impairments | | Impairments | — |
| | 1 |
| | — |
| | 1 |
|
| |
(a) | Corporate and other unallocated items consistsconsist primarily of MPC’s corporate administrative expenses and costs related to certain non-operating assets, except for corporate overhead expenses attributable to MPLX and ANDX, which are included in the Midstream segment. Corporate overhead expenses are not allocated to the Refining & Marketing and Retail segments. |
FirstSecond Quarter 2019 Compared to FirstSecond Quarter 2018
Corporate and other unallocated items increased $102$98 million largely due the inclusion of costs and expenses related to Andeavor operations.
Other unallocated items include transaction-related costs of $34 million associated with the Andeavor acquisition including employee retention, severance and other costs and a litigation reserve adjustment of $22 million.
Six Months Ended June 30, 2019 Compared to Six Months Ended June 30, 2018
Corporate and other unallocated items increased $200 million largely due to increasedthe inclusion of costs and expenses for the combined company after therelated to Andeavor acquisition.
operations.
Other unallocated items include a $207 million gain resulting from the agreements executed with Capline LLC to contribute our 33 percent undivided interest in the Capline pipeline system in exchange for a 33 percent ownership interest in Capline LLC. Other unallocated items also include transaction-related costs of $91$125 million associated with the Andeavor acquisition.acquisition and a litigation reserve adjustment of $22 million. The transaction-related costs recognized in the first quarter largely relate tosix months include the recognition of an obligation for vacation benefits provided to former Andeavor employees.employees in the first quarter as well as employee retention, severance and other costs.
Non-GAAP Financial Measures
Management uses certain financial measures to evaluate our operating performance that are calculated and presented on the basis of methodologies other than in accordance with GAAP. We believe these non-GAAP financial measures are useful to investors and analysts to assess our ongoing financial performance because, when reconciled to itstheir most comparable GAAP financial measure,measures, they provide improved comparability between periods through the exclusion of certain items that we believe are not indicative of our core operating performance and that may obscure our underlying business results and trends. These measures should not be considered a substitute for, or superior to, measures of financial performance prepared in accordance with GAAP, and our calculations thereof may not be comparable to similarly titled measures reported by other companies. The non-GAAP financial measures we use are as follows:
Refining & Marketing Margin
Refining margin is defined as sales revenue less the cost of refinery inputs and purchased products and excludes any LCM inventory market adjustment.
|
| | | | | | | | | |
| | | | Three Months Ended
March 31, |
Reconciliation of Refining & Marketing loss from operations to Refining & Marketing margin (in millions) | | 2019 | | 2018 |
| Refining & Marketing loss from operations | | $ | (334 | ) | | $ | (133 | ) |
| Plus: | | | | |
Refinery direct operating costs(a) | | 1,739 |
| | 1,081 |
|
| Refinery depreciation and amortization | | 387 |
| | 236 |
|
| Other: | | | | |
Operating expenses(a)(b) | | 1,268 |
| | 614 |
|
| Depreciation and amortization | | 40 |
| | 16 |
|
| Refining & Marketing margin | | $ | 3,100 |
| | $ | 1,814 |
|
|
| | | | | | | | | | | | | | | | | |
| | | | Three Months Ended
June 30, | | Six Months Ended
June 30, |
Reconciliation of Refining & Marketing income from operations to Refining & Marketing margin (in millions) | | 2019 | | 2018 | | 2019 | | 2018 |
| Refining & Marketing income from operations | | $ | 906 |
| | $ | 1,025 |
| | $ | 572 |
| | $ | 892 |
|
| Plus (Less): | | | | | | | | |
Refining operating costs(a) | | 1,527 |
| | 776 |
| | 3,079 |
| | 1,685 |
|
| Refining depreciation and amortization | | 368 |
| | 235 |
| | 755 |
| | 471 |
|
| Refining planned turnaround costs | | 237 |
| | 62 |
| | 423 |
| | 235 |
|
Distribution costs(b) | | 1,277 |
| | 774 |
| | 2,567 |
| | 1,403 |
|
| Distribution depreciation and amortization | | 43 |
| | 17 |
| | 83 |
| | 33 |
|
| Income from equity method investments | | (3 | ) | | (4 | ) | | (4 | ) | | (7 | ) |
| Net gain on disposal of assets | | — |
| | (3 | ) | | (6 | ) | | (4 | ) |
| Other income | | (8 | ) | | (27 | ) | | (22 | ) | | (39 | ) |
| Refining & Marketing margin | | $ | 4,347 |
| | $ | 2,855 |
| | $ | 7,447 |
| | $ | 4,669 |
|
| |
(a) | Includes refining major maintenance and operating costs. Excludes turnaround and depreciation and amortization.amortization expense. |
| |
(b) | These costs are primarily related to refined product distribution costs, includingIncludes fees paid to our two sponsored master limited partnerships, MPLX and ANDX.ANDX of $798 million and $596 million for the second quarter 2019 and 2018, respectively, and $1.58 billion and $1.07 billion for the six months ended June 30, 2019 and 2018, respectively. Excludes depreciation and amortization expense. |
Retail Fuel Margin
Retail fuel margin is defined as the price paid by consumers or direct dealers less the cost of refined products, including transportation, consumer excise taxes and bankcard processing fees (where applicable) and excluding any LCM inventory market adjustment.
Retail Merchandise Margin
Retail merchandise margin is defined as the price paid by consumers less the cost of merchandise.
|
| | | | | | | | | | | | | | | | | |
| | | | Three Months Ended
June 30, | | Six Months Ended
June 30, |
Reconciliation of Retail income from operations to Retail total margin (in millions) | | 2019 | | 2018 | | 2019 | | 2018 |
| Retail income from operations | | $ | 493 |
| | $ | 159 |
| | $ | 663 |
| | $ | 254 |
|
| Plus (Less): | | | | | | | | |
| Operating, selling, general and administrative expenses | | 597 |
| | 401 |
| | 1,180 |
| | 785 |
|
| Depreciation and amortization | | 130 |
| | 73 |
| | 256 |
| | 152 |
|
| Income from equity method investments | | (21 | ) | | (19 | ) | | (38 | ) | | (33 | ) |
| Net gain on disposal of assets | | — |
| | — |
| | (2 | ) | | — |
|
| Other income | | (4 | ) | | (2 | ) | | (6 | ) | | (3 | ) |
| Retail total margin | | $ | 1,195 |
| | $ | 612 |
| | $ | 2,053 |
| | $ | 1,155 |
|
| | | | | | | | | |
| Retail total margin: | | | | | | | | |
| Fuel margin | | $ | 694 |
| | $ | 239 |
| | $ | 1,123 |
| | $ | 456 |
|
| Merchandise margin | | 471 |
| | 366 |
| | 878 |
| | 685 |
|
| Other margin | | 30 |
| | 7 |
| | 52 |
| | 14 |
|
| Retail total margin | | $ | 1,195 |
| | $ | 612 |
| | $ | 2,053 |
| | $ | 1,155 |
|
|
| | | | | | | | | |
| | | | Three Months Ended
March 31, |
Reconciliation of Retail income from operations to Retail total margin (in millions) | | 2019 | | 2018 |
| Retail income from operations | | $ | 170 |
| | $ | 95 |
|
| Plus (Less): | | | | |
| Operating, selling, general and administrative expenses | | 583 |
| | 384 |
|
| Depreciation and amortization | | 126 |
| | 79 |
|
| Income from equity method investments | | (17 | ) | | (14 | ) |
| Net gain on disposal of assets | | (2 | ) | | — |
|
| Other income | | (2 | ) | | (1 | ) |
| Retail total margin | | $ | 858 |
| | $ | 543 |
|
| | | | | |
| Retail total margin: | | | | |
| Fuel margin | | $ | 429 |
| | $ | 217 |
|
| Merchandise margin | | 407 |
| | 319 |
|
| Other margin | | 22 |
| | 7 |
|
| Retail total margin | | $ | 858 |
| | $ | 543 |
|
LIQUIDITY AND CAPITAL RESOURCES
Cash Flows
Our consolidated cash and cash equivalents balance was approximately $877 million$1.25 billion at March 31,June 30, 2019 compared to $1.69 billion at December 31, 2018. Net cash provided by (used in) operating activities, investing activities and financing activities are presented in the following table. Our cash flows reflect the results of the business acquired in connection with the Andeavor acquisition from October 1, 2018 forward. | | | | | Three Months Ended
March 31, | | Six Months Ended
June 30, |
| (In millions) | | 2019 | | 2018 | | 2019 | | 2018 |
| Net cash provided by (used in): | Net cash provided by (used in): | | | | Net cash provided by (used in): | | | |
| Operating activities | Operating activities | $ | 1,623 |
| | $ | (137 | ) | Operating activities | $ | 4,245 |
| | $ | 2,249 |
|
| Investing activities | Investing activities | (1,520 | ) | | (778 | ) | Investing activities | (2,880 | ) | | (1,518 | ) |
| Financing activities | Financing activities | (920 | ) | | 2,557 |
| Financing activities | (1,841 | ) | | 1,258 |
|
| Total increase (decrease) in cash | Total increase (decrease) in cash | $ | (817 | ) | | $ | 1,642 |
| Total increase (decrease) in cash | $ | (476 | ) | | $ | 1,989 |
|
Net cash provided by operating activities increased $1.76$2.00 billion in the first threesix months of 2019 compared to the first threesix months of 2018, primarily due to an increase in operating results and favorable changes in working capital of $1.40 billion and an increase in operating results.$658 million. Changes in working capital exclude changes in short-term debt.
Changes in working capital, excluding changes in short-term debt, were a net $470$269 million source of cash in the first three-six- months of 2019 compared to a net $933$389 million use of cash in the first threesix months of 2018.
For the first threesix months of 2019, changes in working capital, excluding changes in short-term debt, were a net $470$269 million source of cash primarily due to the effects of increasing energy commodity prices at the end of the period on working capital. Accounts payable increased primarily due to an increase in crude prices. Current receivables increased primarily due to higher refined product and crude prices and higher crude sales volumes. Accounts payable increased primarily due to increases in crude prices and crude volumes. Inventories decreased due to decreases in refined product and merchandisecrude inventories, partially offset by increasesan increase in crude and materials and supplies inventories.inventory.
For the first threesix months of 2018, changes in working capital, excluding changes in short-term debt, were a net $933$389 million use of cash primarily due to the effect of decreases in volumes, partially offset by increases in energy commodity prices at the end of the period on working capital. Current receivables increased primarily due to higher refined product and crude prices, partially offset by lower volumes. Accounts payable decreased primarily due to lower crude oil volumes purchased slightly offset by higher crude oil prices.a decrease in refined product and feedstock purchases. Inventories decreased due to decreases in crude, refined products and materials and supplies inventories. Current receivables decreased primarily due to lowerand refined product volumes slightly offset by higher prices.
products inventories.
Net cash used in investing activities increased $742 million$1.36 billion in the first threesix months of 2019 compared to the first threesix months of 2018, primarily due to the following:
An increase in additions to property, plant and equipment of $486$953 million primarily due to increased capital expenditures in the first threesix months of 2019 in our Midstream and Refining & Marketing segments; and
an increase in net investments of $282$434 million largely due to investments in connection with the construction of the Gray Oak Pipeline, which is scheduled to commence operations in the fourth quarter of 2019.
The consolidated statements of cash flows exclude changes to the consolidated balance sheets that did not affect cash. A reconciliation of additions to property, plant and equipment per the consolidated statements of cash flows to reported total capital expenditures and investments follows.
| | | | | Three Months Ended
March 31, | | Six Months Ended
June 30, |
| (In millions) | | 2019 | | 2018 | | 2019 | | 2018 |
| Additions to property, plant and equipment per the consolidated statements of cash flows | Additions to property, plant and equipment per the consolidated statements of cash flows | $ | 1,241 |
| | $ | 755 |
| Additions to property, plant and equipment per the consolidated statements of cash flows | $ | 2,419 |
| | $ | 1,466 |
|
| Asset retirement expenditures | Asset retirement expenditures | — |
| | 1 |
| Asset retirement expenditures | — |
| | 5 |
|
| Decrease in capital accruals | (235 | ) | | (49 | ) | |
| Increase (decrease) in capital accruals | | Increase (decrease) in capital accruals | (281 | ) | | 77 |
|
| Total capital expenditures | Total capital expenditures | 1,006 |
| | 707 |
| Total capital expenditures | 2,138 |
| | 1,548 |
|
| Investments in equity method investees (excludes acquisitions) | Investments in equity method investees (excludes acquisitions) | 325 |
| | 41 |
| Investments in equity method investees (excludes acquisitions) | 595 |
| | 118 |
|
| Total capital expenditures and investments | Total capital expenditures and investments | $ | 1,331 |
| | $ | 748 |
| Total capital expenditures and investments | $ | 2,733 |
| | $ | 1,666 |
|
Financing activities were a net $920 million$1.84 billion use of cash in the first threesix months of 2019 compared to a net $2.56$1.26 billion source of cash in the first threesix months of 2018.
Long-term debt borrowings and repayments, including debt issuance costs, were a net $573$848 million source of cash in the first threesix months of 2019 compared to a net $4.29 billion source of cash in the first threesix months of 2018. During the first threesix months of 2019, MPLX had net borrowings of $425$615 million under its revolving credit facility and ANDX had net borrowings of $159$255 million under its revolving credit facility.facilities. During the first threesix months of 2018, MPLX issued $5.5 billion of senior notes, we redeemed $600 million of our senior notes and MPLX repaid $505 million in outstanding borrowings under its revolving credit facility.
Cash used in common stock repurchases decreased $442$827 million in the first threesix months of 2019 compared to the first threesix months of 2018. Share repurchases totaled $885 million$1.39 billion in the first threesix months of 2019 compared to $1.33$2.21 billion in the first threesix months of 2018. In 2018, share repurchases were funded primarily by after tax proceeds from the February 1, 2018 dropdown. See Note 8 to the unaudited consolidated financial statements for further discussion of share repurchases.
Cash used in dividend payments increased $135$276 million in the first threesix months of 2019 compared to the first threesix months of 2018, primarily due to a net increase in the number of shares of our common stock outstanding related to the Andeavor acquisition and a $0.07$0.14 per share increase in our base dividend, partially offset by a reduction of shares resulting from share repurchases. Our dividend payments were $0.53$1.06 per common share in the first threesix months of 2019 compared to $0.46$0.92 per common share in the first threesix months of 2018.
Cash used in distributions to noncontrolling interests increased $130$246 million in the first threesix months of 2019 compared to the first threesix months of 2018, primarily due to the addition of ANDX distributions subsequent to the acquisition of Andeavor and an increase in MPLX’s distribution per common unit.
Contributions from noncontrolling interests increased $94 million in the first three months of 2019 compared to the first three months of 2018 primarily due to cash received in 2019 for an increased noncontrolling interest in an MPLX subsidiary.
| |
| • | Contributions from noncontrolling interests increased $90 million in the first six months of 2019 compared to the first six months of 2018 primarily due to cash received in 2019 for an increased noncontrolling interest in an MPLX subsidiary. |
Derivative Instruments
See Item 3. Quantitative and Qualitative Disclosures about Market Risk for a discussion of derivative instruments and associated market risk.
Capital Resources
Our liquidity totaled $7.47$7.93 billion at March 31,June 30, 2019 consisting of:
| | | | | March 31, 2019 | | June 30, 2019 |
| (In millions) | | Total Capacity | | Outstanding Borrowings | | Available Capacity | | Total Capacity | | Outstanding Borrowings | | Available Capacity |
Bank revolving credit facility(a) | Bank revolving credit facility(a) | $ | 5,000 |
| | $ | 32 |
| | $ | 4,968 |
| Bank revolving credit facility(a) | $ | 5,000 |
| | $ | 32 |
| | $ | 4,968 |
|
| 364-day bank revolving credit facility | 364-day bank revolving credit facility | 1,000 |
| | — |
| | $ | 1,000 |
| 364-day bank revolving credit facility | 1,000 |
| | — |
| | $ | 1,000 |
|
| Trade receivables facility | Trade receivables facility | 750 |
| | — |
| | 750 |
| Trade receivables facility | 750 |
| | — |
| | 750 |
|
| Total | Total | $ | 6,750 |
| | $ | 32 |
| | $ | 6,718 |
| Total | $ | 6,750 |
| | $ | 32 |
| | $ | 6,718 |
|
Cash and cash equivalents(b) | Cash and cash equivalents(b) | | | | | 755 |
| Cash and cash equivalents(b) | | | | | 1,215 |
|
| Total liquidity | Total liquidity | | | | | $ | 7,473 |
| Total liquidity | | | | | $ | 7,933 |
|
| |
(a) | Outstanding borrowings include $32 million in letters of credit outstanding under this facility. Excludes MPLX’s $2.25 billion bank revolving credit facility, which had approximately $1.82$1.63 billion available as of March 31,June 30, 2019, and ANDX’s $2.10 billion bank revolving credit facilities, which had approximately $696$600 million available as of March 31,June 30, 2019. |
| |
(b) | Excludes MPLX and ANDX cash and cash equivalents of $93$7 million and $29$25 million, respectively. |
Because of the alternatives available to us, including internally generated cash flow and access to capital markets and a commercial paper program, we believe that our short-term and long-term liquidity is adequate to fund not only our current operations, but also our near-term and long-term funding requirements, including capital spending programs, the repurchase of shares of our common stock, dividend payments, defined benefit plan contributions, repayment of debt maturities and other amounts that may ultimately be paid in connection with contingencies.
Upon the completion of the merger of MPLX and ANDX on July 30, 2019, the MPLX bank revolving credit facility was amended and restated to increase the borrowing capacity to $3.5 billion and to extend the maturity date to July 30, 2024. The ANDX revolving and dropdown credit facilities were terminated and all outstanding balances were repaid and funded with the new $3.5 billion bank revolving credit facility.
On July 26, 2019, we entered into a new $1 billion 364-day revolving credit facility with a syndicate of banks that will, subject to the satisfaction of customary conditions, become effective upon the expiration of our existing $1 billion 364-day revolving facility in September 2019. The new 364-day revolving credit facility contains substantially the same terms and conditions as our existing 364-day revolving credit facility and will expire in September 2020.
On July 19, 2019, we amended our $750 million trade receivables securitization facility to extend the maturity date to July 16, 2021.
On July 31, 2019, in connection with the closing of the ANDX merger, we amended and restated the existing intercompany loan agreement with MPLX to, among other things, increase MPLX’s borrowing capacity thereunder from $1.0 billion to $1.5 billion in loans at any one time outstanding and to extend the term of the intercompany loan agreement to July 31, 2024.
We have a commercial paper program that allows us to have a maximum of $2.0 billion in commercial paper outstanding. We do not intend to have outstanding commercial paper borrowings in excess of available capacity under our bank revolving credit facility. As of March 31,June 30, 2019, we had no commercial paper borrowings outstanding.
See Note 17 to the unaudited consolidated financial statements for further discussion of our debt.
The MPC credit agreements contain representations and warranties, affirmative and negative covenants and events of default that we consider usual and customary for agreements of these types. The financial covenant included in the MPC credit agreements requires us to maintain, as of the last day of each fiscal quarter, a ratio of Consolidated Net Debt to Total Capitalization (as defined in the MPC credit agreements) of no greater than 0.65 to 1.00. As of March 31,June 30, 2019, we were in compliance with this financial covenant, with a ratio of Consolidated Net Debt to Total Capitalization of 0.220.21 to 1.00, as well as the other covenants contained in the MPC bank revolving credit facility.
The MPLX credit agreement contains representations and warranties, affirmative and negative covenants and events of default that we consider usual and customary for agreements of these types. The MPLX credit agreement includes a financial covenant that requires MPLX to maintain a ratio of Consolidated Total Debt (as defined in the MPLX credit agreement) as of the end of each fiscal quarter to Consolidated EBITDA (as defined in the MPLX credit agreement) for the prior four fiscal quarters of not greater than 5.0 to 1.0 (or 5.5 to 1.0 during the six-month period following certain acquisitions). Consolidated EBITDA is subject to adjustments for certain acquisitions completed and capital projects undertaken during the relevant period. Other covenants restrict MPLX and/or certain of its subsidiaries from incurring debt, creating liens on assets and entering into transactions with affiliates. As of March 31,June 30, 2019, MPLX was in compliance with this debt covenant, with a ratio of Consolidated Total Debt to Consolidated EBITDA of 3.853.70 to 1.0, as well as the other covenants contained in the MPLX credit agreement.
The ANDX credit agreements contain certain representations and warranties, affirmative and restrictive covenants and events of default that we consider to be usual and customary for an agreement of this type, including a financial covenant that requires ANDX to maintain a Consolidated Leverage Ratio (as defined in the ANDX credit agreements) for the prior four fiscal quarters of no greater than 5.0 to 1.0 (or 5.5 to 1.0 for up to two fiscal quarters following certain acquisitions). Consolidated EBITDA used to calculate the Consolidated Leverage Ratio is subject to adjustments for certain acquisitions completed and capital projects undertaken during the relevant period. The covenants also restrict, among other things, ANDX’s ability and/or the ability of certain of its subsidiaries to incur debt, create liens on assets and enter into transactions with affiliates. As of March 31, 2019, ANDX was in compliance with this debt covenant, with a Consolidated Leverage Ratio of 3.86 to 1.0, as well as the other covenants contained in the ANDX credit agreements.
.
Our intention is to maintain an investment-grade credit profile. As of March 31,July 30, 2019, the credit ratings on our senior unsecured debt were as follows.
|
| | |
| Company | Rating Agency | Rating |
| MPC | Moody’s | Baa2 (stable outlook) |
| | Standard & Poor’s | BBB (stable outlook) |
| | Fitch | BBB (stable outlook) |
| MPLX | Moody’s | Baa3Baa2 (stable outlook) |
| | Standard & Poor’s | BBB (stable outlook) |
| | Fitch | BBB- (positive outlook) |
ANDX | Moody’s | Ba1 (review for upgrade) |
| Standard & Poor’s | BBB- (positive watch) |
| Fitch | BBB-BBB (stable outlook) |
The ratings reflect the respective views of the rating agencies. Although it is our intention to maintain a credit profile that supports an investment-grade rating, there is no assurance that these ratings will continue for any given period of time. The ratings may be revised or withdrawn entirely by the rating agencies if, in their respective judgments, circumstances so warrant.
None of the MPC credit agreements, the MPLX credit agreement, the ANDX credit agreements or our trade receivables facility contains credit rating triggers that would result in the acceleration of interest, principal or other payments in the event that our credit ratings are downgraded. However, any downgrades of our senior unsecured debt could increase the applicable interest rates, yields and other fees payable under such agreements. In addition, a downgrade of our senior unsecured debt rating to below investment-grade levels could, under certain circumstances, decrease the amount of trade receivables that are eligible to be sold under our trade receivables facility, impact our ability to purchase crude oil on an unsecured basis, and could result in us having to post letters of credit under existing transportation services or other agreements.agreements and make it more difficult to raise capital in the future.
Capital Requirements
Capital SpendingInvestment Plan
MPC's capital investment plan for 2019 totals approximately $2.8 billion for capital projects and investments, excluding MPLX, ANDX, capitalized interest and acquisitions. MPC’s capital investment plan includes approximately $1.8 billion of growth capital and $1.0 billion of maintenance capital. This plan includes all of the planned capital spending for Refining & Marketing, Retail and Corporate as well as a portion of the planned capital investments in Midstream. MPLX’s capital investment plan for 2019, excluding capitalized interest and acquisitions, includes $2.2 billion of organic growth capital and approximately $200 million of maintenance capital. ANDX’s capital investment plan for 2019, excluding capitalized interest and acquisitions, includes $600 million of organic growth capital and approximately $100 million of maintenance capital. We continuously evaluate our capital investment plan and make changes as conditions warrant.
Capital expenditures and investments are summarized by segment below. These amounts include capital spending and investments related to businesses acquired in connection with the Andeavor acquisition from October 1, 2018 forward.
| | | | | Three Months Ended
March 31, | | Six Months Ended
June 30, |
| (In millions) | | 2019 | | 2018 | | 2019 | | 2018 |
| Refining & Marketing | Refining & Marketing | $ | 394 |
| | $ | 191 |
| Refining & Marketing | $ | 824 |
| | $ | 387 |
|
| Retail | Retail | 73 |
| | 39 |
| Retail | 193 |
| | 127 |
|
| Midstream | Midstream | 823 |
| | 482 |
| Midstream | 1,637 |
| | 1,083 |
|
Corporate and Other(a) | Corporate and Other(a) | 41 |
| | 36 |
| Corporate and Other(a) | 79 |
| | 69 |
|
| Total capital expenditures and investments | Total capital expenditures and investments | $ | 1,331 |
| | $ | 748 |
| Total capital expenditures and investments | $ | 2,733 |
| | $ | 1,666 |
|
| |
(a) | Includes capitalized interest of $31$65 million and $18$34 million for the threesix months ended March 31,June 30, 2019 and 2018, respectively. |
Capital expenditures and investments in affiliates during the threesix months ended March 31,June 30, 2019 were primarily for Midstream and Refining & Marketing segment projects.projects and investments in affiliates. The Midstream segment capital investment plan includes projects for MPLX and ANDX. MPLX’s capital investment plan includes the addition of approximately 825 MMcf/d of processing capacity at five gas processing plants, two in the Marcellus and three in the Southwest, which expands MPLX’s processing capacity in the Permian Basin and the STACK shale play of Oklahoma. The MPLX capital investment plan also includes the addition of approximately 100 mbpd of fractionation capacity in the Marcellus and Utica basins and the continued expansion of MPLX’s marine fleet, long-haul crude
oil, natural gas and NGL pipelines as well as projects to increase its export capability. The ANDX capital investment plan includes the construction of additional crude storage capacity for unloading of marine vessels, the construction of crude gathering systems to provide connectivity to multiple long-haul pipelines and a pipeline interconnect project to provide direct connectivity between certain MPC refineries. The remaining Midstreamsegment’s capital expenditure projectsexpenditures and investments relate to investments in equity affiliate pipelines, including our expected investments in the Gray Oak Pipeline, a new pipeline spanning from the West Texas Permian Basin to the Gulf Coast which is expected to be in service by the end of 2019.
The Refining & Marketing segment capital investment plan includes projects focused on high-return investments in refinery optimization, production of higher value products, increased capacity to upgrade residual fuel oil and expanded export capacity. We also plan to continue investing in domestic light products supply placement flexibility.
Other Capital Requirements
During the threesix months ended March 31,June 30, 2019, we made no contributionscontributed $16 million to our funded pension plans however, weand have additional required funding for the 2019 plan year of approximately $64 million and we$48 million. We may choose to make additional contributions to our pension plans.
On April 24,July 31, 2019, our board of directors approved a dividend of $0.53 per share on common stock. The dividend is payable JuneSeptember 10, 2019, to shareholders of record as of the close of business on May 16,August 21, 2019.
We may, from time to time, repurchase our senior notes in the open market, in privately-negotiated transactions or otherwise in such volumes, at such prices and upon such other terms as we deem appropriate.
Share Repurchases
Since January 1, 2012, our board of directors has approved $18.0 billion in total share repurchase authorizations and we have repurchased a total of $13.98$14.48 billion of our common stock, leaving $4.02$3.52 billion available for repurchases at March 31,June 30, 2019. The table below summarizes our total share repurchases for the threesix months ended March 31,June 30, 2019 and 2018. See Note 8 to the unaudited consolidated financial statements for further discussion of the share repurchase plans.
| | | | Three Months Ended
March 31, | Six Months Ended
June 30, |
| (In millions, except per share data) | 2019 | | 2018 | 2019 | | 2018 |
| Number of shares repurchased | 14 |
| | 19 |
| 23 |
| | 31 |
|
| Cash paid for shares repurchased | $ | 885 |
| | $ | 1,327 |
| $ | 1,385 |
| | $ | 2,212 |
|
| Average cost per share | $ | 62.98 |
| | $ | 68.74 |
| $ | 60.75 |
| | $ | 71.58 |
|
We may utilize various methods to effect the repurchases, which could include open market repurchases, negotiated block transactions, accelerated share repurchases or open market solicitations for shares, some of which may be effected through Rule 10b5-1 plans. The timing and amount of future repurchases, if any, will depend upon several factors, including market and business conditions, and such repurchases may be discontinued at any time.
Contractual Cash Obligations
As of March 31,June 30, 2019, our contractual cash obligations included long-term debt, capital and operating lease obligations, purchase obligations and other long-term liabilities. During the first threesix months of 2019, our long-term debt commitments decreased approximately $230$550 million due to interest payments made during the quarterperiod, partially offset by increased borrowings on the MPLX bank revolving credit facility and ANDX bank revolving credit facilities.facility.
There were no other material changes to our contractual cash obligations outside the ordinary course of business since December 31, 2018.
Off-Balance Sheet Arrangements
Off-balance sheet arrangements comprise those arrangements that may potentially impact our liquidity, capital resources and results of operations, even though such arrangements are not recorded as liabilities under U.S. GAAP. Our off-balance sheet arrangements are limited to indemnities and guarantees that are described below. Although these arrangements serve a variety of our business purposes, we are not dependent on them to maintain our liquidity and capital resources, and we are not aware of any circumstances that are reasonably likely to cause the off-balance sheet arrangements to have a material adverse effect on liquidity and capital resources.
We have provided various guarantees related to equity method investees. In conjunction with our spinoff from Marathon Oil, we entered into various indemnities and guarantees to Marathon Oil. These arrangements are described in Note 2423 to the unaudited consolidated financial statements.
ENVIRONMENTAL MATTERS AND COMPLIANCE COSTS
We have incurred and may continue to incur substantial capital, operating and maintenance, and remediation expenditures as a result of environmental laws and regulations. If these expenditures, as with all costs, are not ultimately reflected in the prices of our products and services, our operating results will be adversely affected. We believe that substantially all of our competitors must comply with similar environmental laws and regulations. However, the specific impact on each competitor may vary depending on a number of factors, including the age and location of its operating facilities, marketing areas, production processes and whether it is also engaged in the petrochemical business or the marine transportation of crude oil and refined products.
On March 3, 2014, the EPA signed the final Tier 3 fuel standards. The final Tier 3 fuel standards require, among other things, a lower annual average sulfur level in gasoline to no more than 10 ppm beginning in calendar year 2017. In addition, gasoline refiners and importers may not exceed a maximum per-gallon sulfur standard of 80 ppm while retailers may not exceed a maximum per-gallon sulfur standard of 95 ppm. From 2014 through 2018, we made approximately $490 million in capital expenditures to comply with these standards and expect to make approximately $260$245 million in capital expenditures for these standards in 2019.
There have been no significant changes to our environmental matters and compliance costs during the threesix months ended March 31,June 30, 2019.
CRITICAL ACCOUNTING ESTIMATES
As of March 31,June 30, 2019, there have been no significant changes to our critical accounting estimates since our Annual Report on Form 10-K for the year ended December 31, 2018.
ACCOUNTING STANDARDS NOT YET ADOPTED
As discussed in Note 2 to the unaudited consolidated financial statements, certain new financial accounting pronouncements will be effective for our financial statements in the future.
ITEM 3. QUANTITATIVE AND QUALITATIVE DISCLOSURES ABOUT MARKET RISK
For a detailed discussion of our risk management strategies and our derivative instruments, see Item 7A. Quantitative and Qualitative Disclosures about Market Risk in our Annual Report on Form 10-K for the year ended December 31, 2018.
See Notes 15 and 16 to the unaudited consolidated financial statements for more information about the fair value measurement of our derivatives, as well as the amounts recorded in our consolidated balance sheets and statements of income. We do not designate any of our commodity derivative instruments as hedges for accounting purposes.
The following table includes the composition of net losses on our commodity derivative positions as of March 31,June 30, 2019 and 2018, respectively.
| | | | | Three Months Ended
March 31, | | Six Months Ended
June 30, |
| (In millions) | | 2019 | | 2018 | | 2019 | | 2018 |
| Realized gain on settled derivative positions | $ | 39 |
| | $ | 5 |
| |
| Realized loss on settled derivative positions | | Realized loss on settled derivative positions | $ | (3 | ) | | $ | (46 | ) |
| Unrealized loss on open net derivative positions | Unrealized loss on open net derivative positions | (139 | ) | | (33 | ) | Unrealized loss on open net derivative positions | (79 | ) | | (39 | ) |
| Net loss | Net loss | $ | (100 | ) | | $ | (28 | ) | Net loss | $ | (82 | ) | | $ | (85 | ) |
See Note 16 to the unaudited consolidated financial statements for additional information on our open derivative positions at March 31,June 30, 2019.
Sensitivity analysis of the effects on income from operations (“IFO”) of hypothetical 10 percent and 25 percent increases and decreases in commodity prices for open commodity derivative instruments as of March 31,June 30, 2019 is provided in the following table.
| | | | | Change in IFO from a
Hypothetical Price
Increase of | | Change in IFO from a
Hypothetical Price
Decrease of | | Change in IFO from a
Hypothetical Price
Increase of | | Change in IFO from a
Hypothetical Price
Decrease of |
| (In millions) | | 10% | | 25% | | 10% | | 25% | | 10% | | 25% | | 10% | | 25% |
| As of March 31, 2019 | | | | | | | | |
| As of June 30, 2019 | | As of June 30, 2019 | | | | | | | |
| Crude | Crude | $ | (61 | ) | | $ | (152 | ) | | $ | 62 |
| | $ | 154 |
| Crude | $ | (112 | ) | | $ | (279 | ) | | $ | 115 |
| | $ | 289 |
|
| Refined products | Refined products | 5 |
| | 12 |
| | (5 | ) | | (12 | ) | Refined products | 44 |
| | 110 |
| | (44 | ) | | (110 | ) |
| Blending products | Blending products | (4 | ) | | (10 | ) | | 4 |
| | 10 |
| Blending products | (11 | ) | | (28 | ) | | 11 |
| | 28 |
|
| Embedded derivatives | Embedded derivatives | (7 | ) | | (16 | ) | | 7 |
| | 16 |
| Embedded derivatives | (7 | ) | | (16 | ) | | 7 |
| | 16 |
|
We remain at risk for possible changes in the market value of commodity derivative instruments; however, such risk should be mitigated by price changes in the underlying physical commodity. Effects of these offsets are not reflected in the above sensitivity analysis.
We evaluate our portfolio of commodity derivative instruments on an ongoing basis and add or revise strategies in anticipation of changes in market conditions and in risk profiles. Changes to the portfolio after March 31,June 30, 2019 would cause future IFO effects to differ from those presented above.
Sensitivity analysis of the effect of a hypothetical 100-basis-point change in interest rates on long-term debt, including the portion classified as current and excluding finance leases, as of March 31,June 30, 2019 is provided in the following table. Fair value of cash and cash equivalents, receivables, accounts payable and accrued interest approximate carrying value and are relatively insensitive to changes in interest rates due to the short-term maturity of the instruments. Accordingly, these instruments are excluded from the table.
| | | (In millions) | | Fair Value as of March 31, 2019(a) | | Change in
Fair Value(b) | | Change in Net Income for the Three Months Ended March 31, 2019(c) | | Fair Value as of June 30, 2019(a) | | Change in
Fair Value(b) | | Change in Net Income for the Six Months Ended June 30, 2019(c) |
| Long-term debt | Long-term debt | | | | | | Long-term debt | | | | | |
| Fixed-rate | Fixed-rate | $ | 26,759 |
| | $ | 2,246 |
| | n/a |
| Fixed-rate | $ | 27,620 |
| | $ | 2,352 |
| | n/a |
|
| Variable-rate | Variable-rate | 1,832 |
| | n/a |
| | 4 |
| Variable-rate | 2,117 |
| | n/a |
| | 9 |
|
| |
(a) | Fair value was based on market prices, where available, or current borrowing rates for financings with similar terms and maturities. |
| |
(b) | Assumes a 100-basis-point decrease in the weighted average yield-to-maturity at March 31,June 30, 2019. |
| |
(c) | Assumes a 100-basis-point change in interest rates. The change to net income was based on the weighted average balance of debt outstanding for the threesix months ended March 31,June 30, 2019. |
At March 31,June 30, 2019, our portfolio of long-term debt was comprised of fixed-rate instruments and variable-rate borrowings. The fair value of our fixed-rate debt is relatively sensitive to interest rate fluctuations. Our sensitivity to interest rate declines and corresponding increases in the fair value of our debt portfolio unfavorably affects our results of operations and cash flows only when we elect to repurchase or otherwise retire fixed-rate debt at prices above carrying value. Interest rate fluctuations generally do not impact the fair value of borrowings under our variable-rate debt, but may affect our results of operations and cash flows.
See Note 15 to the unaudited consolidated financial statements for additional information on the fair value of our debt.
ITEM 4. CONTROLS AND PROCEDURES
Disclosure Controls and Procedures
An evaluation of the effectiveness of the design and operation of our disclosure controls and procedures (as defined in Rules 13(a)-15(e)13a-15(e) under the Securities Exchange Act of 1934, as amended) was carried out under the supervision and with the participation of our management, including our chief executive officer and chief financial officer. Based upon that evaluation, the chief executive officer and chief financial officer concluded that the design and operation of these disclosure controls and procedures were effective as of March 31,June 30, 2019, the end of the period covered by this report.
Internal Control over Financial Reporting and Changes in Internal Control over Financial Reporting
During the quarter ended March 31,June 30, 2019, there were no changes in our internal control over financial reporting that have materially affected, or are reasonably likely to materially affect, our internal control over financial reporting.
PART II – OTHER INFORMATION
ITEM 1. LEGAL PROCEEDINGS
We are the subject of, or a party to, a number of pending or threatened legal actions, contingencies and commitments involving
a variety of matters, including laws and regulations relating to the environment. Except as described below, there have been no material changes to the legal proceedings previously disclosed in our Annual Report on Form 10-K, as updated in the Quarterly Report on Form 10-Q for the quarter ended March 31, 2019.
Litigation
As previously disclosed, in May 2007, the Kentucky attorney general filed a lawsuit against us and Marathon Oil in state court in Franklin County, Kentucky for alleged violations of Kentucky’s emergency pricing and consumer protection laws following Hurricanes Katrina and Rita in 2005. The lawsuit alleged that we overcharged customers by $89 million during September and October 2005. The complaint sought disgorgement of these sums, as well as penalties, under Kentucky’s emergency pricing and consumer protection laws. In May 2011, the Kentucky attorney general amended his complaint to include a request for immediate injunctive relief as well as unspecified damages and penalties related to our wholesale gasoline pricing in April and May 2011 under statewide price controls that were activated by the Kentucky governor on April 26, 2011 and which have since expired. The court denied the attorney general’s request for immediate injunctive relief. In July 2019, MPC and the attorney general reached a settlement to resolve this litigation. This resolution will not have a material adverse effect on our consolidated financial position, results of operations or cash flows.
Environmental Proceedings
Detroit Refinery
In June 2019, we received an offer from the first quarterMichigan Department of 2019, MPLX entered into an agreementEnvironment, Great Lakes, and Energy (“EGLE”) to settle noticesviolations alleged in five NOVs issued to the refinery between September 2017 and February 2019. The NOVs allege violations of violationemissions limitations and other requirements of the refinery’s air permit. We are negotiating a settlement of the allegations with EGLE and cannot currently estimate the timing of the resolution of this matter.
El Paso Refinery
We are presently negotiating with the EPA regarding several emission events at our El Paso refinery that could subject the refinery to stipulated penalties under the existing Consent Decree in U.S. v. Western Refining Co. LP, W.D. Texas No. 3:11-CV-00276-FM (entered August 31, 2011). We cannot currently estimate the timing of the resolution of this matter.
Gallup Refinery
As previously disclosed in MPC’s Annual Report on Form 10-K for the year ended December 31, 2018 (the “2018 10-K”), on October 19, 2018, Western Refining Southwest, Inc. (“Refining Southwest”) received an offer from the West Virginia DepartmentEPA to settle alleged violations of Environmental Protection relating to earth disturbance activities in connection with construction of an NGL line. The $124,030 penalty payment is expected to be made inthe Resource Conservation and Recovery Act (“RCRA”) regulations. In the second quarter of 2019, Refining Southwest and the EPA executed a Consent Agreement and Final Order (CAFO) (Effective Date April 3, 2019) to resolve these allegations, which arose from the Gallup refinery’s self-disclosure of incorrectly profiling and shipping hazardous waste between August 26, 2013 and February 18, 2014 to a disposal site that did not have a RCRA permit and could not accept RCRA hazardous waste. The CAFO requires payment of a penalty of $148,303, and the development of a standard operating procedure, training, a system of management review of waste determination, and a narrative of changes since the alleged violations occurred.
As previously disclosed in our 2018 10-K, in March 2016, the EPA conducted a Risk Management Program inspection at our Gallup refinery and issued an Inspection Report on April 7, 2016 identifying Areas of Concern. In the second quarter of 2019, Refining Southwest and the EPA executed a Consent Agreement and Final Order (CAFO) and Administrative Compliance Order (ACO) (Effective Date April 16, 2019) to resolve alleged violations of the Clean Air Act regulations at the Gallup refinery arising from a Risk Management Program (RMP) inspection that EPA conducted at Gallup refinery in March 2016. Pursuant to the CAFO & ACO Gallup paid a civil penalty of $98,874 and will complete a Supplemental Environmental Project (SEP) valued at approximately $91,351.
Galveston Bay Refinery
In the second quarter of 2019, we reached an agreement with the Texas Commission on Environmental Quality to pay a penalty of $62,782 and undertake a supplemental environmental project at a cost of $62,781 to settle allegations arising from an investigation of deviations self-reported in the 2016 Title V deviation reports.
Los Angeles Refinery
As previously disclosed in our 2018 10-K, Tesoro Refining and Marketing LLC (“TRMC”) previously reached an agreement in principle to pay a penalty of $425,000 and undertake a supplemental environmental project at a cost of $425,000 to settle allegations by the CARB relating to the state’s Greenhouse Gas Reporting Standards. The CARB allegations relate to the self-disclosure and correction of reported greenhouse gas emissions emitted by the Los Angeles refinery’s calciner unit from May 9, 2014 to June 12, 2017. A formal agreement consistent with the foregoing was signed in May 2019, and we expect to make the related payments in the third quarter of 2019.
As previously disclosed in our 2018 10-K, TRMC reached an agreement to pay a penalty of $75,000 and undertake certain supplemental environmental projects with an estimated cost of $75,000 to settle five NOVs from the South Coast Air Quality Management District. The NOVs were issued to the Los Angeles refinery between June and October 2017, alleging violations of various federal and district air emission regulations. A formal agreement consistent with the foregoing was signed in April 2019 and the penalty has been paid.
Martinez Refinery
As previously disclosed in our 2018 10-K, on July 18, 2016, the U.S. Department of Justice (“DOJ”) lodged a complaint on behalf of the EPA and a Consent Decree with the Western District Court of Texas. Among other things, the Consent Decree required that the Martinez refinery meet certain annual emission limits for NOx by July 1, 2018. In February 2018, TRMC informed the EPA that it would need additional time to satisfy requirements of the Consent Decree. In the second quarter of 2019, MPC, the EPA and the DOJ reached a settlement in principle, which includes a civil penalty of approximately $6.5 million and a schedule for installation of a Selective Catalytic Reduction system to control NOx emissions from the FCCU.
ITEM 1A. RISK FACTORS
There have been no material changes from the risk factors previously disclosed in our Annual Report on Form 10-K for the year ended December 31, 2018, other than the risks described below related to the pending MLP Merger.
The pending merger between MPLX and ANDX (the “MLP Merger”) is subject to conditions, including certain conditions that may not be satisfied or completed on a timely basis, if at all. Failure to complete the MLP merger could have a material and adverse effect on us and, even if completed, the MLP merger may not achieve some or all of the anticipated benefits.
On May 8, 2019, we, together with MPLX and ANDX, announced the MLP Merger. Completion of the MLP Merger is subject to a number of customary conditions set forthas updated in the MLP Merger Agreement, including approval by a majority of ANDX’s unitholders, MPLX’s registration statementour Quarterly Report on Form S-4 having become effective under10-Q for the Securities Act of 1933, the approval to list MPLX units issuable in connection with the MLP Merger on the New York Stock Exchange, the absence of any governmental order or law prohibiting the consummation of the MLP Merger, the accuracy of each party’s representations and warranties under the MLP Merger Agreement (subject to the materiality standards set forth in the MLP Merger Agreement), MPLX’s and ANDX’s performance of their respective obligations under the MLP Merger Agreement in all material respects, and the receipt by both parties from their respective counsels of a written opinion regarding the U.S. federal income tax treatment of the transaction. These and other conditions to the closing of the MLP Merger may not be fulfilled in a timely manner or at all, and, accordingly, the MLP Merger may be delayed or may not be completed.
If the MLP Merger is not completed, our ongoing businesses may be adversely affected and, without realizing any of the benefits of having completed the MLP Merger, we will be subject to a number of risks, including the following:
we will be required to pay our costs relating to the MLP Merger, such as legal, accounting and financial advisory expenses, whether or not MLP Merger is completed;
time and resources committed by our management to matters relating to MLP Merger could otherwise have been devoted to pursuing other beneficial opportunities; and
the market price of our common stock could decline to the extent that the current market price reflects a market assumption that the MLP Merger will be completed.
In addition, even if completed there can be no assurance that the MLP Merger will deliver the strategic, financial and operational benefits anticipated by us.quarter ended March 31, 2019.
ITEM 2. UNREGISTERED SALES OF EQUITY SECURITIES AND USE OF PROCEEDS
The following table sets forth a summary of our purchases during the quarter ended March 31,June 30, 2019, of equity securities that are registered by MPC pursuant to Section 12 of the Securities Exchange Act of 1934, as amended.
|
| | | | | | | | | | | | | | |
| Period | | Total Number
of Shares
Purchased(a) | | Average
Price
Paid per
Share(b) | | Total Number of
Shares Purchased as
Part of Publicly
Announced Plans
or Programs | | Maximum Dollar
Value of Shares that
May Yet Be Purchased
Under the Plans or
Programs(c) |
| 01/01/19-01/31/19 | 4,490,477 |
| | $ | 63.48 |
| | 4,489,490 |
| | $ | 4,619,604,825 |
|
| 02/01/19-02/28/19 | 4,398,691 |
| | 64.84 |
| | 4,395,511 |
| | 4,334,605,410 |
|
| 03/01/19-03/31/19 | 5,204,982 |
| | 60.97 |
| | 5,167,580 |
| | 4,019,606,059 |
|
| Total | 14,094,150 |
| | 62.98 |
| | 14,052,581 |
| | |
|
| | | | | | | | | | | | | | |
| Period | | Total Number
of Shares
Purchased(a) | | Average
Price
Paid per
Share(b) | | Total Number of
Shares Purchased as
Part of Publicly
Announced Plans
or Programs | | Maximum Dollar
Value of Shares that
May Yet Be Purchased
Under the Plans or
Programs(c) |
| 04/01/2019-04/30/2019 | 5,268,926 |
| | $ | 61.25 |
| | 5,141,205 |
| | $ | 3,704,606,774 |
|
| 05/01/2019-05/31/2019 | 410,585 |
| | 61.05 |
| | 409,578 |
| | 3,679,603,410 |
|
| 06/01/2019-06/30/2019 | 3,193,848 |
| | 50.11 |
| | 3,193,663 |
| | 3,519,582,400 |
|
| Total | 8,873,359 |
| | 57.23 |
| | 8,744,446 |
| | |
| |
(a) | The amounts in this column include 987, 3,180127,721, 1,007 and 37,402185 shares of our common stock delivered by employees to MPC, upon vesting of restricted stock, to satisfy tax withholding requirements in January, FebruaryApril, May and March,June, respectively. |
| |
(b) | Amounts in this column reflect the weighted average price paid for shares purchased under our share repurchase authorizations and for shares tendered to us in satisfaction of employee tax withholding obligations upon the vesting of restricted stock granted under our stock plans. The weighted average price includes commissions paid to brokers on shares purchased under our share repurchase authorizations. |
| |
(c) | On April 30, 2018, we announced that our board of directors had approved a $5.0 billion share repurchase authorization. This share repurchase authorization has no expiration date. The share repurchase authorization announced on April 30, 2018, together with prior authorizations, results in a total of $18.0 billion of share repurchase authorizations since January 1, 2012. |
ITEM 5. OTHER INFORMATION
None
|
| | | | | | | | | | | | | | |
| | | | | | | Incorporated by Reference | | Filed Herewith | | Furnished Herewith |
Exhibit Number | | Exhibit Description | | Form | | Exhibit | | Filing Date | | SEC File No. | |
| | | | 8-K | | 2.1 | | 4/30/2018 | | 001-35054 | | | | |
| | | | S-4/A | | 2.2 | | 7/5/2018 | | 333-225244 | | | | |
| | | | 8-K | | 2.1 | | 9/18/2018 | | 001-35054 | | | | |
| | | | 8-K | | 2.1 | | 5/8/2019 | | 001-35054 | | | | |
| | | | 8-K | | 3.2 | | 10/1/2018 | | 001-35054 | | | | |
| | | | 10-K | | 3.2 | | 2/28/2019 | | 001-35054 | | | | |
| | | | | | | | | | | | X | | |
| | | | | | | | | | | | X | | |
| | | | | | | | | | | | X | | |
| | First Amendment to Fourth Amended and Restated Omnibus Agreement, dated as of January 30, 2019, among Andeavor LLC, Marathon Petroleum Company LP, Tesoro Refining & Marketing Company LLC, Tesoro Companies, Inc., Tesoro Alaska Company LLC, Andeavor Logistics LP and Tesoro Logistics GP, LLC | | 10-K | | 10.77 | | 2/28/2019 | | 001-35054 | | | | |
| | | | 8-K | | 10.1 | | 5/8/2019 | | 001-35054 | | | | |
| | | | | | | | | | | | X | | |
| | | | | | | | | | | | X | | |
| | | | | | | | | | | | | | X |
| | | | | | | | | | | | | | X |
| 101.INS | | XBRL Instance Document | | | | | | | | | | X | | |
| 101.SCH | | XBRL Taxonomy Extension Schema | | | | | | | | | | X | | |
| 101.PRE | | XBRL Taxonomy Extension Presentation Linkbase | | | | | | | | | | X | | |
| 101.CAL | | XBRL Taxonomy Extension Calculation Linkbase | | | | | | | | | | X | | |
| 101.DEF | | XBRL Taxonomy Extension Definition Linkbase | | | | | | | | | | X | | |
| 101.LAB | | XBRL Taxonomy Extension Label Linkbase | | | | | | | | | | X | | |
|
| | | | | | | | | | | | | | |
| | | | | | | Incorporated by Reference | | Filed Herewith | | Furnished Herewith |
Exhibit Number | | Exhibit Description | | Form | | Exhibit | | Filing Date | | SEC File No. | |
| | | | 8-K | | 2.1 | | 4/30/2018 | | 001-35054 | | | | |
| | | | S-4/A | | 2.2 | | 7/5/2018 | | 333-225244 | | | | |
| | | | 8-K | | 2.1 | | 9/18/2018 | | 001-35054 | | | | |
| | | | 8-K | | 2.1 | | 5/8/2019 | | 001-35054 | | | | |
| | | | 8-K | | 3.2 | | 10/1/2018 | | 001-35054 | | | | |
| | | | 10-K | | 3.2 | | 2/28/2019 | | 001-35054 | | | | |
| | | | 8-K | | 10.1 | | 5/8/2019 | | 001-35054 | | | | |
| | Second Amendment to Receivables Purchase Agreement, dated July 19, 2019, by and among MPC Trade Receivables Company LLC, as seller, Marathon Petroleum Company LP, as servicer, MUFG Bank, Ltd., as administrative agent, certain committed purchasers and conduit purchasers that are parties thereto from time to time and certain other parties thereto from time to time as managing agents and letter of credit issuers. | | 8-K | | 10.1 | | 7/25/2019 | | 001-35054 | | | | |
| | 364-Day Revolving Credit Agreement, dated as of July 26, 2019, among MPC, as borrower, JPMorgan Chase Bank, N.A., as administrative agent, each of JPMorgan Chase Bank, N.A., Wells Fargo Securities, LLC, Barclays Bank PLC, Citibank, N.A., BofA Securities, Mizuho Bank, Ltd., MUFG Bank, Ltd. and Royal Bank of Canada, as joint lead arrangers and joint bookrunners, Wells Fargo Bank, National Association, as syndication agent, each of Bank of America, N.A., Barclays Bank PLC, Citibank, N.A., Mizuho Bank, Ltd., MUFG Bank, Ltd., and Royal Bank of Canada, as documentation agents, and the other lenders and issuing banks that are parties thereto. | | 8-K | | 10.1 | | 8/1/2019 | | 001-35054 | | | | |
| | Amended and Restated Credit Agreement, dated as of July 26, 2019, by and among MPLX, as borrower, Wells Fargo Bank, National Association, as administrative agent, each of Wells Fargo Securities, LLC, JPMorgan Chase Bank, N.A., Barclays Bank PLC, BofA Securities, Inc., Citigroup Global Markets Inc., Mizuho Bank, Ltd., MUFG Bank, Ltd. and Royal Bank of Canada, as joint lead arrangers and joint bookrunners, JPMorgan Chase Bank, N.A., as syndication agent, each of Bank of America, N.A., Barclays Bank PLC, Citigroup Global Markets Inc., Mizuho Bank, Ltd., MUFG Bank, Ltd. and Royal Bank of Canada, as documentation agents, and the other lenders and issuing banks that are parties thereto. | | 8-K | | 10.2 | | 8/1/2019 | | 001-35054 | | | | |
| | Waiver and Second Amendment to Fourth Amended and Restated Omnibus Agreement, dated as of July 29, 2019, by and among MPC, Andeavor Logistics LP, Tesoro Logistics GP, LLC, Tesoro Refining & Marketing Company LLC, Tesoro Companies, Inc., Tesoro Alaska Company LLC and Marathon Petroleum Company LP. | | 8-K | | 10.3 | | 8/1/2019 | | 001-35054 | | | | |
| | | | | | | | | | | | X | | |
| | | | | | | | | | | | X | | |
| | | | | | | | | | | | | | X |
| | | | | | | | | | | | | | X |
| 101.INS | | XBRL Instance Document - the instance document does not appear in the Interactive Data File because its XBRL tags are embedded with the Inline XBRL document. | | | | | | | | | | | | |
|
| | | | | | | | | | | | | | |
| | | | | | Incorporated by Reference | | Filed Herewith | | Furnished Herewith |
Exhibit Number | | Exhibit Description | | Form | | Exhibit | | Filing Date | | SEC File No. | |
| 101.SCH | | Inline XBRL Taxonomy Extension Schema Document. | | | | | | | | | | X | | |
| 101.PRE | | Inline XBRL Taxonomy Extension Presentation Linkbase Document. | | | | | | | | | | X | | |
| 101.CAL | | Inline XBRL Taxonomy Extension Calculation Linkbase Document. | | | | | | | | | | X | | |
| 101.DEF | | Inline XBRL Taxonomy Extension Definition Linkbase Document. | | | | | | | | | | X | | |
| 101.LAB | | Inline XBRL Taxonomy Extension Label Linkbase Document. | | | | | | | | | | X | | |
| |
| * | Schedules have been omitted pursuant to Item 601(b)(2) of Regulation S-K. Marathon Petroleum Corporation hereby undertakes to furnish supplementally a copy of any omitted schedule upon request by the SEC. |
SIGNATURES
Pursuant to the requirements of the Securities Exchange Act of 1934, the registrant has duly caused this report to be signed on its behalf by the undersigned thereunto duly authorized.
|
| | |
May 9,August 5, 2019 | MARATHON PETROLEUM CORPORATION |
| | | |
| | By: | /s/ John J. Quaid |
| | | John J. Quaid Vice President and Controller |