UNITED STATES
SECURITIES AND EXCHANGE COMMISSION
Washington, D.C. 20549
FORM 10-Q
(Mark One)
| ☒ | QUARTERLY REPORT PURSUANT TO SECTION 13 OR 15(d) OF THE SECURITIES EXCHANGE ACT OF 1934 | ||||
For the quarterly period ended March 31, 20202021
OR
| ☐ | TRANSITION REPORT PURSUANT TO SECTION 13 OR 15(d) OF THE SECURITIES EXCHANGE ACT OF 1934 | ||||
For the transition period from to
Commission file number 001-35054
Marathon Petroleum Corporation
(Exact name of registrant as specified in its charter)
| Delaware | 27-1284632 | |||||||
| (State or other jurisdiction of incorporation or organization) | (I.R.S. Employer Identification No.) | |||||||
539 South Main Street,, Findlay,, Ohio45840-3229
(Address of principal executive offices) (Zip code)
(Registrant’s telephone number, including area code)
| Securities registered pursuant to Section 12(b) of the Act | ||||||||
| Title of each class | Trading Symbol(s) | Name of each exchange on which registered | ||||||
| Common Stock, par value $.01 | MPC | New York Stock Exchange | ||||||
Indicate by check mark whether the registrant (1) has filed all reports required to be filed by Section 13 or 15(d) of the Securities Exchange Act of 1934 during the preceding 12 months (or for such shorter period that the registrant was required to file such reports), and (2) has been subject to such filing requirements for the past 90 days. Yes ☑ No ☐
Indicate by check mark whether the registrant has submitted electronically every Interactive Data File required to be submitted pursuant to Rule 405 of Regulation S-T (§232.405 of this chapter) during the preceding 12 months (or for such shorter period that the registrant was required to submit such files.) Yes ☑ No ☐
Indicate by check mark whether the registrant is a large accelerated filer, an accelerated filer, a non-accelerated filer, a smaller reporting company, or an emerging growth company. See the definitions of “large accelerated filer,” “accelerated filer,” “smaller reporting company,” and “emerging growth company” in Rule 12b-2 of the Exchange Act.
Large Accelerated Filer ☑ Accelerated Filer ☐ Non-accelerated Filer ☐ Smaller reporting company ☐
Emerging growth company ☐
If an emerging growth company, indicate by check mark if the registrant has elected not to use the extended transition period for complying with any new or revised financial accounting standards provided pursuant to Section 13(a) of the Exchange Act.Act ☐
Indicate by check mark whether the registrant is a shell company (as defined in Rule 12b-2 of the Exchange Act) Yes ☐ No ☑
There were 650,260,897652,649,795 shares of Marathon Petroleum Corporation common stock outstanding as of May 1, 2020April 30, 2021.
MARATHON PETROLEUM CORPORATION
FORM 10-Q
FOR THE QUARTERLY PERIOD ENDED MARCH 31, 20202021
TABLE OF CONTENTS
| Page | |||||
Unless otherwise stated or the context otherwise indicates, all references in this Form 10-Q to “MPC,” “us,” “our,” “we” or “the Company” mean Marathon Petroleum Corporation and its consolidated subsidiaries.
1
GLOSSARY OF TERMS
Throughout this report, the following company or industry specific terms and abbreviations are used:
| ANS | |||||
| ASC | Accounting Standards Codification | ||||
| ASU | Accounting Standards Update | ||||
| barrel | One stock tank barrel, or 42 United States gallons liquid volume, used in reference to crude oil or other liquid hydrocarbons | ||||
| Conventional Blending for Oxygenate Blending | |||||
| EBITDA (a non-GAAP financial measure) | Earnings Before Interest, Tax, Depreciation and Amortization | ||||
| EPA | United States Environmental Protection Agency | ||||
| Accounting principles generally accepted in the United States | |||||
| California Air Resources Board | |||||
| LA CARBOB | California Reformulated Gasoline Blendstock for Oxygenate Blending | ||||
| LCM | Lower of cost or market | ||||
| LIFO | Last in, first out, an inventory costing method | ||||
| Louisiana Light Sweet crude oil, an oil index benchmark price | |||||
| mbpd | Thousand barrels per day | ||||
| Magellan East Houston crude oil, an oil index benchmark price | |||||
| MMBtu | One million British thermal units, an energy measurement | ||||
| Natural gas liquids, such as ethane, propane, butanes and natural gasoline | |||||
| NYMEX | New York Mercantile Exchange | ||||
| OTC | Over-the-Counter | ||||
| Property, plant and equipment | |||||
| RIN | Renewable Identification Number | ||||
| SEC | United States Securities and Exchange Commission | ||||
| ULSD | Ultra-low sulfur diesel | ||||
| USGC | U.S. Gulf Coast | ||||
| VIE | Variable interest entity | ||||
| WTI | West Texas Intermediate crude oil, an oil index benchmark price | ||||
2
PART I – FINANCIAL INFORMATION
ITEM 1. FINANCIAL STATEMENTS
MARATHON PETROLEUM CORPORATION
CONSOLIDATED STATEMENTS OF INCOME (Unaudited)
| Three Months Ended March 31, | |||||||||||||||||||||||
| (In millions, except per share data) | 2021 | 2020 | |||||||||||||||||||||
| Revenues and other income: | |||||||||||||||||||||||
| Sales and other operating revenues | $ | 22,711 | $ | 22,204 | |||||||||||||||||||
Income (loss) from equity method investments(a) | 91 | (1,233) | |||||||||||||||||||||
| Net gain on disposal of assets | 3 | 3 | |||||||||||||||||||||
| Other income | 77 | 23 | |||||||||||||||||||||
| Total revenues and other income | 22,882 | 20,997 | |||||||||||||||||||||
| Costs and expenses: | |||||||||||||||||||||||
| Cost of revenues (excludes items below) | 21,084 | 20,342 | |||||||||||||||||||||
| LCM inventory valuation adjustment | 0 | 3,185 | |||||||||||||||||||||
| Impairment expense | 0 | 7,822 | |||||||||||||||||||||
| Depreciation and amortization | 844 | 863 | |||||||||||||||||||||
| Selling, general and administrative expenses | 575 | 742 | |||||||||||||||||||||
| Other taxes | 162 | 198 | |||||||||||||||||||||
| Total costs and expenses | 22,665 | 33,152 | |||||||||||||||||||||
| Income (loss) from continuing operations | 217 | (12,155) | |||||||||||||||||||||
| Net interest and other financial costs | 353 | 332 | |||||||||||||||||||||
| Loss from continuing operations before income taxes | (136) | (12,487) | |||||||||||||||||||||
| Provision (benefit) for income taxes on continuing operations | 34 | (1,951) | |||||||||||||||||||||
| Loss from continuing operations, net of tax | (170) | (10,536) | |||||||||||||||||||||
| Income from discontinued operations, net of tax | 234 | 318 | |||||||||||||||||||||
| Net income (loss) | 64 | (10,218) | |||||||||||||||||||||
| Less net income (loss) attributable to: | |||||||||||||||||||||||
| Redeemable noncontrolling interest | 20 | 20 | |||||||||||||||||||||
| Noncontrolling interests | 286 | (1,004) | |||||||||||||||||||||
| Net loss attributable to MPC | $ | (242) | $ | (9,234) | |||||||||||||||||||
| Per share data (See Note 8) | |||||||||||||||||||||||
| Basic: | |||||||||||||||||||||||
| Continuing operations | $ | (0.73) | $ | (14.74) | |||||||||||||||||||
| Discontinued operations | 0.36 | 0.49 | |||||||||||||||||||||
| Net loss per share | $ | (0.37) | $ | (14.25) | |||||||||||||||||||
| Weighted average shares outstanding | 651 | 648 | |||||||||||||||||||||
| Diluted: | |||||||||||||||||||||||
| Continuing operations | $ | (0.73) | $ | (14.74) | |||||||||||||||||||
| Discontinued operations | 0.36 | 0.49 | |||||||||||||||||||||
| Net loss per share | $ | (0.37) | $ | (14.25) | |||||||||||||||||||
| Weighted average shares outstanding | 651 | 648 | |||||||||||||||||||||
| Three Months Ended March 31, | |||||||
| (In millions, except per share data) | 2020 | 2019 | |||||
| Revenues and other income: | |||||||
| Sales and other operating revenues | $ | 25,215 | $ | 28,253 | |||
Income (loss) from equity method investments(a) | (1,210 | ) | 99 | ||||
| Net gain on disposal of assets | 4 | 214 | |||||
| Other income | 71 | 35 | |||||
| Total revenues and other income | 24,080 | 28,601 | |||||
| Costs and expenses: | |||||||
| Cost of revenues (excludes items below) | 22,821 | 25,960 | |||||
| Inventory market valuation adjustment | 3,220 | — | |||||
| Impairment expense | 7,822 | — | |||||
| Depreciation and amortization | 962 | 919 | |||||
| Selling, general and administrative expenses | 821 | 867 | |||||
| Other taxes | 251 | 186 | |||||
| Total costs and expenses | 35,897 | 27,932 | |||||
| Income (loss) from operations | (11,817 | ) | 669 | ||||
| Net interest and other financial costs | 338 | 306 | |||||
| Income (loss) before income taxes | (12,155 | ) | 363 | ||||
| Provision (benefit) for income taxes | (1,937 | ) | 104 | ||||
| Net income (loss) | (10,218 | ) | 259 | ||||
| Less net income (loss) attributable to: | |||||||
| Redeemable noncontrolling interest | 20 | 20 | |||||
| Noncontrolling interests | (1,004 | ) | 246 | ||||
| Net loss attributable to MPC | $ | (9,234 | ) | $ | (7 | ) | |
| Per Share Data (See Note 7) | |||||||
| Basic: | |||||||
| Net loss attributable to MPC per share | $ | (14.25 | ) | $ | (0.01 | ) | |
| Weighted average shares outstanding | 648 | 673 | |||||
| Diluted: | |||||||
| Net loss attributable to MPC per share | $ | (14.25 | ) | $ | (0.01 | ) | |
| Weighted average shares outstanding | 648 | 673 | |||||
The accompanying notes are an integral part of these consolidated financial statements.
| Three Months Ended March 31, | |||||||
| (Millions of dollars) | 2020 | 2019 | |||||
| Net income (loss) | $ | (10,218 | ) | $ | 259 | ||
| Other comprehensive income (loss): | |||||||
| Defined benefit plans: | |||||||
| Actuarial changes, net of tax of $1 and $6, respectively | 4 | (3 | ) | ||||
| Prior service credit, net of tax of ($3) and ($8), respectively | (9 | ) | (3 | ) | |||
| Other, net of tax of $0 and $0, respectively | (1 | ) | (1 | ) | |||
| Other comprehensive loss | (6 | ) | (7 | ) | |||
| Comprehensive income (loss) | (10,224 | ) | 252 | ||||
| Less comprehensive income (loss) attributable to: | |||||||
| Redeemable noncontrolling interest | 20 | 20 | |||||
| Noncontrolling interests | (1,004 | ) | 246 | ||||
| Comprehensive loss attributable to MPC | $ | (9,240 | ) | $ | (14 | ) | |
The accompanying notes are an integral part of these consolidated financial statements.
3
MARATHON PETROLEUM CORPORATION
| (Millions of dollars, except share data) | March 31, 2020 | December 31, 2019 | |||||
| Assets | |||||||
| Current assets: | |||||||
| Cash and cash equivalents | $ | 1,690 | $ | 1,527 | |||
| Receivables, less allowance for doubtful accounts of $18 and $17, respectively | 5,583 | 7,479 | |||||
| Inventories | 7,445 | 10,243 | |||||
| Other current assets | 975 | 921 | |||||
| Total current assets | 15,693 | 20,170 | |||||
| Equity method investments | 5,656 | 6,898 | |||||
| Property, plant and equipment, net | 45,333 | 45,615 | |||||
| Goodwill | 12,710 | 20,040 | |||||
| Right of use assets | 2,562 | 2,459 | |||||
| Other noncurrent assets | 4,363 | 3,374 | |||||
| Total assets | $ | 86,317 | $ | 98,556 | |||
| Liabilities | |||||||
| Current liabilities: | |||||||
| Accounts payable | $ | 8,106 | $ | 11,623 | |||
| Payroll and benefits payable | 1,107 | 1,126 | |||||
| Accrued taxes | 1,098 | 1,186 | |||||
| Debt due within one year | 1,710 | 711 | |||||
| Operating lease liabilities | 630 | 604 | |||||
| Other current liabilities | 918 | 897 | |||||
| Total current liabilities | 13,569 | 16,147 | |||||
| Long-term debt | 29,899 | 28,127 | |||||
| Deferred income taxes | 5,772 | 6,392 | |||||
| Defined benefit postretirement plan obligations | 1,703 | 1,643 | |||||
| Long-term operating lease liabilities | 1,949 | 1,875 | |||||
| Deferred credits and other liabilities | 1,229 | 1,265 | |||||
| Total liabilities | 54,121 | 55,449 | |||||
| Commitments and contingencies (see Note 22) | |||||||
| Redeemable noncontrolling interest | 968 | 968 | |||||
| Equity | |||||||
| MPC stockholders’ equity: | |||||||
| Preferred stock, no shares issued and outstanding (par value $0.01 per share, 30 million shares authorized) | — | — | |||||
| Common stock: | |||||||
| Issued – 979 million and 978 million shares (par value $0.01 per share, 2 billion shares authorized) | 10 | 10 | |||||
| Held in treasury, at cost – 329 million and 329 million shares | (15,145 | ) | (15,143 | ) | |||
| Additional paid-in capital | 33,169 | 33,157 | |||||
| Retained earnings | 6,380 | 15,990 | |||||
| Accumulated other comprehensive loss | (326 | ) | (320 | ) | |||
| Total MPC stockholders’ equity | 24,088 | 33,694 | |||||
| Noncontrolling interests | 7,140 | 8,445 | |||||
| Total equity | 31,228 | 42,139 | |||||
| Total liabilities, redeemable noncontrolling interest and equity | $ | 86,317 | $ | 98,556 | |||
CONSOLIDATED STATEMENTS OF CASH FLOWSCOMPREHENSIVE INCOME (Unaudited)
| Three Months Ended March 31, | |||||||
| (Millions of dollars) | 2020 | 2019 | |||||
| Operating activities: | |||||||
| Net income (loss) | $ | (10,218 | ) | $ | 259 | ||
| Adjustments to reconcile net income (loss) to net cash provided by operating activities: | |||||||
| Amortization of deferred financing costs and debt discount | 14 | — | |||||
| Impairment expense | 7,822 | — | |||||
| Depreciation and amortization | 962 | 919 | |||||
| Inventory market valuation adjustment | 3,220 | — | |||||
| Pension and other postretirement benefits, net | 55 | 52 | |||||
| Deferred income taxes | (625 | ) | 127 | ||||
| Net gain on disposal of assets | (4 | ) | (214 | ) | |||
(Income) loss from equity method investments(a) | 1,210 | (99 | ) | ||||
| Distributions from equity method investments | 175 | 148 | |||||
| Changes in income tax receivable | (1,335 | ) | (19 | ) | |||
| Changes in the fair value of derivative instruments | (47 | ) | 29 | ||||
| Changes in operating assets and liabilities, net of effects of businesses acquired: | |||||||
| Current receivables | 1,899 | (1,018 | ) | ||||
| Inventories | (422 | ) | (4 | ) | |||
| Current accounts payable and accrued liabilities | (3,453 | ) | 1,483 | ||||
| Right of use assets and operating lease liabilities, net | (4 | ) | (1 | ) | |||
| All other, net | (17 | ) | (39 | ) | |||
| Net cash provided by (used in) operating activities | (768 | ) | 1,623 | ||||
| Investing activities: | |||||||
| Additions to property, plant and equipment | (1,062 | ) | (1,241 | ) | |||
| Disposal of assets | 56 | 24 | |||||
| Investments – acquisitions, loans and contributions | (169 | ) | (325 | ) | |||
| – redemptions, repayments and return of capital | 77 | 2 | |||||
| All other, net | 10 | 20 | |||||
| Net cash used in investing activities | (1,088 | ) | (1,520 | ) | |||
| Financing activities: | |||||||
| Long-term debt – borrowings | 4,250 | 2,604 | |||||
| – repayments | (1,521 | ) | (2,031 | ) | |||
| Issuance of common stock | 4 | 2 | |||||
| Common stock repurchased | — | (885 | ) | ||||
| Dividends paid | (377 | ) | (354 | ) | |||
| Distributions to noncontrolling interests | (320 | ) | (325 | ) | |||
| Contributions from noncontrolling interests | — | 95 | |||||
| All other, net | (15 | ) | (26 | ) | |||
| Net cash provided by (used in) financing activities | 2,021 | (920 | ) | ||||
| Net increase (decrease) in cash, cash equivalents and restricted cash | 165 | (817 | ) | ||||
| Cash, cash equivalents and restricted cash at beginning of period | 1,529 | 1,725 | |||||
| Cash, cash equivalents and restricted cash at end of period | $ | 1,694 | $ | 908 | |||
| Three Months Ended March 31, | |||||||||||||||||||||||
| (Millions of dollars) | 2021 | 2020 | |||||||||||||||||||||
| Net income (loss) | $ | 64 | $ | (10,218) | |||||||||||||||||||
| Other comprehensive income (loss): | |||||||||||||||||||||||
| Defined benefit plans: | |||||||||||||||||||||||
| Actuarial changes, net of tax of $3 and $1, respectively | 9 | 4 | |||||||||||||||||||||
| Prior service, net of tax of $(3) and $(3), respectively | (8) | (9) | |||||||||||||||||||||
| Other, net of tax of $0 and $0, respectively | 0 | (1) | |||||||||||||||||||||
| Other comprehensive income (loss) | 1 | (6) | |||||||||||||||||||||
| Comprehensive income (loss) | 65 | (10,224) | |||||||||||||||||||||
| Less comprehensive income (loss) attributable to: | |||||||||||||||||||||||
| Redeemable noncontrolling interest | 20 | 20 | |||||||||||||||||||||
| Noncontrolling interests | 286 | (1,004) | |||||||||||||||||||||
| Comprehensive loss attributable to MPC | $ | (241) | $ | (9,240) | |||||||||||||||||||
The accompanying notes are an integral part of these consolidated financial statements.
4
MARATHON PETROLEUM CORPORATION
CONSOLIDATED BALANCE SHEETS (Unaudited)
| (Millions of dollars, except share data) | March 31, 2021 | December 31, 2020 | |||||||||
| Assets | |||||||||||
| Current assets: | |||||||||||
| Cash and cash equivalents | $ | 624 | $ | 415 | |||||||
| Receivables, less allowance for doubtful accounts of $44 and $18, respectively | 7,468 | 5,760 | |||||||||
| Inventories | 8,407 | 7,999 | |||||||||
| Other current assets | 2,695 | 2,724 | |||||||||
| Assets held for sale | 11,167 | 11,389 | |||||||||
| Total current assets | 30,361 | 28,287 | |||||||||
| Equity method investments | 5,435 | 5,422 | |||||||||
| Property, plant and equipment, net | 38,491 | 39,035 | |||||||||
| Goodwill | 8,256 | 8,256 | |||||||||
| Right of use assets | 1,514 | 1,521 | |||||||||
| Other noncurrent assets | 2,594 | 2,637 | |||||||||
| Total assets | $ | 86,651 | $ | 85,158 | |||||||
| Liabilities | |||||||||||
| Current liabilities: | |||||||||||
| Accounts payable | $ | 9,953 | $ | 7,803 | |||||||
| Payroll and benefits payable | 501 | 732 | |||||||||
| Accrued taxes | 1,034 | 1,105 | |||||||||
| Debt due within one year | 1,786 | 2,854 | |||||||||
| Operating lease liabilities | 475 | 497 | |||||||||
| Other current liabilities | 744 | 822 | |||||||||
| Liabilities held for sale | 1,592 | 1,850 | |||||||||
| Total current liabilities | 16,085 | 15,663 | |||||||||
| Long-term debt | 30,694 | 28,730 | |||||||||
| Deferred income taxes | 6,215 | 6,203 | |||||||||
| Defined benefit postretirement plan obligations | 1,958 | 2,121 | |||||||||
| Long-term operating lease liabilities | 1,007 | 1,014 | |||||||||
| Deferred credits and other liabilities | 1,213 | 1,207 | |||||||||
| Total liabilities | 57,172 | 54,938 | |||||||||
| Commitments and contingencies (see Note 22) | 0 | 0 | |||||||||
| Redeemable noncontrolling interest | 968 | 968 | |||||||||
| Equity | |||||||||||
| MPC stockholders’ equity: | |||||||||||
| Preferred stock, 0 shares issued and outstanding (par value $0.01 per share, 30 million shares authorized) | 0 | 0 | |||||||||
| Common stock: | |||||||||||
| Issued – 981 million and 980 million shares (par value $0.01 per share, 2 billion shares authorized) | 10 | 10 | |||||||||
| Held in treasury, at cost – 329 million and 329 million shares | (15,158) | (15,157) | |||||||||
| Additional paid-in capital | 33,222 | 33,208 | |||||||||
| Retained earnings | 4,029 | 4,650 | |||||||||
| Accumulated other comprehensive loss | (511) | (512) | |||||||||
| Total MPC stockholders’ equity | 21,592 | 22,199 | |||||||||
| Noncontrolling interests | 6,919 | 7,053 | |||||||||
| Total equity | 28,511 | 29,252 | |||||||||
| Total liabilities, redeemable noncontrolling interest and equity | $ | 86,651 | $ | 85,158 | |||||||
The accompanying notes are an integral part of these consolidated financial statements.
5
MARATHON PETROLEUM CORPORATION
CONSOLIDATED STATEMENTS OF CASH FLOWS (Unaudited)
| Three Months Ended March 31, | |||||||||||
| (Millions of dollars) | 2021 | 2020 | |||||||||
| Operating activities: | |||||||||||
| Net income (loss) | $ | 64 | $ | (10,218) | |||||||
| Adjustments to reconcile net income (loss) to net cash provided by operating activities: | |||||||||||
| Amortization of deferred financing costs and debt discount | 22 | 14 | |||||||||
| Impairment expense | 0 | 7,822 | |||||||||
| Depreciation and amortization | 844 | 863 | |||||||||
| LCM inventory valuation adjustment | 0 | 3,185 | |||||||||
| Pension and other postretirement benefits, net | (158) | 55 | |||||||||
| Deferred income taxes | 24 | (691) | |||||||||
| Net gain on disposal of assets | (3) | (3) | |||||||||
(Income) loss from equity method investments(a) | (91) | 1,233 | |||||||||
| Distributions from equity method investments | 142 | 147 | |||||||||
| Income from discontinued operations | (234) | (318) | |||||||||
| Changes in income tax receivable | 54 | (1,335) | |||||||||
| Changes in the fair value of derivative instruments | (43) | (47) | |||||||||
| Changes in operating assets and liabilities, net of effects of businesses acquired: | |||||||||||
| Current receivables | (1,723) | 1,856 | |||||||||
| Inventories | (408) | (397) | |||||||||
| Current accounts payable and accrued liabilities | 1,821 | (3,375) | |||||||||
| Right of use assets and operating lease liabilities, net | 5 | (6) | |||||||||
| All other, net | (51) | (1) | |||||||||
| Cash provided by (used in) operating activities - continuing operations | 265 | (1,216) | |||||||||
| Cash provided by operating activities - discontinued operations | 189 | 448 | |||||||||
| Net cash provided by (used in) operating activities | 454 | (768) | |||||||||
| Investing activities: | |||||||||||
| Additions to property, plant and equipment | (304) | (951) | |||||||||
| Disposal of assets | 76 | 48 | |||||||||
| Investments – acquisitions and contributions | (51) | (169) | |||||||||
| – redemptions, repayments and return of capital | 1 | 77 | |||||||||
| All other, net | 98 | 10 | |||||||||
| Cash used in investing activities - continuing operations | (180) | (985) | |||||||||
| Cash used in investing activities - discontinued operations | (87) | (103) | |||||||||
| Net cash used in investing activities | (267) | (1,088) | |||||||||
| Financing activities: | |||||||||||
| Commercial paper – issued | 6,049 | 0 | |||||||||
| – repayments | (5,356) | 0 | |||||||||
| Long-term debt – borrowings | 6,785 | 4,250 | |||||||||
| – repayments | (6,613) | (1,521) | |||||||||
| Issuance of common stock | 23 | 4 | |||||||||
| Dividends paid | (379) | (377) | |||||||||
| Distributions to noncontrolling interests | (320) | (320) | |||||||||
| Repurchases of noncontrolling interests | (155) | 0 | |||||||||
| All other, net | (18) | (15) | |||||||||
| Net cash provided by financing activities | 16 | 2,021 | |||||||||
| Net change in cash, cash equivalents and restricted cash | $ | 203 | $ | 165 | |||||||
(a)The three months ended March 31, 2020 includes impairment expense. See Note 5 for further information.
The accompanying notes are an integral part of these consolidated financial statements.
6
MARATHON PETROLEUM CORPORATION
CONSOLIDATED STATEMENTS OF CASH FLOWS (Unaudited)
| Three Months Ended March 31, | |||||||||||
| (Millions of dollars) | 2021 | 2020 | |||||||||
| Cash, cash equivalents and restricted cash balances: | |||||||||||
| Continuing operations - beginning of period | $ | 416 | $ | 1,395 | |||||||
Discontinued operations - beginning of period(a) | 140 | 134 | |||||||||
Less: Discontinued operations - end of period(a) | 134 | 89 | |||||||||
| Continuing operations - end of period | $ | 625 | $ | 1,605 | |||||||
(a)Reported as assets held for sale on our consolidated balance sheets.
The accompanying notes are an integral part of these consolidated financial statements.
7
MARATHON PETROLEUM CORPORATION
CONSOLIDATED STATEMENTS OF EQUITY AND REDEEMBALE NONCONTROLLING INTEREST
(Unaudited)
| MPC Stockholders’ Equity | |||||||||||||||||||||||||||||||||||||||||||||||||||||||||||
| Common Stock | Treasury Stock | Additional Paid-in Capital | Retained Earnings | Accumulated Other Comprehensive Income (Loss) | Non-controlling Interests | Total Equity | Redeemable Non-controlling Interest | ||||||||||||||||||||||||||||||||||||||||||||||||||||
| (Shares in millions; amounts in millions of dollars) | Shares | Amount | Shares | Amount | |||||||||||||||||||||||||||||||||||||||||||||||||||||||
| Balance as of December 31, 2020 | 980 | $ | 10 | (329) | $ | (15,157) | $ | 33,208 | $ | 4,650 | $ | (512) | $ | 7,053 | $ | 29,252 | $ | 968 | |||||||||||||||||||||||||||||||||||||||||
| Net income (loss) | — | — | — | — | — | (242) | — | 286 | 44 | 20 | |||||||||||||||||||||||||||||||||||||||||||||||||
| Dividends declared on common stock ($0.58 per share) | — | — | — | — | — | (379) | — | — | (379) | — | |||||||||||||||||||||||||||||||||||||||||||||||||
| Distributions to noncontrolling interests | — | — | — | — | — | — | — | (300) | (300) | (20) | |||||||||||||||||||||||||||||||||||||||||||||||||
| Other comprehensive income | — | — | — | — | — | — | 1 | — | 1 | — | |||||||||||||||||||||||||||||||||||||||||||||||||
| Stock based compensation | 1 | — | 0 | (1) | 18 | — | — | 0 | 17 | — | |||||||||||||||||||||||||||||||||||||||||||||||||
| Equity transactions of MPLX | — | — | — | — | (4) | — | — | (120) | (124) | — | |||||||||||||||||||||||||||||||||||||||||||||||||
| Balance as of March 31, 2021 | 981 | $ | 10 | (329) | $ | (15,158) | $ | 33,222 | $ | 4,029 | $ | (511) | $ | 6,919 | $ | 28,511 | $ | 968 | |||||||||||||||||||||||||||||||||||||||||
| MPC Stockholders’ Equity | |||||||||||||||||||||||||||||||||||||
| Common Stock | Treasury Stock | Additional Paid-in Capital | Retained Earnings | Accumulated Other Comprehensive Income (Loss) | Non-controlling Interests | Total Equity | Redeemable Non-controlling Interest | ||||||||||||||||||||||||||||||
(Shares in millions; amounts in millions of dollars) | Shares | Amount | Shares | Amount | |||||||||||||||||||||||||||||||||
| Balance as of December 31, 2019 | 978 | $ | 10 | (329 | ) | $ | (15,143 | ) | $ | 33,157 | $ | 15,990 | $ | (320 | ) | $ | 8,445 | $ | 42,139 | $ | 968 | ||||||||||||||||
| Net income (loss) | — | — | — | — | — | (9,234 | ) | — | (1,004 | ) | (10,238 | ) | 20 | ||||||||||||||||||||||||
| Dividends declared on common stock ($0.58 per share) | — | — | — | — | — | (377 | ) | — | — | (377 | ) | — | |||||||||||||||||||||||||
| Distributions to noncontrolling interests | — | — | — | — | — | — | — | (300 | ) | (300 | ) | (20 | ) | ||||||||||||||||||||||||
| Other comprehensive loss | — | — | — | — | — | — | (6 | ) | — | (6 | ) | — | |||||||||||||||||||||||||
| Stock based compensation | 1 | — | — | (2 | ) | 17 | — | — | 1 | 16 | — | ||||||||||||||||||||||||||
| Equity transactions of MPLX | — | — | — | — | (5 | ) | — | — | (2 | ) | (7 | ) | — | ||||||||||||||||||||||||
| Other | — | — | — | — | — | 1 | — | — | 1 | — | |||||||||||||||||||||||||||
| Balance as of March 31, 2020 | 979 | $ | 10 | (329 | ) | $ | (15,145 | ) | $ | 33,169 | $ | 6,380 | $ | (326 | ) | $ | 7,140 | $ | 31,228 | $ | 968 | ||||||||||||||||
| MPC Stockholders’ Equity | |||||||||||||||||||||||||||||||||||||
| Common Stock | Treasury Stock | Additional Paid-in Capital | Retained Earnings | Accumulated Other Comprehensive Income (Loss) | Non-controlling Interests | Total Equity | Redeemable Non-controlling Interest | ||||||||||||||||||||||||||||||
| (Shares in millions; amounts in millions of dollars) | Shares | Amount | Shares | Amount | |||||||||||||||||||||||||||||||||
| Balance as of December 31, 2018 | 975 | $ | 10 | (295 | ) | $ | (13,175 | ) | $ | 33,729 | $ | 14,755 | $ | (144 | ) | $ | 8,874 | $ | 44,049 | $ | 1,004 | ||||||||||||||||
| Net income (loss) | — | — | — | — | — | (7 | ) | — | 246 | 239 | 20 | ||||||||||||||||||||||||||
| Dividends declared on common stock ($0.53 per share) | — | — | — | — | — | (357 | ) | — | — | (357 | ) | — | |||||||||||||||||||||||||
| Distributions to noncontrolling interests | — | — | — | — | — | — | — | (305 | ) | (305 | ) | (20 | ) | ||||||||||||||||||||||||
| Contributions from noncontrolling interests | — | — | — | — | — | — | — | 95 | 95 | — | |||||||||||||||||||||||||||
| Other comprehensive loss | — | — | — | — | — | — | (7 | ) | — | (7 | ) | — | |||||||||||||||||||||||||
| Shares repurchased | — | — | (14 | ) | (885 | ) | — | — | — | — | (885 | ) | — | ||||||||||||||||||||||||
| Stock based compensation | 1 | — | — | (3 | ) | 32 | — | — | (1 | ) | 28 | — | |||||||||||||||||||||||||
| Equity transactions of MPLX & ANDX | — | — | — | — | 3 | — | — | (1 | ) | 2 | — | ||||||||||||||||||||||||||
| Other | — | — | — | — | — | — | — | (1 | ) | (1 | ) | — | |||||||||||||||||||||||||
| Balance as of March 31, 2019 | 976 | $ | 10 | (309 | ) | $ | (14,063 | ) | $ | 33,764 | $ | 14,391 | $ | (151 | ) | $ | 8,907 | $ | 42,858 | $ | 1,004 | ||||||||||||||||
| MPC Stockholders’ Equity | |||||||||||||||||||||||||||||||||||||||||||||||||||||||||||
| Common Stock | Treasury Stock | Additional Paid-in Capital | Retained Earnings | Accumulated Other Comprehensive Income (Loss) | Non-controlling Interests | Total Equity | Redeemable Non-controlling Interest | ||||||||||||||||||||||||||||||||||||||||||||||||||||
| (Shares in millions; amounts in millions of dollars) | Shares | Amount | Shares | Amount | |||||||||||||||||||||||||||||||||||||||||||||||||||||||
| Balance as of December 31, 2019 | 978 | $ | 10 | (329) | $ | (15,143) | $ | 33,157 | $ | 15,990 | $ | (320) | $ | 8,445 | $ | 42,139 | $ | 968 | |||||||||||||||||||||||||||||||||||||||||
| Net income (loss) | — | — | — | — | — | (9,234) | — | (1,004) | (10,238) | 20 | |||||||||||||||||||||||||||||||||||||||||||||||||
| Dividends declared on common stock ($0.58 per share) | — | — | — | — | — | (377) | — | — | (377) | — | |||||||||||||||||||||||||||||||||||||||||||||||||
| Distributions to noncontrolling interests | — | — | — | — | — | — | — | (300) | (300) | (20) | |||||||||||||||||||||||||||||||||||||||||||||||||
| Other comprehensive loss | — | — | — | — | — | — | (6) | — | (6) | — | |||||||||||||||||||||||||||||||||||||||||||||||||
| Stock based compensation | 1 | — | 0 | (2) | 17 | — | — | 1 | 16 | — | |||||||||||||||||||||||||||||||||||||||||||||||||
| Equity transactions of MPLX | — | — | — | — | (5) | — | — | (2) | (7) | — | |||||||||||||||||||||||||||||||||||||||||||||||||
| Other | — | — | — | — | — | 1 | — | 0 | 1 | — | |||||||||||||||||||||||||||||||||||||||||||||||||
| Balance as of March 31, 2020 | 979 | $ | 10 | (329) | $ | (15,145) | $ | 33,169 | $ | 6,380 | $ | (326) | $ | 7,140 | $ | 31,228 | $ | 968 | |||||||||||||||||||||||||||||||||||||||||
The accompanying notes are an integral part of these consolidated financial statements.
8
NOTES TO CONSOLIDATED FINANCIAL STATEMENTS (UNAUDITED)
1. DESCRIPTION OF THE BUSINESS AND BASIS OF PRESENTATION
Description of the Business
We are a leading, integrated, downstream energy company headquartered in Findlay, Ohio. We operate the nation's largest refining system with more than 3 million barrels per day of crude oil capacity across 16 refineries.system. We sell refined products to wholesale marketing customers domestically and internationally, to buyers on the spot market to consumers through our Retail business segment and to independent entrepreneurs who operate approximately 6,900 branded outlets. Our retail operations own and operate approximately 3,880 retail transportation fuel and convenience stores across the United States andWe also sell transportation fuel to consumers through approximately 1,070 direct dealer locations under long-term supply contracts. MPC’s midstream operations are primarily conducted through MPLX LP (“MPLX”), which owns and operates crude oil and light product transportation and logistics infrastructure as well as gathering, processing and fractionation assets. We own the general partner and a majority limited partner interest in MPLX.
On October 31, 2019,August 2, 2020, we announcedentered into a definitive agreement to sell Speedway, our intention to separate ourcompany-owned and operated retail transportation fuel and convenience store business, which is operated primarily under the Speedway brand, into an independent, publicly traded company through a tax-free distribution to MPC shareholders of publicly traded stock7-Eleven, Inc. (“7-Eleven”) for $21 billion in the new independent retail transportation fuel and convenience store company. This transaction is targeted to be completed in the fourth quarter of 2020, however timing could change given the COVID-19 related impacts to the business environment and access to capital markets. This transaction iscash, subject to market, regulatorycertain adjustments based on the levels of cash, debt and working capital at closing and certain other items. The taxable transaction is expected to close in the second quarter of 2021, subject to customary closing conditions including final approval byand the MPC Board of Directors, receipt of customary assurances regarding the intended tax-free natureregulatory approvals.
As a result of the transaction, and the effectiveness of a registration statementagreement to be filed with the SEC. Thesell Speedway, business is currently a reporting unit within our Retail segment. MPC will retain its direct dealer business, which is also included in the Retail segment as currently reported. Subsequent to the completion of the separation, the historical results of the Speedway business will be presentedare reported separately as discontinued operations, net of tax, in our consolidated financial statements.statements of income for all periods presented and its assets and liabilities are presented in our consolidated balance sheets as assets and liabilities held for sale. In addition, we separately disclosed the operating and investing cash flows of Speedway as discontinued operations within our consolidated statements of cash flow. See Note 3 for discontinued operations disclosures.
Basis of Presentation
All significant intercompany transactions and accounts have been eliminated.
These interim consolidated financial statements are unaudited; however, in the opinion of our management, these statements reflect all adjustments necessary for a fair statement of the results for the periods reported. All such adjustments are of a normal, recurring nature unless otherwise disclosed. These interim consolidated financial statements, including the notes, have been prepared in accordance with the rules of the SEC applicable to interim period financial statements and do not include all of the information and disclosures required by GAAP for complete financial statements.
These interim consolidated financial statements should be read in conjunction with the audited consolidated financial statements and notes thereto included in our Annual Report on Form 10-K for the year ended December 31, 2019.2020. The results of operations for the three months ended March 31, 20202021 are not necessarily indicative of the results to be expected for the full year.
In accordance with ASC 205, Discontinued Operations, intersegment sales from our Refining & Marketing segment to Speedway are no longer eliminated as intercompany transactions and are now presented within sales and other operating revenue, since we will continue to supply fuel to Speedway subsequent to the sale to 7-Eleven. All periods presented have been retrospectively adjusted to reflect this change. Additionally, beginning August 2, 2020, in accordance with ASC 360, Property, Plant, and Equipment, we ceased recording depreciation and amortization for Speedway’s property, plant and equipment, finite-lived intangible assets and right of use lease assets.
2. ACCOUNTING STANDARDS
Recently Adopted
We are exposed to credit losses primarily through our sales of refined petroleum products, crude oil and midstream services. We assess each customer’s ability to pay through our credit review process. The credit review process considers various factors such as external credit ratings, a review of financial statements to determine liquidity, leverage, trends and business specific risks, market information, pay history and our business strategy. Customers that do not qualify for payment terms are required to prepay or provide a letter of credit. We monitor our ongoing credit exposure through timely review of customer payment activity. At March 31, 2020, we reported $5,583 million of accounts and notes receivable, net of allowances of $18 million.
| ASU | Effective Date | ||||||||||
| 2019-12 | Income Taxes (Topic 740): Simplifying the Accounting for Income Taxes | January 1, 2021 | |||||||||
As a result of the agreement to sell Speedway, its results are reported separately as discontinued operations, net of tax, in our consolidated statements of income for all periods presented and its assets and liabilities are presented in our consolidated balance sheets as assets and liabilities held for sale. Additionally, beginning August 2, 2020, in accordance with ASC 360,
9
Property, Plant, and Equipment, we ceased recording depreciation and amortization for Speedway’s property, plant and equipment, finite-lived intangible assets and right of use lease assets. In addition, we separately disclosed the fiscal yearoperating and investing cash flows of adoption. We do not expectSpeedway as discontinued operations within our consolidated statements of cash flow.
The following tables present Speedway results as reported in income from discontinued operations, net of tax, within our consolidated statements of income and the applicationcarrying value of this ASU to have a material impactassets and liabilities as presented within assets and liabilities held for sale on our consolidated financial statements.balance sheets.
| Three Months Ended March 31, | |||||||||||||||||||||||
| (In millions) | 2021 | 2020 | |||||||||||||||||||||
| Total revenues and other income | $ | 5,339 | $ | 5,560 | |||||||||||||||||||
| Costs and expenses: | |||||||||||||||||||||||
| Cost of revenues (excludes items below) | 4,906 | 4,956 | |||||||||||||||||||||
| LCM inventory valuation adjustment | 0 | 35 | |||||||||||||||||||||
| Depreciation and amortization | 2 | 99 | |||||||||||||||||||||
| Selling, general and administrative expenses | 73 | 79 | |||||||||||||||||||||
| Other taxes | 51 | 53 | |||||||||||||||||||||
| Total costs and expenses | 5,032 | 5,222 | |||||||||||||||||||||
| Income from operations | 307 | 338 | |||||||||||||||||||||
| Net interest and other financial costs | 4 | 6 | |||||||||||||||||||||
| Income before income taxes | 303 | 332 | |||||||||||||||||||||
| Provision for income taxes | 69 | 14 | |||||||||||||||||||||
| Income from discontinued operations, net of tax | $ | 234 | $ | 318 | |||||||||||||||||||
10
| (In millions) | March 31, 2021 | December 31, 2020 | |||||||||
| Assets | |||||||||||
| Cash and cash equivalents | $ | 134 | $ | 140 | |||||||
| Receivables | 244 | 217 | |||||||||
| Inventories | 417 | 438 | |||||||||
| Other current assets | 36 | 34 | |||||||||
| Equity method investments | 305 | 311 | |||||||||
| Property, plant and equipment, net | 4,885 | 4,784 | |||||||||
| Goodwill | 4,390 | 4,390 | |||||||||
| Right of use assets | 587 | 719 | |||||||||
| Other noncurrent assets | 169 | 168 | |||||||||
| Total assets classified as held for sale | $ | 11,167 | $ | 11,201 | |||||||
| Liabilities | |||||||||||
| Accounts payable | $ | 352 | $ | 300 | |||||||
| Payroll and benefits payable | 129 | 168 | |||||||||
| Accrued taxes | 160 | 178 | |||||||||
| Debt due within one year | 9 | 8 | |||||||||
| Operating lease liabilities | 77 | 94 | |||||||||
| Other current liabilities | 154 | 170 | |||||||||
| Long-term debt | 120 | 122 | |||||||||
| Defined benefit postretirement plan obligations | 27 | 25 | |||||||||
| Long-term operating lease liabilities | 486 | 598 | |||||||||
| Deferred credits and other liabilities | 78 | 86 | |||||||||
| Total liabilities classified as held for sale | $ | 1,592 | $ | 1,749 | |||||||
Separation Agreements
In connection with the definitive agreement to sell the Speedway business, we have agreed to enter into various 15-year fuel supply agreements, at closing, through which we will continue to supply fuel to Speedway subsequent to the sale to 7-Eleven. Due to our expected continuing involvement with Speedway through fuel supply agreements, intersegment sales from our Refining & Marketing segment to Speedway are no longer eliminated as intercompany transactions and are now presented within sales and other operating revenue.
Purchase of Speedway’s Interest in PFJ Southeast
During the fourth quarter of 2020, Pilot Travel Centers LLC exercised an option to purchase our 29 percent interest in PFJ Southeast LLC (“PFJ”), subject to customary closing conditions and the receipt of regulatory approvals. PFJ has been accounted for as an asset held for sale as of September 30, 2020 and is reported as the equity method investment balance in the above table.
4. MASTER LIMITED PARTNERSHIP
We own the general partner and a majority limited partner interest in MPLX, which owns and operates crude oil and light product transportation and logistics infrastructure as well as gathering, processing and fractionation assets. We control MPLX through our ownership of the general partner interest and, as of March 31, 20202021, we owned approximately 63 percent of the outstanding MPLX common units.
On July 30, 2019,December 23, 2020, MPLX entered into an agreement with a third party to sell all of its equity interests in MarkWest Javelina Company, L.L.C., MarkWest Javelina Pipeline Company, L.L.C. and MarkWest Gas Services, L.L.C. (collectively, “Javelina”). Javelina’s assets and liabilities have been presented within our consolidated balance sheets as assets and liabilities held for sale as of December 31, 2020. On February 12, 2021, MPLX completed the sale of Javelina.
11
Unit Repurchase Program
On November 2, 2020, MPLX announced its acquisitionboard authorized a unit repurchase program for the repurchase of Andeavor Logistics LP (“ANDX”), and ANDX survived as a wholly owned subsidiaryup to $1 billion of MPLX. At the effective time of the ANDX acquisition, each common unit held by ANDX’s public unitholders was converted into the right to receive 1.135 MPLX common units. ANDXMPLX’s outstanding common units held by MPC were converted into the right to receive 1.0328public.
During the three months ended March 31, 2021, 6,272,981 MPLX common units. Additionally, as a result of MPLX’s acquisition of ANDX, 600,000 ANDX preferred units were converted into 600,000 preferred units of MPLX (“Series B preferred units”). Series B preferred unitholders are entitled to receive, when and if declared by the board, a fixed distribution of $68.75had been repurchased at an average cost per unit per annum, payable semi-annuallyof $24.78. Total cash paid for units repurchased during the three months ended March 31, 2021 was $155 million. As of March 31, 2021, MPLX had agreements to acquire 291,400 additional common units for $7 million, which settled in arrears on February 15 and August 15, or the first business day thereafter, up to and including February 15, 2023. After February 15, 2023, the holdersearly April 2021. As of Series B preferred units are entitled to receive cumulative, quarterly distributions payable in arrearsMarch 31, 2021, $812 million remained outstanding on the 15th dayprogram for future purchases.
MPLX may utilize various methods to effect the repurchases, which could include open market repurchases, negotiated block transactions, tender offers, accelerated unit repurchases or open market solicitations for units, some of February, May, Augustwhich may be effected through Rule 10b5-1 plans. The timing and Novemberamount of each year,repurchases will depend upon several factors, including market and business conditions, and repurchases may be initiated, suspended or the first business day thereafter, based on a floating annual rate equal to the three month LIBOR plus 4.652 percent.discontinued at any time. The repurchase authorization has no expiration date.
We have various long-term, fee-based commercial agreements with MPLX. Under these agreements, MPLX provides transportation, storage, distribution and marketing services to us. With certain exceptions, these agreements generally contain minimum volume commitments. These transactions are eliminated in consolidation but are reflected as intersegment transactions between our Refining & Marketing and Midstream segments. We also have agreements with MPLX that establish fees for operational and management services provided between us and MPLX and for executive management services and certain general and administrative services provided by us to MPLX. These transactions are eliminated in consolidation but are reflected as intersegment transactions between our Corporate and Midstream segments.
Noncontrolling Interest
As a result of equity transactions of MPLX, and ANDX, we are required to adjust non-controlling interest and additional paid-in capital. Changes in MPC’s additional paid-in capital resulting from changes in its ownership interests in MPLX and ANDX were as follows:
| Three Months Ended March 31, | |||||||||||
| (In millions) | 2021 | 2020 | |||||||||
| Increase (decrease) due to issuance/(repurchase) of MPLX common units | $ | (35) | $ | 2 | |||||||
| Tax impact | 31 | (7) | |||||||||
| Decrease in MPC's additional paid-in capital, net of tax | $ | (4) | $ | (5) | |||||||
| Three Months Ended March 31, | |||||||
| (In millions) | 2020 | 2019 | |||||
| Increase due to the issuance of MPLX & ANDX common units | $ | 2 | $ | 4 | |||
| Tax impact | (7 | ) | (1 | ) | |||
| Increase (decrease) in MPC's additional paid-in capital, net of tax | $ | (5 | ) | $ | 3 | ||
The table below provides information related to the impairments recognized during the first quarter of 2020, andalong with the location of these impairments within the first quarter 2020 consolidated statementsstatement of income.
| Three Months Ended March 31, | ||||||||||||||
| (In millions) | Income Statement Line | 2020 | ||||||||||||
| Goodwill | Impairment expense | $ | 7,330 | |||||||||||
| Equity method investments | Income (loss) from equity method investments | 1,315 | ||||||||||||
| Long-lived assets | Impairment expense | 492 | ||||||||||||
| Total impairments | $ | 9,137 | ||||||||||||
| (In millions) | Income Statement Line | Impairment | ||
| Goodwill | Impairment expense | $ | 7,330 | |
| Equity method investments | Income (loss) from equity method investments | 1,315 | ||
| Long-lived assets | Impairment expense | 492 | ||
| Total impairments | $ | 9,137 | ||
12
Goodwill
During the first quarter of 2020, we recorded an impairment of goodwill. See the table below for detail by segment.goodwill of $7.33 billion. The $5.516 billion goodwill impairment within the Refining & Marketing segment was primarily driven by the effects of COVID-19 and the decline in commodity prices. The $1.814 billion impairment within the Midstream segment was primarily driven by additional guidanceinformation related to the slowing of drilling activity, which hashad reduced production growth forecasts from MPLX’s producer customers.
The fair valuevalues of the reporting units for the first quarter of 2020 goodwill impairment analysis waswere determined based on applying both a discounted cash flow method, or income approach, as well as a market approach. The discounted cash flow fair value estimate is based on known or knowable information at the measurement date. The significant assumptions that were used to develop the estimates of the fair values under the discounted cash flow method included management’s best estimates of the expected future results and discount rates, which range from 9.0 percent to 13.5 percent. Fair value determinations require considerable judgment and are sensitive to changes in underlying assumptions and factors. As a result, there can be no assurance that the estimates and assumptions made for purposes of the interim goodwill impairment test will prove to be an accurate prediction of the future. The fair value measurements for the individual reporting units’ overall fair values represent Level 3 measurements.
| (In millions) | Refining & Marketing | Retail | Midstream | Total | |||||||||||
| Balance at January 1, 2020 | $ | 5,572 | $ | 4,951 | $ | 9,517 | $ | 20,040 | |||||||
| Impairments | (5,516 | ) | — | (1,814 | ) | (7,330 | ) | ||||||||
| Transfers | (56 | ) | — | 56 | — | ||||||||||
| Balance at March 31, 2020 | $ | — | $ | 4,951 | $ | 7,759 | $ | 12,710 | |||||||
Equity Method Investments
During the first quarter of 2020, we recorded equity method investment impairment charges totaling $1.315 billion, of which $1.25 billion related to MarkWest Utica EMG, L.L.C. and its investment in Ohio Gathering Company, L.L.C. The impairments were largely due to a reduction in forecasted volumes gathered and processed by the systems operated by the joint ventures.equity method investments. The fair value of the investments was determined based upon applying the discounted cash flow method, which is an income approach. The discounted cash flow fair value estimate is based on known or knowable information at the interim measurement date. The significant assumptions that were used to develop the estimate of the fair value under the discounted cash flow method include management’s best estimates of the expected future cash flows, including prices and volumes, the weighted average cost of capital and the long-term growth rate. Fair value determinations require considerable judgment and are sensitive to changes in underlying assumptions and factors. As a result, there can be no assurance that the estimates and assumptions made for purposes of the impairment test will prove to be an accurate prediction of the future. The fair value of these equity method investments representsrepresent a Level 3 measurement.
Long-lived Assets
During the first quarter of 2020, we identified long-lived asset impairment triggers relating to all 16 of our refinery asset groups within the Refining & Marketing segment as a result of significant impactsdecreases to the Refining & Marketing segment forecastedexpected future cash flows. The cash flows associated with these assets were significantly impacted by the effects of COVID-19 and commodity price declines. We assessedperformed recoverability tests for each refinery asset group for impairment by comparing the undiscounted estimated pretax cash flows to the carrying value of each asset group. Of the 16 refinery asset groups, onlyOnly the Gallup refinery’s carrying value exceeded its undiscounted estimated pretax cash flows. All other refinery asset groups undiscounted estimated pretax cash flows exceeded the carrying value by at least 21 percent. The determination of undiscounted estimated pretax cash flows utilized significant assumptions including management’s best estimates of the expected future cash flows, allocation of certain Refining & Marketing segment cash flows to the individual refineries, the estimated useful lives of the asset groups, and the salvage values of the refineries. The determinations of expected future cash flows and the salvage values of refineries require considerable judgment and are sensitive to changes in underlying assumptions and factors. As a result, there can be no assurance that the estimates and assumptions made for purposes of our impairment analysis will prove to be an accurate prediction of the future. Should our assumptions significantly change in future periods, it is possible we may determine the carrying values of additional refinery asset groups exceed the undiscounted estimated pretax cash flows of their refinery asset groups, which would result in future impairment charges.
It was determined that the fair value of the Gallup refinery’s property, plant and equipment was less than the carrying value. As a result, we recorded a charge of $142 million in the first quarter of 2020 to impairment expense on the consolidated statements of income. The fair value measurements for the Gallup refinery assets represent Level 3 measurements.
During the first quarter of 2020, we identified an impairment trigger relating to asset groups within MPLX’s Western Gathering and Processing (“G&P&P”) reporting unit as a result of significant impactschanges to forecastedexpected future cash flows for these asset groups resulting from the effects of COVID-19. The cash flows associated with these assets were significantly impacted by volume declines reflecting decreased forecasted producer customer production as a result of lower commodity prices. We assessed each asset group within the Western G&P reporting unit for impairment. It was determined that the fair value of the East Texas G&P asset group’s underlying assets were less than the carrying value. As a result, MPLX recorded impairment charges totaling $350 million related to its property, plant and equipment and intangibles, which are included in impairment expense on our consolidated statements of income.
Fair valuevalues of property, plant and equipment waswere determined using a combination of an income and cost
Consolidated VIE
We control MPLX through our ownership of its general partner. MPLX is a VIE because the limited partners do not have substantive kick-out or substantive participating rights over the general partner. We are the primary beneficiary of MPLX because in addition to our significant economic interest, we also have the ability, through our ownership of the general partner, to control the decisions that most significantly impact MPLX. We therefore consolidate MPLX and record a noncontrolling interest for the interest owned by the public. We also record a redeemable noncontrolling interest related to MPLX’s Series A preferred units.
The creditors of MPLX do not have recourse to MPC’s general credit through guarantees or other financial arrangements, except as noted. MPC has effectively guaranteed certain indebtedness of LOOP LLC (“LOOP”) and LOCAP LLC (“LOCAP”), in which MPLX holds an interest. See Note 22 for more information. The assets of MPLX can only be used to settle their own obligations and their creditors have no recourse to our assets, except as noted earlier.
13
The following table presents balance sheet information for the assets and liabilities of MPLX, which are included in our balance sheets.
| (In millions) | March 31, 2021 | December 31, 2020 | |||||||||
| Assets | |||||||||||
| Cash and cash equivalents | $ | 24 | $ | 15 | |||||||
| Receivables, less allowance for doubtful accounts | 536 | 478 | |||||||||
| Inventories | 128 | 118 | |||||||||
| Other current assets | 49 | 67 | |||||||||
| Assets held for sale | 0 | 188 | |||||||||
| Equity method investments | 4,040 | 4,036 | |||||||||
| Property, plant and equipment, net | 21,205 | 21,418 | |||||||||
| Goodwill | 7,657 | 7,657 | |||||||||
| Right of use assets | 296 | 309 | |||||||||
| Other noncurrent assets | 991 | 1,006 | |||||||||
| Liabilities | |||||||||||
| Accounts payable | $ | 474 | $ | 468 | |||||||
| Payroll and benefits payable | 5 | 4 | |||||||||
| Accrued taxes | 67 | 76 | |||||||||
| Debt due within one year | 2 | 764 | |||||||||
| Operating lease liabilities | 63 | 63 | |||||||||
| Liabilities held for sale | 0 | 101 | |||||||||
| Other current liabilities | 274 | 297 | |||||||||
| Long-term debt | 20,052 | 19,375 | |||||||||
| Deferred income taxes | 11 | 12 | |||||||||
| Long-term operating lease liabilities | 230 | 244 | |||||||||
| Deferred credits and other liabilities | 451 | 437 | |||||||||
| (In millions) | March 31, 2020 | December 31, 2019 | |||||
| Assets | |||||||
| Cash and cash equivalents | $ | 57 | $ | 15 | |||
| Receivables, less allowance for doubtful accounts | 544 | 615 | |||||
| Inventories | 105 | 110 | |||||
| Other current assets | 45 | 110 | |||||
| Equity method investments | 3,992 | 5,275 | |||||
| Property, plant and equipment, net | 22,030 | 22,174 | |||||
| Goodwill | 7,722 | 9,536 | |||||
| Right of use assets | 352 | 365 | |||||
| Other noncurrent assets | 1,105 | 1,323 | |||||
| Liabilities | |||||||
| Accounts payable | $ | 521 | $ | 744 | |||
| Payroll and benefits payable | 1 | 5 | |||||
| Accrued taxes | 72 | 80 | |||||
| Debt due within one year | 4 | 9 | |||||
| Operating lease liabilities | 67 | 66 | |||||
| Other current liabilities | 268 | 259 | |||||
| Long-term debt | 20,467 | 19,704 | |||||
| Deferred income taxes | 11 | 12 | |||||
| Long-term operating lease liabilities | 284 | 302 | |||||
| Deferred credits and other liabilities | 422 | 409 | |||||
Transactions with related parties were as follows:
| Three Months Ended March 31, | |||||||
| (In millions) | 2020 | 2019 | |||||
| Sales to related parties | $ | 165 | $ | 186 | |||
| Purchases from related parties | 195 | 204 | |||||
| Three Months Ended March 31, | |||||||||||||||||||||||
| (In millions) | 2021 | 2020 | |||||||||||||||||||||
| Sales to related parties | $ | 43 | $ | 30 | |||||||||||||||||||
| Purchases from related parties | 203 | 195 | |||||||||||||||||||||
Sales to related parties, which are included in sales and other operating revenues, consist primarily of refined product sales to certain of refined products to PFJ Southeast, anour equity affiliate which owns and operates travel plazas primarily in the Southeast region of the United States.affiliates.
Purchases from related parties are included in cost of revenues. We obtain utilities, transportation services and purchase ethanol from certain of our equity affiliates.
We compute basic earnings (loss) per share by dividing net income (loss) attributable to MPC less income allocated to participating securities by the weighted average number of shares of common stock outstanding. Since MPC grants certain incentive compensation awards to employees and non-employee directors that are considered to be participating securities, we have calculated our earnings (loss) per share using the two-class method. Diluted income (loss) per share assumes exercise of certain stock-based compensation awards, provided the effect is not anti-dilutive.
| Three Months Ended March 31, | |||||||
| (In millions, except per share data) | 2020 | 2019 | |||||
| Basic loss per share: | |||||||
| Allocation of loss: | |||||||
| Net loss attributable to MPC | $ | (9,234 | ) | $ | (7 | ) | |
| Income allocated to participating securities | — | — | |||||
| Loss available to common stockholders – basic | $ | (9,234 | ) | $ | (7 | ) | |
| Weighted average common shares outstanding | 648 | 673 | |||||
| Basic loss per share | $ | (14.25 | ) | $ | (0.01 | ) | |
| Diluted loss per share: | |||||||
| Allocation of loss: | |||||||
| Net loss attributable to MPC | $ | (9,234 | ) | $ | (7 | ) | |
| Income allocated to participating securities | — | — | |||||
| Loss available to common stockholders – diluted | $ | (9,234 | ) | $ | (7 | ) | |
| Weighted average common shares outstanding | 648 | 673 | |||||
| Effect of dilutive securities | — | — | |||||
| Weighted average common shares, including dilutive effect | 648 | 673 | |||||
| Diluted loss per share | $ | (14.25 | ) | $ | (0.01 | ) | |
14
| Three Months Ended March 31, | |||||||||||||||||||||||
| (In millions, except per share data) | 2021 | 2020 | |||||||||||||||||||||
| Loss from continuing operations, net of tax | $ | (170) | $ | (10,536) | |||||||||||||||||||
| Less: Net income (loss) attributable to noncontrolling interest | 306 | (984) | |||||||||||||||||||||
| Net income allocated to participating securities | 0 | 0 | |||||||||||||||||||||
| Loss from continuing operations available to common stockholders | $ | (476) | $ | (9,552) | |||||||||||||||||||
| Income from discontinued operations, net of tax | 234 | 318 | |||||||||||||||||||||
| Loss available to common stockholders | $ | (242) | $ | (9,234) | |||||||||||||||||||
| Weighted average common shares outstanding: | |||||||||||||||||||||||
| Basic | 651 | 648 | |||||||||||||||||||||
| Effect of dilutive securities | 0 | 0 | |||||||||||||||||||||
| Diluted | 651 | 648 | |||||||||||||||||||||
| Income (loss) available to common stockholders per share: | |||||||||||||||||||||||
| Basic: | |||||||||||||||||||||||
| Continuing operations | $ | (0.73) | $ | (14.74) | |||||||||||||||||||
| Discontinued operations | 0.36 | 0.49 | |||||||||||||||||||||
| Net loss per share | $ | (0.37) | $ | (14.25) | |||||||||||||||||||
| Diluted: | |||||||||||||||||||||||
| Continuing operations | $ | (0.73) | $ | (14.74) | |||||||||||||||||||
| Discontinued operations | 0.36 | 0.49 | |||||||||||||||||||||
| Net loss per share | $ | (0.37) | $ | (14.25) | |||||||||||||||||||
The following table summarizes the shares that were anti-dilutive and, therefore, were excluded from the diluted share calculation.
| Three Months Ended March 31, | |||||
| (In millions) | 2020 | 2019 | |||
| Shares issuable under stock-based compensation plans | 10 | 7 | |||
| Three Months Ended March 31, | |||||||||||||||||||||||
| (In millions) | 2021 | 2020 | |||||||||||||||||||||
| Shares issuable under stock-based compensation plans | 10 | 10 | |||||||||||||||||||||
| Three Months Ended March 31, | |||||||
| (In millions, except per share data) | 2020 | 2019 | |||||
| Number of shares repurchased | — | 14 | |||||
| Cash paid for shares repurchased | $ | — | $ | 885 | |||
| Average cost per share | $ | — | $ | 62.98 | |||
9. SEGMENT INFORMATION
We have 32 reportable segments: Refining & Marketing Retail and Midstream. Each of these segments is organized and managed based upon the nature of the products and services it offers.
•Refining & Marketing – refines crude oil and other feedstocks at our refineries in the Gulf Coast, Mid-Continent and West Coast regions of the United States, purchases refined products and ethanol for resale and distributes refined products through transportation, storage, distribution and marketing services provided largely by our Midstream segment. We sell refined products to wholesale marketing customers domestically and internationally, to buyers on the spot market, to independent entrepreneurs who operate primarily Marathon® branded outlets, through long-term fuel supply contracts with direct dealers who operate locations mainly under the ARCO® brand and to approximately 3,800 Speedway locations.
• |
Midstream – transports, stores, distributes and markets crude oil and refined products principally for the Refining & Marketing segment via refining logistics assets, pipelines, terminals, towboats and barges; gathers, processes and transports natural gas; and gathers, transports, fractionates, stores and markets NGLs. The Midstream segment primarily reflects the results of MPLX.
15
Segment income represents income (loss) from operations attributable to the reportable segments. Corporate administrative expenses, except for those attributable to MPLX, and costs related to certain non-operating assets are not allocated to the Refining & Marketing and Retail segments.segment. In addition, certain items that affect comparability (as determined by the chief operating decision maker)maker (“CODM”)) are not allocated to the reportable segments. Assets by segment are not a measure used to assess the performance of the company by the CODM and thus are not reported in our disclosures.
| (In millions) | Refining & Marketing | Midstream | Total | ||||||||||||||
| Three Months Ended March 31, 2021 | |||||||||||||||||
| Revenues: | |||||||||||||||||
Third party(a) | $ | 21,661 | $ | 1,050 | $ | 22,711 | |||||||||||
| Intersegment | 28 | 1,199 | 1,227 | ||||||||||||||
| Segment revenues | $ | 21,689 | $ | 2,249 | $ | 23,938 | |||||||||||
| Segment income (loss) from operations | $ | (598) | $ | 972 | $ | 374 | |||||||||||
| Supplemental Data | |||||||||||||||||
Depreciation and amortization(b) | $ | 478 | $ | 334 | $ | 812 | |||||||||||
Capital expenditures and investments(c) | 134 | 138 | 272 | ||||||||||||||
| (In millions) | Refining & Marketing | Midstream | Total | ||||||||||||||
| Three Months Ended March 31, 2020 | |||||||||||||||||
| Revenues: | |||||||||||||||||
Third party(a) | $ | 21,284 | $ | 920 | $ | 22,204 | |||||||||||
| Intersegment | 25 | 1,241 | 1,266 | ||||||||||||||
| Segment revenues | $ | 21,309 | $ | 2,161 | $ | 23,470 | |||||||||||
| Segment income (loss) from operations | $ | (497) | $ | 905 | $ | 408 | |||||||||||
| Supplemental Data | |||||||||||||||||
Depreciation and amortization(b) | $ | 473 | $ | 345 | $ | 818 | |||||||||||
Capital expenditures and investments(c) | 470 | 474 | 944 | ||||||||||||||
(a)Includes Refining & Marketing sales to Speedway and related party sales. See Notes 3 and 7 for additional information.
(b)Differences between segment totals and MPC consolidated totals represent amounts related to corporate and other items not allocated to segments.
(c)Includes changes in capital expenditure accruals and investments in affiliates.
16
| (In millions) | Refining & Marketing | Retail | Midstream | Total | |||||||||||
| Three Months Ended March 31, 2020 | |||||||||||||||
| Revenues: | |||||||||||||||
Third party(a) | $ | 17,528 | $ | 6,769 | $ | 918 | $ | 25,215 | |||||||
| Intersegment | 3,617 | 2 | 1,242 | 4,861 | |||||||||||
| Segment revenues | $ | 21,145 | $ | 6,771 | $ | 2,160 | $ | 30,076 | |||||||
| Segment income (loss) from operations | $ | (622 | ) | $ | 519 | $ | 905 | $ | 802 | ||||||
| Supplemental Data | |||||||||||||||
Depreciation and amortization(b) | $ | 447 | $ | 125 | $ | 345 | $ | 917 | |||||||
Capital expenditures and investments(c) | 459 | 76 | 474 | 1,009 | |||||||||||
| (In millions) | Refining & Marketing | Retail | Midstream | Total | |||||||||||
| Three Months Ended March 31, 2019 | |||||||||||||||
| Revenues: | |||||||||||||||
Third party(a) | $ | 19,920 | $ | 7,376 | $ | 957 | $ | 28,253 | |||||||
| Intersegment | 4,416 | 2 | 1,232 | 5,650 | |||||||||||
| Segment revenues | $ | 24,336 | $ | 7,378 | $ | 2,189 | $ | 33,903 | |||||||
| Segment income (loss) from operations | $ | (334 | ) | $ | 170 | $ | 908 | $ | 744 | ||||||
| Supplemental Data | |||||||||||||||
Depreciation and amortization(b) | $ | 427 | $ | 126 | $ | 307 | $ | 860 | |||||||
Capital expenditures and investments(c) | 394 | 73 | 823 | 1,290 | |||||||||||
The following reconciles segment income from operations to income (loss) from continuing operations before income taxes as reported in the consolidated statements of income:
| Three Months Ended March 31, | |||||||||||||||||||||||
| (In millions) | 2021 | 2020 | |||||||||||||||||||||
| Segment income from operations | $ | 374 | $ | 408 | |||||||||||||||||||
Corporate(a) | (157) | (233) | |||||||||||||||||||||
| Items not allocated to segments: | |||||||||||||||||||||||
Transaction-related costs(b) | 0 | (8) | |||||||||||||||||||||
Impairments(c) | 0 | (9,137) | |||||||||||||||||||||
| LCM inventory valuation adjustment | 0 | (3,185) | |||||||||||||||||||||
| Income (loss) from continuing operations | 217 | (12,155) | |||||||||||||||||||||
| Net interest and other financial costs | 353 | 332 | |||||||||||||||||||||
| Loss from continuing operations before income taxes | $ | (136) | $ | (12,487) | |||||||||||||||||||
| Three Months Ended March 31, | |||||||
| (In millions) | 2020 | 2019 | |||||
| Segment income from operations | $ | 802 | $ | 744 | |||
| Items not allocated to segments: | |||||||
Corporate and other unallocated items(a) | (227 | ) | (191 | ) | |||
Equity method investment restructuring gain(b) | — | 207 | |||||
Transaction-related costs(c) | (35 | ) | (91 | ) | |||
Impairments(d) | (9,137 | ) | — | ||||
Inventory market valuation adjustment(e) | (3,220 | ) | — | ||||
| Income (loss) from operations | (11,817 | ) | 669 | ||||
| Net interest and other financial costs | 338 | 306 | |||||
| Income (loss) before income taxes | $ | (12,155 | ) | $ | 363 | ||
(b)Includes costs incurred in connection with the Midstream strategic review. Costs incurred in connection with the Speedway separation are included in discontinued operations. See Note 3. (c)Includes impairment of goodwill, equity method investments and long lived assets. See Note 5 for additional information. |
The following reconciles segment capital expenditures and investments to total capital expenditures:
| Three Months Ended March 31, | |||||||
| (In millions) | 2020 | 2019 | |||||
| Segment capital expenditures and investments | $ | 1,009 | $ | 1,290 | |||
| Less investments in equity method investees | 169 | 325 | |||||
| Plus items not allocated to segments: | |||||||
| Corporate | 27 | 10 | |||||
| Capitalized interest | 29 | 31 | |||||
Total capital expenditures(a) | $ | 896 | $ | 1,006 | |||
| Three Months Ended March 31, | |||||||||||||||||||||||
| (In millions) | 2021 | 2020 | |||||||||||||||||||||
| Segment capital expenditures and investments | $ | 272 | $ | 944 | |||||||||||||||||||
| Less investments in equity method investees | 51 | 169 | |||||||||||||||||||||
| Plus items not allocated to segments: | |||||||||||||||||||||||
| Corporate | 21 | 27 | |||||||||||||||||||||
| Capitalized interest | 14 | 29 | |||||||||||||||||||||
Total capital expenditures(a) | $ | 256 | $ | 831 | |||||||||||||||||||
(a)Includes changes in capital expenditure accruals. See Note 19 for a reconciliation of total capital expenditures to additions to property, plant and equipment for the three months ended March 31, 2021 and 2020 as reported in the consolidated statements of cash flows. |
10. NET INTEREST AND OTHER FINANCIAL COSTS
Net interest and other financial costs were as follows:
| Three Months Ended March 31, | |||||||||||||||||||||||
| (In millions) | 2021 | 2020 | |||||||||||||||||||||
| Interest income | $ | (1) | $ | (6) | |||||||||||||||||||
| Interest expense | 351 | 355 | |||||||||||||||||||||
| Interest capitalized | (17) | (37) | |||||||||||||||||||||
Pension and other postretirement non-service costs(a) | 0 | (3) | |||||||||||||||||||||
| Other financial costs | 20 | 23 | |||||||||||||||||||||
| Net interest and other financial costs | $ | 353 | $ | 332 | |||||||||||||||||||
(a)See Note 21.
| Three Months Ended March 31, | |||||||
| (In millions) | 2020 | 2019 | |||||
| Interest income | $ | (6 | ) | $ | (9 | ) | |
| Interest expense | 357 | 340 | |||||
| Interest capitalized | (36 | ) | (32 | ) | |||
Pension and other postretirement non-service credits(a) | (3 | ) | (3 | ) | |||
| Other financial costs | 26 | 10 | |||||
| Net interest and other financial costs | $ | 338 | $ | 306 | |||
17
11. INCOME TAXES
We recorded an overalla combined federal, state and foreign income tax benefitprovision of $1.9 billion$34 million for the three months ended March 31, 2020, of which $411 million was2021, primarily due to certain permanent tax differences related to income attributable to the expected NOL carryback provided for under the CARES Act. Thenoncontrolling interests, state taxes and unrecognized tax benefits. We recorded a combined federal, state and foreign income tax rate was 16 percentbenefit of $1,951 million for the three months ended March 31, 2020. Our effective tax benefit rate for the three months ended March 31, 2020 was lower than the U.S. statutory rate primarily due to a significant amount of our pre-tax loss consisting of non-tax deductible goodwill impairment charges, partially offset by a favorable rate effect of the CARES Act legislation.charges. Additionally, our effective tax rate is generally benefited by our noncontrolling interest in MPLX, but this benefit was lower for the three months ended March 31, 2020 compared to the three months ended March 31, 2019 due to impairment charges recorded by MPLX. We recorded an income tax receivable of $1.3 billion in other noncurrent assets to reflect our estimate
A reconciliation of the continuing operations tax benefit we will realize at the time of our 2020 tax return filing which is expected during the second half of 2021. A reconciliation ofprovision (benefit) in dollars as determined using the federal statutory income tax rate applied to income (loss) before income taxes to the provision (benefit) provision for income taxes follows:is shown in the table below.
| Three Months Ended March 31, | |||||||||||||||||||||||
| (In millions) | 2021 | 2020 | |||||||||||||||||||||
| Tax computed at statutory rate | $ | (29) | $ | (2,622) | |||||||||||||||||||
| State and local income taxes, net of federal income tax effects | 15 | (244) | |||||||||||||||||||||
| Goodwill impairment | 0 | 1,157 | |||||||||||||||||||||
| Noncontrolling interests | 31 | 101 | |||||||||||||||||||||
Legislation(a) | 0 | (343) | |||||||||||||||||||||
| Unrecognized tax benefits | 14 | 0 | |||||||||||||||||||||
| Other | 3 | 0 | |||||||||||||||||||||
| Total provision (benefit) for income tax from continuing operations | $ | 34 | $ | (1,951) | |||||||||||||||||||
| Three Months Ended March 31, | |||||
| 2020 | 2019 | ||||
| Statutory rate applied to income before income taxes | 21 | % | 21 | % | |
| State and local income taxes, net of federal income tax effects | 2 | 12 | |||
| Goodwill impairment | (10 | ) | — | ||
| Noncontrolling interests | (1 | ) | (4 | ) | |
| CARES Act legislation | 3 | — | |||
| Other | 1 | — | |||
| Effective tax rate | 16 | % | 29 | % | |
On March 27, 2020, the Coronavirus Aid, Relief, and Economic Security Act (“CARES Act”) was not materialenacted by Congress and signed into law by President Trump in response to any previous period.
12. INVENTORIES
| (In millions) | March 31, 2021 | December 31, 2020 | |||||||||
| Crude oil | $ | 2,715 | $ | 2,588 | |||||||
| Refined products | 4,786 | 4,478 | |||||||||
| Materials and supplies | 906 | 933 | |||||||||
| Total | $ | 8,407 | $ | 7,999 | |||||||
At March 31, 2020, market values for indemnification information.
| (In millions) | March 31, 2020 | December 31, 2019 | |||||
| Crude oil | $ | 3,717 | $ | 3,472 | |||
| Refined products | 5,700 | 5,548 | |||||
| Materials and supplies | 1,000 | 996 | |||||
| Merchandise | 248 | 227 | |||||
| Inventories before LCM inventory valuation reserve | 10,665 | 10,243 | |||||
| LCM inventory valuation reserve | (3,220 | ) | — | ||||
| Total | $ | 7,445 | $ | 10,243 | |||
Inventories are carried at the lower of cost or market value. Costs of crude oil and refined products are aggregated on a consolidated basis for purposes of assessing ifwhether the LIFO cost basis of these inventories may have to be written down to market values. At March 31, 2020, market values for these inventories were lower than their LIFO cost basis and, as a result, we recorded an inventory valuation charge of $3.22 billion to value these inventories at the lower of cost or market. Based on movements of refined product prices, future inventory valuation adjustments could have a negative or positive effect to earnings. Such losses are subject to reversal in subsequent periods if prices recover.
18
13. EQUITY METHOD INVESTMENTS
| Three Months Ended March 31, | |||||||
| (In millions) | 2020 | 2019 | |||||
| Revenues and other income | $ | 1,072 | $ | 1,628 | |||
| Income (loss) from operations | (20 | ) | 336 | ||||
| Net income (loss) | (44 | ) | 314 | ||||
| March 31, 2021 | December 31, 2020 | ||||||||||||||||||||||||||||||||||||||||
| (In millions) | Gross PP&E | Accumulated Depreciation | Net PP&E | Gross PP&E | Accumulated Depreciation | Net PP&E | |||||||||||||||||||||||||||||||||||
| Refining & Marketing | $ | 30,416 | $ | 13,679 | $ | 16,737 | $ | 30,306 | $ | 13,257 | $ | 17,049 | |||||||||||||||||||||||||||||
| Midstream | 27,758 | 6,508 | 21,250 | 27,677 | 6,217 | 21,460 | |||||||||||||||||||||||||||||||||||
| Corporate | 1,365 | 861 | 504 | 1,356 | 830 | 526 | |||||||||||||||||||||||||||||||||||
| Total | $ | 59,539 | $ | 21,048 | $ | 38,491 | $ | 59,339 | $ | 20,304 | $ | 39,035 | |||||||||||||||||||||||||||||
14. RESTRUCTURING
During the third quarter of 2020, we indefinitely idled our refinery located in Gallup, New Mexico and initiated actions to strategically reposition our Martinez, California refinery to a renewable diesel facility. We also approved an involuntary workforce reduction plan. In connection with these strategic actions, we recorded restructuring expenses of $367 million in 2020.
The indefinite idling of the Gallup refinery and actions to strategically reposition the Martinez refinery to a renewable diesel facility resulted in $195 million of restructuring expenses. Of the $195 million of restructuring expenses, we expect $130 million to settle in cash for costs related to decommissioning refinery processing units and storage tanks and fulfilling environmental remediation obligations. Additionally, we recorded a non-cash reserve against our materials and supplies inventory at these facilities of $51 million.
The involuntary workforce reduction plan, together with employee reductions resulting from our actions affecting the Gallup and Martinez refineries, affected approximately 2,050 employees. We recorded $172 million of restructuring expenses for separation benefits payable under our employee separation plan and certain collective bargaining agreements that we expect to settle in cash. Certain of the affected MPC employees provided services to MPLX. MPLX has various employee services agreements and secondment agreements with MPC pursuant to which MPLX reimburses MPC for employee costs, along with the provision of operational and management services in support of MPLX’s operations. Pursuant to such agreements, MPC was reimbursed by MPLX for $37 million of the $172 million of restructuring expenses recorded for these actions.
Restructuring expenses were accrued as restructuring reserves within accounts payable, payroll and benefits payable, other current liabilities and deferred credits and other liabilities within our consolidated balance sheets. We expect cash payments for the remaining exit and disposal costs reserve to occur through 2024.
| (In millions) | Employee separation costs | Exit and disposal costs | Total | |||||||||||||||||
Restructuring reserve balance at September 30, 2020(a) | $ | 158 | $ | 133 | $ | 291 | ||||||||||||||
| Adjustments | 14 | 5 | 19 | |||||||||||||||||
| Cash payments | (134) | (35) | (169) | |||||||||||||||||
| Restructuring reserve balance at December 31, 2020 | $ | 38 | $ | 103 | $ | 141 | ||||||||||||||
| Cash payments | (32) | (16) | (48) | |||||||||||||||||
| Restructuring reserve balance at March 31, 2021 | $ | 6 | $ | 87 | $ | 93 | ||||||||||||||
(a)The restructuring reserve was zero until the third quarter of 2020.
| (In millions) | March 31, 2020 | December 31, 2019 | |||||
| Refining & Marketing | $ | 29,511 | $ | 29,037 | |||
| Retail | 7,161 | 7,104 | |||||
| Midstream | 27,490 | 27,193 | |||||
| Corporate and Other | 1,308 | 1,289 | |||||
| Total | 65,470 | 64,623 | |||||
Less accumulated depreciation(a) | 20,137 | 19,008 | |||||
| Property, plant and equipment, net | $ | 45,333 | $ | 45,615 | |||
19
15. FAIR VALUE MEASUREMENTS
Fair Values—Recurring
The following tables present assets and liabilities accounted for at fair value on a recurring basis as of March 31, 20202021 and December 31, 20192020 by fair value hierarchy level. We have elected to offset the fair value amounts recognized for multiple derivative contracts executed with the same counterparty, including any related cash collateral as shown below; however, fair value amounts by hierarchy level are presented on a gross basis in the following tables.
| March 31, 2021 | |||||||||||||||||||||||||||||||||||
| Fair Value Hierarchy | |||||||||||||||||||||||||||||||||||
| (In millions) | Level 1 | Level 2 | Level 3 | Netting and Collateral(a) | Net Carrying Value on Balance Sheet(b) | Collateral Pledged Not Offset | |||||||||||||||||||||||||||||
| Assets: | |||||||||||||||||||||||||||||||||||
| Commodity contracts | $ | 247 | $ | 2 | $ | 0 | $ | (238) | $ | 11 | $ | 73 | |||||||||||||||||||||||
| Liabilities: | |||||||||||||||||||||||||||||||||||
| Commodity contracts | $ | 247 | $ | 2 | $ | 0 | $ | (249) | $ | 0 | $ | 0 | |||||||||||||||||||||||
| Embedded derivatives in commodity contracts | 0 | 0 | 66 | 0 | 66 | 0 | |||||||||||||||||||||||||||||
| March 31, 2020 | December 31, 2020 | |||||||||||||||||||||||||||||||||||||||||||||||||||||||||
| Fair Value Hierarchy | Fair Value Hierarchy | |||||||||||||||||||||||||||||||||||||||||||||||||||||||||
| (In millions) | Level 1 | Level 2 | Level 3 | Netting and Collateral(a) | Net Carrying Value on Balance Sheet(b) | Collateral Pledged Not Offset | (In millions) | Level 1 | Level 2 | Level 3 | Netting and Collateral(a) | Net Carrying Value on Balance Sheet(b) | Collateral Pledged Not Offset | |||||||||||||||||||||||||||||||||||||||||||||
| Assets: | Assets: | |||||||||||||||||||||||||||||||||||||||||||||||||||||||||
| Commodity contracts | $ | 754 | $ | 32 | $ | — | $ | (679 | ) | $ | 107 | $ | 7 | Commodity contracts | $ | 82 | $ | 6 | $ | 0 | $ | (80) | $ | 8 | $ | 31 | ||||||||||||||||||||||||||||||||
| Liabilities: | Liabilities: | |||||||||||||||||||||||||||||||||||||||||||||||||||||||||
| Commodity contracts | $ | 610 | $ | 19 | $ | — | $ | (628 | ) | $ | 1 | $ | — | Commodity contracts | $ | 81 | $ | 10 | $ | 0 | $ | (91) | $ | 0 | $ | 0 | ||||||||||||||||||||||||||||||||
| Embedded derivatives in commodity contracts | — | — | 45 | — | 45 | — | Embedded derivatives in commodity contracts | 0 | 0 | 63 | 0 | 63 | 0 | |||||||||||||||||||||||||||||||||||||||||||||
(a)Represents the impact of netting assets, liabilities and cash collateral when a legal right of offset exists. As of March 31, 2021, cash collateral of $11 million was netted with the mark-to-market derivative liabilities. As of December 31, 2020, cash collateral of $11 million was netted with mark-to-market derivative liabilities.
| December 31, 2019 | |||||||||||||||||||||||
| Fair Value Hierarchy | |||||||||||||||||||||||
| (In millions) | Level 1 | Level 2 | Level 3 | Netting and Collateral(a) | Net Carrying Value on Balance Sheet(b) | Collateral Pledged Not Offset | |||||||||||||||||
| Assets: | |||||||||||||||||||||||
| Commodity contracts | $ | 57 | $ | 6 | $ | — | $ | (55 | ) | $ | 8 | $ | 73 | ||||||||||
| Liabilities: | |||||||||||||||||||||||
| Commodity contracts | $ | 95 | $ | 11 | $ | — | $ | (106 | ) | $ | — | $ | — | ||||||||||
| Embedded derivatives in commodity contracts | — | — | 60 | — | 60 | — | |||||||||||||||||
Commodity derivatives in Level 1 are exchange-traded contracts for crude oil and refined products measured at fair value with a market approach using the close-of-day settlement prices for the market. Commodity derivatives are covered under master netting agreements with an unconditional right to offset. Collateral deposits in futures commission merchant accounts covered by master netting agreements related to Level 1 commodity derivatives are classified as Level 1 in the fair value hierarchy.
Level 2 instruments are valued based on quoted prices for similar assets and liabilities in active markets, and inputs other than quoted prices, such as liquidity, that are observable for the asset or liability. Commodity derivatives in Level 2 are OTC contracts, which are valued using market quotations from independent price reporting agencies, third-party brokers and commodity exchange price curves that are corroborated with market data.
Level 3 instruments are OTC NGL contracts andinclude embedded derivatives in commodity contracts. The embedded derivative liability relates to a natural gas purchase agreement embedded in a keep‑whole processing agreement. The fair value calculation for these Level 3 instruments at March 31, 20202021 used significant unobservable inputs including: (1) NGL prices interpolated and extrapolated due to inactive markets ranging from $0.26$0.48 to $0.68$1.36 per gallon with a weighted average of $0.39$0.62 per gallon per the current term of the embedded derivative and (2) the probability of renewal of 95100 percent for the first five-year term and 83.5 percent for the second five-yearfive-year term of the natural gas purchase agreement and the related keep-whole processing agreement. Increases or decreases in the fractionation spread result in an increase or decrease in the fair value of the embedded derivative liability. An increase in the probability of renewal would result in an increase in the fair value of the related embedded derivative liability. Beyond the embedded derivative discussed above, we had no outstanding commodity contracts as of March 31, 2020.
20
The following is a reconciliation of the beginning and ending balances recorded for net liabilities classified as Level 3 in the fair value hierarchy.
| Three Months Ended March 31, | |||||||
| (In millions) | 2020 | 2019 | |||||
| Beginning balance | $ | 60 | $ | 61 | |||
| Unrealized and realized (gains) losses included in net income | (14 | ) | 6 | ||||
| Settlements of derivative instruments | (1 | ) | (2 | ) | |||
| Ending balance | $ | 45 | $ | 65 | |||
| The amount of total (gains) losses for the period included in earnings attributable to the change in unrealized losses relating to assets still held at the end of period: | $ | (13 | ) | $ | 5 | ||
| Three Months Ended March 31, | |||||||||||||||||||||||
| (In millions) | 2021 | 2020 | |||||||||||||||||||||
| Beginning balance | $ | 63 | $ | 60 | |||||||||||||||||||
| Unrealized and realized (gains) losses included in net income | 6 | (14) | |||||||||||||||||||||
| Settlements of derivative instruments | (3) | (1) | |||||||||||||||||||||
| Ending balance | $ | 66 | $ | 45 | |||||||||||||||||||
| The amount of total losses/(gains) for the period included in earnings attributable to the change in unrealized losses/(gains) relating to assets still held at the end of period: | $ | 5 | $ | (13) | |||||||||||||||||||
Fair Values – Reported
We believe the carrying value of our other financial instruments, including cash and cash equivalents, receivables, accounts payable and certain accrued liabilities, approximate fair value. Our fair value assessment incorporates a variety of considerations, including the short-term duration of the instruments and the expected insignificance of bad debt expense, which includes an evaluation of counterparty credit risk. The borrowings under our revolving credit facilities, and term loan facility, which include variable interest rates, approximate fair value. The fair value of our fixed and floating rate long-term debt is based on prices from recent trade activity and is categorized in level 3 of the fair value hierarchy. The carrying and fair values of our debt were approximately $31.0$32.0 billion and $27.7$34.7 billion at March 31, 2020,2021, respectively, and approximately $28.3$31.1 billion and $30.1$34.9 billion at December 31, 2019,2020, respectively. These carrying and fair values of our debt exclude the unamortized issuance costs which are netted against our total debt.
16. DERIVATIVES
For further information regarding the fair value measurement of derivative instruments, including any effect of master netting agreements or collateral, see Note 15. We do not designate any of our commodity derivative instruments as hedges for accounting purposes.
Derivatives that are not designated as accounting hedges may include commodity derivatives used to hedge price risk on (1) inventories, (2) fixed price sales of refined products, (3) the acquisition of foreign-sourced crude oil, (4) the acquisition of ethanol for blending with refined products, (5) the sale of NGLs, and (6) the purchase of natural gas.gas and (7) the purchase of soybean oil.
The following table presents the fair value of derivative instruments as of March 31, 20202021 and December 31, 20192020 and the line items in the balance sheets in which the fair values are reflected. The fair value amounts below are presented on a gross basis and do not reflect the netting of asset and liability positions permitted under the terms of our master netting arrangements including cash collateral on deposit with, or received from, brokers. We offset the recognized fair value amounts for multiple derivative instruments executed with the same counterparty in our financial statements when a legal right of offset exists. As a result, the asset and liability amounts below will not agree with the amounts presented in our consolidated balance sheets.
| (In millions) | March 31, 2021 | December 31, 2020 | |||||||||||||||||||||
| Balance Sheet Location | Asset | Liability | Asset | Liability | |||||||||||||||||||
| Commodity derivatives | |||||||||||||||||||||||
| Other current assets | $ | 249 | $ | 249 | $ | 88 | $ | 91 | |||||||||||||||
Other current liabilities(a) | 0 | 10 | 0 | 7 | |||||||||||||||||||
Deferred credits and other liabilities(a) | 0 | 56 | 0 | 56 | |||||||||||||||||||
(a) Includes embedded derivatives.
21
| (In millions) | March 31, 2020 | ||||||
| Balance Sheet Location | Asset | Liability | |||||
| Commodity derivatives | |||||||
| Other current assets | $ | 786 | $ | 629 | |||
Other current liabilities(a) | — | 2 | |||||
Deferred credits and other liabilities(a) | — | 43 | |||||
| (In millions) | December 31, 2019 | ||||||
| Balance Sheet Location | Asset | Liability | |||||
| Commodity derivatives | |||||||
| Other current assets | $ | 63 | $ | 106 | |||
Other current liabilities(a) | — | 5 | |||||
Deferred credits and other liabilities(a) | — | 55 | |||||
The table below summarizes open commodity derivative contracts for crude oil, refined products and blending products as of March 31, 2020.2021.
| Percentage of contracts that expire next quarter | Position | ||||||||||||||||
| (Units in thousands of barrels) | Long | Short | |||||||||||||||
Exchange-traded(a) | |||||||||||||||||
| Crude oil | 81.8% | 36,471 | 43,279 | ||||||||||||||
| Refined products | 91.1% | 22,131 | 21,546 | ||||||||||||||
| Blending products | 96.4% | 5,080 | 3,033 | ||||||||||||||
| Soybean oil | 72.5% | 310 | 755 | ||||||||||||||
(a) Included in exchange-traded are spread contracts in thousands of barrels: Crude oil - 90 long and 830 short; Refined products - 1,900 long and 2,115 short; Blending products - 345 short
| Percentage of contracts that expire next quarter | Position | ||||||
| (Units in thousands of barrels) | Long | Short | |||||
Exchange-traded(a) | |||||||
| Crude oil | 94.8% | 29,202 | 46,121 | ||||
| Refined products | 84.3% | 20,370 | 16,960 | ||||
| Blending products | 100.0% | 3,581 | 3,359 | ||||
The following table summarizes the effect of all commodity derivative instruments in our consolidated statements of income:
| Gain (Loss) | |||||||||||||||||||||||
| (In millions) | Three Months Ended March 31, | ||||||||||||||||||||||
| Income Statement Location | 2021 | 2020 | |||||||||||||||||||||
| Sales and other operating revenues | $ | (10) | $ | 84 | |||||||||||||||||||
| Cost of revenues | (65) | 131 | |||||||||||||||||||||
| Total | $ | (75) | $ | 215 | |||||||||||||||||||
| Gain (Loss) | |||||||
| (In millions) | Three Months Ended March 31, | ||||||
| Income Statement Location | 2020 | 2019 | |||||
| Sales and other operating revenues | $ | 84 | $ | (20 | ) | ||
| Cost of revenues | 131 | (80 | ) | ||||
| Total | $ | 215 | $ | (100 | ) | ||
Our outstanding borrowings at March 31, 20202021 and December 31, 20192020 consisted of the following:
| (In millions) | March 31, 2021 | December 31, 2020 | |||||||||
| Marathon Petroleum Corporation: | |||||||||||
| Commercial paper | $ | 1,717 | $ | 1,024 | |||||||
| Bank revolving credit facility | 1,300 | 0 | |||||||||
| Senior notes | 8,849 | 9,849 | |||||||||
| Notes payable | 1 | 1 | |||||||||
| Finance lease obligations | 623 | 634 | |||||||||
| MPLX LP: | |||||||||||
| Bank revolving credit facility | 835 | 175 | |||||||||
| Senior notes | 19,600 | 20,350 | |||||||||
| Finance lease obligations | 10 | 11 | |||||||||
| Total debt | $ | 32,935 | $ | 32,044 | |||||||
| Unamortized debt issuance costs | (149) | (154) | |||||||||
| Unamortized (discount) premium, net | (306) | (306) | |||||||||
| Amounts due within one year | (1,786) | (2,854) | |||||||||
| Total long-term debt due after one year | $ | 30,694 | $ | 28,730 | |||||||
| (In millions) | March 31, 2020 | December 31, 2019 | |||||
| Marathon Petroleum Corporation: | |||||||
| Bank revolving credit facility | $ | 2,000 | $ | — | |||
| Senior notes | 8,474 | 8,474 | |||||
| Notes payable | 10 | 10 | |||||
| Finance lease obligations | 692 | 679 | |||||
| MPLX LP: | |||||||
| Bank revolving credit facility | 750 | — | |||||
| Term loan facility | 1,000 | 1,000 | |||||
| Senior notes | 19,100 | 19,100 | |||||
| Finance lease obligations | 14 | 19 | |||||
| Total debt | $ | 32,040 | $ | 29,282 | |||
| Unamortized debt issuance costs | (129 | ) | (134 | ) | |||
| Unamortized (discount) premium, net | (302 | ) | (310 | ) | |||
| Amounts due within one year | (1,710 | ) | (711 | ) | |||
| Total long-term debt due after one year | $ | 29,899 | $ | 28,127 | |||
22
Available Capacity under our Credit Facilities as of March 31, 20202021
| (Dollars in millions) | Total Capacity | Outstanding Borrowings | Outstanding Letters of Credit | Available Capacity | Weighted Average Interest Rate | Expiration | ||||||||||||||||||||||||||||||||
| MPC, excluding MPLX | ||||||||||||||||||||||||||||||||||||||
| MPC 364-day bank revolving credit facility | $ | 1,000 | $ | 0 | $ | 0 | $ | 1,000 | 0 | September 2021 | ||||||||||||||||||||||||||||
MPC bank revolving credit facility(a) | 5,000 | 1,300 | 1 | 3,699 | 1.35 | % | October 2023 | |||||||||||||||||||||||||||||||
MPC trade receivables securitization facility(b) | 750 | 0 | 0 | 750 | 0 | July 2021 | ||||||||||||||||||||||||||||||||
| MPLX | ||||||||||||||||||||||||||||||||||||||
MPLX bank revolving credit facility(c) | 3,500 | 835 | 0 | 2,665 | 1.35 | % | July 2024 | |||||||||||||||||||||||||||||||
| (Dollars in millions) | Total Capacity | Outstanding Borrowings | Outstanding Letters of Credit | Available Capacity | Weighted Average Interest Rate | Expiration | |||||||||||||||
| MPC 364-day bank revolving credit facility | $ | 1,000 | $ | — | $ | — | $ | 1,000 | — | September 2020 | |||||||||||
MPC bank revolving credit facility(a) | 5,000 | 2,000 | 1 | 2,999 | 1.89 | % | October 2023 | ||||||||||||||
MPC trade receivables securitization facility(b) | 750 | — | — | 750 | — | July 2021 | |||||||||||||||
MPLX bank revolving credit facility(c) | 3,500 | 750 | — | 2,750 | 1.94 | % | July 2024 | ||||||||||||||
(b) Borrowed $2.55 billion and repaid $2.55 billion during the three months ended March 31, 2021. Availability under our $750 million trade receivables facility is a function of eligible trade receivables, which will be lower in a sustained lower price environment for refined products.
(c) Borrowed $1.91 billion and repaid $1.25 billion during the three months ended March 31, 2021.
In February 2021, we elected to terminate our $1.0 billion unsecured 364-day revolving credit facility due in April 2021. This facility provided us with additional liquidity and financial flexibility during the then ongoing commodity price and demand downturn. There were no borrowings under this credit facility, and we determined that the incremental borrowing capacity of the facility was no longer necessary. We do not intend to replace this facility. We incurred no early termination fees as a result of the early termination of this credit agreement.
MPC Senior Notes
On March 1, 2021, we repaid the $1 billion outstanding aggregate principal amount of 5.125% senior notes due March 2021.
MPLX Senior Notes
On January 15, 2021, MPLX redeemed all the $750 million outstanding aggregate principal amount of 5.250% senior notes due January 2025, including the portion of such notes issued by ANDX, at a price equal to 102.625% of the principal amount.
18. REVENUE
The following table presents our revenues disaggregated by segment and product line.
| (In millions) | Refining & Marketing | Retail | Midstream | Total | |||||||||||
| Three Months Ended March 31, 2020 | |||||||||||||||
| Refined products | $ | 16,539 | $ | 5,289 | $ | 169 | $ | 21,997 | |||||||
| Merchandise | 1 | 1,456 | — | 1,457 | |||||||||||
| Crude oil | 875 | — | — | 875 | |||||||||||
| Midstream services and other | 113 | 24 | 749 | 886 | |||||||||||
| Sales and other operating revenues | $ | 17,528 | $ | 6,769 | $ | 918 | $ | 25,215 | |||||||
| (In millions) | Refining & Marketing | Retail | Midstream | Total | |||||||||||
| Three Months Ended March 31, 2019 | |||||||||||||||
| Refined products | $ | 18,750 | $ | 5,947 | $ | 216 | $ | 24,913 | |||||||
| Merchandise | 1 | 1,409 | — | 1,410 | |||||||||||
| Crude oil | 1,071 | — | — | 1,071 | |||||||||||
| Midstream services and other | 98 | 20 | 741 | 859 | |||||||||||
| Sales and other operating revenues | $ | 19,920 | $ | 7,376 | $ | 957 | $ | 28,253 | |||||||
| (In millions) | Refining & Marketing | Midstream | Total | ||||||||||||||
| Three Months Ended March 31, 2021 | |||||||||||||||||
| Refined products | $ | 19,809 | $ | 282 | $ | 20,091 | |||||||||||
| Crude oil | 1,446 | 0 | 1,446 | ||||||||||||||
| Midstream services and other | 406 | 768 | 1,174 | ||||||||||||||
| Sales and other operating revenues | $ | 21,661 | $ | 1,050 | $ | 22,711 | |||||||||||
| (In millions) | Refining & Marketing | Midstream | Total | ||||||||||||||
| Three Months Ended March 31, 2020 | |||||||||||||||||
| Refined products | $ | 20,269 | $ | 171 | $ | 20,440 | |||||||||||
| Crude oil | 875 | 0 | 875 | ||||||||||||||
| Midstream services and other | 140 | 749 | 889 | ||||||||||||||
| Sales and other operating revenues | $ | 21,284 | $ | 920 | $ | 22,204 | |||||||||||
We do not disclose information on the future performance obligations for any contract with expected duration of one year or less at inception. As of March 31, 2020,2021, we do not have future performance obligations that are material to future periods.
23
Receivables
On the accompanying consolidated balance sheets, receivables, less allowance for doubtful accounts primarily consists of customer receivables. Significant, non-customer balances included in our receivables at March 31, 20202021 include matching buy/sell receivables of $2.33$2.99 billion.
19. SUPPLEMENTAL CASH FLOW INFORMATION
| Three Months Ended March 31, | |||||||
| (In millions) | 2020 | 2019 | |||||
| Net cash provided by operating activities included: | |||||||
| Interest paid (net of amounts capitalized) | $ | 303 | $ | 269 | |||
| Net income taxes paid to taxing authorities | (9 | ) | 42 | ||||
| Non-cash investing and financing activities: | |||||||
Contribution of assets(a) | — | 143 | |||||
Fair value of assets acquired(b) | — | 350 | |||||
| Three Months Ended March 31, | |||||||||||
| (In millions) | 2021 | 2020 | |||||||||
| Net cash provided by operating activities included: | |||||||||||
| Interest paid (net of amounts capitalized) | $ | 336 | $ | 300 | |||||||
| Net income taxes paid to (received from) taxing authorities | 1 | (9) | |||||||||
| (In millions) | March 31, 2021 | December 31, 2020 | |||||||||
Cash and cash equivalents(a) | $ | 624 | $ | 415 | |||||||
Restricted cash(b) | 1 | 1 | |||||||||
| Cash, cash equivalents and restricted cash | $ | 625 | $ | 416 | |||||||
(a) Excludes $134 million and $140 million of cash included in assets held for sale representing Speedway store cash.
| (In millions) | March 31, 2020 | December 31, 2019 | |||||
| Cash and cash equivalents | $ | 1,690 | $ | 1,527 | |||
Restricted cash(a) | 4 | 2 | |||||
| Cash, cash equivalents and restricted cash | $ | 1,694 | $ | 1,529 | |||
The consolidated statements of cash flows exclude changes to the consolidated balance sheets that did not affect cash. The following is a reconciliation of additions to property, plant and equipment to total capital expenditures:
| Three Months Ended March 31, | |||||||
| (In millions) | 2020 | 2019 | |||||
| Additions to property, plant and equipment per the consolidated statements of cash flows | $ | 1,062 | $ | 1,241 | |||
| Decrease in capital accruals | (166 | ) | (235 | ) | |||
| Total capital expenditures | $ | 896 | $ | 1,006 | |||
| Three Months Ended March 31, | |||||||||||
| (In millions) | 2021 | 2020 | |||||||||
| Additions to property, plant and equipment per the consolidated statements of cash flows | $ | 304 | $ | 951 | |||||||
| Decrease in capital accruals | (48) | (120) | |||||||||
| Total capital expenditures | $ | 256 | $ | 831 | |||||||
20. ACCUMULATED OTHER COMPREHENSIVE LOSS
The following table shows the changes in accumulated other comprehensive loss by component. Amounts in parentheses indicate debits.
| (In millions) | Pension Benefits | Other Benefits | Gain on Cash Flow Hedge | Workers Compensation | Total | ||||||||||||||||||||||||
| Balance as of December 31, 2019 | $ | (212) | $ | (116) | $ | 1 | $ | 7 | $ | (320) | |||||||||||||||||||
| Other comprehensive loss before reclassifications, net of tax of $(1) | (2) | (2) | 0 | 0 | (4) | ||||||||||||||||||||||||
| Amounts reclassified from accumulated other comprehensive loss: | |||||||||||||||||||||||||||||
Amortization – prior service credit(a) | (11) | 0 | — | — | (11) | ||||||||||||||||||||||||
– actuarial loss(a) | 8 | 1 | — | — | 9 | ||||||||||||||||||||||||
– settlement loss(a) | 0 | 0 | — | — | 0 | ||||||||||||||||||||||||
| Other | — | — | — | (1) | (1) | ||||||||||||||||||||||||
| Tax effect | 1 | 0 | 0 | 0 | 1 | ||||||||||||||||||||||||
| Other comprehensive loss | (4) | (1) | 0 | (1) | (6) | ||||||||||||||||||||||||
| Balance as of March 31, 2020 | $ | (216) | $ | (117) | $ | 1 | $ | 6 | $ | (326) | |||||||||||||||||||
24
| (In millions) | Pension Benefits | Other Benefits | Gain on Cash Flow Hedge | Workers Compensation | Total | ||||||||||||||
| Balance as of December 31, 2018 | $ | (132 | ) | $ | (23 | ) | $ | 2 | $ | 9 | $ | (144 | ) | ||||||
| Other comprehensive loss before reclassifications, net of tax of $0 | (1 | ) | — | — | — | (1 | ) | ||||||||||||
| Amounts reclassified from accumulated other comprehensive loss: | |||||||||||||||||||
Amortization – prior service credit(a) | (11 | ) | — | — | — | (11 | ) | ||||||||||||
– actuarial loss(a) | 4 | — | — | — | 4 | ||||||||||||||
– settlement loss(a) | — | — | — | — | — | ||||||||||||||
| Other | — | — | — | (1 | ) | (1 | ) | ||||||||||||
| Tax effect | 2 | — | — | — | 2 | ||||||||||||||
| Other comprehensive loss | (6 | ) | — | — | (1 | ) | (7 | ) | |||||||||||
| Balance as of March 31, 2019 | $ | (138 | ) | $ | (23 | ) | $ | 2 | $ | 8 | $ | (151 | ) | ||||||
| (In millions) | Pension Benefits | Other Benefits | Gain on Cash Flow Hedge | Workers Compensation | Total | ||||||||||||||
| Balance as of December 31, 2019 | $ | (212 | ) | $ | (116 | ) | $ | 1 | $ | 7 | $ | (320 | ) | ||||||
| Other comprehensive loss before reclassifications, net of tax of ($1) | (2 | ) | (2 | ) | — | — | (4 | ) | |||||||||||
| Amounts reclassified from accumulated other comprehensive loss: | |||||||||||||||||||
Amortization – prior service credit(a) | (11 | ) | — | — | — | (11 | ) | ||||||||||||
– actuarial loss(a) | 8 | 1 | — | — | 9 | ||||||||||||||
– settlement loss(a) | — | — | — | — | — | ||||||||||||||
| Other | — | — | — | (1 | ) | (1 | ) | ||||||||||||
| Tax effect | 1 | — | — | — | 1 | ||||||||||||||
| Other comprehensive loss | (4 | ) | (1 | ) | — | (1 | ) | (6 | ) | ||||||||||
| Balance as of March 31, 2020 | $ | (216 | ) | $ | (117 | ) | $ | 1 | $ | 6 | $ | (326 | ) | ||||||
| (In millions) | Pension Benefits | Other Benefits | Gain on Cash Flow Hedge | Workers Compensation | Total | ||||||||||||||||||||||||
| Balance as of December 31, 2020 | $ | (338) | $ | (181) | $ | 1 | $ | 6 | $ | (512) | |||||||||||||||||||
| Other comprehensive loss before reclassifications, net of tax of $0 | (2) | 0 | 0 | 0 | (2) | ||||||||||||||||||||||||
| Amounts reclassified from accumulated other comprehensive loss: | |||||||||||||||||||||||||||||
Amortization – prior service credit(a) | (11) | 1 | — | — | (10) | ||||||||||||||||||||||||
– actuarial loss(a) | 12 | 2 | — | — | 14 | ||||||||||||||||||||||||
– settlement loss(a) | 0 | 0 | — | — | 0 | ||||||||||||||||||||||||
| Other | — | — | — | (1) | (1) | ||||||||||||||||||||||||
| Tax effect | (1) | 0 | 0 | 1 | 0 | ||||||||||||||||||||||||
| Other comprehensive income (loss) | (2) | 3 | 0 | 0 | 1 | ||||||||||||||||||||||||
| Balance as of March 31, 2021 | $ | (340) | $ | (178) | $ | 1 | $ | 6 | $ | (511) | |||||||||||||||||||
(a)These accumulated other comprehensive loss components are included in the computation of net periodic benefit cost. See Note 21.
21. PENSION AND OTHER POSTRETIREMENT BENEFITS
The following summarizes the components of net periodic benefit costs:
| Three Months Ended March 31, | |||||||||||||||
| Pension Benefits | Other Benefits | ||||||||||||||
| (In millions) | 2020 | 2019 | 2020 | 2019 | |||||||||||
| Components of net periodic benefit cost: | |||||||||||||||
| Service cost | $ | 69 | $ | 58 | $ | 9 | $ | 8 | |||||||
| Interest cost | 25 | 28 | 8 | 9 | |||||||||||
| Expected return on plan assets | (34 | ) | (32 | ) | — | — | |||||||||
| Amortization – prior service credit | (11 | ) | (11 | ) | — | — | |||||||||
| – actuarial loss | 8 | 4 | 1 | — | |||||||||||
| – settlement loss | — | — | — | — | |||||||||||
| Net periodic benefit cost | $ | 57 | $ | 47 | $ | 18 | $ | 17 | |||||||
| Three Months Ended March 31, | |||||||||||||||||||||||
| Pension Benefits | Other Benefits | ||||||||||||||||||||||
| (In millions) | 2021 | 2020 | 2021 | 2020 | |||||||||||||||||||
| Components of net periodic benefit cost: | |||||||||||||||||||||||
| Service cost | $ | 76 | $ | 63 | $ | 10 | $ | 9 | |||||||||||||||
| Interest cost | 23 | 25 | 7 | 8 | |||||||||||||||||||
| Expected return on plan assets | (33) | (34) | 0 | 0 | |||||||||||||||||||
| Amortization – prior service credit | (11) | (11) | 1 | 0 | |||||||||||||||||||
| – actuarial loss | 11 | 8 | 2 | 1 | |||||||||||||||||||
| – settlement loss | 0 | 0 | 0 | 0 | |||||||||||||||||||
| Net periodic benefit cost | $ | 66 | $ | 51 | $ | 20 | $ | 18 | |||||||||||||||
The components of net periodic benefit cost other than the service cost component are included in net interest and other financial costs on the consolidated statements of income.
During the three months ended March 31, 2020,2021, we made contributions of $3$226 million to our funded pension plans. Benefit payments related to unfunded pension and other postretirement benefit plans were $6$10 million and $11$12 million, respectively, during the three months ended March 31, 2020.2021.
22. COMMITMENTS AND CONTINGENCIES
We are the subject of, or a party to, a number of pending or threatened legal actions, contingencies and commitments involving a variety of matters, including laws and regulations relating to the environment. Some of these matters are discussed below. For matters for which we have not recorded a liability, we are unable to estimate a range of possible loss because the issues involved have not been fully developed through pleadings, discovery or court proceedings. However, the ultimate resolution of some of these contingencies could, individually or in the aggregate, be material.
Environmental Matters
We are subject to federal, state, local and foreign laws and regulations relating to the environment. These laws generally provide for control of pollutants released into the environment and require responsible parties to undertake remediation of hazardous waste disposal sites and certain other locations including presently or formerly owned or operated retail marketing sites. Penalties may be imposed for noncompliance.
At March 31, 20202021 and December 31, 2019,2020, accrued liabilities for remediation totaled $418$393 million and $433$397 million, respectively. It is not presently possible to estimate the ultimate amount of all remediation costs that might be incurred or the penalties, if any, that may be imposed. Receivables for recoverable costs from certain states, under programs to assist companies in clean-up efforts related to underground storage tanks at presently or formerly owned or operated retail marketing sites, were $29$6 million and $29$7 million at March 31, 20202021 and December 31, 2019,2020, respectively.
Governmental and other entities in California, Hawaii, Maryland, New York and Rhode Islandvarious states have filed lawsuits against coal, gas, oil and petroleumenergy companies, including the Company.MPC. The lawsuits allege damages as a result of climate change and the plaintiffs are seeking unspecified damages and abatement under various tort theories. We are currently subject to such proceedings in federal or state courts in California, Delaware, Maryland, Hawaii, Rhode Island and South Carolina. Similar lawsuits may be filed in other jurisdictions. At this early stage, the ultimate outcome of these matters remainsremain uncertain, and neither the likelihood of an unfavorable outcome nor the ultimate liability, if any, can be determined.
We are involved in a number of environmental enforcement matters arising in the ordinary course of business. While the outcome and impact on us cannot be predicted with certainty, management believes the resolution of these environmental matters will not, individually or collectively, have a material adverse effect on our consolidated results of operations, financial position or cash flows.
Other LawsuitsLegal Proceedings
In May 2015,early July 2020, Tesoro High Plains Pipeline Company, LLC (“THPP”), a subsidiary of MPLX, received a Notification of Trespass Determination from the Kentucky attorney generalBureau of Indian Affairs (“BIA”) relating to a portion of the Tesoro High Plains Pipeline that crosses the Fort Berthold Reservation in North Dakota. The notification covered the rights of way for 23 tracts of land and demanded the immediate cessation of pipeline operations. The notification also assessed trespass damages of approximately $187 million. THPP appealed this determination, which triggered an automatic stay of the requested pipeline shutdown and payment. On October 29, the Assistant Secretary - Indian Affairs issued an order vacating the BIA’s trespass order and requiring the Regional Director for the BIA Great Plains Region to issue a new decision on or before December 15 covering all 34 tracts at issue. On December 15, the Regional Director of the BIA issued a new trespass notice to THPP consistent with the Assistant Secretary - Indian Affairs order vacating the prior trespass order. The new order found that THPP was in trespass and assessed trespass damages of approximately $4 million (including interest), which has been paid. The order also required THPP to immediately cease and desist use of the portion of the pipeline that crosses the property at issue. THPP has complied with the Regional Director’s December 15, 2020 notice. On February 12, 2021, landowners filed a lawsuit against our wholly owned subsidiary, Marathon Petroleum Company LP (“MPC LP”),suit in the United StatesU.S. District Court for the Western District of Kentucky asserting claims under federalNorth Dakota (the “District of North Dakota”) against THPP, the Department of the Interior, the Assistant Secretary - Indian Affairs, the Interior Board of Indian Appeals and state antitrust statutes, the Kentucky Consumer Protection Act,BIA, requesting, among other things, that decisions by the Assistant Secretary - Indian Affairs and state common law.the Interior Board of Indian Appeals be vacated as to the award of damages to plaintiffs. In March 2021, THPP received a copy of an order purporting to vacate all orders related to THPP’s alleged trespass issued by the BIA between July 2, 2020 and January 14, 2021. The complaint, as amendedorder directs the Regional Director of the BIA to reconsider the issue of THPP’s alleged trespass and issue a new order, if necessary, after all interested parties have had an opportunity to be heard. Subsequently, landowners voluntarily dismissed the suit filed in July 2015, alleges that MPC LP used deed restrictions, supply agreementsthe District of North Dakota. On April 23, 2021, THPP filed a lawsuit in the District of North Dakota against the United States of America, the U.S. Department of the Interior and the BIA challenging the March order purporting to vacate all previous orders related to THPP’s alleged trespass.
MPLX continues to work towards a settlement of this matter with customers and exchange agreements with competitors to unreasonably restrain trade in areas within Kentucky and seeks declaratory relief, unspecified damages, civil penalties, restitution and disgorgementholders of profits. At this stage,the property rights at issue. Management does not believe the ultimate outcomeresolution of this litigation remains uncertain, and neither the likelihoodmatter will have a material adverse effect on our consolidated financial position, results of an unfavorable outcome nor the ultimate liability, if any, can be determined, and we are unable to estimate a reasonably possible loss (or range of loss) for this matter. We intend to vigorously defend ourselves in this matter.operations, or cash flows.
We are also a party to a number of other lawsuits and other proceedings arising in the ordinary course of business. While the ultimate outcome and impact to us cannot be predicted with certainty, we believe that the resolution of these other lawsuits and proceedings will not have a material adverse effect on our consolidated financial position, results of operations or cash flows.
Guarantees
We have provided certain guarantees, direct and indirect, of the indebtedness of other companies. Under the terms of most of these guarantee arrangements, we would be required to perform should the guaranteed party fail to fulfill its obligations under the specified arrangements. In addition to these financial guarantees, we also have various performance guarantees related to specific agreements.
Guarantees related to indebtedness of equity method investees—
LOOP and LOCAP
MPC and MPLX hold interests in an offshore oil port, LOOP, and MPLX holds an interest in a crude oil pipeline system, LOCAP. Both LOOP and LOCAP have secured various project financings with throughput and deficiency agreements. Under
26
the agreements, MPC, as a shipper, is required to advance funds if the investees are unable to service their debt. Any such advances are considered prepayments of future transportation charges. The duration of the agreements varies but tends to follow the terms of the underlying debt, which extend through 2037. Our maximum potential undiscounted payments under these agreements for the debt principal totaled $171 million as of March 31, 2020.2021.
In connection with MPLX’s 9.19 percent indirect interest in a joint venture (“Dakota Access”) that owns and operates the Dakota Access Pipeline and Energy Transfer Crude Oil Pipeline projects, collectively referred to as the Bakken Pipeline system, MPLX has entered into a Contingent Equity Contribution Agreement. MPLX, along with the other joint venture owners in the Bakken Pipeline system, havehas agreed to make equity contributions to the joint venture upon certain events occurring to allow the entities that own and operate the Bakken Pipeline system to satisfy their senior note payment obligations. The senior notes were issued to repay amounts owed by the pipeline companies to fund the cost of construction of the Bakken Pipeline system.
In March 2020, the U.S. District Court for the District of Columbia (the “D.D.C.”) ordered the U.S. Army Corps of Engineers (“Army Corps”), which granted permits and an easement for the Bakken Pipeline system, to conduct a full environmental impact statement (“EIS”), and further requested briefing on whether an easement permit necessary for the operation of the Bakken Pipeline system should be vacated while the EIS is being prepared.
On July 6, 2020, the D.D.C. ordered vacatur of the easement to cross Lake Oahe during the pendency of an EIS and further ordered a shut down of the pipeline by August 5, 2020. The D.D.C. denied a motion to stay that order. Dakota Access and the Army Corps appealed the D.D.C.’s orders to the U.S. Court of Appeals for the District of Columbia Circuit (the “Court of Appeals”). On July 14, 2020, the Court of Appeals issued an administrative stay while the court considered Dakota Access and the Army Corps’ emergency motion for stay pending appeal. On August 5, 2020, the Court of Appeals stayed the D.D.C.’s injunction that required the pipeline be shutdown and emptied of oil by August 5, 2020. The Court of Appeals denied a stay of the D.D.C.’s March order, which required the EIS, and further denied a stay of the D.D.C.’s July order, which vacated the easement. On January 26, 2021, the Court of Appeals upheld the D.D.C.’s order vacating the easement while the Army Corps prepares the EIS. The Court of Appeals reversed the D.D.C.’s order to the extent it directed that the pipeline be shutdown and emptied of oil. In the D.D.C., briefing has been completed for a renewed request for an injunction. The pipeline remains operational.
If the permitpipeline is vacatedtemporarily shut down pending completion of the EIS, and the vacatur is deemed temporary, MPLX would have to contribute its 9.19 percent pro rata share of funds required to pay interest accruing on the notes and any portion of the principal that matures while the pipeline is shutdown andshutdown. It is expected that MPLX would contribute its 9.19 percent pro rata share of any costs to remediate any deficiencies to reinstate the permit and/or return the pipeline into operation. If the court vacatesvacatur of the easement permit and such action results in a permanent shutdown of the pipeline, MPLX would have to contribute its 9.19 percent pro rata share of the cost to redeem the bonds (including the one percent redemption premium required pursuant to the indenture governing the notes) and any accrued and unpaid interest, if any.interest. As of March 31, 2020,2021, our maximum potential undiscounted payments under the Contingent Equity Contribution Agreement waswere approximately $230 million.
Crowley Ocean Partners LLC and Crowley Blue Water Partners LLC
In connection with our 50 percent indirect interest in Crowley Ocean Partners LLC, we have agreed to conditionally guarantee our portion of the obligations of the joint venture and its subsidiaries under a senior secured term loan agreement. The term loan agreement provides for loans of up to $325 million to finance the acquisition of four product tankers. MPC’s liability under the guarantee for each vessel is conditioned upon the occurrence of certain events, including if we cease to maintain an investment grade credit rating or the charter for the relevant product tanker ceases to be in effect and is not replaced by a charter with an investment grade company on certain defined commercial terms. As of March 31, 2020,2021, our maximum potential undiscounted payments under this agreement for debt principal totaled $125$114 million.
In connection with our 50 percent indirect interest in Crowley Blue Water Partners LLC, we have agreed to provide a conditional guarantee of up to 50 percent of its outstanding debt balance in the event there is no charter agreement in place with an investment grade customer for the entity’s three vessels as well as other financial support in certain circumstances. As of March 31, 2020,2021, our maximum potential undiscounted payments under this arrangement was $118$111 million.
Other guarantees—
We have entered into other guarantees with maximum potential undiscounted payments totaling $103$99 million as of March 31, 2020,2021, which primarily consist of a commitment to contribute cash to an equity method investee for certain catastrophic events, in lieu of procuring insurance coverage, a commitment to fund a share of the bonds issued by a government entity for construction of public utilities in the event that other industrial users of the facility default on their utility payments and leases of assets containing general lease indemnities and guaranteed residual values.
27
Contractual Commitments and Contingencies
At March 31, 2020,2021, our contractual commitments to acquire property, plant and equipment and advance funds to equity method investees totaled $626$396 million.
Certain natural gas processing and gathering arrangements require us to construct natural gas processing plants, natural gas gathering pipelines and NGL pipelines and contain certain fees and charges if specified construction milestones are not achieved for reasons other than force majeure. In certain cases, certain producer customers may have the right to cancel the processing arrangements with us if there are significant delays that are not due to force majeure.
28
| (Dollars in millions) | Total Capacity | Outstanding Borrowings | Outstanding Letters of Credit | Available Capacity | Expiration | |||||||||||||
| MPC 364-day bank revolving credit facility | $ | 1,000 | $ | — | $ | — | $ | 1,000 | September 2020 | |||||||||
| MPC 364-day bank revolving credit facility | 1,000 | — | — | 1,000 | April 2021 | |||||||||||||
MPC bank revolving credit facility(a) | 5,000 | 750 | 1 | 4,249 | October 2023 | |||||||||||||
MPC trade receivables securitization facility(b) | 517 | — | — | 517 | July 2021 | |||||||||||||
| Available capacity, excluding MPLX, as of May 5, 2020 | 6,766 | |||||||||||||||||
ITEM 2. MANAGEMENT’S DISCUSSION AND ANALYSIS OF FINANCIAL CONDITION AND RESULTS OF OPERATIONS
This section should also be read in conjunction with the unaudited consolidated financial statements and accompanying footnotes included under Item 1. Financial Statements and in conjunction with our Annual Report on Form 10-K for the year ended December 31, 2019.2020.
Disclosures Regarding Forward-Looking Statements
This Quarterly Report on Form 10-Q, particularly Management’s Discussion and Analysis of Financial Condition and Results of Operations and Quantitative and Qualitative Disclosures about Market Risk, includes forward-looking statements that are subject to risks, contingencies or uncertainties. You can identify forward-looking statements by words such as “anticipate,” “believe,” “commitment,” “could,” “design,” “estimate,” “expect,” “forecast,” “goal,” “guidance,” “imply,” “intend,” “may,” “objective,” “opportunity,” “outlook,” “plan,” “policy,” “position,” “potential,” “predict,” “priority,” “project,” “proposition,” “prospective,” “pursue,” “seek,” “should,” “strategy,” “target,” “will,” “would” or other similar expressions that convey the uncertainty of future events or outcomes.
Forward-looking statements include, among other things, statements regarding:
•future levels of revenues, refiningfinancial and marketing margins, operating costs, retail gasoline and distillate margins, merchandise margins, income from operations, net income or earnings per share;results;
•future levels of capital, environmental or maintenance expenditures, general and administrative and other expenses;
•expected savings from the restructuring or reorganization of business components;
•the success or timing of completion of ongoing or anticipated capitalprojects or maintenance projects;transactions;
•business strategies, growth opportunities and expected investment;investments;
•consumer demand for refined products, natural gas and NGLs;
•the timing and amount of any future common stock repurchases;repurchases or dividends; and
•the anticipated effects of actions of third parties such as competitors, activist investors, or federal, foreign, state or local regulatory authorities, or plaintiffs in litigation.
Our forward-looking statements are not guarantees of future performance, and you should not rely unduly on them, as they involve risks, uncertainties and assumptions that we cannot predict. Material differences between actual results and any future performance suggested in our forward-looking statements could result from a variety of factors, including the following:
•general economic, political or regulatory developments, including changes in governmental policies relating to refined petroleum products, crude oil, natural gas or NGLs, or taxation;
•the effectsmagnitude and duration of the recent outbreak of COVID-19 pandemic and its effects, including travel restrictions, business and school closures, increased remote work, stay-at-home orders and other actions taken by individuals, government and the adverse impact thereof on our business, financial condition, results of operations and cash flows, including our growth, operating costs, labor availability, logistical capabilities, customer demand for our products and industry demand generally, margins, inventory value, cash position, taxes,private sector to stem the price of our securities and trading markets with respect thereto, our ability to access capital markets, and the global economy and financial markets generally;
•our ability to successfully complete the planned Speedway separationsale and realize the expected benefits within the expected timeframe or at all;
•further impairments;
•the regional, national and worldwide availability and pricing of refined products, crude oil, natural gas, NGLs and other feedstocks;
•the reliability of processing units and other equipment;
•the adequacy of capital resources and liquidity, including the availability, timing and amounts of sufficientfree cash flow necessary to execute business plans and to effect any share repurchases or dividend increases, including withinto maintain or increase the expected timeframe;dividend;
•the potential effects of judicial or other proceedings on the business, financial condition, results of operations and cash flows;
•continued or further volatility in and degradation of general economic, market, industry or business conditions as a result of the COVID-19 pandemic, other infectious disease outbreaks, natural hazards, extreme weather events or otherwise;
compliance with federal and state environmental, economic, health and safety, energy and other policies and regulations including the cost of compliance with the Renewable Fuel Standard, and enforcement actions initiated thereunder;
•adverse market conditions or other similar risks affecting MPLX;
•refining industry overcapacity or under capacity;
29
•changes in producer customers’ drilling plans or in volumes of throughput of crude oil, natural gas, NGLs, refined products or other hydrocarbon-based products;
•non-payment or non-performance by our producer and other customers;
•changes in the cost or availability of third-party vessels, pipelines, railcars and other means of transportation for crude oil, natural gas, NGLs, feedstocks and refined products;
•the price, availability and acceptance of alternative fuels and alternative-fuel vehicles and laws mandating such fuels or vehicles;
•political and economic conditions in nations that consume refined products, natural gas and NGLs, including the United States and Mexico, and in crude oil producing regions, including the Middle East, Africa, Canada and South America;
•actions taken by our competitors, including pricing adjustments, expansion of retail activities, the expansion and retirement of refining capacity and the expansion and retirement of pipeline capacity, processing, fractionation and treating facilities in response to market conditions;
•completion of pipeline projects within the United States;
•changes in fuel and utility costs for our facilities;
•accidents or other unscheduled shutdowns affecting our refineries, machinery, pipelines, processing, fractionation and treating facilities or equipment, or those of our suppliers or customers;
•acts of war, terrorism or civil unrest that could impair our ability to produce refined products, receive feedstocks or to gather, process, fractionate or transport crude oil, natural gas, NGLs or refined products;
•adverse changes in laws including with respect to tax and regulatory matters;
•political pressure and influence of environmental groups and other stakeholders upon policies and decisions related to the production, gathering, refining, processing, fractionation, transportation and marketing of crude oil or other feedstocks, refined products, natural gas, NGLs or other hydrocarbon-based products;
•labor and material shortages;
•the costs, disruption and diversion of management’s attention associated with campaigns commenced by activist investors; and
•personnel changes.
For additional risk factors affecting our business, see the otherrisk factors described in Item 1A. Risk Factors.
our Annual Report on Form 10-K for the year ended December 31, 2020. We undertake no obligation to update any forward-looking statements except to the extent required by applicable law.
Business Update
The recent outbreak of COVID-19 and its development into a pandemic in March 2020 have resulted in significant economic disruption globally. Actions taken by various governmental authorities, individuals and companies around the world to prevent the spread of COVID-19 through social distancing have restricted travel, many business operations, public gatherings and the overall level of individual movement and in-person interaction across the globe.
As we begin 2021, while demand for gasoline. As a result, there has also been a declineremains below historical levels, we continue to see gradual recovery in the demand forenvironment in which our business operates, albeit in some markets and regions more or less than others. The increased availability of vaccinations and the refined petroleum products that we manufacturecorresponding reductions in travel and sell.business restrictions appears to be driving increased economic activity, including the opening of many business and schools as well as more in-person interaction broadly.
In addition, recent global geopolitical events and macroeconomic conditions have exacerbated the decline in crude oil prices and have contributedresponse to an increase in crude oil price volatility.this business environment, we continue to focus on three near-term priorities for our businesses:
We are actively respondingcommitted to positioning our assets so that we are a leader in operational, financial, and sustainability performance and are evaluating the strength and fit of assets in our portfolio. Our goal is that each individual asset generates free-cash-flow back to the impactsbusiness and contributes to shareholder returns. With our investments we are focused on high returning projects that these matterswe believe will enhance the competitiveness of our portfolio, including our investments in sustainable fuels and technologies that lower our carbon intensity as the global energy mix evolves.
30
Improve Commercial Performance
We are havingfocused on leveraging advantaged raw material selection, new approaches in the commercial space to be more dynamic amidst changing market conditions and achieving technology improvements to advance our business. During Marchcommercial performance.
Lower Cost Structure
We are committed to achieving operational excellence by reducing costs, improving efficiency and continuing through April 2020, we started reducing the amount of crude oil processed at our refineries indriving operational improvements. In response to the decreased demandpandemic, in March of 2020, we committed to immediately reducing our capital spending and operating expenses. In 2021, we are continuing this focus with planned reductions of over $200 million for our products, and we temporarily idled portions of refining capacity to further limit production. In addition to these measures to address our operations, we are addressing our liquidity as outlined below.
In connection with our commitment to lower cost, in the third quarter of approximately $1.35 billion, or approximately 30 percent, which is expected to reduce planned spending levels down to $3.0 billion for 2020. The reductions are planned across all segments of the business, including: $250 million in Refining & Marketing; $770 million in Midstream, which includes MPLX; $250 million in Retail; and $80 million in Corporate. Remaining capital spend primarily relates to growth projects that are already in progress or spending that supports the safe and reliable operation of our facilities.
Many uncertainties remain with respect to COVID-19, including its resulting economic effects, and we are unable to predict the ultimate economic impacts from COVID-19 and how quickly national economies can recover once the pandemic ultimately subsides. However, the adverse impact of the economic effects on MPC has been and will likely continue to be significant. We believe we have proactively addressed many of the known impacts of COVID-19 to the extent possible and will strive to continue to do so, but there can be no guarantee the measures will be fully effective.
Other Strategic Actions to Enhance Shareholder ValueUpdates
On October 31, 2019,February 24, 2021, MPC’s board of directors approved our plan to strategically reposition the Martinez refinery to a renewable diesel facility. Converting the Martinez facility from refining petroleum to manufacturing renewable fuels signals our strong commitment to producing a substantial level of lower carbon-intensity fuels in California. As envisioned, the Martinez facility would start producing approximately 260 million gallons per year of renewable diesel by the second half of 2022, with a potential to build to full capacity of approximately 730 million gallons per year by the end of 2023.
The Dickinson, North Dakota, renewable fuels facility began ramping operations at the end of 2020 and is on track to reach full production by the end of the second quarter of 2021. At full capacity, the facility is expected to produce 184 million gallons per year of renewable diesel from corn and soybean oil. MPC is selling the renewable diesel into the California market to comply with the California Low Carbon Fuel Standard.
On August 2, 2020, we announcedentered into a definitive agreement to sell Speedway, our intention to separate ourcompany-owned and operated retail transportation fuel and convenience store business, which is operated primarily under the Speedway brand, into an independent, publicly traded company through a tax-free distribution to MPC shareholders of publicly traded stock7-Eleven, Inc. for $21 billion in the new independent retail transportation fuel and convenience store company. This transaction is targeted to be completed in the fourth quarter of 2020, however timing could change given the COVID-19 related impacts to the business environment and access to capital markets. This transaction iscash, subject to market, regulatorycertain adjustments based on the levels of cash, debt and working capital at closing and certain other items. The taxable transaction is expected to close in the second quarter of 2021, subject to customary closing conditions including final approval by MPC’s board of directors,and the receipt of customary assurances regardingregulatory approvals. 7-Eleven and MPC continue to engage productively with the intended tax-free natureFederal Trade Commission in its review of the transaction.This transaction is expected to result in after-tax cash proceeds of approximately $16.5 billion. The company expects to use the proceeds from the sale to strengthen the balance sheet and return capital to shareholders.
In connection with the effectivenessagreement to sell Speedway, we have agreed to enter into certain ancillary agreements, including 15-year fuel supply agreements associated with 7-Eleven or its subsidiaries, depending on the fuel demand of a registration statementSpeedway and other factors to be filed with the SEC. The Speedway business is currently a reporting unit within our Retail segment. MPC will retain its direct dealer business, which is also includedset forth in the Retail segmentfuel supply agreement. Further, we expect incremental opportunities over time to supply 7-Eleven’s remaining business as currently reported.7-Eleven’s existing arrangements mature and as new locations are added in connection with its announced U.S. and Canada growth strategy.
31
Results
Select results for continuing operations are reflected in the following table.
| Three Months Ended March 31, | ||||||||||||||||||||||||||
| (In millions) | 2021 | 2020 | ||||||||||||||||||||||||
| Income (loss) from continuing operations by segment | ||||||||||||||||||||||||||
| Refining & Marketing | $ | (598) | $ | (497) | ||||||||||||||||||||||
| Midstream | 972 | 905 | ||||||||||||||||||||||||
| Corporate | (157) | (233) | ||||||||||||||||||||||||
| Items not allocated to segments: | ||||||||||||||||||||||||||
Transaction-related costs(a) | — | (8) | ||||||||||||||||||||||||
Impairments(b) | — | (9,137) | ||||||||||||||||||||||||
| LCM inventory valuation adjustment | — | (3,185) | ||||||||||||||||||||||||
| Income (loss) from continuing operations | 217 | (12,155) | ||||||||||||||||||||||||
| Net interest and other financial costs | 353 | 332 | ||||||||||||||||||||||||
| Income (loss) from continuing operations before income taxes | (136) | (12,487) | ||||||||||||||||||||||||
| Provision (benefit) for income taxes on continuing operations | 34 | (1,951) | ||||||||||||||||||||||||
| Income (loss) from continuing operations, net of tax | (170) | (10,536) | ||||||||||||||||||||||||
| Three Months Ended March 31, | ||||||||
| (In millions, except per share data) | 2020 | 2019 | ||||||
| Income (loss) from operations by segment | ||||||||
| Refining & Marketing | $ | (622 | ) | $ | (334 | ) | ||
| Retail | 519 | 170 | ||||||
| Midstream | 905 | 908 | ||||||
| Items not allocated to segments | (12,619 | ) | (75 | ) | ||||
| Income from operations | $ | (11,817 | ) | $ | 669 | |||
| Net loss attributable to MPC | $ | (9,234 | ) | $ | (7 | ) | ||
| Net income attributable to MPC per diluted share | $ | (14.25 | ) | $ | (0.01 | ) | ||
Select results for discontinued operations are reflected in the following table.
| Three Months Ended March 31, | ||||||||||||||||||||||||||
| (In millions) | 2021 | 2020 | ||||||||||||||||||||||||
| Income from discontinued operations | ||||||||||||||||||||||||||
| Speedway | $ | 330 | $ | 400 | ||||||||||||||||||||||
Transaction-related costs(a) | (23) | (27) | ||||||||||||||||||||||||
| LCM inventory valuation adjustment | — | (35) | ||||||||||||||||||||||||
| Income from discontinued operations | 307 | 338 | ||||||||||||||||||||||||
| Net interest and other financial costs | 4 | 6 | ||||||||||||||||||||||||
| Income from discontinued operations before income taxes | 303 | 332 | ||||||||||||||||||||||||
| Provision for income taxes on discontinued operations | 69 | 14 | ||||||||||||||||||||||||
| Income from discontinued operations, net of tax | $ | 234 | $ | 318 | ||||||||||||||||||||||
(a) Costs related to the Speedway separation.
The following table includes net income (loss) per diluted share data.
| Three Months Ended March 31, | ||||||||||||||||||||||||||
| 2021 | 2020 | |||||||||||||||||||||||||
| Net income (loss) per diluted share | ||||||||||||||||||||||||||
| Continuing operations | $ | (0.73) | $ | (14.74) | ||||||||||||||||||||||
| Discontinued operations | 0.36 | 0.49 | ||||||||||||||||||||||||
| Net income (loss) attributable to MPC | $ | (0.37) | $ | (14.25) | ||||||||||||||||||||||
32
See Note 3 to the future.unaudited consolidated financial statements for additional information on discontinued operations.
Refer to the Results of Operations section for a discussion of consolidated financial results and segment results for the first quarter of 20202021 as compared to the first quarter of 2019.2020.
MPLX
We owned approximately 666647 million MPLX common units at March 31, 20202021 with a market value of $7.74$16.59 billion based on the March 31, 20202021 closing price of $11.62$25.63 per common unit. On April 28, 2020,27, 2021, MPLX declared a quarterly cash distribution of $0.6875 per common unit payable on May 15, 2020.14, 2021. As a result, MPLX will make distributions totaling $728$707 million to its common unitholders. MPC’s portion of these distributions is approximately $458$445 million.
We received limited partner distributions of $446$445 million from MPLX in the three months ended March 31, 20202021 and $473$446 million from MPLX and ANDX combined in the three months ended March 31, 2019. The decrease in distributions from2020.
During the prior year is due to the fact that ANDXthree months ended March 31, 2021, 6,272,981 MPLX common units had a higherbeen repurchased at an average cost per unit distribution priorof $24.78. Total cash paid for units repurchased during the three months ended March 31, 2021 was $155 million. As of March 31, 2021, MPLX had agreements to acquire 291,400 additional common units for $7 million, which settled in early April 2021. As of March 31, 2021, $812 million remained outstanding on the Merger when compared to the MPLX distribution per unit post-merger.program for future purchases.
See Note 34 to the unaudited consolidated financial statements for additional information on MPLX.
| March 31, 2021 | ||||||||||||||||||||
| (In millions) | Total Capacity | Outstanding Borrowings | Available Capacity | |||||||||||||||||
Bank revolving credit facility(a) | $ | 5,000 | $ | 1,301 | $ | 3,699 | ||||||||||||||
| 364-day bank revolving credit facility | 1,000 | — | 1,000 | |||||||||||||||||
Trade receivables facility(b) | 750 | — | 750 | |||||||||||||||||
Commercial paper borrowings(c) | — | — | (1,717) | |||||||||||||||||
| Total | $ | 6,750 | $ | 1,301 | $ | 3,732 | ||||||||||||||
Cash and cash equivalents(d) | 734 | |||||||||||||||||||
| Total liquidity | $ | 4,466 | ||||||||||||||||||
(a)Outstanding borrowings include $1 million in letters of credit outstanding under this facility.
(b)Availability under our $750 million trade receivables facility is a function of eligible trade receivables, which will be lower in a sustained lower price environment for refined products.
(c)We do not repurchase anyintend to have outstanding commercial paper borrowings in excess of our common stock, which helped preserve our liquidity during the COVID-19 pandemic. Since January 1, 2012, our boardavailable capacity under bank revolving credit facilities.
(d)Includes cash and cash equivalents classified as assets held for sale of directors has approved $18.0 billion in total share repurchase authorizations$134 million and we have repurchased a total of $15.05 billion of our common stock, leaving $2.96 billion available for repurchases as of March 31, 2020. We will evaluate the timing to resume any future repurchases as market conditions evolve. See Note 8 to the unaudited consolidated financial statements.
Additionally, we have recorded an income tax receivable within other current assets in our balance sheet of approximately $1.63$2.1 billion excluding MPLX cash and cash equivalentswhich is expected to be received during the second half of $57 million, $3.0 billion available under a five-year bank revolving credit facility, $1.0 billion available under a 364-day bank revolving credit facility, and $750 million available under our trade receivables securitization facility resulting in cash and available liquidity of $6.38 billion. MPC drew $2.0 billion on the five-year bank revolving credit facility in the first quarter of 2020. This borrowing was undertaken to provide financial flexibility given the recent commodity price downturn and the significant working capital impact associated with the decline in crude prices. The company has made short-term borrowings to manage the impact of commodity prices on working capital in the past and expects to do so from time to time in the future.2021.
MPLX’s liquidity totaled $4.31$4.19 billion at March 31, 2020.2021. As of March 31, 2020,2021, MPLX had cash and cash equivalents of $57$24 million, $2.75$2.67 billion available under its $3.5 billion revolving credit agreement and $1.5 billion available through its intercompany loan agreement with MPC.
33
OVERVIEW OF SEGMENTS
Refining & Marketing
Refining & Marketing segment income from operations depends largely on our Refining & Marketing margin, refining operating costs, refining planned turnarounds, distribution costs, refining planned turnarounddepreciation expenses and refinery throughputs.
Our Refining & Marketing margin is the difference between the prices of refined products sold and the costs of crude oil and other charge and blendstocks refined, including the costs to transport these inputs to our refineries and the costs of products purchased for resale. The crack spread is a measure of the difference between market prices for refined products and crude oil, commonly used by the industry as a proxy for the refining margin. Crack spreads can fluctuate significantly, particularly when prices of refined products do not move in the same direction as the cost of crude oil. As a performance benchmark and a comparison with other industry participants, we calculate Gulf Coast, Mid-Continent and West Coast crack spreads that we believe most closely track our operations and slate of products. The following are used for these crack-spread calculations:
•The Gulf Coast crack spread uses three barrels of LLSMEH crude producing two barrels of USGC CBOB gasoline and one barrel of USGC ULSD;ULSD. In the first quarter of 2021, we transitioned to MEH crude from LLS crude;
•The Mid-Continent crack spread uses three barrels of WTI crude producing two barrels of Chicago CBOB gasoline and one barrel of Chicago ULSD; and
•The West Coast crack spread uses three barrels of ANS crude producing two barrels of LA CARBOB and one barrel of LA CARB Diesel.
Our refineries can process significant amounts of sweet and sour crude oil, which typically can be purchased at a discount to crude oil referenced in our Gulf Coast, Mid-Continent and West Coast crack spreads. The amount of these discounts, which we refer to as the sweet differential and sour differential, can vary significantly, causing our Refining & Marketing margin to differ from blended crack spreads. In general, larger sweet and sour differentials will enhance our Refining & Marketing margin.
Future crude oil differentials will be dependent on a variety of market and economic factors, as well as U.S. energy policy.
The following table provides sensitivities showing an estimated change in annual net income due to potential changes in market conditions.
| (In millions, after-tax) | ||||
Blended crack spread sensitivity(a) (per $1.00/barrel change) | $ | 910 | ||
Sour differential sensitivity(b) (per $1.00/barrel change) | 420 | |||
Sweet differential sensitivity(c) (per $1.00/barrel change) | 420 | |||
Natural gas price sensitivity(d) (per $1.00/MMBtu) | 325 | |||
| (In millions, after-tax) | ||||||||
Blended crack spread sensitivity(a) (per $1.00/barrel change) | $ | 838 | ||||||
| 396 | |||||||
| 381 | |||||||
| 275 | |
(a)Crack spread based on 40 percent MEH, 40 percent WTI and 20 percent ANS with Gulf Coast, Mid-Continent and West Coast product pricing, respectively, and assumes all other differentials and pricing relationships remain unchanged.
(b)Sour crude oil basket consists of the following crudes: ANS, Argus Sour Crude Index, Maya and Western Canadian Select. We expect approximately 51 percent of the crude processed at our refineries in 2021 will be sour crude.
(c)Sweet crude oil basket consists of the following crudes: Bakken, Brent, MEH, WTI-Cushing and WTI-Midland. We expect approximately 49 percent of the crude processed at our refineries in 2021 will be sweet crude.
(d)This is consumption-based exposure for our Refining & Marketing segment and does not include the sales exposure for our Midstream segment.
In addition to the market changes indicated by the crack spreads, the sour differential and the sweet differential, our Refining & Marketing margin is impacted by factors such as:
•the selling prices realized for refined products;
•the types of crude oil and other charge and blendstocks processed;
•our refinery yields;
•the cost of products purchased for resale; and
•the impact of commodity derivative instruments used to hedge price risk.risk;
•the potential impact of LCM adjustments to inventories in periods of declining prices; and
•the potential impact of LIFO liquidation charges due to draw-downs from historic inventory levels.
Refining & Marketing segment income from operations is also affected by changes in refinery operating costs and refining planned turnaround costs in addition to committed distribution costs. Changes in operating costs are primarily driven by the cost of energy used by our refineries, including purchased natural gas, and the level of maintenance costs. Refining planned
34
turnarounds, requiring temporary shutdown of certain refinery operating units, are periodically performed at each refinery.
We have various long-term, fee-based commercial agreements with MPLX. Under these agreements, MPLX, which is reported in our Midstream segment, provides transportation, storage, distribution and marketing services to our Refining & Marketing segment. Certain of these agreements include commitments for minimum quarterly throughput and distribution volumes of crude oil and refined products and minimum storage volumes of crude oil, refined products and other products. Certain other agreements include commitments to pay for 100 percent of available capacity for certain marine transportation and refining logistics assets.
Midstream
Our Midstream segment transports, stores, distributes and markets crude oil and refined products, principally for our Refining & Marketing segment. The profitability of our pipeline transportation operations primarily depends on tariff rates and the volumes shipped through the pipelines. The profitability of our marine operations primarily depends on the quantity and availability of our vessels and barges. The profitability of our light product terminal operations primarily depends on the throughput volumes at these terminals. The profitability of our fuels distribution services primarily depends on the sales volumes of certain refined products. The profitability of our refining logistics operations depends on the quantity and availability of our refining logistics assets. A majority of the crude oil and refined product shipments on our pipelines and marine vessels and the refined product throughput at our terminals serve our Refining & Marketing segment and our refining logistics assets and fuels distribution services are used solely by our Refining & Marketing segment. As discussed above in the Refining & Marketing section, MPLX, which is reported in our Midstream segment, has various long-term, fee-based commercial agreements related to services provided to our Refining & Marketing segment. Under these agreements, MPLX has received various commitments of minimum throughput, storage and distribution volumes as well as commitments to pay for all available capacity of certain assets. The volume of crude oil that we transport is directly affected by the supply of, and refiner demand for, crude oil in the markets served directly by our crude oil pipelines, terminals and marine operations. Key factors in this supply and demand balance are the production levels of crude oil by producers in various regions or fields, the availability and cost of alternative modes of transportation, the volumes of crude oil processed at refineries and refinery and transportation system maintenance levels. The volume of refined products that we transport, store, distribute and market is directly affected by the production levels of, and user demand for, refined products in the markets served by our refined product pipelines and marine operations. In most of our markets, demand for gasoline and distillate peaks during the summer driving season, which extends from May through September of each year, and declines during the fall and winter months. As with crude oil, other transportation alternatives and system maintenance levels influence refined product movements.
Our Midstream segment also gathers and processes natural gas and NGLs. NGL and natural gas prices are volatile and are impacted by changes in fundamental supply and demand, as well as market uncertainty, availability of NGL transportation and fractionation capacity and a variety of additional factors that are beyond our control. Our Midstream segment profitability is affected by prevailing commodity prices primarily as a result of processing or conditioning at our own or third‑party processing plants, purchasing and selling or gathering and transporting volumes of natural gas at index‑related prices and the cost of third‑party transportation and fractionation services. To the extent that commodity prices influence the level of natural gas drilling by our producer customers, such prices also affect profitability.
35
RESULTS OF OPERATIONS
The following discussion includes comments and analysis relating to our results of operations. This discussion should be read in conjunction with Item 1. Financial Statements and is intended to provide investors with a reasonable basis for assessing our historical operations, but should not serve as the only criteria for predicting our future performance.
Consolidated Results of Operations
| Three Months Ended March 31, | ||||||||||||||||||||||||||||||||||||||
| (In millions) | 2021 | 2020 | Variance | |||||||||||||||||||||||||||||||||||
| Revenues and other income: | ||||||||||||||||||||||||||||||||||||||
Sales and other operating revenues(a) | $ | 22,711 | $ | 22,204 | $ | 507 | ||||||||||||||||||||||||||||||||
| Income (loss) from equity method investments | 91 | (1,233) | 1,324 | |||||||||||||||||||||||||||||||||||
| Net gain on disposal of assets | 3 | 3 | — | |||||||||||||||||||||||||||||||||||
| Other income | 77 | 23 | 54 | |||||||||||||||||||||||||||||||||||
| Total revenues and other income | 22,882 | 20,997 | 1,885 | |||||||||||||||||||||||||||||||||||
| Costs and expenses: | ||||||||||||||||||||||||||||||||||||||
| Cost of revenues (excludes items below) | 21,084 | 20,342 | 742 | |||||||||||||||||||||||||||||||||||
| LCM inventory valuation adjustment | — | 3,185 | (3,185) | |||||||||||||||||||||||||||||||||||
| Impairment expense | — | 7,822 | (7,822) | |||||||||||||||||||||||||||||||||||
| Depreciation and amortization | 844 | 863 | (19) | |||||||||||||||||||||||||||||||||||
| Selling, general and administrative expenses | 575 | 742 | (167) | |||||||||||||||||||||||||||||||||||
| Other taxes | 162 | 198 | (36) | |||||||||||||||||||||||||||||||||||
| Total costs and expenses | 22,665 | 33,152 | (10,487) | |||||||||||||||||||||||||||||||||||
| Income (loss) from continuing operations | 217 | (12,155) | 12,372 | |||||||||||||||||||||||||||||||||||
| Net interest and other financial costs | 353 | 332 | 21 | |||||||||||||||||||||||||||||||||||
| Loss from continuing operations before income taxes | (136) | (12,487) | 12,351 | |||||||||||||||||||||||||||||||||||
| Provision (benefit) for income taxes on continuing operations | 34 | (1,951) | 1,985 | |||||||||||||||||||||||||||||||||||
| Loss from continuing operations, net of tax | (170) | (10,536) | 10,366 | |||||||||||||||||||||||||||||||||||
| Income from discontinued operations, net of tax | 234 | 318 | (84) | |||||||||||||||||||||||||||||||||||
| Net income (loss) | 64 | (10,218) | 10,282 | |||||||||||||||||||||||||||||||||||
| Less net income (loss) attributable to: | ||||||||||||||||||||||||||||||||||||||
| Redeemable noncontrolling interest | 20 | 20 | — | |||||||||||||||||||||||||||||||||||
| Noncontrolling interests | 286 | (1,004) | 1,290 | |||||||||||||||||||||||||||||||||||
| Net loss attributable to MPC | $ | (242) | $ | (9,234) | $ | 8,992 | ||||||||||||||||||||||||||||||||
| Three Months Ended March 31, | ||||||||||||
| (In millions) | 2020 | 2019 | Variance | |||||||||
| Revenues and other income: | ||||||||||||
| Sales and other operating revenues | $ | 25,215 | $ | 28,253 | $ | (3,038 | ) | |||||
Income (loss) from equity method investments(a) | (1,210 | ) | 99 | (1,309 | ) | |||||||
| Net gain on disposal of assets | 4 | 214 | (210 | ) | ||||||||
| Other income | 71 | 35 | 36 | |||||||||
| Total revenues and other income | 24,080 | 28,601 | (4,521 | ) | ||||||||
| Costs and expenses: | ||||||||||||
| Cost of revenues (excludes items below) | 22,821 | 25,960 | (3,139 | ) | ||||||||
| Inventory market valuation adjustment | 3,220 | — | 3,220 | |||||||||
| Impairment expense | 7,822 | — | 7,822 | |||||||||
| Depreciation and amortization | 962 | 919 | 43 | |||||||||
| Selling, general and administrative expenses | 821 | 867 | (46 | ) | ||||||||
| Other taxes | 251 | 186 | 65 | |||||||||
| Total costs and expenses | 35,897 | 27,932 | 7,965 | |||||||||
| Income (loss) from operations | (11,817 | ) | 669 | (12,486 | ) | |||||||
| Net interest and other financial costs | 338 | 306 | 32 | |||||||||
| Income (loss) before income taxes | (12,155 | ) | 363 | (12,518 | ) | |||||||
| Provision (benefit) for income taxes | (1,937 | ) | 104 | (2,041 | ) | |||||||
| Net income (loss) | (10,218 | ) | 259 | (10,477 | ) | |||||||
| Less net income (loss) attributable to: | ||||||||||||
| Redeemable noncontrolling interest | 20 | 20 | — | |||||||||
| Noncontrolling interests | (1,004 | ) | 246 | (1,250 | ) | |||||||
| Net loss attributable to MPC | $ | (9,234 | ) | $ | (7 | ) | $ | (9,227 | ) | |||
First Quarter 20202021 Compared to First Quarter 20192020
Net loss attributable to MPC increased $9.23decreased $8.99 billion in the first quarter of 20202021 compared to the first quarter of 2019 primarily2020 largely due to the absence of impairment expenses for goodwill and long-lived assetsan LCM inventory charge in the first three months of $7.82 billion, an inventory market valuation adjustment of $3.22 billion and impairments of equity method investments of $1.32 billion during the period.2021.
Revenues and other income decreased $4.52increased $1.89 billion primarily due to:
•increased other income of $54 million primarily due to higher income on RIN sales.
36
Costs and expenses decreased net gain$10.49 billion primarily due to:
•increased cost of $210revenues of $742 million mainly due to higher crude oil costs;
•the absence of a $207 million gain recognized in 2019 in connection with MPC’s exchange of its undivided interestan LCM inventory valuation charge in the Capline pipeline system for an equity ownership in Capline LLC.
•decreased impairment expense of $7.82 billion due to impairments recorded for goodwill and long-lived assets in the first quarter of $7.33 billion and $492 million, respectively,2020 primarily driven by the effects of COVID-19 and the decline in commodity prices; and
•decreased selling, general and administrative expenses of property tax refunds received in the first quarter of 2019 and environmental taxes increased$167 million largely due to the reinstatement of the Oil Spill Tax incost reductions realized from our 2020 after not being active in 2019.workforce reduction and other cost control efforts.
Noncontrolling interests increased $1.29 billion primarily due to an increase in MPLX’s net income largely due to impairment expense recognized during the three months ended March 31, 2019 due to impairment charges recorded by MPLX. 2020.
Results of Discontinued Operations
The combined federal, stateresults of the Speedway business are presented as discontinued operations in our consolidated financial statements.
The following includes key financial and foreign income tax rate was 29 percentoperating data for Speedway for the three months ended March 31, 2019. first quarter of 2021 compared to the first quarter of 2020.
| Three Months Ended March 31, | ||||||||||||||||||||||||||
| Key Financial and Operating Data | 2021 | 2020 | ||||||||||||||||||||||||
Speedway fuel sales (millions of gallons) | 1,436 | 1,636 | ||||||||||||||||||||||||
Speedway fuel margin (dollars per gallon)(a)(b) | $ | 0.2567 | $ | 0.3540 | ||||||||||||||||||||||
Merchandise sales (in millions) | $ | 1,512 | $ | 1,461 | ||||||||||||||||||||||
Merchandise margin (in millions)(b)(c) | $ | 442 | $ | 414 | ||||||||||||||||||||||
| Merchandise margin percent | 29.3 | % | 28.3 | % | ||||||||||||||||||||||
Same store gasoline sales volume (period over period)(d) | (12.3) | % | (8.3) | % | ||||||||||||||||||||||
Same store merchandise sales (period over period)(d)(e) | 7.0 | % | 0.7 | % | ||||||||||||||||||||||
| Convenience stores at period-end | 3,833 | 3,881 | ||||||||||||||||||||||||
(a)The effectiveprice paid by consumers less the cost of refined products, excluding transportation, consumer excise taxes and bankcard processing fees (where applicable), divided by gasoline and distillate sales volume. Excludes inventory valuation adjustments.
(b)See “Non-GAAP Measures” section for reconciliation and further information regarding this non-GAAP measure.
(c)The price paid by consumers less the cost of merchandise.
(d)Same store comparison includes only locations owned at least 13 months.
(e)Excludes cigarettes.
First Quarter 2021 Compared to First Quarter 2020
Income from discontinued operations, net of tax, rate for the three months ended March 31, 2019 was greater than the U.S. statutory rate of 21 percentdecreased $84 million. Quarterly results reflected lower fuel margins and fuel volumes partially offset by higher merchandise sales and margins and lower operating expenses. Changes in fuel sales volumes were primarily due to $36the outbreak of COVID-19 and its development into a pandemic in March 2020, which resulted in restricted travel, social distancing and reduced business operations. Discontinued operations for the first quarter of 2021 include $23 million of state deferred tax expense recorded as an out of period adjustment partially offset by permanent tax differencescosts related to net income attributablethe Speedway separation and for the first quarter of 2020 includes a $35 million LCM inventory charge and $27 million of costs related to noncontrolling interests.the Speedway separation.
37
assets. As a result, Speedway depreciation and amortization was $2 million and $99 million, for first quarter of 2021 and 2020, respectively.
The Speedway fuel margin decreased $1.25 billion due to MPLX’s net loss primarily resulting25.67 cents per gallon in the first quarter of 2021, from impairment expense recognized during35.40 cents per gallon in the quarter.first quarter of 2020.
See Note 3 to the unaudited consolidated financial statements for additional information on discontinued operations.
Segment Results
Refining & Marketing
The following includes key financial and operating data for the first quarter of 20202021 compared to the first quarter of 2019.2020.
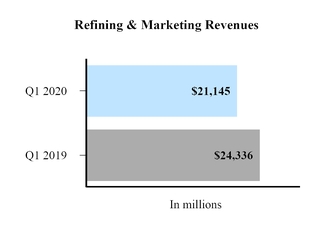
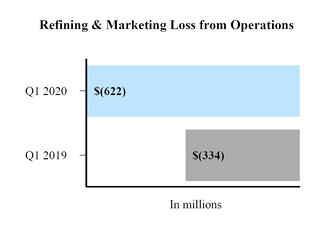
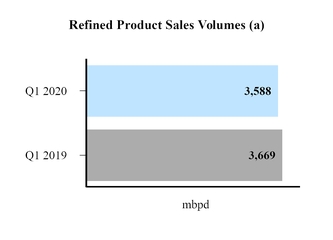
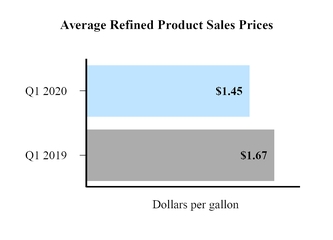
| Three Months Ended March 31, | ||||||||
| 2020 | 2019 | |||||||
| Refining & Marketing Operating Statistics | ||||||||
Net refinery throughput (mbpd) | 2,994 | 3,084 | ||||||
Refining & Marketing margin per barrel(a)(b) | $ | 11.30 | $ | 11.17 | ||||
| Less: | ||||||||
Refining operating costs per barrel(c) | 6.00 | 5.58 | ||||||
Distribution costs per barrel(d) | 4.73 | 4.65 | ||||||
| Refining planned turnaround costs per barrel | 1.21 | 0.68 | ||||||
| Depreciation and amortization per barrel | 1.64 | 1.54 | ||||||
| Plus: | ||||||||
Other per barrel(e) | — | 0.07 | ||||||
| Refining & Marketing segment loss per barrel | $ | (2.28 | ) | $ | (1.21 | ) | ||

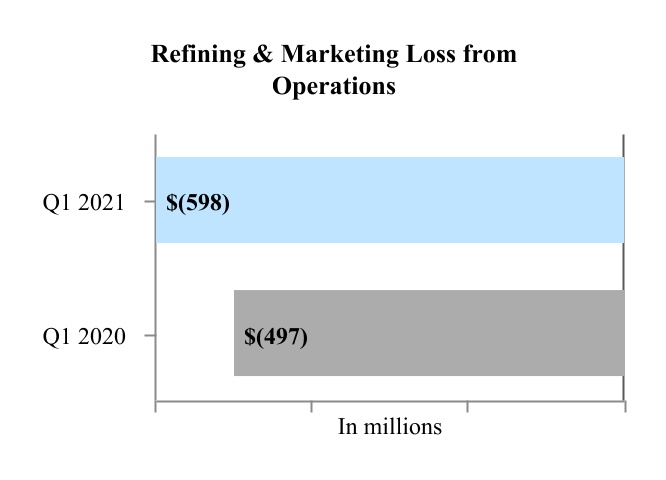
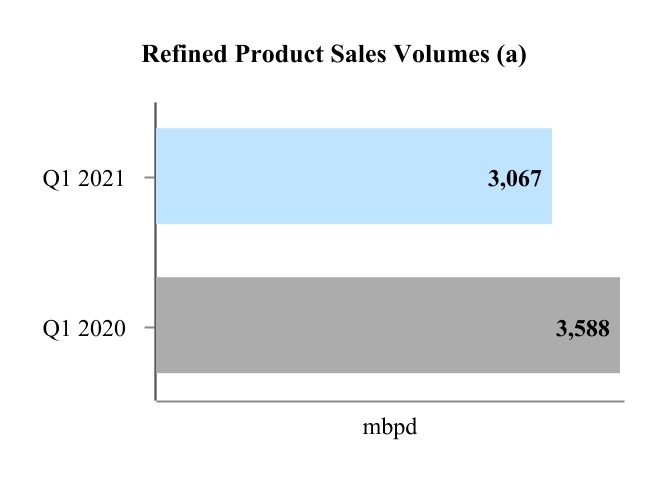
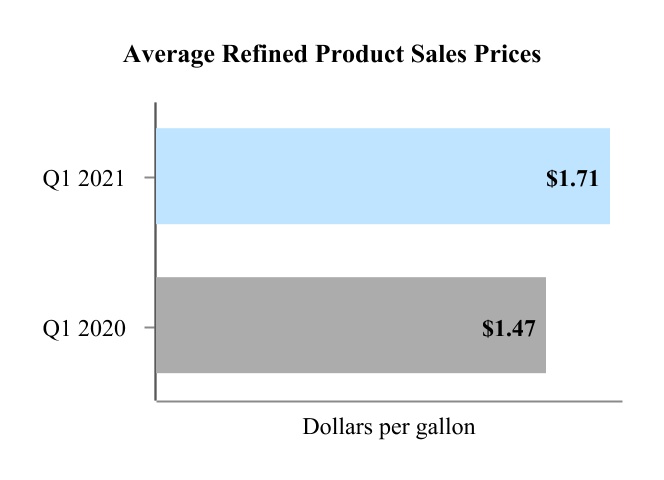
(a)Includes intersegment sales to Midstream and sales destined for export.
38
| Three Months Ended March 31, | ||||||||||||||||||||||||||
| 2021 | 2020 | |||||||||||||||||||||||||
| Refining & Marketing Operating Statistics | ||||||||||||||||||||||||||
Net refinery throughput (mbpd) | 2,565 | 2,994 | ||||||||||||||||||||||||
Refining & Marketing margin per barrel(a)(b) | 10.16 | 11.86 | ||||||||||||||||||||||||
| Less: | ||||||||||||||||||||||||||
Refining operating costs per barrel, excluding winter storm effect(c) | 5.16 | 6.00 | ||||||||||||||||||||||||
Winter storm effect on refining operating cost(d) | 0.13 | — | ||||||||||||||||||||||||
| Distribution costs per barrel | 5.18 | 4.74 | ||||||||||||||||||||||||
| Refining planned turnaround costs per barrel | 0.48 | 1.21 | ||||||||||||||||||||||||
| Depreciation and amortization per barrel | 2.07 | 1.74 | ||||||||||||||||||||||||
| Plus: | ||||||||||||||||||||||||||
Other per barrel(e) | 0.27 | 0.01 | ||||||||||||||||||||||||
| Refining & Marketing segment income (loss) per barrel | $ | (2.59) | $ | (1.82) | ||||||||||||||||||||||
| Fees paid to MPLX included in distribution costs above | $ | 3.66 | $ | 3.15 | ||||||||||||||||||||||
(a)Sales revenue less cost of Contentsrefinery inputs and purchased products, divided by net refinery throughput.
(b)See “Non-GAAP Measures” section for reconciliation and further information regarding this non-GAAP measure.
(c)Includes refining operating costs and major maintenance costs. Excludes planned turnaround and depreciation and amortization expense.
(d)Winter storms in the first quarter of 2021 resulted in higher costs, including maintenance and repairs.
(e)Includes income (loss) from equity method investments, net gain (loss) on disposal of assets and other income.
39
The following table presents certain benchmark prices in our marketing areas and market indicators that we believe are helpful in understanding the results of our Refining & Marketing segment. The benchmark crack spreads below do not reflect the market cost of RINs necessary to meet EPA renewable volume obligations for attributable products under the Renewable Fuel Standard.
| Three Months Ended March 31, | ||||||||||||||||||||||||||
Benchmark Spot Prices (dollars per gallon) | 2021 | 2020 | ||||||||||||||||||||||||
| Chicago CBOB unleaded regular gasoline | $ | 1.65 | $ | 1.21 | ||||||||||||||||||||||
| Chicago ULSD | 1.74 | 1.43 | ||||||||||||||||||||||||
| USGC CBOB unleaded regular gasoline | 1.70 | 1.25 | ||||||||||||||||||||||||
| USGC ULSD | 1.70 | 1.47 | ||||||||||||||||||||||||
| LA CARBOB | 1.85 | 1.54 | ||||||||||||||||||||||||
| LA CARB diesel | 1.78 | 1.63 | ||||||||||||||||||||||||
Market Indicators (dollars per barrel) | ||||||||||||||||||||||||||
| WTI | $ | 58.14 | $ | 45.78 | ||||||||||||||||||||||
| MEH | 59.51 | — | ||||||||||||||||||||||||
| LLS | — | 47.65 | ||||||||||||||||||||||||
| ANS | 61.07 | 51.03 | ||||||||||||||||||||||||
| Crack Spreads: | ||||||||||||||||||||||||||
| Mid-Continent WTI 3-2-1 | $ | 7.83 | $ | 7.39 | ||||||||||||||||||||||
| USGC MEH 3-2-1 | 6.66 | — | ||||||||||||||||||||||||
| USGC LLS 3-2-1 | — | 6.48 | ||||||||||||||||||||||||
| West Coast ANS 3-2-1 | 10.63 | 12.68 | ||||||||||||||||||||||||
Blended 3-2-1(a) | 7.92 | 8.31 | ||||||||||||||||||||||||
| Crude Oil Differentials: | ||||||||||||||||||||||||||
| Sweet | $ | (1.02) | $ | (0.70) | ||||||||||||||||||||||
| Sour | (3.12) | (4.90) | ||||||||||||||||||||||||
| Three Months Ended March 31, | ||||||||
Benchmark Spot Prices (dollars per gallon) | 2020 | 2019 | ||||||
| Chicago CBOB unleaded regular gasoline | $ | 1.21 | $ | 1.51 | ||||
| Chicago ULSD | 1.43 | 1.84 | ||||||
| USGC CBOB unleaded regular gasoline | 1.25 | 1.52 | ||||||
| USGC ULSD | 1.47 | 1.88 | ||||||
| LA CARBOB | 1.54 | 1.82 | ||||||
| LA CARB diesel | 1.63 | 1.92 | ||||||
Market Indicators (dollars per barrel) | ||||||||
| LLS | $ | 47.65 | $ | 62.34 | ||||
| WTI | 45.78 | 54.90 | ||||||
| ANS | 51.03 | 64.48 | ||||||
| Crack Spreads: | ||||||||
| Mid-Continent WTI 3-2-1 | $ | 7.39 | $ | 11.70 | ||||
| USGC LLS 3-2-1 | 6.48 | 5.23 | ||||||
| West Coast ANS 3-2-1 | 12.68 | 11.91 | ||||||
Blended 3-2-1(a) | 8.31 | 9.29 | ||||||
| Crude Oil Differentials: | ||||||||
| Sweet | $ | (0.70 | ) | $ | (3.30 | ) | ||
| Sour | (4.90 | ) | (3.13 | ) | ||||
First Quarter 20202021 Compared to First Quarter 20192020
Refining & Marketing segment revenues decreased $3.19 billionincreased $380 million primarily due to increased average refined product sales prices of $0.24 per gallon, partially offset by lower refined product sales volumes, which decreased 81 mbpd, and decreased average refined product sales prices of $0.22 per gallon. These decreases were primarily the result of reduced travel and business operations associated with the COVID-19 pandemic.521 mbpd.
Refining & Marketing segment lossincome from operations increased $288decreased $101 million primarily due to lower blended crack spreads, partially offset by reduced refining operating, distribution, and higherrefining planned turnaround expenses.costs.
Refining & Marketing margin was $11.30$10.16 per barrel for the first quarter of 20202021 compared to $11.17$11.86 per barrel for the first quarter of 2019.2020. Refining & Marketing margin is affected by our performance against the market indicators shown earlier, which use spot market values and an estimated mix of crude purchases and product sales. Based on the market indicators and our crude oil throughput, we estimate a net negative impact of approximately $490$700 million on Refining & Marketing margin for the first quarter of 20202021 compared to the first quarter of 2019,2020, primarily due to lower WTIvolumes and crack spreads and narrower sweet crude oil differentials, partially offset by wider sour crude oil differentials. Our reported Refining & Marketing margin differs from market indicators due to the mix of crudes purchased and their costs, the effect of market structure on our crude oil acquisition prices, the effect of RIN prices on the crack spread, and other items like refinery yields, and other feedstock variances.variances and fuel margin from sales to direct dealers. These factors had an estimated net positivenegative effect of approximately $470$200 million on Refining & Marketing segment income in the first quarter of 20202021 compared to the first quarter of 2019.2020.
40
For the three months ended March 31, 2021, refining operating costs, excluding depreciation and amortization increased $0.42and the winter storm effect, decreased $448 million, or $0.84 per barrel, primarily duecompared to higher engineered projects, maintenancethe three months ended March 31, 2020 as we took actions to reduce costs in response to the economic effects of COVID-19, including operating at lower throughput at our refineries and taxes, partially offset by lower energy costs. While,idling portions of our refining capacity.
Distribution costs, excluding depreciation and amortization, decreased $94 million and include fees paid to MPLX of $846 million and $858 million for the first quarter of 2021 and 2020, respectively. On a per barrel basis, distribution costs, excluding depreciation and amortization, were flat as compared to first quarter of 2019, the lower throughput resulted in an $0.08
Refining planned turnaround costs increased $0.53decreased $217 million, or $0.73 per barrel, due to the timing of turnaround activity.
Depreciation and amortization increased $0.33 per barrel primarily due to lower throughput and increased by $0.10 per barrel.costs.
Supplemental Refining & Marketing Statistics
| Three Months Ended March 31, | |||||||||||||||||||||||
| 2021 | 2020 | ||||||||||||||||||||||
| Refining & Marketing Operating Statistics | |||||||||||||||||||||||
Crude oil capacity utilization percent(a) | 83 | 91 | |||||||||||||||||||||
Refinery throughputs (mbpd): | |||||||||||||||||||||||
| Crude oil refined | 2,381 | 2,784 | |||||||||||||||||||||
| Other charge and blendstocks | 184 | 210 | |||||||||||||||||||||
| Net refinery throughput | 2,565 | 2,994 | |||||||||||||||||||||
| Sour crude oil throughput percent | 48 | 49 | |||||||||||||||||||||
| Sweet crude oil throughput percent | 52 | 51 | |||||||||||||||||||||
Refined product yields (mbpd): | |||||||||||||||||||||||
| Gasoline | 1,324 | 1,488 | |||||||||||||||||||||
| Distillates | 881 | 1,020 | |||||||||||||||||||||
| Propane | 45 | 58 | |||||||||||||||||||||
| Feedstocks and petrochemicals | 222 | 352 | |||||||||||||||||||||
| Heavy fuel oil | 36 | 37 | |||||||||||||||||||||
| Asphalt | 97 | 80 | |||||||||||||||||||||
| Total | 2,605 | 3,035 | |||||||||||||||||||||
Refined product export sales volumes (mbpd)(b) | 243 | 383 | |||||||||||||||||||||
(a)Based on calendar-day capacity, which is an annual average that includes down time for planned maintenance and other normal operating activities.
(b)Represents fully loaded export cargoes for each time period. These sales volumes are included in the total sales volume amounts.
41
| Three Months Ended March 31, | |||||
| 2020 | 2019 | ||||
| Refining & Marketing Operating Statistics | |||||
Refined product export sales volumes (mbpd)(a) | 383 | 430 | |||
Crude oil capacity utilization percent(b) | 91 | 95 | |||
Refinery throughputs (mbpd):(c) | |||||
| Crude oil refined | 2,784 | 2,869 | |||
| Other charge and blendstocks | 210 | 215 | |||
| Net refinery throughput | 2,994 | 3,084 | |||
| Sour crude oil throughput percent | 49 | 52 | |||
| Sweet crude oil throughput percent | 51 | 48 | |||
Refined product yields (mbpd):(c) | |||||
| Gasoline | 1,488 | 1,533 | |||
| Distillates | 1,020 | 1,091 | |||
| Propane | 58 | 53 | |||
| Feedstocks and petrochemicals | 352 | 330 | |||
| Heavy fuel oil | 37 | 45 | |||
| Asphalt | 80 | 80 | |||
| Total | 3,035 | 3,132 | |||
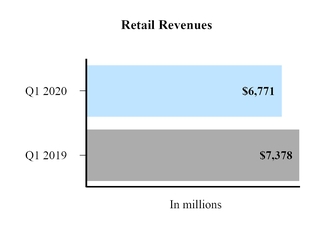
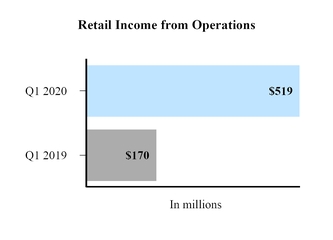
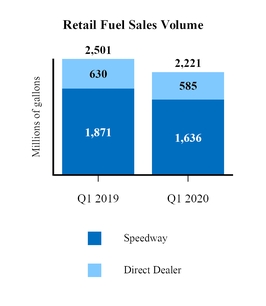
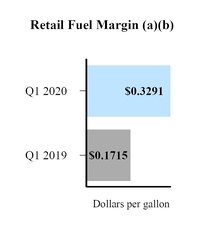
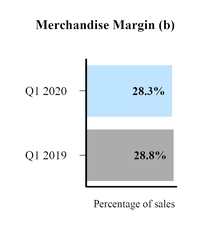
| Three Months Ended March 31, | ||||||||
| Key Financial and Operating Data | 2020 | 2019 | ||||||
Average fuel sales prices (dollars per gallon) | $ | 2.41 | $ | 2.58 | ||||
Merchandise sales (in millions) | $ | 1,461 | $ | 1,413 | ||||
Merchandise margin (in millions)(a)(b) | $ | 414 | $ | 407 | ||||
Same store gasoline sales volume (period over period)(c) | (8.3 | )% | (3.2 | )% | ||||
Same store merchandise sales (period over period)(c)(d) | 0.7 | % | 5.4 | % | ||||
| Convenience stores at period-end | 3,881 | 3,918 | ||||||
| Direct dealer locations at period-end | 1,070 | 1,062 | ||||||
Midstream
The following includes key financial and operating data for the first quarter of 20202021 compared to the first quarter of 2019.2020.
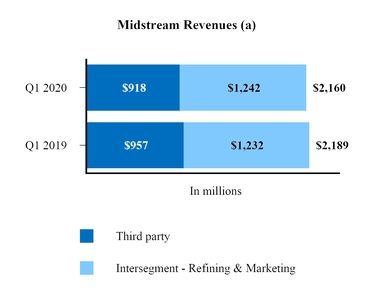
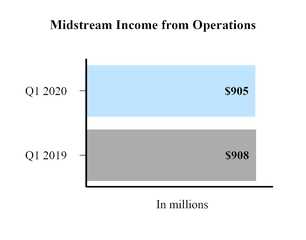
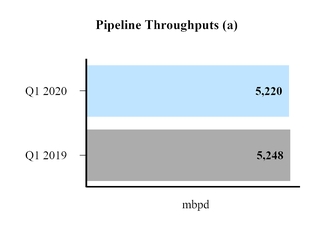
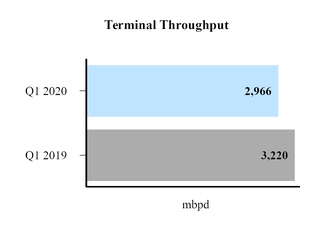
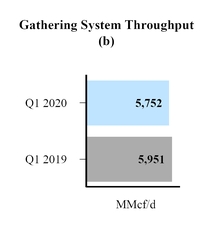
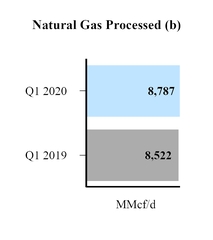
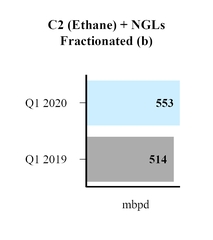
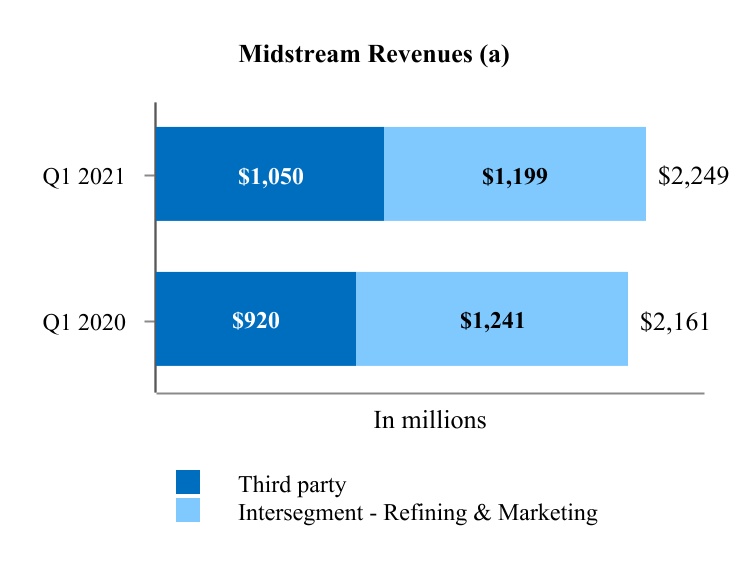
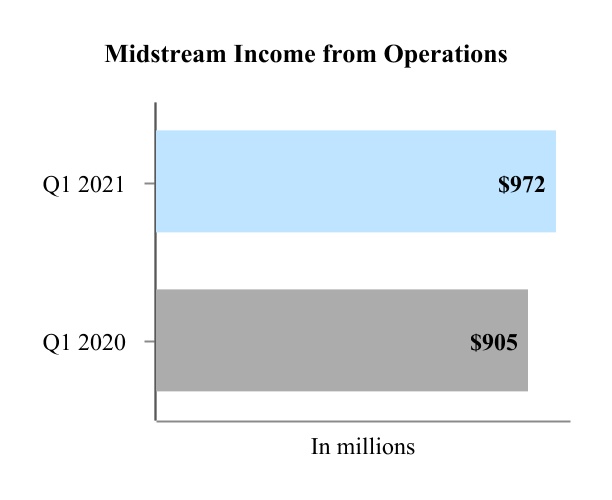
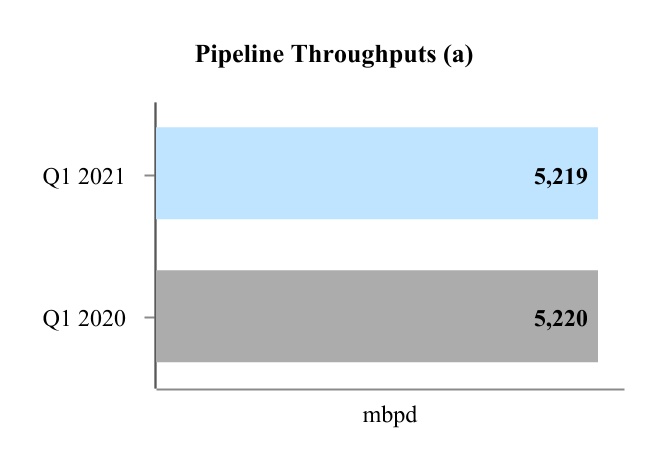

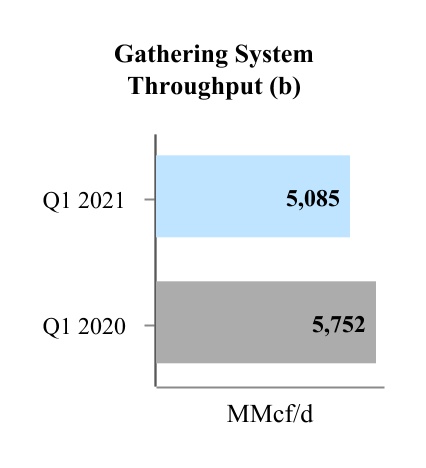
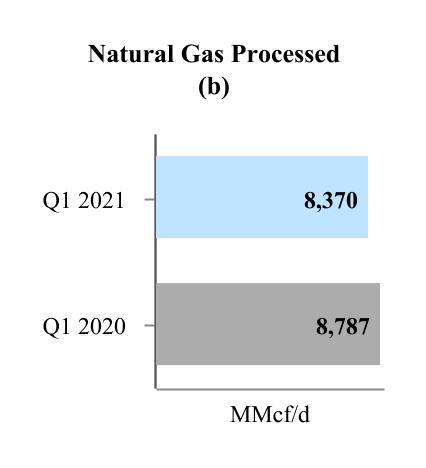
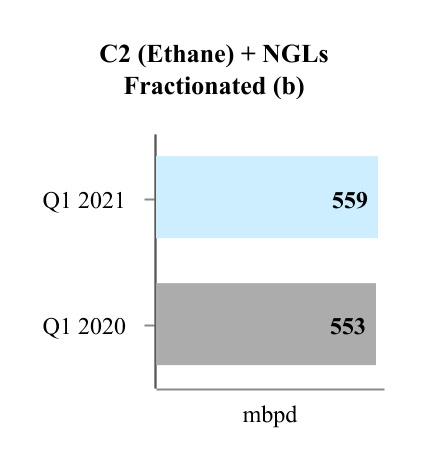
| Three Months Ended March 31, | ||||||||
| Benchmark Prices | 2020 | 2019 | ||||||
Natural Gas NYMEX HH ($ per MMBtu) | $ | 1.87 | $ | 2.87 | ||||
C2 + NGL Pricing ($ per gallon)(a) | $ | 0.40 | $ | 0.62 | ||||
42
| Three Months Ended March 31, | ||||||||||||||||||||||||||
| Benchmark Prices | 2021 | 2020 | ||||||||||||||||||||||||
Natural Gas NYMEX HH ($ per MMBtu) | $ | 2.72 | $ | 1.87 | ||||||||||||||||||||||
C2 + NGL Pricing ($ per gallon)(a) | $ | 0.73 | $ | 0.40 | ||||||||||||||||||||||
(a)C2 + NGL pricing based on Mont Belvieu prices assuming an NGL barrel of approximately 35 percent ethane, 35 percent propane, 6 percent iso-butane, 12 percent normal butane and 12 percent natural gasoline.
First Quarter 20202021 Compared to First Quarter 20192020
Midstream segment revenue decreased $29 million primarily due to lower natural gas and NGL prices during the quarter.
Corporate
Key Financial Information (in millions) | Three Months Ended March 31, | |||||||||||||||||||||||||
| 2021 | 2020 | |||||||||||||||||||||||||
Corporate(a) | $ | (157) | $ | (233) | ||||||||||||||||||||||
(a)Corporate costs consist primarily of 2019 as strong performance across MPLX’s base business was driven by stable, fee-based earnings primarilyMPC’s corporate administrative expenses and costs related to certain non-operating assets, except for corporate overhead expenses attributable to MPLX, which are included in the Midstream segment.
First Quarter 2021 Compared to First Quarter 2020
Corporate costs decreased $76 million largely due to cost reductions realized from pipeline volume commitments as well as contributions from organic growth projects.
Items not Allocated to Segments
Key Financial Information (in millions) | Three Months Ended March 31, | |||||||||||||||||||||||||
| 2021 | 2020 | |||||||||||||||||||||||||
| Items not allocated to segments: | ||||||||||||||||||||||||||
Transaction-related costs(a) | — | (8) | ||||||||||||||||||||||||
| Impairments | — | (9,137) | ||||||||||||||||||||||||
| LCM inventory valuation adjustment | — | (3,185) | ||||||||||||||||||||||||
Key Financial Information (in millions) | Three Months Ended March 31, | |||||||
| 2020 | 2019 | |||||||
| Items not allocated to segments: | ||||||||
Corporate and other unallocated items(a) | $ | (227 | ) | $ | (191 | ) | ||
| Capline restructuring gain | — | 207 | ||||||
| Transaction-related costs | (35 | ) | (91 | ) | ||||
| Impairments | (9,137 | ) | — | |||||
| Inventory market valuation adjustment | (3,220 | ) | — | |||||
First Quarter 20202021 Compared to First Quarter 2019
During the first quarter of 2020, we recorded impairment charges of approximately $9.14 billion, which includes $7.82 billion related to goodwill and long-lived assets and impairments of equity method investments of $1.32 billion, and an inventory market valuation adjustment charge of $3.22$3.19 billion primarily driven by the effects of COVID-19 and the decline in commodity prices.
43
Non-GAAP Financial Measures
Management uses certain financial measures to evaluate our operating performance that are calculated and presented on the basis of methodologies other than in accordance with GAAP. We believe these non-GAAP financial measures are useful to investors and analysts to assess our ongoing financial performance because, when reconciled to their most comparable GAAP financial measures, they provide improved comparability between periods through the exclusion of certain items that we believe are not indicative of our core operating performance and that may obscure our underlying business results and trends. These measures should not be considered a substitute for, or superior to, measures of financial performance prepared in accordance with GAAP, and our calculations thereof may not be comparable to similarly titled measures reported by other companies. The non-GAAP financial measures we use are as follows:
Refining & Marketing Margin
Refining margin is defined as sales revenue less the cost of refinery inputs and purchased products.products and excludes other items as reflected in the table below.
Reconciliation of Refining & Marketing income from operations to Refining & Marketing gross margin and Refining & Marketing margin
| Three Months Ended March 31, | |||||||||||||||||||||||||||||
| (in millions) | 2021 | 2020 | |||||||||||||||||||||||||||
Refining & Marketing income from operations(a) | $ | (598) | $ | (497) | |||||||||||||||||||||||||
| Plus (Less): | |||||||||||||||||||||||||||||
| Selling, general and administrative expenses | 456 | 556 | |||||||||||||||||||||||||||
| LCM inventory valuation adjustment | — | (3,185) | |||||||||||||||||||||||||||
| (Income) loss from equity method investments | (5) | 3 | |||||||||||||||||||||||||||
| Net gain on disposal of assets | (3) | — | |||||||||||||||||||||||||||
| Other income | (54) | (4) | |||||||||||||||||||||||||||
| Refining & Marketing gross margin | (204) | (3,127) | |||||||||||||||||||||||||||
| Plus (Less): | |||||||||||||||||||||||||||||
| Operating expenses (excluding depreciation and amortization) | 2,275 | 2,833 | |||||||||||||||||||||||||||
| LCM inventory valuation adjustment | — | 3,185 | |||||||||||||||||||||||||||
| Depreciation and amortization | 478 | 473 | |||||||||||||||||||||||||||
Gross margin excluded from Refining & Marketing margin(b) | (179) | (109) | |||||||||||||||||||||||||||
| Other taxes included in Refining & Marketing margin | (24) | (24) | |||||||||||||||||||||||||||
Refining & Marketing margin(a) | 2,346 | 3,231 | |||||||||||||||||||||||||||
(a)LCM inventory valuation adjustments are excluded from Refining & Marketing income from operations and Refining & Marketing margin.
(b)The gross margin, excluding depreciation and amortization, of other related operations included in the Refining & Marketing segment and processing of credit card transactions on behalf of certain of our marketing customers.
44
| Three Months Ended March 31, | |||||||||
Reconciliation of Refining & Marketing income from operations to Refining & Marketing margin (in millions) | 2020 | 2019 | |||||||
| Refining & Marketing income from operations | $ | (622 | ) | $ | (334 | ) | |||
| Plus (Less): | |||||||||
Refining operating costs(a) | 1,636 | 1,552 | |||||||
| Refining depreciation and amortization | 401 | 387 | |||||||
| Refining planned turnaround costs | 329 | 186 | |||||||
Distribution costs(b) | 1,290 | 1,290 | |||||||
| Distribution depreciation and amortization | 46 | 40 | |||||||
| (Income) loss from equity method investments | 3 | (1 | ) | ||||||
| Net gain on disposal of assets | — | (6 | ) | ||||||
| Other income | (4 | ) | (14 | ) | |||||
| Refining & Marketing margin | $ | 3,079 | $ | 3,100 | |||||
Reconciliation of income from discontinued operations to Speedway gross margin and Speedway margin
| Three Months Ended March 31, | ||||||||||||||||||||||||||||||||||||||
| Three Months Ended March 31, | ||||||||||||||||||||||||||||||||||||||
Reconciliation of Retail income from operations to Retail total margin (in millions) | 2020 | 2019 | ||||||||||||||||||||||||||||||||||||
| Retail income from operations | $ | 519 | $ | 170 | ||||||||||||||||||||||||||||||||||
| (in millions) | (in millions) | 2021 | 2020 | |||||||||||||||||||||||||||||||||||
Income from discontinued operations(a) | Income from discontinued operations(a) | $ | 307 | $ | 338 | |||||||||||||||||||||||||||||||||
| Plus (Less): | Plus (Less): | Plus (Less): | ||||||||||||||||||||||||||||||||||||
| Operating, selling, general and administrative expenses | Operating, selling, general and administrative expenses | 598 | 583 | Operating, selling, general and administrative expenses | 570 | 606 | ||||||||||||||||||||||||||||||||
| Depreciation and amortization | 125 | 126 | ||||||||||||||||||||||||||||||||||||
| Income from equity method investments | Income from equity method investments | (22 | ) | (17 | ) | Income from equity method investments | (19) | (22) | ||||||||||||||||||||||||||||||
| Net gain on disposal of assets | Net gain on disposal of assets | (1 | ) | (2 | ) | Net gain on disposal of assets | — | (1) | ||||||||||||||||||||||||||||||
| Other income | Other income | (49 | ) | (2 | ) | Other income | (38) | (49) | ||||||||||||||||||||||||||||||
| Retail total margin | $ | 1,170 | $ | 858 | ||||||||||||||||||||||||||||||||||
| Speedway gross margin | Speedway gross margin | 820 | 872 | |||||||||||||||||||||||||||||||||||
| Plus: | Plus: | |||||||||||||||||||||||||||||||||||||
| LCM inventory valuation adjustment | LCM inventory valuation adjustment | — | 35 | |||||||||||||||||||||||||||||||||||
| Depreciation and amortization | Depreciation and amortization | 2 | 99 | |||||||||||||||||||||||||||||||||||
Speedway margin(a) | Speedway margin(a) | $ | 822 | $ | 1,006 | |||||||||||||||||||||||||||||||||
| Retail total margin: | ||||||||||||||||||||||||||||||||||||||
| Speedway margin: | Speedway margin: | |||||||||||||||||||||||||||||||||||||
| Fuel margin | Fuel margin | $ | 731 | $ | 429 | Fuel margin | $ | 369 | $ | 579 | ||||||||||||||||||||||||||||
| Merchandise margin | Merchandise margin | 414 | 407 | Merchandise margin | 442 | 414 | ||||||||||||||||||||||||||||||||
| Other margin | Other margin | 25 | 22 | Other margin | 11 | 13 | ||||||||||||||||||||||||||||||||
| Retail total margin | $ | 1,170 | $ | 858 | ||||||||||||||||||||||||||||||||||
| Speedway margin | Speedway margin | $ | 822 | $ | 1,006 | |||||||||||||||||||||||||||||||||
LIQUIDITY AND CAPITAL RESOURCES
Cash Flows
Our consolidated cash and cash equivalents balance for continuing operations was approximately $1.69 billion$624 million at March 31, 20202021 compared to $1.53 billion$415 million at December 31, 2019.2020. Cash and cash equivalents for discontinued operations was $134 million at March 31, 2021 compared to $140 million at December 31, 2020. Net cash provided by (used in) operating activities, investing activities and financing activities are presented in the following table.
| Three Months Ended March 31, | Three Months Ended March 31, | |||||||||||||||||||||
| (In millions) | 2020 | 2019 | (In millions) | 2021 | 2020 | |||||||||||||||||
| Net cash provided by (used in): | Net cash provided by (used in): | Net cash provided by (used in): | ||||||||||||||||||||
| Operating activities | Operating activities | $ | (768 | ) | $ | 1,623 | Operating activities | $ | 454 | $ | (768) | |||||||||||
| Investing activities | Investing activities | (1,088 | ) | (1,520 | ) | Investing activities | (267) | (1,088) | ||||||||||||||
| Financing activities | Financing activities | 2,021 | (920 | ) | Financing activities | 16 | 2,021 | |||||||||||||||
| Total increase (decrease) in cash | Total increase (decrease) in cash | $ | 165 | $ | (817 | ) | Total increase (decrease) in cash | $ | 203 | $ | 165 | |||||||||||
Net cash provided by operating activities decreased $2.39increased $1.22 billion in the first three months of 20202021 compared to the first three months of 2019,2020, primarily due to an unfavorablea favorable change in working capital of $2.52$1.62 billion mainly due towhen comparing the change in working capital in both periods. These changes were partially offset by a decrease in accounts payable.cash provided by discontinued operations of $259 million which reflect the results of the Speedway business. Changes in working capital exclude changes in short-term debt.
45
Changes in working capital, excluding changes in short-term debt, were a net $2.03$348 million use of cash in the first three months of 2021 compared to a net $1.97 billion use of cash in the first three months of 2020 compared to a net $489 million source of cash in2020.
For the first three months of 2019.2021, changes in working capital were a net $348 million use of cash primarily due to the effects of increasing energy commodity prices at the end of the period on working capital. Accounts payable increased primarily due to increases in crude prices and volumes. Current receivables increased primarily due to higher crude and refined product prices. Inventories increased primarily due to increases in refined products and crude inventories.
For the first three months of 2020, changes in working capital, excluding the LCM reserve and changes in short-term debt, were a net $2.03$1.97 billion use of cash primarily due to the effects of decreasing energy commodity prices at the end of the period on working capital. Accounts payable decreased primarily due to a decrease in crude prices. Current receivables decreased primarily due to lower crude and refined product prices partially offset by an increase in crude volumes. Excluding the LCM reserve,inventories increased due to increases in crude and refined product inventories.
Net cash used in investing activities decreased $432$821 million in the first three months of 20202021 compared to the first three months of 2019,2020, primarily due to the following:
a decrease in additions to property, plant and equipment of $179$647 million primarily due to decreased capital expenditures in the first three months of 20202021 in our Midstream and Refining & Marketing segments; andsegments.
The consolidated statements of cash flows exclude changes to the consolidated balance sheets that did not affect cash. A reconciliation of additions to property, plant and equipment per the consolidated statements of cash flows to reported total capital expenditures and investments follows.
| Three Months Ended March 31, | ||||||||
| (In millions) | 2020 | 2019 | ||||||
| Additions to property, plant and equipment per the consolidated statements of cash flows | $ | 1,062 | $ | 1,241 | ||||
| Decrease in capital accruals | (166 | ) | (235 | ) | ||||
| Total capital expenditures | 896 | 1,006 | ||||||
| Investments in equity method investees (excludes acquisitions) | 169 | 325 | ||||||
| Total capital expenditures and investments | $ | 1,065 | $ | 1,331 | ||||
| Three Months Ended March 31, | ||||||||||||||
| (In millions) | 2021 | 2020 | ||||||||||||
| Additions to property, plant and equipment per the consolidated statements of cash flows | $ | 304 | $ | 951 | ||||||||||
| Decrease in capital accruals | (48) | (120) | ||||||||||||
| Total capital expenditures | 256 | 831 | ||||||||||||
| Investments in equity method investees (excludes acquisitions) | 51 | 169 | ||||||||||||
| Total capital expenditures and investments | $ | 307 | $ | 1,000 | ||||||||||
Financing activities were a net $16 million source of cash in the first three months of 2021 compared to a net $2.02 billion source of cash in the first three months of 2020 compared to2020.
•MPC had net borrowings of $693 million under its commercial paper program in the first three months of 2021.
•Long-term debt borrowings and repayments were a net $920$172 million usesource of cash in the first three months of 2019.
•Repurchases of 2019, MPLX had net borrowings of $425noncontrolling interests were $155 million under its revolving credit facility and ANDX had net borrowings of $159 million under its revolving credit facility. MPLX completed its acquisition of ANDX on July 30, 2019.
Derivative Instruments
See Item 3. Quantitative and Qualitative Disclosures about Market Risk for a discussion of derivative instruments and associated market risk.
Capital Resources
MPC, Excluding MPLX
We control MPLX through our ownership of the general partner, however, the creditors of MPLX do not have recourse to MPC’s general credit through guarantees or other financial arrangements. The assets of MPLX can only be used to settle its own obligations and its creditors have no recourse to our assets. Therefore, in the following table, we present the liquidity of MPC, excluding MPLX. MPLX liquidity is discussed in the following section.
Our liquidity, excluding MPLX, totaled $6.38$4.47 billion at March 31, 20202021 consisting of:
| March 31, 2021 | ||||||||||||||||||||
| (In millions) | Total Capacity | Outstanding Borrowings | Available Capacity | |||||||||||||||||
Bank revolving credit facility(a) | $ | 5,000 | $ | 1,301 | $ | 3,699 | ||||||||||||||
| 364-day bank revolving credit facility | 1,000 | — | 1,000 | |||||||||||||||||
Trade receivables facility(b) | 750 | — | 750 | |||||||||||||||||
Commercial paper borrowings(c) | — | $ | — | (1,717) | ||||||||||||||||
| Total | $ | 6,750 | $ | 1,301 | $ | 3,732 | ||||||||||||||
Cash and cash equivalents(d) | 734 | |||||||||||||||||||
| Total liquidity | $ | 4,466 | ||||||||||||||||||
| March 31, 2020 | ||||||||||||
| (In millions) | Total Capacity | Outstanding Borrowings | Available Capacity | |||||||||
Bank revolving credit facility(a)(b) | $ | 5,000 | $ | 2,001 | $ | 2,999 | ||||||
| 364-day bank revolving credit facility | 1,000 | — | $ | 1,000 | ||||||||
Trade receivables facility(c) | 750 | — | 750 | |||||||||
| Total | $ | 6,750 | $ | 2,001 | $ | 4,749 | ||||||
Cash and cash equivalents(d) | 1,633 | |||||||||||
| Total liquidity | $ | 6,382 | ||||||||||
(b)Availability under our $750 million trade receivables facility is a function of eligible trade receivables, which will be lower in a sustained lower price environment for refined products. (c)We do not intend to have outstanding commercial paper borrowings in excess of available capacity under bank revolving credit facilities. (d)Includes cash and cash equivalents classified as assets held for sale of $134 million (see Note 3 to the unaudited consolidated financial statements) and excludes cash and cash equivalents of MPLX of $24 million. |
Because of the alternatives available to us, including internally generated cash flow and access to capital markets and a commercial paper program, we believe that our short-term and long-term liquidity is adequate to fund not only our current operations, but also our near-term and long-term funding requirements, including capital spending programs, the repurchase of shares of our common stock, dividend payments, defined benefit plan contributions, repayment of debt maturities and other amounts that may ultimately be paid in connection with contingencies. We did not repurchase shares during the three months ended March 31, 2021. The timing and amount of future repurchases will depend upon several factors, including market and business conditions, and such repurchases may be initiated, suspended or discontinued at any time.
We have a commercial paper program that allows us to have a maximum of $2.0 billion in commercial paper outstanding. We do not intend to have outstanding commercial paper borrowings in excess of available capacity under our bank revolving credit facility. As ofAt March 31, 2020,2021, we had no$1.72 billion outstanding under the commercial paper borrowings outstanding.
| (Dollars in millions) | Total Capacity | Outstanding Borrowings | Outstanding Letters of Credit | Available Capacity | Expiration | |||||||||||||
| MPC 364-day bank revolving credit facility | $ | 1,000 | $ | — | $ | — | $ | 1,000 | September 2020 | |||||||||
| MPC 364-day bank revolving credit facility | 1,000 | — | — | 1,000 | April 2021 | |||||||||||||
MPC bank revolving credit facility(a) | 5,000 | 750 | 1 | 4,249 | October 2023 | |||||||||||||
MPC trade receivables securitization facility(b) | 517 | — | — | 517 | July 2021 | |||||||||||||
| Available capacity, excluding MPLX, as of May 5, 2020 | 6,766 | |||||||||||||||||
The MPC credit agreements and our trade receivables facility contain representations and warranties, affirmative and negative covenants and events of default that we consider usual and customary for agreements of these types. The financial covenant included in the MPC credit agreements requires us to maintain, as of the last day of each fiscal quarter, a ratio of Consolidated Net Debt to Total Capitalization (as defined in the MPC credit agreements) of no greater than 0.65 to 1.00. As of March 31, 2020,2021, we were in compliance with the covenants contained in the MPC bank revolving credit facility and our trade receivables facility, including the financial covenant with a ratio of Consolidated Net Debt to Total Capitalization of 0.310.40 to 1.00.
Our intention is to maintain an investment-grade credit profile. As of May 5, 2020,April 20, 2021, the credit ratings on our senior unsecured debt are as follows.
| Company | Rating Agency | Rating | ||||||
| MPC | Moody’s | Baa2 (negative outlook) | ||||||
| Standard & Poor’s | BBB (negative outlook) | |||||||
| Fitch | BBB | |||||||
47
The ratings reflect the respective views of the rating agencies. Although it is our intention to maintain a credit profile that supports an investment-grade rating, there is no assurance that these ratings will continue for any given period of time. The ratings may be revised or withdrawn entirely by the rating agencies if, in their respective judgments, circumstances so warrant.
None of the MPC credit agreements or our trade receivables facility contains credit rating triggers that would result in the acceleration of interest, principal or other payments in the event that our credit ratings are downgraded. However, any downgrades of our senior unsecured debt could increase the applicable interest rates, yields and other fees payable under such agreements and may limit our flexibility to obtain financing in the future, including to refinance existing indebtedness. In addition, a downgrade of our senior unsecured debt rating to below investment-grade levels could, under certain circumstances, decrease the amount of trade receivables that are eligible to be sold under our trade receivables facility, impact our ability to purchase crude oil on an unsecured basis and could result in us having to post letters of credit under existing transportation services or other agreements.
See Note 17 to the unaudited consolidated financial statements for further discussion of our debt.
MPLX
MPLX’s liquidity totaled $4.31$4.19 billion at March 31, 20202021 consisting of:
| March 31, 2020 | March 31, 2021 | |||||||||||||||||||||||||||||||
| (In millions) | Total Capacity | Outstanding Borrowings | Available Capacity | (In millions) | Total Capacity | Outstanding Borrowings | Available Capacity | |||||||||||||||||||||||||
| MPLX LP - bank revolving credit facility | MPLX LP - bank revolving credit facility | $ | 3,500 | $ | 750 | $ | 2,750 | MPLX LP - bank revolving credit facility | $ | 3,500 | $ | 835 | $ | 2,665 | ||||||||||||||||||
| MPC Intercompany Loan Agreement | MPC Intercompany Loan Agreement | 1,500 | — | 1,500 | MPC Intercompany Loan Agreement | 1,500 | — | 1,500 | ||||||||||||||||||||||||
| Total | Total | $ | 5,000 | $ | 750 | $ | 4,250 | Total | $ | 5,000 | $ | 835 | $ | 4,165 | ||||||||||||||||||
| Cash and cash equivalents | Cash and cash equivalents | 57 | Cash and cash equivalents | 24 | ||||||||||||||||||||||||||||
| Total liquidity | Total liquidity | $ | 4,307 | Total liquidity | $ | 4,189 | ||||||||||||||||||||||||||
The MPLX credit agreement and term loan agreement containcontains certain representations and warranties, affirmative and restrictive covenants and events of default that we consider to be usual and customary for an agreement of this type. The financial covenant requires MPLX to maintain a ratio of Consolidated Total Debt as of the end of each fiscal quarter to Consolidated EBITDA (both as defined in the MPLX credit agreement) for the prior four fiscal quarters of no greater than 5.0 to 1.0 (or 5.5 to 1.0 during the six-month period following certain acquisitions). Consolidated EBITDA is subject to adjustments for certain acquisitions completed and capital projects undertaken during the relevant period. Other covenants restrict MPLX and/or certain of its subsidiaries from incurring debt, creating liens on assets and entering into transactions with affiliates. As of March 31, 2020,2021, MPLX was in compliance with the covenants, including the financial covenant with a ratio of Consolidated Total Debt to Consolidated EBITDA of 3.803.8 to 1.0.
Our intention is to maintain an investment-grade credit profile for MPLX. As of May 5, 2020,April 20, 2021, the credit ratings on MPLX’s senior unsecured debt are as follows.
| Company | Rating Agency | Rating | ||||||
| MPLX | Moody’s | Baa2 (negative outlook) | ||||||
| Standard & Poor’s | BBB (negative outlook) | |||||||
| Fitch | BBB | |||||||
The ratings reflect the respective views of the rating agencies. Although it is our intention to maintain a credit profile that supports an investment-grade rating for MPLX, there is no assurance that these ratings will continue for any given period of time. The ratings may be revised or withdrawn entirely by the rating agencies if, in their respective judgments, circumstances so warrant.
The agreements governing MPLX’s debt obligations do not contain credit rating triggers that would result in the acceleration of interest, principal or other payments in the event that MPLX credit ratings are downgraded. However, any downgrades of MPLX senior unsecured debt to below investment grade ratings could increase the applicable interest rates, yields and other fees payable under such agreements. In addition, a downgrade of MPLX senior unsecured debt ratings to below investment-grade levels may limit MPLX’s ability to obtain future financing, including to refinance existing indebtedness.
See Item 8. Financial Statements and Supplementary Data – Note 17 for further discussion of MPLX’s debt.
Capital Requirements
Capital Investment Plan
MPC's capital investment plan for 2020 originally totaled2021 totals approximately $2.6$1.4 billion for capital projects and investments, excluding MPLX, capitalized interest, potential acquisitions and acquisitions.MPLX’s capital investment plan. MPC’s capital investment plan includes all of the planned capital spending for Refining & Marketing Retail and Corporate, as well as a portion of the planned capital investments in Midstream. MPLX’sMidstream and Speedway’s capital spending for the first quarter of 2021, which is now reported separately as discontinued operations. The remainder of the planned capital spending for Midstream reflects the capital investment plan for 2020 originally totaled approximately $1.75 billion.
| Capital Investment Plan | ||||||||||||
| (In millions) | Revised 2020 Outlook | Original 2020 Guidance | Reduction | |||||||||
| MPC, excluding MPLX | ||||||||||||
| Refining & Marketing | $ | 1,300 | $ | 1,550 | $ | (250 | ) | |||||
| Retail | 300 | 550 | (250 | ) | ||||||||
| Midstream - Other | 230 | 300 | (70 | ) | ||||||||
| Corporate and Other | 120 | 200 | (80 | ) | ||||||||
| Total MPC, excluding MPLX | $ | 1,950 | $ | 2,600 | $ | (650 | ) | |||||
| Midstream - MPLX | $ | 1,050 | $ | 1,750 | $ | (700 | ) | |||||
Capital expenditures and investments for MPC and MPLX are summarized below.
| Three Months Ended March 31, | ||||||||||||||
| (In millions) | 2021 | 2020 | ||||||||||||
Capital expenditures and investments:(a) | ||||||||||||||
| MPC continuing operations, excluding MPLX | ||||||||||||||
| Refining & Marketing | $ | 134 | $ | 470 | ||||||||||
| Midstream - Other | 16 | 76 | ||||||||||||
Corporate and Other(b) | 21 | 27 | ||||||||||||
| Total MPC continuing operations, excluding MPLX | $ | 171 | $ | 573 | ||||||||||
| MPC discontinued operations - Speedway | $ | 103 | $ | 65 | ||||||||||
| Midstream - MPLX | $ | 122 | $ | 398 | ||||||||||
(a) Capital expenditures exclude changes in capital accruals.
| Three Months Ended March 31, | ||||||||
| (In millions) | 2020 | 2019 | ||||||
| MPC, excluding MPLX | ||||||||
| Refining & Marketing | $ | 459 | $ | 394 | ||||
| Retail | 76 | 73 | ||||||
| Midstream - Other | 76 | 194 | ||||||
Corporate and Other(a) | 56 | 41 | ||||||
| Total MPC, excluding MPLX | $ | 667 | $ | 702 | ||||
| Midstream - MPLX | $ | 398 | $ | 629 | ||||
(b) Excludes capitalized interest of $14 million and $29 million for the three months ended March 31, 2021 and 2020, respectively. |
Capital expenditures and investments in affiliates during the three months ended March 31, 20202021 were primarily for Midstream and Refining & Marketing segment projects and investments in affiliates.projects.
Other Capital Requirements
During the three months ended March 31, 2020,2021, we contributed $3$226 million to our funded pension plans. We may choose to make additional contributions to our pension plans.
On April 29, 2020,28, 2021, our board of directors approved a dividend of $0.58 per share on common stock. The dividend is payable June 10, 2020,2021, to shareholders of record as of the close of business on May 20, 2020.19, 2021.
As of March 31, 2021, $93 million of restructuring expenses were accrued as restructuring reserves in our consolidated balance sheet. We expect cash payments for the remaining exit and disposal costs reserve to occur through 2024.
We may, from time to time, repurchase our senior notes in the open market, in tender offers, in privately-negotiated transactions or otherwise in such volumes, at such prices and upon such other terms as we deem appropriate.
49
Share Repurchases
During the three months ended March 31, 2020 and 2019. See Note 82021, 6,272,981 MPLX common units had been repurchased at an average cost per unit of $24.78. Total cash paid for units repurchased during the three months ended March 31, 2021 was $155 million. As of March 31, 2021, MPLX had agreements to acquire 291,400 additional common units for $7 million, which settled in early April 2021. As of March 31, 2021, $812 million remained outstanding on the unaudited consolidated financial statementsprogram for further discussion of the share repurchase plans.
| Three Months Ended March 31, | |||||||
| (In millions, except per share data) | 2020 | 2019 | |||||
| Number of shares repurchased | — | 14 | |||||
| Cash paid for shares repurchased | $ | — | $ | 885 | |||
| Average cost per share | $ | — | $ | 62.98 | |||
We may utilize various methods to effect the repurchases, which could include open market repurchases, negotiated block transactions, tender offers, accelerated share repurchases or open market solicitations for shares, some of which may be effected through Rule 10b5-1 plans. The timing and amount of future repurchases, if any, will depend upon several factors, including market and business conditions, and such repurchases may be discontinued at any time.
Contractual Cash Obligations
As of March 31, 2020,2021, our contractual cash obligations included long-term debt, capital and operating lease obligations, purchase obligations and other long-term liabilities. During the first three months of 2020,2021, our long-term debt commitments increased approximately $2.55 billion$620 million primarily due to borrowings under the MPC and MPLX bank revolving credit facilities.facility and commercial paper program and the MPLX revolving credit facility, partially offset by the repayment of $1.0 billion of MPC senior notes and the redemption of $750 million of MPLX senior notes.
Off-Balance Sheet Arrangements
Off-balance sheet arrangements comprise those arrangements that may potentially impact our liquidity, capital resources and results of operations, even though such arrangements are not recorded as liabilities under U.S. GAAP. Our off-balance sheet arrangements are limited to indemnities and guarantees that are described below. Although these arrangements serve a variety of our business purposes, we are not dependent on them to maintain our liquidity and capital resources, and we are not aware of any circumstances that are reasonably likely to cause the off-balance sheet arrangements to have a material adverse effect on our liquidity and capital resources.
We have provided various guarantees related to equity method investees. In conjunction with our spinoff from Marathon Oil, we entered into various indemnities and guarantees to Marathon Oil. These arrangements are described in Note 22 to the unaudited consolidated financial statements.
ENVIRONMENTAL MATTERS AND COMPLIANCE COSTS
We have incurred and may continue to incur substantial capital, operating and maintenance, and remediation expenditures as a result of environmental laws and regulations. If these expenditures, as with all costs, are not ultimately reflected in the prices of our products and services, our operating results will be adversely affected. We believe that substantially all of our competitors must comply with similar environmental laws and regulations. However, the specific impact on each competitor may vary depending on a number of factors, including the age and location of its operating facilities, marketing areas, production processes and whether it is also engaged in the petrochemical business or the marine transportation of crude oil and refined products.
There have been no significant changes to our environmental matters and compliance costs during the three months ended March 31, 2020.2021.
CRITICAL ACCOUNTING ESTIMATES
As of March 31, 2020,2021, there have been no significant changes to our critical accounting estimates since our Annual Report on Form 10-K for the year ended December 31, 2019 except as noted below.2020.
ACCOUNTING STANDARDS NOT YET ADOPTED
ITEM 3. QUANTITATIVE AND QUALITATIVE DISCLOSURES ABOUT MARKET RISK
For a detailed discussion of our risk management strategies and our derivative instruments, see Item 7A. Quantitative and Qualitative Disclosures about Market Risk in our Annual Report on Form 10-K for the year ended December 31, 2019.2020.
See Notes 15 and 16 to the unaudited consolidated financial statements for more information about the fair value measurement of our derivatives, as well as the amounts recorded in our consolidated balance sheets and statements of income. We do not designate any of our commodity derivative instruments as hedges for accounting purposes.
The following table includes the composition of net gains and losses on our commodity derivative positions as of March 31, 2021 and 2020, and 2019, respectively.
| Three Months Ended March 31, | ||||||||
| (In millions) | 2020 | 2019 | ||||||
| Realized gain on settled derivative positions | $ | 2 | $ | 39 | ||||
| Unrealized gain (loss) on open net derivative positions | 213 | (139 | ) | |||||
| Net gain (loss) | $ | 215 | $ | (100 | ) | |||
| Three Months Ended March 31, | ||||||||||||||
| (In millions) | 2021 | 2020 | ||||||||||||
| Realized gain (loss) on settled derivative positions | $ | (76) | $ | 2 | ||||||||||
| Unrealized gain on open net derivative positions | 1 | 213 | ||||||||||||
| Net gain (loss) | $ | (75) | $ | 215 | ||||||||||
See Note 16 to the unaudited consolidated financial statements for additional information on our open derivative positions at March 31, 2020.2021.
Sensitivity analysis of the effects on income from operations (“IFO”) of hypothetical 10 percent and 25 percent increases and decreases in commodity prices for open commodity derivative instruments as of March 31, 20202021 is provided in the following table.
| Change in IFO from a Hypothetical Price Increase of | Change in IFO from a Hypothetical Price Decrease of | |||||||||||||||
| (In millions) | 10% | 25% | 10% | 25% | ||||||||||||
| As of March 31, 2020 | ||||||||||||||||
| Crude | $ | (56 | ) | $ | (140 | ) | $ | 58 | $ | 144 | ||||||
| Refined products | 12 | 29 | (12 | ) | (29 | ) | ||||||||||
| Blending products | (2 | ) | (5 | ) | 2 | 5 | ||||||||||
| Embedded derivatives | (5 | ) | (11 | ) | 5 | 11 | ||||||||||
| Change in IFO from a Hypothetical Price Increase of | Change in IFO from a Hypothetical Price Decrease of | |||||||||||||||||||||||||
| (In millions) | 10% | 25% | 10% | 25% | ||||||||||||||||||||||
| As of March 31, 2021 | ||||||||||||||||||||||||||
| Crude | $ | (38) | $ | (96) | $ | 38 | $ | 96 | ||||||||||||||||||
| Refined products | 1 | 4 | (1) | (4) | ||||||||||||||||||||||
| Blending products | 10 | 25 | (10) | (25) | ||||||||||||||||||||||
| Soybean oil | (13) | (32) | 13 | 32 | ||||||||||||||||||||||
| Embedded derivatives | (7) | (17) | 7 | 17 | ||||||||||||||||||||||
We remain at risk for possible changes in the market value of commodity derivative instruments; however, such risk should be mitigated by price changes in the underlying physical commodity. Effects of these offsets are not reflected in the above sensitivity analysis.
We evaluate our portfolio of commodity derivative instruments on an ongoing basis and add or revise strategies in anticipation of changes in market conditions and in risk profiles. Changes to the portfolio after March 31, 20202021 would cause future IFO effects to differ from those presented above.
Sensitivity analysis of the effect of a hypothetical 100-basis-point change in interest rates on long-term debt, including the portion classified as current and excluding finance leases, as of March 31, 20202021 is provided in the following table. Fair value of cash and cash equivalents, receivables, accounts payable and accrued interest approximate carrying value and are relatively insensitive to changes in interest rates due to the short-term maturity of the instruments. Accordingly, these instruments are excluded from the table.
51
| (In millions) | Fair Value as of March 31, 2021(a) | Change in Fair Value(b) | Change in Net Income for the Three Months Ended March 31, 2021(c) | |||||||||||||||||
| Long-term debt | ||||||||||||||||||||
| Fixed-rate | $ | 30,195 | $ | 2,648 | n/a | |||||||||||||||
| Variable-rate | 4,852 | n/a | 8 | |||||||||||||||||
(a)Fair value was based on market prices, where available, or current borrowing rates for financings with similar terms and maturities.
| (In millions) | Fair Value as of March 31, 2020(a) | Change in Fair Value(b) | Change in Net Income for the Three Months Ended March 31, 2020(c) | ||||||||
| Long-term debt | |||||||||||
| Fixed-rate | $ | 22,289 | $ | 1,772 | n/a | ||||||
| Variable-rate | 3,751 | n/a | 8 | ||||||||
(b) |
| Assumes a 100-basis-point decrease in the weighted average yield-to-maturity at |
(c),Assumes a 100-basis-point change in interest rates. The change to net income was based on the weighted average balance of debt outstanding for the three months ended March 31, 2021.
At March 31, 2021, our portfolio of long-term debt was comprised of fixed-rate instruments and variable-rate borrowings. The fair value of our fixed-rate debt is relatively sensitive to interest rate fluctuations. Our sensitivity to interest rate declines and corresponding increases in the fair value of our debt portfolio unfavorably affects our results of operations and cash flows only when we elect to repurchase or otherwise retire fixed-rate debt at prices above carrying value. Interest rate fluctuations generally do not impact the fair value of borrowings under our variable-rate debt, but may affect our results of operations and cash flows.
See Note 15 to the unaudited consolidated financial statements for additional information on the fair value of our debt.
ITEM 4. CONTROLS AND PROCEDURES
Disclosure Controls and Procedures
An evaluation of the effectiveness of the design and operation of our disclosure controls and procedures (as defined in RulesRule 13a-15(e) under the Securities Exchange Act of 1934, as amended) was carried out under the supervision and with the participation of our management, including our chief executive officer and chief financial officer. Based upon that evaluation, the chief executive officer and chief financial officer concluded that the design and operation of these disclosure controls and procedures were effective as of March 31, 2020,2021, the end of the period covered by this report.
Changes in Internal Control over Financial Reporting
During the quarter ended March 31, 2020,2021, there were no changes in our internal control over financial reporting that have materially affected, or are reasonably likely to materially affect, our internal control over financial reporting.
52
PART II – OTHER INFORMATION
ITEM 1. LEGAL PROCEEDINGS
We are the subject of, or a party to, a number of pending or threatened legal actions, contingencies and commitments involving a variety of matters, including laws and regulations relating to the environment. While it is possible that an adverse result in one or more of the lawsuits or proceedings in which we are a defendant could be material to us, based upon current information and our experience as a defendant in other matters, we believe that these lawsuits and proceedings, individually or in the aggregate, will not have a material adverse effect on our consolidated results of operations, financial position or cash flows. Except as described below, there have been no material changes to the legal proceedings previously disclosed in our Annual Report on Form 10-K.
Litigation
Tesoro High Plains Pipeline
In connection with MPLX’s 9.19 percent indirect interestearly July 2020, Tesoro High Plains Pipeline Company, LLC (“THPP”), a subsidiary of MPLX, received a Notification of Trespass Determination from the Bureau of Indian Affairs (“BIA”) relating to a portion of the Tesoro High Plains Pipeline that crosses the Fort Berthold Reservation in North Dakota. The notification covered the rights of way for 23 tracts of land and demanded the immediate cessation of pipeline operations. The notification also assessed trespass damages of approximately $187 million. THPP appealed this determination, which triggered an automatic stay of the requested pipeline shutdown and payment. On October 29, the Assistant Secretary - Indian Affairs issued an order vacating the BIA’s trespass order and requiring the Regional Director for the BIA Great Plains Region to issue a joint venture that owns and operatesnew decision on or before December 15 covering all 34 tracts at issue. On December 15, the Dakota Access Pipeline and Energy Transfer Crude Oil Pipeline projects, collectively referredRegional Director of the BIA issued a new trespass notice to as the Bakken Pipeline system, MPLX has entered into a Contingent Equity Contribution Agreement whereby MPLX LP, alongTHPP consistent with the other joint venture ownersAssistant Secretary - Indian Affairs order vacating the prior trespass order. The new order found that THPP was in trespass and assessed trespass damages of approximately $4 million (including interest). The order also required THPP to immediately cease and desist use of the Bakken Pipeline system, have agreed to make equity contributions toportion of the joint venture upon certain events occurring to allowpipeline that crosses the entities that ownproperty at issue. The new order was appealed, and operate the Bakken Pipeline system to satisfy their senior note payment obligations. The senior notes were issued to repay amounts owedwas upheld by the pipeline companies to fundAssistant Secretary - Indian Affairs. THPP has complied with the cost of construction of Bakken Pipeline system.
MPLX continues to work towards a settlement of this matter with holders of the EISproperty rights at issue.
Climate Change
On April 26, 2021, Anne Arundel County, Maryland, filed suit in the Circuit Court for Anne Arundel County, Maryland, against 26 energy industry defendants, including MPC and the vacatur is deemed temporary, MPLX would haveSpeedway. The claims made in this lawsuit are substantially similar to contribute its 9.19 percent pro rata share of funds required to pay interest accruing on the notes while the pipeline is shutdown and its 9.19 percent pro rata share of any costs to remediate any deficiencies to reinstate the permit and/or return the pipeline into operation. If the court vacates the permit and such action resultsthose made in a permanent shutdown of the pipeline, MPLX would have to contribute its 9.19 percent pro rata share of the cost to redeem the bonds (including the one percent redemption premium required pursuant to the indenture governing the notes) and any accrued and unpaid interest, if any.MPC’s previously disclosed climate change litigation.
Environmental Proceedings
There have been no material changes to the environmental proceedings previously disclosed in our Annual Report on Form 10-K for the year ended December 31, 2019 (the “2019 10-K”), governmental and other entities in California, New York, Maryland and Rhode Island have filed lawsuits against coal, gas, oil and petroleum companies, including the Company. The lawsuits allege damages as a result of climate change and the plaintiffs are seeking unspecified damages and abatement under various tort theories. In March 2020, the City and County of Honolulu, Hawaii filed suit against 20 oil and gas defendants, including MPC, making similar allegations. Similar lawsuits may be filed in other jurisdictions. At this early stage, the ultimate outcome of these matters remain uncertain, and neither the likelihood of an unfavorable outcome nor the ultimate liability, if any, can be determined.
53
ITEM 1A. RISK FACTORS
ITEM 2. UNREGISTERED SALES OF EQUITY SECURITIES AND USE OF PROCEEDS
The following table sets forth a summary of our purchases during the quarter ended March 31, 2020,2021, of equity securities that are registered by MPC pursuant to Section 12 of the Securities Exchange Act of 1934, as amended.
| Period | Total Number of Shares Purchased(a) | Average Price Paid per Share(b) | Total Number of Shares Purchased as Part of Publicly Announced Plans or Programs | Maximum Dollar Value of Shares that May Yet Be Purchased Under the Plans or Programs(c) | ||||||||||||||||||||||
| 01/01/2021-01/31/2021 | 61 | $ | 41.26 | — | $ | 2,954,604,016 | ||||||||||||||||||||
| 02/01/2021-02/28/2021 | 440 | 43.19 | — | $ | 2,954,604,016 | |||||||||||||||||||||
| 03/01/2021-03/31/2021 | — | — | — | $ | 2,954,604,016 | |||||||||||||||||||||
| Total | 501 | 42.96 | — | |||||||||||||||||||||||
(a)The amounts in this column include 61, 440 and 0 shares of our common stock delivered by employees to MPC, upon vesting of restricted stock, to satisfy tax withholding requirements in January, February and March, respectively.
(b)Amounts in this column reflect the weighted average price paid for shares tendered to us in satisfaction of employee tax withholding obligations upon the vesting of restricted stock granted under our stock plans.
(c)On April 30, 2018, we announced that our board of directors had approved a $5 billion share repurchase authorization in addition to the remaining authorization pursuant to the May 31, 2017 announcement. These share purchase authorizations have no expiration date. The share repurchase authorization announced on April 30, 2018, together with prior authorizations, results in a total of $18 billion of share repurchase authorizations since January 1, 2012.
54
| Period | Total Number of Shares Purchased(a) | Average Price Paid per Share(b) | Total Number of Shares Purchased as Part of Publicly Announced Plans or Programs | Maximum Dollar Value of Shares that May Yet Be Purchased Under the Plans or Programs(c) | ||||||||||
| 01/01/2020-01/31/2020 | — | $ | — | — | $ | 2,954,604,016 | ||||||||
| 02/01/2020-02/29/2020 | 1,572 | 53.37 | — | 2,954,604,016 | ||||||||||
| 03/01/2020-03/31/2020 | 22,722 | 46.95 | — | 2,954,604,016 | ||||||||||
| Total | 24,294 | 47.37 | — | |||||||||||
ITEM 6. EXHIBITS
| Incorporated by Reference | Filed Herewith | Furnished Herewith | ||||||||||||||||||||||||||||||||||||||||||
Exhibit Number | Exhibit Description | Form | Exhibit | Filing Date | SEC File No. | |||||||||||||||||||||||||||||||||||||||
| 2.1† | 8-K | 2.1 | 4/30/2018 | 001-35054 | ||||||||||||||||||||||||||||||||||||||||
| 2.2 | S-4/A | 2.2 | 7/5/2018 | 333-225244 | ||||||||||||||||||||||||||||||||||||||||
| 2.3 | 8-K | 2.1 | 9/18/2018 | 001-35054 | ||||||||||||||||||||||||||||||||||||||||
| 2.4† | 8-K | 2.1 | 5/8/2019 | 001-35054 | ||||||||||||||||||||||||||||||||||||||||
| 2.5† | 8-K | 2.1 | 8/3/2020 | 001-35054 | ||||||||||||||||||||||||||||||||||||||||
| 2.6 | 10-K | 2.7 | 2/26/2021 | 001-35054 | ||||||||||||||||||||||||||||||||||||||||
| 10.1 | 10-K | 10.73 | 2/26/2021 | 001-35054 | ||||||||||||||||||||||||||||||||||||||||
| 10.2 | 10-K | 10.74 | 2/26/2021 | 001-35054 | ||||||||||||||||||||||||||||||||||||||||
| 3.1 | 8-K | 3.2 | 10/1/2018 | 001-35054 | ||||||||||||||||||||||||||||||||||||||||
| 3.2 | 10-K | 3.2 | 2/28/2019 | 001-35054 | ||||||||||||||||||||||||||||||||||||||||
| 31.1 | X | |||||||||||||||||||||||||||||||||||||||||||
| 31.2 | X | |||||||||||||||||||||||||||||||||||||||||||
| 32.1 | X | |||||||||||||||||||||||||||||||||||||||||||
| 32.2 | X | |||||||||||||||||||||||||||||||||||||||||||
| 101.INS | Inline XBRL Instance Document - the instance document does not appear in the Interactive Data File because its XBRL tags are embedded with the Inline XBRL document. | |||||||||||||||||||||||||||||||||||||||||||
| 101.SCH | Inline XBRL Taxonomy Extension Schema Document. | X | ||||||||||||||||||||||||||||||||||||||||||
| 101.PRE | Inline XBRL Taxonomy Extension Presentation Linkbase Document. | X | ||||||||||||||||||||||||||||||||||||||||||
| 101.CAL | Inline XBRL Taxonomy Extension Calculation Linkbase Document. | X | ||||||||||||||||||||||||||||||||||||||||||
| 101.DEF | Inline XBRL Taxonomy Extension Definition Linkbase Document. | X | ||||||||||||||||||||||||||||||||||||||||||
| 101.LAB | Inline XBRL Taxonomy Extension Label Linkbase Document. | X | ||||||||||||||||||||||||||||||||||||||||||
| 104 | Cover Page Interactive Data File (formatted as Inline XBRL and contained in Exhibit 101). | |||||||||||||||||||||||||||||||||||||||||||
† The exhibits and schedules have been omitted pursuant to Item 601(b)(2) of Regulation S-K and will be provided to the Securities and Exchange Commission upon request.
55
| Incorporated by Reference | Filed Herewith | Furnished Herewith | ||||||||||||
Exhibit Number | Exhibit Description | Form | Exhibit | Filing Date | SEC File No. | |||||||||
| 2.1* | 8-K | 2.1 | 4/30/2018 | 001-35054 | ||||||||||
| 2.2 | S-4/A | 2.2 | 7/5/2018 | 333-225244 | ||||||||||
| 2.3 | 8-K | 2.1 | 9/18/2018 | 001-35054 | ||||||||||
| 2.4 * | 8-K | 2.1 | 5/8/2019 | 001-35054 | ||||||||||
| 3.1 | 8-K | 3.2 | 10/1/2018 | 001-35054 | ||||||||||
| 3.2 | 10-K | 3.2 | 2/28/2019 | 001-35054 | ||||||||||
| 4.1 | 8-K | 4.1 | 4/27/2020 | 001-35054 | ||||||||||
| 10.1 | 8-K | 10.1 | 4/27/2020 | 001-35054 | ||||||||||
| 10.2 | X | |||||||||||||
| 10.3 | X | |||||||||||||
| 10.4 | X | |||||||||||||
| 10.5 | X | |||||||||||||
| 10.6 | X | |||||||||||||
| 31.1 | X | |||||||||||||
| 31.2 | X | |||||||||||||
| 32.1 | X | |||||||||||||
| 32.2 | X | |||||||||||||
| 101.INS | Inline XBRL Instance Document - the instance document does not appear in the Interactive Data File because its XBRL tags are embedded with the Inline XBRL document. | |||||||||||||
| 101.SCH | Inline XBRL Taxonomy Extension Schema Document. | X | ||||||||||||
| 101.PRE | Inline XBRL Taxonomy Extension Presentation Linkbase Document. | X | ||||||||||||
| 101.CAL | Inline XBRL Taxonomy Extension Calculation Linkbase Document. | X | ||||||||||||
| 101.DEF | Inline XBRL Taxonomy Extension Definition Linkbase Document. | X | ||||||||||||
| 101.LAB | Inline XBRL Taxonomy Extension Label Linkbase Document. | X | ||||||||||||
| 104 | Cover Page Interactive Data File (formatted as Inline XBRL and contained in Exhibit 101). | |||||||||||||
SIGNATURES
Pursuant to the requirements of the Securities Exchange Act of 1934, the registrant has duly caused this report to be signed on its behalf by the undersigned thereunto duly authorized.
| May 6, 2021 | MARATHON PETROLEUM CORPORATION | |||||||
| By: | ||||||||
| /s/ John J. Quaid | ||||||||
John J. Quaid Senior Vice President and Controller | ||||||||
56