For support.
UNITED STATES SECURITIES AND EXCHANGE COMMISSION
Washington, D.C. 20549
Form 10-Q
(Mark One)
☒QUARTERLY REPORT PURSUANT TO SECTION 13 OR 15(d) OF THE SECURITIES EXCHANGE ACT OF 1934
| ☒ | QUARTERLY REPORT PURSUANT TO SECTION 13 OR 15(d) OF THE SECURITIES EXCHANGE ACT OF 1934 |
For the quarterly period ended June 30, 20182019
OR
☐TRANSITION REPORT PURSUANT TO SECTION 13 OR 15(d) OF THE SECURITIES EXCHANGE ACT OF 1934
| ☐ | TRANSITION REPORT PURSUANT TO SECTION 13 OR 15(d) OF THE SECURITIES EXCHANGE ACT OF 1934 |
Commission File Number 001-35299


ALKERMES PUBLIC LIMITED COMPANY
(Exact name of registrant as specified in its charter)
| | |
Ireland | | 98-1007018 |
(State or other jurisdiction of incorporation or organization) | | (I.R.S. Employer Identification No.) |
Connaught House
1 Burlington Road
Dublin 4, Ireland D04 C5Y6
(Address of principal executive offices)
+ 353-1-772-8000
(Registrant’s telephone number, including area code)
Securities registered pursuant to Section 12(b) of the Act:
Title of each class | | Trading Symbol(s) | | Name of each exchange on which registered |
Ordinary shares, $0.01 par value | | ALKS | | Nasdaq Global Select Market |
Indicate by check mark whether the registrant (1) has filed all reports required to be filed by Section 13 or 15(d) of the Securities Exchange Act of 1934 during the preceding 12 months (or for such shorter period that the registrant was required to file such reports), and (2) has been subject to such filing requirements for the past 90 days. Yes ☒ No ☐
Indicate by check mark whether the registrant has submitted electronically every Interactive Data File required to be submitted and posted pursuant to Rule 405 of Regulation S-T (§ 232.405 of this chapter) during the preceding 12 months (or for such shorter period that the registrant was required to submit and post such files). Yes ☒ No ☐
Indicate by check mark whether the registrant is a large accelerated filer, an accelerated filer, a non-accelerated filer, smaller reporting company, or an emerging growth company. See the definitions of “large accelerated filer,” “accelerated filer,” “smaller reporting company,” and “emerging growth company” in Rule 12b-2 of the Exchange Act.
| | |
Large accelerated filer ☒ | | Accelerated filer ☐ |
Non-accelerated filer ☐ | | Smaller reporting company ☐ |
Emerging growth company ☐
| | Emerging growth company ☐ |
If an emerging growth company, indicate by check mark if the registrant has elected not to use the extended transition period for complying with any new or revised financial accounting standards provided pursuant to Section 13(a) of the Exchange Act. ☐
Indicate by check mark whether the registrant is a shell company (as defined in Rule 12b-2 of the Exchange Act): Yes ☐ No ☒
The number of the registrant’s ordinary shares, $0.01 par value, outstanding as of July 23, 201822, 2019 was 155,315,178157,130,612 shares.
ALKERMES PLC AND SUBSIDIARIES
QUARTERLY REPORT ON FORM 10-Q
FOR THE QUARTERLY PERIOD ENDED JUNE 30, 2018
2019
Cautionary Note Concerning Forward-Looking Statements
This document contains and incorporates by reference “forward-looking“forward‑looking statements” within the meaning of Section 27A of the Securities Act of 1933, as amended (the “Securities Act”), and Section 21E of the Securities Exchange Act of 1934, as amended (the “Exchange Act”). In some cases, these statements can be identified by the use of forward-lookingforward‑looking terminology such as “may,” “will,” “could,” “should,” “would,” “expect,” “anticipate,” “continue,” “believe,” “plan,” “estimate,” “intend,” or other similar words. These statements discuss future expectations and contain projections of results of operations or of financial condition, or state trends and known uncertainties or other forward-lookingforward‑looking information. Forward-looking statements in this Quarterly Report on Form 10-Q (“Form 10-Q”) include, without limitation, statements regarding:
●our expectations regarding our financial performance, including revenues, expenses, gross margins, liquidity, capital expenditures and income taxes;
●our expectations regarding our products, including the development, regulatory (including expectations about regulatory filings, regulatory approvals and regulatory timelines), therapeutic and commercial scope and potential of such products and the costs and expenses related thereto;
●our expectations regarding the initiation, timing and results of clinical trials of our products;
●our expectations regarding the competitive landscape, and changes therein, related to our products, including competition from generic forms of our products, our development programs, and our industry generally;
●our expectations regarding the financial impact of currency exchange rate fluctuations and valuations;
●our expectations regarding future amortization of intangible assets;
●our expectations regarding our collaborations, licensing arrangements and other significant agreements with third parties relating to our products, including our development programs;
●our expectations regarding the impact of new legislation and related regulations, including the Tax Cuts and Jobs Act of 2017, and the adoption of new accounting pronouncements;
●our expectations regarding near‑term changes in the nature of our market risk exposures or in management’s objectives and strategies with respect to managing such exposures;
●our ability to comply with restrictive covenants of our indebtedness and our ability to fund our debt service obligations;
●our expectations regarding future capital requirements and capital expenditures and our ability to finance our operations and capital requirements;
●our expectations regarding the timing, outcome and impact of administrative, regulatory, legal and other proceedings related to our patents, other proprietary and intellectual property (“IP”) rights, and our products, including the commercialization of such products; and
●other factors discussed elsewhere in this Form 10-Q.
| • | our expectations regarding our financial performance, including revenues, expenses, gross margins, liquidity, capital expenditures and income taxes; |
| • | our expectations regarding our products, including those expectations related to product development, regulatory filings, regulatory approvals and regulatory timelines, therapeutic and commercial scope and potential, and the costs and expenses related to such activities; |
| • | our expectations regarding the initiation, timing and results of clinical trials of our products; |
| • | our expectations regarding the competitive landscape, and changes therein, related to our products, including competition from generic forms of our products or competitive products and competitive development programs; |
| • | our expectations regarding the financial impact of currency exchange rate fluctuations and valuations; |
| • | our expectations regarding future amortization of intangible assets; |
| • | our expectations regarding our collaborations, licensing arrangements and other significant agreements with third parties relating to our products, including our development programs; |
| • | our expectations regarding the impact of new legislation, rules, regulations and the adoption of new accounting pronouncements; |
| • | our expectations regarding near‑term changes in the nature of our market risk exposures or in management’s objectives and strategies with respect to managing such exposures; |
| • | our ability to comply with restrictive covenants of our indebtedness and our ability to fund our debt service obligations; |
| • | our expectations regarding future capital requirements and capital expenditures and our ability to finance our operations and capital requirements; |
| • | our expectations regarding the timing, outcome and impact of administrative, regulatory, legal and other proceedings related to our patents, other proprietary and intellectual property (“IP”) rights, and our products; and |
| • | other factors discussed elsewhere in this Form 10-Q. |
Actual results might differ materially from those expressed or implied by these forward-looking statements because these forward-looking statements are subject to risks, assumptions and uncertainties. These risks, assumptions and uncertainties include, among others: the unfavorable outcome of litigation, including so-called “Paragraph IV” litigation and other patent litigation, related to any of our products, which may lead to competition from generic drug manufacturers; data from clinical trials may be interpreted by the United States (“U.S.”) Food and Drug Administration (“FDA”) in different ways than we interpret it; the FDA may not agree with our regulatory approval strategies or components of our filings for our products, including our clinical trial designs, conduct and methodologies and, for ALKS 5461, evidence of efficacy and adequacy of bridging to buprenorphine; clinical development activities may not be completed on time or at all; the results of our clinical development activities may not be positive, or predictive of real-world results or of results in subsequent clinical trials; regulatory submissions may not occur or be submitted in a timely manner; the company and its licensees may not be able to continue to successfully commercialize their products; there may be a reduction in payment rate or reimbursement for the company’s products or an increase in the company’s financial obligations to governmental payers; the FDA or regulatory authorities outside the U.S. may make adverse decisions regarding the company’s products; the company’s products may prove difficult to manufacture, be precluded from commercialization by the proprietary rights of third parties, or have unintended side effects, adverse reactions or incidents of misuse; and those risks, assumptions and uncertainties described under the heading “Risk Factors” in the Company’s Annual Report on Form 10-K for the year ended December 31, 2017 (the “Annual Report”) and in subsequent filings made by the company with the U.S. Securities and Exchange Commission (“SEC”), which are
available on the SEC’s website at www.sec.gov. You are cautioned not to place undue reliance on forward-looking statements, which speak only as of the date of this Form 10-Q. All subsequent written and oral forward-looking statements concerning the matters addressed in this Form 10-Q and attributable to us or any person acting on our behalf are expressly qualified in their entirety by the cautionary statements contained or referred to in this section. Except as required by applicable law or regulation, we do not undertake any obligation to update publicly or revise any forward-looking statements, whether as a result of new information, future events or otherwise. In light of these risks, assumptions and uncertainties, the forward-looking events discussed in this Form 10-Q might not occur. For more information regarding the risks, assumptions and uncertainties of our business, see “Part I, Item 1A—Risk Factors” in our Annual Report on Form 10-K for the year ended December 31, 2018 (the “Annual Report”).
This Form 10-Q includes data that we obtained from industry publications and third-party research, surveys and studies. Industry publications and third-party research, surveys and studies generally indicate that their information has been obtained from sources believed to be reliable, although they do not guarantee the accuracy or completeness of such information. This Form 10-Q also includes data based on our own internal estimates and research. Our internal estimates and research have not been verified by any independent source, and, while we believe the industry publications and third-party research, surveys and studies are reliable, we have not independently verified such data. Such third-party data and our internal estimates and research are necessarily subject to a high degree of uncertainty and risk due to a variety of factors, including those described in “Item“Part I, Item 1A—Risk Factors” in our Annual Report and in subsequent reports filed with the SEC.United States (“U.S.”) Securities and Exchange Commission (the “SEC”). These and other factors could cause our results to differ materially from those expressed in the estimates included in this Form 10-Q.
Note Regarding Company and Product References
Alkermes plc (as used in this report, together with our subsidiaries, “Alkermes,” the “Company,” “us,” “we” and “our”) is a fully integrated, global biopharmaceutical company that applies its scientific expertise and proprietary technologies to research, develop and commercialize, both with partners and on its own, pharmaceutical products that are designed to address unmet medical needs of patients in major therapeutic areas. We have a diversified portfolio of marketedcommercial drug products and a clinical pipeline of product candidates that addressfocused on central nervous system (“CNS”) disorders such as schizophrenia, depression, addiction and multiple sclerosis (“MS”)., and oncology. Except as otherwise suggested by the context, (a) references to “products” or “our products” in this Form 10-Q include our marketed products, marketed products using our proprietary technologies, our product candidates, and product candidates using our proprietary technologies, development products and development products using our proprietary technologies, (b) references to the “biopharmaceutical industry” in this Form 10-Q are intended to include reference to the “biotechnology industry” and/or the “pharmaceutical industry” and (c) references in this Form 10-Q to “licensees” are used interchangeably with references to “partners.”
Note Regarding Trademarks
We are the owner of various U.S. federal trademark registrations (“®”) and other trademarks (“TM”), including ALKERMES®, ARISTADA®, ARISTADA INITIOTM®, LinkeRx®, NanoCrystal®, VIVITROL® and VIVITROL®VUMERITYTM.
The following are trademarks of the respective companies listed: AMPYRA® and FAMPYRA®—Acorda Therapeutics, Inc. (“Acorda”); BYDUREON® —Amylin Pharmaceuticals, LLC; INVEGA SUSTENNA®, INVEGA TRINZA®, TREVICTA®,XEPLION®, and RISPERDAL CONSTA®—Johnson & Johnson (or its affiliates); TECFIDERA®—Biogen MA Inc. (together with its affiliates, “Biogen”); and ZYPREXA®—Eli Lilly and Company.& Company. Other trademarks, trade names and service marks appearing in this Form 10-Q are the property of their respective owners. Solely for convenience, the trademarks and trade names in this Form 10-Q are referred to without the ® and TM symbols, but such references should not be construed as any indicator that their respective owners will not assert, to the fullest extent under applicable law, their rights thereto.
PART I. FINANCIAL INFORMATION
Item 1. Condensed Consolidated Financial Statements:
ALKERMES PLC AND SUBSIDIARIES
CONDENSED CONSOLIDATED BALANCE SHEETS
(unaudited)
| | | | | | | |
| | June 30, 2018 | | December 31, 2017 | | June 30, 2019 | | December 31, 2018 |
| | (In thousands, except share and per share amounts) | | (In thousands, except share and per share amounts) |
ASSETS | | | | | | | | | | |
CURRENT ASSETS: | | | | | | | | | | |
Cash and cash equivalents | | $ | 155,849 | | $ | 191,296 | | $195,954 | | $266,762 |
Investments—short-term | | | 277,658 | | | 242,208 | | 374,340 | | 272,533 |
Receivables, net | | | 255,230 | | | 233,590 | | 261,226 | | 292,223 |
Contract assets | | | 14,582 | | | — | | 12,690 | | 8,230 |
Inventory | | | 87,165 | | | 93,275 | | 94,780 | | 90,196 |
Prepaid expenses and other current assets | | | 49,639 | | | 48,475 | | 55,607 | | 53,308 |
Total current assets | | | 840,123 | | | 808,844 | | 994,597 | | 983,252 |
PROPERTY, PLANT AND EQUIPMENT, NET | | | 296,635 | | | 284,736 | | 326,230 | | 309,987 |
INTANGIBLE ASSETS, NET | | | 223,852 | | | 256,168 | | 170,986 | | 191,001 |
INVESTMENTS—LONG-TERM | | | 127,012 | | | 157,212 | | 23,299 | | 80,744 |
GOODWILL | | | 92,873 | | | 92,873 | | 92,873 | | 92,873 |
CONTINGENT CONSIDERATION | | | 63,300 | | | 84,800 | | 26,100 | | 65,200 |
RIGHT-OF-USE ASSETS | | | 15,911 | | — |
DEFERRED TAX ASSETS | | | 93,066 | | | 98,560 | | 86,894 | | 85,807 |
OTHER ASSETS | | | 14,625 | | | 14,034 | | 14,861 | | 16,143 |
TOTAL ASSETS | | $ | 1,751,486 | | $ | 1,797,227 | | $1,751,751 | | $1,825,007 |
LIABILITIES AND SHAREHOLDERS’ EQUITY | | | | | | | | | | |
CURRENT LIABILITIES: | | | | | | | | | | |
Accounts payable and accrued expenses | | $ | 279,702 | | $ | 286,166 | | $320,490 | | $333,762 |
Contract liabilities—short-term | | | 4,928 | | | 1,956 | | 2,103 | | 3,169 |
Operating lease liabilities—short-term | | | 8,710 | | — |
Long-term debt—short-term | | | 2,843 | | | 3,000 | | 2,843 | | 2,843 |
Total current liabilities | | | 287,473 | | | 291,122 | | 334,146 | | 339,774 |
LONG-TERM DEBT | | | 277,548 | | | 278,436 | | 275,381 | | 276,465 |
OTHER LONG-TERM LIABILITIES | | | 22,453 | | | 19,204 | | 30,571 | | 27,958 |
OPERATING LEASE LIABILITIES—LONG-TERM | | | 8,864 | | — |
CONTRACT LIABILITIES—LONG-TERM | | | 5,857 | | | 5,657 | | 11,621 | | 9,525 |
Total liabilities | | | 593,331 | | | 594,419 | | 660,583 | | 653,722 |
COMMITMENTS AND CONTINGENCIES (Note 14) | | | | | | | |
COMMITMENTS AND CONTINGENT LIABILITIES (Note 14) | | | | | |
SHAREHOLDERS’ EQUITY: | | | | | | | | | | |
Preferred shares, par value, $0.01 per share; 50,000,000 shares authorized; zero issued and outstanding at June 30, 2018 and December 31, 2017, respectively | | | — | | | — | |
Ordinary shares, par value, $0.01 per share; 450,000,000 shares authorized; 157,612,457 and 156,057,632 shares issued; 155,302,753 and 154,009,456 shares outstanding at June 30, 2018 and December 31, 2017, respectively | | | 1,573 | | | 1,557 | |
Treasury shares, at cost (2,309,704 and 2,048,176 shares at June 30, 2018 and December 31, 2017, respectively) | | | (105,088) | | | (89,347) | |
Preferred shares, par value, $0.01 per share; 50,000,000 shares authorized; zero issued and outstanding at June 30, 2019 and December 31, 2018, respectively | | | — | | — |
Ordinary shares, par value, $0.01 per share; 450,000,000 shares authorized; 159,796,116 and 158,180,833 shares issued; 157,096,873 and 155,757,344 shares outstanding at June 30, 2019 and December 31, 2018, respectively | | | 1,595 | | 1,579 |
Treasury shares, at cost (2,699,243 and 2,423,489 shares at June 30, 2019 and December 31, 2018, respectively) | | | (118,143) | | (108,969) |
Additional paid-in capital | | | 2,406,861 | | | 2,338,755 | | 2,533,086 | | 2,467,323 |
Accumulated other comprehensive loss | | | (3,980) | | | (3,792) | | (1,614) | | (3,280) |
Accumulated deficit | | | (1,141,211) | | | (1,044,365) | | (1,323,756) | | (1,185,368) |
Total shareholders’ equity | | | 1,158,155 | | | 1,202,808 | | 1,091,168 | | 1,171,285 |
TOTAL LIABILITIES AND SHAREHOLDERS’ EQUITY | | $ | 1,751,486 | | $ | 1,797,227 | | $1,751,751 | | $1,825,007 |
The accompanying notes are an integral part of these unaudited condensed consolidated financial statements.
ALKERMES PLC AND SUBSIDIARIES
CONDENSED CONSOLIDATED STATEMENTS OF OPERATIONS AND COMPREHENSIVE LOSS
(unaudited)
| | Three Months Ended | | | Six Months Ended | |
| | June 30, | | | June 30, | |
| | 2019 | | | 2018 | | | 2019 | | | 2018 | |
| | (In thousands, except per share amounts) | | | | | | | | | |
REVENUES: | | | | | | | | | | | | | | | | |
Manufacturing and royalty revenues | | $ | 127,897 | | | $ | 128,241 | | | $ | 236,812 | | | $ | 242,842 | |
Product sales, net | | | 136,635 | | | | 109,807 | | | | 236,116 | | | | 201,649 | |
Research and development revenue | | | 14,340 | | | | 18,344 | | | | 29,046 | | | | 37,051 | |
License revenue | | | 1,000 | | | | 48,250 | | | | 1,000 | | | | 48,250 | |
Total revenues | | | 279,872 | | | | 304,642 | | | | 502,974 | | | | 529,792 | |
EXPENSES: | | | | | | | | | | | | | | | | |
Cost of goods manufactured and sold (exclusive of amortization of acquired intangible assets shown below) | | | 46,223 | | | | 43,417 | | | | 91,584 | | | | 87,893 | |
Research and development | | | 104,435 | | | | 106,823 | | | | 207,005 | | | | 215,169 | |
Selling, general and administrative | | | 155,075 | | | | 138,257 | | | | 296,295 | | | | 256,404 | |
Amortization of acquired intangible assets | | | 10,062 | | | | 16,247 | | | | 20,014 | | | | 32,316 | |
Total expenses | | | 315,795 | | | | 304,744 | | | | 614,898 | | | | 591,782 | |
OPERATING LOSS | | | (35,923 | ) | | | (102 | ) | | | (111,924 | ) | | | (61,990 | ) |
OTHER EXPENSE, NET: | | | | | | | | | | | | | | | | |
Interest income | | | 3,706 | | | | 1,900 | | | | 7,276 | | | | 3,386 | |
Interest expense | | | (3,520 | ) | | | (3,126 | ) | | | (7,020 | ) | | | (8,614 | ) |
Change in the fair value of contingent consideration | | | (6,500 | ) | | | (19,600 | ) | | | (29,100 | ) | | | (21,500 | ) |
Other income (expense), net | | | 1,851 | | | | (3,517 | ) | | | 130 | | | | (2,725 | ) |
Total other expense, net | | | (4,463 | ) | | | (24,343 | ) | | | (28,714 | ) | | | (29,453 | ) |
LOSS BEFORE INCOME TAXES | | | (40,386 | ) | | | (24,445 | ) | | | (140,638 | ) | | | (91,443 | ) |
INCOME TAX PROVISION (BENEFIT) | | | 1,604 | | | | 8,204 | | | | (2,250 | ) | | | 3,711 | |
NET LOSS | | $ | (41,990 | ) | | $ | (32,649 | ) | | $ | (138,388 | ) | | $ | (95,154 | ) |
LOSS PER ORDINARY SHARE: | | | | | | | | | | | | | | | | |
Basic and diluted | | $ | (0.27 | ) | | $ | (0.21 | ) | | $ | (0.88 | ) | | $ | (0.61 | ) |
WEIGHTED AVERAGE NUMBER OF ORDINARY SHARES OUTSTANDING: | | | | | | | | | | | | | | | | |
Basic and diluted | | | 156,991 | | | | 155,176 | | | | 156,665 | | | | 154,802 | |
COMPREHENSIVE LOSS: | | | | | | | | | | | | | | | | |
Net loss | | $ | (41,990 | ) | | $ | (32,649 | ) | | $ | (138,388 | ) | | $ | (95,154 | ) |
Holding gain (loss), net of a tax provision (benefit) of $265, $47, $494 and $(53), respectively | | | 896 | | | | 148 | | | | 1,666 | | | | (188 | ) |
COMPREHENSIVE LOSS | | $ | (41,094 | ) | | $ | (32,501 | ) | | $ | (136,722 | ) | | $ | (95,342 | ) |
The accompanying notes are an integral part of these unaudited condensed consolidated financial statements.
ALKERMES PLC AND SUBSIDIARIES
CONDENSED CONSOLIDATED STATEMENTS OF CASH FLOWS
(unaudited)
| | Six Months Ended | |
| | June 30, | |
| | 2019 | | | 2018 | |
| | (In thousands) | |
CASH FLOWS FROM OPERATING ACTIVITIES: | | | | | | | | |
Net loss | | $ | (138,388 | ) | | $ | (95,154 | ) |
Adjustments to reconcile net loss to cash flows from operating activities: | | | | | | | | |
Depreciation and amortization | | | 39,556 | | | | 51,491 | |
Share-based compensation expense | | | 52,861 | | | | 50,975 | |
Deferred income taxes | | | (2,401 | ) | | | 3,368 | |
Change in the fair value of contingent consideration | | | 29,100 | | | | 21,500 | |
Loss on debt refinancing | | | — | | | | 2,298 | |
Payment made for debt refinancing | | | — | | | | (2,251 | ) |
Other non-cash charges | | | 675 | | | | 1,398 | |
Changes in assets and liabilities: | | | | | | | | |
Receivables | | | 30,996 | | | | (21,640 | ) |
Contract assets | | | (4,460 | ) | | | (5,471 | ) |
Inventory | | | (3,928 | ) | | | (2,082 | ) |
Prepaid expenses and other assets | | | 737 | | | | (1,615 | ) |
Right-of-use assets | | | 4,229 | | | | — | |
Accounts payable and accrued expenses | | | (9,918 | ) | | | (2,624 | ) |
Contract liabilities | | | 1,030 | | | | 1,343 | |
Operating lease liabilities | | | (4,593 | ) | | | — | |
Other long-term liabilities | | | 3,539 | | | | 3,752 | |
Cash flows (used in) provided by operating activities | | | (965 | ) | | | 5,288 | |
CASH FLOWS FROM INVESTING ACTIVITIES: | | | | | | | | |
Additions of property, plant and equipment | | | (39,542 | ) | | | (35,420 | ) |
Proceeds from the sale of equipment | | | 291 | | | | 423 | |
Proceeds from contingent consideration | | | 10,000 | | | | — | |
Purchases of investments | | | (121,809 | ) | | | (138,644 | ) |
Sales and maturities of investments | | | 79,104 | | | | 133,101 | |
Cash flows used in investing activities | | | (71,956 | ) | | | (40,540 | ) |
CASH FLOWS FROM FINANCING ACTIVITIES: | | | | | | | | |
Proceeds from the issuance of ordinary shares under share-based compensation arrangements | | | 12,608 | | | | 17,000 | |
Employee taxes paid related to net share settlement of equity awards | | | (9,074 | ) | | | (15,742 | ) |
Principal payments of long-term debt | | | (1,421 | ) | | | (710 | ) |
Payment made for debt refinancing | | | — | | | | (743 | ) |
Cash flows provided by (used in) financing activities | | | 2,113 | | | | (195 | ) |
NET DECREASE IN CASH AND CASH EQUIVALENTS | | | (70,808 | ) | | | (35,447 | ) |
CASH AND CASH EQUIVALENTS—Beginning of period | | | 266,762 | | | | 191,296 | |
CASH AND CASH EQUIVALENTS—End of period | | $ | 195,954 | | | $ | 155,849 | |
SUPPLEMENTAL CASH FLOW DISCLOSURE: | | | | | | | | |
Non-cash investing and financing activities: | | | | | | | | |
Purchased capital expenditures included in accounts payable and accrued expenses | | $ | 2,994 | | | $ | 7,246 | |
The accompanying notes are an integral part of these unaudited condensed consolidated financial statements.
ALKERMES PLC AND SUBSIDIARIES
CONDENSED CONSOLIDATED STATEMENTS OF SHAREHOLDERS’ EQUITY
(unaudited)
| | | | | | | | | | | | | | Accumulated | | | | | | | | | | | | | | | | | |
| | | | | | | | | | Additional | | | Other | | | | | | | | | | | | | | | | | |
| | Ordinary Shares | | | Paid-In | | | Comprehensive | | | Accumulated | | | Treasury Stock | | | | | |
| | Shares | | | Amount | | | Capital | | | Loss | | | Deficit | | | Shares | | | Amount | | | Total | |
| | (In thousands, except share data) | |
BALANCE — December 31, 2018 | | | 158,180,833 | | | $ | 1,579 | | | $ | 2,467,323 | | | $ | (3,280 | ) | | $ | (1,185,368 | ) | | | (2,423,489 | ) | | $ | (108,969 | ) | | $ | 1,171,285 | |
Issuance of ordinary shares under employee stock plans | | | 656,352 | | | | 7 | | | | 10,547 | | | | — | | | | — | | | | — | | | | — | | | | 10,554 | |
Receipt of Alkermes' shares for the exercise of stock options or to satisfy minimum tax withholding obligations related to share-based awards | | | 740,689 | | | | 7 | | | | 93 | | | | — | | | | — | | | | (269,357 | ) | | | (8,980 | ) | | | (8,880 | ) |
Share-based compensation expense | | | — | | | | — | | | | 24,810 | | | | — | | | | — | | | | — | | | | — | | | | 24,810 | |
Unrealized gain on marketable securities, net of tax provision of $229 | | | — | | | | — | | | | — | | | | 770 | | | | — | | | | — | | | | — | | | | 770 | |
Net loss | | | — | | | | — | | | | — | | | | — | | | | (96,398 | ) | | | — | | | | — | | | | (96,398 | ) |
BALANCE — March 31, 2019 | | | 159,577,874 | | | $ | 1,593 | | | $ | 2,502,773 | | | $ | (2,510 | ) | | $ | (1,281,766 | ) | | | (2,692,846 | ) | | $ | (117,949 | ) | | $ | 1,102,141 | |
Issuance of ordinary shares under employee stock plans | | | 197,953 | | | 2 | | | | 2,052 | | | | — | | | | — | | | | — | | | | — | | | | 2,054 | |
Receipt of Alkermes' shares for the purchase of stock options or to satisfy minimum tax withholding obligations related to share-based awards | | | 20,289 | | | | — | | | | — | | | | — | | | | — | | | | (6,397 | ) | | | (194 | ) | | | (194 | ) |
Share-based compensation expense | | | — | | | | — | | | | 28,261 | | | | — | | | | — | | | | — | | | | — | | | | 28,261 | |
Unrealized loss on marketable securities, net of tax provision of $265 | | | — | | | | — | | | | — | | | | 896 | | | | — | | | | — | | | | — | | | | 896 | |
Net loss | | | — | | | | — | | | | — | | | | — | | | | (41,990 | ) | | | — | | | | — | | | | (41,990 | ) |
BALANCE — June 30, 2019 | | | 159,796,116 | | | $ | 1,595 | | | $ | 2,533,086 | | | $ | (1,614 | ) | | $ | (1,323,756 | ) | | | (2,699,243 | ) | | $ | (118,143 | ) | | $ | 1,091,168 | |
| | | | | | | | | | | | | | Accumulated | | | | | | | | | | | | | | | | | |
| | | | | | | | | | Additional | | | Other | | | | | | | | | | | | | | | | | |
| | Ordinary Shares | | | Paid-In | | | Comprehensive | | | Accumulated | | | Treasury Stock | | | | | |
| | Shares | | | Amount | | | Capital | | | Loss | | | Deficit | | | Shares | | | Amount | | | Total | |
| | (In thousands, except share data) | |
BALANCE — December 31, 2017 | | | 156,057,632 | | | $ | 1,557 | | | $ | 2,338,755 | | | $ | (3,792 | ) | | $ | (1,044,365 | ) | | | (2,048,176 | ) | | $ | (89,347 | ) | | $ | 1,202,808 | |
Issuance of ordinary shares under employee stock plans | | | 539,563 | | | 6 | | | | 13,159 | | | | — | | | | — | | | | — | | | | — | | | | 13,165 | |
Receipt of Alkermes' shares for the exercise of stock options or to satisfy minimum tax withholding obligations related to share-based awards | | | 716,123 | | | 7 | | | | (7 | ) | | | — | | | | — | | | | (261,159 | ) | | | (15,724 | ) | | | (15,724 | ) |
Share-based compensation expense | | | — | | | | — | | | | 20,176 | | | | — | | | | — | | | | — | | | | — | | | | 20,176 | |
Unrealized loss on marketable securities, net of tax benefit of $(100) | | | — | | | | — | | | | — | | | | (337 | ) | | | — | | | | — | | | | — | | | | (337 | ) |
Cumulative effect adjustment related to the adoption of new accounting standards | | | — | | | | — | | | | — | | | | — | | | | (1,692 | ) | | | — | | | | — | | | | (1,692 | ) |
Net loss | | | — | | | | — | | | | — | | | | — | | | | (62,505 | ) | | | — | | | | — | | | | (62,505 | ) |
BALANCE — March 31, 2018 | | | 157,313,318 | | | $ | 1,570 | | | $ | 2,372,083 | | | $ | (4,129 | ) | | $ | (1,108,562 | ) | | | (2,309,335 | ) | | $ | (105,071 | ) | | $ | 1,155,891 | |
Issuance of ordinary shares under employee stock plans | | | 297,889 | | | 2 | | | | 3,833 | | | | — | | | | — | | | | — | | | | — | | | | 3,835 | |
Receipt of Alkermes' shares for the purchase of stock options or to satisfy minimum tax withholding obligations related to share-based awards | | | 1,250 | | | 1 | | | | (2 | ) | | | — | | | | — | | | | (369 | ) | | | (17 | ) | | | (18 | ) |
Share-based compensation expense | | | — | | | | — | | | | 30,947 | | | | — | | | | — | | | | — | | | | — | | | | 30,947 | |
Unrealized loss on marketable securities, net of tax provision of $47 | | | — | | | | — | | | | — | | | | 149 | | | | — | | | | — | | | | — | | | | 149 | |
Cumulative effect adjustment related to the adoption of new accounting standards | | | — | | | | — | | | | — | | | | — | | | | — | | | | — | | | | — | | | | — | |
Net loss | | | — | | | | — | | | | — | | | | — | | | | (32,649 | ) | | | — | | | | — | | | | (32,649 | ) |
BALANCE — June 30, 2018 | | | 157,612,457 | | | $ | 1,573 | | | $ | 2,406,861 | | | $ | (3,980 | ) | | $ | (1,141,211 | ) | | | (2,309,704 | ) | | $ | (105,088 | ) | | $ | 1,158,155 | |
The accompanying notes are an integral part of these unaudited condensed consolidated financial statements.
9
ALKERMES PLC AND SUBSIDIARIES
CONDENSED CONSOLIDATED STATEMENTS OF OPERATIONS AND COMPREHENSIVE LOSS
(unaudited)
| | | | | | | | | | | | |
| | Three Months Ended | | Six Months Ended |
| | June 30, | | June 30, |
| | 2018 | | 2017 | | 2018 | | 2017 |
| | (In thousands, except per share amounts) |
REVENUES: | | | | | | | | | | | | |
Manufacturing and royalty revenues | | $ | 128,241 | | $ | 129,252 | | $ | 242,842 | | $ | 243,931 |
Product sales, net | | | 109,807 | | | 88,756 | | | 201,649 | | | 165,212 |
License revenue | | | 48,250 | | | — | | | 48,250 | | | — |
Research and development revenue | | | 18,344 | | | 833 | | | 37,051 | | | 1,476 |
Total revenues | | | 304,642 | | | 218,841 | | | 529,792 | | | 410,619 |
EXPENSES: | | | | | | | | | | | | |
Cost of goods manufactured and sold (exclusive of amortization of acquired intangible assets shown below) | | | 43,417 | | | 39,775 | | | 87,893 | | | 80,187 |
Research and development | | | 106,823 | | | 99,153 | | | 215,169 | | | 203,988 |
Selling, general and administrative | | | 138,257 | | | 108,950 | | | 256,404 | | | 211,049 |
Amortization of acquired intangible assets | | | 16,247 | | | 15,472 | | | 32,316 | | | 30,774 |
Total expenses | | | 304,744 | | | 263,350 | | | 591,782 | | | 525,998 |
OPERATING LOSS | | | (102) | | | (44,509) | | | (61,990) | | | (115,379) |
OTHER EXPENSE, NET: | | | | | | | | | | | | |
Interest income | | | 1,900 | | | 1,171 | | | 3,386 | | | 2,114 |
Interest expense | | | (3,126) | | | (2,923) | | | (8,614) | | | (5,687) |
Change in the fair value of contingent consideration | | | (19,600) | | | 700 | | | (21,500) | | | 2,300 |
Other expense, net | | | (3,517) | | | (119) | | | (2,725) | | | (1,618) |
Total other expense, net | | | (24,343) | | | (1,171) | | | (29,453) | | | (2,891) |
LOSS BEFORE INCOME TAXES | | | (24,445) | | | (45,680) | | | (91,443) | | | (118,270) |
INCOME TAX PROVISION (BENEFIT) | | | 8,204 | | | (2,681) | | | 3,711 | | | (6,390) |
NET LOSS | | $ | (32,649) | | $ | (42,999) | | $ | (95,154) | | $ | (111,880) |
LOSS PER ORDINARY SHARE: | | | | | | | | | | | | |
Basic and diluted | | $ | (0.21) | | $ | (0.28) | | $ | (0.61) | | $ | (0.73) |
WEIGHTED AVERAGE NUMBER OF ORDINARY SHARES OUTSTANDING: | | | | | | | | | | | | |
Basic and diluted | | | 155,176 | | | 153,392 | | | 154,802 | | | 153,050 |
COMPREHENSIVE LOSS: | | | | | | | | | | | | |
Net loss | | $ | (32,649) | | $ | (42,999) | | $ | (95,154) | | $ | (111,880) |
Holding gain (loss), net of a tax provision (benefit) of $47, $(71), $(53) and $(49), respectively | | | 148 | | | (133) | | | (188) | | | (61) |
COMPREHENSIVE LOSS | | $ | (32,501) | | $ | (43,132) | | $ | (95,342) | | $ | (111,941) |
The accompanying notes are an integral part of these unaudited condensed consolidated financial statements.
ALKERMES PLC AND SUBSIDIARIES
CONDENSED CONSOLIDATED STATEMENTS OF CASH FLOWS
(unaudited)
| | | | | | |
| | Six Months Ended |
| | June 30, |
| | 2018 | | 2017 |
| | (In thousands) |
CASH FLOWS FROM OPERATING ACTIVITIES: | | | | | | |
Net loss | | $ | (95,154) | | $ | (111,880) |
Adjustments to reconcile net loss to cash flows from operating activities: | | | | | | |
Depreciation and amortization | | | 51,491 | | | 48,269 |
Share-based compensation expense | | | 50,975 | | | 43,848 |
Deferred income taxes | | | 3,368 | | | (6,863) |
Change in the fair value of contingent consideration | | | 21,500 | | | (2,300) |
Loss on debt refinancing | | | 2,298 | | | — |
Payment made for debt refinancing | | | (2,251) | | | — |
Other non-cash charges | | | 1,398 | | | 3,532 |
Changes in assets and liabilities: | | | | | | |
Receivables | | | (21,640) | | | (8,606) |
Contract assets | | | (5,471) | | | — |
Inventory | | | (2,082) | | | (14,585) |
Prepaid expenses and other assets | | | (1,615) | | | (5,574) |
Accounts payable and accrued expenses | | | (2,624) | | | 13,400 |
Contract liabilities | | | 1,343 | | | (473) |
Other long-term liabilities | | | 3,752 | | | 5,034 |
Cash flows provided by (used in) operating activities | | | 5,288 | | | (36,198) |
CASH FLOWS FROM INVESTING ACTIVITIES: | | | | | | |
Additions of property, plant and equipment | | | (35,420) | | | (20,656) |
Proceeds from the sale of equipment | | | 423 | | | 7 |
Purchases of investments | | | (138,644) | | | (160,554) |
Sales and maturities of investments | | | 133,101 | | | 190,642 |
Cash flows (used in) provided by investing activities | | | (40,540) | | | 9,439 |
CASH FLOWS FROM FINANCING ACTIVITIES: | | | | | | |
Proceeds from the issuance of ordinary shares under share-based compensation arrangements | | | 17,000 | | | 16,404 |
Employee taxes paid related to net share settlement of equity awards | | | (15,742) | | | (16,417) |
Payment made for debt refinancing | | | (743) | | | — |
Principal payments of long-term debt | | | (710) | | | (1,500) |
Cash flows used in financing activities | | | (195) | | | (1,513) |
NET DECREASE IN CASH AND CASH EQUIVALENTS | | | (35,447) | | | (28,272) |
CASH AND CASH EQUIVALENTS—Beginning of period | | | 191,296 | | | 186,378 |
CASH AND CASH EQUIVALENTS—End of period | | $ | 155,849 | | $ | 158,106 |
SUPPLEMENTAL CASH FLOW DISCLOSURE: | | | | | | |
Non-cash investing and financing activities: | | | | | | |
Purchased capital expenditures included in accounts payable and accrued expenses | | $ | 7,246 | | $ | 4,531 |
The accompanying notes are an integral part of these unaudited condensed consolidated financial statements.
Table of Contents
ALKERMES PLC AND SUBSIDIARIES
NOTES TO CONDENSED CONSOLIDATED FINANCIAL STATEMENTS — (Unaudited)
1. THE COMPANY
Alkermes plc is a fully integrated, global biopharmaceutical company that applies its scientific expertise and proprietary technologies to research, develop and commercialize, both with partners and on its own, pharmaceutical products that are designed to address unmet medical needs of patients in major therapeutic areas. The Company has a diversified portfolio of marketedcommercial drug products and a clinical pipeline of product candidates that addressfocused on CNS disorders such as schizophrenia, depression, addiction and MS.MS, and oncology. Headquartered in Dublin, Ireland, Alkermesthe Company has a research and development (“an R&D”)&D center in Waltham, Massachusetts; an R&D and manufacturing facility in Athlone, Ireland; and a manufacturing facility in Wilmington, Ohio.
2. SUMMARY OF SIGNIFICANT ACCOUNTING POLICIES
Basis of Presentation
The accompanying condensed consolidated financial statements of the Company for the three and six months ended June 30, 20182019 and 20172018 are unaudited and have been prepared on a basis substantially consistent with the audited financial statements for the year ended December 31, 2017.2018. The year-end condensed consolidated balance sheet data, which is presented for comparative purposes, was derived from audited financial statements, but does not include all disclosures required by accounting principles generally accepted in the U.S. (commonly referred to as “GAAP”). In the opinion of management, the condensed consolidated financial statements include all adjustments, which are of a normal recurring nature, that are necessary to state fairly the results of operations for the reported periods.
These financial statements should be read in conjunction with the audited consolidated financial statements and notes thereto of the Company, which are contained in the Company’s Annual Report that has been filed with the SEC.Report. The results of the Company’s operations for any interim period are not necessarily indicative of the results of the Company’s operations for any other interim period or for aany full fiscal year.
Principles of Consolidation
The condensed consolidated financial statements include the accounts of Alkermes plc and its wholly-owned subsidiaries as disclosed in Note 2, Summary of Significant Accounting Policies, in the “Notes to Consolidated Financial Statements” accompanying the Company’s Annual Report. Intercompany accounts and transactions have been eliminated.
Use of Estimates
The preparation of the Company’s condensed consolidated financial statements in accordance with GAAP requires management to make estimates, judgments and assumptions that may affect the reported amounts of assets, liabilities, revenues and expenses, and related disclosure of contingent assets and liabilities. On an ongoing basis, the Company evaluates its estimates, judgments and methodologies, including those related to revenue recognitionfrom contracts with its customers and related allowances, its collaborative relationships, clinical trial expenses, the valuation of inventory, impairment and amortization of intangibles and long-lived assets, share-based compensation, income taxes including the valuation allowance for deferred tax assets, valuation of investments, contingent consideration and litigation. The Company bases its estimates on historical experience and on various other assumptions that are believed to be reasonable, the results of which form the basis for making judgments about the carrying values of assets and liabilities. Actual results may differ from these estimates under different assumptions or conditions.
Segment Information
The Company operates as one business segment, which is the business of developing, manufacturing and commercializing medicines. The Company’s chief decision maker, the Chairman of the Board and Chief Executive Officer, reviews the Company’s operating results on an aggregate basis and manages the Company’s operations as a single operating unit.
10
Table of Contents
ALKERMES PLC AND SUBSIDIARIES
NOTES TO CONDENSED CONSOLIDATED FINANCIAL STATEMENTS — (Unaudited) (Continued)
Income Taxes
The Company’s provision for income taxes or income tax provision (benefit) in the three and six months ended June 30, 2018 and 2017benefit primarily relatedrelates to U.S. federal and state taxes. The Company records a deferred tax asset or liability based on the difference between the financial statement and tax basis of its assets and liabilities, as measured by enacted jurisdictional tax rates assumed to be in effect when these differences reverse. At June 30, 2018,2019, the Company maintained a valuation allowance against certain of its U.S. and foreign deferred tax assets. The Company evaluates, at each reporting period, the need for a valuation allowance on its deferred tax assets on a jurisdiction-by-jurisdiction basis.
As of June 30, 2018, the Company has not modified its position with respect to provisional amounts recorded to its financial statements as a result of the Tax Cuts and Jobs Act (“Tax Reform”) that was enacted in December 2017. The Company will continue to analyze the impact of Tax Reform on the Company. For additional information, please refer to Note 2, Summary of Significant Accounting Policies, in the “Notes to Consolidated Financial Statements” accompanying the Annual Report.
New Accounting Pronouncements
From time to time, new accounting pronouncements are issued by the Financial Accounting Standards Board (“FASB”) or other standard-setting bodies that are adopted by the Company as of the specified effective date. Unless otherwise discussed, the Company believes that the impact of recently issued guidance that are not yet effective will not have a material impact on its financial position or results of operations upon adoption.
In May 2014, the FASB issued guidance that outlines a single comprehensive model for entities to use in accounting for revenue arising from contracts with customers and supersedes most current revenue recognition guidance, including industry-specific guidance. The guidance (“Topic 606”) is based on the principle that an entity should recognize revenue to depict the transfer of goods or services to customers in an amount that reflects the consideration to which the entity expects to be entitled in exchange for those goods or services. The guidance also requires additional disclosure about the nature, amount, timing and uncertainty of revenue and cash flows arising from customer contracts, including significant judgments and changes in judgments and assets recognized from costs incurred to fulfill a contract. Numerous updates have been issued subsequent to the initial guidance that provide clarification on a number of specific issues and require additional disclosures. The two permitted transition methods under the new guidance are the full retrospective method, in which case the guidance would be applied to each prior reporting period presented and the cumulative effect of applying the guidance would be recognized at the earliest period shown, or the modified retrospective method, in which case the cumulative effect of applying the guidance would be recognized at the date of initial application. In July 2015, the FASB approved the deferral of the new guidance's effective date by one year. The new guidance became effective for annual reporting periods beginning after December 15, 2017.
Effective January 1, 2018,2019, the Company adopted the requirements of under Accounting Standards Update (“ASU”) 2016-02, Leases (“Topic 606842”) using the optional modified retrospective method. As part oftransition method and recognized a cumulative-effect adjustment to the adoption, the Company reviewed all contracts that were not yet completed as ofcondensed consolidated balance sheet on the date of initial applicationadoption. Comparative periods have not been restated. Topic 842 was issued in determining the cumulative-effect impact related to the adoption of Topic 606. The cumulative-effect impact recorded to retained earnings resulted in an adjustment of approximately $0.8 million, which was primarily due to the acceleration of manufacturing revenue, offset by an adjustment to deferred revenue for license and milestone payments that will now be recognized over time. The following balance sheet accounts were impacted:
Table of Contents
ALKERMES PLC AND SUBSIDIARIES
NOTES TO CONDENSED CONSOLIDATED FINANCIAL STATEMENTS — (Unaudited) (Continued)
| | | |
| | Topic 606 Adjustment |
(In thousands) | | |
Contract assets | | $ | 9,110 |
Inventory | | | (8,209) |
Deferred tax asset | | | 109 |
Contract liabilities—short-term | | | (1,104) |
Contract liabilities—long-term | | | (724) |
Accumulated deficit | | | 818 |
| | $ | — |
For additional information regarding how the Company is accounting for revenue under the updated guidance, refer to Note 3, Revenue from Contracts with Customers, in the “Notes to Condensed Consolidated Financial Statements” in this Form 10-Q.
In January 2016, the FASB issued guidance that enhances the reporting model for financial instruments by addressing certain aspects of recognition, measurement, presentation and disclosure of financial instruments. The amendments in this guidance include: requiring equity securities to be measured at fair value with changes in fair value recognized through the income statement; simplifying the impairment assessment of equity instruments without readily determinable fair values by requiring a qualitative assessment to identify impairment; eliminating the requirement to disclose the fair value of financial instruments measured at amortized cost for entities that are not public business entities; eliminating the requirement for public business entities to disclose the method(s) and significant assumptions used to estimate the fair value that is required to be disclosed for financial instruments measured at amortized cost on the balance sheet; requiring public business entities to use the exit price notion when measuring the fair value of financial instruments for disclosure purposes; requiring an entity to present separately in other comprehensive income the portion of the total change in the fair value of a liability resulting from a change in the instrument-specific credit risk when the entity has elected to measure the liability at fair value in accordance with the fair value option for financial instruments; requiring separate presentation of financial assets and financial liabilities by measurement category and form of financial asset; and clarifying that an entity should evaluate the need for a valuation allowance on a deferred tax asset related to available-for-sale securities in combination with the entity’s other deferred tax assets. This guidance is effective for the Company in this year ending December 31, 2018, and the Company has determined that the adoption of this guidance will not have a material impact on its consolidated financial statements.
In February 2016, the FASB issued guidanceorder to increase transparency and comparability among organizations by recognizing right-of-use lease assets and operating lease liabilities on the balance sheet and disclosing key information about leasing arrangements. The main difference between previous GAAP (“Topic 840”) and this guidanceTopic 842 is the recognition of right-of-use lease assets and lease liabilities by lessees for those leases classified as operating leases under previous GAAP. This guidance becomes effective forTopic 840. At January 1, 2019, the Company in the year ending December 31, 2019 and the Company continues to assess the impact that this guidance will have on its consolidated financial statements. At this time, the Company cannot conclude as to the total expected impact the adoptionrecorded a right-of-use asset of this new guidance will have on its consolidated financial statements, but does believe that the adoption will have a material impact on the Company’s balance sheet as it currently has, among other operating leases, two operating leases for 67,000 and 175,000 square feet of office and laboratory space in two separate locations in Waltham, Massachusetts that expire in 2020 and 2021, respectively,$20.1 million and an operating lease for 14,600 square feetliability of corporate office space in Dublin, Ireland that expires in 2022. In addition, during the three months ended March 31, 2018,$22.1 million. For additional information regarding how the Company entered into a leaseis accounting for 220,000 square feet of office and laboratory spaceleases under Topic 842, refer to be constructedNote 9, Leases, in Waltham, Massachusetts with a delivery date of January 2020.
the “Notes to Condensed Consolidated Financial Statements” in this Form 10-Q.
In June 2016, the FASB issued guidanceASU 2016-13, Measurement of Credit Losses on Financial Instruments, to provide financial statement users with more decision-useful information about the expected credit losses on financial instruments and other commitments to extend credit held by a reporting entity at each reporting date. To achieve this objective, the amendments in this guidanceASU replace the incurred loss impairment methodology in current GAAP with a methodology that reflects expected credit losses and requires consideration of a broader range of reasonable and supportable information to inform credit loss estimates. This guidanceASU becomes effective for the Company in the year ending December 31, 2020, with early adoption permitted for the
Table of Contents
ALKERMES PLC AND SUBSIDIARIES
NOTES TO CONDENSED CONSOLIDATED FINANCIAL STATEMENTS — (Unaudited) (Continued)
Company in the year ending December 31, 2019. The Company is currently assessing the impact that this guidanceASU will have on its consolidated financial statements.
In October 2016,June 2018, the FASB issued guidanceASU 2018-07, Improvements to simplifyNonemployee Share-Based Payment Accounting, which addresses the accounting for nonemployee share-based payment transactions resulting from expanding the scope of Topic 718, Compensation – Stock Compensation, to include share-based payment transactions for acquiring goods and improve accounting on transfers of assets between affiliated entities. The updated guidance eliminates the prohibitionservices from nonemployees. This ASU became effective for all intra-entity asset transfers, except for inventory. Effective January 1, 2018,and was adopted by the Company adopted this guidancein the year ending December 31, 2019 and recorded a cumulative-effect adjustmentthe adoption of $0.9 million to retained earnings.
the ASU did not have an impact on its consolidated financial statements.
In July 2017,August 2018, the FASB issued guidance that addresses narrow issues identified as a resultASU 2018-14, Disclosure Framework – Changes to the Disclosure Requirements for Fair Value Measurement, which aims to improve the effectiveness of fair value measurement disclosures. The amendments in this ASU modify the complexity associated with applying GAAPdisclosure requirements on fair value measurements based on the concepts in FASB Concepts Statement, Conceptual Framework for certain financial instruments with characteristicsFinancial Reporting - Chapter 8: Notes to Financial Statements, including the consideration of liabilitiescosts and equity. The guidancebenefits. This ASU becomes effective for the Company in the year ending December 31, 20192020 and early adoption is permitted. The Company is currently assessing the impact that this guidanceASU will have on its consolidated financial statements.
11
ALKERMES PLC AND SUBSIDIARIES
NOTES TO CONDENSED CONSOLIDATED FINANCIAL STATEMENTS — (Unaudited) (Continued)
In August 2018, the FASB issued ASU 2018-15, Customer’s Accounting for Implementation Costs Incurred in a Cloud Computing Arrangement That Is a Service Contract, which aligns the requirements for capitalizing implementation costs incurred in a hosting arrangement that is a service contract with the requirements for capitalizing implementation costs incurred to develop or obtain internal-use software (and hosting arrangements that include an internal-use software license). This ASU also requires the entity to expense the capitalized implementation costs of a hosting arrangement that is a service contract over the term of the hosting arrangement, which includes reasonably certain renewals. This ASU becomes effective for the Company in the year ending December 31, 2020 and early adoption is permitted. The Company is currently assessing the impact that this ASU will have on its consolidated financial statements.
In November 2018, the FASB issued ASU 2018-18, Clarifying the Interaction Between Topic 808 and Topic 606, which clarifies when transactions between participants in a collaborative arrangement are within the scope of the FASB’s revenue standard, Topic 606. This ASU becomes effective for the Company in the year ending December 31, 2020 and early adoption is permitted. The Company is currently assessing the impact that this ASU will have on its consolidated financial statements.
3. REVENUE FROM CONTRACTS WITH CUSTOMERS
Under Topic 606, the Company recognizes revenues when its customer obtains control of promised goods or services, in an amount that reflects the consideration the Company expects to receive in exchange for those goods or services. The Company recognizes revenues following the five stepfive-step model prescribed under Topic 606: (i) identify contract(s) with a customer; (ii) identify the performance obligation(s) in the contract(s); (iii) determine the transaction price; (iv) allocate the transaction price to the performance obligation(s) in the contract(s); and (v) recognize revenues when (or as) the Company satisfies the performance obligation(s).
Collaborative Arrangements
The Company has entered into collaboration agreements with pharmaceutical companies including Janssen for INVEGA SUSTENNA/XEPLIONManufacturing and INVEGA TRINZA/TREVICTA as well as RISPERDAL CONSTA; Acorda for AMPYRA/FAMPYRA; AstraZeneca for BYDUREON; and Biogen for BIIB098 (formerly ALKS 8700). Substantially all of the products developed under the Company’s collaborative arrangements, except for BIIB098, are currently being marketed as approved products, for which the Company receives payments for manufacturing services and/or royalties on net product sales.Royalty Revenues
During the three and six months ended June 30, 20182019 and 2017,2018, the Company recorded manufacturing and royalty revenues from its collaborative arrangements as follows:
| | | | | | | | | | | | | |
| | Three Months Ended June 30, 2018 | | Six Months Ended June 30, 2018 | | Three Months Ended June 30, 2019 | | | Six Months Ended June 30, 2019 | |
(In thousands) | | | Manufacturing Revenue | | | Royalty Revenue | | | Total | | | Manufacturing Revenue | | | Royalty Revenue | | | Total | | Manufacturing Revenue | | | Royalty Revenue | | | Total | | | Manufacturing Revenue | | | Royalty Revenue | | | Total | |
INVEGA SUSTENNA/XEPLION & INVEGA TRINZA/TREVICTA | | $ | — | | $ | 63,250 | | $ | 63,250 | | $ | — | | $ | 109,336 | | $ | 109,336 | | $ | — | | | $ | 67,289 | | | $ | 67,289 | | | $ | — | | | $ | 120,586 | | | $ | 120,586 | |
RISPERDAL CONSTA | | | | 20,506 | | | | 4,068 | | | | 24,574 | | | | 38,428 | | | | 8,453 | | | | 46,881 | |
AMPYRA/FAMPYRA | | 11,543 | | 8,135 | | 19,678 | | 25,106 | | 22,831 | | 47,937 | | | 6,474 | | | | 3,317 | | | | 9,791 | | | | 12,153 | | | | 9,823 | | | | 21,976 | |
RISPERDAL CONSTA | | 17,237 | | 4,694 | | 21,931 | | 35,029 | | 9,606 | | 44,635 | |
BYDUREON | | — | | 13,509 | | 13,509 | | — | | 23,258 | | 23,258 | |
Other | | | 8,148 | | | 1,725 | | | 9,873 | | | 14,384 | | | 3,292 | | | 17,676 | | | 11,399 | | | | 14,844 | | | | 26,243 | | | | 18,745 | | | | 28,624 | | | | 47,369 | |
| | $ | 36,928 | | $ | 91,313 | | $ | 128,241 | | $ | 74,519 | | $ | 168,323 | | $ | 242,842 | | $ | 38,379 | | | $ | 89,518 | | | $ | 127,897 | | | $ | 69,326 | | | $ | 167,486 | | | $ | 236,812 | |
| | Three Months Ended June 30, 2018 | | | Six Months Ended June 30, 2018 | |
(In thousands) | | Manufacturing Revenue | | | Royalty Revenue | | | Total | | | Manufacturing Revenue | | | Royalty Revenue | | | Total | |
INVEGA SUSTENNA/XEPLION & INVEGA TRINZA/TREVICTA | | $ | — | | | $ | 63,250 | | | $ | 63,250 | | | $ | — | | | $ | 109,336 | | | $ | 109,336 | |
RISPERDAL CONSTA | | | 17,237 | | | | 4,694 | | | | 21,931 | | | | 35,029 | | | | 9,606 | | | | 44,635 | |
AMPYRA/FAMPYRA | | | 11,543 | | | | 8,135 | | | | 19,678 | | | | 25,106 | | | | 22,831 | | | | 47,937 | |
Other | | | 8,148 | | | | 15,234 | | | | 23,382 | | | | 14,384 | | | | 26,550 | | | | 40,934 | |
| | $ | 36,928 | | | $ | 91,313 | | | $ | 128,241 | | | $ | 74,519 | | | $ | 168,323 | | | $ | 242,842 | |
Table of Contents12
ALKERMES PLC AND SUBSIDIARIES
NOTES TO CONDENSED CONSOLIDATED FINANCIAL STATEMENTS — (Unaudited) (Continued)
| | | | | | | | | | | | | | | | | | |
| | Three Months Ended June 30, 2017 | | Six Months Ended June 30, 2017 |
(In thousands) | | | Manufacturing Revenue | | | Royalty Revenue | | | Total | | | Manufacturing Revenue | | | Royalty Revenue | | | Total |
INVEGA SUSTENNA/XEPLION & INVEGA TRINZA/TREVICTA | | $ | — | | $ | 56,642 | | $ | 56,642 | | $ | — | | $ | 95,824 | | $ | 95,824 |
AMPYRA/FAMPYRA | | | 12,233 | | | 13,023 | | | 25,256 | | | 26,069 | | | 28,406 | | | 54,475 |
RISPERDAL CONSTA | | | 20,380 | | | 5,147 | | | 25,527 | | | 36,020 | | | 10,328 | | | 46,348 |
BYDUREON | | | — | | | 11,635 | | | 11,635 | | | — | | | 23,901 | | | 23,901 |
Other | | | 7,821 | | | 2,371 | | | 10,192 | | | 17,197 | | | 6,186 | | | 23,383 |
| | $ | 40,434 | | $ | 88,818 | | $ | 129,252 | | $ | 79,286 | | $ | 164,645 | | $ | 243,931 |
Manufacturing revenues— The Company recognizes manufacturing revenues from the sale of products it manufactures, which is its one performance obligation under such arrangements, for resale by its licensees. Manufacturing revenuesfor the Company’s partnered products, with the exception of those from Janssen related to RISPERDAL CONSTA, are recognized over time as products move through the manufacturing process, using a standard cost-based model as a measure of progress, which represents a faithful depiction of the transfer of goods. The Company recognizes manufacturing revenue from these products over time as it determined, in each instance, that it has a right to payment for performance completed to date if its customer were to terminate the manufacturing agreement for reasons other than the Company’s non-performance and the products have no alternative future use. The Company invoices its licensees upon shipment with payment terms between 30 to 90 days. Prior to the adoption of Topic 606, the Company recorded manufacturing revenue from the sale of products it manufactures for resale by its partners after the Company had shipped such products and risk of loss had passed to the Company’s partner, assuming persuasive evidence of an arrangement existed, the sales price was fixed or determinable and collectability was reasonably assured.
The Company is the exclusive manufacturer of RISPERDAL CONSTA for commercial sale under its manufacturing and supply agreement with Janssen. The Company determined that it is appropriate to record revenue under this agreement at the point in time when control of the product passes to Janssen, which is determined to be when the product has been fully manufactured, since Janssen does not control the product during the manufacturing process and, in the event Janssen terminates the manufacturing and supply agreement, it is unclear whether, and at what amount, the Company would be reimbursed for performance completed to date for product not yet fully manufactured. The manufacturing process is considered fully complete once the finished goods have been approved for shipment by both the Company and Janssen.
The sales price for certain of the Company’s manufacturing revenues is based on the end-market sales price earned by its licensees. As end-market sales generally occur after the Company has recorded manufacturing revenue, the Company estimates the sales price for such products based on information supplied to it by the Company’s licensees, its historical transaction experience and other third-party data. Differences between actual manufacturing revenues and estimated manufacturing revenues are reconciled and adjusted for in the period in which they become known, which is generally within the same quarter. The difference between the Company’s actual and estimated manufacturing revenues has not been material.
Royalty revenues—The Company recognizes royalty revenues related to the sale of products by its licensees that incorporate the Company's technologies. Royalties, with the exception of those earned on sales of AMPYRA as set forth below, qualify for the sales-and-usage exemption under Topic 606 as (i) royalties are based strictly on the sales-and-usage by the licensee; and (ii) a license of IP is the sole or predominant item to which such royalties relate. Based on this exemption, these royalties are earned under the terms of a license agreement in the period the products are sold by the Company's partner and the Company has a present right to payment. Royalties on AMPYRA manufactured under our license and supply agreements with Acorda are incorporated into the standard cost-based model described in the manufacturing revenues section, above, as the terms of such agreements entitle the Company to royalty revenue as the product is being manufactured, which represents a faithful depiction of the transfer of goods, and not based on the end-market sales of the licensee. Certain of the Company's royalty revenues are recognized by the Company based on information supplied to the Company by its partners and require estimates to be made. Differences between actual royalty revenues and estimated royalty revenues are reconciled and adjusted for in the period in which they become
Table of Contents
ALKERMES PLC AND SUBSIDIARIES
NOTES TO CONDENSED CONSOLIDATED FINANCIAL STATEMENTS — (Unaudited) (Continued)
known, which is generally within the same quarter. The difference between the Company’s actual and estimated royalty revenues has not been material.
Multiple Element Arrangements
When entering into multiple element arrangements, the Company identifies whether its performance obligations under the arrangement represent a distinct good or service or a series of distinct goods or services. A series of distinct goods or services is required to be accounted for as a single performance obligation provided that (i) each distinct good or service in the series promised would meet the criteria to be a performance obligation satisfied over time; and (ii) the same method would be used to measure the Company’s progress toward complete satisfaction of the performance obligation to transfer each distinct good or service in the series to the customer. If a contract is separated into more than one performance obligation, the Company allocates the total transaction price to each performance obligation in an amount based on the estimated relative standalone selling prices of the promised goods or services underlying each performance obligation. The fair value of deliverables under the arrangement may be derived using a “best estimate of selling price” if vendor-specific objective evidence and third-party evidence is not available.
The Company recognizes revenue when or as it satisfies a performance obligation by transferring an asset to a customer. An asset is transferred when or as the customer obtains control of that asset. Significant management judgment is required in determining the consideration to be earned under an arrangement and the period over which the Company is expected to complete its performance obligations under an arrangement. Steering committee services that are not inconsequential or perfunctory and that are determined to be performance obligations are combined with other research services or performance obligations required under an arrangement, if any, in determining the level of effort required in an arrangement and the period over which the Company expects to complete its aggregate performance obligations.
In November 2017, the Company granted Biogen, under a license and collaboration agreement, a worldwide, exclusive, sublicensable license to develop, manufacture and commercialize BIIB098 and other products covered by patents licensed to Biogen under the agreement. Upon entering into this agreement in November 2017, the Company received an up-front cash payment of $28.0 million. In June 2018, the Company received an additional cash payment of $50.0 million following Biogen’s review of preliminary gastrointestinal tolerability data from the ongoing clinical development program for BIIB098. The Company is also eligible to receive an additional payment of $150.0 million upon an approval by the FDA on or before December 31, 2021 of a 505(b)(2) new drug application (“NDA”) (or, in certain circumstances, a 505(b)(1) NDA) for BIIB098. The Company is also eligible to receive additional payments upon achievement of developmental milestones with respect to the first two products, other than BIIB098, covered by patents licensed to Biogen under the agreement. In addition, the Company will receive a mid-teens percentage royalty on worldwide net sales of BIIB098, subject to, under certain circumstances, minimum annual payments for the first five years following FDA approval of BIIB098. The Company will also receive royalties on net sales of products, other than BIIB098, covered by patents licensed to Biogen under the agreement, at tiered royalty rates calculated as percentages of net sales ranging from high-single digits to low double-digits. All royalties are payable on a product-by-product and country-by-country basis until the later of (i) the last-to-expire patent right covering the applicable product in the applicable country and (ii) a specified period of time from the first commercial sale of the applicable product in the applicable country. Royalties for all such products and the minimum annual payments for BIIB098 are subject to reductions as set forth in the agreement. Biogen paid a portion of the BIIB098 development costs the Company incurred in 2017 and, since January 1, 2018, Biogen is responsible for all BIIB098 development costs the Company incurs, subject to annual budget limitations. The Company has retained the right to manufacture clinical supplies and commercial supplies of BIIB098 and all other products covered by patents licensed to Biogen under the agreement, subject to Biogen’s right to manufacture or have manufactured commercial supplies as a back-up manufacturer and subject to good faith agreement by the parties on the terms of such manufacturing arrangements.
The Company evaluated the agreement under Topic 606 and determined that it had four initial performance obligations: (i) the grant of a distinct, right-to-use license to Biogen; (ii) future development services; (iii) clinical supply; and (iv) participation on a joint steering committee with Biogen. The participation on the joint steering committee was considered to be perfunctory and thus not recognized as a separate unit of accounting. The deliverables, aside from the participation in the joint steering committee which was considered to be perfunctory, were determined to
Table of Contents
ALKERMES PLC AND SUBSIDIARIES
NOTES TO CONDENSED CONSOLIDATED FINANCIAL STATEMENTS — (Unaudited) (Continued)
be separate performance obligations as the license is separately identifiable from the development services and clinical supply, and the development services are not expected to significantly modify or customize the IP.
The consideration allocable to the delivered performance obligation(s) is limited to the amount that is not contingent upon the delivery of additional items or meeting other specified performance conditions. The Company allocated the non-contingent consideration to each unit of accounting using the relative selling price method based on its best estimate of selling price for the license and other deliverables. The Company used a discounted cash flow model to estimate the fair value of the license in order to allocate the consideration to the performance obligations. To estimate the fair value of the license, the Company assessed the likelihood of the FDA’s approval of BIIB098 and estimated the expected future cash flows assuming FDA approval and the maintenance of the IP protecting BIIB098. The Company then discounted these cash flows using a discount rate of 8.0%, which it believes captures a market participant’s view of the risk associated with the expected cash flows. The best estimate of selling price of the development services and clinical supply were determined through third-party evidence. The Company believes that a change in the assumptions used to determine its best estimate of selling price for the license most likely would not have a significant effect on the allocation of consideration transferred.
At the date the license was delivered to Biogen, under Topic 606, the Company allocated $27.0 million to the delivery of the license, $0.9 million to future R&D work and $0.1 million to clinical supply. The amounts allocated to the R&D services and clinical supply will be recognized over the course of the R&D work and as clinical supply is delivered to Biogen, which is expected to continue through 2019.
The Company determined that the future milestones it is entitled to receive, including the $150.0 million payment upon approval by the FDA on or before December 31, 2021 of a 505(b)(2) NDA (or, in certain circumstances, a 505(b)(1) NDA) for BIIB098, and sales-based royalties, are variable consideration. The Company is using the most likely amount method for estimating the variable consideration to be received related to the milestones under this arrangement. Given the challenges inherent in developing and obtaining approval for pharmaceutical and biologic products, there was substantial uncertainty as to whether these milestones would be achieved at the time the license and collaboration agreement was entered into. Accordingly, the Company has not included these milestones or royalties in the transaction price as it is not probable that a significant reversal in the amount of cumulative revenue recognized will not occur.
During the three months ended June 30, 2018, the Company recognized $48.3 million in license revenue related to the license and collaboration agreement with Biogen for BIIB098, which was triggered by Biogen’s decision to pay the $50.0 million option payment following Biogen’s review of preliminary gastrointestinal tolerability data from the ongoing clinical development program for BIIB098, including certain data from the long-term safety clinical trial and part A of the elective, randomized, head-to-head phase 3 gastrointestinal tolerability clinical trial comparing BIIB098 and dimethyl fumarate. The Company previously determined that this $50.0 million milestone payment was variable consideration, as described above, and was not included in the initial transaction price as it was not probable that a significant reversal in the amount of cumulative revenue recognized would not occur. Upon receipt of the $50.0 million payment, the constraint preventing revenue recognition from previously occurring was removed and the payment was included in the transaction price and allocated to the performance obligations, as previously described. The Company recognized the transaction price allocated to the license upon receipt of the $50.0 million payment as the license had already been delivered to Biogen. The remaining $1.7 million of the $50.0 million payment was allocated to future development services and clinical supply, which will be accounted for as R&D revenue.
Research and development revenue—R&D revenue consists of funding that compensates the Company for formulation, pre‑clinical and clinical testing under R&D arrangements with its partners. The Company generally bills its partners under R&D arrangements using a full‑time equivalent (“FTE”) or hourly rate, plus direct external costs, if any. Revenue is recognized as the obligations under the R&D arrangements are performed. The research and development revenue recorded during the three and six months ended June 30, 2018 primarily related to revenue earned under the Company’s license and collaboration agreement with Biogen for BIIB098.
Table of Contents
ALKERMES PLC AND SUBSIDIARIES
NOTES TO CONDENSED CONSOLIDATED FINANCIAL STATEMENTS — (Unaudited) (Continued)
Product Sales, Net
The Company’s product sales, net consist of sales of VIVITROL and ARISTADA (together with ARISTADA INITIO) in the U.S., primarily to wholesalers, specialty distributors and pharmacies. Product sales, net are recognized when the customer obtains control of the product, which is when the product has been received by the customer.
Revenues from product sales are recorded net of reserves established for applicable discounts and allowances that are offered within contracts with the Company’s customers, health care providers or payers. The Company’s process for estimating reserves established for these variable consideration components does not differ materially from historical practices. The transaction price, which includes variable consideration reflecting the impact of discounts and allowances, may be subject to constraint and is included in the net sales price only to the extent that it is probable that a significant reversal of the amount of the cumulative revenues recognized will not occur in a future period. Actual amounts may ultimately differ from the Company’s estimates. If actual results vary, the Company adjusts these estimates, which could have an effect on earnings in the period of adjustment. The following are the Company’s significant categories of sales discounts and allowances:
●Medicaid Rebates—the Company records accruals for rebates to states under the Medicaid Drug Rebate Program as a reduction of sales when the product is shipped into the distribution channel using the most likely amount method. The Company rebates individual states for all eligible units purchased under the Medicaid program based on a rebate per unit calculation, which is based on the Company’s average manufacturer prices. The Company estimates expected unit sales and rebates per unit under the Medicaid program and adjusts its rebate based on actual unit sales and rebates per unit. To date, actual Medicaid rebates have not differed materially from the Company’s estimates;
●Chargebacks—discounts that occur when contracted indirect customers purchase directly from wholesalers and specialty distributors. Contracted customers generally purchase a product at its contracted price. The wholesaler or specialty distributor, in turn, then generally charges back to the Company the difference between the wholesale acquisition cost and the contracted price paid to the wholesaler or specialty distributor by the customer. The allowance for chargebacks is made using the most likely amount method and is based on actual and expected utilization of these programs. Chargebacks could exceed historical experience and the Company’s estimates of future participation in these programs. To date, actual chargebacks have not differed materially from the Company’s estimates;
●Product Discounts—cash consideration, including sales incentives, given by the Company under agreements with a number of wholesaler, distributor, pharmacy, and treatment provider customers that provide them with a discount on the purchase price of products. The reserve is made using the most likely amount method and to date, actual product discounts have not differed materially from the Company’s estimates; and
●Product Returns—the Company records an estimate for product returns at the time its customers take title to the Company’s product. The Company estimates this liability using the most likely amount method based on its historical return levels and specifically identified anticipated returns due to known business conditions and product expiry dates. Return amounts are recorded as a deduction to arrive at product sales, net. Once product is returned, it is destroyed.
During the three and six months ended June 30, 20182019 and 2017,2018, the Company recorded product sales, net, as follows:
| | | | | | | | | | | | | |
| | Three Months Ended June 30, | | Six Months Ended June 30, | | Three Months Ended June 30, | | | Six Months Ended June 30, | |
(In thousands) | | 2018 | | 2017 | | 2018 | | 2017 | | 2019 | | | 2018 | | | 2019 | | | 2018 | |
VIVITROL | | $ | 76,203 | | $ | 66,071 | | $ | 138,885 | | $ | 124,527 | | $ | 88,199 | | | $ | 76,203 | | | $ | 157,382 | | | $ | 138,885 | |
ARISTADA | | | 33,604 | | | 22,685 | | | 62,764 | | | 40,685 | | | 48,436 | | | | 33,604 | | | | 78,734 | | | | 62,764 | |
Total product sales, net | | $ | 109,807 | | $ | 88,756 | | $ | 201,649 | | $ | 165,212 | | $ | 136,635 | | | $ | 109,807 | | | $ | 236,116 | | | $ | 201,649 | |
Table of ContentsResearch and Development Revenue
ALKERMES PLC AND SUBSIDIARIES
NOTES TO CONDENSED CONSOLIDATED FINANCIAL STATEMENTS — (Unaudited) (Continued)
Receivables, Net—Receivables, net, include amounts billed and currently due from customers. The amounts due are stated at their net estimated realizable value. The Company maintains an allowance for doubtful accounts to provide forrecorded research and development (“R&D”) revenue of $13.6 million and $27.4 million during the estimated amount of receivables that will not be collected. The allowance is based upon an assessment of customer creditworthiness, historical payment experience,three and six months ended June 30, 2019, respectively, and $17.8 million and $35.3 million during the age of outstanding receivablesthree and collateral to the extent applicable. The Company’s allowance for doubtful accounts was $0.2 million atsix months ended June 30, 2018, respectively, related to its license and December 31, 2017.collaboration agreement with Biogen for diroximel fumarate (“BIIB098”). The Company expects to earn an additional $26.9 million in R&D revenue under this agreement with Biogen through 2021.
Contract Assets—Contract assets include unbilled amounts resulting from sales under certain of the Company’s manufacturing contracts where revenue is recognized over time. The products included in the contract assets table below complete the manufacturing process in ten days to eight weeks. As such, the Company availed itself of the practical expedient to not disclose the transaction price allocated to the remaining performance obligations as the only performance obligation is completing the manufacturing of such products, and the time remaining to manufacture the products is generally less than eight weeks. Contract assets are classified as current.
Contract assets consisted of the following:
| | | | |
(In thousands) | | Contract Assets | | Contract Assets | |
Contract assets at January 1, 2018 | | $ | 9,110 | |
Contract assets at January 1, 2019 | | | $ | 8,230 | |
Additions | | | 38,364 | | | 19,829 | |
Transferred to receivables, net | | | (32,892) | | | (15,369 | ) |
Contract assets at June 30, 2018 | | $ | 14,582 | |
Contract assets at June 30, 2019 | | | $ | 12,690 | |
Contract Liabilities—The Company’s contractContract liabilities consist of contractual obligations related to deferred revenue.
Contract liabilities consisted of the following:
| | | | |
(In thousands) | | Contract Liabilities | | Contract Liabilities | |
Contract liabilities at January 1, 2018 | | $ | 9,442 | |
Contract liabilities at January 1, 2019 | | | $ | 12,694 | |
Additions | | | 3,614 | | | 2,101 | |
Amounts recognized into revenue | | | (2,271) | | | (1,071 | ) |
Contract liabilities at June 30, 2018 | | $ | 10,785 | |
Contract liabilities at June 30, 2019 | | | $ | 13,724 | |
In order to determine revenue recognized in the period from contract liabilities, we first allocate revenue to the individual contract liability balance outstanding at the beginning of the period until the revenue exceeds that balance. If additional advances are received on those contracts in subsequent periods, we assume all revenue recognized in the reporting period first applies to the beginning contract liability as opposed to a portion applying to the new advances for the period.13
Table of Contents
ALKERMES PLC AND SUBSIDIARIES
NOTES TO CONDENSED CONSOLIDATED FINANCIAL STATEMENTS — (Unaudited) (Continued)
The Company adopted Topic 606 using the modified retrospective method. As such, the Company recognized the cumulative effect of initially applying Topic 606 as an adjustment to the opening balance of shareholders’ equity at January 1, 2018. Therefore, the comparative information has not been adjusted and continues to be reported under the old revenue recognition guidance (“Topic 605”). The quantitative impacts of the changes are set out below for each of the condensed consolidated balance sheet and the condensed consolidated statement of operations for the current reporting period.
ADJUSTED CONDENSED CONSOLIDATED BALANCE SHEET
| | | | | | | | | | |
| | June 30, 2018 |
| | As Reported | | Adjustment | | | Balances Without Adoption of Topic 606 |
| | (In thousands) |
ASSETS | | | | | | | | | | |
Contract assets | | $ | 14,582 | | $ | (14,582) | (1) | | $ | — |
Inventory | | | 87,165 | | | 9,346 | (2) | | | 96,511 |
Deferred tax asset | | | 93,066 | | | (223) | (3) | | | 92,843 |
| | | | | | | | | | |
LIABILITIES | | | | | | | | | | |
Contract liabilities—short-term | | $ | 4,928 | | $ | (4,928) | (4) | | $ | — |
Deferred revenue—short-term | | | — | | | 3,189 | (4) | | | 3,189 |
Contract liabilities—long-term | | | 5,857 | | | (5,857) | (4) | | | — |
Deferred revenue—long-term | | | — | | | 5,030 | (4) | | | 5,030 |
| | | | | | | | | | |
SHAREHOLDERS' EQUITY | | | | | | | | | | |
Accumulated deficit | | $ | (1,141,211) | | $ | (2,893) | (5) | | $ | (1,144,104) |
The adjustments are a result of the following:
| |
(1)
| Adjustment to contract assets is to reverse revenue recognized over time under Topic 606.
|
(2)
| Adjustment to inventory to add back the cost of goods manufactured related to the revenue transactions summarized in item (1), above.
|
(3)
| Adjustment to deferred tax asset is to apply the tax impact of the revenue transactions summarized in item (1), above.
|
(4)
| Adjustment to contract liabilities—short-term and contract liabilities—long-term to reclassify amounts previously classified as deferred revenue—short-term and deferred revenue—long-term under Topic 605.
|
(5)
| Adjustment to accumulated deficit for the net impact of the transactions noted in items (1) through (4), above.
|
Table of Contents
ALKERMES PLC AND SUBSIDIARIES
NOTES TO CONDENSED CONSOLIDATED FINANCIAL STATEMENTS — (Unaudited) (Continued)
ADJUSTED CONDENSED CONSOLIDATED STATEMENTS
OF OPERATIONS AND COMPREHENSIVE LOSS
| | | | | | | | | | | | | | | | | | | | |
| | Three Months Ended June 30, 2018 | | Six Months Ended June 30, 2018 |
| | As Reported | | Adjustment | | | Balances Without Adoption of Topic 606 | | As Reported | | Adjustment | | | Balances Without Adoption of Topic 606 |
| | (In thousands, except per share amounts) |
REVENUES: | | | | | | | | | | | | | | | | | | | | |
Manufacturing and royalty revenues | | $ | 128,241 | | $ | 11,487 | (1) | | $ | 139,728 | | $ | 242,842 | | $ | (5,472) | (1) | | $ | 237,370 |
Product sales, net | | | 109,807 | | | — | | | | 109,807 | | | 201,649 | | | — | | | | 201,649 |
License revenue | | | 48,250 | | | (48,250) | (2) | | | — | | | 48,250 | | | (48,250) | (2) | | | — |
Research and development revenue | | | 18,344 | | | 49,819 | (3) | | | 68,163 | | | 37,051 | | | 49,641 | (3) | | | 86,692 |
Total revenues | | | 304,642 | | | 13,056 | | | | 317,698 | | | 529,792 | | | (4,081) | | | | 525,711 |
EXPENSES: | | | | | | | | | | | | | | | | | | | | |
Cost of goods manufactured and sold | | | 43,417 | | | 4,988 | (4) | | | 48,405 | | | 87,893 | | | 1,139 | (4) | | | 89,032 |
Research and development | | | 106,823 | | | — | | | | 106,823 | | | 215,169 | | | — | | | | 215,169 |
Selling, general and administrative | | | 138,257 | | | — | | | | 138,257 | | | 256,404 | | | — | | | | 256,404 |
Amortization of acquired intangible assets | | | 16,247 | | | — | | | | 16,247 | | | 32,316 | | | — | | | | 32,316 |
Total expenses | | | 304,744 | | | 4,988 | | | | 309,732 | | | 591,782 | | | 1,139 | | | | 592,921 |
Operating loss | | | (102) | | | 8,068 | | | | 7,966 | | | (61,990) | | | (5,220) | | | | (67,210) |
Other expense, net | | | (24,343) | | | — | | | | (24,343) | | | (29,453) | | | — | | | | (29,453) |
Loss before income taxes | | | (24,445) | | | 8,068 | | | | (16,377) | | | (91,443) | | | (5,220) | | | | (96,663) |
Income tax provision | | | 8,204 | | | 1,372 | | | | 9,576 | | | 3,711 | | | 115 | | | | 3,826 |
Net loss | | $ | (32,649) | | $ | 6,696 | | | $ | (25,953) | | $ | (95,154) | | $ | (5,335) | | | $ | (100,489) |
| | | | | | | | | | | | | | | | | | | | |
Loss per ordinary share — basic and diluted | | $ | (0.21) | | $ | 0.04 | | | $ | (0.17) | | $ | (0.61) | | $ | (0.04) | | | $ | (0.65) |
The adjustments are a result of the following:
(1)
| Adjustment to manufacturing and royalty revenues to recognize revenue under Topic 605 in the three and six months ended June 30, 2018 that was recognized under Topic 606.
|
(2)
| Adjustments to license revenue during the three and six months ended June 30, 2018 to recognize revenue under Topic 605 that was recognized under Topic 606.
|
(3)
| Adjustments to research and development revenue during the three and six months ended June 30, 2018 to recognize revenue under Topic 605 that was recognized under Topic 606.
|
(4)
| Adjustment to cost of goods manufactured and sold to recognize the cost from the transactions noted in item (1), above.
|
The Company’s changes in assets and liabilities within its condensed consolidated statement of cash flows changed as a result of the differences in the condensed consolidated balance sheet and change in net income in the condensed consolidated statement of operations but the overall cash flows used in operating activities did not change.
Table of Contents
ALKERMES PLC AND SUBSIDIARIES
NOTES TO CONDENSED CONSOLIDATED FINANCIAL STATEMENTS — (Unaudited) (Continued)
4. INVESTMENTS
INVESTMENTS
Investments consisted of the following (in thousands):
| | | | | | | | | | | | | | | | | | | | | Gross Unrealized | | | | | |
| | | | Gross Unrealized | | | | | | | | | | | | Losses | | | | | |
| | | | | | Losses | | | | Amortized | | | | | | | Less than | | | Greater than | | | Estimated | |
| | Amortized | | | | Less than | | Greater than | | Estimated | |
June 30, 2018 | | Cost | | Gains | | One Year | | One Year | | Fair Value | |
June 30, 2019 | | | Cost | | | Gains | | | One Year | | | One Year | | | Fair Value | |
Short-term investments: | | | | | | | | | | | | | | | | | | | | | | | | | | | | | | | | | | | |
Available-for-sale securities: | | | | | | | | | | | | | | | | | | | | | | | | | | | | | | | | | | | |
Corporate debt securities | | | $ | 172,509 | | | $ | 765 | | | $ | — | | | $ | (64 | ) | | $ | 173,210 | |
U.S. government and agency debt securities | | $ | 167,322 | | $ | 3 | | $ | (144) | | $ | (116) | | $ | 167,065 | | | 114,271 | | | | 560 | | | | (1 | ) | | | (5 | ) | | | 114,825 | |
Corporate debt securities | | | 76,908 | | | 14 | | | (151) | | | (12) | | | 76,759 | |
International government agency debt securities | | | 33,885 | | | 2 | | | (53) | | | — | | | 33,834 | | | 85,970 | | | | 357 | | | | — | | | | (22 | ) | | | 86,305 | |
Total short-term investments | | | 278,115 | | | 19 | | | (348) | | | (128) | | | 277,658 | | | 372,750 | | | | 1,682 | | | | (1 | ) | | | (91 | ) | | | 374,340 | |
Long-term investments: | | | | | | | | | | | | | | | | | | | | | | | | | | | | | | | | | | | |
Available-for-sale securities: | | | | | | | | | | | | | | | | | | | | | | | | | | | | | | | | | | | |
Corporate debt securities | | | 67,126 | | | — | | | (503) | | | (35) | | | 66,588 | | | 13,545 | | | | — | | | | (10 | ) | | | (35 | ) | | | 13,500 | |
U.S. government and agency debt securities | | | 35,457 | | | — | | | (273) | | | (76) | | | 35,108 | | | 4,170 | | | | — | | | | (3 | ) | | | — | | | | 4,167 | |
International government agency debt securities | | | 21,875 | | | — | | | (186) | | | — | | | 21,689 | | | 2,019 | | | | — | | | | — | | | | — | | | | 2,019 | |
| | | 124,458 | | | — | | | (962) | | | (111) | | | 123,385 | | | 19,734 | | | | — | | | | (13 | ) | | | (35 | ) | | $ | 19,686 | |
Held-to-maturity securities: | | | | | | | | | | | | | | | | | | | | | | | | | | | | | | | | | | | |
Certificates of deposit | | | | 1,820 | | | | — | | | | — | | | | — | | | | 1,820 | |
Fixed term deposit account | �� | | 1,667 | | | 169 | | | — | | | — | | | 1,836 | | | 1,667 | | | | 126 | | | | — | | | | — | | | | 1,793 | |
Certificates of deposit | | | 1,791 | | | — | | | — | | | — | | | 1,791 | |
| | | 3,458 | | | 169 | | | — | | | — | | | 3,627 | | | 3,487 | | | | 126 | | | | — | | | | — | | | | 3,613 | |
Total long-term investments | | | 127,916 | | | 169 | | | (962) | | | (111) | | | 127,012 | | | 23,221 | | | | 126 | | | | (13 | ) | | | (35 | ) | | | 23,299 | |
Total investments | | $ | 406,031 | | $ | 188 | | $ | (1,310) | | $ | (239) | | $ | 404,670 | | $ | 395,971 | | | $ | 1,808 | | | $ | (14 | ) | | $ | (126 | ) | | $ | 397,639 | |
| | | | | | | | | | | | | | | | | | | | | | | | | | | | | | | | | | | |
December 31, 2017 | | | | | | | | | | | | | | | | |
December 31, 2018 | | | | | | | | | | | | | | | | | | | | | |
Short-term investments: | | | | | | | | | | | | | | | | | | | | | | | | | | | | | | | | | | | |
Available-for-sale securities: | | | | | | | | | | | | | | | | | | | | | | | | | | | | | | | | | | | |
Corporate debt securities | | | $ | 120,197 | | | $ | 57 | | | $ | (62 | ) | | $ | (274 | ) | | $ | 119,918 | |
U.S. government and agency debt securities | | $ | 150,673 | | $ | 1 | | $ | (130) | | $ | (233) | | $ | 150,311 | | | 80,055 | | | | 115 | | | | (11 | ) | | | (87 | ) | | | 80,072 | |
International government agency debt securities | | | | 72,091 | | | | 85 | | | | (8 | ) | | | (117 | ) | | | 72,051 | |
| | | | 272,343 | | | | 257 | | | | (81 | ) | | | (478 | ) | | | 272,041 | |
Held-to-maturity securities: | | | | | | | | | | | | | | | | | | | | | |
Corporate debt securities | | | 56,552 | | | 3 | | | (48) | | | (10) | | | 56,497 | | | 492 | | | | — | | | | — | | | | — | | | | 492 | |
International government agency debt securities | | | 35,478 | | | 1 | | | (54) | | | (25) | | | 35,400 | |
Total short-term investments | | | 242,703 | | | 5 | | | (232) | | | (268) | | | 242,208 | | | 272,835 | | | | 257 | | | | (81 | ) | | | (478 | ) | | | 272,533 | |
Long-term investments: | | | | | | | | | | | | | | | | | | | | | | | | | | | | | | | | | | | |
Available-for-sale securities: | | | | | | | | | | | | | | | | | | | | | | | | | | | | | | | | | | | |
Corporate debt securities | | | 83,924 | | | — | | | (300) | | | (34) | | | 83,590 | | | 53,505 | | | | — | | | | (185 | ) | | | (93 | ) | | $ | 53,227 | |
U.S. government and agency debt securities | | | 48,948 | | | — | | | (270) | | | (71) | | | 48,607 | | | 18,474 | | | | — | | | | (21 | ) | | | (12 | ) | | | 18,441 | |
International government agency debt securities | | | 21,453 | | | — | | | (118) | | | — | | | 21,335 | | | 5,457 | | | | — | | | | (4 | ) | | | — | | | | 5,453 | |
| | | 154,325 | | | — | | | (688) | | | (105) | | | 153,532 | | | 77,436 | | | | — | | | | (210 | ) | | | (105 | ) | | | 77,121 | |
Held-to-maturity securities: | | | | | | | | | | | | | | | | | | | | | | | | | | | | | | | | | | | |
Certificates of deposit | | | | 1,820 | | | | — | | | | — | | | | — | | | | 1,820 | |
Fixed term deposit account | | | 1,667 | | | 222 | | | — | | | — | | | 1,889 | | | 1,667 | | | | 136 | | | | — | | | | — | | | | 1,803 | |
Certificates of deposit | | | 1,791 | | | — | | | — | | | — | | | 1,791 | |
| | | 3,458 | | | 222 | | | — | | | — | | | 3,680 | | | 3,487 | | | | 136 | | | | — | | | | — | | | | 3,623 | |
Total long-term investments | | | 157,783 | | | 222 | | | (688) | | | (105) | | | 157,212 | | | 80,923 | | | | 136 | | | | (210 | ) | | | (105 | ) | | | 80,744 | |
Total investments | | $ | 400,486 | | $ | 227 | | $ | (920) | | $ | (373) | | $ | 399,420 | | $ | 353,758 | | | $ | 393 | | | $ | (291 | ) | | $ | (583 | ) | | $ | 353,277 | |
14
ALKERMES PLC AND SUBSIDIARIES
NOTES TO CONDENSED CONSOLIDATED FINANCIAL STATEMENTS — (Unaudited) (Continued)
The proceeds from the sales and maturities of marketable securities, which were identified using the specific identification method and were primarily reinvested, and resulted in realized gains and losses, were as follows:
| | | | | | | |
| | Six Months Ended June 30, | | Six Months Ended June 30, | |
(In thousands) | | 2018 | | 2017 | | 2019 | | | 2018 | |
Proceeds from the sales and maturities of marketable securities | | $ | 133,101 | | $ | 190,642 | | $ | 79,104 | | | $ | 133,101 | |
Realized gains | | $ | 4 | | $ | 9 | | $ | — | | | $ | 4 | |
Realized losses | | $ | 5 | | $ | 3 | | $ | 5 | | | $ | 5 | |
Table of Contents
ALKERMES PLC AND SUBSIDIARIES
NOTES TO CONDENSED CONSOLIDATED FINANCIAL STATEMENTS — (Unaudited) (Continued)
The Company’s available-for-sale and held-to-maturity securities at June 30, 20182019 had contractual maturities in the following periods:
| | | | | | | | | | | | | |
| | Available-for-sale | | Held-to-maturity | | Available-for-sale | | | Held-to-maturity | |
| | Amortized | | Estimated | | Amortized | | Estimated | | Amortized | | | Estimated | | | Amortized | | | Estimated | |
(In thousands) | | Cost | | Fair Value | | Cost | | Fair Value | | Cost | | | Fair Value | | | Cost | | | Fair Value | |
Within 1 year | | $ | 251,659 | | $ | 251,240 | | $ | 1,791 | | $ | 1,791 | | $ | 255,326 | | | $ | 255,736 | | | $ | 1,820 | | | $ | 1,820 | |
After 1 year through 5 years | | | 150,914 | | | 149,803 | | | 1,667 | | | 1,836 | | | 137,158 | | | | 138,290 | | | | 1,667 | | | | 1,793 | |
Total | | $ | 402,573 | | $ | 401,043 | | $ | 3,458 | | $ | 3,627 | | $ | 392,484 | | | $ | 394,026 | | | $ | 3,487 | | | $ | 3,613 | |
At June 30, 2018,2019, the Company believed that the unrealized losses on its available-for-sale investments were temporary. The investments with unrealized losses consisted primarily of U.S. government and agencycorporate debt securities. In making the determination that the decline in fair value of these securities was temporary, the Company considered various factors, including, but not limited to: the length of time each security was in an unrealized loss position; the extent to which fair value was less than cost; financial condition and near-term prospects of the issuers; the Company’s intent not to sell these securities; and the assessment that it is more likely than not that the Company would not be required to sell these securities before the recovery of their amortized cost basis.
In May 2014, the Company entered into an agreement whereby it is committed to provide up to €7.4 million to a partnership, Fountain Healthcare Partners II, L.P. of Ireland (“Fountain”), which was created to carry on the business of investing exclusively in companies and businesses engaged in the healthcare, pharmaceutical and life sciences sectors. As of June 30, 2018,2019, the Company’s total contribution in Fountain was equal to €4.2€5.5 million. The Company’s commitment represents approximately 7% of the partnership’s total funding. The Company is accounting for its investment in Fountain under the equity method. During the three and six months ended June 30, 2018, the Company recorded a decrease in its investment in Fountain of $0.4 million2019 and $0.5 million, respectively. During the three and six months ended June 30, 2017,2018, the Company recorded a decrease in its investment in Fountain of less than $0.1 million and $0.6 million, respectively. million. The decreaseschanges recorded represent the Company’s proportional share of Fountain’s net losses for these periods. The Company’s $3.45.9 million and $3.7$5.5 million net investment in Fountain at June 30, 20182019 and December 31, 2017,2018, respectively, was included within “Other assets” in the accompanying condensed consolidated balance sheets.
5. FAIR VALUE MEASUREMENTS
The following table presents information about the Company’s assets and liabilities that are measured at fair value on a recurring basis and indicates the fair value hierarchy of the valuation techniques the Company utilized to determine such fair value:
| | | | | | | | | | | | | |
| | June 30, | | | | | | | | | | | June 30, | | | | | | | | | | | | | |
(In thousands) | | 2018 | | Level 1 | | Level 2 | | Level 3 | | 2019 | | | Level 1 | | | Level 2 | | | Level 3 | |
Assets: | | | | | | | | | | | | | | | | | | | | | | | | | | | | |
Cash equivalents | | $ | 1,836 | | $ | 1,836 | | $ | — | | $ | — | | $ | 51,593 | | | $ | 51,593 | | | $ | — | | | $ | — | |
U.S. government and agency debt securities | | | 202,173 | | | 150,235 | | | 51,938 | | | — | | | 118,992 | | | | 70,233 | | | | 48,759 | | | | — | |
Corporate debt securities | | | 143,347 | | | — | | | 142,855 | | | 492 | | | 186,710 | | | | — | | | | 186,710 | | | | — | |
International government agency debt securities | | | 55,523 | | | — | | | 55,523 | | | — | | | 88,324 | | | | — | | | | 88,324 | | | | — | |
Contingent consideration | | | 63,300 | | | — | | | — | | | 63,300 | | | 26,100 | | | | — | | | | — | | | | 26,100 | |
Common stock warrants | | | 428 | | | — | | | — | | | 428 | | | 1,906 | | | | — | | | | — | | | | 1,906 | |
Total | | $ | 466,607 | | $ | 152,071 | | $ | 250,316 | | $ | 64,220 | | $ | 473,625 | | | $ | 121,826 | | | $ | 323,793 | | | $ | 28,006 | |
15
Table of Contents
ALKERMES PLC AND SUBSIDIARIES
NOTES TO CONDENSED CONSOLIDATED FINANCIAL STATEMENTS — (Unaudited) (Continued)
| | | | | | | | | | | | | |
| | December 31, | | | | | | | | | | | December 31, | | | | | | | | | | | | | |
| | 2017 | | Level 1 | | Level 2 | | Level 3 | | 2018 | | | Level 1 | | | Level 2 | | | Level 3 | |
Assets: | | | | | | | | | | | | | | | | | | | | | | | | | | | | |
Cash equivalents | | $ | 1,889 | | $ | 1,889 | | $ | — | | $ | — | | $ | 54,590 | | | $ | 54,590 | | | $ | — | | | $ | — | |
U.S. government and agency debt securities | | | 198,918 | | | 124,958 | | | 73,960 | | | — | | | 98,513 | | | | 60,107 | | | | 38,406 | | | | — | |
Corporate debt securities | | | 140,087 | | | — | | | 140,087 | | | — | | | 173,637 | | | | — | | | | 173,145 | | | | 492 | |
International government agency debt securities | | | 56,735 | | | — | | | 56,735 | | | — | | | 77,504 | | | | — | | | | 77,504 | | | | — | |
Contingent consideration | | | 84,800 | | | — | | | — | | | 84,800 | | | 65,200 | | | | — | | | | — | | | | 65,200 | |
Common stock warrants | | | 1,395 | | | — | | | — | | | 1,395 | | | 1,205 | | | | — | | | | — | | | | 1,205 | |
Total | | $ | 483,824 | | $ | 126,847 | | $ | 270,782 | | $ | 86,195 | | $ | 470,649 | | | $ | 114,697 | | | $ | 289,055 | | | $ | 66,897 | |
The Company transfers its financial assets and liabilities, measured at fair value on a recurring basis, between the fair value hierarchies at the end of each reporting period.
There were no transfers of any securities between the fair value hierarchies during the six months ended June 30, 2018.2019. The following table is a rollforward of the fair value of the Company’s assets whose fair values were determined using Level 3 inputs at June 30, 2018:2019:
| | | |
(In thousands) | | Fair Value |
Balance, January 1, 2018 | | $ | 86,195 |
Purchase of corporate debt security | | | 492 |
Change in the fair value of contingent consideration | | | (21,500) |
Decrease in the fair value of warrants | | | (967) |
Balance, June 30, 2018 | | $ | 64,220 |
(In thousands) | | Fair Value | |
Balance, January 1, 2019 | | $ | 66,897 | |
Change in the fair value of contingent consideration | | | (29,100 | ) |
Payment received for contingent consideration | | | (10,000 | ) |
Impairment of corporate debt security | | | (492 | ) |
Increase in the fair value of warrants | | | 701 | |
Balance, June 30, 2019 | | $ | 28,006 | |
The Company’s investments in U.S. government and agency debt securities, international government agency debt securities and corporate debt securities classified as Level 2 within the fair value hierarchy were initially valued at the transaction price and subsequently valued, at the end of each reporting period, utilizing market-observable data. The market-observable data included reportable trades, benchmark yields, credit spreads, broker/dealer quotes, bids, offers, current spot rates and other industry and economic events. The Company validated the prices developed using the market-observable data by obtaining market values from other pricing sources, analyzing pricing data in certain instances and confirming that the relevant markets are active.
The Company’s contingent consideration relates to the divestiture of its Gainesville, GA facility in March 2015 (the “Gainesville Transaction”), as summarized in Note 15, Divestiture, in the “Notes to Consolidated Financial Statements” of the Company’s Annual Report. At June 30,. On December 20, 2018, the Company determinedentered into a Second Amendment to the valuePurchase and Sale Agreement (“Purchase and Sale Agreement Amendment”) with Recro Pharma, Inc. (“Recro”), pursuant to which the Company received a $5.0 million payment in the first quarter of 2019 and another $5.0 million payment in the contingent consideration usingsecond quarter of 2019; the following valuation approaches:
• The Company is entitledeligible to receive $45.0 million upon regulatory approvallow double-digit royalties on net sales of the first NDA for IV/IM and parenteral forms of Meloxicam orand any other product with the same active ingredient as Meloxicam IV/IM that is discovered or identified using certain of the Company’s IP to which Recro Pharma, Inc. (“Recro”) was provided a right of use, through license or transfer (the “Meloxicam Product(s)”). The fair value; and is eligible to receive up to $130.0 million in milestone payments upon the achievement of thecertain regulatory milestone was estimated based on applying the likelihood of achieving this regulatory milestone and applying a discount rate from the expected time the milestone occurssales milestones related to the balance sheet date. The Company expects the regulatory milestone event to occur in the second quarter of 2019 and used a discount rate of 4.4%;
• The Company is entitled to receive future royalties on net sales of Meloxicam Products. To estimate the fair value of the future royalties, the Company assessed the likelihood of a Meloxicam Product being approved for sale and estimated the expected future sales of such Meloxicam Product assuming approval and IP protection. The Company then discounted these expected payments using a discount rate of 16.0%, which it believes captures a market participant’s view of the risk associated with the expected payments; and
16
• The Company is entitled to receive payments of up to $80.0 million upon achieving certain sales milestones on future sales of the Meloxicam Products. The sales milestones were determined through the use of a real
Table of Contents
ALKERMES PLC AND SUBSIDIARIES
NOTES TO CONDENSED CONSOLIDATED FINANCIAL STATEMENTS — (Unaudited) (Continued)
In accordance with the accounting standard for fair value measurements, the Company’s contingent consideration has been classified as a Level 3 asset as its fair value is based on significant inputs not observable in the market. The fair value of the contingent consideration at June 30, 2019 was determined as follows:
| • | The Company received a $5.0 million payment in the first quarter of 2019 and another $5.0 million payment in the second quarter of 2019; the Company is entitled to receive $5.0 million upon regulatory approval of a New Drug Application (“NDA”) for the first Meloxicam Product; and $45.0 million in seven equal, annual installments beginning on the first anniversary of such approval. The fair value of the regulatory milestone was estimated based on applying the likelihood of achieving the regulatory milestone and applying a discount rate from the expected time the milestone will occur to the balance sheet date. The Company expects the regulatory milestone event to occur in the third quarter of 2020 and used a discount rate of 17.0%; |
| • | The Company is entitled to receive future royalties on net sales of Meloxicam Products. To estimate the fair value of the future royalties, the Company assessed the likelihood of a Meloxicam Product being approved for sale and estimated the expected future sales given approval and IP protection. These expected payments were then discounted using a discount rate of 17.0%, which the Company believes captures a market participant’s view of the risk associated with the expected payments; and |
| • | The Company is entitled to receive payments of up to $80.0 million upon achieving certain sales milestones on future sales of the Meloxicam Products. The sales milestones were determined through the use of a real options approach, where net sales are simulated in a risk-neutral world. To employ this methodology, the Company used a risk-adjusted expected growth rate based on its assessments of expected growth in net sales of the approved Meloxicam Product, adjusted by an appropriate factor capturing their respective correlation with the market. A resulting expected (probability-weighted) milestone payment was then discounted at a cost of debt of 17.0%. |
Significant judgment was employed in determining the appropriateness of these assumptions at the acquisition date and for each subsequent period. Accordingly, changes in assumptions described above could have a material impact on the increase or decrease in the fair value of contingent consideration recorded in any given period.
In March 2019, Recro received a second complete response letter (“CRL”) from the U.S. Food and Drug Administration (“FDA”) regarding its NDA for IV Meloxicam. As a result of Recro’s receipt of this second CRL, the Company used a risk-adjusted expected growth rate based ondelayed its assessments of expected growth in net salesanticipated date for the FDA’s approval of the approvedIV Meloxicam Product, adjusted by an appropriate factor capturing their respective correlation withNDA and reduced the market. A resulting expected (probability-weighted) milestone payment was then discounted at a costprobability of debt, which ranged from 4.2%success and amount of forecasted sales due to 5.9%.
this delay in our valuation model. At June 30, 20182019 and December 31, 2017,2018, the Company determined that the value of the contingent consideration was $63.3$26.1 million and $84.8$65.2 million, respectively. The Company recorded a decrease of $19.6$6.5 million and $21.5$29.1 million during the three and six months ended June 30, 2018,2019, respectively, and an increase of $0.7$19.6 million and $2.3$21.5 million duringin the three and six months ended June 30, 2017,2018, respectively, within “Change in the fair value of contingent consideration” in the accompanying condensed consolidated statements of operations and comprehensive loss.
As part of the Gainesville Transaction, the Company also received warrants to purchase 350,000 shares of Recro common stock at a per share exercise price of $19.46. The Company used a Black-Scholes model with the following assumptions to determine the fair value of these warrants at June 30, 2018:
| | | | |
Closing stock price at June 30, 2018 | | $ | 5.02 | |
Warrant strike price | | $ | 19.46 | |
Expected term (years) | | | 3.78 | |
Risk-free rate | | | 2.67 | % |
Volatility | | | 74.0 | % |
During the three and six months ended June 30, 2018, the Company determined that the fair value of the warrants, recorded within “Other assets” in the accompanying condensed consolidated balance sheets, decreased by $1.3 million and $1.0 million, respectively, and during the three and six months ended June 30, 2017, decreased by $0.4 million and $0.2 million, respectively. The change in the fair value of the warrants was recorded within “Other expense, net” in the accompanying condensed consolidated statements of operations and comprehensive loss.
The carrying amounts reflected in the condensed consolidated balance sheets for cash and cash equivalents, accounts receivable, other current assets, accounts payable and accrued expenses approximate fair value due to their short-term nature.
6. INVENTORY
Inventory is stated at the lower of cost and net realizable value. Cost is determined using the first-in, first-out method. Inventory consisted of the following:
| | | | | | | |
| | June 30, | | December 31, | | June 30, | | | December 31, | |
(In thousands) | | 2018 | | 2017 | | 2019 | | | 2018 | |
Raw materials | | $ | 31,328 | | $ | 29,883 | | $ | 31,729 | | | $ | 31,824 | |
Work in process | | | 37,180 | | | 38,964 | | | 44,833 | | | | 38,019 | |
Finished goods(1) | | | 18,657 | | | 24,428 | | | 18,218 | | | | 20,353 | |
Total inventory | | $ | 87,165 | | $ | 93,275 | | $ | 94,780 | | | $ | 90,196 | |
(1) | At June 30, 20182019 and December 31, 2017,2018, the Company had $13.3$15.0 million and $8.7$11.0 million, respectively, of finished goods inventory located at its third-party warehouse and shipping service provider. |
17
Table of Contents
ALKERMES PLC AND SUBSIDIARIES
NOTES TO CONDENSED CONSOLIDATED FINANCIAL STATEMENTS — (Unaudited) (Continued)
7. PROPERTY, PLANT AND EQUIPMENT
Property, plant and equipment consisted of the following:
| | | | | | | |
| | June 30, | | December 31, | | June 30, | | | December 31, | |
(In thousands) | | 2018 | | 2017 | | 2019 | | | 2018 | |
Land | | $ | 6,293 | | $ | 6,293 | | $ | 6,560 | | | $ | 6,486 | |
Building and improvements | | | 156,168 | | | 155,198 | | | 172,410 | | | | 157,053 | |
Furniture, fixtures and equipment | | | 301,012 | | | 289,455 | | | 328,164 | | | | 314,831 | |
Leasehold improvements | | | 19,890 | | | 19,578 | | | 20,105 | | | | 20,105 | |
Construction in progress | | | 72,010 | | | 54,270 | | | 95,720 | | | | 88,983 | |
Subtotal | | | 555,373 | | | 524,794 | | | 622,959 | | | | 587,458 | |
Less: accumulated depreciation | | | (258,738) | | | (240,058) | | | (296,729 | ) | | | (277,471 | ) |
Total property, plant and equipment, net | | $ | 296,635 | | $ | 284,736 | | $ | 326,230 | | | $ | 309,987 | |
8. GOODWILL AND INTANGIBLE ASSETS
Goodwill and intangible assets consisted of the following:
| | | | | | | | | | | | |
| | | | Six Months Ended | |
| | | | June 30, 2018 | | | | June 30, 2019 | | | December 31, 2018 | |
(In thousands) | | Weighted
Amortizable
Life (Years) | | Gross Carrying Amount | | Accumulated
Amortization | | Net Carrying
Amount | | Weighted Amortizable Life (Years) | | Gross Carrying Amount | | | Accumulated Amortization | | | Net Carrying Amount | | | Gross Carrying Amount | | | Accumulated Amortization | | | Net Carrying Amount | |
Goodwill | | | | $ | 92,873 | | $ | — | | $ | 92,873 | | | | $ | 92,873 | | | $ | — | | | $ | 92,873 | | | $ | 92,873 | | | $ | — | | | $ | 92,873 | |
Finite-lived intangible assets: | | | | | | | | | | | | | | | | | | | | | | | | | | | | | | | | | | | | | |
Collaboration agreements | | 12 | | $ | 465,590 | | $ | (294,147) | | $ | 171,443 | | 12 | | $ | 465,590 | | | $ | (333,834 | ) | | $ | 131,756 | | | $ | 465,590 | | | $ | (319,311 | ) | | $ | 146,279 | |
NanoCrystal technology | | 13 | | | 74,600 | | | (35,081) | | | 39,519 | | 13 | | | 74,600 | | | | (42,826 | ) | | | 31,774 | | | | 74,600 | | | | (38,942 | ) | | | 35,658 | |
OCR technologies | | 12 | | | 42,560 | | | (29,670) | | | 12,890 | | 12 | | | 42,560 | | | | (35,104 | ) | | | 7,456 | | | | 42,560 | | | | (33,496 | ) | | | 9,064 | |
Total | | | | $ | 582,750 | | $ | (358,898) | | $ | 223,852 | | | | $ | 582,750 | | | $ | (411,764 | ) | | $ | 170,986 | | | $ | 582,750 | | | $ | (391,749 | ) | | $ | 191,001 | |
Based on the Company’s most recent analysis, amortization of intangible assets included within its condensed consolidated balance sheet at June 30, 20182019 is expected to be approximately $65.0$40.0 million, $55.0$40.0 million, $50.0$40.0 million, $40.0$35.0 million and $35.0 million in the years ending December 31, 20182019 through 2022,2023, respectively. Although the Company believes such available information and assumptions are reasonable, given the inherent risks and uncertainties underlying its expectations regarding such future revenues, there is the potential for the Company’s actual results to vary significantly from such expectations. If revenues are projected to change, the related amortization of the intangible assets will change in proportion to the change in revenues.
9. LEASES
The Company adopted Topic 842 on January 1, 2019. Upon adoption, the Company elected the package of transition practical expedients, which allowed it to carry forward prior conclusions related to whether any expired or existing contracts are or contain leases, the lease classification for any expired or existing leases and initial direct costs for existing leases. The Company also elected the practical expedient to not reassess certain land easements and made an accounting policy election to not recognize leases with an initial term of 12 months or less within its condensed consolidated balance sheets and to instead recognize those lease payments on a straight-line basis in its condensed consolidated statements of operations over the lease term.
The Company elected to adopt this standard using the optional modified retrospective transition method with no restatement of its prior periods or cumulative adjustment to retained earnings. With the adoption of Topic 842, the Company’s condensed consolidated balance sheet now contains the following line items: Right-of-use assets, Operating lease liabilities—short-term and Operating lease liabilities—long-term.
18
ALKERMES PLC AND SUBSIDIARIES
NOTES TO CONDENSED CONSOLIDATED FINANCIAL STATEMENTS — (Unaudited) (Continued)
The Company determined that it held the following significant operating leases of office and laboratory space as of January 1, 2019:
| • | An operating lease for 175,000 square feet of office and laboratory space in Waltham, Massachusetts that expires in 2021, with an option to extend the term for up to two five-year periods; |
| • | An operating lease for 67,000 square feet of office space in Waltham, Massachusetts that expires in 2020, with an option to extend the term for up to two one-year periods; |
| • | An operating lease for 14,600 square feet of office space in Dublin, Ireland that expires in 2022, with an option to extend the term for an additional five-year period; and |
| • | An operating lease for 7,000 square feet of corporate office and administrative space in Washington, D.C. that expires in 2029 and includes an option to extend the term for an additional five-year period. |
The Company also has two additional operating leases that are included in its lease accounting but are not considered significant.
As all the existing leases subject to the new lease standard were previously classified as operating leases by the Company, they were similarly classified as operating leases under the new standard. The Company has determined that the identified operating leases did not contain non-lease components and require no further allocation of the total lease cost. Additionally, the agreements in place did not contain information to determine the rate implicit in the leases. As such, the Company calculated the incremental borrowing rate based on the assumed remaining lease term for each lease in order to calculate the present value of the remaining lease payments. At June 30, 2019, the weighted average incremental borrowing rate and the weighted average remaining lease term for the operating leases held by the Company were 4.64% and 4.1 years, respectively.
As of June 30, 2019, right-of-use assets and liabilities arising from operating leases were $15.9 million and $17.6 million, respectively. During the three and six months ended June 30, 2019, cash paid for amounts included for the measurement of lease liabilities was $2.3 million and $4.6 million, respectively and the Company recorded operating lease expense of $2.1 million and $4.2 million, respectively.
Future lease payments under non-cancelable leases as of June 30, 2019 and December 31, 2018:
| | June 30, | | | December 31, | |
(In thousands) | | 2019 | | | 2018 | |
2019 | | $ | 4,492 | | | $ | 9,394 | |
2020 | | | 8,651 | | | | 10,717 | |
2021 | | | 2,519 | | | | 4,706 | |
2022 | | | 500 | | | | 2,455 | |
2023 | | | 509 | | | | 2,389 | |
Thereafter | | | 3,107 | | | | 23,940 | |
Total lease payments | | $ | 19,778 | | | $ | 53,601 | |
Less: imputed interest | | | (2,204 | ) | | | — | |
Total operating lease liabilities | | $ | 17,574 | | | $ | 53,601 | |
In March 2018, the Company entered into a lease agreement for approximately 220,000 square feet of office and laboratory space located in a building that is being built at 900 Winter Street, Waltham, Massachusetts (“900 Winter Street”). The Company plans to occupy the premises in early 2020. The initial term of the lease shall commence on the earlier of: (i) the Delivery Date (defined as the later of (a) January 20, 2020, or (b) the date on which the landlord substantially completes its work in accordance with the terms of the lease), or (ii) the date the Company enters into possession of all or any substantial portion of 900 Winter Street for the conduct of its business (the “Commencement Date”). The initial lease term expires on the last day of the calendar month in which the fifteenth (15th) anniversary of the Commencement Date occurs, with an option to extend for an additional ten (10) years.
19
ALKERMES PLC AND SUBSIDIARIES
NOTES TO CONDENSED CONSOLIDATED FINANCIAL STATEMENTS — (Unaudited) (Continued)
As the Company (a) does not have the right to obtain or control the leased premises during the construction period; (b) does not have the right of payment for the partially constructed assets and, thus, could be potentially leased to another tenant; and (c) does not legally own or control the land on which the property improvements are being constructed, it was not included as a right-of-use asset at June 30, 2019. Additionally, the future lease payments, outlined above, included the 900 Winter Street payments as of December 31, 2018; these payments are not included in the table under Topic 842.
10. ACCOUNTS PAYABLE AND ACCRUED EXPENSES
Accounts payable and accrued expenses consisted of the following:
| | | | | | | |
| | June 30, | | December 31, | | June 30, | | | December 31, | |
(In thousands) | | 2018 | | 2017 | | 2019 | | | 2018 | |
Accounts payable | | $ | 57,879 | | $ | 55,526 | | $ | 42,880 | | | $ | 39,767 | |
Accrued compensation | | | 43,929 | | | 54,568 | | | 54,011 | | | | 67,613 | |
Accrued sales discounts, allowances and reserves | | | 124,363 | | | 111,137 | | | 147,608 | | | | 152,911 | |
Accrued other | | | 53,531 | | | 64,935 | | | 75,991 | | | | 73,471 | |
Total accounts payable and accrued expenses | | $ | 279,702 | | $ | 286,166 | | $ | 320,490 | | | $ | 333,762 | |
Table of Contents
ALKERMES PLC AND SUBSIDIARIES
NOTES TO CONDENSED CONSOLIDATED FINANCIAL STATEMENTS — (Unaudited) (Continued)
10.11. LONG-TERM DEBT
Long-term debt consisted of the following:
| | | | | | | |
| | June 30, | | December 31, | | June 30, | | | December 31, | |
(In thousands) | | 2018 | | 2017 | | 2019 | | | 2018 | |
2023 Term Loans, due March 26, 2023 | | $ | 280,391 | | $ | 281,436 | | $ | 278,224 | | | $ | 279,308 | |
Less: current portion | | | (2,843) | | | (3,000) | | | (2,843 | ) | | | (2,843 | ) |
Long-term debt | | $ | 277,548 | | $ | 278,436 | | $ | 275,381 | | | $ | 276,465 | |
In March 2018, the Company amended and refinanced its existing term loan, referred to as Term Loan B-1 (as so amended and refinanced, the “2023 Term Loans”), in order to, among other things, extend the due date of the loan from September 25, 2021 to March 26, 2023, reduce the interest payable from LIBOR plus 2.75% with a LIBOR floor of 0.75% to LIBOR plus 2.25% 2.25% with noa 0% LIBOR floor and increase covenant flexibility (the “Refinancing”).
The Refinancing involved multiple lenders who were considered members of a loan syndicate. In determining whether the Refinancing was to be accounted for as a debt extinguishment or a debt modification, the Company considered whether creditors remained the same or changed and whether the changes in debt terms were substantial. A change in the debt terms was considered to be substantial if the present value of the remaining cash flows under the new terms of the 2023 Term Loans was at least 10% different from the present value of the remaining cash flows under the former Term Loan B-1 (commonly referred to as the “10% Test”). The Company performed a separate 10% Test for each individual creditor participating in the loan syndication. With the exception of one lender, who owned 1% of the total outstanding principal amount of Term Loan B-1 at the date of the Refinancing and was accounted for as a debt extinguishment, the Refinancing was accounted for as a debt modification.
The Refinancing resulted in a $2.3 million charge in the three months ended March 31, 2018, which was included in “Interest expense” in the accompanying condensed consolidated statement of operations and comprehensive loss.
11. RESTRUCTURINGThe estimated fair value of the 2023 Term Loans, which was based on quoted market price indications (Level 2 in the fair value hierarchy, as described in Note 5, Fair Value Measurements, above) and which may not be representative of actual values that could have been, or will be, realized in the future, was $278.2 million and $274.7 million at June 30, 2019 and December 31, 2018, respectively.
On January 25, 2018, the Company’s management approved a restructuring plan at its Athlone, Ireland manufacturing facility designed to streamline future operational performance. The restructuring plan included a reduction in headcount of 24 employees. In connection with this restructuring plan, during the six months ended June 30, 2018, the Company recorded a restructuring charge of $3.2 million within cost of goods manufactured and sold and $0.4 million within R&D expense, which consisted of severance and outplacement services. As of June 30, 2018, the Company had made substantially all of its severance and outplacement services payments related to this restructuring.20
ALKERMES PLC AND SUBSIDIARIES
NOTES TO CONDENSED CONSOLIDATED FINANCIAL STATEMENTS — (Unaudited) (Continued)
12. SHARE-BASED COMPENSATION
Share-based compensation expense consisted of the following:
| | | | | | | | | | | | | |
| | Three Months Ended | | Six Months Ended | | Three Months Ended | | | Six Months Ended | |
| | June 30, | | June 30, | | June 30, | | | June 30, | |
(In thousands) | | 2018 | | 2017 | | 2018 | | 2017 | | 2019 | | | 2018 | | | 2019 | | | 2018 | |
Cost of goods manufactured and sold | | $ | 2,454 | | $ | 1,908 | | $ | 3,872 | | $ | 4,141 | | $ | 2,505 | | | $ | 2,454 | | | $ | 4,483 | | | $ | 3,872 | |
Research and development | | | 8,552 | | | 5,661 | | | 15,266 | | | 11,255 | | | 8,135 | | | | 8,552 | | | | 15,881 | | | | 15,266 | |
Selling, general and administrative | | | 19,927 | | | 15,110 | | | 31,837 | | | 28,452 | | | 17,605 | | | | 19,927 | | | | 32,497 | | | | 31,837 | |
Total share-based compensation expense | | $ | 30,933 | | $ | 22,679 | | $ | 50,975 | | $ | 43,848 | | $ | 28,245 | | | $ | 30,933 | | | $ | 52,861 | | | $ | 50,975 | |
At June 30, 20182019 and December 31, 2017, $0.52018, $3.0 million and $0.4$2.7 million, respectively, of share-based compensation cost was capitalized and recorded as “Inventory” in the accompanying condensed consolidated balance sheets.
In February 2017, the compensation committee of the Company’s board of directors approved awards of restricted stock units (“RSUs”) to all employees employed by the Company during 2017, in each case subject to vesting on the
Table of Contents
ALKERMES PLC AND SUBSIDIARIES
NOTES TO CONDENSED CONSOLIDATED FINANCIAL STATEMENTS — (Unaudited) (Continued)
achievement of the following performance criteria: (i) FDA approval of the NDA for ALKS 5461, (ii) the achievement of the pre-specified primary efficacy endpoints in each of two phase 3 studies of ALKS 3831, and (iii) revenues equal to or greater than a pre-specified amount for the year ending December 31, 2019. These performance criteria are being assessed over a performance period of three years from the date of the grant.
In December 2018, the Company achieved the pre-specified primary efficacy endpoints on its second of the two phase 3 studies of ALKS 3831, resulting in the vesting of a portion of the performance-based RSUs and the recognition of $17.1 million in share-based compensation expense related to these awards. The Company recognized $2.1 million, $6.7 million and $8.3 million of this expense in cost of goods manufactured and sold; R&D expense; and SG&A expense, respectively.
At June 30, 2018,2019, there was $56.7$32.4 million of unrecognized compensation cost related to these performance-vestingthe remaining unvested portion of the performance-based RSUs, which would be recognized in accordance with the terms of the award if and when the Company deems it probable that the performance criteria will be met.
The unvested portion of the awards will expire if the performance conditions have not been met on or before the three-year anniversary of the grant date.
13. LOSS PER SHARE
Basic loss per ordinary share is calculated based upon net loss available to holders of ordinary shares divided by the weighted average number of shares outstanding. For the three and six months ended June 30, 20182019 and 2017,2018, as the Company was in a net loss position, the diluted loss per share calculation did not assume conversion or exercise of stock options and awards as they would have had an anti-dilutive effect on loss per share.
The following potential ordinary equivalent shares have not been included in the net loss per ordinary share calculation because the effect would have been anti-dilutive:
| | | | | | | | | | | |
| | Three Months Ended | | Six Months Ended | | Three Months Ended | | | Six Months Ended | |
| | June 30, | | June 30, | | June 30, | | | June 30, | |
(In thousands) | | 2018 | | 2017 | | 2018 | | 2017 | | 2019 | | | 2018 | | | 2019 | | | 2018 | |
Stock options | | | 11,572 | | | 9,850 | | 10,465 | | 9,511 | | | 14,548 | | | | 11,572 | | | | 14,217 | | | | 10,465 | |
Restricted stock units | | | 2,832 | | | 2,159 | | 2,819 | | 1,998 | | | 3,254 | | | | 2,832 | | | | 2,609 | | | | 2,819 | |
Total | | | 14,404 | | | 12,009 | | 13,284 | | 11,509 | | | 17,802 | | | | 14,404 | | | | 16,826 | | | | 13,284 | |
21
ALKERMES PLC AND SUBSIDIARIES
NOTES TO CONDENSED CONSOLIDATED FINANCIAL STATEMENTS — (Unaudited) (Continued)
14. COMMITMENTS AND CONTINGENCIES
Lease Commitments
In March 2018, the Company entered into a lease agreement for approximately 220,000 square feet of office and laboratory space located in a building to be built at 900 Winter Street, Waltham, Massachusetts (“900 Winter Street”). The Company plans to occupy the premises in early 2020. The initial term of the lease shall commence on the earlier of: (i) the Delivery Date (defined as (a) the later of January 20, 2020, or (b) the date on which the landlord substantially completes its work in accordance with the terms of the lease), or (ii) the date the Company enters into possession of all or any substantial portion of 900 Winter Street for the conduct of its business (the “Commencement Date”). The initial lease term expires on the last day of the calendar month in which the fifteenth (15th) anniversary of the Commencement Date occurs, with an option to extend for an additional ten (10) years.
CONTINGENT LIABILITIES
Litigation
From time to time, the Company may be subject to legal proceedings and claims in the ordinary course of business. On a quarterly basis, the Company reviews the status of each significant matter and assesses its potential financial exposure. If the potential loss from any claim, asserted or unasserted, or legal proceeding is considered probable and the amount can be reasonably estimated, the Company would accrue a liability for the estimated loss. Because of uncertainties related to claims and litigation, accruals are based on the Company’s best estimates, based onutilizing all available information. On a periodic basis, as additional information becomes available, or based on specific events such as the outcome of litigation or settlement of claims, the Company may reassess the potential liability related to these matters and may revise these estimates, which could result in material adverse adjustments to the Company’s operating results. At June 30, 2018,2019, there were no potential material losses from claims, asserted or unasserted, or legal proceedings the Company determined were probable of occurring.
Table of Contents
ALKERMES PLC AND SUBSIDIARIES
NOTES TO CONDENSED CONSOLIDATED FINANCIAL STATEMENTS — (Unaudited) (Continued)
INVEGA SUSTENNA ANDA Litigation
In January 2018, Janssen Pharmaceuticals NV and Janssen Pharmaceuticals, Inc. initiated a patent infringement lawsuit in the United States District Court for the District of New Jersey against Teva Pharmaceuticals USA, Inc. (“Teva”), who filed an abbreviated new drug application (“ANDA”) seeking approval to market a generic version of INVEGA SUSTENNA before the expiration of United StatesU.S. Patent No. 9,439,906. Requested judicial remedies included recovery of litigation costs and injunctive relief. The Company is not a party to these proceedings.
For information about risks relating to the INVEGA SUSTENNA Paragraph IV litigation, see “Part I, Item 1A—Risk Factors” of the Company’s Annual Report, and specificallyincluding the section entitled “—We or our licensees may face claims against IPintellectual property rights covering our products and competition from generic drug manufacturers.”
AMPYRA ANDA Litigation
TenEleven separate Paragraph IV Certification Notices have been received by the Company and/or its partner Acorda from: Accord Healthcare, Inc. (“Accord”); Actavis Laboratories FL, Inc. (“Actavis”); Alkem Laboratories Ltd. (“Alkem”); Apotex Corporation and Apotex, Inc. (collectively, “Apotex”); Aurobindo Pharma Ltd. (“Aurobindo”); MicroLabs Limited (“MicroLabs”); Mylan Pharmaceuticals, Inc. (“Mylan”); Par Pharmaceutical, Inc. (“Par”); Roxane Laboratories, Inc. (“Roxane”); Sun Pharmaceutical Industries Limited and Sun Pharmaceuticals Industries Inc. (collectively, “Sun”); and Teva (collectively with Accord, Actavis, Alkem, Apotex, Aurobindo, MicroLabs, Mylan, Par, Roxane and Sun, the “ANDA Filers”) advising that each of the ANDA Filers had submitted an ANDA to the FDA seeking marketing approval for generic versions of AMPYRA (dalfampridine) Extended-Release Tablets, 10 mg. The ANDA Filers challenged the validity of one or more of the Orange Book-listed patents for AMPYRA, and they also asserted that their generic versions do not infringe certain claims of these patents. In response, the Company and/or Acorda filed lawsuits against the ANDA Filers in the U.S. District Court for the District of Delaware (the “Delaware Court”) asserting infringement of U.S. Patent No. 5,540,938 (the “‘938 Patent”), whichone or more of the Company owns, and U.S. Patent Nos. 8,007,826; 8,354,437; 8,440,703; and 8,663,685, which are owned by Acorda.Orange Book-listed patents for AMPYRA. Requested judicial remedies included recovery of litigation costs and injunctive relief. Mylan challenged the jurisdiction of the Delaware Court with respect to the Delaware action. In January 2015, the Delaware Court denied Mylan’s motion to dismiss. Subsequently, in January 2015, the Delaware Court granted Mylan’s request for an interlocutory appeal of its jurisdictional decision to the Federal Circuit. In March 2016, the Federal Circuit denied Mylan’s appeal. Mylan requested the U.S. Court of Appeals for the Federal Circuit (the “Federal Circuit”) to reconsider its decision. However, on June 20, 2016, the Federal Circuit denied Mylan’s request. Mylan filed an appeal with the U.S. Supreme Court, which was denied.
All lawsuits were filed within 45 days from the date of receipt of each of the Paragraph IV Certification Notices from the ANDA Filers. As a result, a 30-month statutory stay of approval period applied to each of the ANDA Filers’ ANDAs under the U.S. Drug Price Competition and Patent Term Restoration Act of 1984 (the “Hatch-Waxman Act”). The first 30-month stay started on January 22, 2015, and restricted the FDA from approving the ANDA Filers’ ANDAs until July 2017 at the earliest, unless a Federal district court issued a decision adverse to all of the asserted Orange Book-listed patents prior to that date. Lawsuits with eight of the ANDA Filers have beenwere consolidated into a single case.
The Company and/or Acorda entered into a settlement agreement with each of Accord, Actavis, Alkem, Apotex, Aurobindo, MicroLabs, Par and Sun (collectively, the “Settling ANDA Filers”) to resolve the patent litigation that the Company and/or Acorda brought against the Settlingthese settling ANDA Filers in the Delaware Court. As a result of the settlement agreements, the Settling ANDA Filers will be permitted to market generic versions of AMPYRA in the U.S. at a specified date in the future. The parties submitted their respective settlement agreements to the U.S. Federal Trade Commission and the U.S. Department of Justice, as required by federal law.Filers. The settlements with the Settlingthese settling ANDA Filers did not impact the patent litigation that the Company and Acorda brought against the remaining ANDA Filers, (the “Non-Settling ANDA Filers”),including as described in this Form 10-Q.below.
22
On March 31, 2017, after a bench trial, the Delaware Court issued an opinion (the “Delaware Court Decision”), upholding the validity of the ‘938 Patent, which pertains to the formulation of AMPYRA and is set to expire on July 30,
Table of Contents
ALKERMES PLC AND SUBSIDIARIES
NOTES TO CONDENSED CONSOLIDATED FINANCIAL STATEMENTS — (Unaudited) (Continued)
2018, and finding that Apotex, Mylan, Roxane and Teva stipulated that their proposed generic formsIn March 2017, after a bench trial, the U.S. District Court for the District of AMPYRA infringed the ‘938 Patent. The Delaware (the “Delaware Court”) issued an opinion (the “Delaware Court alsoDecision”), which, among other things, invalidated U.S. Patent Nos. 8,007,826; 8,354,437; 8,440,703; and 8,663,685. The Delaware Court also upheld the validity of the U.S. Patent No. 5,540,938 which pertained to the formulation of AMPYRA, but that patent expired on July 30, 2018. In May 2017, Acorda filed an appeal with the Federal Circuit of the Delaware Court Decision with the Federal Circuit with respect to the findings on U.S. Patent Nos. 8,007,826; 8,354,437; 8,440,703; and 8,663,685. In June 2017,On September 10, 2018, the Non-Settling ANDA Filers filed their cross-appeal ofFederal Circuit affirmed the Delaware Court Decision, withwhich invalidated U.S. Patent Nos. 8,007,826; 8,354,437; 8,440,703; and 8,663,685. In October 2018, Acorda filed a petition for rehearing and rehearing en banc of the Federal Circuit’s decision, but in January 2019, the Federal Circuit with respectdenied Acorda’s petition. In April 2019, Acorda filed a petition for writ of certiorari to the validitySupreme Court of the ‘938 Patent. The CompanyUnited States. In June 2019, Roxane, Mylan and AcordaTeva filed their openinga brief on August 7, 2017. The Non-Settling ANDA Filers responded on October 2, 2017. The Companyin opposition to Acorda’s petition and Acorda filed a response and reply brief on November 13, 2017, and the Non-Settling ANDA Filers filed their reply brief on November 27, 2017. The Federal Circuit heard oral argument on June 7, 2018. In addition, on May 23, 2018, Acorda filed a motion for an injunction pending appeal with the Federal Circuit. The Non-Settling ANDA Filers filed an opposition on May 30, 2018 and Acorda filed its reply on June 6, 2018. This motion is currently pending. If the Federal Circuit upholds the Delaware Court Decision or, in certain circumstances, remands or vacates the decision to the Delaware Court, we can expect competition from generic forms of AMPYRA as early as July 31, 2018, following expiration of the ‘938 Patent.such opposition.
The Company intends to vigorously enforce its IP rights. For information about risks relating to the AMPYRA Paragraph IV litigations and other proceedings see “Part I, Item 1A—Risk Factors” of the Company’s Annual Report, and specificallyincluding the section entitled “—We or our licensees may face claims against IPintellectual property rights covering our products and competition from generic drug manufacturers.”
VIVITROL IPR Proceeding
OnIn April 20, 2018, Amneal Pharmaceuticals LLC (“Amneal”) filed a petition with the Patent Trial and Appeal Board (the “PTAB”) of the U.S. Patent and Trademark Office seeking an inter partes review (“IPR”) petition with the U.S. Patent and Trademark Office challengingof U.S. Patent Number 7,919,499 (the “‘499“ ’499 Patent”), which is an Orange Book-listed patent for VIVITROL. The Company’s Preliminary Patent Owner ResponseVIVITROL, seeking cancellation of claims 1-13 of the ’499 Patent. On November 7, 2018, the PTAB issued an order instituting an IPR of all challenged claims. A hearing with the PTAB is due August 9, 2018,scheduled for July 29, 2019, and a decision on the Patent Trial and Appeal Board will decide whether to institutematter is expected from the IPRPTAB by November 9, 2018. If instituted, the7, 2019. The Company will vigorously defend the ‘499’499 Patent in the IPR proceedings. For information about risks relating to the ‘499’499 Patent IPR proceedings see “Part I, Item 1A—Risk Factors” in the Company’s Annual Report, and specificallyincluding the sections entitled “— Patent protection for our products is important and uncertain” and “— Uncertainty over intellectual property in the biopharmaceutical industry has been the source of litigation, which is inherently costly and unpredictable.unpredictable, could significantly delay or prevent approval or commercialization of our products, and could adversely affect our business.”
RISPERDAL CONSTA European Opposition Proceedings
In December 2016, Nanjing Luye Pharmaceutical Co Ltd, Pharmathen SA, Teva Pharmaceutical Industries Ltd and Dehns Ltd (a law firm representing an unidentified opponent) filed notices of opposition with the European Patent Office (the “EPO”) in respect of EP 2 269 577 B (the “EP ’577” Patent), which is a patent directed to certain risperidone microsphere compositions, including RISPERDAL CONSTA. Following a hearing on the matter in January 2019, the EPO issued a written decision revoking the EP’577 Patent in April 2019. The Company filed a notice of appeal of the decision to the EPO’s Technical Boards of Appeal on June 12, 2019 and will continue to vigorously defend the EP ’577 Patent. For information about risks relating to the EP ’577 Patent opposition proceedings see “Part I, Item 1A—Risk Factors” of the Company’s Annual Report, including the sections entitled “— Patent protection for our products is important and uncertain” and “— Uncertainty over intellectual property in the biopharmaceutical industry has been the source of litigation, which is inherently costly and unpredictable, could significantly delay or prevent approval or commercialization of our products, and could adversely affect our business.”
RISPERDAL CONSTA ANDA Litigation
On July 17, 2019, the Company, together with Janssen Pharmaceuticals, Inc., initiated a patent infringement lawsuit in the United States District Court for the District of Delaware against Luye Pharma Group Ltd., Luye Pharma (USA) Ltd., Nanking Luye Pharmaceutical Co., Ltd. and Shandong Luye Pharmaceutical Co., Ltd. (collectively, “Luye”). Luye filed a 505(b)(2) NDA seeking approval to market a competing product to RISPERDAL CONSTA before the expiration of U.S. Patent No. 6,667,061. Requested judicial remedies included, among other things, recovery of litigation costs and injunctive relief. On July 23, 2019, Luye filed its answer and affirmative defenses.
For information about risks relating to the RISPERDAL CONSTA Paragraph IV litigation, see “Part I, Item 1A—Risk Factors” of the Company’s Annual Report, including the section entitled “—We or our licensees may face claims against intellectual property rights covering our products and competition from generic drug manufacturers.”
23
ALKERMES PLC AND SUBSIDIARIES
NOTES TO CONDENSED CONSOLIDATED FINANCIAL STATEMENTS — (Unaudited) (Continued)
Government Matters
OnIn June 22, 2017 and January 2019, the Company received a subpoena and a civil investigative demand, respectively, each from an Office of the U.S. Attorney for documents related to VIVITROL. The Company is cooperating with the government.
Securities Litigation
OnIn November 22, 2017, a purported stockholder of the Company filed a putative class action against the Company and certain of its officers (collectively, the “Defendants”) in the United States District Court for the Southern District of New York captioned Gagnon v. Alkermes plc, et al., No. 1:17-cv-09178.17-cv-09178. This complaint has beenwas amended twice since its initial filing. The second amended complaint was filed on behalf of a putative class of purchasers of Alkermes securities during the period of February 24, 2015 tothrough November 14, 2017 and allegesalleged violations of Sections 10(b) and 20(a) of the Securities Exchange Act of 1934, as amended, based on allegedly false or misleading statements and omissions regarding the Company’s marketing practices related to VIVITROL. The lawsuit seeks,sought, among other things, unspecified damages for alleged inflation in the price of securities, and reasonable costs and expenses, including attorneys’ fees. OnIn June 29, 2018, Defendants filed a motion to dismiss the second amended complaint.complaint and in March 2019, the United States District Court for the Southern District of New York issued an order granting Defendants’ motion to dismiss and dismissing the case in its entirety and with prejudice. In April 2019, the plaintiff filed a motion for partial reconsideration, which was denied by the Court on July 2, 2019. Plaintiff has until August 2, 2019 to file a notice of appeal of the Court’s decision to the United States Court of Appeals for the Second Circuit. For information about risks relating to this action, see “Part I, Item 1A—Risk Factors” of the Company’s Annual Report, including the section entitled “—Litigation or arbitration against Alkermes, including securities litigation, or citizen petitions filed with the FDA, may result in financial losses, harm our reputation, divert management resources, negatively impact the approval of our products, or otherwise negatively impact our business.”
In December 2018 and specificallyJanuary 2019, purported stockholders of the Company filed putative class actions against the Company and certain of its officers in the United States District Court for the Eastern District of New York captioned Karimian v. Alkermes plc, et al., No. 1:18-cv-07410 and. McDermott v. Alkermes plc, et al., No. 1:19-cv-00624, respectively. In March 2019, the United States District Court for the Eastern District of New York consolidated the two cases and appointed a lead plaintiff. The plaintiff filed an amended complaint on July 9, 2019 naming one additional officer of the Company and one former officer of the Company as defendants. The amended complaint was filed on behalf of a putative class of purchasers of Alkermes securities during the period of July 31, 2014 through November 1, 2018 and alleges violations of Sections 10(b) and 20(a) of the Securities Exchange Act of 1934, as amended, based on allegedly false or misleading statements and omissions regarding the Company’s clinical methodologies and regulatory submission for ALKS 5461 and the FDA’s review and consideration of that submission. The lawsuit seeks, among other things, unspecified money damages, prejudgment and postjudgment interest, reasonable attorneys’ fees, expert fees and other costs. For information about risks relating to this action, see “Part I, Item 1A—Risk Factors” of the Company’s Annual Report, including the section entitled “—Litigation or arbitration against Alkermes, including securities litigation, or citizen petitions filed with the FDA, may result in financial losses, harm our reputation, divert management resources, negatively impact the approval of our products, or otherwise negatively impact our business.”
Item 2. Management's Discussion and Analysis of Financial Condition and Results of Operations
The following discussion should be read in conjunction with our condensed consolidated financial statements and related notes beginning on page 5 of this Form 10-Q, and “Management’s Discussion and Analysis of Financial Condition and Results of Operations” and the financial statements and notes thereto included in our Annual Report, which has beenwas filed with the SEC.
SEC on February 15, 2019.
Executive Summary
Net loss for the three and six months ended June 30, 20182019 was $32.6$42.0 million and $95.2$138.4 million, respectively, or $0.21$0.27 and $0.61$0.88 per ordinary share— basic and diluted, respectively, as compared to a net loss of $43.0$32.6 million and $111.9$95.2 million, respectively, or $0.28$0.21 and $0.73$0.61 per ordinary share— basic and diluted, respectively, for the three and six months ended June 30, 2017, respectively. 2018.
The decreaseincrease in the net loss in both the three and six months ended June 30, 2018,2019, as compared to the three and six months ended June 30, 2017,2018, was primarily due to the receipt of $48.3 million in license revenue related to our license and collaboration agreement with Biogen for the development of BIIB098. Duringrelating to BIIB098 in the three months ended June 30, 2018 we recognized $66.1and a reduction in the fair value of contingent consideration of $6.5 million of revenueand $29.1 million, respectively, related to this agreement, as discussedthe second CRL that Recro received regarding its NDA for IV Meloxicam in the License Revenue and Research and Development Revenue sections below.March 2019. In addition, revenue from our proprietary product sales, net increased by 24%there were increases in selling, general and 22%, respectively,administrative (“SG&A”) expenses of 12% and 16% in the three and six months ended June 30, 2018,2019, respectively, as compared to the three and six months ended June 30, 2017. The increase in revenue was partially offset by an increase in operating expenses of 16% and 13%, respectively, in the three and six months ended June 30, 2018, as compared to the three and six months ended June 30, 2017, which was primarily due to increased investment in the commercialization of VIVITROL and ARISTADA. In addition, during the three months ended June 30, 2018, we had a $19.6 million charge due to a decrease in the fair value of the contingent consideration related to IV Meloxicam as a result of Recro’s receipt of a complete response letter from the FDA regarding the NDA for IV Meloxicam.2018. These items are discussed in greater detail later in the “Results of Operations” section of this Part I, Item 2 of this Form 10-Q.
Products
Products
Marketed Products
Our portfolio of marketed products is designed to address unmet medical needs of patients in major therapeutic areas. See the description of the marketed products below, and refer to “Part I, Item 1A—Risk Factors” of our Annual Report for important factors that could adversely affect our marketed products and to the “Patents and Proprietary Rights” section in “Part I, Item 1— Business” of our Annual Report for information with respect to the IP protection for these marketed products.
Summary information regarding our proprietary products includes:
| | | | | | |
Product | | Indication(s) | | LicenseeParty Responsible for Commercialization
| | Territory |
| | | | | | |
| | Initiation or re-initiationre- initiation of ARISTADA for the treatment of Schizophrenia | | NoneAlkermes
| | Commercialized by Alkermes in the U.S.
|
| Schizophrenia | | NoneAlkermes
| | Commercialized by Alkermes in the U.S.
|
| | | | | | |
| | | | | | |
 
| | Alcohol dependence and Opioid dependence | | None
Alkermes Cilag GmbH International (“Cilag”) | | Commercialized by Alkermes in the U.S.
Russia and Commonwealth of Independent States (“CIS”) |
Summary information regarding products that use our proprietary technologies includes:
| | | | | | |
Product | | Indication(s) | | Licensee | | Territory |
| | | | | | |
RISPERDAL CONSTA | | Schizophrenia and Bipolar I disorder | | Janssen Pharmaceutica Inc. (“ (“Janssen, Inc.”) and Janssen Pharmaceutica International, a division of Cilag International AG (“Janssen International”) | | Worldwide |
| | | | | | |
Product
| | Indication(s)
| | Licensee
| | Territory
|
INVEGA SUSTENNA | | Schizophrenia and Schizoaffective disorder | | Janssen Pharmaceutica N.V. (together (together with Janssen, Inc., Janssen International and their affiliates “Janssen” “Janssen”) | | U.S. |
XEPLION | | Schizophrenia | | Janssen | | All countries outside of the U.S. (“ROW”) |
INVEGA TRINZA | | Schizophrenia | | Janssen | | U.S. |
TREVICTA | | Schizophrenia | | Janssen | | ROW |
AMPYRA
FAMPYRA
| | Treatment to improve walking in patients with MS, as demonstrated by an increase in walking speed
| | Acorda
Biogen, under sublicense from Acorda
| | U.S.
ROW
|
BYDUREON and BYDUREON BCise
| | Type 2 diabetes
| | AstraZeneca plc (“AstraZeneca”)
| | Worldwide
|
Proprietary Products
We develop and commercialize products designed to address the unmet needs of patients suffering from addiction and schizophrenia.
ARISTADA INITIO
ARISTADA INITIO (aripiprazole lauroxil), For additional information about the proprietary technologies underlying our proprietary products, refer to the “Proprietary Product Platforms” section in combination with oral aripiprazole, is indicated for the initiation“Part I, Item 1— Business” of ARISTADA when used for the treatment of schizophrenia in adults. ARISTADA INITIO leverages the company's proprietary NanoCrystal technology and is designed to provide an extended-release formulation using a smaller particle size of aripiprazole lauroxil compared to ARISTADA, thereby enabling faster dissolution and leading to more rapid achievement of relevant levels of aripiprazole. The ARISTADA INITIO regimen, consisting of a single injection of 675 mg ARISTADA INITIO in combination with a single 30 mg dose of oral aripiprazole, can be used to initiate onto any dose of ARISTADA, and provides patients with relevant levels of aripiprazole within four days of treatment initiation. The first ARISTADA dose may be administered on the same day as the ARISTADA INITIO regimen or up to 10 days thereafter.
ARISTADA INITIO was approved by the FDA in June 2018. We developed ARISTADA INITIO and exclusively manufacture and commercialize it in the U.S.
our Annual Report.
ARISTADA
ARISTADA (aripiprazole lauroxil) is an extended-release intramuscular injectable suspension approved in the U.S. for the treatment of schizophrenia. ARISTADA is the first of our products to utilize our proprietary LinkeRx technology. ARISTADA is a prodrug; once in the body, ARISTADA is likely converted by enzyme-mediated hydrolysis to N-hydroxymethyl aripiprazole, which is then hydrolyzed to aripiprazole. ARISTADA is the first atypical antipsychoticavailable in four dose strengths with once-monthly once-every-six-weeks and once-every-two-months dosing options to deliver and maintain therapeutic levels of medication in the body. ARISTADA has four dosing options (441 mg, 662 mg, 882 mgmg), a six-week dosing option (882 mg) and 1064a two-month dosing option (1064 mg) and. ARISTADA is packaged in a ready-to-use, pre-filled product format. We developed ARISTADA and exclusively manufacture and commercialize it in the U.S.
In April 2019, we announced positive topline results from ALPINE (“Aripiprazole Lauroxil and Paliperidone palmitate: INitiation Effectiveness”), a six-month study evaluating the efficacy, safety and tolerability of ARISTADA and INVEGA SUSTENNA when used to initiate patients experiencing an acute exacerbation of schizophrenia in the hospital and to maintain treatment in an outpatient setting.
ARISTADA INITIO
ARISTADA INITIO (aripiprazole lauroxil), in combination with a single 30 mg dose of oral aripiprazole, is indicated for the initiation of ARISTADA when used for the treatment of schizophrenia in adults. ARISTADA INITIO leverages our proprietary NanoCrystal technology and provides an extended-release formulation of aripiprazole lauroxil in a smaller particle size compared to ARISTADA. This smaller particle size enables faster dissolution and leads to more rapid achievement of relevant levels of aripiprazole. The ARISTADA INITIO regimen, consisting of a single injection of 675 mg ARISTADA INITIO in combination with a single 30 mg dose of oral aripiprazole, when used to initiate onto any dose of ARISTADA, provides patients with relevant levels of aripiprazole within four days of treatment initiation. The first ARISTADA dose may be administered on the same day as the ARISTADA INITIO regimen or up to 10 days thereafter. We developed ARISTADA INITIO and exclusively manufacture and commercialize it in the U.S.
VIVITROL
VIVITROL (naltrexone for extended-release injectable suspension) is a once-monthly, non-narcotic, injectable medication approved in the U.S., Russia and certain countries of the CIS for the treatment of alcohol dependence and for the prevention of relapse to opioid dependence, following opioid detoxification. VIVITROL uses our polymer-based microsphere injectable extended-release technology to deliver and maintain therapeutic medication levels in the body through one intramuscular injection every four weeks. We developed and exclusively manufacture VIVITROL. We commercialize VIVITROL in the U.S., and Cilag commercializes VIVITROL in Russia and certain countries of the CIS.
For a discussion of legal proceedings related to the patents covering VIVITROL, see Note 14, Commitments and Contingent Liabilities in the “Notes to Condensed Consolidated Financial Statements” in this Form 10-Q, and for information about risks relating to such legal proceedings, see “Part I, Item 1A—Risk Factors” in our Annual Report, including the sections entitled “— Patent protection for our products is important and uncertain,” “— Uncertainty over intellectual property in the biopharmaceutical industry has been the source of litigation, which is inherently costly and unpredictable, could significantly delay or prevent approval or commercialization of our products, and could adversely affect our business” and “— Litigation, arbitration or regulatory action (such as citizens petitions) filed against regulatory agencies related to our product or Alkermes, including securities litigation, may result in financial losses, harm our reputation, divert management resources, negatively impact the approval of our products, or otherwise negatively impact our business.”
Products Using Our Proprietary Technologies
We have granted licenses under our proprietary technologies to enable third parties to develop, commercialize and, in some cases, manufacture products for which we receive royalties and/or manufacturing revenues. Such arrangements include the following:
INVEGA SUSTENNA/XEPLION, INVEGA TRINZA/TREVICTA and RISPERDAL CONSTA
INVEGA SUSTENNA/XEPLION (paliperidone palmitate), INVEGA TRINZA (paliperidone palmitate)/TRINZA/TREVICTA (paliperidone palmitate 3-monthly3-month injection) and RISPERDAL CONSTA (risperidone long-acting injection) are long-acting atypical antipsychotics owned and commercialized worldwide by Janssen that incorporate our proprietary technologies. For additional information about our proprietary technologies, refer to the “Proprietary Product Platforms” section in “Part I, Item 1— Business” of our Annual Report.
In May 2018, U.S. Patent Nos. 9,974,746 and 9,974,747 were granted. U.S. Patent No. 9,974,746 has claims to an injectable nanoparticulate active agent composition produced by a method for reducing flake-like aggregates. U.S. Patent No. 9,974,747 has claims to a method of reducing flake-like aggregates in an injectable nanoparticulate active agent composition. These patents, which we believe are subject to our license agreement with Janssen, expire in 2030.
INVEGA SUSTENNA is approved in the U.S. for the treatment of schizophrenia and for the treatment of schizoaffective disorder as either a monotherapy or adjunctive therapy. Paliperidone palmitate extended-release injectable suspension is approved in the European Union (“EU”) and other countries outside of the U.S. for the treatment of schizophrenia and is marketed and sold under the trade name XEPLION. INVEGA SUSTENNA/XEPLION uses our nanoparticle injectable extended-release technology to increase the rate of dissolution and enable the formulation of an aqueous suspension for once-monthly intramuscular administration. INVEGA SUSTENNA/XEPLION is manufactured by Janssen.
In January 2018, Janssen Pharmaceuticals NV and Janssen Pharmaceuticals, Inc. initiated For a patent infringement lawsuit in the U.S. District Court for the District of New Jersey against Teva, who filed an ANDA seeking approval to market a generic version of INVEGA SUSTENNA before the expiration of U.S. Patent No. 9,439,906. We are not a party to these proceedings. For further discussion of the legal proceedings related to the patents covering INVEGA SUSTENNA, see Note 14, Commitments and ContingenciesContingent Liabilities in the “Notes to Condensed Consolidated Financial Statements” in this Form 10-Q and for information about risks relating to the INVEGA SUSTENNA Paragraph IV litigation,such legal proceedings, see “Part I, Item 1A—Risk Factors” ofin our Annual Report, and specificallyincluding the section entitled “—We or our licensees may face claims against IPintellectual property rights covering our products and competition from generic drug manufacturers.”
INVEGA TRINZA is an atypical antipsychotic injectionapproved in the U.S. for the treatment of schizophrenia used in peoplepatients who have been adequately treated with INVEGA SUSTENNA for at least four months. INVEGA TRINZA is the first schizophrenia treatment to be taken once every three months. TREVICTA is approved in the EU for the maintenance treatment of schizophrenia in adult patients who are clinically stable on XEPLION. INVEGA TRINZA/TREVICTA is the first schizophrenia treatment to be taken once every three months. INVEGA TRINZA/TREVICTA uses our proprietary technology and is manufactured by Janssen.
RISPERDAL CONSTA is approved in the U.S. for the treatment of schizophrenia and as both monotherapy and adjunctive therapy to lithium or valproate in the maintenance treatment of bipolar I disorder. RISPERDAL CONSTA is approved in numerous countries outside of the U.S. for the treatment of schizophrenia and the maintenance treatment of bipolar I disorder. RISPERDAL CONSTA uses our polymer-based microsphere injectable extended-release technology to deliver and maintain therapeutic medication levels in the body through just one intramuscular injection every two weeks. RISPERDAL CONSTA microspheres are exclusively manufactured by us.
AMPYRA/FAMPYRA
AMPYRA (dalfampridine)/FAMPYRA (fampridine) is believed to be the first treatment approved in the U.S. and in over 50 countries across Europe, Asia and the Americas to improve walking in adults with MS who have walking disability, as demonstrated by an increase in walking speed. Extended-release dalfampridine tablets are marketed and sold by Acorda in the U.S. under the trade name AMPYRA and by Biogen outside the U.S. under the trade name FAMPYRA. In July 2011, the European Medicines Agency (“EMA”) conditionally approved FAMPYRA in the EU and, in May 2017, the EMA granted FAMPYRA For a standard marketing authorization in the EU for the improvement of walking in adults with MS. AMPYRA and FAMPYRA incorporate our oral controlled-release technology. AMPYRA and FAMPYRA are manufactured by us.
We and/or Acorda have received notices of ANDA filings for AMPYRA asserting that a generic form of AMPYRA would not infringe AMPYRA’s Orange Book-listed patents and/or those patents are invalid. In response, we and/or Acorda filed lawsuits against certain of the ANDA filers in the Delaware Court asserting infringement of the ‘938 Patent, which we own, and U.S. Patent Nos. 8,007,826; 8,354,437; 8,440,703; and 8,663,685, which are owned by Acorda. In May 2017, Acorda filed its appeal of the Delaware Court Decision with the Federal Circuit with respect to the findings on U.S. Patent Nos. 8,007,826; 8,354,437; 8,440,703; and 8,663,685. In June 2017, certain of the ANDA filers filed a cross-appeal of the Delaware Court Decision with the Federal Circuit with respect to the validity of the ‘938 Patent. We and Acorda filed an opening brief in August 2017 and the ANDA filers responded in October 2017. Each side
subsequently filed a response and reply brief in November 2017. The Federal Circuit heard oral argument on June 7, 2018. If the Federal Circuit upholds the Delaware Court Decision or, in certain circumstances, remands or vacates the decision to the Delaware Court, we can expect competition from generic forms of AMPYRA as early as July 31, 2018, following expiration of the ‘938 Patent. For further discussion of the legal proceedings related to certain of the patents covering AMPYRA,RISPERDAL CONSTA, see Note 14, Commitments and ContingenciesContingent Liabilities in the “Notes to Condensed Consolidated Financial Statements” in this Form 10-Q and for information about risks relating to such legal proceedings, see “Part I, Item 1A—Risk Factors” ofin our Annual Report.Report, including the section entitled “—We or our licensees may face claims against intellectual property rights covering our products and competition from generic drug manufacturers.”
The legal proceedings in the Delaware Court related to the patents covering AMPYRA do not involve the patents covering FAMPYRA, and the latest of the patents covering FAMPYRA expires in April 2025 in the EU.
BYDUREON and BYDUREON BCise
BYDUREON (exenatide extended-release for injectable suspension) is approved in the U.S. and the EU for the treatment of type 2 diabetes. AstraZeneca is responsible for the development and commercialization of BYDUREON worldwide. BYDUREON, a once-weekly formulation of exenatide, uses our polymer-based microsphere injectable extended-release technology. BYDUREON is manufactured by AstraZeneca. BYDUREON Pen 2 mg, a pre-filled, single-use pen injector that contains the same formulation and dose as the original BYDUREON single-dose tray, is available in the U.S., certain countries in the EU and Japan. BYDUREON was also approved by the FDA in April 2018 as an add-on to basal insulin in adults with type 2 diabetes who have inadequate glycemic control.
BYDUREON BCise, a new formulation of BYDUREON in an improved once-weekly, single-dose autoinjector device for adults with type 2 diabetes was approved by the FDA in October 2017 and is available in the U.S. A regulatory application for the new autoinjector device has also been accepted by the EMA.
Key Development Programs
Our R&D is focused on leveraging our formulation expertise and proprietary product platforms to developdeveloping novel, competitively advantaged medications designed to enhance patient outcomes in major CNS disorders, such as schizophrenia, addiction, depression and MS.MS, and in oncology. As part of our ongoing R&D efforts, we have devoted, and will continue to devote, significant resources to conducting pre-clinical work and clinical studies to advanceadvancing the development of new pharmaceutical products. The discussion below highlights our current key R&D programs. Drug development involves a high degree of risk and investment, and the status, timing and scope of our development programs are subject to change. Important factors that could adversely affect our drug development efforts are discussed under the heading “Cautionary Note Concerning Forward-Looking Statements” in this Form 10-Q and in “Part I, Item 1A—Risk Factors” of our Annual Report. Refer to the “Patents and Proprietary Rights” section in “Part I, Item 1— Business” of our Annual Report for information with respect to the IP protection for our key development products.candidates.
The following graphic summarizes the status of our key development programs:
| |
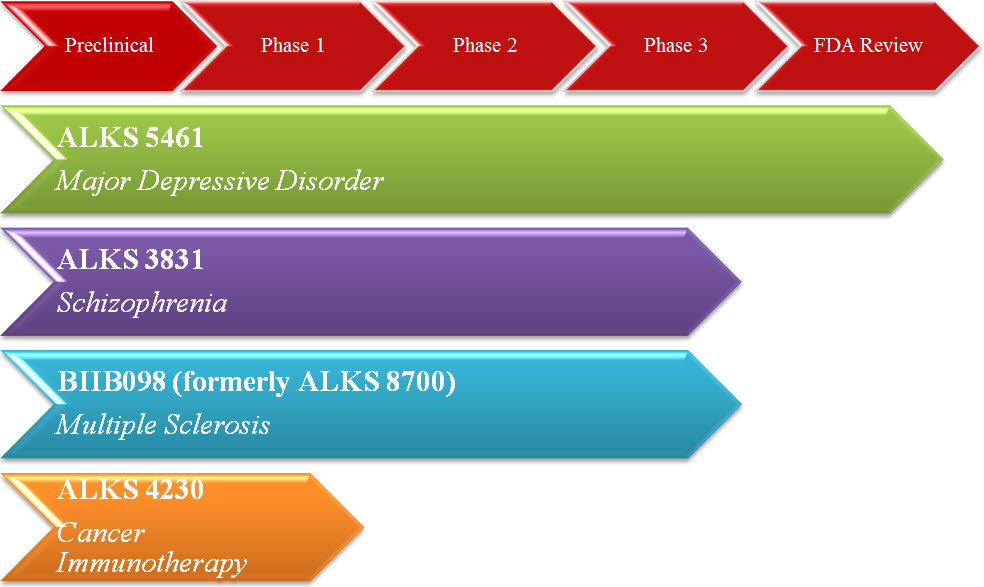
| Preclinical Phase 1 Phase 2 Phase 3 FDA Review
ALKS 5461 Major Depressive Disorder
ALKS 3831 Schizophrenia
BIIB 098 (formerly ALKS 8700) Multiple Sclerosis
ALKS 4230 Cancer immunotherapy
|
ALKS 5461Diroximel fumarate (BIIB098)
ALKS 5461 is a proprietary, investigational, once-daily, oral medicine that acts as an opioid system modulator and represents a novel mechanism of action for the adjunctive treatment of Major Depressive DisorderDiroximel fumarate (“MDD”BIIB098”). ALKS 5461 is a fixed-dose combination of buprenorphine, a partial mu-opioid receptor agonist and kappa-opioid receptor antagonist, and samidorphan, a mu-opioid receptor antagonist. Our NDA for ALKS 5461 was submitted to the FDA in January 2018 and accepted by the FDA for review in April 2018. Acceptance of the NDA for review followed FDA issuance, and then rescission, of a refusal to file letter citing insufficient evidence of effectiveness and the need for additional bridging data, both of which we expect will be addressed in the context of the FDA’s review. The NDA is based on a clinical efficacy and safety package with data from more than 30 clinical trials and more than 1,500 patients with MDD. The FDA has tentatively scheduled an advisory committee meeting for the ALKS 5461 NDA on November 1, 2018 and has issued a target action date for the ALKS 5461 NDA of January 31, 2019 under the Prescription Drug User Fee Act.
In June 2018, U.S. Patent No. 10,005,790 relating to ALKS 5461 was granted. This patent has claims to a compound which is an intermediate in a process for synthesizing samidorphan, and expires in 2031.
ALKS 3831
ALKS 3831 is an investigational, novel, once-daily, oral atypical antipsychotic drug candidate for the treatment of schizophrenia. ALKS 3831 is composed of samidorphan in combination with the established antipsychotic drug olanzapine, which is generally available under the name ZYPREXA. ALKS 3831 is designed to provide the strong antipsychotic efficacy of olanzapine and a differentiated safety profile with favorable weight and metabolic properties.
The ENLIGHTEN clinical development program for ALKS 3831 includes two key studies: ENLIGHTEN-1, a study evaluating the antipsychotic efficacy of ALKS 3831 compared to placebo over four weeks and ENLIGHTEN-2, a study assessing weight gain with ALKS 3831 compared to olanzapine in patients with schizophrenia over six months. The program also includes supportive studies to evaluate the pharmacokinetic and metabolic profile of ALKS 3831 and long-
term safety.
Results from ENLIGHTEN-2 are expected in the fourth quarter of 2018.
Topline results from the completed exploratory phase 1 metabolic study of ALKS 3831, assessing the effects of ALKS 3831 on important metabolic parameters compared to olanzapine, were announced in the second quarter of 2018.
We expect to use safety and efficacy data from the ENLIGHTEN clinical development program, if successful, to serve as the basis for an NDA, which we plan to submit to the FDA in mid-2019.
In April 2018 and June 2018, respectively, U.S. Patent Nos. 9,943,514 and 10,005,790 relating to ALKS 3831 were granted. U.S. Patent No. 9,943,514 has claims to a method of suppressing food intake by administering a genus of compounds which includes samidorphan. U.S. Patent No. 10,005,790 has claims to a compound which is an intermediate in a process for synthesizing samidorphan. Both patents expire in 2031.
BIIB098 (formerly ALKS 8700)
BIIB098 (diroximel fumarate), formerly referred to as ALKS 8700, is ana novel, oral novel fumarate candidate in development for the treatment of relapsing forms of MS. BIIB098 is designed to rapidly and efficiently convert to monomethyl fumarate in the body and may have the potential to potentially offer differentiated featuresgastrointestinal tolerability due to its chemical structure as compared to the currently marketed dimethyl fumarate, TECFIDERA.
We expect to complete the required non-clinical studies
The pivotal clinical program for BIIB098 consists of pharmacokinetic bridging studies comparing BIIB098 and TECFIDERA and a two-year, multicenter, open-label study designed to assess the safety of BIIB098, which we initiated in 2018 and fileDecember 2015. We submitted a 505(b)(2) NDA for BIIB098 in December 2018, which was accepted for review by the FDA in February 2019. The NDA was assigned a Prescription Drug User Fee Act (“PDUFA”) target action date in the fourth quarter of 2018.2019. For more information about 505(b)(2) NDAs, see “Part 1, Item 1—Business, Regulatory, Hatch-Waxman Act” of our Annual Report. In addition, we expect topline results in mid-2019 for EVOLVE-MS-2, an elective, randomized, head-to-head phase 3 study of the gastrointestinal tolerability of BIIB098 versus TECFIDERA.
In November 2017, we entered into an exclusive license and collaboration agreement with Biogen relating to BIIB098. For more information about the license and collaboration agreement with Biogen, see “Part 1, Item 1—Business, Collaborative Arrangements” of our Annual Report. If approved, Biogen intends to market BIIB098 under the brand name VUMERITY, which has been conditionally accepted by the FDA and will be confirmed upon approval.
ALKS 3831
ALKS 3831 is an investigational, novel, once-daily, oral atypical antipsychotic drug candidate for the treatment of adults with schizophrenia and for the treatment of adults with bipolar I disorder. ALKS 3831 is composed of samidorphan, a novel, new molecular entity, co-formulated with the established antipsychotic agent, olanzapine, in a single bilayer tablet.
ALKS 3831 is designed to provide the robust antipsychotic efficacy of olanzapine while mitigating olanzapine-associated weight gain. The ENLIGHTEN clinical development program for ALKS 3831 includes two key phase 3 studies in patients with schizophrenia: ENLIGHTEN-1, a four-week study evaluating the antipsychotic efficacy of ALKS 3831 compared to placebo, and ENLIGHTEN-2, a six-month study assessing weight gain with ALKS 3831 compared to olanzapine. The program also includes supportive studies to evaluate the pharmacokinetic and metabolic profile and long-term safety of ALKS 3831.
In April 2019, we presented positive data from the ENLIGHTEN-2 study and interim results from an ongoing ENLIGHTEN-2 52-week open-label, safety extension study.
In May 2019, we conducted a pre-NDA meeting with the FDA to discuss the FDA’s key requirements for our planned NDA for ALKS 3831, including those related to efficacy, safety, weight and metabolic profile, and the expansion of the planned NDA for ALKS 3831 to encompass the treatment of bipolar I disorder in addition to the treatment of schizophrenia. We anticipate submitting a single NDA for the two indications in the fourth quarter of 2019, which will include data from the ENLIGHTEN clinical development program in patients with schizophrenia, as well as pharmacokinetic bridging data comparing ALKS 3831 and ZYPREXA® (olanzapine).
In May 2019, U.S. Patent No. 10,300,054 relating to ALKS 3831 was granted. This patent has claims that cover compositions of olanzapine and samidorphan and expires in 2031.
ALKS 4230
ALKS 4230 is ana novel, engineered fusion protein designed to preferentially bind and signal through the intermediate affinity interleukin-2 (“IL-2”) receptor complex, thereby selectively activating and increasing the number of immunostimulatoryexpand tumor-killing immune cells while avoiding the expansionactivation of immunosuppressive cells that interfere with anti-tumor response.by preferentially binding to the intermediate-affinity interleukin-2 (“IL-2”) receptor complex. The selectivity of ALKS 4230 is designed to leverage the proven anti-tumor effects while overcoming limitations of existing IL-2 therapy which activates both immunosuppressive and tumor-killing immune cells. Our phase 1 study forwhile mitigating certain limitations.
ARTISTRY is a Company-sponsored clinical program evaluating ALKS 4230 is designed to evaluatein patients with advanced solid tumors. ARTISTRY-1, an ongoing phase 1/2 study of ALKS 4230 administered via intravenous infusion as a monotherapy agent and in combination with the anti-PD-1 therapy, pembrolizumab. A dose-escalation stagepembrolizumab, is designed to determine aevaluate the safety profile and anti-tumor activity of ALKS 4230 in patients with select advanced solid tumors. ARTISTRY-2, an ongoing phase 1/2 study of ALKS 4230 administered subcutaneously as monotherapy and in combination with pembrolizumab in patients with advanced solid tumors, is designed to explore the safety, tolerability and efficacy of ALKS 4230 administered subcutaneously and assess once-weekly and once-every-three-week dosing schedules. ARTISTRY-2, which the Company initiated in February 2019, will be conducted in two stages: dose-escalation followed by dose-expansion.
In June 2019, we announced the initiation of the monotherapy expansion stage of ARTISTRY-1, following the identification of 6 µg/kg/day administered intravenously as the recommended monotherapy phase 2 dose of ALKS 4230 to evaluate in patients with renal cell carcinoma or melanoma. The dose escalation stage of ARTISTRY-1 is still ongoing, as the maximum tolerated dose of ALKS 4230 in a monotherapy setting and to identify the optimal dose range of ALKS 4230 based on measures of immunological-pharmacodynamic effects is ongoing, with initial results expected in 2018. Upon completion of the dose-escalation stage, we expect to initiate a dose-expansionhas not yet been reached. The combination therapy stage of ALKS 4230 in patients with selected solid tumor types. In the third quarter of 2018, we plan to expand the phase 1 study to include evaluation ofARTISTRY-1 is also ongoing, assessing ALKS 4230 in combination with pembrolizumab in patients with select advanced solid tumors.
ALKS 5461 Update
ALKS 5461 is a proprietary, once-daily, oral investigational medicine with a novel mechanism of action for the anti-PD-1 therapy, pembrolizumab.adjunctive treatment of major depressive disorder (“MDD”) in patients with an inadequate response to standard antidepressant therapies. ALKS 5461 is a fixed-dose combination of buprenorphine, a partial mu-opioid receptor agonist and kappa-opioid receptor antagonist, and samidorphan, a mu-opioid receptor antagonist.
The clinical development program for ALKS 5461 included three core phase 3 efficacy studies (FORWARD-3, FORWARD-4 and FORWARD-5), one core phase 2 efficacy study (Study 202), and additional supportive studies to evaluate the long-term safety, dosing, pharmacokinetic profile and human abuse potential of ALKS 5461. Our NDA for ALKS 5461 was submitted to the FDA in January 2018, and in February 2019, we announced receipt of a CRL from the FDA for the ALKS 5461 NDA. The CRL states that the FDA is unable to approve the ALKS 5461 NDA in its present form and requests additional clinical data to provide substantial evidence of effectiveness of ALKS 5461 for the adjunctive treatment of MDD.
Results of Operations
Manufacturing and Royalty Revenues
Manufacturing revenuesfor products that incorporate our technologies, with the exception of those from Janssen related to RISPERDAL CONSTA, are recognized over time as products move through the manufacturing process, using a standard cost-based model as a measure of progress. Manufacturing revenue from RISPERDAL CONSTA is recognized at the point in time the product has been fully manufactured. Royalties are generally earned on our licensees’ net sales of products that incorporate our technologies and are recognized in the period the products are sold by our licensees. The following table compares manufacturing and royalty revenues earned in the three and six months ended June 30, 20182019 and 2017:
2018:
| | | | | | | | | | | | | | | | | | | |
| | Three Months Ended | | Change | | Six Months Ended | | Change | Three Months Ended | | | Change | | | Six Months Ended | | | Change | |
| | June 30, | | Favorable/ | | June 30, | | Favorable/ | June 30, | | | Favorable/ | | | June 30, | | | Favorable/ | |
(In millions) | | 2018 | | 2017 | | (Unfavorable) | | 2018 | | 2017 | | (Unfavorable) | 2019 | | | 2018 | | | (Unfavorable) | | | 2019 | | | 2018 | | | (Unfavorable) | |
Manufacturing and royalty revenues: | | | | | | | | | | | | | | | | | | | | | | | | | | | | | | | | | | | | | | | | | |
INVEGA SUSTENNA/XEPLION & INVEGA TRINZA/TREVICTA | | $ | 63.3 | | $ | 56.6 | | $ | 6.7 | | $ | 109.3 | | $ | 95.8 | | $ | 13.5 | $ | 67.3 | | | $ | 63.3 | | | $ | 4.0 | | | $ | 120.6 | | | $ | 109.3 | | | $ | 11.3 | |
RISPERDAL CONSTA | | | 24.6 | | | | 21.9 | | | | 2.7 | | | | 46.9 | | | | 44.6 | | | | 2.3 | |
AMPYRA/FAMPYRA | | | 19.7 | | | 25.3 | | | (5.6) | | | 47.9 | | | 54.5 | | | (6.6) | | 9.8 | | | | 19.7 | | | | (9.9 | ) | | | 22.0 | | | | 47.9 | | | | (25.9 | ) |
RISPERDAL CONSTA | | | 21.9 | | | 25.5 | | | (3.6) | | | 44.6 | | | 46.3 | | | (1.7) | |
BYDUREON | | | 13.5 | | | 11.6 | | | 1.9 | | | 23.3 | | | 23.9 | | | (0.6) | |
Other | | | 9.8 | | | 10.3 | | | (0.5) | | | 17.7 | | | 23.4 | | | (5.7) | | 26.2 | | | | 23.3 | | | | 2.9 | | | | 47.3 | | | | 41.0 | | | | 6.3 | |
Manufacturing and royalty revenues | | $ | 128.2 | | $ | 129.3 | | $ | (1.1) | | $ | 242.8 | | $ | 243.9 | | $ | (1.1) | $ | 127.9 | | | $ | 128.2 | | | $ | (0.3 | ) | | $ | 236.8 | | | $ | 242.8 | | | $ | (6.0 | ) |
The increase in INVEGA SUSTENNA/XEPLION and INVEGA TRINZA/TREVICTA royalty revenues in the three and six months ended June 30, 2018,2019, as compared to the three and six months ended June 30, 2017,2018, was primarily due to an increase in Janssen’s end-market sales of INVEGA SUSTENNA/XEPLION and INVEGA TRINZA/TREVICTA. During the three and six months ended June 30, 2018,2019, Janssen’s end-market sales of INVEGA SUSTENNA/XEPLION and INVEGA TRINZA/TREVICTA were $720.0$818.0 million and $1,416.0$1,608.0 million, respectively, as compared to $629.0$720.0 million and $1,233.0$1,416.0 million, respectively, during the three and six months ended June 30, 2017.2018, respectively. Under our agreement with Janssen, we earn tiered royalty revenuespayments on end-market net sales of INVEGA SUSTENNA/XEPLION and INVEGA TRINZA/TREVICTA, of: 5%which consist of a patent royalty and a know-how royalty, both of which are determined on a country-by-country basis. The patent royalty, which equals 1.5% of net sales, is payable in each country until the expiration of the last of the patents with valid claims applicable to the product in such country. The know-how royalty is a tiered royalty of 3.5% on calendar year net sales up to $250 million; 7%5.5% on calendar year net sales of between $250 million and $500 million; and 9%7.5% on calendar year net sales exceeding $500 million. The know-how royalty rate resets to 5%3.5% at the beginning of each calendar year. year and is payable until the later of 15 years from the first commercial sale of a product in each individual country or expiry of the license agreement.
The adoption of Topic 606 had no impact onincrease in revenues from RISPERDAL CONSTA in the methodthree and six months ended June 30, 2019, as compared to the three and six months ended June 30, 2018, was due to a 19% and 10% increase in which we recognizemanufacturing revenue, respectively, partially offset by a 13% and 12% decrease in RISPERDAL CONSTA royalty revenue, fromrespectively. The increase in manufacturing revenue in both periods was primarily due to an 18% and 8% increase in the amount of RISPERDAL CONSTA shipped to Janssen, respectively. The decrease in royalty revenue was due to a decrease in end-market sales of INVEGA SUSTENNA/XEPLIONRISPERDAL CONSTA, which were $182.0 million and INVEGA TRINZA/TREVICTA.
With$361.0 million in the adoptionthree and six months ended June 30, 2019, respectively, as compared to $188.0 million and $384.0 million in the three and six months ended June 30, 2018. We recognize manufacturing revenue, equal to 7.5% of Topic 606, we changedJanssen’s unit net sales price of RISPERDAL CONSTA, at the way we record certain of our manufacturing and royalty revenue for AMPYRA and FAMPYRA. For AMPYRApoint in time when RISPERDAL CONSTA has been fully manufactured, under our license and supply agreements with Acorda, we now record manufacturing and royalty revenue aswhich is when the product is being manufactured, rather than when it is shipped to Acorda. For FAMPYRA, we record manufacturing revenue as the product is being manufactured, rather than when it is shipped, but continue toapproved for shipment. We record royalty revenue, equal to 2.5% of end-market net sales, when the end-market sale of FAMPYRARISPERDAL CONSTA occurs. See Note 3, Revenue from Contracts with Customers, in the “Notes to Condensed Consolidated Financial Statements” in this Form 10-Q, for additional information regarding the adoption of Topic 606.
The decrease in the amount of manufacturing and royalty revenue recognized for AMPYRA and FAMPYRA in both the three and six months ended June 30, 2018,2019, as compared to the three and six months ended June 30, 2017,2018, was primarily due to a 30% and 17% decrease in the amount of revenue earned on AMPYRA, respectively, due to a decrease in demand due to the anticipated entry of generic forms of AMPYRA. On March 31, 2017, the Delaware Court upheld the ��938 Patent, which pertainsAMPYRA to the formulation ofU.S. market in September 2018. AMPYRA revenues decreased by 93% and is set to expire in July 2018, and invalidated U.S. Patent Nos. 8,007,826; 8,354,437; 8,440,703; and 8,663,685, which pertain to AMPYRA. Acorda filed an appeal with the Federal Circuit with respect to the Delaware Court’s findings on U.S. Patent Nos. 8,007,826; 8,354,437; 8,440,703; and 8,663,685. If the Federal Circuit upholds the Delaware Court’s findings with respect to U.S. Patent Nos. 8,007,826; 8,354,437; 8,440,703; and 8,663,685, or, in certain circumstances, remands or vacates the decision to the Delaware Court we can expect competition from generic forms of AMPYRA as early as July 31, 2018, following expiration of the ‘938 Patent. We can expect that competition from generic forms of AMPYRA will impact our manufacturing and royalty revenues and we expect our manufacturing and royalty revenues to continue to decline in advance of generic entry in anticipation of reduced demand for AMPYRA.
For further discussion of the legal proceedings related to the patents covering AMPYRA, see “Part II, Item 1—Legal Proceedings” and Note 14, Commitments and Contingencies in the “Notes to Condensed Consolidated Financial Statements” in this Form 10-Q, and for information about risks relating to such legal proceedings see “Part I, Item 1A—Risk Factors” of our Annual Report. The legal proceedings related to the patents covering AMPYRA do not involve the patents covering FAMPYRA, and the latest of the patents covering FAMPYRA expires in April 2025 in the EU.
Under Topic 606, we continue to recognize manufacturing revenue for RISPERDAL CONSTA at a point in time, however, we now recognize manufacturing revenue when RISPERDAL CONSTA has been fully manufactured, which is when the product is approved for sale, rather than when it is shipped. We continue to record royalty revenue when the
end-market sale of RISPERDAL CONSTA occurs. The decrease in the amount of revenues from RISPERDAL CONSTA earned in the three months ended June 30, 2018, as compared to the three months ended June 30, 2017 was primarily due to a 15% decrease in RISPERDAL CONSTA manufacturing revenue, which was primarily due to a 28% decrease in the amount of RISPERDAL CONSTA manufactured for resale in the U.S.85%, partially offset by a 9% increase in the amount of RISPERDAL CONSTA manufactured for resale in the rest of the world. The decrease in the amount of revenues from RISPERDAL CONSTA earned in the six months ended June 30, 2018, as compared to the six months ended June 30, 2017 was primarily due to a 7% decrease in RISPERDAL CONSTA royalty revenue. End-market sales of RISPERDAL CONSTA were $188.0 million and $384.0 millionrespectively, in the three and six months ended June 30, 2018, respectively, as compared to $207.0 million and $414.0 million in the three and six months ended June 30, 2017, respectively.
The change in BYDUREON royalty revenues in the three and six months ended June 30, 2018,2019, as compared to the three and six months ended June 30, 2017,2018. This was duepartially offset by a 45% and 38% increase in FAMPYRA revenues in the three and six months ended June 30, 2019, as compared to the amount of end-market sales of BYDUREON by AstraZeneca. During the three and six months ended June 30, 2018, AstraZeneca’s end-market sales of BYDUREON were approximately $153.8 million and $293.1 million, respectively, as comparedwhich was primarily due to $146.0 million and $298.8 millionan increase in the threeamount of FAMPYRA manufactured during the periods. We do not anticipate manufacturing any AMPYRA for Acorda during the remainder of 2019. We recognize manufacturing revenues for AMPYRA and six months ended June 30, 2017, respectively. The adoption of Topic 606 had no impact in the method in which we recognizeFAMPYRA and royalty revenue from salesAMPYRA over time as the products move through the manufacturing process, using an input method based on costs as a measure of BYDUREON.progress. Royalty revenue from FAMPYRA is recognized in the period FAMPYRA is sold by Biogen.
Product Sales, net
Our product sales, net, consist of sales of VIVITROL, ARISTADA and ARISTADA INITIO in the U.S., primarily to wholesalers, specialty distributors and pharmacies. The following table presents the adjustments deducted from product sales, gross to arrive at product sales, net, during the three and six months ended June 30, 20182019 and 2017:2018:
| | | | | | | | | | | | | | | | | | | | | | Three Months Ended | | | | Six Months Ended | | |
| | Three Months Ended | | Six Months Ended | | June 30, | | | | June 30, | | |
| | June 30, | | June 30, | | |
(In millions) | | 2018 | | % of Sales | | 2017 | | % of Sales | | | 2018 | | % of Sales | | 2017 | | % of Sales | | |
(In millions, except for % of Sales) | | 2019 | | | % of Sales | | | | 2018 | | | % of Sales | | | | 2019 | | | % of Sales | | | | 2018 | | | % of Sales | | |
Product sales, gross | | $ | 209.0 | | 100.0 | % | | $ | 167.9 | | 100.0 | % | | $ | 386.6 | | 100.0 | % | $ | 300.5 | | 100.0 | % | $ | 261.1 | | | | 100.0 | | % | | $ | 209.0 | | | | 100.0 | | % | | $ | 457.2 | | | | 100.0 | | % | | $ | 386.6 | | | | 100.0 | | % |
Adjustments to product sales, gross: | | | | | | | | | | | | | | | | | | | | | | | | | | | | | | | | | | | | | | | | | | | | | | | | | | | | | | | | |
Medicaid rebates | | | (54.2) | | (25.9) | % | | | (42.5) | | (25.3) | % | | | (95.8) | | (24.8) | % | | (70.1) | | (23.3) | % | | (59.5 | ) | | | (22.8 | ) | % | | | (54.2 | ) | | | (25.9 | ) | % | | | (106.2 | ) | | | (23.3 | ) | % | | | (95.8 | ) | | | (24.8 | ) | % |
Chargebacks | | | (15.7) | | (7.5) | % | | | (12.2) | | (7.3) | % | | | (30.4) | | (7.9) | % | | (21.9) | | (7.3) | % | | (20.4 | ) | | | (7.8 | ) | % | | | (15.7 | ) | | | (7.5 | ) | % | | | (37.2 | ) | | | (8.1 | ) | % | | | (30.4 | ) | | | (7.9 | ) | % |
Product discounts | | | (15.3) | | (7.3) | % | | | (12.9) | | (7.7) | % | | | (29.4) | | (7.6) | % | | (23.1) | | (7.7) | % | | (20.5 | ) | | | (7.9 | ) | % | | | (15.3 | ) | | | (7.3 | ) | % | | | (35.6 | ) | | | (7.8 | ) | % | | | (29.4 | ) | | | (7.6 | ) | % |
Medicare Part D | | | (6.8) | | (3.3) | % | | | (3.5) | | (2.1) | % | | | (12.2) | | (3.2) | % | | (5.8) | | (1.9) | % | | (11.1 | ) | | | (4.3 | ) | % | | | (6.8 | ) | | | (3.3 | ) | % | | | (18.5 | ) | | | (4.0 | ) | % | | | (12.2 | ) | | | (3.2 | ) | % |
Other | | | (7.2) | | (3.5) | % | | | (8.0) | | (4.8) | % | | | (17.2) | | (4.4) | % | | (14.4) | | (4.8) | % | | (13.0 | ) | | | (4.9 | ) | % | | | (7.2 | ) | | | (3.5 | ) | % | | | (23.6 | ) | | | (5.2 | ) | % | | | (17.2 | ) | | | (4.4 | ) | % |
Total adjustments | | | (99.2) | | (47.5) | % | | | (79.1) | | (47.2) | % | | | (185.0) | | (47.9) | % | | (135.3) | | (45.0) | % | | (124.5 | ) | | | (47.7 | ) | % | | | (99.2 | ) | | | (47.5 | ) | % | | | (221.1 | ) | | | (48.4 | ) | % | | | (185.0 | ) | | | (47.9 | ) | % |
Product sales, net | | $ | 109.8 | | 52.5 | % | | $ | 88.8 | | 52.8 | % | | $ | 201.6 | | 52.1 | % | $ | 165.2 | | 55.0 | % | $ | 136.6 | | | | 52.3 | | % | | $ | 109.8 | | | | 52.5 | | % | | $ | 236.1 | | | | 51.6 | | % | | $ | 201.6 | | | | 52.1 | | % |
Our productProduct sales, net, for VIVITROL and ARISTADA in the three and six months ended June 30, 20182019 were $76.2$88.2 million and $33.6$157.4 million, respectively, as compared to $66.1$76.2 million and $22.7 million in the three months ended June 30, 2017, respectively. Our product sales, net for VIVITROL and ARISTADA in the six months ended June 30, 2018 were $138.9 million and $62.8 million, respectively, as compared to $124.5 million and $40.7 million in the six months ended June 30, 2017, respectively.
The increase in product sales, gross, in the three and six months ended June 30, 2018, respectively. Product sales, net for ARISTADA/ARISTADA INITIO in the three and six months ended June 30, 2019 were $48.4 million and $78.7 million, respectively, as compared to $33.6 million and $62.8 million in the corresponding prior periods,three and six months ended June 30, 2018, respectively.
The increase in product sales, gross was primarily due to increased unit sales of both VIVITROL and ARISTADA. VIVITROL product sales, gross, increased by 16%12% and 18%10%, in the three and six months ended June 30, 2018,2019, respectively, as compared to the three and six months ended June 30, 2017, respectively,2018, which was due to an increase in the number of VIVITROL units sold. We did not have a price increase for VIVITROL in 2018 or to date in 2019. ARISTADA and ARISTADA INITIO collective product sales, gross, increased by 54%57% and 66%38%, in the three and six months ended June 30, 2018,2019, respectively, as compared to the three and six months ended June 30, 2017, respectively,2018, which was primarily due to ana 40% and 23% increase in the number of ARISTADA and ARISTADA INITIO collective units sold, of 43% and 51%, respectively, and a 3%4% and a 6% price increase that went into effect in January 2018.July 2018 and February 2019, respectively.
LicenseResearch and Development Revenue
| | | | | | | | | | | | | | | | | | | |
| | Three Months Ended | | Change | | Six Months Ended | | Change | Three Months Ended | | | Change | | | Six Months Ended | | | Change | |
| | June 30, | | Favorable/ | | June 30, | | Favorable/ | June 30, | | | Favorable/ | | | June 30, | | | Favorable/ | |
(In millions) | | 2018 | | 2017 | | (Unfavorable) | | 2018 | | 2017 | | (Unfavorable) | 2019 | | | 2018 | | | (Unfavorable) | | | 2019 | | | 2018 | | | (Unfavorable) | |
License revenue | | $ | 48.3 | | $ | — | | $ | 48.3 | | $ | 48.3 | | $ | — | | $ | 48.3 | |
Research and development revenue | | $ | 14.3 | | | $ | 18.3 | | | $ | (4.0 | ) | | $ | 29.0 | | | $ | 37.1 | | | $ | (8.0 | ) |
The decrease in R&D revenue in the three and six months ended June 30, 2019, as compared to the three and six months ended June 30, 2018, was primarily due to the revenue earned under the license and collaboration agreement with Biogen for BIIB098. Our R&D revenues earned under our license and collaboration agreement with Biogen for BIIB098 were $13.6 million and $27.4 million in the three and six months ended June 30, 2019, respectively, as compared to $17.8 million and $35.3 million in the three and six months ended June 30, 2018, respectively. These decreases were due to the timing of activity within the program. We submitted a 505(b)(2) NDA for BIIB098 in December 2018, which was accepted by the FDA for review in February 2019.
License Revenue
| Three Months Ended | | | Change | | | Six Months Ended | | | Change | |
| June 30, | | | Favorable/ | | | June 30, | | | Favorable/ | |
(In millions) | 2019 | | | 2018 | | | (Unfavorable) | | | 2019 | | | 2018 | | | (Unfavorable) | |
License revenue | $ | 1.0 | | | $ | 48.3 | | | $ | (47.3 | ) | | $ | 1.0 | | | $ | 48.3 | | | $ | (47.3 | ) |
During the three months ended June 30, 2018, we recognized $48.3 million in license revenue related to the license and collaboration agreement with Biogen for BIIB098, which was triggered by Biogen’s decision to pay the $50.0 million option payment following Biogen’s review of preliminary gastrointestinal tolerability data from the ongoing clinical development program for BIIB098, including certain data from our long-term safety clinical trial and part A of the elective, randomized, head-to-head phase 3 gastrointestinal tolerability clinical trial comparing BIIB098 and dimethyl fumarate. As discussed in Note 3, Revenue from Contracts with Customers, we determined that this $50.0 million option payment was variable consideration and it was not included in the initial transaction price as it was not probable that a significant reversal in the amount of cumulative revenue recognized would not occur. Upon receipt of the $50.0 million payment, the constraint preventing revenue recognition from previously occurring was removed and the payment was included in the transaction price and allocated to the performance obligations, which included: (i) the grant of a distinct, right-to-use license to Biogen; (ii) future development services; and (iii) clinical supply. As the license was delivered to Biogen shortly after the agreement was signed during the three months ended December 31, 2017, we recognized the transaction price allocated to the license upon receipt of the $50.0 million payment. The remaining $1.7 million of the $50.0 million payment was allocated to future development services and clinical supply, which will be accounted for as R&D revenue.fumarate.
Research and Development Revenue
| | | | | | | | | | | | | | | | | | |
| | Three Months Ended | | Change | | Six Months Ended | | Change |
| | June 30, | | Favorable/ | | June 30, | | Favorable/ |
(In millions) | | 2018 | | 2017 | | (Unfavorable) | | 2018 | | 2017 | | (Unfavorable) |
Research and development revenue | | $ | 18.3 | | $ | 0.8 | | $ | 17.5 | | $ | 37.1 | | $ | 1.5 | | $ | 35.6 |
The increase in R&D revenue in the three and six months ended June 30, 2018, as compared to the three and six months ended June 30, 2017, was due to the revenue earned under the license and collaboration agreement we entered into during the three months ended December 31, 2017 with Biogen for BIIB098. Under the agreement, since January 1, 2018, Biogen is responsible for all of the BIIB098 development costs we incur, subject to annual budget limitations.
Costs and Expenses
Cost of Goods Manufactured and Sold
| | | | | | | | | | | | | | | | | | | |
| | Three Months Ended | | Change | | Six Months Ended | | Change | Three Months Ended | | | Change | | | Six Months Ended | | | Change | |
| | June 30, | | Favorable/ | | June 30, | | Favorable/ | June 30, | | | Favorable/ | | | June 30, | | | Favorable/ | |
(In millions) | | 2018 | | 2017 | | (Unfavorable) | | 2018 | | 2017 | | (Unfavorable) | 2019 | | | 2018 | | | (Unfavorable) | | | 2019 | | | 2018 | | | (Unfavorable) | |
Cost of goods manufactured and sold | | $ | 43.4 | | $ | 39.8 | | $ | (3.6) | | $ | 87.9 | | $ | 80.2 | | $ | (7.7) | $ | 46.2 | | | $ | 43.4 | | | $ | (2.8 | ) | | $ | 91.6 | | | $ | 87.9 | | | $ | (3.7 | ) |
The increase in cost of goods manufactured and sold in the three and six months ended June 30, 2019, as compared to the three and six months ended June 30, 2018, as compared to the three months ended June 30, 2017, was primarily due to increased sales of VIVITROL and ARISTADA in the three months ended June 30, 2018, as compared to the three months ended June 30, 2017, and an increase in cost of goods manufactured related to RISPERDAL CONSTA was due to an increase in standard costs related to RISPERDAL CONSTA.
The increase inVIVITROL cost of goods manufactured and sold, due to the increase in gross sales of VIVITROL noted above. The increase in the six months ended June 30, 2018,2019, as compared to the six months ended June 30, 2017,2018, was primarily due to increased sales of VIVITROL and ARISTADA in the six months ended June 30, 2018, as compared to the six months ended June 30, 2017 and the restructuring activity at our Athlone, Ireland manufacturing facility. During the three months ended March 31, 2018, management approvedpartially offset by a plan designed to streamline future operational performance which included a reduction in headcount of 24 employees. Accordingly, we recorded a restructuring charge of $3.2 million within cost of goods manufactured and sold whichrecorded during the three months ended March 31, 2018 due to management’s approval of a restructuring plan at our Athlone, Ireland manufacturing facility designed to streamline future operational performance. The restructuring plan consisted of severance
and outplacement services. As of June 30, 2018, we had made substantially all of our severance and outplacement services payments related to this restructuring. a reduction in headcount of 24 employees.
Research and Development Expense
For each of our R&D programs, we incur both external and internal expenses. External R&D expenses include clinical and non‑clinical activities performed by contract research organizations, consulting fees, laboratory services, purchases of drug product materials and third‑party manufacturing development costs. Internal R&D expenses include employee‑related expenses, occupancy costs, depreciation and general overhead. We track external R&D expenses for each of our development programs; however, internal R&D expenses are not tracked by individual program as they benefit multiple programs or our technologies in general.
The following table sets forth our external R&D expenses for the three and six months ended June 30, 20182019 and 20172018 relating to each of our key development programs, all other development programs and our internal R&D expenses by the nature of such expenses:
| | | | | | | | | | | | | | | | | | |
| | Three Months Ended | | Change | | Six Months Ended | | Change |
| | June 30, | | Favorable/ | | June 30, | | Favorable/ |
(In millions) | | 2018 | | 2017 | | (Unfavorable) | | 2018 | | 2017 | | (Unfavorable) |
External R&D Expenses: | | | | | | | | | | | | | | | | | | |
Key development programs: | | | | | | | | | | | | | | | | | | |
ALKS 3831 | | $ | 15.6 | | $ | 25.6 | | $ | 10.0 | | $ | 30.7 | | $ | 51.4 | | $ | 20.7 |
BIIB098 | | | 10.7 | | | 10.9 | | | 0.2 | | | 22.2 | | | 25.6 | | | 3.4 |
ALKS 5461 | | | 8.5 | | | 8.9 | | | 0.4 | | | 16.8 | | | 18.1 | | | 1.3 |
ALKS 4230 | | | 2.1 | | | 1.5 | | | (0.6) | | | 9.2 | | | 3.4 | | | (5.8) |
ARISTADA and ARISTADA line extensions | | | 6.7 | | | 2.1 | | | (4.6) | | | 11.3 | | | 4.0 | | | (7.3) |
Other external R&D expenses | | | 10.9 | | | 8.2 | | | (2.7) | | | 22.2 | | | 18.1 | | | (4.1) |
Total external R&D expenses | | | 54.5 | | | 57.2 | | | 2.7 | | | 112.4 | | | 120.6 | | | 8.2 |
Internal R&D expenses: | | | | | | | | | | | | | | | | | | |
Employee-related | | | 41.0 | | | 32.3 | | | (8.7) | | | 80.6 | | | 64.0 | | | (16.6) |
Occupancy | | | 2.9 | | | 2.4 | | | (0.5) | | | 5.6 | | | 4.8 | | | (0.8) |
Depreciation | | | 2.9 | | | 2.6 | | | (0.3) | | | 5.8 | | | 5.0 | | | (0.8) |
Other | | | 5.5 | | | 4.7 | | | (0.8) | | | 10.8 | | | 9.6 | | | (1.2) |
Total internal R&D expenses | | | 52.3 | | | 42.0 | | | (10.3) | | | 102.8 | | | 83.4 | | | (19.4) |
Research and development expenses | | $ | 106.8 | | $ | 99.2 | | $ | (7.6) | | $ | 215.2 | | $ | 204.0 | | $ | (11.2) |
| | Three Months Ended | | | Change | | | Six Months Ended | | | Change | |
| | June 30, | | | Favorable/ | | | June 30, | | | Favorable/ | |
(In millions) | | 2019 | | | 2018 | | | (Unfavorable) | | | 2019 | | | 2018 | | | (Unfavorable) | |
External R&D Expenses: | | | | | | | | | | | | | | | | | | | | | | | | |
Development programs: | | | | | | | | | | | | | | | | | | | | | | | | |
BIIB098 | | $ | 8.8 | | | $ | 10.7 | | | $ | 1.9 | | | $ | 18.2 | | | $ | 22.2 | | | $ | 4.0 | |
ALKS 3831 | | | 8.2 | | | | 15.6 | | | | 7.4 | | | | 15.9 | | | | 30.7 | | | | 14.8 | |
ALKS 4230 | | | 9.3 | | | | 2.1 | | | | (7.2 | ) | | | 14.5 | | | | 9.2 | | | | (5.3 | ) |
ALKS 5461 | | | 4.8 | | | | 8.5 | | | | 3.7 | | | | 11.2 | | | | 16.8 | | | | 5.6 | |
ARISTADA and ARISTADA line extensions | | | 1.8 | | | | 6.7 | | | | 4.9 | | | | 4.7 | | | | 11.3 | | | | 6.6 | |
Other external R&D expenses | �� | | 14.1 | | | | 10.9 | | | | (3.2 | ) | | | 26.7 | | | | 22.2 | | | | (4.5 | ) |
Total external R&D expenses | | | 47.0 | | | | 54.5 | | | | 7.5 | | | | 91.2 | | | | 112.4 | | | | 21.2 | |
Internal R&D expenses: | | | | | | | | | | | | | | | | | | | | | | | | |
Employee-related | | | 45.0 | | | | 41.0 | | | | (4.0 | ) | | | 91.4 | | | | 80.6 | | | | (10.8 | ) |
Depreciation | | | 3.3 | | | | 2.9 | | | | (0.4 | ) | | | 6.6 | | | | 5.8 | | | | (0.8 | ) |
Occupancy | | | 3.1 | | | | 2.9 | | | | (0.2 | ) | | | 6.0 | | | | 5.6 | | | | (0.4 | ) |
Other | | | 6.0 | | | | 5.5 | | | | (0.5 | ) | | | 11.8 | | | | 10.8 | | | | (1.0 | ) |
Total internal R&D expenses | | | 57.4 | | | | 52.3 | | | | (5.1 | ) | | | 115.8 | | | | 102.8 | | | | (13.0 | ) |
Research and development expenses | | $ | 104.4 | | | $ | 106.8 | | | $ | 2.4 | | | $ | 207.0 | | | $ | 215.2 | | | $ | 8.2 | |
These amounts are not necessarily predictive of future R&D expenses. In an effort to allocate our spending most effectively, we continually evaluate theour products under development, based on the performance of such products in pre-clinicalpre‑clinical and/or clinical trials, our expectations regarding the likelihood of their regulatory approval and our view of their commercial viability, among other factors.
The decrease in expenses related to BIIB098 in both periods presented was primarily due to the timing of activity within the two-year, multicenter, open-label phase 3 study designed to assess the safety of BIIB098, which was initiated in December 2015. We also initiated an elective, randomized, head-to-head phase 3 study designed to compare the gastrointestinal tolerability of BIIB098 and TECFIDERA in patients with relapsing-remitting MS in March 2017. The decrease in expenses related to ALKS 3831 in both periods presented was primarily due to the decrease in activity within the ENLIGHTEN-1 and ENLIGHTEN-2 pivotal trials, which were initiated in December 2015 and February 2016, respectively, partially offset by an increase in activity within a phase 3 study of ALKS 3831 in young adults, which was initiated in June 2017. The decreaseincrease in expenses related to BIIB098 wasALKS 4230 in both periods presented were primarily duerelated to the timing of activity within the two-year, multicenter, open-label phase 3 study designed to assessARTISTRY development program for ALKS 4230, as described under the safety of BIIB098, which was initiated in December 2015. We also initiated an elective, randomized, head-to-head phase 3 study designed to compare the gastrointestinal tolerability of BIIB098 to TECFIDERA in patients with relapsing-remitting MS in March 2017.heading “Key Development Programs” above. The decrease in expenses related to ALKS 5461 in both periods presented was primarily due to a decrease in activity within the program as we completed submission of our NDA to the FDA seeking marketing approval of ALKS 5461 for the adjunctive treatment of MDD in January 2018. The increase in expenses related to ALKS 4230 was primarily related to the timing of the phase 1 study, as described above under the heading “ALKS 4230”. The increasedecrease in expenses related to ARISTADA and ARISTADA line extensions in both periods presented was primarily due to an increase in the activity in a phase 3b clinicaltiming of the ALPINE study, to evaluateas described under the efficacy and safety of ARISTADA and INVEGA SUSTENNA in patients experiencing an acute exacerbation of schizophrenia.
heading “Key Development Programs” above.
The increase in employee-related expenses was primarily due to an increase in R&D headcount of 18%8% from June 30, 20172018 to June 30, 2018.2019.
Selling, General and Administrative Expense
| | | | | | | | | | | | | | | | | | | |
| | Three Months Ended | | Change | | Six Months Ended | | Change | | Three Months Ended | | | Change | | | Six Months Ended | | | Change | |
| | June 30, | | Favorable/ | | June 30, | | Favorable/ | | June 30, | | | Favorable/ | | | June 30, | | | Favorable/ | |
(In millions) | | 2018 | | 2017 | | (Unfavorable) | | 2018 | | 2017 | | (Unfavorable) | | 2019 | | | 2018 | | | (Unfavorable) | | | 2019 | | | 2018 | | | (Unfavorable) | |
Selling, general and administrative expense | | $ | 138.3 | | $ | 108.9 | | $ | (29.4) | | $ | 256.4 | | $ | 211.0 | | $ | (45.4) | | $ | 155.1 | | | $ | 138.3 | | | $ | (16.8 | ) | | $ | 296.3 | | | $ | 256.4 | | | $ | (39.9 | ) |
The increase in selling, general and administrative (“SG&A”)&A expense in the three and six months ended June 30, 2019, as compared to the three and six months ended June 30, 2018, was primarily due to an increase in employee-related expenses of $13.5 million and $30.5 million, respectively, which was primarily due to an increase in our SG&A-related headcount of 17% from June 30, 2018 to June 30, 2019. In addition, marketing and professional services fees increased by $2.9 million and $8.5 million in the three and six months ended June 30, 2019, as compared to the three and six months ended June 30, 2017, was primarily due to an increase in marketing and professional services fees of $15.5 million and $21.4 million,2018, respectively, and employee-related expenses of $12.4 million and $21.4 million, respectively. The increase in marketing and professional services feeswhich was primarily due to additional brand investments in both VIVITROL, ARISTADA and ARISTADA INITIO, as well as an increase in patient access support services, such as reimbursement and transition assistance, for bothall of these products, and investment in ALKS 5461 as the FDA has issued a target action date for the ALKS 5461 NDA of January 31, 2019 under the Prescription Drug User Fee Act. The increase in employee-related expenses was primarily due to an increase in our SG&A-related headcount of 13% from June 30, 2017 to June 30, 2018.products.
Amortization of Acquired Intangible Assets
| | | | | | | | | | | | | | | | | | | |
| | Three Months Ended | | Change | | Six Months Ended | | Change | | Three Months Ended | | | Change | | | Six Months Ended | | | Change | |
| | June 30, | | Favorable/ | | June 30, | | Favorable/ | | June 30, | | | Favorable/ | | | June 30, | | | Favorable/ | |
(In millions) | | 2018 | | 2017 | | (Unfavorable) | | 2018 | | 2017 | | (Unfavorable) | | 2019 | | | 2018 | | | (Unfavorable) | | | 2019 | | | 2018 | | | (Unfavorable) | |
Amortization of acquired intangible assets | | $ | 16.2 | | $ | 15.5 | | $ | (0.7) | | $ | 32.3 | | $ | 30.8 | | $ | (1.5) | | $ | 10.1 | | | $ | 16.2 | | | $ | 6.1 | | | $ | 20.0 | | | $ | 32.3 | | | $ | 12.3 | |
We amortize our amortizable intangible assets using the economic-use method, which reflects the pattern that the economic benefits of the intangible assets are consumed as revenue is generated from the underlying patent or contract. Based on our most recent analysis, amortization of intangible assets included within our consolidated balance sheet at June 30, 20182019 is expected to be approximately $65.0$40.0 million, $55.0$40.0 million, $50.0$40.0 million, $40.0$35.0 million and $35.0 million in the years ending December 31, 20182019 through 2022,2023, respectively.
Other Expense, Netnet
| | | | | | | | | | | | | | | | | | | |
| | Three Months Ended | | Change | | Six Months Ended | | Change | | Three Months Ended | | | Change | | | Six Months Ended | | | Change | |
| | June 30, | | Favorable/ | | June 30, | | Favorable/ | | June 30, | | | Favorable/ | | | June 30, | | | Favorable/ | |
(In millions) | | 2018 | | 2017 | | (Unfavorable) | | 2018 | | 2017 | | (Unfavorable) | | 2019 | | | 2018 | | | (Unfavorable) | | | 2019 | | | 2018 | | | (Unfavorable) | |
Interest income | | $ | 1.8 | | $ | 1.2 | | $ | 0.6 | | $ | 3.3 | | $ | 2.1 | | $ | 1.2 | | $ | 3.7 | | | $ | 1.9 | | | $ | 1.8 | | | $ | 7.3 | | | $ | 3.4 | | | $ | 3.9 | |
Interest expense | | | (3.1) | | | (2.9) | | | (0.2) | | | (8.6) | | | (5.7) | | | (2.9) | | | (3.5 | ) | | | (3.1 | ) | | | (0.4 | ) | | | (7.0 | ) | | | (8.6 | ) | | | 1.6 | |
Change in the fair value of contingent consideration | | | (19.6) | | | 0.7 | | | (20.3) | | | (21.5) | | | 2.3 | | | (23.8) | | | (6.5 | ) | | | (19.6 | ) | | | 13.1 | | | | (29.1 | ) | | | (21.5 | ) | | | (7.6 | ) |
Other expense, net | | | (3.5) | | | (0.1) | | | (3.4) | | | (2.7) | | | (1.6) | | | (1.1) | |
Other income (expense), net | | | | 1.8 | | | | (3.5 | ) | | | 5.3 | | | | 0.1 | | | | (2.7 | ) | | | 2.8 | |
Total other expense, net | | $ | (24.4) | | $ | (1.1) | | $ | (23.3) | | $ | (29.5) | | $ | (2.9) | | $ | (26.6) | | $ | (4.5 | ) | | $ | (24.3 | ) | | $ | 19.8 | | | $ | (28.7 | ) | | $ | (29.4 | ) | | $ | 0.7 | |
The increase in interest expense in the six months ended June 30, 2018, as compared to the six months ended June 30, 2017, was due to the Refinancing in March 2018. The Refinancing, which, among other things, extended the due date of the term loan from September 25, 2021 to March 26, 2023 and lowered the interest rate on our term loan from LIBOR plus 2.75% with a LIBOR floor of 0.75% to LIBOR plus 2.25% with no LIBOR floor, resulted in a charge of $2.3 million in the three months ended March 31, 2018. The Refinancing is discussed in greater detail in Note 10, Long-Term Debt in the “Notes to Condensed Consolidated Financial Statements” in this Form 10-Q.
The decrease in the fair value of contingent consideration during the three and six months ended June 30, 2018, as compared to the three and six months ended June 30, 2017,for both periods presented was primarily due to the complete response letter Recro receivedRecro’s receipt of a second CRL from the FDA in May 2018March 2019 regarding its NDA for IV Meloxicam. As a result of receipt of the complete response letter,this second CRL, we delayed our anticipated date for the FDA’s approval of the IV Meloxicam NDA and reduced the probability of success and amount of forecasted sales due to this delay in our valuation model. The valuation approach used to determine the fair
value of the contingent consideration is discussed in greater detail in Note 5, Fair Value Measurements, in the “Notes to Condensed Consolidated Financial Statements” in this Form 10-Q.
Income Tax Provision (Benefit)Taxes
| | | | | | | | | | | | | | | | | | | |
| | Three Months Ended | | Change | | Six Months Ended | | Change | | Three Months Ended | | | Change | | | Six Months Ended | | | Change | |
| | June 30, | | Favorable/ | | June 30, | | Favorable/ | | June 30, | | | Favorable/ | | | June 30, | | | Favorable/ | |
(In millions) | | 2018 | | 2017 | | (Unfavorable) | | 2018 | | 2017 | | (Unfavorable) | | 2019 | | | 2018 | | | (Unfavorable) | | | 2019 | | | 2018 | | | (Unfavorable) | |
Income tax provision (benefit) | | $ | 8.2 | | $ | (2.7) | | $ | (10.9) | | $ | 3.7 | | $ | (6.4) | | $ | (10.1) | | $ | 1.6 | | | $ | 8.2 | | | $ | 6.6 | | | $ | (2.3 | ) | | $ | 3.7 | | | $ | 6.0 | |
The income tax provision (benefit) in the three and six months ended June 30, 20182019 and 20172018 primarily related to U.S. federal and state taxes. The unfavorablefavorable change in income taxes in the three months ended June 30, 2019, as compared to the corresponding period, was primarily due to a reduction in ordinary income earned in the U.S.
The income tax benefit in the six months ended June 30, 2019 primarily related to a $7.9 million discrete tax benefit to reflect the foreign derived intangible income (“FDII”) proposed regulations issued by the U.S. Department of the Treasury and the U.S. Internal Revenue Service in March 2019. The benefit is partially offset by a $4.9 million discrete tax expense for employee equity activity. The income tax provision in the six months ended June 30, 2018 primarily related to $9.0 million in U.S. federal and state taxes on ordinary income, partially offset by $5.1 million of discrete tax benefits related to the exercise and vesting of stock-based awards. The favorable change in income taxes in the six months ended June 30, 2019, as compared to the corresponding prior periods,period, was primarily due to an increase ina reduction to ordinary income earned in the U.S. and the recognition of FDII tax benefits, partially offset by increased tax expense from employee equity activity.
We will continue to evaluate the impact of tax legislation and will update our disclosures as additional information and interpretive guidance becomes available.
Liquidity and Financial Condition
Our financial condition is summarized as follows:
| | | | | | | | | | | | | | | | | | | |
| | June 30, 2018 | | December 31, 2017 | | June 30, 2019 | | | December 31, 2018 | |
(In millions) | | U.S. | | Ireland | | Total | | U.S. | | Ireland | | Total | | U.S. | | | Ireland | | | Total | | | U.S. | | | Ireland | | | Total | |
Cash and cash equivalents | | $ | 51.2 | | $ | 104.6 | | $ | 155.8 | | $ | 114.7 | | $ | 76.6 | | $ | 191.3 | | $ | 126.7 | | | $ | 69.3 | | | $ | 196.0 | | | $ | 139.3 | | | $ | 127.5 | | | $ | 266.8 | |
Investments—short-term | | | 174.9 | | | 102.8 | | | 277.7 | | | 127.5 | | | 114.7 | | | 242.2 | | | 290.0 | | | | 84.3 | | | | 374.3 | | | | 203.3 | | | | 69.2 | | | | 272.5 | |
Investments—long-term | | | 87.9 | | | 39.1 | | | 127.0 | | | 108.9 | | | 48.3 | | | 157.2 | | | 10.5 | | | | 12.8 | | | | 23.3 | | | | 51.5 | | | | 29.2 | | | | 80.7 | |
Total cash and investments | | $ | 314.0 | | $ | 246.5 | | $ | 560.5 | | $ | 351.1 | | $ | 239.6 | | $ | 590.7 | | $ | 427.2 | | | $ | 166.4 | | | $ | 593.6 | | | $ | 394.1 | | | $ | 225.9 | | | $ | 620.0 | |
Outstanding borrowings—short and long-term | | $ | 280.4 | | $ | — | | $ | 280.4 | | $ | 281.4 | | $ | — | | $ | 281.4 | | $ | 278.2 | | | $ | — | | | $ | 278.2 | | | $ | 279.3 | | | $ | — | | | $ | 279.3 | |
At June 30, 2018,2019, our investments consisted of the following:
| | | | | | | | | | | | | |
| | | | | Gross | | | | | | | | | Gross | | | | | |
| | Amortized | | Unrealized | | Estimated | | Amortized | | | Unrealized | | | Estimated | |
(In millions) | | Cost | | Gains | | Losses | | Fair Value | | Cost | | | Gains | | | Losses | | | Fair Value | |
Investments—short-term | | $ | 278.1 | | $ | — | | $ | (0.4) | | $ | 277.7 | |
Investments—short-term available-for-sale | | | $ | 372.7 | | | $ | 1.7 | | | $ | (0.1 | ) | | $ | 374.3 | |
Investments—long-term available-for-sale | | | 124.5 | | | — | | | (1.1) | | | 123.4 | | | 19.7 | | | | — | | | | — | | | | 19.7 | |
Investments—long-term held-to-maturity | | | 3.5 | | | 0.1 | | | — | | | 3.6 | | | 3.5 | | | | 0.1 | | | | — | | | | 3.6 | |
Total | | $ | 406.1 | | $ | 0.1 | | $ | (1.5) | | $ | 404.7 | | $ | 395.9 | | | $ | 1.8 | | | $ | (0.1 | ) | | $ | 397.6 | |
Our investment objectives are to preserve capital, provide sufficient liquidity to satisfy operating requirements and generate investment income. We mitigate credit risk in our cash reserves by maintaining a well-diversified portfolio that limits the amount of investment exposure as to institution, maturity and investment type. However, the value of these securities may be adversely affected by the instability of the global financial markets, which could, in turn, adversely impact our financial position and our overall liquidity. Our available-for-sale investments consist primarily of short- and long-term U.S. government and agency debt securities, corporate debt securities and debt securities issued by foreign agencies and backed by foreign governments. Our held-to-maturity investments consist of investments that are restricted and held as collateral under certain letters of credit related to certain of our lease agreements.
We classify available-for-sale investments in an unrealized loss position, whichthat do not mature within 12 months, as long-term investments. Available-for-sale investments in an unrealized gain position are classified as short-term investments, regardless of maturity date. We have the intent and ability to hold these investments until recovery, which may be at maturity, and it is more likely than not that we would not be required to sell these securities before recovery of their amortized cost. At June 30, 2018,2019, we performed an analysis of our investments with unrealized losses for impairment and determined that they were temporarily impaired.
Sources and Uses of Cash
We expect that our existing cash and investments balance will be sufficient to finance our anticipated working capital and other cash requirements, such as capital expenditures and principal and interest payments, for at least twelve12 months following the date on which this Form 10-Q is filed. Subject to market conditions, interest rates and other
factors, we may pursue opportunities to obtain additional financing in the future, including debt and equity offerings, corporate collaborations, bank borrowings, debt refinancings, arrangements relating to assets or other financing methods or structures.
Information about our cash flows, by category, is presented in “Part I, Item 1–Condensed Consolidated Financial Statements of Cash Flows” of this Form 10-Q. The following table summarizes our cash flows for the six months ended June 30, 20182019 and 2017:2018:
| | | | | | | |
| | Six Months Ended | | Six Months Ended | |
| | June 30, | | June 30, | |
(In millions) | | 2018 | | 2017 | | 2019 | | | 2018 | |
Cash and cash equivalents, beginning of period | | $ | 191.3 | | $ | 186.4 | | $ | 266.8 | | | $ | 191.3 | |
Cash flows provided by (used in) operating activities | | | 5.3 | | | (36.2) | |
Cash flows (used in) provided by investing activities | | | (40.6) | | | 9.4 | |
Cash flows used in financing activities | | | (0.2) | | | (1.5) | |
Cash flows (used in) provided by operating activities | | | | (1.0 | ) | | | 5.3 | |
Cash flows used in investing activities | | | | (71.9 | ) | | | (40.6 | ) |
Cash flows provided by (used in) financing activities | | | | 2.1 | | | | (0.2 | ) |
Cash and cash equivalents, end of period | | $ | 155.8 | | $ | 158.1 | | $ | 196.0 | | | $ | 155.8 | |
The change in cash flows provided byfrom operating activities in the six months ended June 30, 2018,2019, as compared to the cash flows used in operating activities in the six months ended June 30, 2017,2018, was primarily due to a 24% increase in cash received from our customers, which was driven in large part by the license and collaboration agreement with Biogen for BIIB098, as previously discussed. This was partially offset by a 22%19% increase in cash paid to our employees, which was primarily due to a 12%10% increase in our headcount from June 30, 20172018 to June 30, 2018.
2019. This was partially offset by a 7% increase in cash received from our customers, which was primarily due to the increase in our product sales, net, as described under the heading “Product Sales, net” above.
The increase in cash flows used in investing activities in the six months ended June 30, 2018, as compared to the cash flows provided by investing activities in the six months ended June 30, 2017, was due to a $35.6 million decrease in the net sales of investments and a $14.8 million increase in additions to our property, plant and equipment, which consisted predominately of construction of facilities and purchase of equipment at our Wilmington, Ohio location for the manufacture of products currently in development and existing proprietary products.
The decrease in cash flows used in financing activities in the six months ended June 30, 2018,2019, as compared to the six months ended June 30, 2017,2018, was primarily due to a $1.3$37.2 million increase in the amountnet purchases of cashinvestments, partially offset by the $10.0 million that we received from our employees uponRecro in connection with the exercise of stock options.
contingent consideration from the Gainesville Transaction.
Borrowings
In March 2018, we completed the Refinancing related to the 2023 Term Loans. The 2023 Term Loans mature on March 26, 2023, bear interest for LIBOR Rate Loans (as defined in the Amended Credit Agreement) at LIBOR plus 2.25%, with no LIBOR floor and for ABR Loans (as defined in the Amended Credit Agreement) at ABR plus 1.25%, with an ABR floor of 1.00%.
The 2023 Term Loans amortize in equal quarterly amounts of 0.25% of the original principal amount of the loan, with the balance payable at maturity. The credit agreement, as amended by the March 2018 amendment (the “Amended Credit Agreement”), provides for incremental capacity in an amount of $175,000,000 plus additional amounts so long as we meet certain conditions, including a specified leverage ratio. The Amended Credit Agreement includes customary restrictive covenants subject to certain exceptions and baskets. The Amended Credit Agreement also contains customary affirmative covenants and events of default.
At June 30, 2018,2019, the principal balance of our borrowings consisted of $283.5$280.7 million outstanding under our 2023 Term Loans. See Note 10, 11, Long-Term Debt, in the “Notes to condensedCondensed Consolidated Financial Statements” in this Form 10-Q for a further discussion of our 2023 Term Loans.
Contractual Obligations
In March 2018, we entered into a lease agreement for 900 Winter Street. The lease is for approximately 220,000 square feet of office and laboratory space in Waltham, Massachusetts and the term of the lease shall commence on the earlier of the Delivery Date or Commencement Date. The initial lease term expires on the last day of the calendar month
in which the fifteenth (15th) anniversary of the Commencement Date occurs, with an option to extend for an additional ten (10) years.
Refer to the “Contractual Obligations” section within “Part II, Item 7 – Management’s Discussion and Analysis of Financial Condition and Results of Operations” of our Annual Report for a discussion of our other contractual obligations. Other than the entry into the lease agreement for 900 Winter Street, ourOur contractual obligations have not materially changed from the date of our Annual Report.
Off-Balance Sheet Arrangements
At June 30, 2018,2019, we were not party to any off-balance sheet arrangements that have, or are reasonably likely to have, a current or future effect on our financial condition, changes in financial condition, revenue or expenses, results of operations, liquidity, capital expenditures or capital resources material to investors.
Critical Accounting Estimates
The discussion and analysis of our financial condition and results of operations is based on our financial statements, which have been prepared in accordance with GAAP. The preparation of these financial statements requires us to make estimates and assumptions that affect the reported amounts of assets and liabilities and the disclosure of contingent assets and liabilities at the date of our financial statements and the reported amounts of revenues and expenses during the reporting period. Actual results may differ from these estimates under different assumptions or conditions. Refer to “Critical Accounting Estimates” within “Part II, Item 7 – Management’s Discussion and Analysis of Financial Condition and Results of Operations” of our Annual Report for a discussion of our critical accounting estimates. In addition, refer to Note 3, Revenue from Contracts with Customers, in this Form 10-Q for a discussion of how we changed the way we recognize revenue under Topic 606.
New Accounting Standards
Refer to “New Accounting Pronouncements” included in Note 2, Summary of Significant Accounting Policies in the “Notes to Condensed Consolidated Financial Statements” in this Form 10-Q for a discussion of certain new accounting standards applicable to us. In addition, refer to Note 9, Leases, in this Form 10-Q for a discussion of how we changed the way we account for leases under Topic 842.
Item 3. Quantitative and Qualitative Disclosures About Market Risk
Market risks related to our investment portfolio, and the ways we manage such risks, are summarized in “Part II, Item 7A – Quantitative and Qualitative Disclosures About Market Risk” of our Annual Report. We regularly review our marketable securities holdings and shift our investment holdings to those that best meet our investment objectives, which are to preserve capital, provide sufficient liquidity to satisfy operating requirements and generate investment income. Apart from such adjustments to our investment portfolio, there have been no material changes to our market risks since December 31, 2017,2018, and we do not anticipate any near-term changes in the nature of our market risk exposures or in our management's objectives and strategies with respect to managing such exposures.
We are exposed to foreign currency exchange risk related to manufacturing and royalty revenues we receive on certain of our products, partially offset by certain operating costs arising from expenses and payables in connection with our Irish operations that are settled predominantly in Euro. These foreign currency exchange rate risks are summarized in “Part II, Item 7A – Quantitative and Qualitative Disclosures About Market Risk” of our Annual Report. There has been no material change in our assessment of our sensitivity to foreign currency exchange rate risk since December 31, 2017.2018.
Item 4. Controls and Procedures
a) Evaluation of Disclosure Controls and Procedures
Our management, with the participation of our Chief Executive Officer and Chief Financial Officer, evaluated the effectiveness of the design and operation of our disclosure controls and procedures (as defined in Rule 13a-15(e) under
the Securities Exchange Act of 1934, as amended (the “Exchange Act”)), onas of June 30, 2018.2019. Based on that evaluation, our Chief Executive Officer and Chief Financial Officer concluded that our disclosure controls and procedures were effective as of June 30, 20182019 to provide reasonable assurance that the information required to be disclosed by us in the reports that we file under the Exchange Act is recorded, processed, summarized and reported within the time periods specified in the SEC’s rules and forms and that such information is accumulated and communicated to our management, including our Chief Executive Officer and Chief Financial Officer, as appropriate, to allow timely decisions regarding required disclosure. In designing and evaluating our disclosure controls and procedures, our management recognized that any controls and procedures, no matter how well designed and operated, can provide only reasonable assurance of achieving the desired control objectives, and our management necessarily was required to apply its judgment in evaluating the cost-benefit relationship of possible controls and procedures.
b) Change in Internal Control Over Financial Reporting
During the period covered by this report, there have been no changes in our internal control over financial reporting that have materially affected, or are reasonably likely to materially affect, our internal control over financial reporting.
PART II. OTHER INFORMATION
Item 1.Legal Proceedings
For information regarding legal proceedings, refer to Note 14, Commitments and ContingenciesContingent Liabilities in the “Notes to Condensed Consolidated Financial Statements” in this Form 10-Q, which is incorporated into this Part II, Item 1 by reference.
Item 1A.Risk Factors
Certain U.S. holders ofPreliminary, topline or interim data from our ordinary sharesclinical trials that we may suffer adverse tax consequences if any of our non-U.S. subsidiaries is characterizedannounce, publish or report from time to time may change as a “controlled foreign corporation”.
On December 22, 2017, the Tax Cutsmore patient data become available, are subject to audit and Jobs Act was signed into law. This legislation significantlyverification procedures that could result in material changes U.S. tax law by, among other things, changing the rules which determine whether a foreign corporation is treated for U.S. tax purposes as a controlled foreign corporation, or CFC, for taxable years ended December 31, 2017 and onwards. The impact of this change on certain holders of our ordinary shares is uncertain and could be adverse, including potential income inclusions and reporting requirements for U.S. persons (as defined in the Internal Revenue Code) whofinal data, and may not be indicative of final data or results of future clinical trials.
From time to time, we may announce, publish or report preliminary, topline or interim data from our clinical trials. Preliminary, topline or interim data from our clinical trials, including those in oncology, are treated as owning (directly or indirectly) at least 10% of the value or voting power of our shares. The determination of CFC status is complex and includes attribution rules, the application of which is not entirely certain. Recent changes to these attribution rules relatingsubject to the determination of CFC status make it likelyrisk that one or more of the clinical outcomes may materially change as patient enrollment continues and/or more patient data become available and may not be indicative of final data from such trials or results of future clinical trials. Preliminary, topline or interim data also remain subject to audit confirmation and verification procedures that may result in the final data being materially different from the preliminary, topline or interim data we previously announce, published or reported. For example, preliminary data from our non-U.S. subsidiaries willongoing clinical trials of ALKS 4230 may change as more patient data become available and are not necessarily predictive of final data from such trials. As a result, preliminary, topline and interim data should be classified as a CFC. Existingviewed with caution until the final data are available. Material adverse differences between preliminary, topline or interim data and prospective investors should consult their tax advisers regarding the potential applicationfinal data or results of these rules to their investments in us.
See “Certain Irishfuture clinical trials could significantly harm our business, financial condition, cash flows and United States Federal Income Tax Considerations – United States Federal Income Tax Considerations” in our Form S-1/A, filed with the SEC on February 29, 2012, for additional discussion with respect to other potential U.S. federal income tax consequencesresults of investments in us.operations.
There have been no other material changes from the risk factors disclosed in our Annual Report. Further discussion of our risk factors appears in “Part I, Item 1A—Risk Factors” of our Annual Report and under the heading “Cautionary Note Concerning Forward-Looking Statements” in this Form 10-Q.Report.
Item 2.Unregistered Sales of Equity Securities and Use of Proceeds
On September 16, 2011, our board of directors authorized the continuation of the Alkermes, Inc. program to repurchase up to $215.0 million of our ordinary shares at the discretion of management from time to time in the open market or through privately negotiated transactions. We did not purchase any shares under this program during the six
months ended June 30, 2018.2019. As of June 30, 2018,2019, we had purchased a total of 8,866,342 shares under this program at a cost of $114.0 million.
During the three monthsmonths ended June 30, 2018,2019, we acquired 369 Alkermes6,397 of our ordinary shares, at an average price of $48.30$30.35 per share, related to the vesting of employee equity awards to satisfy withholding tax obligations.
Item 5.Other Information
The Company's policy governing transactions in its securities by its directors, officers and employees permits its officers, directors and employees to enter into trading plans in accordance with Rule 10b5-1 under the Exchange Act. During the quarter ended June 30, 2018, Dr. Floyd E. Bloom,2019, Mr. Paul J. Mitchell, a director of the Company, entered into a trading plan in accordance with Rule 10b5-1 and the Company’s policy governing transactions in its securities by its directors, officers and employees. The Company undertakes no obligation to update or revise the information provided herein, including for any revision or termination of an established trading plan.
Item 6.Exhibits
The following exhibits are filed or furnished as part of this Form 10-Q:
EXHIBIT INDEX
| | | |
| | | |
Exhibit No. | | Description of Exhibit | |
10.1† | | | Alkermes plc 2018 Stock Option and Incentive Plan, as amended (incorporated by reference to Exhibit 10.1 to the Alkermes plc Current Report on Form 8-K filed on May 23, 2018)22, 2019). | |
10.2 # | | | FirstSecond Amendment to Lease, dated June 21, 2018,May 10, 2019, by and between Alkermes, Inc. and PDM 900 Unit, LLC.
|
31.1 # | | | Rule 13a-14(a)/15d-14(a) Certification. |
31.2 # | | | Rule 13a-14(a)/15d-14(a) Certification. |
32.1 ‡ | | | Certification pursuant to 18 U.S.C. Section 1350, as adopted pursuant to Section 906 of the Sarbanes-Oxley Act of 2002. |
101 #+ 101.INS
| | | The following materials from Alkermes plc’s Quarterly Report on Form 10-Q forXBRL Instance Document – the three and six months ended June 30, 2018, formattedinstance document does not appear in the Interactive Data File because its XBRL (“Extensible Business Reporting Language”): (i)tags are embedded within the Condensed Consolidated Balance Sheets, (ii) the Condensed Consolidated Statements of Operations and Comprehensive Loss, (iii) the Condensed Consolidated Statements of Cash Flows, and (iv) the Notes to the Condensed Consolidated Financial Statements.Inline XBRL document.
|
101.SCH # | | XBRL Taxonomy Extension Schema Document. |
101.CAL # | | XBRL Taxonomy Extension Calculation Linkbase Document. |
101.DEF # | | XBRL Taxonomy Extension Definition Linkbase Document. |
101.LAB # | | XBRL Taxonomy Extension Label Linkbase Document. |
101.PRE # | | XBRL Taxonomy Extension Presentation Linkbase Document. |
+ XBRL (Extensible Business Reporting Language).
† | Indicates a management contract or any compensatory plan, contract or arrangement. |
SIGNATURES
# Filed herewith.
‡ Furnished herewith.
† Indicates a management contract or any compensatory plan, contract or arrangement.
* Confidential treatment has been granted or requested for certain portions of this exhibit. Such portions have been filed separately with the SEC pursuant to a confidential treatment request.
SIGNATURES
Pursuant to the requirements of the Securities Exchange Act of 1934, the registrant has duly caused this report to be signed on its behalf by the undersigned thereunto duly authorized.
| | | |
| ALKERMES plc | |
| | | |
| (Registrant) | |
| | | |
| | | |
| By: | /s/ Richard F. Pops | |
| | Chairman and Chief Executive Officer | |
| | (Principal Executive Officer) | |
|
| | |
| By: | /s/ James M. Frates | |
| | Senior Vice President and Chief Financial Officer | |
| | (Principal Financial Officer) | |
Date: July 26, 201825, 2019
41