UNITED STATES
SECURITIES AND EXCHANGE COMMISSION
Washington, D.C. 20549
FORM 10-Q
(Mark One)
|
| | | | |
| x | QUARTERLY REPORT PURSUANT TO SECTION 13 OR 15(d) OF THE SECURITIES EXCHANGE ACT OF 1934 |
For the quarterly period ended September 30, 20172021
OR
|
| | | | |
| ¨ | TRANSITION REPORT PURSUANT TO SECTION 13 OR 15(d) OF THE SECURITIES EXCHANGE ACT OF 1934 |
For the transition period from to
Commission file number: 001-35355
_____________________________________________________________
MANNING & NAPIER, INC.
(Exact name of registrant as specified in its charter)
|
| | | | | | | | | | |
| Delaware | | 45-2609100 |
(State or other jurisdiction of
incorporation or organization)
| | (I.R.S. Employer
Identification No.)
|
| |
290 Woodcliff Drive Fairport, New York
| | 14450 |
| Fairport, | New York | | 14450 |
| (Address of principal executive offices) | | (Zip Code) |
(585) 325-6880
(Registrant’s telephone number, including area code:
(585) 325-6880code)
_____________________________________________________________
Securities registered pursuant to Section 12(b) of the Act:
| | | | | | | | |
| Title of each class | Trading Symbol(s) | Name of each exchange on which registered |
| Class A common stock, $0.01 par value per share | MN | New York Stock Exchange |
Indicate by check mark whether the registrant (1) has filed all reports required to be filed by Section 13 or 15(d) of the Securities Exchange Act of 1934 during the preceding 12 months (or for such shorter period that the registrant was required to file such reports), and (2) has been subject to such filing requirements for the past 90 days. Yes x No ¨
Indicate by check mark whether the registrant has submitted electronically and posted on its corporate Web site, if any, every Interactive Data File required to be submitted and posted pursuant to Rule 405 of Regulation S-T (§232.405 of this chapter) during the preceding 12 months (or for such shorter period that the registrant was required to submit and post such files). Yes x No ¨
Indicate by check mark whether the registrant is a large accelerated filer, an accelerated filer, a non-accelerated filer, a smaller reporting company, or an emerging growth company. See the definitions of “large accelerated filer,” “accelerated filer,” “smaller reporting company,” and "emerging growth company" in Rule 12b-2 of the Exchange Act:
| | | | | | | | | | | | | | | | | | | | |
| Large accelerated filer | | ¨ | | Accelerated filer | | ¨
|
| | | |
| Non-accelerated filer | | x | | Smaller reporting company | | x |
| | | | | | |
Large accelerated filer | | ¨ | | Accelerated filer | | x |
| | | |
Non-accelerated filer | | ¨ (Do not check if a smaller reporting company)
| | Smaller reporting company | | ¨ |
| | | | | | |
| | | | Emerging growth company | | ¨
|
If an emerging growth company, indicate by check mark if the registrant has elected not to use the extended transition period for complying with any new or revised financial accounting standards provided pursuant to Section 13(a) of the Exchange Act. ¨
Indicate by check mark whether the registrant is a shell company (as defined in Rule 12b-2 of the Exchange Act). Yes ¨ No x
Indicate the number of shares outstanding of each of the registrant’s classes of common stock, as of the latest practicable date.
|
| | | | | | | |
| Class | | Outstanding at November 3, 20179, 2021 |
| Class A common stock, $0.01 par value per share | | 15,039,347 |
Class B common stock, $0.01 par value per share | | 1,00018,465,554 |
TABLE OF CONTENTS
|
| | | | | | | |
| | Page |
| Part I | | |
| Item 1. | | |
| | |
| | |
| | |
| | |
| | |
| | |
| Item 2. | | |
| Item 3. | | |
| Item 4. | | |
| | |
| Part II | | |
| Item 1A. | | |
Item 6.2. | | |
| Item 6. | | |
| | |
| In this Quarterly Report on Form 10-Q, “we”, “our”, “us”, the “Company”, “Manning & Napier” and the “Registrant” refers to Manning & Napier, Inc. and, unless the context otherwise requires, its consolidated direct and indirect subsidiaries and predecessors. | |
PART I—FINANCIAL INFORMATION
Item 1. Financial Statements
Manning & Napier, Inc.
Consolidated Statements of Financial Condition
(InU.S. dollars in thousands, except share data)
| | | | | September 30, 2017 | | December 31, 2016 | | September 30, 2021 | | December 31, 2020 |
| | | (unaudited) | | | | | (unaudited) | | |
| Assets | | | | | Assets | |
| Cash and cash equivalents | | $ | 103,322 |
| | $ | 100,819 |
| Cash and cash equivalents | | $ | 64,567 | | | $ | 57,635 | |
| Accounts receivable | | 11,041 |
| | 15,434 |
| Accounts receivable | | 11,101 | | | 11,915 | |
| Accounts receivable—affiliated mutual funds | | 6,213 |
| | 6,761 |
| |
| Investment securities | | 38,322 |
| | 36,475 |
| Investment securities | | 25,091 | | | 23,497 | |
| Investment securities - consolidated funds | | — |
| | 995 |
| |
| Prepaid expenses and other assets | | 2,977 |
| | 4,883 |
| Prepaid expenses and other assets | | 14,686 | | | 15,711 | |
| Total current assets | | 161,875 |
| | 165,367 |
| Total current assets | | 115,445 | | | 108,758 | |
| Property and equipment, net | | 5,536 |
| | 5,680 |
| Property and equipment, net | | 2,475 | | | 3,075 | |
| Operating lease right-of-use assets | | Operating lease right-of-use assets | | 15,017 | | | 16,405 | |
| Net deferred tax assets, non-current | | 39,563 |
| | 41,905 |
| Net deferred tax assets, non-current | | 20,231 | | | 19,645 | |
| Goodwill | | 4,829 |
| | 4,829 |
| Goodwill | | 4,829 | | | 4,829 | |
| Other long-term assets | | 2,784 |
| | 2,818 |
| Other long-term assets | | 3,154 | | | 3,373 | |
| Total assets | | $ | 214,587 |
| | $ | 220,599 |
| Total assets | | $ | 161,151 | | | $ | 156,085 | |
| | | | | | | | | |
| Liabilities | | | | | Liabilities | |
| Accounts payable | | $ | 1,915 |
| | $ | 2,053 |
| Accounts payable | | $ | 2,221 | | | $ | 1,787 | |
| Accrued expenses and other liabilities | | 25,609 |
| | 35,115 |
| Accrued expenses and other liabilities | | 29,157 | | | 36,439 | |
| Deferred revenue | | 10,326 |
| | 10,210 |
| Deferred revenue | | 13,152 | | | 11,476 | |
| Total current liabilities | | 37,850 |
| | 47,378 |
| Total current liabilities | | 44,530 | | | 49,702 | |
| Operating lease liabilities, non-current | | Operating lease liabilities, non-current | | 14,931 | | | 16,646 | |
| Amounts payable under tax receivable agreement, non-current | | Amounts payable under tax receivable agreement, non-current | | 15,598 | | | 13,759 | |
| Other long-term liabilities | | 3,352 |
| | 4,034 |
| Other long-term liabilities | | 182 | | | 221 | |
| Amounts payable under tax receivable agreement, non-current | | 32,244 |
| | 34,709 |
| |
| Total liabilities | | 73,446 |
| | 86,121 |
| Total liabilities | | 75,241 | | | 80,328 | |
| Commitments and contingencies (Note 8) | |
|
| |
|
| |
| Commitments and contingencies (Note 9) | | Commitments and contingencies (Note 9) | | 0 | | 0 |
| Shareholders’ equity | | | | | Shareholders’ equity | |
| Class A common stock, $0.01 par value; 300,000,000 shares authorized; 15,039,347 and 14,982,880 shares issued and outstanding at September 30, 2017 and December 31, 2016, respectively | | 150 |
| | 150 |
| |
| Class B common stock, $0.01 par value; 2,000 shares authorized, 1,000 shares issued and outstanding at September 30, 2017 and December 31, 2016 | | — |
| | — |
| |
| Class A common stock, $0.01 par value; 300,000,000 shares authorized; 19,214,559 and 18,465,554 shares issued and outstanding at September 30, 2021, 16,989,943 shares issued and outstanding at December 31, 2020 | | Class A common stock, $0.01 par value; 300,000,000 shares authorized; 19,214,559 and 18,465,554 shares issued and outstanding at September 30, 2021, 16,989,943 shares issued and outstanding at December 31, 2020 | | 192 | | | 170 | |
| Treasury stock, at cost, 749,005 and zero shares at September 30, 2021 and December 31, 2020, respectively | | Treasury stock, at cost, 749,005 and zero shares at September 30, 2021 and December 31, 2020, respectively | | (5,666) | | | — | |
| Additional paid-in capital | | 198,536 |
| | 200,158 |
| Additional paid-in capital | | 104,954 | | | 111,848 | |
| Retained deficit | | (35,706 | ) | | (37,383 | ) | Retained deficit | | (12,082) | | | (28,826) | |
| Accumulated other comprehensive income (loss) | | (30 | ) | | (13 | ) | |
| Accumulated other comprehensive loss | | Accumulated other comprehensive loss | | (315) | | | (235) | |
| Total shareholders’ equity | | 162,950 |
| | 162,912 |
| Total shareholders’ equity | | 87,083 | | | 82,957 | |
| Noncontrolling interests | | (21,809 | ) | | (28,434 | ) | Noncontrolling interests | | (1,173) | | | (7,200) | |
| Total shareholders’ equity and noncontrolling interests | | 141,141 |
| | 134,478 |
| Total shareholders’ equity and noncontrolling interests | | 85,910 | | | 75,757 | |
| Total liabilities, shareholders’ equity and noncontrolling interests | | $ | 214,587 |
| | $ | 220,599 |
| Total liabilities, shareholders’ equity and noncontrolling interests | | $ | 161,151 | | | $ | 156,085 | |
The accompanying notes are an integral part of these consolidated financial statements.
Manning & Napier, Inc.
Consolidated Statements of Operations
(InU.S. dollars in thousands, except share data)
(Unaudited)
| | | | | Three months ended September 30, | | Nine months ended September 30, | | | Three months ended September 30, | | Nine months ended September 30, |
| | | 2017 | | 2016 | | 2017 | | 2016 | | 2021 | | 2020 | | 2021 | | 2020 |
| Revenues | | | | | | | | | Revenues | | | | | | | | |
| Investment management services revenue | | $ | 48,838 |
| | $ | 63,305 |
| | $ | 155,859 |
| | $ | 189,852 |
| |
| Management Fees | | Management Fees | |
| Wealth Management | | Wealth Management | | $ | 16,366 | | | $ | 13,743 | | | $ | 47,825 | | | $ | 41,335 | |
| Institutional and Intermediary | | Institutional and Intermediary | | 16,209 | | | 13,534 | | | 45,678 | | | 38,255 | |
| Distribution and shareholder servicing | | Distribution and shareholder servicing | | 2,278 | | | 2,424 | | | 6,667 | | | 7,117 | |
| Custodial services | | Custodial services | | 1,759 | | | 1,577 | | | 5,125 | | | 4,639 | |
| Other revenue | | Other revenue | | 925 | | | 789 | | | 2,470 | | | 2,176 | |
| Total revenue | | Total revenue | | 37,537 | | | 32,067 | | | 107,765 | | | 93,522 | |
| Expenses | | | | | | | | | Expenses | | | | | | | | |
| Compensation and related costs | | 22,287 |
| | 24,627 |
| | 67,901 |
| | 70,973 |
| Compensation and related costs | | 18,749 | | | 18,605 | | | 55,970 | | | 55,247 | |
| Distribution, servicing and custody expenses | | 6,920 |
| | 8,798 |
| | 21,415 |
| | 26,590 |
| Distribution, servicing and custody expenses | | 2,512 | | | 2,596 | | | 7,367 | | | 7,834 | |
| Other operating costs | | 7,887 |
| | 8,188 |
| | 23,099 |
| | 24,854 |
| Other operating costs | | 6,970 | | | 6,611 | | | 21,143 | | | 21,197 | |
| Total operating expenses | | 37,094 |
| | 41,613 |
| | 112,415 |
| | 122,417 |
| Total operating expenses | | 28,231 | | | 27,812 | | | 84,480 | | | 84,278 | |
| Operating income | | 11,744 |
| | 21,692 |
| | 43,444 |
| | 67,435 |
| Operating income | | 9,306 | | | 4,255 | | | 23,285 | | | 9,244 | |
| Non-operating income (loss) | | | | | | | | | Non-operating income (loss) | | | | | | | | |
| Interest expense | | (22 | ) | | (127 | ) | | (34 | ) | | (339 | ) | Interest expense | | (1) | | | — | | | (4) | | | (5) | |
| Interest and dividend income | | 191 |
| | 141 |
| | 609 |
| | 457 |
| Interest and dividend income | | (13) | | | 115 | | | 218 | | | 835 | |
| Change in liability under tax receivable agreement | | (33 | ) | | (76 | ) | | (33 | ) | | (94 | ) | Change in liability under tax receivable agreement | | — | | | 24 | | | (228) | | | (1,912) | |
| Net gains (losses) on investments | | 711 |
| | (80 | ) | | 2,293 |
| | 1,192 |
| Net gains (losses) on investments | | (59) | | | 411 | | | 655 | | | (5) | |
| Total non-operating income (loss) | | 847 |
| | (142 | ) | | 2,835 |
| | 1,216 |
| Total non-operating income (loss) | | (73) | | | 550 | | | 641 | | | (1,087) | |
| Income before provision for income taxes | | 12,591 |
| | 21,550 |
| | 46,279 |
| | 68,651 |
| |
| Provision for income taxes | | 739 |
| | 1,565 |
| | 3,324 |
| | 4,784 |
| |
| Income before provision for (benefit from) income taxes | | Income before provision for (benefit from) income taxes | | 9,233 | | | 4,805 | | | 23,926 | | | 8,157 | |
| Provision for (benefit from) income taxes | | Provision for (benefit from) income taxes | | 2,523 | | | 1,738 | | | 4,511 | | | (28) | |
| Net income attributable to controlling and noncontrolling interests | | 11,852 |
| | 19,985 |
| | 42,955 |
| | 63,867 |
| Net income attributable to controlling and noncontrolling interests | | 6,710 | | | 3,067 | | | 19,415 | | | 8,185 | |
| Less: net income attributable to noncontrolling interests | | 10,331 |
| | 17,727 |
| | 37,852 |
| | 56,586 |
| Less: net income attributable to noncontrolling interests | | 207 | | | 560 | | | 1,747 | | | 3,274 | |
| Net income attributable to Manning & Napier, Inc. | | $ | 1,521 |
| | $ | 2,258 |
| | $ | 5,103 |
| | $ | 7,281 |
| Net income attributable to Manning & Napier, Inc. | | $ | 6,503 | | | $ | 2,507 | | | $ | 17,668 | | | $ | 4,911 | |
| | | | | | | | | | | | | | | | | |
| Net income per share available to Class A common stock | | | | | | | | | Net income per share available to Class A common stock | |
| Basic | | $ | 0.10 |
| | $ | 0.15 |
| | $ | 0.35 |
| | $ | 0.49 |
| Basic | | $ | 0.35 | | | $ | 0.15 | | | $ | 1.01 | | | $ | 0.30 | |
| Diluted | | $ | 0.10 |
| | $ | 0.15 |
| | $ | 0.35 |
| | $ | 0.48 |
| Diluted | | $ | 0.29 | | | $ | 0.13�� | | | $ | 0.85 | | | $ | 0.15 | |
| Weighted average shares of Class A common stock outstanding | | | | | | | | | Weighted average shares of Class A common stock outstanding | | | | | | | | |
| Basic | | 14,249,347 |
| | 14,042,880 |
| | 14,135,288 |
| | 13,916,721 |
| Basic | | 18,481,147 | | | 16,176,280 | | | 17,493,299 | | | 16,041,128 | |
| Diluted | | 78,210,019 |
| | 14,175,321 |
| | 14,241,642 |
| | 14,173,283 |
| Diluted | | 22,226,455 | | | 18,928,954 | | | 20,843,170 | | | 48,339,759 | |
| Cash dividends declared per share of Class A common stock | | $ | 0.08 |
| | $ | 0.16 |
| | $ | 0.24 |
| | $ | 0.48 |
| |
The accompanying notes are an integral part of these consolidated financial statements.
Manning & Napier, Inc.
Consolidated Statements of Comprehensive Income
(InU.S. dollars in thousands)
(Unaudited)
| | | | | | | | | | | | | | | | | | | | | | | | | | |
| | | Three months ended September 30, | | Nine months ended September 30, |
| | 2021 | | 2020 | | 2021 | | 2020 |
| Net income attributable to controlling and noncontrolling interests | | $ | 6,710 | | | $ | 3,067 | | | $ | 19,415 | | | $ | 8,185 | |
| Net unrealized holding gains (losses) on investment securities, net of tax | | (34) | | | 6 | | | (87) | | | (243) | |
| Reclassification adjustment for net realized gains on investment securities included in net income | | (75) | | | — | | | (1) | | | (174) | |
| Comprehensive income | | $ | 6,601 | | | $ | 3,073 | | | $ | 19,327 | | | $ | 7,768 | |
| Less: Comprehensive income attributable to noncontrolling interests | | 130 | | | 639 | | | 1,739 | | | 2,992 | |
| Comprehensive income attributable to Manning & Napier, Inc. | | $ | 6,471 | | | $ | 2,434 | | | $ | 17,588 | | | $ | 4,776 | |
|
| | | | | | | | | | | | | | | | |
| | | Three months ended September 30, | | Nine months ended September 30, |
| | | 2017 | | 2016 | | 2017 | | 2016 |
| Net income attributable to controlling and noncontrolling interests | | $ | 11,852 |
| | $ | 19,985 |
| | $ | 42,955 |
| | $ | 63,867 |
|
| Net unrealized holding gain (loss) on investment securities, net of tax | | (2 | ) | | 1 |
| | (17 | ) | | 7 |
|
| Comprehensive income | | $ | 11,850 |
| | $ | 19,986 |
| | $ | 42,938 |
| | $ | 63,874 |
|
| Less: Comprehensive income attributable to noncontrolling interests | | 10,329 |
| | 17,728 |
| | 37,835 |
| | 56,593 |
|
| Comprehensive income attributable to Manning & Napier, Inc. | | $ | 1,521 |
| | $ | 2,258 |
| | $ | 5,103 |
| | $ | 7,281 |
|
The accompanying notes are an integral part of these consolidated financial statements.
Manning & Napier, Inc.
Consolidated Statements of Shareholders’ Equity
(InU.S. dollars in thousands, except share data)
(Unaudited)
| | | | | | | | | | | | | | | | | | | | | | | | | | | | | | | | | | | | | | | | | | | | | | | | | | | | | |
| | | | | | | | | | | | | | | | | |
| | Common Stock – Class A | | Treasury Stock | | Additional
Paid in Capital | | Retained
Deficit | | Accumulated
Other
Comprehensive Income (Loss) | | Non
Controlling
Interests | | |
| Shares | | Amount | | Shares | | Amount | | | | | | Total |
| Three months ended September 30, 2021 | | | | | | | | | | | | | | | | | |
| Balance—June 30, 2021 | 18,493,570 | | | $ | 192 | | | 713,665 | | | $ | (5,337) | | | $ | 104,402 | | | $ | (17,661) | | | $ | (284) | | | $ | (1,301) | | | $ | 80,011 | |
| Net income | — | | | — | | | — | | | — | | | — | | | 6,503 | | | — | | | 207 | | | 6,710 | |
| Distributions to noncontrolling interests | — | | | — | | | — | | | — | | | — | | | — | | | — | | | (81) | | | (81) | |
| Net changes in unrealized investment securities gains or losses | — | | | — | | | — | | | — | | | — | | | — | | | (31) | | | (3) | | | (34) | |
| Common stock issued under equity compensation plan, net of forfeitures | 7,324 | | | — | | | — | | | — | | | — | | | — | | | — | | | — | | | — | |
| Shares withheld to satisfy tax withholding requirements related to equity awards | — | | | — | | | — | | | — | | | 35 | | | — | | | — | | | (77) | | | (42) | |
| Equity-based compensation | — | | | — | | | — | | | — | | | 558 | | | — | | | — | | | 82 | | | 640 | |
| Dividends declared on Class A common stock - $0.05 per share | — | | | — | | | — | | | — | | | — | | | (924) | | | — | | | — | | | (924) | |
| Purchases of treasury stock | (35,340) | | | — | | | 35,340 | | | (329) | | | — | | | — | | | — | | | — | | | (329) | |
| Cost of issuing common stock | — | | | — | | | — | | | — | | | (41) | | | — | | | — | | | — | | | (41) | |
| | | | | | | | | | | | | | | | | |
| | | | | | | | | | | | | | | | | |
| Balance—September 30, 2021 | 18,465,554 | | | $ | 192 | | | 749,005 | | | $ | (5,666) | | | $ | 104,954 | | | $ | (12,082) | | | $ | (315) | | | $ | (1,173) | | | $ | 85,910 | |
| | | | | | | | | | | | | | | | | |
| Nine months ended September 30, 2021 | | | | | | | | | | | | | | | | | |
| Balance—December 31, 2020 | 16,989,943 | | | $ | 170 | | | — | | | $ | — | | | $ | 111,848 | | | $ | (28,826) | | | $ | (235) | | | $ | (7,200) | | | $ | 75,757 | |
| Net income | — | | | — | | | — | | | — | | | — | | | 17,668 | | | — | | | 1,747 | | | 19,415 | |
| Distributions to noncontrolling interests | — | | | — | | | — | | | — | | | — | | | — | | | — | | | (652) | | | (652) | |
| Net changes in unrealized investment securities gains or losses | — | | | — | | | — | | | — | | | — | | | — | | | (80) | | | (7) | | | (87) | |
| Common stock issued under equity compensation plan, net of forfeitures | 631,647 | | | 6 | | | — | | | — | | | (6) | | | — | | | — | | | — | | | — | |
| Shares withheld to satisfy tax withholding requirements related to equity awards | — | | | — | | | — | | | — | | | (4,779) | | | — | | | — | | | (419) | | | (5,198) | |
| Equity-based compensation | — | | | — | | | — | | | — | | | 2,521 | | | — | | | — | | | 221 | | | 2,742 | |
| Dividends declared on Class A common stock - $0.05 per share | — | | | — | | | — | | | — | | | — | | | (924) | | | — | | | — | | | (924) | |
| Cost of issuing common stock | — | | | — | | | — | | | — | | | (97) | | | — | | | — | | | — | | | (97) | |
| Purchases of treasury stock | (749,005) | | | — | | | 749,005 | | | (5,666) | | | — | | | — | | | — | | | — | | | (5,666) | |
| Impact of changes in ownership of Manning & Napier Group, LLC (Note 4) | 1,592,969 | | | 16 | | | — | | | — | | | (5,153) | | | — | | | — | | | 5,137 | | | — | |
| Deferred tax impacts from transactions with shareholders (Note 4) | — | | | — | | | — | | | — | | | 620 | | | — | | | — | | | — | | | 620 | |
| Balance—September 30, 2021 | 18,465,554 | | | $ | 192 | | | 749,005 | | | $ | (5,666) | | | $ | 104,954 | | | $ | (12,082) | | | $ | (315) | | | $ | (1,173) | | | $ | 85,910 | |
| | | | | Common Stock – Class A | | Treasury Stock | Additional
Paid in Capital | | Retained
Deficit | | Accumulated
Other
Comprehensive Income (Loss) | | Non
Controlling
Interests | | |
| | | Shares | | Amount | | Shares | | Amount | | Total |
| Three months ended September 30, 2020 | | Three months ended September 30, 2020 | | | | | | | | | | | | | | | | | |
| Balance—June 30, 2020 | | Balance—June 30, 2020 | 16,275,359 | | | $ | 163 | | | $ | — | | | $ | — | | | $ | 112,300 | | | $ | (36,407) | | | $ | (112) | | | $ | (6,852) | | | $ | 69,092 | |
| Net income | | Net income | — | | | — | | | — | | | — | | | — | | | 2,507 | | | — | | | 560 | | | 3,067 | |
| Distributions to noncontrolling interests | | Distributions to noncontrolling interests | — | | | — | | | — | | | — | | | — | | | — | | | — | | | (177) | | | (177) | |
| Net changes in unrealized investment securities gains or losses | | Net changes in unrealized investment securities gains or losses | — | | | — | | | — | | | — | | | — | | | — | | | (73) | | | 79 | | | 6 | |
| Common stock issued under equity compensation plan, net of forfeitures | | Common stock issued under equity compensation plan, net of forfeitures | 215,473 | | | 2 | | | — | | | — | | | (2) | | | — | | | — | | | — | | | — | |
| Shares withheld to satisfy tax withholding requirements related to equity awards | | Shares withheld to satisfy tax withholding requirements related to equity awards | — | | | — | | | — | | | — | | | (565) | | | — | | | — | | | (455) | | | (1,020) | |
| Equity-based compensation | | Equity-based compensation | — | | | — | | | — | | | — | | | 1,108 | | | — | | | — | | | (278) | | | 830 | |
| | | | | Common Stock – class A | | Common Stock – class B | | Additional Paid in Capital | | Retained Deficit | | Accumulated Other Comprehensive Income (Loss) | | Non Controlling Interests | | | |
| | | Shares | | Amount | | Shares | | Amount | | Total | |
| Balance—December 31, 2015 | | 14,755,130 |
| | $ | 148 |
| | 1,000 |
| | $ | — |
| | $ | 205,760 |
| | $ | (37,149 | ) | | $ | (3 | ) | | $ | (33,976 | ) | | $ | 134,780 |
| |
| Net income | | — |
| | — |
| | — |
| | — |
| | — |
| | 7,281 |
| | — |
| | 56,586 |
| | 63,867 |
| |
| Distributions to noncontrolling interests | | — |
| | — |
| | — |
| | — |
| | — |
| | — |
| | — |
| | (34,153 | ) | | (34,153 | ) | |
| Net changes in unrealized investment securities gains or losses | | — |
| | — |
| | — |
| | — |
| | — |
| | — |
| | 7 |
| | — |
| | 7 |
| |
| Common stock issued under equity compensation plan | | 277,750 |
| | 2 |
| | — |
| | — |
| | (2 | ) | | — |
| | — |
| | — |
| | — |
| |
| Shares withheld to satisfy tax withholding requirements related to restricted stock units granted | | — |
| | — |
| | — |
| | — |
| | (162 | ) | | — |
| | — |
| | (791 | ) | | (953 | ) | |
| Equity-based compensation | | — |
| | — |
| | — |
| | — |
| | 433 |
| | — |
| | — |
| | 2,102 |
| | 2,535 |
| |
| Dividends declared on Class A common stock - $0.48 per share | | — |
| | — |
| | — |
| | — |
| | — |
| | (7,159 | ) | | — |
| | — |
| | (7,159 | ) | |
| Impact of changes in ownership of Manning & Napier Group, LLC | | — |
| | — |
| | — |
| | — |
| | (2,144 | ) | | — |
| | — |
| | (13,991 | ) | | (16,135 | ) | |
| Balance—September 30, 2016 | | 15,032,880 |
| | $ | 150 |
| | 1,000 |
| | $ | — |
| | $ | 203,885 |
| | $ | (37,027 | ) | | $ | 4 |
| | $ | (24,223 | ) | | $ | 142,789 |
| |
| Balance—September 30, 2020 | | Balance—September 30, 2020 | 16,490,832 | | | $ | 165 | | | — | | | — | | | $ | 112,841 | | | $ | (33,900) | | | $ | (185) | | | $ | (7,123) | | | $ | 71,798 | |
| | | | | | | | | | | | | | | | | | | | | | | | | | | | | | | | | | | | | |
| Balance—December 31, 2016 | | 14,982,880 |
| | $ | 150 |
| | 1,000 |
| | $ | — |
| | $ | 200,158 |
| | $ | (37,383 | ) | | $ | (13 | ) | | $ | (28,434 | ) | | $ | 134,478 |
| |
| Nine months ended September 30, 2020 | | Nine months ended September 30, 2020 | |
| Balance—December 31, 2019 | | Balance—December 31, 2019 | 15,956,526 | | | $ | 160 | | | $ | — | | | $ | — | | | $ | 198,516 | | | $ | (38,478) | | | $ | (50) | | | $ | (10,527) | | | $ | 149,621 | |
| Net income | | — |
| | — |
| | — |
| | — |
| | — |
| | 5,103 |
| | — |
| | 37,852 |
| | 42,955 |
| Net income | — | | | — | | | — | | | — | | | — | | | 4,911 | | | — | | | 3,274 | | | 8,185 | |
| Distributions to noncontrolling interests | | — |
| | — |
| | — |
| | — |
| | — |
| | — |
| | — |
| | (24,490 | ) | | (24,490 | ) | Distributions to noncontrolling interests | — | | | — | | | — | | | — | | | — | | | — | | | — | | | (177) | | | (177) | |
| Net changes in unrealized investment securities gains or losses | | — |
| | — |
| | — |
| | — |
| | — |
| | — |
| | (17 | ) | | — |
| | (17 | ) | Net changes in unrealized investment securities gains or losses | — | | | ��� | | | — | | | — | | | — | | | — | | | (135) | | | (108) | | | (243) | |
| Common stock issued under equity compensation plan, net of forfeitures | | 56,467 |
| | — |
| | — |
| | — |
| | — |
| | — |
| | — |
| | — |
| | — |
| Common stock issued under equity compensation plan, net of forfeitures | 534,306 | | | 5 | | | — | | | — | | | (5) | | | — | | | — | | | — | | | — | |
| Shares withheld to satisfy tax withholding requirements related to restricted stock units vested | | — |
| | — |
| | — |
| | — |
| | (48 | ) | | — |
| | — |
| | (224 | ) | | (272 | ) | |
| Shares withheld to satisfy tax withholding requirements related to equity awards | | Shares withheld to satisfy tax withholding requirements related to equity awards | — | | | — | | | — | | | — | | | (565) | | | — | | | — | | | (457) | | | (1,022) | |
| Equity-based compensation | | — |
| | — |
| | — |
| | — |
| | 304 |
| | — |
| | — |
| | 1,412 |
| | 1,716 |
| Equity-based compensation | — | | | — | | | — | | | — | | | 1,630 | | | — | | | — | | | 1,315 | | | 2,945 | |
| Dividends declared on Class A common stock - $0.24 per share | | — |
| | — |
| | — |
| | — |
| | — |
| | (3,426 | ) | | — |
| | — |
| | (3,426 | ) | |
| Impact of changes in ownership of Manning & Napier Group, LLC (Note 4) | | — |
| | — |
| | — |
| | — |
| | (1,878 | ) | | — |
| | — |
| | (7,925 | ) | | (9,803 | ) | |
| Balance—September 30, 2017 | | 15,039,347 |
| | $ | 150 |
| | 1,000 |
| | $ | — |
| | $ | 198,536 |
| | $ | (35,706 | ) | | $ | (30 | ) | | $ | (21,809 | ) | | $ | 141,141 |
| |
| Dividends declared on Class A common stock - $0.02 per share | | Dividends declared on Class A common stock - $0.02 per share | — | | | — | | | — | | | — | | | — | | | (333) | | | — | | | — | | | (333) | |
| Impact of changes in ownership of Manning & Napier Group, LLC | | Impact of changes in ownership of Manning & Napier Group, LLC | — | | | — | | | — | | | — | | | (90,341) | | | — | | | — | | | (443) | | | (90,784) | |
| Deferred tax impacts from transactions with shareholders | | Deferred tax impacts from transactions with shareholders | | 3,606 | | | 3,606 | |
| Balance—September 30, 2020 | | Balance—September 30, 2020 | 16,490,832 | | | $ | 165 | | | — | | | $ | — | | | $ | 112,841 | | | $ | (33,900) | | | $ | (185) | | | $ | (7,123) | | | $ | 71,798 | |
|
The accompanying notes are an integral part of these consolidated financial statements.
Manning & Napier, Inc.
Consolidated Statements of Cash Flows
(InU.S. dollars in thousands)
(Unaudited)
| | | | | Nine months ended September 30, | | | Nine months ended September 30, |
| | | 2017 | | 2016 | | 2021 | | 2020 |
| Cash flows from operating activities: | | | | | Cash flows from operating activities: | | | | |
| Net income attributable to controlling and noncontrolling interests | | $ | 42,955 |
| | $ | 63,867 |
| Net income attributable to controlling and noncontrolling interests | | $ | 19,415 | | | $ | 8,185 | |
| Adjustment to reconcile net income to net cash provided by operating activities: | | | | | Adjustment to reconcile net income to net cash provided by operating activities: | |
| Equity-based compensation | | 1,716 |
| | 2,535 |
| Equity-based compensation | | 2,742 | | | 2,945 | |
| Depreciation and amortization | | 1,328 |
| | 1,952 |
| Depreciation and amortization | | 1,472 | | | 1,147 | |
| Change in amounts payable under tax receivable agreement | | 33 |
| | 94 |
| Change in amounts payable under tax receivable agreement | | 228 | | | 1,912 | |
| Change in contingent consideration liability | | — |
| | (500 | ) | |
| Net (gains) losses on investment securities | | (2,293 | ) | | (1,192 | ) | |
| Impairment of long-lived assets | | Impairment of long-lived assets | | — | | | 663 | |
| Gain on sale of intangible assets | | Gain on sale of intangible assets | | — | | | (21) | |
| | Net losses (gains) on investment securities | | Net losses (gains) on investment securities | | (655) | | | 5 | |
| Deferred income taxes | | 2,342 |
| | 2,212 |
| Deferred income taxes | | 1,644 | | | (789) | |
| Amortization of debt issuance costs | | — |
| | 117 |
| |
| (Increase) decrease in operating assets and increase (decrease) in operating liabilities: | | | | | (Increase) decrease in operating assets and increase (decrease) in operating liabilities: | |
| Accounts receivable | | 4,073 |
| | 2,011 |
| Accounts receivable | | 979 | | | (683) | |
| Accounts receivable—affiliated mutual funds | | 548 |
| | 1,862 |
| |
| Due from broker - consolidated funds | | — |
| | 3,795 |
| |
| Prepaid expenses and other assets | | 1,907 |
| | 1,238 |
| Prepaid expenses and other assets | | 386 | | | (3,429) | |
| Other long-term assets | | Other long-term assets | | 1,894 | | | 2,450 | |
| Accounts payable | | (138 | ) | | (349 | ) | Accounts payable | | 434 | | | 1,112 | |
| Accrued expenses and other liabilities | | (10,599 | ) | | (12,196 | ) | Accrued expenses and other liabilities | | (6,667) | | | (165) | |
| Deferred revenue | | 116 |
| | (68 | ) | Deferred revenue | | 1,676 | | | 699 | |
| Other long-term liabilities | | (671 | ) | | (8 | ) | Other long-term liabilities | | (2,374) | | | (2,832) | |
| Net cash provided by operating activities | | 41,317 |
| | 65,370 |
| Net cash provided by operating activities | | 21,175 | | | 11,199 | |
| Cash flows from investing activities: | | | | | Cash flows from investing activities: | | | | |
| Purchase of property and equipment | | (1,057 | ) | | (240 | ) | Purchase of property and equipment | | (222) | | | (204) | |
| Sale of investments | | 12,871 |
| | 9,033 |
| Sale of investments | | 6,190 | | | 71,310 | |
| Purchase of investments | | (38,510 | ) | | (4,229 | ) | Purchase of investments | | (10,565) | | | (23,250) | |
| Due from broker | | — |
| | 4,022 |
| |
| Sale of intangible assets | | Sale of intangible assets | | — | | | 21 | |
| | Proceeds from maturity of investments | | 27,063 |
| | — |
| Proceeds from maturity of investments | | 3,350 | | | 18,720 | |
| Acquisitions, net of cash received | | 320 |
| | (9,321 | ) | |
| Net cash provided by (used in) investing activities | | 687 |
| | (735 | ) | |
| | Net cash (used in) provided by investing activities | | Net cash (used in) provided by investing activities | | (1,246) | | | 66,597 | |
| Cash flows from financing activities: | | | | | Cash flows from financing activities: | | | | |
| Distributions to noncontrolling interests | | (24,490 | ) | | (34,153 | ) | Distributions to noncontrolling interests | | (652) | | | (177) | |
| Dividends paid on Class A common stock | | (4,802 | ) | | (7,123 | ) | Dividends paid on Class A common stock | | (924) | | | (645) | |
| Payment of shares withheld to satisfy withholding requirements | | (272 | ) | | (953 | ) | Payment of shares withheld to satisfy withholding requirements | | (5,644) | | | (1,022) | |
| Purchases of treasury stock | | Purchases of treasury stock | | (5,666) | | | — | |
| Payment of capital lease obligations | | (134 | ) | | (154 | ) | Payment of capital lease obligations | | (54) | | | (81) | |
| Payment of issuing common stock costs | | Payment of issuing common stock costs | | (56) | | | — | |
| Purchase of Class A units of Manning & Napier Group, LLC | | (9,803 | ) | | (16,135 | ) | Purchase of Class A units of Manning & Napier Group, LLC | | — | | | (90,784) | |
| | Net cash used in financing activities | | (39,501 | ) | | (58,518 | ) | Net cash used in financing activities | | (12,997) | | | (92,709) | |
| | Net increase (decrease) in cash and cash equivalents | | 2,503 |
| | 6,117 |
| Net increase (decrease) in cash and cash equivalents | | 6,932 | | | (14,913) | |
| Cash and cash equivalents: | | | | | Cash and cash equivalents: | |
| Beginning of period | | 100,819 |
| | 117,591 |
| Beginning of period | | 57,635 | | | 67,088 | |
| End of period | | $ | 103,322 |
| | $ | 123,708 |
| End of period | | $ | 64,567 | | | $ | 52,175 | |
The accompanying notes are an integral part of these consolidated financial statements.
Manning & Napier, Inc.
Notes to Consolidated Financial Statements
Note 1—Organization and Nature of the Business
Manning & Napier, Inc. ("Manning & Napier", or the "Company") is an independent investment management firm that provides our clients with a broad range of financial solutions and investment solutions through separately managed accounts, mutual funds, and collective investment trusts, as well as a variety of consultative services that complement its investment process.strategies. Founded in 1970 the Company offers U.S. and non-U.S. equity, fixed income and a range of blended asset portfolios, such as life cycle funds and actively-managed exchange-traded fund ("ETF")-based portfolios. Headquarteredheadquartered in Fairport, New York,NY, the Company serves a diversified client base of high net worthhigh-net-worth individuals and institutions, including 401(k) plans, pension plans, Taft-Hartley plans, endowments and foundations. The Company's investment strategies offer equity, fixed income and a range of blended asset portfolios, including life cycle funds.
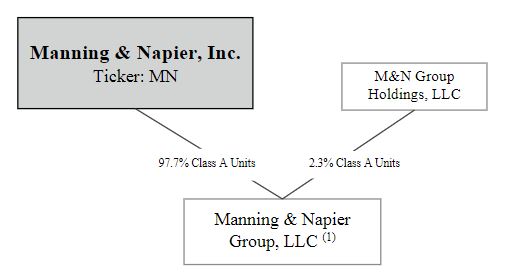
The Company was incorporated in 2011 as a Delaware corporation, and is the sole managing member of Manning & Napier Group, LLC and its subsidiaries ("(“Manning & Napier Group"Group”), a holding company for the investment management businesses conducted by its operating subsidiaries. The Company completed the exchange of 1,562,959 Class A units held by M&N Group Holdings, LLC ("M&N Group Holdings") and 30,010 Class A units held by Manning & Napier Capital Company, LLC ("MNCC"), the entirety of its ownership in Manning & Napier Group, on June 30, 2021 through the issuance of 1,592,969 shares of unregistered Class A Common Stock of the Company. As a result, Manning & Napier acquired an equivalent number of Class A units of Manning & Napier Group and its ownership of Manning & Napier Group increased from approximately 89.0% to 97.7% (Refer to Note 4 for further discussion). The diagram below depicts the Company's organizationorganizational structure as of September 30, 2017.2021.

| |
(1) | The consolidated operating subsidiaries of Manning & Napier Group include Manning & Napier Advisors, LLC ("MNA"), Manning & Napier Alternative Opportunities, LLC, Perspective Partners LLC, Manning & Napier Information Services, LLC, Manning & Napier Benefits, LLC, Manning & Napier Investor Services, Inc., Exeter Trust Company and Rainier Investment Management, LLC. |
| |
(2) | On November 17, 2017, all outstanding shares of the Company's Class B common stock will be automatically, without any further action on the Company's part or the holder of the shares of the Company's Class B common stock, canceled and will revert to the status of authorized but unissued shares of Class B common stock. |
(1)The consolidated operating subsidiaries of Manning & Napier Group include Manning & Napier Advisors, LLC ("MNA"), Manning & Napier Investor Services, Inc., Exeter Trust Company and Rainier Investment Management, LLC ("Rainier"). Note 2—Summary of Significant Accounting Policies
Critical Accounting Policies
There have been no significant changes in ourThe Company's critical accounting policies and estimates from those that wereare disclosed in ourits Annual Report on Form 10-K for the year ended December 31, 2016.
Manning & Napier, Inc.
Notes to Consolidated Financial Statements (Continued)
2020. The Company believes that the disclosures herein are adequate so that the information presented is not misleading; however, these financial statements should be read in conjunction with the financial statements and the notes thereto in ourthe Company's Annual Report on Form 10-K for the year ended December 31, 2016.2020. The financial data for the interim periods may not necessarily be indicative of results for future interim periods or for the full year.
Basis of Presentation
The accompanying unaudited consolidated financial statements were prepared in accordance with accounting principles generally accepted in the United States of America (“U.S. GAAP”) and related rules and regulations of the U.S. Securities and Exchange Commission (“SEC”) for interim financial reporting and include all adjustments, consisting only of normal recurring adjustments which are, in the opinion of management, necessary for a fair statement of the results for the interim period.
The preparation of financial statements in conformity with U.S. GAAP requires management to make estimates or assumptions that affect the reported amounts and disclosures in the consolidated financial statements. Actual results could differ from these estimates or assumptions.
Manning & Napier, Inc.
Notes to Consolidated Financial Statements (Continued)
Principles of Consolidation
The Company consolidates all majority-owned subsidiaries. In addition, asAs of September 30, 2017,2021, Manning & Napier holds an economic interest of approximately 17.8%97.7% in Manning & Napier Group but,and, as managing member, controls all of the business and affairs of Manning & Napier Group. As a result, the Company consolidates the financial results of Manning & Napier Group and records a noncontrolling interest on its consolidated statements of financial condition with respect to the remaining economic interest in Manning & Napier Group held by Manning & Napier Group Holdings, LLC (“M&N Group Holdings”) and Manning & Napier Capital Company, LLC (“MNCC”).Holdings.
All material intercompany transactions have been eliminated in consolidation.
In accordance with Accounting Standards Update ("ASU") 2015-02, Consolidation (Topic 810) – Amendments to the Consolidation Analysis, the determination of whether a company is required to consolidate an entity is based on, among other things, an entity’s purpose and design, a company’s ability to direct the activities of the entity that most significantly impact the entity’s economic performance, and whether a company is obligated to absorb losses or receive benefits that could potentially be significant to the entity. The standard also requires ongoing assessments of whether a company is the primary beneficiary of a variable interest entity (“VIE”). When utilizing the voting interest entity ("VOE") model, controlling financial interest is generally defined as majority ownership of voting interests.
The Company provides seed capital to its investment teams to develop new productsstrategies and services for its clients. The original seed investment may be held in a separately managed account, comprised solely of the Company's investments or within a mutual fund, where the Company's investments may represent all or only a portion of the total equity investment in the mutual fund. Pursuant to U.S. GAAP, the Company evaluates its investments in mutual funds on a regular basis and consolidates such mutual funds for which it holds a controlling financial interest. When no longer deemed to hold a controlling financial interest, the Company would deconsolidate the fund and classify the remaining investment as either an equity method investment, equity investments, at fair value, or as trading securities, as applicable. As of September 30, 2021 and December 31, 2020, the Company did not have investments classified as an equity method investment.
The Company serves as the investment adviser for Manning & Napier Fund, Inc. series of mutual funds (the “Fund”), Exeter Trust Company Collective Investment Trusts (“CIT”), Rainier Investment Management Mutual Funds and Rainier Multiple Investment Trust. The Fund, CIT Rainier Investment Management Mutual Funds and Rainier Multiple Investment Trust are legal entities, the business and affairs of which are managed by their respective boards of directors. As a result, each of these entities is a VOE. The Company holds, in limited cases, direct investments in a mutual fund (which are made on the same terms as are available to other investors) and consolidates each of these entities where it has a controlling financial interest or a majority voting interest. The Company's investments in the Fund amounted to approximately $1.5$2.0 million as of September 30, 20172021 and $1.3$1.0 million as of December 31, 2016.2020. As of September 30, 2021 and December 31, 2016,2020, the Company maintaineddid not have a controlling financial interest in oneany mutual fund, fund.
Revenue
Investment Management: Investment management fees are computed as a percentage of assets under management ("AUM"). The Company's performance obligation is a series of services that form part of a single performance obligation satisfied over time.
Separately managed accounts are paid in advance, typically for a semi-annual or quarterly period, or in arrears, typically for a monthly or quarterly period. When investment management fees are paid in advance, the Company defers the revenue as a contract liability and recognizes it over the applicable period. When investment management fees are paid in arrears, the Company estimates revenue and records a contract asset (accrued accounts receivable) based on AUM as of the most recent month end date.
Mutual funds and collective investment trust investment management revenue is calculated and earned daily based on AUM. Revenue is presented net of cash rebates and fees waived pursuant to contractual expense limitations of the funds. The Company also has agreements with third parties who provide recordkeeping and administrative services for employee benefit plans participating in the collective investment trusts. The Company is acting as an agent on behalf of the employee benefit plan sponsors, therefore, investment management revenue is recorded net of fees paid to third party service providers.
Distribution and shareholder servicing: The Company receives distribution and servicing fees for providing services to its affiliated mutual funds. Revenue is computed and earned daily based on a percentage of AUM. The performance obligation is a series of services that form part of a single performance obligation satisfied over time. The Company has agreements with third parties who provide distribution and administrative services for its mutual funds. The agreements are evaluated to determine whether revenue should be reported gross or net of payments to third-party service providers. The Company controls the services provided and acts as a principal in the relationship. Therefore, distribution and shareholder servicing revenue is recorded gross of fees paid to third parties.
Custodial services: Custodial service fees are calculated as a percentage of the client’s market value with additional fees charged for certain transactions. For the safeguarding and administrative services that are subject to a percentage of market
Manning & Napier, Fund, Inc. Quality Equity Series, and consolidated
Notes to Consolidated Financial Statements (Continued)
value fee, the mutual fund. AsCompany's performance obligation is a series of September 30, 2017, the Company did not maintainservices that form part of a controlling financial interest, but did retain significant influencesingle performance obligation satisfied over time. Revenue for transactions assigned a stand-alone selling price is recognized in the mutual fund,period in which was accountedthe transaction is executed. Custodial service fees are billed monthly in arrears. The Company has agreements with third parties who provide safeguarding, recordkeeping and administrative services for their clients. The Company controls the services provided and acts as an equity method investment.a principal in the relationship. Therefore, custodial service revenue is recorded gross of fees paid to third parties.
Cash and Cash Equivalents
The Company generally considers all highly liquid investments with original maturities of three months or less to be cash equivalents. Cash and cash equivalents are primarily held in operating accounts at major financial institutions and also in money market securities. Cash equivalents are stated at cost, which approximates market value due to the short-term maturity of these investments. The fair value of cash equivalents havehas been classified as Level 1 in accordance with the fair value hierarchy.
Investment Securities
Manning & Napier, Inc.
Notes to Consolidated Financial Statements (Continued)
Investment securities are classified as either equity investments, trading, equity method investments or available-for-sale and are carried at fair value. Fair value is determined based on quoted market prices in active markets for identical or similar instruments.
Investment securities classified as tradingequity investments, at fair value consist of equity securities, fixed income securities and investments in mutual funds for which the Company provides advisory services. Realized and unrealized gains and losses on equity investments, at fair value or trading securities, are recorded in net gains (losses) on investments in the consolidated statements of operations. At September 30, 2017, trading securities consist solely of investments held by the Company to provide initial cash seeding for product development purposes.
Investments classified as equity method investments represent seed investments in which the Company owns between 20-50% of the outstanding voting interests in the affiliated fund or when it is determined that the Company is able to exercise significant influence but not control over the investments. If the seed investment results in significant influence, but not control, the investment will be accounted for as an equity method investment. When using the equity method, the Company recognizes its share of the investee's net income or loss for the period which isapplicable, are recorded in net gains (losses) on investments in the consolidated statements of operations.
Investment securities classified as available-for-sale consist of U.S. Treasury notes and other short-term investments.corporate bonds. Unrealized gains and losses on available-for-sale securities are excluded from earnings and are reported, net of deferred income tax, as a separate component of accumulated other comprehensive income in stockholders’shareholders’ equity until realized. The Company periodically reviews each individual security position that has an unrealized loss, or impairment, to determine if that impairment is other-than-temporary. If impairment is determined to be other-than-temporary, the carrying value of the security will be written down to fair value and the loss will be recognized in earnings. Realized gains and losses on sales of available-for-sale securities are computed on a specific identification basis and are recorded in net gains (losses) on investments in the consolidated statements of operations.
Property, Equipment, Software and EquipmentDepreciation
Property and equipment is presented net of accumulated depreciation of approximately $11.3$12.0 million and $11.6$12.6 million as of September 30, 20172021 and December 31, 2016,2020, respectively.
Capitalized implementation costs for hosting arrangements are included within prepaid expenses and other assets on the Company's statements of financial condition and totaled approximately $6.7 million and $5.3 million, net of accumulated amortization, as of September 30, 2021 and December 31, 2020, respectively.
Goodwill and Intangible Assets
Goodwill represents the excess cost over the fair value of the identifiable net assets of acquired companies. Identifiable intangible assets generally represent the cost of client relationships and investment management agreements acquired as well as trademarks. Goodwill and indefinite-lived assets are tested for impairment annually or more frequently if events or circumstances indicate that the carrying value may not be recoverable. Intangible assets subject to amortization are tested for impairment whenever events or circumstances indicate that the carrying value may not be recoverable. Goodwill and intangible assets require significant management estimate and judgment, including the valuation and expected life determination in connection with the initial purchase price allocation and the ongoing evaluation for impairment.
On May 10, 2017,Leases
The Company determines if an arrangement is a lease at inception. Operating leases are included in operating lease right-of-use ("ROU") assets, accrued expenses and other liabilities and operating lease liabilities, non-current on its consolidated statements of financial condition. Finance leases are included in other long-term assets, accrued expenses and other liabilities, and other long-term liabilities on its consolidated statements of financial condition.
ROU assets represent the Company entered intoCompany's right to use an agreementunderlying asset for the lease term and lease liabilities represent the Company's obligation to sell certain U.S. mutual funds to a third party. The transaction is expected to close duringmake lease payments arising from the fourth quarter of 2017, with the selling pricelease. Operating lease ROU assets and lease liabilities are recognized at commencement date based on the total assets under managementpresent value of lease payments over the lease term. As the Company's leases do not provide an implicit rate, the Company uses its incremental borrowing rate based on the transaction closing date. As of September 30, 2017,information available at commencement date in determining the assets under management for these products was approximately $0.4 billion. The carryingpresent value of lease payments. The incremental borrowing rate, for each identified lease, is the intangible assets for client relationships associated with these products was $0 asrate of September 30, 2017.
Operating Segments
The Company operates in one segment, the investment management industry.
Revenue
The majority of the Company’s revenues are based on fees charged to manage customers’ portfolios. Investment management fees are generally computed as a percentage of assets under management ("AUM") and recognized as earned. Fees for providing investment advisory services are computed and billed in accordance with the provisions of the applicable investment management agreements. For the Company’s separately managed accounts, clients either pay investment management fees in advance, typically for a semi-annual or quarterly period, or in arrears, typically for a monthly or quarterly period. When investment management fees are paid in advance,interest that the Company defers the revenue and recognizes itwould have to pay to borrow on a collateralized basis over the applicable period. When investment management fees are paid in arrears, the Company estimates revenues based on AUM market values as of the most recent month end date, and adjusts to actual when billed. For mutual funds and collective investment trust vehicles, the Company’s fees are calculated and earned daily based on AUM. Investment management fees are presented net of cash rebates and fees waived pursuant to contractual expense limitations of the funds.a similar term. The
The Company is contractually obligated to make payments to certain advisory clients with the intent of providing those clients a discounted fee. In accordance with ASC 605-50, Revenue Recognition - Customer Payments and Incentives, these payments are presented as a reduction to revenue. There were no incentives reported as a reduction to revenue for the three
Manning & Napier, Inc.
Notes to Consolidated Financial Statements (Continued)
operating lease ROU asset is reduced for any lease incentives. The Company's lease terms may include options to extend or terminate the lease when it is reasonably certain that it will exercise that option. Lease expense for lease payments is recognized on a straight-line basis over the lease term.
months endedThe Company has lease agreements with lease and non-lease components, which are combined for all classes of underlying assets.
Treasury Stock
On February 3, 2021, the Board of Directors approved a share repurchase program authorizing the Company to purchase up to $10.0 million of Manning & Napier Inc. Class A common shares through December 31, 2021. As of September 30, 2017, while incentives were $3.4 million2021, the Company had purchased 749,005 shares of Class A common stock for an aggregate price of approximately $5.7 million.
Treasury stock is accounted for under the nine months ended September 30, 2017. Incentives reportedcost method and is included as a reductiondeduction from equity in the Shareholders' Equity section of the consolidated statements of financial condition. Upon any subsequent retirement or resale, the treasury stock account is reduced by the cost of such stock.
Operating Segments
The Company operates in 1 segment, the investment management industry.
Recent Accounting Pronouncements
In December 2019, the Financial Accounting Standards Board ("FASB") issued ASU 2019-12, Simplifying the Accounting for Income Taxes, which is intended to simplify various aspects of the income tax accounting guidance, including interim-period accounting for enacted changes in the tax law. ASU 2019-12 is effective for public business entities for fiscal years beginning after December 15, 2020, including interim periods within those fiscal years, and early adoption is permitted. The adoption of this ASU as of January 1, 2021 did not have a material impact on the Company's consolidated financial statements.
Note 3—Revenue
Disaggregated Revenue
The following table represents the Company’s wealth management and institutional and intermediary investment management revenue were $3.3 million and $8.9 million forby investment portfolio during the three and nine months ended September 30, 2016, respectively.2021 and 2020:
The Company has agreements with third parties who provide distribution and administrative services for its mutual funds, collective investment trusts and certain separately managed accounts. Third party agreements are evaluated against ASC 605-45 Revenue Recognition - Principal Agent Considerations to determine whether revenue should be reported gross or net of payments to third-party service providers. In management's judgment there are various indicators that support gross revenue reporting, the most notable being the Company acts as primary obligor and therefore principal service provider. Based on this evaluation, investment management service revenue is recorded gross of distribution and administrative fees paid to third parties. | | | | | | | | | | | | | | | | | | | | | | | | | | | | | | | | | | | | | | |
| | Three months ended September 30, 2021 | | Three months ended September 30, 2020 |
| | Wealth Management | | Institutional and Intermediary | | Total | | Wealth Management | | Institutional and Intermediary | | Total |
| | (in thousands) |
| Blended Asset | | $ | 14,865 | | | $ | 8,689 | | | 23,554 | | | $ | 12,117 | | | $ | 8,261 | | | $ | 20,378 | |
| Equity | | 1,394 | | | 7,071 | | | 8,465 | | | 1,450 | | | 4,892 | | | 6,342 | |
| Fixed Income | | 107 | | | 449 | | | 556 | | | 176 | | | 381 | | | 557 | |
| Total | | 16,366 | | | $ | 16,209 | | | $ | 32,575 | | | $ | 13,743 | | | $ | 13,534 | | | $ | 27,277 | |
| | | | | | | | | | | | |
| | | Nine months ended September 30, 2021 | | Nine months ended September 30, 2020 |
| | Wealth Management | | Institutional and Intermediary | | Total | | Wealth Management | | Institutional and Intermediary | | Total |
| | | (in thousands) |
| Blended Asset | | $ | 42,714 | | | $ | 25,103 | | | $ | 67,817 | | | $ | 36,044 | | | $ | 24,096 | | | $ | 60,140 | |
| Equity | | 4,786 | | | 19,310 | | | 24,096 | | | 4,800 | | | 13,141 | | | 17,941 | |
| Fixed Income | | 325 | | | 1,265 | | | 1,590 | | | 491 | | | 1,018 | | | 1,509 | |
| Total | | $ | 47,825 | | | $ | 45,678 | | | $ | 93,503 | | | $ | 41,335 | | | $ | 38,255 | | | $ | 79,590 | |
Advisory Agreements
The Company derives significant revenue from its role as advisor to affiliated mutual funds and collective investment trusts. Fees earned for advisory related services were approximately $19.4 million and $64.6 million for the three and nine months ended September 30, 2017, respectively, and $28.8 million and $86.7 million for the three and nine months ended September 30, 2016, respectively, which represents greater than 10% of the Company's revenue in each period.10
Recent Accounting Pronouncements
In May 2014, the FASB issued ASU 2014-09, Revenue from Contracts with Customers (Topic 606), which supersedes existing accounting standards for revenue recognition and creates a single framework. The revenue standard contains principals that will be applied to determine the measurement of revenue and timing of recognition and also impacts the accounting for incremental costs to obtain a contract. We will adopt the new standard on its effective date of January 1, 2018. While we have not identified material changes in the timing of revenue recognition, we continue to evaluate the presentation of certain revenue related costs on a gross versus net basis. We anticipate that certain first year costs associated with new investment management contracts will be capitalized and amortized over an estimated customer contract period. We have not yet determined whether we will adopt the standard using the retrospective approach with adjustment to each prior period or modified retrospective approach with the cumulative effect of initial application recognized at the date of initial application.
In January 2016, the FASB issued ASU 2016-01, Recognition and Measurement of Financial Assets and Financial Liabilities, which requires all equity investments to be measured at fair value with changes in the fair value recognized through net income. ASU 2016-01 will be effective on January 1, 2018 and will result in a cumulative-effect adjustment to the balance sheet upon adoption. The Company is currently evaluating the impact that ASU 2016-01 will have on its consolidated financial statements.
In February 2016, the FASB issued ASU 2016-02, Leases (Topic 842), which is intended to increase transparency and comparability among organizations by recognizing all lease transactions (with terms in excess of 12 months) on the balance sheet as a lease liability and a right-of-use asset (as defined). The new guidance will be effective for fiscal years beginning after December 15, 2018, with earlier application permitted. Upon adoption, the lessee will apply the new standard retrospectively to all periods presented or retrospectively using a cumulative effect adjustment in the year of adoption. The Company is currently evaluating the impact that ASU 2016-02 will have on its consolidated financial statements.
In March 2016, the FASB issued ASU 2016-09, Stock Compensation - Stock Compensation (Topic 718),Improvements to Employee Share-Based Payment Accounting, which is intended to simplify several aspects of the accounting for share-based payment award transactions. The guidance is effective for fiscal years beginning after December 15, 2016. The Company's adoption of these amendments on January 1, 2017 did not have a material impact on its consolidated financial statements.
In August 2016, the FASB issued ASU 2016-15, Statement of Cash Flows (Topic 230), Classification of Certain Cash Receipts and Cash Payments, to clarify guidance on the classification of certain cash receipts and cash payments in the statement of cash flows. The FASB issued the ASU with the intent of reducing diversity in practice regarding eight types of cash flows. The ASU is effective for annual reporting periods beginning after December 15, 2017, including interim periods within those annual reporting periods. The Company is evaluating the effect of adopting this new accounting standard.
In January 2017, the FASB issued ASU 2017-04, Intangibles - Goodwill and Other (Topic 350), Simplifying the Test for Goodwill Impairment, which simplifies the accounting for goodwill impairments by eliminating step two from the goodwill impairment test. The ASU requires goodwill impairments to be measured on the basis of the fair value of the reporting unit relative to the reporting unit's carrying amount rather than on the basis of the implied amount of goodwill relative to the goodwill balance of the reporting unit. The ASU is effective for annual and interim impairment tests for periods beginning after December 15, 2019. Early adoption is allowed for annual and interim impairment tests occurring after January 1, 2017. The Company is evaluating the effect of adopting this new accounting standard.
Manning & Napier, Inc.
Notes to Consolidated Financial Statements (Continued)
Accounts Receivable
Note 3—Acquisitions
On April 30, 2016, the Company acquired a majority ownership interest in Rainier Investment Management, LLC ("Rainier”), an active investment management firm. Under the terms of the transaction, the Company initially acquired a 75% ownership interest in Rainier, with the remaining 25% ownership maintained by key professionals at Rainier. AsAccounts receivable as of September 30, 2017,2021 and December 31, 2020 consisted of the following:
| | | | | | | | | | | | | | |
| | | September 30, 2021 | | December 31, 2020 |
| | | (in thousands) |
| Accounts receivable - third parties | | $ | 6,212 | | | $ | 7,315 | |
| Accounts receivable - affiliated mutual funds and collective investment trusts | | 4,889 | | | 4,600 | |
| Total accounts receivable | | $ | 11,101 | | | $ | 11,915 | |
Accounts receivable represents the Company's ownership interestunconditional rights to consideration arising from its performance under separately managed account, mutual fund and collective investment trust, distribution and shareholder servicing, and custodial service contracts. Accounts receivable balances do not include an allowance for doubtful accounts nor has any significant bad debt expense attributable to accounts receivable been recorded during the three and nine months ended September 30, 2021 or 2020.
Advisory and Distribution Agreements
The Company earns investment advisory fees, distribution fees and administrative service fees under agreements with affiliated mutual funds and collective investment trusts. Fees earned for advisory and distribution services provided were approximately $11.1 million and $31.6 million for the three and nine months ended September 30, 2021, respectively, and approximately $9.3 million and $26.7 million for the three and nine months ended September 30, 2020, respectively, which represents greater than 25% of revenue in Rainier was 86%, an increaseeach period. The following provides amounts due from affiliated mutual funds and collective investment trusts reported within accounts receivable in the acquisition due toconsolidated statements of financial condition as of September 30, 2021 and December 31, 2020:
| | | | | | | | | | | | | | |
| | | September 30, 2021 | | December 31, 2020 |
| | | (in thousands) |
| Affiliated mutual funds | | $ | 3,492 | | | $ | 3,275 | |
| Affiliated collective investment trusts | | 1,397 | | | 1,325 | |
| Accounts receivable - affiliated mutual funds and collective investment trusts | | $ | 4,889 | | | $ | 4,600 | |
Contract assets and liabilities
Accrued accounts receivable: Accrued accounts receivable represents the forfeitureCompany's contract asset for revenue that has been recognized in advance of unvested ownership interests by certain individuals retiring from Rainier subsequent tobilling separately managed account contracts. Consideration for the acquisition.
Consideration transferred included an upfront cash paymentperiod billed in arrears is dependent on the transaction closingclient’s AUM on a future billing date and therefore conditional as of $13.0 million, a portion of which was held in escrow.the reporting period end. During the second quarternine months ended September 30, 2021, revenue was increased by less than $0.1 million for changes in transaction price. Accrued accounts receivable of 2017, the Company received approximately $0.3 million from amounts heldis reported within prepaid expenses and other assets in escrowthe consolidated statements of financial condition for post closing adjustments. Additional cash paymentsboth September 30, 2021 and December 31, 2020.
Deferred revenue: Deferred revenue is recorded when consideration is received or unconditionally due in advance of upproviding services to $32.5 million over a four year period are contingent upon Rainier’s achievement of certain annual financial targets. The fair valuethe Company's customer. Revenue recognized during the nine months ended September 30, 2021 that was included in deferred revenue at the beginning of the liabilityperiod was approximately $11.3 million.
Costs to obtain a contract: Under compensation plans in effect for this contingent consideration recognizedperiods prior to January 1, 2020, certain incremental first year commissions directly associated with new customer contracts were capitalized and amortized on the acquisition date was $3.5 million. Asa straight-line basis over an estimated customer contract period of 3 to 7 years. The total net asset as of September 30, 20172021 and December 31, 2016,2020 was approximately $0.5 million and $0.7 million, respectively. The related amortization expense, which is included in compensation and related costs, totaled approximately $0.1 million and $0.2 million for the fair value of this contingent liability was $0.
The transaction was accountedthree and nine months ended September 30, 2021 and $0.1 million and $0.2 million for by the Company usingthree and nine months ended September 30, 2020. An impairment loss is recorded for contract acquisition costs related to client contracts that cancel during the acquisition method under ASC 805, Business Combinations. Duringperiod. These impairment losses totaled less than $0.1 million for both the second quarter of 2016, the Company completed a preliminary allocation of the Aprilthree and nine months ended September 30, 2016 purchase price to the assets acquired2021 and liabilities assumed. During the first quarter of 2017, certain adjustments were recorded to liabilities assumed and the purchase price allocation was finalized as of March 31, 2017. The final purchase price was allocated as follows (in thousands):September 30, 2020.
|
| | | |
| Assets acquired | |
| Current assets | $ | 6,998 |
|
| Property and equipment, net | 783 |
|
| Intangible assets | |
| Client relationships | 9,320 |
|
| Trademarks | 270 |
|
| Goodwill | 3,958 |
|
| Total assets acquired | 21,329 |
|
| Liabilities assumed | |
| Accounts payable and accrued expenses | 4,023 |
|
| Other liabilities | 1,204 |
|
| Total liabilities assumed | 5,227 |
|
| Purchase price | $ | 16,102 |
|
Manning & Napier, Inc.
Notes to Consolidated Financial Statements (Continued) Note 4—Noncontrolling Interests
Manning & Napier holds an economic interest of approximately 17.8%97.7% in Manning & Napier Group, butand as managing member controls all of the business and affairs of Manning & Napier Group. As a result, the Company consolidates the financial results of Manning & Napier Group and records a noncontrolling interest on its consolidated statementstatements of financial condition with respect to the remaining approximately 82.2% aggregate2.3% economic interest in Manning & Napier Group held by M&N Group Holdings and MNCC.Holdings. Net income attributable to noncontrolling interests on the statements of operations represents the portion of earnings attributable to the economic interest in Manning & Napier Group held by the noncontrolling interests.
Manning & Napier, Inc.
Notes to Consolidated Financial Statements (Continued)
The following table provides a reconciliation from “Income before provision for (benefit from) income taxes” to “Net income attributable to Manning & Napier, Inc.”:
| | | | | | | | | | | | | | | | | | | | | | | | | | |
| | Three months ended September 30, | | Nine months ended September 30, |
| | 2021 | | 2020 | | 2021 | | 2020 |
| | | (in thousands) |
| Income before provision for (benefit from) income taxes | | $ | 9,233 | | | $ | 4,805 | | | $ | 23,926 | | | $ | 8,157 | |
Less: income (loss) before provision for (benefit from) income taxes of Manning & Napier, Inc. (1) | | (24) | | | 14 | | | (234) | | | (1,950) | |
| Income before provision for income taxes, as adjusted | | 9,257 | | | 4,791 | | | 24,160 | | | 10,107 | |
Controlling interest percentage (2) | | 97.7 | % | | 88.2 | % | | 92.7 | % | | 64.0 | % |
| Net income attributable to controlling interest | | 9,042 | | | 4,225 | | | 22,388 | | | 6,471 | |
Plus: income (loss) before provision for (benefit from) income taxes of Manning & Napier, Inc. (1) | | (24) | | | 14 | | | (234) | | | (1,950) | |
| Income (loss) before provision for (benefit from) income taxes attributable to Manning & Napier, Inc. | | 9,018 | | | 4,239 | | | 22,154 | | | 4,521 | |
Less: provision for (benefit from) income taxes of Manning & Napier, Inc.(3) | | 2,515 | | | 1,732 | | | 4,486 | | | (390) | |
| Net income attributable to Manning & Napier, Inc. | | $ | 6,503 | | | $ | 2,507 | | | $ | 17,668 | | | $ | 4,911 | |
________________________ |
| | | | | | | | | | | | | | | | |
| | | Three months ended September 30, | | Nine months ended September 30, |
| | | 2017 | | 2016 | | 2017 | | 2016 |
| | | (in thousands) |
| Income before provision for income taxes | | $ | 12,591 |
| | $ | 21,550 |
| | $ | 46,279 |
| | $ | 68,651 |
|
Less: gain (loss) before provision for income taxes of Manning & Napier, Inc. (1) | | (51 | ) | | (95 | ) | | (45 | ) | | (114 | ) |
| Income before provision for income taxes, as adjusted | | 12,642 |
| | 21,645 |
| | 46,324 |
| | 68,765 |
|
Controlling interest percentage (2) | | 17.8 | % | | 17.4 | % | | 17.7 | % | | 17.1 | % |
| Net income attributable to controlling interest | | 2,261 |
| | 3,765 |
| | 8,189 |
| | 11,753 |
|
Plus: gain (loss) before provision for income taxes of Manning & Napier, Inc. (1) | | (51 | ) | | (95 | ) | | (45 | ) | | (114 | ) |
| Income before income taxes attributable to Manning & Napier, Inc. | | 2,210 |
| | 3,670 |
| | 8,144 |
| | 11,639 |
|
Less: provision for income taxes of Manning & Napier, Inc. (3) | | 689 |
| | 1,412 |
| | 3,041 |
| | 4,358 |
|
| Net income attributable to Manning & Napier, Inc. | | $ | 1,521 |
| | $ | 2,258 |
| | $ | 5,103 |
| | $ | 7,281 |
|
________________________(2)Income before provision for (benefit from) income taxes is allocated to the controlling interest based on the percentage of units of Manning & Napier Group held by Manning & Napier, Inc. The amount represents the Company's weighted ownership of Manning & Napier Group's income for the respective periods.
| |
(1) | Manning & Napier, Inc. incurs certain gains or expenses that are only attributable to it and are therefore excluded from the net income attributable to noncontrolling interests. |
| |
(2) | Income before provision for income taxes is allocated to the controlling interest based on the percentage of units of Manning & Napier Group held by Manning & Napier, Inc. The amount represents the Company's weighted ownership of Manning & Napier Group for the respective periods. |
| |
(3) | The consolidated provision for income taxes is equal to the sum of (i) the provision for income taxes for entities other than Manning & Napier, Inc. and (ii) the provision for income taxes of Manning & Napier, Inc. which includes all U.S. federal and state income taxes. The consolidated provision for income taxes was $0.7 million and $3.3 million for the three and nine months ended September 30, 2017, respectively, and $1.6 million and $4.8 million for the three and nine months ended September 30, 2016, respectively.
|
(3)The consolidated provision for (benefit from) income taxes is equal to the sum of (i) the provision for (benefit from) income taxes for entities other than Manning & Napier, Inc. and (ii) the provision for (benefit from) income taxes of Manning & Napier, Inc. which includes all U.S. federal and state income taxes. The consolidated provision for (benefit from) income taxes was a provision of $2.5 million and $1.7 million for the three months ended September 30, 2021 and 2020, respectively, and a provision of $4.5 million and benefit of less than $0.1 million for the nine months ended September 30, 2021 and 2020, respectively.
As of September 30, 2017,2021, a total of 63,931,065428,812 units of Manning & Napier Group were held by the noncontrolling interests. Pursuant to the terms of the exchange agreement entered into at the time of the Company's initial public offering ("Exchange Agreement"), such units may be exchangeabletendered for shares of the Company's Class A common stock.exchange or redemption. For any units exchanged, the Company willmay (i) pay an amount of cash equal to the number of tendered units exchanged multiplied by the value of one share of the Company's Class A common stock less a market discount and expected expenses, or, at the Company's election, (ii) issue shares of the Company's Class A common stock on a one-for-one basis, subject to customary adjustments. As the Company receives units of Manning & Napier Group that are exchanged, the Company's ownership of Manning & Napier Group will increase.
DuringOn March 15, 2021, the nine months ended September 30, 2017, M&N Group Holdings and MNCC exchanged a totalCompany received notice that 1,592,969 of 1,853,506 Class A units of Manning & Napier Group were tendered for approximately $9.8 millionredemption or exchange. The independent directors, on behalf of the Company, decided that such exchange would be settled in cash. Subsequent to1,592,969 shares of unregistered Class A common stock of the Company. The Company completed the exchange theon June 30, 2021 and as a result, Manning & Napier acquired an equivalent number of Class A units were retired, resulting in an increase in Manning & Napier's ownership inof Manning & Napier Group. In addition, duringGroup and its ownership of Manning & Napier Group increased from 89.0% to 97.7%.
Manning & Napier, Inc.
Notes to Consolidated Financial Statements (Continued)
During the nine months ended September 30, 2017,2021, Class A common stock was issued under the Company's 2011 Equity Compensation Plan (the "Equity Plan") for which Manning & Napier, Inc. acquired an equivalent number of Class A units of Manning & Napier Group, net of forfeitures of unvested restricted stock awards.
Manning & Napier, Inc.
Notes to Consolidated Financial Statements (Continued)
Group.
The following is the impact to the Company's equity ownership interest in Manning & Napier Group for the nine months ended September 30, 2017:2021:
|
| | | | | | | | | | |
| | Manning & Napier Group Class A Units Held | | |
| |
Manning & Napier | |
Noncontrolling Interests | | Total | | Manning & Napier Ownership % |
| As of December 31, 2016 | 13,826,575 |
| | 65,784,571 |
| | 79,611,146 |
| | 17.4% |
Class A Units issued (1) | 46,467 |
| | — |
| | 46,467 |
| | —% |
| Class A Units exchanged | — |
| | (1,853,506 | ) | | (1,853,506 | ) | | 0.4% |
| As of September 30, 2017 | 13,873,042 |
| | 63,931,065 |
| | 77,804,107 |
| | 17.8% |
______________________ | |
(1) | The impact of the transaction of Manning & Napier's ownership was less than 0.1%. |
| | | | | | | | | | | | | | | | | | | | | | | |
| Manning & Napier Group Class A Units Held | | |
| |
Manning & Napier | |
Noncontrolling Interests | | Total | | Manning & Napier Ownership % |
| | | | | | | |
| | | | | | | |
| | | | | | | |
| | | | | | | |
| | | | | | | |
| | | | | | | |
| | | | | | | |
| | | | | | | |
| | | | | | | |
| As of December 31, 2020 | 15,783,638 | | | 2,021,781 | | | 17,805,419 | | | 88.6% |
| Class A Units issued | 624,323 | | | — | | | 624,323 | | | 0.4% |
| Class A Units exchanged | 1,592,969 | | | (1,592,969) | | | — | | | 8.7% |
| As of September 30, 2021 | 18,000,930 | | | 428,812 | | | 18,429,742 | | | 97.7% |
Manning & Napier Inc., as managing member, controls all of the business and affairs of Manning & Napier Group. Since the Company continues to have a controlling interest in Manning & Napier Group, the aforementioned changes in ownership of Manning & Napier Group were accounted for as equity transactions under ASC Topic 810, Consolidation. Additional paid-in capital and noncontrolling interests in the Consolidated Statementsconsolidated statements of Financial Positionfinancial position are adjusted to reallocate the Company's historical equity to reflect the change in ownership of Manning & Napier Group.
As a result of the completion of the exchange on June 30, 2021 and Manning & Napier Group's election under Section 754 of the Internal Revenue Code ("IRC"), the Company expects to benefit from future depreciation and amortization deductions resulting from increases in the tax basis of tangible and intangible assets of Manning & Napier Group. Those deductions allocated to the Company will be taken into account in reporting the Company's taxable income resulting in the recognition of a deferred tax asset.
Manning & Napier and the holders of Manning & Napier Group are party to a tax receivable agreement ("TRA"), pursuant to which Manning & Napier is required to pay to such holders 85% of the applicable cash savings, if any, in U.S. federal, state, local and foreign income tax that Manning & Napier actually realizes, or is deemed to realize in certain circumstances, as a result of (i) certain tax attributes of their units sold to Manning & Napier or exchanged (for shares of Class A common stock) and that are created as a result of the sales or exchanges and payments under the TRA and (ii) tax benefits related to imputed interest.
Accordingly, as a result of the completion of the exchange on June 30, 2021, deferred tax assets, amounts payable under the tax receivable agreement and additional paid-in capital increased by approximately $1.9 million, $1.6 million and $0.3 million respectively, within the Company’s consolidated statements of financial condition. In addition, the Company recognized a deferred tax asset of approximately $0.3 million, resulting from an increased share of Manning & Napier Group's existing deferred tax assets.
At September 30, 20172021 and December 31, 2016,2020, the Company had recorded a liability of $34.7$18.8 million and $37.1$19.0 million, respectively, representing the estimated payments due to the selling unit holders under the tax receivable agreement ("TRA")TRA entered into between Manning & Napier and the other holders of Class A Units of Manning & Napier Group. Of these amounts, $2.5approximately $3.2 million and $2.4$5.2 million were included in accrued expenses and other liabilities at September 30, 20172021 and December 31, 2016,2020, respectively. The Company made payments of $2.4approximately $2.1 million during the nine months ended September 30, 2021 and $3.4 millionmade no payments pursuant to the TRA during the nine months ended September 30, 2017 and 2016, respectively.2020.
Obligations pursuant to the TRA are obligations of Manning & Napier. They do not impact the noncontrolling interests. These obligations are not income tax obligations. Furthermore, the TRA has no impact on the allocation of the provision for income taxes to the Company’s net income.
13
Note 5—Investment Securities
The following represents the Company’s investment securities holdings as of September 30, 2017 and December 31, 2016: |
| | | | | | | | | | | | | | | | |
| | | September 30, 2017 |
| | | Cost | | Unrealized Gains | | Unrealized Losses | | Fair Value |
| | | (in thousands) |
| Available-for-sale securities | | | | | | | | |
| U.S. Treasury notes | | $ | 7,117 |
| | $ | 3 |
| | $ | (13 | ) | | $ | 7,107 |
|
| Short-term investments | | 22,255 |
| | — |
| | — |
| | 22,255 |
|
| | | | | | | | | 29,362 |
|
| Trading securities | | | | | | | | |
| Equity securities | | | | | | | | 2,493 |
|
| Fixed income securities | | | | | | | | 5,009 |
|
| Mutual funds | | | | | | | | 346 |
|
| | | | | | | | | 7,848 |
|
| Equity method investments | | | | | | | | |
| Mutual funds | | | | | | | | 1,112 |
|
| Total investment securities | | | | | | | | $ | 38,322 |
|
Manning & Napier, Inc.
Notes to Consolidated Financial Statements (Continued)
Note 5—Investment Securities
The following represents the Company’s investment securities holdings as of September 30, 2021 and December 31, 2020: | | | | | December 31, 2016 | | September 30, 2021 |
| | | Cost | | Unrealized Gains | | Unrealized Losses | | Fair Value | | Cost | | Unrealized
Gains | | Unrealized
Losses | | Fair
Value |
| | | (in thousands) | | | (in thousands) |
| Available-for-sale securities | | | | | | | | | Available-for-sale securities | |
| U.S. Treasury notes | | $ | 7,093 |
| | $ | 13 |
| | $ | (6 | ) | | $ | 7,100 |
| U.S. Treasury notes | | $ | 10,100 | | | $ | — | | | $ | (159) | | | $ | 9,941 | |
| Short-term investments | | 14,744 |
| | — |
| | — |
| | 14,744 |
| |
| Fixed income securities | | Fixed income securities | | 7,408 | | | — | | | (109) | | | 7,299 | |
| | | | | | | | | 21,844 |
| |
| Trading securities | | | | | | | | | |
| | | 17,240 | |
| Equity investments, at fair value | | Equity investments, at fair value | | |
| Equity securities | | | | | | | | 7,176 |
| Equity securities | | 5,831 | |
| Fixed income securities | | 7,167 |
| |
| Mutual funds | | | | | | | | 288 |
| Mutual funds | | 2,020 | |
| Mutual funds - consolidated funds | | | | | | | | 995 |
| |
| | | | | | | | | 15,626 |
| | 7,851 | |
| Total investment securities | | | | | | | | $ | 37,470 |
| Total investment securities | | $ | 25,091 | |
| | | | | | | | | | | | | | | | | | | | | | | | | | |
| | December 31, 2020 |
| | Cost | | Unrealized
Gains | | Unrealized
Losses | | Fair
Value |
| | | (in thousands) |
| Available-for-sale securities | | | | | | | | |
| U.S. Treasury notes | | $ | 10,587 | | | $ | — | | | $ | (89) | | | $ | 10,498 | |
| Fixed income securities | | 6,497 | | | — | | | (94) | | | 6,403 | |
| | | | | | | | |
| | | | | | | | 16,901 | |
| Equity investments, at fair value | | | | | | | | |
| Equity securities | | | | | | | | 5,592 | |
| Mutual funds | | | | | | | | 1,004 | |
| | | | | | | | 6,596 | |
| Total investment securities | | | | | | | | $ | 23,497 | |
Investment securities are classified as either tradingequity investments or available-for-sale and are carried at fair value. Fair value is determined based on quoted market prices in active markets for identical or similar instruments.
Investment securities classified as tradingequity investments, at fair value consist of equity securities, fixed income securities and investments in mutual funds for which the Company provides advisory services. At September 30, 20172021 and December 31, 2016, trading securities2020, equity investments, at fair value consist solely of investments held by the Company to provide initial cash seeding for product development purposes.purposes and investments in mutual funds to hedge economic exposure to market movements on its deferred compensation plan. The Company recognized approximately $1.5 million and $1.6$0.1 million of net unrealized gains and $0.1 million of net unrealized losses related to investments classified as tradingequity investments, at fair value during the nine months ended September 30, 20172021 and 2016,2020, respectively.
Investment securities classified as available-for-sale consist of U.S. Treasury notes and other short-term investmentscorporate bonds to optimize cash management opportunities and for compliance with certain regulatory requirements and to optimize cash management opportunities.requirements. As of September 30, 20172021 and December 31, 2016,2020, approximately $0.6 million of these securities was considered restricted. The Company periodically reviews each individual security position that has an unrealized loss, or impairment, to determine if that impairment is other-than-temporary. No other-than-temporary impairment charges have been recognized by the Company during the nine months endedSeptember 30, 20172021 and 2016.2020.
Note 6—Fair Value Measurements
Fair value is defined as the price that the Company would receive upon selling an investment in an orderly transaction to an independent buyer in the principal or most advantageous market of the investment. A fair value hierarchy is providedapplied that gives the highest priority to unadjusted quoted prices in active markets for identical assets and liabilities (Level 1) and the lowest priority to unobservable inputs (Level 3).
Manning & Napier, Inc.
Notes to Consolidated Financial Statements (Continued)
The following three-tier fair value hierarchy prioritizes the inputs used in measuring fair value:
•Level 1—observable inputs such as quoted prices in active markets for identical securities;
•Level 2—other significant observable inputs (including but not limited to quoted prices for similar securities, interest rates, prepayment rates, credit risk, etc.); and
•Level 3—significant unobservable inputs (including the Company’s own assumptions in determining the fair value of investments).
Manning & Napier, Inc.
Notes to Consolidated Financial Statements (Continued)
The following providestable summarizes the hierarchy of inputs used to derive the fair value of the Company’s financial instruments measured at fair value on a recurring basisassets as of September 30, 20172021 and December 31, 2016:2020:
| | | | | | | | | | | | | | | | | | | | | | | | | | |
| | September 30, 2021 |
| | Level 1 | | Level 2 | | Level 3 | | Totals |
| | | (in thousands) |
| Equity securities | | $ | 5,831 | | | $ | — | | | $ | — | | | $ | 5,831 | |
| Fixed income securities | | — | | | 7,299 | | | — | | | 7,299 | |
| Mutual funds | | 2,020 | | | — | | | — | | | 2,020 | |
| | | | | | | | |
| U.S. Treasury notes | | — | | | 9,941 | | | — | | | 9,941 | |
| | | | | | | | |
| Total assets at fair value | | $ | 7,851 | | | $ | 17,240 | | | $ | — | | | $ | 25,091 | |
| | | | | September 30, 2017 | | December 31, 2020 |
| | | Level 1 | | Level 2 | | Level 3 | | Totals | | Level 1 | | Level 2 | | Level 3 | | Totals |
| | | (in thousands) | | | (in thousands) |
| Equity securities | | $ | 2,493 |
| | $ | — |
| | $ | — |
| | $ | 2,493 |
| Equity securities | | $ | 5,592 | | | $ | — | | | $ | — | | | $ | 5,592 | |
| Fixed income securities | | — |
| | 5,009 |
| | — |
| | 5,009 |
| Fixed income securities | | — | | | 6,403 | | | — | | | 6,403 | |
| Mutual funds | | 1,458 |
| | — |
| | — |
| | 1,458 |
| Mutual funds | | 1,004 | | | — | | | — | | | 1,004 | |
| U.S. Treasury notes | | — |
| | 7,107 |
| | — |
| | 7,107 |
| U.S. Treasury notes | | — | | | 10,498 | | | — | | | 10,498 | |
| Short-term investments | | 22,255 |
| | — |
| | — |
| | 22,255 |
| |
| | Total assets at fair value | | $ | 26,206 |
| | $ | 12,116 |
| | $ | — |
| | $ | 38,322 |
| Total assets at fair value | | $ | 6,596 | | | $ | 16,901 | | | $ | — | | | $ | 23,497 | |
| | | | | | | | | | |
| Contingent consideration liability | | $ | — |
| | $ | — |
| | $ | — |
| | $ | — |
| |
| Total liabilities at fair value | | $ | — |
| | $ | — |
| | $ | — |
| | $ | — |
| |
|
| | | | | | | | | | | | | | | | |
| | | December 31, 2016 |
| | | Level 1 | | Level 2 | | Level 3 | | Totals |
| | | (in thousands) |
| Equity securities | | $ | 7,176 |
| | $ | — |
| | $ | — |
| | $ | 7,176 |
|
| Fixed income securities | | 1,071 |
| | 6,096 |
| | — |
| | 7,167 |
|
| Mutual funds | | 288 |
| | — |
| | — |
| | 288 |
|
| Mutual funds - consolidated funds | | 995 |
| | — |
| | — |
| | 995 |
|
| U.S. Treasury notes | | — |
| | 7,100 |
| | — |
| | 7,100 |
|
| Short-term investments | | 14,744 |
| | — |
| | — |
| | 14,744 |
|
| Total assets at fair value | | $ | 24,274 |
| | $ | 13,196 |
| | $ | — |
| | $ | 37,470 |
|
| | | | | | | | | |
| Contingent consideration liability | | $ | — |
| | $ | — |
| | $ | — |
| | $ | — |
|
| Total liabilities at fair value | | $ | — |
| | $ | — |
| | $ | — |
| | $ | — |
|
Short-term investments consists of certificate of deposits ("CDs") that are stated at cost, which approximate fair value due to the short maturity of the investments.
Valuations of investments in fixed income securities and U.S. Treasury notes can generally be obtained through independent pricing services. For most bond types, the pricing service utilizes matrix pricing, which considers one or more of the following factors: yield or price of bonds of comparable quality, coupon, maturity, current cash flows, type and current day trade information, as well as dealer supplied prices. These valuations are categorized as Level 2 in the hierarchy.
Contingent consideration was a component of the purchase price of Rainier (Note 3). The contingent consideration is payable over a four year period upon Rainier’s achievement of certain financial targets. The fair value of the contingent consideration is calculated on a quarterly basis by forecasting Rainier’s adjusted earnings before interest, taxes and amortization ("EBITA") as defined by the purchase agreement over the contingency period with changes in the fair value included in other operating costs in the consolidated statements of operations.
There were no changes in contingent consideration liability measured at fair value using significant unobservable inputs (Level 3) for the nine months ended September 30, 2017. The fair value was $0 at September 30, 2017 and December 31, 2016.
The Company’s policy is to recognize transfers in and transfers out of the valuation levels as of the beginning of the reporting period. There were no transfers between Levelsvaluation levels during the nine months ended September 30, 2017.2021.
Note 7—Accrued Expenses and Other Liabilities
Accrued expenses and other liabilities as of September 30, 2021 and December 31, 2020 consisted of the following:
| | | | | | | | | | | | | | |
| | September 30, 2021 | | December 31, 2020 |
| | | (in thousands) |
| Accrued bonus and sales commissions | | $ | 16,554 | | | $ | 19,999 | |
| Accrued payroll and benefits | | 3,248 | | | 4,629 | |
| Accrued sub-transfer agent fees | | 469 | | | 437 | |
| | | | |
| Amounts payable under tax receivable agreement | | 3,159 | | | 5,220 | |
| Short-term operating lease liabilities | | 2,661 | | | 2,854 | |
| Other accruals and liabilities | | 3,066 | | | 3,300 | |
| Total accrued expenses and other liabilities | | $ | 29,157 | | | $ | 36,439 | |
Manning & Napier, Inc.
Notes to Consolidated Financial Statements (Continued)
Note 8—Leases
The Company has operating and finance leases for office space and certain equipment. For these leases, the office space or equipment is an explicitly identified asset within the contract. The Company has determined that it has obtained substantially all of the economic benefits from the use of the underlying asset and directs how and for what purpose the asset is used during the term of the contract.
Certain of the Company's operating leases have been subleased for which the Company will receive cash totaling approximately $3.7 million over the remaining term of such leases. The lease terms for the four subleased operating leases end ranging from 2025 to 2028.
The components of lease expense for the three and nine months ended September 30, 2021 and 2020 were as follows:
| | | | | | | | | | | | | | | | | | | | | | | | | | |
| | Three months ended September 30, | | Nine months ended September 30, |
| | 2021 | | 2020 | | 2021 | | 2020 |
| | (in thousands) |
| Finance lease expense | | | | | | | | |
| Amortization of right-of-use assets | | $ | 14 | | | $ | 9 | | | $ | 50 | | | $ | 57 | |
| Interest on lease liabilities | | 1 | | | 1 | | | 4 | | | 5 | |
| Operating lease expense | | 768 | | | 931 | | | 2,413 | | | 3,151 | |
| Short-term lease expense | | — | | | — | | | — | | | 3 | |
| Variable lease expense | | 38 | | | 31 | | | 177 | | | 178 | |
| Sublease income | | (179) | | | (136) | | | (523) | | | (463) | |
| Total lease expense | | $ | 642 | | | $ | 836 | | | $ | 2,121 | | | $ | 2,931 | |
Supplemental cash flow information related to leases for the three and nine months ended September 30, 2021 and 2020 were as follows:
| | | | | | | | | | | | | | | | | | | | | | | | | | |
| | Three months ended September 30, | | Nine months ended September 30, |
| | 2021 | | 2020 | | 2021 | | 2020 |
| | (in thousands) |
| Cash paid for amounts included in the measurement of lease liabilities: | | | | | | | | |
| Operating cash flows from finance leases | | $ | 1 | | | $ | 2 | | | $ | 4 | | | $ | 6 | |
| Finance cash flows from finance leases | | $ | 17 | | | $ | 24 | | | $ | 49 | | | 76 | |
| Operating cash flows from operating leases | | $ | 1,200 | | | $ | 941 | | | $ | 3,090 | | | 2,601 | |
| | | | | | | | |
| Right-of-use assets obtained in exchange for new lease obligations: | | | | | | | | |
| Finance leases | | $ | — | | | $ | — | | | $ | — | | | — | |
| Operating leases | | $ | 441 | | | $ | 678 | | | $ | 479 | | | $ | 814 | |
Manning & Napier, Inc.
Notes to Consolidated Financial Statements (Continued)
Supplemental balance sheet information related to leases as of September 30, 2021 was as follows:
| | | | | | | | |
| (in thousands, except lease term and discount rate) | | September 30, 2021 |
| Finance Leases | | |
Finance lease right-of-use assets (1) | | $ | 99 | |
| | |
| Accrued expenses and other liabilities | | $ | 59 | |
| Other long-term liabilities | | 47 | |
| Total finance lease liabilities | | $ | 106 | |
| | |
| Operating Leases | | |
| Operating lease right-of-use assets | | $ | 15,017 | |
| | |
| Accrued expenses and other liabilities | | $ | 2,661 | |
| Operating lease liabilities, non-current | | 14,931 | |
| Total operating lease liabilities | | $ | 17,592 | |
| | |
| Weighted average remaining lease term | | |
| Finance leases | | 1.88 years |
| Operating leases | | 5.94 years |
| Weighted average discount rate | | |
| Finance leases | | 4.35 | % |
| Operating leases | | 5.11 | % |
_______________________(1)Amounts included in other long-term assets within the consolidated statements of financial condition.
Maturities of lease liabilities were as follows:
| | | | | | | | | | | | | | |
| Twelve month period ending September 30, | | Finance Leases | | Operating Leases |
| | (in thousands) |
| 2022 | | $ | 62 | | | $ | 3,483 | |
| 2023 | | 41 | | | 3,525 | |
| 2024 | | 7 | | | 3,484 | |
| 2025 | | — | | | 3,196 | |
| 2026 | | — | | | 3,119 | |
| Thereafter | | — | | | 3,572 | |
| Total lease payments | | 110 | | | 20,379 | |
| Less imputed interest | | (4) | | | (2,787) | |
| Total lease liabilities | | $ | 106 | | | $ | 17,592 | |
Note 7—Accrued Expenses and Other Liabilities
Accrued expenses and other liabilities as of September 30, 2017 and December 31, 2016 consisted of the following:
|
| | | | | | | | |
| | | September 30, 2017 | | December 31, 2016 |
| | | (in thousands) |
| Accrued bonus and sales commissions | | $ | 11,471 |
| | $ | 18,342 |
|
| Accrued payroll and benefits | | 3,705 |
| | 3,430 |
|
| Accrued sub-transfer agent fees | | 3,000 |
| | 4,785 |
|
| Dividends payable | | 1,203 |
| | 2,397 |
|
| Amounts payable under tax receivable agreement | | 2,475 |
| | 2,364 |
|
| Other accruals and liabilities | | 3,755 |
| | 3,797 |
|
| Total accrued expenses and other liabilities | | $ | 25,609 |
| | $ | 35,115 |
|
Note 8—9—Commitments and Contingencies
The Company may from time to time enter into agreements that contain certain representations and warranties and which provide general indemnifications. The Company may also serve as a guarantor of such obligations of one or more of the Manning & Napier Group entities.obligations. The Company’s maximum exposure under these arrangements is unknown, as this would involve future claims that may be made against the Company that have not yet occurred. The Company expects any risk of liability associated with such guarantees to be remote.
Manning & Napier, Inc.
Notes to Consolidated Financial Statements (Continued)
Regulation
As an investment adviser to a variety of investment products, the Company and its affiliated broker-dealer are subject to routine reviews and inspections by the SEC and the Financial Industry Regulatory Authority, Inc., National Futures Association and U.S. Commodity Futures Trading Commission. From time to time the Company may also be subject to claims, or be involved in various legal proceedings, arising in the ordinary course of its business and be subject to other contingencies. The Company does not believe that the outcome of any of these reviews, inspections or other legal proceedings will have a material impact on its consolidated financial statements; however, litigation is subject to many uncertainties, and the outcome of individual litigated matters is difficult to predict. The Company will establish accruals for matters that are probable, can be reasonably estimated, and may take into account any related insurance recoveries to the extent of such recoveries. As of September 30, 20172021 and December 31, 2016,2020, the Company has not accrued for any such claims, legal proceedings, or other contingencies.
Note 9—10—Earnings per Common Share
Basic earnings per share (“basic EPS”) is computed using the two-class method to determine net income available to Class A common stock. The two-class method includes an earnings allocation formula that determines earnings per share for each participating security according to dividends declared and undistributed earnings for the period. The Company's restricted Class A common shares granted under the Equity Plan have non-forfeitable dividend rights during their vesting period and are therefore considered participating securities under the two-class method. Under the two-class method, the Company's net income available to Class A common stock is reduced by the amount allocated to the unvested restricted Class A common stock. Basic EPS is calculated by dividing net income available to Class A common stock by the weighted average number of common shares outstanding during the period.
Diluted earnings per share (“diluted EPS”) is computed under the more dilutive of either the treasury method or the two-class method. For the diluted calculation, the weighted average number of common shares outstanding during the period is increased by the assumed conversion into Class A common stock of the unvested equityrestricted stock units, unvested restricted stock awards, and outstanding stock options (collectively, "outstanding equity awards"), as well as the exchangeable Class A units of Manning & Napier Group, to the extent that such conversion would dilute earnings per share.
Net income attributable to noncontrolling interests on the statements of operations represents the portion of earnings attributable to the economic interest of Manning & Napier Group held by the noncontrolling interests (Note 4). For periods in which the outstanding Class A Units of Manning & Napier Group are dilutive to the Company's earnings per share, the calculation of diluted earnings per share also takes into account the incremental net income that would be available to Class A common stock upon the conversion of Class A Units into Class A common stock.
Manning & Napier, Inc.
Notes to Consolidated Financial Statements (Continued)
The following is a reconciliation of the income and share data used in the basic and diluted earnings per shareEPS computations for the three and nine months endedSeptember 30, 2017 and 2016 under the two-class method:
|
| | | | | | | | | | | | | | | | |
| | | Three months ended September 30, | | Nine months ended September 30, |
| | | 2017 | | 2016 | | 2017 | | 2016 |
| | | (in thousands, except share data) |
| Net income attributable to controlling and noncontrolling interests | | $ | 11,852 |
| | $ | 19,985 |
| | $ | 42,955 |
| | $ | 63,867 |
|
| Less: net income attributable to noncontrolling interests | | 10,331 |
| | 17,727 |
| | 37,852 |
| | 56,586 |
|
| Net income attributable to Manning & Napier, Inc. | | $ | 1,521 |
| | $ | 2,258 |
| | $ | 5,103 |
| | $ | 7,281 |
|
| Less: allocation to participating securities | | 83 |
| | 158 |
| | 288 |
| | 480 |
|
| Net income available to Class A common stock | | $ | 1,438 |
| | $ | 2,100 |
| | $ | 4,815 |
| | $ | 6,801 |
|
| | | | | | | | | |
| Weighted average shares of Class A common stock outstanding - basic | | 14,249,347 |
| | 14,042,880 |
| | 14,135,288 |
| | 13,916,721 |
|
| Dilutive effect of unvested equity awards | | 23,388 |
| | 132,441 |
| | 106,354 |
| | 256,562 |
|
| Dilutive effect of exchangeable Class A Units | | 63,937,284 |
| | — |
| | — |
| | — |
|
| Weighted average shares of Class A common stock outstanding - diluted | | 78,210,019 |
| | 14,175,321 |
| | 14,241,642 |
| | 14,173,283 |
|
| Net income available to Class A common stock per share - basic | | $ | 0.10 |
| | $ | 0.15 |
| | $ | 0.35 |
| | $ | 0.49 |
|
| Net income available to Class A common stock per share - diluted | | $ | 0.10 |
| | $ | 0.15 |
| | $ | 0.35 |
| | $ | 0.48 |
|
The Company’s Class B common stock represents voting interests and does not participate in the earnings of the Company. Accordingly, there is no basic or diluted EPS related to the Company’s Class B common stock.
For both the three and nine months ended September 30, 2017, 790,0002021 and 2020 under the two-class method:
| | | | | | | | | | | | | | | | | | | | | | | | | | |
| | Three months ended September 30, | | Nine months ended September 30, |
| | 2021 | | 2020 | | 2021 | | 2020 |
| | | (in thousands, except share data) |
| Numerator: | | | | | | | | |
| Net income attributable to controlling and noncontrolling interests | | $ | 6,710 | | | $ | 3,067 | | | $ | 19,415 | | | $ | 8,185 | |
| Less: net income attributable to noncontrolling interests | | 207 | | | 560 | | | 1,747 | | | 3,274 | |
| Net income attributable to Manning & Napier, Inc. | | $ | 6,503 | | | $ | 2,507 | | | $ | 17,668 | | | $ | 4,911 | |
| Less: allocation to participating securities | | — | | | 20 | | | 45 | | | 52 | |
| Net income available to Class A common stock for basic EPS | | $ | 6,503 | | | $ | 2,487 | | | $ | 17,623 | | | $ | 4,859 | |
| Plus: reallocation of net income attributable to participating securities | | — | | | 3 | | | 8 | | | 4 | |
| Plus: incremental net income as a result of conversion of Class A Units of Manning & Napier Group to Class A common stock | | (60) | | | — | | | — | | | 2,279 | |
| Net income available to Class A common stock for diluted EPS | | $ | 6,443 | | | $ | 2,490 | | | $ | 17,631 | | | $ | 7,142 | |
| | | | | | | | |
| Denominator: | | | | | | | | |
| Weighted average shares of Class A common stock outstanding - basic | | 18,481,147 | | | 16,176,280 | | | 17,493,299 | | | 16,041,128 | |
| Dilutive effect of outstanding equity awards | | 3,316,496 | | | 2,752,674 | | | 3,349,871 | | | 1,584,781 | |
| Dilutive effect of exchangeable Class A Units | | 428,812 | | | — | | | — | | | 30,713,850 | |
| Weighted average shares of Class A common stock outstanding - diluted | | 22,226,455 | | | 18,928,954 | | | 20,843,170 | | | 48,339,759 | |
| Net income available to Class A common stock per share - basic | | $ | 0.35 | | | $ | 0.15 | | | $ | 1.01 | | | $ | 0.30 | |
| Net income available to Class A common stock per share - diluted | | $ | 0.29 | | | $ | 0.13 | | | $ | 0.85 | | | $ | 0.15 | |
Performance-based stock options are excluded from the calculation of diluted EPS for periods in which the associated market condition has not yet been achieved. As such, for the three and nine months ended September 30, 2021, no unvested performance-based stock options were excluded, and for the three and nine months ended September 30, 2020, 2,022,000 unvested performance-based stock options were excluded from the calculation of diluted EPS.
For each of the three and nine months ended September 30, 2021, no unvested equity awards were excluded from the calculation of diluted earnings per common share because the effect would have been anti-dilutive.EPS. For both the three and nine months ended September 30, 2016, 990,0002020, 64,530 and 164,696, respectively, unvested equity awards were excluded from the calculation of diluted earnings per common shareEPS because the effect would have been anti-dilutive.
At September 30, 20172021, there were 63,931,065428,812 Class A Units of Manning & Napier Group outstanding, which, subject to certain restrictions, may be exchangeable for up to an equivalent number of shares of the Company's Class A common stock. These units were not included in the calculation of diluted earnings per common share for the nine months ended September 30, 2017,2021 because the effect would have been anti-dilutive.
At September 30, 2016 there were 65,784,571 Class A Units of Manning & Napier Group outstanding, which were not included in the calculation of diluted earnings per common share for the three and nine months ended September 30, 2016, because the effect would have been anti-dilutive.
Note 10—Equity Based11—Equity-Based Compensation
The Equity Plan was adopted by the Company's board of directors and approved by stockholdersshareholders prior to the consummation of the Company's 2011 initial public offering. Under the Equity Plan, a total of 13,142,813 equity interests are authorized for issuance, and may be issued in the form of Class A common stock, restricted stock units, stock options, units of Manning & Napier Group, or certain classes of membership interests in the Company which may convert into units of Manning & Napier Group.
The following table summarizes the award activity for the nine months ended At September 30, 2017 under2021, a total of 2,154,456 equity interests were available for issuance pursuant to the Equity Plan:Plan.
|
| | | | | | | |
| | | Restricted Stock Awards | | Weighted Average Grant Date Fair Value |
| Stock awards outstanding at January 1, 2017 | | 1,207,788 |
| | $ | 12.56 |
|
| Granted | | 70,399 |
| | $ | 5.55 |
|
| Vested | | (276,064 | ) | | $ | 12.41 |
|
| Forfeited | | (150,000 | ) | | $ | 12.20 |
|
| Stock awards outstanding at September 30, 2017 | | 852,123 |
| | $ | 12.09 |
|
Manning & Napier, Inc.
Notes to Consolidated Financial Statements (Continued)
The following table summarizes activity related to awards of restricted stock and restricted stock units (collectively, "stock awards") under the Equity Plan for the nine months ended September 30, 2021:
| | | | | | | | | | | | | | |
| | Stock Awards | | Weighted Average Grant Date Fair Value |
| Outstanding at January 1, 2021 | | 3,044,981 | | | $ | 2.03 | |
| Granted | | 1,152,369 | | | $ | 6.04 | |
| Vested | | (201,778) | | | $ | 9.70 | |
| Forfeited | | (182,405) | | | $ | 2.16 | |
| Outstanding at September 30, 2021 | | 3,813,167 | | | $ | 2.83 | |
The weighted average fair value of stock awards granted during the nine months ended September 30, 2021 was $6.04, based on the closing sale price of the Company's Class A common stock as reported on the New York Stock Exchange on the date of grant, and, if not entitled to dividends or dividend equivalents during the vesting period, reduced by the present value of such amounts expected to be paid on the underlying shares during the requisite service period.
For the three and nine months ended September 30, 2017,2021, the Company recorded approximately $0.3$0.6 million and $1.7$2.6 million, respectively, of compensation expense related to stock awards under the Equity Plan. For the three and nine months ended September 30, 2016,2020, the Company recorded approximately $0.4$0.7 million and $2.5 million, respectively, of compensation expense related to stock awards under the Equity Plan. The aggregate intrinsic value of stock awards that vested during each of the nine months ended September 30, 2021 and 2020 was approximately $1.5 million and $0.9 million, respectively. As of September 30, 2017,2021, there was unrecognized compensation expense of approximately $8.2 million related to Equity Planstock awards, of approximately $5.8 million, which the Company expects to recognize over a weighted average period of approximately 3.53.9 years.
DuringA summary of activity under the nine months ended September 30, 2017 and 2016, the Company withheld a total of 69,597 and 111,729 restricted shares, respectively, as a result of net share settlements to satisfy employee tax withholding obligations. The Company paid approximately $0.3 million and $1.0 million in employee tax withholding obligationsEquity Plan related to these settlementsstock option awards during the nine months ended September 30, 20172021 is presented below:
| | | | | | | | | | | | | | | | | | | | | | | | | | |
| | Stock Option Awards | | Weighted Average Exercise Price | | Weighted Average Contractual Term
(years) | | Aggregate
Intrinsic
Value
(in thousands) |
| Outstanding at January 1, 2021 | | 2,250,000 | | | $ | 2.01 | | | | | |
| Granted | | — | | | $ | — | | | | | |
| Exercised | | (1,750,000) | | | $ | 2.01 | | | | | |
| Forfeited | | — | | | $ | — | | | | | |
| Outstanding at September 30, 2021 | | 500,000 | | | $ | 2.01 | | | 3.8 | | $ | 3,560 | |
| Exercisable at September 30, 2021 | | 333,332 | | | $ | 2.01 | | | 3.6 | | $ | 2,373 | |
For the three and 2016, respectively.nine months ended September 30, 2021, the Company recorded approximately less than $0.1 million and $0.2 million, respectively, of compensation expense related to stock options under the Equity Plan. For the three and nine months ended September 30, 2020, the Company recorded approximately $0.1 million and $0.4 million, respectively, of compensation expense related to stock options under the Equity Plan. As of September 30, 2021, there was unrecognized compensation expense of less than $0.1 million related to stock options, which the Company expects to recognize over a weighted average period of approximately 0.4 years.
In connection with the vesting of restricted stock units and exercise of stock options during the nine months ended September 30, 2021, the Company withheld a total of 710,019 shares of Class A common stock to satisfy approximately $5.2 million of employee income tax withholding requirements. These net share settlements had the effect of shares repurchased and retired by the Company, as they reduced the total number of Class A common shares outstanding.
Note 11—12—Income Taxes
The Company is comprised of entities that have elected to be treated as either a limited liability company ("LLC") or a “C-Corporation". As such, the entities functioning as LLC’sLLCs are not liable for or able to benefit from U.S. federal and most state income taxes on their earnings, and earnings (losses) will be included in the personal income tax returns of each entity’s unit holders. The entities functioning as C-Corporations are liable for or able to benefit from U.S. federal and state and local income taxes on their earnings and losses, respectively.
Manning & Napier, Inc.
Notes to Consolidated Financial Statements (Continued)
In calculating the provision for income taxes, the Company uses an estimate of the annual effective tax rate based upon the facts and circumstances at each interim period. On a quarterly basis, the estimated annual effective tax rate is adjusted, as appropriate, based upon changes in facts and circumstances, if any, as compared to those forecasted at the beginning of the fiscal year and at each interim period thereafter.
The Company’s income tax provision (benefit) and effective tax rate were as follows:
| | | | | | | | | | | | | | | | | | | | | | | | | | |
| | | Three months ended September 30, | | Nine months ended September 30, |
| | | 2021 | | 2020 | | 2021 | | 2020 |
| | | (in thousands) |
| Income before provision for (benefit from) income taxes | | $ | 9,233 | | | $ | 4,805 | | | $ | 23,926 | | | $ | 8,157 | |
| Effective tax rate | | 27.3 | % | | 36.2 | % | | 18.9 | % | | (0.3) | % |
| Provision for (benefit from) income taxes | | 2,523 | | | 1,738 | | | 4,511 | | | (28) | |
| Provision for (benefit from) income taxes at statutory rate | | 1,939 | | | 1,009 | | | 5,024 | | | 1,713 | |
| Difference between tax at effective vs. statutory rate | | $ | 584 | | | $ | 729 | | | $ | (513) | | | $ | (1,741) | |
|
| | | | | | | | | | | | | | | | |
| | | Three months ended September 30, | | Nine months ended September 30, |
| | | 2017 | | 2016 | | 2017 | | 2016 |
| | | (in thousands) |
| Earnings from continuing operations before income taxes | | $ | 12,591 |
| | $ | 21,550 |
| | $ | 46,279 |
| | $ | 68,651 |
|
| Effective tax rate | | 5.9 | % | | 7.3 | % | | 7.2 | % | | 7.0 | % |
| Provision for income taxes | | 739 |
| | 1,565 |
| | 3,324 |
| | 4,784 |
|
| Provision for income taxes @ statutory rate | | 4,281 |
| | 7,543 |
| | 15,735 |
| | 24,028 |
|
| Difference between tax at effective vs. statutory rate | | $ | (3,542 | ) | | $ | (5,978 | ) | | $ | (12,411 | ) | | $ | (19,244 | ) |
For the three and nine months endedSeptember 30, 2017 and 2016, the difference between the Company’s recordedThe provision and the provision that would result from applying the U.S. statutory rate of 34% and 35%, respectively, is primarilyfor (benefit from) income taxes includes a benefit attributable to the benefit resulting from the fact that a significant portion of the Company’s operations include a series of flow-through entities which are generally not subject to federal and most state income taxes. Accordingly, a portion of the Company’s earnings are not subject to corporate level taxes. The Company recognized a reduced benefit from flow-through entities during the nine months ended September 30, 2021 compared to September 30, 2020 due to a higher portion of Manning & Napier Group's earnings subject to taxation at the C-Corporation level attributed to Manning & Napier Inc.'s increased ownership of Manning & Napier Group as of September 30, 2021 compared to September 30, 2020.
In addition, the effective rate during the nine months ended September 30, 2021 is lower than the statutory rate of 21% due to the incremental tax benefits realized from the exercise of stock option awards during the first and second quarters of 2021, partially offset by the impacts from permanent differences between book and tax income, including but not limited to Section 162(m) of the IRC which limits the annual amount of deductible compensation. During the three months ended September 30, 2021, the Company reached a settlement with a certain state related to the Company's 2016, 2017 and 2018 corporate income tax returns. As a result, the Company recognized approximately $0.3 million within its provision for income taxes during the three months ended September 30, 2021.
For the nine months ended September 30, 2020, the income tax benefit also includes the impact from the enactment of the Coronavirus Aid, Relief, and Economic Security Act ("CARES Act") on March 27, 2020 which includes, among other things, the ability to carryback net operating losses from 2018, 2019 and 2020 when the federal tax rate was 34% compared to the current statutory rate of 21%. As a result, the Company recognized an income tax benefit related to the favorable rate applied to its net operating losses.
Note 12—13—Related Party Transactions
Transactions with noncontrolling members
From time to time, the Company may be asked to provide certain services, including accounting, legal and other administrative functions for the noncontrolling members of Manning & Napier Group. While immaterial, the Company has not received any reimbursement for such services.
The Company manages the personal funds of certain of the Company's executive officers including William Manning.and directors and/or their affiliated entities. Pursuant to the respective investment management agreements, in some instances the Company waivesmay waive or reducesreduce its regular advisory fees for these accounts and personal funds utilized to incubate products.accounts. The aggregate value of the fees earned was approximately $0.2 million and the value of the fees waived was approximatelyless than $0.1 million for each of the nine months ended September 30, 2017. The aggregate value of2021 and 2020. No fees were waived for the fees earned was approximately $0.1 millionnine months ended September 30, 2021 and the aggregate value of the fees waived was less than $0.1 million for the nine months ended September 30, 2016.2020.
Affiliated fund transactions
The Company earns investment advisory fees, distribution fees and administrative service fees under agreements with affiliated mutual funds and collective investment trusts. The aggregate value of revenueFees earned wasfor advisory and distribution services provided were approximately $19.4$11.1 million and $64.6$31.6 million for the three and nine months ended September 30, 2017,2021, respectively, and $28.8$9.3 million and $86.7$26.7 million for the three and nine months ended September 30, 2016,2020, respectively. As ofFees earned for administrative services provided were approximately $0.3 million and $0.8 million for the three and nine months ended September 30, 20172021, respectively, and December 31, 2016, amounts due from the affiliated mutual funds was approximately $6.2$0.4 million and $6.8$1.2 million respectively. As offor the three and nine months ended September 30, 2017 and December 31, 2016,2020, respectively. See Note 3 for disclosure of amounts due from affiliated mutual funds and collective investment trusts was approximately $2.1 million and $4.5 million, respectively.trusts.
Manning & Napier, Inc.
Notes to Consolidated Financial Statements (Continued)
The Company incurs certain expenses on behalf of the collective investment trusts and has contractually agreed to limit its fees and reimburse expenses to limit operating expenses incurred by certain affiliated fund series. The aggregate value of fees waived and expenses reimbursed to, or incurred for, affiliated mutual funds and collective investment trusts was $4.1were approximately $0.5 million and $3.4$1.6 million for the three and nine months ended September 30, 20172021, and 2016, respectively.$1.3 million and $3.7 million for the three and nine months ended September 30, 2020.
Note 13—14—Subsequent Events
Distributions and dividendsDividend on Class A common stock
On October 24, 2017,22, 2021, the Board of Directors approved a distribution from Manning & Napier Group to Manning & Napier and the noncontrolling interests of Manning & Napier Group. The amount of the distribution will be based on earnings for the quarter ended December 31, 2017, with a maximum amount of $10.0 million. Concurrently, theCompany's Board of Directors declared an $0.08a $0.05 per share dividend to the holders of Class A common stock. The dividend is payable on or about February 1, 2018November 22, 2021 to shareholders of record as of January 15, 2018.November 8, 2021.
Item 2. Management’s Discussion and Analysis of Financial Condition and Results of Operations.Operations
This report contains forward-looking statements within the meaning of section 27A of the Securities Act of 1933, as amended, and Section 21E of the Securities Exchange Act of 1934, as amended (the "Exchange Act"), which reflect ourthe views of Manning & Napier, Inc. ("we," "our," or "us") with respect to, among other things, our future operations and financial performance. Words like "believes," "expects," "may," "estimates," "will," "should," "could," "intends," "likely," "plans," "outlook," or "anticipates" or the negative thereof or other variations thereon or comparable terminology, are used to identify forward-looking statements, although not all forward-looking statements contain these words.
Although we believe that we are basing our expectations and beliefs on reasonable assumptions within the bounds of what we currently know about our business and operations, there can be no assurance that our actual results will not differ materially from what we expect or believe. Some of the factors that could cause our actual results to differ materially from our expectations or beliefs are disclosed in the “Risk Factors” section, as well as other sections, of our Annual Report on Form 10-K which include, without limitation: changes in securities or financial markets or general economic conditions; the impact of the COVID-19 pandemic and related recovery efforts on the U.S. and global economy; a decline in the performance of our products; client sales and redemption activity; any loss of an executive officer or key personnel; changes in our business related to strategic acquisitions and other transactions; and changes of government policy or regulations. All forward-looking statements speak only as of the date on which they are made and we undertake no duty to update or revise any forward-looking statements, whether as a result of new information, future events or otherwise.
Overview
Our Business
We areManning & Napier, Inc. is an independent investment management firm that provides our clients with a broad range of financial solutions and investment solutions, as well as a variety of consultative services that complement our investment process.strategies. Founded in 1970 we offer U.S. and non-U.S equity, fixed income, and a range of blended asset portfolios, such as life cycle funds and exchange-traded fund ("ETF")-based portfolios. Weheadquartered in Fairport, New York, we serve a diversified client base of high net worthhigh-net-worth individuals and institutions, including 401(k) plans, pension plans, Taft-Hartley plans, endowments and foundations. Our investment strategies offer equity, fixed income and a range of blended asset portfolios, including life cycle funds.
Impact of COVID-19
We are continuing to address the challenges of COVID-19 by protecting the health and well-being of our employees, while servicing our clients and leveraging technology to fully support our business needs in a primarily digital manner.
We are closely monitoring the impact related to the COVID-19 pandemic on our investment performance, financial statements, capital and liquidity, and our business operations. Our financial condition is stable, which we believe will allow us to effectively manage the financial impacts of COVID-19. We believe our balance sheet should provide us with more than sufficient resources and flexibility to meet our present and future cash needs, as well as to continue investing in key strategic initiatives.
For further discussion regarding the potential future impacts of COVID-19 and related economic conditions on the Company's financial statements, capital and liquidity, and business operations, are based principally insee the United States, with"Risk Factors" section of our headquarters located in Fairport, New York.Annual Report on Form 10-K.
Market Developments
FinancialU.S. equity and fixed income market performance was flat during the third quarter as strong economic growth was met with rising investor consternation over a variety of issues, including the state of the economic cycle. The strength of the economic recovery has sustained for so long that many indicators now appear to be showing an economy that is already in the middle phase of the economic cycle. This is indicative of an evolving economic environment, one where growth is likely to slow from here, and pockets of systematic risk are starting to build.
In addition, inflation has returned, although we believe this is will be largely transitory as supply chain constraints, commodity price increases, and government stimuli wear off. Nevertheless, wage pressures must be closely monitored going forward, particularly as we move later into the cycle, a time when the labor market will further tighten.
Along with economic concerns, markets specificallyare also wrestling with the current tenremoval of the twin tailwinds of fiscal and monetary policy. As these programs swing from easing to neutral, and eventually, to tightening, the immense amount of global liquidity may reverse, providing a headwind for financial assets. Market valuations across equities and fixed income have held in place or mildly contracted throughout the year, bullgiving fundamentals some opportunity to ‘grow into’ to what had been particularly elevated valuations. Given our outlook, and considering the state of market have hadvaluations today, we believe investors should be judicious, and avoid reaching for yield or taking on excess risk.
Other Business Updates
On February 3, 2021, the Board of Directors approved a significant impactshare repurchase program authorizing the purchase of up to $10.0 million of Manning & Napier Inc. Class A common shares. Given the strength of our balance sheet and cash position, the Company planned to use the approved share repurchase program to help offset dilution created from the awards issued under the Company’s long-term incentive plan to our employees during the first quarter of 2021. These equity awards were valued at approximately $6.0 million and will vest over the next 5 years. The authority to repurchase shares will be exercised from time to time as market conditions warrant, is subject to regulatory considerations and will expire on asset flowsDecember 31, 2021. The timing, amount, and other terms and conditions of any repurchases will be determined by management at its discretion based on a variety of factors, including the market valueprice of our assets under management ("AUM"). Though our relative returnsshares, general market and economic conditions, and legal requirements. The repurchase program may be modified, discontinued or suspended at any time. We have been competitive forfunded the program through cash on hand and cash flow. During the nine months ended September 30, 20172021, we purchased a total of 749,005 Class A common shares using approximately $5.7 million in cash.
On March 15, 2021, the Company received notice that 1,592,969 of Class A units of Manning & Napier Group, LLC ("Manning & Napier Group") were tendered for redemption or exchange. The independent directors, on behalf of the Company, decided that such exchange would be settled in 1,592,969 shares of unregistered Class A Common Stock of the Company. The Company completed the exchange on June 30, 2021 and have helped repair our longer-term track records, the one, three, and five year annualized returns for many of our key investment strategies have trailed their related benchmarks in recent years. In addition, we have experienced increased competition as a result, Manning & Napier acquired an equivalent number of lower fee passive investment products which have gained popularity over the last decade, such as index fundsClass A units of Manning & Napier Group and ETFs.
As a resultits ownership of these factors, we have experienced net client outflows since 2013 resulting in an overall decrease in our AUM, which is likelyManning & Napier Group increased from 89.0% to continue in the near term, though at a slower rate of decrease. Additionally, we expect that AUM will decrease approximately $0.4 billion in the fourth quarter of 2017 as a result of the anticipated sale of the Rainier Investment Management U.S. product set. Our ability to increase AUM in the future will depend in part on our ability to execute our investment strategies to achieve competitive investment returns, and on our ability to successfully distribute our products and services, including those that have been areas of strategic focus for us.97.7%.
Our strategic initiatives are focused on gathering and retaining client assets. In response to industry trends and increasing fee pressure from passive strategies offered by our competitors, management is evaluating fees across our product set, including restructuring fees across many of our mutual fund and collective trust products. Management fee reductions and corresponding distribution and shareholder servicing expense reductions for the various series of our funds will be rolled out beginning during the fourth quarter of 2017 and continuing through the first half of 2018. Given the overall pressure on fees that all active managers are facing, we believe that bringing our fund fees to a more competitive level will enhance our ability to attract additional assets in the future.
Additionally, we are actively marketing our Custom Solution program. Custom Solution is a competitively priced consultative advisory service in which we tailor an allocation among proprietary and non-proprietary investment products and vehicles to meet a client’s unique investment objectives and cash flow needs. Direct advisory services such as Custom Solution are an essential part of our strategy to pursue direct relationships with clients built on managing risk and meeting investment objectives over market cycles.
Our ProductsSolutions
We derive substantially all of our revenues from investment management fees earned from providing advisory services to separately managed accounts and to mutual funds and collective investment trusts—including those offered by MNA,Manning & Napier Advisors, LLC ("MNA"), the Manning & Napier Fund, Inc. (the "Fund"), Exeter Trust Company, and Rainier Investment Management.
Management, LLC ("Rainier").
Our separate accounts are primarily distributed through our Direct Channel,wealth management sales channel, where our representativesfinancial consultants form relationships with high net worthhigh-net-worth individuals, middle market institutions or large institutions that are working with a consultant.endowments, foundations, and retirement plans. To a lesser extent, we also obtain a portion of our separate account distribution via third parties, either through our Intermediary Channelintermediary sales channel, where national brokerage firm representatives or independent financial advisors select our separate account strategies for their clients, or through our Platform/Sub-Advisory Channel,platform/sub-advisor relationships, where unaffiliated registered investment advisors approve our strategies for their product platforms. Our separate account productsstrategies are a primary driver of our blended asset portfolios for high net worth,high-net-worth, middle market institutional clients and financial intermediaries. In contrast, larger institutions and unaffiliated registered investment advisor platforms are a driver of our separate account equity portfolios.
Our mutual funds and collective investment trusts are distributed primarily through financial intermediaries, including brokers, financial advisors, retirement plan advisors and platform relationships. We also distribute our mutual fund and collective investment trusts through our direct salesinstitutional representatives, in particularparticularly within the defined contribution, Taft-Hartley, and institutional marketplace. Our mutual fund and collective investment trust productsstrategies are an important driver of both our blended asset class and single asset class portfolios.
Assets Under Management
Our AUM was $26.5 billionsales efforts distinctly separate the Wealth Management clients to which we deliver holistic solutions, including high-net-worth families, endowments and foundations, and small and mid-sized business, from our Institutional and Intermediary clients, including third party advisors, platforms and consultants, as well as larger institutions and Taft-Hartley clients. The table below reflects the estimated composition of our assets under management ("AUM") as of September 30, 2017. The composition of our AUM2021, by vehicle and portfolio is illustrated in the table below:
|
| | | | | | | | | | | | | | | | |
| | | September 30, 2017 |
| AUM - by investment vehicle and portfolio | | Blended Asset | | Equity | | Fixed Income | | Total |
| | | (in millions) |
| Separately managed accounts | | $ | 10,728.4 |
| | $ | 5,412.4 |
| | $ | 1,219.5 |
| | $ | 17,360.3 |
|
| Mutual funds and collective investment trusts | | 5,651.7 |
| | 3,425.0 |
| | 108.8 |
| | 9,185.5 |
|
| Total | | $ | 16,380.1 |
| | $ | 8,837.4 |
| | $ | 1,328.3 |
| | $ | 26,545.8 |
|
The composition of our separately managed accounts as of September 30, 2017, bysales channel and portfolio, is set forth in the table below:investment portfolio:
| | | | | | | | | | | | | | | | | | | | | | | | | | |
| | | September 30, 2021 |
| | Blended
Asset | | Equity | | Fixed Income | | Total |
| | | (dollars in millions) |
| Total AUM | | | | | | | | |
| Wealth Management | | $ | 8,254.2 | | | $ | 982.6 | | | $ | 243.5 | | | $ | 9,480.3 | |
| Institutional and Intermediary | | 6,420.6 | | | 5,247.1 | | | 828.2 | | | 12,495.9 | |
| | | | | | | | |
| Total | | $ | 14,674.8 | | | $ | 6,229.7 | | | $ | 1,071.7 | | | $ | 21,976.2 | |
| Percentage of AUM | | | | | | | | |
| Wealth Management | | 38 | % | | 4 | % | | 1 | % | | 43 | % |
| Institutional and Intermediary | | 29 | % | | 24 | % | | 4 | % | | 57 | % |
| | | | | | | | |
| Total | | 67 | % | | 28 | % | | 5 | % | | 100 | % |
| Percentage of portfolio by channel | | | | | | | | |
| Wealth Management | | 56 | % | | 16 | % | | 23 | % | | 43 | % |
| Institutional and Intermediary | | 44 | % | | 84 | % | | 77 | % | | 57 | % |
| | | | | | | | |
| Total | | 100 | % | | 100 | % | | 100 | % | | 100 | % |
| Percentage of channel by portfolio | | | | | | | | |
| Wealth Management | | 87 | % | | 10 | % | | 3 | % | | 100 | % |
| Institutional and Intermediary | | 51 | % | | 42 | % | | 7 | % | | 100 | % |
| | | | | | | | |
|
| | | | | | | | | | | | | | | | |
| | | September 30, 2017 |
| | | Blended Asset | | Equity | | Fixed Income | | Total |
| | | (dollars in millions) |
| Separate account AUM | | | | | | | | |
| Direct Channel | | $ | 8,167.8 |
| | $ | 3,789.4 |
| | $ | 1,081.9 |
| | $ | 13,039.1 |
|
| Intermediary Channel | | 2,554.8 |
| | 717.5 |
| | 137.6 |
| | 3,409.9 |
|
| Platform/Sub-advisor Channel | | 5.8 |
| | 905.5 |
| | — |
| | 911.3 |
|
| Total | | $ | 10,728.4 |
| | $ | 5,412.4 |
| | $ | 1,219.5 |
| | $ | 17,360.3 |
|
| Percentage of separate account AUM | | | | | | | | |
| Direct Channel | | 47 | % | | 22 | % | | 6 | % | | 75 | % |
| Intermediary Channel | | 15 | % | | 4 | % | | 1 | % | | 20 | % |
| Platform/Sub-advisor Channel | | 0 | % | | 5 | % | | — | % | | 5 | % |
| Total | | 62 | % | | 31 | % | | 7 | % | | 100 | % |
| Percentage of portfolio by channel | | | | | | | | |
| Direct Channel | | 76 | % | | 70 | % | | 89 | % | | 75 | % |
| Intermediary Channel | | 24 | % | | 13 | % | | 11 | % | | 20 | % |
| Platform/Sub-advisor Channel | | 0 | % | | 17 | % | | — | % | | 5 | % |
| Total | | 100 | % | | 100 | % | | 100 | % | | 100 | % |
| Percentage of channel by portfolio | | | | | | | | |
| Direct Channel | | 63 | % | | 29 | % | | 8 | % | | 100 | % |
| Intermediary Channel | | 75 | % | | 21 | % | | 4 | % | | 100 | % |
| Platform/Sub-advisor Channel | | 1 | % | | 99 | % | | — | % | | 100 | % |
Our separate accounts contributed 47% of our total gross client inflows for the nine months ended September 30, 2017 andwealth management channel represented 65%43% of our total AUM as of September 30, 2017.
2021. Blended portfolios are the most significant portion of wealth management assets, representing 87%, while equity and fixed income portfolios represent 10% and 3%, respectively.
Our separate account business has historically been driven primarily by our Direct Channel, where sales representatives form a relationship with high net worth investors, middle market institutions,institutional and large institutional clients working in conjunction with a consultant. The Direct Channel contributed 66% of the total gross client inflows for our separate account business for the nine months ended September 30, 2017 andintermediary channel represented 75%57% of our total separate account AUM as of September 30, 2017. We anticipate the Direct Channel to continue to be2021. Blended portfolios are also the largest driverportion of new separateinstitutional and intermediary assets at 51% of AUM, followed by equity and fixed income portfolios at 42% and 7%, respectively.
As of September 30, 2021, blended portfolios account business going forward, givenfor 67% of our total AUM at $14.7 billion, a 1% decrease from June 30, 2021 when blended assets were $14.9 billion. Blended portfolio AUM is split across distribution channels, with 56% in wealth management and 44% in institutional and intermediary. Equity portfolios account for 28% of our total AUM, at $6.2 billion, a 2% decrease from June 30, 2021 when equity portfolios were at $6.3 billion. Of equity portfolio AUM, 84% is in the Direct Channel’s high net worthinstitutional and middle marketintermediary channel, and 16% is in the wealth management channel. Fixed income portfolios account for 5% of total AUM at $1.1 billion, a 1% increase from June 30, 2021. The majority of fixed income assets come through the institutional client-type focus.and intermediary channel at 77%, and 23% in the wealth management channel.
During the nine months ended September 30, 2017,2021, our wealth management sales channel contributed 32% of our total gross client inflows, while our institutional and intermediary channel contributed 68%. Of the $2.0 billion in gross client inflows, blended asset portfolios represented 68% of the separate account gross client inflows from the Direct Channel,67%, while equity and fixed income portfolios each represented 16%. As of September 30, 2017, blended asset24% and equity portfolios represented 63% and 29%9%, respectively, of total Direct Channel separate account AUM, while our fixed income portfolios were 8%. We expect our focus on individuals and middle market institutions to continue to drive interest in our blended asset class portfolios, where we provide a comprehensive portfolio of stocks and bonds managed to a client’s specific investment objectives. Our relationships with larger institutions may also be a driver of growth in separately managed account equity strategies, though many of these larger institutions may seek exposure to non-U.S. equity strategies through commingled vehicles rather than separately managed accounts to limit related custody expenses.
To a lesser extent, we also obtain separate account business from third parties, including financial advisors or unaffiliated registered investment advisor programs or platforms. During the nine months ended September 30, 2017, 20% of the total gross client inflows for separate accounts came from financial advisor representatives (Intermediary Channel), and an additional 13% came from registered investment advisor platforms (Platform/Sub-advisor Channel). The Intermediary and Platform/Sub-advisor Channels represented 25% of our total separate account AUM as of September 30, 2017.
New separate account business through the Intermediary Channel flowed into both our blended asset and equity portfolios, driven by advisors’ needs to identify either a one-stop solution (blended asset portfolio) or to fill a mandate within a multi-strategy portfolio. During the nine months ended September 30, 2017, blended asset and equity portfolios represented 50% and 22%, respectively, of the separate account gross client inflows from the Intermediary Channel. As of September 30, 2017, 75% of our separate account AUM derived from financial advisors was allocated to blended asset portfolios, with 21% allocated to equity and 4% allocated to fixed income. We expect that equity and fixed income portfolios may see additional interest from financial advisors over time as more advisors structure a multi-strategy portfolio for their clients.
During the nine months ended September 30, 2017, 99% of our separate account gross client inflows from the Platform/Sub-advisory Channel were into equity portfolios. Gross client inflows through the Platform/Sub-advisor Channel are primarily directed to our equity strategies, where we are filling a specific mandate within the investment program or platform product.
Our annualized separate account retention rate across all channels was 80% during the nine months ended September 30, 2017, a decrease from our historical retention rate, which was 85% for the twelve months ended December 31, 2016.
The composition of our mutual fund and collective investment trust AUM as of September 30, 2017, by portfolio, is set forth in the table below:respectively.
|
| | | | | | | | | | | | | | | | |
| | | September 30, 2017 |
| | | Blended Asset | | Equity | | Fixed Income | | Total |
| | | (in millions) |
| Mutual fund and collective investment trust AUM | | $ | 5,651.7 |
| | $ | 3,425.0 |
| | $ | 108.8 |
| | $ | 9,185.5 |
|
Our mutual funds and collective investment trusts contributed 53%Our mutual fund and collective investment trust business is driven by both financial intermediaries and direct sales representatives. Intermediary distribution of our mutual fund and collective investment trust vehicles is achieved via financial advisors, brokers and retirement plan advisors. Through our Intermediary Channel, we are focused on our blended asset life cycle fund vehicles given our emphasis on advisors who work with retirement plans. Our blended asset portfolios are also used by advisors seeking a multi-asset class solution for their retail clients. In addition, we are focused on equity and fixed income portfolios within the Intermediary Channel for intermediaries who wish to use our mutual funds as a component of a larger portfolio.
We also have relationships with consultants and manager research teams at platforms in order to distribute our funds within advisory programs, or through placement on platforms' approved lists of funds. To facilitate our relationships with intermediaries, we currently have approximately 285 dealer relationships. These relationships are important to our retail business as well as our 401(k) life cycle and institutional business.
Through the Direct Channel, we also form relationships with middle market and large market defined contribution plan sponsors seeking to use our life cycle mutual funds and collective investment trusts as default options on their investment menu. Our Direct Sales Representatives also distribute our equity portfolios to large institutional clients with which we have direct relationships and often, the client's consultant. We expect this channel to focus on distributing blended asset and equity portfolio funds in the future.
Results of Operations
Below is a discussion of our consolidated results of operations for the three and nine months ended September 30, 20172021 and 2016.2020.
Components of Results of Operations
Overview
An important factorOne of the most significant factors influencing inflowsnet flows and outflows of our AUM is the investment performance of our various strategies. As an active manager, it is typical for our investment approaches. Our varietystrategies to exhibit portfolio positioning that is notably divergent from benchmarks and common market indices. We believe this is a strength of stock selectionour investment approach, although it can cause substantial performance deviations, both positive and negative, versus common benchmarks. In general, our investment processes have a preference for risk management, focusing heavily on fundamentals and valuations. Historically, we have tended to provide a degree of downside protection in adverse markets, while having participated somewhat less than fully in bull markets. Broadly speaking, we expect our investment approach to reduce volatility and create a smoother performance pattern over time, and we believe these characteristics are desirable and an attractive differentiator in our industry. As a result, the overall performance of our suite of investment strategies absolute pricing discipline and active asset allocation management approach generallyoften differs from many others in the industry, potentially causing the results in specific absolute and relative return characteristics in different market environments. For example, during a fundamental-driven bull market when prices are rising alongside improving fundamentals, we are likelyof our operations to, experience positive absolute returns and competitive relative returns. However, in a more momentum-driven bull market, when prices become disconnected from underlying fundamentals, or narrow market environment where a small handful of stocks outperform the average stock, we are likely to experience positive absolute returns but lagging relative returns. Similarly, during a valuation-driven bear market, when markets experience a period of price correction following a momentum-driven bull market, we are likely to experience negative absolute returns but strong relative returns. However, in a momentum-driven bear market, which is typically characterized by broad price declines in a highly correlated market, we are likely to experience negative absolute returns and potentially lagging relative returns. Essentially, our approach is likely to do well when markets are driven by fundamentals, but lag when markets are driven primarily by momentum.at times, also diverge.
Other components impacting our operating results include:
•asset-based fee rates and changes in those rates;
•the composition of our AUM among various portfolios, vehicles and client types;
•changes in our variable costs, including incentive compensation and distribution, servicing and custody expenses, which are affected by our investment performance, level of our AUM and revenue; and
•fixed costs, including changes to base compensation, vendor-related costs and investment spending on new products.
Assets Under Management and Investment Performance
The following table reflects the indicated components of our AUM for our investment vehiclessales channels for the three and nine months ended September 30, 20172021 and 2016:2020: | | | | | | | | | | | | | | | | Sales Channel (4) |
| | Separately managed accounts | | Mutual funds and collective investment trusts | | Total | | Separately managed accounts | | Mutual funds and collective investment trusts | | Total | | Wealth Management | | Institutional and Intermediary | | Total | | Wealth Management | | Institutional and Intermediary | | Total |
| | | | (in millions) | | | | | | | | | | | | (in millions) | | | | | | | | |
| As of June 30, 2017 | $ | 17,714.9 |
| | $ | 9,360.6 |
| | $ | 27,075.5 |
| | 65 | % | | 35 | % | | 100 | % | |
| As of June 30, 2021 | | As of June 30, 2021 | $ | 9,613.5 | | | $ | 12,648.0 | | | $ | 22,261.5 | | | 43 | % | | 57 | % | | 100 | % |
Gross client inflows (1) | 407.2 |
| | 393.4 |
| | 800.6 |
| | | | | | | Gross client inflows (1) | 211.0 | | | 401.8 | | | 612.8 | | |
Gross client outflows (1) | (1,383.4 | ) | | (928.2 | ) | | (2,311.6 | ) | | | | | | | Gross client outflows (1) | (237.2) | | | (532.5) | | | (769.7) | | |
| Market appreciation/(depreciation) & other (2) | 621.6 |
| | 359.7 |
| | 981.3 |
| | | | | | | Market appreciation/(depreciation) & other (2) | (107.0) | | | (21.4) | | | (128.4) | | |
| As of September 30, 2017 | $ | 17,360.3 |
| | $ | 9,185.5 |
| | $ | 26,545.8 |
| | 65 | % | | 35 | % | | 100 | % | |
| As of September 30, 2021 | | As of September 30, 2021 | $ | 9,480.3 | | | $ | 12,495.9 | | | $ | 21,976.2 | | | 43 | % | | 57 | % | | 100 | % |
| Average AUM for period | $ | 17,707.0 |
| | $ | 9,294.0 |
| | $ | 27,001.0 |
| | | | | | | Average AUM for period | $ | 9,629.3 | | | $ | 12,732.2 | | | $ | 22,361.5 | | |
| | | | | | | | | | | | | |
| As of June 30, 2016 | $ | 20,585.0 |
| | $ | 15,131.2 |
| | $ | 35,716.2 |
| | 58 | % | | 42 | % | | 100 | % | |
| As of June 30, 2020 | | As of June 30, 2020 | $ | 8,334.4 | | | $ | 10,305.9 | | | $ | 18,640.3 | | | 45 | % | | 55 | % | | 100 | % |
Gross client inflows (1) | 374.6 |
| | 752.2 |
| | 1,126.8 |
| | | | | | | Gross client inflows (1) | 250.7 | | | 343.7 | | | 594.4 | | |
Gross client outflows (1) | (1,226.0 | ) | | (2,163.2 | ) | | (3,389.2 | ) | | | | | | | Gross client outflows (1) | (304.9) | | | (674.8) | | | (979.7) | | |
AUM Reclassification (5) | | AUM Reclassification (5) | (266.8) | | | 266.8 | | | — | | |
Market appreciation/(depreciation) & other (2) | 803.4 |
| | 561.3 |
| | 1,364.7 |
| | | | | | | Market appreciation/(depreciation) & other (2) | 89.2 | | | 900.9 | | | 990.1 | | |
| As of September 30, 2016 | $ | 20,537.0 |
| | $ | 14,281.5 |
| | $ | 34,818.5 |
| | 59 | % | | 41 | % | | 100 | % | |
| As of September 30, 2020 | | As of September 30, 2020 | $ | 8,102.6 | | | $ | 11,142.5 | | | $ | 19,245.1 | | | 42 | % | | 58 | % | | 100 | % |
| Average AUM for period | $ | 20,678.1 |
| | $ | 14,767.5 |
| | $ | 35,445.6 |
| | | | | | | Average AUM for period | $ | 8,093.3 | | | $ | 11,129.6 | | | $ | 19,222.9 | | |
| | | | | | | | | | | | | |
| | Separately managed accounts | | Mutual funds and collective investment trusts | | Total | | Separately managed accounts | | Mutual funds and collective investment trusts | | Total | | Wealth Management | | Institutional and Intermediary | | Total | | Wealth Management | | Institutional and Intermediary | | Total |
| | |
| | (in millions) | | |
| | | | | | | | | | (in millions) | | | | | | | | |
| As of December 31, 2016 | $ | 18,801.9 |
| | $ | 12,881.1 |
| | $ | 31,683.0 |
| | 59 | % | | 41 | % | | 100 | % | |
| As of December 31, 2020 | | As of December 31, 2020 | $ | 8,906.4 | | | $ | 11,213.0 | | | $ | 20,119.4 | | | 44 | % | | 56 | % | | 100 | % |
Gross client inflows (1) | 1,384.3 |
| | 1,554.4 |
| | 2,938.7 |
| | | | | | | Gross client inflows (1) | 652.4 | | | 1,374.1 | | | 2,026.5 | | |
Gross client outflows (1) | (5,223.1 | ) | | (6,807.8 | ) | | (12,030.9 | ) | | | | | | | Gross client outflows (1) | (837.7) | | | (1,539.8) | | | (2,377.5) | | |
Market appreciation/(depreciation) & other (2) | 2,397.2 |
| | 1,557.8 |
| | 3,955.0 |
| | | | | | | |
| As of September 30, 2017 | $ | 17,360.3 |
| | $ | 9,185.5 |
| | $ | 26,545.8 |
| | 65 | % | | 35 | % | | 100 | % | |
Market appreciation/(depreciation) & other (2)(3) | | Market appreciation/(depreciation) & other (2)(3) | 759.2 | | | 1,448.6 | | | 2,207.8 | | |
| As of September 30, 2021 | | As of September 30, 2021 | $ | 9,480.3 | | | $ | 12,495.9 | | | $ | 21,976.2 | | | 43 | % | | 57 | % | | 100 | % |
| Average AUM for period | $ | 18,397.8 |
| | $ | 10,784.9 |
| | $ | 29,182.7 |
| | | | | | | Average AUM for period | $ | 9,352.7 | | | $ | 12,178.9 | | | $ | 21,531.6 | | |
| | | | | | | | | | | | | |
| As of December 31, 2015 | $ | 20,735.4 |
| | $ | 14,706.8 |
| | $ | 35,442.2 |
| | 59 | % | | 41 | % | | 100 | % | |
| As of December 31, 2019 | | As of December 31, 2019 | $ | 8,716.4 | | | $ | 10,763.7 | | | $ | 19,480.1 | | | 45 | % | | 55 | % | | 100 | % |
Gross client inflows (1) | 1,295.9 |
| | 2,534.1 |
| | 3,830.0 |
| | | | | | | Gross client inflows (1) | 646.1 | | | 1,169.9 | | | 1,816.0 | | |
Gross client outflows (1) | (4,178.4 | ) | | (5,694.7 | ) | | (9,873.1 | ) | | | | | | | Gross client outflows (1) | (1,040.9) | | | (2,279.6) | | | (3,320.5) | | |
| Acquired assets | 1,234.2 |
| | 1,660.1 |
| | 2,894.3 |
| | | | | | | |
| Market appreciation/(depreciation) & other (2) | 1,449.9 |
| | 1,075.2 |
| | 2,525.1 |
| | | | | | | Market appreciation/(depreciation) & other (2) | (219.0) | | | 1,488.5 | | | 1,269.5 | | |
| As of September 30, 2016 | $ | 20,537.0 |
| | $ | 14,281.5 |
| | $ | 34,818.5 |
| | 59 | % | | 41 | % | | 100 | % | |
| As of September 30, 2020 | | As of September 30, 2020 | $ | 8,102.6 | | | $ | 11,142.5 | | | $ | 19,245.1 | | | 42 | % | | 58 | % | | 100 | % |
| Average AUM for period | $ | 20,584.2 |
| | $ | 14,724.0 |
| | $ | 35,308.2 |
| | | | | | | Average AUM for period | $ | 7,903.8 | | | $ | 10,869.2 | | | $ | 18,773.0 | | |
________________________
| |
(1) | Transfers of client assets between portfolios are included in gross client inflows and gross client outflows. |
| |
(2) | Market appreciation/(depreciation) and other includes investment gains/(losses) on assets under management, the impact of changes in foreign exchange rates and net flows from non-sales related activities including net reinvested dividends. |
(1)Transfers of client assets between portfolios are included in gross client inflows and gross client outflows.
(2)Market appreciation/(depreciation) and other includes investment gains/(losses) on assets under management, the impact of changes in foreign exchange rates and net flows from non-sales related activities including net reinvested dividends.
(3)Beginning in March 2021, AUM includes assets associated with our model-delivery business, previously classified as assets under advisement. These assets totaled $429.9 million at December 31, 2020, comprised of $62.5 million in our wealth management channel and $367.4 million in our institutional and intermediary channel. These amounts are included above in market appreciation (depreciation) and other for the nine months ended September 30, 2021.
(4)AUM and gross client flows between sales channels have been estimated based upon preliminary data. For a limited portion of our mutual fund AUM, reporting by sales channel is not available at the time of this report. Such estimates have no impact on total AUM, total cash flows, or AUM by investment portfolio reported in the table above.
(5)During the third quarter of 2020, the Company identified certain Institutional and Intermediary assets that were incorrectly allocated to the Wealth Management Sales Channel as of June 30, 2020. The difference had no impact to total AUM or AUM by Portfolio as of June 30, 2020 and were reclassified to the appropriate Sales Channel during the third quarter of 2020.
The following table reflects the indicated components of our AUM for our portfolios for the three and nine months ended September 30,
20172021 and
2016:2020: |
| | | | | | | | | | | | | | | | | | | | | | | | | | | |
| | Blended Asset | | Equity | | Fixed Income | | Total | | Blended Asset | | Equity | | Fixed Income | | Total |
| | | | (in millions) | | | | | | | | | | |
| As of June 30, 2017 | $ | 16,613.8 |
| | $ | 9,094.3 |
| | $ | 1,367.4 |
| | $ | 27,075.5 |
| | 61 | % | | 34 | % | | 5 | % | | 100 | % |
Gross client inflows (1) | 468.0 |
| | 278.0 |
| | 54.6 |
| | 800.6 |
| | | | | | | | |
Gross client outflows (1) | (1,193.5 | ) | | (1,014.5 | ) | | (103.6 | ) | | (2,311.6 | ) | | | | | | | | |
Market appreciation/(depreciation) & other (2) | 491.8 |
| | 479.6 |
| | 9.9 |
| | 981.3 |
| | | | | | | | |
| As of September 30, 2017 | $ | 16,380.1 |
| | $ | 8,837.4 |
| | $ | 1,328.3 |
| | $ | 26,545.8 |
| | 62 | % | | 33 | % | | 5 | % | | 100 | % |
| Average AUM for period | $ | 16,538.6 |
| | $ | 9,125.2 |
| | $ | 1,337.2 |
| | $ | 27,001.0 |
| | | | | | | | |
| | | | | | | | | | | | | | | | |
| As of June 30, 2016 | $ | 21,676.8 |
| | $ | 12,608.9 |
| | $ | 1,430.5 |
| | $ | 35,716.2 |
| | 61 | % | | 35 | % | | 4 | % | | 100 | % |
Gross client inflows (1) | 742.8 |
| | 329.1 |
| | 54.9 |
| | 1,126.8 |
| | | | | | | | |
Gross client outflows (1) | (1,628.3 | ) | | (1,612.5 | ) | | (148.4 | ) | | (3,389.2 | ) | | | | | | | | |
Market appreciation/(depreciation) & other (2) | 757.6 |
| | 599.3 |
| | 7.8 |
| | 1,364.7 |
| | | | | | | | |
| As of September 30, 2016 | $ | 21,548.9 |
| | $ | 11,924.8 |
| | $ | 1,344.8 |
| | $ | 34,818.5 |
| | 62 | % | | 34 | % | | 4 | % | | 100 | % |
| Average AUM for period | $ | 21,649.0 |
| | $ | 12,412.7 |
| | $ | 1,383.9 |
| | $ | 35,445.6 |
| | | | | | | | |
| | | | | | | | | | | | | | | | |
| | Blended Asset | | Equity | | Fixed Income | | Total | | Blended Asset | | Equity | | Fixed Income | | Total |
| | | | (in millions) | | | | | | | | | | |
| As of December 31, 2016 | $ | 19,909.4 |
| | $ | 10,463.9 |
| | $ | 1,309.7 |
| | $ | 31,683.0 |
| | 63 | % | | 33 | % | | 4 | % | | 100 | % |
Gross client inflows (1) | 1,733.9 |
| | 914.1 |
| | 290.7 |
| | 2,938.7 |
| | | | | | | | |
Gross client outflows (1) | (7,321.1 | ) | | (4,382.1 | ) | | (327.7 | ) | | (12,030.9 | ) | | | | | | | | |
Market appreciation/(depreciation) & other (2) | 2,057.9 |
| | 1,841.5 |
| | 55.6 |
| | 3,955.0 |
| | | | | | | | |
| As of September 30, 2017 | $ | 16,380.1 |
| | $ | 8,837.4 |
| | $ | 1,328.3 |
| | $ | 26,545.8 |
| | 62 | % | | 33 | % | | 5 | % | | 100 | % |
| Average AUM for period | $ | 17,917.8 |
| | $ | 9,948.0 |
| | $ | 1,316.9 |
| | $ | 29,182.7 |
| | | | | | | | |
| | | | | | | | | | | | | | | | |
| As of December 31, 2015 | $ | 22,442.4 |
| | $ | 11,828.4 |
| | $ | 1,171.4 |
| | $ | 35,442.2 |
| | 64 | % | | 33 | % | | 3 | % | | 100 | % |
Gross client inflows (1) | 2,571.2 |
| | 972.1 |
| | 286.7 |
| | 3,830.0 |
| | | | | | | | |
Gross client outflows (1) | (4,982.2 | ) | | (4,550.1 | ) | | (340.8 | ) | | (9,873.1 | ) | | | | | | | | |
| Acquired assets | — |
| | 2,719.8 |
| | 174.5 |
| | 2,894.3 |
| | | | | | | | |
Market appreciation/(depreciation) & other (2) | 1,517.5 |
| | 954.6 |
| | 53.0 |
| | 2,525.1 |
| | | | | | | | |
| As of September 30, 2016 | $ | 21,548.9 |
| | $ | 11,924.8 |
| | $ | 1,344.8 |
| | $ | 34,818.5 |
| | 62 | % | | 34 | % | | 4 | % | | 100 | % |
| Average AUM for period | $ | 21,840.7 |
| | $ | 12,167.4 |
| | $ | 1,300.1 |
| | $ | 35,308.2 |
| | | | | | | | |
| | | | | | | | | | | | | | | | | | | | | | | | | | | | | | | | | | | | | | | | | | | | | | | |
| Blended
Asset | | Equity | | Fixed
Income | | Total | | Blended
Asset | | Equity | | Fixed
Income | | Total |
| | | | (in millions) | | | | | | | | | | |
| As of June 30, 2021 | $ | 14,868.6 | | | $ | 6,333.9 | | | $ | 1,059.0 | | | $ | 22,261.5 | | | 67 | % | | 28 | % | | 5 | % | | 100 | % |
Gross client inflows (1) | 437.9 | | | 116.5 | | | 58.4 | | | 612.8 | | | | | | | | | |
Gross client outflows (1) | (528.4) | | | (189.8) | | | (51.5) | | | (769.7) | | | | | | | | | |
Market appreciation/(depreciation) & other (2) | (103.3) | | | (30.9) | | | 5.8 | | | (128.4) | | | | | | | | | |
| As of September 30, 2021 | $ | 14,674.8 | | | $ | 6,229.7 | | | $ | 1,071.7 | | | $ | 21,976.2 | | | 67 | % | | 28 | % | | 5 | % | | 100 | % |
| Average AUM for period | $ | 14,908.6 | | | $ | 6,381.1 | | | $ | 1,071.8 | | | $ | 22,361.5 | | | | | | | | | |
| | | | | | | | | | | | | | | |
| As of June 30, 2020 | $ | 13,075.3 | | | $ | 4,561.7 | | | $ | 1,003.3 | | | $ | 18,640.3 | | | 71 | % | | 23 | % | | 6 | % | | 100 | % |
Gross client inflows (1) | 461.3 | | | 104.2 | | | 28.9 | | | 594.4 | | | | | | | | | |
Gross client outflows (1) | (756.6) | | | (191.4) | | | (31.7) | | | (979.7) | | | | | | | | | |
Market appreciation/(depreciation) & other (2) | 587.7 | | | 398.1 | | | 4.3 | | | 990.1 | | | | | | | | | |
| As of September 30, 2020 | $ | 13,367.7 | | | $ | 4,872.6 | | | $ | 1,004.8 | | | $ | 19,245.1 | | | 69 | % | | 26 | % | | 5 | % | | 100 | % |
| Average AUM for period | $ | 13,432.5 | | | $ | 4,785.3 | | | $ | 1,005.1 | | | $ | 19,222.9 | | | | | | | | | |
| | | | | | | | | | | | | | | |
| Blended
Asset | | Equity | | Fixed
Income | | Total | | Blended
Asset | | Equity | | Fixed
Income | | Total |
| | | | (in millions) | | | | | | | | | | |
| As of December 31, 2020 | $ | 13,558.8 | | | $ | 5,545.3 | | | $ | 1,015.3 | | | $ | 20,119.4 | | | 67 | % | | 28 | % | | 5 | % | | 100 | % |
| Gross client inflows (1) | 1,361.4 | | | 487.3 | | | 177.8 | | | 2,026.5 | | | | | | | | | |
| Gross client outflows (1) | (1,602.1) | | | (632.6) | | | (142.8) | | | (2,377.5) | | | | | | | | | |
Market appreciation/(depreciation) & other (2) (3) | 1,356.7 | | | 829.7 | | | 21.4 | | | 2,207.8 | | | | | | | | | |
| As of September 30, 2021 | $ | 14,674.8 | | | $ | 6,229.7 | | | $ | 1,071.7 | | | $ | 21,976.2 | | | 67 | % | | 28 | % | | 5 | % | | 100 | % |
| Average AUM for period | $ | 14,388.1 | | | $ | 6,096.2 | | | $ | 1,047.3 | | | $ | 21,531.6 | | | | | | | | | |
| | | | | | | | | | | | | | | |
| As of December 31, 2019 | $ | 13,473.3 | | | $ | 4,988.8 | | | $ | 1,018.0 | | | $ | 19,480.1 | | | 69 | % | | 26 | % | | 5 | % | | 100 | % |
Gross client inflows (1) | 1,256.0 | | | 440.8 | | | 119.2 | | | 1,816.0 | | | | | | | | | |
Gross client outflows (1) | (2,424.8) | | | (715.6) | | | (180.1) | | | (3,320.5) | | | | | | | | | |
| | | | | | | | | | | | | | | |
Market appreciation/(depreciation) & other (2) | 1,063.2 | | | 158.6 | | | 47.7 | | | 1,269.5 | | | | | | | | | |
| As of September 30, 2020 | $ | 13,367.7 | | | $ | 4,872.6 | | | $ | 1,004.8 | | | $ | 19,245.1 | | | 69 | % | | 26 | % | | 5 | % | | 100 | % |
| Average AUM for period | $ | 13,124.9 | | | $ | 4,635.3 | | | $ | 1,012.8 | | | $ | 18,773.0 | | | | | | | | | |
________________________
| |
(1) | Transfers of client assets between portfolios are included in gross client inflows and gross client outflows. |
| |
(2) | Market appreciation/(depreciation) and other includes investment gains/(losses) on assets under management, the impact of changes in foreign exchange rates and net flows from non-sales related activities including net reinvested dividends. |
(1)Transfers of client assets between portfolios are included in gross client inflows and gross client outflows.
(2)Market appreciation/(depreciation) and other includes investment gains/(losses) on assets under management, the impact of changes in foreign exchange rates and net flows from non-sales related activities including net reinvested dividends.
(3)Beginning in March 2021, AUM includes assets associated with our model-delivery business, previously classified as assets under advisement. These assets totaled $429.9 million at December 31, 2020. These amounts are included above in market appreciation (depreciation) and other for the nine months ended September 30, 2021.
The following table summarizes the annualized returns for several of our key investment strategies and the relative performance of the industry benchmark over the periods indicated.benchmarks. Since inception and over long-term periods, we believe these strategies have earned attractive returns on both an absolute and relative basis. We recognize, however that some key strategies have mixed track records over the past several years. These strategies are used across separate account, mutual fund and collective investment trust vehicles, and represent approximately 80%78% of our AUM as of September 30, 2017.2021.
| | | Key Strategies | AUM as of
September 30, 2017 (in millions) | Inception Date | | Annualized Returns as of September 30, 2017 (3) | Key Strategies | AUM as of
September 30, 2021 (in millions) | Inception Date | | Annualized Returns as of September 30, 2021 (2) |
| | One Year | | Three Year | | Five Year | | Ten Year | | Market Cycle (1) | | Inception | | One Year | | Three Year | | Five Year | | Ten Year | | | Inception |
Long-Term Growth (30%-80% Equity Exposure)
| $ | 7,440.5 |
| 1/1/1973 | | 8.8% | | 4.4% | | 7.2% | | 4.7% | | 6.5% | | 9.6% | Long-Term Growth (30%-80% Equity Exposure) | $ | 6,015.7 | | 1/1/1973 | | 16.4% | | 12.3% | | 10.2% | | 9.6% | | | 9.7% |
| Blended Benchmark: 55% S&P 500 Total Return / 45% Bloomberg Barclays Government/Credit Bond | | | 9.9% | | 7.3% | | 8.7% | | 6.4% | | 5.4% | | 9.3% | |
| Blended Index (3) | | Blended Index (3) | | 15.2% | | 10.4% | | 9.6% | | 9.2% | | | 8.9% |
| Core Non-U.S. Equity | $ | 4,242.2 |
| 10/1/1996 | | 14.4% | | 3.6% | | 6.0% | | 1.6% | | 5.9% | | 7.7% | Core Non-U.S. Equity | $ | 807.5 | | 10/1/1996 | | 30.5% | | 15.2% | | 12.0% | | 9.1% | | | 8.3% |
| Benchmark: ACWIxUS Index | | | 19.6% | | 4.7% | | 7.0% | | 1.3% | | 3.8% | | 5.4% | Benchmark: ACWIxUS Index | | | 23.9% | | 8.0% | | 8.9% | | 7.5% | | | 5.6% |
| Growth with Reduced Volatility (20%-60% Equity Exposure) | $ | 3,322.9 |
| 1/1/1973 | | 6.5% | | 3.4% | | 5.5% | | 4.2% | | 5.9% | | 8.8% | Growth with Reduced Volatility (20%-60% Equity Exposure) | $ | 2,974.1 | | 1/1/1973 | | 12.4% | | 10.6% | | 8.4% | | 7.8% | | | 8.8% |
| Blended Benchmark: 40% S&P 500 Total Return / 60% Bloomberg Barclays Government/Credit Bond | | | 7.1% | | 6.1% | | 6.9% | | 5.9% | | 5.4% | | 8.8% | |
| Blended Index (4) | | Blended Index (4) | | | 10.9% | | 8.9% | | 7.7% | | 7.5% | | | 8.4% |
| Equity-Oriented (70%-100% Equity Exposure) | $ | 1,513.4 |
| 1/1/1993 | | 12.8% | | 5.6% | | 9.6% | | 4.9% | | 6.9% | | 10.0% | Equity-Oriented (70%-100% Equity Exposure) | $ | 1,564.5 | | 1/1/1993 | | 26.1% | | 15.8% | | 14.7% | | 13.1% | | | 10.7% |
| Blended Benchmark: 65% Russell 3000® / 20% ACWIxUS / 15% Bloomberg Barclays U.S. Aggregate Bond | | | 16.0% | | 8.4% | | 11.0% | | 6.0% | | 5.3% | | 8.6% | |
| Blended Benchmark: 65% Russell 3000 / 20% ACWIxUS/ 15% Bloomberg U.S. Aggregate Bond | | Blended Benchmark: 65% Russell 3000 / 20% ACWIxUS/ 15% Bloomberg U.S. Aggregate Bond | | | 25.0% | | 13.0% | | 13.3% | | 12.8% | | | 9.2% |
| Equity-Focused Blend (50%-90% Equity Exposure) | $ | 1,130.9 |
| 4/1/2000 | | 10.4% | | 5.0% | | 8.2% | | 4.9% | | 7.0% | | 7.0% | Equity-Focused Blend (50%-90% Equity Exposure) | $ | 1,217.5 | | 4/1/2000 | | 19.7% | | 13.8% | | 11.8% | | 11.0% | | | 8.0% |
| Blended Benchmark: 53% Russell 3000/ 17% ACWIxUS/ 30% Bloomberg Barclays U.S. Aggregate Bond | | | 13.0% | | 7.4% | | 9.4% | | 5.8% | | 5.4% | | 5.4% | |
| Blended Benchmark: 53% Russell 3000 / 17% ACWIxUS/ 30% Bloomberg U.S. Aggregate Bond | | Blended Benchmark: 53% Russell 3000 / 17% ACWIxUS/ 30% Bloomberg U.S. Aggregate Bond | | 20.1% | | 11.8% | | 11.5% | | 11.1% | | | 6.4% |
| Core Equity-Unrestricted (90%-100% Equity Exposure) | $ | 951.1 |
| 1/1/1995 | | 14.8% | | 6.1% | | 11.4% | | 5.9% | | 7.7% | | 11.1% | Core Equity-Unrestricted (90%-100% Equity Exposure) | $ | 710.1 | | 1/1/1995 | | 28.9% | | 16.4% | | 16.4% | | 14.9% | | | 11.9% |
| Blended Benchmark: 80% Russell 3000® / 20% ACWIxUS | | | 19.0% | | 9.6% | | 12.8% | | 6.4% | | 5.1% | | 9.1% | |
| Blended Benchmark: 80% Russell 3000 / 20% ACWIxUS | | Blended Benchmark: 80% Russell 3000 / 20% ACWIxUS | | | 30.3% | | 14.4% | | 15.3% | | 14.8% | | | 9.9% |
| Core U.S. Equity | $ | 703.4 |
| 7/1/2000 | | 16.1% | | 7.7% | | 12.5% | | 6.4% | | N/A (2) | | 7.5% | Core U.S. Equity | $ | 303.6 | | 7/1/2000 | | 29.7% | | 18.1% | | 18.1% | | 16.1% | | | 9.5% |
| Benchmark: Russell 3000® Index | | | 18.7% | | 10.7% | | 14.2% | | 7.6% | | N/A (2) | | 5.7% | |
| Benchmark: Russell 3000 | | Benchmark: Russell 3000 | | 31.9% | | 16.0% | | 16.9% | | 16.6% | | | 7.6% |
| Conservative Growth (5%-35% Equity Exposure) | $ | 538.8 |
| 4/1/1992 | | 3.6% | | 2.4% | | 3.3% | | 3.8% | | 5.2% | | 6.0% | Conservative Growth (5%-35% Equity Exposure) | $ | 610.4 | | 4/1/1992 | | 6.1% | | 7.2% | | 5.4% | | 5.0% | | | 6.0% |
| Blended Benchmark:15% Russell 3000/ 5% ACWIxUS/ 80% Bloomberg Barclays U.S. Intermediate Aggregate Bond | | | 3.8% | | 3.7% | | 3.9% | | 4.5% | | 5.0% | | 6.2% | |
| Blended Benchmark: 15% Russell 3000 / 5% ACWIxUS / 80% Bloomberg U.S. Intermediate Aggregate Bond | | Blended Benchmark: 15% Russell 3000 / 5% ACWIxUS / 80% Bloomberg U.S. Intermediate Aggregate Bond | | 5.2% | | 6.6% | | 5.1% | | 4.9% | | | 6.1% |
| Aggregate Fixed Income | $ | 495.8 |
| 1/1/1984 | | 0.3% | | 2.3% | | 1.8% | | 4.3% | | 4.9% | | 7.3% | Aggregate Fixed Income | $ | 211.7 | | 1/1/1984 | | (0.4)% | | 5.7% | | 3.2% | | 3.1% | | | 6.9% |
| Benchmark: Bloomberg Barclays U.S. Aggregate Bond | | | 0.1% | | 2.7% | | 2.1% | | 4.3% | | 5.1% | | 7.2% | |
| Benchmark: Bloomberg U.S. Aggregate Bond | | Benchmark: Bloomberg U.S. Aggregate Bond | | | (0.9)% | | 5.4% | | 2.9% | | 3.0% | | | 6.9% |
| Rainier International Small Cap | $ | 629.5 |
| 3/28/2012 | | 22.1% | | 13.2% | | 15.3% | | N/A (2) | | N/A (2) | | 15.4% | Rainier International Small Cap | $ | 1,224.1 | | 3/28/2012 | | 27.7% | | 15.9% | | 15.1% | | N/A (1) | | | 14.4% |
| Benchmark: MSCI ACWIxUS Small Cap Index | | | 19.2% | | 8.1% | | 9.7% | | N/A (2) | | N/A (2) | | 6% | Benchmark: MSCI ACWIxUS Small Cap Index | | 33.1% | | 10.3% | | 10.3% | | N/A (1) | | | 8.4% |
| Disciplined Value | $ | 372.4 |
| 11/1/2003 | | 15.9% | | 9% | | 12.0% | | 8.2% | | N/A (2) | | 10.8% | |
| Disciplined Value US | | Disciplined Value US | $ | 1,448.2 | | 1/1/2013 | | 28.4% | | 9.0% | | 12.1% | | N/A (1) | | | 13.7% |
| Benchmark: Russell 1000 Value | | | 15.1% | | 8.5% | | 13.2% | | 5.9% | | N/A (2) | | 8.4% | Benchmark: Russell 1000 Value | | 35.0% | | 10.1% | | 10.9% | | N/A (1) | | | 13.5% |
__________________________
| |
(1) | The market cycle performance numbers are calculated from April 1, 2000 to September 30, 2017. We believe that a full market cycle time period should contain a wide range of market conditions and usually consists of a bear market, recovery and bull market stage. Our definition of the current market cycle includes the bear market that began with an abrupt decline in the technology sector (4/1/2000 - 9/30/2002), the subsequent failed recovery (10/1/2002 - 10/31/2007), the financial crisis bear market (11/1/2007 - 2/28/2009), and the current bull market (3/1/2009 - current). The period utilized in our current market cycle may differ from periods used by other investment managers.
|
| |
(2) | Performance not available given the product's inception date. |
| |
(3) | Key investment strategy returns are presented net of fees. Benchmark returns do not reflect any fees or expenses. |
(1)Performance not available given the product's inception date.
(2)Key investment strategy returns are presented net of fees. Benchmark returns do not reflect any fees or expenses.
(3)Benchmark shown uses the 55/45 Blended Index from 01/01/1973-12/31/1987 and the 40/15/45 Blended Index from 01/01/1988- 9/30/2021. The 55/45 Blended Index is represented by 55% S&P 500 Total Return Index ("S&P 500") and 45% Bloomberg U.S. Government/Credit Bond Index ("BGCB"). The 40/15/45 Blended Index is 40% Russell 3000 Index ("Russell 3000"), 15% MSCI ACWI ex USA Index ("ACWxUS"), and 45% Bloomberg U.S. Aggregate Bond Index ("BAB").
(4)Benchmark shown uses the 40/60 Blended Index from 01/01/1973-12/31/1987, the 30/10/60 Blended Index from 01/01/1988-12/31/2019, and the 30/10/30/30 Blended Index from 01/01/2020 to 9/30/2021. The 40/60 Blended Index is represented by 40% S&P 500 and 60% BGCB. The 30/10/60 Blended Index is represented by 30% Russell 3000, 10% ACWxUS, and 60% BAB. The 30/10/30/30 Blended Index is represented by 30% Russell 3000, 10% ACWxUS, 30% BAB, and 30% Intermediate Aggregate Bond Index.
Revenue
Our revenues primarily consist of investment management fees earned from managing our clients’ AUM. We earn our investment management fees as a percentage of our clients’ AUM either as of a specified date or on a daily basis. Our investment management fees can fluctuate based on the average fee rate for our investment management products, which are affected by the composition of our AUM among various portfolios and investment vehicles.
The Company servesWe serve as the investment adviser for Manning & Napier Fund, Inc., Rainier Investment Management Mutual Funds, Exeter Trust Company Collective Investment Trusts and Rainier Multiple Investment Trust. The mutual funds are open-end mutual funds that primarily offer no-load share classes designed to meet the needs of a range of institutional and other investors. Exeter Trust Company, an affiliated New Hampshire-chartered trust company and Rainier Multiple Investment Trust sponsor collective investment trusts for qualified retirement plans, including 401(k) plans. These mutual funds and collective investment trusts comprised $9.2$6.1 billion,, or 35%28%, of our AUM as of September 30, 2017.2021. MNA and Rainier also serve as the investment advisor to all of our separately managed accounts, managing $17.4$15.9 billion,, or 65%72%, of our AUM as of September 30, 2017,2021, including assets managed as a sub-advisor to pooled investment vehicles. For the period ended September 30, 20172021 approximately 97%98% of our revenue was earned from clients located in the United States.
In response to industry trends and increasing fee pressure from passive strategies offered by our competitors as well as the anticipated impact of regulatory changes, management is in the midst of an effort to restructure fees across our fund product set. We anticipate that the majority of the financial impacts, including reduced management fees andearn distribution and servicing charges, will occur in the first halffees for providing services to our affiliated mutual funds. Revenue is computed and earned daily based on a percentage of 2018AUM.
We earn custodial service fees for administrative and the impact on our overall revenue margins will vary depending on the business mix at the timesafeguarding services performed by Exeter Trust Company. Fees are calculated as a percentage of the fee change. Given the overall pressure onclient's market value with additional fees that all active managers are facing, we believe that bringing our fund fees to a more competitive level will enhance our ability to attract additional assets in the future.for certain transactions.
Operating Expenses
Our largest operating expenses are employee compensation and related costs, and to a lesser degree, distribution, servicing and custody expenses, discussed further below, with a significant portion of these expenses varying in a direct relationship to our absolute and relative investment management performance, as well as AUM and revenues. We review our operating expenses in relation to the investment market environment and changes in our revenues. However, we are generally willingthe strength of our balance sheet has historically provided us the flexibility to make the expenditures as necessary even when faced with declining rates of growth in revenues in order to support our investment products, our client service levels, strategic initiatives and our long-term value.
•Compensation and related costs. Employee compensation and related costs represent our largest expense, including employee salaries and benefits, incentive compensation to investment and sales professionals, and equity-based compensation issued under our long-term incentive plan as well as equity compensation plan.compensation. These costs are affected by changes in the employee headcount, the mix of existing job descriptions, competitive factors, the addition of new skill sets and variations in the level of our AUM and revenues, changes in our stock price reflected in our share-based compensation and/or the number of awards issued.revenues. In addition, these costs are impacted by the amount of compensation granted under our equity plan and the amount of deferred cash awards granted under our long-term incentive plan. Incentive compensation for our research team considers the cumulative impact of both absolute and relative investment performance over the trailing one-, two- and three-yearhistorical time periods, with more weight placed on the recent periods. As such, incentive compensation paid to our research team will vary, in part, based on absolute and relative investment performance.
•Distribution, servicing and custody expenses. Distribution, servicing and custody expenseexpenses represent amounts paid to various platforms that distribute our mutual fundsintermediaries for distribution, shareholder servicing, administrative servicing and collective trust funds, as well as costs for custodial services, shareholder services, and 12b-1 distribution.services. These expenses generally increase or decrease in line with changes in our mutual fund and collective investment trust AUM or services performed by these intermediaries.
•Other operating costs. Other operating costs include technology costs, accounting, legal and other professional service fees, occupancy and facility costs, travel and entertainment expenses, insurance, market data service expenses and all other miscellaneous costs associated with managing the day-to-day operations of our business.
Non-Operating Income (Loss)
Non-operating income (loss) includes interest expense, interest and dividend income, changes in liability under the tax receivable agreement ("TRA") entered into between Manning & Napier and the other holders of Class A units of Manning & Napier Group, LLC ("Manning & Napier Group"), gains (losses) related to investment securities sales andas well as changes in values of those investment securities designated as trading and equity method investments.securities, at fair value.
We expect the interest and investment components of non-operating income (loss) to fluctuate based on market conditions, the performance of our investments and the overall amount of our investments held by the Company to provide initial cash seeding for product development purposes and short-term investment for cash management opportunities.
Provision for Income Taxes
The Company is comprised of entities that have elected to be treated as either a limited liability company ("LLC") or a "C-Corporation". As such, the entities functioning as LLC'sLLCs are not liable for or able to benefit from U.S. federal or most state and local income taxes on their earnings, and their earnings (losses) will be included in the personal income tax returns of each entity's unit holders. The entities functioning as C-Corporations are liable for or able to benefit from U.S. federal and state and local income taxes on their earnings and losses, respectively.
Noncontrolling Interests
Manning & Napier, Inc. holds an economic interest of approximately 17.8%97.7% in Manning & Napier Group as of September 30, 2017 but,2021 and, as managing member, controls all of the business and affairs of Manning & Napier Group. As a result, the Company consolidates the financial results of Manning & Napier Group and records a noncontrolling interest in our consolidated financial statements. Net income attributable to noncontrolling interests on the consolidated statements of operations represents the portion of earnings attributable to the economic interest in Manning & Napier Group held by the noncontrolling interests.
Critical Accounting Policies and Estimates
There have been no significant changes in ourOur critical accounting policies and estimates from those that wereare disclosed in our Annual Report on Form 10-K for the year ended December 31, 2016.2020.
This management’s discussion and analysis should be read in conjunction with the Company’s Annual Report on Form 10-K for the year ended December 31, 20162020 together with the consolidated financial statements and related notes and the other financial information that appear elsewhere in this report.
Recent Accounting Pronouncements
See Note 2, "Summary of Significant Accounting Policies - Recent Accounting Pronouncements" to the Consolidated Financial Statements included in Item 1 of Part I of this Quarterly Report on Form 10-Q for additional information.
Three Months Ended September 30, 20172021 Compared to Three Months Ended September 30, 20162020
Assets Under Management
The following table reflects changes in our AUM for the three months ended September 30, 20172021 and 2016:2020:
| | | | | | | | | | | | | Three months ended September 30, | | Period-to-Period |
| | | Three months ended September 30, | | Period-to-Period | | | 2021 | | 2020 | | $ | | % |
| | | 2017 | | 2016 | | $ | | % | | | (in millions) | | |
| | | (in millions) | | | |
| Separately managed accounts | | | | | | | | | |
Wealth Management (3) | | Wealth Management (3) | |
| Beginning assets under management | | $ | 17,714.9 |
| | $ | 20,585.0 |
| | $ | (2,870.1 | ) | | (14 | )% | Beginning assets under management | | $ | 9,613.5 | | | $ | 8,334.4 | | | $ | 1,279.1 | | | 15 | % |
Gross client inflows (1) | | 407.2 |
| | 374.6 |
| | 32.6 |
| | 9 | % | Gross client inflows (1) | | 211.0 | | | 250.7 | | | (39.7) | | | (16) | % |
Gross client outflows (1) | | (1,383.4 | ) | | (1,226.0 | ) | | (157.4 | ) | | 13 | % | Gross client outflows (1) | | (237.2) | | | (304.9) | | | 67.7 | | | (22) | % |
AUM Reclassification (4) | | AUM Reclassification (4) | | — | | | (266.8) | | | 266.8 | | | NM |
Market appreciation (depreciation) & other (2) | | 621.6 |
| | 803.4 |
| | (181.8 | ) | | (23 | )% | Market appreciation (depreciation) & other (2) | | (107.0) | | | 89.2 | | | (196.2) | | | (220) | % |
| Ending assets under management | | $ | 17,360.3 |
| | $ | 20,537.0 |
| | $ | (3,176.7 | ) | | (15 | )% | Ending assets under management | | $ | 9,480.3 | | | $ | 8,102.6 | | | $ | 1,377.7 | | | 17 | % |
| Mutual funds and collective investment trusts | | | | | | | | | |
| Average AUM for period | | Average AUM for period | | $ | 9,629.3 | | | $ | 8,093.3 | | | | |
Institutional and Intermediary (3) | | Institutional and Intermediary (3) | |
| Beginning assets under management | | $ | 9,360.6 |
| | $ | 15,131.2 |
| | $ | (5,770.6 | ) | | (38 | )% | Beginning assets under management | | $ | 12,648.0 | | | $ | 10,305.9 | | | $ | 2,342.1 | | | 23 | % |
Gross client inflows (1) | | 393.4 |
| | 752.2 |
| | (358.8 | ) | | (48 | )% | Gross client inflows (1) | | 401.8 | | | 343.7 | | | 58.1 | | | 17 | % |
Gross client outflows (1) | | (928.2 | ) | | (2,163.2 | ) | | 1,235.0 |
| | (57 | )% | Gross client outflows (1) | | (532.5) | | | (674.8) | | | 142.3 | | | (21) | % |
AUM Reclassification (4) | | AUM Reclassification (4) | | — | | | 266.8 | | | (266.8) | | | NM |
Market appreciation (depreciation) & other (2) | | 359.7 |
| | 561.3 |
| | (201.6 | ) | | (36 | )% | Market appreciation (depreciation) & other (2) | | (21.4) | | | 900.9 | | | (922.3) | | | (102) | % |
| Ending assets under management | | $ | 9,185.5 |
| | $ | 14,281.5 |
| | $ | (5,096.0 | ) | | (36 | )% | Ending assets under management | | $ | 12,495.9 | | | $ | 11,142.5 | | | $ | 1,353.4 | | | 12 | % |
| Average AUM for period | | Average AUM for period | | $ | 12,732.2 | | | $ | 11,129.6 | | | | |
| Total assets under management | | | | | | | | | Total assets under management | |
| Beginning assets under management | | $ | 27,075.5 |
| | $ | 35,716.2 |
| | $ | (8,640.7 | ) | | (24 | )% | Beginning assets under management | | $ | 22,261.5 | | | $ | 18,640.3 | | | $ | 3,621.2 | | | 19 | % |
Gross client inflows (1) | | 800.6 |
| | 1,126.8 |
| | (326.2 | ) | | (29 | )% | Gross client inflows (1) | | 612.8 | | | 594.4 | | | 18.4 | | | 3 | % |
Gross client outflows (1) | | (2,311.6 | ) | | (3,389.2 | ) | | 1,077.6 |
| | (32 | )% | Gross client outflows (1) | | (769.7) | | | (979.7) | | | 210.0 | | | (21) | % |
AUM Reclassification (4) | | AUM Reclassification (4) | | — | | | — | | | — | | | — | % |
Market appreciation (depreciation) & other (2) | | 981.3 |
| | 1,364.7 |
| | (383.4 | ) | | (28 | )% | Market appreciation (depreciation) & other (2) | | (128.4) | | | 990.1 | | | (1,118.5) | | | (113) | % |
| Ending assets under management | | $ | 26,545.8 |
| | $ | 34,818.5 |
| | $ | (8,272.7 | ) | | (24 | )% | Ending assets under management | | $ | 21,976.2 | | | $ | 19,245.1 | | | $ | 2,731.1 | | | 14 | % |
| Average AUM for period | | Average AUM for period | | $ | 22,361.5 | | | $ | 19,222.9 | | | | |
________________________
| |
(1) | Transfers of client assets between portfolios are included in gross client inflows and gross client outflows. |
NM - Percentage change not meaningful
| |
(2) | Market appreciation/(depreciation) and other includes investment gains/(losses) on assets under management, the impact of changes in foreign exchange rates and net flows from non-sales related activities including net reinvested dividends. |
(1)Transfers of client assets between portfolios are included in gross client inflows and gross client outflows.
(2)Market appreciation/(depreciation) and other includes investment gains/(losses) on assets under management, the impact of changes in foreign exchange rates and net flows from non-sales related activities including net reinvested dividends.
(3)AUM and gross client flows between sales channels have been estimated based upon preliminary data. For a limited portion of our mutual fund AUM, reporting by sales channel is not available at the time of this report. Such estimates have no impact on total AUM, total cash flows, or AUM by investment portfolio reported in the table above.
(4)During the third quarter of 2020, the Company identified certain Institutional and Intermediary assets that were incorrectly allocated to the Wealth Management Sales Channel as of June 30, 2020. The difference had no impact to total AUM or AUM by Portfolio as of June 30, 2020 and were reclassified to the appropriate Sales Channel during the third quarter of 2020.
Our total AUM decreasedincreased by $8.3$2.7 billion from $34.8$19.2 billion at September 30, 20162020 to $26.5$22.0 billion at September 30, 2017.2021. The decreaseincrease was attributable to market appreciation of $3.9 billion, partially offset by net client outflows of $11.1 billion, partially offset by market appreciation of $2.8$1.2 billion. Net client outflows consisted of approximately $4.9$0.3 billion of net outflows for separate accountswealth management and $6.2$0.8 billion for mutual fundsinstitutional and collective investment trusts.intermediary. By portfolio, the rates of change in AUM from September 30, 20162020 to September 30, 2017
2021 consisted of a $3.1$1.4 billion, or 26% decrease28% increase in our equity portfolio, a $5.2$1.3 billion, or 24% decrease10% increase in our blended asset portfolio, and a decreasean increase of $16.5approximately $66.9 million, or 1%7% in our fixed income portfolio.
We attribute our net cashhave experienced a decrease in the overall rate of outflows to our challenging investment returns, whereby our one, three, and five yearwith gross outflows of approximately $0.8 billion during the quarter ended September 30, 2021, a 21% decrease from the quarter ended September 30, 2020. Gross outflows annualized returns for manyas a percentage of our key investment strategiesAUM, or turnover rate, for the three months ended September 30, 2021 was 14%. We believe outflows have trailed their related benchmarks in recent yearsimproved as a result of our client service efforts and increased competition from lower fee passive investment products. Our ability to improve cash flows going forward will depend onexcellent performance, particularly regarding our ability to sustain improved investmentretain AUM in the most performance sensitive areas of our business, such as our Institutional and execute onIntermediary channel, coupled with the lack of COVID-driven market volatility during the 2021 period as compared to 2020.
The rate of gross client inflows was approximately $0.6 billion during the three months ended September 30, 2021, a 3% increase from the quarter ended September 30, 2020. The 2020 period reflects impacts from COVID related travel restrictions, while 2021 changes in our strategic initiatives focused on gatheringorganization and retainingnational recognition awards boosted our presence within intermediated channels. We believe that by continuing to demonstrate stability in client assets.AUM and modernizing our platform, we will provide a foundation from which we can continue to grow.
The total AUM decrease of $0.5approximately $0.3 billion, to $26.5$22.0 billion at September 30, 20172021 from $27.1$22.3 billion at June 30, 20172021 was attributable to net client cash outflowsmarket depreciation of $1.5$0.1 billion, partially offset by market appreciation of $1.0 billion. Our separate accounts and mutual fund and collective investment trust vehicles had net client outflows of approximately $1.0 billion$0.2 billion. Net client outflows consisted of $26.2 million for wealth management while net client inflows in institutional and $0.5 billion, respectively.intermediary were $130.7 million. The blended investment gainloss was 4%1.1% in separately managedwealth management accounts and 4%0.2% in mutual fundsinstitutional and collective investment trusts.intermediary. By portfolio in the period, our AUM decreased by $0.2 billion in our blended asset portfolio and $0.3$0.1 billion in our equity portfolio, and increased by $39.1$12.7 million in our fixed income portfolio.
As of September 30, 2017,2021, the composition of our AUM was 65%43% in separate accountswealth management and 35%57% in mutual fundsinstitutional and collective investment trusts,intermediary, compared to 59%42% in separate accountswealth management and 41%58% in mutual fundsinstitutional and collective investment trustsintermediary at September 30, 2016.2020. The composition of our AUM across portfolios at September 30, 20172021 was 62%67% in blended assets, 33%28% in equity, and 5% in fixed income, compared to 62%69% in blended assets, 34%26% in equity, and 4%5% in fixed income at September 30, 2016.2020.
With regard toFor our separate accounts,wealth management channel, gross client inflows of $0.4$0.2 billion were offset by approximately $1.4$0.2 billion of gross client outflows during the three months ended September 30, 2017. The $0.4 billion gross2021. Gross client inflows include approximately $0.2 billion into our blended asset portfolio and $0.2less than $0.1 billion into both our equity portfolio. During the three months ended September 30, 2017, 75% of our separate account gross client inflows were derived from our Direct Channel. With regard to gross client outflows, cancellations were approximately $0.5 billion and withdrawals from existing accounts were approximately $0.9 billion. Outflows during the second quarter were 46%, 48% and 6% from blended, equity and fixed income portfolios, respectively. Our separate account clients redeemed assets at a rate of 31%portfolios. Outflows during the quarter compared to a 33% redemption rate over the trailing twelve months ended September 30, 2017. The annualized separate account retention rate was 89% for the three months ended September 30, 2017 compared to 82% for the rolling twelve months ended September 30, 2017.were $0.2 billion, or 87% from blended portfolios, less than $0.1 billion, or 9% from equity, and less than $0.1 billion, or 4% from fixed income portfolios, respectively.
NetGross client inflows of $0.4 billion were offset entirely by gross client outflows of $0.5 billion fromwithin our mutual fundinstitutional and collective investment trusts included gross client inflows of $0.4 billion, offset by gross client outflows of $0.9 billionintermediary channel during the three months ended September 30, 2017.2021. Gross client inflows include approximately $0.3 billion into our blended asset life cycle vehicles, includingportfolios, and less than $0.1 billion into both risk basedour equity and target date strategies, represented $0.3 billion, or 73%, of mutual fund and collective trust fund gross client inflows during the three months ended September 30, 2017.fixed income portfolios. With regard to gross client outflows, $0.6$0.3 billion, or 61%, of mutual fund and collective investment trust gross client outflows were60% was from our blended asset mutual fundportfolios, $0.2 billion or 32% was from our equity portfolios, and collective trust products.less than $0.1 billion, or 8% was from our fixed income portfolios.
The following table sets forth our results of operations and related data for the three months ended September 30, 20172021 and 2016:2020:
| | | | | Three months ended September 30, | | Period-to-Period | | | Three months ended September 30, | | Period-to-Period |
| | | 2017 | | 2016 | | $ | | % | | 2021 | | 2020 | | $ | | % |
| | | (in thousands, except share data) | | | | | (in thousands, except share data) | | |
| Revenues | | | | | | | | | Revenues | |
| Investment management services revenue | | $ | 48,838 |
| | $ | 63,305 |
| | $ | (14,467 | ) | | (23 | )% | |
| Management Fees | | Management Fees | |
| Wealth management | | Wealth management | | $ | 16,366 | | | $ | 13,743 | | | $ | 2,623 | | | 19 | % |
| Institutional and intermediary | | Institutional and intermediary | | 16,209 | | | 13,534 | | | 2,675 | | | 20 | % |
| Distribution and shareholder servicing | | Distribution and shareholder servicing | | 2,278 | | | 2,424 | | | (146) | | | (6) | % |
| Custodial services | | Custodial services | | 1,759 | | | 1,577 | | | 182 | | | 12 | % |
| Other revenue | | Other revenue | | 925 | | | 789 | | | 136 | | | 17 | % |
| Total revenue | | Total revenue | | 37,537 | | | 32,067 | | | 5,470 | | | 17 | % |
| Expenses | | | | | | | | | Expenses | | | | | | | |
| Compensation and related costs | | 22,287 |
| | 24,627 |
| | (2,340 | ) | | (10 | )% | Compensation and related costs | | 18,749 | | | 18,605 | | | 144 | | | 1 | % |
| Distribution, servicing and custody expenses | | 6,920 |
| | 8,798 |
| | (1,878 | ) | | (21 | )% | Distribution, servicing and custody expenses | | 2,512 | | | 2,596 | | | (84) | | | (3) | % |
| Other operating costs | | 7,887 |
| | 8,188 |
| | (301 | ) | | (4 | )% | Other operating costs | | 6,970 | | | 6,611 | | | 359 | | | 5 | % |
| Total operating expenses | | 37,094 |
| | 41,613 |
| | (4,519 | ) | | (11 | )% | Total operating expenses | | 28,231 | | | 27,812 | | | 419 | | | 2 | % |
| Operating income | | 11,744 |
| | 21,692 |
| | (9,948 | ) | | (46 | )% | Operating income | | 9,306 | | | 4,255 | | | 5,051 | | | 119 | % |
| Non-operating income (loss) | | | | | | | | | Non-operating income (loss) | |
| Non-operating income (loss), net | | 847 |
| | (142 | ) | | 989 |
| | * |
| Non-operating income (loss), net | | (73) | | | 550 | | | (623) | | | (113) | % |
| Income before provision for income taxes | | 12,591 |
| | 21,550 |
| | (8,959 | ) | | (42 | )% | Income before provision for income taxes | | 9,233 | | | 4,805 | | | 4,428 | | | 92 | % |
| Provision for income taxes | | 739 |
| | 1,565 |
| | (826 | ) | | (53 | )% | Provision for income taxes | | 2,523 | | | 1,738 | | | 785 | | | 45 | % |
| Net income attributable to controlling and noncontrolling interests | | 11,852 |
| | 19,985 |
| | (8,133 | ) | | (41 | )% | Net income attributable to controlling and noncontrolling interests | | 6,710 | | | 3,067 | | | 3,643 | | | 119 | % |
| Less: net income attributable to noncontrolling interests | | 10,331 |
| | 17,727 |
| | (7,396 | ) | | (42 | )% | Less: net income attributable to noncontrolling interests | | 207 | | | 560 | | | (353) | | | (63) | % |
| Net income attributable to Manning & Napier, Inc. | | $ | 1,521 |
| | $ | 2,258 |
| | $ | (737 | ) | | (33 | )% | Net income attributable to Manning & Napier, Inc. | | $ | 6,503 | | | $ | 2,507 | | | $ | 3,996 | | | 159 | % |
| Per Share Data | | | | | | | | | Per Share Data | | | | | | | |
| Net income per share available to Class A common stock | | | | | | | | | Net income per share available to Class A common stock | |
| Basic | | $ | 0.10 |
| | $ | 0.15 |
| | | | | Basic | | $ | 0.35 | | | $ | 0.15 | | |
| Diluted | | $ | 0.10 |
| | $ | 0.15 |
| | | | | Diluted | | $ | 0.29 | | | $ | 0.13 | | |
| Weighted average shares of Class A common stock outstanding | | | | | | | | | Weighted average shares of Class A common stock outstanding | | | | | |
| Basic | | 14,249,347 |
| | 14,042,880 |
| | | | | Basic | | 18,481,147 | | | 16,176,280 | | |
| Diluted | | 78,210,019 |
| | 14,175,321 |
| | | | | Diluted | | 22,226,455 | | | 18,928,954 | | |
| Cash dividends declared per share of Class A common stock | | $ | 0.08 |
| | $ | 0.16 |
| | | | | |
| | | | | | | | | | | | | | |
| Other financial and operating data | | | | | | | | | Other financial and operating data | |
Economic income (1) | | Economic income (1) | | $ | 9,793 | | | $ | 5,219 | | | $ | 4,574 | | | 88 | % |
Economic net income (1) | | $ | 7,681 |
| | $ | 13,361 |
| | $ | (5,680 | ) | | (43 | )% | Economic net income (1) | | $ | 6,872 | | | $ | 3,170 | | | $ | 3,702 | | | 117 | % |
Economic net income per adjusted share (1) | | $ | 0.10 |
| | $ | 0.16 |
| |
| |
|
| Economic net income per adjusted share (1) | | $ | 0.30 | | | $ | 0.14 | | |
Weighted average adjusted Class A common stock outstanding (1) | | 79,060,711 |
| | 81,171,115 |
| | | | | Weighted average adjusted Class A common stock outstanding(1) | | 23,133,382 | | | 22,395,521 | | |
_______________________
| |
(*) | Percentage change not meaningful |
| |
(1) | See “Management’s Discussion and Analysis of Financial Condition and Results of Operations – Supplemental Non-GAAP Financial Information” for Manning & Napier’s reasons for including these non-GAAP measures in this report in addition to a reconciliation of non-GAAP financial measures to GAAP measures for the periods indicated. |
(1)See “Management’s Discussion and Analysis of Financial Condition and Results of Operations – Supplemental Non-GAAP Financial Information” for Manning & Napier’s reasons for including these measures not calculated in accordance with accounting principles generally accepted in the United States of America ("GAAP") in this report in addition to a reconciliation of non-GAAP financial measures to GAAP measures for the periods indicated.
Revenues
Our investmentWealth management services revenue decreasedincreased by $14.5$2.6 million, or 23%19%, to $48.8$16.4 million for the three months ended September 30, 20172021 from $63.3$13.7 million for the three months ended September 30, 2016.2020. This decreaseincrease is driven primarily by an $8.4a 19%, or $1.5 billion, or 24%, decreaseincrease in our average wealth management AUM to $27.0 billion for the three months ended September 30, 2017 from $35.4 billion for the three months ended September 30, 2016. Average AUM decreased as a result of net client outflows of $11.1 billion, partially offset by market appreciation of $2.8 billion during the rolling twelve months ended September 30, 2017. By portfolio, our AUM decreases were concentrated in our equity and blended asset portfolios, which decreased by 26% and 24%, respectively, compared to September 30, 2016. The outflows were largely attributable to challenging portfolio performance relative to benchmarks and increased competition as a result of an industry shift to lower fee passive investment products.
Our average separately managed account fee for the three months ended September 30, 2017 remained consistent at 0.62% when2021 compared to the three months ended September 30, 2016. For the three months ended2020. At September 30, 2017 and 2016, separately managed account standard fees ranged from 0.15% to 1.25% depending on investment objective and account size. As of September 30, 2017,2021 the concentration of investments in our separately managed accountwealth management assets was 62%were 87% blended assets, 31%10% equity and 7%3% fixed income, compared to 58%91% blended assets, 36%6% equity, and 6%3% fixed income as of September 30, 2016.2020.
Our average fee on mutual fundInstitutional and collective investment trust productsintermediary revenue increased to 0.85% for the three months ended September 30, 2017 from 0.77% for the three months ended September 30, 2016. This increase was primarily due to a single retirement plan relationship which redeemed approximately $2.5 billion during the second quarter of 2017 where the fees were lower than those associated with the remaining population of mutual fund and collective AUM. The management fees earned on our mutual fund and collective investment trust management fees ranged from 0.14% to 1.00%, depending on investment strategy, for the three months ended September 30, 2017 and 2016. As of September 30, 2017, the concentration of assets in our mutual fund and collective investment trusts was 62% blended assets, 37% equity and 1% fixed income, compared to 68% blended assets, 31% equity and 1% fixed income as of September 30, 2016.
Operating Expenses
Our operating expenses decreased by $4.5$2.7 million, or 11%20%, to $37.1$16.2 million for the three months ended September 30, 20172021 from $41.6$13.5 million for the three months ended September 30, 2016.2020. This increase is driven primarily by a 14%, or $1.6 billion, increase in our average institutional and intermediary AUM for the three months ended September 30, 2021 compared to the three months ended September 30, 2020. As of September 30, 2021, the concentration of assets in our institutional and intermediary channel was 51% blended assets, 42% equity and 7% fixed income, compared to 54% blended assets, 39% equity and 7% fixed income as of September 30, 2020.
CompensationDistribution and related costsshareholder servicing revenue decreased by $2.3$0.1 million, or 10%6%, to $22.3$2.3 million for the three months ended September 30, 20172021 from $24.6$2.4 million for the three months ended September 30, 2016.2020. This decrease was driven by lower variable incentive costs as a result of the reductionchange in AUM, coupled with a reduction inbusiness mix within our average overall workforce of 7% comparedmutual funds.
Custodial services increased by $0.2 million, or 12%, to $1.8 million for the three months ended September 30, 2016.2021 from $1.6 million for the three months ended September 30, 2020, in line with changes in our collective investment trust AUM for each period.
Operating Expenses
Our operating expenses increased by $0.4 million, or 2%, to $28.2 million for the three months ended September 30, 2021 from $27.8 million for the three months ended September 30, 2020.
Compensation and related costs increased by $0.1 million, or 1%, to $18.7 million for the three months ended September 30, 2021 from $18.6 million for the three months ended September 30, 2020. This increase in the current quarter compared to the third quarter of 2020 was driven by increases in our sales incentive accruals as well as one time severance costs, partially offset by the impacts of the implementation of a deferred compensation plan during the first quarter of 2021, whereby a fraction of incentive compensation for our most highly compensated employees will be invested in our investment products and vested over a multi-year period. When considered as a percentage of revenue, compensation and related costs was 50% for the three months ended September 30, 2017 was 46% compared to 39%2021 and 58% for the three months ended September 30, 2016. We anticipate that our compensation ratio as a percentage of revenue will remain elevated in the near term compared to prior periods.2020.
Distribution, servicing and custody expenses decreased by $1.9$0.1 million, or 21%3%, to $6.9$2.5 million for the three months ended September 30, 20172021 from $8.8$2.6 million for the three months ended September 30, 2016. The decrease was generally driven by a 37% decrease in mutual fund and collective investment trust average AUM for the three months ended September 30, 2017 compared to the three months ended September 30, 2016. The percentage decrease in AUM exceeds the percentage decrease in expense since 2017 redemptions have been concentrated in those relationships where we do not have distribution and servicing obligations. Specifically, we had a single retirement plan relationship which redeemed approximately $2.5 billion during the second quarter of 2017 where there was no associated distribution obligation.2020. As a percentage of mutual fund and collective investment trust average AUM, distribution, servicing and custody expense was 0.30%0.16% for the three months ended September 30, 2017,2021, compared to 0.24%0.18% for the three months ended September 30, 2016.2020.
Other operating costs for the three months ended September 30, 2017 was $7.92021 were $7.0 million, an increase of approximately $0.4 million, or 5%, compared to $8.2the three months ended September 30, 2020. As a percentage of revenue, other operating costs were 19% for the three months ended September 30, 2021 and 21% for the three months ended September 30, 2020. The increase during the current quarter as compared to the third quarter of 2020 was driven by a $1.2 million gain recognized in the 2020 period related to a reimbursement of expenses paid previously on behalf of the Company's affiliated mutual funds and collective investment trusts.
Non-Operating Income (Loss)
Non-operating loss for the three months ended September 30, 2021 was less than $0.1 million, a decrease of $0.6 million, from non-operating income of $0.6 million for the three months ended September 30, 2016. Included in other operating costs for2020. The following table reflects the three months ended September 30, 2017 were certain one-time costs, including those associated with the adoptioncomponents of the Rainier International Discovery Fund onto the Manning & Napier fund platform and the mutual fund fee restructure. As a percentage of revenue, other operating costs was 16% for the three months ended September 30, 2017 and 13% for the three months ended September 30, 2016.
Non-Operating Income (Loss)
Non-operating income for the three months ended September 30, 2017 was $0.8 million, compared to net loss of $0.1 million for the three months ended September 30, 2016. Included within non-operating income (loss) for the three months ended September 30, 20172021 and 2016 was $0.7 million2020:
| | | | | | | | | | | | | | | | | | | | | | | |
| | Three months ended September 30, | | Period-to-Period |
| 2021 | | 2020 | | $ | | % |
| | (in thousands) | | |
| Non-operating income (loss) | | | | | | | |
| Interest expense | $ | (1) | | | $ | — | | | $ | (1) | | | NM |
| Interest and dividend income | (13) | | | 115 | | | (128) | | | (111) | % |
| Change in liability under tax receivable agreement | — | | | 24 | | | (24) | | | (100) | % |
Net gains (losses) on investments (1) | (59) | | | 411 | | | (470) | | | (114) | % |
| | | | | | | |
| Total non-operating income (loss) | $ | (73) | | | $ | 550 | | | $ | (623) | | | (113) | % |
__________________________
NM - Percentage change not meaningful
(1)The amount of net gains and $0.1 million of net losses, respectively,gain (loss) on investments held by us, to provide initial cash seeding for product development purposes. Interest expense forpurposes and to hedge economic exposure to market movements on our deferred compensation plan, will vary depending on the three months ended September 30, 2017 decreased by approximately $0.1 million compared to the three months ended September 30, 2016, driven by the terminationperformance and overall amount of our credit facility in early 2017 and the unused commitment fee on our credit facility paid in 2016.investments.
Provision for Income Taxes
Our tax provision decreased by $0.8 million to $0.7for income taxes was $2.5 million for the three months ended September 30, 2017 from $1.62021, compared to a provision of $1.7 million for the three months ended September 30, 2016. The change was primarily driven by2020. This increase is attributed to an increase in earnings, coupled with a decrease in taxablehigher portion of Manning & Napier Group's earnings subject to taxation at the C-Corporation level during the three months ended September 30, 2021 compared to the prior year.same period in 2020. Manning & Napier Inc.'s weighted ownership of Manning & Napier Group was 97.7% for the three months ended September 30, 2021 compared to 88.2% for the same period in 2020. This increase in weighted ownership is primarily the result of the annual exchange process between the Company and the holders of its non-controlling interests. In addition, during the three months ended September 30, 2021, we reached a settlement with a certain state related to our 2016, 2017 and 2018 corporate income tax returns. As a result, we recognized approximately $0.3 million within the provision for income taxes during the three months ended September 30, 2021.
Nine Months Ended September 30, 20172021 Compared to Nine Months Ended September 30, 20162020
Assets Under Management
The following table reflects changes in our AUM for the nine months ended September 30, 20172021 and 2016:2020:
| | | | | | | | | | | | | Nine months ended September 30, | | Period-to-Period |
| | | Nine months ended September 30, | | Period-to-Period | | | 2021 | | 2020 | | $ | | % |
| | | 2017 | | 2016 | | $ | | % | | | (in millions) | | |
| | | (in millions) | | | |
| Separately managed accounts | | | | | | | | | |
Wealth Management (4) | | Wealth Management (4) | |
| Beginning assets under management | | $ | 18,801.9 |
| | $ | 20,735.4 |
| | $ | (1,933.5 | ) | | (9 | )% | Beginning assets under management | | $ | 8,906.4 | | | $ | 8,716.4 | | | $ | 190.0 | | | 2 | % |
Gross client inflows (1) | | 1,384.3 |
| | 1,295.9 |
| | 88.4 |
| | 7 | % | Gross client inflows (1) | | 652.4 | | | 646.1 | | | 6.3 | | | 1 | % |
Gross client outflows (1) | | (5,223.1 | ) | | (4,178.4 | ) | | (1,044.7 | ) | | 25 | % | Gross client outflows (1) | | (837.7) | | | (1,040.9) | | | 203.2 | | | (20) | % |
| Acquired assets | | — |
| | 1,234.2 |
| | (1,234.2 | ) | | * |
| |
Market appreciation (depreciation) & other (2) | | 2,397.2 |
| | 1,449.9 |
| | 947.3 |
| | 65 | % | |
Market appreciation (depreciation) & other (2) (3) | | Market appreciation (depreciation) & other (2) (3) | | 759.2 | | | (219.0) | | | 978.2 | | | (447) | % |
| Ending assets under management | | $ | 17,360.3 |
| | $ | 20,537.0 |
| | $ | (3,176.7 | ) | | (15 | )% | Ending assets under management | | $ | 9,480.3 | | | $ | 8,102.6 | | | $ | 1,377.7 | | | 17 | % |
| Mutual funds and collective investment trusts | | | | | | | | | |
| Average AUM for period | | Average AUM for period | | $ | 9,352.7 | | | $ | 7,903.8 | | | | |
Institutional and Intermediary (4) | | Institutional and Intermediary (4) | |
| Beginning assets under management | | $ | 12,881.1 |
| | $ | 14,706.8 |
| | $ | (1,825.7 | ) | | (12 | )% | Beginning assets under management | | $ | 11,213.0 | | | $ | 10,763.7 | | | $ | 449.3 | | | 4 | % |
Gross client inflows (1) | | 1,554.4 |
| | 2,534.1 |
| | (979.7 | ) | | (39 | )% | Gross client inflows (1) | | 1,374.1 | | | 1,169.9 | | | 204.2 | | | 17 | % |
Gross client outflows (1) | | (6,807.8 | ) | | (5,694.7 | ) | | (1,113.1 | ) | | 20 | % | Gross client outflows (1) | | (1,539.8) | | | (2,279.6) | | | 739.8 | | | (32) | % |
| Acquired assets | | — |
| | 1,660.1 |
| | (1,660.1 | ) | | * |
| |
Market appreciation (depreciation) & other (2) | | 1,557.8 |
| | 1,075.2 |
| | 482.6 |
| | 45 | % | |
| Market appreciation (depreciation) & other (2) (3) | | Market appreciation (depreciation) & other (2) (3) | | 1,448.6 | | | 1,488.5 | | | (39.9) | | | (3) | % |
| Ending assets under management | | $ | 9,185.5 |
| | $ | 14,281.5 |
| | $ | (5,096.0 | ) | | (36 | )% | Ending assets under management | | $ | 12,495.9 | | | $ | 11,142.5 | | | $ | 1,353.4 | | | 12 | % |
| Average AUM for period | | Average AUM for period | | $ | 12,178.9 | | | $ | 10,869.2 | | | | |
| Total assets under management | | | | | | | | | Total assets under management | |
| Beginning assets under management | | $ | 31,683.0 |
| | $ | 35,442.2 |
| | $ | (3,759.2 | ) | | (11 | )% | Beginning assets under management | | $ | 20,119.4 | | | $ | 19,480.1 | | | $ | 639.3 | | | 3 | % |
Gross client inflows (1) | | 2,938.7 |
| | 3,830.0 |
| | (891.3 | ) | | (23 | )% | Gross client inflows (1) | | 2,026.5 | | | 1,816.0 | | | 210.5 | | | 12 | % |
Gross client outflows (1) | | (12,030.9 | ) | | (9,873.1 | ) | | (2,157.8 | ) | | 22 | % | Gross client outflows (1) | | (2,377.5) | | | (3,320.5) | | | 943.0 | | | (28) | % |
| Acquired assets | | — |
| | 2,894.3 |
| | (2,894.3 | ) | | * |
| |
Market appreciation (depreciation) & other (2) | | 3,955.0 |
| | 2,525.1 |
| | 1,429.9 |
| | 57 | % | |
| Market appreciation (depreciation) & other (2) (3) | | Market appreciation (depreciation) & other (2) (3) | | 2,207.8 | | | 1,269.5 | | | 938.3 | | | 74 | % |
| Ending assets under management | | $ | 26,545.8 |
| | $ | 34,818.5 |
| | $ | (8,272.7 | ) | | (24 | )% | Ending assets under management | | $ | 21,976.2 | | | $ | 19,245.1 | | | $ | 2,731.1 | | | 14 | % |
| Average AUM for period | | Average AUM for period | | $ | 21,531.6 | | | $ | 18,773.0 | | | | |
________________________
| |
(*) | Percentage change not meaningful |
| |
(1) | Transfers of client assets between portfolios are included in gross client inflows and gross client outflows. |
| |
(2) | Market appreciation/(depreciation) and other includes investment gains/(losses) on assets under management, the impact of changes in foreign exchange rates and net flows from non-sales related activities including net reinvested dividends. |
(1)Transfers of client assets between portfolios are included in gross client inflows and gross client outflows.
(2)Market appreciation/(depreciation) and other includes investment gains/(losses) on assets under management, the impact of changes in foreign exchange rates and net flows from non-sales related activities including net reinvested dividends.
(3)Beginning in March 2021, AUM includes assets associated with our model-delivery business, previously classified as assets under advisement. These assets totaled $429.9 million at December 31, 2020, comprised of $62.5 million in our wealth management channel and $367.4 million in our institutional and intermediary channel. These amounts are included above in market appreciation (depreciation) and other for the nine months ended September 30, 2021.
(4)AUM and gross client flows between sales channels have been estimated based upon preliminary data. For a limited portion of our mutual fund AUM, reporting by sales channel is not available at the time of this report. Such estimates have no impact on total AUM, total cash flows, or AUM by investment portfolio reported in the table above.
Our total AUM decreasedincreased by $8.3$2.7 billion from $34.8$19.2 billion at September 30, 20162020 to $26.5$22.0 billion at September 30, 2017.2021. The decreaseincrease was attributable to market appreciation of $3.9 billion, partially offset by net client outflows of $11.1 billion, partially offset by market appreciation of $2.8$1.2 billion. Net client outflows consisted of approximately $4.9$0.3 billion of net outflows for separate accountswealth management and $6.2$0.8 billion for mutual fundsinstitutional and collective investment trusts. intermediary. By portfolio, the rates of change in AUM from September 30, 2020 to September 30, 2021 consisted of a $1.4 billion, or 28% increase in our equity portfolio, a $1.3 billion, or 10% increase in our blended asset portfolio, and an increase of $66.9 million, or 7% in our fixed income portfolio.
We attributehave experienced a decrease in the overall rate of outflows with gross outflows of approximately $2.4 billion during the nine months ended September 30, 2021, a 28% improvement from the same period through September 30, 2020. Gross
client inflows were approximately $2.0 billion during the nine months ended September 30, 2021, a 12% increase compared to the same period in 2020. We believe that by demonstrating stability in client AUM and in our net cash outflows to our challenging investment returns, whereby our one, three, and five year annualized returns for many of our key investment strategies have trailed their related benchmarks in recent years and increased competition from lower fee passive investment products. Our abilityorganization, along with continuing to improve cash flows going forwardlong-term track records and modernizing our platform, we will depend on our ability to sustain improved investment performance and execute on our strategic initiatives focused on gathering and retaining client assets.provide a foundation from which we can grow.
The total AUM decreaseincrease of $5.1$1.9 billion, or 16%9%, to $26.5$22.0 billion at September 30, 20172021 from $31.7$20.1 billion at December 31, 20162020 was attributable to market appreciation of $2.2 billion, offset by net client cash outflows of $9.1 billion, partially offset by market appreciation of $4.0$0.4 billion. Included in net client flows during the nine months ended September 30, 20172021 were net client outflows in separately managed accountswealth management of approximately $3.8 billion and mutual funds and collective investment trusts of approximately $5.3$0.2 billion. The blended investment gainappreciation was 12.7%8.5% in separately managed accountswealth management and 12.1%12.9% in mutual fundsinstitutional and collective investment trusts.intermediary. By portfolio, our net $5.1$1.9 billion AUM decreaseincrease was derived from a decreaseincreases of $3.5$0.7 billion, or 18%, in our
blended asset portfolio and $1.6 billion, or 16%12%, in our equity portfolio, offset by an increase of $18.6$1.1 billion, or 8%, in our blended asset portfolio and $56.4 million, or 1%6%, in our fixed income portfolio.
As of September 30, 2017,2021, the composition of our AUM was 65%43% in separate accountswealth management and 35%57% in mutual fundsinstitutional and collective investment trusts,intermediary, compared to 59%42% in separate accountswealth management and 41%58% in mutual fundsinstitutional and collective investment trustsintermediary at September 30, 2016.2020. The composition of our AUM across portfolios at September 30, 20172021 was 62%67% in blended assets, 33%28% in equity, and 5% in fixed income, compared to 62%69% in blended assets, 34%26% in equity, and 4%5% in fixed income atas of September 30, 2016.2020.
With regard to our separate accounts,wealth management channel, gross client inflows of $1.4$0.7 billion were offset by approximately $5.2$0.8 billion of gross client outflows during the nine months ended September 30, 2017. The $1.4 billion of gross2021. Gross client inflows included $0.6 billion into our blended asset portfolios, $0.5and less than $0.1 billion into both our equity portfolios and $0.2 billion into fixed income portfolios. During the nine months ended September 30, 2017, 66% of our separate account gross client inflows were derived from our Direct Channel. Gross client inflows were split with 65% contributions from existing accounts and 35% from new relationships. Gross client outflows were split with 45% withdrawals from existing accounts and 55% representing client cancellations. Our blended asset and equity portfolios experienced net client outflows of approximately $1.4 billion and $2.4 billion, respectively. In light of challenging relative returns, our separate account clients redeemed assets at a rate of 37%Outflows during the nine months ended September 30, 2017, compared to a 33% redemption rate over the trailing twelve months ended September 30, 2017.2021 were $0.8 billion, with 87% from blended portfolios, 9% from equity, and 4% from fixed income portfolios, respectively. The annualized separate account retention rate was 80%98% for the nine months ended September 30, 2017, down from 82% for2021,consistent with the rolling twelve months ended September 30, 2017.2021.
Net client outflows of $5.3 billionflows from our mutual fundinstitutional and collective investment trustsintermediary channel were relatively stable and included gross client inflows of $1.6$1.4 billion, offset by gross client outflows of $6.8$1.5 billion during the nine months ended September 30, 2017.2021. Gross client inflows included $0.8 billion, or 57% into our blended asset life cycle vehicles, including both risk based and target date strategies, represented $1.1portfolios, $0.4 billion or 71%, of mutual fund31% into our equity portfolios and collective trust fund gross client inflows$0.2 billion or 12% into our fixed income portfolios during the nine months ended September 30, 2017.2021. With regard to grossinstitutional and intermediary client outflows, $5.3$0.9 billion, or 77%57%, of mutual fund and collective investment trust gross client outflows were from blended asset mutual fund and collective trust products. A single retirement plan relationship redeemed approximately $2.5portfolios, $0.6 billion or 36% were from our blended asset portfolioequity portfolios and $0.1 billion, or 7%, was from our fixed income portfolios during the second quarternine months ended September 30, 2021.
The following table sets forth our results of operations and other data for the nine months ended September 30, 20172021 and 2016:2020: | | | | | Nine months ended September 30, | | Period-to-Period | | | Nine months ended September 30, | | Period-to-Period |
| | | 2017 | | 2016 | | $ | | % | | 2021 | | 2020 | | $ | | % |
| | | (in thousands, except share data) | | | | | (in thousands, except share data) | | |
| Revenues | | | | | | | | | Revenues | |
| Investment management services revenue | | $ | 155,859 |
| | $ | 189,852 |
| | $ | (33,993 | ) | | (18 | )% | |
| Management Fees | | Management Fees | |
| Wealth management | | Wealth management | | $ | 47,825 | | | $ | 41,335 | | | $ | 6,490 | | | 16 | % |
| Institutional and intermediary | | Institutional and intermediary | | 45,678 | | | 38,255 | | | 7,423 | | | 19 | % |
| Distribution and shareholder servicing | | Distribution and shareholder servicing | | 6,667 | | | 7,117 | | | (450) | | | (6) | % |
| Custodial services | | Custodial services | | 5,125 | | | 4,639 | | | 486 | | | 10 | % |
| Other revenue | | Other revenue | | 2,470 | | | 2,176 | | | 294 | | | 14 | % |
| Total revenue | | Total revenue | | 107,765 | | | 93,522 | | | 14,243 | | | 15 | % |
| Expenses | | | | | | | | | Expenses | | | | | | | |
| Compensation and related costs | | 67,901 |
| | 70,973 |
| | (3,072 | ) | | (4 | )% | Compensation and related costs | | 55,970 | | | 55,247 | | | 723 | | | 1 | % |
| Distribution, servicing and custody expenses | | 21,415 |
| | 26,590 |
| | (5,175 | ) | | (19 | )% | Distribution, servicing and custody expenses | | 7,367 | | | 7,834 | | | (467) | | | (6) | % |
| Other operating costs | | 23,099 |
| | 24,854 |
| | (1,755 | ) | | (7 | )% | Other operating costs | | 21,143 | | | 21,197 | | | (54) | | | — | % |
| Total operating expenses | | 112,415 |
| | 122,417 |
| | (10,002 | ) | | (8 | )% | Total operating expenses | | 84,480 | | | 84,278 | | | 202 | | | — | % |
| Operating income | | 43,444 |
| | 67,435 |
| | (23,991 | ) | | (36 | )% | Operating income | | 23,285 | | | 9,244 | | | 14,041 | | | 152 | % |
| Non-operating income (loss) | | | | | | | | | Non-operating income (loss) | |
| Non-operating income (loss), net | | 2,835 |
| | 1,216 |
| | 1,619 |
| | 133 | % | Non-operating income (loss), net | | 641 | | | (1,087) | | | 1,728 | | | (159) | % |
| Income before provision for income taxes | | 46,279 |
| | 68,651 |
| | (22,372 | ) | | (33 | )% | Income before provision for income taxes | | 23,926 | | | 8,157 | | | 15,769 | | | 193 | % |
| Provision for income taxes | | 3,324 |
| | 4,784 |
| | (1,460 | ) | | (31 | )% | |
| Provision for (benefit from) income taxes | | Provision for (benefit from) income taxes | | 4,511 | | | (28) | | | 4,539 | | | (16,211) | % |
| Net income attributable to controlling and noncontrolling interests | | 42,955 |
| | 63,867 |
| | (20,912 | ) | | (33 | )% | Net income attributable to controlling and noncontrolling interests | | 19,415 | | | 8,185 | | | 11,230 | | | 137 | % |
| Less: net income attributable to noncontrolling interests | | 37,852 |
| | 56,586 |
| | (18,734 | ) | | (33 | )% | Less: net income attributable to noncontrolling interests | | 1,747 | | | 3,274 | | | (1,527) | | | (47) | % |
| Net income attributable to Manning & Napier, Inc. | | $ | 5,103 |
| | $ | 7,281 |
| | $ | (2,178 | ) | | (30 | )% | Net income attributable to Manning & Napier, Inc. | | $ | 17,668 | | | $ | 4,911 | | | $ | 12,757 | | | 260 | % |
| Per Share Data | | | | | | | | | Per Share Data | | | | | | | |
| Net income per share available to Class A common stock | | | | | | | | | Net income per share available to Class A common stock | |
| Basic | | $ | 0.35 |
| | $ | 0.49 |
| | | | | Basic | | $ | 1.01 | | | $ | 0.30 | | |
| Diluted | | $ | 0.35 |
| | $ | 0.48 |
| | | | | Diluted | | $ | 0.85 | | | $ | 0.15 | | |
| Weighted average shares of Class A common stock outstanding | | | | | | | | | Weighted average shares of Class A common stock outstanding | | | | | |
| Basic | | 14,135,288 |
| | 13,916,721 |
| | | | | Basic | | 17,493,299 | | | 16,041,128 | | |
| Diluted | | 14,241,642 |
| | 14,173,283 |
| | | | | Diluted | | 20,843,170 | | | 48,339,759 | | |
| Cash dividends declared per share of Class A common stock | | $ | 0.24 |
| | $ | 0.48 |
| | | | | |
| | | | | | | | | | | | | | | |
| Other financial and operating data | | | | | | | | | Other financial and operating data | |
Economic income (1) | | Economic income (1) | | $ | 26,202 | | | $ | 10,248 | | | $ | 15,954 | | | 156 | % |
Economic net income (1) | | $ | 28,230 |
| | $ | 42,570 |
| | $ | (14,340 | ) | | (34 | )% | Economic net income (1) | | $ | 20,959 | | | $ | 8,707 | | | $ | 12,252 | | | 141 | % |
Economic net income per adjusted share (1) | | $ | 0.35 |
| | $ | 0.52 |
| | | | | Economic net income per adjusted share (1) | | $ | 0.90 | | | $ | 0.17 | | |
Weighted average adjusted Class A common stock outstanding (1) | | 79,747,791 |
| | 82,282,598 |
| | | | | Weighted average adjusted Class A common stock outstanding (1) | | 23,333,816 | | | 50,460,114 | | |
________________________
| |
(1) | See “Management’s Discussion and Analysis of Financial Condition and Results of Operations – Supplemental Non-GAAP Financial Information” for Manning & Napier’s reasons for including these non-GAAP measures in this report in addition to a reconciliation of non-GAAP financial measures to GAAP measures for the periods indicated. |
(1)See “Management’s Discussion and Analysis of Financial Condition and Results of Operations – Supplemental Non-GAAP Financial Information” for Manning & Napier’s reasons for including these non-GAAP measures in this report in addition to a reconciliation of non-GAAP financial measures to GAAP measures for the periods indicated.
Revenues
Our investmentWealth management services revenue decreasedincreased by $34.0$6.5 million, or 18%16%, to $155.9$47.8 million for the nine months ended September 30, 20172021 from $189.9$41.3 million for the nine months ended September 30, 2016.2020. This decrease wasincrease is driven primarily by a $6.1 billion, or 17%, decreasean 18% increase in our average wealth management AUM to $29.2 billion for the nine months ended September 30, 2017 from $35.3 billion for2021 compared to the nine
months ended September 30, 2016. Average AUM decreased as a result of net client outflows of $11.1 billion offset by market appreciation and other changes of $2.8 billion for the rolling twelve months ended September 30, 2017. By portfolio, our equity and blended asset portfolios decreased by 26% and 24%, respectively, compared to September 30, 2016. The outflows were largely attributable to challenging portfolio performance relative to benchmarks.
Our average separately managed account fee remained consistent at 0.62% for the nine months ended September 30, 2017 compared to 0.62% for the nine months ended September 30, 2016. For both the nine months ended September 30, 2017 and 2016, separately managed account management fees ranged from 0.15% to 1.25%, depending on investment objective and account size.2020. As of September 30, 2017,2021, the concentration of assets in our separately managed accountswealth management channel was 62%87% blended
assets, 31%10% equity and 7%3% fixed income, compared to 58%91% blended assets, 36%6% equity and 6%3% fixed income as ofat September 30, 2016.2020.
Our average fee on mutual fundInstitutional and collective investment trust products was 0.81% for the nine months ended September 30, 2017, an increase from 0.78% for the nine months ended September 30, 2016. This increase was primarily due to a single retirement plan relationship which redeemed approximately $2.5 billion during the second quarter of 2017 where the fees were lower than those associated with the remaining population of mutual fund and collective AUM. For both the nine months ended September 30, 2017 and 2016, mutual fund and collective investment trust management fees ranged from 0.14% to 1.00%, depending on investment strategy. As of September 30, 2017 the concentration of assets in our mutual fund and collective investment trusts was 62% blended assets, 37% equity and 1% fixed income, compared to 68% blended assets, 31% equity and 1% fixed income as of September 30, 2016.
Operating Expenses
Our operating expenses decreasedintermediary revenue increased by $10.0$7.4 million, or 8%19%, to $112.4$45.7 million for the nine months ended September 30, 20172021 from $122.4$38.3 million for the nine months ended September 30, 2016.2020. This increase is driven primarily by a 12%, or $1.3 billion, increase in average institutional and intermediary AUM for the nine months ended September 30, 2021 compared to the nine months ended September 30, 2020. As of September 30, 2021 the concentration of assets in our institutional and intermediary channel was 51% blended assets, 42% equity and 7% fixed income, compared to 54% blended assets, 39% equity and 7% fixed income as of September 30, 2020.
CompensationDistribution and related costsshareholder servicing revenue decreased by $3.1$0.5 million, or 4%6%, to $67.9$6.7 million for the nine months ended September 30, 20172021 from $71.0$7.1 million for the nine months ended September 30, 2016. The2020. This decrease was primarily driven by lower variablea change in business mix within our mutual funds.
Custodial services revenue increased by $0.5 million, or 10%, to $5.1 million for the nine months ended September 30, 2021 from $4.6 million for the nine months ended September 30, 2020. The increase primarily relates to a corresponding increase in our collective investment trust AUM for each period.
Operating Expenses
Our operating expenses increased by $0.2 million to $84.5 million for the nine months ended September 30, 2021 from $84.3 million for the nine months ended September 30, 2020.
Compensation and related costs increased by $0.7 million, or 1%, to $56.0 million for the nine months ended September 30, 2021 from $55.2 million for the nine months ended September 30, 2020. This change was driven by higher incentive costs ascompensation accruals based on increases in both sales and year to date performance in 2021, partially offset by a result ofdecrease in our workforce and the reductionimpacts from the newly implemented deferred compensation plan in AUM, coupled with a reduction in equity based compensation due to the timing and amount of unvested equity awards.2021. When considered as a percentage of revenue, compensation and related costs was 52% for the nine months ended September 30, 2017 was 44% compared to 37% in 2016. We anticipate that our compensation ratio as a percentage of revenue will remain elevated in2021 and 59% for the near term compared to prior periods.nine months ended September 30, 2020.
Distribution, servicing and custody expenses decreased by $5.2$0.5 million, or 19%6%, to $21.4$7.4 million for the nine months ended September 30, 20172021 from $26.6$7.8 million for the nine months ended September 30, 2016.2020. The decrease was generally attributable toexpense decreased despite a 27% decrease6% increase in mutual fund and collective investment trust average AUM for the nine months ended September 30, 20172021 compared to the nine months ended September 30, 2016. The percentage decrease in2020. AUM exceeds the percentage decrease in expense since 2017 redemptions have beenincreases were concentrated in those relationshipsfund share classes where we dothe company does not haveincur distribution and servicing obligations. Specifically, we had a single retirement plan relationship which redeemed approximately $2.5 billion during the second quarter of 2017 where there was no associated distribution obligation.fees. As a percentage of mutual fund and collective investment trust average AUM, distribution, servicing and custody expense was 0.27%0.17% for the nine months ended September 30, 2017,2021, compared to 0.24%0.19% for the nine months ended September 30, 2016.2020.
Other operating costs decreased by $1.8$0.1 million or 7%, to $23.1$21.1 million for the nine months ended September 30, 20172021 from $24.9$21.2 million for the nine months ended September 30, 2016.2020. As a percentage of revenue, other operating costs for the nine months ended September 30, 20172021 was 15%20% compared to 13%23% for 2016.nine months ended September 30, 2020.
Non-Operating Income (Loss)
Non-operating income for the nine months ended September 30, 20172021 was $2.8$0.6 million, compared to $1.2an increase of $1.7 million, from non-operating loss of $1.1 million for the nine months ended September 30, 2016. Included in2020. The following table reflects the components of non-operating income (loss) wasfor the nine months ended September 30, 2021 and 2020:
| | | | | | | | | | | | | | | | | | | | | | | |
| | Nine months ended September 30, | | Period-to-Period |
| 2021 | | 2020 | | $ | | % |
| | (in thousands) | | |
| Non-operating income (loss) | | | | | | | |
| Interest expense | $ | (4) | | | $ | (5) | | | $ | 1 | | | 20 | % |
Interest and dividend income (1) | 218 | | | 835 | | | (617) | | | (74) | % |
Change in liability under tax receivable agreement (2) | (228) | | | (1,912) | | | 1,684 | | | 88 | % |
Net gains (losses) on investments (3) | 655 | | | (5) | | | 660 | | | 13,200 | % |
| | | | | | | |
| Total non-operating income (loss) | $ | 641 | | | $ | (1,087) | | | $ | 1,728 | | | 159 | % |
__________________________
(1)The decrease in interest and dividend income for the nine months ended September 30, 2021 compared to 2020 is attributable to a decrease in investments, including U.S. Treasury notes and bills, corporate bonds and other short-term investments to optimize cash management opportunities, coupled with a decrease in interest rates.
(2)The change in the liability under the tax receivable agreement for the nine months ended September 30, 2021 is driven by an increase in the Company's expected tax benefits under the tax receivable agreement with the other holders of units of Manning & Napier Group and the corresponding changes in the payment of such benefits. The change during the nine months ended September 30, 2020 is driven by the tax benefits realized with the enactment of the CARES Act.
(3)The amount of net gain of $2.3 million(loss) on investments held by us, to provide initial cash seeding for product development purposes forand to hedge economic exposure to market movements on our deferred compensation plan, will vary depending on the nine months ended September 30, 2017, compared to $1.2 million in 2016. Interest expense for the nine months ended September 30, 2017 decreased by $0.3 million compared to the nine months ended September 30, 2016, driven by the terminationperformance and overall amount of our credit facility in early 2017 and the unused commitment fee on our credit facility paid in 2016.investments.
Provision for Income Taxes
Our tax provision decreased by $1.5 million, or 31%, to $3.3for income taxes was $4.5 million for the nine months ended September 30, 2017 from $4.82021, compared to a benefit of less than $0.1 million for the nine months ended September 30, 2016.2020. The change wasexpense increase is attributed primarily driven byto the 2020 enactment of the CARES Act which includes, among other things, the elimination of certain restrictions on recognizing net operating losses. As a decrease in taxableresult, during the nine months ended September 30, 2020, we recognized an income tax benefit related to the favorable rate applied to our net operating losses. Further, for the nine months ended September 30, 2021, a higher portion of Manning & Napier Group's earnings asis subject to taxation at the C-Corporation level when compared to the prior year.same period in 2020. Manning & Napier Inc.'s weighted ownership of Manning & Napier Group was 92.7% for the nine months ended September 30, 2021, compared to 64.0% during the same period of 2020. This increase is primarily the result of the annual exchange process between the Company and the holders of its non-controlling interests. In addition, during the nine months ended September 30, 2021, we reached a settlement with a certain state related to our 2016, 2017 and 2018 corporate income tax returns. As a result, we recognized approximately $0.3 million within the provision for income taxes during the nine months ended September 30, 2021.
Supplemental Non-GAAP Financial Information
To provide investors with greater insight, promote transparency and allow for a more comprehensive understanding of the information used by management in its financial and operational decision-making, we supplement our consolidated statements of operations presented on a GAAP basis with non-GAAP financial measures of earnings.
Management uses economic income, economic net income and economic net income per adjusted share as financial measures to evaluate the profitability and efficiency of our business as a whole in the ordinary, ongoing and customary course of its business.operations. Economic income, economic net income and economic net income per adjusted share are not presented in accordance with GAAP.
Economic income presents a non-GAAP financial measure of the controlling and non-controlling interests of Manning & Napier Group and excludes from income before provision for income taxes strategic restructuring and transaction costs, net. We define strategic restructuring and transaction costs, net, as items related to our ongoing strategic review focused on the evolution of our distribution strategy and technology initiatives. These costs include severance-related costs, certain consulting and other professional service fees, lease and other contract termination costs, and gain or loss on sale of a business.
Economic net income is a non-GAAP measure of after-tax operating performance and equals ourthe Company’s income before provision for income taxes less adjusted income taxes. Adjusted income taxes are estimated assuming the exchange of all outstanding units of Manning & Napier Group into Class A common stock on a one-to-one basis. Therefore, all income of Manning & Napier Group allocated to the units of Manning & Napier Group is treated as if it were allocated to us and represents an estimate of income tax expense at an effective rate of 39.0%29.8% and 38.0%39.3% for the three months ended September 30, 20172021 and 2016,2020, respectively, and 39.0%of 20.0% and 38.0%15.0% for the nine months ended September 30, 20172021 and 2016,2020, respectively, reflecting assumed federal, state and local income taxes.
Economic net income per adjusted share is a non-GAAP measure and is equal to economic net income divided by the weighted average adjusted Class A common shares outstanding. The number of weighted average adjusted Class A common shares outstanding for all periods presented is determined by assuming the weighted average exchangeable units of Manning & Napier Group, weighted average unvested stock units, weighted average unvested restricted stock awards, and unvested equity awardsweighted average vested stock options are converted into our outstanding Class A common stock as of the respective reporting date, on a one-to-one basis. Our management uses economic net income, among other financial data, to determine the earnings available to distribute as dividends to holders of its Class A common stock and to the holders of the units of Manning & Napier Group.
Non-GAAP measures are not a substitute for financial measures prepared in accordance with GAAP.GAAP and therefore should not be used in isolation of, but in conjunction with, GAAP measures. Additionally, our non-GAAP measures may differ from similar measures used by other companies, even if similar terms are used to identify such measures.
The following table sets forth, for the periods indicated, our other financial and operating data for the nine months endedSeptember 30, 2017 and 2016:data:
| | | | | | | | | | | | | | | | | | | | | | | | | | |
| | | Three months ended September 30, | | Nine months ended September 30, |
| | 2021 | | 2020 | | 2021 | | 2020 |
| | (in thousands, except share data) |
| Economic income (Non-GAAP) | | $ | 9,793 | | | $ | 5,219 | | | $ | 26,202 | | | $ | 10,248 | |
| Economic net income (Non-GAAP) | | $ | 6,872 | | | $ | 3,170 | | | $ | 20,959 | | | $ | 8,707 | |
| Economic net income per adjusted share (Non-GAAP) | | $ | 0.30 | | | $ | 0.14 | | | $ | 0.90 | | | $ | 0.17 | |
| Weighted average adjusted Class A common stock outstanding (Non-GAAP) | | 23,133,382 | | | 22,395,521 | | | 23,333,816 | | | 50,460,114 | |
|
| | | | | | | | | | | | | | | | |
| | | Three months ended September 30, | | Nine months ended September 30, |
| | | 2017 | | 2016 | | 2017 | | 2016 |
| | | (in thousands, except share data) |
| Income before provision for income taxes | | $ | 12,591 |
| | $ | 21,550 |
| | $ | 46,279 |
| | $ | 68,651 |
|
| Economic net income (Non-GAAP) | | $ | 7,681 |
| | $ | 13,361 |
| | $ | 28,230 |
| | $ | 42,570 |
|
| Economic net income per adjusted share (Non-GAAP) | | $ | 0.10 |
| | $ | 0.16 |
| | $ | 0.35 |
| | $ | 0.52 |
|
| Weighted average adjusted Class A common stock outstanding (Non-GAAP) | | 79,060,711 |
| | 81,171,115 |
| | 79,747,791 |
| | 82,282,598 |
|
The following table sets forth, for the periods indicated, a reconciliation of non-GAAP financial measures to GAAP measures:
| | | | | | | | | | | | | | | | | | | | | | | | | | |
| | | Three months ended September 30, | | Nine months ended September 30, |
| | 2021 | | 2020 | | 2021 | | 2020 |
| | | (in thousands, except share data) |
| Net income attributable to Manning & Napier, Inc. | | $ | 6,503 | | | $ | 2,507 | | | $ | 17,668 | | | $ | 4,911 | |
| Add back: Net income attributable to noncontrolling interests | | 207 | | | 560 | | | 1,747 | | | 3,274 | |
| | | | | | | | |
| | | | | | | | |
| Add back: Provision for (benefit from) income taxes | | 2,523 | | | 1,738 | | | 4,511 | | | (28) | |
| Income before provision for (benefit from) income taxes | | $ | 9,233 | | | $ | 4,805 | | | $ | 23,926 | | | $ | 8,157 | |
Add back: Strategic restructuring and transaction costs, net (1) | | 560 | | | 414 | | | 2,276 | | | 2,091 | |
| Economic income (Non-GAAP) | | $ | 9,793 | | | 5,219 | | | 26,202 | | | 10,248 | |
| Adjusted income taxes (Non-GAAP) | | 2,921 | | | 2,049 | | | 5,243 | | | 1,541 | |
| Economic net income (Non-GAAP) | | $ | 6,872 | | | $ | 3,170 | | | $ | 20,959 | | | $ | 8,707 | |
| | | | | | | | |
| Weighted average shares of Class A common stock outstanding - Basic | | 18,481,147 | | | 16,176,280 | | | 17,493,299 | | | 16,041,128 | |
| Assumed vesting, conversion or exchange of: | | | | | | | | |
| Weighted average Manning & Napier Group, LLC units outstanding (noncontrolling interest) | | 428,812 | | | 2,021,781 | | | 1,479,121 | | | 30,713,850 | |
| Weighted average unvested restricted stock units and share awards | | 3,890,091 | | | 3,562,979 | | | 3,885,833 | | | 3,306,941 | |
| Weighted average vested stock options | | 333,332 | | | 634,481 | | | 475,563 | | | 398,195 | |
| Weighted average adjusted shares (Non-GAAP) | | 23,133,382 | | | 22,395,521 | | | 23,333,816 | | | 50,460,114 | |
| | | | | | | | |
| Economic net income per adjusted share (Non-GAAP) | | $ | 0.30 | | | $ | 0.14 | | | $ | 0.90 | | | $ | 0.17 | |
__________________________
(1) Strategic restructuring and transaction costs, net, are included in the following financial statement line items of our Consolidated Statements of Operations:
| | | | | | | | | | | | | | | | | | | | | | | | | | |
| | | Three months ended September 30, | | Nine months ended September 30, |
| | 2021 | | 2020 | | 2021 | | 2020 |
| | (in thousands) |
| Compensation and related costs | | $ | 532 | | | $ | 63 | | | $ | 1,172 | | | $ | 903 | |
| Other operating costs | | 28 | | | 351 | | | 1,104 | | | 1,188 | |
| | | | | | | | |
| Total strategic restructuring and transaction costs, net | | $ | 560 | | | $ | 414 | | | $ | 2,276 | | | $ | 2,091 | |
|
| | | | | | | | | | | | | | | | |
| | | Three months ended September 30, | | Nine months ended September 30, |
| | | 2017 | | 2016 | | 2017 | | 2016 |
| | | (in thousands, except share data) |
| Net income attributable to Manning & Napier, Inc. | | $ | 1,521 |
| | $ | 2,258 |
| | $ | 5,103 |
| | $ | 7,281 |
|
| Add back: Net income attributable to noncontrolling interests | | 10,331 |
| | 17,727 |
| | 37,852 |
| | 56,586 |
|
| Add back: Provision for income taxes | | 739 |
| | 1,565 |
| | 3,324 |
| | 4,784 |
|
| Income before provision for income taxes | | 12,591 |
| | 21,550 |
| | 46,279 |
| | 68,651 |
|
| Adjusted income taxes (Non-GAAP) | | 4,910 |
| | 8,189 |
| | 18,049 |
| | 26,081 |
|
| Economic net income (Non-GAAP) | | $ | 7,681 |
| | $ | 13,361 |
| | $ | 28,230 |
| | $ | 42,570 |
|
| | | | | | | | | |
| Weighted average shares of Class A common stock outstanding - Basic | | 14,249,347 |
| | 14,042,880 |
| | 14,135,288 |
| | 13,916,721 |
|
| Assumed vesting, conversion or exchange of: | | | | | | | | |
| Weighted average Manning & Napier Group, LLC units outstanding (noncontrolling interest) | | 63,937,284 |
| | 65,784,571 |
| | 64,541,055 |
| | 66,686,373 |
|
| Weighted average unvested restricted share-based awards | | 874,080 |
| | 1,343,664 |
| | 1,071,448 |
| | 1,679,504 |
|
| Weighted average adjusted shares (Non-GAAP) | | 79,060,711 |
| | 81,171,115 |
| | 79,747,791 |
| | 82,282,598 |
|
| | | | | | | | | |
| Economic net income per adjusted share (Non-GAAP) | | $ | 0.10 |
| | $ | 0.16 |
| | $ | 0.35 |
| | $ | 0.52 |
|
Liquidity and Capital Resources
Historically, our cash and liquidity needs have been met primarily through cash generated by our operations.operations and cash and cash equivalents on hand. Our current financial condition isat September 30, 2021 was highly liquid, with a significant amount of our assets comprised of cash and cash equivalents, accounts receivable and investment securities held by us for the purpose of optimizing short-term cash management and providing initial cash seeding for product development purposes.
The following table sets forth certain key financial data relating to our liquidity and capital resources as of September 30, 20172021 and December 31, 20162020:
| | | | | September 30, 2017 | | December 31, 2016 | | September 30, 2021 | | December 31, 2020 |
| | | (in thousands) | | | (in thousands) |
| Cash and cash equivalents | | $ | 103,322 |
| | $ | 100,819 |
| Cash and cash equivalents | | $ | 64,567 | | | $ | 57,635 | |
| Accounts receivable | | $ | 17,254 |
| | $ | 22,195 |
| Accounts receivable | | 11,101 | | | 11,915 | |
| Investment securities | | $ | 38,322 |
| | $ | 36,475 |
| Investment securities | | 25,091 | | | 23,497 | |
| Investment securities - consolidated funds | | $ | — |
| | $ | 995 |
| |
Amounts payable under tax receivable agreement (1) | | $ | 34,719 |
| | $ | 37,073 |
| Amounts payable under tax receivable agreement (1) | | $ | 18,757 | | | $ | 18,979 | |
Contingent consideration liability (2) | | $ | — |
| | $ | — |
| |
________________________
| |
(1) | In light of numerous factors affecting our obligation to make such payments, the timing and amounts of any such actual payments are based on our best estimate as of September 30, 2017 and December 31, 2016, including our ability to realize the expected tax benefits. Actual payments may significantly differ from estimated payments.(1)In light of numerous factors affecting our obligation to make such payments, the timing and amounts of any such actual payments are based on our best estimate as of September 30, 2021 and December 31, 2020, including our ability to realize the expected tax benefits. Actual payments may significantly differ from estimated payments. We have no material assets other than our ownership of Class A units of Manning & Napier Group and, accordingly, will depend on distributions from Manning & Napier Group to pay taxes and operating expenses, as well as any dividends we may pay. As managing member of Manning & Napier Group, we will determine the timing and amount of any distributions to be paid to its members. We intend to cause Manning & Napier Group to distribute cash to its members, including us, in an amount sufficient to cover taxes and operating expenses, including dividends, if any, declared by us. If we do cause Manning & Napier Group to make such distributions, Manning & Napier Group Holdings, LLC ("M&N Group Holdings") and any other holders of units of Manning & Napier Group will be entitled to receive equivalent distributions on a pari-passu basis. |
| |
(2) | Represents the fair value of additional cash payments related to our acquisition of Rainier of up to $32.5 million over the period ending December 31, 2019, contingent upon Rainier's achievement of certain financial targets. |
In determining the sufficiency of liquidity and capital resources to fund our business, we regularly monitor our liquidity position, including among other things, cash, working capital, long-term liabilities, lease commitments and operating company distributions.
On January 12, 2017, we terminated our revolving credit agreement that provided borrowing capacityFebruary 3, 2021, the Board of Directors approved a share repurchase program authorizing the purchase of up to $100.0 million. No amounts had been borrowed$10.0 million of Manning & Napier Inc. Class A common shares. Given the strength of our balance sheet and thus nonecash position, the Company intended to use the approved share repurchase program to help offset dilution created from the awards issued under the Company’s long-term incentive plan to our employees during the first quarter of 2021. These equity awards were outstanding. Our decisionvalued at approximately $6.0 million and will vest over the next 5 years. The authority to terminate the facility wasrepurchase shares, which will be exercised from time to time as market conditions warrant, is subject to regulatory considerations and will expire on December 31, 2021. The timing, amount, and other terms and conditions of any repurchases will be determined by management at its discretion based on an evaluationa variety of factors, including the costmarket price of shares, general market and economic conditions, and legal requirements. The repurchase program may be modified, discontinued or suspended at any time. We have funded the program through cash on hand and cash flow. During the nine months ended September 30, 2021, Manning & Napier Inc. purchased a total of 749,005 Class A common shares using approximately $5.7 million in cash.
Given the continued strength of our balance sheet during the six months ended June 30, 2021, along with the renewed stability of our earnings, our Board of Directors reinstated the cash dividends on our Class A common stock while continuing our share repurchase program. As such, on July 20, 2021, the Board of Directors declared a $0.05 per share dividend to the holders of Class A common stock. The dividend was paid on August 16, 2021 to shareholders of record as of August 2, 2021. In addition, on October 22, 2021, the Board of Directors declared a $0.05 per share dividend to the holders of Class A common stock. The dividend is payable on or about November 22, 2021 to shareholders of record as of November 8, 2021. These cash dividends on our Class A common stock were, and any future dividends would be, funded from our portion of distributions made by Manning & Napier Group, from its available cash generated from operations.
As of September 30, 2021, a total of 428,812 units of Manning & Napier Group were held by the noncontrolling interests, including M&N Group Holdings. Pursuant to the terms of the facility,annual exchange process, such units may be tendered for exchange or redemption. On March 15, 2021, the anticipated need to finance capitalCompany received notice that 1,592,969 of Class A units of Manning & Napier Group were tendered for redemption or other projects, and the sufficiency of liquidity and capital resources.
On May 10, 2017, we entered into an agreement to sell certain U.S. equity products to a third party.exchange. The selling price will be determined by the assets under managementindependent directors, on the date of closing, which is expected to be in the fourth quarter of 2017. The amountbehalf of the assets under managementCompany, decided that such exchange would be settled in 1,592,969 shares of unregistered Class A Common Stock of the Company. The Company
completed the exchange on June 30, 2021 and as a result, Manning & Napier acquired an equivalent number of Class A units of Manning & Napier Group and its ownership of Manning & Napier Group increased from 89.0% to be sold97.7%.
With approximately $89.7 million in cash and investment securities on hand as of September 30, 2017 was approximately $0.4 billion.
2021, we expect that we have sufficient liquidity available to meet our needs for the foreseeable future. We believe that cash on hand and cash generated from operations will be sufficient over the next twelve months to meet our working capital requirements. Further, we expect that cash on hand, including short-term investments and cash generated by operations will be sufficient to meet our liquidity needs for the foreseeable future.
Cash Flows
The following table sets forth our cash flows for the nine months ended September 30, 20172021 and 2016.2020. Operating activities consist primarily of net income subject to adjustments for changes in operating assets and liabilities, equity-based compensation expense, changes in the liability under the TRA, and contingent consideration, deferred income tax expense and depreciation and amortization. Investing activities consist primarily of the purchase and sale of investments for the purpose of providing initial cash seeding for product development and for cash management purposes and purchases of property and equipment. Financing activities consist primarily of distributions to noncontrolling interests, purchases of treasury stock, dividends paid on our Class A common stock, payment of shares withheld to satisfy withholding requirements and purchases of Class A units held by noncontrolling interests of Manning & Napier Group.
| | | | | | | | | | | | | | |
| | | Nine months ended September 30, |
| | | 2021 | | 2020 |
| | | (in thousands) |
| Net cash provided by operating activities | | $ | 21,175 | | | $ | 11,199 | |
| Net cash (used in) provided by investing activities | | (1,246) | | | 66,597 | |
| Net cash used in financing activities | | (12,997) | | | (92,709) | |
| Net change in cash and cash equivalents | | $ | 6,932 | | | $ | (14,913) | |
|
| | | | | | | | |
| | | Nine months ended September 30, |
| | | 2017 | | 2016 |
| | | (in thousands) |
| Net cash provided by operating activities | | $ | 41,317 |
| | $ | 65,370 |
|
| Net cash provided by (used in) investing activities | | 687 |
| | (735 | ) |
| Net cash used in financing activities | | (39,501 | ) | | (58,518 | ) |
| Net change in cash and cash equivalents | | $ | 2,503 |
| | $ | 6,117 |
|
Nine Months Ended September 30, 20172021 Compared to Nine Months EndedSeptember 30, 20162020
Operating Activities
Operating activities provided $41.3 million and $65.4 million of net cash for the nine months ended September 30, 2017 and 2016, respectively. This overall $24.1 milliondecrease in net cash provided by operating activities for the nine months ended September 30, 2017 compared to 2016 was due to a decrease in net income after adjustment for non-cash items of approximately $23.0 million driven by lower revenues resulting primarily from changes in our average AUM. This decrease was also due to $3.8 million of cash from consolidated funds due to the timing of trading activity in 2016, partially offset by an increase of $2.7 million in operating assets and liabilities.
Investing Activities
Investing activities provided $0.7$21.2 million and used $0.7$11.2 million of net cash for the nine months ended September 30, 20172021 and 2016,2020, respectively. This overall $10.0 million increase in net cash provided by operating activities for the nine months ended September 30, 2021 compared to 2020 was attributed to an increase in net income after adjustment for non-cash items of approximately $10.8 million during the nine months ended September 30, 2021 compared to the same period of 2020. The increase in net income after adjustment for non-cash items of $24.8 million during the nine months ended September 30, 2021 compared to $14.0 million during the same period in 2020 was driven by higher revenues resulting from an increase in our average AUM. This increase in net cash was partially offset by changes in operating assets and operating liabilities of approximately $0.8 million, driven by the timing and amount of payments of accrued incentive compensation and an increase in payments pursuant to the TRA with $2.1 million paid during the nine months ended September 30, 2021 as a result of the receipt of a $2.4 million income tax refund during the second quarter of 2021.
Investing Activities
Investing activities used $1.2 million and provided $66.6 million of net cash for the nine months ended September 30, 2021 and 2020, respectively. This change was primarily driven by changesa decrease in cash from investing activities of $7.4$67.8 million due to our funding of and timing of activity within our investment securities. During the nine months ended September 30, 2017,2021, we usedreceived approximately $7.5$1.0 million, net, forfrom the purchase, sale and maturity of short-term investments for cash management purposes, which was offset by cash provided of approximately $10.4 million net within our investment securities forcompared to receiving $66.8 million in the purposessame period of new product development due2020, primarily related to the sale of investment securities in order help fund the redemption of certain portfolios andClass A units during the seedingsix months ended June 30, 2020. We used approximately $0.2 million of a new portfolio. In addition, we utilized $9.3 millioncash for acquisitions during 2016. Ourthe purchases of property and equipment was approximately $1.1 million during both the nine months ended September 30, 2017 compared to $0.2 million in 2016.2021 and 2020.
Financing Activities
Financing activities used $39.5$13.0 million and $58.5$92.7 million of net cash for the nine months ended September 30, 20172021 and 2016,2020, respectively. This overall $19.0$79.7 milliondecrease in net cash used in financing activities was primarily the result of a reduction in distributions to noncontrolling interests of $9.7 million and dividends paid on Class A common stock of $2.3 million driven by lower income after adjustment for non-cash items in 2017 compared to 2016. The decrease in cash used in financing activities was also driven by a decrease of $6.3 million of cash used for the purchaseredemption of Class A units of Manning & Napier Group pursuant to the annual exchange agreement entered into atprocess, existing since the time of our IPO, of $9.8$90.8 million in 2020, whereas the Company settled the exchange in 2021 utilizing 1,592,969 shares of unregistered Class A Common Stock of the Company. This decrease in cash used was partially offset by an increase in cash used for the payment of shares withheld to satisfy withholding requirements in connection with the vesting of restricted stock units and exercise of stock options and the purchase of treasury shares during the nine months ended September 30, 2017, 2021. The increase in cash used for the payment of shares withheld to satisfy withholding requirements on equity awards of $4.6 million
compared to $16.1 million in 2016. This decrease was due2020 is attributed to a lower exchange pricethe timing and a lower numberamount of units exchanged in 2017 compared to 2016.stock options exercised during the nine months ended September 30, 2021. In addition, during the nine months ended September 30, 2017 and 20162021 we utilizedused cash of $5.7 million for the purchase of treasury shares under the share repurchase program of up to $10.0 million of Manning & Napier Inc. Class A common shares approved on February 3, 2021. We used cash of approximately $0.3$0.9 million and $1.0$0.6 million during the nine months ended September 30, 2021 and 2020, respectively, for the paymentdividends paid on Class A common stock.
Dividends
We have funded our historical quarterly cash dividends on our Class A common stock, and we believe any future dividends would be funded from our portion of shares withheld to satisfy tax withholdings duedistributions made by Manning & Napier Group, from its available cash generated from operations. Due to the vestingmarket volatility and corresponding earnings volatility that could occur stemming from the COVID-19 pandemic, the Board of equity awards duringDirectors did not approve any cash dividends on our Class A common stock after the respective periods.
Dividendsdividend paid on May 1, 2020 until July 2021. Given the continued strength of our balance sheet, along with the renewed stability of our earnings, our Board of Directors reinstated the cash dividends on our Class A common stock while continuing our share repurchase program.
On October 25, 2016,July 20, 2021, the Board of Directors declared a $0.16 per share dividend to the holders of Class A common stock. The dividend was paid on February 1, 2017 to shareholders of record as of January 13, 2017.
On March 7, 2017, the Board of Directors declared an $0.08 per share dividend to the holders of Class A common stock. The dividend was paid on May 1, 2017 to shareholders of record as of April 14, 2017.
On April 25, 2017, the Board of Directors declared an $0.08$0.05 per share dividend to the holders of Class A common stock. The dividend was paid on August 1, 201716, 2021 to shareholders of record as of July 14, 2017.August 2, 2021.
On July 25, 2017,October 22, 2021, the Board of Directors declared an $0.08 per share dividend to the holders of Class A common stock. The dividend was paid on November 1, 2017 to shareholders of record as of October 13, 2017.
On October 24, 2017, the Board of Directors declared an $0.08a $0.05 per share dividend to the holders of Class A common stock. The dividend is payable on or about February 1, 2018November 22, 2021 to shareholders of record as of January 15, 2018.
We currently intend to pay quarterly cash dividends on our Class A common stock. We intend to fund such dividends from our portion of distributions made by Manning & Napier Group, from its available cash generated from operations. William Manning, as the holder of our Class B common stock, will not be entitled to any cash dividends in his capacity as a Class B stockholder, but will, in his capacity as an indirect holder of Class A units of Manning & Napier Group, generally participate on a pro rata basis in distributions by Manning & Napier Group.November 8, 2021.
The declaration and payment of all future dividends, if any, will be at the sole discretion of our boardBoard of directors.Directors. In determining the amount of any future dividends, our boardBoard of directorsDirectors will take into account:
•the financial results of Manning & Napier Group;
•our available cash, as well as anticipated cash requirements, including any debt servicing and payments required under the TRA;tax receivable agreement or the Exchange Agreement;
•our capital requirements and the capital requirements of our subsidiaries, including Manning & Napier Group;
•contractual, legal, tax and regulatory restrictions on, and implications of, the payment of dividends by us to our stockholdersshareholders or distributions by Manning & Napier Group to us, including the obligation of Manning & Napier Group to make tax distributions to its unitholders, including us;
•general economic and business conditions;conditions, including the impact of the COVID-19 pandemic; and
•any other factors that our boardBoard of directorsDirectors may deem relevant.
We have no material assets other than our ownership of Class A units of Manning & Napier Group and, accordingly, will depend on distributions from Manning & Napier Group to fund any dividends we may pay. As managing member of Manning & Napier Group, we will determine the timing and amount of any distributions to be paid to its members, other than mandatory tax distributions required under Manning & Napier Group's operating agreement. We intend to cause Manning & Napier Group to distribute cash to its members, including us, in an amount sufficient to cover dividends, if any, declared by us. If we do cause Manning & Napier Group to make such distributions, M&N Group Holdings MNCC and any other holders of units of Manning & Napier Group will be entitled to receive equivalent distributions on a pari passu basis.
On March 2, 2021, the Board of Directors approved a $2.5 million distribution from Manning & Napier Group to Manning & Napier and the noncontrolling interests of Manning & Napier Group, of which approximately $0.3 million was paid to the noncontrolling members of Manning & Napier Group. Contractual ObligationsOn April 19, 2021, the Board of Directors approved a $2.5 million distribution from Manning & Napier Group to Manning & Napier and the noncontrolling interests of Manning & Napier Group, of which approximately $0.3 million was paid to the noncontrolling members of Manning & Napier Group.
There have been no material changes in our contractual obligations as set forth in our Annual Report on Form 10-K forOn July 20, 2021, the year ended December 31, 2016.Board of Directors approved a $3.5 million distribution from Manning & Napier Group to Manning & Napier and the noncontrolling interests of Manning & Napier Group, of which approximately $0.1 million was paid to the noncontrolling members of Manning & Napier Group.
Off Balance Sheet Arrangements
We did not have any off-balance sheet arrangements as of September 30, 2017.2021.
Item 3. Quantitative and Qualitative Disclosures About Market Risk
Market RiskAs a "smaller reporting company," we are not required to provide this information.
Our exposure to market risk is directly related to the role
The value of our AUM was $26.5 billion as of September 30, 2017. Assuming a 10% increase or decrease in the value of our AUM and the change being proportionally distributed over all our products, the value would increase or decrease by approximately $2.7 billion, which would cause an annualized increase or decrease in revenues of approximately $18.8 million at our current weighted average fee rate of 0.71%.
We have not adopted a corporate-level risk management policy regarding client assets, nor have we attempted to hedge at the corporate level the market risks that would affect the value of our overall AUM and related revenues. Some of these risks (e.g., sector risks and currency risks) are inherent in certain strategies, and clients may invest in particular strategies to gain exposure to these risks.
We also are subject to market risk from a decline in the prices of investment securities that we own. These securities consist primarily of equity securities, fixed-income securities, investments in mutual funds, including the Fund for which MNA provides advisory services and short-term investment for cash management purposes. The value of these investments was $38.3 million as of September 30, 2017 of which approximately $7.8 million is investment securities classified as trading, $1.1 million is classified as equity method investments and $29.4 million is investment securities classified as available-for-sale. Management regularly monitors the value of these investments; however, given their nature and relative size, we have not adopted a specific risk management policy to manage the associated market risk. Assuming a 10% increase or decrease in the values of these investment securities, the fair value would increase or decrease by approximately $3.8 million at September 30, 2017. Due to the nature of our business, we believe that we do not face any material risk from inflation.
Exchange Rate Risk
A substantial portion of the accounts that we advise, or sub-advise, hold investments that are denominated in currencies other than the U.S. dollar. Movements in the rate of exchange between the U.S. dollar and the underlying foreign currency affect the values of assets held in accounts we manage, thereby affecting the amount of revenues we earn. The value of the assets we manage was $26.5 billion as of September 30, 2017. As of September 30, 2017, approximately 18% of our AUM across our investment strategies was invested in securities denominated in currencies other than the U.S. dollar. To the extent our AUM are denominated in currencies other than the U.S. dollar, the value of those AUM would decrease, with an increase in the value of the U.S. dollar, or increase, with a decrease in the value of the U.S. dollar.
We monitor our exposure to exchange rate risk and make decisions on how to manage such risk accordingly; however, we have not adopted a corporate-level risk management policy to manage exchange rate risk. Assuming that 18% of our AUM is invested in securities denominated in currencies other than the U.S. dollar and excluding the impact of any hedging arrangements, a 10% increase or decrease in the value of the U.S. dollar would increase or decrease the fair value of our AUM by approximately $0.5 billion, which would cause an annualized increase or decrease in revenues of approximately $3.4 million at our current weighted average fee rate of 0.71%.
Interest Rate Risk
The Company was exposed to interest-rate risk primarily due to our AUM that is invested in debt securities, as well as corporate assets that are invested in debt securities and short-term investments. Management considered a hypothetical 100 basis point fluctuation in interest rates and estimated the impact of such a fluctuation on these investments. Management determined there was no material impact as of September 30, 2017. Additionally, given the current level of income we earn from our cash and cash equivalent balances and short-term investments, interest rate changes would not have a material impact on us.
Item 4. Controls and Procedures
Disclosure Controls and Procedures
Our management, including our Chief Executive Officer and PrincipalChief Financial Officer, evaluated the effectiveness of our disclosure controls and procedures as of September 30, 20172021 pursuant to Rule 13a-15 under the Exchange Act. Based on that evaluation, our Chief Executive Officer and PrincipalChief Financial Officer have concluded that, as of September 30, 2017,2021, our disclosure controls and procedures (as defined in Rule 13a-15(e) under the Exchange Act) were effective to ensure that information we are required to disclose in reports that we file or submit under the Exchange Act is recorded, processed, summarized and reported within the time periods specified in SEC rules and forms, and that such information is accumulated and communicated to our management, including our Chief Executive Officer and PrincipalChief Financial Officer, as appropriate, to allow timely decisions regarding required disclosures.
Changes in Internal Control Over Financial Reporting
There were no changes in our internal control over financial reporting during the quarter ended September 30, 20172021 that materially affected, or are reasonably likely to materially affect, our internal control over financial reporting.
PART II—OTHER INFORMATION
Item 1A. Risk Factors
We have set forth in Item 1A to our Annual Report on Form 10-K for the year ended December 31, 20162020 risk factors relating to our business, our industry, our structure and our Class A common stock. Readers of this Quarterly Report on Form 10-Q are referred to such Item 1A for a more complete understanding of risks concerning our company. There have been no material changes in our risk factors since those published in such Form 10-K for the year ended December 31, 2016.2020.
Item 2. Unregistered Sales of Equity Securities and Use of Proceeds
Pursuant to the share repurchase program approved by our Board of Directors in February 2021 for up to $10.0 million of our Class A common shares, during the three months ended September 30, 2021, we repurchased Class A common shares as follows:
| | | | | | | | | | | | | | | | | | | | | | | | | | |
| Period | | Total Number of Shares Purchased | | Average Price Paid Per Share
(in dollars) | | Total Number of Shares Purchased as Part of Publicly Announced Plans or Programs | | Approximate Value of Shares that May Yet Be Purchased Under the Plans or Programs |
| July 1 - 31, 2021 | | 186 | | | $ | 8.42 | | | 186 | | | $ | 4,661,689 | |
| August 1 - 31, 2021 | | 35,154 | | | $ | 9.33 | | | 35,154 | | | $ | 4,333,708 | |
| September 1 - 30, 2021 | | — | | | $ | — | | | — | | | $ | 4,333,708 | |
| Total | | 35,340 | | | $ | — | | | 35,340 | | | $ | 4,333,708 | |
The repurchase program will expire on December 31, 2021.
Item 6. Exhibits
|
| | | | | | | | | | |
| Exhibit No. | | Description | |
| 31.1 | |
| | |
31.1 | | | |
| | |
| 31.2 | | | |
| | |
| 32.1 | | | |
| | |
| 32.2 | | | |
| | |
| 101 | | Materials from the Manning & Napier, Inc. Quarterly Report on Form 10-Q for the quarter ended September 30, 2017,2021, formatted in Extensible Business Reporting Language (XBRL): (i) Consolidated Statements of Financial Condition, (ii) Consolidated Statements of Operations, (iii) Consolidated Statements of Comprehensive Income, (iv) Consolidated StatementStatements of Shareholders’ Equity, (v) Consolidated Statements of Cash Flows, and (vi) related Notes to the Unaudited Consolidated Financial Statements. | |
| | | |
| 104 | | Cover Page Interactive Data File (included in Exhibit 101) | |
SIGNATURES
Pursuant to the requirements of the Securities Exchange Act of 1934, the registrant has duly caused this report to be signed on its behalf by the undersigned thereunto duly authorized.
|
| | | | | | | | | | | | | |
| | MANNING & NAPIER, INC. |
| | |
Dated: November 8, 201712, 2021 | | By: | | /s/ WILLIAM MANNINGMarc Mayer |
| | | | William ManningMarc Mayer |
| | | | Chief Executive Officer |
| | | | (principal executive officer) |
| | |
| | | | /s/ BETH H. GALUSHAPaul J. Battaglia |
| | | | Beth H. GalushaPaul J. Battaglia |
| | | | PrincipalChief Financial Officer |
| | | | (principal financial and accounting officer) |