UNITED STATES
SECURITIES AND EXCHANGE COMMISSION
Washington, D.C. 20549
FORM 10-Q
(Mark One)
|
| |
| x | QUARTERLY REPORT PURSUANT TO SECTION 13 OR 15(d) OF THE SECURITIES EXCHANGE ACT OF 1934 |
For the quarterly period ended June 30, 2018March 31, 2019
OR
|
| |
| ¨ | TRANSITION REPORT PURSUANT TO SECTION 13 OR 15(d) OF THE SECURITIES EXCHANGE ACT OF 1934 |
For the transition period from to
Commission file number: 001-35355
_____________________________________________________________
MANNING & NAPIER, INC.
(Exact name of registrant as specified in its charter)
|
| | |
| Delaware | | 45-2609100 |
(State or other jurisdiction of incorporation or organization) | | (I.R.S. Employer Identification No.) |
| | |
290 Woodcliff Drive Fairport, New York | | 14450 |
| (Address of principal executive offices) | | (Zip Code) |
(585) 325-6880
Registrant’s telephone number, including area code:
(585) 325-6880code
_____________________________________________________________
Indicate by check mark whether the registrant (1) has filed all reports required to be filed by Section 13 or 15(d) of the Securities Exchange Act of 1934 during the preceding 12 months (or for such shorter period that the registrant was required to file such reports), and (2) has been subject to such filing requirements for the past 90 days. Yes x No ¨
Indicate by check mark whether the registrant has submitted electronically and posted on its corporate Web site, if any, every Interactive Data File required to be submitted and posted pursuant to Rule 405 of Regulation S-T during the preceding 12 months (or for such shorter period that the registrant was required to submit and post such files). Yes x No ¨
Indicate by check mark whether the registrant is a large accelerated filer, an accelerated filer, a non-accelerated filer, smaller reporting company, or an emerging growth company. See the definitions of “large accelerated filer,” “accelerated filer,” “smaller reporting company,” and "emerging growth company" in Rule 12b-2 of the Exchange Act:
|
| | | | | | |
| Large accelerated filer | | ¨ | | Accelerated filer | | x¨
|
| | | | |
| Non-accelerated filer | | ¨ (Do not check if a smaller reporting company)
x | | Smaller reporting company | | ¨x |
| | | | | | | |
| | | | | Emerging growth company | | ¨
|
If an emerging growth company, indicate by check mark if the registrant has elected not to use the extended transition period for complying with any new or revised financial accounting standards provided pursuant to Section 13(a) of the Exchange Act. ¨
Indicate by check mark whether the registrant is a shell company (as defined in Rule 12b-2 of the Exchange Act). Yes ¨ No x
Securities registered pursuant to Section 12(b) of the Act:
|
| | |
| Title of each class | Trading Symbol(s) | Name of each exchange on which registered |
| Class A common stock, $0.01 par value per share | MN | New York Stock Exchange |
Indicate the number of shares outstanding of each of the registrant’s classes of common stock, as of the latest practicable date.
|
| | |
| Class | | Outstanding at August 6, 2018May 7, 2019 |
| Class A common stock, $0.01 par value per share | | 15,333,04115,645,595 |
TABLE OF CONTENTS
|
| | |
| | | Page |
| Part I | | |
| Item 1. | | |
| | | |
| | | |
| | | |
| | | |
| | | |
| | | |
| Item 2. | | |
| Item 3. | | |
| Item 4. | | |
| | | |
| Part II | | |
| Item 1A. | | |
| Item 6. | | |
| | | |
| | In this Quarterly Report on Form 10-Q, “we”, “our”, “us”, the “Company”, “Manning & Napier” and the “Registrant” refers to Manning & Napier, Inc. and, unless the context otherwise requires, its consolidated direct and indirect subsidiaries and predecessors. | |
PART I—FINANCIAL INFORMATION
Item 1. Financial Statements
Manning & Napier, Inc.
Consolidated Statements of Financial Condition
(InU.S. dollars in thousands, except share data)
| | | | | June 30, 2018 | | December 31, 2017 | | March 31, 2019 | | December 31, 2018 |
| | | (unaudited) | | | | (unaudited) | | |
| Assets | | | | | | | | |
| Cash and cash equivalents | | $ | 77,198 |
| | $ | 78,262 |
| | $ | 54,308 |
| | $ | 59,586 |
|
| Accounts receivable | | 12,863 |
| | 15,337 |
| | 10,751 |
| | 11,447 |
|
| Investment securities | | 69,376 |
| | 70,404 |
| | 88,106 |
| | 91,190 |
|
| Prepaid expenses and other assets | | 5,104 |
| | 4,870 |
| | 6,182 |
| | 5,221 |
|
| Total current assets | | 164,541 |
| | 168,873 |
| | 159,347 |
| | 167,444 |
|
| Property and equipment, net | | 5,737 |
| | 5,407 |
| | 5,710 |
| | 5,649 |
|
| Operating lease right-of-use assets | | | 19,957 |
| | — |
|
| Net deferred tax assets, non-current | | 22,508 |
| | 23,298 |
| | 20,712 |
| | 20,795 |
|
| Goodwill | | 4,829 |
| | 4,829 |
| | 4,829 |
| | 4,829 |
|
| Other long-term assets | | 4,496 |
| | 2,773 |
| | 4,077 |
| | 3,842 |
|
| Total assets | | $ | 202,111 |
| | $ | 205,180 |
| | $ | 214,632 |
| | $ | 202,559 |
|
| | | | | | | | | |
| Liabilities | | | | | | | | |
| Accounts payable | | $ | 2,367 |
| | $ | 1,612 |
| | $ | 1,979 |
| | $ | 1,845 |
|
| Accrued expenses and other liabilities | | 25,428 |
| | 32,347 |
| | 16,960 |
| | 25,126 |
|
| Deferred revenue | | 9,886 |
| | 10,213 |
| | 9,039 |
| | 9,305 |
|
| Total current liabilities | | 37,681 |
| | 44,172 |
| | 27,978 |
| | 36,276 |
|
| Operating lease liabilities, non-current | | | 20,010 |
| | — |
|
| Amounts payable under tax receivable agreement, non-current | | | 17,154 |
| | 17,349 |
|
| Other long-term liabilities | | 3,185 |
| | 3,370 |
| | 582 |
| | 2,691 |
|
| Amounts payable under tax receivable agreement, non-current | | 18,987 |
| | 19,278 |
| |
| Total liabilities | | 59,853 |
| | 66,820 |
| | 65,724 |
| | 56,316 |
|
| Commitments and contingencies (Note 8) | |
|
| |
|
| |
| Commitments and contingencies (Note 9) | | |
|
| |
|
|
| Shareholders’ equity | | | | | | | | |
| Class A common stock, $0.01 par value; 300,000,000 shares authorized; 15,333,041 and 15,039,347 shares issued and outstanding at June 30, 2018 and December 31, 2017, respectively | | 153 |
| | 150 |
| |
| Class A common stock, $0.01 par value; 300,000,000 shares authorized; 15,684,573 and 15,310,958 shares issued and outstanding at March 31, 2019 and December 31, 2018, respectively | | | 157 |
| | 153 |
|
| Additional paid-in capital | | 198,488 |
| | 198,641 |
| | 198,811 |
| | 198,604 |
|
| Retained deficit | | (38,626 | ) | | (38,424 | ) | | (38,516 | ) | | (38,865 | ) |
| Accumulated other comprehensive income (loss) | | (113 | ) | | (86 | ) | |
| Accumulated other comprehensive income | | | (56 | ) | | (77 | ) |
| Total shareholders’ equity | | 159,902 |
| | 160,281 |
| | 160,396 |
| | 159,815 |
|
| Noncontrolling interests | | (17,644 | ) | | (21,921 | ) | | (11,488 | ) | | (13,572 | ) |
| Total shareholders’ equity and noncontrolling interests | | 142,258 |
| | 138,360 |
| | 148,908 |
| | 146,243 |
|
| Total liabilities, shareholders’ equity and noncontrolling interests | | $ | 202,111 |
| | $ | 205,180 |
| | $ | 214,632 |
| | $ | 202,559 |
|
The accompanying notes are an integral part of these consolidated financial statements.
Manning & Napier, Inc.
Consolidated Statements of Operations
(InU.S. dollars in thousands, except share data)
(Unaudited)
| | | | | Three months ended June 30, | | Six months ended June 30, | | Three months ended March 31, |
| | | 2018 | | 2017 | | 2018 | | 2017 | | 2019 | | 2018 |
| Revenues | | | | | | | | | | | | |
| Management Fees | | | | | | | | | | | | |
| Separately managed accounts | | $ | 24,483 |
| | $ | 27,530 |
| | $ | 49,838 |
| | $ | 57,469 |
| | $ | 21,475 |
| | $ | 25,355 |
|
| Mutual funds and collective investment trusts | | 11,030 |
| | 17,806 |
| | 22,010 |
| | 37,091 |
| | 8,228 |
| | 10,980 |
|
| Distribution and shareholder servicing | | 3,033 |
| | 3,353 |
| | 6,211 |
| | 6,393 |
| | 2,624 |
| | 3,178 |
|
| Custodial services | | 1,895 |
| | 2,012 |
| | 3,817 |
| | 4,357 |
| | 1,745 |
| | 1,922 |
|
| Other revenue | | 679 |
| | 835 |
| | 1,468 |
| | 1,711 |
| | 725 |
| | 789 |
|
| Total revenue | | 41,120 |
| | 51,536 |
| | 83,344 |
| | 107,021 |
| | 34,797 |
| | 42,224 |
|
| Expenses | | | | | | | | | | | | |
| Compensation and related costs | | 21,689 |
| | 22,233 |
| | 45,462 |
| | 45,614 |
| | 21,448 |
| | 23,773 |
|
| Distribution, servicing and custody expenses | | 4,502 |
| | 7,084 |
| | 9,283 |
| | 14,495 |
| | 3,758 |
| | 4,781 |
|
| Other operating costs | | 8,579 |
| | 7,234 |
| | 15,033 |
| | 15,212 |
| | 8,307 |
| | 6,454 |
|
| Total operating expenses | | 34,770 |
| | 36,551 |
| | 69,778 |
| | 75,321 |
| | 33,513 |
| | 35,008 |
|
| Operating income | | 6,350 |
| | 14,985 |
| | 13,566 |
| | 31,700 |
| | 1,284 |
| | 7,216 |
|
| Non-operating income (loss) | | | | | | | | | | | | |
| Interest expense | | (21 | ) | | (2 | ) | | (30 | ) | | (12 | ) | | (3 | ) | | (9 | ) |
| Interest and dividend income | | 374 |
| | 238 |
| | 876 |
| | 418 |
| | 809 |
| | 502 |
|
| Change in liability under tax receivable agreement | | — |
| | — |
| | 291 |
| | — |
| | 195 |
| | 291 |
|
| Net gains (losses) on investments | | (21 | ) | | 610 |
| | (270 | ) | | 1,582 |
| | 874 |
| | (249 | ) |
| Total non-operating income (loss) | | 332 |
| | 846 |
| | 867 |
| | 1,988 |
| |
| Total non-operating income | | | 1,875 |
| | 535 |
|
| Income before provision for income taxes | | 6,682 |
| | 15,831 |
| | 14,433 |
| | 33,688 |
| | 3,159 |
| | 7,751 |
|
| Provision for income taxes | | 492 |
| | 1,242 |
| | 970 |
| | 2,585 |
| | 242 |
| | 478 |
|
| Net income attributable to controlling and noncontrolling interests | | 6,190 |
| | 14,589 |
| | 13,463 |
| | 31,103 |
| | 2,917 |
| | 7,273 |
|
| Less: net income attributable to noncontrolling interests | | 5,424 |
| | 12,904 |
| | 11,483 |
| | 27,521 |
| | 2,356 |
| | 6,059 |
|
| Net income attributable to Manning & Napier, Inc. | | $ | 766 |
| | $ | 1,685 |
| | $ | 1,980 |
| | $ | 3,582 |
| | $ | 561 |
| | $ | 1,214 |
|
| | | | | | | | | | | | | |
| Net income per share available to Class A common stock | | | | | | | | | | | | |
| Basic | | $ | 0.05 |
| | $ | 0.12 |
| | $ | 0.13 |
| | $ | 0.25 |
| | $ | 0.04 |
| | $ | 0.08 |
|
| Diluted | | $ | 0.05 |
| | $ | 0.12 |
| | $ | 0.13 |
| | $ | 0.25 |
| | $ | 0.03 |
| | $ | 0.07 |
|
| Weighted average shares of Class A common stock outstanding | | | | | | | | | | | | |
| Basic | | 14,691,928 |
| | 14,111,368 |
| | 14,503,784 |
| | 14,077,313 |
| | 14,927,265 |
| | 14,313,549 |
|
| Diluted | | 14,709,403 |
| | 14,298,834 |
| | 14,530,398 |
| | 14,256,911 |
| | 78,581,169 |
| | 78,283,583 |
|
| Cash dividends declared per share of Class A common stock | | $ | 0.08 |
| | $ | 0.08 |
| | $ | 0.16 |
| | $ | 0.16 |
| |
The accompanying notes are an integral part of these consolidated financial statements.
Manning & Napier, Inc.
Consolidated Statements of Comprehensive Income
(InU.S. dollars in thousands)
(Unaudited)
| | | | | Three months ended June 30, | | Six months ended June 30, | | Three months ended March 31, |
| | | 2018 | | 2017 | | 2018 | | 2017 | | 2019 | | 2018 |
| Net income attributable to controlling and noncontrolling interests | | $ | 6,190 |
| | $ | 14,589 |
| | $ | 13,463 |
| | $ | 31,103 |
| | $ | 2,917 |
| | $ | 7,273 |
|
| Net unrealized holding gain (loss) on investment securities, net of tax | | — |
| | (9 | ) | | (147 | ) | | (15 | ) | |
| Comprehensive income attributable to controlling and noncontrolling interests | | $ | 6,190 |
| | $ | 14,580 |
| | $ | 13,316 |
| | $ | 31,088 |
| |
| Net unrealized holding gains (losses) on investment securities, net of tax | | | 115 |
| | (147 | ) |
| Reclassification adjustment for realized (gains) losses on investment securities included in net income | | | (14 | ) | | — |
|
| Comprehensive income | | | $ | 3,018 |
| | $ | 7,126 |
|
| Less: Comprehensive income attributable to noncontrolling interests | | 5,424 |
| | 12,895 |
| | 11,363 |
| | 27,506 |
| | 2,436 |
| | 5,939 |
|
| Comprehensive income attributable to Manning & Napier, Inc. | | $ | 766 |
| | $ | 1,685 |
| | $ | 1,953 |
| | $ | 3,582 |
| | $ | 582 |
| | $ | 1,187 |
|
The accompanying notes are an integral part of these consolidated financial statements.
Manning & Napier, Inc.
Consolidated Statements of Shareholders’ Equity
(InU.S. dollars in thousands, except share data)
(Unaudited)
| | | | | Common Stock – class A | | Common Stock – class B | | Additional Paid in Capital | | Retained Deficit | | Accumulated Other Comprehensive Income (Loss) | | Non Controlling Interests | | | Common Stock – Class A | | Additional Paid in Capital | | Retained Deficit | | Accumulated Other Comprehensive Income (Loss) | | Non Controlling Interests | | |
| | | Shares | | Amount | | Shares | | Amount | | Total | |
| Balance—December 31, 2016 | | 14,982,880 |
| | $ | 150 |
| | 1,000 |
| | $ | — |
| | $ | 200,158 |
| | $ | (37,383 | ) | | $ | (13 | ) | | $ | (28,434 | ) | | $ | 134,478 |
| |
| Net income | | — |
| | — |
| | — |
| | — |
| | — |
| | 3,582 |
| | — |
| | 27,521 |
| | 31,103 |
| |
| Distributions to noncontrolling interests | | — |
| | — |
| | — |
| | — |
| | — |
| | — |
| | — |
| | (17,660 | ) | | (17,660 | ) | |
| Net changes in unrealized investment securities gains or losses | | — |
| | — |
| | — |
| | — |
| | — |
| | — |
| | (15 | ) | | — |
| | (15 | ) | |
| Common stock issued under equity compensation plan, net of forfeitures | | 96,467 |
| | 1 |
| | — |
| | — |
| | (1 | ) | | — |
| | — |
| | — |
| | — |
| |
| Shares withheld to satisfy tax withholding requirements related to restricted stock units granted | | — |
| | — |
| | — |
| | — |
| | (48 | ) | | — |
| | — |
| | (224 | ) | | (272 | ) | |
| Equity-based compensation | | — |
| | — |
| | — |
| | — |
| | 253 |
| | — |
| | — |
| | 1,183 |
| | 1,436 |
| |
| Dividends declared on Class A common stock - $0.16 per share | | — |
| | — |
| | — |
| | — |
| | — |
| | (2,273 | ) | | — |
| | — |
| | (2,273 | ) | |
| Impact of changes in ownership of Manning & Napier Group, LLC | | — |
| | — |
| | — |
| | — |
| | (1,876 | ) | | — |
| | — |
| | (7,927 | ) | | (9,803 | ) | |
| Balance—June 30, 2017 | | 15,079,347 |
| | $ | 151 |
| | 1,000 |
| | $ | — |
| | $ | 198,486 |
| | $ | (36,074 | ) | | $ | (28 | ) | | $ | (25,541 | ) | | $ | 136,994 |
| |
| | | | | | | | | | | | | | | | | | | | Shares | | Amount | | Additional Paid in Capital | | Retained Deficit | | Accumulated Other Comprehensive Income (Loss) | | Non Controlling Interests | | Total |
| Balance—December 31, 2017 | | 15,039,347 |
| | $ | 150 |
| | — |
| | $ | — |
| | $ | 198,641 |
| | $ | (38,424 | ) | | $ | (86 | ) | | $ | (21,921 | ) | | $ | 138,360 |
| 15,039,347 |
|
| $ | 150 |
| | $ | 138,360 |
|
| Net income | | — |
| | — |
| | — |
| | — |
| | — |
| | 1,980 |
| | — |
| | 11,483 |
| | 13,463 |
| — |
| | — |
| | — |
| | 1,214 |
| | — |
| | 6,059 |
| | 7,273 |
|
| Distributions to noncontrolling interests | | — |
| | — |
| | — |
| | — |
| | — |
| | — |
| | — |
| | (8,181 | ) | | (8,181 | ) | — |
| | — |
| | — |
| | — |
| | — |
| | (4,908 | ) | | (4,908 | ) |
| Net changes in unrealized investment securities gains or losses | | — |
| | — |
| | — |
| | — |
| | — |
| | — |
| | (27 | ) | | (120 | ) | | (147 | ) | — |
| | — |
| | — |
| | — |
| | (27 | ) | | (120 | ) | | (147 | ) |
| Common stock issued under equity compensation plan | | 224,218 |
| | 3 |
| | (3 | ) | | — |
| | — |
| | — |
| | — |
|
| Equity-based compensation | | — |
| | — |
| | 209 |
| | — |
| | — |
| | 944 |
| | 1,153 |
|
| Dividends declared on Class A common stock - $0.08 per share | | — |
| | — |
| | — |
| | (1,221 | ) | | — |
| | — |
| | (1,221 | ) |
| Cumulative effect of change in accounting principle, net of taxes | | — |
| | — |
| | — |
| | 266 |
| | — |
| | 1,224 |
| | 1,490 |
|
| Impact of changes in ownership of Manning & Napier Group, LLC | | — |
| | — |
| | (440 | ) | | — |
| | — |
| | (1,478 | ) | | (1,918 | ) |
| Balance—March 31, 2018 | | 15,263,565 |
| | $ | 153 |
| | $ | 198,407 |
| | $ | (38,165 | ) | | $ | (113 | ) | | $ | (20,200 | ) | | $ | 140,082 |
|
| | | | | | | | | | | | | | | |
| Balance—December 31, 2018 | | 15,310,958 |
| | $ | 153 |
| | $ | 198,604 |
| | $ | (38,865 | ) | | $ | (77 | ) | | $ | (13,572 | ) | | $ | 146,243 |
|
| Net income | | — |
| | — |
| | — |
| | 561 |
| | — |
| | 2,356 |
| | 2,917 |
|
| Distributions to noncontrolling interests | | — |
| | — |
| | — |
| | — |
| | — |
| | (1,620 | ) | | (1,620 | ) |
| Net changes in unrealized investment securities gains or losses | | — |
| | — |
| | — |
| | — |
| | 21 |
| | 94 |
| | 115 |
|
| Common stock issued under equity compensation plan, net of forfeitures | | 293,694 |
| | 3 |
| | — |
| | — |
| | (3 | ) | | — |
| | — |
| | — |
| | — |
| 373,615 |
| | 4 |
| | (4 | ) | | — |
| | — |
| | — |
| | — |
|
| Equity-based compensation | | — |
| | — |
| | — |
| | — |
| | 297 |
| | — |
| | — |
| | 1,342 |
| | 1,639 |
| — |
| | — |
| | 272 |
| | — |
| | — |
| | 1,193 |
| | 1,465 |
|
| Dividends declared on Class A common stock - $0.16 per share | | — |
| | — |
| | — |
| | — |
| | — |
| | (2,448 | ) | | — |
| | — |
| | (2,448 | ) | |
| Cumulative effect of change in accounting principle, net of taxes (Note 3) | | — |
| | — |
| | — |
| | — |
| | — |
| | 266 |
| | — |
| | 1,224 |
| | 1,490 |
| |
| Dividends declared on Class A common stock - $0.02 per share | | — |
| | — |
| | — |
| | (288 | ) | | — |
| | — |
| | (288 | ) |
| Cumulative effect of change in accounting principle, net of taxes (Note 8) | | — |
| | — |
| | — |
| | 76 |
| | — |
| | — |
| | 76 |
|
| Impact of changes in ownership of Manning & Napier Group, LLC (Note 4) | | — |
| | — |
| | — |
| | — |
| | (447 | ) | | — |
| | — |
| | (1,471 | ) | | (1,918 | ) | — |
| | — |
| | (61 | ) | | — |
| | — |
| | 61 |
| | — |
|
| Balance—June 30, 2018 | | 15,333,041 |
| | $ | 153 |
| | — |
| | $ | — |
| | $ | 198,488 |
| | $ | (38,626 | ) | | $ | (113 | ) | | $ | (17,644 | ) | | $ | 142,258 |
| |
| Balance—March 31, 2019 | | 15,684,573 |
| | $ | 157 |
| | $ | 198,811 |
| | $ | (38,516 | ) | | $ | (56 | ) | | $ | (11,488 | ) | | $ | 148,908 |
|
The accompanying notes are an integral part of these consolidated financial statements.
Manning & Napier, Inc.
Consolidated Statements of Cash Flows
(InU.S. dollars in thousands)
(Unaudited)
| | | | | Six months ended June 30, | | Three months ended March 31, |
| | | 2018 | | 2017 | | 2019 | | 2018 |
| Cash flows from operating activities: | | | | | | | | |
| Net income attributable to controlling and noncontrolling interests | | $ | 13,463 |
| | $ | 31,103 |
| | $ | 2,917 |
| | $ | 7,273 |
|
| Adjustment to reconcile net income to net cash provided by operating activities: | | | | | | | | |
| Equity-based compensation | | 1,639 |
| | 1,436 |
| | 1,465 |
| | 1,153 |
|
| Depreciation and amortization | | 957 |
| | 875 |
| | 403 |
| | 557 |
|
| Change in amounts payable under tax receivable agreement | | (291 | ) | | — |
| | (195 | ) | | (291 | ) |
| Gain on sale of intangible assets | | (2,509 | ) | | — |
| | (56 | ) |
| (2,388 | ) |
| Net (gains) losses on investment securities | | 270 |
| | (1,582 | ) | | (874 | ) | | 249 |
|
| Deferred income taxes | | 721 |
| | 1,983 |
| | 158 |
| | 437 |
|
| (Increase) decrease in operating assets and increase (decrease) in operating liabilities: | | | | | | | | |
| Accounts receivable | | 2,474 |
| | 4,160 |
| | 695 |
| | 1,816 |
|
| Prepaid expenses and other assets | | 197 |
| | 1,033 |
| | (960 | ) | | (426 | ) |
| Other long-term assets | | (617 | ) | | — |
| |
| Long-term assets | | | 660 |
|
| (479 | ) |
| Accounts payable | | 755 |
| | (738 | ) | | 134 |
| | 104 |
|
| Accrued expenses and other liabilities | | (6,714 | ) | | (8,017 | ) | | (10,458 | ) | | (11,617 | ) |
| Deferred revenue | | (327 | ) | | 273 |
| | (266 | ) | | 69 |
|
| Other long-term liabilities | | (348 | ) | | (315 | ) | |
| Net cash provided by operating activities | | 9,670 |
| | 30,211 |
| |
| Long-term liabilities | | | (500 | ) | | (173 | ) |
| Net cash used in operating activities | | | (6,877 | ) | | (3,716 | ) |
| Cash flows from investing activities: | | | | | | | | |
| Purchase of property and equipment | | (1,265 | ) | | (750 | ) | | (576 | ) | | (321 | ) |
| Sale of investments | | 1,615 |
| | 4,243 |
| | 2,015 |
| | 1,380 |
|
| Purchase of investments | | (25,967 | ) | | (25,822 | ) | | (15,301 | ) | | (12,237 | ) |
| Sale of intangible assets | | 2,509 |
| | — |
| | 56 |
|
| 2,388 |
|
| Proceeds from maturity of investments | | 24,963 |
| | 15,364 |
| | 17,358 |
| | 11,761 |
|
| Acquisitions, net of cash received | | — |
| | 320 |
| |
| Net cash provided by (used in) investing activities | | 1,855 |
| | (6,645 | ) | |
| Net cash provided by investing activities | | | 3,552 |
| | 2,971 |
|
| Cash flows from financing activities: | | | | | | | | |
| Distributions to noncontrolling interests | | (8,181 | ) | | (17,660 | ) | | (1,620 | ) | | (4,908 | ) |
| Dividends paid on Class A common stock | | (2,424 | ) | | (3,596 | ) | | (306 | ) | | (1,203 | ) |
| Payment of shares withheld to satisfy withholding requirements | | — |
| | (271 | ) | |
| Payment of capital lease obligations | | (66 | ) | | (97 | ) | | (27 | ) | | (33 | ) |
| Purchase of Class A units of Manning & Napier Group, LLC | | (1,918 | ) | | (9,803 | ) | | — |
| | (1,918 | ) |
| Net cash used in financing activities | | (12,589 | ) | | (31,427 | ) | | (1,953 | ) | | (8,062 | ) |
| Net increase (decrease) in cash and cash equivalents | | (1,064 | ) | | (7,861 | ) | | (5,278 | ) | | (8,807 | ) |
| Cash and cash equivalents: | | | | | | | | |
| Beginning of period | | 78,262 |
| | 100,819 |
| | 59,586 |
| | 78,262 |
|
| End of period | | $ | 77,198 |
| | $ | 92,958 |
| | $ | 54,308 |
| | $ | 69,455 |
|
The accompanying notes are an integral part of these consolidated financial statements.
Manning & Napier, Inc.
Notes to Consolidated Financial Statements
Note 1—Organization and Nature of the Business
Manning & Napier, Inc. ("Manning & Napier", or the "Company") provides a broad range of investment solutions through separately managed accounts, mutual funds, and collective investment trusts,trust funds, as well as a variety of consultative services that complement its investment process. Founded in 1970, the Company offers U.S. and non-U.S. equity, fixed income and alternative strategies, as well as a range of blended asset portfolios, such asincluding life cycle funds and actively-managed exchange-traded fund ("ETF")-based portfolios.funds. Headquartered in Fairport, New York, the Company serves a diversified client base of high-net-worth individuals and institutions, including 401(k) plans, pension plans, Taft-Hartley plans, platforms, endowments and foundations.
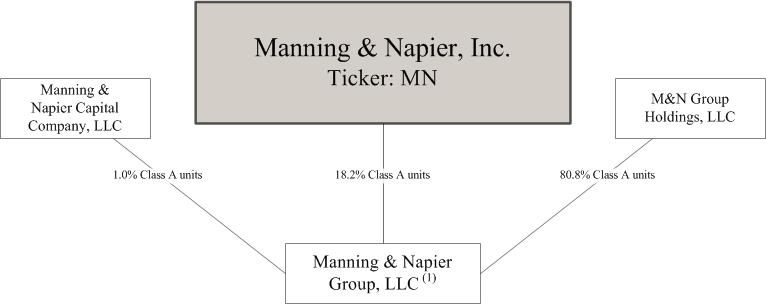
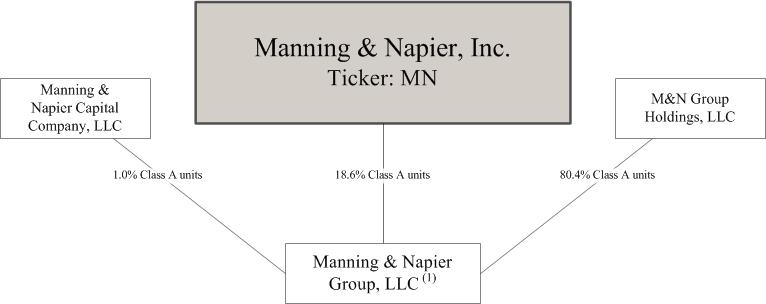
The Company was incorporated in 2011 as a Delaware corporation, and is the sole managing member of Manning & Napier Group, LLC ("and its subsidiaries (“Manning & Napier Group"Group”), a holding company for the investment management businesses conducted by its operating subsidiaries. The diagram below depicts the Company's organizationorganizational structure as of June 30, 2018.March 31, 2019.
| |
| (1) | The consolidated operating subsidiaries of Manning & Napier Group include Manning & Napier Advisors, LLC ("MNA"), Perspective Partners LLC, Manning & Napier Information Services, LLC, Manning & Napier Investor Services, Inc., Exeter Trust Company and Rainier Investment Management, LLC ("Rainier"). |
Note 2—Summary of Significant Accounting Policies
Critical Accounting Policies
The Company's critical accounting policies and estimates are disclosed in its Annual Report on Form 10-K for the year ended December 31, 2017.2018. The Company believes that the disclosures herein are adequate so that the information presented is not misleading; however, these financial statements should be read in conjunction with the financial statements and the notes thereto in the Company's Annual Report on Form 10-K for the year ended December 31, 2017.2018. The financial data for the interim periods may not necessarily be indicative of results for future interim periods or for the full year.
Changes to the Company's accounting policies as a result of adoptingadoption ASU 2014-09,2016-02, Revenue from Contracts with CustomersLeases (Topic 606)842) are discussed under "Revenue""Leases" below and in Note 8.
Basis of Presentation
The accompanying unaudited consolidated financial statements were prepared in accordance with accounting principles generally accepted in the United States of America (“U.S. GAAP”) and related rules and regulations of the U.S. Securities and Exchange Commission (“SEC”) for interim financial reporting and include all adjustments, consisting only of normal recurring adjustments which are, in the opinion of management, necessary for a fair statement of the results for the interim period.
The preparation of financial statements in conformity with U.S. GAAP requires management to make estimates or assumptions that affect the reported amounts and disclosures in the consolidated financial statements. Actual results could differ from these estimates or assumptions.
Manning & Napier, Inc.
Notes to Consolidated Financial Statements (Continued)
Principles of Consolidation
The Company consolidates all majority-owned subsidiaries. In addition, as of March 31, 2019, Manning & Napier holds an economic interest of approximately 18.6% in Manning & Napier Group but, as managing member, controls all of the business and affairs of Manning & Napier Group. As a result, the Company consolidates the financial results of Manning & Napier Group and records a noncontrolling interest on its consolidated statements of financial condition with respect to the remaining economic interest in Manning & Napier Group held by Manning & Napier Group Holdings, LLC (“M&N Group Holdings”) and Manning & Napier Capital Company, LLC (“MNCC”).
All material intercompany transactions have been eliminated in consolidation.
In accordance with Accounting Standards Update ("ASU") 2015-02, Consolidation (Topic 810) – Amendments to the Consolidation Analysis, "Coststhe determination of whether a company is required to Obtainconsolidate an entity is based on, among other things, an entity’s purpose and design, a Contract"company’s ability to direct the activities of the entity that most significantly impact the entity’s economic performance, and "Reclassifications" below.whether a company is obligated to absorb losses or receive benefits that could potentially be significant to the entity. The standard also requires ongoing assessments of whether a company is the primary beneficiary of a variable interest entity (“VIE”). When utilizing the voting interest entity ("VOE") model, controlling financial interest is generally defined as majority ownership of voting interests.
The Company provides seed capital to its investment teams to develop new strategies and services for its clients. The original seed investment may be held in a separately managed account, comprised solely of the Company's investments or within a mutual fund, where the Company's investments may represent all or only a portion of the total equity investment in the mutual fund. Pursuant to U.S. GAAP, the Company evaluates its investments in mutual funds on a regular basis and consolidates such mutual funds for which it holds a controlling financial interest. When no longer deemed to hold a controlling financial interest, the Company would deconsolidate the fund and classify the remaining investment as either an equity method investment or as trading securities, as applicable.
The Company serves as the investment adviser for Manning & Napier Fund, Inc. series of mutual funds (the “Fund”), Exeter Trust Company Collective Investment Trusts (“CIT”) and Rainier Multiple Investment Trust. The Fund, CIT and Rainier Multiple Investment Trust are legal entities, the business and affairs of which are managed by their respective boards of directors. As a result, each of these entities is a VOE. The Company holds, in limited cases, direct investments in a mutual fund (which are made on the same terms as are available to other investors) and consolidates each of these entities where it has a controlling financial interest or a majority voting interest. The Company's investments in the Fund amounted to approximately $3.9 million as of March 31, 2019 and $3.6 million as of December 31, 2018. As of March 31, 2019 and December 31, 2018 the Company did not have a controlling financial interest in any mutual fund.
Revenue
Investment Management: Investment management fees are computed as a percentage of assets under management ("AUM"). The Company's performance obligation is a series of services that form part of a single performance obligation satisfied over time.
Separately managed accounts are paid in advance, typically for a semi-annual or quarterly period, or in arrears, typically for a monthly or quarterly period. When investment management fees are paid in advance, the Company defers the revenue as a contract liability and recognizes it over the applicable period. When investment management fees are paid in arrears, the Company estimates revenue and records a contract asset (accrued accounts receivable) based on AUM as of the most recent month end date.
Manning & Napier, Inc.
Notes to Consolidated Financial Statements (Continued)
Mutual funds and collective investment trust investment management revenue is calculated and earned daily based on AUM. Revenue is presented net of cash rebates and fees waived pursuant to contractual expense limitations of the funds. The Company also has agreements with third parties who provide recordkeeping and administrative services for employee benefit plans participating in the collective investment trusts. The Company is acting as an agent on behalf of the employee benefit plan sponsors, therefore, investment management revenue is recorded net of fees paid to third party service providers.
Distribution and shareholder servicing: The Company receives distribution and servicing fees for providing services to its affiliated mutual funds. Revenue is computed and earned daily based on a percentage of AUM. The performance obligation is a series of services that form part of a single performance obligation satisfied over time. The Company has agreements with third parties who provide distribution and administrative services for its mutual funds. The agreements are evaluated to determine whether revenue should be reported gross or net of payments to third-party service providers. The Company controls the services provided and acts as a principal in the relationship. Therefore, distribution and shareholder servicing revenue is recorded gross of fees paid to third parties.
Custodial services: Custodial service fees are calculated as a percentage of the client’s market value with additional fees charged for certain transactions. For the safeguarding and administrative services that are subject to a percentage of market
Manning & Napier, Inc.
Notes to Consolidated Financial Statements (Continued)
value fee, the Company's performance obligation is a series of services that form part of a single performance obligation satisfied over time. Revenue for transactions assigned a stand-alone selling price is recognized in the period which the transaction is executed. Custodial service fees are billed monthly in arrears. The Company has agreements with third parties who provide safeguarding, recordkeeping and administrative services for their clients. The Company controls the services provided and acts as a principal in the relationship. Therefore, custodial service revenue is recorded gross of fees paid to third parties.
Costs to Obtain a Contract
Incremental first year commissions directly associated with new separate account and collective investment trust contracts are capitalized and amortized on a straight-line basis over the estimated customer contract period of 7 years for separate accounts and 3 years for collective investment trust contracts. Refer to Note 3 for further discussion.
Basis of Presentation
The accompanying unaudited consolidated financial statements were prepared in accordance with accounting principles generally accepted in the United States of America (“U.S. GAAP”) and related rules and regulations of the U.S. Securities and Exchange Commission (“SEC”) for interim financial reporting and include all adjustments, consisting only of normal recurring adjustments which are, in the opinion of management, necessary for a fair statement of the results for the interim period.
The preparation of financial statements in conformity with U.S. GAAP requires management to make estimates or assumptions that affect the reported amounts and disclosures in the consolidated financial statements. Actual results could differ from these estimates or assumptions.
Reclassifications
The Company changed the presentation of revenue within its consolidated statements of operations for the three and six months ended June 30, 2018. Revenue, previously reported as a single line item, has been disaggregated to present revenue by the various services the Company provides. Amounts for the comparative prior periods have been reclassified to conform to the current period presentation. These reclassifications had no impact on previously reported net income or financial position and do not represent a restatement of any previously published financial results.
For periods prior to and including December 31, 2017, the Company presented "Accounts receivable - affiliated mutual funds" on its consolidated statements of financial condition. Further disclosure regarding accounts receivable from affiliated mutual funds and the components of accounts receivable as of June 30, 2018 is included in "Accounts Receivable" in Note 3 of the notes to the consolidated financial statements. Amounts for the comparative prior fiscal year periods have been reclassified to conform to the current period presentation. These reclassifications had no impact on previously reported net income and do not represent a restatement of any previously published financial results.
Principles of Consolidation
The Company consolidates all majority-owned subsidiaries. In addition, as of June 30, 2018, Manning & Napier holds an economic interest of approximately 18.2% in Manning & Napier Group but, as managing member, controls all of the business and affairs of Manning & Napier Group. As a result, the Company consolidates the financial results of Manning & Napier Group and records a noncontrolling interest on its consolidated statements of financial condition with respect to the remaining economic interest in Manning & Napier Group held by Manning & Napier Group Holdings, LLC (“M&N Group Holdings”) and Manning & Napier Capital Company, LLC (“MNCC”).
All material intercompany transactions have been eliminated in consolidation.
Manning & Napier, Inc.
Notes to Consolidated Financial Statements (Continued)
In accordance with Accounting Standards Update ("ASU") 2015-02, Consolidation (Topic 810) – Amendments to the Consolidation Analysis, the determination of whether a company is required to consolidate an entity is based on, among other things, an entity’s purpose and design, a company’s ability to direct the activities of the entity that most significantly impact the entity’s economic performance, and whether a company is obligated to absorb losses or receive benefits that could potentially be significant to the entity. The standard also requires ongoing assessments of whether a company is the primary beneficiary of a variable interest entity (“VIE”). When utilizing the voting interest entity ("VOE") model, controlling financial interest is generally defined as majority ownership of voting interests.
The Company provides seed capital to its investment teams to develop new products and services for its clients. The original seed investment may be held in a separately managed account, comprised solely of the Company's investments, or within a mutual fund, where the Company's investments may represent all or only a portion of the total equity investment in the mutual fund. Pursuant to U.S. GAAP, the Company evaluates its investments in mutual funds on a regular basis and consolidates such mutual funds for which it holds a controlling financial interest. When no longer deemed to hold a controlling financial interest, the Company would deconsolidate the fund and classify the remaining investment as either an equity method investment or as trading securities, as applicable.
The Company serves as the investment adviser for Manning & Napier Fund, Inc. series of mutual funds (the “Fund”), Exeter Trust Company Collective Investment Trusts (“CIT”) and Rainier Multiple Investment Trust. The Fund, CIT and Rainier Multiple Investment Trust are legal entities, the business and affairs of which are managed by their respective boards of directors. As a result, each of these entities is a VOE. The Company holds, in limited cases, direct investments in a mutual fund (which are made on the same terms as are available to other investors) and consolidates each of these entities where it has a controlling financial interest or a majority voting interest. The Company's investments in the Fund amounted to approximately $1.4 million as of June 30, 2018 and $2.6 million as of December 31, 2017. As of December 31, 2017, the Company maintained significant influence in one mutual fund, Manning & Napier Fund, Inc. Quality Equity Series, but did not maintain a controlling financial interest in the mutual fund, which was accounted for as an equity method investment. During the first quarter of 2018, the Manning & Napier Fund, Inc. Quality Equity Series liquidated and closed.
Cash and Cash Equivalents
The Company generally considers all highly liquid investments with original maturities of three months or less to be cash equivalents. Cash and cash equivalents are primarily held in operating accounts at major financial institutions and also in money market securities. Cash equivalents are stated at cost, which approximates market value due to the short-term maturity of these investments. The fair value of cash equivalents have been classified as Level 1 in accordance with the fair value hierarchy.
Investment Securities
Investment securities are classified as either trading, equity method investments or available-for-sale and are carried at fair value. Fair value is determined based on quoted market prices in active markets for identical or similar instruments.
Investment securities classified as trading consist of equity securities, fixed income securities, and investments in mutual funds for which the Company provides advisory services. Realized and unrealized gains and losses on trading securities are recorded in net gains (losses) on investments in the consolidated statements of operations. At June 30, 2018March 31, 2019, trading securities consist solely of investments held by the Company to provide initial cash seeding for product development purposes.purposes and investments to hedge economic exposure to market movements on its deferred compensation plan.
Investments classified as equity method investments represent seed investments in which the Company owns between 20-50% of the outstanding voting interests in the affiliated fund or when it is determined that the Company is able to exercise significant influence but not control over the investments. If the seed investment results in significant influence, but not control, the investment will be accounted for as an equity method investment. When using the equity method, the Company recognizes its share of the investee's net income or loss for the period which is recorded in net gains (losses) on investments in the consolidated statements of operations.
Investment securities classified as available-for-sale consist of U.S. Treasury notes corporate bonds and other short-term investments. Unrealized gains and losses on available-for-sale securities are excluded from earnings and are reported, net of deferred income tax, as a separate component of accumulated other comprehensive income in stockholders’ equity until realized. The Company periodically reviews each individual security position that has an unrealized loss, or impairment, to determine if that impairment is other-than-temporary. If impairment is determined to be other-than-temporary, the carrying value of the security will be written down to fair value and the loss will be recognized in earnings. Realized gains and losses on sales of available-for-sale securities are computed on a specific identification basis and are recorded in net gains (losses) on investments in the consolidated statements of operations.
Manning & Napier, Inc.
Notes to Consolidated Financial Statements (Continued)
Property and Equipment
Property and equipment is presented net of accumulated depreciation of approximately $11.7$11.2 million and $11.4$11.3 million as of June 30, 2018March 31, 2019 and December 31, 2017,2018, respectively.
Goodwill and Intangible Assets
Goodwill represents the excess cost over the fair value of the identifiable net assets of acquired companies. Identifiable intangible assets generally represent the cost of client relationships and investment management agreements acquired as well as trademarks. Goodwill and indefinite-lived assets are tested for impairment annually or more frequently if events or circumstances indicate that the carrying value may not be recoverable. Intangible assets subject to amortization are tested for impairment whenever events or circumstances indicate that the carrying value may not be recoverable. Goodwill and intangible assets require significant management estimate and judgment, including the valuation and expected life determination in connection with the initial purchase price allocation and the ongoing evaluation for impairment.
On January 16, 2018, theManning & Napier, Inc.
Notes to Consolidated Financial Statements (Continued)
Leases
The Company solddetermines if an arrangement is a Rainier U.S. mutual fund to a third party for approximately $2.1 million, basedlease at inception. Operating leases are included in operating lease right-of-use ("ROU") assets, accrued expenses and other liabilities and operating lease liabilities, non-current on total assets under management on the closing dateits consolidated statements of approximately $0.3 billion. The carrying value of the intangible assets for client relationships associated with these products was zero as a result of the impairment loss recognized in 2016. During the first quarter of 2018, the Company recognized a gain of approximately $2.1 million for the sale of this fund, asfinancial condition. Finance leases are included in other operating costs in thelong-term assets, accrued expenses and other liabilities, and other long-term liabilities on its consolidated statements of operations.financial condition.
ROU assets represent the Company's right to use an underlying asset for the lease term and lease liabilities represent the Company's obligation to make lease payments arising from the lease. Operating lease ROU assets and lease liabilities are recognized at commencement date based on the present value of lease payments over the lease term. As the Company's leases do not provide an implicit rate, the Company uses its incremental borrowing rate based on the information available at commencement date in determining the present value of lease payments. The incremental borrowing rate, for each identified lease, is the rate of interest that the Company would have to pay to borrow on a collateralized basis over a similar term. The operating lease ROU asset is reduced for any lease incentives. The Company's lease terms may include options to extend or terminate the lease when it is reasonably certain that it will exercise that option. Lease expense for lease payments is recognized on a straight-line basis over the lease term.
The Company has lease agreements with lease and non-lease components, which are combined for all classes of underlying assets.
Operating Segments
The Company operates in one segment, the investment management industry.
Recently Adopted Accounting Pronouncements
In May 2014, the FASB issued ASU 2014-09, Revenue from Contracts with Customers (Topic 606). The revenue standard contains principals to determine the measurement of revenue and timing of recognition and also impacts the accounting for incremental costs to obtain a contract. The Company adopted the new standard on its effective date of January 1, 2018. Refer to Note 3 for further discussion regarding the impact of adoption of this standard.
In January 2016, the FASB issued ASU 2016-01, Recognition and Measurement of Financial Assets and Financial Liabilities, which requires all equity investments to be measured at fair value with changes in the fair value recognized through net income. The guidance is effective on January 1, 2018. The Company's adoption of ASU 2016-01 on January 1, 2018 did not have a material impact on its consolidated financial statements.
In August 2016, the FASB issued ASU 2016-15, Statement of Cash Flows (Topic 230), Classification of Certain Cash Receipts and Cash Payments, to clarify guidance on the classification of certain cash receipts and cash payments in the statement of cash flows. The FASB issued the ASU with the intent of reducing diversity in practice regarding eight types of cash flows. The ASU is effective for annual reporting periods beginning after December 15, 2017, including interim periods within those annual reporting periods. The Company's adoption of ASU 2016-15 on January 1, 2018 did not have a material impact on its consolidated financial statements.
Recent Accounting Pronouncements Not Yet Adopted
In February 2016, the FASB issued ASU 2016-02, Leases (Topic 842), which is intended to increase transparency and comparability among organizations by recognizing all lease transactions (with terms in excess of 12 months) on the balance sheet as a lease liability and a right-of-use asset (as defined). In July 2018, the FASB issued ASU 2018-11, Leases - Targeted Improvements, which provides an optional transition method related to implementing the new lease standard. The Company adopted the new guidancestandard on its effective date of January 1, 2019. Refer to Note 8 for further discussion regarding the impact of adoption.
In February 2018, the FASB issued ASU No. 2018-02, Income Statement - Reporting Comprehensive Income (Topic 220): Reclassification of Certain Tax Effects from Accumulated Other Comprehensive Income. The ASU requires a reclassification from accumulated other comprehensive income to retained earnings for stranded tax effects resulting from the newly enacted federal corporate income tax rate as a result of the Tax Cuts and Jobs Act. The amount of the reclassification is the difference between the historical corporate income tax rate and the newly enacted 21% corporate income tax rate. The ASU will be effective for fiscal years beginning after December 15, 2018, with earlier applicationearly adoption permitted. UponThe Company's adoption the lessee will apply the new standard retrospectively to all periods presented or retrospectively usingof ASU 2018-02 on January 1, 2019 did not have a cumulative effect adjustment in the year of adoption. The Company is currently evaluating thematerial impact that ASU 2016-02 will have on its consolidated financial statements.
Recent Accounting Pronouncements Not Yet Adopted
In January 2017, the FASB issued ASU 2017-04, Intangibles - Goodwill and Other (Topic 350), Simplifying the Test for Goodwill Impairment, which simplifies the accounting for goodwill impairments by eliminating step two from the goodwill impairment test. The ASU requires goodwill impairments to be measured on the basis of the fair value of the reporting unit relative to the reporting unit's carrying amount rather than on the basis of the implied amount of goodwill relative to the goodwill balance of the reporting unit. The ASU is effective for annual and interim impairment tests for periods beginning after December 15, 2019. Early adoption is allowed for annual and interim impairment tests occurring after January 1, 2017. The Company is evaluating the effect of adopting this new accounting standard.
In February 2018, the FASB issued ASU No. 2018-02, Income Statement - Reporting Comprehensive Income (Topic 220): Reclassification of Certain Tax Effects from Accumulated Other Comprehensive Income. The ASU requires a reclassification from accumulated other comprehensive income to retained earnings for stranded tax effects resulting from the newly enacted federal corporate income tax rate as a result of the Tax Cuts and Jobs Act. The amount of the reclassification is the difference between the historical corporate income tax rate and the newly enacted 21% corporate income tax rate. The ASU will be
Manning & Napier, Inc.
Notes to Consolidated Financial Statements (Continued)
effective for fiscal years beginning after December 15, 2018, with early adoption permitted. The Company is evaluating the effect of adopting this new accounting standard.
Note 3—Revenue Contract Assets and Contract Liabilities
Adoption of ASU 2014-09, Revenue from Contracts with Customers (Topic 606)
On January 1, 2018, the Company adopted Topic 606 using the modified retrospective approach with the cumulative effect of initial application recognized January 1, 2018. Results for reporting periods beginning after January 1, 2018 are presented under Topic 606, while prior period amounts are not adjusted and continue to be reported in accordance with the Company's historic accounting policies under Topic 605. The Company elected the practical expedient to adjust for active contracts that existed at the date of adoption. A reduction to opening shareholders' equity and noncontrolling interests of $1.5 million, net of taxes, as of January 1, 2018 has been recorded due to the cumulative impact of adopting Topic 606 related to the capitalization of incremental contract costs.
While there were no changes in the timing of revenue recognition, upon the adoption of Topic 606, the Company changed the presentation of certain revenue related costs on a gross versus net basis. The changes did not have a significant impact to total revenue, distribution, servicing and custody expenses and other operating costs, and had no impact on net income. Changes in the presentation of revenue related costs on a gross versus net basis are summarized below:
Fees in the amount of $0.7 million and $1.3 million for the three and six months ended June 30, 2018, respectively, due to third parties who provide record-keeping and administrative services for employee benefit plans participating in the Company's collective investment trusts are presented net as a reduction of mutual fund and collective investment trust revenue. Prior to the adoption of Topic 606 third party record-keeper fees associated with the Company's collective investment trusts were reported as distribution, servicing and custody expense.
Fees in the amount of $0.5 million and $1.0 million for the three and six months ended June 30, 2018, respectively, due to a third party who provides accounting and administrative services on behalf of the Company to its affiliated mutual fund are presented as other operating costs. Prior to the adoption of Topic 606, these fees were presented as a reduction of other revenue.
Fees in the amount of $0.1 million and $0.2 million for the three and six months ended June 30, 2018, respectively, due to a third party who provides safeguarding and administrative services on behalf of the Company are presented as distribution, servicing and custody expense. Prior to the adoption of Topic 606, these fees were presented as a reduction of custodial service revenue.
Disaggregated Revenue
The following table represents the Company’s separately managed account and mutual fund and collective investment trust investment management revenue by investment portfolio forduring the three and six months ended June 30,March 31, 2019 and March 31, 2018:
|
| | | | | | | | | | | | | | | | | | | | | | | | |
| | | Three months ended June 30, 2018 | | Six months ended June 30, 2018 |
| | | Separately managed accounts | | Mutual funds and collective investment trusts | | Total | | Separately managed accounts | | Mutual funds and collective investment trusts | | Total |
| | | (in thousands) |
| Blended Asset | | $ | 18,010 |
| | $ | 6,699 |
| | $ | 24,709 |
| | $ | 36,319 |
| | $ | 13,151 |
| | $ | 49,470 |
|
| Equity | | 5,831 |
| | 4,222 |
| | 10,053 |
| | 12,187 |
| | 8,710 |
| | 20,897 |
|
| Fixed Income | | 642 |
| | 109 |
| | 751 |
| | 1,332 |
| | 149 |
| | 1,481 |
|
| Total | | $ | 24,483 |
| | $ | 11,030 |
| | $ | 35,513 |
| | $ | 49,838 |
| | $ | 22,010 |
| | $ | 71,848 |
|
Manning & Napier, Inc.
Notes to Consolidated Financial Statements (Continued)
|
| | | | | | | | | | | | | | | | | | | | | | | | |
| | | Three months ended March 31, 2019 | | Three months ended March 31, 2018 |
| | | Separately managed accounts | | Mutual funds and collective investment trusts | | Total | | Separately managed accounts | | Mutual funds and collective investment trusts | | Total |
| | | (in thousands) |
| Blended Asset | | $ | 16,271 |
| | $ | 5,055 |
| | $ | 21,326 |
| | $ | 18,309 |
| | $ | 6,452 |
| | $ | 24,761 |
|
| Equity | | 4,612 |
| | 3,106 |
| | 7,718 |
| | 6,356 |
| | 4,488 |
| | 10,844 |
|
| Fixed Income | | 592 |
| | 67 |
| | 659 |
| | 690 |
| | 40 |
| | 730 |
|
| Total | | $ | 21,475 |
| | $ | 8,228 |
| | $ | 29,703 |
| | $ | 25,355 |
| | $ | 10,980 |
| | $ | 36,335 |
|
Accounts Receivable
Accounts receivable as of June 30, 2018March 31, 2019 and December 31, 20172018 consisted of the following:
| | | | | June 30, 2018 | | December 31, 2017 | | March 31, 2019 | | December 31, 2018 |
| | | (in thousands) | | (in thousands) |
| Accounts receivable - third parties | | $ | 5,850 |
| | $ | 7,278 |
| | $ | 6,318 |
| | $ | 5,342 |
|
| Accounts receivable - affiliated mutual funds and collective investment trusts | | 7,013 |
| | 8,059 |
| | 4,433 |
| | 6,105 |
|
| Total accounts receivable | | $ | 12,863 |
| | $ | 15,337 |
| | $ | 10,751 |
| | $ | 11,447 |
|
Accounts receivable: Accounts receivable represents the Company's unconditional rights to consideration arising from its performance under separately managed account, mutual fund and collective investment trust, distribution and shareholder servicing, and custodial service contracts. Accounts receivable balances do not include an allowance for doubtful accounts nor has any significant bad debt expense attributable to accounts receivable been recorded during the three and six months ended June 30, 2018March 31, 2019 or 2017. Accounts receivable are stated at cost, which approximates net realizable value due to the short-term collection period.2018.
Advisory and Distribution Agreements
The Company earns investment advisory fees, distribution fees and administrative service fees under agreements with affiliated mutual funds and collective investment trusts. Fees earned for advisory and distribution services provided were approximately $14.3$11.1 million and $28.8$14.5 million forduring the three and six months ended June 30,March 31, 2019 and 2018, respectively, and approximately $21.1 million and $45.2 million for the three and six months ended June 30, 2017, respectively, which represents greater than 10%25% of revenue in each period. The following provides amounts due from affiliated mutual funds and collective investment trusts reported within accounts receivable in the consolidated statement of financial condition as of June 30, 2018March 31, 2019 and December 31, 2017:2018:
| | | | | June 30, 2018 | | December 31, 2017 | | March 31, 2019 | | December 31, 2018 |
| | | (in thousands) | | (in thousands) |
Affiliated mutual funds (1) | | $ | 5,472 |
| | $ | 6,219 |
| | $ | 3,071 |
| | $ | 4,802 |
|
| Affiliated collective investment trusts | | 1,541 |
| | 1,840 |
| | 1,362 |
| | 1,303 |
|
| Accounts receivable - affiliated mutual funds and collective investment trusts | | $ | 7,013 |
| | $ | 8,059 |
| | $ | 4,433 |
| | $ | 6,105 |
|
________________________
| |
(1) | December 31, 2017 balance includes $0.7 million of distribution and servicing fees receivable, which in the prior fiscal period were reflected in "Accounts Receivable". This amount was reclassified to conform to the current period presentation (Note 2). |
Contract assets and liabilities
Accrued accounts receivable: Accrued accounts receivable represents the Company's contract asset for revenue that has been recognized in advance of billing separately managed account contracts. Consideration for the period billed in arrears is dependent on the client’s AUM on a future billing date and therefore conditional as of the reporting period end. During the sixthree months ended June 30, 2018,March 31, 2019, revenue was decreasedincreased by less than $0.1 million for changes in transaction price. Accrued accounts receivable of approximately $0.3 million and $0.2 million is reported within prepaid expenses and other assets in the consolidated statement of financial condition as of June 30, 2018.March 31, 2019 and December 31, 2018, respectively.
Manning & Napier, Inc.
Notes to Consolidated Financial Statements (Continued)
Deferred revenue: Deferred revenue is recorded when consideration is received or unconditionally due in advance of providing services to the Company's customer. Revenue recognized forduring the sixthree months ended June 30, 2018March 31, 2019 that was included in deferred revenue at the beginning of the period was approximately $9.7$7.1 million.
Costs to obtain a contract: Incremental first year commissions directly associated with new separate account and collective investment trust contracts are capitalized and amortized straight-line over an estimated customer contract period of 7 years for separate accounts and 3 years for collective investment trust contracts. The total net asset as of June 30,both March 31, 2019 and December 31, 2018 was approximately $1.5$1.2 million. Amortization expense included in compensation and related costs totaled approximately $0.1 million and $0.2 million forduring the three and six months ended June 30, 2018, respectively.March 31, 2019. An impairment loss of approximatelyless than $0.1 million was recognized forduring the sixthree months ended June 30, 2018March 31, 2019 related to contract acquisition costs for client contracts that canceled during the period.
Manning & Napier, Inc.
Notes to Consolidated Financial Statements (Continued)
Note 4—Noncontrolling Interests
Manning & Napier holds an economic interest of approximately 18.2%18.6% in Manning & Napier Group, but as managing member controls all of the business and affairs of Manning & Napier Group. As a result, the Company consolidates the financial results of Manning & Napier Group and records a noncontrolling interest on its consolidated statement of financial condition with respect to the remaining approximately 81.8% aggregate81.4% economic interest in Manning & Napier Group held by M&N Group Holdings and MNCC. Net income attributable to noncontrolling interests on the statements of operations represents the portion of earnings attributable to the economic interest in Manning & Napier Group held by the noncontrolling interests.
The following provides a reconciliation from “Income before provision for income taxes” to “Net income attributable to Manning & Napier, Inc.”:
| | | | | Three months ended June 30, | | Six months ended June 30, | | Three months ended March 31, |
| | | 2018 | | 2017 | | 2018 | | 2017 | | 2019 | | 2018 |
| | | (in thousands) | | (in thousands) |
| Income before provision for income taxes | | $ | 6,682 |
| | $ | 15,831 |
| | $ | 14,433 |
| | $ | 33,688 |
| | $ | 3,159 |
| | $ | 7,751 |
|
Less: income (loss) before provision for income taxes of Manning & Napier, Inc. (1) | | (12 | ) | | 4 |
| | 259 |
| | 7 |
| |
Less: income before provision for income taxes of Manning & Napier, Inc. (1) | | | 191 |
| | 271 |
|
| Income before provision for income taxes, as adjusted | | 6,694 |
| | 15,827 |
| | 14,174 |
| | 33,681 |
| | 2,968 |
| | 7,480 |
|
Controlling interest percentage (2) | | 18.2 | % | | 17.8 | % | | 18.2 | % | | 17.6 | % | | 18.6 | % | | 18.1 | % |
| Net income attributable to controlling interest | | 1,221 |
| | 2,826 |
| | 2,573 |
| | 5,928 |
| | 552 |
| | 1,352 |
|
Plus: income (loss) before provision for income taxes of Manning & Napier, Inc. (1) | | (12 | ) | | 4 |
| | 259 |
| | 7 |
| |
Plus: income before provision for income taxes of Manning & Napier, Inc. (1) | | | 191 |
| | 271 |
|
| Income before income taxes attributable to Manning & Napier, Inc. | | 1,209 |
| | 2,830 |
| | 2,832 |
| | 5,935 |
| | 743 |
| | 1,623 |
|
Less: provision for income taxes of Manning & Napier, Inc. (3) | | 443 |
| | 1,145 |
| | 852 |
| | 2,353 |
| | 182 |
| | 409 |
|
| Net income attributable to Manning & Napier, Inc. | | $ | 766 |
| | $ | 1,685 |
| | $ | 1,980 |
| | $ | 3,582 |
| | $ | 561 |
| | $ | 1,214 |
|
________________________ | |
| (1) | Manning & Napier, Inc. incurs certain income or expenses that are only attributable to it and are therefore excluded from the net income attributable to noncontrolling interests. |
| |
| (2) | Income before provision for income taxes is allocated to the controlling interest based on the percentage of units of Manning & Napier Group held by Manning & Napier, Inc. The amount represents the Company's weighted ownership of Manning & Napier Group for the respective periods. |
| |
| (3) | The consolidated provision for income taxes is equal to the sum of (i) the provision for income taxes for entities other than Manning & Napier, Inc. and (ii) the provision for income taxes of Manning & Napier, Inc. which includes all U.S. federal and state income taxes. The consolidated provision for income taxes was $0.5$0.2 million and $1.0$0.5 million for the three and six months ended June 30, 2018, respectively,March 31, 2019 and $1.2 million and $2.6 million for the three and six months ended June 30, 2017,2018, respectively. |
As of June 30, 2018,March 31, 2019, a total of 63,349,721 units of Manning & Napier Group were held by the noncontrolling interests. Pursuant to the terms of the exchange agreement entered into at the time of the Company's initial public offering ("Exchange Agreement"), such units may be exchangeable for shares of the Company's Class A common stock. For any units exchanged, the Company will (i) pay an amount of cash equal to the number of units exchanged multiplied by the 15-day value of one share of the Company's Class A common stock less a market discount and expected expenses, or, at the Company's election, (ii) issue shares of the Company's Class A common stock on a one-for-one basis, subject to customary adjustments. As the Company receives units of Manning & Napier Group that are exchanged, the Company's ownership of Manning & Napier Group will increase. See Note 14 for further discussion.
Manning & Napier, Inc.
Notes to Consolidated Financial Statements (Continued)
During the sixthree months ended June 30, 2018, M&N Group Holdings and MNCC exchanged a total of 581,344 Class A units of Manning & Napier Group for approximately $1.9 million in cash. Subsequent to the exchange the Class A units were retired, resulting in an increase in Manning & Napier's ownership in Manning & Napier Group. In addition, during the six months ended June 30, 2018,March 31, 2019, Class A common stock was issued under the Company's 2011 Equity Compensation Plan (the "Equity Plan") for which Manning & Napier, Inc. acquired an equivalent number of Class A units of Manning & Napier Group.
Manning & Napier, Inc.
Notes to Consolidated Financial Statements (Continued)
Group, net of forfeitures of unvested restricted stock awards.
The following is the impact to the Company's equity ownership interest in Manning & Napier Group for the sixthree months ended June 30, 2018:March 31, 2019:
| | | | Manning & Napier Group Class A Units Held | | Manning & Napier Group Class A Units Held | |
| |
Manning & Napier | |
Noncontrolling Interests | | Total | | Manning & Napier Ownership % |
Manning & Napier | |
Noncontrolling Interests | | Total | | Manning & Napier Ownership % |
| As of December 31, 2017 | 13,873,042 |
| | 63,931,065 |
| | 77,804,107 |
| | 17.8% | |
| As of December 31, 2018 | | 14,126,736 |
| | 63,349,721 |
| | 77,476,457 |
| | 18.2% |
| Class A Units issued | 253,694 |
| | — |
| | 253,694 |
| | 0.3% | 351,532 |
| | — |
| | 351,532 |
| | 0.4% |
| Class A Units exchanged | — |
| | (581,344 | ) | | (581,344 | ) | | 0.1% | — |
| | — |
| | — |
| | —% |
| As of June 30, 2018 | 14,126,736 |
| | 63,349,721 |
| | 77,476,457 |
| | 18.2% | |
| As of March 31, 2019 | | 14,478,268 |
| | 63,349,721 |
| | 77,827,989 |
| | 18.6% |
Since the Company continues to have a controlling interest in Manning & Napier Group, the aforementioned changes in ownership of Manning & Napier Group were accounted for as equity transactions under ASC 810, Consolidation. Additional paid-in capital and noncontrolling interests in the Consolidated Statements of Financial Position are adjusted to reallocate the Company's historical equity to reflect the change in ownership of Manning & Napier Group.
At June 30, 2018March 31, 2019 and December 31, 2017,2018, the Company had recorded a total liability of $21.5$17.8 million and $21.8$18.0 million, respectively, representing the estimated payments due to the selling unit holders under the tax receivable agreement ("TRA") entered into between Manning & Napier and the other holders of Class A Units of Manning & Napier Group. Of these amounts, $2.5$0.7 million waswere included in accrued expenses and other liabilities as of June 30, 2018at both March 31, 2019 and December 31, 2017.2018. The Company made no payments pursuant to the TRA during the sixthree months ended June 30, 2018March 31, 2019 and 2017.2018.
Obligations pursuant to the TRA are obligations of Manning & Napier. They do not impact the noncontrolling interests. These obligations are not income tax obligations. Furthermore, the TRA has no impact on the allocation of the provision for income taxes to the Company’s net income.
Note 5—Investment Securities
The following represents the Company’s investment securities holdings as of June 30, 2018March 31, 2019 and December 31, 20172018: | | | | | June 30, 2018 | | March 31, 2019 |
| | | Cost | | Unrealized Gains | | Unrealized Losses | | Fair Value | | Cost | | Unrealized Gains | | Unrealized Losses | | Fair Value |
| | | (in thousands) | | (in thousands) |
| Available-for-sale securities | | | | | | | | | | | | | | | | |
| U.S. Treasury notes | | | $ | 17,561 |
| | $ | 90 |
| | $ | — |
| | $ | 17,651 |
|
| Fixed income securities | | $ | 19,589 |
| | $ | — |
| | $ | (172 | ) | | $ | 19,417 |
| | 17,939 |
| | — |
| | (13 | ) | | 17,926 |
|
| U.S. Treasury notes | | 22,663 |
| | — |
| | (45 | ) | | 22,618 |
| |
| Short-term investments | | 22,470 |
| | — |
| | — |
| | 22,470 |
| | 43,423 |
| | — |
| | — |
| | 43,423 |
|
| | | | | | | | | 64,505 |
| | | | | | | | 79,000 |
|
| Trading securities | | | | | | | | | | | | | | | | |
| Equity securities | | | | | | | | 3,463 |
| | | | | | | | 5,242 |
|
| Mutual funds | | | | | | | | 1,408 |
| | | | | | | | 3,864 |
|
| | | | | | | | | 4,871 |
| | | | | | | | 9,106 |
|
| Total investment securities | | | | | | | | $ | 69,376 |
| | | | | | | | $ | 88,106 |
|
Manning & Napier, Inc.
Notes to Consolidated Financial Statements (Continued)
| | | | | December 31, 2017 | | December 31, 2018 |
| | | Cost | | Unrealized Gains | | Unrealized Losses | | Fair Value | | Cost | | Unrealized Gains | | Unrealized Losses | | Fair Value |
| | | (in thousands) | | (in thousands) |
| Available-for-sale securities | | | | | | | | | | | | | | | | |
| U.S. Treasury notes | | | $ | 21,613 |
| | $ | 36 |
| | $ | — |
| | $ | 21,649 |
|
| Fixed income securities | | $ | 19,589 |
| | $ | — |
| | $ | (29 | ) | | $ | 19,560 |
| | 15,488 |
| | — |
| | (75 | ) | | 15,413 |
|
| U.S. Treasury notes | | 22,428 |
| | — |
| | (42 | ) | | 22,386 |
| |
| Short-term investments | | 22,323 |
| | — |
| | — |
| | 22,323 |
| | 45,879 |
| | — |
| | — |
| | 45,879 |
|
| | | | | | | | | 64,269 |
| | | | | | | | 82,941 |
|
| Trading securities | | | | | | | | | | | | | | | | |
| Equity securities | | | | | | | | 3,548 |
| | | | | | | | 4,683 |
|
| Mutual funds | | | | | | | | 1,409 |
| | | | | | | | 3,566 |
|
| | | | | | | | | 4,957 |
| | | | | | | | 8,249 |
|
| Equity method investments | | | | | | | | | |
| Mutual funds | | | | | | | | 1,178 |
| |
| Total investment securities | | | | | | | | $ | 70,404 |
| | | | | | | | $ | 91,190 |
|
Investment securities are classified as either trading or available-for-sale and are carried at fair value. Fair value is determined based on quoted market prices in active markets for identical or similar instruments.
Investment securities classified as trading consist of equity securities, fixed income securities and investments in mutual funds for which the Company provides advisory services. At June 30, 2018March 31, 2019 and December 31, 20172018, trading securities consist solely of investments held by the Company to provide initial cash seeding for product development purposes.purposes and investments in mutual funds to hedge economic exposure to market movements on its deferred compensation plan. The Company recognized approximately $0.3$0.9 million of net unrealized lossesgains and $1.2$0.2 million of net unrealized gainslosses related to investments classified as trading during the sixthree months ended June 30, 2018March 31, 2019 and 20172018, respectively.
Investment securities classified as available-for-sale consist of U.S. Treasury notes, corporate bonds and other short-term investments to optimize cash management opportunities and for compliance with certain regulatory requirements and to optimize cash management opportunities.requirements. As of June 30, 2018March 31, 2019 and December 31, 20172018, approximately $0.6 million of these securities was considered restricted. The Company periodically reviews each individual security position that has an unrealized loss, or impairment, to determine if that impairment is other-than-temporary. No other-than-temporary impairment charges have been recognized by the Company during the sixthree months ended June 30, 2018March 31, 2019 and 20172018.
Note 6—Fair Value Measurements
Fair value is defined as the price that the Company would receive upon selling an investment in an orderly transaction to an independent buyer in the principal or most advantageous market of the investment. A fair value hierarchy is provided that gives the highest priority to unadjusted quoted prices in active markets for identical assets and liabilities (Level 1) and the lowest priority to unobservable inputs (Level 3).
The following three-tier fair value hierarchy prioritizes the inputs used in measuring fair value:
•Level 1—observable inputs such as quoted prices in active markets for identical securities;
Level 2—other significant observable inputs (including but not limited to quoted prices for similar securities, interest rates, prepayment rates, credit risk, etc.); and
Level 3—significant unobservable inputs (including the Company’s own assumptions in determining the fair value of investments).
Manning & Napier, Inc.
Notes to Consolidated Financial Statements (Continued)
The following provides the hierarchy of inputs used to derive the fair value of the Company’s financial instruments measured at fair value on a recurring basisassets as of June 30, 2018March 31, 2019 and December 31, 20172018:
| | | | | June 30, 2018 | | March 31, 2019 |
| | | Level 1 | | Level 2 | | Level 3 | | Totals | | Level 1 | | Level 2 | | Level 3 | | Totals |
| | | (in thousands) | | (in thousands) |
| Equity securities | | $ | 3,463 |
| | $ | — |
| | $ | — |
| | $ | 3,463 |
| | $ | 5,242 |
| | $ | — |
| | $ | — |
| | $ | 5,242 |
|
| Fixed income securities | | — |
| | 19,417 |
| | — |
| | 19,417 |
| | — |
| | 17,926 |
| | — |
| | 17,926 |
|
| Mutual funds | | 1,408 |
| | — |
| | — |
| | 1,408 |
| | 3,864 |
| | — |
| | — |
| | 3,864 |
|
| U.S. Treasury notes | | — |
| | 22,618 |
| | — |
| | 22,618 |
| | — |
| | 17,651 |
| | — |
| | 17,651 |
|
| Short-term investments | | 22,470 |
| | — |
| | — |
| | 22,470 |
| | 40,225 |
| | 3,198 |
| | — |
| | 43,423 |
|
| Total assets at fair value | | $ | 27,341 |
| | $ | 42,035 |
| | $ | — |
| | $ | 69,376 |
| | $ | 49,331 |
| | $ | 38,775 |
| | $ | — |
| | $ | 88,106 |
|
| | | | | | | | | | | | | | | | | |
| Contingent consideration liability | | $ | — |
| | $ | — |
| | $ | — |
| | $ | — |
| | $ | — |
| | $ | — |
| | $ | — |
| | $ | — |
|
| Total liabilities at fair value | | $ | — |
| | $ | — |
| | $ | — |
| | $ | — |
| | $ | — |
| | $ | — |
| | $ | — |
| | $ | — |
|
| | | | | December 31, 2017 | | December 31, 2018 |
| | | Level 1 | | Level 2 | | Level 3 | | Totals | | Level 1 | | Level 2 | | Level 3 | | Totals |
| | | (in thousands) | | (in thousands) |
| Equity securities | | $ | 3,548 |
| | $ | — |
| | $ | — |
| | $ | 3,548 |
| | $ | 4,683 |
| | $ | — |
| | $ | — |
| | $ | 4,683 |
|
| Fixed income securities | | — |
| | 19,560 |
| | — |
| | 19,560 |
| | — |
| | 15,413 |
| | — |
| | 15,413 |
|
| Mutual funds | | 2,587 |
| | — |
| | — |
| | 2,587 |
| | 3,566 |
| | — |
| | — |
| | 3,566 |
|
| U.S. Treasury notes | | — |
| | 22,386 |
| | — |
| | 22,386 |
| | — |
| | 21,649 |
| | — |
| | 21,649 |
|
| Short-term investments | | 22,323 |
| | — |
| | — |
| | 22,323 |
| | 43,914 |
| | 1,965 |
| | — |
| | 45,879 |
|
| Total assets at fair value | | $ | 28,458 |
| | $ | 41,946 |
| | $ | — |
| | $ | 70,404 |
| | $ | 52,163 |
| | $ | 39,027 |
| | $ | — |
| | $ | 91,190 |
|
| | | | | | | | | | | | | | | | | |
| Contingent consideration liability | | $ | — |
| | $ | — |
| | $ | — |
| | $ | — |
| | $ | — |
| | $ | — |
| | $ | — |
| | $ | — |
|
| Total liabilities at fair value | | $ | — |
| | $ | — |
| | $ | — |
| | $ | — |
| | $ | — |
| | $ | — |
| | $ | — |
| | $ | — |
|
Short-term investments consists of certificate of deposits ("CDs") that are stated at cost, which approximate fair value due to the short maturity of the investments.investments and U.S. Treasury bills.
Valuations of investments in fixed income securities and U.S. Treasury notes and bills can generally be obtained through independent pricing services. For most bond types, the pricing service utilizes matrix pricing, which considers one or more of the following factors: yield or price of bonds of comparable quality, coupon, maturity, current cash flows, type and current day trade information, as well as dealer supplied prices. These valuations are categorized as Level 2 in the hierarchy.
Contingent consideration was a component of the Company's purchase price of Rainier in 2016 of additional cash payments of up to $32.5 million over the period ending December 31, 2019, contingent upon Rainier’sRainier's achievement of certain financial targets. The fair value of the contingent consideration is calculated on a quarterly basis by forecasting Rainier’s adjusted earnings before interest, taxes and amortization ("EBITA") over the contingency period. There were no changes in contingent consideration liability measured at fair value using significant unobservable inputs (Level 3) for the sixthree months ended June 30, 2018.March 31, 2019.
The Company’s policy is to recognize transfers in and transfers out of the valuation levels as of the beginning of the reporting period. There were no transfers between Levelsvaluation levels during the sixthree months ended June 30, 2018March 31, 2019.
Manning & Napier, Inc.
Notes to Consolidated Financial Statements (Continued)
Note 7—Accrued Expenses and Other Liabilities
Accrued expenses and other liabilities as of June 30, 2018March 31, 2019 and December 31, 20172018 consisted of the following:
| | | | | June 30, 2018 | | December 31, 2017 | | March 31, 2019 | | December 31, 2018 |
| | | (in thousands) | | (in thousands) |
| Accrued bonus and sales commissions | | $ | 14,728 |
| | $ | 19,153 |
| | $ | 6,885 |
| | $ | 16,121 |
|
| Accrued payroll and benefits | | 2,243 |
| | 3,877 |
| | 2,880 |
| | 4,087 |
|
| Accrued sub-transfer agent fees | | 1,738 |
| | 2,445 |
| | 760 |
| | 1,451 |
|
| Dividends payable | | 1,227 |
| | 1,203 |
| | 314 |
| | 306 |
|
| Amounts payable under tax receivable agreement | | 2,549 |
| | 2,549 |
| | 674 |
| | 674 |
|
| Short-term operating lease liabilities | | | 2,722 |
| | — |
|
| Other accruals and liabilities | | 2,943 |
| | 3,120 |
| | 2,725 |
| | 2,487 |
|
| Total accrued expenses and other liabilities | | $ | 25,428 |
| | $ | 32,347 |
| | $ | 16,960 |
| | $ | 25,126 |
|
During the year ended December 31, 2018, the Company commenced a voluntary employee retirement offering (the "offering"), available to employees meeting certain age and length-of-service requirements as well as business function criteria. Employees electing to participate in the offering were subject to approval by the Company, and received enhanced separation benefits. These employees are required to render service until their agreed upon termination date (which varies from person to person) in order to receive the benefits and as such, the liability will be recognized ratably over the applicable service period.
The Company estimates the total employee severance costs under the offering to be approximately $2.6 million, of which approximately $2.2 million was recognized during the year ended December 31, 2018. During the three months ended March 31, 2019, the Company recognized approximately $0.1 million of severance costs under the offering and approximately $0.4 million as a result of involuntary workforce reductions. Employee severance costs recognized are included in compensation and related costs in the consolidated statements of operations.
The following table summarizes the changes in accrued employee severance costs recognized by the Company during the three months ended March 31, 2019, as included in accrued expenses and other liabilities in the consolidated statements of financial condition:
|
| | | | |
| | | Three months ended March 31, 2019 |
| | | (in thousands) |
| Accrued employee severance costs as of December 31, 2018 | | $ | 1,642 |
|
| Employee severance costs recognized | | 502 |
|
| Payment of employee severance costs | | (1,230 | ) |
| Accrued employee severance costs as of March 31, 2019 | | $ | 914 |
|
Note 8—Leases
Adoption of ASU 2016-02, Leases (Topic 842)
On January 1, 2019, the Company adopted Topic 842 using the optional transition method. Consequently, financial information and disclosures for the reporting periods beginning after January 1, 2019 are presented under Topic 842, while prior period amounts are not adjusted and continue to be reported in accordance with the Company's historic accounting policies under Topic 840.
Topic 842 provides a number of optional practical expedients as part of the transition from Topic 840. The Company elected the ‘package of practical expedients’, which permits it to not reassess, under Topic 842, its prior conclusions about lease identification, lease classification and initial direct costs.
Topic 842 also provides practical expedients for an entity’s ongoing accounting under Topic 842. The Company elected the short-term lease recognition exemption for all leases that qualify, and elected the practical expedient to combine lease and non-lease components as a single combined lease component for all of its leases.
On adoption, the Company recognized lease liabilities of approximately $23.2 million and right-of-use assets for approximately $20.6 million, based on the present value of the remaining minimum rental payments under Topic 840 for operating leases that existed as of the date of adoption. In addition, the Company wrote-down approximately $2.6 million of unamortized deferred lease costs and tenant incentives previously recorded as deferred rent liability in the consolidated
Manning & Napier, Inc.
Notes to Consolidated Financial Statements (Continued)
statements of financial condition as of December 31, 2018. The Company recognized an increase to opening shareholders' equity and noncontrolling interest of approximately $0.1 million, as of January 1, 2019, related to the deferred tax impacts of adopting Topic 842.
Leases
The Company has operating and finance leases for office space and certain equipment. For these leases, the office space or equipment is an explicitly identified asset within the contract. The Company has determined that it has obtained substantially all of the economic benefits from the use of the underlying asset and directs how and for what purpose the asset is used during the term of the contract.
The Company's leases have remaining lease terms ranging between 1 year and approximately 9 years. The Company's lease term on certain of its multi-year office space leases, including its headquarters, include options for the Company to extend those leases for periods ranging from an additional five to ten years. In addition, the Company has the option to reduce a portion of its square footage at certain times throughout the term of the lease for its headquarters. The Company determined it is not reasonably certain at this time it will exercise the options to extend these leases or will exercise the options to reduce its square footage; therefore, the payment amounts related to these lease term extensions and contraction options have been excluded from determining its right-of-use asset and lease liability.
Certain of the Company's operating leases for office space include variable lease payments, including non-lease components (such as utilities and operating expenses) that vary based on actual expenses and are adjusted on an annual basis. The Company concluded that these variable lease payments are in substance fixed payments and included the estimated variable payments in its determination of right-of-use assets and lease liabilities.
Changes in the lease terms, including renewal options and options to reduce its square footage, incremental borrowing rates, and/or variable lease payments, and the corresponding impact to the right-of-use assets and lease liabilities, are recognized in the period incurred.
Certain of the Company's operating leases have been subleased for which the Company will receive cash totaling approximately $0.4 million over the term of such leases. The lease terms for the two subleased operating leases end in 2019 and 2021.
The components of lease expense for the three months ended March 31, 2019 were as follows: |
| | | | |
| | | Three months ended March 31, 2019 |
| | | (in thousands) |
| Finance lease expense | | |
| Amortization of right-of-use assets | | $ | 29 |
|
| Interest on lease liabilities | | 3 |
|
| Operating lease expense | | 923 |
|
| Short-term lease expense | | 4 |
|
| Variable lease expense | | 46 |
|
| Sublease income | | (123 | ) |
| Total | | $ | 882 |
|
Manning & Napier, Inc.
Notes to Consolidated Financial Statements (Continued)
Supplemental cash flow information related to leases for the three months ended March 31, 2019 was as follows: |
| | | | |
| | | Three months ended March 31, 2019 |
| | | (in thousands) |
| Cash paid for amounts included in the measurement of lease liabilities: | | |
| Operating cash flows from finance leases | | $ | 3 |
|
| Finance cash flows from finance leases | | $ | 27 |
|
| Operating cash flows from operating leases | | $ | 794 |
|
| | | |
| Right-of-use assets obtained in exchange for new lease obligations: | | |
| Finance leases | | $ | 163 |
|
| Operating leases | | $ | — |
|
Supplemental balance sheet information related to leases as of March 31, 2019 was as follows:
|
| | | | |
| (in thousands, except lease term and discount rate) | | March 31, 2019 |
| Finance Leases | | |
Finance lease right-of-use assets (1) | | $ | 284 |
|
| | | |
| Accrued expenses and other liabilities | | $ | 127 |
|
| Other long-term liabilities | | 173 |
|
| Total finance lease liabilities | | $ | 300 |
|
| | | |
| Operating Leases | | |
| Operating lease right-of-use assets | | $ | 19,957 |
|
| | | |
| Accrued expenses and other liabilities | | $ | 2,722 |
|
| Operating lease liabilities, non-current | | 20,010 |
|
| Total operating lease liabilities | | $ | 22,732 |
|
| | | |
| Weighted average remaining lease term | | |
| Finance leases | | 3.10 years |
|
| Operating leases | | 8.03 years |
|
| Weighted average discount rate | | |
| Finance leases | | 4.27 | % |
| Operating leases | | 5.21 | % |
| |
| (1) | Amounts included in other long-term assets within the consolidated statements of financial condition. |
Manning & Napier, Inc.
Notes to Consolidated Financial Statements (Continued)
Maturities of lease liabilities were as follows:
|
| | | | | | | | |
| Twelve month period ending March 31, | | Finance Leases | | Operating Leases |
| | | (in thousands) |
| 2020 | | $ | 137 |
| | $ | 3,839 |
|
| 2021 | | 82 |
| | 3,643 |
|
| 2022 | | 53 |
| | 3,544 |
|
| 2023 | | 30 |
| | 3,228 |
|
| 2024 | | 20 |
| | 2,964 |
|
| Thereafter | | — |
| | 10,695 |
|
| Total lease payments | | 322 |
| | 27,913 |
|
| Less imputed interest | | (22 | ) | | (5,181 | ) |
| Total lease liabilities | | $ | 300 |
| | $ | 22,732 |
|
As of December 31, 2018, minimum rent payments relating to the office leases for each of the following five years and thereafter were as follows:
|
| | | | |
| Year Ending December 31, | | Minimum Payments |
| | | (in thousands) |
| 2019 | | $ | 3,748 |
|
| 2020 | | 3,780 |
|
| 2021 | | 3,712 |
|
| 2022 | | 3,668 |
|
| 2023 | | 3,369 |
|
| Thereafter | | 13,397 |
|
| Total undiscounted lease payments | | $ | 31,674 |
|
Note 9—Commitments and Contingencies
The Company may from time to time enter into agreements that contain certain representations and warranties and which provide general indemnifications. The Company may also serve as a guarantor of such obligations of one or more of the Manning & Napier Group entities.obligations. The Company’s maximum exposure under these arrangements is unknown, as this would involve future claims that may be made against the Company that have not yet occurred. The Company expects any risk of liability associated with such guarantees to be remote.
Regulation
As an investment adviser to a variety of investment products, the Company and its affiliated broker-dealer are subject to routine reviews and inspections by the SEC and the Financial Industry Regulatory Authority, Inc. Additionally, the Company could be subject to non-routine reviews and inspections by the National Futures Association and U.S. Commodity Futures Trading Commission in regards to the Company’s de minimis exposure to commodity interest investments in the mutual funds and collective investment trust vehicles it operates. From time to time the Company may also be subject to claims, or be involved in various legal proceedings, arising in the ordinary course of its business and be subject to other contingencies. The Company does not believe that the outcome of any of these reviews, inspections or other legal proceedings will have a material impact on its consolidated financial statements; however, litigation is subject to many uncertainties, and the outcome of individual litigated matters is difficult to predict. The Company will establish accruals for matters that are probable, can be reasonably estimated, and may take into account any related insurance recoveries to the extent of such recoveries. As of June 30, 2018March 31, 2019 and December 31, 2017,2018, the Company has not accrued for any such claims, legal proceedings, or other contingencies.
Note 9—10—Earnings per Common Share
Basic earnings per share (“basic EPS”) is computed using the two-class method to determine net income available to Class A common stock. The two-class method includes an earnings allocation formula that determines earnings per share for each participating security according to dividends declared and undistributed earnings for the period. The Company's restricted Class A common shares granted under the Equity Plan have non-forfeitable dividend rights during their vesting period and are therefore considered participating securities under the two-class method. Under the two-class method, the Company's net income available to Class A common stock is reduced by the amount allocated to the unvested restricted Class A common
Manning & Napier, Inc.
Notes to Consolidated Financial Statements (Continued)
stock. Basic EPS is calculated by dividing net income available to Class A common stock by the weighted average number of common shares outstanding during the period.
Diluted earnings per share (“diluted EPS”) is computed under the more dilutive of either the treasury method or the two-class method. For the diluted calculation, the weighted average number of common shares outstanding during the period is increased by the assumed conversion into Class A common stock of the unvested equity awards and the exchangeable Class A units of Manning & Napier Group, to the extent that such conversion would dilute earnings per share.
Manning & Napier, Inc.
Notes to Consolidated Financial Statements (Continued)
The following is a reconciliation of the income and share data used in the basic and diluted earnings per shareEPS computations for the three and sixthree months ended June 30, 2018March 31, 2019 and 20172018 under the two-class method:
| | | | | Three months ended June 30, | | Six months ended June 30, | | Three months ended March 31, |
| | | 2018 | | 2017 | | 2018 | | 2017 | | 2019 | | 2018 |
| | | (in thousands, except share data) | | (in thousands, except share data) |
| Net income attributable to controlling and noncontrolling interests | | $ | 6,190 |
| | $ | 14,589 |
| | $ | 13,463 |
| | $ | 31,103 |
| | $ | 2,917 |
| | $ | 7,273 |
|
| Less: net income attributable to noncontrolling interests | | 5,424 |
| | 12,904 |
| | 11,483 |
| | 27,521 |
| | 2,356 |
| | 6,059 |
|
| Net income attributable to Manning & Napier, Inc. | | $ | 766 |
| | $ | 1,685 |
| | $ | 1,980 |
| | $ | 3,582 |
| | $ | 561 |
| | $ | 1,214 |
|
| Less: allocation to participating securities | | 47 |
| | 102 |
| | 95 |
| | 212 |
| | (5 | ) | | 63 |
|
| Net income available to Class A common stock | | $ | 719 |
| | $ | 1,583 |
| | $ | 1,885 |
| | $ | 3,370 |
| | $ | 566 |
| | $ | 1,151 |
|
| | | | | | | | | | | | | |
| Weighted average shares of Class A common stock outstanding - basic | | 14,691,928 |
| | 14,111,368 |
| | 14,503,784 |
| | 14,077,313 |
| | 14,927,265 |
| | 14,313,549 |
|
| Dilutive effect of unvested equity awards | | 17,475 |
| | 187,466 |
| | 26,614 |
| | 179,598 |
| | 304,183 |
| | 51,888 |
|
| Dilutive effect of exchangeable Class A Units | | — |
| | — |
| | — |
| | — |
| | 63,349,721 |
| | 63,918,146 |
|
| Weighted average shares of Class A common stock outstanding - diluted | | 14,709,403 |
| | 14,298,834 |
| | 14,530,398 |
| | 14,256,911 |
| | 78,581,169 |
| | 78,283,583 |
|
| Net income available to Class A common stock per share - basic | | $ | 0.05 |
| | $ | 0.12 |
| | $ | 0.13 |
| | $ | 0.25 |
| | $ | 0.04 |
| | $ | 0.08 |
|
| Net income available to Class A common stock per share - diluted | | $ | 0.05 |
| | $ | 0.12 |
| | $ | 0.13 |
| | $ | 0.25 |
| | $ | 0.03 |
| | $ | 0.07 |
|
For the threethree-months ended March 31, 2019, 3,000,000 unvested performance-based stock options were excluded from the calculation of diluted EPS because the associated market condition had not yet been achieved.
For the three-months ended March 31, 2019 and six months ended June 30, 2018, 592,5001,413,560 and 668,603,866,103, respectively, unvested equity awards were excluded from the calculation of diluted earnings per common share because the effect would have been anti-dilutive. For both the three and six months ended June 30, 2017, 830,000 unvested equity awards were excluded from the calculation of diluted earnings per common share because the effect would have been anti-dilutive.
At June 30, 2018 and 2017, there were 63,349,721 and 63,941,860 Class A Units of Manning & Napier Group outstanding, respectively, which, subject to certain restrictions, may be exchangeable for up to an equivalent number of the Company's Class A common stock. These units were not included in the calculation of diluted earnings per common share for the three and six months ended June 30, 2018 or for the three and six months ended June 30, 2017,EPS because the effect would have been anti-dilutive.
Note 10—11—Equity Based Compensation
The Equity Plan was adopted by the Company's board of directors and approved by stockholders prior to the consummation of the Company's 2011 initial public offering. Under the Equity Plan, a total of 13,142,813 equity interests are authorized for issuance, and may be issued in the form of Class A common stock, restricted stock units, stock options, units of Manning & Napier Group, or certain classes of membership interests in the Company which may convert into units of Manning & Napier Group.
The following table summarizes activity related to awards of restricted stock and restricted stock units (collectively, "stock awards") activity under the award activityEquity Plan for the sixthree months ended June 30, 2018March 31, 2019 under the Equity Plan::
| | | | | Restricted Stock Awards | | Weighted Average Grant Date Fair Value | | Stock Awards | | Weighted Average Grant Date Fair Value |
| Stock awards outstanding at January 1, 2018 | | 852,123 |
| | $ | 12.09 |
| |
| Outstanding at January 1, 2019 | | | 1,602,337 |
| | $ | 5.31 |
|
| Granted | | 300,321 |
| | $ | 3.43 |
| | 723,842 |
| | $ | 2.40 |
|
| Vested | | (491,194 | ) | | $ | 7.91 |
| | (388,615 | ) | | $ | 2.56 |
|
| Forfeited | | — |
| | $ | — |
| | (15,000 | ) | | $ | 12.20 |
|
| Stock awards outstanding at June 30, 2018 | | 661,250 |
| | $ | 11.27 |
| |
| Outstanding at March 31, 2019 | | | 1,922,564 |
| | $ | 4.72 |
|
The weighted average fair value of Equity Planstock awards granted during the sixthree months ended June 30, 2018March 31, 2019 was $3.43,$2.40, based on the closing sale price of Manning & Napier Inc.'s Class A common stock as reported on the New York Stock Exchange on the date of grant, and, when applicable,if not entitled to dividends or dividend equivalents during the vesting period, reduced by the present value of the dividendssuch amounts expected to be paid on the underlying shares during the requisite service period. Restricted stock unit awards are not entitled to dividends declared on the underlying shares of Class A common stock until the awards vest.
Manning & Napier, Inc.
Notes to Consolidated Financial Statements (Continued)
For the three and six months ended June 30,March 31, 2019 and 2018, the Company recorded approximately $0.5$1.4 million and $1.6$1.2 million, respectively, of compensation expense related to stock awards under the Equity Plan. For the three and six months ended June 30, 2017, the Company recorded approximately $0.7 million and $1.4 million, respectively, of compensation expense related to awards under the Equity Plan. The aggregate intrinsic value of awards that vested during the six months ended June 30, 2018 and 2017 was approximately $1.7 million and $1.2 million, respectively. As of June 30, 2018,March 31, 2019, there was unrecognized compensation expense of approximately $5.3 million related to Equity Planstock awards, of approximately $4.7 million, which the Company expects to recognize over a weighted average period of approximately 2.82.2 years. The aggregate intrinsic value of stock awards that vested during the three months ended March 31, 2019 was approximately $1.0 million.
A summary of activity under the Equity Plan related to stock option awards during the three months ended March 31, 2019 is presented below:
|
| | | | | | | | | | | | | |
| | | Stock Option Awards | | Weighted Average Exercise Price | | Weighted Average Contractual Term (years) | | Aggregate Intrinsic Value (in thousands) |
| Outstanding at January 1, 2019 | | — |
| | $ | — |
| | | | |
| Granted | | 3,500,000 |
| | $ | 2.01 |
| | | | |
| Vested | | — |
| | $ | — |
| | | | |
| Forfeited | | — |
| | $ | — |
| | | | |
| Outstanding at March 31, 2019 | | 3,500,000 |
| | $ | 2.01 |
| | 4.1 | | $ | 315 |
|
| Exercisable at March 31, 2019 | | — |
| | $ | — |
| | | | |
For the three months ended March 31, 2019, the Company recorded approximately $0.1 million of compensation expense related to stock options under the Equity Plan. As of March 31, 2019, there was unrecognized compensation expense of approximately $1.4 million related to stock options, which the Company expects to recognize over a weighted average period of approximately 1.4 years.
During the three months ended March 31, 2019, the Company granted a total of 3,500,000 stock option awards under the Equity Plan, 3,000,000 of which are subject to the achievement of specified performance criteria ("performance options"). The performance options vest in installments, only if the closing price per share of the Company's Class A common stock as reported on the New York Stock Exchange exceeds a certain threshold for 20 consecutive days ("target price") prior to a specified date ("target date"). Target prices range from $3.25 to $7.75. Target dates by which each target price must be achieved range from three to seven years from the grant date. These performance options are considered to have a market condition, the effect of which is reflected in the grant date fair value of the award. As such, as long as the requisite service is rendered for these awards, compensation expense will be recognized regardless of whether the market condition is achieved. The fair value of these performance options was estimated using a Monte Carlo simulation model and the weighted average grant date fair value for the performance options granted was $0.38.
For stock option awards with service conditions only ("service-based options"), the Company determines the fair value of each option award on the date of grant using the Black-Scholes option pricing model. The weighted average grant date fair value of service-based options granted during the three months ended March 31, 2019 was $0.62, using the following assumptions:
|
| | |
| | Three months ended March 31, 2019 |
| Expected volatility | | 45.00% |
| Expected term (in years) | | 4.9 - 6.9 |
| Risk-free interest rate | | 2.49% - 2.58% |
| Expected dividend yield | | 3.98% |
Note 11—12—Income Taxes
The Company is comprised of entities that have elected to be treated as either a limited liability company ("LLC") or a C corporation (“C-Corporation")“C-Corporation". As such, the entities functioning as LLCs are not liable for or able to benefit from U.S. federal and most state income taxes on their earnings, and earnings (losses), which will be included in the personal income tax returns of each entity’s unit holders. The entities functioning as C-Corporations are liable for or able to benefit from U.S. federal and state and local income taxes on their earnings and losses, respectively.
Manning & Napier, Inc.
Notes to Consolidated Financial Statements (Continued)
The Company’s income tax provision and effective tax rate were as follows:
| | | | | Three months ended June 30, | | Six months ended June 30, | | Three months ended March 31, |
| | | 2018 | | 2017 | | 2018 | | 2017 | | 2019 | | 2018 |
| | | (in thousands) | | (in thousands) |
| Earnings from continuing operations before income taxes | | $ | 6,682 |
| | $ | 15,831 |
| | $ | 14,433 |
| | $ | 33,688 |
| | $ | 3,159 |
| | $ | 7,751 |
|
| Effective tax rate | | 7.4 | % | | 7.8 | % | | 6.7 | % | | 7.7 | % | | 7.7 | % | | 6.2 | % |
| Provision for income taxes | | 492 |
| | 1,242 |
| | 970 |
| | 2,585 |
| | 242 |
| | 478 |
|
| Provision for income taxes @ statutory rate | | 1,403 |
| | 5,383 |
| | 3,031 |
| | 11,454 |
| |
| Provision for income taxes at statutory rate | | | 663 |
| | 1,628 |
|
| Difference between tax at effective vs. statutory rate | | $ | (911 | ) | | $ | (4,141 | ) | | $ | (2,061 | ) | | $ | (8,869 | ) | | $ | (421 | ) | | $ | (1,150 | ) |
TheFor both the three months ended March 31, 2019 and 2018, the difference between the Company’s recorded provision and the provision that would result from applying the U.S. statutory rate of 21% for the three and six months ended June 30, 2018 and 34% for the three and six months ended June 30, 2017 is primarily attributable to the benefit resulting from the fact that a significant portion of the Company’s operations include a series of flow-through entities which are generally not subject to federal and most state income taxes. Accordingly, a portion of the Company’s earnings are not subject to corporate level taxes.
Note 12—13—Related Party Transactions
Transactions with noncontrolling members
From time to time, the Company may be asked to provide certain services, including accounting, legal and other administrative functions for the noncontrolling members of Manning & Napier Group. While immaterial, the Company has not received any reimbursement for such services.
The Company manages the personal funds and funds of affiliated entities of certain of the Company's current and former executive officers and directors.directors, including William Manning. Pursuant to the respective investment management agreements, in some instances the Company waives or reduces its regular advisory fees for these accounts.accounts and personal funds utilized to incubate products. The aggregate value of the fees earned and the value of fees waived was less than $0.1 million for each of the sixthree months ended June 30, 2018March 31, 2019 and 2017, respectively.2018.
Affiliated fund transactions
The Company earns investment advisory fees, distribution fees and administrative service fees under agreements with affiliated mutual funds and collective investment trusts. FeesThe aggregate value of revenue earned for advisory and distribution services provided werewas approximately $14.3$11.6 million and $28.8$15.0 million for the three and six months ended June 30,March 31, 2019 and 2018, respectively. As of March 31, 2019 and December 31, 2018, amounts due from the affiliated mutual funds was approximately $21.1$3.1 million and $45.2$4.8 million, for the threerespectively. As of March 31, 2019 and six months ended June 30, 2017, respectively. Fees earned for administrative services provided were approximately $0.5 million and $1.0 million for the three and six months ended June 30,December 31, 2018, respectively. See Note 3 for disclosure of amounts due from affiliated mutual funds and collective investment trusts.trusts was approximately $1.4 million and $1.3 million, respectively.
The Company incurs certain expenses on behalf of the collective investment trusts and has contractually agreed to limit its fees and reimburse expenses to limit operating expenses incurred by certain affiliated fund series. The aggregate value of fees waived and expenses reimbursed to, or incurred for, affiliated mutual funds and collective investment trusts was approximately $0.7$1.5 million and $2.4$1.7 million for the three and six months ended June 30,March 31, 2019 and 2018, and $1.4 million and $2.7 million for the three and six months ended June 30, 2017, respectively. As of June 30,March 31, 2019 and December 31, 2018, the Company has recorded a receivable of approximately $0.7$0.2 million for expenses paid on behalf of an affiliated mutual fund. These expenses are reimbursable to the Company under an agreement with the affiliated mutual fund, and are included within other long-term assets on the consolidated statements of financial condition.
Note 14—Subsequent Events
Exchange of Class A units of Manning & Napier Inc.Group
NotesPursuant to Consolidated Financial Statements (Continued)
Note 13—the terms of the Exchange Agreement (Note 4), M&N Group Holdings and MNCC exchanged a total of 1,315,521 Class A units of Manning & Napier Group on May 2, 2019, for approximately $3.1 million in cash. Subsequent Eventsto the exchange, the Class A units were retired. As a result of the exchange and retirement, the Company's ownership of Manning & Napier Group increased to approximately 18.9%.
Distributions and dividends
On July 24, 2018,April 23, 2019, the Board of Directors approved a distribution from Manning & Napier Group to Manning & Napier and the noncontrolling interests of Manning & Napier Group. The amount of the distribution will be based on earnings for the quarter endedending June 30, 2018, with a maximum amount of $2.5 million.2019. Concurrently, the Board of Directors declared an $0.08a $0.02 per share dividend to the holders of Class A common stock. The dividend is payable on or about NovemberAugust 1, 20182019 to shareholders of record as of OctoberJuly 15, 2018.
Voluntary Employee Retirement Offering
During the quarter ended June 30, 2018, the Company commenced a voluntary employee retirement offering (the "offering"), available to employees meeting certain age and length-of-service requirements as well as business function criteria. Employees electing to participate in the offering are subject to approval by the Company, and will receive enhanced separation benefits. As of June 30, 2018, the period for voluntary participation in the offering remained open. Subsequent to June 30, 2018, the offering period closed.
The Company's estimate of the costs and benefits to be recorded under the offering is approximately $2.6 million, of which approximately $2.2 million is expected to be incurred during the third and fourth quarters of 2018. Participants will depart on a staggered schedule to maintain business continuity.2019.
Item 2. Management’s Discussion and Analysis of Financial Condition and Results of Operations.Operations
This report contains forward-looking statements within the meaning of section 27A of the Securities Act of 1933, as amended, and Section 21E of the Securities Exchange Act of 1934, as amended (the "Exchange Act") which reflect theour views of Manning & Napier, Inc. ("we," "our," or "us") with respect to, among other things, our operations and financial performance. Words like "believes," "expects," "may," "estimates," "will," "should," "could," "intends," "likely," "plans," or "anticipates" or the negative thereof or other variations thereon or comparable terminology, are used to identify forward-looking statements, although not all forward-looking statements contain these words. Although we believe that we are basing our expectations and beliefs on reasonable assumptions within the bounds of what we currently know about our business and operations, there can be no assurance that our actual results will not differ materially from what we expect or believe. Some of the factors that could cause our actual results to differ materially from our expectations or beliefs are disclosed in the “Risk Factors” section, as well as other sections, of our Annual Report on Form 10-K which include, without limitation: changes in securities or financial markets or general economic conditions; a decline in the performance of our products; client sales and redemption activity; any loss of an executive officer or key personnel; changes in our business related to strategic acquisitions and other transactions; risks related to the accuracy of the estimates and assumptions we used to revalue our net deferred tax assets in accordance with U.S. Tax Reform; and changes of government policy or regulations. All forward-looking statements speak only as of the date on which they are made and we undertake no duty to update or revise any forward-looking statements, whether as a result of new information, future events or otherwise.
Overview
Our Business
We are an independent investmentwealth management firm that provides a broad range of investment solutions through separately managed accounts, mutual funds, and collective investment trust funds, as well as a variety of consultative services that complement our investment process. Founded in 1970, we offer U.S. and non-U.S equity, fixed income and alternative strategies, as well as a range of blended asset portfolios, such as life cycle funds and actively-managed exchange-traded fund ("ETF")-based portfolios.including life-cycle funds. We serve a diversified client base of high-net-worth individuals and institutions, including 401(k) plans, pension plans, Taft-Hartley plans, platforms, endowments and foundations. Our operations are based principally in the United States, with our headquarters located in Fairport, New York.
Market Developments
With regardVolatility sharply returned to notable developments tofinancial markets in 2018. Throughout the investment environment, two persistent headwinds active managers have faced sinceyear, several key risks worsened, culminating in one of the Global Financial Crisis have recently become tailwinds: equity correlations and valuation dispersion. Equity correlations collapsed atmost significant market selloffs of the startdecade. In the first quarter of 2017, suggesting investors are now pricing stocks based on corporate fundamentals and other factors that affect individual companies. We believe this provides fundamental-based active investment managers, like us, a wider opportunity set to exploit. Valuation dispersion has also shifted, moving notably higher, resulting in more opportunities for active investment managers to take advantage of security mispricing. To the extent that these dynamics continue to hold, we believe the market environment should remain more conducive to active investment managers relative to the generally challenging environment that has persisted for2019, much of the market selloff was reversed as stock prices strongly rallied across the globe. In U.S. equities specifically, both U.S. large- and small-cap stocks gained back most of last year’s losses.
Along with the market surge was a strong investor preference for growth stocks. Over the past decade.
We have experienced net client outflows since 2013 resulting in an overall decrease in our AUM, which is likely to continueseveral years, U.S. growth has considerably outperformed U.S. value. Although this trend briefly swung in the near term, thoughother direction last year, growth again retook the lead to start 2019. For selective, valuation-conscious managers such as ourselves, we believe atthis stylistic trend remains a slower rate. Our abilitychallenge.
International stocks bounced back during the first quarter as well. Over the trailing year, however, international equities are significantly lagging their U.S. peers, continuing a trend that has gone on for most of the post-global financial crisis period. The strong dollar remains a key headwind to increase AUMinternational equity performance.
In fixed income, the Federal Reserve stopped raising interest rates in the future will dependquarter. The pause in partFed rate hikes supported short-term interest rates to hold steady, while enabling longer-term interest rates to fall. Falling interest rates, along with tighter credit spreads, contributed to positive results across the fixed income landscape.
Going forward, we expect financial markets to remain highly dynamic. Global growth is decelerating, and the U.S. economy remains in a later stage of its economic cycle (with significant potential spillover effects on our abilityinternational markets). These factors, as well as other key risks, may lead to execute ourfurther market volatility. This investment strategies to achieve competitiveclimate illustrates the benefits of an actively managed investment returns, and on our ability to successfully distribute our products and services, including those that have been areas of strategic focusapproach for us.
As part of our recent business plan review and due in part to these AUM and corresponding revenue decreases, we have implemented initiatives focused on strengthening our core business and improving profitability through expense management, while prioritizing initiatives that we believe will support future AUM growth. Our sales and service teams have prioritized our most competitive product and service offerings for distribution while remaining focused on protecting our existing client relationships. With an initial focus on expense management, we have reviewed operating expenses across our firm and made adjustments where feasible, including workforce reductions. During the quarter ending June 30, 2018, we commenced a voluntary employee retirement offering ("the offering") for employees meeting certain age and length-of-service requirements, and whose business function is outside of our Research and Sales teams. As of June 30, 2018, the period for voluntary participation in the offering remained open. Subsequent to June 30, 2018, that offering period closed, and we also completed additional workforce reductions. Under these initiatives, we estimate approximately $2.7 million in severance charges will be incurred during the third and fourth quarters of 2018. Ongoing savings achieved from these expense management initiatives will be redirected toward increased investment in our information technology infrastructure.
In response to industry trends and increasing fee pressure from passive strategies offered by our competitors, management has evaluated fees across our product set and is restructuring fees across many of our mutual fund and collective trust products. Management fee reductions and corresponding distribution and shareholder servicing expense reductions for the various series of our funds began during the fourth quarter of 2017 and will continue throughout 2018. Given the overall pressure on fees that
all active managers are facing, we believe that bringing our fund fees to a more competitive level will enhance our ability to attract additional assets in the future.
Additionally, we are actively marketing our Custom Solution offering. Custom Solution is a competitively priced consultative advisory service in which we tailor an allocation among proprietary and non-proprietary investment products and vehicles to meet a client’s unique investment objectives and cash flow needs. Direct advisory services such as Custom Solution are an essential part of our strategy to pursue direct relationships with clients built on managing risk and meeting investment objectives over market cycles. investors.
Our ProductsSolutions
We derive substantially all of our revenues from investment management fees earned from providing advisory services to separately managed accounts, mutual funds and collective investment trusts—including those offered by MNA, the Manning & Napier Fund, Inc. (the "Fund"), Exeter Trust Company, and Rainier Investment Management.Rainier.
Our separate accounts are primarily distributed through our Direct Channel,direct sales channel, where our representativesclient consultants form relationships with high-net-worth individuals, middle market institutions or large institutions that are working with a consultant. To a lesser extent, we also obtain a portion of our separate account distribution via third parties, either through our Intermediary Channelintermediary sales channel where national brokerage firm representatives or independent financial advisors select our separate account strategies for their clients, or through our Platform/Sub-Advisory Channel,platform/sub-advisor channel, where unaffiliated registered investment advisors approve our strategies for their product platforms. Our separate account productsstrategies are a primary driver of our blended asset
portfolios for high-net-worth, middle market institutional clients and financial intermediaries. In contrast, larger institutions and unaffiliated registered investment advisor platforms are a driver of our separate account equity portfolios.
Our mutual funds and collective investment trusts are distributed through financial intermediaries, including brokers, financial advisors, retirement plan advisors and platform relationships. We also distribute our mutual fund and collective investment trusts through our direct sales representatives, in particularparticularly within the defined contribution and institutional marketplace. Our mutual fund and collective investment trust productsstrategies are an important driver of both our blended asset class and single asset class portfolios.
Our AUM was $22.8$21.1 billion as of June 30, 2018.March 31, 2019. The composition of our AUM by vehicle and portfolio is illustrated in the table below:
|
| | | | | | | | | | | | | | | | |
| | | June 30, 2018 |
| AUM - by investment vehicle and portfolio | | Blended Asset | | Equity | | Fixed Income | | Total |
| | | (in millions) |
| Separately managed accounts | | $ | 10,084.1 |
| | $ | 4,446.6 |
| | $ | 1,075.2 |
| | $ | 15,605.9 |
|
| Mutual funds and collective investment trusts | | 4,893.8 |
| | 2,224.8 |
| | 113.2 |
| | 7,231.8 |
|
| Total | | $ | 14,977.9 |
| | $ | 6,671.4 |
| | $ | 1,188.4 |
| | $ | 22,837.7 |
|
Separately Managed Accounts |
| | | | | | | | | | | | | | | | |
| | | March 31, 2019 |
| AUM - by investment vehicle and portfolio | | Blended Asset | | Equity | | Fixed Income | | Total |
| | | (in millions) |
| Separately managed accounts | | $ | 9,458.5 |
| | $ | 4,233.5 |
| | $ | 975.2 |
| | $ | 14,667.2 |
|
| Mutual funds and collective investment trusts | | 4,376.2 |
| | 1,993.8 |
| | 100.6 |
| | 6,470.6 |
|
| Total | | $ | 13,834.7 |
| | $ | 6,227.3 |
| | $ | 1,075.8 |
| | $ | 21,137.8 |
|
The composition of our separately managed accounts as of June 30, 2018,March 31, 2019, by channel and portfolio, is set forth in the table below:
| | | | | June 30, 2018 | | March 31, 2019 |
| | | Blended Asset | | Equity | | Fixed Income | | Total | | Blended Asset | | Equity | | Fixed Income | | Total |
| | | (dollars in millions) | | (dollars in millions) |
| Separate account AUM | | | | | | | | | | | | | | | | |
| Direct Channel | | $ | 7,669.6 |
| | $ | 2,988.2 |
| | $ | 957.2 |
| | $ | 11,615.0 |
| | $ | 7,221.3 |
| | $ | 2,662.4 |
| | $ | 857.5 |
| | $ | 10,741.2 |
|
| Intermediary Channel | | 2,408.6 |
| | 631.0 |
| | 118.0 |
| | 3,157.6 |
| | 2,225.5 |
| | 549.3 |
| | 117.7 |
| | 2,892.5 |
|
| Platform/Sub-advisor Channel | | 5.9 |
| | 827.4 |
| | — |
| | 833.3 |
| | 11.7 |
| | 1,021.8 |
| | — |
| | 1,033.5 |
|
| Total | | $ | 10,084.1 |
| | $ | 4,446.6 |
| | $ | 1,075.2 |
| | $ | 15,605.9 |
| | $ | 9,458.5 |
| | $ | 4,233.5 |
| | $ | 975.2 |
| | $ | 14,667.2 |
|
| Percentage of separate account AUM | | | | | | | | | | | | | | | | |
| Direct Channel | | 49 | % | | 19 | % | | 6 | % | | 74 | % | | 49 | % | | 18 | % | | 6 | % | | 73 | % |
| Intermediary Channel | | 15 | % | | 4 | % | | 1 | % | | 20 | % | | 15 | % | | 4 | % | | 1 | % | | 20 | % |
| Platform/Sub-advisor Channel | | 0 | % | | 6 | % | | — | % | | 6 | % | | 0 | % | | 7 | % | | — | % | | 7 | % |
| Total | | 64 | % | | 29 | % | | 7 | % | | 100 | % | | 64 | % | | 29 | % | | 7 | % | | 100 | % |
| Percentage of portfolio by channel | | | | | | | | | | | | | | | | |
| Direct Channel | | 76 | % | | 67 | % | | 89 | % | | 74 | % | | 76 | % | | 63 | % | | 88 | % | | 73 | % |
| Intermediary Channel | | 24 | % | | 14 | % | | 11 | % | | 20 | % | | 24 | % | | 13 | % | | 12 | % | | 20 | % |
| Platform/Sub-advisor Channel | | 0 | % | | 19 | % | | — | % | | 6 | % | | 0 | % | | 24 | % | | — | % | | 7 | % |
| Total | | 100 | % | | 100 | % | | 100 | % | | 100 | % | | 100 | % | | 100 | % | | 100 | % | | 100 | % |
| Percentage of channel by portfolio | | | | | | | | | | | | | | | | |
| Direct Channel | | 66 | % | | 26 | % | | 8 | % | | 100 | % | | 67 | % | | 25 | % | | 8 | % | | 100 | % |
| Intermediary Channel | | 76 | % | | 20 | % | | 4 | % | | 100 | % | | 77 | % | | 19 | % | | 4 | % | | 100 | % |
| Platform/Sub-advisor Channel | | 1 | % | | 99 | % | | — | % | | 100 | % | | 1 | % | | 99 | % | | — | % | | 100 | % |
Our separate accounts contributed 47%44% of our total gross client inflows for the sixthree months ended June 30, 2018March 31, 2019 and represented 68%69% of our total AUM as of June 30, 2018.March 31, 2019.
Our separate account business has historically been driven primarily by our Direct Channel, where sales representatives form a relationship with high-net-worthhigh net worth investors, middle market institutions, and large institutional clients working in conjunction with a consultant. The Direct Channel contributed 63%66% of the total gross client inflows for our separate account business for the sixthree months ended June 30, 2018March 31, 2019 and represented 74%73% of our total separate account AUM as of June 30, 2018.March 31, 2019. We anticipate the Direct Channel to continue to be the largest driver of new separate account business going forward, given the Direct Channel’s high-net-worthhigh net worth and middle market institutional client-type focus.
During the sixthree months ended June 30, 2018,March 31, 2019, blended asset portfolios represented 62%63% of the separate account gross client inflows from the Direct Channel, while equity and fixed income portfolios represented 21%31% and 18%6%, respectively. As of June 30, 2018,March 31, 2019, blended asset and equity portfolios represented 66%67% and 26%25%, respectively, of total Direct Channel separate account AUM, while our fixed income portfolios were 8%. We expect our focus on individuals and middle market institutions to continue to drive interest in our blended asset class portfolios, where we provide a comprehensive portfolio of stocks and bonds managed to a client’s specific investment objectives. Our relationships with larger institutions may also be a driver of growth in separately managed account equity strategies, though many of these larger institutions may seek exposure to non-U.S. equity strategies through commingled vehicles rather than separately managed accounts to limit related custody expenses.
To a lesser extent, we also obtain separate account business from third parties, including financial advisors or unaffiliated registered investment advisor programs or platforms. During the sixthree months ended June 30, 2018, 22%March 31, 2019, 9% of the total gross client inflows for separate accounts came from financial advisor representatives (Intermediary Channel), and an additional 15%25% came from registered investment advisor platforms (Platform/Sub-advisor Channel). The Intermediary and Platform/Sub-advisor Channels collectively represented 26%27% of our total separate account AUM as of June 30, 2018.March 31, 2019.
New separate account business through the Intermediary Channel flowed into both our blended asset and equity portfolios, driven by advisors’ needs to identify either a one-stop solution (blended asset portfolio) or to fill a mandate within a multi-strategy portfolio. During the sixthree months ended June 30, 2018,March 31, 2019, blended asset and equity portfolios represented 82%69% and
18% 28%, respectively, of the separate account gross client inflows from the Intermediary Channel. As of June 30, 2018, 76%March 31, 2019, 77% of our separate account AUM derived from financial advisors was allocated to blended asset portfolios, with 20%19% allocated to equity and 4% allocated to fixed income. We expect that equity and fixed income portfolios may see additional interest from financial advisors over time as more advisors structure a multi-strategy portfolio for their clients.
During the sixthree months ended June 30, 2018, 100%March 31, 2019, substantially all of our separate account gross client inflows from the Platform/Sub-advisory Channel were into equity portfolios. Gross client inflows through the Platform/Sub-advisor Channel are primarily directed to our equity strategies, where we are filling a specific mandate within the investment program or platform product.
Our annualized separate account retention rate across all channels was 83%92% during the sixthree months ended June 30, 2018, consistent with 84%March 31, 2019, an increase from our historical retention rate, which was 89% for the rolling 12twelve months ended June 30, 2018.
Mutual Funds and Collective Investment TrustsMarch 31, 2019.
The composition of our mutual fund and collective investment trust AUM as of June 30, 2018,March 31, 2019, by portfolio, is set forth in the table below:
|
| | | | | | | | | | | | | | | | |
| | | June 30, 2018 |
| | | Blended Asset | | Equity | | Fixed Income | | Total |
| | | (in millions) |
| Mutual fund and collective investment trust AUM | | $ | 4,893.8 |
| | $ | 2,224.8 |
| | $ | 113.2 |
| | $ | 7,231.8 |
|
|
| | | | | | | | | | | | | | | | |
| | | March 31, 2019 |
| | | Blended Asset | | Equity | | Fixed Income | | Total |
| | | (in millions) |
| Mutual fund and collective investment trust AUM | | $ | 4,376.2 |
| | $ | 1,993.8 |
| | $ | 100.6 |
| | $ | 6,470.6 |
|
Our mutual funds and collective investment trusts contributed 53%56% of our total gross client inflows for the sixthree months ended June 30, 2018March 31, 2019 and represented 32%31% of our total AUM as of June 30, 2018March 31, 2019. As of June 30, 2018March 31, 2019, our mutual fund and collective investment trust AUM consisted of 68%67% from blended asset portfolios and 31% from equity portfolios and 1% from fixed income portfolios compared to 62%65% and 37%33% for blended asset and equity portfolios as of June 30, 2017.March 31, 2018. During the sixthree months ended June 30, 2018March 31, 2019, 63%39%, 33%,57% and 3%4% of the gross client inflows were attributable to blended asset,assets, equity and fixed income portfolios, respectively.
Our mutual fund and collective investment trust business is driven by both financial intermediaries and direct sales representatives. Intermediary distribution of our mutual fund and collective investment trust vehicles is achieved via financial advisors, brokers and retirement plan advisors. Through our Intermediary Channel, we are focused on distributing both our blended asset life cycle fund vehicles and our single asset class fund vehicles to advisors who work with retail and retirement plan clients. Our blended asset portfolios are used by advisors seeking a multi-asset class solution for their clients while ourretail clients. In addition, we are focused on equity and fixed income portfolios are used bywithin the Intermediary Channel for intermediaries wishingwho wish to use our mutual funds as a component of a larger portfolio or retirement plan menu design.portfolio.
We also have relationships with consultants and manager research teams at platforms in order to distribute our funds within advisory programs, or through placement on platforms' approved lists of funds. To facilitate our relationships with intermediaries, we currently have approximately 290265 dealer relationships. These relationships are important to our retail business as well as our 401(k) life cycle and institutional business.
Through the Direct Channel,Our direct sales representatives also distribute our equity portfolios to large institutional clients with which we have direct relationships. We also formhave relationships with middle market and large market defined contribution plan sponsors seeking to use our life cycle mutual funds and collective investment trusts as default options on their investment menu. Our Direct Sales Representatives also distribute our equity portfolios to large institutional clients with which we have direct relationships and often, the client's consultant. We expect this channel to focus on distributing blended asset and equity portfolio funds in the future.
Results of Operations
Below is a discussion of our consolidated results of operations for the three and six months ended June 30, 2018March 31, 2019 and 20172018.
Components of Results of Operations
Overview
An important factor influencing inflows and outflows of our AUM is the investment performance of our various investment approaches. Our variety of stock selection strategies, absolute pricing discipline and active asset allocation management approach generally resultsresult in specific absolute and relative return characteristics in different market environments. For example, during a fundamental-driven bull market when prices are rising alongside improving fundamentals, we are likely to experience positive absolute returns and competitive relative returns. However, in a more momentum-driven bull market, when prices become disconnected from underlying fundamentals, or narrow market environment where a small handful of stocks outperform the average stock, we are likely to experience positive absolute returns but lagging relative returns. Similarly,
during a valuation-driven bear market, when markets experience a period of price correction following a momentum-driven bull market, we are likely to experience negative absolute returns but strong relative returns. However, in a momentum-driven bear market, which is typically characterized by broad price declines in a highly correlated market, we are likely to experience negative absolute returns and potentially lagging relative returns. Essentially, our approach is likely to do well when markets are driven by fundamentals, but lag when markets are driven primarily by momentum.
Other components impacting our operating results include:
asset-based fee rates and changes in those rates;
the composition of our AUM among various portfolios, vehicles and client types;
changes in our variable costs, including incentive compensation and distribution, servicing and custody expenses, which are affected by our investment performance, level of our AUM and revenue; and
fixed costs, including changes to base compensation, vendor-related costs and investment spending on new products.
Assets Under Management and Investment Performance
The following table reflects the indicated components of our AUM for our investment vehicles for the three and six months ended June 30, 2018March 31, 2019 and 20172018:
| | | | Separately managed accounts | | Mutual funds and collective investment trusts | | Total | | Separately managed accounts | | Mutual funds and collective investment trusts | | Total | Separately managed accounts | | Mutual funds and collective investment trusts | | Total | | Separately managed accounts | | Mutual funds and collective investment trusts | | Total |
| | | | (in millions) | | | | | | | | | | | (in millions) | | | | | | | | |
| As of March 31, 2018 | $ | 15,960.1 |
| | $ | 7,473.4 |
| | $ | 23,433.5 |
| | 68 | % | | 32 | % | | 100 | % | |
| As of December 31, 2018 | | $ | 13,792.1 |
| | $ | 6,371.5 |
| | $ | 20,163.6 |
| | 68 | % | | 32 | % | | 100 | % |
Gross client inflows (1) | 331.1 |
| | 349.7 |
| | 680.8 |
| | | | | | | 316.1 |
| | 404.6 |
| | 720.7 |
| | | | | | |
Gross client outflows (1) | (899.7 | ) | | (654.5 | ) | | (1,554.2 | ) | | | | | | | (664.9 | ) | | (908.0 | ) | | (1,572.9 | ) | | | | | | |
Market appreciation/(depreciation) & other (2) | 214.4 |
| | 63.2 |
| | 277.6 |
| | | | | | | 1,223.9 |
| | 602.5 |
| | 1,826.4 |
| | | | | | |
| As of June 30, 2018 | $ | 15,605.9 |
| | $ | 7,231.8 |
| | $ | 22,837.7 |
| | 68 | % | | 32 | % | | 100 | % | |
| As of March 31, 2019 | | $ | 14,667.2 |
| | $ | 6,470.6 |
| | $ | 21,137.8 |
| | 69 | % | | 31 | % | | 100 | % |
| Average AUM for period | $ | 15,689.8 |
| | $ | 7,394.2 |
| | $ | 23,084.0 |
| | | | | | | $ | 14,324.0 |
| | $ | 6,343.7 |
| | $ | 20,667.7 |
| | | | | | |
| | | | | | | | | | | | | |
| As of March 31, 2017 | $ | 18,762.8 |
| | $ | 12,866.6 |
| | $ | 31,629.4 |
| | 59 | % | | 41 | % | | 100 | % | |
Gross client inflows (1) | 621.2 |
| | 450.0 |
| | 1,071.2 |
| | | | | | | |
Gross client outflows (1) | (2,316.8 | ) | | (4,375.2 | ) | | (6,692.0 | ) | | | | | | | |
Market appreciation/(depreciation) & other (2) | 647.7 |
| | 419.2 |
| | 1,066.9 |
| | | | | | | |
| As of June 30, 2017 | $ | 17,714.9 |
| | $ | 9,360.6 |
| | $ | 27,075.5 |
| | 65 | % | | 35 | % | | 100 | % | |
| Average AUM for period | $ | 18,424.4 |
| | $ | 10,218.0 |
| | $ | 28,642.4 |
| | | | | | | |
| | | | | | | | | | | | | |
| | Separately managed accounts | | Mutual funds and collective investment trusts | | Total | | Separately managed accounts | | Mutual funds and collective investment trusts | | Total | |
| | |
| | (in millions) | | |
| | | | | | | | | | | | | | | | | |
| As of December 31, 2017 | $ | 16,856.6 |
| | $ | 8,256.6 |
| | $ | 25,113.2 |
| | 67 | % | | 33 | % | | 100 | % | $ | 16,856.6 |
| | $ | 8,256.6 |
| | $ | 25,113.2 |
| | 67 | % | | 33 | % | | 100 | % |
Gross client inflows (1) | 749.7 |
| | 831.0 |
| | 1,580.7 |
| | | | | | | 418.6 |
| | 481.3 |
| | 899.9 |
| | | | | | |
Gross client outflows (1) | (2,225.5 | ) | | (1,685.5 | ) | | (3,911.0 | ) | | | | | | | (1,325.8 | ) | | (1,031.0 | ) | | (2,356.8 | ) | | | | | | |
| Acquired/(disposed) assets | — |
| | (251.6 | ) | | (251.6 | ) | | | | | | | — |
| | (251.6 | ) | | (251.6 | ) | | | | | | |
Market appreciation/(depreciation) & other (2) | 225.1 |
| | 81.3 |
| | 306.4 |
| | | | | | | 10.7 |
| | 18.1 |
| | 28.8 |
| | | | | | |
| As of June 30, 2018 | $ | 15,605.9 |
| | $ | 7,231.8 |
| | $ | 22,837.7 |
| | 68 | % | | 32 | % | | 100 | % | |
| As of March 31, 2018 | | $ | 15,960.1 |
| | $ | 7,473.4 |
| | $ | 23,433.5 |
| | 68 | % | | 32 | % | | 100 | % |
| Average AUM for period | $ | 16,087.8 |
| | $ | 7,640.0 |
| | $ | 23,727.8 |
| | | | | | | $ | 16,453.9 |
| | $ | 7,873.3 |
| | $ | 24,327.2 |
| | | | | | |
| | | | | | | | | | | | | |
| As of December 31, 2016 | $ | 18,801.9 |
| | $ | 12,881.1 |
| | $ | 31,683.0 |
| | 59 | % | | 41 | % | | 100 | % | |
Gross client inflows (1) | 977.1 |
| | 1,161.0 |
| | 2,138.1 |
| | | | | | | |
Gross client outflows (1) | (3,839.7 | ) | | (5,879.6 | ) | | (9,719.3 | ) | | | | | | | |
Market appreciation/(depreciation) & other (2) | 1,775.6 |
| | 1,198.1 |
| | 2,973.7 |
| | | | | | | |
| As of June 30, 2017 | $ | 17,714.9 |
| | $ | 9,360.6 |
| | $ | 27,075.5 |
| | 65 | % | | 35 | % | | 100 | % | |
| Average AUM for period | $ | 18,694.9 |
| | $ | 11,541.0 |
| | $ | 30,235.9 |
| | | | | | | |
________________________
| |
| (1) | Transfers of client assets between portfolios are included in gross client inflows and gross client outflows. |
| |
| (2) | Market appreciation/(depreciation) and other includes investment gains/(losses) on assets under management, the impact of changes in foreign exchange rates and net flows from non-sales related activities including net reinvested dividends. |
The following table reflects the indicated components of our AUM for our portfolios for the three and six months ended June 30, 2018March 31, 2019 and 2017:2018:
| | | | Blended Asset | | Equity | | Fixed Income | | Total | | Blended Asset | | Equity | | Fixed Income | | Total | Blended Asset | | Equity | | Fixed Income | | Total | | Blended Asset | | Equity | | Fixed Income | | Total |
| | | | (in millions) | | | | | | | | | | | | | (in millions) | | | | | | | | | | |
| As of March 31, 2018 | $ | 14,998.4 |
| | $ | 7,214.2 |
| | $ | 1,220.9 |
| | $ | 23,433.5 |
| | 64 | % | | 31 | % | | 5 | % | | 100 | % | |
| As of December 31, 2018 | | $ | 13,532.2 |
| | $ | 5,501.9 |
| | $ | 1,129.5 |
| | $ | 20,163.6 |
| | 67 | % | | 27 | % | | 6 | % | | 100 | % |
Gross client inflows (1) | 432.6 |
| | 231.2 |
| | 17.0 |
| | 680.8 |
| | | | | | | | | 302.1 |
| | 379.3 |
| | 39.3 |
| | 720.7 |
| | | | | | | | |
Gross client outflows (1) | (718.3 | ) | | (776.7 | ) | | (59.2 | ) | | (1,554.2 | ) | | | | | | | | | (1,065.9 | ) | | (382.7 | ) | | (124.3 | ) | | (1,572.9 | ) | | | | | | | | |
Market appreciation/(depreciation) & other (2) | 265.2 |
| | 2.7 |
| | 9.7 |
| | 277.6 |
| | | | | | | | | 1,066.3 |
| | 728.7 |
| | 31.4 |
| | 1,826.4 |
| | | | | | | | |
| As of June 30, 2018 | $ | 14,977.9 |
| | $ | 6,671.4 |
| | $ | 1,188.4 |
| | $ | 22,837.7 |
| | 66 | % | | 29 | % | | 5 | % | | 100 | % | |
| As of March 31, 2019 | | $ | 13,834.7 |
| | $ | 6,227.2 |
| | $ | 1,075.9 |
| | $ | 21,137.8 |
| | 66 | % | | 29 | % | | 5 | % | | 100 | % |
| Average AUM for period | $ | 14,973.6 |
| | $ | 6,909.2 |
| | $ | 1,201.2 |
| | $ | 23,084.0 |
| | | | | | | | | $ | 13,634.7 |
| | $ | 5,927.8 |
| | $ | 1,105.2 |
| | $ | 20,667.7 |
| | | | | | | | |
| | | | | | | | | | | | | | | | | |
| As of March 31, 2017 | $ | 19,851.8 |
| | $ | 10,496.4 |
| | $ | 1,281.2 |
| | $ | 31,629.4 |
| | 63 | % | | 33 | % | | 4 | % | | 100 | % | |
Gross client inflows (1) | 560.7 |
| | 318.0 |
| | 192.5 |
| | 1,071.2 |
| | | | | | | | | |
Gross client outflows (1) | (4,251.0 | ) | | (2,314.4 | ) | | (126.6 | ) | | (6,692.0 | ) | | | | | | | | | |
Market appreciation/(depreciation) & other (2) | 452.3 |
| | 594.3 |
| | 20.3 |
| | 1,066.9 |
| | | | | | | | | |
| As of June 30, 2017 | $ | 16,613.8 |
| | $ | 9,094.3 |
| | $ | 1,367.4 |
| | $ | 27,075.5 |
| | 61 | % | | 34 | % | | 5 | % | | 100 | % | |
| Average AUM for period | $ | 17,249.6 |
| | $ | 10,061.2 |
| | $ | 1,331.6 |
| | $ | 28,642.4 |
| | | | | | | | | |
| | | | | | | | | | | | | | | | | |
| | Blended Asset | | Equity | | Fixed Income | | Total | | Blended Asset | | Equity | | Fixed Income | | Total | |
| | | | (in millions) | | | | | | | | | | | | | | | | | | | | | | | | | |
| As of December 31, 2017 | $ | 15,666.6 |
| | $ | 8,120.6 |
| | $ | 1,326.0 |
| | $ | 25,113.2 |
| | 63 | % | | 32 | % | | 5 | % | | 100 | % | $ | 15,666.6 |
| | $ | 8,120.6 |
| | $ | 1,326.0 |
| | $ | 25,113.2 |
| | 63 | % | | 32 | % | | 5 | % | | 100 | % |
Gross client inflows (1) | 891.8 |
| | 586.7 |
| | 102.2 |
| | 1,580.7 |
| | | | | | | | | 459.2 |
| | 355.5 |
| | 85.2 |
| | 899.9 |
| | | | | | | | |
Gross client outflows (1) | (1,821.0 | ) | | (1,843.2 | ) | | (246.8 | ) | | (3,911.0 | ) | | | | | | | | | (1,102.7 | ) | | (1,066.5 | ) | | (187.6 | ) | | (2,356.8 | ) | | | | | | | | |
| Acquired/(disposed) assets | — |
| | (251.6 | ) | | — |
| | (251.6 | ) | | | | | | | | | — |
| | (251.6 | ) | | — |
| | (251.6 | ) | | | | | | | | |
Market appreciation/(depreciation) & other (2) | 240.5 |
| | 58.9 |
| | 7.0 |
| | 306.4 |
| | | | | | | | | (24.7 | ) | | 56.2 |
| | (2.7 | ) | | 28.8 |
| | | | | | | | |
| As of June 30, 2018 | $ | 14,977.9 |
| | $ | 6,671.4 |
| | $ | 1,188.4 |
| | $ | 22,837.7 |
| | 66 | % | | 29 | % | | 5 | % | | 100 | % | |
| As of March 31, 2018 | | $ | 14,998.4 |
| | $ | 7,214.2 |
| | $ | 1,220.9 |
| | $ | 23,433.5 |
| | 64 | % | | 31 | % | | 5 | % | | 100 | % |
| Average AUM for period | $ | 15,216.4 |
| | $ | 7,262.9 |
| | $ | 1,248.5 |
| | $ | 23,727.8 |
| | | | | | | | | $ | 15,431.9 |
| | $ | 7,607.3 |
| | $ | 1,288.0 |
| | $ | 24,327.2 |
| | | | | | | | |
| | | | | | | | | | | | | | | | | |
| As of December 31, 2016 | $ | 19,909.4 |
| | $ | 10,463.9 |
| | $ | 1,309.7 |
| | $ | 31,683.0 |
| | 63 | % | | 33 | % | | 4 | % | | 100 | % | |
Gross client inflows (1) | 1,265.9 |
| | 636.1 |
| | 236.1 |
| | 2,138.1 |
| | | | | | | | | |
Gross client outflows (1) | (6,127.6 | ) | | (3,367.6 | ) | | (224.1 | ) | | (9,719.3 | ) | | | | | | | | | |
Market appreciation/(depreciation) & other (2) | 1,566.1 |
| | 1,361.9 |
| | 45.7 |
| | 2,973.7 |
| | | | | | | | | |
| As of June 30, 2017 | $ | 16,613.8 |
| | $ | 9,094.3 |
| | $ | 1,367.4 |
| | $ | 27,075.5 |
| | 61 | % | | 34 | % | | 5 | % | | 100 | % | |
| Average AUM for period | $ | 18,600.4 |
| | $ | 10,323.8 |
| | $ | 1,311.7 |
| | $ | 30,235.9 |
| | | | | | | | | |
________________________
| |
| (1) | Transfers of client assets between portfolios are included in gross client inflows and gross client outflows. |
| |
| (2) | Market appreciation/(depreciation) and other includes investment gains/(losses) on assets under management, the impact of changes in foreign exchange rates and net flows from non-sales related activities including net reinvested dividends. |
The following table summarizes the annualized returns for several of our key investment strategies and the relative performance of the industry benchmark over the periods indicated.benchmarks. Since inception and over long-term periods, we believe these strategies have earned attractive returns on both an absolute and relative basis. We recognize, however that some key strategies have mixed track records over the past several years. These strategies are used across separate account, mutual fund and collective investment trust vehicles, and represent approximately 81%77% of our AUM as of June 30, 2018.March 31, 2019.
| | | Key Strategies | AUM as of
June 30, 2018 (in millions) | Inception Date | | Annualized Returns as of June 30, 2018 (1) | AUM as of
March 31, 2019 (in millions) | Inception Date | | Annualized Returns as of March 31, 2019 (3) |
| | One Year | | Three Year | | Five Year | | Ten Year | | Market Cycle (2) | | Inception | | One Year | | Three Year | | Five Year | | Ten Year | | Market Cycle (1) | | Inception |
Long-Term Growth (30%-80% Equity Exposure)
| $ | 6,830.5 |
| 1/1/1973 | | 7.2% | | 5.2% | | 6.6% | | 6.3% | | 6.4% | | 9.5% | $ | 5,935.5 |
| 1/1/1973 | | 5.0% | | 7.2% | | 4.4% | | 9.5% | | 6.0% | | 9.3% |
| Blended Benchmark: 55% S&P 500 Total Return / 45% Bloomberg Barclays Government/Credit Bond | | | 7.5% | | 7.4% | | 8.4% | | 7.6% | | 5.5% | | 9.2% | |
| Blended Index (4) | | | | 5.2% | | 7.6% | | 5.9% | | 9.6% | | 5.0% | | 8.7% |
| Core Non-U.S. Equity | $ | 2,645.3 |
| 10/1/1996 | | 4.8% | | 3.8% | | 3.9% | | 2.4% | | 5.7% | | 7.4% | $ | 2,072.6 |
| 10/1/1996 | | (5.5)% | | 4.8% | | 0.2% | | 7.6% | | 4.6% | | 6.5% |
| Benchmark: ACWIxUS Index | | | 7.3% | | 5.1% | | 6.0% | | 2.5% | | 3.7% | | 5.2% | | | (4.2)% | | 8.1% | | 2.6% | | 8.9% | | 3.0% | | 4.6% |
| Growth with Reduced Volatility (20%-60% Equity Exposure) | $ | 3,041.1 |
| 1/1/1973 | | 5.2% | | 3.9% | | 5.1% | | 5.4% | | 5.8% | | 8.7% | $ | 2,639.0 |
| 1/1/1973 | | 4.5% | | 5.6% | | 3.5% | | 7.7% | | 5.5% | | 8.5% |
| Blended Benchmark: 40% S&P 500 Total Return / 60% Bloomberg Barclays Government/Credit Bond | | | 5.2% | | 5.9% | | 6.7% | | 6.6% | | 5.4% | | 8.7% | |
| Blended Index (5) | | | | 5.2% | | 6.1% | | 5.1% | | 8.1% | | 5.0% | | 8.4% |
| Equity-Oriented (70%-100% Equity Exposure) | $ | 1,466.3 |
| 1/1/1993 | | 14.1% | | 8.4% | | 9.4% | | 7.8% | | 7.2% | | 10.0% | $ | 1,402.6 |
| 1/1/1993 | | 6.0% | | 10.8% | | 6.4% | | 12.1% | | 6.5% | | 9.5% |
| Blended Benchmark: 65% Russell 3000® / 20% ACWIxUS / 15% Bloomberg Barclays U.S. Aggregate Bond | | | 11.0% | | 8.9% | | 10.2% | | 7.9% | | 5.4% | | 8.6% | |
| Blended Benchmark: 65% Russell 3000 / 20% ACWIxUS/ 15% Bloomberg Barclays U.S. Aggregate Bond | | | | 5.6% | | 10.8% | | 7.7% | | 12.8% | | 4.8% | | 8.1% |
| Equity-Focused Blend (50%-90% Equity Exposure) | $ | 1,056.6 |
| 4/1/2000 | | 8.8% | | 6.1% | | 7.6% | | 6.9% | | 7.0% | | 7.0% | $ | 992.7 |
| 4/1/2000 | | 5.6% | | 8.4% | | 5.0% | | 10.5% | | 6.9% | | 6.9% |
| Blended Benchmark: 53% Russell 3000/ 17% ACWIxUS/ 30% Bloomberg Barclays U.S. Aggregate Bond | | | 8.9% | | 7.6% | | 8.8% | | 7.3% | | 5.4% | | 5.4% | |
| Blended Benchmark: 53% Russell 3000 / 20% ACWIxUS/ 30% Bloomberg Barclays U.S. Aggregate Bond | | | | 5.5% | | 9.2% | | 6.9% | | 11.3% | | 5.4% | | 5.4% |
| Core Equity-Unrestricted (90%-100% Equity Exposure) | $ | 936.9 |
| 1/1/1995 | | 16.9% | | 10.0% | | 11.2% | | 9.2% | | 8.0% | | 11.3% | $ | 620.4 |
| 1/1/1995 | | 7.8% | | 12.7% | | 7.6% | | 13.7% | | 7.2% | | 10.6% |
| Blended Benchmark: 80% Russell 3000® / 20% ACWIxUS | | | 13.3% | | 10.3% | | 11.8% | | 8.7% | | 5.4% | | 9.2% | |
| Blended Benchmark: 80% Russell 3000 / 20% ACWIxUS | | | | 6.1% | | 12.4% | | 8.8% | | 14.6% | | 4.7% | | 8.6% |
| Core U.S. Equity | | $ | 439.9 |
| 7/1/2000 | | 10.6% | | 14.6% | | 9.2% | | 14.4% | | N/A (2) | | 7.2% |
| Benchmark: Russell 3000 | | | | 8.8% | | 13.5% | | 10.4% | | 16.0% | | N/A (2) | | 5.3% |
| Conservative Growth (5%-35% Equity Exposure) | | $ | 484.9 |
| 4/1/1992 | | 3.9% | | 3.6% | | 2.5% | | 5.2% | | 5.0% | | 5.8% |
| Blended Benchmark: 15% Russell 3000 / 5% ACWIxUS / 80% Bloomberg Barclays U.S. Intermediate Aggregate Bond | | | | 4.7% | | 3.8% | | 3.6% | | 5.5% | | 4.9% | | 6.1% |
| Aggregate Fixed Income | | $ | 366.2 |
| 1/1/1984 | | 4.3% | | 1.9% | | 2.3% | | 3.6% | | 4.5% | | 7.0% |
| Benchmark: Bloomberg Barclays U.S. Aggregate Bond | | | | 4.5% | | 2.0% | | 2.7% | | 3.8% | | 4.8% | | 7.0% |
| Rainier International Small Cap | $ | 803.6 |
| 3/28/2012 | | 21.2% | | 11.1% | | 13.2% | | N/A (3) | | N/A (3) | | 15.0% | $ | 805.9 |
| 3/28/2012 | | (11.4)% | | 7.2% | | 6.0% | | N/A (2) | | N/A (2) | | 10.1% |
| Benchmark: MSCI ACWIxUS Small Cap Index | | | 10.6% | | 7.9% | | 9.0% | | N/A (3) | | N/A (3) | | 8.1% | | | (9.5)% | | 7.0% | | 3.3% | | N/A (2) | | N/A (2) | | 4.8% |
| Conservative Growth (5%-35% Equity Exposure) | $ | 505.0 |
| 4/1/1992 | | 2.7% | | 2.5% | | 3.2% | | 4.2% | | 5.0% | | 5.9% | |
| Blended Benchmark:15% Russell 3000/ 5% ACWIxUS/ 80% Bloomberg Barclays U.S. Intermediate Aggregate Bond | | | 2.3% | | 3.1% | | 3.8% | | 4.5% | | 4.9% | | 6.1% | |
| Core U.S. Equity | $ | 465.3 |
| 7/1/2000 | | 18.8% | | 11.7% | | 12.7% | | 10.0% | | N/A (3) | | 8.0% | |
| Benchmark: Russell 3000® Index | | | 14.8% | | 11.6% | | 13.3% | | 10.2% | | N/A (3) | | 6.0% | |
| Disciplined Value Unrestricted | $ | 431.7 |
| 11/1/2003 | | 11.4% | | 10.9% | | 11.0% | | 9.5% | | N/A (3) | | 10.7% | |
| Disciplined Value | | $ | 468.5 |
| 11/1/2003 | | 7.6% | | 12.7% | | 9.6% | | 13.9% | | N/A (2) | | 10.7% |
| Benchmark: Russell 1000 Value | | | 6.8% | | 8.3% | | 10.3% | | 8.5% | | N/A (3) | | 8.3% | | | 5.7% | | 10.5% | | 7.7% | | 14.5% | | N/A (2) | | 8.1% |
| Aggregate Fixed Income | $ | 384.6 |
| 1/1/1984 | | (0.6)% | | 1.4% | | 1.9% | | 3.8% | | 4.6% | | 7.1% | |
| Benchmark: Bloomberg Barclays U.S. Aggregate Bond | | | (0.4)% | | 1.7% | | 2.3% | | 3.7% | | 4.8% | | 7.0% | |
__________________________
| |
| (1) | Key investment strategy returns are presented net of fees. Benchmark returns do not reflect any fees or expenses. |
| |
(2) | MarketThe market cycle performance isnumbers are calculated from April 1, 2000 to June 30, 2018.March 31, 2019. We believe that a full market cycle time period should contain a wide range of market conditions and usually consists of a bear market, recovery and bull market stage. Our definition of the current market cycle includes the bear market that began with an abrupt decline in the technology sector (4/1/2000 - 9/30/2002), the subsequent failed recovery (10/1/2002 - 10/31/2007), the financial crisis bear market (11/1/2007 - 2/28/2009), and the current bull market (3/1/2009 - current). The period utilized in our current market cycle may differ from periods used by other investment managers.
|
| |
(3)(2) | Performance not available given the product's inception date. |
| |
| (3) | Key investment strategy returns are presented net of fees. Benchmark returns do not reflect any fees or expenses. |
| |
| (4) | Benchmark shown uses the 55/45 Blended Index from 01/01/1973-12/31/1987 and the 40/15/45 Blended Index from 01/01/1988-12/31/2018. The 55/45 Blended Index is represented by 55% S&P 500 Total Return Index ("S&P 500") and 45% Bloomberg Barclays U.S. Government/Credit Bond Index ("BGCB"). The 40/15/45 Blended Index is 40% Russell 3000 Index ("Russel 3000"), 15% MSCI ACWI ex USA Index ("ACWxUS"), and 45% Bloomberg Barclays U.S. Aggregate Bond Index ("BAB"). |
| |
| (5) | Benchmark shown uses the 40/60 Blended Index from 01/01/1973-12/31/1987 and the 30/10/60 Blended Index from 01/01/1988-12/31/2018. The 40/60 Blended Index is represented by 40% S&P 500 and 60% BGCB. The 30/10/60 Blended Index is represented by 30% Russell 3000, 10% ACWxUS, and 60% BAB. |
Revenue
Our revenues primarily consist of investment management fees earned from managing our clients’ AUM. We earn our investment management fees as a percentage of our clients’ AUM either as of a specified date or on a daily basis. Our investment management fees can fluctuate based on the average fee rate for our investment management products, which are affected by the composition of our AUM among various portfolios and investment vehicles.
The Company servesWe serve as the investment adviser for the Fund.Manning & Napier Fund, Inc., Exeter Trust Company Collective Investment Trusts and Rainier Multiple Investment Trust. The mutual funds are open-end mutual funds that primarily offer no-load share classes designed to meet the needs of a range of institutional and other investors. Exeter Trust Company, an affiliated New Hampshire-chartered trust company and Rainier Multiple Investment Trust sponsor collective investment trusts for qualified retirement plans, including 401(k) plans. These mutual funds and collective investment trusts comprised $7.26.5 billion, or 32%31%, of our AUM as of June 30, 2018March 31, 2019. MNA and Rainier also serve as the investment advisor to all of our separately managed accounts, managing $15.614.7 billion, or 68%69%, of our AUM as of June 30, 2018March 31, 2019, including assets managed as a sub-advisor to pooled investment vehicles. For the period ended June 30, 2018March 31, 2019 approximately 98%99% of our revenue was earned from clients located in the United States.
The Company earnsWe earn distribution and servicing fees for providing services to itsour affiliated mutual funds. Revenue is computed and earned daily based on a percentage of AUM.
The Company earnsWe earn custodial service fees for administrative and safeguarding services performed by Exeter Trust Company, our New Hampshire-chartered trust company.Company. Fees are calculated as a percentage of the client's market value with additional fees for certain transactions.
In response to industry trends and increasing fee pressure from passive strategies offered by our competitors as well as the anticipated impact of regulatory changes, management isAs discussed above in the midstOverview-Business Review section, during the first quarter of an2019 we completed the effort to restructure fees acrossfor many of our mutual fund product set. The financial impacts, including reduced management fees and distribution and servicing charges, will occur throughout 2018 and early 2019.collective trust vehicles. The impact on our overall revenue margins will vary depending on the business mix at the time of the fee change. Given the overall pressure on fees that all active managers are facing, we believe that bringing our fund fees to a more competitive level will enhance our ability to attract additional assets in the future.
Operating Expenses
Our largest operating expense isexpenses are employee compensation and distribution, servicing and custody expenses, discussed further below. Abelow, with a significant portion of this expense variesthese expenses varying in a direct relationship to our absolute and relative investment management performance, as well as AUM and revenues. We review our operating expenses in relation to the investment market environment and changes in our revenues. However, we are generally willing to make expenditures as necessary even when faced with declining rates of growth in revenues in order to support our investment products, our client service levels, strategic initiatives and our long-term value.
Compensation and related costs. Employee compensation and related costs represent our largest expense, including employee salaries and benefits, incentive compensation to investment and sales professionals, and equity-based compensation issued under our long-term incentive plan as well as equity compensation plan.compensation. These costs are affected by changes in the employee headcount, the mix of existing job descriptions, competitive factors, the addition of new skill sets and variations in the level of our AUM and revenues, changes in our stock price reflected in our share-based compensation and/or the number of awards issued.revenues. In addition, these costs are impacted by the amount of compensation granted under our equity plan and the amount of deferred cash awards granted under our long-term incentive plan. Incentive compensation for our research team considers the cumulative impact of both absolute and relative investment performance over historical time periods, with more weight placed on the recent periods. As such, incentive compensation paid to our research team will vary, in part, based on absolute and relative investment performance.
Distribution, servicing and custody expenses. Distribution, servicing and custody expense represent amounts paid to various intermediaries for distribution, shareholder servicing, administrative servicing and custodial services. These expenses generally increase or decrease in line with changes in our mutual fund and collective investment trust AUM or services performed by these intermediaries. We are working to restructureDuring the first quarter of 2019, we completed the effort of restructuring fees across our mutual funds that began in 2017. Given the overall pressure on fees that all active managers are facing, we believe that bringing our fund product set throughout 2018fees to a more competitive level will enhance our ability to attract additional assets in the future. The financial impacts will include a reduction in the management fees on our existing business, as well as an offsetting reduction in related distribution, servicing and early 2019 resulting in reduced investment management revenue and distribution and servicingcustody expenses. The impact on margins will depend on the business mix at the time of the fee restructuring.
Other operating costs. Other operating costs include accounting, legal and other professional service fees, occupancy and facility costs, travel and entertainment expenses, insurance, market data service expenses and all other miscellaneous costs associated with managing the day-to-day operations of our business.
Non-Operating Income (Loss)
Non-operating income (loss) includes interest expense, interest and dividend income, changes in the liability under the tax receivable agreement ("TRA") entered into between Manning & Napier and the other holders of Class A units of Manning & Napier Group, gains (losses) related to investment securities sales and changes in values of those investment securities designated as trading and equity method investments.trading.
We expect the interest and investment components of non-operating income (loss) to fluctuate based on market conditions, the performance of our investments and the overall amount of our investments held by the Company to provide initial cash seeding for product development purposes and short-term investment for cash management opportunities.
Provision for Income Taxes
The Company is comprised of entities that have elected to be treated as either a limited liability company ("LLC") or a C corporation ("C-Corporation")"C-Corporation". As such, the entities functioning as LLCs are not liable for or able to benefit from U.S. federal or most state and local income taxes on their earnings, and their earnings (losses), which will be included in the personal income tax returns of each entity's unit holders. The entities functioning as C-Corporations are liable for or able to benefit from U.S. federal and state and local income taxes on their earnings and losses, respectively.
Noncontrolling Interests
Manning & Napier, Inc. holds an economic interest of approximately 18.2%18.6% in Manning & Napier Group as of June 30, 2018March 31, 2019 but, as managing member, controls all of the business and affairs of Manning & Napier Group. As a result, the Company consolidates the financial results of Manning & Napier Group and records a noncontrolling interest in our consolidated financial statements. Net income attributable to noncontrolling interests on the consolidated statements of operations represents the portion of earnings attributable to the economic interest in Manning & Napier Group held by the noncontrolling interests.
Critical Accounting Policies and Estimates
Our critical accounting policies and estimates are disclosed in our Annual Report on Form 10-K for the year ended December 31, 2017.2018. Changes to our accounting policies as a result of adoptingadoption Topic 606842 are discussed under "Revenue" and "Costs to Obtain a Contract""Leases" of Note 2, "Summary of Significant Accounting Policies "Policies" and under "Adoption of ASU 2014-09, Revenue from contracts with customers2016-02, Leases (Topic 606)842)" of Note 3, "Revenue, Contract Assets and Contract Liabilities"8, "Leases" to the Consolidated Financial Statements included in Item 1 of Part I of this Quarterly Report on Form 10-Q.
This management’s discussion and analysis should be read in conjunction with the Company’s Annual Report on Form 10-K for the year ended December 31, 20172018 together with the consolidated financial statements and related notes and the other financial information that appear elsewhere in this report.
Recent Accounting Pronouncements
See Note 2, "Summary of Significant Accounting Policies - RecentRecently Adopted Accounting Pronouncements" and "Recent Accounting Pronouncements Not Yet Adopted" to the Consolidated Financial Statements included in Item 1 of Part I of this Quarterly Report on Form 10-Q for additional information.
Three Months Ended June 30, 2018March 31, 2019 Compared to Three Months Ended June 30, 2017March 31, 2018
Assets Under Management
The following table reflects changes in our AUM for the three months ended June 30, 2018March 31, 2019 and 20172018:
| | | | | Three months ended June 30, | | Period-to-Period | | Three months ended March 31, | | Period-to-Period |
| | | 2018 | | 2017 | | $ | | % | | 2019 | | 2018 | | $ | | % |
| | | (in millions) | | | | (in millions) | | |
| Separately managed accounts | | | | | | | | | | | | | | | | |
| Beginning assets under management | | $ | 15,960.1 |
| | $ | 18,762.8 |
| | $ | (2,802.7 | ) | | (15 | )% | | $ | 13,792.1 |
| | $ | 16,856.6 |
| | $ | (3,064.5 | ) | | (18 | )% |
Gross client inflows (1) | | 331.1 |
| | 621.2 |
| | (290.1 | ) | | (47 | )% | | 316.1 |
| | 418.6 |
| | (102.5 | ) | | (24 | )% |
Gross client outflows (1) | | (899.7 | ) | | (2,316.8 | ) | | 1,417.1 |
| | (61 | )% | | (664.9 | ) | | (1,325.8 | ) | | 660.9 |
| | (50 | )% |
| Acquired assets | | | — |
| | — |
| | — |
| | — | % |
Market appreciation (depreciation) & other (2) | | 214.4 |
| | 647.7 |
| | (433.3 | ) | | (67 | )% | | 1,223.9 |
| | 10.7 |
| | 1,213.2 |
| | * |
|
| Ending assets under management | | $ | 15,605.9 |
| | $ | 17,714.9 |
| | $ | (2,109.0 | ) | | (12 | )% | | $ | 14,667.2 |
| | $ | 15,960.1 |
| | $ | (1,292.9 | ) | | (8 | )% |
| Average AUM for period | | $ | 15,689.8 |
| | $ | 18,424.4 |
| | $ | (2,734.6 | ) | | (15 | )% | | $ | 14,324.0 |
| | $ | 16,453.9 |
| | | | |
| | | | | | | | | | |
| Mutual funds and collective investment trusts | | | | | | | | | | | | | | | | |
| Beginning assets under management | | $ | 7,473.4 |
| | $ | 12,866.6 |
| | $ | (5,393.2 | ) | | (42 | )% | | $ | 6,371.5 |
| | $ | 8,256.6 |
| | $ | (1,885.1 | ) | | (23 | )% |
Gross client inflows (1) | | 349.7 |
| | 450.0 |
| | (100.3 | ) | | (22 | )% | | 404.6 |
| | 481.3 |
| | (76.7 | ) | | (16 | )% |
Gross client outflows (1) | | (654.5 | ) | | (4,375.2 | ) | | 3,720.7 |
| | (85 | )% | | (908.0 | ) | | (1,031.0 | ) | | 123.0 |
| | (12 | )% |
| Acquired assets | | | — |
| | (251.6 | ) | | 251.6 |
| | (100 | )% |
Market appreciation (depreciation) & other (2) | | 63.2 |
| | 419.2 |
| | (356.0 | ) | | (85 | )% | | 602.5 |
| | 18.1 |
| | 584.4 |
| | * |
|
| Ending assets under management | | $ | 7,231.8 |
| | $ | 9,360.6 |
| | $ | (2,128.8 | ) | | (23 | )% | | $ | 6,470.6 |
| | $ | 7,473.4 |
| | $ | (1,002.8 | ) | | (13 | )% |
| Average AUM for period | | $ | 7,394.2 |
| | $ | 10,218.0 |
| | $ | (2,823.8 | ) | | (28 | )% | | $ | 6,343.7 |
| | $ | 7,873.3 |
| | | | |
| | | | | | | | | | |
| Total assets under management | | | | | | | | | | | | | | | | |
| Beginning assets under management | | $ | 23,433.5 |
| | $ | 31,629.4 |
| | $ | (8,195.9 | ) | | (26 | )% | | $ | 20,163.6 |
| | $ | 25,113.2 |
| | $ | (4,949.6 | ) | | (20 | )% |
Gross client inflows (1) | | 680.8 |
| | 1,071.2 |
| | (390.4 | ) | | (36 | )% | | 720.7 |
| | 899.9 |
| | (179.2 | ) | | (20 | )% |
Gross client outflows (1) | | (1,554.2 | ) | | (6,692.0 | ) | | 5,137.8 |
| | (77 | )% | | (1,572.9 | ) | | (2,356.8 | ) | | 783.9 |
| | (33 | )% |
| Acquired assets | | | — |
| | (251.6 | ) | | 251.6 |
| | (100 | )% |
Market appreciation (depreciation) & other (2) | | 277.6 |
| | 1,066.9 |
| | (789.3 | ) | | (74 | )% | | 1,826.4 |
| | 28.8 |
| | 1,797.6 |
| | * |
|
| Ending assets under management | | $ | 22,837.7 |
| | $ | 27,075.5 |
| | $ | (4,237.8 | ) | | (16 | )% | | $ | 21,137.8 |
| | $ | 23,433.5 |
| | $ | (2,295.7 | ) | | (10 | )% |
| Average AUM for period | | $ | 23,084.0 |
| | $ | 28,642.4 |
| | $ | (5,558.4 | ) | | (19 | )% | | $ | 20,667.7 |
| | $ | 24,327.2 |
| | | | |
________________________
| |
| (*) | Percentage change not meaningful. |
| |
| (1) | Transfers of client assets between portfolios are included in gross client inflows and gross client outflows. |
| |
| (2) | Market appreciation/(depreciation) and other includes investment gains/(losses) on assets under management, the impact of changes in foreign exchange rates and net flows from non-sales related activities including net reinvested dividends. |
Our total AUM decreased by $4.2$2.3 billion from $27.1$23.4 billion at June 30, 2017March 31, 2018 to $22.8$21.1 billion at June 30, 2018.March 31, 2019. The decrease was attributable to net client outflows of $5.9 billion and disposed assets of $0.4$3.0 billion, partially offset by market appreciation of $2.0$0.7 billion. Net client outflows consisted of approximately $3.4$1.9 billion of net outflows for separate accounts and $2.4$1.1 billion for mutual funds and collective investment trusts. By portfolio, the rates of change in AUM from June 30, 2017March 31, 2018 to June 30, 2018March 31, 2019 consisted of a $1.6$1.0 billion, or 10%14% decrease in our equity portfolio, a $1.2 billion, or 8% decrease in our blended asset portfolio, a $2.4 billion, or 27% decrease in our equity portfolio, and a decrease of $0.2 billion,$145.0 million, or 13%12% in our fixed income portfolio.
While many of our key strategies report favorable one year and long term annualizedachieved competitive relative returns, we attribute our net cash outflows during the three months ended March 31, 2019 to challenging three and five year annualized returns wherein many of the strategies included in our key investment strategies have trailed their related benchmarks. In addition, we face increased competition from lower fee passive investment products.blended asset and equity portfolios. Our ability to improve cash flows going forward will depend on our ability to sustain the improved investment performance we achieved over the past year and execute on our strategic initiatives focused on gathering and retaining client assets.
The total AUM decreaseincrease of $0.6$1.0 billion, to $22.8$21.1 billion at June 30, 2018March 31, 2019 from $23.4$20.2 billion at MarchDecember 31, 2018 was attributable to market appreciation of $1.8 billion, partially offset by net client cash outflows of $0.9 billion, partially offset by market appreciation of $0.3 billion. Our separate accounts and mutual fund and collective investment trust vehicles had net client outflows of approximately $0.6$0.3 billion and $0.3$0.5 billion, respectively. Therespectively, from December 31, 2018 to March 31, 2019. In the same period, the blended investment gain was 1.3%8.9% in separately managed accounts and 0.8%9.5% in mutual funds
and collective investment trusts. By portfolio in that period, our AUM decreasedincreased by $20.5 million$0.3 billion in our blended asset portfolio $0.5and $0.7 billion in our equity portfolio, and $32.5decreased by $53.6 million in our fixed income portfolio.
As of June 30, 2018,March 31, 2019, the composition of our AUM was 69% in separate accounts and 31% in mutual funds and collective investment trusts, compared to 68% in separate accounts and 32% in mutual funds and collective investment trusts compared to 65% in separate accounts and 35% in mutual funds and collective investment trusts at June 30, 2017.March 31, 2018. The composition of our AUM across portfolios at June 30, 2018March 31, 2019 was 66% in blended assets, 29% in equity, and 5% in fixed income, compared to 61%64% in blended assets, 34%31% in equity, and 5% in fixed income at June 30, 2017.March 31, 2018.
With regard to our separate accounts, gross client inflows of approximately $0.3 billion were offset by approximately $0.9$0.7 billion of gross client outflows during the three months ended June 30, 2018.March 31, 2019. The $0.3 billion gross client inflows include approximately $0.2$0.1 billion into our blended asset portfolio and $0.1 billion into our equity portfolio. During the three months ended June 30, 2018, 60%March 31, 2019, 66% of our separate account gross client inflows were derived from our Direct Channel. With regard to gross client outflows, cancellations were approximately $0.6 billion. Withdrawals$0.3 billion and withdrawals from existing accounts were approximately $0.3$0.4 billion. Outflows during the secondfirst quarter 2018 were 47%69%, 48%16% and 5%15% from blended, equity and fixed income portfolios, respectively. Our separate account clients redeemed assets at a rate of 23%19% during the quarter, compared to a 29%21% redemption rate over the trailing twelve months ended June 30, 2018. OurMarch 31, 2019. The annualized separate account retention rate across all channels was 85% during92% for the three months ended June 30, 2018March 31, 2019 compared to 84%89% for the rolling 12twelve months ended June 30, 2018.March 31, 2019.
Net client outflows of $0.3$0.5 billion from our mutual fund and collective investment trusts included gross client inflows of $0.3$0.4 billion, offset by gross client outflows of $0.7$0.9 billion during the three months ended June 30, 2018.March 31, 2019. Gross client inflows into our blended asset life cycle vehicles, including both risk based and target date strategies, represented $0.2 billion, or 68%39%, of mutual fund and collective trust fund gross client inflows during the three months ended June 30, 2018.March 31, 2019. With regard to gross client outflows, $0.3$0.6 billion, or 53%67%, of mutual fund and collective investment trust gross client outflows were from our equityblended asset mutual fund and collective trust products.
The following table sets forth our results of operations and related data for the three months ended June 30, 2018March 31, 2019 and 2017:2018:
| | | | | Three months ended June 30, | | Period-to-Period | | Three months ended March 31, | | Period-to-Period |
| | | 2018 | | 2017 | | $ | | % | | 2019 | | 2018 | | $ | | % |
| | | (in thousands, except share data) | | | | (in thousands, except share data) | | |
| Revenues | | | | | | | | | | | | | | | | |
| Management Fees | | | | | | | | | | | | | | | | |
| Separately managed accounts | | $ | 24,483 |
| | $ | 27,530 |
| | $ | (3,047 | ) | | (11 | )% | | $ | 21,475 |
| | $ | 25,355 |
| | $ | (3,880 | ) | | (15 | )% |
| Mutual funds and collective investment trusts | | 11,030 |
| | 17,806 |
| | (6,776 | ) | | (38 | )% | | 8,228 |
| | 10,980 |
| | (2,752 | ) | | (25 | )% |
| Distribution and shareholder servicing | | 3,033 |
| | 3,353 |
| | (320 | ) | | (10 | )% | | 2,624 |
| | 3,178 |
| | (554 | ) | | (17 | )% |
| Custodial services | | 1,895 |
| | 2,012 |
| | (117 | ) | | (6 | )% | | 1,745 |
| | 1,922 |
| | (177 | ) | | (9 | )% |
| Other revenue | | 679 |
| | 835 |
| | (156 | ) | | (19 | )% | | 725 |
| | 789 |
| | (64 | ) | | (8 | )% |
| Total revenue | | 41,120 |
| | 51,536 |
| | (10,416 | ) | | (20 | )% | | 34,797 |
| | 42,224 |
| | (7,427 | ) | | (18 | )% |
| Expenses | | | | | | | | | | | | | | | | |
| Compensation and related costs | | 21,689 |
| | 22,233 |
| | (544 | ) | | (2 | )% | | 21,448 |
| | 23,773 |
| | (2,325 | ) | | (10 | )% |
| Distribution, servicing and custody expenses | | 4,502 |
| | 7,084 |
| | (2,582 | ) | | (36 | )% | | 3,758 |
| | 4,781 |
| | (1,023 | ) | | (21 | )% |
| Other operating costs | | 8,579 |
| | 7,234 |
| | 1,345 |
| | 19 | % | | 8,307 |
| | 6,454 |
| | 1,853 |
| | 29 | % |
| Total operating expenses | | 34,770 |
| | 36,551 |
| | (1,781 | ) | | (5 | )% | | 33,513 |
| | 35,008 |
| | (1,495 | ) | | (4 | )% |
| Operating income | | 6,350 |
| | 14,985 |
| | (8,635 | ) | | (58 | )% | | 1,284 |
| | 7,216 |
| | (5,932 | ) | | (82 | )% |
| Non-operating income (loss) | | | | | | | | | | | | | | | | |
| Non-operating income (loss), net | | 332 |
| | 846 |
| | (514 | ) | | (61 | )% | | 1,875 |
| | 535 |
| | 1,340 |
| | * |
|
| Income before provision for income taxes | | 6,682 |
| | 15,831 |
| | (9,149 | ) | | (58 | )% | | 3,159 |
| | 7,751 |
| | (4,592 | ) | | (59 | )% |
| Provision for income taxes | | 492 |
| | 1,242 |
| | (750 | ) | | (60 | )% | | 242 |
| | 478 |
| | (236 | ) | | (49 | )% |
| Net income attributable to controlling and noncontrolling interests | | 6,190 |
| | 14,589 |
| | (8,399 | ) | | (58 | )% | | 2,917 |
| | 7,273 |
| | (4,356 | ) | | (60 | )% |
| Less: net income attributable to noncontrolling interests | | 5,424 |
| | 12,904 |
| | (7,480 | ) | | (58 | )% | | 2,356 |
| | 6,059 |
| | (3,703 | ) | | (61 | )% |
| Net income attributable to Manning & Napier, Inc. | | $ | 766 |
| | $ | 1,685 |
| | $ | (919 | ) | | (55 | )% | | $ | 561 |
| | $ | 1,214 |
| | $ | (653 | ) | | (54 | )% |
| Per Share Data | | | | | | | | | | | | | | | | |
| Net income per share available to Class A common stock | | | | | | | | | | | | | | | | |
| Basic | | $ | 0.05 |
| | $ | 0.12 |
| | | | | | $ | 0.04 |
| | $ | 0.08 |
| | | | |
| Diluted | | $ | 0.05 |
| | $ | 0.12 |
| | | | | | $ | 0.03 |
| | $ | 0.07 |
| | | | |
| Weighted average shares of Class A common stock outstanding | | | | | | | | | | | | | | | | |
| Basic | | 14,691,928 |
| | 14,111,368 |
| | | | | | 14,927,265 |
| | 14,313,549 |
| | | | |
| Diluted | | 14,709,403 |
| | 14,298,834 |
| | | | | | 78,581,169 |
| | 78,283,583 |
| | | | |
| Cash dividends declared per share of Class A common stock | | $ | 0.08 |
| | $ | 0.08 |
| | | | | |
| | | | | | | | | | | | | | | | | |
| Other financial and operating data | | | | | | | | | | | | | | | | |
Economic net income (1) | | $ | 4,629 |
| | $ | 9,657 |
| | $ | (5,028 | ) | | (52 | )% | | $ | 2,243 |
| | $ | 5,619 |
| | $ | (3,376 | ) | | (60 | )% |
Economic net income per adjusted share (1) | | $ | 0.06 |
| | $ | 0.12 |
| |
| |
|
| | $ | 0.03 |
| | $ | 0.07 |
| |
| |
|
|
Weighted average adjusted Class A common stock outstanding (1) | | 78,751,512 |
| | 79,189,372 |
| | | | | | 80,068,669 |
| | 79,105,231 |
| | | | |
_______________________
| |
| (*) | Percentage change not meaningful. |
| |
| (1) | See “Management’s Discussion and Analysis of Financial Condition and Results of Operations – Supplemental Non-GAAP Financial Information” for Manning & Napier’s reasons for including these non-GAAP measures in this report in addition to a reconciliation of non-GAAP financial measures to GAAP measures for the periods indicated. |
Revenues
Separately managed accountaccount revenue decreased by $3.0$3.9 million, or 11%15%, to $24.5$21.5 million for the three months ended June 30, 2018March 31, 2019 from $27.5$25.4 million for the three months ended June 30, 2017.March 31, 2018. This decrease is driven primarily by a 15%13%, or $2.1 billion, decrease in our average separately managedmanged account AUM for the three months ended June 30, 2018March 31, 2019 compared to the three months ended June 30, 2017.March 31, 2018. Our average separately managed account fee for the three months ended June 30, 2018 increasedMarch 31, 2019 decreased slightly to 0.63%0.61% when compared to the 0.62% for full year 2017.the three months ended March 31, 2018. For both periods our separately managed account standard fees ranged from 0.15% to 1.25% depending on investment objective and account size. As of June 30, 2018,March 31, 2019, the concentration of investments in our separately managed account assets was 64% blended assets, 29% equity and 7% fixed income, compared to 61%63% blended assets, 32%30% equity and 7% fixed income as of June 30, 2017. The shift from equity to blended assets is the result of the concentration of net cash outflows from our equity portfolios, particularly during the first half ofMarch 31, 2018.
Mutual fund and collective investment trust revenue decreased by $6.8$2.8 million, or 38%25%, to $8.2 million for the three months ended March 31, 2019 from $11.0 million for the three months ended June 30, 2018 from $17.8 million for the three months ended June 30, 2017.March 31, 2018. This decrease is driven primarily by a 28%19%, or $2.8$1.5 billion, decrease in our average mutual fund and collective investment trust AUM for the three months ended June 30, 2018March 31, 2019 compared to the three months ended June 30, 2017. In addition, with the adoption of Topic 606, effective January 1, 2018, third party record-keeping and administrative services for employee benefit plans participating in the Company's collective investment trusts of $0.7 million for the three months ended June 30, 2018 are presented net as a reduction of mutual fund and collective investment trust revenue. Prior to the adoption of Topic 606, third party record-keeper fees associated with the Company's collective investment trusts were reported as distribution, servicing and custody expense.March 31, 2018. Our average fee on mutual fund and collective investment trust products decreased slightly to 0.76%0.69% for the three months ended June 30, 2018 when comparedMarch 31, 2019 from 0.73% for the three months ended March 31, 2018. This decrease was primarily due to the 0.77% for full year 2017. Management fees earned onrestructuring of our funds that was completed during the first quarter of 2019. Our mutual fund and collective investment trust management fees ranged from 0.14%0.25% to 1.00%, depending on investment strategy, for the three months ended June 30, 2018March 31, 2019 and 2017.2018. As of June 30, 2018,March 31, 2019, the concentration of assets in our mutual fund and collective investment trusts was 68%67% blended assets, 31% equity and 1%2% fixed income, compared to 62%65% blended assets, 37%33% equity and 1%2% fixed income as of June 30, 2017.March 31, 2018.
Distribution and shareholder servicing revenue decreased by $0.3$0.6 million, or 10%17%, to $3.0$2.6 million for the three months ended June 30, 2018March 31, 2019 from $3.4$3.2 million for the three months ended June 30, 2017.March 31, 2018. This decrease was driven by a reduction in mutual fund and collective trust average AUM of 28%19% for the same period; however,period.
Custodial services revenue decreased by $0.2 million, or 9%, to $1.7 million for the reductionthree months ended March 31, 2019 from $1.9 million for the three months ended March 31, 2018. The decrease primarily relates to decreases in mutual fund andour collective investment trust AUM has exceeded the reduction in distribution and shareholder servicing revenue due to the fact that net outflows have been concentrated in those funds where there is not a distribution and shareholder fee. In addition, during the second quarter of 2017, there was a shift of AUM into funds that have a shareholder servicing fee.
In response to industry trends and increasing fee pressure from passive strategies offered by our competitors as well as the anticipated impact of regulatory changes, management is in the midst of an effort to restructure fees across our fund product set. The financial impacts, including reduced management fees and distribution and servicing charges, will occur throughout 2018 and early 2019. The impact on our overall revenue margins will vary depending on the business mix at the time of the fee change. Given the overall pressure on fees that all active managers are facing, we believe that bringing our fund fees to a more competitive level will enhance our ability to attract additional assets in the future.AUM.
Operating Expenses
Our operating expenses decreased by $1.8$1.5 million, or 5%4%, to $34.8$33.5 million for the three months ended June 30, 2018March 31, 2019 from $36.6$35.0 million for the three months ended June 30, 2017.March 31, 2018.
Compensation and related costs decreased by $0.5$2.3 million, or 2%10%, to $21.7$21.4 million for the three months ended June 30, 2018March 31, 2019 from $22.2$23.8 million for the three months ended June 30, 2017.March 31, 2018. This decrease in the current quarter compared to the first quarter of 2018 was driven primarily by a 14% decrease in average workforce and lower variable incentive costs as a result of the reduction in AUM, and an 8% reduction in average workforce, partially offset by changesan increase in our executive team compensation.share-based compensation and employee severance costs. When considered as a percentage of revenue, compensation and related costs for the three months ended June 30, 2018March 31, 2019 was 53%62% compared to 43%56% for the three months ended June 30, 2017.March 31, 2018. We anticipate that our compensation ratio as a percentage of revenue will remain elevated in the near term compared to prior periods.
Distribution, servicing and custody expenses decreased by $2.6$1.0 million, or 36%21%, to $4.5$3.8 million for the three months ended June 30, 2018March 31, 2019 from $7.1$4.8 million for the three months ended June 30, 2017.March 31, 2018. The decrease was generally driven by a 28%19% decrease in mutual fund and collective investment trust average AUM for the three months ended June 30, 2018March 31, 2019 compared to the three months ended June 30, 2017. In addition, approximately $0.7 millionMarch 31, 2018 as well as the elimination of certain distribution expenses following the decrease in expense is a resultrestructuring of the adoption of Topic 606 whereby fees paid to third parties who provide record-keeping and administrative services for employee benefit plans participating in our collective investment trusts were reported as expense prior to January 1, 2018 at which time the Company began reporting the fees as a reduction of revenue.mutual fund fees. As a percentage of mutual fund and collective investment trust average AUM, distribution, servicing and custody expense was 0.24% for the three months ended June 30, 2018,March 31, 2019, compared to 0.28%0.25% for the three months ended June 30, 2017.
March 31, 2018.
Other operating costs for the three months ended June 30, 2018March 31, 2019 was $8.6$8.3 million, compared to $7.2$6.5 million for the three months ended June 30, 2017. Included withinMarch 31, 2018. The increase compared to the first quarter of 2018 was driven by the $2.1 million operating gain reflected in the first quarter of 2018 related to the Company's sale of Rainier U.S. mutual funds, which offset other operating costs forin the three months ended June 30, 2018 is approximately $0.5 millionfirst quarter of fees due2018. In addition, we continue to a third party who provides accounting and administrative services that were previously recorded as a reduction of other revenue prior to the adoption of Topic 606 (see Note 3).invest in our information technology infrastructure. As a percentage of revenue, other operating costs was 21%24% for the three months ended June 30, 2018March 31, 2019 and 14%15% for the three months ended June 30, 2017.March 31, 2018.
Non-Operating Income (Loss)
Non-operating income for the three months ended June 30, 2018March 31, 2019 was $0.3$1.9 million, a decreasean increase of $0.5$1.3 million, from non-operating income of $0.8$0.5 million for the three months ended June 30, 2017.March 31, 2018. The following table reflects the components of non-operating income (loss) for the three months ended June 30, 2018March 31, 2019 and 2017:2018:
| | | | Three months ended June 30, | | Period-to-Period | Three months ended March 31, | | Period-to-Period |
| | 2018 | | 2017 | | $ | | % | 2019 | | 2018 | | $ | | % |
| | (in thousands) | | | (in thousands) | | |
| Non-operating income (loss) | | | | | | | | | | | | | | |
| Interest expense | $ | (21 | ) | | $ | (2 | ) | | $ | (19 | ) | | * |
| $ | (3 | ) | | $ | (9 | ) | | $ | 6 |
| | (67 | )% |
Interest and dividend income (1) | 374 |
| | 238 |
| | 136 |
| | 57 | % | 809 |
| | 502 |
| | $ | 307 |
| | 61 | % |
| Change in liability under tax receivable agreement | | 195 |
| | 291 |
| | $ | (96 | ) | | (33 | )% |
Net gains (losses) on investments (2) | (21 | ) | | 610 |
| | (631 | ) | | * |
| 874 |
| | (249 | ) | | $ | 1,123 |
| | * |
|
| Total non-operating income (loss) | $ | 332 |
| | $ | 846 |
| | $ | (514 | ) | | (61 | )% | |
| Total non-operating income | | $ | 1,875 |
| | $ | 535 |
| | $ | 1,340 |
| | * |
|
__________________________
| |
| (*) | Percentage change not meaningfulmeaningful. |
| |
| (1) | The increase in interest and dividend income for the three months ended June 30, 2018March 31, 2019 compared to 20172018 is attributable to an increase in investments, including U.S. Treasury notes and bills, corporate bonds and other short-term investments to optimize cash management opportunities, coupled with an increase in interest rates. |
| |
| (2) | Amounts represent net income on investments we held to provide initial cash seeding for product development purposes. The amount varies depending on the performance of our investments and the overall amount of our investments in seeded products. |
Provision for Income Taxes
Our tax provision decreased by $0.8for income taxes was $0.2 million tofor the three months ended March 31, 2019, a decrease of approximately $0.2 million from $0.5 million for the three months ended June 30, 2018 from $1.2 million for the three months ended June 30, 2017.March 31, 2018. The change was primarily driven by the enactment of the Tax Cuts and Jobs Act ("U.S. Tax Reform") in 2017. The U.S. Tax Reform reduced the federal corporate income tax rate from 35% to 21%, among other things. The remaining decrease is driven by a decrease in taxable earnings compared to the prior year.
Six Months Ended June 30, 2018 Compared to Six Months Ended June 30, 2017
Assets Under Management
The following table reflects changes in our AUM for the six months ended June 30, 2018 and 2017:
|
| | | | | | | | | | | | | | | |
| | | Six months ended June 30, | | Period-to-Period |
| | | 2018 | | 2017 | | $ | | % |
| | | (in millions) | | |
| Separately managed accounts | | | | | | | | |
| Beginning assets under management | | $ | 16,856.6 |
| | $ | 18,801.9 |
| | $ | (1,945.3 | ) | | (10 | )% |
Gross client inflows (1) | | 749.7 |
| | 977.1 |
| | (227.4 | ) | | (23 | )% |
Gross client outflows (1) | | (2,225.5 | ) | | (3,839.7 | ) | | 1,614.2 |
| | (42 | )% |
Market appreciation (depreciation) & other (2) | | 225.1 |
| | 1,775.6 |
| | (1,550.5 | ) | | (87 | )% |
| Ending assets under management | | $ | 15,605.9 |
| | $ | 17,714.9 |
| | $ | (2,109.0 | ) | | (12 | )% |
| Average AUM for period | | $ | 16,087.8 |
| | $ | 18,694.9 |
| | $ | (2,607.1 | ) | | (14 | )% |
| Mutual funds and collective investment trusts | | | | | | | | |
| Beginning assets under management | | $ | 8,256.6 |
| | $ | 12,881.1 |
| | $ | (4,624.5 | ) | | (36 | )% |
Gross client inflows (1) | | 831.0 |
| | 1,161.0 |
| | (330.0 | ) | | (28 | )% |
Gross client outflows (1) | | (1,685.5 | ) | | (5,879.6 | ) | | 4,194.1 |
| | (71 | )% |
| Acquired/(disposed) assets | | (251.6 | ) | | — |
| | (251.6 | ) | | * |
|
Market appreciation (depreciation) & other (2) | | 81.3 |
| | 1,198.1 |
| | (1,116.8 | ) | | (93 | )% |
| Ending assets under management | | $ | 7,231.8 |
| | $ | 9,360.6 |
| | $ | (2,128.8 | ) | | (23 | )% |
| Average AUM for period | | $ | 7,640.0 |
| | $ | 11,541.0 |
| | $ | (3,901.0 | ) | | (34 | )% |
| Total assets under management | | | | | | | | |
| Beginning assets under management | | $ | 25,113.2 |
| | $ | 31,683.0 |
| | $ | (6,569.8 | ) | | (21 | )% |
Gross client inflows (1) | | 1,580.7 |
| | 2,138.1 |
| | (557.4 | ) | | (26 | )% |
Gross client outflows (1) | | (3,911.0 | ) | | (9,719.3 | ) | | 5,808.3 |
| | (60 | )% |
| Acquired/(disposed) assets | | (251.6 | ) | | — |
| | (251.6 | ) | | * |
|
Market appreciation (depreciation) & other (2) | | 306.4 |
| | 2,973.7 |
| | (2,667.3 | ) | | (90 | )% |
| Ending assets under management | | $ | 22,837.7 |
| | $ | 27,075.5 |
| | $ | (4,237.8 | ) | | (16 | )% |
| Average AUM for period | | $ | 23,727.8 |
| | $ | 30,235.9 |
| | $ | (6,508.1 | ) | | (22 | )% |
________________________
| |
(*) | Percentage change not meaningful |
| |
(1) | Transfers of client assets between portfolios are included in gross client inflows and gross client outflows. |
| |
(2) | Market appreciation/(depreciation) and other includes investment gains/(losses) on assets under management, the impact of changes in foreign exchange rates and net flows from non-sales related activities including net reinvested dividends. |
Our total AUM decreased by $4.2 billion from $27.1 billion at June 30, 2017 to $22.8 billion at June 30, 2018. The decrease was attributable to net client outflows of $5.9 billion and disposed assets of $0.4 billion, partially offset by market appreciation of $2.0 billion. Net client outflows consisted of approximately $3.4 billion of net outflows for separate accounts and $2.4 billion for mutual funds and collective investment trusts. By portfolio, the rates of change in AUM from June 30, 2017 to June 30, 2018 consisted of a $1.6 billion, or 10% decrease in our blended asset portfolio, a $2.4 billion, or 27% decrease in our equity portfolio, and a decrease of $0.2 billion, or 13% in our fixed income portfolio.
While many of our key strategies report favorable one year and long term annualized returns, we attribute our net cash outflows to challenging three and five year annualized returns where our key investment strategies have trailed their related benchmarks. In addition, we face increased competition from lower fee passive investment products. Our ability to improve cash flows going forward will depend on our ability to sustain the improved investment performance we achieved over the past year and execute on our strategic initiatives focused on gathering and retaining client assets.
The total AUM decrease of $2.3 billion, or 9%, to $22.8 billion at June 30, 2018 from $25.1 billion at December 31, 2017 was attributable to net client cash outflows of $2.3 billion, and disposed assets of $0.3 billion, partially offset by market appreciation of $0.3 billion. Included in net client flows during the six months ended June 30, 2018 were net client outflows in separately managed accounts of approximately $1.5 billion and mutual funds and collective investment trusts of approximately $0.9 billion. The blended investment gain was 1.3% in separately managed accounts and 1.0% in mutual funds and collective investment trusts. By portfolio, our net $2.3 billion AUM decrease was derived from a decrease of $0.7 billion, or 4%, in our blended asset portfolio and $1.4 billion, or 18%, in our equity portfolio, offset by an increase of $0.1 billion, or 10%, in our fixed income portfolio.
As of June 30, 2018, the composition of our AUM was 68% in separate accounts and 32% in mutual funds and collective investment trusts, compared to 65% in separate accounts and 35% in mutual funds and collective investment trusts at June 30, 2017. The composition of our AUM across portfolios at June 30, 2018 was 66% in blended assets, 29% in equity, and 5% in fixed income, compared to 61% in blended assets, 34% in equity, and 5% in fixed income at June 30, 2017.
With regard to our separate accounts, gross client inflows of $0.7 billion were offset by approximately $2.2 billion of gross client outflows during the six months ended June 30, 2018. The $0.7 billion of gross client inflows included $0.4 billion into our blended asset portfolios, $0.3 billion into our equity portfolios and less than $0.1 billion into fixed income portfolios. During the six months ended June 30, 2018, 63% of our separate account gross client inflows were derived from our Direct Channel. Gross client inflows were split with 83% contributions from existing accounts and 17% from new relationships. With regard to gross client outflows, cancellations were approximately $1.5 billion. Withdrawals from existing accounts were approximately $0.7 billion. Our blended asset and equity portfolios experienced net client outflows of approximately $0.6 billion and $.08 billion, respectively. Our separate account clients redeemed assets at a rate of 26% during the six months ended June 30, 2018, compared to a 29% redemption rate over the trailing twelve months ended June 30, 2018. The annualized separate account retention rate was 83% for the six months ended June 30, 2018, compared to 84% for the rolling twelve months ended June 30, 2018.
Net client outflows of $0.9 billion from our mutual fund and collective investment trusts included gross client inflows of $0.8 billion offset by gross client outflows of $1.7 billion during the six months ended June 30, 2018. Gross client inflows into our blended asset life cycle vehicles, including both risk based and target date strategies, represented $0.5 billion, or 63%, of mutual fund and collective trust fund gross client inflows during the six months ended June 30, 2018. With regard to gross client outflows, $0.9 billion, or 52%, of mutual fund and collective investment trust gross client outflows were from blended asset mutual fund and collective trust products.
The following table sets forth our results of operations and other data for the six months ended June 30, 2018 and 2017:
|
| | | | | | | | | | | | | | | |
| | | Six months ended June 30, | | Period-to-Period |
| | | 2018 | | 2017 | | $ | | % |
| | | (in thousands, except share data) | | |
| Revenues | | | | | | | | |
| Management Fees | | | | | | | | |
| Separately managed accounts | | $ | 49,838 |
| | $ | 57,469 |
| | $ | (7,631 | ) | | (13 | )% |
| Mutual funds and collective investment trusts | | 22,010 |
| | 37,091 |
| | (15,081 | ) | | (41 | )% |
| Distribution and shareholder servicing | | 6,211 |
| | 6,393 |
| | (182 | ) | | (3 | )% |
| Custodial services | | 3,817 |
| | 4,357 |
| | (540 | ) | | (12 | )% |
| Other revenue | | 1,468 |
| | 1,711 |
| | (243 | ) | | (14 | )% |
| Total revenue | | 83,344 |
| | 107,021 |
| | (23,677 | ) | | (22 | )% |
| Expenses | | | | | | | | |
| Compensation and related costs | | 45,462 |
| | 45,614 |
| | (152 | ) | | — | % |
| Distribution, servicing and custody expenses | | 9,283 |
| | 14,495 |
| | (5,212 | ) | | (36 | )% |
| Other operating costs | | 15,033 |
| | 15,212 |
| | (179 | ) | | (1 | )% |
| Total operating expenses | | 69,778 |
| | 75,321 |
| | (5,543 | ) | | (7 | )% |
| Operating income | | 13,566 |
| | 31,700 |
| | (18,134 | ) | | (57 | )% |
| Non-operating income (loss) | | | | | | | | |
| Non-operating income (loss), net | | 867 |
| | 1,988 |
| | (1,121 | ) | | (56 | )% |
| Income before provision for income taxes | | 14,433 |
| | 33,688 |
| | (19,255 | ) | | (57 | )% |
| Provision for income taxes | | 970 |
| | 2,585 |
| | (1,615 | ) | | (62 | )% |
| Net income attributable to controlling and noncontrolling interests | | 13,463 |
| | 31,103 |
| | (17,640 | ) | | (57 | )% |
| Less: net income attributable to noncontrolling interests | | 11,483 |
| | 27,521 |
| | (16,038 | ) | | (58 | )% |
| Net income attributable to Manning & Napier, Inc. | | $ | 1,980 |
| | $ | 3,582 |
| | $ | (1,602 | ) | | (45 | )% |
| Per Share Data | | | | | | | | |
| Net income per share available to Class A common stock | | | | | | | | |
| Basic | | $ | 0.13 |
| | $ | 0.25 |
| | | | |
| Diluted | | $ | 0.13 |
| | $ | 0.25 |
| | | | |
| Weighted average shares of Class A common stock outstanding | | | | | | | | |
| Basic | | 14,503,784 |
| | 14,077,313 |
| | | | |
| Diluted | | 14,530,398 |
| | 14,256,911 |
| | | | |
| Cash dividends declared per share of Class A common stock | | $ | 0.16 |
| | $ | 0.16 |
| | | | |
| | | | | | | | | |
| Other financial and operating data | | | | | | | | |
Economic net income (1) | | $ | 10,248 |
| | $ | 20,550 |
| | $ | (10,302 | ) | | (50 | )% |
Economic net income per adjusted share (1) | | $ | 0.13 |
| | $ | 0.26 |
| | | | |
Weighted average adjusted Class A common stock outstanding (1) | | 78,927,395 |
| | 80,097,025 |
| | | | |
________________________
| |
(1) | See “Management’s Discussion and Analysis of Financial Condition and Results of Operations – Supplemental Non-GAAP Financial Information” for Manning & Napier’s reasons for including these non-GAAP measures in this report in addition to a reconciliation of non-GAAP financial measures to GAAP measures for the periods indicated. |
Revenues
Separately managed account revenue decreased by $7.6 million, or 13%, to $49.8 million for the six months ended June 30, 2018 from $57.5 million for the six months ended June 30, 2017. This decrease is driven primarily by a 14% decrease in our average separately managed account AUM for the six months ended June 30, 2018 compared to the six months ended June 30, 2017. Our average separately managed account fee for the six months ended June 30, 2018 remained consistent at 0.63% when compared to the 0.62% for full year 2017. For both periods our separately managed account standard fees ranged from 0.15% to 1.25% depending on investment objective and account size. As of June 30, 2018, the concentration of investments in our separately managed account assets was 64% blended assets, 29% equity and 7% fixed income, compared to 61% blended assets, 32% equity and 7% fixed income as of June 30, 2017. The shift from equity to blended assets is the result of the concentration of net cash outflows from our equity portfolios, particularly during the first half of 2018.
Mutual fund and collective investment trust revenue decreased by $15.1 million, or 41%, to $22.0 million for the six months ended June 30, 2018 from $37.1 million for the six months ended June 30, 2017. This decrease is driven primarily by a 34% or $3.9 billion, decrease in our average mutual fund and collective investment trust AUM for the six months ended June 30, 2018 compared to the six months ended June 30, 2017. In addition, with the adoption of Topic 606, effective January 1, 2018, third party record-keeping and administrative services for employee benefit plans participating in the Company's collective investment trusts of $1.3 million for the six months ended June 30, 2018 are presented net as a reduction of mutual fund and collective investment trust revenue. Prior to the adoption of Topic 606, third party record-keeper fees associated with the Company's collective investment trusts were reported as distribution, servicing and custody expense. Our average fee on mutual fund and collective investment trust products decreased to 0.74% for the six months ended June 30, 2018 when compared to the 0.77% for full year 2017. Management fees earned on our mutual fund and collective investment trust management fees ranged from 0.14% to 1.00%, depending on investment strategy, for the six months ended June 30, 2018 and 2017. As of June 30, 2018, the concentration of assets in our mutual fund and collective investment trusts was 68% blended assets, 31% equity and 1% fixed income, compared to 62% blended assets, 37% equity and 1% fixed income as of June 30, 2017.
Distribution and shareholder servicing revenue decreased by $0.2 million, or 3%, to $6.2 million for the six months ended June 30, 2018 from $6.4 million for the six months ended June 30, 2017. This decrease is driven by a reduction in mutual fund and collective trust AUM of 34% for the same period; however, the reduction in mutual fund and collective trust AUM has exceeded the reduction in distribution and shareholder servicing revenue due to the fact that net outflows have been concentrated in those funds where there is not a distribution and shareholder fee. In addition, during the second quarter of 2017 there was a shift of AUM into funds that have a shareholder servicing fee.
Custodial services revenue decreased by $0.5 million, or 12%, to $3.8 million for the six months ended June 30, 2018 from $4.4 million for the six months ended June 30, 2017. The decrease primarily relates to decreases in our collective investment trust AUM.
In response to industry trends and increasing fee pressure from passive strategies offered by our competitors as well as the anticipated impact of regulatory changes, management is in the midst of an effort to restructure fees across our fund product set. The financial impacts, including reduced management fees and distribution and servicing charges, will occur throughout 2018 and early 2019. The impact on our overall revenue margins will vary depending on the business mix at the time of the fee change. Given the overall pressure on fees that all active managers are facing, we believe that bringing our fund fees to a more competitive level will enhance our ability to attract additional assets in the future.
Operating Expenses
Our operating expenses decreased by $5.5 million, or 7%, to $69.8 million for the six months ended June 30, 2018 from $75.3 million for the six months ended June 30, 2017.
Compensation and related costs decreased by $0.2 million, or 0%, to $45.5 million for the six months ended June 30, 2018 from $45.6 million for the six months ended June 30, 2017. The decrease was driven primarily by lower variable incentive costs as a result of the reduction in AUM and a 9% reduction in average workforce, partially offset by changes in our executive team compensation. When considered as a percentage of revenue, compensation and related costs for the six months ended June 30, 2018 was 55% compared to 43% in 2017. We anticipate that our compensation ratio as a percentage of revenue will remain elevated in the near term compared to prior periods.
Distribution, servicing and custody expenses decreased by $5.2 million, or 36%, to $9.3 million for the six months ended June 30, 2018 from $14.5 million for the six months ended June 30, 2017. The decrease was generally attributable to a 34% decrease in mutual fund and collective investment trust average AUM for the six months ended June 30, 2018 compared to the six months ended June 30, 2017. In addition, approximately $1.3 million of the decrease in expense is a result of the adoption of Topic 606, whereby fees paid to third parties who provide record-keeping and administrative services for employee benefit plans participating in our collective investment trusts were reported as expense prior to January 1, 2018 at which time the Company began reporting the fees as a reduction of revenue. As a percentage of mutual fund and collective investment trust
average AUM, distribution, servicing and custody expense was 0.25% for the six months ended June 30, 2018, compared to 0.25% for the six months ended June 30, 2017.
Other operating costs decreased by $0.2 million, or 1%, to $15.0 million for the six months ended June 30, 2018 from $15.2 million for the six months ended June 30, 2017. The decrease was driven mainly by the $2.1 million operating gain included in the six months ended June 30, 2018 for the sale of our Rainier U.S. mutual funds during the first quarter of 2018. This decrease was partially offset by approximately $1.0 million of fees due to a third party who provides accounting and administrative services that is included in other operating costs during the six months ended June 30, 2018 and were previously recorded as a reduction of other revenue prior to the adoption of Topic 606 (see Note 3). As a percentage of revenue, other operating costs for the six months ended June 30, 2018 was 18% compared to 14% for 2017.
Non-Operating Income (Loss)
Non-operating income for the six months ended June 30, 2018 was $0.9 million, a decrease of $1.1 million, from non-operating income of $2.0 million for the six months ended June 30, 2017. The following table reflects the components of non-operating income (loss) for the six months ended June 30, 2018 and 2017:
|
| | | | | | | | | | | | | | |
| | Six months ended June 30, | | Period-to-Period |
| | 2018 | | 2017 | | $ | | % |
| | (in thousands) | | |
| Non-operating income (loss) | | | | | | | |
| Interest expense | $ | (30 | ) | | $ | (12 | ) | | $ | (18 | ) | | 150 | % |
Interest and dividend income (1) | 876 |
| | 418 |
| | 458 |
| | 110 | % |
Change in liability under tax receivable agreement (2) | 291 |
| | — |
| | 291 |
| | * |
|
Net gains (losses) on investments (3) | (270 | ) | | 1,582 |
| | (1,852 | ) | | * |
|
| Total non-operating income (loss) | $ | 867 |
| | $ | 1,988 |
| | $ | (1,121 | ) | | (56 | )% |
__________________________
| |
(*) | Percentage change not meaningful |
| |
(1) | The increase in interest and dividend income for the six months ended June 30, 2018 compared to 2017 is attributable to an increase in investments, including U.S. Treasury notes, corporate bonds and other short-term investments to optimize cash management opportunities, coupled with an increase in interest rates. |
| |
(2) | The change in the liability under the tax receivable agreement for the six months ended June 30, 2018 is attributed to a reduction in our effective tax rate and a corresponding decrease in the payment of the tax benefit. |
| |
(3) | Amounts represent net income on investments we held to provide initial cash seeding for product development purposes. The amount varies depending on the performance of our investments and the overall amount of our investments in seeded products. |
Provision for Income Taxes
Our tax provision decreased by $1.6 million to $1.0 million for the six months ended June 30, 2018 from $2.6 million for the six months ended June 30, 2017. The change was primarily driven by the enactment of the U.S. Tax Reform in 2017. The U.S. Tax Reform reduced the federal corporate income tax rate from 35% to 21%, among other things. The remaining decrease is driven by a decrease in taxable earnings compared to the prior year.
Supplemental Non-GAAP Financial Information
To provide investors with greater insight, promote transparency and allow for a more comprehensive understanding of the information used by management in its financial and operational decision-making, we supplement our consolidated statements of operations presented on a GAAP basis with non-GAAP financial measures of earnings.
Management uses economic net income and economic net income per adjusted share as financial measures to evaluate the profitability and efficiency of itsour business. Economic net income and economic net income per adjusted share are not presented in accordance with GAAP.
Economic net income is a non-GAAP measure of after-tax operating performance and equals ourthe Company’s economic income before provision for income taxes less adjusted income taxes. Adjusted income taxes are estimated assuming the exchange of all outstanding units of Manning & Napier Group, LLC into Class A common stock on a one-to-one basis. Therefore, all income of Manning & Napier Group allocated to the units of Manning & Napier Group is treated as if it were allocated to us and represents an estimate of income tax expense at an effective rate of 30.7%29.0% and 29.0%27.5% for the three and six months ended June 30,March 31, 2019 and 2018, respectively, and 39.0% for the three and six months ended June 30, 2017, reflecting assumed federal, state and local income taxes.
Economic net income per adjusted share is equal to economic net income divided by the weighted average adjusted Class A common shares outstanding. The number of weighted average adjusted Class A common shares outstanding for all periods presented is determined by assuming the weighted average exchangeable units of Manning & Napier Group, weighted average unvested stock units, weighted average unvested restricted stock awards, and unvested equity awardsweighted average vested stock options are converted into our outstanding Class A common stock as of the respective reporting date, on a one-to-one basis. Our management uses economic net income, among other financial data, to determine the earnings available to distribute as dividends to holders of its Class A common stock and to the holders of the units of Manning & Napier Group.
Non-GAAP measures are not a substitute for financial measures prepared in accordance with GAAP.GAAP and therefore should not be used in isolation of, but in conjunction with, GAAP measures. Additionally, our non-GAAP measures may differ from similar measures used by other companies, even if similar terms are used to identify such measures.
The following table sets forth, for the periods indicated, our other financial and operating data for the three and six months endedJune 30, 2018 and 2017:data:
| | | | | Three months ended June 30, | | Six months ended June 30, | | Three months ended March 31, |
| | | 2018 | | 2017 | | 2018 | | 2017 | | 2019 | | 2018 |
| | | (in thousands, except share data) | | (in thousands, except share data) |
| Income before provision for income taxes | | $ | 6,682 |
| | $ | 15,831 |
| | $ | 14,433 |
| | $ | 33,688 |
| | $ | 3,159 |
| | $ | 7,751 |
|
| Economic net income (Non-GAAP) | | $ | 4,629 |
| | $ | 9,657 |
| | $ | 10,248 |
| | $ | 20,550 |
| | $ | 2,243 |
| | $ | 5,619 |
|
| Economic net income per adjusted share (Non-GAAP) | | $ | 0.06 |
| | $ | 0.12 |
| | $ | 0.13 |
| | $ | 0.26 |
| | $ | 0.03 |
| | $ | 0.07 |
|
| Weighted average adjusted Class A common stock outstanding (Non-GAAP) | | 78,751,512 |
| | 79,189,372 |
| | 78,927,395 |
| | 80,097,025 |
| | 80,068,669 |
| | 79,105,231 |
|
The following table sets forth, for the periods indicated, a reconciliation of non-GAAP financial measures to GAAP measures:
| | | | | Three months ended June 30, | | Six months ended June 30, | | Three months ended March 31, |
| | | 2018 | | 2017 | | 2018 | | 2017 | | 2019 | | 2018 |
| | | (in thousands, except share data) | | (in thousands, except share data) |
| Net income attributable to Manning & Napier, Inc. | | $ | 766 |
| | $ | 1,685 |
| | $ | 1,980 |
| | $ | 3,582 |
| | $ | 561 |
| | $ | 1,214 |
|
| Add back: Net income attributable to noncontrolling interests | | 5,424 |
| | 12,904 |
| | 11,483 |
| | 27,521 |
| | 2,356 |
| | 6,059 |
|
| Add back: Provision for income taxes | | 492 |
| | 1,242 |
| | 970 |
| | 2,585 |
| | 242 |
| | 478 |
|
| Income before provision for income taxes | | 6,682 |
| | 15,831 |
| | 14,433 |
| | 33,688 |
| | $ | 3,159 |
| | $ | 7,751 |
|
| Adjusted income taxes (Non-GAAP) | | 2,053 |
| | 6,174 |
| | 4,185 |
| | 13,138 |
| | 916 |
| | 2,132 |
|
| Economic net income (Non-GAAP) | | $ | 4,629 |
| | $ | 9,657 |
| | $ | 10,248 |
| | $ | 20,550 |
| | $ | 2,243 |
| | $ | 5,619 |
|
| | | | | | | | | | |
|
| |
|
| Weighted average shares of Class A common stock outstanding - Basic | | 14,691,928 |
| | 14,111,368 |
| | 14,503,784 |
| | 14,077,313 |
| | 14,927,265 |
| | 14,313,549 |
|
| Assumed vesting, conversion or exchange of: | | | | | | | | | |
|
| |
|
| Weighted average Manning & Napier Group, LLC units outstanding (noncontrolling interest) | | 63,349,721 |
| | 63,941,860 |
| | 63,632,363 |
| | 64,847,944 |
| | 63,349,721 |
| | 63,918,146 |
|
| Weighted average unvested restricted share-based awards | | 709,863 |
| | 1,136,144 |
| | 791,248 |
| | 1,171,768 |
| |
| Weighted average unvested restricted stock units and share awards | | | 1,791,683 |
| | 873,536 |
|
| Weighted average vested stock options | | | — |
| | — |
|
| Weighted average adjusted shares (Non-GAAP) | | 78,751,512 |
| | 79,189,372 |
| | 78,927,395 |
| | 80,097,025 |
| | 80,068,669 |
| | 79,105,231 |
|
| | | | | | | | | | | | | |
| Economic net income per adjusted share (Non-GAAP) | | $ | 0.06 |
| | $ | 0.12 |
| | $ | 0.13 |
| | $ | 0.26 |
| | $ | 0.03 |
| | $ | 0.07 |
|
Liquidity and Capital Resources
Historically, our cash and liquidity needs have been met primarily through cash generated by our operations. Our current financial condition is highly liquid, with a significant amount of our assets comprised of cash and cash equivalents, accounts receivable and investment securities held by us for the purpose of optimizing short-term cash management and providing initial cash seeding for product development purposes.
The following table sets forth certain key financial data relating to our liquidity and capital resources as of June 30, 2018March 31, 2019 and December 31, 20172018:
| | | | | June 30, 2018 | | December 31, 2017 | | March 31, 2019 | | December 31, 2018 |
| | | (in thousands) | | (in thousands) |
| Cash and cash equivalents | | $ | 77,198 |
| | $ | 78,262 |
| | $ | 54,308 |
| | $ | 59,586 |
|
| Accounts receivable | | $ | 12,863 |
| | $ | 15,337 |
| | $ | 10,751 |
| | $ | 11,447 |
|
| Investment securities | | $ | 69,376 |
| | $ | 70,404 |
| | $ | 88,106 |
| | $ | 91,190 |
|
Amounts payable under tax receivable agreement (1) | | $ | 21,536 |
| | $ | 21,827 |
| | $ | 17,828 |
| | $ | 18,023 |
|
Contingent consideration liability (2) | | $ | — |
| | $ | — |
| | $ | — |
| | $ | — |
|
________________________
| |
| (1) | In light of numerous factors affecting our obligation to make such payments, the timing and amounts of any such actual payments are based on our best estimate as of June 30, 2018March 31, 2019 and December 31, 20172018, including our ability to realize the expected tax benefits. Actual payments may significantly differ from estimated payments. |
| |
| (2) | Represents the fair value of additional cash payments related to our acquisition of Rainier of up to $32.5 million over the period ending December 31, 2019, contingent upon Rainier's achievement of certain financial targets. |
During the quarter ended June 30, 2018, we commenced a voluntary employee retirement offering (the "offering"), availableWe have no material assets other than our ownership of Class A units of Manning & Napier Group and, accordingly, will depend on distributions from Manning & Napier Group to employees meeting certain agepay taxes and length-of-service requirements,operating expenses, as well as business function criteria. Employees who elect to participate inany dividends we may pay. As managing member of Manning & Napier Group, we will determine the offering are subject to approval by the Company,timing and will receive enhanced separation benefits. Asamount of June 30, 2018, the period for voluntary participation in the offering remained open. Subsequent to June 30, 2018, the offering period closed. Our estimate of the costs and benefitsany distributions to be recorded under the offering is approximately $2.6 million,paid to its members. We intend to cause Manning & Napier Group to distribute cash to its members, including us, in an amount sufficient to cover taxes and operating expenses, including dividends, if any, declared by us. If we do cause Manning & Napier Group to make such distributions, M&N Group Holdings, MNCC and any other holders of which approximately $2.2 million is expectedunits of Manning & Napier Group will be entitled to be incurred during the third and fourth quarters of 2018. Participants will departreceive equivalent distributions on a staggered schedule to maintain business continuity.pari passu basis.
In determining the sufficiency of liquidity and capital resources to fund our business, we regularly monitor our liquidity position, including among other things, cash, working capital, long-term liabilities, lease commitments and operating company distributions.
Pursuant to the terms of the exchange agreement entered into at the time of the Company's initial public offering, M&N Group Holdings and MNCC exchanged a total of 1,315,521 Class A units of Manning & Napier Group on May 2, 2019, for approximately $3.1 million in cash. Subsequent to the exchange, the Class A units were retired. As a result of the exchange and retirement, the Company's ownership of Manning & Napier Group increased to approximately 18.9%.
We believe that cash on hand and cash generated from operations will be sufficient over the next twelve months to meet our working capital requirements. Further, we expect that cash on hand, including short-term investments and cash generated by operations will be sufficient to meet our liquidity needs for the foreseeable future.
Cash Flows
The following table sets forth our cash flows for the sixthree months ended June 30, 2018March 31, 2019 and 20172018. Operating activities consist primarily of net income subject to adjustments for changes in operating assets and liabilities, equity-based compensation expense, changes in the liability under the TRA, deferred income tax expense, gain on sale of intangible assets and depreciation and amortization. Investing activities consist primarily of the purchase and sale of investments for the purpose of providing initial cash seeding for product development and for cash management purposes, gain on sale of intangible assets and and purchases of property and equipment. Financing activities consist primarily of distributions to noncontrolling interests, dividends paid on our Class A common stock, and purchases of Class A units held by noncontrolling interests of Manning & Napier Group.
|
| | | | | | | | |
| | | Six months ended June 30, |
| | | 2018 | | 2017 |
| | | (in thousands) |
| Net cash provided by operating activities | | $ | 9,670 |
| | $ | 30,211 |
|
| Net cash provided by (used in) investing activities | | 1,855 |
| | (6,645 | ) |
| Net cash used in financing activities | | (12,589 | ) | | (31,427 | ) |
| Net (decrease) increase in cash and cash equivalents | | $ | (1,064 | ) | | $ | (7,861 | ) |
|
| | | | | | | | |
| | | Three months ended March 31, |
| | | 2019 | | 2018 |
| | | (in thousands) |
| Net cash used in operating activities | | $ | (6,877 | ) | | $ | (3,716 | ) |
| Net cash provided by investing activities | | 3,552 |
| | 2,971 |
|
| Net cash used in financing activities | | (1,953 | ) | | (8,062 | ) |
| Net change in cash and cash equivalents | | $ | (5,278 | ) | | $ | (8,807 | ) |
SixThree Months Ended June 30, 2018March 31, 2019 Compared to SixThree Months Ended June 30, 2017March 31, 2018
Operating Activities
Operating activities provided $9.7used $6.9 million and $30.2$3.7 million of net cash for the sixthree months ended June 30,March 31, 2019 and 2018, and 2017, respectively. TheThis overall $20.5$3.2 milliondecrease increase in net cash provided byused in operating activities for the sixthree months ended June 30, 2018March 31, 2019 compared to 20172018 was due to a decrease in net income after adjustment for non-cash items of approximately $19.6$3.2 million driven by lower revenues resulting primarily from changesthe decrease in our average AUM,AUM. Cash used during the three months ended March 31, 2019 and 2018 is primarily driven by the timing of a decreasemajority of approximately $1.0 million in operating assets and liabilities.our accrued incentive compensation payments occurring during the first quarter of the year.
Investing Activities
Investing activities provided $1.9$3.6 million and used $6.6$3.0 million of net cash for the sixthree months ended June 30,March 31, 2019 and 2018, and 2017, respectively. This change was primarily driven by changes in investing activities of $6.8$3.2 million due to our funding of and timing of activity within our investment securitiessecurities. During the three months ended March 31, 2019, we received approximately $3.7 million, net, from the purchase and by $2.1 million of proceeds received for the sale of a Rainier U.S. mutual fund during the first quarter of 2018.certain short-term investments for cash management purposes. During the sixthree months ended June 30, 2018, total net investment activity received approximately $1.0 million of cash compared to $6.2 million used for the six months ended June 30, 2017. InMarch 31, 2018, we received approximately $1.2$0.1 million of proceeds from the redemption of certain seeded portfolios, partially offset byportfolios. In addition, we received proceeds from the usesale of intangible assets of approximately $0.1 million net,during the three months ended March 31, 2019, compared to purchase short-term investments for cash management purposes.$2.4 million in the same period of 2018. Our purchases of property and equipment werewas approximately $1.3 million and $0.8$0.6 million during the sixthree months ended June 30, 2018 and 2017, respectively.March 31, 2019 compared to $0.3 million in the same period of 2018.
Financing Activities
Financing activities used $12.6$2.0 million and $31.4$8.1 million of net cash for the sixthree months ended June 30,March 31, 2019 and 2018, and 2017, respectively. This overall $18.8$6.1 milliondecrease in net cash used in the six months ended June 30, 2018financing activities was primarily the result of a reduction in distributions to noncontrolling interests of $9.5$3.3 million and dividends paid on Class A common stock of $1.2$0.9 million driven by lower income after adjustment for non-cash items in 20182019 compared to 2017. We2018. The decrease in cash used in financing activities was also driven by a decrease of $1.9 million of cash during the six months ended June 30, 2018used for the purchase of Class A Unitsunits of Manning & Napier Group pursuant to the exchange agreement entered into at the time of our IPO, compared to $9.8 millionIPO. The 2019 exchange closed during 2017. This decreasethe second quarter of $7.9 million2019, whereas the 2018 exchange was completed during the first quarter of cash used was due to a lower exchange price and a lower number of units exchanged in 2018.
Dividends
On October 24, 2017,23, 2018, the Board of Directors declared a $0.08$0.02 per share dividend to the holders of Class A common stock. The dividend was paid on February 1, 20182019 to shareholders of record as of January 15, 2018.2019.
On March 6, 2018,5, 2019, the Board of Directors declared an $0.08a $0.02 per share dividend to the holders of Class A common stock. The dividend was paid on May 1, 20182019 to shareholders of record as of April 13, 2018.15, 2019.
On April 24, 2018,23, 2019, the Board of Directors declared an $0.08 per share dividend to the holders of Class A common stock. The dividend was paid on August 1, 2018 to shareholders of record as of July 13, 2018.
On July 24, 2018, the Board of Directors declared an $0.08a $0.02 per share dividend to the holders of Class A common stock. The dividend is payable on or about NovemberAugust 1, 20182019 to shareholders of record as of OctoberJuly 15, 2018.2019.
We currently intend to payhave historically paid quarterly cash dividends on our Class A common stock. We intend to fundhave funded such dividends and we believe any future dividends would be funded from our portion of distributions made by Manning & Napier Group, from its available cash generated from operations.
The declaration and payment of all future dividends, if any, will be at the sole discretion of our board of directors. In determining the amount of any future dividends, our board of directors will take into account:
the financial results of Manning & Napier Group;
our available cash, as well as anticipated cash requirements, including any debt servicing and payments required under the TRA;tax receivable agreement;
our capital requirements and the capital requirements of our subsidiaries, including Manning & Napier Group;
contractual, legal, tax and regulatory restrictions on, and implications of, the payment of dividends by us to our stockholders or distributions by Manning & Napier Group to us, including the obligation of Manning & Napier Group to make tax distributions to its unitholders, including us;
general economic and business conditions; and
any other factors that our board of directors may deem relevant.
We have no material assets other than our ownership of Class A units of Manning & Napier Group and, accordingly, will depend on distributions from Manning & Napier Group to fund any dividends we may pay. As managing member of Manning & Napier Group, we will determine the timing and amount of any distributions to be paid to its members, other than mandatory tax distributions required under Manning & Napier Group's operating agreement. We intend to cause Manning & Napier Group to distribute cash to its members, including us, in an amount sufficient to cover dividends, if any, declared by us. If we do cause Manning & Napier Group to make such distributions, M&N Group Holdings, MNCC and any other holders of units of Manning & Napier Group will be entitled to receive equivalent distributions on a pari passu basis.
Contractual Obligations
As of December 31, 2017, our contractual obligation for our primary office facility was approximately $14.5 million, or $2.9 million annually, under an operating lease expiring on December 31, 2022. Subsequent to December 31, 2017, we entered into an amended lease agreement for these facilities, expiring on January 31, 2028. As of June 30, 2018, our contractual obligation related to these facilities was approximately $24.9 million, or $2.6 million annually. There have been no other material changes in our contractual obligations as set forth in our Annual Report on Form 10-K for the year ended December 31, 2017.
Off Balance Sheet Arrangements
We did not have any off-balance sheet arrangements as of June 30, 2018March 31, 2019.
Item 3. Quantitative and Qualitative Disclosures About Market Risk
Market Risk
Our exposureAs a "smaller reporting company," we are not required to market risk is directly related to the role of our operating company as an investment advisor for the mutual funds and separate accounts it manages. Substantially all of our revenues are derived from investment management agreements with these funds and accounts. Under these agreements, the investment management fees we receive are based on the value of our AUM and our fee rates. Accordingly, our revenues and net income may decline as a result of our AUM decreasing due to depreciation of our investment portfolios. In addition, such a decline could cause our clients to withdraw their funds in favor of investments offering higher returns or lower risk, which would cause our revenues to decline further.
The value of our AUM was $22.8 billion as of June 30, 2018. Assuming a 10% increase or decrease in the value of our AUM and the change being proportionally distributed over all our products, the value would increase or decrease by approximately $2.3 billion, which would cause an annualized increase or decrease in revenues of approximately $16.2 million at our current weighted average fee rate of 0.71%.
We have not adopted a corporate-level risk management policy regarding client assets, nor have we attempted to hedge at the corporate level the market risks that would affect the value of our overall AUM and related revenues. Some of these risks (e.g., sector risks and currency risks) are inherent in certain strategies, and clients may invest in particular strategies to gain exposure to these risks.
We also are subject to market risk from a decline in the prices of investment securities that we own. These securities consist primarily of equity securities, fixed-income securities, investments in mutual funds, including the Fund for which MNA provides advisory services and short-term investment for cash management purposes. The value of these investments was $69.4 million as of June 30, 2018 of which approximately $4.9 million is investment securities classified as trading and $64.5 million is investment securities classified as available-for-sale. Management regularly monitors the value of these investments; however, given their nature and relative size, we have not adopted a specific risk management policy to manage the associated market risk. Assuming a 10% increase or decrease in the values of these investment securities, the fair value would increase or decrease by approximately $6.9 million at June 30, 2018. Due to the nature of our business, we believe that we do not face any material risk from inflation.
Exchange Rate Risk
A substantial portion of the accounts that we advise, or sub-advise, hold investments that are denominated in currencies other than the U.S. dollar. Movements in the rate of exchange between the U.S. dollar and the underlying foreign currency affect the values of assets held in accounts we manage, thereby affecting the amount of revenues we earn. The value of the assets we manage was $22.8 billion as of June 30, 2018. As of June 30, 2018, approximately 16% of our AUM across our investment strategies was invested in securities denominated in currencies other than the U.S. dollar. To the extent our AUM are denominated in currencies other than the U.S. dollar, the value of those AUM would decrease, with an increase in the value of the U.S. dollar, or increase, with a decrease in the value of the U.S. dollar.
We monitor our exposure to exchange rate risk and make decisions on how to manage such risk accordingly; however, we have not adopted a corporate-level risk management policy to manage exchange rate risk. Assuming that 16% of our AUM is invested in securities denominated in currencies other than the U.S. dollar and excluding the impact of any hedging
arrangements, a 10% increase or decrease in the value of the U.S. dollar would increase or decrease the fair value of our AUM by approximately $0.4 billion, which would cause an annualized increase or decrease in revenues of approximately $2.7 million at our current weighted average fee rate of 0.71%.
Interest Rate Risk
We are exposed to interest-rate risk primarily due to our AUM that is invested in debt securities, as well as corporate assets that are invested in debt securities and short-term investments. Management considered a hypothetical 100 basis point fluctuation in interest rates and estimated the impact of such a fluctuation on these investments. Management determined there was no material impact as of June 30, 2018. Additionally, given the current level of income we earn from our cash and cash equivalent balances and short-term investments, interest rate changes would not have a material impact on us.provide this information.
Item 4. Controls and Procedures
Disclosure Controls and Procedures
Our management, including our Chief Executive OfficersOfficer and Chief Financial Officer, evaluated the effectiveness of our disclosure controls and procedures as of June 30, 2018March 31, 2019 pursuant to Rule 13a-15 under the Exchange Act. Based on that evaluation, our Chief Executive OfficersOfficer and Chief Financial Officer have concluded that, as of June 30, 2018March 31, 2019, our disclosure controls and procedures (as defined in Rule 13a-15(e) under the Exchange Act) were effective to ensure that information we are required to disclose in reports that we file or submit under the Exchange Act is recorded, processed, summarized and reported within the time periods specified in SEC rules and forms, and that such information is accumulated and communicated to our management, including our Chief Executive OfficersOfficer and Chief Financial Officer, as appropriate, to allow timely decisions regarding required disclosures.
Changes in Internal Control Over Financial Reporting
There were no changes in our internal control over financial reporting during the quarter ended June 30, 2018March 31, 2019 that materially affected, or are reasonably likely to materially affect, our internal control over financial reporting.
PART II—OTHER INFORMATION
Item 1A. Risk Factors
We have set forth in Item 1A to our Annual Report on Form 10-K for the year ended December 31, 20172018 risk factors relating to our business, our industry, our structure and our Class A common stock. Readers of this Quarterly Report on Form 10-Q are referred to such Item 1A for a more complete understanding of risks concerning our company. There have been no material changes in our risk factors since those published in such Form 10-K for the year ended December 31, 2017.2018.
Item 6. Exhibits
|
| | |
| Exhibit No. | | Description |
| | |
| | | |
| 10.1 * | | FormEmployment Agreement, dated January 30, 2019, of Redemption Agreement between M&N Group Holdings, LLC and Manning & Napier Group, LLC, dated March 30, 2018Marc Mayer, is incorporated herein by reference to Exhibit 10.110.15 to the Company's CurrentCompany’s Annual Report on Form 8-K,10-K for the fiscal year ended December 31, 2018, filed with the Securities and Exchange Commission on April 2, 2018March 27, 2019. |
| | | |
10.210.2* | | Form of RedemptionRestricted Stock Unit Award Agreement, dated January 30, 2019, by and between Manning & Napier, Capital Company, L.L.C.Inc., and Manning & Napier Group, LLC, dated March 30, 2018Marc Mayer, is incorporated herein by reference to Exhibit 10.210.16 to the Company's CurrentCompany’s Annual Report on Form 8-K,10-K for the fiscal year ended December 31, 2018, filed with the Securities and Exchange Commission on April 2,March 27, 2019. |
| | |
| 10.3* | | |
| | |
| 10.4* | | |
| | | |
31.1 (a) | | |
| | |
31.1 (b) | | |
| | |
31.1 (c) | | |
| | |
| 31.2 | | |
| | |
32.1 (a) | | |
| | |
32.1 (b) | | |
| | |
32.1 (c) | | |
| | |
| 32.2 | | |
| | |
| 101 | | Materials from the Manning & Napier, Inc. Quarterly Report on Form 10-Q for the quarter ended June 30, 2018,March 31, 2019, formatted in Extensible Business Reporting Language (XBRL): (i) Consolidated Statements of Financial Condition, (ii) Consolidated Statements of Operations, (iii) Consolidated Statements of Comprehensive Income, (iv) Consolidated Statement of Shareholders’ Equity, (v) Consolidated Statements of Cash Flows, and (vi) related Notes to the Unaudited Consolidated Financial Statements. |
________________________
| |
| (*) | Management contract or compensatory plan or arrangement |
SIGNATURES
Pursuant to the requirements of the Securities Exchange Act of 1934, the registrant has duly caused this report to be signed on its behalf by the undersigned thereunto duly authorized.
Dated: August 9, 2018
|
| | | | |
| | MANNING & NAPIER, INC. |
| | | |
| Dated: May 14, 2019 | | By: | | /s/ Jeffrey S. Coons |
| | Name: | Jeffrey S. Coons |
| | Title: | President and Co-Chief Executive Officer
(principal executive officer)
Marc Mayer |
| | | | |
| By: | /s/ Charles H. Stamey |
| | Name: | Charles H. Stamey |
| | Title: | Executive Vice President and Co-Chief Executive Officer
(principal executive officer)
Marc Mayer |
| | | | |
| By: | /s/ Richard Goldberg |
| | Name: | Richard Goldberg |
| | Title: | Director and Co-ChiefChief Executive Officer
(principal executive officer)
|
| | | | | (principal executive officer) |
| | By: | |
| | | | /s/ Paul J. Battaglia |
| | | Name: | | Paul J. Battaglia |
| | | Title: | | Chief Financial Officer |
| | | | (principal financial and accounting officer) |