UNITED STATES
SECURITIES AND EXCHANGE COMMISSION
Washington, D.C. 20549
_____________________________________________
FORM 10-Q
____________________________________________
| | | | | |
| (Mark One) |
| ☒ | QUARTERLY REPORT PURSUANT TO SECTION 13 OR 15(d) OF THE SECURITIES EXCHANGE ACT OF 1934 |
For the quarterly period ended March 31, 20212022
OR
| | | | | |
| ☐ | TRANSITION REPORT PURSUANT TO SECTION 13 OR 15(d) OF THE SECURITIES EXCHANGE ACT OF 1934 |
For the transition period from to
Commission file number 001-35714
_____________________________________________
MPLX LP
(Exact name of registrant as specified in its charter)
_____________________________________________
| | | | | | | | | | | | | | | | | | | | |
| Delaware | | | 27-0005456 |
(State or other jurisdiction of
incorporation or organization) | | (I.R.S. Employer
Identification No.) |
| | | | | | | | | | | | | | | | | |
| 200 E. Hardin Street, | Findlay, | Ohio | | 45840 | |
| (Address of principal executive offices) | | (Zip code) | |
(419) 421-2414
(Registrant’s telephone number, including area code)
_____________________________________________
| | | | | | | | |
| Securities Registered pursuant to Section 12(b) of the Act |
| Title of each class | Trading symbol(s) | Name of each exchange on which registered |
| Common Units Representing Limited Partnership Interests | MPLX | New York Stock Exchange |
Indicate by check mark whether the registrant (1) has filed all reports required to be filed by Section 13 or 15(d) of the Securities Exchange Act of 1934 during the preceding 12 months (or for such shorter period that the registrant was required to file such reports), and (2) has been subject to such filing requirements for the past 90 days. Yes x No ¨
Indicate by check mark whether the registrant has submitted electronically every Interactive Data File required to be submitted pursuant to Rule 405 of Regulation S-T (§232.405 of this chapter) during the preceding 12 months (or for such shorter period that the registrant was required to submit such files.) Yes x No ¨
Indicate by check mark whether the registrant is a large accelerated filer, an accelerated filer, a non-accelerated filer, a smaller reporting company, or an emerging growth company. See the definitions of “large accelerated filer,” “accelerated filer,” “smaller reporting company,” and “emerging growth company” in Rule 12b-2 of the Exchange Act.
| | | | | | | | | | | |
| Large accelerated filer | x | Accelerated filer | ☐ |
| Non-accelerated filer | ☐ | Smaller reporting company | ☐ |
| | Emerging growth company | ☐ |
If an emerging growth company, indicate by check mark if the registrant has elected not to use the extended transition period for complying with any new or revised financial accounting standards provided pursuant to Section 13(a) of the Exchange Act. ¨
Indicate by check mark whether the registrant is a shell company (as defined in Rule 12b-2 of the Exchange Act) Yes ☐ No x
MPLX LP had 1,029,527,0521,012,303,833 common units outstanding at April 30, 2021.29, 2022.
Table of Contents
Unless the context otherwise requires, references in this report to “MPLX LP,” “MPLX,” “the Partnership,” “we,” “our,” “us,” or like terms refer to MPLX LP and its subsidiaries. Additionally, throughout this Quarterly Report on Form 10-Q, we have used terms in our discussion of the business and operating results that have been defined in our Glossary of Terms.
Glossary of Terms
The abbreviations, acronyms and industry technology used in this report are defined as follows. | | | | | |
| |
| ASC | Accounting Standards Codification |
| ASU | Accounting Standards Update |
| |
| Barrel | One stock tank barrel, or 42 United StatesU.S. gallons of liquid volume, used in reference to crude oil or other liquid hydrocarbons |
| |
Bcf/d | One billion cubic feet per day |
| Btu | One British thermal unit, an energy measurement |
Condensate | A natural gas liquid with a low vapor pressure mainly composed of propane, butane, pentane and heavier hydrocarbon fractions |
| DCF (a non-GAAP financial measure) | Distributable Cash Flow |
| |
| EBITDA (a non-GAAP financial measure) | Earnings Before Interest, Taxes, Depreciation and Amortization |
| |
| |
FASB | Financial Accounting Standards Board |
| GAAP | Accounting principles generally accepted in the United States of America |
| |
| |
| |
| |
| G&P | Gathering and Processing segment |
| LIBOR | London Interbank Offered Rate |
| L&S | Logistics and Storage segment |
| mbpd | Thousand barrels per day |
Merger | MPLX acquisition by merger of Andeavor Logistics LP (“ANDX”) on July 30, 2019 |
| MMBtu | One million British thermal units, an energy measurement |
| MMcf/d | One million cubic feet of natural gas per day |
| NGL | Natural gas liquids, such as ethane, propane, butanes and natural gasoline |
NYSE | New York Stock Exchange |
| |
| |
| |
| |
Realized derivative gain/loss | The gain or loss recognized when a derivative matures or is settled |
| SEC | United StatesU.S. Securities and Exchange Commission |
Unrealized derivative gain/loss | The gain or loss recognized on a derivative due to changes in fair value prior to the instrument maturing or settling |
| VIE | Variable interest entity |
Wholesale Exchange | The transfer to MPC of the Western wholesale distribution business, which MPLX acquired as a result of its acquisition of ANDX, on July 31, 2020. |
| |
Part I—Financial Information
Item 1. Financial Statements
MPLX LP
Consolidated Statements of Income (Unaudited) | | | Three Months Ended
March 31, | | | Three Months Ended March 31, | |
| (In millions, except per unit data) | (In millions, except per unit data) | 2021 | | 2020 | | (In millions, except per unit data) | 2022 | | 2021 | |
| Revenues and other income: | Revenues and other income: | | | | | Revenues and other income: | | | | |
| Service revenue | Service revenue | $ | 589 | | | $ | 612 | | | Service revenue | $ | 554 | | | $ | 589 | | |
| Service revenue - related parties | Service revenue - related parties | 872 | | | 928 | | | Service revenue - related parties | 915 | | | 872 | | |
| Service revenue - product related | Service revenue - product related | 77 | | | 39 | | | Service revenue - product related | 123 | | | 77 | | |
| Rental income | Rental income | 99 | | | 96 | | | Rental income | 91 | | | 99 | | |
| Rental income - related parties | Rental income - related parties | 242 | | | 234 | | | Rental income - related parties | 165 | | | 242 | | |
| Product sales | Product sales | 282 | | | 169 | | | Product sales | 497 | | | 282 | | |
| Product sales - related parties | Product sales - related parties | 42 | | | 33 | | | Product sales - related parties | 45 | | | 42 | | |
| Income/(loss) from equity method investments(1) | 70 | | | (1,184) | | | |
| Other income | 1 | | | 1 | | | |
| Sales-type lease revenue - related parties | | Sales-type lease revenue - related parties | 111 | | | 37 | | |
| Income from equity method investments | | Income from equity method investments | 99 | | | 70 | | |
| Other income (loss) | | Other income (loss) | (17) | | | 1 | | |
| Other income - related parties | Other income - related parties | 65 | | | 64 | | | Other income - related parties | 27 | | | 28 | | |
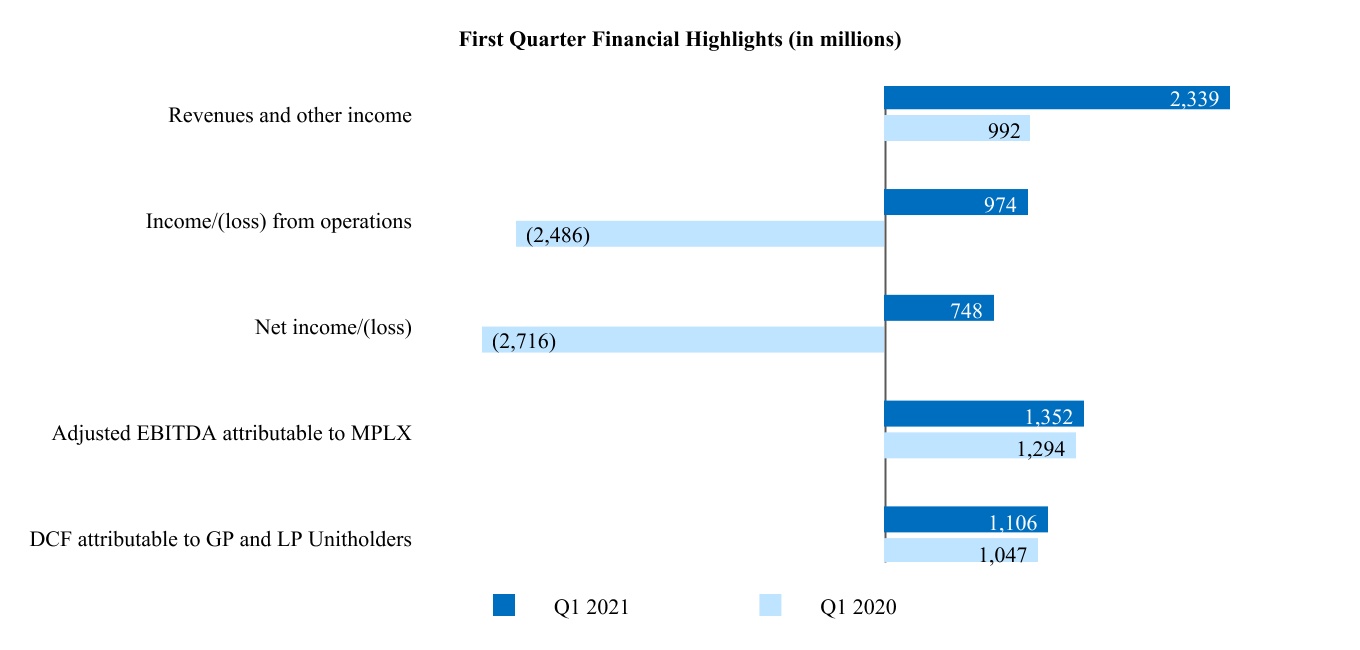
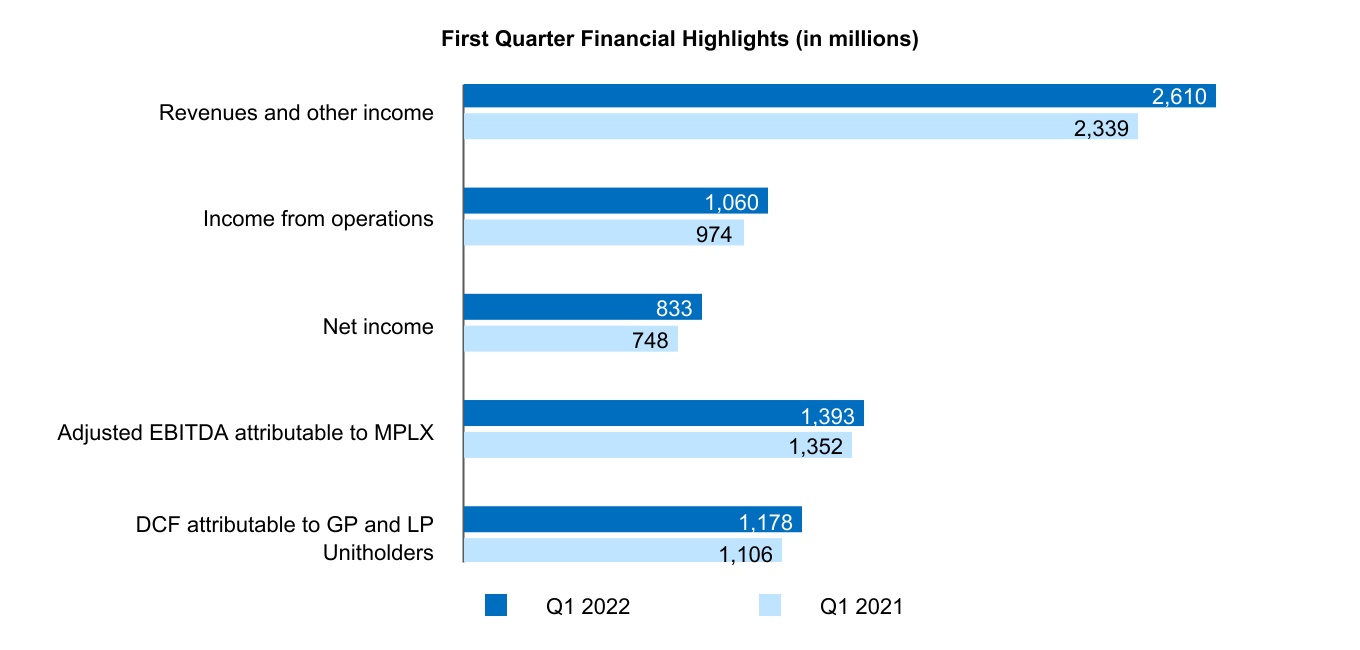
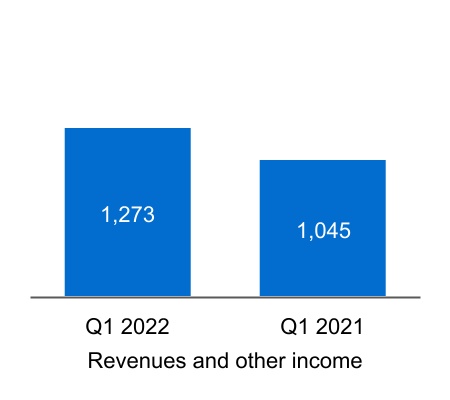
| Total revenues and other income | Total revenues and other income | 2,339 | | | 992 | | | Total revenues and other income | 2,610 | | | 2,339 | | |
| Costs and expenses: | Costs and expenses: | | | | | Costs and expenses: | | | | |
| Cost of revenues (excludes items below) | Cost of revenues (excludes items below) | 273 | | | 368 | | | Cost of revenues (excludes items below) | 287 | | | 273 | | |
| Purchased product costs | Purchased product costs | 276 | | | 135 | | | Purchased product costs | 467 | | | 276 | | |
| Rental cost of sales | Rental cost of sales | 32 | | | 35 | | | Rental cost of sales | 37 | | | 32 | | |
| Rental cost of sales - related parties | Rental cost of sales - related parties | 39 | | | 46 | | | Rental cost of sales - related parties | 15 | | | 39 | | |
| Purchases - related parties | Purchases - related parties | 298 | | | 276 | | | Purchases - related parties | 319 | | | 298 | | |
| Depreciation and amortization | Depreciation and amortization | 329 | | | 325 | | | Depreciation and amortization | 313 | | | 329 | | |
| Impairment expense | 0 | | | 2,165 | | | |
| | General and administrative expenses | General and administrative expenses | 86 | | | 97 | | | General and administrative expenses | 78 | | | 86 | | |
| | Other taxes | Other taxes | 32 | | | 31 | | | Other taxes | 34 | | | 32 | | |
| Total costs and expenses | Total costs and expenses | 1,365 | | | 3,478 | | | Total costs and expenses | 1,550 | | | 1,365 | | |
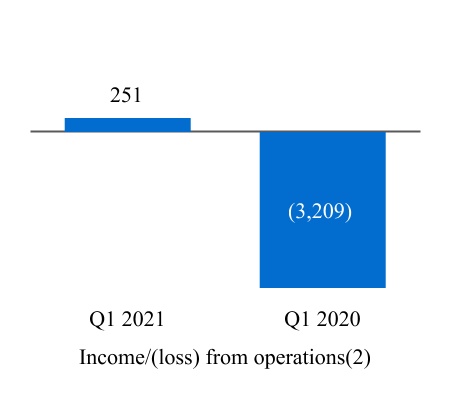
| Income/(loss) from operations | 974 | | | (2,486) | | | |
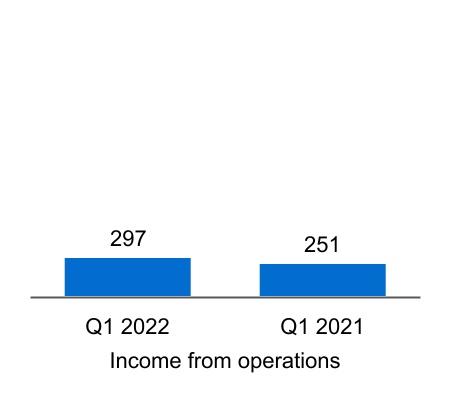
| Income from operations | | Income from operations | 1,060 | | | 974 | | |
| Related party interest and other financial costs | Related party interest and other financial costs | 0 | | | 3 | | | Related party interest and other financial costs | 4 | | | — | | |
| Interest expense (net of amounts capitalized of $5 million, $13 million, respectively) | 198 | | | 211 | | | |
| Interest expense (net of amounts capitalized of $2 million, $5 million, respectively) | | Interest expense (net of amounts capitalized of $2 million, $5 million, respectively) | 198 | | | 198 | | |
| Other financial costs | Other financial costs | 27 | | | 16 | | | Other financial costs | 20 | | | 27 | | |
| Income/(loss) before income taxes | 749 | | | (2,716) | | | |
| Income before income taxes | | Income before income taxes | 838 | | | 749 | | |
| Provision for income taxes | Provision for income taxes | 1 | | | 0 | | | Provision for income taxes | 5 | | | 1 | | |
| Net income/(loss) | 748 | | | (2,716) | | | |
| Net income | | Net income | 833 | | | 748 | | |
| Less: Net income attributable to noncontrolling interests | Less: Net income attributable to noncontrolling interests | 9 | | | 8 | | | Less: Net income attributable to noncontrolling interests | 8 | | | 9 | | |
| | Net income/(loss) attributable to MPLX LP | 739 | | | (2,724) | | | |
| Less: Series A preferred unit distributions | 20 | | | 20 | | | |
| Less: Series B preferred unit distributions | 11 | | | 11 | | | |
| Net income attributable to MPLX LP | | Net income attributable to MPLX LP | 825 | | | 739 | | |
| Less: Series A preferred unitholders interest in net income | | Less: Series A preferred unitholders interest in net income | 21 | | | 20 | | |
| Less: Series B preferred unitholders interest in net income | | Less: Series B preferred unitholders interest in net income | 11 | | | 11 | | |
| | Limited partners’ interest in net income/(loss) attributable to MPLX LP | $ | 708 | | | $ | (2,755) | | | |
| Limited partners’ interest in net income attributable to MPLX LP | | Limited partners’ interest in net income attributable to MPLX LP | $ | 793 | | | $ | 708 | | |
| Per Unit Data (See Note 6) | Per Unit Data (See Note 6) | | | | | Per Unit Data (See Note 6) | | | | |
| Net income/(loss) attributable to MPLX LP per limited partner unit: | | | |
| Net income attributable to MPLX LP per limited partner unit: | | Net income attributable to MPLX LP per limited partner unit: | | |
| Common - basic | Common - basic | $ | 0.68 | | | $ | (2.60) | | | Common - basic | $ | 0.78 | | | $ | 0.68 | | |
| Common - diluted | Common - diluted | $ | 0.68 | | | $ | (2.60) | | | Common - diluted | $ | 0.78 | | | $ | 0.68 | | |
| Weighted average limited partner units outstanding: | Weighted average limited partner units outstanding: | | | Weighted average limited partner units outstanding: | | |
| Common - basic | Common - basic | 1,037 | | | 1,058 | | | Common - basic | 1,015 | | | 1,037 | | |
| Common - diluted | Common - diluted | 1,037 | | | 1,058 | | | Common - diluted | 1,015 | | | 1,037 | | |
|
(1) The 2020 period includes $1,264 million of impairment expense. See Note 4.
The accompanying notes are an integral part of these consolidated financial statements.
MPLX LP
Consolidated Statements of Comprehensive Income (Unaudited)
| | | Three Months Ended
March 31, | | | Three Months Ended March 31, | |
| (In millions) | (In millions) | 2021 | | 2020 | | (In millions) | 2022 | | 2021 | |
| Net income/(loss) | $ | 748 | | | $ | (2,716) | | | |
| Other comprehensive income/(loss), net of tax: | | | |
| Net income | | Net income | $ | 833 | | | $ | 748 | | |
| Other comprehensive income, net of tax: | | Other comprehensive income, net of tax: | | |
| Remeasurements of pension and other postretirement benefits related to equity method investments, net of tax | Remeasurements of pension and other postretirement benefits related to equity method investments, net of tax | (2) | | | (1) | | | Remeasurements of pension and other postretirement benefits related to equity method investments, net of tax | 9 | | | (2) | | |
| Comprehensive income/(loss) | 746 | | | (2,717) | | | |
| Comprehensive income | | Comprehensive income | 842 | | | 746 | | |
| Less comprehensive income attributable to: | Less comprehensive income attributable to: | | | Less comprehensive income attributable to: | | |
| Noncontrolling interests | Noncontrolling interests | 9 | | | 8 | | | Noncontrolling interests | 8 | | | 9 | | |
| | Comprehensive income/(loss) attributable to MPLX LP | $ | 737 | | | $ | (2,725) | | | |
| Comprehensive income attributable to MPLX LP | | Comprehensive income attributable to MPLX LP | $ | 834 | | | $ | 737 | | |
The accompanying notes are an integral part of these consolidated financial statements.
MPLX LP
Consolidated Balance Sheets (Unaudited)
| | (In millions) | (In millions) | March 31, 2021 | | December 31, 2020 | (In millions) | March 31, 2022 | | December 31, 2021 |
| Assets | Assets | | | | Assets | | | |
| Current assets: | Current assets: | | Current assets: | |
| Cash and cash equivalents | Cash and cash equivalents | $ | 24 | | | $ | 15 | | Cash and cash equivalents | $ | 42 | | | $ | 13 | |
| | Receivables, net | Receivables, net | 523 | | | 452 | | Receivables, net | 741 | | | 654 | |
| Current assets - related parties | Current assets - related parties | 650 | | | 677 | | Current assets - related parties | 813 | | | 644 | |
| Inventories | Inventories | 128 | | | 118 | | Inventories | 149 | | | 142 | |
| Assets held for sale | 0 | | | 188 | | |
| | Other current assets | Other current assets | 49 | | | 65 | | Other current assets | 53 | | | 54 | |
| Total current assets | Total current assets | 1,374 | | | 1,515 | | Total current assets | 1,798 | | | 1,507 | |
| Equity method investments | Equity method investments | 4,040 | | | 4,036 | | Equity method investments | 4,079 | | | 3,981 | |
| Property, plant and equipment, net | Property, plant and equipment, net | 20,996 | | | 21,218 | | Property, plant and equipment, net | 19,912 | | | 20,042 | |
| Intangibles, net | Intangibles, net | 927 | | | 959 | | Intangibles, net | 800 | | | 831 | |
| Goodwill | Goodwill | 7,657 | | | 7,657 | | Goodwill | 7,657 | | | 7,657 | |
| Right of use assets, net | Right of use assets, net | 296 | | | 309 | | Right of use assets, net | 280 | | | 268 | |
| Noncurrent assets - related parties | Noncurrent assets - related parties | 676 | | | 672 | | Noncurrent assets - related parties | 1,151 | | | 1,161 | |
| Other noncurrent assets | Other noncurrent assets | 64 | | | 48 | | Other noncurrent assets | 50 | | | 60 | |
| Total assets | Total assets | 36,030 | | | 36,414 | | Total assets | 35,727 | | | 35,507 | |
| Liabilities | Liabilities | | | | Liabilities | | | |
| Current liabilities: | Current liabilities: | | Current liabilities: | |
| Accounts payable | Accounts payable | 162 | | | 152 | | Accounts payable | 214 | | | 172 | |
| Accrued liabilities | Accrued liabilities | 233 | | | 194 | | Accrued liabilities | 396 | | | 363 | |
| | Current liabilities - related parties | Current liabilities - related parties | 338 | | | 356 | | Current liabilities - related parties | 687 | | | 1,780 | |
| Accrued property, plant and equipment | Accrued property, plant and equipment | 58 | | | 84 | | Accrued property, plant and equipment | 91 | | | 97 | |
| | Long-term debt due within one year | Long-term debt due within one year | 2 | | | 764 | | Long-term debt due within one year | 999 | | | 499 | |
| Accrued interest payable | Accrued interest payable | 189 | | | 222 | | Accrued interest payable | 192 | | | 202 | |
| Operating lease liabilities | Operating lease liabilities | 63 | | | 63 | | Operating lease liabilities | 47 | | | 59 | |
| Liabilities held for sale | 0 | | | 101 | | |
| | Other current liabilities | Other current liabilities | 151 | | | 150 | | Other current liabilities | 232 | | | 176 | |
| Total current liabilities | Total current liabilities | 1,196 | | | 2,086 | | Total current liabilities | 2,858 | | | 3,348 | |
| Long-term deferred revenue | Long-term deferred revenue | 332 | | | 314 | | Long-term deferred revenue | 405 | | | 383 | |
| Long-term liabilities - related parties | Long-term liabilities - related parties | 279 | | | 283 | | Long-term liabilities - related parties | 305 | | | 302 | |
| Long-term debt | Long-term debt | 20,052 | | | 19,375 | | Long-term debt | 18,757 | | | 18,072 | |
| Deferred income taxes | Deferred income taxes | 11 | | | 12 | | Deferred income taxes | 14 | | | 10 | |
| Long-term operating lease liabilities | Long-term operating lease liabilities | 230 | | | 244 | | Long-term operating lease liabilities | 228 | | | 205 | |
| Deferred credits and other liabilities | Deferred credits and other liabilities | 112 | | | 115 | | Deferred credits and other liabilities | 159 | | | 170 | |
| Total liabilities | Total liabilities | 22,212 | | | 22,429 | | Total liabilities | 22,726 | | | 22,490 | |
| Commitments and contingencies (see Note 21) | 0 | | 0 | |
| Series A preferred units | 968 | | | 968 | | |
| Commitments and contingencies (see Note 14) | | Commitments and contingencies (see Note 14) | 0 | | 0 |
| Series A preferred units (30 million and 30 million units issued and outstanding) | | Series A preferred units (30 million and 30 million units issued and outstanding) | 965 | | | 965 | |
| Equity | Equity | | Equity | |
| Common unitholders - public (385 million and 391 million units issued and outstanding) | 9,226 | | | 9,384 | | |
| Common unitholders - public (366 million and 369 million units issued and outstanding) | | Common unitholders - public (366 million and 369 million units issued and outstanding) | 8,505 | | | 8,579 | |
| | Common unitholders - MPC (647 million and 647 million units issued and outstanding) | Common unitholders - MPC (647 million and 647 million units issued and outstanding) | 2,796 | | | 2,792 | | Common unitholders - MPC (647 million and 647 million units issued and outstanding) | 2,698 | | | 2,638 | |
| | Series B preferred units (.6 million and .6 million units issued and outstanding) | 601 | | | 611 | | |
| Series B preferred units (0.6 million and 0.6 million units issued and outstanding) | | Series B preferred units (0.6 million and 0.6 million units issued and outstanding) | 601 | | | 611 | |
| | Accumulated other comprehensive loss | Accumulated other comprehensive loss | (17) | | | (15) | | Accumulated other comprehensive loss | (8) | | | (17) | |
| Total MPLX LP partners’ capital | Total MPLX LP partners’ capital | 12,606 | | | 12,772 | | Total MPLX LP partners’ capital | 11,796 | | | 11,811 | |
| Noncontrolling interests | Noncontrolling interests | 244 | | | 245 | | Noncontrolling interests | 240 | | | 241 | |
| Total equity | Total equity | 12,850 | | | 13,017 | | Total equity | 12,036 | | | 12,052 | |
| Total liabilities, preferred units and equity | Total liabilities, preferred units and equity | $ | 36,030 | | | $ | 36,414 | | Total liabilities, preferred units and equity | $ | 35,727 | | | $ | 35,507 | |
The accompanying notes are an integral part of these consolidated financial statements.
MPLX LP
Consolidated Statements of Cash Flows (Unaudited) | | | Three Months Ended
March 31, | | Three Months Ended March 31, |
| (In millions) | (In millions) | 2021 | | 2020 | (In millions) | 2022 | | 2021 |
| Increase/(decrease) in cash, cash equivalents and restricted cash | | | | |
| Operating activities: | Operating activities: | | Operating activities: | | | |
| Net income/(loss) | $ | 748 | | | $ | (2,716) | | |
| Adjustments to reconcile net income/(loss) to net cash provided by operating activities: | | |
| Net income | | Net income | $ | 833 | | | $ | 748 | |
| Adjustments to reconcile net income to net cash provided by operating activities: | | Adjustments to reconcile net income to net cash provided by operating activities: | |
| Amortization of deferred financing costs | Amortization of deferred financing costs | 17 | | | 14 | | Amortization of deferred financing costs | 18 | | | 17 | |
| Depreciation and amortization | Depreciation and amortization | 329 | | | 325 | | Depreciation and amortization | 313 | | | 329 | |
| Impairment expense | 0 | | | 2,165 | | |
| | Deferred income taxes | | Deferred income taxes | 4 | | | — | |
| (Income)/loss from equity method investments(1) | (70) | | | 1,184 | | |
| Loss on disposal of assets | | Loss on disposal of assets | 18 | | | — | |
| Income from equity method investments | | Income from equity method investments | (99) | | | (70) | |
| Distributions from unconsolidated affiliates | Distributions from unconsolidated affiliates | 119 | | | 119 | | Distributions from unconsolidated affiliates | 120 | | | 119 | |
| Change in fair value of derivatives | | Change in fair value of derivatives | (9) | | | 3 | |
| Changes in: | Changes in: | | Changes in: | |
| Current receivables | Current receivables | (67) | | | 71 | | Current receivables | (87) | | | (67) | |
| Inventories | Inventories | (11) | | | 3 | | Inventories | (7) | | | (11) | |
| Fair value of derivatives | 3 | | | (15) | | |
| Current accounts payable and accrued liabilities | Current accounts payable and accrued liabilities | 26 | | | (142) | | Current accounts payable and accrued liabilities | 73 | | | 26 | |
| Current assets/current liabilities - related parties | Current assets/current liabilities - related parties | (8) | | | (52) | | Current assets/current liabilities - related parties | (112) | | | (8) | |
| | Right of use assets/operating lease liabilities | Right of use assets/operating lease liabilities | (1) | | | (4) | | Right of use assets/operating lease liabilities | (1) | | | (1) | |
| Deferred revenue | Deferred revenue | 24 | | | 27 | | Deferred revenue | 16 | | | 24 | |
| All other, net | All other, net | 15 | | | 30 | | All other, net | 45 | | | 15 | |
| Net cash provided by operating activities | Net cash provided by operating activities | 1,124 | | | 1,009 | | Net cash provided by operating activities | 1,125 | | | 1,124 | |
| Investing activities: | Investing activities: | | | | Investing activities: | | | |
| Additions to property, plant and equipment | Additions to property, plant and equipment | (126) | | | (379) | | Additions to property, plant and equipment | (169) | | | (126) | |
| | Disposal of assets | Disposal of assets | 70 | | | 39 | | Disposal of assets | 3 | | | 70 | |
| | Investments in unconsolidated affiliates | Investments in unconsolidated affiliates | (35) | | | (91) | | Investments in unconsolidated affiliates | (110) | | | (35) | |
| | Distributions from unconsolidated affiliates - return of capital | 0 | | | 69 | | |
| | All other, net | All other, net | 1 | | | 0 | | All other, net | — | | | 1 | |
| Net cash used in investing activities | Net cash used in investing activities | (90) | | | (362) | | Net cash used in investing activities | (276) | | | (90) | |
| Financing activities: | Financing activities: | | | | Financing activities: | | | |
| Long-term debt - borrowings | Long-term debt - borrowings | 1,910 | | | 1,325 | | Long-term debt - borrowings | 2,385 | | | 1,910 | |
| - repayments | - repayments | (2,020) | | | (581) | | - repayments | (1,201) | | | (2,020) | |
| Related party debt - borrowings | Related party debt - borrowings | 2,241 | | | 1,667 | | Related party debt - borrowings | 1,849 | | | 2,241 | |
| - repayments | - repayments | (2,241) | | | (2,261) | | - repayments | (2,976) | | | (2,241) | |
| | Debt issuance costs | | Debt issuance costs | (16) | | | — | |
| | Unit repurchases | Unit repurchases | (155) | | | 0 | | Unit repurchases | (100) | | | (155) | |
| | Distributions to noncontrolling interests | Distributions to noncontrolling interests | (10) | | | (9) | | Distributions to noncontrolling interests | (9) | | | (10) | |
| Distributions to Series A preferred unitholders | Distributions to Series A preferred unitholders | (20) | | | (20) | | Distributions to Series A preferred unitholders | (21) | | | (20) | |
| Distributions to Series B preferred unitholders | Distributions to Series B preferred unitholders | (21) | | | (21) | | Distributions to Series B preferred unitholders | (21) | | | (21) | |
| Distributions to unitholders and general partner | Distributions to unitholders and general partner | (713) | | | (717) | | Distributions to unitholders and general partner | (716) | | | (713) | |
| | Contributions from MPC | Contributions from MPC | 7 | | | 14 | | Contributions from MPC | 10 | | | 7 | |
| | All other, net | All other, net | (3) | | | (2) | | All other, net | (4) | | | (3) | |
| Net cash used in financing activities | Net cash used in financing activities | (1,025) | | | (605) | | Net cash used in financing activities | (820) | | | (1,025) | |
| Net increase in cash, cash equivalents and restricted cash | Net increase in cash, cash equivalents and restricted cash | 9 | | | 42 | | Net increase in cash, cash equivalents and restricted cash | 29 | | | 9 | |
| Cash, cash equivalents and restricted cash at beginning of period | Cash, cash equivalents and restricted cash at beginning of period | 15 | | | 15 | | Cash, cash equivalents and restricted cash at beginning of period | 13 | | | 15 | |
| Cash, cash equivalents and restricted cash at end of period | Cash, cash equivalents and restricted cash at end of period | $ | 24 | | | $ | 57 | | Cash, cash equivalents and restricted cash at end of period | $ | 42 | | | $ | 24 | |
(1) The 2020 period includes $1,264 million of impairment expense. See Note 4.
The accompanying notes are an integral part of these consolidated financial statements.
MPLX LP
Consolidated Statements of Equity and Series A Preferred Units (Unaudited)
| | | | | | | | | | | | | | | | | | | | | | | | | | | | | | | | | | | | | |
| | Partnership | | | | | | | | |
| (In millions) | Common
Unit-holders
Public | | Common
Unit-holder
MPC | | Series B Preferred Unit-holders | | Accumulated Other Comprehensive Loss | | Non-controlling
Interests | | | | Total |
| | | | | | | | | | | | | |
| | | | | | | | | | | | | |
| | | | | | | | | | | | | |
| | | | | | | | | | | | | |
| | | | | | | | | | | | | |
| | | | | | | | | | | | | |
| | | | | | | | | | | | | |
| | | | | | | | | | | | | |
| | | | | | | | | | | | | |
| | | | | | | | | | | | | |
| | | | | | | | | | | | | |
| | | | | | | | | | | | | |
| | | | | | | | | | | | | |
| | | | | | | | | | | | | |
| | | | | | | | | | | | | |
| | | | | | | | | | | | | |
| | | | | | | | | | | | | |
| | | | | | | | | | | | | |
| | | | | | | | | | | | | |
| | | | | | | | | | | | | |
| | | | | | | | | | | | | |
| | | | | | | | | | | | | |
| | | | | | | | | | | | | |
| | | | | | | | | | | | | |
| | | | | | | | | | | | | |
| | | | | | | | | | | | | |
| | | | | | | | | | | | | |
| | | | | | | | | | | | | |
| | | | | | | | | | | | | |
| | | | | | | | | | | | | |
| | | | | | | | | | | | | |
| | | | | | | | | | | | | |
| | | | | | | | | | | | | |
| | | | | | | | | | | | | |
| | | | | | | | | | | | | |
| | | | | | | | | | | | | |
| | | | | | | | | | | | | |
| | | | | | | | | | | | | |
| | | | | | | | | | | | | |
| | | | | | | | | | | | | |
| | | | | | | | | | | | | |
| | | | | | | | | | | | | |
| | | | | | | | | | | | | |
| | | | | | | | | | | | | |
|
|
| Balance at December 31, 2019 | $ | 10,800 | | | $ | 4,968 | | | $ | 611 | | | $ | (15) | | | $ | 249 | | | | | $ | 16,613 | |
| Net (loss)/income (excludes amounts attributable to preferred units) | (1,022) | | | (1,733) | | | 11 | | | 0 | | | 8 | | | | | (2,736) | |
| Distributions to: | | | | | | | | | | | | | |
| Unitholders | (271) | | | (446) | | | (21) | | | 0 | | | 0 | | | | | (738) | |
| Noncontrolling interests | 0 | | | 0 | | | 0 | | | 0 | | | (9) | | | | | (9) | |
| Contributions from: | | | | | | | | | | | | | |
| MPC | 0 | | | 225 | | | 0 | | | 0 | | | 0 | | | | | 225 | |
| | | | | | | | | | | | | |
| Other | 2 | | | 0 | | | 0 | | | (1) | | | 0 | | | | | 1 | |
| Balance at March 31, 2020 | 9,509 | | | 3,014 | | | 601 | | | (16) | | | 248 | | | | | 13,356 | |
| | | | | | | | | | | | | |
| | | | | | | | | | | | | |
| | | | | | | | | | | | | |
| | | | | | | | | | | | | |
| | | | | | | | | | | | | |
| | | | | | | | | | | | | |
| | | | | | | | | | | | | |
| | | | | | | | | | | | | |
| | | | | | | | | | | | | |
| | | | | | | | | | | | | |
| | | | | | | | | | | | | |
| | | | | | | | | | | | | |
| | | | | | | | | | | | | |
| | | | | | | | | | | | | |
| | | | | | | | | | | | | |
| | | | | | | | | | | | | |
| | | | | | | | | | | | | |
| | | | | | | | | | | | | |
| | | | | | | | | | | | | |
| | | | | | | | | | | | | |
| | | | | | | | | | | | | |
| | | | | | | | | | | | | |
| | | | | | | | | | | | | |
| | | | | | | | | | | | | |
| | | | | | | | | | | | | |
| | | | | | | | | | | | | |
| | | | | | | | | | | | | |
| | | | | | | | | | | | | |
| | | | | | | | | | | | | |
| | | | | | | | | | | | | |
| | | | | | | | | | | | | |
| | | | | | | | | | | | | |
|
|
| Balance at December 31, 2020 | 9,384 | | | 2,792 | | | 611 | | | (15) | | | 245 | | | | | 13,017 | |
| | | | | | | | | | | | | |
| Net income (excludes amounts attributable to preferred units) | 266 | | | 443 | | | 11 | | | 0 | | | 9 | | | | | 729 | |
| Unit Repurchases | (155) | | | 0 | | | 0 | | | 0 | | | 0 | | | | | (155) | |
| | | | | | | | | | | | | |
| Distributions to: | | | | | | | | | | | | | |
| | | | | | | | | | | | | |
| Unitholders | (269) | | | (445) | | | (21) | | | 0 | | | 0 | | | | | (735) | |
| Noncontrolling interests | 0 | | | 0 | | | 0 | | | 0 | | | (10) | | | | | (10) | |
| Contributions from: | | | | | | | | | | | | | |
| MPC | 0 | | | 7 | | | 0 | | | 0 | | | 0 | | | | | 7 | |
| | | | | | | | | | | | | |
| | | | | | | | | | | | | |
| Other | 0 | | | (1) | | | 0 | | | (2) | | | 0 | | | | | (3) | |
| | | | | | | | | | | | | |
| | | | | | | | | | | | | |
| | | | | | | | | | | | | |
| | | | | | | | | | | | | |
| | | | | | | | | | | | | |
| | | | | | | | | | | | | |
| | | | | | | | | | | | | |
| Balance at March 31, 2021 | $ | 9,226 | | | $ | 2,796 | | | $ | 601 | | | $ | (17) | | | $ | 244 | | | | | $ | 12,850 | |
| | | | | | | | | | | | | |
| | | | | | | | | | | | | |
| | | | | | | | | | | | | |
| | | | | | | | | | | | | |
| | | | | | | | | | | | | |
| | | | | | | | | | | | | |
| | | | | | | | | | | | | |
| | | | | | | | | | | | | |
| | | | | | | | | | | | | |
| | | | | | | | | | | | | |
| | | | | | | | | | | | | |
| | | | | | | | | | | | | |
| | | | | | | | | | | | | |
| | | | | | | | | | | | | |
| | | | | | | | | | | | | |
| | | | | | | | | | | | | |
| | | | | | | | | | | | | |
| | | | | | | | | | | | | |
| | | | | | | | | | | | | |
| | | | | | | | | | | | | |
| | | | | | | | | | | | | |
| | | | | | | | | | | | | |
| | | | | | | | | | | | | |
| | | | | | | | | | | | | |
| | | | | | | | | | | | | |
| | | | | | | | | | | | | |
| | | | | | | | | | | | | |
| | | | | | | | | | | | | |
| | | | | | | | | | | | | |
| | | | | | | | | | | | | |
| | | | | | | | | | | | | |
| | | | | | | | | | | | | |
| | | | | | | | | | | | | |
| | | | | | | | | | | | | |
| | | | | | | | | | | | | |
| | | | | | | | | | | | | |
| | | | | | | | | | | | | |
| | | | | | | | | | | | | |
| | | | | | | | | | | | | |
| | | | | | | | | | | | | |
| | | | | | | | | | | | | |
| | | | | | | | | | | | | |
| | | | | | | | | | | | | | | | | | | | | | | | | | | | | | | | | | | | | | | | | | | | | | |
| | Partnership | | | | | | | | | | | |
| (In millions) | Common
Unit-holders
Public | | Common
Unit-holder
MPC | | Series B Preferred Unit-holders | | Accumulated Other Comprehensive Loss | | Non-controlling
Interests | | | | Total | | | Series A Preferred Unit-holders |
| | | | | | | | | | | | | | | | |
| | | | | | | | | | | | | | | | |
| | | | | | | | | | | | | | | | |
| | | | | | | | | | | | | | | | |
| | | | | | | | | | | | | | | | |
| | | | | | | | | | | | | | | | |
| | | | | | | | | | | | | | | | |
| | | | | | | | | | | | | | | | |
| | | | | | | | | | | | | | | | |
| | | | | | | | | | | | | | | | |
| | | | | | | | | | | | | | | | |
| | | | | | | | | | | | | | | | |
| | | | | | | | | | | | | | | | |
| | | | | | | | | | | | | | | | |
| | | | | | | | | | | | | | | | |
| | | | | | | | | | | | | | | | |
| | | | | | | | | | | | | | | | |
| | | | | | | | | | | | | | | | |
| | | | | | | | | | | | | | | | |
| | | | | | | | | | | | | | | | |
| | | | | | | | | | | | | | | | |
| | | | | | | | | | | | | | | | |
| | | | | | | | | | | | | | | | |
| | | | | | | | | | | | | | | | |
| | | | | | | | | | | | | | | | |
| | | | | | | | | | | | | | | | |
| | | | | | | | | | | | | | | | |
| | | | | | | | | | | | | | | | |
| | | | | | | | | | | | | | | | |
| | | | | | | | | | | | | | | | |
| | | | | | | | | | | | | | | | |
| | | | | | | | | | | | | | | | |
| | | | | | | | | | | | | | | | |
| | | | | | | | | | | | | | | | |
| | | | | | | | | | | | | | | | |
| | | | | | | | | | | | | | | | |
| | | | | | | | | | | | | | | | |
| | | | | | | | | | | | | | | | |
| | | | | | | | | | | | | | | | |
| | | | | | | | | | | | | | | | |
| | | | | | | | | | | | | | | | |
| | | | | | | | | | | | | | | | |
| | | | | | | | | | | | | | | | |
| | | | | | | | | | | | | | | | |
| | | |
| | | |
| Balance at December 31, 2020 | $ | 9,384 | | | $ | 2,792 | | | $ | 611 | | | $ | (15) | | | $ | 245 | | | | | $ | 13,017 | | | | $ | 968 | |
| Net income | 266 | | | 443 | | | 11 | | | — | | | 9 | | | | | 729 | | | | 20 | |
| Unit Repurchases | (155) | | | — | | | — | | | — | | | — | | | | | (155) | | | | — | |
| Distributions | (269) | | | (445) | | | (21) | | | — | | | (10) | | | | | (745) | | | | (20) | |
| Contributions | — | | | 7 | | | — | | | — | | | — | | | | | 7 | | | | — | |
| Other | — | | | (1) | | | — | | | (2) | | | — | | | | | (3) | | | | — | |
| Balance at March 31, 2021 | $ | 9,226 | | | $ | 2,796 | | | $ | 601 | | | $ | (17) | | | $ | 244 | | | | | $ | 12,850 | | | | $ | 968 | |
| | | | | | | | | | | | | | | | |
| | | | | | | | | | | | | | | | |
| | | | | | | | | | | | | | | | |
| | | | | | | | | | | | | | | | |
| | | | | | | | | | | | | | | | |
| | | | | | | | | | | | | | | | |
| | | | | | | | | | | | | | | | |
| | | | | | | | | | | | | | | | |
| | | | | | | | | | | | | | | | |
| | | | | | | | | | | | | | | | |
| | | | | | | | | | | | | | | | |
| | | | | | | | | | | | | | | | |
| | | | | | | | | | | | | | | | |
| | | | | | | | | | | | | | | | |
| | | | | | | | | | | | | | | | |
| | | | | | | | | | | | | | | | |
| | | | | | | | | | | | | | | | |
| | | | | | | | | | | | | | | | |
| | | | | | | | | | | | | | | | |
| | | | | | | | | | | | | | | | |
| | | | | | | | | | | | | | | | |
| | | | | | | | | | | | | | | | |
| | | | | | | | | | | | | | | | |
| | | | | | | | | | | | | | | | |
| | | |
| | | |
| | | | | | | | | | | | | | | | |
| Balance at December 31, 2021 | $ | 8,579 | | | $ | 2,638 | | | $ | 611 | | | $ | (17) | | | $ | 241 | | | | | $ | 12,052 | | | | $ | 965 | |
| | | | | | | | | | | | | | | | |
| Net income | 287 | | | 506 | | | 11 | | | — | | | 8 | | | | | 812 | | | | 21 | |
| Unit Repurchases | (100) | | | — | | | — | | | — | | | — | | | | | (100) | | | | — | |
| | | | | | | | | | | | | | | | |
| | | | | | | | | | | | | | | | |
| Distributions | (260) | | | (456) | | | (21) | | | — | | | (9) | | | | | (746) | | | | (21) | |
| Contributions | — | | | 10 | | | — | | | — | | | — | | | | | 10 | | | | — | |
| | | | | | | | | | | | | | | | |
| Other | (1) | | | — | | | — | | | 9 | | | — | | | | | 8 | | | | — | |
| | | | | | | | | | | | | | | | |
| | | | | | | | | | | | | | | | |
| | | | | | | | | | | | | | | | |
| | | | | | | | | | | | | | | | |
| | | | | | | | | | | | | | | | |
| | | | | | | | | | | | | | | | |
| | | | | | | | | | | | | | | | |
| Balance at March 31, 2022 | $ | 8,505 | | | $ | 2,698 | | | $ | 601 | | | $ | (8) | | | $ | 240 | | | | | $ | 12,036 | | | | $ | 965 | |
| | | | | | | | | | | | | | | | |
| | | | | | | | | | | | | | | | |
| | | | | | | | | | | | | | | | |
| | | | | | | | | | | | | | | | |
| | | | | | | | | | | | | | | | |
| | | | | | | | | | | | | | | | |
| | | | | | | | | | | | | | | | |
| | | | | | | | | | | | | | | | |
| | | | | | | | | | | | | | | | |
| | | | | | | | | | | | | | | | |
| | | | | | | | | | | | | | | | |
| | | | | | | | | | | | | | | | |
| | | | | | | | | | | | | | | | |
| | | | | | | | | | | | | | | | |
| | | | | | | | | | | | | | | | |
| | | | | | | | | | | | | | | | |
| | | | | | | | | | | | | | | | |
| | | | | | | | | | | | | | | | |
| | | | | | | | | | | | | | | | |
| | | | | | | | | | | | | | | | |
| | | | | | | | | | | | | | | | |
| | | | | | | | | | | | | | | | |
| | | | | | | | | | | | | | | | |
| | | | | | | | | | | | | | | | |
| | | | | | | | | | | | | | | | |
| | | | | | | | | | | | | | | | |
| | | | | | | | | | | | | | | | |
| | | | | | | | | | | | | | | | |
| | | | | | | | | | | | | | | | |
| | | | | | | | | | | | | | | | |
| | | | | | | | | | | | | | | | |
| | | | | | | | | | | | | | | | |
| | | | | | | | | | | | | | | | |
| | | | | | | | | | | | | | | | |
| | | | | | | | | | | | | | | | |
The accompanying notes are an integral part of these consolidated financial statements.
Notes to Consolidated Financial Statements (Unaudited)
1. Description of the Business and Basis of Presentation
Description of the Business –
MPLX LP is a diversified, large-cap master limited partnership formed by Marathon Petroleum Corporation that owns and operates midstream energy infrastructure and logistics assets, and provides fuels distribution services. References in this report to “MPLX LP,” “MPLX,” “the Partnership,” “we,” “ours,” “us,” or like terms refer to MPLX LP and its subsidiaries. References to “MPC” refer collectively to Marathon Petroleum Corporation as our sponsor and its subsidiaries, other than the Partnership. We are engaged in the gathering, transportation, storage and distribution of crude oil, asphaltrefined products and refined petroleumother hydrocarbon-based products; the gathering, processing and transportation of natural gas; and the gathering, transportation, fractionation, storage and marketing of NGLs. MPLX’s principal executive office is located in Findlay, Ohio.
MPLX’s business consists of 2 segments based on the nature of services it offers: Logistics and Storage (“L&S”), which relates primarily to crude oil, asphaltrefined products and refined petroleumother hydrocarbon-based products; and Gathering and Processing (“G&P”), which relates primarily to natural gas and NGLs. See Note 97 for additional information regarding the operations and results of these segments.
On July 31, 2020, MPLX completed the exchangeBasis of Western Refining Wholesale, LLC (“WRW”) to Western Refining Southwest, Inc. (now known as Western Refining Southwest LLC) (“WRSW”), a wholly owned subsidiary of MPC, in exchange for the redemption of 18,582,088 MPLX common units held by WRSW (the “Wholesale Exchange”). See Note 3 for additional information regarding the Wholesale Exchange. These financial statements include the results of WRSW through July 31, 2020.
ImpairmentsPresentation – During the first quarter of 2021, we have seen improvement in the environment in which our business operates as COVID-19 impacts are beginning to subside. The increased availability of vaccinations, coupled with an easing of COVID-19 restrictions in certain areas, has been followed by an increase in economic activity, the opening of many businesses and schools and an increase in in-person interaction and associated travel. No additional events or circumstances arose during the first quarter of 2021 that would indicate potential impairment beyond those recognized in 2020 as noted below.
During the first quarter of 2020, the overall deterioration in the economy and the environment in which MPLX and its customers operate, as well as a sustained decrease in unit price, were considered triggering events at that time resulting in impairments of the carrying value of certain assets. We recognized impairments related to goodwill, certain equity method investments and certain long-lived assets (including intangibles), within our G&P segment. Many of our producer customers refined and updated production forecasts in response to the environment at that time, which impacted their expected future demand for our services, including the future utilization of our assets. Additionally, certain of our contracts have commodity price exposure, including NGL prices, which experienced increased volatility as noted above. The table below provides information related to the impairments recognized during the first quarter of 2020 as well as the corresponding footnote where additional information can be found.
| | | | | | | | | | | | | | |
| (In millions) | | Impairment | | Footnote Reference |
| Goodwill | | $ | 1,814 | | | 12 |
| Equity method investments | | 1,264 | | | 4 |
| Intangibles, net | | 177 | | | 12 |
| Property, plant and equipment, net | | 174 | | | 11 |
| Total impairments | | $ | 3,429 | | | |
Basis of Presentation – The accompanying interim consolidated financial statements are unaudited; however, in the opinion of MPLX’s management, these statements reflect all adjustments necessary for a fair statement of the results for the periods reported. All such adjustments are of a normal, recurring nature unless otherwise disclosed. These interim consolidated financial statements, including the notes, have been prepared in accordance with the rules and regulations of the SEC applicable to interim period financial statements and do not include all of the information and disclosures required by GAAP for complete financial statements. Certain information derived from our audited annual financial statements, prepared in accordance with GAAP, has been condensed or omitted from these interim financial statements.
These interim consolidated financial statements should be read in conjunction with the audited consolidated financial statements and notes thereto included in theour Annual Report on Form 10-K for the year ended December 31, 2020.2021. The results of operations for the three months ended March 31, 20212022 are not necessarily indicative of the results to be expected for the full year.
MPLX’s consolidated financial statements include all majority-owned and controlled subsidiaries. For non-wholly owned consolidated subsidiaries, the interests owned by third parties have been recorded as “Noncontrolling interests” on the accompanying Consolidated Balance Sheets. Intercompany investments, accounts and transactions have been eliminated. MPLX’s investments in which MPLX exercises significant influence but does not control and does not have a controlling financial interest are accounted for using the equity method. MPLX’s investments in VIEs in which MPLX exercises significant influence but does not control and is not the primary beneficiary are also accounted for using the equity method.
In preparing the Consolidated Statements of Equity, net income attributableCertain prior period financial statement amounts have been reclassified to MPLX LP is allocatedconform to Series A and Series B preferred unitholders based on a fixed distribution schedule. Distributions, although earned, are not accrued until declared. The allocation of net income attributable to MPLX LP for purposes of calculating net income per limited partner unit is described in Note 6.current period presentation.
2. Accounting Standards
Recently Adopted
WeASU 2021-10, Government Assistance (Topic 832): Disclosures by Business Entities about Government Assistance
In November 2021, the FASB issued guidance requiring disclosures for certain types of government assistance that have been accounted for by analogy to grant or contribution models. Disclosures will include information about the type of transactions, accounting and the impact on financial statements. MPLX prospectively adopted this standard in the first quarter of 2022. The adoption of this standard did not adopt any ASUs during the first three months of 2021 that are expected to have a material impact toon our financial statements or financial statement disclosures.
3. Acquisitions and Dispositions
Sale of Javelina Assets and Liabilities
On February 12, 2021, MarkWest Energy Operating Company, L.L.C., (“MarkWest Energy”) a wholly owned subsidiary of MPLX, completed the sale of all of MarkWest Energy’s equity interests in MarkWest Javelina Company L.L.C., MarkWest Javelina Pipeline Company L.L.C., and MarkWest Gas Services L.L.C. (collectively, “Javelina”) pursuant to the terms of an Equity Purchase Agreement entered into with a third party on December 23, 2020. The agreement included adjustments for working capital as well as an earnout provision based on the performance of the assets. NaN gain or loss was recorded on the sale. The estimated value of the earnout provision was recorded as a contingent asset shown within “Other noncurrent assets” on the Consolidated Balance Sheet as of March 31, 2021. Javelina’s assets and liabilities sold are shown on the Consolidated Balance Sheet as “Assets held for sale” and “Liabilities held for sale” for the year ended December 31, 2020. Prior to the sale, Javelina was reported within the G&P segment.
Wholesale Exchange
On July 31, 2020, MPLX entered into a Redemption Agreement (the “Redemption Agreement”) with WRSW, a wholly owned subsidiary of MPC, pursuant to which MPLX agreed to transfer to WRSW all of the outstanding membership interests in WRW in exchange for the redemption of MPLX common units held by WRSW. The transaction effected the transfer to MPC of the Western wholesale distribution business that MPLX acquired as a result of its acquisition of ANDX. Per the terms of the Redemption Agreement, MPLX redeemed 18,582,088 common units (the “Redeemed Units”) held by WRSW on July 31, 2020. The number of Redeemed Units was calculated by dividing WRW’s aggregate valuation of $340 million by the simple average of the volume weighted average NYSE prices of an MPLX common unit for the ten trading days ending at market close on July 27, 2020. MPLX canceled the Redeemed Units immediately following the Wholesale Exchange. The carrying value of the net assets of WRW transferred to MPC was approximately $90 million as of July 31, 2020, resulting in $250 million being recorded to “Common Unit-holder MPC” within the Consolidated Statements of Equity, netted against the fair value of the redeemed units. Included within the $90 million carrying value of the WRW net assets was approximately $65 million of goodwill.
4.3. Investments and Noncontrolling Interests
The following table presents MPLX’s equity method investments at the dates indicated:
| | | Ownership as of | | Carrying value at | | Ownership as of | | Carrying value at |
| | March 31, | | March 31, | | December 31, | | March 31, | | March 31, | | December 31, |
| (In millions, except ownership percentages) | (In millions, except ownership percentages) | 2021 | | 2021 | | 2020 | (In millions, except ownership percentages) | 2022 | | 2022 | | 2021 |
| L&S | L&S | | | | | | L&S | | | | | |
MarEn Bakken Company LLC(1) | MarEn Bakken Company LLC(1) | 25% | | $ | 462 | | | $ | 465 | | MarEn Bakken Company LLC(1) | 25% | | $ | 502 | | | $ | 449 | |
| Illinois Extension Pipeline Company, L.L.C. | Illinois Extension Pipeline Company, L.L.C. | 35% | | 259 | | | 254 | | Illinois Extension Pipeline Company, L.L.C. | 35% | | 249 | | | 243 | |
| LOOP LLC | LOOP LLC | 41% | | 257 | | | 252 | | LOOP LLC | 41% | | 274 | | | 265 | |
Andeavor Logistics Rio Pipeline LLC(2) | Andeavor Logistics Rio Pipeline LLC(2) | 67% | | 193 | | | 194 | | Andeavor Logistics Rio Pipeline LLC(2) | 67% | | 181 | | | 183 | |
| Minnesota Pipe Line Company, LLC | Minnesota Pipe Line Company, LLC | 17% | | 187 | | | 188 | | Minnesota Pipe Line Company, LLC | 17% | | 182 | | | 183 | |
Whistler Pipeline LLC(2) | Whistler Pipeline LLC(2) | 38% | | 187 | | | 185 | | Whistler Pipeline LLC(2) | 38% | | 166 | | | 155 | |
| Explorer Pipeline Company | Explorer Pipeline Company | 25% | | 69 | | | 72 | | Explorer Pipeline Company | 25% | | 65 | | | 66 | |
W2W Holdings LLC(3)(2) | W2W Holdings LLC(3)(2) | 50% | | 73 | | | 72 | | W2W Holdings LLC(3)(2) | 50% | | 56 | | | 58 | |
| Other(2) | Other(2) | | 105 | | | 103 | | Other(2) | | 125 | | | 116 | |
| Total L&S | Total L&S | | 1,792 | | | 1,785 | | Total L&S | | 1,800 | | | 1,718 | |
| G&P | G&P | | G&P | |
MarkWest Utica EMG, L.L.C.(2) | MarkWest Utica EMG, L.L.C.(2) | 57% | | 696 | | | 698 | | MarkWest Utica EMG, L.L.C.(2) | 57% | | 681 | | | 680 | |
Sherwood Midstream LLC(2) | Sherwood Midstream LLC(2) | 50% | | 552 | | | 557 | | Sherwood Midstream LLC(2) | 50% | | 539 | | | 544 | |
MarkWest EMG Jefferson Dry Gas Gathering Company, L.L.C.(2) | MarkWest EMG Jefferson Dry Gas Gathering Company, L.L.C.(2) | 67% | | 313 | | | 307 | | MarkWest EMG Jefferson Dry Gas Gathering Company, L.L.C.(2) | 67% | | 336 | | | 332 | |
| MarkWest Torñado GP, L.L.C.(2) | | MarkWest Torñado GP, L.L.C.(2) | 60% | | 266 | | | 246 | |
Rendezvous Gas Services, L.L.C.(2) | Rendezvous Gas Services, L.L.C.(2) | 78% | | 157 | | | 159 | | Rendezvous Gas Services, L.L.C.(2) | 78% | | 145 | | | 147 | |
Sherwood Midstream Holdings LLC(2) | Sherwood Midstream Holdings LLC(2) | 51% | | 145 | | | 148 | | Sherwood Midstream Holdings LLC(2) | 51% | | 133 | | | 136 | |
| | Centrahoma Processing LLC | Centrahoma Processing LLC | 40% | | 137 | | | 145 | | Centrahoma Processing LLC | 40% | | 133 | | | 133 | |
| | Other(2) | Other(2) | | 248 | | | 237 | | Other(2) | | 46 | | | 45 | |
| | Total G&P | Total G&P | | 2,248 | | | 2,251 | | Total G&P | | 2,279 | | | 2,263 | |
| Total | Total | | $ | 4,040 | | | $ | 4,036 | | Total | | $ | 4,079 | | | $ | 3,981 | |
(1) The investment in MarEn Bakken Company LLC includes our 9.19 percent indirect interest in a joint venture (“Dakota Access”) that owns and operates the Dakota Access Pipeline and Energy Transfer Crude Oil Pipeline projects, collectively referred to as the Bakken Pipeline system or DAPL.
(2) Investments deemed to be VIEs. Some investments included within “Other” have also been deemed to be VIEs.
(3) Through our ownership interest in W2W Holdings LLC, we have a 15 percent equity interest Wink to Webster Pipeline LLC.
For those entities that have been deemed to be VIEs, neither MPLX nor any of its subsidiaries have been deemed to be the primary beneficiary due to voting rights on significant matters. While we have the ability to exercise influence through participation in the management committees which make all significant decisions, we have equal influence over each committee as a joint interest partner and all significant decisions require the consent of the other investors without regard to economic interest andinterest; as such, we have determined that these entities should not be consolidated and apply the equity method of accounting with respect to our investments in each entity.
Sherwood Midstream LLC (“Sherwood Midstream”) has been deemed the primary beneficiary of Sherwood Midstream Holdings LLC (Sherwood(“Sherwood Midstream Holdings”) due to its controlling financial interest through its authority to manage the joint venture. As a result, Sherwood Midstream consolidates Sherwood Midstream Holdings. Therefore, MPLX also reports its portion of Sherwood Midstream Holdings’ net assets as a component of its investment in Sherwood Midstream. As of March 31, 2021,2022, MPLX has a 24.55 percent indirect ownership interest in Sherwood Midstream Holdings through Sherwood Midstream.
MPLX’s maximum exposure to loss as a result of its involvement with equity method investments includes its equity investment, any additional capital contribution commitments and any operating expenses incurred by the subsidiary operator in excess of its compensation received for the performance of the operating services. MPLX did not provide any financial support to equity method investments that it was not contractually obligated to provide during the three months ended March 31, 2021.
During the first quarter of 2020, we recorded an other than temporary impairment for three joint ventures in which we have an interest as discussed in Note 1. Impairment of these investments was $1,264 million, of which $1,251 million was related to MarkWest Utica EMG, L.L.C. and its investment in Ohio Gathering Company, L.L.C. The impairment was recorded through “Income from equity method investments.” The impairments were largely due to a reduction in forecasted volumes gathered and processed by the systems operated by the joint ventures. No additional impairments have been recorded since that time.
Summarized financial information for MPLX’s equity method investments for the three months ended March 31, 20212022 and 20202021 is as follows:
| | | Three Months Ended March 31, 2021 | | Three Months Ended March 31, 2022 |
| (In millions) | (In millions) | VIEs | | Non-VIEs | | Total | (In millions) | VIEs | | Non-VIEs | | Total |
| Revenues and other income | Revenues and other income | $ | 163 | | | $ | 284 | | | $ | 447 | | Revenues and other income | $ | 249 | | | $ | 308 | | | $ | 557 | |
| Costs and expenses | Costs and expenses | 107 | | | 131 | | | 238 | | Costs and expenses | 137 | | | 129 | | | 266 | |
| Income from operations | Income from operations | 56 | | | 153 | | | 209 | | Income from operations | 112 | | | 179 | | | 291 | |
| Net income | Net income | 64 | | | 140 | | | 204 | | Net income | 103 | | | 166 | | | 269 | |
Income from equity method investments(1) | Income from equity method investments(1) | $ | 39 | | | $ | 31 | | | $ | 70 | | Income from equity method investments(1) | $ | 55 | | | $ | 44 | | | $ | 99 | |
(1) Includes the impact of any basis differential amortization or accretion.
| | | | | | | | | | | | | | | | | |
| Three Months Ended March 31, 2020 |
| (In millions) | VIEs | | Non-VIEs | | Total |
| Revenues and other income | $ | (217) | | | $ | 337 | | | $ | 120 | |
| Costs and expenses | 104 | | | 132 | | | 236 | |
| (Loss)/income from operations | (321) | | | 205 | | | (116) | |
| Net (loss)/income | (337) | | | 186 | | | (151) | |
(Loss)/income from equity method investments(1) | $ | (1,222) | | | $ | 38 | | | $ | (1,184) | |
(1) Includes the impact of any basis differential amortization or accretion in addition to the impairment of $1,264 million. | | | | | | | | | | | | | | | | | |
| Three Months Ended March 31, 2021 |
| (In millions) | VIEs | | Non-VIEs | | Total |
| Revenues and other income | $ | 163 | | | $ | 284 | | | $ | 447 | |
| Costs and expenses | 107 | | | 131 | | | 238 | |
| Income from operations | 56 | | | 153 | | | 209 | |
| Net income | 64 | | | 140 | | | 204 | |
| Income from equity method investments | $ | 39 | | | $ | 31 | | | $ | 70 | |
Summarized balance sheet information for MPLX’s equity method investments as of March 31, 20212022 and December 31, 20202021 is as follows:
| | | March 31, 2021 | | March 31, 2022 |
| (In millions) | (In millions) | VIEs | | Non-VIEs | | Total | (In millions) | VIEs | | Non-VIEs | | Total |
| Current assets | Current assets | $ | 312 | | | $ | 321 | | | $ | 633 | | Current assets | $ | 386 | | | $ | 370 | | | $ | 756 | |
| Noncurrent assets | Noncurrent assets | 7,266 | | | 4,967 | | | 12,233 | | Noncurrent assets | 7,482 | | | 4,875 | | | 12,357 | |
| Current liabilities | Current liabilities | 338 | | | 194 | | | 532 | | Current liabilities | 773 | | | 259 | | | 1,032 | |
| Noncurrent liabilities | Noncurrent liabilities | $ | 2,053 | | | $ | 853 | | | $ | 2,906 | | Noncurrent liabilities | $ | 1,929 | | | $ | 789 | | | $ | 2,718 | |
| | | December 31, 2020 | | December 31, 2021 |
| (In millions) | (In millions) | VIEs | | Non-VIEs | | Total | (In millions) | VIEs | | Non-VIEs | | Total |
| Current assets | Current assets | $ | 530 | | | $ | 318 | | | $ | 848 | | Current assets | $ | 335 | | | $ | 411 | | | $ | 746 | |
| Noncurrent assets | Noncurrent assets | 6,889 | | | 4,997 | | | 11,886 | | Noncurrent assets | 7,439 | | | 4,895 | | | 12,334 | |
| Current liabilities | Current liabilities | 323 | | | 187 | | | 510 | | Current liabilities | 217 | | | 310 | | | 527 | |
| Noncurrent liabilities | Noncurrent liabilities | $ | 1,904 | | | $ | 830 | | | $ | 2,734 | | Noncurrent liabilities | $ | 2,461 | | | $ | 788 | | | $ | 3,249 | |
As of March 31, 2021 and December 31, 2020, the underlying net assets of MPLX’s investees in the G&P segment exceeded the carrying value of its equity method investments by approximately $56 million and $57 million, respectively. As of March 31, 2021 and December 31, 2020, the carrying value of MPLX’s equity method investments in the L&S segment exceeded the underlying net assets of its investees by $331 million.
At March 31, 2021 and December 31, 2020, the G&P basis difference was being amortized into net income over the remaining estimated useful lives of the underlying assets, except for $31 million of excess related to goodwill. At March 31, 2021 and December 31, 2020, the L&S basis difference was being amortized into net income over the remaining estimated useful lives of the underlying assets, except for $167 million of excess related to goodwill.
5.4. Related Party Agreements and Transactions
MPLX engages in transactions with both MPC and certain of its equity method investments as part of its normal business; however, transactions with MPC make up the majority of MPLX’s related party transactions. Transactions with related parties are further described below.
MPLX has various long-term, fee-based commercial agreements with MPC. Under these agreements, MPLX provides transportation, gathering, terminal, fuels distribution, marketing, storage, management, operational and other services to MPC. MPC has committed to provide MPLX with minimum quarterly throughput volumes on crude oil and refined products, and other fees for storage capacity;capacity, operating and management fees;fees, as well as reimbursements for certain direct and indirect costs. MPC has also committed to provide a fixed fee for 100 percent of available capacity for boats, barges and third-party chartered equipment under the marine transportation service agreement. MPLX also has a keep-whole commodity agreement with MPC under which MPC pays us a processing fee for NGLs related to keep-whole agreements and delivers shrink gas to the producers on our behalf. We pay MPC a marketing fee in exchange for assuming the commodity risk. Additionally, MPLX has obligations to MPC for services provided to MPLX by MPC under omnibus and employee services-type agreements as well as other various agreements.
Related Party Loan
MPLX is party to a loan agreement with MPC Investment LLC (“MPC Investment”) (the “MPC Loan Agreement”). Under the terms of the agreement, MPC Investment extends loans to MPLX on a revolving basis as requested by MPLX and as agreed to by MPC Investment. The borrowing capacity of the MPC Loan Agreement is $1.5 billion aggregate principal amount of all loans outstanding at any one time. The loan agreement is scheduled to expire, and borrowings under the loan agreement are scheduled to mature and become due and payable, on July 31, 2024, provided that MPC Investment may demand payment of all or any portion of the outstanding principal amount of the loan, together with all accrued and unpaid interest and other amounts (if any), at any time prior to maturity. Borrowings under the MPC Loan Agreement bear interest at LIBOR plus 1.25 percent or such lower rate as would be applicable to such loans under the MPLX Credit Agreement as discussed in Note 15. 11.
Activity on the MPC Loan Agreement was as follows:
| | | | | | | | | | | |
| (In millions) | Three Months Ended March 31, 2021 | | Year Ended December 31, 2020 |
| Borrowings | $ | 2,241 | | | $ | 6,264 | |
| Average interest rate of borrowings | 1.371 | % | | 2.278 | % |
| Repayments | $ | 2,241 | | | $ | 6,858 | |
Outstanding balance at end of period(1) | $ | 0 | | | $ | 0 | |
(1) Included in “Current liabilities - related parties” on the Consolidated Balance Sheets. | | | | | | | | | | | |
| Three Months Ended March 31, |
| (In millions) | 2022 | | 2021 |
| Borrowings | $ | 1,849 | | | $ | 2,241 | |
| Average interest rate of borrowings | 1.400 | % | | 1.371 | % |
| Repayments | $ | 2,976 | | | $ | 2,241 | |
| Outstanding balance at end of period | $ | 323 | | | $ | — | |
Related Party Revenue
Related party sales to MPC primarily consist of crude oil and refined products pipeline and trucking transportation services based on tariff/tariff or contracted rates; storage, terminal and fuels distribution services based on contracted rates; and marine transportation services. Related party sales to MPC also consist of revenue related to volume deficiency credits.
MPLX also has operating agreements with MPC under which it receives a fee for operating MPC’s retained pipeline assets and a fixed annual fee for providing oversight and management services required to run the marine business. MPLX also receives management fee revenue for engineering, construction and administrative services for operating certain of its equity method investments.
Revenue received from These agreements are classified as “Other income - related parties includedparties” on the Consolidated Statements of Income was as follows:
| | | | | | | | | | | | | | | |
| | Three Months Ended March 31, | | |
| (In millions) | 2021 | | 2020 | | | | |
| Service revenues - related parties | | | | | | | |
| MPC | $ | 871 | | | $ | 927 | | | | | |
| Other | 1 | | | 1 | | | | | |
| Total Service revenue - related parties | 872 | | | 928 | | | | | |
| Rental income - related parties | | | | | | | |
| MPC | 242 | | | 234 | | | | | |
Product sales - related parties(1) | | | | | | | |
| MPC | 42 | | | 33 | | | | | |
| Other income - related parties | | | | | | | |
| MPC | 49 | | | 48 | | | | | |
| Other | 16 | | | 16 | | | | | |
| | | | | | | |
| | | | | | | |
| | | | | | | |
| | | | | | | |
| | | | | | | |
| | | | | | | |
| | | | | | | |
| | | | | | | |
| | | | | | | |
| | | | | | | |
| Total Other income - related parties | $ | 65 | | | $ | 64 | | | | | |
(1) There were additionalCertain product sales to MPC that net to zero within the consolidated financial statements as the transactions are recorded net due to the terms of the agreements under which such product was sold. For the three months ended March 31, 20212022 and March 31, 2020,2021, these sales totaled $168$293 million and $173$168 million, respectively.
Related Party Expenses
MPC providescharges MPLX for executive management services and certain general and administrative services to MPLX under the terms of our omnibus agreements (“Omnibus charges”). Omnibus charges included in “Rental cost of sales - related parties” primarily relate to services that support MPLX’s rental operations and maintenance of assets available for rent.rent, as well as compensation expenses. Omnibus charges included in “Purchases - related parties” primarily relate to services that support MPLX’s operations and maintenance activities, as well as compensation expenses. Omnibus charges included in “General and administrative expenses” primarily relate to services that support MPLX’s executive management, accounting and human resources activities. MPLX also obtains employee services from MPC under employee services agreements (“ESA charges”). ESA charges for personnel directly involved in or supporting operations and maintenance activities related to rental services are classified as “Rental cost of sales - related parties.” ESA charges for personnel directly involved in or supporting operations and maintenance activities related to other services are classified as “Purchases - related parties.” ESA charges for personnel involved in executive management, accounting and human resources activities are classified as “General and administrative expenses.” In addition to these agreements, MPLX purchases products from MPC, makes payments to MPC in its capacity as general contractor to MPLX, and has certain lease agreements with MPC.
ExpensesFor the three months ended March 31, 2022 and March 31, 2021, “General and administrative expenses” incurred from MPC under the omnibustotaled $55 million and employee services agreements as well as other purchases from MPC included on the Consolidated Statements of Income are as follows:
| | | | | | | | | | | | | | | |
| | Three Months Ended March 31, | | |
| (In millions) | 2021 | | 2020 | | | | |
| Rental cost of sales - related parties | | | | | | | |
| MPC | $ | 39 | | | $ | 46 | | | | | |
| Purchases - related parties | | | | | | | |
| MPC | 294 | | | 271 | | | | | |
| Other | 4 | | | 5 | | | | | |
| Total Purchases - related parties | 298 | | | 276 | | | | | |
| General and administrative expenses | | | | | | | |
| MPC | $ | 57 | | | $ | 64 | | | | | |
| | | | | | | |
| | | | | | | |
Some charges incurred under the omnibus and ESA agreements are related to engineering services and are associated with assets under construction. These charges are added to “Property, plant and equipment, net” on the Consolidated Balance Sheets. For the three months ended March 31, 20212022 and March 31, 2020,2021, these charges totaled $12$19 million and $36$12 million, respectively.
MPC has also been advancing certain strategic priorities to lay a foundation for long-term success, including plans to optimize its assets and structurally lower costs in 2021 and beyond. In 2020, MPC approved and executed an involuntary workforce reduction plan, which together with employee reductions resulting from MPC's indefinite idling of its Martinez, California and Gallup, New Mexico refineries, affected approximately 2,050 employees. All of the employees that conduct MPLX’s business are directly employed by affiliates of MPC, and certain of those employees were affected by MPC’s workforce reductions. During the third and fourth quarters of 2020, MPLX reimbursed MPC for $37 million related to severance and employee benefits related expenses that MPC recorded in connection with its workforce reductions. There were no such costs in the first quarter of 2021.
Related Party Assets and Liabilities
Assets and liabilities with related parties appearing on the Consolidated Balance Sheets are detailed in the table below. This table identifies the various components of related party assets and liabilities, including those associated with leases (see Note 20 for additional information) and deferred revenue on minimum volume commitments. If MPC fails to meet its minimum committed volumes, MPC will pay MPLX a deficiency payment based on the terms of the agreement. The deficiency amounts received under these agreements (excluding payments received under agreements classified as sales-type leases) are recorded as “Current liabilities - related parties.” In many cases, MPC may then apply the amount of any such deficiency payments as a credit for volumes in excess of its minimum volume commitment in future periods under the terms of the applicable agreements. MPLX recognizes related party revenues for the deficiency payments when credits are used for volumes in excess of minimum quarterly volume commitments, where it is probable the customer will not use the credit in future periods or upon the expiration of the credits. The use or expiration of the credits is a decrease in “Current liabilities - related parties.” Deficiency payments under agreements that have been classified as sales-type leases are recorded as a reduction against the corresponding lease receivable. In addition, capital projects MPLX is undertakingundertakes at the request of MPC are reimbursed in cash and recognized in incomeas revenue over the remaining term of the applicable agreements or in some cases, as an equitya contribution from its sponsor.MPC.
| | | | | | | | | | | |
| (In millions) | March 31, 2021 | | December 31, 2020 |
| Current assets - related parties | | | |
| Receivables - MPC | $ | 586 | | | $ | 615 | |
| | | |
| | | |
| | | |
| | | |
| | | |
| | | |
| | | |
| | | |
| Receivables - Other | 14 | | | 27 | |
| Prepaid - MPC | 17 | | | 4 | |
| Other - MPC | 1 | | | 1 | |
| Lease Receivables - MPC | 32 | | | 30 | |
| Total | 650 | | | 677 | |
| Noncurrent assets - related parties | | | |
| Long-term receivables - MPC | 32 | | | 32 | |
| Right of use assets - MPC | 230 | | | 231 | |
| Long-term lease receivables - MPC | 388 | | | 386 | |
| Unguaranteed residual asset - MPC | 26 | | | 23 | |
| Total | 676 | | | 672 | |
| Current liabilities - related parties | | | |
| Payables - MPC | 213 | | | 215 | |
| | | |
| | | |
| | | |
| | | |
| | | |
| Payables - Other | 26 | | | 43 | |
| Operating lease liabilities - MPC | 1 | | | 1 | |
| | | |
| Deferred revenue - Minimum volume deficiencies - MPC | 65 | | | 66 | |
| Deferred revenue - Project reimbursements - MPC | 32 | | | 30 | |
| Deferred revenue - Project reimbursements - Other | 1 | | | 1 | |
| Total | 338 | | | 356 | |
| Long-term liabilities - related parties | | | |
| Long-term operating lease liabilities - MPC | 229 | | | 229 | |
| | | |
| | | |
| Long-term deferred revenue - Project reimbursements - MPC | 43 | | | 47 | |
| Long-term deferred revenue - Project reimbursements - Other | 7 | | | 7 | |
| Total | $ | 279 | | | $ | 283 | |
14
| | | | | | | | | | | |
| (In millions) | March 31, 2022 | | December 31, 2021 |
| Current assets - related parties | | | |
| Receivables | $ | 707 | | | $ | 555 | |
| Prepaid | 17 | | | 4 | |
| Other | 3 | | | 3 | |
| Lease receivables | 86 | | | 82 | |
| Total | 813 | | | 644 | |
| Noncurrent assets - related parties | | | |
| Long-term receivables | 30 | | | 31 | |
| Right of use assets | 229 | | | 229 | |
| Long-term lease receivables | 828 | | | 854 | |
| Unguaranteed residual asset | 64 | | | 47 | |
| Total | 1,151 | | | 1,161 | |
| Current liabilities - related parties | | | |
MPC loan agreement and other payables(1) | 606 | | | 1,702 | |
| Operating lease liabilities | 1 | | | 1 | |
| | | |
| Deferred revenue - Minimum volume deficiencies | 38 | | | 35 | |
| | | |
| | | |
| Deferred revenue - Project reimbursements | 42 | | | 42 | |
| Total | 687 | | | 1,780 | |
| Long-term liabilities - related parties | | | |
| Long-term operating lease liabilities | 228 | | | 228 | |
| | | |
| | | |
| | | |
| | | |
| Long-term deferred revenue - Project reimbursements | 77 | | | 74 | |
| Total | $ | 305 | | | $ | 302 | |
Other Related Party Transactions
From time to time, MPLX may also sell to or purchase from related parties, assets and inventory at the lesser of average unit cost or net realizable value. Sales to related parties for the three months ended March 31, 20212022 and 2020 were $9$1,450 million and $2 million, respectively. Purchases from related parties were immaterial for the three months ended Marchas of December 31, 2021 and 2020.related to outstanding borrowings on the intercompany loan with MPC, which are included in “Current liabilities - related parties” on the Consolidated Balance Sheets.
6. Net Income/(Loss) Per Limited Partner Unit
Net income/(loss) per unit applicable to common units is computed by dividing net income/(loss) attributable to MPLX LP less income/(loss) allocated to participating securities by the weighted average number of common units outstanding.
During the three months ended March 31, 2021 and 2020, MPLX had participating securities consisting of common units, certain equity-based compensation awards, Series A preferred units and Series B preferred units and had dilutive potential common units consisting of certain equity-based compensation awards. Potential common units omitted from the diluted earnings per unit calculation for the three months ended March 31, 2021 and 2020 were less than 1 million.
| | | | | | | | | | | | | | | |
| Three Months Ended March 31, | | |
| (In millions) | 2021 | | 2020 | | | | |
| Net income/(loss) attributable to MPLX LP | $ | 739 | | | $ | (2,724) | | | | | |
Less: Distributions declared on Series A preferred units(1) | 20 | | | 20 | | | | | |
| | | | | | | |
Distributions declared on Series B preferred units(1) | 11 | | | 11 | | | | | |
Limited partners’ distributions declared on MPLX common units (including common units of general partner)(1) | 707 | | | 728 | | | | | |
| | | | | | | |
| Undistributed net gain/(loss) attributable to MPLX LP | $ | 1 | | | $ | (3,483) | | | | | |
(1) See Note 7 for distribution information.
| | | | | | | | | | | | | | | | | | | | | | | | | |
| | Three Months Ended March 31, 2021 |
| (In millions, except per unit data) | Limited Partners’
Common Units | | | | Series A Preferred Units | | Series B Preferred Units | | Total |
| Basic and diluted net income attributable to MPLX LP per unit | | | | | | | | | |
| Net income attributable to MPLX LP: | | | | | | | | | |
| Distributions declared | $ | 707 | | | | | $ | 20 | | | $ | 11 | | | $ | 738 | |
| Undistributed net gain attributable to MPLX LP | 1 | | | | | 0 | | | 0 | | | 1 | |
Net income attributable to MPLX LP(1) | $ | 708 | | | | | $ | 20 | | | $ | 11 | | | $ | 739 | |
| Weighted average units outstanding: | | | | | | | | | |
| Basic | 1,037 | | | | | | | | | |
| Diluted | 1,037 | | | | | | | | | |
| Net income attributable to MPLX LP per limited partner unit: | | | | | | | | | |
| Basic | $ | 0.68 | | | | | | | | | |
| Diluted | $ | 0.68 | | | | | | | | | |
(1) Allocation of net income attributable to MPLX LP assumes all earnings for the period had been distributed based on the distribution priorities applicable to the period.
| | | | | | | | | | | | | | | | | | | | | | | |
| | Three Months Ended March 31, 2020 |
| (In millions, except per unit data) | Limited Partners’
Common Units | | Series A Preferred Units | | Series B Preferred Units | | Total |
| Basic and diluted net income attributable to MPLX LP per unit | | | | | | | |
| Net income attributable to MPLX LP: | | | | | | | |
| Distributions declared | $ | 728 | | | $ | 20 | | | $ | 11 | | | $ | 759 | |
| Undistributed net loss attributable to MPLX LP | (3,483) | | | 0 | | | 0 | | | (3,483) | |
Net (loss)/income attributable to MPLX LP(1) | $ | (2,755) | | | $ | 20 | | | $ | 11 | | | $ | (2,724) | |
| Weighted average units outstanding: | | | | | | | |
| Basic | 1,058 | | | | | | | |
| Diluted | 1,058 | | | | | | | |
| Net income attributable to MPLX LP per limited partner unit: | | | | | | | |
| Basic | $ | (2.60) | | | | | | | |
| Diluted | $ | (2.60) | | | | | | | |
(1) Allocation of net income attributable to MPLX LP assumes all earnings for the period had been distributed based on the distribution priorities applicable to the period.
7.5. Equity
The changes in the number of common units outstanding during the three months ended March 31, 20212022 are summarized below:
| | | | | | | | | | | |
| (In units) | Common | | | | | | |
Balance at December 31, 20202021 | 1,038,777,9781,016,178,378 | | | | | | | |
| Unit-based compensation awards | 143,247148,951 | | | | | | | |
| Units redeemed in unit repurchase program | (6,272,981)(3,119,522) | | | | | | | |
| | | | | | | |
Balance at March 31, 20212022 | 1,032,648,2441,013,207,807 | | | | | | | |
Unit Repurchase Program
On November 2, 2020, MPLX announced the board authorization of a unit repurchase program for the repurchase of up to $1 billion of MPLX’s outstanding common units held by the public. MPLX may utilize various methods to effect the repurchases, which could include open market repurchases, negotiated block transactions, tender offers, accelerated unit repurchases or open market solicitations for units, some of which may be effected through Rule 10b5-1 plans. The timing and amount of repurchases will depend upon several factors, including market and business conditions, and repurchases may be initiated, suspended or discontinued at any time. The repurchase authorization has no expiration date. During the three months ended March 31, 2021, 6,272,981 public2022, we repurchased 3,119,522 common units were repurchased at an average cost per unit of $24.78. Total cash$32.06 per unit and paid for units repurchased during 2021 was $155$100 million with $812 million remaining available under the program for future repurchases as of March 31, 2021.cash. As of March 31, 2021,2022, we had agreements to acquire 291,400 additional common units for $7$237 million which settled in April 2021.
Wholesale Exchange
In connection with the Wholesale Exchange as discussed in Note 3, 18,582,088 units were redeemed by MPC in exchange for all of the outstanding membership interests in WRW. These units were cancelled by MPLX immediately following the transaction.remaining under our repurchase authorization.
Series B Preferred Units
MPLX has 600,000 outstanding 600,000 units of 6.875 percent Fixed-to-Floating Rate Cumulative Redeemable Perpetual Preferred Units representing limited partner interests of MPLX with a price to the public of $1,000 per unit (the “Series B preferred
units”). The Series B preferred units are pari passu with the Series A preferred units with respect to distribution rights and rights upon liquidation. Series B preferred unitholders are entitled to receive a fixed distribution of $68.75 per unit, per annum, payable semi-annually in arrears on the 15th day, or the first business day thereafter, of February and August of each year up to and including February 15, 2023. After February 15, 2023, the holders of Series B preferred units are entitled to receive cumulative, quarterly distributions payable in arrears on the 15th day of February, May, August and November of each year, or the first business day thereafter, based on a floating annual rate equal to the three-month LIBOR plus 4.652 percent, in each case assuming a distribution is declared by the Board of Directors..
The changes inDirectors. MPLX has the right to redeem some or all of the Series B preferred units, at any time, on or after February 15, 2023 at the Series B preferred unit balance from December 31, 2020 through March 31, 2021 are summarized below. Series B preferred units are included inredemption price of $1,000 per unit, plus any accumulated and unpaid distributions up to the Consolidated Balance Sheets and Consolidated Statements of Equity within “Series B preferred units”.
| | | | | |
(In millions) | Series B Preferred Units |
Balance at December 31, 2020 | $ | 611 | |
Net income allocated | 11 | |
Distributions received by Series B preferred unitholders | (21) | |
Balance at March 31, 2021 | $ | 601 | |
redemption date.
Cash distributions
–In accordance with the MPLX partnership agreement, on
On April 27, 2021,26, 2022, MPLX declared a quarterly cash distribution for the first quarter of 2021,2022, totaling $707$713 million, or $0.6875$0.7050 per common unit. This distribution will be paid on May 13, 2022 to common unitholders of record on May 6, 2022. This rate will also be received by Series A preferred unitholders. These
Quarterly distributions will be paid on May 14,for 2022 and 2021 to common unitholders of record on May 7, 2021.are summarized below:
| | | | | | | | | | | |
| (Per common unit) | 2022 | | 2021 |
| March 31, | $ | 0.7050 | | | $ | 0.6875 | |
| | | |
| | | |
| | | |
In accordance with the distribution rights discussed above, MPLX also made a cash distribution payment totaling $21 million to Series B unitholders on February 16, 2021.
Quarterly distributions for the first quarters of 2021 and 2020 are summarized below:
| | | | | | | | | | | |
| (Per common unit) | 2021 | | 2020 |
| March 31, | $ | 0.6875 | | | $ | 0.6875 | |
| | | |
| | | |
| | | |
The allocation of total quarterly cash distributions to limited and preferred unitholders is as follows for the three months ended March 31, 20212022 and 2020.2021. Distributions, although earned, are not accrued until declared. MPLX’s distributions are declared subsequent to quarter end; therefore, the following table represents total cash distributions applicable to the period in which the distributions were earned.
| | | Three Months Ended March 31, | | | Three Months Ended March 31, | |
| (In millions) | (In millions) | 2021 | | 2020 | | (In millions) | 2022 | | 2021 | |
| Common and preferred unit distributions: | Common and preferred unit distributions: | | | | | Common and preferred unit distributions: | | | | |
| Common unitholders, includes common units of general partner | Common unitholders, includes common units of general partner | $ | 707 | | | $ | 728 | | | Common unitholders, includes common units of general partner | $ | 713 | | | $ | 707 | | |
| | Series A preferred unit distributions | Series A preferred unit distributions | 20 | | | 20 | | | Series A preferred unit distributions | 21 | | | 20 | | |
| Series B preferred unit distributions | Series B preferred unit distributions | 11 | | | 11 | | | Series B preferred unit distributions | 11 | | | 11 | | |
| Total cash distributions declared | Total cash distributions declared | $ | 738 | | | $ | 759 | | | Total cash distributions declared | $ | 745 | | | $ | 738 | | |
6. Net Income/(Loss) Per Limited Partner Unit
8. Series A Preferred UnitsNet income/(loss) per unit applicable to common units is computed by dividing net income attributable to MPLX LP less income allocated to participating securities by the weighted average number of common units outstanding.
On May 13, 2016,During the three months ended March 31, 2022 and 2021, MPLX LP issued approximately 30.8 million 6.5 percent Series A Convertible preferredhad participating securities consisting of common units, for a cash purchase price of $32.50 per unit. Thecertain equity-based compensation awards, Series A preferred units rank senior to all common units and pari passu with all Series B preferred units with respect to distributions and rights upon liquidation. The holdershad dilutive potential common units consisting of certain equity-based compensation awards. Potential common units omitted from the Series A preferred units are entitled to receive, when and if declared by the board, a quarterly distribution equal to the greater of $0.528125diluted earnings per unit or the amount of distributions they would have received on an as converted basis. On April 27, 2021, MPLX declared a quarterly cash distribution of $0.6875 per common unitcalculation for the first quarter of 2021. Holders of the Series A preferred units will receive the common unit rate in lieu of the lower $0.528125 base amount.
The holders may convert their Series A preferred units into common units at any time, in full or in part, subject to minimum conversion amountsthree months ended March 31, 2022 and conditions. After the fourth anniversary of the issuance date, MPLX may convert the Series A preferred units into common units at any time, in whole or in part, subject to certain minimum conversion amounts and conditions, if the closing price of MPLX common units is greater2021 were less than $48.75 for the 20-day trading period immediately preceding the conversion notice date. The conversion rate for the Series A preferred units shall be the quotient of (a) the sum of (i) $32.50, plus (ii) any unpaid cash distributions on the applicable preferred unit, divided by (b) $32.50, subject to adjustment1 million.
for unit distributions, unit splits and similar transactions. The holders of the Series A preferred units are entitled to vote on an as-converted basis with the common unitholders and have certain other class voting rights with respect to any amendment to the MPLX partnership agreement that would adversely affect any rights, preferences or privileges of the preferred units. In addition, upon certain events involving a change of control, the holders of preferred units may elect, among other potential elections, to convert their Series A preferred units to common units at the then change of control conversion rate. | | | | | | | | | | | | | | | |
| Three Months Ended March 31, | | |
| (In millions) | 2022 | | 2021 | | | | |
| Net income attributable to MPLX LP | $ | 825 | | | $ | 739 | | | | | |
| Less: Distributions declared on Series A preferred units | 21 | | | 20 | | | | | |
| | | | | | | |
| Distributions declared on Series B preferred units | 11 | | | 11 | | | | | |
| Limited partners’ distributions declared on MPLX common units (including common units of general partner) | 713 | | | 707 | | | | | |
| | | | | | | |
| Undistributed net gain attributable to MPLX LP | $ | 80 | | | $ | 1 | | | | | |
Approximately 29.6 million Series A preferred units remaining outstanding as | | | | | | | | | | | | | | | | | | | | | | | | | |
| Three Months Ended March 31, 2022 |
| (In millions, except per unit data) | Limited Partners’
Common Units | | | | Series A Preferred Units | | Series B Preferred Units | | Total |
| Basic and diluted net income attributable to MPLX LP per unit | | | | | | | | | |
| Net income attributable to MPLX LP: | | | | | | | | | |
| Distributions declared | $ | 713 | | | | | $ | 21 | | | $ | 11 | | | $ | 745 | |
| Undistributed net gain attributable to MPLX LP | 78 | | | | | 2 | | | — | | | 80 | |
Net income attributable to MPLX LP(1) | $ | 791 | | | | | $ | 23 | | | $ | 11 | | | $ | 825 | |
| Weighted average units outstanding: | | | | | | | | | |
| Basic | 1,015 | | | | | | | | | |
| Diluted | 1,015 | | | | | | | | | |
| Net income attributable to MPLX LP per limited partner unit: | | | | | | | | | |
| Basic | $ | 0.78 | | | | | | | | | |
| Diluted | $ | 0.78 | | | | | | | | | |
(1) Allocation of March 31, 2021. The changes innet income attributable to MPLX LP assumes all earnings for the redeemable preferred balance from December 31, 2020 through March 31, 2021 are summarized below:period had been distributed based on the distribution priorities applicable to the period.
| | | | | |
(In millions) | Redeemable Series A Preferred Units |
Balance at December 31, 2020 | $ | 968 | |
Net income allocated | 20 | |
Distributions received by Series A preferred unitholders | (20) | |
| |
Balance at March 31, 2021 | $ | 968 | |
| | | | | | | | | | | | | | | | | | | | | | | |
| Three Months Ended March 31, 2021 |
| (In millions, except per unit data) | Limited Partners’
Common Units | | Series A Preferred Units | | Series B Preferred Units | | Total |
| Basic and diluted net income attributable to MPLX LP per unit | | | | | | | |
| Net income attributable to MPLX LP: | | | | | | | |
| Distributions declared | $ | 707 | | | $ | 20 | | | $ | 11 | | | $ | 738 | |
| Undistributed net gain attributable to MPLX LP | 1 | | | — | | | — | | | 1 | |
Net income attributable to MPLX LP(1) | $ | 708 | | | $ | 20 | | | $ | 11 | | | $ | 739 | |
| Weighted average units outstanding: | | | | | | | |
| Basic | 1,037 | | | | | | | |
| Diluted | 1,037 | | | | | | | |
| Net income attributable to MPLX LP per limited partner unit: | | | | | | | |
| Basic | $ | 0.68 | | | | | | | |
| Diluted | $ | 0.68 | | | | | | | |
(1) Allocation of net income attributable to MPLX LP assumes all earnings for the period had been distributed based on the distribution priorities applicable to the period.
The Series A preferred units are considered redeemable securities under GAAP due to the existence of redemption provisions upon a deemed liquidation event which is outside MPLX’s control. Therefore, they are presented as temporary equity in the mezzanine section of the Consolidated Balance Sheets. The Series A preferred units have been recorded at their issuance date fair value, net of issuance costs. Income allocations increase the carrying value and declared distributions decrease the carrying value of the Series A preferred units. As the Series A preferred units are not currently redeemable and not probable of becoming redeemable, adjustment to the initial carrying amount is not necessary and would only be required if it becomes probable that the Series A preferred units would become redeemable.
7. Segment Information
MPLX’s chief operating decision maker is the chief executive officer (“CEO”) of its general partner. The CEO reviews MPLX’s discrete financial information, makes operating decisions, assesses financial performance and allocates resources on a type of service basis. MPLX has 2 reportable segments: L&S and G&P. Each of these segments is organized and managed based upon the nature of the products and services it offers.
•L&S – transports, gathers, stores distributes and marketsdistributes crude oil, asphalt, refined petroleum products, and water.other hydrocarbon-based products. Also includes anthe operation of refining logistics, fuels distribution and inland marine business,businesses, terminals, rail facilities, and storage caverns and refining logistics.caverns.
•G&P – gathers, processes and transports natural gas; and gathers, transports, fractionates, stores and markets NGLs.
Our CEO evaluates the performance of our segments using Segment Adjusted EBITDA. Amounts included in net income and excluded from Segment Adjusted EBITDA include: (i) depreciation and amortization; (ii) provision/(benefit) for income taxes; (iii) amortization of deferred financing costs; (iv) extinguishment of debt; (v) non-cash equity-based compensation; (vi) impairment expense; (vii) net interest and other financial costs; (viii)(iii) impairment expense; (iv) income/(loss) from equity method investments; (ix)(v) distributions and adjustments related to equity method investments; (x) unrealized derivative gains/(losses); (xi) acquisition costs; (xii)(vi) noncontrolling interest;interests; and (xiii)(vii) other adjustments as deemed necessary. These items are either: (i) believed to be non-recurring in nature; (ii) not believed to be allocable or controlled by the segment; or (iii) are not tied to the operational performance of the segment.
The tables below present information about revenues and other income, Segment Adjusted EBITDA, restructuring expenses, capital expenditures and investments in unconsolidated affiliates as well as total assets for our reportable segments:
| | | Three Months Ended March 31, | | | Three Months Ended March 31, | |
| (In millions) | (In millions) | 2021 | | 2020 | | (In millions) | 2022 | | 2021 | |
| L&S | L&S | | | | | L&S | | | | |
| Service revenue | Service revenue | $ | 953 | | | $ | 1,004 | | | Service revenue | $ | 983 | | | $ | 953 | | |
| Rental income | Rental income | 249 | | | 242 | | | Rental income | 175 | | | 249 | | |
| Product related revenue | Product related revenue | 4 | | | 19 | | | Product related revenue | 4 | | | 4 | | |
| Sales-type lease revenue | | Sales-type lease revenue | 111 | | | 37 | | |
| Income from equity method investments | Income from equity method investments | 36 | | | 50 | | | Income from equity method investments | 52 | | | 36 | | |
| Other income | Other income | 52 | | | 51 | | | Other income | 12 | | | 15 | | |
Total segment revenues and other income(1) | Total segment revenues and other income(1) | 1,294 | | | 1,366 | | | Total segment revenues and other income(1) | 1,337 | | | 1,294 | | |
Segment Adjusted EBITDA(2) | Segment Adjusted EBITDA(2) | 896 | | | 872 | | | Segment Adjusted EBITDA(2) | 904 | | | 896 | | |
| | Capital expenditures | Capital expenditures | 59 | | | 184 | | | Capital expenditures | 77 | | | 59 | | |
| Investments in unconsolidated affiliates | Investments in unconsolidated affiliates | 9 | | | 54 | | | Investments in unconsolidated affiliates | 68 | | | 9 | | |
| G&P | G&P | | | G&P | | |
| Service revenue | Service revenue | 508 | | | 536 | | | Service revenue | 486 | | | 508 | | |
| Rental income | Rental income | 92 | | | 88 | | | Rental income | 81 | | | 92 | | |
| Product related revenue | Product related revenue | 397 | | | 222 | | | Product related revenue | 661 | | | 397 | | |
| Income/(loss) from equity method investments | 34 | | | (1,234) | | | |
| Other income | 14 | | | 14 | | | |
Total segment revenues and other income/(loss)(1) | 1,045 | | | (374) | | | |
| Income from equity method investments | | Income from equity method investments | 47 | | | 34 | | |
| Other income/(loss) | | Other income/(loss) | (2) | | | 14 | | |
Total segment revenues and other income(1) | | Total segment revenues and other income(1) | 1,273 | | | 1,045 | | |
Segment Adjusted EBITDA(2) | Segment Adjusted EBITDA(2) | 456 | | | 422 | | | Segment Adjusted EBITDA(2) | 489 | | | 456 | | |
| | Capital expenditures | Capital expenditures | 30 | | | 134 | | | Capital expenditures | 95 | | | 30 | | |
| Investments in unconsolidated affiliates | Investments in unconsolidated affiliates | $ | 26 | | | $ | 37 | | | Investments in unconsolidated affiliates | $ | 42 | | | $ | 26 | | |
(1) Within the total segment revenues and other income amounts presented above, third party revenues for the L&S segment were $129$135 million and $158$129 million for the three months ended March 31, 20212022 and 2020,March 31, 2021, respectively. Third party revenues for the G&P segment were $1,212 million and $989 million for the three months ended March 31, 20212022 and third party losses were $425 million for the three months ended March 31, 2020.2021, respectively.
(2) See below for the reconciliation from Segment Adjusted EBITDA to “Net income.”
| | | | | | | | | | | |
| (In millions) | March 31, 2021 | | December 31, 2020 |
| Segment assets | | | |
| Cash and cash equivalents | $ | 24 | | | $ | 15 | |
| L&S | 20,787 | | | 20,938 | |
| G&P | 15,219 | | | 15,461 | |
| Total assets | $ | 36,030 | | | $ | 36,414 | |
The table below provides a reconciliation between “Net income/(loss)”income” and Segment Adjusted EBITDA.
| | | | | | | | | | | | | | | |
| Three Months Ended March 31, | | |
| (In millions) | 2021 | | 2020 | | | | |
| Reconciliation to Net income/(loss): | | | | | | | |
| L&S Segment Adjusted EBITDA | $ | 896 | | | $ | 872 | | | | | |
| G&P Segment Adjusted EBITDA | 456 | | | 422 | | | | | |
| Total reportable segments | 1,352 | | | 1,294 | | | | | |
Depreciation and amortization(1) | (329) | | | (325) | | | | | |
| Provision for income taxes | (1) | | | 0 | | | | | |
| Amortization of deferred financing costs | (17) | | | (14) | | | | | |
| Non-cash equity-based compensation | (3) | | | (5) | | | | | |
| Impairment expense | 0 | | | (2,165) | | | | | |
| Net interest and other financial costs | (220) | | | (216) | | | | | |
| Gain on extinguishment of debt | 12 | | | 0 | | | | | |
| Income/(loss) from equity method investments | 70 | | | (1,184) | | | | | |
| Distributions/adjustments related to equity method investments | (121) | | | (124) | | | | | |
Unrealized derivative (losses)/gains(2) | (3) | | | 15 | | | | | |
| | | | | | | |
| | | | | | | |
| Other | (2) | | | (1) | | | | | |
| Adjusted EBITDA attributable to noncontrolling interests | 10 | | | 9 | | | | | |
| | | | | | | |
| Net income/(loss) | $ | 748 | | | $ | (2,716) | | | | | |
| | | | | | | | | | | | | | | |
| Three Months Ended March 31, | | |
| (In millions) | 2022 | | 2021 | | | | |
| Reconciliation to Net income: | | | | | | | |
| L&S Segment Adjusted EBITDA | $ | 904 | | | $ | 896 | | | | | |
| G&P Segment Adjusted EBITDA | 489 | | | 456 | | | | | |
| Total reportable segments | 1,393 | | | 1,352 | | | | | |
Depreciation and amortization(1) | (313) | | | (329) | | | | | |
| | | | | | | |
| Interest and other financial costs | (222) | | | (225) | | | | | |
| Income from equity method investments | 99 | | | 70 | | | | | |
| Distributions/adjustments related to equity method investments | (132) | | | (121) | | | | | |
| | | | | | | |
| | | | | | | |
| Other | (1) | | | (9) | | | | | |
| Adjusted EBITDA attributable to noncontrolling interests | 9 | | | 10 | | | | | |
| | | | | | | |
| Net income | $ | 833 | | | $ | 748 | | | | | |
(1) Depreciation and amortization attributable to L&S was $130 million and $147 million for the three months ended March 31, 20212022 and $138 million for the three months ended March 31, 2020.2021, respectively. Depreciation and amortization attributable to G&P was $183 million and $182 million for the three months ended March 31, 20212022 and $187 million for the three months ended March 31, 2020.
(2) MPLX makes a distinction between realized and unrealized gains and losses on derivatives. During the period when a derivative contract is outstanding, changes in the fair value of the derivative are recorded as an unrealized gain or loss. When a derivative contract matures or is settled, the previously recorded unrealized gain or loss is reversed and the realized gain or loss of the contract is recorded.2021, respectively.
10. Inventories
Inventories consist of the following:
| | | | | | | | | | | |
| (In millions) | March 31, 2021 | | December 31, 2020 |
| NGLs | $ | 5 | | | $ | 5 | |
| Line fill | 20 | | | 13 | |
| Spare parts, materials and supplies | 103 | | | 100 | |
| Total inventories | $ | 128 | | | $ | 118 | |
11.8. Property, Plant and Equipment
Property, plant and equipment with associated accumulated depreciation is shown below:
| | | | | | | | | | | | | |
| (In millions) | | | March 31, 2021 | | December 31, 2020 |
| L&S | | | | | |
| Pipelines | | | $ | 6,045 | | | $ | 6,026 | |
| Refining logistics | | | 2,335 | | | 2,333 | |
| Terminals | | | 1,649 | | | 1,643 | |
| Marine | | | 965 | | | 965 | |
| Land, building and other | | | 1,584 | | | 1,584 | |
| Construction-in-progress | | | 277 | | | 262 | |
| Total L&S property, plant and equipment | | | 12,855 | | | 12,813 | |
| G&P | | | | | |
| Gathering and transportation | | | 7,559 | | | 7,547 | |
| Processing and fractionation | | | 5,725 | | | 5,721 | |
| Land, building and other | | | 510 | | | 507 | |
| Construction-in-progress | | | 288 | | | 287 | |
| Total G&P property, plant and equipment | | | 14,082 | | | 14,062 | |
| Total property, plant and equipment | | | 26,937 | | | 26,875 | |
| Less accumulated depreciation | | | 5,941 | | | 5,657 | |
| Property, plant and equipment, net | | | $ | 20,996 | | | $ | 21,218 | |
Long-lived assets used in operations are assessed for impairment whenever changes in facts and circumstances indicate that the carrying value of the assets may not be recoverable based on the expected undiscounted future cash flow of an asset group. For purposes of impairment evaluation, long-lived assets must be grouped at the lowest level for which independent cash flows can be identified, which is at least at the segment level and in some cases for similar assets in the same geographic region where cash flows can be separately identified. If the sum of the undiscounted cash flows is less than the carrying value of an asset group, fair value is calculated, and the carrying value is written down if greater than the calculated fair value.
During the first quarter of 2020, we identified an impairment trigger relating to asset groups within our Western G&P reporting unit as a result of significant impacts to forecasted cash flows for these asset groups resulting from the first quarter events and circumstances as discussed in Note 1. The cash flows associated with these assets were significantly impacted by volume declines reflecting decreased forecasted producer customer production as a result of lower commodity prices. After assessing each asset group within the Western G&P reporting unit for impairment, only the East Texas G&P asset group resulted in the fair value of the underlying assets being less than the carrying value. As a result, an impairment of $174 million was recorded to “Impairment expense” on the Consolidated Statements of Income in the first quarter of 2020. No additional impairments have been recorded since that time. | | | | | | | | | | | | | | | | | | | | | | | | | | | | | | | | | | | | | |
| | | March 31, 2022 | | December 31, 2021 |
| (In millions) | | | Gross PP&E | | Accumulated Depreciation | | Net PP&E | | Gross PP&E | | Accumulated Depreciation | | Net PP&E |
| L&S | | | $ | 12,438 | | | $ | 3,347 | | | $ | 9,091 | | | $ | 12,371 | | | $ | 3,227 | | | $ | 9,144 | |
| G&P | | | 14,253 | | | 3,432 | | | 10,821 | | | 14,175 | | | 3,277 | | | 10,898 | |
| Total | | | $ | 26,691 | | | $ | 6,779 | | | $ | 19,912 | | | $ | 26,546 | | | $ | 6,504 | | | $ | 20,042 | |
12. Goodwill and Intangibles
Goodwill
MPLX annually evaluates goodwill for impairment as of November 30, as well as whenever events or changes in circumstances indicate it is more likely than not that the fair value of a reporting unit with goodwill is less than its carrying amount. There were no impairments recorded as a result of our November 30, 2020 annual goodwill impairment evaluation.
During the first quarter of 2020, we determined that an interim impairment analysis of the goodwill recorded was necessary based on consideration of a number of first quarter events and circumstances as discussed in Note 1. Our producer customers in our Eastern G&P region reduced production forecasts and drilling activity in response to the global economic downturn. Additionally, a decline in NGL prices impacted our future revenue forecast. After performing our evaluations related to the interim impairment of goodwill during the first quarter of 2020, we recorded an impairment of $1,814 million within the Eastern G&P reporting unit, which was recorded to “Impairment expense” on the Consolidated Statements of Income. The
impairment was primarily driven by additional guidance related to the slowing of drilling activity, which reduced production growth forecasts from our producer customers.
Changes in the carrying amount of goodwill were as follows:
| | | | | | | | | | | | | | | | | |
| (In millions) | L&S | | G&P | | Total |
| Gross goodwill as of December 31, 2019 | $ | 7,722 | | | $ | 3,141 | | | $ | 10,863 | |
| Accumulated impairment losses | 0 | | | (1,327) | | | (1,327) | |
| Balance as of December 31, 2019 | 7,722 | | | 1,814 | | | 9,536 | |
| Impairment losses | 0 | | | (1,814) | | | (1,814) | |
| | | | | |
| Wholesale Exchange (Note 3) | (65) | | | 0 | | | (65) | |
| Balance as of December 31, 2020 | 7,657 | | | 0 | | | 7,657 | |
| | | | | |
| | | | | |
| | | | | |
| Balance as of March 31, 2021 | 7,657 | | | 0 | | | 7,657 | |
| | | | | |
| Gross goodwill as of March 31, 2021 | 7,657 | | | 3,141 | | | 10,798 | |
| Accumulated impairment losses | 0 | | | (3,141) | | | (3,141) | |
| Balance as of March 31, 2021 | $ | 7,657 | | | $ | 0 | | | $ | 7,657 | |
Intangible Assets
During the first quarter of 2020, we also determined that an impairment analysis of intangibles within our Western G&P reporting unit was necessary. See Note 11 for additional information regarding our assessment around the Western G&P reporting unit, and more specifically our East Texas G&P asset group. The fair value of the intangibles in our East Texas G&P asset group was determined based on applying the multi-period excess earnings method, which is an income approach. Key assumptions included management’s best estimates of the expected future cash flows from existing customers, customer attrition rates and the discount rate. After performing our evaluations related to the impairment of intangible assets associated with our East Texas G&P asset group during the first quarter of 2020, we recorded an impairment of $177 million to “Impairment expense” on the Consolidated Statements of Income related to our customer relationships. No additional impairments have been recorded since that time.
MPLX’s remaining intangible assets are comprised of customer contracts and relationships. Gross intangible assets with accumulated amortization as of March 31, 2021 and December 31, 2020 is shown below:
| | | | | | | | | | | | | | | | | | | | | | | | | | | | | | | | | | | | | | | | | | | | |
| | | | March 31, 2021 | | December 31, 2020 |
| (In millions) | | Useful Lives | | Gross | | Accumulated Amortization(1) | | Net | | Gross | | Accumulated Amortization(2) | | Net |
| L&S | | 6 - 8 years | | $ | 283 | | | $ | (90) | | | $ | 193 | | | $ | 283 | | | $ | (81) | | | $ | 202 | |
| G&P | | 6 - 25 years | | 1,288 | | | (554) | | | 734 | | | 1,288 | | | (531) | | | 757 | |
| | | | $ | 1,571 | | | $ | (644) | | | $ | 927 | | | $ | 1,571 | | | $ | (612) | | | $ | 959 | |
(1) Amortization expense attributable to the L&S and G&P segments for the three months ended March 31, 2021 was $9 million and $23 million, respectively.
(2) Impairment charge of $177 million is included within the G&P accumulated amortization.
Estimated future amortization expense related to the intangible assets at March 31, 2021 is as follows:
| | | | | | | | |
| (In millions) | | |
| 2021 | | $ | 95 | |
| 2022 | | 127 | |
| 2023 | | 127 | |
| 2024 | | 127 | |
| 2025 | | 113 | |
| Thereafter | | 338 | |
| Total | | $ | 927 | |
13.9. Fair Value Measurements
Fair Values – Recurring
Fair value measurements and disclosures relate primarily to MPLX’s derivative positions as discussed in Note 14. The following table presents the financial instruments carried at fair value on a recurring basis as of March 31, 2021 and December 31, 2020 by fair value hierarchy level. MPLX has elected to offset the fair value amounts recognized for multiple derivative contracts executed with the same counterparty.
| | | | | | | | | | | | | | | | | | | | | | | |
| March 31, 2021 | | December 31, 2020 |
| (In millions) | Assets | | Liabilities | | Assets | | Liabilities |
| | | | | | | |
| | | | | | | |
| Significant unobservable inputs (Level 3) | | | | | | | |
| | | | | | | |
| | | | | | | |
| Embedded derivatives in commodity contracts | $ | 0 | | | $ | (66) | | | $ | 0 | | | $ | (63) | |
| Total carrying value on Consolidated Balance Sheets | $ | 0 | | | $ | (66) | | | $ | 0 | | | $ | (63) | |
Level 3 instruments include all NGL transactions and embedded derivatives in commodity contracts. Therelate to an embedded derivative liability relates tofor a natural gas purchase commitment embedded in a keep-whole processing agreement. The fair value calculation for these Level 3 instruments used significant unobservable inputs including: (1) NGL prices interpolated and extrapolated due to inactive markets ranging from $0.48$0.73 to $1.36$2.38 per gallon with a weighted average of $0.62$0.97 per gallon and (2) the probability of renewal of 100 percent for the first five-year term and second five-yearrenewal term of the gas purchase commitment and related keep-whole processing agreement. Increases or decreases in the fractionation spread result in an increase or decrease in the fair value of the embedded derivative liability, respectively. Beyond the embedded derivative discussed above, we had no outstanding commodity derivative contracts as of March 31, 20212022 or December 31, 2020.2021.
Changes in Level 3 Fair Value Measurements
The following table is a reconciliation of the net beginning and ending balances recorded for net assets and liabilities classified as Level 3 in the fair value hierarchy.
| | | | | | | | | | | | | | | | | | | | | | | | | | | |
| Three Months Ended March 31, 2021 | | Three Months Ended March 31, 2020 |
| (In millions) | Commodity Derivative Contracts (net) | | | | Embedded Derivatives in Commodity Contracts (net) | | Commodity Derivative Contracts (net) | | | | Embedded Derivatives in Commodity Contracts (net) |
| Fair value at beginning of period | $ | 0 | | | | | $ | (63) | | | $ | 0 | | | | | $ | (60) | |
Total (losses)/gains (realized and unrealized) included in earnings(1) | 0 | | | | | (6) | | | 0 | | | | | 14 | |
| Settlements | 0 | | | | | 3 | | | 0 | | | | | 1 | |
| | | | | | | | | | | |
| Fair value at end of period | 0 | | | | | (66) | | | 0 | | | | | (45) | |
| The amount of total (losses)/gains for the period included in earnings attributable to the change in unrealized gains or losses relating to liabilities still held at end of period | $ | 0 | | | | | $ | (5) | | | $ | 0 | | | | | $ | 13 | |
| | | | | | | | | | | | | | | | | | | |
| | | | | Three Months Ended March 31, |
| | | | | 2022 | | | | | | 2021 |
| (In millions) | | | | | Embedded Derivatives in Commodity Contracts (net) | | | | | | Embedded Derivatives in Commodity Contracts (net) |
| Fair value at beginning of period | | | | | $ | (108) | | | | | | | $ | (63) | |
Total gain/(loss) (realized and unrealized) included in earnings(1) | | | | | 4 | | | | | | | (6) | |
| Settlements | | | | | 5 | | | | | | | 3 | |
| | | | | | | | | | | |
| Fair value at end of period | | | | | (99) | | | | | | | (66) | |
| The amount of total gain/(loss) for the period included in earnings attributable to the change in unrealized gain/(loss) relating to liabilities still held at end of period | | | | | $ | 5 | | | | | | | $ | (5) | |
(1) Gains and losses on commodity derivative contracts classified as Level 3 are recorded in “Product sales”on the Consolidated Statements of Income. Gains and lossesGain/(loss) on derivatives embedded in commodity contracts are recorded in “Purchased product costs” and “Cost of revenues” on the Consolidated Statements of Income.
Fair Values – Reported
MPLX’s primary financial instruments are cash and cash equivalents, receivables, receivables from related parties, lease receivables from related parties, accounts payable, payables to related parties and long-term debt. MPLX’s fair value assessment incorporates a variety of considerations, including (1) the duration of the instruments, (2) MPC’s investment-grade credit rating and (3) the historical incurrence of and expected future insignificance of bad debt expense, which includes an evaluation of counterparty credit risk. MPLX believes the carrying values of its current assets and liabilities approximate fair value. The recorded value of the amounts outstanding under the bank revolving credit facility, if any, approximates fair value
due to the variable interest rate that approximatesapproximate current market rates. Derivative instruments are recorded at fair value, based on available market information (see Note 14)10).
The fair value of MPLX’s long-term debt is estimated based on recent market non-binding indicative quotes. The long-term debt fair values are considered Level 3 measurements. The following table summarizes the fair value and carrying value of our third-party debt, excluding finance leases:leases and unamortized debt issuance costs:
| | | | | | | | | | | | | | | | | | | | | | | |
| March 31, 2021 | | December 31, 2020 |
| (In millions) | Fair Value | | Carrying Value | | Fair Value | | Carrying Value |
| Long-term debt (including amounts due within one year) | $ | 21,988 | | | $ | 20,156 | | | $ | 22,951 | | | $ | 20,244 | |
| | | | | | | | | | | | | | | | | | | | | | | |
| March 31, 2022 | | December 31, 2021 |
| (In millions) | Fair Value | | Carrying Value | | Fair Value | | Carrying Value |
Outstanding debt(1) | $ | 20,392 | | | $ | 19,864 | | | $ | 20,779 | | | $ | 18,664 | |
(1) Amounts outstanding under the MPC Loan Agreement are not included in the table above, as the carrying value approximates fair value. This balance is reflected in “Current liabilities - related parties” on the Consolidated Balance Sheets.
14.10. Derivative Financial Instruments
As of March 31, 2021,2022, MPLX had no outstanding commodity contracts beyond the embedded derivative discussed below.
Embedded Derivative - MPLX has a natural gas purchase commitment embedded in a keep-whole processing agreement with a producer customer in the Southern Appalachian region expiring in December 2022.2027. The customer has the unilateral option to extend the agreement for 2 consecutive 1 five-year termsterm through December 2032. For accounting purposes, the natural gas purchase commitment and the term extending options haveoption has been aggregated into a single compound embedded derivative. The probability of the customer exercising its optionsoption is determined based on assumptions about the customer’s potential business strategy decision points that may exist at the time they would elect whether to renew the contract. The changes in fair value of this compound embedded derivative are based on the difference between the contractual and index pricing, the probability of the producer customer exercising its option to extend and the estimated favorability of these contracts compared to current market conditions. The changes in fair value are recorded in earnings through “Purchased product costs” on the Consolidated Statements of Income. For further information regarding the fair value measurement of derivative instruments, see Note 9. As of March 31, 20212022 and December 31, 2020,2021, the estimated fair value of this contract was a liability of $66$99 million and $63$108 million, respectively.
Certain derivative positions are subject to master netting agreements, therefore, MPLX has elected to offset derivative assets and liabilities that are legally permissible to be offset. As of March 31, 20212022 and December 31, 2020,2021, there were no derivative assets or liabilities that were offset on the Consolidated Balance Sheets. The impact of MPLX’s derivative instruments on its Consolidated Balance Sheets is summarized below:
| | | | | | | | | | | | | | | | | | | | | | | |
| (In millions) | March 31, 2021 | | December 31, 2020 |
| Derivative contracts not designated as hedging instruments and their balance sheet location | Asset | | Liability | | Asset | | Liability |
Commodity contracts(1) | | | | | | | |
| Other current assets / Other current liabilities | $ | 0 | | | $ | (10) | | | $ | 0 | | | $ | (7) | |
| Other noncurrent assets / Deferred credits and other liabilities | 0 | | | (56) | | | 0 | | | (56) | |
| Total | $ | 0 | | | $ | (66) | | | $ | 0 | | | $ | (63) | |
| | | | | | | | | | | | | | | | | | | | | | | |
| (In millions) | March 31, 2022 | | December 31, 2021 |
| Derivative contracts not designated as hedging instruments and their balance sheet location | Asset | | Liability | | Asset | | Liability |
Commodity contracts(1) | | | | | | | |
| Other current assets / Other current liabilities | $ | — | | | $ | (16) | | | $ | — | | | $ | (15) | |
| Other noncurrent assets / Deferred credits and other liabilities | — | | | (83) | | | — | | | (93) | |
| Total | $ | — | | | $ | (99) | | | $ | — | | | $ | (108) | |
(1) Includes the embedded derivativesderivative in the commodity contracts ascontract discussed above.
For further information regardingWe make a distinction between realized or unrealized gains and losses on derivatives. During the period when a derivative contract is outstanding, changes in the fair value measurement of the derivative instruments, see Note 13. There were no material changes to MPLX’s policy regardingare recorded as an unrealized gain or loss. When a derivative contract matures or is settled, the accounting for Level 2previously recorded unrealized gain or loss is reversed and Level 3 instruments as previously disclosed in MPLX’s Annual Report on Form 10-K for the year ended December 31, 2020.
realized gain or loss of the contract is recorded. The impact of MPLX’s derivative contracts not designated as hedging instruments and the location of gains and losses recognized on the Consolidated Statements of Income is summarized below: | | | | | | | | | | | | | | | |
| Three Months Ended March 31, | | |
| (In millions) | 2021 | | 2020 | | | | |
| | | | | | | |
| | | | | | | |
| | | | | | | |
| | | | | | | |
| Purchased product costs | | | | | | | |
| Realized (loss)/gain | $ | (3) | | | $ | (1) | | | | | |
| Unrealized (loss)/gain | (3) | | | 15 | | | | | |
| Purchased product costs derivative (loss)/gain | (6) | | | 14 | | | | | |
| | | | | | | |
| | | | | | | |
| | | | | | | |
| | | | | | | |
| | | | | | | |
| Total derivative (loss)/gain | $ | (6) | | | $ | 14 | | | | | |
| | | | | | | | | | | | | | | |
| Three Months Ended March 31, | | |
| (In millions) | 2022 | | 2021 | | | | |
| | | | | | | |
| | | | | | | |
| | | | | | | |
| | | | | | | |
| Purchased product costs | | | | | | | |
| Realized loss | $ | (5) | | | $ | (3) | | | | | |
| Unrealized gain/(loss) | 9 | | | (3) | | | | | |
| Purchased product cost derivative gain/(loss) | $ | 4 | | | $ | (6) | | | | | |
| | | | | | | |
| | | | | | | |
| | | | | | | |
| | | | | | | |
| | | | | | | |
| | | | | | | |
15.11. Debt
MPLX’s outstanding borrowings consist of the following:
| | | | | | | | | | | |
| (In millions) | March 31, 2021 | | December 31, 2020 |
| MPLX LP: | | | |
| | | |
| Bank revolving credit facility | $ | 835 | | | $ | 175 | |
| | | |
| | | |
| | | |
| | | |
| Floating rate senior notes | 1,000 | | | 1,000 | |
| | | |
| | | |
| | | |
| | | |
| | | |
| | | |
| | | |
| | | |
| | | |
| | | |
| | | |
| | | |
| | | |
| | | |
| | | |
| | | |
| | | |
| | | |
| | | |
| | | |
| | | |
| Fixed rate senior notes | 18,532 | | | 19,240 | |
| Consolidated subsidiaries: | | | |
| MarkWest | 23 | | | 23 | |
| ANDX | 45 | | | 87 | |
| | | |
Financing lease obligations(1) | 10 | | | 11 | |
| Total | 20,445 | | | 20,536 | |
| Unamortized debt issuance costs | (112) | | | (116) | |
| Unamortized discount/premium | (279) | | | (281) | |
| Amounts due within one year | (2) | | | (764) | |
| Total long-term debt due after one year | $ | 20,052 | | | $ | 19,375 | |
(1) See Note 20 for lease information. | | | | | | | | | | | |
| (In millions) | March 31, 2022 | | December 31, 2021 |
| MPLX LP: | | | |
| | | |
| MPLX Credit Agreement | $ | — | | | $ | 300 | |
| | | |
| | | |
| | | |
| | | |
| | | |
| | | |
| | | |
| | | |
| | | |
| | | |
| | | |
| | | |
| | | |
| | | |
| | | |
| | | |
| | | |
| | | |
| | | |
| | | |
| | | |
| | | |
| | | |
| | | |
| | | |
| | | |
| | | |
| Fixed rate senior notes | 20,032 | | | 18,532 | |
| Consolidated subsidiaries: | | | |
| MarkWest | 23 | | | 23 | |
| ANDX | 45 | | | 45 | |
| | | |
| Financing lease obligations | 8 | | | 9 | |
| Total | 20,108 | | | 18,909 | |
| Unamortized debt issuance costs | (116) | | | (102) | |
| Unamortized discount/premium | (236) | | | (236) | |
| Amounts due within one year | (999) | | | (499) | |
| Total long-term debt due after one year | $ | 18,757 | | | $ | 18,072 | |
Credit Agreement
MPLX’s amended and restated revolving credit facilityagreement (as amended, the “MPLX Credit Agreement”), has a borrowing capacity ofprovides for borrowings up to $3.5 billion and a term that extends to July 2024. During the three months ended March 31, 2021,2022, MPLX borrowed $1.91 billion$900 million under the MPLX Credit Agreement, at an average interest rate of 1.3471.451 percent, and repaid $1.25 billion.$1,200 million. At March 31, 2021,2022, MPLX had $835 million inno outstanding borrowings and less than $1 million in letters of credit outstanding under the MPLX Credit Agreement, resulting in total availability of $2.67$3.5 billion, or 76.1100 percent of the borrowing capacity.
Floating Rate Senior Notes18
Fixed Rate Senior Notes
MPLX’s senior notes, including those issued by consolidated subsidiaries, consist of various series of senior notes expiringmaturing between 2022 and 2058 with interest rates ranging from 1.750 percent to 5.500 percent. Interest on each series of notes is payable semi-annually in arrears on various dates depending on the series of the notes.
On December 29, 2020,March 14, 2022, MPLX announced the redemption of $750 million outstandingissued $1.5 billion aggregate principal amount of 5.2504.950 percent senior notes due January 15, 2025, including approximately $42 million aggregate principal amount of senior notes issued by Andeavor Logistics LP. These amounts are included on the Consolidated Balance Sheet at December 31, 2020 as “Long-term debt due within one year”.March 2052 (the “2052 Senior Notes”) in an underwritten public offering. The notes2052 Senior Notes were redeemed on January 15, 2021offered at a price equal to 102.625 percent of the principal amount, which resulted in a payment of $20 million related to the note premium offset bypublic of 98.982 percent with interest payable semi-annually in arrears, commencing on September 14, 2022. The net proceeds were used to repay amounts outstanding under the immediate recognition of $12 million of unamortized debt premiumMPC Intercompany Loan Agreement and issuance costs, which resulted in a loss on extinguishment of debt of $8 million that is included on the Consolidated Statements of Income as “Other financial costs”.MPLX Credit Agreement.
16.12. Revenue
Disaggregation of Revenue
The following tables represent a disaggregation of revenue for each reportable segment for the three months ended March 31, 20212022 and 2020:2021:
| | | Three Months Ended March 31, 2021 | | Three Months Ended March 31, 2022 |
| (In millions) | (In millions) | L&S | | G&P | | Total | (In millions) | L&S | | G&P | | Total |
| Revenues and other income: | Revenues and other income: | | | | | | Revenues and other income: | | | | | |
| Service revenue | Service revenue | $ | 84 | | | $ | 505 | | | $ | 589 | | Service revenue | $ | 72 | | | $ | 482 | | | $ | 554 | |
| Service revenue - related parties | Service revenue - related parties | 869 | | | 3 | | | 872 | | Service revenue - related parties | 911 | | | 4 | | | 915 | |
| Service revenue - product related | Service revenue - product related | 0 | | | 77 | | | 77 | | Service revenue - product related | — | | | 123 | | | 123 | |
| Product sales | Product sales | 1 | | | 281 | | | 282 | | Product sales | 1 | | | 496 | | | 497 | |
| Product sales - related parties | Product sales - related parties | 3 | | | 39 | | | 42 | | Product sales - related parties | 3 | | | 42 | | | 45 | |
| Total revenues from contracts with customers | Total revenues from contracts with customers | $ | 957 | | | $ | 905 | | | 1,862 | | Total revenues from contracts with customers | $ | 987 | | | $ | 1,147 | | | 2,134 | |
| | Non-ASC 606 revenue(1) | Non-ASC 606 revenue(1) | | 477 | | Non-ASC 606 revenue(1) | | 476 | |
| Total revenues and other income | Total revenues and other income | | $ | 2,339 | | Total revenues and other income | | $ | 2,610 | |
| | | Three Months Ended March 31, 2020 | | Three Months Ended March 31, 2021 |
| (In millions) | (In millions) | L&S | | G&P | | Total | (In millions) | L&S | | G&P | | Total |
| Revenues and other income: | Revenues and other income: | | | | | | Revenues and other income: | | | | | |
| Service revenue | Service revenue | $ | 84 | | | $ | 528 | | | $ | 612 | | Service revenue | $ | 84 | | | $ | 505 | | | $ | 589 | |
| Service revenue - related parties | Service revenue - related parties | 920 | | | 8 | | | 928 | | Service revenue - related parties | 869 | | | 3 | | | 872 | |
| Service revenue - product related | Service revenue - product related | 0 | | | 39 | | | 39 | | Service revenue - product related | — | | | 77 | | | 77 | |
| Product sales | Product sales | 15 | | | 154 | | | 169 | | Product sales | 1 | | | 281 | | | 282 | |
| Product sales - related parties | Product sales - related parties | 4 | | | 29 | | | 33 | | Product sales - related parties | 3 | | | 39 | | | 42 | |
| Total revenues from contracts with customers | Total revenues from contracts with customers | $ | 1,023 | | | $ | 758 | | | 1,781 | | Total revenues from contracts with customers | $ | 957 | | | $ | 905 | | | 1,862 | |
| Non-ASC 606 (loss)/revenue(1) | | (789) | | |
| Non-ASC 606 revenue(1) | | Non-ASC 606 revenue(1) | | 477 | |
| Total revenues and other income | Total revenues and other income | | $ | 992 | | Total revenues and other income | | $ | 2,339 | |
(1) Non-ASC 606 Revenue includes rental income, income/(loss)sales-type lease revenue, income from equity method investments, derivative gains and losses, mark-to-market adjustments, and other income.
Contract Balances
Contract assets typically relate to deficiency payments related to minimum volume commitments and aid in construction agreements where the revenue recognized and MPLX’s rights to consideration for work completed exceeds the amount billed to the customer. Contract assets are included in “Other current assets” and “Other noncurrent assets” on the Consolidated Balance Sheets.
Contract liabilities, which we refer to as “Deferred revenue” and “Long-term deferred revenue,” typically relate to advance payments for aid in construction agreements and deferred customer credits associated with makeup rights and minimum volume commitments. Related to minimum volume commitments, breakage is estimated and recognized into service revenue in
instances where it is probable the customer will not use the credit in future periods. We classify contract liabilities as current or long-term based on the timing of when we expect to recognize revenue.
“Receivables, net” primarily relate to our commodity sales. Portions of the “Receivables, net” balance are attributed to the sale of commodity product controlled by MPLX prior to sale while a significant portion of the balance relates to the sale of commodity product on behalf of our producer customers. The sales and related “Receivable,“Receivables, net” are commingled and excluded from the table below. MPLX remits the net sales price back to our producer customers upon completion of the sale. Each period end, certain amounts within accounts payable relate to our payments to producer customers. Such amounts are not deemed material at period end as a result of when we settle with each producer.
The tables below reflect the changes in our contract balances for the three-month periods ended March 31, 20212022 and 2020:
| | | | | | | | | | | | | | | | | | | | | | | | | | | | | |
| (In millions) | Balance at December 31, 2020(1) | | Additions/ (Deletions) | | Revenue Recognized(2) | | | | Balance at
March 31, 2021 | | | | |
| Contract assets | $ | 40 | | | $ | (27) | | | $ | 0 | | | | | $ | 13 | | | | | |
| Long-term contract assets | 2 | | | 0 | | | 0 | | | | | 2 | | | | | |
| Deferred revenue | 37 | | | 7 | | | (1) | | | | | 43 | | | | | |
| Deferred revenue - related parties | 91 | | | 21 | | | (20) | | | | | 92 | | | | | |
| Long-term deferred revenue | 119 | | | 4 | | | 0 | | | | | 123 | | | | | |
| Long-term deferred revenue - related parties | 48 | | | (4) | | | 0 | | | | | 44 | | | | | |
| Long-term contract liability | $ | 6 | | | $ | 0 | | | $ | 0 | | | | | $ | 6 | | | | | |
| | (In millions) | (In millions) | Balance at December 31, 2019(1) | | Additions/ (Deletions) | | Revenue Recognized(2) | | | Balance at
March 31, 2020 | | (In millions) | Balance at December 31, 2021(1) | | Additions/ (Deletions) | | Revenue Recognized(2) | | | Balance at March 31, 2022 | |
| Contract assets | Contract assets | $ | 39 | | | $ | (27) | | | $ | 0 | | | | $ | 12 | | | Contract assets | $ | 25 | | | $ | (18) | | | $ | — | | | | $ | 7 | | |
| | Long-term contract assets | | Long-term contract assets | 2 | | | — | | | — | | | | 2 | | |
| Deferred revenue | Deferred revenue | 23 | | | 5 | | | (3) | | | | 25 | | | Deferred revenue | 56 | | | 11 | | | (9) | | | | 58 | | |
| Deferred revenue - related parties | Deferred revenue - related parties | 53 | | | 12 | | | (16) | | | | 49 | | | Deferred revenue - related parties | 60 | | | 34 | | | (26) | | | | 68 | | |
| Long-term deferred revenue | Long-term deferred revenue | 90 | | | 6 | | | 0 | | | | 96 | | | Long-term deferred revenue | 135 | | | 2 | | | — | | | | 137 | | |
| Long-term deferred revenue - related parties | Long-term deferred revenue - related parties | $ | 55 | | | $ | 1 | | | $ | 0 | | | | $ | 56 | | | Long-term deferred revenue - related parties | 31 | | | — | | | — | | | | 31 | | |
| | Long-term contract liabilities | | Long-term contract liabilities | $ | 5 | | | $ | — | | | $ | — | | | | $ | 5 | | |
| | | | | | | | | | | | | | | | | | | | | | | | | | | | | |
| (In millions) | Balance at December 31, 2020(1) | | Additions/ (Deletions) | | Revenue Recognized(2) | | | | Balance at
March 31, 2021 | | | | |
| Contract assets | $ | 40 | | | $ | (27) | | | $ | — | | | | | $ | 13 | | | | | |
| Long-term contract assets | 2 | | | — | | | — | | | | | 2 | | | | | |
| Deferred revenue | 37 | | | 7 | | | (1) | | | | | 43 | | | | | |
| Deferred revenue - related parties | 91 | | | 21 | | | (20) | | | | | 92 | | | | | |
| Long-term deferred revenue | 119 | | | 4 | | | — | | | | | 123 | | | | | |
| Long-term deferred revenue - related parties | 48 | | | (4) | | | — | | | | | 44 | | | | | |
| Long-term contract liabilities | $ | 6 | | | $ | — | | | $ | — | | | | | $ | 6 | | | | | |
(1) Balance represents ASC 606 portion of each respective line item.
(2) NaNNo significant revenue was recognized related to past performance obligations in the current periods.
Remaining Performance Obligations
The table below includes estimated revenue expected to be recognized in the future related to performance obligations that are unsatisfied (or partially unsatisfied) at the end of the reporting period.
As of March 31, 2021,2022, the amounts allocated to contract assets and contract liabilities on the Consolidated Balance Sheets are $301$293 million and are reflected in the amounts below. This will be recognized as revenue as the obligations are satisfied, which is expected to occur over the next 2322 years. Further, MPLX does not disclose variable consideration due to volume variability in the table below.
| | (In millions) | (In millions) | | (In millions) | |
| 2021 | $ | 1,435 | | |
| 2022 | 2022 | 1,838 | | 2022 | $ | 1,432 | |
| 2023 | 2023 | 1,674 | | 2023 | 1,771 | |
| 2024 | 2024 | 1,546 | | 2024 | 1,633 | |
| 2025 and thereafter | 4,580 | | |
Total revenue on remaining performance obligations(1),(2),(3) | $ | 11,073 | | |
| 2025 | | 2025 | 1,560 | |
| 2026 and thereafter | | 2026 and thereafter | 3,362 | |
Total revenue on remaining performance obligations(1)(2)(3) | | Total revenue on remaining performance obligations(1)(2)(3) | $ | 9,758 | |
(1) All fixed consideration from contracts with customers is included in the amounts presented above. Variable consideration that is constrained or not required to be estimated as it reflects our efforts to perform is excluded.
(2) Arrangements deemed implicit leases are included in “Rental income” and sales-type leases are excluded from this table.
(3) Only minimum volume commitments that are deemed fixed are included in the table above. MPLX has various minimum volume commitments in processing arrangements that vary based on the actual Btu content of the gas received. These amounts are deemed variable consideration and are excluded from the table above.
We do not disclose information on the future performance obligations for any contract with an original expected duration of
one year or less.
17.13. Supplemental Cash Flow Information
| | | | Three Months Ended March 31, | | Three Months Ended March 31, |
| (In millions) | (In millions) | 2021 | | 2020 | (In millions) | 2022 | | 2021 |
| Net cash provided by operating activities included: | Net cash provided by operating activities included: | | | | Net cash provided by operating activities included: | | | |
| Interest paid (net of amounts capitalized) | Interest paid (net of amounts capitalized) | $ | 231 | | | $ | 210 | | Interest paid (net of amounts capitalized) | $ | 213 | | | $ | 231 | |
| | Non-cash investing and financing activities: | | |
| Net transfers of property, plant and equipment (to)/from materials and supplies inventories | $ | 0 | | | $ | (1) | | |
| |
The Consolidated Statements of Cash Flows exclude changes to the Consolidated Balance Sheets that diddo not affect cash. The following is the change of additions to property, plant and equipment related to capital accruals:
| | | | | | | | | | | |
| | Three Months Ended March 31, |
| (In millions) | 2021 | | 2020 |
| | | |
| Decrease in capital accruals | $ | (37) | | | $ | (61) | |
| | | |
| | | |
| | | | | | | | | | | |
| | Three Months Ended March 31, |
| (In millions) | 2022 | | 2021 |
| | | |
| Increase/(decrease) in capital accruals | $ | 3 | | | $ | (37) | |
| | | |
| | | |
18. Accumulated Other Comprehensive Loss
MPLX LP records an accumulated other comprehensive loss on the Consolidated Balance Sheets relating to pension and other post-retirement benefits provided by LOOP LLC (“LOOP”) and Explorer Pipeline Company (“Explorer”) to their employees. MPLX LP is not a sponsor of these benefit plans.
The following table shows the changes in “Accumulated other comprehensive loss” by component during the period December 31, 2020 through March 31, 2021.
| | | | | | | | | | | | | | | | | |
| (In millions) | Pension
Benefits | | Other
Post-Retirement Benefits | | Total |
Balance at December 31, 2020(1) | $ | (13) | | | $ | (2) | | | $ | (15) | |
Other comprehensive loss - remeasurements(2) | (2) | | | 0 | | | (2) | |
| | | | | |
| | | | | |
| | | | | |
| | | | | |
| | | | | |
| | | | | |
Balance at March 31, 2021(1) | $ | (15) | | | $ | (2) | | | $ | (17) | |
The following table shows the changes in “Accumulated other comprehensive loss” by component during the period December 31, 2019 through March 31, 2020.
| | | | | | | | | | | | | | | | | |
| (In millions) | Pension
Benefits | | Other
Post-Retirement Benefits | | Total |
Balance at December 31, 2019(1) | $ | (14) | | | $ | (1) | | | $ | (15) | |
Other comprehensive loss - remeasurements(2) | 0 | | | (1) | | | (1) | |
| | | | | |
| | | | | |
| | | | | |
| | | | | |
| | | | | |
Balance at March 31, 2020(1) | $ | (14) | | | $ | (2) | | | $ | (16) | |
(1) These components of “Accumulated other comprehensive loss” are included in the computation of net periodic benefit cost by LOOP and Explorer and are therefore included on the Consolidated Statements of Income under the caption “Income/(loss) from equity method investments.”
(2) Components of other comprehensive income/loss - remeasurements relate to actuarial gains and losses as well as amortization of prior service costs. MPLX records an adjustment to “Comprehensive income” in accordance with its ownership interest in LOOP and Explorer.
19. Equity-Based Compensation
Phantom Units
The following is a summary of phantom unit award activity of MPLX LP common units for the three months ended March 31, 2021:
| | | | | | | | | | | |
| | Number
of Units | | Weighted
Average
Fair Value |
| Outstanding at December 31, 2020 | 644,023 | | | $ | 28.65 | |
| Granted | 321,927 | | | 24.88 | |
| | | |
| Settled | (143,088) | | | 29.73 | |
| Forfeited | (1,270) | | | 33.09 | |
| Outstanding at March 31, 2021 | 821,592 | | | $ | 26.98 | |
Performance Units
The following is a summary of the activity for performance unit awards to be settled in MPLX LP common units for the three months ended March 31, 2021:
| | | | | |
| Number of
Units |
Outstanding at December 31, 2020 | 3,092,286 | |
Granted | 375,730 | |
Settled | (1,347,177) | |
Forfeited | (1,761) | |
Outstanding at March 31, 2021 | 2,119,078 | |
No new performance unit awards were granted during the three months ended March 31, 2021. The performance units shown above as granted represents subsequent tranches of the 2020 and 2019 performance unit awards that were subject to a performance condition based on MPLX LP’s 2021 distributable cash flow, which, due to the nature of the award terms, did not meet the criteria for a grant date fair value until the first quarter of 2021, at which time we began recognizing units and expense related to these tranches. Grant date fair value of the performance condition is based on potential payouts of up to $2.00 per unit. Compensation cost associated with the performance condition is based on the grant date fair value of the payout deemed most probable to occur and is adjusted as the expectation for payout changes.
20. Leases
During the first quarter of 2020, reimbursements for projects at certain MPLX refining logistics locations were agreed to between MPLX and MPC. These reimbursements relate to the storage services agreements between MPLX and MPC at these locations and required the embedded leases within these agreements to be reassessed under the leasing standard. As a result of the reassessment, one of our leases was reclassified from an operating lease to a sales-type lease. As a result, the underlying assets previously shown on the Consolidated Balance Sheets associated with the sales-type lease were derecognized and the net investment in the lease (i.e., the sum of the present value of the future lease payments and the unguaranteed residual value of the assets) was recorded as a lease receivable. See Note 5 for the location of lease receivables and unguaranteed residual assets on the Consolidated Balance Sheets. The difference between the net book value of the underlying assets and the net investment in the lease has been recorded as a Contribution from MPC in the Consolidated Statements of Equity given that the transaction related to refining logistics was a common control transaction. During the first quarter of 2020, MPLX derecognized approximately $171 million of property, plant and equipment, recorded a lease receivable of approximately $370 million, recorded an unguaranteed residual asset of approximately $10 million and a Contribution from MPC of $209 million.
Lease revenues included on the Consolidated Statements of Income were as follows:
| | | | | | | | | | | | | | | | | | | | | | | |
| Three Months Ended March 31, 2021 | | Three Months Ended March 31, 2020 |
| (In millions) | Related Party | | Third Party | | Related Party | | Third Party |
| Operating leases: | | | | | | | |
Operating lease revenue(1) | $ | 202 | | | $ | 68 | | | $ | 186 | | | $ | 63 | |
| | | | | | | |
| Sales-type leases: | | | | | | | |
| Profit/(loss) recognized at the commencement date | 0 | | | 0 | | | 0 | | | N/A |
| Interest income (Sales-type lease revenue- fixed minimum) | 37 | | | 0 | | | 38 | | | N/A |
| Interest income (Revenue from variable lease payments) | $ | 0 | | | $ | 0 | | | $ | 0 | | | N/A |
(1) These amounts are presented net of executory costs.
21.14. Commitments and Contingencies
MPLX is the subject of, or a party to, a number of pending or threatened legal actions, contingencies and commitments involving a variety of matters, including laws and regulations relating to the environment. Some of these matters are discussed below. For matters for which MPLX has not recorded a liability, MPLX is unable to estimate a range of possible loss because the issues involved have not been fully developed through pleadings, discovery or court proceedings. However, the ultimate resolution of some of these contingencies could, individually or in the aggregate, be material.
Environmental Matters –
MPLX is subject to federal, state and local laws and regulations relating to the environment. These laws generally provide for control of pollutants released into the environment and require responsible parties to undertake remediation of hazardous waste disposal sites. Penalties may be imposed for non-compliance.
At March 31, 20212022 and December 31, 2020,2021, accrued liabilities for remediation totaled $18$42 million and $17$23 million, respectively. It is not presently possible to estimate the ultimate amount of all remediation costs that might be incurred or the penalties, if any, that may be imposed. At March 31, 2021 and December 31, 2020, there were 0 balances with MPC for indemnification of environmental costs.
MPLX is involved in environmental enforcement matters arising in the ordinary course of business. While the outcome and impact to MPLX cannot be predicted with certainty, management believes the resolution of these environmental matters will not, individually or collectively, have a material adverse effect on its consolidated results of operations, financial position or cash flows.
MPLX is also a party to a number of other lawsuits and other proceedings arising in the ordinary course of business. While the ultimate outcome and impact to MPLX cannot be predicted with certainty, management believes the resolution of these other lawsuits and proceedings will not, individually or collectively, have a material adverse effect on its consolidated financial position, results of operations or cash flows.
Guarantees
Guarantees
–
Over the years, MPLX has sold various assets in the normal course of its business. Certain of the related agreements contain performance and general guarantees, including guarantees regarding inaccuracies in representations, warranties, covenants and agreements, and environmental and general indemnifications that require MPLX to perform upon the occurrence of a triggering event or condition. These guarantees and indemnifications are part of the normal course of selling assets. MPLX is typically not able to calculate the maximum potential amount of future payments that could be made under such contractual provisions because of the variability inherent in the guarantees and indemnities. Most often, the nature of the guarantees and indemnities is such that there is no appropriate method for quantifying the exposure because the underlying triggering event has little or no past experience upon which a reasonable prediction of the outcome can be based.
In connection with ourWe hold a 9.19 percent indirect interest in a joint venture (“Dakota Access”) that owns and operates the Dakota Access Pipeline and Energy Transfer Crude Oil Pipeline projects, collectively referred to as the Bakken Pipeline system or DAPL, weDAPL. In 2020, the
U.S. District Court for the District of Columbia (the “D.D.C.”) ordered the U.S. Army Corps of Engineers (“Army Corps”), which granted permits and an easement for the Bakken Pipeline system, to prepare an environmental impact statement (“EIS”) relating to an easement under Lake Oahe in North Dakota. The D.D.C. later vacated the easement. The EIS is currently expected to be completed in the second half of 2022.
In May 2021, the D.D.C. denied a renewed request for an injunction to shut down the pipeline while the EIS is being prepared. In June 2021, the D.D.C. issued an order dismissing without prejudice the tribes’ claims against the Dakota Access Pipeline. The litigation could be reopened or new litigation challenging the EIS, once completed, could be filed. The pipeline remains operational.
We have entered into a Contingent Equity Contribution Agreement whereby MPLX LP, along with the other joint venture owners in the Bakken Pipeline system, has agreed to make equity contributions to the joint venture upon certain events occurring to allow the entities that own and operate the Bakken Pipeline system to satisfy their senior note payment obligations.
The senior notes were issued to repay amounts owed by the pipeline companies to fund the cost of construction of the Bakken Pipeline system.
In March 2020, the U.S. District Court for the District of Columbia (the “D.D.C.”) ordered the U.S. Army Corps of Engineers (“Army Corps”), which granted permits and an easement for the Bakken Pipeline system, to conduct a full environmental impact statement (“EIS”), and further requested briefing on whether an easement necessary for the operation of the Bakken Pipeline system should be vacated while the EIS is being prepared.
On July 6, 2020, the D.D.C. ordered vacatur of the easement to cross Lake Oahe during the pendency of an EIS and further ordered a shut down of the pipeline by August 5, 2020. The D.D.C. denied a motion to stay that order. Dakota Access and the Army Corps appealed the D.D.C.’s orders to the U.S. Court of Appeals for the District of Columbia Circuit (the “Court of Appeals”). On July 14, 2020, the Court of Appeals issued an administrative stay while the court considered Dakota Access and the Army Corps’ emergency motion for stay pending appeal. On August 5, 2020, the Court of Appeals stayed the D.D.C.’s injunction that required the pipeline be shutdown and emptied of oil by August 5, 2020. The Court of Appeals denied a stay of the D.D.C.’s March order, which required the EIS, and further denied a stay of the D.D.C.’s July order, which vacated the easement. On January 26, 2021, the Court of Appeals upheld the D.D.C.’s order vacating the easement while the Army Corps prepares the EIS. The Court of Appeals reversed the D.D.C.’s order to the extent it directed that the pipeline be shutdown and emptied of oil. In the D.D.C., briefing has been completed for a renewed request for an injunction. The pipeline remains operational.
If the pipeline iswere temporarily shut down, pending completion of the EIS, MPLX would have to contribute its 9.19 percent pro rata share of funds required to pay interest accruing on the notes and any portion of the principal that matures while the pipeline is shutdown. MPLX also expects to contribute its 9.19 percent pro rata share of any costs to remediate any deficiencies to reinstate the permit and/or return the pipeline into operation. If the vacatur of the easement permit results in a permanent shutdown of the pipeline, MPLX would have to contribute its 9.19 percent pro rata share of the cost to redeem the bonds (including the 1%one percent redemption premium required pursuant to the indenture governing the notes) and any accrued and unpaid interest. As of March 31, 2021,2022, our maximum potential undiscounted payments under the Contingent Equity Contribution Agreement were approximately $230$170 million.
Other Legal Proceedings
–
In early July 2020, Tesoro High Plains Pipeline Company, LLC (“THPP”), a subsidiary of MPLX, received a Notification of Trespass Determination from the Bureau of Indian Affairs (“BIA”) relating to a portion of the Tesoro High Plains Pipeline that crosses the Fort Berthold Reservation in North Dakota. The notification covered the rights of way for 23 tracts of land and demanded the immediate cessation of pipeline operations. The notification alsooperations and assessed trespass damages of approximately $187 million. THPP appealed this determination, which triggered an automatic stay of the requested pipeline shutdown and payment. On October 29,appeal, the Assistant Secretary - Indian Affairs issued an order vacating the BIA’s trespass order and requiringremanded to the Regional Director for the BIA Great Plains Region to issue a new decision based on or before December 15 covering all 34 tracts at issue.specific criteria. On December 15, 2020, the Regional Director of the BIA issued a new trespass notice to THPP, consistent with the Assistant Secretary - Indian Affairs order vacating the prior trespass order. The new order foundfinding that THPP was in trespass and assessedassessing trespass damages of approximately $4 million (including interest), which has been paid. The order also required that THPP to immediately cease and desist use of the portion of the pipeline that crosses the property at issue. THPP has complied with the Regional Director’s December 15, 2020 notice. On February 12, 2021, landowners filed suit in the U.S. District Court for the District of North Dakota (the “District of North Dakota”) against THPP, the Department of the Interior, the Assistant Secretary - Indian Affairs, the Interior Board of Indian Appeals and the BIA, requesting, among other things, that decisions by the Assistant Secretary - Indian Affairs and the Interior Board of Indian Appeals be vacated as to the award of damages to plaintiffs. In March 2021, THPP received a copy of an order purporting to vacate all orders related to THPP’s alleged trespass issued by the BIA between July 2, 2020 and January 14, 2021. The order directs the Regional Director of the BIA to reconsider the issue of THPP’s alleged trespass and issue a new order, if necessary, after all interested parties have had an opportunity to be heard. Subsequently, landowners voluntarily dismissed the suit filed in the District of North Dakota. On April 23, 2021, THPP filed a lawsuit in the District of North Dakota against the United States of America, the U.S. Department of the Interior and the BIA (together, the “U.S. Government Parties”) challenging the March order purporting to vacate all previous orders related to THPP’s alleged trespass.
On February 8, 2022, the U.S. Government Parties filed their answer to THPP’s suit, asserting counterclaims for trespass and ejectment. The U.S. Government Parties claim THPP is in continued trespass with respect to the pipeline and seek disgorgement of pipeline profits from June 1, 2013 to present, removal of the pipeline and remediation. We intend to vigorously defend ourselves against these counterclaims. We continue to work towards a settlement of this matter with holders of the property rights at issue.
Contractual Commitments and Contingencies
– At March 31, 2021, MPLX’s contractual commitments to acquire property, plant and equipment totaled $101 million. These commitments were primarily related to G&P plant expansion, terminal and pipeline projects. In addition, from
From time to time and in the ordinary course of business, MPLX and its affiliates provide guarantees of MPLX’s subsidiaries payment and performance obligations in the G&P segment. Certain natural gas processing and gathering arrangements require MPLX to construct new natural gas processing plants, natural gas gathering pipelines and
NGL pipelines and contain certain fees and charges if specified construction milestones are not achieved for reasons other than force majeure. In certain cases, certain producers may have the right to cancel the processing arrangements if there are significant delays that are not due to force majeure. As of March 31, 2021,2022, management does not believe there are any indications that MPLX will not be able to meet the construction milestones, that force majeure does not apply or that such fees and charges will otherwise be triggered.
Item 2. Management’s Discussion and Analysis of Financial Condition and Results of Operations
Management’s Discussion and Analysis of Financial Condition and Results of Operations should also be read in conjunction with the unaudited consolidated financial statements and accompanying footnotes included under Item 1. Financial Statements and in conjunction with our Annual Report on Form 10-K for the year ended December 31, 2020.2021.
Disclosures Regarding Forward-Looking Statements
This Quarterly Report on Form 10-Q, particularly Management’s Discussion and Analysis of Financial Condition and Results of Operations and Quantitative and Qualitative Disclosures about Market Risk, includes forward-looking statements that are subject to risks, contingencies or uncertainties. You can identify forward-looking statements by words such as “anticipate,” “believe,” “commitment,” “could,” “design,” “estimate,” “expect,” “forecast,” “goal,” “guidance,” “imply,” “intend,” “may,” “objective,” “opportunity,” “outlook,” “plan,” “policy,” “position,” “potential,” “predict,” “priority,” “project,” “proposition,” “prospective,” “pursue,” “seek,” “should,” “strategy,” “target,” “will,” “would” or other similar expressions that convey the uncertainty of future events or outcomes.
Forward-looking statements include, among other things, statements regarding:
•future financial and operating results;
•environmental, social and governance (“ESG”) goals and targets, including those related to greenhouse gas emissions, diversity and inclusion and ESG reporting;
•our plans to achieve our ESG goals and targets and to monitor and report progress thereon;
•the success or timing of completion of ongoing or anticipated capital or maintenance projects;
•the timing and amount of future distributions or unit repurchases; and
•the anticipated effects of actions of third parties such as competitors, activist investors, federal, foreign, state or local regulatory authorities, or plaintiffs in litigation.
Our forward-looking statements are not guarantees of future performance and you should not rely unduly on them, as they involve risks, uncertainties and assumptions that we cannot predict.assumptions. Material differences between actual results and any future performance suggested in our forward-looking statements could result from a variety of factors, including the following:
•the continuance or escalation of the military conflict between Russia and Ukraine, and related sanctions;
•general economic, political or regulatory developments, including inflation, changes in governmental policies relating to refined petroleum products, crude oil, natural gas or NGLs, or taxation;
•the magnitude, duration and durationextent of future resurgences of the COVID-19 pandemic and its restrictions, including travel restrictions, business and school closures, increased remote work, stay-at-home orders and other actions taken by individuals, governments and the private sector to stem the spread of the virus;
•the ability of MPC to achieve its strategic objectives and the effects of those strategic decisions on us;
•further impairments;
•negative capital market conditions, including an increase of the current yield on common units;
•the ability to achieve strategic and financial objectives, including with respect to distribution coverage, future distribution levels, proposed projects and completed transactions;
•the success of MPC’s portfolio optimization, including the ability to complete any divestitures on commercially reasonable terms and/or within the expected timeframe, and the effects of any such divestitures on theour business, financial condition, results of operations and cash flows;
•adverse changes in laws including with respect to tax and regulatory matters;
•the adequacy of capital resources and liquidity, including the availability of sufficient cash flow to pay distributions and access to debt on commercially reasonable terms, and the ability to successfully execute business plans, growth strategies and self-funding models;
•the timing and extent of changes in commodity prices and demand for crude oil, refined products, feedstocks or other hydrocarbon-based products;
•volatility in or degradation of market and industry conditions;
•changes to the expected construction costs and timing of projects and planned investments, and the ability to obtain regulatory and other approvals with respect thereto;
•completion of midstream infrastructure by competitors;
•disruptions due to equipment interruption or failure, including electrical shortages and power grid failures;
•the suspension, reduction or termination of MPC’s obligations under MPLX’s commercial agreements;
•modifications to financial policies, capital budgets, and earnings and distributions;
•the ability to manage disruptions in credit markets or changes to credit ratings;
•compliance with federal and state environmental, economic, health and safety, energy and other policies and regulations or enforcement actions initiated thereunder;
•adverse results in litigation;
•the reliability of processing units and other equipment;
•the effect of restructuring or reorganization of business components;
•the potential effects of changes in tariff rates on our business, financial condition, results of operations and cash flows;
•changes in foreign imports and exports of crude oil, refined products, natural gas and NGLs;
•changes in producer customers’ drilling plans or in volumes of throughput of crude oil, natural gas, NGLs, refined products or other hydrocarbon-based products;
•changes in the cost or availability of third-party vessels, pipelines, railcars and other means of transportation for crude oil, natural gas, NGLs, feedstocks and refined products;
•the price, availability and acceptance of alternative fuels and alternative-fuel vehicles and laws mandating such fuels or vehicles;
•actions taken by our competitors, including pricing adjustments and the expansion and retirement of pipeline capacity, processing, fractionation and treating facilities in response to market conditions;
•expectations regarding joint venture arrangements and other acquisitions or divestitures of assets;
•midstream and refining industry overcapacity or under capacity;
•accidents or other unscheduled shutdowns affecting our machinery, pipelines, processing, fractionation and treating facilities or equipment, means of transportation, or those of our suppliers or customers;
•acts of war, terrorism or civil unrest that could impair our ability to gather, process, fractionate or transport crude oil, natural gas, NGLs or refined products; and
•political pressure and influence of environmental groups upon policies and decisions related to the production, gathering, refining, processing, fractionation, transportation and marketing of crude oil or other feedstocks, refined products, natural gas, NGLs or other hydrocarbon-based products.
For additional risk factors affecting our business, see the risk factors described in our Annual Report on Form 10-K for the year ended December 31, 2020.2021. We undertake no obligation to update any forward-looking statementsstatement except to the extent required by applicable law.
MPLX OVERVIEWOverview
We are a diversified, large-cap MLP formed by MPC, that owns and operates midstream energy infrastructure and logistics assets, and provides fuels distribution services. We areThe business consists of two segments based on the nature of services it offers: Logistics and Storage (“L&S”), and Gathering and Processing (“G&P”). The L&S segment is engaged in the gathering, transportation, storage and distribution of crude oil, refined products and refined petroleum products;other hydrocarbon-based products. The L&S segment also includes the operation of our refining logistics, fuels distribution and inland marine businesses, terminals, rail facilities and storage caverns. The G&P segment provides gathering, processing and transportation of natural gas; and the gathering, transportation, fractionation, storage and marketing of NGLs. Our operations are conducted in our Logistics and Storage and Gathering and Processing segments.
SIGNIFICANT FINANCIAL AND OTHER HIGHLIGHTSSignificant Financial and Other Highlights
Significant financial highlights including revenues and other income, income from operations, net income, adjusted EBITDA attributable to MPLX and DCF attributable to GP and LP unitholders for the three months ended March 31, 20212022 and March 31, 20202021 are shown in the chart below. See the Non-GAAP Financial Information section below for the definitions of Adjusted EBITDA and DCF and the Results of Operations section for further details regarding changes in these metrics.
Other Highlights
•Announced a first quarter 2021 distribution rate of $0.6875 per common unit.
•During the first quarter of 2021, we returned $155 million to unitholders through the repurchase of 6,272,981 public common units under our unit repurchase program. As of March 31, 2021, total repurchases of $188 million have been made under the unit repurchase program since the program was launched in the fourth quarter of 2020.
•In line with previously announced efforts around portfolio optimization, the company closed on the sale of our Javelina plant in Corpus Christi, Texas, on February 12, 2021, for $70 million of cash in addition to future consideration contingent on the performance of the facility.
•On January 15, 2021 we redeemed $750 million outstanding aggregate principal amount of 5.250 percent senior notes due January 15, 2025, at 102.625 percent of the principal amount.
CURRENT ECONOMIC ENVIRONMENT
During the first quarter of 2021, we have seen improvement in the environment in which our business operates as COVID-19 impacts are beginning to subside. The increased availability of vaccinations, coupled with an easing of COVID-19 restrictions in certain areas, has been followed by an increase in economic activity, the opening of many businesses and schools and an increase in in-person interaction and associated travel.
In the first quarter of 2020, the outbreak of COVID-19 and its development into a pandemic resulted in significant economic disruption globally. Actions taken by various governmental authorities, individuals and companies around the world to prevent the spread of COVID-19 through social distancing restricted travel, many business operations, public gatherings and the overall level of individual movement and in-person interaction across the globe. This significantly reduced global economic activity and resulted in a decline in the demand for products for which we provide midstream services. Macroeconomic conditions and global geopolitical events have also resulted in significant price volatility related to those aforementioned products.
We took actions to respond to the impacts that these matters have had on our business including:
•Emphasizing strict capital discipline by focusing on investments that deliver the most attractive returns
•Identifying areas where we can reduce operating expenses across the business
•Evaluating and high-grading our capital portfolio
Many uncertainties remain with respectOther Highlights
•Generated net cash provided by operating activities of $1,125 million and free cash flow of $850 million in the first quarter of 2022.
•Announced a first quarter 2022 distribution of $0.7050 per common unit, resulting in a distribution coverage ratio of 1.65x for the first quarter.
•Returned $100 million of cash to COVID-19unitholders through the repurchase of over 3 million common units under our unit repurchase program.
•Issued $1.5 billion aggregate principal amount of 4.950 percent senior notes due March 2052 (the “2052 Senior Notes”) in an underwritten public offering. The net proceeds were used to repay amounts outstanding under the MPC Intercompany Loan Agreement and the MPLX Credit Agreement.
Current Economic Environment
Through the first three months of 2022, we continue to see recovery in the environment in which our business operates. We are unable to predict the ultimate economic impacts frompotential effects that further resurgences of COVID-19 and how quickly economies can fully recover to pre-pandemic levels. We believe we have proactively addressed manyor the continuance or escalation of the known impactsmilitary conflict between Russia and Ukraine may have on our financial position and results. In response to this business environment, MPLX remains focused on executing its strategic priorities of COVID-19 to the extent possiblestrict capital discipline, embedding a low-cost culture, and will strive to continue to do so, but there can be no guarantee the measures will be fully effective.portfolio optimization.
NON-GAAP FINANCIAL INFORMATIONNon-GAAP Financial Information
Our management uses a variety of financial and operating metrics to analyze our performance. These metrics are significant factors in assessing our operating results and profitability and include the non-GAAP financial measures of Adjusted EBITDA, DCF, free cash flow (“FCF”) and excess/deficitfree cash flow.flow after distributions. The amount of Adjusted EBITDA and DCF generated is considered by the board of directors of our general partner in approving MPLX’s cash distributions. Management also utilizes Segment Adjusted EBITDA in evaluating the financial performance of our segments. The use of this measure allows investors to understand how management evaluates financial performance to make operating decisions and allocate resources.
We define Adjusted EBITDA as net income adjusted for: (i) depreciation and amortization; (ii) provision/(benefit) for income taxes; (iii) amortization of deferred financing costs; (iv) (gain)/loss on extinguishment of debt; (v) non-cash equity-based compensation; (vi) impairment expense; (vii) net interest and other financial costs; (viii) income/(loss)(iv) impairment expense; (v) income from equity method investments; (ix)(vi) distributions and adjustments related to equity method investments; (x) unrealized derivative gains/(losses); (xi) acquisition costs; (xii)(vii) noncontrolling interest;interests; and (xiii)(viii) other adjustments as deemed necessary. We also use DCF, which we define as Adjusted EBITDA adjusted for: (i) deferred revenue impacts; (ii) sales-type lease payments, net of income; (iii) net interest and other financial costs; (iii)(iv) net maintenance capital expenditures; (iv)(v) equity method investment capital expenditures paid out; and (v)(vi) other adjustments as deemed necessary. We make a distinction between realized and unrealized gains and losses on derivatives. DuringSegment Adjusted EBITDA represents Adjusted EBITDA attributable to the period when a derivative contract is outstanding, changes in the fair value of the derivative are recorded as an unrealized gain or loss. When a derivative contract matures or is settled, the previously recorded unrealized gain or loss is reversed and the realized gain or loss of the contract is recorded.reportable segments.
We define FCF as net cash provided by operating activities adjusted for (i) net cash used in investing activities; (ii) cash contributions from MPC; (iii) cash contributions from noncontrolling interests and (iv) cash distributions to noncontrolling interests. We define excess/deficitfree cash flow after distributions as FCF adjusted forless base distributions to common and preferred unitholders.
We believe that the presentation of Adjusted EBITDA, DCF, FCF and excess/deficitfree cash flow after distributions provides useful information to investors in assessing our financial condition and results of operations. The GAAP measures most directly comparable to Adjusted EBITDA and DCF are net income and net cash provided by operating activities while the GAAP measure most directly comparable to FCF and excess/deficitfree cash flow after distributions is net cash provided by operating activities. These non-GAAP financial measures should not be considered alternatives to GAAP net income or net cash provided by operating activities as they have important limitations as analytical tools because they exclude some but not all items that affect net income and net cash provided by operating activities or any other measure of financial performance or liquidity presented in accordance with GAAP. These non-GAAP financial measures should not be considered in isolation or as substitutes for analysis of our results as reported under GAAP. Additionally, because non-GAAP financial measures may be defined differently by other companies in our industry, our definitions may not be comparable to similarly titled measures of other companies, thereby diminishing their utility. For a reconciliation of Adjusted EBITDA and DCF to their most directly comparable measures calculated and presented in accordance with GAAP, see the Results of Operations section. For a reconciliation of FCF and excess/deficitfree cash flow after distributions to their most directly comparable measure calculated and presented in accordance with GAAP, see the Liquidity and Capital resources section.
Management also utilizes Segment Adjusted EBITDA in evaluating the financial performanceComparability of our segments. The use of this measure allows investors to understand how management evaluates financial performance to make operating decisions and allocate resources.Financial Results
COMPARABILITY OF OUR FINANCIAL RESULTS
Our acquisitions and dispositions haveThe Javelina divestiture, which was completed on February 12, 2021, has impacted comparability of our financial results (see Note 3 ofresults. Prior to the Notes to Consolidated Financial Statements).sale, Javelina was reported within the G&P segment.
During the normal course of business, we amend or modify our contractual agreements with customers. These amendments or modifications require the agreements to be reassessed under ASC 842, which can impact the classification of revenues or costs associated with the agreement. These reassessments may impact the comparability of our financial results.
RESULTS OF OPERATIONSResults of Operations
The following tables and discussion are a summary of our results of operations for the three months ended March 31, 20212022 and 2020,2021, including a reconciliation of Adjusted EBITDA and DCF from “Net income” and “Net cash provided by operating activities,” to the most directly comparable GAAP financial measures.
| | | | Three Months Ended March 31, | | | Three Months Ended March 31, | |
| (In millions) | (In millions) | 2021 | | 2020 | | Variance | | (In millions) | 2022 | | 2021 | | Variance | |
| Revenues and other income: | | Revenues and other income: | | | | | | |
| Total revenues and other income(1) | $ | 2,339 | | | $ | 992 | | | $ | 1,347 | | | |
| Total revenues and other income | | Total revenues and other income | $ | 2,610 | | | $ | 2,339 | | | $ | 271 | | |
| Costs and expenses: | Costs and expenses: | | | Costs and expenses: | | |
| Cost of revenues (excludes items below) | Cost of revenues (excludes items below) | 273 | | | 368 | | | (95) | | | Cost of revenues (excludes items below) | 287 | | | 273 | | | 14 | | |
| Purchased product costs | Purchased product costs | 276 | | | 135 | | | 141 | | | Purchased product costs | 467 | | | 276 | | | 191 | | |
| Rental cost of sales | Rental cost of sales | 32 | | | 35 | | | (3) | | | Rental cost of sales | 37 | | | 32 | | | 5 | | |
| Rental cost of sales - related parties | Rental cost of sales - related parties | 39 | | | 46 | | | (7) | | | Rental cost of sales - related parties | 15 | | | 39 | | | (24) | | |
| Purchases - related parties | Purchases - related parties | 298 | | | 276 | | | 22 | | | Purchases - related parties | 319 | | | 298 | | | 21 | | |
| Depreciation and amortization | Depreciation and amortization | 329 | | | 325 | | | 4 | | | Depreciation and amortization | 313 | | | 329 | | | (16) | | |
| Impairment expense | — | | | 2,165 | | | (2,165) | | | |
| | General and administrative expenses | General and administrative expenses | 86 | | | 97 | | | (11) | | | General and administrative expenses | 78 | | | 86 | | | (8) | | |
| | Other taxes | Other taxes | 32 | | | 31 | | | 1 | | | Other taxes | 34 | | | 32 | | | 2 | | |
| Total costs and expenses | Total costs and expenses | 1,365 | | | 3,478 | | | (2,113) | | | Total costs and expenses | 1,550 | | | 1,365 | | | 185 | | |
| Income/(loss) from operations | 974 | | | (2,486) | | | 3,460 | | | |
| Income from operations | | Income from operations | 1,060 | | | 974 | | | 86 | | |
| Related party interest and other financial costs | Related party interest and other financial costs | — | | | 3 | | | (3) | | | Related party interest and other financial costs | 4 | | | — | | | 4 | | |
| Interest expense, net of amounts capitalized | Interest expense, net of amounts capitalized | 198 | | | 211 | | | (13) | | | Interest expense, net of amounts capitalized | 198 | | | 198 | | | — | | |
| Other financial costs | Other financial costs | 27 | | | 16 | | | 11 | | | Other financial costs | 20 | | | 27 | | | (7) | | |
| Income/(loss) before income taxes | 749 | | | (2,716) | | | 3,465 | | | |
| Income before income taxes | | Income before income taxes | 838 | | | 749 | | | 89 | | |
| Provision for income taxes | Provision for income taxes | 1 | | | — | | | 1 | | | Provision for income taxes | 5 | | | 1 | | | 4 | | |
| Net income/(loss) | 748 | | | (2,716) | | | 3,464 | | | |
| Net income | | Net income | 833 | | | 748 | | | 85 | | |
| Less: Net income attributable to noncontrolling interests | Less: Net income attributable to noncontrolling interests | 9 | | | 8 | | | 1 | | | Less: Net income attributable to noncontrolling interests | 8 | | | 9 | | | (1) | | |
| | Net income/(loss) attributable to MPLX LP | 739 | | | (2,724) | | | 3,463 | | | |
| Net income attributable to MPLX LP | | Net income attributable to MPLX LP | 825 | | | 739 | | | 86 | | |
| Adjusted EBITDA attributable to MPLX LP(2) | 1,352 | | | 1,294 | | | 58 | | | |
Adjusted EBITDA attributable to MPLX LP(1) | | Adjusted EBITDA attributable to MPLX LP(1) | 1,393 | | | 1,352 | | | 41 | | |
| DCF attributable to GP and LP unitholders(2) | $ | 1,106 | | | $ | 1,047 | | | $ | 59 | | | |
DCF attributable to GP and LP unitholders(1) | | DCF attributable to GP and LP unitholders(1) | $ | 1,178 | | | $ | 1,106 | | | $ | 72 | | |
|
(1) The three months ended March 31, 2020 includes impairment expense of approximately $1.3 billion related to three equity method investments.
(2) Non-GAAP measure. See reconciliation below to the most directly comparable GAAP measures.
| | | | Three Months Ended March 31, | | | Three Months Ended March 31, | |
| (In millions) | (In millions) | 2021 | | 2020 | | Variance | | (In millions) | 2022 | | 2021 | | Variance | |
| Reconciliation of Adjusted EBITDA attributable to MPLX LP and DCF attributable to GP and LP unitholders from Net income: | Reconciliation of Adjusted EBITDA attributable to MPLX LP and DCF attributable to GP and LP unitholders from Net income: | | | | | | | Reconciliation of Adjusted EBITDA attributable to MPLX LP and DCF attributable to GP and LP unitholders from Net income: | | | | | | |
| Net income/(loss) | $ | 748 | | | $ | (2,716) | | | $ | 3,464 | | | |
| Net income | | Net income | $ | 833 | | | $ | 748 | | | $ | 85 | | |
| Provision for income taxes | Provision for income taxes | 1 | | | — | | | 1 | | | Provision for income taxes | 5 | | | 1 | | | 4 | | |
| Amortization of deferred financing costs | 17 | | | 14 | | | 3 | | | |
| Gain on extinguishment of debt | (12) | | | — | | | (12) | | | |
| Net interest and other financial costs | 220 | | | 216 | | | 4 | | | |
| Income/(loss) from operations | 974 | | | (2,486) | | | 3,460 | | | |
| Interest and other financial costs | | Interest and other financial costs | 222 | | | 225 | | | (3) | | |
| Income from operations | | Income from operations | 1,060 | | | 974 | | | 86 | | |
| Depreciation and amortization | Depreciation and amortization | 329 | | | 325 | | | 4 | | | Depreciation and amortization | 313 | | | 329 | | | (16) | | |
| Non-cash equity-based compensation | 3 | | | 5 | | | (2) | | | |
| Impairment expense | — | | | 2,165 | | | (2,165) | | | |
| (Income)/loss from equity method investments | (70) | | | 1,184 | | | (1,254) | | | |
| | Income from equity method investments | | Income from equity method investments | (99) | | | (70) | | | (29) | | |
| Distributions/adjustments related to equity method investments | Distributions/adjustments related to equity method investments | 121 | | | 124 | | | (3) | | | Distributions/adjustments related to equity method investments | 132 | | | 121 | | | 11 | | |
Unrealized derivative losses/(gains)(1) | 3 | | | (15) | | | 18 | | | |
| | Other | Other | 2 | | | 1 | | | 1 | | | Other | (4) | | | 8 | | | (12) | | |
| Adjusted EBITDA | Adjusted EBITDA | 1,362 | | | 1,303 | | | 59 | | | Adjusted EBITDA | 1,402 | | | 1,362 | | | 40 | | |
| Adjusted EBITDA attributable to noncontrolling interests | Adjusted EBITDA attributable to noncontrolling interests | (10) | | | (9) | | | (1) | | | Adjusted EBITDA attributable to noncontrolling interests | (9) | | | (10) | | | 1 | | |
| Adjusted EBITDA attributable to MPLX LP(2) | 1,352 | | | 1,294 | | | 58 | | | |
| Adjusted EBITDA attributable to MPLX LP | | Adjusted EBITDA attributable to MPLX LP | 1,393 | | | 1,352 | | | 41 | | |
| Deferred revenue impacts | Deferred revenue impacts | 22 | | | 23 | | | (1) | | | Deferred revenue impacts | 24 | | | 22 | | | 2 | | |
| Net interest and other financial costs | (220) | | | (216) | | | (4) | | | |
| Maintenance capital expenditures | (18) | | | (34) | | | 16 | | | |
| Maintenance capital expenditures reimbursements | 7 | | | 14 | | | (7) | | | |
| Sales-type lease payments, net of income | | Sales-type lease payments, net of income | 5 | | | — | | | 5 | | |
Net interest and other financial costs(1) | | Net interest and other financial costs(1) | (204) | | | (220) | | | 16 | | |
| Maintenance capital expenditures, net of reimbursements | | Maintenance capital expenditures, net of reimbursements | (14) | | | (11) | | | (3) | | |
| Equity method investment capital expenditures paid out | Equity method investment capital expenditures paid out | (1) | | | (7) | | | 6 | | | Equity method investment capital expenditures paid out | (3) | | | (1) | | | (2) | | |
| | Other | Other | (5) | | | 4 | | | (9) | | | Other | 9 | | | (5) | | | 14 | | |
| | DCF | DCF | 1,137 | | | 1,078 | | | 59 | | | DCF | 1,210 | | | 1,137 | | | 73 | | |
| Preferred unit distributions | Preferred unit distributions | (31) | | | (31) | | | — | | | Preferred unit distributions | (32) | | | (31) | | | (1) | | |
| DCF attributable to GP and LP unitholders | DCF attributable to GP and LP unitholders | $ | 1,106 | | | $ | 1,047 | | | $ | 59 | | | DCF attributable to GP and LP unitholders | $ | 1,178 | | | $ | 1,106 | | | $ | 72 | | |
|
(1) MPLX makes a distinction between realizedExcludes gain/ loss on extinguishment of debt and unrealized gains and losses on derivatives. During the period when a derivative contract is outstanding, changes in the fair valueamortization of the derivative are recorded as an unrealized gain or loss. When a derivative contract matures or is settled, the previously recorded unrealized gain or loss is reversed and the realized gain or loss of the contract is recorded.
(2) For the three months ended March 31, 2021, the L&S and G&P segments made up $896 million and $456 million of Adjusted EBITDA attributable to MPLX LP, respectively. For the three months ended March 31, 2020, the L&S and G&P segments made up $872 million and $422 million of Adjusted EBITDA attributable to MPLX LP, respectively.deferred financing costs.
| | | | Three Months Ended March 31, | | Three Months Ended March 31, |
| (In millions) | (In millions) | 2021 | | 2020 | | Variance | (In millions) | 2022 | | 2021 | | Variance |
| Reconciliation of Adjusted EBITDA attributable to MPLX LP and DCF attributable to GP and LP unitholders from Net cash provided by operating activities: | Reconciliation of Adjusted EBITDA attributable to MPLX LP and DCF attributable to GP and LP unitholders from Net cash provided by operating activities: | | | | | | Reconciliation of Adjusted EBITDA attributable to MPLX LP and DCF attributable to GP and LP unitholders from Net cash provided by operating activities: | | | | | |
| Net cash provided by operating activities | Net cash provided by operating activities | $ | 1,124 | | | $ | 1,009 | | | $ | 115 | | Net cash provided by operating activities | $ | 1,125 | | | $ | 1,124 | | | $ | 1 | |
| Changes in working capital items | Changes in working capital items | 34 | | | 112 | | | (78) | | Changes in working capital items | 118 | | | 37 | | | 81 | |
| All other, net | All other, net | (15) | | | (30) | | | 15 | | All other, net | (45) | | | (15) | | | (30) | |
| Non-cash equity-based compensation | 3 | | | 5 | | | (2) | | |
| Gain on extinguishment of debt | | Gain on extinguishment of debt | — | | | (12) | | | 12 | |
Net interest and other financial costs(1) | | Net interest and other financial costs(1) | 204 | | | 220 | | | (16) | |
| | Gain on extinguishment of debt | (12) | | | — | | | (12) | | |
| Net interest and other financial costs | 220 | | | 216 | | | 4 | | |
| Current income taxes | 1 | | | — | | | 1 | | |
| Unrealized derivative losses/(gains)(1) | 3 | | | (15) | | | 18 | | |
| | Other adjustments to equity method investment distributions | Other adjustments to equity method investment distributions | 2 | | | 5 | | | (3) | | Other adjustments to equity method investment distributions | 12 | | | 2 | | | 10 | |
| Other | Other | 2 | | | 1 | | | 1 | | Other | (12) | | | 6 | | | (18) | |
| Adjusted EBITDA | Adjusted EBITDA | 1,362 | | | 1,303 | | | 59 | | Adjusted EBITDA | 1,402 | | | 1,362 | | | 40 | |
| Adjusted EBITDA attributable to noncontrolling interests | Adjusted EBITDA attributable to noncontrolling interests | (10) | | | (9) | | | (1) | | Adjusted EBITDA attributable to noncontrolling interests | (9) | | | (10) | | | 1 | |
| Adjusted EBITDA attributable to MPLX LP(2) | 1,352 | | | 1,294 | | | 58 | | |
| Adjusted EBITDA attributable to MPLX LP | | Adjusted EBITDA attributable to MPLX LP | 1,393 | | | 1,352 | | | 41 | |
| Deferred revenue impacts | Deferred revenue impacts | 22 | | | 23 | | | (1) | | Deferred revenue impacts | 24 | | | 22 | | | 2 | |
| Net interest and other financial costs | (220) | | | (216) | | | (4) | | |
| Maintenance capital expenditures | (18) | | | (34) | | | 16 | | |
| Maintenance capital expenditures reimbursements | 7 | | | 14 | | | (7) | | |
| Sales-type lease payments, net of income | | Sales-type lease payments, net of income | 5 | | | — | | | 5 | |
Net interest and other financial costs(1) | | Net interest and other financial costs(1) | (204) | | | (220) | | | 16 | |
| Maintenance capital expenditures, net of reimbursements | | Maintenance capital expenditures, net of reimbursements | (14) | | | (11) | | | (3) | |
| Equity method investment capital expenditures paid out | Equity method investment capital expenditures paid out | (1) | | | (7) | | | 6 | | Equity method investment capital expenditures paid out | (3) | | | (1) | | | (2) | |
| | Other | Other | (5) | | | 4 | | | (9) | | Other | 9 | | | (5) | | | 14 | |
| | DCF | DCF | 1,137 | | | 1,078 | | | 59 | | DCF | 1,210 | | | 1,137 | | | 73 | |
| Preferred unit distributions | Preferred unit distributions | (31) | | | (31) | | | — | | Preferred unit distributions | (32) | | | (31) | | | (1) | |
| DCF attributable to GP and LP unitholders | DCF attributable to GP and LP unitholders | $ | 1,106 | | | $ | 1,047 | | | $ | 59 | | DCF attributable to GP and LP unitholders | $ | 1,178 | | | $ | 1,106 | | | $ | 72 | |
|
(1) MPLX makes a distinction between realizedExcludes gain/ loss on extinguishment of debt and unrealized gains and losses on derivatives. During the period when a derivative contract is outstanding, changes in the fair valueamortization of the derivative are recorded as an unrealized gain or loss. When a derivative contract matures or is settled, the previously recorded unrealized gain or loss is reversed and the realized gain or loss of the contract is recorded.
(2) For the three months ended March 31, 2021, the L&S and G&P segments made up $896 million and $456 million of Adjusted EBITDA attributable to MPLX LP, respectively. For the three months ended March 31, 2020, the L&S and G&P segments made up $872 million and $422 million of Adjusted EBITDA attributable to MPLX LP, respectively.deferred financing costs.
Three months ended March 31, 20212022 compared to three months ended March 31, 20202021
Total revenues and other income increased $1,347$271 million in the first quarter of 20212022 compared to the same period of 2020.2021. This increase was primarily due to impairments recordedhigher prices and volumes in most regions in the first quarterG&P segment of 2020 of $1,264approximately $274 million. ImpairmentsThere were recognized related to our ownershipalso increased pipeline fees in MarkWest Utica EMG, our indirect ownership in Ohio Gathering Company, L.L.C. through our investment in MarkWest Utica EMG and our ownership in Uintah Basin Field Services, L.L.C. The remaining $83 million increase is primarilythe L&S segment due to higher product related revenue due to higher prices in all G&P regions of approximately $192 millionpipeline throughput outweighing decreased average tariff rates, as well as from increased pipeline tariff rates and increased revenue from terminal storage.equity method income across both segments. These increases were partially offset by lower fees from lower volumes in the Southwest and Bakkena loss on disposal of $46 million, which includes impacts related to severe weather in the Southwest. There were also decreases due to the Wholesale Exchange, lower marine transportation fees, decreased volume deficiency payments and lower L&S terminal and pipeline volumes, including decreased throughputs on certain of our equity method investments.assets.
Cost of Revenues decreased $95revenues increased $14 million in the first quarter of 20212022 compared to the same period of 2020.2021. This was primarily due to lower repairs, maintenancehigher environmental response and operating costs and lower project-related spend, both as a result of cost reduction initiatives. The Wholesale Exchange as well as other miscellaneous expenses also contributed to the decrease.remediation costs.
Purchased product costs increased $141$191 million in the first quarter of 20212022 compared to the same period of 2020.2021 This was primarily due to an increase of $18 million related to unrealized derivative gains in the prior year compared to unrealized
derivative losses in the current year and higher prices of $136$143 million in the Southwest and Southern Appalachia partially offset by lowerand higher volumes of $14 million in the Southwest.
Rental cost of sales and rental cost of sales - related parties decreased $7$19 million in the first quarter of 20212022 compared to the same period of 2020.2021. This was primarily due to lower operatingmodifications to lease contracts which resulted in costs now being recorded to purchases - related parties, as wellnoted below, as decreased project spend from overallopposed to rental cost reduction initiatives.of sales - related parties.
Purchases - related parties increased $22$21 million in the first quarter of 20212022 compared to the same period of 2020.2021. This was primarily due to higher pricesmodifications to lease contracts which resulted in the Rockies and higher employeecosts now being recorded to purchases - related costs.parties as opposed to rental cost of sales - related parties, as noted above.
Impairment expenseDepreciation and amortization decreased $2,165$16 million in the first quarter of 20212022 compared to the same period of 2020. During the first quarter of 2020 we recorded impairment expense for goodwill, intangible assets and property, plant and equipment of $1,814 million, $177 million and $174 million, respectively. The impairment of goodwill related to our Eastern G&P reporting unit while the intangible asset and property, plant and equipment impairments relate to certain assets in our Southwest region. The impairments were primarily driven by the slowing of drilling activity, which reduced production growth forecasts from our producer customers.
General and administrative expenses decreased $11 million in the first quarter of 2021 compared to the same period of 2020.2021. This was primarily due to decreased employee costs from MPCthe prior year derecognition of assets reclassified as a result of cost reduction initiatives as well as decreased other miscellaneous expenses.sales-type leases due to contract modifications.
Segment Results
We classify our business in the following reportable segments: L&S and G&P. Segment Adjusted EBITDA represents Adjusted EBITDA attributable to the reportable segments. Amounts included in net income and excluded from Segment Adjusted EBITDA include: (i) depreciation and amortization; (ii) provision/(benefit) for income taxes; (iii) amortization of deferred financing costs; (iv) (gain)/loss on extinguishment of debt; (v) non-cash equity-based compensation; (vi) impairment expense; (vii) net interest and other financial costs; (viii)(iii) impairment expense; (iv) income/(loss) from equity method investments; (ix)(v) distributions and adjustments related to equity method investments; (x) unrealized derivative gains/(losses); (xi) acquisition costs; (xii)(vi) noncontrolling interests; and (xiii)(vii) other adjustments as deemed necessary. These items are either: (i) believed to be non-recurring in nature; (ii) not believed to be allocable or controlled by the segment; or (iii) are not tied to the operational performance of the segment.
The tables below present information about Segment Adjusted EBITDA for the reported segments for the three months ended March 31, 20212022 and 2020.2021.
L&S Segment
First Quarter L&S Segment Financial Highlights (in millions)
| | | | | | | | | | | | | | | | | | | | | | | |
| Three Months Ended March 31, | | |
| (In millions) | 2022 | | 2021 | | Variance | | | | | | |
| Service revenue | $ | 983 | | | $ | 953 | | | $ | 30 | | | | | | | |
| Rental income | 175 | | | 249 | | | (74) | | | | | | | |
| Product related revenue | 4 | | | 4 | | | — | | | | | | | |
| Sales-type lease revenue | 111 | | | 37 | | | 74 | | | | | | | |
| Income from equity method investments | 52 | | | 36 | | | 16 | | | | | | | |
| Other income | 12 | | | 15 | | | (3) | | | | | | | |
| Total segment revenues and other income | 1,337 | | | 1,294 | | | 43 | | | | | | | |
| Cost of revenues | 141 | | | 144 | | | (3) | | | | | | | |
| Purchases - related parties | 239 | | | 215 | | | 24 | | | | | | | |
| Depreciation and amortization | 130 | | | 147 | | | (17) | | | | | | | |
| General and administrative expenses | 43 | | | 46 | | | (3) | | | | | | | |
| | | | | | | | | | | |
| Other taxes | 21 | | | 19 | | | 2 | | | | | | | |
| Segment income from operations | 763 | | | 723 | | | 40 | | | | | | | |
| Depreciation and amortization | 130 | | | 147 | | | (17) | | | | | | | |
| Income from equity method investments | (52) | | | (36) | | | (16) | | | | | | | |
| Distributions/adjustments related to equity method investments | 58 | | | 58 | | | — | | | | | | | |
| | | | | | | | | | | |
| | | | | | | | | | | |
| Other | 5 | | | 4 | | | 1 | | | | | | | |
| | | | | | | | | | | |
Segment adjusted EBITDA(1) | 904 | | | 896 | | | 8 | | | | | | | |
| | | | | | | | | | | |
| Capital expenditures | 77 | | | 59 | | | 18 | | | | | | | |
Investments in unconsolidated affiliates(2) | $ | 68 | | | $ | 9 | | | $ | 59 | | | | | | | |
(1) See the Reconciliation of Adjusted EBITDA attributable to MPLX LP and DCF attributable to GP and LP unitholders from Net income table for the reconciliation to the most directly comparable GAAP measure.
(2) The three months ended March 31, 2022 includes a contribution of $60 million to our Bakken Pipeline joint venture to fund our share of a debt repayment by the joint venture.
Three months ended March 31, 2022 compared to three months ended March 31, 2021
Service revenue increased $30 million in the first quarter of 2022 compared to the same period of 2021. This was primarily due to a net increase in pipeline fees due to increased throughput outweighing lower average tariff rates, as well as to an increase of $15 million from changes in the presentation of lease income between service revenue, rental income and sales-type lease revenue due to modifications to lease contracts. Fee escalations also contributed to the increase.
Rental income decreased $74 million in the first quarter of 2022 compared to the same period of 2021. This was primarily due to a net decrease of $88 million from changes in the presentation of lease income between service revenue, rental income and sales-type lease revenue due to modifications to lease contracts. The decrease was partially offset by fee escalations.
Sales-type lease revenue - related parties increased $74 million in the first quarter of 2022 compared to the same period of 2021. This was primarily due to an increase of $73 million from changes in the presentation of lease income between service revenue, rental income and sales-type lease revenue due to modifications to lease contracts.
Income from equity methods investments increased $16 million in the first quarter of 2022 compared to the same period of 2021. This was primarily due to increased throughput on equity method investment pipeline systems, including the Whistler pipeline which was placed into service in the third quarter of 2021.
Cost of revenues decreased $3 million in the first quarter of 2022 compared to the same period of 2021. This was primarily due to modifications to lease contracts which resulted in costs being recorded to purchases - related parties, as noted below, as opposed to rental cost of sales - related parties, which is included in the decrease being explained here. The decrease was partially offset by higher environmental response and remediation costs compared to the first quarter of 2021.
Purchases - related parties increased $24 million in the first quarter of 2022 compared to the same period of 2021. This was primarily due to modifications to lease contracts which resulted in costs now being recorded to purchases - related parties as opposed to rental cost of sales - related parties, which is included in cost of revenues as noted above. This increase, and other miscellaneous increases, were partially offset by decreased employee-related costs from MPC.
Depreciation and amortization decreased $17 million in the first quarter of 2022 compared to the same period of 2021. This was primarily due to the derecognition of fixed assets due to the modification of certain lease contracts and accelerated depreciation on refining logistics assets at MPC’s idled Gallup refinery.
L&S SegmentOperating Data
| | | | | | | | | | | | | | | |
| Three Months Ended March 31, | | |
| 2022 | | 2021 | | | | |
| L&S | | | | | | | |
| Pipeline throughput (mbpd) | | | | | | | |
| Crude oil pipelines | 3,380 | | | 3,282 | | | | | |
| Product pipelines | 1,956 | | | 1,858 | | | | | |
| Total pipelines | 5,336 | | | 5,140 | | | | | |
| | | | | | | |
Average tariff rates ($ per barrel)(1) | | | | | | | |
| Crude oil pipelines | $ | 0.93 | | | $ | 0.96 | | | | | |
| Product pipelines | 0.82 | | | 0.79 | | | | | |
| Total pipelines | $ | 0.89 | | | $ | 0.90 | | | | | |
| | | | | | | |
| Terminal throughput (mbpd) | 2,941 | | | 2,613 | | | | | |
| | | | | | | |
| | | | | | | |
| | | | | | | |
Marine Assets (number in operation)(2) | | | | | | | |
| Barges | 296 | | | 297 | | | | | |
| Towboats | 23 | | | 23 | | | | | |
(1) Average tariff rates calculated using pipeline transportation revenues divided by pipeline throughput barrels.
(2) Represents total at end of period.
G&P Segment
First Quarter L&SG&P Segment Financial Highlights (in millions)
| | | Three Months Ended March 31, | | | Three Months Ended March 31, | |
| (In millions) | (In millions) | 2021 | | 2020 | | Variance | | (In millions) | 2022 | | 2021 | | Variance | |
| Service revenue | Service revenue | $ | 953 | | | $ | 1,004 | | | $ | (51) | | | Service revenue | $ | 486 | | | $ | 508 | | | $ | (22) | | |
| Rental income | Rental income | 249 | | | 242 | | | 7 | | | Rental income | 81 | | | 92 | | | (11) | | |
| Product related revenue | Product related revenue | 4 | | | 19 | | | (15) | | | Product related revenue | 661 | | | 397 | | | 264 | | |
| Income from equity method investments | Income from equity method investments | 36 | | | 50 | | | (14) | | | Income from equity method investments | 47 | | | 34 | | | 13 | | |
| Other income | 52 | | | 51 | | | 1 | | | |
| Other income/(loss) | | Other income/(loss) | (2) | | | 14 | | | (16) | | |
| Total segment revenues and other income | Total segment revenues and other income | 1,294 | | | 1,366 | | | (72) | | | Total segment revenues and other income | 1,273 | | | 1,045 | | | 228 | | |
| Cost of revenues | Cost of revenues | 144 | | | 238 | | | (94) | | | Cost of revenues | 198 | | | 200 | | | (2) | | |
| Purchased product costs | | Purchased product costs | 467 | | | 276 | | | 191 | | |
| Purchases - related parties | Purchases - related parties | 215 | | | 199 | | | 16 | | | Purchases - related parties | 80 | | | 83 | | | (3) | | |
| Depreciation and amortization | Depreciation and amortization | 147 | | | 138 | | | 9 | | | Depreciation and amortization | 183 | | | 182 | | | 1 | | |
| | General and administrative expenses | General and administrative expenses | 46 | | | 52 | | | (6) | | | General and administrative expenses | 35 | | | 40 | | | (5) | | |
| | Other taxes | Other taxes | 19 | | | 16 | | | 3 | | | Other taxes | 13 | | | 13 | | | — | | |
| Segment income from operations | Segment income from operations | 723 | | | 723 | | | — | | | Segment income from operations | 297 | | | 251 | | | 46 | | |
| Depreciation and amortization | Depreciation and amortization | 147 | | | 138 | | | 9 | | | Depreciation and amortization | 183 | | | 182 | | | 1 | | |
| | Income from equity method investments | Income from equity method investments | (36) | | | (50) | | | 14 | | | Income from equity method investments | (47) | | | (34) | | | (13) | | |
| Distributions/adjustments related to equity method investments | Distributions/adjustments related to equity method investments | 58 | | | 57 | | | 1 | | | Distributions/adjustments related to equity method investments | 74 | | | 63 | | | 11 | | |
| | Non-cash equity-based compensation | 2 | | | 3 | | | (1) | | | |
| Other | Other | 2 | | | 1 | | | 1 | | | Other | (9) | | | 4 | | | (13) | | |
| Segment adjusted EBITDA(1) | 896 | | | 872 | | | 24 | | | |
| Adjusted EBITDA attributable to noncontrolling interests | | Adjusted EBITDA attributable to noncontrolling interests | (9) | | | (10) | | | 1 | | |
Segment Adjusted EBITDA(1) | | Segment Adjusted EBITDA(1) | 489 | | | 456 | | | 33 | | |
| | Capital expenditures | Capital expenditures | 59 | | | 184 | | | (125) | | | Capital expenditures | 95 | | | 30 | | | 65 | | |
| Investments in unconsolidated affiliates | Investments in unconsolidated affiliates | $ | 9 | | | $ | 54 | | | $ | (45) | | | Investments in unconsolidated affiliates | $ | 42 | | | $ | 26 | | | $ | 16 | | |
(1) See the Reconciliation of Adjusted EBITDA attributable to MPLX LP and DCF attributable to GP and LP unitholders from Net income table for the reconciliation to the most directly comparable GAAP measure.
Three months ended March 31, 20212022 compared to three months ended March 31, 20202021
Service revenue decreased $51$22 million in the first quarter of 20212022 compared to the same period of 2020.2021. This was primarily due to lower fees from lower volumes in the Rockies and Marcellus as well as a decrease in volumes due to the Javelina divestiture in the Southwest of $34 million, partially offset by an increase in fees due to a 2021 contract modification in the Marcellus resulting in a change in the presentation of the related income from rental income to service revenue.
Rental income decreased $11 million in the first quarter of 2022 compared to the same period of 2021. This was primarily due to a $26 million decrease in marine transportation fees, an $11 million decrease in volume deficiency payments, a $25 million decrease due to the Wholesale Exchange as well as other immaterial decreases associated with terminal and pipeline volumes. These decreases were partially offset by increased pipeline tariff rates and increased fees associated with Mt. Airy.
Rental income increased $7 million2021 contract modification in the first quarterMarcellus resulting in a change in the presentation of 2021 comparedthe related income from rental income to the same period of 2020. This was primarily due to increased terminal storage fees as well as additional refining logistics fees associated with increased storage capacity and annual fee escalations.
Product related revenue decreased $15increased $264 million in the first quarter of 20212022 compared to the same period of 2020.2021. This was primarily due to higher prices across all regions of approximately $187 million and higher processed volumes in the Wholesale Exchange.Southwest of $87 million. This was partially offset by a decrease in volumes primarily due to the Javelina divestiture in the Southwest.
Income from equity method investments decreased $14increased $13 million in the first quarter of 20212022 compared to the same period of 2020. This was2021, primarily due to decreased throughputhigher volumes on MarEn Bakken Company LLC, Explorer Pipeline Company, Illinois Extension Pipeline Company L.L.C. and LOCAP LLC.rates associated with joint ventures in the Utica, Marcellus and Southwest regions.
Cost of revenuesOther income/(loss) decreased $94 million in the first quarter of 2021 compared to the same period of 2020. This was primarily due to the Wholesale Exchange as well as lower project-related spend as a result of cost reduction initiatives.
Purchases - related parties increased $16 million in the first quarter of 20212022 compared to the same period of 2020.2021 primarily due to a loss on disposal of assets.
Purchased product costs increased $191 million in the first quarter of 2022 compared to the same period of 2021. This was primarily due to higher employee related costs.prices of $143 million in the Southwest and Southern Appalachia and higher volumes in the Southwest.
Depreciation and amortization increased $9 million in the first quarter of 2021 compared to the same period of 2020. This was primarily due to accelerated depreciation related to assets at an indefinitely idled MPC refinery, as well as property, plant and equipment placed in service in the last nine months of 2020 and the first three months of 2021.
General and administrative expenses decreased $6 million in the first quarter of 2021 compared to the same period of 2020. This was primarily due to decreased employee costs from MPC as a result of cost reduction initiatives.
G&P SegmentOperating Data
First Quarter G&P Segment Financial Highlights (in millions)
(1) Includes impairment of equity method investments of $1,264 million for 2020.
(2) Includes impairment of goodwill of $1,814 million, long-lived assets including intangibles of $351 million and equity method investments of $1,264 million for 2020.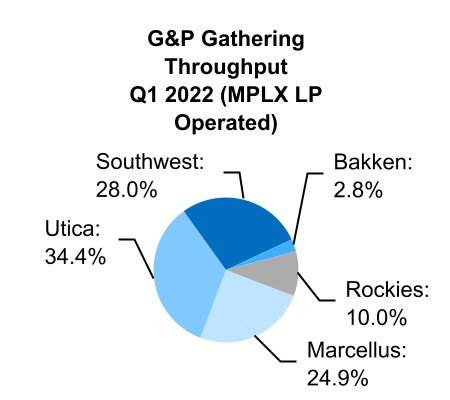
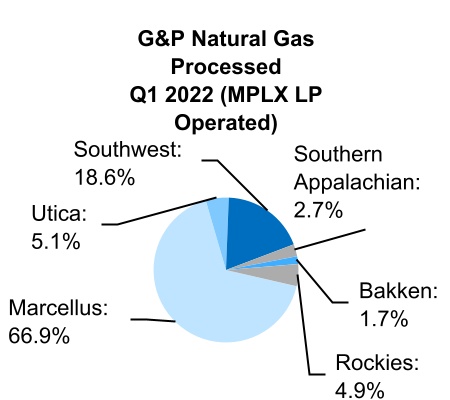
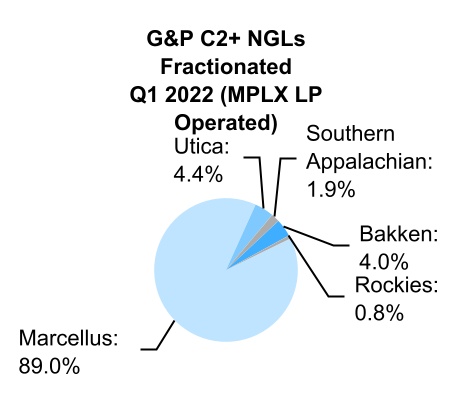
| | | | | | | | | | | | | | | | | | | | | | | |
| Three Months Ended March 31, | | |
| (In millions) | 2021 | | 2020 | | Variance | | | | | | |
| Service revenue | $ | 508 | | | $ | 536 | | | $ | (28) | | | | | | | |
| Rental income | 92 | | | 88 | | | 4 | | | | | | | |
| Product related revenue | 397 | | | 222 | | | 175 | | | | | | | |
Income/(loss) from equity method investments(1) | 34 | | | (1,234) | | | 1,268 | | | | | | | |
| Other income | 14 | | | 14 | | | — | | | | | | | |
| Total segment revenues and other income/(loss) | 1,045 | | | (374) | | | 1,419 | | | | | | | |
| Cost of revenues | 200 | | | 211 | | | (11) | | | | | | | |
| Purchased product costs | 276 | | | 135 | | | 141 | | | | | | | |
| Purchases - related parties | 83 | | | 77 | | | 6 | | | | | | | |
| Depreciation and amortization | 182 | | | 187 | | | (5) | | | | | | | |
| Impairment expense | — | | | 2,165 | | | (2,165) | | | | | | | |
| General and administrative expenses | 40 | | | 45 | | | (5) | | | | | | | |
| | | | | | | | | | | |
| Other taxes | 13 | | | 15 | | | (2) | | | | | | | |
| Segment income/(loss) from operations | 251 | | | (3,209) | | | 3,460 | | | | | | | |
| Depreciation and amortization | 182 | | | 187 | | | (5) | | | | | | | |
| Impairment expense | — | | | 2,165 | | | (2,165) | | | | | | | |
| (Income)/loss from equity method investments | (34) | | | 1,234 | | | (1,268) | | | | | | | |
| Distributions/adjustments related to equity method investments | 63 | | | 67 | | | (4) | | | | | | | |
| | | | | | | | | | | |
Unrealized derivative losses/(gains)(2) | 3 | | | (15) | | | 18 | | | | | | | |
| Non-cash equity-based compensation | 1 | | | 2 | | | (1) | | | | | | | |
| | | | | | | | | | | |
| Adjusted EBITDA attributable to noncontrolling interests | (10) | | | (9) | | | (1) | | | | | | | |
Segment Adjusted EBITDA(3) | 456 | | | 422 | | | 34 | | | | | | | |
| | | | | | | | | | | |
| Capital expenditures | 30 | | | 134 | | | (104) | | | | | | | |
| Investments in unconsolidated affiliates | $ | 26 | | | $ | 37 | | | $ | (11) | | | | | | | |
| | | | | | | | | | | | | | | | | | | | | | | |
| Three Months Ended
March 31, 2022 | | Three Months Ended
March 31, 2021 |
| MPLX LP(1) | | MPLX LP Operated(2) | | MPLX LP(1) | | MPLX LP Operated(2) |
| G&P | | | | | | | |
| Gathering Throughput (MMcf/d) | | | | | | | |
| Marcellus Operations | 1,314 | | | 1,314 | | | 1,298 | | | 1,298 | |
| Utica Operations | — | | | 1,813 | | | — | | | 1,566 | |
| Southwest Operations | 1,307 | | | 1,476 | | | 1,373 | | | 1,448 | |
| Bakken Operations | 147 | | | 147 | | | 146 | | | 146 | |
| Rockies Operations | 394 | | | 526 | | | 470 | | | 627 | |
| Total gathering throughput | 3,162 | | | 5,276 | | | 3,287 | | | 5,085 | |
| | | | | | | |
| Natural Gas Processed (MMcf/d) | | | | | | | |
| Marcellus Operations | 4,015 | | | 5,529 | | | 4,249 | | | 5,677 | |
| Utica Operations | — | | | 423 | | | — | | | 513 | |
Southwest Operations(3) | 1,384 | | | 1,541 | | | 1,295 | | | 1,367 | |
| Southern Appalachian Operations | 224 | | | 224 | | | 227 | | | 227 | |
| Bakken Operations | 143 | | | 143 | | | 145 | | | 145 | |
| Rockies Operations | 407 | | | 407 | | | 441 | | | 441 | |
| Total natural gas processed | 6,173 | | | 8,267 | | | 6,357 | | | 8,370 | |
| | | | | | | |
| C2 + NGLs Fractionated (mbpd) | | | | | | | |
Marcellus Operations(4) | 468 | | | 468 | | | 489 | | | 489 | |
Utica Operations(4) | — | | | 23 | | | — | | | 28 | |
Southwest Operations(3) | — | | | — | | | 8 | | | 8 | |
| Southern Appalachian Operations | 10 | | | 10 | | | 11 | | | 11 | |
| Bakken Operations | 21 | | | 21 | | | 19 | | | 19 | |
| Rockies Operations | 4 | | | 4 | | | 4 | | | 4 | |
Total C2 + NGLs fractionated(5) | 503 | | | 526 | | | 531 | | | 559 | |
(1) Includes impairment of equity method investments of $1,264 million for 2020.
(2) MPLX makes a distinction between realized and unrealized gains and losses on derivatives. During the period when a derivative contract is outstanding, changes in the fair value of the derivative are recorded as an unrealized gain or loss. When a derivative contract matures or is settled, the previously recorded unrealized gain or loss is reversed and the realized gain or loss of the contract is recorded.
(3) See the Reconciliation of Adjusted EBITDA attributable to MPLX LP and DCF attributable to GP and LP unitholders from Net income table for the reconciliation to the most directly comparable GAAP measure.
| | | | | | | | | | | | | | | |
| Three Months Ended March 31, | | |
| 2022 | | 2021 | | | | |
| Pricing Information | | | | | | | |
| Natural Gas NYMEX HH ($ per MMBtu) | $ | 4.57 | | | $ | 2.72 | | | | | |
C2 + NGL Pricing ($ per gallon)(6) | $ | 1.15 | | | $ | 0.73 | | | | | |
Three(1) This column represents operating data for entities that have been consolidated into the MPLX financial statements.
(2) This column represents operating data for entities that have been consolidated into the MPLX financial statements as well as operating data for MPLX-operated equity method investments.
(3) The Southwest Operations for the three months ended March 31, 2021 compared toinclude the Javelina complex, which was sold on February 12, 2021. The processing and fractionated volumes calculated for the number of days MPLX owned these assets during 2021 were 96 MMcf/d and 17 mbpd, respectively.
(4) Entities within the Marcellus and Utica Operations jointly own the Hopedale fractionation complex. Hopedale throughput is included in the Marcellus and Utica Operations and represent each region’s utilization of the complex.
(5) Purity ethane makes up approximately 188 mbpd and 199 mbpd of total MPLX Operated, fractionated products for the three months ended March 31, 20202022 and 2021, respectively. Purity ethane makes up approximately 184 mbpd and 194 mbpd of total MPLX LP consolidated, fractionated products for the three months ended March 31, 2022 and 2021, respectively.
Service revenue decreased $28 million in the first quarter of 2021 compared to the same period of 2020. This was primarily due to lower fees from lower volumes in the Southwest andBakken, which includes impacts related to severe weather in the Southwest.
Product related revenue increased $175 million in the first quarter of 2021 compared to the same period of 2020. This was primarily due to higher(6) C2 + NGL pricing based on Mont Belvieu prices in all of the regionsassuming an NGL barrel of approximately $192 million35 percent ethane, 35 percent propane, six percent Iso-Butane, 12 percent normal butane and a slight increase in volume in the Rockies, partially offset by lower volumes in the Southwestof $18 million, which includes impacts related to severe weather in the Southwest.
Income from equity method investments increased $1,268 million in the first quarter of 2021 compared to the same period of 2020. This increase was driven by impairments recorded in the first quarter of 2020 of $1,264 million. Impairments were recognized related to our ownership in MarkWest Utica EMG, our indirect ownership in Ohio Gathering Company, L.L.C. through our investment in MarkWest Utica EMG and our ownership in Uintah Basin Field Services, L.L.C. Also contributing to the increase was higher volumes associated with our Sherwood Midstream LLC and Ohio Condensate Company joint ventures.
Cost of revenues decreased $11 million in the first quarter of 2021 compared to the same period of 2020. This decrease is attributable to lower repairs, maintenance and operating costs in the Marcellus and Southwest as a result of cost reduction initiatives, partially offset by higher prices in the Rockies.
Purchased product costs increased $141 million in the first quarter of 2021 compared to the same period of 2020. This was primarily due to an increase of $18 million related to unrealized derivative gains in the prior year compared to unrealized derivative losses in the current year and higher prices of $136 million in the Southwest and Southern Appalachia, partially offset by lower volumes of $14 million in the Southwest.
Purchases - related parties increased $6 million in the first quarter of 2021 compared to the same period of 2020. This was primarily due to higher prices in the Rockies partially offset by lower employee related costs.
Impairment expense decreased $2,165 million in the first quarter of 2021 compared to the same period of 2020. During the first quarter of 2020 we recorded impairment expense for goodwill, intangible assets and property, plant and equipment of $1,814 million, $177 million and $174 million, respectively. The impairment of goodwill related to our Eastern G&P reporting unit while the intangible asset and property, plant and equipment impairments relate to certain assets in our Southwest region. The impairments were primarily driven by the slowing of drilling activity, which reduced production growth forecasts from our producer customers.12 percent natural gasoline.
SEASONALITYSeasonality
The volume of crude oil and refined products transported and stored utilizing our assets is directly affected by the level of supply and demand for crude oil and refined products in the markets served directly or indirectly by our assets. AnyThe majority of effects of seasonality on the L&S segment’s revenues will be mitigated through the use of our fee-based transportation and storage services agreements with MPC that include minimum volume commitments.
In our G&P segment, we experience minimal impacts from seasonal fluctuations which impact the demand for natural gas and NGLs and the related commodity prices caused by various factors including variations in weather patterns from year to year. We are able to manage the seasonality impacts through the execution of our marketing strategy and via our storage capabilities. Overall, our exposure to the seasonality fluctuations is declining due to our growth in our fee-based business.
OPERATING DATA
| | | | | | | | | | | | | | | |
| Three Months Ended
March 31, | | |
| 2021 | | 2020 | | | | |
| L&S | | | | | | | |
| Pipeline throughput (mbpd) | | | | | | | |
| Crude oil pipelines | 3,282 | | | 3,210 | | | | | |
| Product pipelines | 1,858 | | | 1,905 | | | | | |
| Total pipelines | 5,140 | | | 5,115 | | | | | |
| | | | | | | |
Average tariff rates ($ per barrel)(1) | | | | | | | |
| Crude oil pipelines | $ | 0.96 | | | $ | 0.93 | | | | | |
| Product pipelines | 0.79 | | | 0.79 | | | | | |
| Total pipelines | $ | 0.90 | | | $ | 0.88 | | | | | |
| | | | | | | |
| Terminal throughput (mbpd) | 2,613 | | | 2,966 | | | | | |
| | | | | | | |
| | | | | | | |
| | | | | | | |
Marine Assets (number in operation)(2) | | | | | | | |
| Barges | 297 | | | 305 | | | | | |
| Towboats | 23 | | | 23 | | | | | |
| | | | | | | | | | | | | | | | | | | | | | | |
| Three Months Ended
March 31, 2021 | | Three Months Ended
March 31, 2020 |
| MPLX LP(3) | | MPLX LP Operated(4) | | MPLX LP(3) | | MPLX LP Operated(4) |
| G&P | | | | | | | |
| Gathering Throughput (MMcf/d) | | | | | | | |
| Marcellus Operations | 1,298 | | | 1,298 | | | 1,420 | | | 1,420 | |
| Utica Operations | — | | | 1,566 | | | — | | | 1,800 | |
| Southwest Operations | 1,373 | | | 1,448 | | | 1,557 | | | 1,601 | |
| Bakken Operations | 146 | | | 146 | | | 156 | | | 156 | |
| Rockies Operations | 470 | | | 627 | | | 592 | | | 775 | |
| Total gathering throughput | 3,287 | | | 5,085 | | | 3,725 | | | 5,752 | |
| | | | | | | |
| Natural Gas Processed (MMcf/d) | | | | | | | |
| Marcellus Operations | 4,249 | | | 5,677 | | | 4,198 | | | 5,522 | |
| Utica Operations | — | | | 513 | | | — | | | 648 | |
| Southwest Operations | 1,295 | | | 1,367 | | | 1,648 | | | 1,679 | |
| Southern Appalachian Operations | 227 | | | 227 | | | 243 | | | 243 | |
| Bakken Operations | 145 | | | 145 | | | 156 | | | 156 | |
| Rockies Operations | 441 | | | 441 | | | 539 | | | 539 | |
| Total natural gas processed | 6,357 | | | 8,370 | | | 6,784 | | | 8,787 | |
| | | | | | | |
| C2 + NGLs Fractionated (mbpd) | | | | | | | |
Marcellus Operations(5) | 489 | | | 489 | | | 456 | | | 456 | |
Utica Operations(5) | — | | | 28 | | | — | | | 34 | |
| Southwest Operations | 8 | | | 8 | | | 15 | | | 15 | |
Southern Appalachian Operations(6) | 11 | | | 11 | | | 12 | | | 12 | |
| Bakken Operations | 19 | | | 19 | | | 31 | | | 31 | |
| Rockies Operations | 4 | | | 4 | | | 5 | | | 5 | |
Total C2 + NGLs fractionated(7) | 531 | | | 559 | | | 519 | | | 553 | |
| | | | | | | | | | | | | | | |
| Three Months Ended
March 31, | | |
| 2021 | | 2020 | | | | |
| Pricing Information | | | | | | | |
| Natural Gas NYMEX HH ($ per MMBtu) | $ | 2.72 | | | $ | 1.87 | | | | | |
C2 + NGL Pricing ($ per gallon)(8) | $ | 0.73 | | | $ | 0.40 | | | | | |
(1) Average tariff rates calculated using pipeline transportation revenues divided by pipeline throughput barrels.
(2) Represents total at end of period.
(3) This column represents operating data for entities that have been consolidated into the MPLX financial statements.
(4) This column represents operating data for entities that have been consolidated into the MPLX financial statements as well as operating data for MPLX-operated equity method investments.
(5) Hopedale is jointly owned by Ohio FractionationLiquidity and MarkWest Utica EMG. Ohio Fractionation is a subsidiary of MarkWest Liberty Midstream. MarkWest Liberty Midstream and MarkWest Utica EMG are entities that operate in the Marcellus and Utica regions, respectively. Marcellus Operations includes Ohio Fractionation’s portion utilized of the jointly owned Hopedale Fractionation Complex. Utica Operations includes MarkWest Utica EMG’s portion utilized of the jointly owned Hopedale Fractionation Complex. Additionally, Sherwood Midstream has the right to fractionation revenue and the obligation to pay expenses related to 40 mbpd of capacity in the Hopedale 3 and Hopedale 4 fractionators.
(6) Includes NGLs fractionated for the Marcellus Operations and Utica Operations.
(7) Purity ethane makes up approximately 199 mbpd and 190 mbpd of total MPLX Operated, fractionated products for the three months ended March 31, 2021 and 2020, respectively. Purity ethane makes up approximately 194 mbpd and 183 mbpd of total MPLX LP consolidated, fractionated products for the three months ended March 31, 2021 and 2020, respectively.
(8) C2 + NGL pricing based on Mont Belvieu prices assuming an NGL barrel of approximately 35 percent ethane, 35 percent propane, six percent Iso-Butane, 12 percent normal butane and 12 percent natural gasoline.
LIQUIDITY AND CAPITAL RESOURCESCapital Resources
Cash Flows
Our cash and cash equivalents were $24$42 million at March 31, 20212022 and $15$13 million at December 31, 2020.2021. The change in cash, cash equivalents and restricted cash was due to the factors discussed below. Net cash provided by (used in) operating activities, investing activities and financing activities were as follows:
| | | | | | | | | | | |
| | Three Months Ended March 31, |
| (In millions) | 2021 | | 2020 |
| Net cash provided by (used in): | | | |
| Operating activities | $ | 1,124 | | | $ | 1,009 | |
| Investing activities | (90) | | | (362) | |
| Financing activities | (1,025) | | | (605) | |
| Total | $ | 9 | | | $ | 42 | |
| | | | | | | | | | | |
| | Three Months Ended March 31, |
| (In millions) | 2022 | | 2021 |
| Net cash provided by (used in): | | | |
| Operating activities | $ | 1,125 | | | $ | 1,124 | |
| Investing activities | (276) | | | (90) | |
| Financing activities | (820) | | | (1,025) | |
| Total | $ | 29 | | | $ | 9 | |
Net cash provided by operating activities increased $115$1 million in the first three months of 20212022 compared to the first three months of 2020, primarily due2021. The increase in net income adjusted for non-cash items.was offset by working capital requirements.
Net cash used in investing activities decreased $272increased $186 million in the first three months of 20212022 compared to the first three months of 2020,2021, primarily due to decreasedan increase in capital spending related to the capital budget and decreasedan increase in contributions to equity method investments.investments, which included the $60 million contribution to our Bakken Pipeline joint venture to fund our share of a debt repayment by the joint venture. The first quarter of 2021 also included proceeds from the sale of our Javelina plant, which further reduced the use of cash in that period.
Financing activities were an $820 million use of cash in the first three months of 2022 compared to a $1,025 million use of cash in the first three months of 2021 compared to a $605 million use of cash in the first three months of 2020.2021. The primary reason for the increasedecrease in the use of cash was due to net debt borrowings of $57 million in the returnfirst quarter of capital2022 compared to unitholders throughnet debt repayments of $110 million in the first quarter of 2021, as well as decreased spending on the unit repurchase program as well as net repayments on long-term debtof $55 million in the current yearfirst quarter of 2022 compared to net borrowing on long-term debt in the prior year.first quarter of 2021.
Free Cash Flow
The following table provides a reconciliation of FCF and excess/deficitfree cash flow after distributions from net cash provided by operating activities for the three months ended March 31, 20212022 and March 31, 2020.2021.
| | | | Three Months Ended March 31, | | | | Three Months Ended March 31, | |
| (In millions) | (In millions) | | 2021 | | 2020 | | (In millions) | | 2022 | | | 2021 | |
| Net cash provided by operating activities | Net cash provided by operating activities | | $ | 1,124 | | | $ | 1,009 | | | Net cash provided by operating activities | | $ | 1,125 | | | | $ | 1,124 | | |
| Adjustments to reconcile net cash provided by operating activities to free cash flow | Adjustments to reconcile net cash provided by operating activities to free cash flow | | | | Adjustments to reconcile net cash provided by operating activities to free cash flow | | | | | |
| Net cash used in investing activities | Net cash used in investing activities | | (90) | | | (362) | | | Net cash used in investing activities | | (276) | | | | (90) | | |
| Contributions from MPC | Contributions from MPC | | 7 | | | 14 | | | Contributions from MPC | | 10 | | | | 7 | | |
| | Distributions to noncontrolling interests | Distributions to noncontrolling interests | | (10) | | | (9) | | | Distributions to noncontrolling interests | | (9) | | | | (10) | | |
| Free cash flow | Free cash flow | | 1,031 | | | 652 | | | Free cash flow | | 850 | | | | 1,031 | | |
| | Distributions to common and preferred unitholders | | (754) | | | (758) | | | |
| Excess (deficit) cash flow | | $ | 277 | | | $ | (106) | | | |
| Distributions paid to common and preferred unitholders | | Distributions paid to common and preferred unitholders | | (758) | | | | (754) | | |
| Free cash flow after distributions | | Free cash flow after distributions | | $ | 92 | | | | $ | 277 | | |
Debt and Liquidity Overview
On January 15, 2021,March 14, 2022, MPLX redeemed $750 million outstandingissued $1.5 billion aggregate principal amount of 5.2504.950 percent senior notes due January 15, 2025,March 2052 (the “2052 Senior Notes”) in an underwritten public offering. The 2052 Senior Notes were offered at 102.625a price to the public of 98.982 percent ofwith interest payable semi-annually in arrears, commencing on September 14, 2022. The net proceeds were used to repay amounts outstanding under the principal amount.MPC Intercompany Loan Agreement and the MPLX Credit Agreement.
Our outstanding borrowings atAs of March 31, 2022, we had $20.1 billion in aggregate principal amount of senior notes outstanding. The increase compared to year-end 2021 and December 31, 2020 consistresulted from the issuance of the following:
| | | | | | | | | | | |
| (In millions) | March 31, 2021 | | December 31, 2020 |
| MPLX LP: | | | |
| | | |
| | | |
| | | |
| Bank revolving credit facility | $ | 835 | | | $ | 175 | |
| | | |
| | | |
| | | |
| | | |
| Floating rate senior notes | 1,000 | | | 1,000 | |
| | | |
| | | |
| | | |
| | | |
| | | |
| | | |
| | | |
| | | |
| | | |
| | | |
| | | |
| | | |
| | | |
| | | |
| | | |
| | | |
| | | |
| | | |
| | | |
| | | |
| | | |
| | | |
| Fixed rate senior notes | 18,532 | | | 19,240 | |
| Consolidated subsidiaries: | | | |
| MarkWest | 23 | | | 23 | |
| ANDX | 45 | | | 87 | |
| | | |
| Financing lease obligations | 10 | | | 11 | |
| Total | 20,445 | | | 20,536 | |
| Unamortized debt issuance costs | (112) | | | (116) | |
| Unamortized discount/premium | (279) | | | (281) | |
| Amounts due within one year | (2) | | | (764) | |
| Total long-term debt due after one year | $ | 20,052 | | | $ | 19,375 | |
Our intention is to maintain an investment gradeinvestment-grade credit profile. As of April 20, 2021,March 31, 2022, the credit ratings on our senior unsecured debt were at or above investment grade level as follows:
| | | | | | | | |
| Rating Agency | | Rating |
| Moody’s | | Baa2 (negative(stable outlook) |
| Standard & Poor’s | | BBB (negative(stable outlook) |
| Fitch | | BBB (stable outlook) |
The ratings reflect the respective views of the rating agencies. Although it is our intention to maintain a credit profile that supports an investment grade rating, there is no assurance that these ratings will continue for any given period of time. The ratings may be revised or withdrawn entirely by the rating agencies if, in their respective judgments, circumstances so warrant.
The MPLX Credit Agreement contains certain representations and warranties, affirmative and restrictive covenants and events of default that we consider to be usual and customary for an agreement of this type. The financial covenant requires MPLX to maintain a ratio of Consolidated Total Debt as of the end of each fiscal quarter to Consolidated EBITDA (both as defined in the MPLX Credit Agreement) for the prior four fiscal quarters of no greater than 5.0 to 1.0 (or 5.5 to 1.0 during the six-month period following certain acquisitions). Consolidated EBITDA is subject to adjustments for certain acquisitions completed and capital projects undertaken during the relevant period. Other covenants restrict us and/or certain of our subsidiaries from incurring debt, creating liens on assets and entering into transactions with affiliates. As of March 31, 2021,2022, we were in
compliance with the covenants, including the financial covenant with a ratio of Consolidated Total Debt to Consolidated EBITDA of 3.83.64 to 1.0.
The agreements governing our debt obligations do not contain credit rating triggers that would result in the acceleration of interest, principal or other payments solely in the event that our credit ratings are downgraded. However, any downgrades in the credit ratings of our senior unsecured debt ratings to below investment grade ratings could, among other things, increase the applicable interest rates and other fees payable under the MPLX Credit Agreement and may limit our ability to obtain future financing, including refinancing existing indebtedness.
Our liquidity totaled $4.2$4.7 billion at March 31, 20212022 consisting of:
| | | March 31, 2021 | | March 31, 2022 |
| (In millions) | (In millions) | Total Capacity | | Outstanding Borrowings | | Available
Capacity | (In millions) | Total Capacity | | Outstanding Borrowings | | Available
Capacity |
Bank revolving credit facility due 2024(1) | $ | 3,500 | | | $ | (835) | | | $ | 2,665 | | |
MPLX Credit Agreement(1) | | MPLX Credit Agreement(1) | $ | 3,500 | | | $ | — | | | $ | 3,500 | |
| | MPC Loan Agreement | MPC Loan Agreement | 1,500 | | | — | | | 1,500 | | MPC Loan Agreement | 1,500 | | | (323) | | | 1,177 | |
| Total liquidity | Total liquidity | $ | 5,000 | | | $ | (835) | | | 4,165 | | Total liquidity | $ | 5,000 | | | $ | (323) | | | 4,677 | |
| Cash and cash equivalents | Cash and cash equivalents | | | | | 24 | | Cash and cash equivalents | | | | | 42 | |
| Total liquidity | Total liquidity | | $ | 4,189 | | Total liquidity | | $ | 4,719 | |
(1) Outstanding borrowings include less than $1 million in letters of credit outstanding under this facility.
We expect our ongoing sources of liquidity to include cash generated from operations and borrowings under the MPC Loan Agreement, the MPLX Credit Agreement and access to capital markets. We believe that cash generated from these sources will be sufficient to meet our short-term and long-term funding requirements, including working capital requirements, capital expenditure requirements, contractual obligations, and quarterly cash distributions. We may also, from time to time, repurchase our senior notes or preferred units in the open market, in tender offers, in privately negotiated transactions or otherwise in such volumes, at market prices and upon such other terms as we deem appropriate and execute unit repurchases under our unit repurchase program. MPC manages our cash and cash equivalents on our behalf directly with third-party institutions as part of the treasury services that it provides to us under our omnibus agreement. From time to time, we may also consider utilizing other sources of liquidity, including the formation of joint ventures or sales of non-strategic assets.
Equity and Preferred Units Overview
Common units
The table below summarizes the changes in the number of units outstanding through March 31, 2021:2022:
| | | | | | | | | |
| (In units) | | | | | Common |
Balance at December 31, 20202021 | | | | | 1,038,777,9781,016,178,378 | |
| Unit-based compensation awards | | | | | 143,247148,951 | |
Units redeemed in Unit Repurchase Programunit repurchase program | | | | | (6,272,981)(3,119,522) | |
| | | | | |
Balance at March 31, 20212022 | | | | | 1,032,648,2441,013,207,807 | |
Unit Repurchase Program
During the three months ended March 31, 2022, we repurchased approximately 3 million common units at an average cost per unit of $32.06 per unit and paid $100 million of cash. As of March 31, 2022, we had repurchased a total of approximately 28 million units at an average cost per unit of $27.76 per unit for a total of $763 million under the unit repurchase program. We have $237 million remaining under our repurchase authorization.
Distributions
We intend to pay a minimum quarterly distribution to the holders of our common units of $0.2625 per unit, or $1.05 per unit on an annualized basis, to the extent we have sufficient cash from our operations after the establishment of cash reserves and the payment of costs and expenses, including reimbursements of expenses to our general partner. The amount of distributions paid under our policy and the decision to make any distributions is determined by our general partner, taking into consideration the terms of our partnership agreement. Such minimum distribution would equate to $271$266 million per quarter, or $1,084$1,064 million per year, based on the number of common units outstanding at March 31, 2021. 2022.
On April 27, 2021, we announced the board of directors of our general partner had26, 2022, MPLX declared a cash distribution for the first quarter of $0.68752022, totaling $713 million, or $0.7050 per unit thatcommon unit. This distribution will be paid on May 14, 202113, 2022 to common unitholders of record on May 7, 2021. This is consistent with the prior quarter distribution. This rate will also be received by Series A preferred unitholders.6, 2022. Although our partnership agreement requires that we distribute all of our available cash each quarter, we do not otherwise have a legal obligation to distribute any particular amount per common unit. This rate will also be received by Series A preferred unitholders.
Series B preferred unitholders are entitled to receive a fixed distribution of $68.75 per unit, per annum, payable semi-annually in arrears on February 15 and August 15, or the first business day thereafter, up to and including February 15, 2023. After February 15, 2023, the holders of Series B preferred units are entitled to receive cumulative, quarterly distributions payable in
arrears on the 15th day of February, May, August and November of each year, or the first business day thereafter, based on a floating annual rate equal to the three-month LIBOR plus 4.652 percent, in each case assuming a distribution is declared by the Boardboard of Directors.directors. Accordingly, a cash distribution payment totaling $21 million was paid to Series B unitholders on February 16, 2021.15, 2022.
MPLX has the right to redeem some or all of the Series B preferred units, at any time, on or after February 15, 2023. MPLX will pay unitholders the Series B preferred unit redemption price of $1,000 per unit plus any accumulated and unpaid distributions up to the redemption date.
The allocation of total quarterly cash distributions is as follows for the three months ended March 31, 20212022 and 2020.2021. MPLX’s distributions are declared subsequent to quarter end; therefore, the following table represents total cash distributions applicable to the period in which the distributions were earned.
| | | Three Months Ended March 31, | | | Three Months Ended March 31, | |
| (In millions, except per unit data) | (In millions, except per unit data) | 2021 | | 2020 | | (In millions, except per unit data) | 2022 | | 2021 | |
| Distribution declared: | Distribution declared: | | | | | Distribution declared: | | | | |
| Limited partner units - public | Limited partner units - public | $ | 262 | | | $ | 270 | | | Limited partner units - public | $ | 257 | | | $ | 262 | | |
| Limited partner units - MPC | Limited partner units - MPC | 445 | | | 458 | | | Limited partner units - MPC | 456 | | | 445 | | |
| | Total LP distribution declared | Total LP distribution declared | 707 | | | 728 | | | Total LP distribution declared | 713 | | | 707 | | |
| Series A preferred units | Series A preferred units | 20 | | | 20 | | | Series A preferred units | 21 | | | 20 | | |
| Series B preferred units | Series B preferred units | 11 | | | 11 | | | Series B preferred units | 11 | | | 11 | | |
| Total distribution declared | Total distribution declared | 738 | | | 759 | | | Total distribution declared | 745 | | | 738 | | |
| | Cash distributions declared per limited partner common unit | $ | 0.6875 | | | $ | 0.6875 | | | |
| Quarterly cash distributions declared per limited partner common unit | | Quarterly cash distributions declared per limited partner common unit | $ | 0.7050 | | | $ | 0.6875 | | |
Capital Expenditures
Our operations are capital intensive, requiring investments to expand, upgrade, enhance or maintain existing operations and to meet environmental and operational regulations. Our capital requirements consist of maintenance capital expenditures and growth capital expenditures. Examples of maintenance capital expenditures are those made to replace partially or fully depreciated assets, to maintain the existing operating capacity of our assets and to extend their useful lives, or other capital expenditures that are incurred in maintaining existing system volumes and related cash flows. In contrast, growth capital expenditures are those incurred for acquisitions or capital improvements that we expect will increase our operating capacity to increasefor volumes gathered, processed, transported or fractionated, decrease operating expenses within our facilities or increase operating income over the long term. Examples of growth capital expenditures include the acquisition of equipmentcosts to develop or the construction costs associated with new well connections, and the development ofacquire additional pipeline, terminal, processing or storage capacity. In general, growth capital includes costs that are expected to generate additional or new cash flow for MPLX.
MPLX’s initial capital investment plan for 2022 totaled $900 million which includes growth capital of $700 million, maintenance capital of $140 million and a $60 million investment in unconsolidated affiliates for the repayment of our 9.19 percent indirect share of the Bakken Pipeline joint venture’s debt due in 2022. Growth capital expenditures and investments in affiliates during the three months ended March 31, 2022 were primarily for gas gathering, processing and de-ethanization projects in our Bakken, Marcellus, and Southwest basins and the expansion of our crude gathering systems in the Permian and Bakken basins. Spending for the quarter also included the $60 million contribution to our Bakken Pipeline joint venture to fund our share of a debt repayment by the joint venture. We continuously evaluate our capital plan and make changes as conditions warrant.
Our capital expenditures are shown in the table below:
| | | | | | | | | | | |
| | Three Months Ended March 31, |
| (In millions) | 2021 | | 2020 |
| Capital expenditures: | | | |
| Growth capital expenditures | $ | 71 | | | $ | 284 | |
| Growth capital reimbursements | — | | | — | |
| Investments in unconsolidated affiliates | 35 | | | 91 | |
| Return of capital | — | | | (69) | |
| | | |
| Capitalized interest | (5) | | | (13) | |
| Total growth capital expenditures | 101 | | | 293 | |
| Maintenance capital expenditures | 18 | | | 34 | |
| Maintenance capital reimbursements | (7) | | | (14) | |
| Total maintenance capital expenditures | 11 | | | 20 | |
| | | |
| Total growth and maintenance capital expenditures | 112 | | | 313 | |
Investments in unconsolidated affiliates(1) | (35) | | | (91) | |
Return of capital(1) | — | | | 69 | |
| | | |
Growth and maintenance capital reimbursements(2) | 7 | | | 14 | |
| Decrease in capital accruals | 37 | | | 61 | |
| Capitalized interest | 5 | | | 13 | |
Additions to property, plant and equipment, net(1) | $ | 126 | | | $ | 379 | |
| | | | | | | | | | | |
| | Three Months Ended March 31, |
| (In millions) | 2022 | | 2021 |
| Capital expenditures: | | | |
| Growth capital expenditures | $ | 148 | | | $ | 71 | |
| | | |
| Investments in unconsolidated affiliates | 110 | | | 35 | |
| | | |
| | | |
| Capitalized interest | (2) | | | (5) | |
| Total growth capital expenditures | 256 | | | 101 | |
| Maintenance capital expenditures | 24 | | | 18 | |
| Maintenance capital reimbursements | (10) | | | (7) | |
| | | |
| Total maintenance capital expenditures | 14 | | | 11 | |
| | | |
| Total growth and maintenance capital expenditures | 270 | | | 112 | |
Investments in unconsolidated affiliates(1) | (110) | | | (35) | |
| | | |
| | | |
Growth and maintenance capital reimbursements(2) | 10 | | | 7 | |
| Decrease in capital accruals | (3) | | | 37 | |
| Capitalized interest | 2 | | | 5 | |
Additions to property, plant and equipment, net(1) | $ | 169 | | | $ | 126 | |
(1) Investments in unconsolidated affiliates return of capital and additions to property, plant and equipment, net are shown as separate lines within investing activities in the Consolidated Statements of Cash Flows.
(2) Growth and maintenance capital reimbursements are included in the Contributions from MPC line within financing activities in the Consolidated Statements of Cash Flows.
Contractual Cash Obligations
As of March 31, 2021,2022, our contractual cash obligations included long-termthird-party and related party debt, finance and operating lease obligations, purchase obligations for services and to acquire property, plant and equipment, and other liabilities. During the three months ended March 31, 2021,2022, our third-party long-term debt obligations decreasedincreased by $90 million,$1.2 billion, primarily due to the redemptionissuance of $750 million outstandingthe $1.5 billion aggregate principal amount of 5.2504.950 percent senior notes due January 15, 20252052 Senior Notes, discussed above, partially offset by increased borrowingsabove. A portion of the issuance was used to repay amounts outstanding on the MPLX Credit Agreement. There were no other material changes to our contractual obligations outside the ordinary course of business since December 31, 2020.2021.
Off-Balance Sheet Arrangements
Off-balance sheet arrangements comprise those arrangements that may potentially impact our liquidity, capital resources and results of operations, even though such arrangements are not recorded as liabilities under U.S. GAAP. Our off-balance sheet arrangements are limited to indemnities and guarantees that are described in Note 21.14. Although these arrangements serve a variety of our business purposes, we are not dependent on them to maintain our liquidity and capital resources, and we are not aware of any circumstances that are reasonably likely to cause the off-balance sheet arrangements to have a material adverse effect on our liquidity and capital resources.
TRANSACTIONS WITH RELATED PARTIESTransactions with Related Parties
At March 31, 2021,2022, MPC owned our non-economic general partnership interest and held approximately 6364 percent of our outstanding common units.
Excluding revenues attributable to volumes shipped byWe provide MPC under joint tariffs with third parties that are treated as third-party revenues for accounting purposes and excluding losses for impairment of equity method investments, MPC accounted for 51 percent and 55 percent of our total revenues and other income for the first quarter of 2021 and 2020, respectively. We provide crude oil and product pipeline and trucking transportation services based on regulated tarifftariff/contracted rates, andas well as storage, servicesterminal, fuels distribution, and inland marine transportation services based on contracted rates.
Of our total costs and expenses, excluding impairment expense, We also have agreements with MPC accountedunder which we receive fees for 29 percent and 29 percentoperating MPC’s retained pipeline assets, providing management services for the first quartermarine business, and operating certain of 2021 and 2020, respectively.MPC’s equity method investments. MPC performedprovides us with certain services for us related to information technology, engineering, legal, accounting, treasury, human resources and other administrative services.services under employee services and omnibus services agreements.
The below table shows the percentage of “Total revenues and other income” as well as “Total costs and expenses” with MPC:
| | | | | | | | | | | |
| Three Months Ended March 31, |
| 2022 | | 2021 |
| Total revenues and other income | 48 | % | | 51 | % |
| Total costs and expenses | 24 | % | | 29 | % |
For further discussion of agreements and activity with MPC and related parties see Item 1. Business in our Annual Report on Form 10-K for the year ended December 31, 20202021 and Note 54 of the Notes to the Consolidated Financial Statements in this report.
ENVIRONMENTAL MATTERS AND COMPLIANCE COSTSEnvironmental Matters and Compliance Costs
We have incurred and may continue to incur substantial capital, operating and maintenance, and remediation expenditures as a result of environmental laws and regulations. If these expenditures, as with all costs, are not ultimately reflected in the prices of our products and services, our operating results will be adversely affected. We believe that substantially all of our competitors must comply with similar environmental laws and regulations. However, the specific impact on each competitor may vary depending on a number of factors, including, but not limited to, the age and location of its operating facilities.
As ofDuring the three months ended March 31, 2021, there2022, environmental remediation costs increased due to a release of crude oil on our pipeline near Edwardsville, Illinois in March of 2022. There have been no significantadditional changes to our environmental matters and compliance costs since our Annual Report on Form 10-K for the year ended December 31, 2020.2021.
CRITICAL ACCOUNTING ESTIMATESCritical Accounting Estimates
As of March 31, 2021,2022, there have been no significant changes to our critical accounting estimates since our Annual Report on Form 10-K for the year ended December 31, 2020.2021.
ACCOUNTING STANDARDS NOT YET ADOPTEDAccounting Standards Not Yet Adopted
While new financial accounting pronouncements will be effective for our financial statements in the future, there are no standards that have not yet been adopted that are expected to have a material impact on our financial statements. Accounting standards are discussed in Note 2 of the Notes to the Consolidated Financial Statements.
Item 3. Quantitative and Qualitative Disclosures about Market Risk
We are exposed to market risks related to the volatility of commodity prices. We employ various strategies, including the potential use of commodity derivative instruments, to economically hedge the risks related to these price fluctuations. We are also exposed to market risks related to changes in interest rates. As of March 31, 2021,2022, we did not have any open financial or commodity derivative instruments to economically hedge the economic risks related to interest rate fluctuations or commodity derivative instruments to economically hedge the risks related to the volatility of commodity prices;prices, respectively; however, we continually monitor the market and our exposure and may enter into these arrangements in the future. While there is a risk related to changes in fair value of derivative instruments we may enter into, such risk is mitigated by price or rate changes related to the underlying commodity or financial transaction.
Commodity Price Risk
The information about commodity price risk for the three months ended March 31, 20212022 does not differ materially from that discussed in Item 7A. Quantitative and Qualitative Disclosures about Market Risk of our Annual Report on Form 10-K for the year ended December 31, 2020.2021.
Outstanding Derivative Contracts
We have aSee Notes 9 and 10 to the unaudited consolidated financial statements for more information about the fair value measurement of our natural gas purchase commitment embedded in a keep-whole processing agreement with a producer customer in the Southern Appalachian region expiring in December 2022. The customer has the unilateral option to extend the agreement for two consecutive five-year terms through December 2032. For accounting purposes, the natural gas purchase commitment and the term extending options have been aggregated into a single compound embedded derivative. The probability of the customer exercising its options is determined based on assumptions about the customer’s potential business strategy decision points that may exist at the time they would elect whether to renew the contract. The changes in fair value of this compound embedded derivative, are based onas well as the difference between the contractual and index pricing and the probability of the producer customer exercising its option to extend. The changes in fair value areamounts recorded in earnings through “Purchased product costs” on the Consolidated Statementsour consolidated balance sheets and statements of Income. Asincome. We do not designate any of March 31, 2021 and December 31, 2020, the estimated fair value of this contract was a liability of $66 million and $63 million, respectively.our commodity derivative instruments as hedges for accounting purposes.
Open Derivative Positions and Sensitivity Analysis
As of March 31, 2021, we have no open commodity derivative contracts. We evaluate our portfolio of commodity derivative instruments on an ongoing basis and add or revise strategies in anticipation of changes in market conditions and in risk profiles.
Interest Rate Risk and Sensitivity Analysis
Sensitivity analysis of the effect of a hypothetical 100-basis-point change in interest rates on long-termthird-party outstanding debt, excluding finance leases, is provided in the following table. Fair value of cash and cash equivalents, receivables, accounts payable and accrued interest approximate carrying value and are relatively insensitive to changes in interest rates due to the short-term maturity of the instruments. Accordingly, these instruments are excluded from the table.
| | | | | | | | | | | | | | | | | |
| (In millions) | Fair value as of March 31, 2021(1) | | Change in Fair Value(2) | | Change in Income Before Income Taxes for the Three Months Ended March 31, 2021(3) |
| Long-term debt (including amounts due within one year) | | | | | |
| Fixed-rate | $ | 20,152 | | | $ | 1,843 | | | N/A |
| Variable-rate | $ | 1,836 | | | $ | 14 | | | $ | 4 | |
| | | | | | | | | | | | | | | | | |
| (In millions) | Fair Value as of March 31, 2022(1) | | Change in Fair Value(2) | | Change in Income Before Income Taxes for the Three Months Ended March 31, 2022(3) |
| Outstanding debt | | | | | |
| Fixed-rate | $ | 20,392 | | | $ | 1,832 | | | N/A |
Variable-rate(4) | $ | — | | | $ | — | | | $ | 1 | |
(1) Fair value was based on market prices, where available, or current borrowing rates for financings with similar terms and maturities.
(2) Assumes a 100-basis-point decrease in the weighted average yield-to-maturity at March 31, 2021.2022.
(3) Assumes a 100-basis-point change in interest rates. The change to net income was based on the weighted average balance of all outstanding variable-rate debt for the three months ended March 31, 2021.2022.
(4) MPLX had no outstanding borrowings on the MPLX Credit Agreement as of March 31, 2022.
At March 31, 2021,2022, our portfolio of long-term debt consisted of fixed-rate instruments and variable-rate instruments including fixed rate senior notes, floating rate senior notes andalso provides for borrowings under our revolving credit facility. The fair value of our fixed-rate debt is relatively sensitive to interest rate fluctuations. Our sensitivity to interest rate declines and corresponding increases in the fair value of our debt portfolio unfavorably affects our results of operations and cash flows only when we elect to repurchase or otherwise retire fixed-rate debt at prices above carrying value. Interest rate fluctuations generally do not impact the fair value of borrowings under our bank revolving credit facility,MPLX Credit Agreement, but may affect our results of operations and cash flows. As
See Note 9 to the unaudited consolidated financial statements for additional information on the fair value of March 31, 2021, we did not have any financial derivative instruments to hedge the risks related to interest rate fluctuations; however, we continually monitor the market and our exposure and may enter into these agreements in the future.debt.
Item 4. Controls and Procedures
Disclosure Controls and Procedures
An evaluation of the effectiveness of the design and operation of our disclosure controls and procedures (as defined in Rules 13a-15(e) and 15d-15(e) under the Securities Exchange Act of 1934, as amended) was carried out under the supervision and with the participation of management, including the chief executive officer and chief financial officer of our general partner. Based upon that evaluation, the chief executive officer and chief financial officer of our general partner concluded that the design and operation of these disclosure controls and procedures were effective as of March 31, 2021,2022, the end of the period covered by this report.
Changes in Internal Control Over Financial Reporting
During the quarter ended March 31, 2021,2022, there were no changes in our internal control over financial reporting that have materially affected, or are reasonably likely to materially affect, our internal control over financial reporting.
Part II – Other Information
Item 1. Legal Proceedings
We are the subject of, or a party to, a number of pending or threatened legal actions, contingencies and commitments involving a variety of matters, including laws and regulations relating to the environment. While it is possible that an adverse result in one or more of the lawsuits or proceedings in which we are a defendant could be material to us, based upon current information and our experience as a defendant in other matters, we believe that these lawsuits and proceedings, individually or in the aggregate, will not have a material adverse effect on our consolidated results of operations, financial position or cash flows. Except as described below, there have been no material changes to the legal proceedings previously disclosed in our Annual Report on Form 10-K.
Litigation
Tesoro High Plains Pipeline
In early July 2020, Tesoro High Plains Pipeline Company, LLC (“THPP”), a subsidiary of MPLX, received a Notification of Trespass Determination from the Bureau of Indian Affairs (“BIA”) relating to a portion of the Tesoro High Plains Pipeline that crosses the Fort Berthold Reservation in North Dakota. The notification covered the rights of way for 23 tracts of land and demanded the immediate cessation of pipeline operations. The notification also assessed trespass damages of approximately $187 million. THPP appealed this determination, which triggered an automatic stay of the requested pipeline shutdown and payment. On October 29, the Assistant Secretary - Indian Affairs issued an order vacating the BIA’s trespass order and requiring the Regional Director for the BIA Great Plains Region to issue a new decision on or before December 15 covering all 34 tracts at issue. On December 15, the Regional Director of the BIA issued a new trespass notice to THPP consistent with the Assistant Secretary - Indian Affairs order vacating the prior trespass order. The new order found that THPP was in trespass and assessed trespass damages of approximately $4 million (including interest). The order also required THPP to immediately cease and desist use of the portion of the pipeline that crosses the property at issue. The new order was appealed, and was upheld by the Assistant Secretary - Indian Affairs. THPP has complied with the Regional Director’s December 15, 2020 notice. On February 12, 2021, landowners filed suit in the U.S. District Court for the District of North Dakota (the “District of North Dakota”) against THPP, the Department of the Interior, the Assistant Secretary - Indian Affairs, the Interior Board of Indian Appeals and the BIA, requesting, among other things, that decisions by the Assistant Secretary - Indian Affairs and the Interior Board of Indian Appeals be vacated as to the award of damages to plaintiffs. In March 2021, THPP received a copy of an order purporting to vacate all orders related to THPP’s alleged trespass issued by the BIA between July 2, 2020 and January 14, 2021. The order directs the Regional Director of the BIA to reconsider the issue of THPP’s alleged trespass and issue a new order, if necessary, after all interested parties have had an opportunity to be heard. Subsequently, landowners voluntarily dismissed the suit filed in the District of North Dakota. On April 23, 2021, THPP filed a lawsuit in the District of North Dakota against the United States of America, the U.S. Department of the Interior and the BIA challenging the March order purporting to vacate all previous orders related to THPP’s alleged trespass.
We continue to work towards a settlement of this matter with holders of the property rights at issue.
Environmental Proceedings
Item 103 of Regulation S-K promulgated by the SEC requires disclosure of certain environmental matters when a governmental authority is a party to the proceedings and such proceedings involve potential monetary sanctions, unless we reasonably believe that the matter will result in no monetary sanctions, or in monetary sanctions, exclusive of interest and costs, of less than $300,000. The following matters are disclosed in accordance with that requirement. We do not currently believe that the eventual outcome of any such matters, individually or in the aggregate, could have a material adverse effect on our business, financial condition, results of operations or cash flows.
ThereExcept as described below, there have been no material changes to the environmental proceedingslegal matters previously disclosed in our Annual Report on Form 10-K.10-K for the year ended December 31, 2021.
Edwardsville Incident
In March 2022, the State of Illinois brought an action against Marathon Pipe Line LLC, an indirect wholly owned subsidiary of MPLX LP, asserting various violations and demanding a permanent injunction and civil penalties in connection with a March 2022 release of crude oil on a pipeline near Edwardsville, Illinois. We are negotiating a settlement of the allegations and cannot currently estimate the timing of the resolution of this matter.
Item 1A. Risk Factors
There have been no material changes from the risk factors previously disclosed in our Annual Report on Form 10-K for the year ended December 31, 2020.2021.
Item 2. Unregistered Sales of Equity Securities and Use of Proceeds
The following table sets forth a summary of our purchases during the quarter ended March 31, 2021,2022, of equity securities that are registered by MPLX pursuant to Section 12 of the Securities Exchange Act of 1934, as amended.
| | | | | | | | | | | | | | | | | | | | | | | | | | |
| Period | | Total Number of Units Purchased | | Average Price
Paid per
Unit(1) | | Total Number of Units Purchased as Part of Publicly Announced Plans or Programs | | Maximum Dollar Value of Units that May Yet Be Purchased Under the Plans or Programs(2) |
| 1/01/2021-1/31/2021 | 879,708 | | | $ | 23.47 | | | 879,708 | | | $ | 946,504,250 | |
| 2/01/2021-2/28/2021 | 2,148,970 | | | $ | 24.24 | | | 2,148,970 | | | $ | 894,403,501 | |
| 3/01/2021-3/31/2021 | 3,244,303 | | | $ | 25.49 | | | 3,244,303 | | | $ | 811,694,451 | |
| Total | 6,272,981 | | | $ | 24.78 | | | 6,272,981 | | | |
| | | | | | | | | | | | | | | | | | | | | | | | | | |
| | | | | | | | Millions of Dollars |
| Period | | Total Number of Units Purchased | | Average Price
Paid per
Unit(1) | | Total Number of Units Purchased as Part of Publicly Announced Plans or Programs | | Maximum Dollar Value of Units that May Yet Be Purchased Under the Plans or Programs(2) |
| 1/01/2022-1/31/2022 | 1,371,325 | | | $ | 31.36 | | | 1,371,325 | | | $ | 294 | |
| 2/01/2022-2/28/2022 | 570,396 | | | 32.37 | | | 570,396 | | | 275 | |
| 3/01/2022-3/31/2022 | 1,177,801 | | | 32.72 | | | 1,177,801 | | | $ | 237 | |
| Total | 3,119,522 | | | $ | 32.06 | | | 3,119,522 | | | |
(1)Amounts in this column reflect the weighted average price paid for units purchased under our unit repurchase authorization. The weighted average price includes commissions paid to brokers on shares repurchased under our unit repurchase authorization.during the quarter.
(2)On November 2, 2020, we announced the board authorization of a unit repurchase program for the repurchase of up to $1 billion of MPLX’s common units held by the public. This unit repurchase authorization has no expiration date.
Item 6. Exhibits
| | | | | | | | | | | | | | | | | | | | | | | | | | | | | | | | | | | | | | | | | | | | |
| | | | | Incorporated by Reference From | | | | |
Exhibit
Number | | Exhibit Description | | Form | | Exhibit | | Filing Date | | SEC File No. | | Filed
Herewith | | Furnished
Herewith |
| 2.1† | | | | 8-K | | 2.1 | | | 5/8/2019 | | 001-35714 | | | | |
| 3.1 | | | | S-1 | | 3.1 | | | 7/2/2012 | | 333-182500 | | | | |
| 3.2 | | | | S-1/A | | 3.2 | | | 10/9/2012 | | 333-182500 | | | | |
| 3.3 | | | | 8-K | | 3.1 | | | 2/3/2021 | | 001-35714 | | | | |
| 10.1 | | | | 10-K | | 10.106 | | 2/26/2021 | | 001-35714 | | | | |
| 31.1 | | | | | | | | | | | | X | | |
| 31.2 | | | | | | | | | | | | X | | |
| 32.1 | | | | | | | | | | | | | | X |
| 32.2 | | | | | | | | | | | | | | X |
| 101.INS | | XBRL Instance Document: The instance document does not appear in the interactive data file because its XBRL tags are embedded within the Inline XBRL document. | | | | | | | | | | | | |
| 101.SCH | | Inline XBRL Taxonomy Extension Schema Document. | | | | | | | | | | X | | |
| 101.CAL | | Inline XBRL Taxonomy Extension Calculation Linkbase Document. | | | | | | | | | | X | | |
| 101.DEF | | Inline XBRL Taxonomy Extension Definition Linkbase Document. | | | | | | | | | | X | | |
| 101.LAB | | Inline XBRL Taxonomy Extension Label Linkbase Document. | | | | | | | | | | X | | |
| 101.PRE | | Inline XBRL Taxonomy Extension Presentation Linkbase Document. | | | | | | | | | | X | | |
| 104 | | Cover Page Interactive Data File (formatted as Inline XBRL and contained in Exhibit 101). | | | | | | | | | | | | |
| | | | | | | | | | | | | | | | | | | | | | | | | | | | | | | | | | | | | | | | | | | | |
| | | | | Incorporated by Reference From | | | | |
Exhibit
Number | | Exhibit Description | | Form | | Exhibit | | Filing Date | | SEC File No. | | Filed
Herewith | | Furnished
Herewith |
| 3.1 | | | | S-1 | | 3.1 | | | 7/2/2012 | | 333-182500 | | | | |
| 3.2 | | | | S-1/A | | 3.2 | | | 10/9/2012 | | 333-182500 | | | | |
| 3.3 | | | | 8-K | | 3.1 | | | 2/3/2021 | | 001-35714 | | | | |
| 10.1 | | | | | | | | | | | | X | | |
| 10.2 | | | | | | | | | | | | X | | |
| 10.3 | | | | | | | | | | | | X | | |
| 31.1 | | | | | | | | | | | | X | | |
| 31.2 | | | | | | | | | | | | X | | |
| 32.1 | | | | | | | | | | | | | | X |
| 32.2 | | | | | | | | | | | | | | X |
| 101.INS | | XBRL Instance Document: The instance document does not appear in the interactive data file because its XBRL tags are embedded within the Inline XBRL document. | | | | | | | | | | | | |
| 101.SCH | | Inline XBRL Taxonomy Extension Schema Document. | | | | | | | | | | X | | |
| 101.CAL | | Inline XBRL Taxonomy Extension Calculation Linkbase Document. | | | | | | | | | | X | | |
| 101.DEF | | Inline XBRL Taxonomy Extension Definition Linkbase Document. | | | | | | | | | | X | | |
| 101.LAB | | Inline XBRL Taxonomy Extension Label Linkbase Document. | | | | | | | | | | X | | |
| 101.PRE | | Inline XBRL Taxonomy Extension Presentation Linkbase Document. | | | | | | | | | | X | | |
| 104 | | Cover Page Interactive Data File (formatted as Inline XBRL and contained in Exhibit 101). | | | | | | | | | | | | |
† The exhibits and schedulesPursuant to Item 601(b)(4) of Regulation S-K, certain instruments with respect to long-term debt issues have been omitted pursuantwhere the amount of securities authorized under such instruments does not exceed 10 percent of the total consolidated assets of the Registrant. The Registrant hereby agrees to Item 601(b)(2)furnish a copy of Regulation S-K and will be providedany such instrument to the Securities and Exchange Commission upon requestits request.
SIGNATURES
Pursuant to the requirements of the Securities Exchange Act of 1934, the registrant has duly caused this report to be signed on its behalf by the undersigned thereunto duly authorized.
| | | | | | | | | | | |
| MPLX LP | | |
| | | |
| By: | | MPLX GP LLC |
| | | Its general partner |
| | | |
Date: May 6, 20213, 2022 | By: | | /s/ C. Kristopher HagedornKelly D. Wright |
| | | C. Kristopher HagedornKelly D. Wright |
| | | Vice President and Controller of MPLX GP LLC (the general partner of MPLX LP) |