UNITED STATES
SECURITIES AND EXCHANGE COMMISSION
Washington, D.C. 20549
_____________________________________________
FORM 10-Q
____________________________________________
| | | | | |
| (Mark One) |
| ☒ | QUARTERLY REPORT PURSUANT TO SECTION 13 OR 15(d) OF THE SECURITIES EXCHANGE ACT OF 1934 |
For the quarterly period ended June 30, 2023March 31, 2024
OR
| | | | | |
| ☐ | TRANSITION REPORT PURSUANT TO SECTION 13 OR 15(d) OF THE SECURITIES EXCHANGE ACT OF 1934 |
For the transition period from to
Commission file number 001-35714
_____________________________________________
MPLX LP
(Exact name of registrant as specified in its charter)
_____________________________________________
| | | | | | | | | | | | | | | | | | | | |
| Delaware | | | 27-0005456 |
(State or other jurisdiction of
incorporation or organization) | | (I.R.S. Employer
Identification No.) |
| | | | | | | | | | | | | | | | | |
| 200 E. Hardin Street, | Findlay, | Ohio | | 45840 | |
| (Address of principal executive offices) | | (Zip code) | |
(419) 421-2414422-2121
(Registrant’s telephone number, including area code)
_____________________________________________
| | | | | | | | |
| Securities Registered pursuant to Section 12(b) of the Act |
| Title of each class | Trading symbol(s) | Name of each exchange on which registered |
| Common Units Representing Limited Partnership Interests | MPLX | New York Stock Exchange |
Indicate by check mark whether the registrant (1) has filed all reports required to be filed by Section 13 or 15(d) of the Securities Exchange Act of 1934 during the preceding 12 months (or for such shorter period that the registrant was required to file such reports), and (2) has been subject to such filing requirements for the past 90 days. Yes x No ¨
Indicate by check mark whether the registrant has submitted electronically every Interactive Data File required to be submitted pursuant to Rule 405 of Regulation S-T (§232.405 of this chapter) during the preceding 12 months (or for such shorter period that the registrant was required to submit such files.) Yes x No ¨
Indicate by check mark whether the registrant is a large accelerated filer, an accelerated filer, a non-accelerated filer, a smaller reporting company, or an emerging growth company. See the definitions of “large accelerated filer,” “accelerated filer,” “smaller reporting company,” and “emerging growth company” in Rule 12b-2 of the Exchange Act.
| | | | | | | | | | | | | | | | | | | | | | | |
| Large accelerated filer | x | | Accelerated filer | ☐ | | Non-accelerated filer | ☐ |
| | | | | | | | | | | | | | |
| Smaller reporting company | ☐ | | Emerging growth company | ☐ |
If an emerging growth company, indicate by check mark if the registrant has elected not to use the extended transition period for complying with any new or revised financial accounting standards provided pursuant to Section 13(a) of the Exchange Act. ¨
Indicate by check mark whether the registrant is a shell company (as defined in Rule 12b-2 of the Exchange Act) Yes ☐ No x
MPLX LP had 1,001,216,8671,016,195,695 common units outstanding as of JulyApril 26, 2023.2024.
Table of Contents
| | | | | | | | |
| | Page |
| |
| Item 1. | | |
| | |
| | |
| | |
| | |
| | |
| | |
| Item 2. | | |
| Item 3. | | |
| Item 4. | | |
| | |
| |
| Item 1. | | |
| Item 1A. | | |
| Item 2. | | |
| Item 5. | | |
| Item 6. | | |
| | |
Unless otherwise stated or the context otherwise indicates, all references in this Form 10-Q to “MPLX LP,” “MPLX,” “the Partnership,” “we,” “our,” “us,” or like terms refer to MPLX LP and its consolidated subsidiaries. References to our sponsor and customer, “MPC,” refer collectively to Marathon Petroleum Corporation and its subsidiaries, other than the Partnership.
Glossary of Terms
The abbreviations, acronyms and industry technologyterminology used in this report are defined as follows:
| | | | | |
| |
| ASC | Accounting Standards Codification |
| ASU | Accounting Standards Update |
| |
Barrelbarrel | One stock tank barrel, or 42 U.S.United States gallons of liquid volume, used in reference to crude oil or other liquid hydrocarbons |
| |
| |
| Btu | One British thermal unit, an energy measurement
| |
| DCF (a non-GAAP financial measure) | Distributable Cash Flow |
| |
| EBITDA (a non-GAAP financial measure) | Earnings Before Interest, Taxes, Depreciation and Amortization |
| |
| |
| FASB | Financial Accounting Standards Board |
| FCF (a non-GAAP financial measure) | Free Cash Flow |
| GAAP | Accounting principles generally accepted in the United States of America |
| |
| |
| |
| |
| G&P | Gathering and Processing segment |
| L&S | Logistics and Storage segment |
| mbpd | Thousand barrels per day |
| |
| MMBtu | One million British thermal units, an energy measurement |
| MMcf/d | One million cubic feet of natural gas per day |
| NGL | Natural gas liquids, such as ethane, propane, butanes and natural gasoline |
| |
| |
| |
| |
| |
| SEC | U.S.United States Securities and Exchange Commission |
| SOFR | Secured Overnight Financing Rate |
| |
| VIE | Variable interest entity |
| |
| |
PartPART I—Financial InformationFINANCIAL INFORMATION
Item 1. Financial Statements
MPLX LP
Consolidated Statements of Income (Unaudited) | | | | | | | | | | | | | | | | | | | | | | | |
| Three Months Ended
June 30, | | Six Months Ended
June 30, |
| (In millions, except per unit data) | 2023 | | 2022 | | 2023 | | 2022 |
| Revenues and other income: | | | | | | | |
| Service revenue | $ | 635 | | | $ | 577 | | | $ | 1,240 | | | $ | 1,131 | |
| Service revenue - related parties | 971 | | | 938 | | | 1,924 | | | 1,853 | |
| Service revenue - product related | 60 | | | 118 | | | 139 | | | 241 | |
| Rental income | 59 | | | 102 | | | 120 | | | 193 | |
| Rental income - related parties | 203 | | | 198 | | | 405 | | | 363 | |
| Product sales | 376 | | | 698 | | | 796 | | | 1,195 | |
| Product sales - related parties | 34 | | | 51 | | | 104 | | | 96 | |
| | | | | | | |
| Sales-type lease revenue | 33 | | | — | | | 67 | | | — | |
| Sales-type lease revenue - related parties | 125 | | | 114 | | | 250 | | | 225 | |
| Income from equity method investments | 145 | | | 111 | | | 279 | | | 210 | |
| Other income (loss) | 18 | | | 6 | | | 21 | | | (11) | |
| Other income - related parties | 31 | | | 27 | | | 58 | | | 54 | |
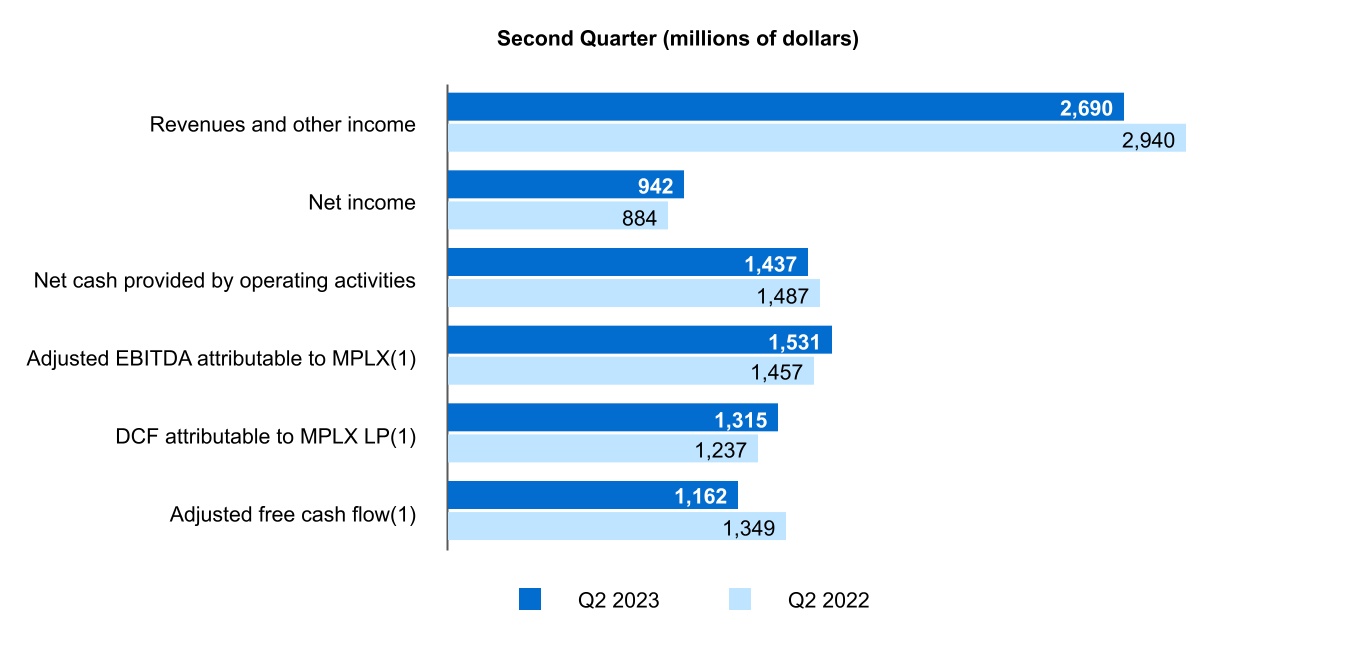
| Total revenues and other income | 2,690 | | | 2,940 | | | 5,403 | | | 5,550 | |
| Costs and expenses: | | | | | | | |
| Cost of revenues (excludes items below) | 348 | | | 323 | | | 656 | | | 610 | |
| Purchased product costs | 354 | | | 663 | | | 760 | | | 1,130 | |
| Rental cost of sales | 20 | | | 42 | | | 40 | | | 79 | |
| Rental cost of sales - related parties | 9 | | | 19 | | | 16 | | | 34 | |
| Purchases - related parties | 357 | | | 351 | | | 718 | | | 670 | |
| Depreciation and amortization | 310 | | | 310 | | | 606 | | | 623 | |
| | | | | | | |
| General and administrative expenses | 89 | | | 82 | | | 178 | | | 160 | |
| | | | | | | |
| Other taxes | 28 | | | 33 | | | 58 | | | 67 | |
| Total costs and expenses | 1,515 | | | 1,823 | | | 3,032 | | | 3,373 | |
| Income from operations | 1,175 | | | 1,117 | | | 2,371 | | | 2,177 | |
| Related-party interest and other financial costs | — | | | 1 | | | — | | | 5 | |
| Interest expense, net of amounts capitalized | 226 | | | 212 | | | 450 | | | 410 | |
| Other financial costs | 7 | | | 20 | | | 26 | | | 40 | |
| Income before income taxes | 942 | | | 884 | | | 1,895 | | | 1,722 | |
| Provision for income taxes | — | | | — | | | 1 | | | 5 | |
| Net income | 942 | | | 884 | | | 1,894 | | | 1,717 | |
| Less: Net income attributable to noncontrolling interests | 9 | | | 9 | | | 18 | | | 17 | |
| | | | | | | |
| Net income attributable to MPLX LP | 933 | | | 875 | | | 1,876 | | | 1,700 | |
| Less: Series A preferred unitholders interest in net income | 23 | | | 21 | | | 46 | | | 42 | |
| Less: Series B preferred unitholders interest in net income | — | | | 10 | | | 5 | | | 21 | |
| Limited partners' interest in net income attributable to MPLX LP | $ | 910 | | | $ | 844 | | | $ | 1,825 | | | $ | 1,637 | |
| Per Unit Data (See Note 6) | | | | | | | |
| Net income attributable to MPLX LP per limited partner unit: | | | | | | |
| Common - basic | $ | 0.91 | | | $ | 0.83 | | | $ | 1.81 | | | $ | 1.61 | |
| Common - diluted | $ | 0.91 | | | $ | 0.83 | | | $ | 1.81 | | | $ | 1.61 | |
| Weighted average limited partner units outstanding: | | | | | | | |
| Common - basic | 1,001 | | | 1,012 | | | 1,001 | | | 1,013 | |
| Common - diluted | 1,001 | | | 1,012 | | | 1,001 | | | 1,014 | |
| | | | | | | |
| | | | | | | | | | | | | | | |
| Three Months Ended
March 31, | | |
| (In millions, except per unit data) | 2024 | | 2023 | | | | |
| Revenues and other income: | | | | | | | |
| Service revenue | $ | 658 | | | $ | 605 | | | | | |
| Service revenue - related parties | 986 | | | 953 | | | | | |
| Service revenue - product related | 95 | | | 79 | | | | | |
| Rental income | 60 | | | 61 | | | | | |
| Rental income - related parties | 217 | | | 202 | | | | | |
| Product sales | 370 | | | 420 | | | | | |
| Product sales - related parties | 63 | | | 70 | | | | | |
| | | | | | | |
| Sales-type lease revenue | 34 | | | 34 | | | | | |
| Sales-type lease revenue - related parties | 121 | | | 125 | | | | | |
| Income from equity method investments | 157 | | | 134 | | | | | |
| Other income | 45 | | | 3 | | | | | |
| Other income - related parties | 40 | | | 27 | | | | | |
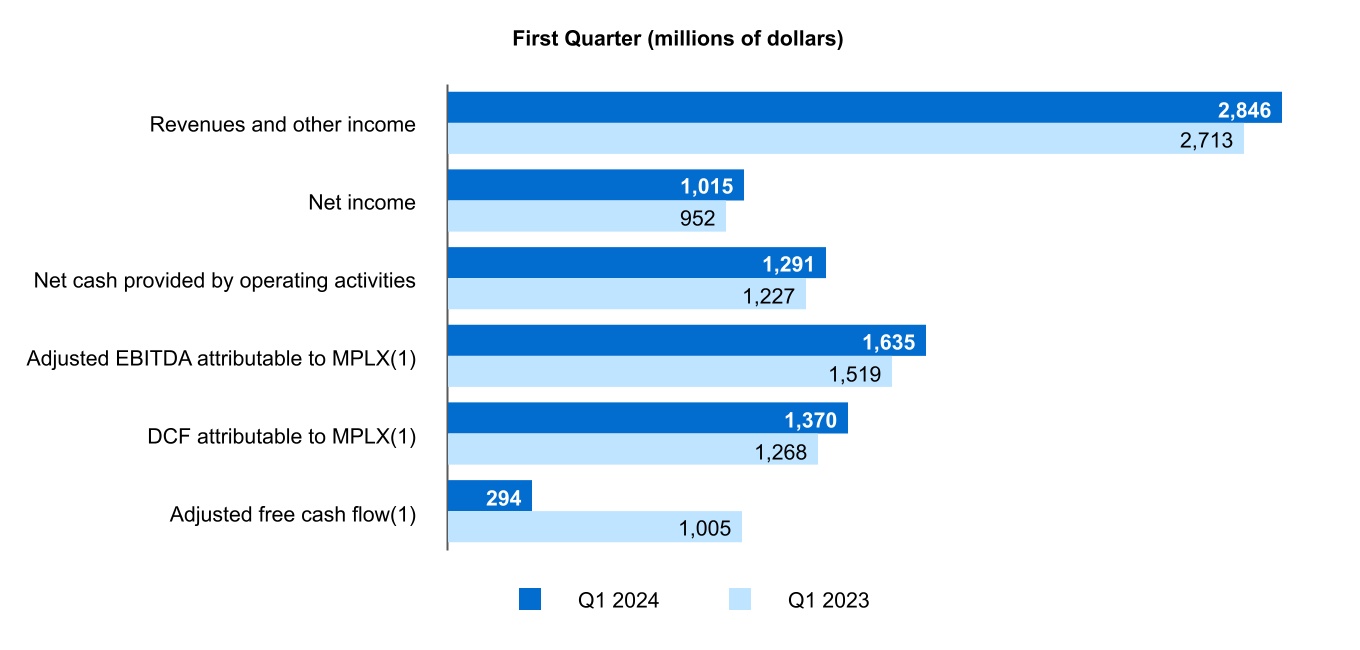
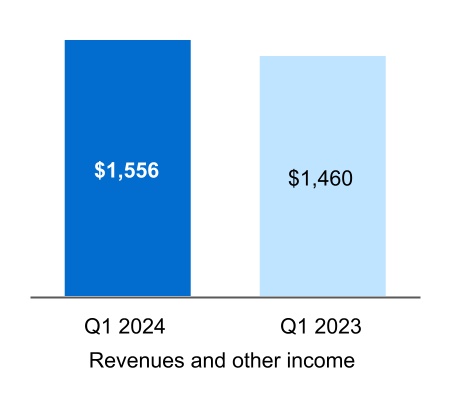
| Total revenues and other income | 2,846 | | | 2,713 | | | | | |
| Costs and expenses: | | | | | | | |
| Cost of revenues (excludes items below) | 371 | | | 308 | | | | | |
| Purchased product costs | 369 | | | 406 | | | | | |
| Rental cost of sales | 19 | | | 20 | | | | | |
| Rental cost of sales - related parties | 4 | | | 7 | | | | | |
| Purchases - related parties | 372 | | | 361 | | | | | |
| Depreciation and amortization | 317 | | | 296 | | | | | |
| | | | | | | |
| General and administrative expenses | 109 | | | 89 | | | | | |
| | | | | | | |
| Other taxes | 34 | | | 30 | | | | | |
| Total costs and expenses | 1,595 | | | 1,517 | | | | | |
| Income from operations | 1,251 | | | 1,196 | | | | | |
| Net interest and other financial costs | 235 | | | 243 | | | | | |
| Income before income taxes | 1,016 | | | 953 | | | | | |
| Provision for income taxes | 1 | | | 1 | | | | | |
| Net income | 1,015 | | | 952 | | | | | |
| Less: Net income attributable to noncontrolling interests | 10 | | | 9 | | | | | |
| Net income attributable to MPLX LP | 1,005 | | | 943 | | | | | |
| Less: Series A preferred unitholders’ interest in net income | 10 | | | 23 | | | | | |
| Less: Series B preferred unitholders’ interest in net income | — | | | 5 | | | | | |
| Limited partners' interest in net income attributable to MPLX LP | $ | 995 | | | $ | 915 | | | | | |
| | | | | | | |
| Per Unit Data (See Note 7) | | | | | | | |
| Net income attributable to MPLX LP per limited partner unit: | | | | | | |
| Common - basic | $ | 0.98 | | | $ | 0.91 | | | | | |
| Common - diluted | $ | 0.98 | | | $ | 0.91 | | | | | |
| Weighted average limited partner units outstanding: | | | | | | | |
| Common - basic | 1,008 | | | 1,001 | | | | | |
| Common - diluted | 1,008 | | | 1,001 | | | | | |
The accompanying notes are an integral part of these consolidated financial statements.
MPLX LP
Consolidated Statements of Comprehensive Income (Unaudited)
| | | | | | | | | | | | | | | | | | | | | | | |
| Three Months Ended
June 30, | | Six Months Ended
June 30, |
| (In millions) | 2023 | | 2022 | | 2023 | | 2022 |
| Net income | $ | 942 | | | $ | 884 | | | $ | 1,894 | | | $ | 1,717 | |
| Other comprehensive income, net of tax: | | | | | | | |
| Remeasurements of pension and other postretirement benefits related to equity method investments, net of tax | — | | | — | | | 4 | | | 9 | |
| Comprehensive income | 942 | | | 884 | | | 1,898 | | | 1,726 | |
| Less comprehensive income attributable to: | | | | | | | |
| Noncontrolling interests | 9 | | | 9 | | | 18 | | | 17 | |
| | | | | | | |
| Comprehensive income attributable to MPLX LP | $ | 933 | | | $ | 875 | | | $ | 1,880 | | | $ | 1,709 | |
| | | | | | | | | | | | | | | |
| Three Months Ended
March 31, | | |
| (In millions) | 2024 | | 2023 | | | | |
| Net income | $ | 1,015 | | | $ | 952 | | | | | |
| Other comprehensive income, net of tax: | | | | | | | |
| Remeasurements of pension and other postretirement benefits related to equity method investments, net of tax | 1 | | | 4 | | | | | |
| Comprehensive income | 1,016 | | | 956 | | | | | |
| Less comprehensive income attributable to: | | | | | | | |
| Noncontrolling interests | 10 | | | 9 | | | | | |
| Comprehensive income attributable to MPLX LP | $ | 1,006 | | | $ | 947 | | | | | |
The accompanying notes are an integral part of these consolidated financial statements.
MPLX LP
Consolidated Balance Sheets (Unaudited)
| | | | | | | | | | | |
| (In millions) | June 30,
2023 | | December 31,
2022 |
| Assets | | | |
| | | |
| Cash and cash equivalents | $ | 755 | | | $ | 238 | |
| | | |
| Receivables, net | 717 | | | 737 | |
| Current assets - related parties | 654 | | | 729 | |
| Inventories | 146 | | | 148 | |
| | | |
| Other current assets | 49 | | | 53 | |
| Total current assets | 2,321 | | | 1,905 | |
| Equity method investments | 4,124 | | | 4,095 | |
| Property, plant and equipment, net | 18,692 | | | 18,848 | |
| Intangibles, net | 641 | | | 705 | |
| Goodwill | 7,645 | | | 7,645 | |
| Right of use assets, net | 281 | | | 283 | |
| Noncurrent assets - related parties | 1,199 | | | 1,225 | |
| Other noncurrent assets | 970 | | | 959 | |
| Total assets | 35,873 | | | 35,665 | |
| | | |
| Liabilities | | | |
| | | |
| Accounts payable | 128 | | | 224 | |
| Accrued liabilities | 241 | | | 269 | |
| | | |
| | | |
| | | |
| Current liabilities - related parties | 336 | | | 343 | |
| Accrued property, plant and equipment | 149 | | | 128 | |
| | | |
| Long-term debt due within one year | 1 | | | 988 | |
| Accrued interest payable | 247 | | | 237 | |
| Operating lease liabilities | 49 | | | 46 | |
| | | |
| Other current liabilities | 165 | | | 166 | |
| Total current liabilities | 1,316 | | | 2,401 | |
| Long-term deferred revenue | 268 | | | 219 | |
| Long-term liabilities - related parties | 341 | | | 338 | |
| Long-term debt | 20,405 | | | 18,808 | |
| Deferred income taxes | 13 | | | 13 | |
| Long-term operating lease liabilities | 228 | | | 230 | |
| Other long-term liabilities | 113 | | | 142 | |
| Total liabilities | 22,684 | | | 22,151 | |
| Commitments and contingencies (see Note 14) | | | |
| Series A preferred units (30 million and 30 million units issued and outstanding) | 968 | | | 968 | |
| | | |
| Equity | | | |
| Common unitholders - public (354 million and 354 million units issued and outstanding) | 8,508 | | | 8,413 | |
| | | |
| Common unitholders - MPC (647 million and 647 million units issued and outstanding) | 3,480 | | | 3,293 | |
| | | |
| | | |
| Series B preferred units (0 and 0.6 million units issued and outstanding) | — | | | 611 | |
| | | |
| Accumulated other comprehensive loss | (4) | | | (8) | |
| Total MPLX LP partners’ capital | 11,984 | | | 12,309 | |
| Noncontrolling interests | 237 | | | 237 | |
| Total equity | 12,221 | | | 12,546 | |
| Total liabilities, preferred units and equity | $ | 35,873 | | | $ | 35,665 | |
| | | | | | | | | | | |
| (In millions) | March 31,
2024 | | December 31,
2023 |
| Assets | | | |
| Cash and cash equivalents | $ | 385 | | | $ | 1,048 | |
| | | |
| Receivables, net | 752 | | | 823 | |
| Current assets - related parties | 803 | | | 748 | |
| Inventories | 163 | | | 159 | |
| | | |
| Other current assets | 36 | | | 30 | |
| Total current assets | 2,139 | | | 2,808 | |
| Equity method investments | 4,343 | | | 3,743 | |
| Property, plant and equipment, net | 19,299 | | | 19,264 | |
| Intangibles, net | 618 | | | 654 | |
| Goodwill | 7,645 | | | 7,645 | |
| Right of use assets, net | 290 | | | 264 | |
| Noncurrent assets - related parties | 1,151 | | | 1,161 | |
| Other noncurrent assets | 976 | | | 990 | |
| Total assets | 36,461 | | | 36,529 | |
| | | |
| Liabilities | | | |
| Accounts payable | 132 | | | 153 | |
| Accrued liabilities | 248 | | | 300 | |
| Current liabilities - related parties | 351 | | | 360 | |
| Accrued property, plant and equipment | 166 | | | 216 | |
| | | |
| Long-term debt due within one year | 1,639 | | | 1,135 | |
| Accrued interest payable | 187 | | | 242 | |
| Operating lease liabilities | 50 | | | 45 | |
| | | |
| Other current liabilities | 187 | | | 173 | |
| Total current liabilities | 2,960 | | | 2,624 | |
| Long-term deferred revenue | 349 | | | 347 | |
| Long-term liabilities - related parties | 320 | | | 325 | |
| Long-term debt | 18,805 | | | 19,296 | |
| Deferred income taxes | 16 | | | 16 | |
| Long-term operating lease liabilities | 231 | | | 211 | |
| Other long-term liabilities | 133 | | | 126 | |
| Total liabilities | 22,814 | | | 22,945 | |
| Commitments and contingencies (see Note 16) | | | |
| Series A preferred units (17 million and 27 million units outstanding) | 561 | | | 895 | |
| | | |
| Equity | | | |
| Common unitholders - public (364 million and 356 million units outstanding) | 8,997 | | | 8,700 | |
| Common unitholders - MPC (647 million and 647 million units outstanding) | 3,858 | | | 3,758 | |
| Accumulated other comprehensive loss | (3) | | | (4) | |
| Total MPLX LP partners’ capital | 12,852 | | | 12,454 | |
| Noncontrolling interests | 234 | | | 235 | |
| Total equity | 13,086 | | | 12,689 | |
| Total liabilities, preferred units and equity | $ | 36,461 | | | $ | 36,529 | |
The accompanying notes are an integral part of these consolidated financial statements.
MPLX LP
Consolidated Statements of Cash Flows (Unaudited) | | | | | | | | | | | |
| Six Months Ended
June 30, |
| (In millions) | 2023 | | 2022 |
| Operating activities: | | | |
| Net income | $ | 1,894 | | | $ | 1,717 | |
| Adjustments to reconcile net income to net cash provided by operating activities: | | | |
| Amortization of deferred financing costs | 29 | | | 36 | |
| Depreciation and amortization | 606 | | | 623 | |
| | | |
| Deferred income taxes | (1) | | | 4 | |
| | | |
| | | |
| (Gain)/loss on disposal of assets | (13) | | | 16 | |
| Income from equity method investments | (279) | | | (210) | |
| Distributions from unconsolidated affiliates | 331 | | | 258 | |
| Change in fair value of derivatives | (18) | | | (16) | |
| Changes in: | | | |
| Receivables | 54 | | | (131) | |
| Inventories | (7) | | | (15) | |
| Accounts payable and accrued liabilities | (95) | | | 253 | |
| Assets/liabilities - related parties | 123 | | | — | |
| | | |
| Right of use assets/operating lease liabilities | 2 | | | — | |
| Deferred revenue | 35 | | | 41 | |
| All other, net | 3 | | | 36 | |
| Net cash provided by operating activities | 2,664 | | | 2,612 | |
| Investing activities: | | | |
| Additions to property, plant and equipment | (432) | | | (294) | |
| Acquisitions, net of cash acquired | — | | | (28) | |
| Disposal of assets | 18 | | | 67 | |
| | | |
| Investments in unconsolidated affiliates | (77) | | | (156) | |
| | | |
| | | |
| | | |
| Net cash used in investing activities | (491) | | | (411) | |
| Financing activities: | | | |
| Long-term debt borrowings | 1,589 | | | 2,385 | |
| Long-term debt repayments | (1,001) | | | (1,201) | |
| Related party debt borrowings | — | | | 2,824 | |
| Related party debt repayments | — | | | (4,274) | |
| Debt issuance costs | (15) | | | (16) | |
| | | |
| Unit repurchases | — | | | (135) | |
| Redemption of Series B preferred units | (600) | | | — | |
| | | |
| | | |
| | | |
| | | |
| Distributions to noncontrolling interests | (19) | | | (19) | |
| Distributions to Series A preferred unitholders | (46) | | | (42) | |
| Distributions to Series B preferred unitholders | (21) | | | (21) | |
| Distributions to unitholders and general partner | (1,553) | | | (1,430) | |
| | | |
| Contributions from MPC | 13 | | | 17 | |
| | | |
| All other, net | (3) | | | (4) | |
| Net cash used in financing activities | (1,656) | | | (1,916) | |
| Net change in cash, cash equivalents and restricted cash | 517 | | | 285 | |
| Cash, cash equivalents and restricted cash at beginning of period | 238 | | | 13 | |
| Cash, cash equivalents and restricted cash at end of period | $ | 755 | | | $ | 298 | |
| | | |
| | | |
| | | |
| | | |
| | | |
| | | |
| | | |
| | | |
| | | |
| | | |
| | | |
| | | |
| | | |
| | | |
| | | |
| | | |
| | | |
| | | |
| | | |
| | | |
| | | |
| | | |
| | | |
| | | |
| | | |
| | | | | | | | | | | |
| Three Months Ended
March 31, |
| (In millions) | 2024 | | 2023 |
| Operating activities: | | | |
| Net income | $ | 1,015 | | | $ | 952 | |
| Adjustments to reconcile net income to net cash provided by operating activities: | | | |
| Amortization of deferred financing costs | 13 | | | 17 | |
| Depreciation and amortization | 317 | | | 296 | |
| | | |
| | | |
| | | |
| Gain on sales-type leases and equity method investments | (20) | | | — | |
| | | |
| Income from equity method investments | (157) | | | (134) | |
| Distributions from unconsolidated affiliates | 180 | | | 140 | |
| Change in fair value of derivatives | 8 | | | (5) | |
| Changes in: | | | |
| Receivables | 95 | | | 38 | |
| Inventories | (4) | | | (2) | |
| Accounts payable and accrued liabilities | (115) | | | (130) | |
| Assets/liabilities - related parties | (46) | | | 44 | |
| | | |
| Right of use assets/operating lease liabilities | (1) | | | (1) | |
| Deferred revenue | 9 | | | 3 | |
| All other, net | (3) | | | 9 | |
| Net cash provided by operating activities | 1,291 | | | 1,227 | |
| Investing activities: | | | |
| Additions to property, plant and equipment | (255) | | | (169) | |
| Acquisitions, net of cash acquired | (622) | | | — | |
| | | |
| | | |
| Investments in unconsolidated affiliates | (119) | | | (51) | |
| | | |
| | | |
| | | |
| Net cash used in investing activities | (996) | | | (220) | |
| Financing activities: | | | |
| Long-term debt borrowings | — | | | 1,589 | |
| Long-term debt repayments | — | | | (1,000) | |
| | | |
| | | |
| Debt issuance costs | — | | | (15) | |
| | | |
| Unit repurchases | (75) | | | — | |
| Redemption of Series B preferred units | — | | | (600) | |
| | | |
| | | |
| | | |
| | | |
| Distributions to noncontrolling interests | (11) | | | (10) | |
| Distributions to Series A preferred unitholders | (23) | | | (23) | |
| Distributions to Series B preferred unitholders | — | | | (21) | |
| Distributions to unitholders and general partner | (853) | | | (777) | |
| | | |
| Contributions from MPC | 10 | | | 8 | |
| | | |
| All other, net | (6) | | | (3) | |
| Net cash used in financing activities | (958) | | | (852) | |
| Net change in cash, cash equivalents and restricted cash | (663) | | | 155 | |
| Cash, cash equivalents and restricted cash at beginning of period | 1,048 | | | 238 | |
| Cash, cash equivalents and restricted cash at end of period | $ | 385 | | | $ | 393 | |
| | | |
| | | |
| | | |
The accompanying notes are an integral part of these consolidated financial statements.
MPLX LP
Consolidated Statements of Equity and Series A Preferred Units (Unaudited)
| | | | | | | | | | | | | | | | | | | | | | | | | | | | | | | | | | | | | | |
| | Partnership | | | | | | | | | |
| (In millions) | Common
Unit-holders
Public | | Common
Unit-holder
MPC | | Accumulated Other Comprehensive Loss | | Non-controlling
Interests | | Total | | | Series A Preferred Unit-holders |
| Balance at December 31, 2023 | $ | 8,700 | | | $ | 3,758 | | | $ | (4) | | | $ | 235 | | | $ | 12,689 | | | | $ | 895 | |
| Net income | 355 | | | 640 | | | — | | | 10 | | | 1,005 | | | | 10 | |
| Unit repurchases | (75) | | | — | | | — | | | — | | | (75) | | | | — | |
| Conversion of Series A preferred units | 321 | | | — | | | — | | | — | | | 321 | | | | (321) | |
| Distributions | (303) | | | (550) | | | — | | | (11) | | | (864) | | | | (23) | |
| Contributions | — | | | 10 | | | — | | | — | | | 10 | | | | — | |
| Other | (1) | | | — | | | 1 | | | — | | | — | | | | — | |
| Balance at March 31, 2024 | $ | 8,997 | | | $ | 3,858 | | | $ | (3) | | | $ | 234 | | | $ | 13,086 | | | | $ | 561 | |
| | | | | | | | | | | | |
| | | | | | | | | | | | |
| | | | | | | | | | | | |
| | | | | | | | | | | | |
| | | | | | | | | | | | |
| | | | | | | | | | | | |
| | | | | | | | | | | | |
| | | | | | | | | | | | |
| | | | | | | | | | | | |
| | | | | | | | | | | | |
| | | | | | | | | | | | |
| | | | | | | | | | | | |
| | | | | | | | | | | | |
| | | | | | | | | | | | |
| | | | | | | | | | | | | | | | | | | | | | | | | | | | | | | | | | | | | | | | | | | | | | |
| | Partnership | | | | | | | | | | | |
| (In millions) | Common
Unit-holders
Public | | Common
Unit-holder
MPC | | Series B Preferred Unit-holders | | Accumulated Other Comprehensive Loss | | Non-controlling
Interests | | | | Total | | | Series A Preferred Unit-holders |
| Balance at December 31, 2022 | $ | 8,413 | | | $ | 3,293 | | | $ | 611 | | | $ | (8) | | | $ | 237 | | | | | $ | 12,546 | | | | $ | 968 | |
| | | | | | | | | | | | | | | | |
| Net income | 323 | | | 592 | | | 5 | | | — | | | 9 | | | | | 929 | | | | 23 | |
| | | | | | | | | | | | | | | | |
| | | | | | | | | | | | | | | | |
| | | | | | | | | | | | | | | | |
| Redemption of Series B preferred units | (2) | | | (3) | | | (595) | | | — | | | — | | | | | (600) | | | | — | |
| Distributions | (275) | | | (502) | | | (21) | | | — | | | (10) | | | | | (808) | | | | (23) | |
| Contributions | — | | | 8 | | | — | | | — | | | — | | | | | 8 | | | | — | |
| | | | | | | | | | | | | | | | |
| Other | — | | | — | | | — | | | 4 | | | 1 | | | | | 5 | | | | — | |
| | | | | | | | | | | | | | | | |
| | | | | | | | | | | | | | | | |
| | | | | | | | | | | | | | | | |
| | | | | | | | | | | | | | | | |
| | | | | | | | | | | | | | | | |
| | | | | | | | | | | | | | | | |
| Balance at March 31, 2023 | $ | 8,459 | | | $ | 3,388 | | | $ | — | | | $ | (4) | | | $ | 237 | | | | | $ | 12,080 | | | | $ | 968 | |
| | | | | | | | | | | | | | | | |
| Net income | 322 | | | 588 | | | — | | | — | | | 9 | | | | | 919 | | | | 23 | |
| Unit repurchases | — | | | — | | | — | | | — | | | — | | | | | — | | | | — | |
| | | | | | | | | | | | | | | | |
| | | | | | | | | | | | | | | | |
| Distributions | (274) | | | (502) | | | — | | | — | | | (9) | | | | | (785) | | | | (23) | |
| Contributions | — | | | 5 | | | — | | | — | | | — | | | | | 5 | | | | — | |
| | | | | | | | | | | | | | | | |
| | | | | | | | | | | | | | | | |
| Other | 1 | | | 1 | | | — | | | — | | | — | | | | | 2 | | | | — | |
| | | | | | | | | | | | | | | | |
| | | | | | | | | | | | | | | | |
| | | | | | | | | | | | | | | | |
| | | | | | | | | | | | | | | | |
| | | | | | | | | | | | | | | | |
| | | | | | | | | | | | | | | | |
| | | | | | | | | | | | | | | | |
| Balance at June 30, 2023 | $ | 8,508 | | | $ | 3,480 | | | $ | — | | | $ | (4) | | | $ | 237 | | | | | $ | 12,221 | | | | $ | 968 | |
| | | | | | | | | | | | | | | | |
| | | | | | | | | | | | | | | | |
| | | | | | | | | | | | | | | | |
| | | | | | | | | | | | | | | | |
| | | | | | | | | | | | | | | | |
| | | | | | | | | | | | | | | | |
| | | | | | | | | | | | | | | | |
| | | | | | | | | | | | | | | | |
| | | | | | | | | | | | | | | | |
| | | | | | | | | | | | | | | | |
| | | | | | | | | | | | | | | | |
| | | | | | | | | | | | | | | | |
| | | | | | | | | | | | | | | | |
| | | | | | | | | | | | | | | | |
| | | | | | | | | | | | | | | | |
| | | | | | | | | | | | | | | | |
| | | | | | | | | | | | | | | | |
| | | | | | | | | | | | | | | | |
| | | | | | | | | | | | | | | | |
| | | | | | | | | | | | | | | | |
| Balance at December 31, 2021 | $ | 8,579 | | | $ | 2,638 | | | $ | 611 | | | $ | (17) | | | $ | 241 | | | | | $ | 12,052 | | | | $ | 965 | |
| | | | | | | | | | | | | | | | |
| Net income | 287 | | | 506 | | | 11 | | | — | | | 8 | | | | | 812 | | | | 21 | |
| Unit repurchases | (100) | | | — | | | — | | | — | | | — | | | | | (100) | | | | — | |
| | | | | | | | | | | | | | | | |
| | | | | | | | | | | | | | | | |
| Distributions | (260) | | | (456) | | | (21) | | | — | | | (9) | | | | | (746) | | | | (21) | |
| Contributions | — | | | 10 | | | — | | | — | | | — | | | | | 10 | | | | — | |
| | | | | | | | | | | | | | | | |
| Other | (1) | | | — | | | — | | | 9 | | | — | | | | | 8 | | | | — | |
| | | | | | | | | | | | | | | | |
| | | | | | | | | | | | | | | | |
| | | | | | | | | | | | | | | | |
| | | | | | | | | | | | | | | | |
| | | | | | | | | | | | | | | | |
| | | | | | | | | | | | | | | | |
| | | | | | | | | | | | | | | | |
| Balance at March 31, 2022 | $ | 8,505 | | | $ | 2,698 | | | $ | 601 | | | $ | (8) | | | $ | 240 | | | | | $ | 12,036 | | | | $ | 965 | |
| | | | | | | | | | | | | | | | |
| Net income | 304 | | | 540 | | | 10 | | | — | | | 9 | | | | | 863 | | | | 21 | |
| Unit repurchases | (35) | | | — | | | — | | | — | | | — | | | | | (35) | | | | — | |
| | | | | | | | | | | | | | | | |
| | | | | | | | | | | | | | | | |
| Distributions | (257) | | | (457) | | | — | | | — | | | (10) | | | | | (724) | | | | (21) | |
| Contributions | — | | | 2 | | | — | | | — | | | — | | | | | 2 | | | | — | |
| | | | | | | | | | | | | | | | |
| Other | 1 | | | 1 | | | — | | | — | | | — | | | | | 2 | | | | — | |
| | | | | | | | | | | | | | | | |
| | | | | | | | | | | | | | | | |
| | | | | | | | | | | | | | | | |
| | | | | | | | | | | | | | | | |
| | | | | | | | | | | | | | | | |
| | | | | | | | | | | | | | | | |
| | | | | | | | | | | | | | | | |
| Balance at June 30, 2022 | 8,518 | | | 2,784 | | | 611 | | | (8) | | | 239 | | | | | 12,144 | | | | 965 | |
| | | | | | | | | | | | | | | | |
| | | | | | | | | | | | | | | | |
| | | | | | | | | | | | | | | | |
| | | | | | | | | | | | | | | | |
| | | | | | | | | | | | | | | | |
| | | | | | | | | | | | | | | | |
| | | | | | | | | | | | | | | | |
| | | | | | | | | | | | | | | | |
| | | | | | | | | | | | | | | | |
| | | | | | | | | | | | | | | | |
| | | | | | | | | | | | | | | | |
| | | | | | | | | | | | | | | | |
| | | | | | | | | | | | | | | | |
| | | | | | | | | | | | | | | | |
| | | | | | | | | | | | | | | | |
| | | | | | | | | | | | | | | | |
| | | | | | | | | | | | | | | | |
| | | | | | | | | | | | | | | | |
| | | | | | | | | | | | | | | | | | | | | | | | | | | | | | | | | | | | | | | | | | | | |
| Partnership | | | | | | | | | |
| Common
Unit-holders
Public | | Common
Unit-holder
MPC | | Series B Preferred Unit-holders | | Accumulated Other Comprehensive Loss | | Non-controlling
Interests | | Total | | | Series A Preferred Unit-holders |
| Balance at December 31, 2022 | $ | 8,413 | | | $ | 3,293 | | | $ | 611 | | | $ | (8) | | | $ | 237 | | | $ | 12,546 | | | | $ | 968 | |
| Net income | 323 | | | 592 | | | 5 | | | — | | | 9 | | | 929 | | | | 23 | |
| | | | | | | | | | | | | | |
| Redemption of Series B preferred units | (2) | | | (3) | | | (595) | | | — | | | — | | | (600) | | | | — | |
| Distributions | (275) | | | (502) | | | (21) | | | — | | | (10) | | | (808) | | | | (23) | |
| Contributions | — | | | 8 | | | — | | | — | | | — | | | 8 | | | | — | |
| Other | — | | | — | | | — | | | 4 | | | 1 | | | 5 | | | | — | |
| Balance at March 31, 2023 | $ | 8,459 | | | $ | 3,388 | | | $ | — | | | $ | (4) | | | $ | 237 | | | $ | 12,080 | | | | $ | 968 | |
| | | | | | | | | | | | | | |
| | | | | | | | | | | | | | |
| | | | | | | | | | | | | | |
| | | | | | | | | | | | | | |
| | | | | | | | | | | | | | |
| | | | | | | | | | | | | | |
| | | | | | | | | | | | | | |
| | | | | | | | | | | | | | |
| | | | | | | | | | | | | | |
| | | | | | | | | | | | | | |
| | | | | | | | | | | | | | |
| | | | | | | | | | | | | | |
The accompanying notes are an integral part of these consolidated financial statements.
Notes to Consolidated Financial Statements (Unaudited)
1. Description of the Business and Basis of Presentation
Description of the Business
MPLX LP is a diversified, large-cap master limited partnership formed by Marathon Petroleum Corporation that owns and operates midstream energy infrastructure and logistics assets, and provides fuels distribution services. We are engaged in the gathering, transportation, storage and distribution of crude oil, refined products, other hydrocarbon-based products and renewables; the gathering, processing and transportation of natural gas; and the transportation, fractionation, storage and marketing of NGLs. MPLX’s principal executive office is located in Findlay, Ohio. MPLX was formed on March 27, 2012 as a Delaware limited partnership and completed its initial public offering on October 31, 2012.
MPLX’s business consists of two segments based on the nature of services it offers: Logistics and Storage (“L&S”), which relates primarily to crude oil, refined products, other hydrocarbon-based products and renewables; and Gathering and Processing (“G&P”), which relates primarily to natural gas and NGLs. See Note 78 for additional information regarding the operations and results of these segments.
Basis of Presentation
These interim consolidated financial statements are unaudited; however, in the opinion of MPLX’s management, these statements reflect all adjustments necessary for a fair statement of the results for the periods reported. All such adjustments are of a normal, recurring nature unless otherwise disclosed. These interim consolidated financial statements, including the notes, have been prepared in accordance with the rules and regulations of the SEC applicable to interim period financial statements and do not include all of the information and disclosures required by GAAP for complete financial statements. Certain information derived from our audited annual financial statements, prepared in accordance with GAAP, has been condensed or omitted from these interim financial statements.
These interim consolidated financial statements should be read in conjunction with the audited consolidated financial statements and notes thereto included in our Annual Report on Form 10-K for the year ended December 31, 2022.2023. The results of operations for the three and six months ended June 30, 2023March 31, 2024 are not necessarily indicative of the results to be expected for the full year.
MPLX’s consolidated financial statements include all majority-owned and controlled subsidiaries. For non-wholly owned consolidated subsidiaries, the interests owned by third parties have been recorded as Noncontrolling interests on the accompanying Consolidated Balance Sheets. Intercompany accounts and transactions have been eliminated. MPLX’s investments in which MPLX exercises significant influence but does not control and does not have a controlling financial interest are accounted for using the equity method. MPLX’s investments in VIEs in which MPLX exercises significant influence but does not control and is not the primary beneficiary are also accounted for using the equity method.
2. Accounting Standards and Disclosure Rules
Recently Adopted
Not Yet Adopted
ASU 2023-01,Leases (Topic 842): Common Control Arrangements. The adoption of this ASU did not have a material impact on our financial statements or disclosures.
Not Yet Adopted
SEC Release No. 33-11275, The Enhancement and Standardization of Climate-Related Disclosures for Investors
In March 2024, the SEC adopted rules under SEC Release No. 33-11275, The Enhancement and Standardization of Climate-Related Disclosures for Investors, which requires registrants to provide certain climate-related information in their annual reports. As part of the disclosures, material impacts from severe weather events and other natural conditions will be required in the audited financial statements. In April 2024, the SEC voluntarily stayed the rules pending judicial review. Pending the results of the judicial review, the disclosure requirements are effective for the Partnership’s Annual Report on Form 10-K for the fiscal year ended December 31, 2025. We are evaluating the impact these rules will have on our disclosures and monitoring the status of the judicial review.
ASU 2023-07, Segment Reporting (Topic 280): Improvements to Reportable Segment Disclosures
In November 2023, the FASB issued an ASU to amend certain provisions of ASC 842 that apply to arrangements between related parties under common control. The ASU amends the accounting for the amortization period of leasehold improvements in common-control leases for all entities and requires certainupdate reportable segment disclosure requirements primarily by requiring enhanced disclosures when the lease term is shorter than the useful life of the asset.about significant segment expenses. This ASU is effective for fiscal years beginning after December 15, 2023, includingand for interim periods within those fiscal years.years beginning after December 15, 2024. Early adoption is permitted. The amendments should be applied retrospectively to all prior periods presented in the financial statements. We do not expectare currently evaluating the application ofimpact this ASU towill have a material impact on our consolidated financial statements or financial disclosures.
3. Acquisition
Utica Midstream Acquisition
On March 22, 2024, MPLX used $625 million of cash on hand to purchase additional ownership interest in existing joint ventures and gathering assets (“Utica Midstream Acquisition”), which will enhance our position in the Utica basin. Prior to the acquisition, we owned an indirect interest in Ohio Gathering Company L.L.C. (“OGC”) and a direct interest in Ohio Condensate Company L.L.C. (“OCC”) and now own a combined 73 percent interest in OGC, a 100 percent interest in OCC, and a 100 percent interest in a dry gas gathering system in the Utica basin, including 53 miles of gathering pipeline and three dehydration units with a combined capacity of approximately 620 MMcf/d. OGC continues to be accounted for as an equity method investment, as MPLX did not obtain control of OGC as a result of the transaction. The acquisition date fair value of our investment in OGC exceeded our portion of the underlying net assets of the joint venture by approximately $86 million. OCC was previously accounted for as an equity method investment, and it is now reflected as a consolidated subsidiary within our consolidated financial results. The results for the acquired business are reported within our G&P segment.
The acquisition was accounted for as a business combination requiring all the acquired assets and liabilities to be remeasured to fair value resulting in a consolidated fair value of net assets and liabilities of $625 million. The preliminary determination of the fair value includes $518 million related to acquired interests in the joint ventures and the remaining balance related to other acquired assets and liabilities. The revaluation of MPLX’s existing 62 percent equity method investment in OCC resulted in a $20 million gain, which is included in Other income within the accompanying consolidated statements of income. The fair value of equity method investments was based on a discounted cash flow model.
4. Investments and Noncontrolling Interests
The following table presents MPLX’s equity method investments at the dates indicated:
| | Ownership as of | | Carrying value at |
| June 30, | | June 30, | | December 31, |
| | | Ownership as of | | | | | Ownership as of | | Carrying value at |
| | | March 31, | | | | | March 31, | | March 31, | | December 31, |
| (In millions, except ownership percentages) | (In millions, except ownership percentages) | VIE | | 2023 | | 2023 | | 2022 | (In millions, except ownership percentages) | VIE | | 2024 | | 2023 |
| L&S | L&S | | | | | | | |
| Andeavor Logistics Rio Pipeline LLC | |
| Andeavor Logistics Rio Pipeline LLC | |
| Andeavor Logistics Rio Pipeline LLC | Andeavor Logistics Rio Pipeline LLC | X | | 67% | | $ | 176 | | | $ | 177 | |
| Illinois Extension Pipeline Company, L.L.C. | Illinois Extension Pipeline Company, L.L.C. | | 35% | | 241 | | | 236 | |
| LOOP LLC | LOOP LLC | | 41% | | 296 | | | 287 | |
MarEn Bakken Company LLC(1) | MarEn Bakken Company LLC(1) | | 25% | | 460 | | | 475 | |
| Minnesota Pipe Line Company, LLC | Minnesota Pipe Line Company, LLC | | 17% | | 176 | | | 178 | |
| Whistler Pipeline LLC | Whistler Pipeline LLC | | 38% | | 213 | | | 211 | |
Other(2) | Other(2) | X | | 289 | | | 269 | |
| Total L&S | Total L&S | | 1,851 | | | 1,833 | |
| G&P | G&P | |
| Centrahoma Processing LLC | Centrahoma Processing LLC | | 40% | | 123 | | | 131 | |
| Centrahoma Processing LLC | |
| Centrahoma Processing LLC | |
| MarkWest EMG Jefferson Dry Gas Gathering Company, L.L.C | MarkWest EMG Jefferson Dry Gas Gathering Company, L.L.C | X | | 67% | | 344 | | | 335 | |
| MarkWest Torñado GP, L.L.C. | X | | 60% | | 310 | | | 306 | |
| MarkWest Utica EMG, L.L.C. | MarkWest Utica EMG, L.L.C. | X | | 58% | | 693 | | | 669 | |
Ohio Gathering Company L.L.C.(3) | |
| Rendezvous Gas Services, L.L.C. | Rendezvous Gas Services, L.L.C. | X | | 78% | | 133 | | | 137 | |
| Sherwood Midstream Holdings LLC | Sherwood Midstream Holdings LLC | X | | 51% | | 119 | | | 125 | |
| Sherwood Midstream LLC | Sherwood Midstream LLC | X | | 50% | | 507 | | | 512 | |
Other(2) | X | | 44 | | | 47 | |
| Other | |
| Total G&P | Total G&P | | 2,273 | | | 2,262 | |
| Total | Total | | $ | 4,124 | | | $ | 4,095 | |
(1) The investment in MarEn Bakken Company LLC includes our 9.19 percent indirect interest in a joint venture (“Dakota Access”) that owns and operates the Dakota Access Pipeline and Energy Transfer Crude Oil Pipeline projects, collectively referred to as the Bakken Pipeline system or DAPL.system.
(2) Some investments included within Other have also been deemed to be VIEs.
For those entities that have been deemed to be VIEs, neither MPLX nor any of its subsidiaries have been deemed to be the primary beneficiary due to voting rights on significant matters. While we have the ability to exercise influence through participation in the management committees which make all significant decisions, we have equal influence over each committee as a joint interest partner and all significant decisions require the consent of the other investors without regard to economic interest. As such, we have determined that these entities should not be consolidated and applied the equity method of accounting with respect to our investments in each entity.
MPLX’s maximum exposure to loss as a result of its involvement with equity method investments includes its equity investment, any additional capital contribution commitments and any operating expenses incurred by the subsidiary operator in excess of its compensation received for the performance of the operating services. MPLX did not provide any financial support to equity method investments that it was not contractually obligated to provide during the sixthree months ended June 30,March 31, 2024 and March 31, 2023. See Note 1416 for information on our Guarantees related to indebtedness of equity method investees.
4.5. Related Party Agreements and Transactions
MPLX engages in transactions with both MPC and certain of its equity method investments as part of its normal business; however, transactions with MPC make up the majority of MPLX’s related party transactions. Transactions with related parties are further described below.
MPLX has various long-term, fee-based commercial agreements with MPC. Under these agreements, MPLX provides transportation, gathering, terminal, fuels distribution, marketing, storage, management, operational and other services to MPC. MPC has committed to provide MPLX with minimum quarterly throughput volumes on crude oil and refined products and other fees for storage capacity; operating and management fees; as well asand reimbursements for certain direct and indirect costs. MPC has also committed to provide a fixed fee for 100 percent of available capacity for boats, barges and third-party chartered equipment under the marine transportation service agreement.agreements. MPLX also has a keep-whole commodity agreement with MPC under which MPC pays us a processing fee for NGLs related to keep-whole agreements and delivers shrink gas to the producers on our behalf. Wewe pay MPC a marketing fee in exchange for assuming the commodity risk. Additionally,In addition, MPLX has obligations to
MPC for services provided to MPLX by MPC under omnibus and employee services-typeservices type agreements as well as various other agreements.
During the second quarter of 2023, several terminal and storage services agreements with MPC were amended for certain items, including exercise of a five-year renewal option, with terms now extending to 2028.
Related Party Loan
MPLX is party to a loan agreement (the “MPC Loan Agreement”) with MPC. Under the terms of the MPC Loan Agreement, MPC extends loans to MPLX on a revolving basis as requested by MPLX and as agreed to by MPC. The borrowing capacity of the MPC Loan Agreement is $1.5 billion aggregate principal amount of all loans outstanding at any one time. The MPC Loan Agreement is scheduled to expire, and borrowings under the loan agreement are scheduled to mature and become due and payable, on July 31, 2024, provided that MPC may demand payment of all or any portion of the outstanding principal amount of the loan, together with all accrued and unpaid interest and other amounts (if any), at any time prior to maturity. Borrowings under the MPC Loan Agreement bear interest at one-month term SOFR adjusted upward by 0.10 percent plus 1.25 percent or such lower rate as would be applicable to such loans under the MPLX Credit Agreement as discussed in Note 11.
There was no activity on the MPC Loan Agreement for the sixthree months ended June 30, 2023.
Related Party Revenue
Related party sales to MPC primarily consist of crude oil and refined products pipeline and trucking transportation services based on tariff or contracted rates; storage, terminal and fuels distribution services based on contracted rates; and marine transportation services. Related party sales to MPC also consist of revenue related to volume deficiency credits.
MPLX also has operating agreements with MPC under which it receives a fee for operating MPC’s retained pipeline assets and a fixed annual fee for providing oversight and management services required to run the marine business. MPLX also receives management fee revenue for engineering, construction and administrative services for operating certain of its equity method investments. Amounts earned under these agreements are classified as Other income - related parties in the Consolidated Statements of Income.
Certain product sales to MPC and other related parties net to zero within the consolidated financial statements as the transactions are recorded net due to the terms of the agreements under which such product was sold. For the three and six months ended June 30,March 31, 2024 and March 31, 2023, these sales totaled $150$202 million and $348$198 million, respectively. For the three and six months ended June 30, 2022, these sales totaled $281 million and $574 million, respectively.
Related Party Expenses
MPC charges MPLX for executive management services and certain general and administrative services provided to MPLX under the terms of our omnibus agreements (“Omnibus charges”) and for certain employee services provided to MPLX under employee services agreements (“ESA charges”). Omnibus charges and ESA charges are classified as Rental cost of sales - related parties, Purchases - related parties, or General and administrative expenses depending on the nature of the asset or activity with which the costs are associated. In addition to these agreements, MPLX purchases products from MPC, makes payments to MPC in its capacity as general contractor to MPLX, and has certain rent and lease agreements with MPC.
For the three and six months ended June 30,March 31, 2024 and March 31, 2023, General and administrative expenses incurred from MPC totaled $61$73 million and $125$64 million, respectively. For the three and six months ended June 30, 2022, General and administrative expenses incurred from MPC totaled $58 million and $113 million, respectively.
Some charges incurred under the omnibus, and employee service and co-location agreements are related to engineering and construction services and are associated with assets under construction. These charges are added to Property, plant and equipment, net on the Consolidated Balance Sheets. For the three and six months ended June 30,March 31, 2024 and March 31, 2023, these charges totaled $18$41 million and $28 million, respectively. For the three and six months ended June 30, 2022, these charges totaled $19 million and $38$10 million, respectively.
Related Party Assets and Liabilities
Assets and liabilities with related parties appearing in the Consolidated Balance Sheets are detailed in the table below. This table identifies the various components of related party assets and liabilities, including those associated with leases and deferred revenue on minimum volume commitments. If MPC fails to meet its minimum committed volumes, MPC will pay MPLX a deficiency payment based on the terms of the agreement. The deficiency amounts received under these agreements (excluding payments received under agreements classified as sales-type leases) are recorded as Current liabilities - related parties. In many cases, MPC may then apply the amount of any such deficiency payments as a credit for volumes in excess of its minimum volume commitment in future periods under the terms of the applicable agreements. MPLX recognizes related party revenues for the deficiency payments when credits are used for volumes in excess of minimum quarterly volume commitments, where it is probable the customer will not use the credit in future periods or upon the expiration of the credits. The use or expiration of the
credits is a decrease in Current liabilities - related parties. Deficiency payments under agreements that have been classified as sales-type leases are recorded as a reduction against the corresponding lease receivable. In addition, capital projects MPLX undertakes at the request of MPC are reimbursed in cash and recognized as revenue over the remaining term of the applicable agreements or in some cases, as a contribution from MPC.
| | (In millions) | (In millions) | June 30,
2023 | | December 31,
2022 | (In millions) | March 31,
2024 | | December 31,
2023 |
| Current assets - related parties | Current assets - related parties | | | |
| Receivables | |
| Receivables | |
| Receivables | Receivables | $ | 510 | | | $ | 610 | |
| Lease receivables | Lease receivables | 129 | | | 111 | |
| Prepaid | Prepaid | 10 | | | 5 | |
| Other | Other | 5 | | | 3 | |
| Total | Total | 654 | | | 729 | |
| Noncurrent assets - related parties | Noncurrent assets - related parties | | | |
| Long-term lease receivables | Long-term lease receivables | 844 | | | 883 | |
| Long-term lease receivables | |
| Long-term lease receivables | |
| Right of use assets | Right of use assets | 228 | | | 228 | |
| Unguaranteed residual asset | Unguaranteed residual asset | 105 | | | 87 | |
| Long-term receivables | Long-term receivables | 22 | | | 27 | |
| Total | Total | 1,199 | | | 1,225 | |
| Current liabilities - related parties | Current liabilities - related parties | | | |
MPC loan agreement and other payables(1) | MPC loan agreement and other payables(1) | 254 | | | 262 | |
MPC loan agreement and other payables(1) | |
MPC loan agreement and other payables(1) | |
| Deferred revenue | Deferred revenue | 81 | | | 80 | |
| Operating lease liabilities | Operating lease liabilities | 1 | | | 1 | |
| Total | Total | 336 | | | 343 | |
| Long-term liabilities - related parties | Long-term liabilities - related parties | | | |
| Long-term operating lease liabilities | Long-term operating lease liabilities | 226 | | | 228 | |
| Long-term operating lease liabilities | |
| Long-term operating lease liabilities | |
| Long-term deferred revenue | Long-term deferred revenue | 115 | | | 110 | |
| Total | Total | $ | 341 | | | $ | 338 | |
(1) There were no borrowings outstanding on the MPC Loan Agreement as of June 30, 2023March 31, 2024 or December 31, 2022.
Other Related Party Transactions
From time to time, MPLX may also sell to or purchase from related parties, assets and inventory at the lesser of average unit cost or net realizable value.2023.
5.6. Equity
The changes in the number of common units during the sixthree months ended June 30, 2023March 31, 2024 are summarized below:
| | | | | | | | | | | |
| (In units) | Common Units | | | | | | |
Balance at December 31, 20222023 | 1,001,020,6161,003,498,875 | | | | | | | |
| Unit-based compensation awards | 148,267135,285 | | | | | | | |
| Conversion of Series A preferred units | 10,024,831 | | | | | | |
| Units redeemed in unit repurchase program | (1,872,917) | | | | | | |
Balance at June 30, 2023March 31, 2024 | 1,001,168,8831,011,786,074 | | | | | | | |
Unit Repurchase Program
On August 2, 2022, we announced the board authorization for the repurchase of up to an additional $1 billion of MPLX common units held by the public. This unit repurchase authorization has no expiration date. We may utilize various methods to effect the repurchases, which could include open market repurchases, negotiated block transactions, accelerated unit repurchases, tender offers or open market solicitations for units, some of which may be effected through Rule 10b5-1 plans. The timing and amount of future
repurchases, if any, will depend upon several factors, including market and business conditions, and such repurchases may be suspended, discontinued or restarted at any time.
No | | | | | | | | | | | | | | | |
| Three Months Ended
March 31, | | |
| (In millions, except per unit data) | 2024 | | 2023 | | | | |
| Number of common units repurchased | 2 | | | — | | | | | |
Cash paid for common units repurchased(1) | $ | 75 | | | $ | — | | | | | |
Average cost per unit(1) | $ | 40.04 | | | $ | — | | | | | |
(1) Cash paid for common units were repurchased and average cost per unit includes commissions paid to brokers during the three or six months ended June 30, 2023. period.
As of June 30, 2023,March 31, 2024, we had $846$771 million remaining under the unit repurchase authorization.
March 31, 2024. Series A preferred unitholders exercised their rights to convert an additional 5 million Series A preferred units into common units subsequent to March 31, 2024, but prior to the date the financial statements were filed. Redemption of the Series B Preferred Units
On February 15, 2023, MPLX exercised its right to redeem all 600,000 outstanding units of 6.875 percent Fixed-to-Floating Rate Cumulative Redeemable Perpetual Preferred Units (the “Series B preferred units”). MPLX paid unitholders the Series B preferred unit redemption price of $1,000 per unit.
Distributions on the Series B preferred units were payable semi-annually in arrears on the 15th day, or the first business day thereafter, of February and August of each year up to and including February 15, 2023. In accordance with these terms, MPLX made a final cash distribution of $21 million to Series B preferred unitholders on February 15, 2023, in conjunction with the redemption.
The changes in the Series B preferred unit balance during the six months ended June 30, 2023 and June 30, 2022 are included in the Consolidated Statements of Equity within Series B preferred units.
Distributions
On July 25, 2023,April 23, 2024, MPLX declared a cash distribution for the secondfirst quarter of 2023,2024, totaling $776$864 million, or $0.775$0.850 per common unit. This distribution will be paid on August 14, 2023May 13, 2024 to common unitholders of record on August 4, 2023.May 3, 2024. This rate will also be received by Series A preferred unitholders.
Quarterly distributions for 20232024 and 20222023 are summarized below:
| | | | | | | | | | | |
| (Per common unit) | 2023 | | 2022 |
| March 31, | $ | 0.775 | | | $ | 0.705 | |
| June 30, | 0.775 | | | 0.705 | |
| | | |
| | | |
| | | | | | | | | | | |
| (Per common unit) | 2024 | | 2023 |
| March 31, | $ | 0.850 | | | $ | 0.775 | |
| | | |
| | | |
The allocation of total quarterly cash distributions to limitedcommon and preferred unitholders is as follows for the three and six months ended June 30, 2023March 31, 2024 and June 30, 2022.March 31, 2023. Distributions, although earned, are not accrued until declared. MPLX’s distributions are declared subsequent to quarter end; therefore, the following table represents total cash distributions applicable to the period in which the distributions were earned. | | | | | | | | | | | | | | | | | | | | | | | |
| Three Months Ended
June 30, | | Six Months Ended
June 30, |
| (In millions) | 2023 | | 2022 | | 2023 | | 2022 |
| Common and preferred unit distributions: | | | | | | | |
| Common unitholders, includes common units of general partner | $ | 776 | | | $ | 714 | | | $ | 1,552 | | | $ | 1,427 | |
| | | | | | | |
| Series A preferred unit distributions | 23 | | | 21 | | | 46 | | | 42 | |
Series B preferred unit distributions(1) | — | | | 10 | | | 5 | | | 21 | |
| Total cash distributions declared | $ | 799 | | | $ | 745 | | | $ | 1,603 | | | $ | 1,490 | |
| | | | | | | | | | | | | | | |
| Three Months Ended
March 31, | | |
| (In millions) | 2024 | | 2023 | | | | |
| Common and preferred unit distributions: | | | | | | | |
| Common unitholders, includes common units of general partner | $ | 864 | | | $ | 776 | | | | | |
| Series A preferred unit distributions | 10 | | | 23 | | | | | |
Series B preferred unit distributions(1) | — | | | 5 | | | | | |
| Total cash distributions declared | $ | 874 | | | $ | 804 | | | | | |
(1) The sixthree months ended June 30,March 31, 2023 includes the portion of the $21 million distribution paid to the Series B preferred unitholders on February 15, 2023 that was earned during the period prior to redemption.
6.7. Net Income Per Limited Partner Unit
Net income per unit applicable to common units is computed by dividing net income attributable to MPLX LP less income allocated to participating securities by the weighted average number of common units outstanding.
During the three and six months ended June 30,March 31, 2024 and March 31, 2023, and June 30, 2022, MPLX had participating securities consisting of common units, certain equity-based compensation awards, Series A preferred units, and Series B preferred units and also had dilutive potential common units consisting of certain equity-based compensation awards. Potential common units omitted from the diluted earnings per unit calculation for the three and six months ended June 30, 2023March 31, 2024 and June 30, 2022March 31, 2023 were less than 1 million.
| | | | | | | | | | | | | | | | | | | | | | | |
| Three Months Ended
June 30, | | Six Months Ended
June 30, |
| (In millions) | 2023 | | 2022 | | 2023 | | 2022 |
| Net income attributable to MPLX LP | $ | 933 | | | $ | 875 | | | $ | 1,876 | | | $ | 1,700 | |
| Less: Distributions declared on Series A preferred units | 23 | | | 21 | | | 46 | | | 42 | |
| | | | | | | |
| Distributions declared on Series B preferred units | — | | | 10 | | | 5 | | | 21 | |
| Limited partners’ distributions declared on MPLX common units (including common units of general partner) | 776 | | | 714 | | | 1,552 | | | 1,427 | |
| | | | | | | |
| Undistributed net gain attributable to MPLX LP | $ | 134 | | | $ | 130 | | | $ | 273 | | | $ | 210 | |
| | Three Months Ended June 30, 2023 |
| Three Months Ended
March 31, | |
| Three Months Ended
March 31, | |
| Three Months Ended
March 31, | |
| (In millions, except per unit data) | (In millions, except per unit data) | Limited Partners’
Common Units | | | Series A Preferred Units | | | Total |
| Basic and diluted net income attributable to MPLX LP per unit | | | | | | | |
| Net income attributable to MPLX LP: | | | | | |
| Distributions declared | $ | 776 | | | | $ | 23 | | | | $ | 799 | |
| Undistributed net gain attributable to MPLX LP | 130 | | | | 4 | | | | 134 | |
Net income attributable to MPLX LP(1) | 906 | | | | $ | 27 | | | | 933 | |
| | (In millions, except per unit data) | |
| (In millions, except per unit data) | |
Net income attributable to MPLX LP(1): | |
Net income attributable to MPLX LP(1): | |
Net income attributable to MPLX LP(1): | |
| Less: Distributions declared on Series A preferred units | |
| Less: Distributions declared on Series A preferred units | |
| Less: Distributions declared on Series A preferred units | |
| Distributions declared on Series B preferred units | |
| Distributions declared on Series B preferred units | |
| Distributions declared on Series B preferred units | |
| Undistributed earnings allocated to participating securities | |
| Undistributed earnings allocated to participating securities | |
| Undistributed earnings allocated to participating securities | |
| Impact of redemption of Series B preferred units | |
| Impact of redemption of Series B preferred units | |
| Impact of redemption of Series B preferred units | |
| Net Income available to common unitholders | |
| Net Income available to common unitholders | |
| Net Income available to common unitholders | |
| Weighted average units outstanding: | |
| Weighted average units outstanding: | |
| Weighted average units outstanding: | Weighted average units outstanding: | | | | | |
| Basic | Basic | 1,001 | | | | | | |
| Basic | |
| Basic | |
| Diluted | |
| Diluted | |
| Diluted | Diluted | 1,001 | | | | | | |
| Net income attributable to MPLX LP per limited partner unit: | Net income attributable to MPLX LP per limited partner unit: | | | | | |
| Net income attributable to MPLX LP per limited partner unit: | |
| Net income attributable to MPLX LP per limited partner unit: | |
| Basic | |
| Basic | |
| Basic | Basic | $ | 0.91 | | | | | | |
| Diluted | Diluted | $ | 0.91 | | | | | | |
| Diluted | |
| Diluted | |
(1) Allocation of net income attributable to MPLX LP assumes all earnings for the period hadhave been distributed based on the distribution priorities applicable to the period.
| | | | | | | | | | | | | | | | | | | | | | | | | |
| Three Months Ended June 30, 2022 |
| (In millions, except per unit data) | Limited Partners’
Common Units | | | | Series A Preferred Units | | Series B Preferred Units | | Total |
| Basic and diluted net income attributable to MPLX LP per unit | | | | | | | | | |
| Net income attributable to MPLX LP: | | | | | | | | | |
| Distributions declared | $ | 714 | | | | | $ | 21 | | | $ | 10 | | | $ | 745 | |
| Undistributed net gain attributable to MPLX LP | 126 | | | | | 4 | | | — | | | 130 | |
Net income attributable to MPLX LP(1) | $ | 840 | | | | | $ | 25 | | | $ | 10 | | | $ | 875 | |
| Weighted average units outstanding: | | | | | | | | | |
| Basic | 1,012 | | | | | | | | | |
| Diluted | 1,012 | | | | | | | | | |
| Net income attributable to MPLX LP per limited partner unit: | | | | | | | | | |
| Basic | $ | 0.83 | | | | | | | | | |
| Diluted | $ | 0.83 | | | | | | | | | |
(1) Allocation of net income attributable to MPLX LP assumes all earnings for the period had been distributed based on the distribution priorities applicable to the period.
| | | | | | | | | | | | | | | | | | | | | | | | | |
| Six Months Ended June 30, 2023 |
| (In millions, except per unit data) | Limited Partners’
Common Units | | | | Series A Preferred Units | | Series B Preferred Units | | Total |
| Basic and diluted net income attributable to MPLX LP per unit | | | | | | | | | |
| Net income attributable to MPLX LP: | | | | | | | | | |
| Distributions declared | $ | 1,552 | | | | | $ | 46 | | | $ | 5 | | | $ | 1,603 | |
| Undistributed net gain attributable to MPLX LP | 265 | | | | | 8 | | | — | | | 273 | |
Net income attributable to MPLX LP(1) | 1,817 | | | | | $ | 54 | | | $ | 5 | | | 1,876 | |
| Impact of redemption of Series B preferred units | (5) | | | | | | | | | (5) | |
| Income available to common unitholders | $ | 1,812 | | | | | | | | | $ | 1,871 | |
| Weighted average units outstanding: | | | | | | | | | |
| Basic | 1,001 | | | | | | | | | |
| Diluted | 1,001 | | | | | | | | | |
| Net income attributable to MPLX LP per limited partner unit: | | | | | | | | | |
| Basic | 1.81 | | | | | | | | | |
| Diluted | 1.81 | | | | | | | | | |
(1) Allocation of net income attributable to MPLX LP assumes all earnings for the period had been distributed based on the distribution priorities applicable to the period.
| | | | | | | | | | | | | | | | | | | | | | | | | |
| Six Months Ended June 30, 2022 |
| (In millions, except per unit data) | Limited Partners’
Common Units | | | | Series A Preferred Units | | Series B Preferred Units | | Total |
| Basic and diluted net income attributable to MPLX LP per unit | | | | | | | | | |
| Net income attributable to MPLX LP: | | | | | | | | | |
| Distributions declared | $ | 1,427 | | | | | $ | 42 | | | $ | 21 | | | $ | 1,490 | |
| Undistributed net gain attributable to MPLX LP | 204 | | | | | 6 | | | — | | | 210 | |
Net income attributable to MPLX LP(1) | $ | 1,631 | | | | | $ | 48 | | | $ | 21 | | | $ | 1,700 | |
| Weighted average units outstanding: | | | | | | | | | |
| Basic | 1,013 | | | | | | | | | |
| Diluted | 1,014 | | | | | | | | | |
| Net income attributable to MPLX LP per limited partner unit: | | | | | | | | | |
| Basic | $ | 1.61 | | | | | | | | | |
| Diluted | $ | 1.61 | | | | | | | | | |
(1) Allocation of net income attributable to MPLX LP assumes all earnings for the period had been distributed based on the distribution priorities applicable to the period.
7.8. Segment Information
MPLX’s chief operating decision maker (“CODM”) is the chief executive officer of its general partner. The CODM reviews MPLX’s discrete financial information, makes operating decisions, assesses financial performance and allocates resources on a type of service basis. MPLX has two reportable segments: L&S and G&P. Each of these segments is organized and managed based upon the nature of the products and services it offers.
•L&S – gathers, transports, stores and distributes crude oil, refined products, other hydrocarbon-based products and renewables. Also includes the operation of refining logistics, fuels distribution and inland marine businesses, terminals, rail facilities, and storage caverns.
•G&P – gathers, processes and transports natural gas; and transports, fractionates, stores and markets NGLs.
Our CODM evaluates the performance of our segments using Segment Adjusted EBITDA. Amounts included in net income and excluded from Segment Adjusted EBITDA include: (i) depreciation and amortization; (ii) net interest and other financial costs; (iii) income/(loss) from equity method investments; (iv) distributions and adjustments related to equity method investments; (v) gain on sales-type leases; (vi) impairment expense; (vii)(vi) noncontrolling interests; and (viii)(vii) other adjustments, as applicable. These items are either: (i) believed to be non-recurring in nature; (ii) not believed to be allocable or controlled by the segment; or (iii) are
not tied to the operational performance of the segment. Assets by segment are not a measure used to assess the performance of the Partnership by our CODM and thus are not reported in our disclosures.
The tables below present information about revenues and other income, Segment Adjusted EBITDA, capital expenditures and investments in unconsolidated affiliates for our reportable segments:
| | Three Months Ended
June 30, | | Six Months Ended
June 30, |
| Three Months Ended
March 31, | |
| Three Months Ended
March 31, | |
| Three Months Ended
March 31, | |
| (In millions) | |
| (In millions) | |
| (In millions) | (In millions) | 2023 | | 2022 | | 2023 | | 2022 |
| L&S | L&S | | | | | | | |
| L&S | |
| L&S | |
| Service revenue | |
| Service revenue | |
| Service revenue | Service revenue | $ | 1,060 | | | $ | 1,010 | | | $ | 2,093 | | | $ | 1,993 | |
| Rental income | Rental income | 210 | | | 208 | | | 422 | | | 383 | |
| Rental income | |
| Rental income | |
| Product related revenue | |
| Product related revenue | |
| Product related revenue | Product related revenue | 3 | | | 7 | | | 8 | | | 11 | |
| Sales-type lease revenue | Sales-type lease revenue | 125 | | | 114 | | | 250 | | | 225 | |
| Sales-type lease revenue | |
| Sales-type lease revenue | |
| Income from equity method investments | |
| Income from equity method investments | |
| Income from equity method investments | Income from equity method investments | 82 | | | 59 | | | 153 | | | 111 | |
| Other income | Other income | 18 | | | 22 | | | 32 | | | 34 | |
| Other income | |
| Other income | |
Total segment revenues and other income(1) | |
Total segment revenues and other income(1) | |
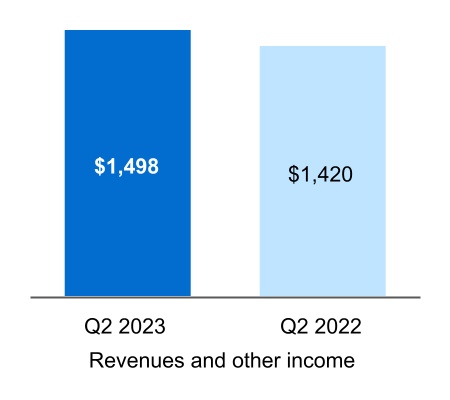
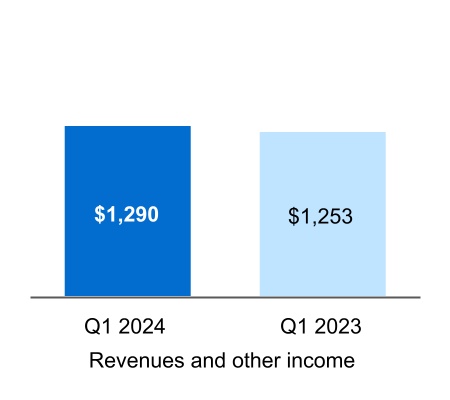
Total segment revenues and other income(1) | Total segment revenues and other income(1) | 1,498 | | | 1,420 | | | 2,958 | | | 2,757 | |
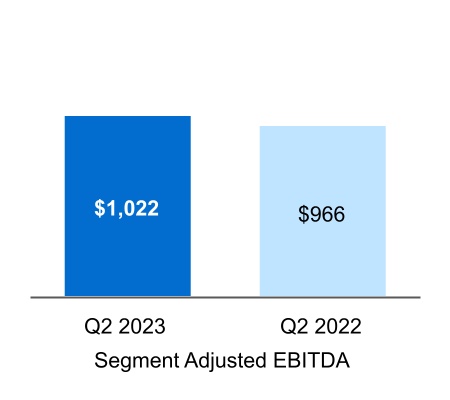
Segment Adjusted EBITDA(2) | Segment Adjusted EBITDA(2) | 1,022 | | | 966 | | | 2,048 | | | 1,870 | |
Segment Adjusted EBITDA(2) | |
Segment Adjusted EBITDA(2) | |
| Capital expenditures | |
| Capital expenditures | |
| Capital expenditures | |
Investments in unconsolidated affiliates(3) | |
Investments in unconsolidated affiliates(3) | |
Investments in unconsolidated affiliates(3) | |
| G&P | |
| G&P | |
| G&P | |
| Service revenue | |
| Service revenue | |
| Service revenue | |
| Rental income | |
| Rental income | |
| Rental income | |
| Product related revenue | |
| Product related revenue | |
| Product related revenue | |
| Sales-type lease revenue | |
| Sales-type lease revenue | |
| Sales-type lease revenue | |
| Income from equity method investments | |
| Income from equity method investments | |
| Income from equity method investments | |
| Other income | |
| Other income | |
| Other income | |
Total segment revenues and other income(1) | |
Total segment revenues and other income(1) | |
Total segment revenues and other income(1) | |
Segment Adjusted EBITDA(2) | |
Segment Adjusted EBITDA(2) | |
Segment Adjusted EBITDA(2) | |
| Capital expenditures | |
| Capital expenditures | |
| Capital expenditures | Capital expenditures | 110 | | | 81 | | | 178 | | | 158 | |
| Investments in unconsolidated affiliates | Investments in unconsolidated affiliates | 1 | | | 10 | | | 16 | | | 78 | |
| G&P | |
| Service revenue | 546 | | | 505 | | | 1,071 | | | 991 | |
| Rental income | 52 | | | 92 | | | 103 | | | 173 | |
| Product related revenue | 467 | | | 860 | | | 1,031 | | | 1,521 | |
| Sales-type lease revenue | 33 | | | — | | | 67 | | | — | |
| Income from equity method investments | 63 | | | 52 | | | 126 | | | 99 | |
| Other income | 31 | | | 11 | | | 47 | | | 9 | |
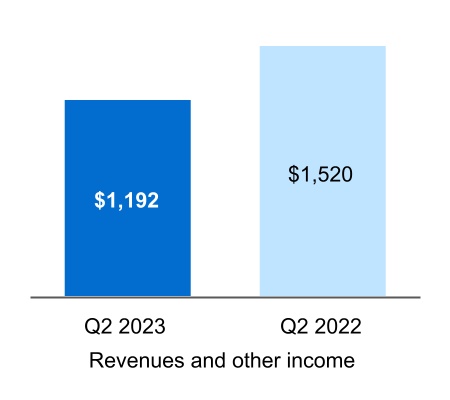
Total segment revenues and other income(1) | 1,192 | | | 1,520 | | | 2,445 | | | 2,793 | |
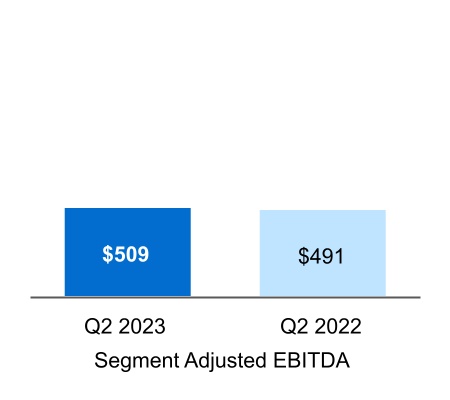
Segment Adjusted EBITDA(2) | 509 | | | 491 | | | 1,002 | | | 980 | |
| Capital expenditures | 143 | | | 95 | | | 266 | | | 190 | |
| Investments in unconsolidated affiliates | Investments in unconsolidated affiliates | $ | 25 | | | $ | 36 | | | $ | 61 | | | $ | 78 | |
| Investments in unconsolidated affiliates | |
(1) Within the total segment revenues and other income amounts presented above, third party revenues for the L&S segment were $187$207 million and $357$170 million for the three and six months ended June 30,March 31, 2024 and March 31, 2023, respectively, and $158 million and $293 million for the three and six months ended June 30, 2022, respectively. Third party revenues for the G&P segment were $1,139$1,212 million and $2,305$1,166 million for the three and six months ended June 30,March 31, 2024 and March 31, 2023, respectively, and $1,454 million and $2,666 million for the three and six months ended June 30, 2022, respectively.
(2) See below for the reconciliation from Segment Adjusted EBITDA to Net income.
The table below provides a reconciliation of Segment Adjusted EBITDA for reportable segments to Net income.
| | Three Months Ended
June 30, | | Six Months Ended
June 30, |
| Three Months Ended
March 31, | |
| Three Months Ended
March 31, | |
| Three Months Ended
March 31, | |
| (In millions) | |
| (In millions) | |
| (In millions) | (In millions) | 2023 | | 2022 | | 2023 | | 2022 |
| Reconciliation to Net income: | Reconciliation to Net income: | | | | | | | |
| Reconciliation to Net income: | |
| Reconciliation to Net income: | |
| L&S Segment Adjusted EBITDA | |
| L&S Segment Adjusted EBITDA | |
| L&S Segment Adjusted EBITDA | L&S Segment Adjusted EBITDA | $ | 1,022 | | | $ | 966 | | | $ | 2,048 | | | $ | 1,870 | |
| G&P Segment Adjusted EBITDA | G&P Segment Adjusted EBITDA | 509 | | | 491 | | | 1,002 | | | 980 | |
| G&P Segment Adjusted EBITDA | |
| G&P Segment Adjusted EBITDA | |
| Total reportable segments | |
| Total reportable segments | |
| Total reportable segments | Total reportable segments | 1,531 | | | 1,457 | | | 3,050 | | | 2,850 | |
Depreciation and amortization(1) | Depreciation and amortization(1) | (310) | | | (310) | | | (606) | | | (623) | |
| Interest and other financial costs | (233) | | | (233) | | | (476) | | | (455) | |
Depreciation and amortization(1) | |
Depreciation and amortization(1) | |
| | Net interest and other financial costs | |
| | Net interest and other financial costs | |
| | Net interest and other financial costs | |
| Income from equity method investments | |
| Income from equity method investments | |
| Income from equity method investments | Income from equity method investments | 145 | | | 111 | | | 279 | | | 210 | |
| Distributions/adjustments related to equity method investments | Distributions/adjustments related to equity method investments | (190) | | | (152) | | | (343) | | | (284) | |
| Distributions/adjustments related to equity method investments | |
| Distributions/adjustments related to equity method investments | |
| Adjusted EBITDA attributable to noncontrolling interests | Adjusted EBITDA attributable to noncontrolling interests | 10 | | | 10 | | | 20 | | | 19 | |
| Adjusted EBITDA attributable to noncontrolling interests | |
| Adjusted EBITDA attributable to noncontrolling interests | |
| Other(2) | |
| Other(2) | |
| Other(2) | Other(2) | (11) | | | 1 | | | (30) | | | — | |
| Net income | Net income | $ | 942 | | | $ | 884 | | | $ | 1,894 | | | $ | 1,717 | |
| Net income | |
| Net income | |
(1) Depreciation and amortization attributable to L&S was $140$130 million and $269$129 million for the three and six months ended June 30,March 31, 2024 and March 31, 2023, respectively, and $129 million and $259 million for the three and six months ended June 30, 2022, respectively. Depreciation and amortization attributable to G&P was $170$187 million and $337$167 million for the three and six months ended June 30,March 31, 2024 and March 31, 2023, respectively, and $181 million and $364 million for the three and six months ended June 30, 2022, respectively.
(2) Includes unrealized derivative gain/(loss), non-cash equity-based compensation, provision for income taxes, and other miscellaneous items.
8.9. Property, Plant and Equipment
Property, plant and equipment with associated accumulated depreciation is shown below:
| | | | | | | | | | | | | | | | | | | | | | | | | | | | | | | | | | | | | |
| | | June 30, 2023 | | December 31, 2022 |
| (In millions) | | | Gross PP&E | | Accumulated Depreciation | | Net PP&E | | Gross PP&E | | Accumulated Depreciation | | Net PP&E |
| L&S | | | $ | 12,575 | | | $ | 3,801 | | | $ | 8,774 | | | $ | 12,416 | | | $ | 3,554 | | | $ | 8,862 | |
| G&P | | | 13,711 | | | 3,793 | | | 9,918 | | | 13,495 | | | 3,509 | | | 9,986 | |
| Total | | | $ | 26,286 | | | $ | 7,594 | | | $ | 18,692 | | | $ | 25,911 | | | $ | 7,063 | | | $ | 18,848 | |
We capitalize interest as part of the cost of major projects during the construction period. Capitalized interest totaled $4 million and $7 million for the three and six months ended June 30, 2023, respectively, and $3 million and $5 million for the three and six months ended June 30, 2022, respectively.
| | | | | | | | | | | | | | | | | | | | | | | | | | | | | | | | | | | | | |
| | | March 31, 2024 | | December 31, 2023 |
| (In millions) | | | Gross PP&E | | Accumulated Depreciation | | Net PP&E | | Gross PP&E | | Accumulated Depreciation | | Net PP&E |
| L&S | | | $ | 12,842 | | | $ | 4,158 | | | $ | 8,684 | | | $ | 12,779 | | | $ | 4,037 | | | $ | 8,742 | |
| G&P | | | 14,852 | | | 4,237 | | | 10,615 | | | 14,606 | | | 4,084 | | | 10,522 | |
| Total | | | $ | 27,694 | | | $ | 8,395 | | | $ | 19,299 | | | $ | 27,385 | | | $ | 8,121 | | | $ | 19,264 | |
9.10. Fair Value Measurements
Fair Values – Recurring
The following table presents the impact on the Consolidated Balance Sheets of MPLX’s financial instruments carried at fair value on a recurring basis as of June 30, 2023March 31, 2024 and December 31, 20222023 by fair value hierarchy level.
| | | | | | | | | | | | | | | | | | | | | | | |
| June 30, 2023 | | December 31, 2022 |
| (In millions) | Asset | | Liability | | Asset | | Liability |
| Commodity contracts (Level 2) | | | | | | | |
| Other current assets / Other current liabilities | $ | 10 | | | $ | — | | | $ | — | | | $ | — | |
| Embedded derivatives in commodity contracts (Level 3) | | | | | | | |
| Other current assets / Other current liabilities | — | | | 7 | | | — | | | 10 | |
| Other noncurrent assets / Other long-term liabilities | — | | | 46 | | | — | | | 51 | |
| Total carrying value in Consolidated Balance Sheets | $ | 10 | | | $ | 53 | | | $ | — | | | $ | 61 | |
Level 2 instruments include over-the-counter fixed swaps to mitigate the price risk from our sales of propane. The swap valuations are based on observable inputs in the form of forward prices based on Mont Belvieu propane forward spot prices and contain no significant unobservable inputs.
| | | | | | | | | | | | | | | | | | | | | | | |
| March 31, 2024 | | December 31, 2023 |
| (In millions) | Asset | | Liability | | Asset | | Liability |
| | | | | | | |
| | | | | | | |
| Embedded derivatives in commodity contracts (Level 3) | | | | | | | |
| Other current assets / Other current liabilities | $ | — | | | $ | 13 | | | $ | — | | | $ | 11 | |
| Other noncurrent assets / Other long-term liabilities | — | | | 56 | | | — | | | 50 | |
| Total carrying value in Consolidated Balance Sheets | $ | — | | | $ | 69 | | | $ | — | | | $ | 61 | |
Level 3 instruments relate to an embedded derivative liability for a natural gas purchase commitment embedded in a keep-whole processing agreement. The fair value calculation for these Level 3 instruments used significant unobservable inputs including: (1) NGL prices interpolated and extrapolated due to inactive markets ranging from $0.54$0.66 to $1.34$1.61 per gallon with a weighted average of $0.72$0.83 per gallon and (2) thea 100 percent probability of renewal of 100 percent for the five-year renewal term of the gas purchase commitment and related keep-whole processing agreement. Increases or decreases in the fractionation spread result in an increase or decrease in the fair value of the embedded derivative liability, respectively.
Changes in Level 3 Fair Value Measurements
The following table is a reconciliation of the net beginning and ending balances recorded for net liabilities classified as Level 3 in the fair value hierarchy.
| | Three Months Ended
June 30, | | Six Months Ended
June 30, |
| Three Months Ended
March 31, | |
| Three Months Ended
March 31, | |
| Three Months Ended
March 31, | |
| (In millions) | |
| (In millions) | |
| (In millions) | (In millions) | 2023 | | 2022 | | 2023 | | 2022 |
| | Beginning balance | Beginning balance | $ | (58) | | | $ | (99) | | | $ | (61) | | | $ | (108) | |
Unrealized and realized gain included in Net Income(1) | 3 | | | 4 | | | 3 | | | 8 | |
| | Beginning balance | |
| | Beginning balance | |
Unrealized and realized (loss)/gain included in Net Income(1) | |
Unrealized and realized (loss)/gain included in Net Income(1) | |
Unrealized and realized (loss)/gain included in Net Income(1) | |
| Settlements | |
| Settlements | |
| Settlements | Settlements | 2 | | | 3 | | | 5 | | | 8 | |
| | Ending balance | Ending balance | $ | (53) | | | $ | (92) | | | $ | (53) | | | $ | (92) | |
| | The amount of total gain for the period included in earnings attributable to the change in unrealized gain relating to liabilities still held at end of period | $ | 3 | | | $ | 3 | | | $ | 3 | | | $ | 8 | |
| Ending balance | |
| | Ending balance | |
| | The amount of total loss for the period included in earnings attributable to the change in unrealized gain/(loss) relating to liabilities still held at end of period | |
| | The amount of total loss for the period included in earnings attributable to the change in unrealized gain/(loss) relating to liabilities still held at end of period | |
| | The amount of total loss for the period included in earnings attributable to the change in unrealized gain/(loss) relating to liabilities still held at end of period | |
(1) Gain/(loss)(Loss)/gain on derivatives embedded in commodity contracts are recorded in Purchased product costs in the Consolidated Statements of Income.
Non-recurring fair value measurements and disclosures in 2024 relate to the purchase of additional ownership interest in existing joint ventures and gathering assets as discussed in Note 3.
Fair Values – Reported
We believe the carrying value of our other financial instruments, including cash and cash equivalents, receivables, receivables from related parties, lease receivables, lease receivables from related parties, accounts payable, and payables to related parties, approximate fair value. MPLX’s fair value assessment incorporates a variety of considerations, including the duration of the instruments, MPC’s investment-grade credit rating, and the historical incurrence of and expected future insignificance of bad debt expense, which includes an evaluation of counterparty credit risk. The recorded value of the amounts outstanding under the bank revolving credit facility, if any, approximates fair value due to the variable interest rate that approximates current market rates. Derivative instruments are recorded at fair value, based on available market information (see Note 10)11).
The fair value of MPLX’s debt is estimated based on prices from recent trade activity and is categorized in Level 3 of the fair value hierarchy. The following table summarizes the fair value and carrying value of our third-party debt, excluding finance leases and unamortized debt issuance costs:
| | June 30, 2023 | | December 31, 2022 |
| March 31, 2024 | | | March 31, 2024 | | December 31, 2023 |
| (In millions) | (In millions) | Fair Value | | Carrying Value | | Fair Value | | Carrying Value | (In millions) | Fair Value | | Carrying Value | | Fair Value | | Carrying Value |
Outstanding debt(1) | Outstanding debt(1) | $ | 18,671 | | | $ | 20,527 | | | $ | 18,095 | | | $ | 19,905 | |
(1) Any amounts outstanding under the MPC Loan Agreement are not included in the table above, as the carrying value approximates fair value. This balance is reflected in Current liabilities - related parties in the Consolidated Balance Sheets.
10.11. Derivatives
As of June 30, 2023, MPLX had the following outstanding commodity contracts that were executed to manage the price risk associated with sales of propane during 2023:
| | | | | | | | | | | | | | |
Derivative contracts not designated as hedging instruments | | Financial Position | | Notional Quantity |
Propane (gal) | | Short | | 33,970,000 | |
Embedded Derivative - MPLX has a natural gas purchase commitment embedded in a keep-whole processing agreement with a producer customer in the Southern AppalachianAppalachia region expiring in December 2027. The customer has the unilateral option to extend the agreement for one five-year term through December 2032. For accounting purposes, the natural gas purchase commitment and the term extending option have been aggregated into a single compound embedded derivative. The probability of the customer exercising its option is determined based on assumptions about the customer’s potential business strategy decision points that may exist at the time they would elect whether to renew the contract. The changes in fair value of this compound embedded derivative are based on the difference between the contractual and index pricing, the probability of the producer customer exercising its option to extend, and the estimated favorability of these contracts compared to current market conditions. The changes in fair value are recorded in earnings through Purchased product costs in the Consolidated Statements of Income. For further information regarding the fair value measurement of derivative instruments, see Note 9.10. As of June 30, 2023March 31, 2024 and December 31, 2022,2023, the estimated fair value of this contract was a liability of $53$69 million and $61 million, respectively.
Certain derivative positions are subject to master netting agreements,agreements; therefore, MPLX has elected to offset derivative assets and liabilities that are legally permissible to be offset. As of June 30, 2023March 31, 2024 and December 31, 2022,2023, there were no derivative assets or liabilities that were offset in the Consolidated Balance Sheets.
We make a distinction between realized or unrealized gains and losses on derivatives. During the period when a derivative contract is outstanding, changes in the fair value of the derivative are recorded as an unrealized gain or loss. When a derivative contract matures or is settled, the previously recorded unrealized gain or loss is reversed, and the realized gain or loss of the contract is recorded. The impact of MPLX’s derivative contracts not designated as hedging instruments and the location of gains and losses recognized in the Consolidated Statements of Income is summarized below:
| | Three Months Ended
June 30, | | Six Months Ended
June 30, |
| Three Months Ended
March 31, | |
| Three Months Ended
March 31, | |
| Three Months Ended
March 31, | |
| (In millions) | (In millions) | 2023 | | 2022 | | 2023 | | 2022 |
| (In millions) | |
| (In millions) | |
| Product sales: | |
| Product sales: | |
| Product sales: | Product sales: | | | | | | | |
| | Unrealized gain | Unrealized gain | $ | 8 | | | $ | — | | | $ | 10 | | | $ | — | |
| | Unrealized gain | |
| | Unrealized gain | |
| Product sales derivative gain | |
| Product sales derivative gain | |
| Product sales derivative gain | Product sales derivative gain | 8 | | | — | | | 10 | | | — | |
| Purchased product costs: | Purchased product costs: | | | | | | | |
| Purchased product costs: | |
| Purchased product costs: | |
| Realized loss | Realized loss | (2) | | | (3) | | | (5) | | | (8) | |
| Unrealized gain | 5 | | | 7 | | | 8 | | | 16 | |
| Purchased product cost derivative gain | 3 | | | 4 | | | 3 | | | 8 | |
| Realized loss | |
| Realized loss | |
| Unrealized (loss)/gain | |
| Unrealized (loss)/gain | |
| Unrealized (loss)/gain | |
| Purchased product cost derivative loss | |
| Purchased product cost derivative loss | |
| Purchased product cost derivative loss | |
| | Total derivative gain included in Net income | $ | 11 | | | $ | 4 | | | $ | 13 | | | $ | 8 | |
| Total derivative (loss)/gain included in Net income | |
| | Total derivative (loss)/gain included in Net income | |
| | Total derivative (loss)/gain included in Net income | |
MPLX’s outstanding borrowings consist of the following:
| | | | | | | | | | | |
| (In millions) | June 30,
2023 | | December 31,
2022 |
| MPLX LP: | | | |
| | | |
| MPLX Credit Agreement | $ | — | | | $ | — | |
| | | |
| | | |
| | | |
| | | |
| | | |
| | | |
| | | |
| | | |
| | | |
| | | |
| | | |
| | | |
| | | |
| | | |
| | | |
| | | |
| | | |
| | | |
| | | |
| | | |
| | | |
| | | |
| | | |
| | | |
| | | |
| | | |
| | | |
| | | |
| | | |
| | | |
| Fixed rate senior notes | 20,657 | | | 20,046 | |
| Consolidated subsidiaries: | | | |
| MarkWest | 12 | | | 23 | |
| ANDX | 31 | | | 31 | |
| | | |
| Finance lease obligations | 7 | | | 8 | |
| Total | 20,707 | | | 20,108 | |
| Unamortized debt issuance costs | (128) | | | (117) | |
| Unamortized discount | (173) | | | (195) | |
| Amounts due within one year | (1) | | | (988) | |
| Total long-term debt due after one year | $ | 20,405 | | | $ | 18,808 | |
| | | | | | | | | | | |
| (In millions) | March 31,
2024 | | December 31,
2023 |
| MPLX LP: | | | |
| MPLX Credit Agreement | $ | — | | | $ | — | |
| | | |
| | | |
| | | |
| | | |
| | | |
| | | |
| | | |
| | | |
| | | |
| | | |
| | | |
| | | |
| | | |
| | | |
| | | |
| | | |
| | | |
| | | |
| | | |
| | | |
| | | |
| | | |
| | | |
| | | |
| | | |
| | | |
| Fixed rate senior notes | 20,657 | | | 20,657 | |
| Consolidated subsidiaries: | | | |
| MarkWest | 12 | | | 12 | |
| ANDX | 31 | | | 31 | |
| Finance lease obligations | 6 | | | 6 | |
| Total | 20,706 | | | 20,706 | |
| Unamortized debt issuance costs | (119) | | | (122) | |
| Unamortized discount | (143) | | | (153) | |
| Amounts due within one year | (1,639) | | | (1,135) | |
| Total long-term debt due after one year | $ | 18,805 | | | $ | 19,296 | |
Credit Agreement
MPLX’s credit agreement (the “MPLX Credit Agreement”) matures in July 2027 and, among other things, provides for a $2 billion unsecured revolving credit facility and letter of credit issuing capacity under the facility of up to $150 million. Letter of credit issuing capacity is included in, not in addition to, the $2 billion borrowing capacity. Borrowings under the MPLX Credit Agreement bear interest, at MPLX’s election, at either the Adjusted Term SOFR or the Alternate Base Rate, both as defined in the MPLX Credit Agreement, plus an applicable margin.
There was no activity on the MPLX Credit Agreement during the sixthree months ended June 30, 2023.
Fixed Rate Senior Notes
MPLX’s senior notes, including those issued by consolidated subsidiaries, consist of various series of senior notes maturing between 2024 and 2058 with interest rates ranging from 1.750 percent to 5.650 percent. Interest on each series of notes is payable semi-annually in arrears on various dates depending on the series of the notes.
13. Net Interest and Other Financial Costs
Net interest and other financial costs were as follows:
| | | | | | | | | | | | | | | | | | |
| | Three Months Ended
March 31, | | |
| (In millions) | | 2024 | | 2023 | | | | |
| Interest expense | | $ | 228 | | | $ | 227 | | | | | |
| Other financial costs | | 26 | | | 27 | | | | | |
| Interest income | | (15) | | | (8) | | | | | |
| Capitalized interest | | (4) | | | (3) | | | | | |
| | | | | | | | |
| Net interest and other financial costs | | $ | 235 | | | $ | 243 | | | | | |
On February 9, 2023, MPLX issued $1.6 billion aggregate principal amount of notes, consisting of $1.1 billion principal amount of 5.00 percent senior notes due 2033 (the “2033 Senior Notes”) and $500 million principal amount of 5.65 percent senior notes due 2053 (the “2053 Senior Notes”). The 2033 Senior Notes were offered at a price to the public of 99.170 percent of par with interest payable semi-annually in arrears, commencing on September 1, 2023. The 2053 Senior Notes were offered at a price to the public of 99.536 percent of par with interest payable semi-annually in arrears, commencing on September 1, 2023.
On February 15, 2023, MPLX used $600 million of the net proceeds from the offering of the 2033 Senior Notes and 2053 Senior Notes described above to redeem all of the outstanding Series B preferred units. On March 13, 2023, MPLX used the remaining proceeds from the offering, and cash on hand, to redeem all of MPLX’s and MarkWest’s $1.0 billion aggregate principal amount of 4.50 percent senior notes due July 2023, at par, plus accrued and unpaid interest. The redemption resulted in a loss of $9 million due to the immediate expense recognition of unamortized debt discount and issuance costs for the three months ended March 31, 2023, which is included on the Consolidated Statements of Income as Other financial costs.
12.14. Revenue
Disaggregation of Revenue
The following tables represent a disaggregation of revenue for each reportable segment for the three and six months ended June 30, 2023March 31, 2024 and June 30, 2022:March 31, 2023:
| | | | | | | | | | | | | | | | | |
| Three Months Ended March 31, 2024 |
| (In millions) | L&S | | G&P | | Total |
| Revenues and other income: | | | | | |
| Service revenue | $ | 85 | | | $ | 573 | | | $ | 658 | |
| Service revenue - related parties | 982 | | | 4 | | | 986 | |
| Service revenue - product related | — | | | 95 | | | 95 | |
| Product sales | 2 | | | 368 | | | 370 | |
| Product sales - related parties | 3 | | | 60 | | | 63 | |
| Total revenues from contracts with customers | $ | 1,072 | | | $ | 1,100 | | | 2,172 | |
Non-ASC 606 revenue(1) | | | | | 674 | |
| Total revenues and other income | | | | | $ | 2,846 | |
| | | | | | | | | | | | | | | | | |
| Three Months Ended June 30, 2023 |
| (In millions) | L&S | | G&P | | Total |
| Revenues and other income: | | | | | |
| Service revenue | $ | 92 | | | $ | 543 | | | $ | 635 | |
| Service revenue - related parties | 968 | | | 3 | | | 971 | |
| Service revenue - product related | — | | | 60 | | | 60 | |
| Product sales | — | | | 376 | | | 376 | |
| Product sales - related parties | 3 | | | 31 | | | 34 | |
| Total revenues from contracts with customers | $ | 1,063 | | | $ | 1,013 | | | 2,076 | |
Non-ASC 606 revenue(1) | | | | | 614 | |
| Total revenues and other income | | | | | $ | 2,690 | |
| | | | | | | | | | | | | | | | | |
| Three Months Ended June 30, 2022 |
| (In millions) | L&S | | G&P | | Total |
| Revenues and other income: | | | | | |
| Service revenue | $ | 77 | | | $ | 500 | | | $ | 577 | |
| Service revenue - related parties | 933 | | | 5 | | | 938 | |
| Service revenue - product related | — | | | 118 | | | 118 | |
| Product sales | 2 | | | 696 | | | 698 | |
| Product sales - related parties | 5 | | | 46 | | | 51 | |
| Total revenues from contracts with customers | $ | 1,017 | | | $ | 1,365 | | | 2,382 | |
Non-ASC 606 revenue(1) | | | | | 558 | |
| Total revenues and other income | | | | | $ | 2,940 | |
| | | | | | | | | | | | | | | | | |
| Six Months Ended June 30, 2023 |
| (In millions) | L&S | | G&P | | Total |
| Revenues and other income: | | | | | |
| Service revenue | 175 | | | 1,065 | | | $ | 1,240 | |
| Service revenue - related parties | 1,918 | | | 6 | | | 1,924 | |
| Service revenue - product related | — | | | 139 | | | 139 | |
| Product sales | 2 | | | 794 | | | 796 | |
| Product sales - related parties | 6 | | | 98 | | | 104 | |
| Total revenues from contracts with customers | $ | 2,101 | | | $ | 2,102 | | | 4,203 | |
Non-ASC 606 revenue(1) | | | | | 1,200 | |
| Total revenues and other income | | | | | $ | 5,403 | |
| | Six Months Ended June 30, 2022 |
| Three Months Ended March 31, 2023 | | | Three Months Ended March 31, 2023 |
| (In millions) | (In millions) | L&S | | G&P | | Total | (In millions) | L&S | | G&P | | Total |
| Revenues and other income: | Revenues and other income: | | | | | |
| Service revenue | |
| Service revenue | |
| Service revenue | Service revenue | 149 | | | 982 | | | $ | 1,131 | |
| Service revenue - related parties | Service revenue - related parties | 1,844 | | | 9 | | | 1,853 | |
| Service revenue - product related | Service revenue - product related | — | | | 241 | | | 241 | |
| Product sales | Product sales | 3 | | | 1,192 | | | 1,195 | |
| Product sales - related parties | Product sales - related parties | 8 | | | 88 | | | 96 | |
| Total revenues from contracts with customers | Total revenues from contracts with customers | $ | 2,004 | | | $ | 2,512 | | | 4,516 | |
Non-ASC 606 revenue(1) | Non-ASC 606 revenue(1) | | 1,034 | |
| Total revenues and other income | Total revenues and other income | | $ | 5,550 | |
(1) Non-ASC 606 Revenue includes rental income, sales-type lease revenue, income from equity method investments, and other income (loss).
Contract Balances
Our receivables are primarily associated with customer contracts. Payment terms vary by product or service type,type; however, the period between invoicing and payment is not significant. Included within the receivables are balances related to commodity sales on behalf of our producer customers, for which we remit the net sales price back to the producer customers upon completion of the sale. These balances are included in Receivables, net on the Consolidated Balance Sheets.
Under certain of our contracts, we recognize revenues in excess of billings which we present as contract assets. Contract assets typically relate to deficiency payments related to minimum volume commitments and aid in construction agreements where the revenue recognized and MPLX’s rights to consideration for work completed exceeds the amount billed to the customer. Contract assets are included in Other current assets and Other noncurrent assets on the Consolidated Balance Sheets.
Under certain of our contracts, we receive payments in advance of satisfying our performance obligations, which are recorded as contract liabilities. Contract liabilities, which we present as Deferred revenue and Long-term deferred revenue, typically relate to advance payments for aid in construction agreements and deferred customer credits associated with makeup rights and minimum volume commitments. Related to minimum volume commitments, breakage is estimated and recognized into service revenue in instances where it is probable the customer will not use the credit in future periods. We classify contract liabilities as current or long-term based on the timing of when we expect to recognize revenue.
The tables below reflect the changes in ASC 606 contract balances for the six-month periodsthree months ended June 30, 2023March 31, 2024 and June 30, 2022:March 31, 2023:
| | | | | | | | | | | | | | | | | | | | | | | |
| (In millions) | Balance at December 31, 2023 | | Additions/ (Deletions) | | Revenue Recognized(1) | | Balance at March 31, 2024 |
| Contract assets | $ | 3 | | | $ | (1) | | | $ | — | | | $ | 2 | |
| Long-term contract assets | 1 | | | — | | | — | | | 1 | |
| Deferred revenue | 59 | | | 19 | | | (12) | | | 66 | |
| Deferred revenue - related parties | 47 | | | 27 | | | (20) | | | 54 | |
| Long-term deferred revenue | 344 | | | 2 | | | — | | | 346 | |
| Long-term deferred revenue - related parties | $ | 29 | | | $ | — | | | $ | — | | | $ | 29 | |
| | | | | | | |
| | | | | | | |
| | | | | | | | | | | | | | | | | | | | | | | |
| (In millions) | Balance at December 31, 2022 | | Additions/ (Deletions) | | Revenue Recognized(1) | | Balance at June 30, 2023 |
| Contract assets | $ | 21 | | | $ | (3) | | | $ | — | | | $ | 18 | |
| Long-term contract assets | 1 | | | — | | | — | | | 1 | |
| Deferred revenue | 57 | | | 12 | | | (22) | | | 47 | |
| Deferred revenue - related parties | 63 | | | 47 | | | (48) | | | 62 | |
| Long-term deferred revenue | 216 | | | 49 | | | — | | | 265 | |
| Long-term deferred revenue - related parties | 25 | | | 3 | | | — | | | 28 | |
| Contract liabilities | — | | | 1 | | | — | | | 1 | |
| Long-term contract liabilities | $ | 2 | | | $ | (2) | | | $ | — | | | $ | — | |
| | (In millions) | (In millions) | Balance at December 31, 2021 | | Additions/ (Deletions) | | Revenue Recognized(1) | | Balance at June 30, 2022 | (In millions) | Balance at December 31, 2022 | | Additions/ (Deletions) | | Revenue Recognized(1) | | Balance at March 31, 2023 |
| Contract assets | Contract assets | $ | 25 | | | $ | (14) | | | $ | — | | | $ | 11 | |
| Long-term contract assets | Long-term contract assets | 2 | | | — | | | — | | | 2 | |
| Deferred revenue | Deferred revenue | 56 | | | 26 | | | (25) | | | 57 | |
| Deferred revenue - related parties | Deferred revenue - related parties | 60 | | | 54 | | | (57) | | | 57 | |
| Long-term deferred revenue | Long-term deferred revenue | 135 | | | 17 | | | — | | | 152 | |
| Long-term deferred revenue - related parties | Long-term deferred revenue - related parties | 31 | | | (3) | | | — | | | 28 | |
| Contract liabilities | |
| Long-term contract liabilities | Long-term contract liabilities | $ | 5 | | | $ | — | | | $ | — | | | $ | 5 | |
(1) No significant revenue was recognized related to past performance obligations in the current periods.
Remaining Performance Obligations
The table below includes estimated revenue expected to be recognized in the future related to performance obligations that are unsatisfied (or partially unsatisfied) as of June 30, 2023.March 31, 2024. The amounts presented below are generally limited to fixed consideration from contracts with customers that contain minimum volume commitments.
A significant portion of our future contracted revenue is excluded from the amounts presented below in accordance with ASC 606. Variable consideration that is constrained or not required to be estimated as it reflects our efforts to perform is excluded from this disclosure. Additionally, we do not disclose information on the future performance obligations for any contract with an original expected duration of one year or less, or that are terminable by our customer with little or no termination penalties. Potential future performance obligations related to renewals that have not yet been exercised or are not certain of exercise are excluded from the amounts presented below. Revenues classified as Rental income and Sales-type lease revenue are also excluded from this table.
| | | | | |
| (In billions) | |
| 2023 | $ | 1.0 | |
| 2024 | 1.9 | |
| 2025 | 1.8 | |
| 2026 | 1.7 | |
| 2027 | 1.6 | |
| Thereafter | 0.9 | |
| Total estimated revenue on remaining performance obligations | $ | 8.9 | |
| | | | | |
| (In billions) | |
| 2024 | $ | 1.5 | |
| 2025 | 2.0 | |
| 2026 | 1.8 | |
| 2027 | 1.7 | |
| 2028 | 0.5 | |
| 2029 and thereafter | 0.6 | |
| Total estimated revenue on remaining performance obligations | $ | 8.1 | |
As of June 30, 2023,March 31, 2024, unsatisfied performance obligations included in the Consolidated Balance Sheets are $402$495 million and will be recognized as revenue as the obligations are satisfied, which is expected to occur over the next 21 years. A portion of this amount is not disclosed in the table above as it is deemed variable consideration due to volume variability.
15. Supplemental Cash Flow Information
| | | | | | | | | | | |
| | Six Months Ended
June 30, |
| (In millions) | 2023 | | 2022 |
| Net cash provided by operating activities included: | | | |
| Interest paid (net of amounts capitalized) | $ | 440 | | | $ | 393 | |
| Income taxes paid | 3 | | | 1 | |
| | | |
| | | |
| | | |
| | | |
| | | |
| Non-cash investing and financing activities: | | | |
| Net transfers of property, plant and equipment (to)/from materials and supplies inventories | 9 | | | — | |
| Net transfers of property, plant and equipment to lease receivable | $ | 62 | | | $ | 18 | |
| | | |
| | | |
| | | |
| | | |
| | | | | | | | | | | |
| | Three Months Ended
March 31, |
| (In millions) | 2024 | | 2023 |
| Net cash provided by operating activities included: | | | |
| Interest paid (net of amounts capitalized) | $ | 278 | | | $ | 270 | |
| Income taxes paid | — | | | 1 | |
| Cash paid for amounts included in the measurement of lease liabilities: | | | |
| Payments on operating leases | 19 | | | 19 | |
| | | |
| | | |
| | | |
| Non-cash investing and financing activities: | | | |
| Net transfers of property, plant and equipment (to)/from materials and supplies inventory | (1) | | | 9 | |
| Net transfers of property, plant and equipment to lease receivable | 25 | | | 28 | |
| | | |
| ROU assets obtained in exchange for new operating lease obligations | $ | 34 | | | $ | 2 | |
| | | |
| | | |
The Consolidated Statements of Cash Flows exclude changes to the Consolidated Balance Sheets that do not affect cash. The following is a reconciliation of additions to property, plant and equipment to total capital expenditures:
| | | | | | | | | | | |
| | Six Months Ended
June 30, |
| (In millions) | 2023 | | 2022 |
| Additions to property, plant and equipment | $ | 432 | | | $ | 294 | |
| Increase in capital accruals | 12 | | | 54 | |
| | | |
| Total capital expenditures | $ | 444 | | | $ | 348 | |
| | | | | | | | | | | |
| | Three Months Ended
March 31, |
| (In millions) | 2024 | | 2023 |
| Additions to property, plant and equipment | $ | 255 | | | $ | 169 | |
| (Decrease)/Increase in capital accruals | (45) | | | 22 | |
| | | |
| Total capital expenditures | $ | 210 | | | $ | 191 | |
14.16. Commitments and Contingencies
MPLX is the subject of, or a party to, a number of pending or threatened legal actions, contingencies and commitments involving a variety of matters, including laws and regulations relating to the environment. Some of these matters are discussed below. For matters for which MPLX has not recorded a liability, MPLX is unable to estimate a range of possible loss because the issues involved have not been fully developed through pleadings, discovery or court proceedings. However, the ultimate resolution of some of these contingencies could, individually or in the aggregate, be material.
Environmental Matters
MPLX is subject to federal, state and local laws and regulations relating to the environment. These laws generally provide for control of pollutants released into the environment and require responsible parties to undertake remediation of hazardous waste disposal sites. Penalties may be imposed for non-compliance.
Accrued liabilities for remediation totaled $17 million at both June 30, 2023March 31, 2024 and $19 million December 31, 2022.2023. It is not presently possible to estimate the ultimate amount of all remediation costs that might be incurred or the penalties, if any, that may be imposed.
MPLX is involved in environmental enforcement matters arising in the ordinary course of business. While the outcome and impact to MPLX cannot be predicted with certainty, management believes the resolution of these environmental matters will not, individually or collectively, have a material adverse effect on its consolidated results of operations, financial position or cash flows.
Other Legal Proceedings
In July 2020, Tesoro High Plains Pipeline Company, LLC (“THPP”), a subsidiary of MPLX, received a Notification of Trespass Determination from the Bureau of Indian Affairs (“BIA”) relating to a portion of the Tesoro High Plains Pipeline that crosses the Fort Berthold Reservation in North Dakota. The notification demanded the immediate cessation of pipeline operations and assessed trespass damages of approximately $187 million. After subsequent appeal proceedings and in compliance with a new order issued by the BIA, in December 2020, THPP paid approximately $4 million in assessed trespass damages and ceased use of the portion of the pipeline that crosses the property at issue. In March 2021, the BIA issued an order purporting to vacate the BIA's prior orders related to THPP’s alleged trespass and direct the Regional Director of the BIA to reconsider the issue of THPP’s alleged trespass and issue a new order. In April 2021, THPP filed a lawsuit in the District of North Dakota against the United States of America, the U.S. Department of the Interior and the BIA (together,(collectively, the “U.S. Government Parties”) challenging the March 2021 order purporting to vacate all previous orders related to THPP’s alleged trespass. On February 8, 2022, the U.S. Government Parties filed their answer and counterclaims to THPP’s suit claiming THPP is in continued trespass with respect to the pipeline and seekseeking disgorgement of pipeline profits from June 1, 2013 to present, removal of the pipeline and remediation. We intendOn November 8, 2023, the District Court of North Dakota granted THPP’s motion to vigorously defend ourselves against thesesever and stay the U.S. Government Parties’ counterclaims. The case will proceed on the merits of THPP’s challenge to the March 2021 order purporting
to vacate all previous orders related to THPP’s alleged trespass. THPP continues not to operate that portion of the pipeline that crosses the property at issue.
MPLX is also a party to a number of other lawsuits and other proceedings arising in the ordinary course of business. While the ultimate outcome and impact to MPLX cannot be predicted with certainty, management believes the resolution of these other lawsuits and proceedings will not, individually or collectively, have a material adverse effect on its consolidated financial position, results of operations or cash flows.
Guarantees related to indebtedness of equity method investees
We hold a 9.19 percent indirect interest in a joint venture thatDakota Access, which owns and operates the Dakota Access Pipeline and Energy Transfer Crude Oil Pipeline projects, collectively referred to as the Bakken Pipeline system or DAPL.system. In 2020, the U.S. District Court for the District of Columbia (the “D.D.C.”) ordered the U.S.United States Army Corps of Engineers (“Army Corps”), which granted permits and an easement for the Bakken Pipeline system, to prepare an environmental impact statement (“EIS”) relating to an easement under Lake Oahe in North Dakota. The D.D.C. later vacated the easement. The EIS has been delayed and the Army Corps currently expects to releaseissued a draft EIS in 2023.
In May 2021,September 2023 detailing various options for the D.D.C. deniedeasement going forward, including denying the easement, approving the easement with additional measures, rerouting the easement, or approving the easement with no changes. The Army Corps has not selected a renewed request for an injunction to shut downpreferred alternative, but will make a decision in its final review, after considering input from the pipeline while the EIS is being prepared. In June 2021, the D.D.C. issued an order dismissing without prejudice the tribes’ claims against the Dakota Access Pipeline. The litigation could be reopened or new litigation challenging the EIS, once completed, could be filed.public and other agencies. The pipeline remains operational.
We have entered into a Contingent Equity Contribution Agreement whereby MPLX LP, along with the other joint venture owners in the Bakken Pipeline system, has agreed to make equity contributions to the joint venture upon certain events occurring to allow the entities that own and operate the Bakken Pipeline system to satisfy their senior note payment obligations. The senior notes were issued to repay amounts owed by the pipeline companies to fund the cost of construction of the Bakken Pipeline system.
If the vacatur of the easement results in a temporary shutdown of the pipeline, were temporarily shut down, MPLX would have to contribute its 9.19 percent pro rata share of funds required to pay interest accruing on the notes and any portion of the principal that matures while the pipeline is shutdown. MPLX also expects to contribute its 9.19 percent pro rata share of any costs to remediate any deficiencies to reinstate the permiteasement and/or return the pipeline into operation. If the vacatur of the easement permit results in a permanent shutdown of the pipeline, MPLX would have to contribute its 9.19 percent pro rata share of the cost to redeem the bonds (including the one percent redemption premium required pursuant to the indenture governing the notes) and any accrued and unpaid interest. As of June 30, 2023,March 31, 2024, our maximum potential undiscounted payments under the Contingent Equity Contribution Agreement were approximately $170 million.
Contractual Commitments and Contingencies
From time to time and in the ordinary course of business, MPLX and its affiliates provide guarantees of MPLX’s subsidiaries payment and performance obligations in the G&P segment. Certain natural gas processing and gathering arrangements require MPLX to construct new natural gas processing plants, natural gas gathering pipelines and NGL pipelines and contain certain fees and charges if specified construction milestones are not achieved for reasons other than force majeure. In certain cases, certain producers may have the right to cancel the processing arrangements if there are significant delays that are not due to force majeure. As of June 30, 2023,March 31, 2024, management does not believe there are any indications that MPLX will not be able to meet the construction milestones, that force majeure does not apply or that such fees and charges will otherwise be triggered.
Item 2. Management’s Discussion and Analysis of Financial Condition and Results of Operations
Management’s Discussion and Analysis of Financial Condition and Results of Operations should also be read in conjunction with the unaudited consolidated financial statements and accompanying footnotes included under Item 1. Financial Statements and in conjunction with our Annual Report on Form 10-K for the year ended December 31, 2022.
Disclosures Regarding Forward-Looking Statements
This Quarterly Report on Form 10-Q, particularly Management’s Discussion and Analysis of Financial Condition and Results of Operations and Quantitative and Qualitative Disclosures about Market Risk, includes forward-looking statements that are subject to risks, contingencies or uncertainties. You can identify forward-looking statements by words such as “anticipate,” “believe,” “commitment,” “could,” “design,” “estimate,” “expect,” “forecast,” “goal,” “guidance,” “intend,” “may,” “objective,” “opportunity,” “outlook,” “plan,” “policy,” “position,” “potential,” “predict,” “priority,” “project,” “prospective,” “pursue,” “seek,” “should,” “strategy,” “target,” “will,” “would” or other similar expressions that convey the uncertainty of future events or outcomes.
Forward-looking statements include, among other things, statements regarding:
•future financial and operating results;
•environmental, social and governance, (“ESG”)which we refer to as “ESG,” plans and goals, including those related to greenhouse gas emissions and intensity, biodiversity, diversity, equity and inclusion and ESG reporting;
•future levels of capital, environmental or maintenance expenditures, general and administrative and other expenses;
•the success or timing of completion of ongoing or anticipated capital or maintenance projects;
•business strategies, growth opportunities and expected investments;investments, including plans to grow stable cash flows, lower costs and return capital to unitholders;
•the timing and amount of future distributions or unit repurchases; and
•the anticipated effects of actions of third parties such as competitors, activist investors, federal, foreign, state or local regulatory authorities, or plaintiffs in litigation.
Our forward-looking statements are not guarantees of future performance and you should not rely unduly on them, as they involve risks, uncertainties and assumptions that we cannot predict. Forward-looking and other statements regarding our ESG plans and goals are not an indication that these statements are material to investors or required to be disclosed in our filings with the SEC. In addition, historical, current, and forward-looking ESG-related statements may be based on standards for measuring progress that are still developing, internal controls and processes that continue to evolve, and assumptions that are subject to change in the future. Material differences between actual results and any future performance suggested in our forward-looking statements could result from a variety of factors, including the following:
•general economic, political or regulatory developments, including inflation, interest rates, changes in governmental policies relating to refined petroleum products, crude oil, natural gas, NGLs, renewables, or taxation;
•the ability of MPC to achieve its strategic objectives and the effects of those strategic decisions on us;
•further impairments;
•negative capital market conditions, including an increase of the current yield on common units;
•the ability to achieve strategic and financial objectives, including with respect to distribution coverage, future distribution levels, proposed projects and completed transactions;
•the success of MPC’s portfolio optimization, including the ability to complete any divestitures on commercially reasonable terms and/or within the expected timeframe, and the effects of any such divestitures on our business, financial condition, results of operations and cash flows;
•consumer demand for refined products, natural gas, renewables and NGLs;
•the adequacy of capital resources and liquidity, including the availability of sufficient cash flow to pay distributions and access to debt on commercially reasonable terms, and the ability to successfully execute business plans, growth strategies and self-funding models;
•the timing and extent of changes in commodity prices and demand for crude oil, refined products, feedstocks or other hydrocarbon-based products, or renewables;
•volatility in or degradation of general economic, market, industry or business conditions, including as a result of the COVID-19 pandemic,pandemics, other infectious disease outbreaks, natural hazards, extreme weather events, regional conflicts such as hostilities in the military conflict between RussiaMiddle East and Ukraine, other conflicts, inflation, or rising interest rates or otherwise;rates;
•changes to the expected construction costs and timing of projects and planned investments, and the ability to obtain regulatory and other approvals with respect thereto;
•the availability of desirable strategic alternatives to optimize portfolio assets and our ability to obtain regulatory and other approvals with respect thereto;
•completion of midstream infrastructure by competitors;
•disruptions due to equipment interruption or failure, including electrical shortages and power grid failures;
•the suspension, reduction or termination of MPC’s obligations under MPLX’s commercial agreements;
•modifications to financial policies, capital budgets, and earnings and distributions;
•the ability to manage disruptions in credit markets or changes to credit ratings;
•complianceour ability to comply with federal and state environmental, economic, health and safety, energy and other policies and regulations or enforcement actions initiated thereunder;
•adverse results in litigation;
•the effect of restructuring or reorganization of business components;
•the potential effects of changes in tariff rates on our business, financial condition, results of operations and cash flows;
•foreign imports and exports of crude oil, refined products, natural gas and NGLs;
•changes in producer customers’ drilling plans or in volumes of throughput of crude oil, natural gas, NGLs, refined products, other hydrocarbon-based products, or renewables;
•changes in the cost or availability of third-party vessels, pipelines, railcars and other means of transportation for crude oil, natural gas, NGLs, feedstocks, refined products, or renewables;
•the price, availability and acceptance of alternative fuels and alternative-fuel vehicles and laws mandating such fuels or vehicles;
•actions taken by our competitors, including pricing adjustments and the expansion and retirement of pipeline capacity, processing, fractionation and treating facilities in response to market conditions;
•expectations regarding joint venture arrangements and other acquisitions or divestitures of assets;
•midstream and refining industry overcapacity or undercapacity;
•accidentsindustrial incidents or other unscheduled shutdowns affecting our machinery, pipelines, processing, fractionation and treating facilities or equipment, means of transportation, or those of our suppliers or customers;
•acts of war, terrorism or civil unrest that could impair our ability to gather, process, fractionate or transport crude oil, natural gas, NGLs, refined products, or renewables;
•labor and material shortages;
•the timing and ability to obtain necessary regulatory approvals and permits and to satisfy other conditions necessary to complete planned projects or to consummate planned transactions within the expected timeframe, if at all;
•the availability of desirable strategic alternatives to optimize portfolio assets and the ability to obtain regulatory and other approvals with respect thereto;
•political pressure and influence of environmental groups upon policies and decisions relatedother stakeholders that are adverse to the production, gathering, refining, processing, fractionation, transportation and marketing of crude oil or other feedstocks, refined products, natural gas, NGLs, other hydrocarbon-based products, or renewables;
•the imposition of windfall profit taxes or maximum refining margin penalties on companies operating in the energy industry in California or other jurisdictions; and
•our ability to successfully implement our sustainable energy strategy and principles and achieve our ESG goals and targets within the expected timeframe, if at all.
For additional risk factors affecting our business, see the risk factors described in our Annual Report on Form 10-K for the year ended December 31, 2022.2023. We undertake no obligation to update any forward-looking statements except to the extent required by applicable law.
MPLX Overview
We are a diversified, large-cap master limited partnership formed by MPC in 2012 that owns and operates midstream energy infrastructure and logistics assets, and provides fuels distribution services. The business consists of two segments based on the nature of services it offers: Logistics and Storage (“L&S”) and Gathering and Processing (“G&P”). The
Our L&S segment primarily engages in the gathering, transportation, storagegathers, transports, stores and distribution ofdistributes crude oil, refined products, including renewable diesel, and other hydrocarbon-based products,products. Additionally, the segment markets refined products. The profitability of pipeline transportation operations primarily depends on tariff rates and renewables.the volumes shipped through the pipelines. The L&S segment also includesprofitability of marine operations primarily depends on the operationquantity and availability of our vessels and barges. The profitability of our terminal operations primarily depends on the throughput volumes at our terminals. The profitability of our fuels distribution services primarily depends on the sales volumes of certain refined products. The profitability of our refining logistics operations depends on the quantity and availability of our refining logistics assets. A majority of the crude oil and refined product shipments on our pipelines and marine vessels, the throughput at our terminals and refining logistics assets serve MPC and our fuels distribution services are used solely by MPC. We have various long-term, fee-based commercial agreements related to services provided to MPC. Under these agreements, we receive various commitments of minimum throughput, storage and inland marine businesses, terminals, rail facilities and storage caverns. The G&P segment provides gathering, processing and transportation of natural gasdistribution volumes as well as commitments to pay for all available capacity of certain assets. The volume of crude oil that we transport is directly affected by the supply of, and refiner demand for, crude oil in the markets served directly by our crude oil pipelines, terminals and marine operations. Key factors in this supply and demand balance are the production levels of crude oil by producers in various regions or fields, the availability and cost of alternative modes of transportation, fractionation, storagethe volumes of crude oil processed at refineries and marketing of NGLs.
transportation system maintenance levels. The volume of refined products that we transport, store, distribute and market is directly affected by the production levels of, and user demand for, refined products in the markets served by our refined product pipelines and marine operations. In most of our markets, demand for gasoline and distillate peaks during the summer driving season, which extends from May through September of each year, and declines during the fall and winter months. As with crude oil, other transportation alternatives and system maintenance levels influence refined product movements.
Our G&P segment gathers, processes and transports natural gas and transports, fractionates, stores and markets NGLs. NGL and natural gas prices are volatile and are impacted by changes in fundamental supply and demand, as well as market uncertainty, availability of NGL transportation and fractionation capacity and a variety of additional factors that are beyond our control. G&P segment profitability is affected by prevailing commodity prices primarily as a result of processing at our own or third‑party processing plants, purchasing and selling or gathering and transporting volumes of natural gas at index‑related prices and the cost of third‑party transportation and fractionation services. To the extent that commodity prices influence the level of natural gas drilling by our producer customers, such prices also affect profitability.
Significant Financial and Other Highlights
Significant financial highlights for the three months ended June 30,March 31, 2024 and March 31, 2023 and June 30, 2022 are shown in the chart below. Refer to the Results of Operations, the Liquidity and Capital Resources, and Non-GAAP Financial Information sections for further information.
(1) Non-GAAP measure. See reconciliations that follow for the most directly comparable GAAP measures.
Other Highlights
•Returned $799 million and $1,620$951 million of capital to unitholders in the three and six months ended June 30, 2023, in the form of distributions.March 31, 2024, via distributions and unit repurchases.
•Announced a secondfirst quarter 20232024 distribution of $0.7750$0.850 per common unit.
Current Economic Environment
In an effort to ease inflationBrought our 200 mmcf/d Harmon Creek ll processing plant online in support of its monetary policy goals, the Federal Reserve has raised interest rates multiple times throughout 2022 and 2023. We cannot predict the effect of higher interest rates, the concern of a recession, or the impact of inflation and fuel prices on demand for our services. InMarcellus in response to this business environment, MPLX remains focusedproducer demand.
•Progressed our long-term growth strategy through the acquisition of additional ownership interest in existing joint ventures and gathering assets in the Utica basin (“Utica Midstream Acquisition”).
•Additionally, on executing its strategic prioritiesMarch 26, 2024, we entered into a definitive agreement to strategically combine the Whistler Pipeline and Rio Bravo Pipeline project in a newly formed joint venture. This will expand our Permian natural gas value chain, increasing our footprint in the region for future growth. The transaction is expected to close in the second quarter of strict capital discipline, fostering2024, subject to receipt of required regulatory approvals and satisfaction of other customary closing conditions.
Succession Planning
As previously disclosed, MPC maintains a low-cost culture, and portfolio optimization. Also,mandatory retirement policy that, absent a waiver or extension, requires an executive officer to retire from service to the extent permitted by regulationscompany coincident with, or immediately following, the first of the month after such executive officer reaches age 65 (the "Policy"). Michael J. Hennigan, President and Chief Executive Officer of our existing agreements, manygeneral partner, as well as the Chief Executive Officer of which provide for inflation-based adjustments, we have increasedMPC, will reach mandatory retirement on August 1, 2024. Accordingly, the fees we charge our customers to reflect higher levelsMPC Board of inflation.Directors, with a focus on the long-term strategic direction of the company, is engaged in appropriate succession planning
activities, including, among other customary steps, the review of succession candidates, as well as consideration of any waiver or extension of the Policy respecting Mr. Hennigan.
Non-GAAP Financial Information
Our management uses a variety of financial and operating metrics to analyze our performance. These metrics are significant factors in assessing our operating results and profitability and include the non-GAAP financial measures of Adjusted EBITDA, DCF, adjusted free cash flow (“Adjusted FCF”), and Adjusted FCF after distributions. The amount of
Adjusted EBITDA is a financial performance measure used by management, industry analysts, investors, lenders, and DCF generated is considered byrating agencies to assess the board of directorsfinancial performance and operating results of our general partner in approving MPLX’s cash distributions.
ongoing business operations. Additionally, we believe adjusted EBITDA provides useful information to investors for trending, analyzing and benchmarking our operating results from period to period as compared to other companies that may have different financing and capital structures. We define Adjusted EBITDA as net income adjusted for: (i) provision for income taxes; (ii) net interest and other financial costs; (iii) depreciation and amortization; (iv) income/(loss) from equity method investments; (v) distributions and adjustments related to equity method investments; (vi) gain on sales-type leases; (vii) impairment expense; (viii)(vii) noncontrolling interests; and (ix)(viii) other adjustments, as applicable.
DCF is a financial performance and liquidity measure used by management and by the board of directors of our general partner as a key component in the determination of cash distributions paid to unitholders. We also usebelieve DCF which weis an important financial measure for unitholders as an indicator of cash return on investment and to evaluate whether the partnership is generating sufficient cash flow to support quarterly distributions. In addition, DCF is commonly used by the investment community because the market value of publicly traded partnerships is based, in part, on DCF and cash distributions paid to unitholders. We define DCF as Adjusted EBITDA adjusted for: (i) deferred revenue impacts; (ii) sales-type lease payments, net of income; (iii) adjusted net interest and other financial costs; (iv) net maintenance capital expenditures; (v) equity method investment capital expenditures paid out; and (vi) other adjustments as deemed necessary.
Adjusted FCF and Adjusted FCF after distributions are financial liquidity measures used by management in the allocation of capital and to assess financial performance. We believe that unitholders may use this metric to analyze our ability to manage leverage and return capital. We define Adjusted FCF as net cash provided by operating activities adjusted for: (i) net cash used in investing activities; (ii) cash contributions from MPC; and (iii) cash distributions to noncontrolling interests. We define Adjusted FCF after distributions as Adjusted FCF less base distributions to common and preferred unitholders.
We believe that the presentation of Adjusted EBITDA, DCF, Adjusted FCF and Adjusted FCF after distributions provides useful information to investors in assessing our financial condition and results of operations. The GAAP measures most directly comparable to Adjusted EBITDA and DCF are net income and net cash provided by operating activities while the GAAP measure
most directly comparable to Adjusted FCF and Adjusted FCF after distributions is net cash provided by operating activities. These non-GAAP financial measures should not be considered alternatives to GAAP net income or net cash provided by operating activities as they have important limitations as analytical tools because they exclude some but not all items that affect net income and net cash provided by operating activities or any other measure of financial performance or liquidity presented in accordance with GAAP. These non-GAAP financial measures should not be considered in isolation or as substitutes for analysis of our results as reported under GAAP. Additionally, because non-GAAP financial measures may be defined differently by other companies in our industry, our definitions may not be comparable to similarly titled measures of other companies, thereby diminishing their utility. For a reconciliation of Adjusted EBITDA and DCF to their most directly comparable measures calculated and presented in accordance with GAAP, see Results of Operations. For a reconciliation of Adjusted FCF and Adjusted FCF after distributions to their most directly comparable measure calculated and presented in accordance with GAAP, see Liquidity and Capital Resources.
During the normal course of business, we amend or modify our contractual agreements with customers. These amendments or modifications require the agreements to be reassessed under ASU No. 2016-02, Leases (“ASC 842”), which can impact the classification of revenues or costs associated with the agreement. These reassessments may impact the comparability of our financial results.
Results of Operations
The following tables and discussion summarize our results of operations, including a reconciliation of Adjusted EBITDA and DCF from Net income and Net cash provided by operating activities, to the most directly comparable GAAP financial measures. This discussion should be read in conjunction with Item 1. Financial Statements and is intended to provide investors with a reasonable basis for assessing our historical operations, but should not serve as the only criteria for predicting our future performance.
| | | Three Months Ended June 30, | | Six Months Ended June 30, |
| (In millions) | 2023 | | 2022 | | Variance | | 2023 | | 2022 | | Variance |
| Revenues and other income: | | | | | | | | | | | |
| | (In millions) | |
| (In millions) | |
| (In millions) | |
| Revenues and other income: | |
| Revenues and other income: | |
| Revenues and other income: | |
| Total revenues and other income | |
| Total revenues and other income | |
| Total revenues and other income | Total revenues and other income | $ | 2,690 | | | $ | 2,940 | | | $ | (250) | | | $ | 5,403 | | | $ | 5,550 | | | $ | (147) | |
| Costs and expenses: | Costs and expenses: | |
| Costs and expenses: | |
| Costs and expenses: | |
| Cost of revenues (excludes items below) | |
| Cost of revenues (excludes items below) | |
| Cost of revenues (excludes items below) | Cost of revenues (excludes items below) | 348 | | | 323 | | | 25 | | | 656 | | | 610 | | | 46 | |
| Purchased product costs | Purchased product costs | 354 | | | 663 | | | (309) | | | 760 | | | 1,130 | | | (370) | |
| Purchased product costs | |
| Purchased product costs | |
| Rental cost of sales | |
| Rental cost of sales | |
| Rental cost of sales | Rental cost of sales | 20 | | | 42 | | | (22) | | | 40 | | | 79 | | | (39) | |
| Rental cost of sales - related parties | Rental cost of sales - related parties | 9 | | | 19 | | | (10) | | | 16 | | | 34 | | | (18) | |
| Rental cost of sales - related parties | |
| Rental cost of sales - related parties | |
| Purchases - related parties | |
| Purchases - related parties | |
| Purchases - related parties | Purchases - related parties | 357 | | | 351 | | | 6 | | | 718 | | | 670 | | | 48 | |
| Depreciation and amortization | Depreciation and amortization | 310 | | | 310 | | | — | | | 606 | | | 623 | | | (17) | |
| Depreciation and amortization | |
| Depreciation and amortization | |
| General and administrative expenses | |
| General and administrative expenses | |
| General and administrative expenses | General and administrative expenses | 89 | | | 82 | | | 7 | | | 178 | | | 160 | | | 18 | |
| Other taxes | Other taxes | 28 | | | 33 | | | (5) | | | 58 | | | 67 | | | (9) | |
| Other taxes | |
| Other taxes | |
| Total costs and expenses | |
| Total costs and expenses | |
| Total costs and expenses | Total costs and expenses | 1,515 | | | 1,823 | | | (308) | | | 3,032 | | | 3,373 | | | (341) | |
| Income from operations | Income from operations | 1,175 | | | 1,117 | | | 58 | | | 2,371 | | | 2,177 | | | 194 | |
| Related-party interest and other financial costs | — | | | 1 | | | (1) | | | — | | | 5 | | | (5) | |
| Interest expense, net of amounts capitalized | 226 | | | 212 | | | 14 | | | 450 | | | 410 | | | 40 | |
| Other financial costs | 7 | | | 20 | | | (13) | | | 26 | | | 40 | | | (14) | |
| Income from operations | |
| Income from operations | |
| Net interest and other financial costs | |
| Net interest and other financial costs | |
| Net interest and other financial costs | |
| Income before income taxes | |
| Income before income taxes | |
| Income before income taxes | Income before income taxes | 942 | | | 884 | | | 58 | | | 1,895 | | | 1,722 | | | 173 | |
| Provision for income taxes | Provision for income taxes | — | | | — | | | — | | | 1 | | | 5 | | | (4) | |
| Provision for income taxes | |
| Provision for income taxes | |
| Net income | |
| Net income | |
| Net income | Net income | 942 | | | 884 | | | 58 | | | 1,894 | | | 1,717 | | | 177 | |
| Less: Net income attributable to noncontrolling interests | Less: Net income attributable to noncontrolling interests | 9 | | | 9 | | | — | | | 18 | | | 17 | | | 1 | |
| Less: Net income attributable to noncontrolling interests | |
| Less: Net income attributable to noncontrolling interests | |
| Net income attributable to MPLX LP | |
| Net income attributable to MPLX LP | |
| Net income attributable to MPLX LP | Net income attributable to MPLX LP | 933 | | | 875 | | | 58 | | | 1,876 | | | 1,700 | | | 176 | |
| Adjusted EBITDA attributable to MPLX LP(1) | Adjusted EBITDA attributable to MPLX LP(1) | 1,531 | | | 1,457 | | | 74 | | | 3,050 | | | 2,850 | | | 200 | |
| Adjusted EBITDA attributable to MPLX LP(1) | |
| Adjusted EBITDA attributable to MPLX LP(1) | |
DCF attributable to MPLX(1) | DCF attributable to MPLX(1) | $ | 1,315 | | | $ | 1,237 | | | $ | 78 | | | $ | 2,583 | | | $ | 2,447 | | | $ | 136 | |
DCF attributable to MPLX(1) | |
DCF attributable to MPLX(1) | |
(1) Non-GAAP measure. See reconciliation below to the most directly comparable GAAP measures.
| | | |
| | | | Three Months Ended June 30, | | Six Months Ended June 30, |
| (In millions) | (In millions) | 2023 | | 2022 | | Variance | | 2023 | | 2022 | | Variance |
| (In millions) | |
| (In millions) | |
| Reconciliation of Adjusted EBITDA attributable to MPLX LP and DCF attributable to GP and LP unitholders from Net income: | |
| Reconciliation of Adjusted EBITDA attributable to MPLX LP and DCF attributable to GP and LP unitholders from Net income: | |
| Reconciliation of Adjusted EBITDA attributable to MPLX LP and DCF attributable to GP and LP unitholders from Net income: | Reconciliation of Adjusted EBITDA attributable to MPLX LP and DCF attributable to GP and LP unitholders from Net income: | | | | | | | | | | | |
| Net income | Net income | $ | 942 | | | $ | 884 | | | $ | 58 | | | $ | 1,894 | | | $ | 1,717 | | | $ | 177 | |
| Net income | |
| Net income | |
| Provision for income taxes | Provision for income taxes | — | | | — | | | — | | | 1 | | | 5 | | | (4) | |
| Interest and other financial costs | 233 | | | 233 | | | — | | | 476 | | | 455 | | | 21 | |
| Provision for income taxes | |
| Provision for income taxes | |
| Net interest and other financial costs | |
| Net interest and other financial costs | |
| Net interest and other financial costs | |
| Income from operations | |
| Income from operations | |
| Income from operations | Income from operations | 1,175 | | | 1,117 | | | 58 | | | 2,371 | | | 2,177 | | | 194 | |
| Depreciation and amortization | Depreciation and amortization | 310 | | | 310 | | | — | | | 606 | | | 623 | | | (17) | |
| Depreciation and amortization | |
| Depreciation and amortization | |
| Income from equity method investments | |
| Income from equity method investments | |
| Income from equity method investments | Income from equity method investments | (145) | | | (111) | | | (34) | | | (279) | | | (210) | | | (69) | |
| Distributions/adjustments related to equity method investments | Distributions/adjustments related to equity method investments | 190 | | | 152 | | | 38 | | | 343 | | | 284 | | | 59 | |
| Distributions/adjustments related to equity method investments | |
| Distributions/adjustments related to equity method investments | |
| Other(1) | |
| Other(1) | |
| | Other(1) | Other(1) | 11 | | | (1) | | | 12 | | | 29 | | | (5) | | | 34 | |
| Adjusted EBITDA | Adjusted EBITDA | 1,541 | | | 1,467 | | | 74 | | | 3,070 | | | 2,869 | | | 201 | |
| Adjusted EBITDA | |
| Adjusted EBITDA | |
| Adjusted EBITDA attributable to noncontrolling interests | |
| Adjusted EBITDA attributable to noncontrolling interests | |
| Adjusted EBITDA attributable to noncontrolling interests | Adjusted EBITDA attributable to noncontrolling interests | (10) | | | (10) | | | — | | | (20) | | | (19) | | | (1) | |
| Adjusted EBITDA attributable to MPLX LP | Adjusted EBITDA attributable to MPLX LP | 1,531 | | | 1,457 | | | 74 | | | 3,050 | | | 2,850 | | | 200 | |
| Adjusted EBITDA attributable to MPLX LP | |
| Adjusted EBITDA attributable to MPLX LP | |
| Deferred revenue impacts | |
| Deferred revenue impacts | |
| Deferred revenue impacts | Deferred revenue impacts | 28 | | | 24 | | | 4 | | | 40 | | | 48 | | | (8) | |
| Sales-type lease payments, net of income | Sales-type lease payments, net of income | 2 | | | 5 | | | (3) | | | 6 | | | 10 | | | (4) | |
Net interest and other financial costs(2) | (221) | | | (215) | | | (6) | | | (438) | | | (419) | | | (19) | |
| Sales-type lease payments, net of income | |
| Sales-type lease payments, net of income | |
Adjusted net interest and other financial costs(2) | |
Adjusted net interest and other financial costs(2) | |
Adjusted net interest and other financial costs(2) | |
| Maintenance capital expenditures, net of reimbursements | |
| Maintenance capital expenditures, net of reimbursements | |
| Maintenance capital expenditures, net of reimbursements | Maintenance capital expenditures, net of reimbursements | (21) | | | (39) | | | 18 | | | (65) | | | (53) | | | (12) | |
| Equity method investment maintenance capital expenditures paid out | Equity method investment maintenance capital expenditures paid out | (2) | | | (3) | | | 1 | | | (7) | | | (6) | | | (1) | |
| Equity method investment maintenance capital expenditures paid out | |
| Equity method investment maintenance capital expenditures paid out | |
| Other | |
| Other | |
| Other | Other | (2) | | | 8 | | | (10) | | | (3) | | | 17 | | | (20) | |
| DCF attributable to MPLX LP | DCF attributable to MPLX LP | 1,315 | | | 1,237 | | | 78 | | | 2,583 | | | 2,447 | | | 136 | |
| DCF attributable to MPLX LP | |
| DCF attributable to MPLX LP | |
| Preferred unit distributions | |
| Preferred unit distributions | |
| Preferred unit distributions | Preferred unit distributions | (23) | | | (31) | | | 8 | | | (51) | | | (63) | | | 12 | |
| DCF attributable to GP and LP unitholders | DCF attributable to GP and LP unitholders | $ | 1,292 | | | $ | 1,206 | | | $ | 86 | | | $ | 2,532 | | | $ | 2,384 | | | $ | 148 | |
| DCF attributable to GP and LP unitholders | |
| DCF attributable to GP and LP unitholders | |
(1) Includes unrealized derivative gain/(loss), non-cash equity-based compensation and other miscellaneous items.
(2) ExcludesRepresents Net interest and other financial costs excluding gain/loss on extinguishment of debt and amortization of deferred financing costs.
| | | |
| | | | Three Months Ended June 30, | | Six Months Ended June 30, |
| (In millions) | (In millions) | 2023 | | 2022 | | Variance | | 2023 | | 2022 | | Variance |
| (In millions) | |
| (In millions) | |
| Reconciliation of Adjusted EBITDA attributable to MPLX LP and DCF attributable to GP and LP unitholders from Net cash provided by operating activities: | |
| Reconciliation of Adjusted EBITDA attributable to MPLX LP and DCF attributable to GP and LP unitholders from Net cash provided by operating activities: | |
| Reconciliation of Adjusted EBITDA attributable to MPLX LP and DCF attributable to GP and LP unitholders from Net cash provided by operating activities: | Reconciliation of Adjusted EBITDA attributable to MPLX LP and DCF attributable to GP and LP unitholders from Net cash provided by operating activities: | | | | | | | | | | | |
| Net cash provided by operating activities | Net cash provided by operating activities | $ | 1,437 | | | $ | 1,487 | | | $ | (50) | | | $ | 2,664 | | | $ | 2,612 | | | $ | 52 | |
| Net cash provided by operating activities | |
| Net cash provided by operating activities | |
| Changes in working capital items | |
| Changes in working capital items | |
| Changes in working capital items | Changes in working capital items | (160) | | | (266) | | | 106 | | | (112) | | | (148) | | | 36 | |
| All other, net | All other, net | 6 | | | 9 | | | (3) | | | (3) | | | (36) | | | 33 | |
| All other, net | |
| All other, net | |
| Loss on extinguishment of debt | Loss on extinguishment of debt | — | | | — | | | — | | | 9 | | | — | | | 9 | |
Net interest and other financial costs(1) | 221 | | | 215 | | | 6 | | | 438 | | | 419 | | | 19 | |
| Loss on extinguishment of debt | |
| Loss on extinguishment of debt | |
Adjusted net interest and other financial costs(1) | |
Adjusted net interest and other financial costs(1) | |
Adjusted net interest and other financial costs(1) | |
| Other adjustments to equity method investment distributions | |
| Other adjustments to equity method investment distributions | |
| Other adjustments to equity method investment distributions | |
| | Other | |
| | Other | |
| | Other adjustments to equity method investment distributions | (1) | | | 14 | | | (15) | | | 12 | | | 26 | | | (14) | |
| Other | Other | 38 | | | 8 | | | 30 | | | 62 | | | (4) | | | 66 | |
| Adjusted EBITDA | Adjusted EBITDA | 1,541 | | | 1,467 | | | 74 | | | 3,070 | | | 2,869 | | | 201 | |
| Adjusted EBITDA | |
| Adjusted EBITDA | |
| Adjusted EBITDA attributable to noncontrolling interests | Adjusted EBITDA attributable to noncontrolling interests | (10) | | | (10) | | | — | | | (20) | | | (19) | | | (1) | |
| | Adjusted EBITDA attributable to noncontrolling interests | |
| Adjusted EBITDA attributable to noncontrolling interests | |
| Adjusted EBITDA attributable to MPLX LP | |
| Adjusted EBITDA attributable to MPLX LP | |
| Adjusted EBITDA attributable to MPLX LP | Adjusted EBITDA attributable to MPLX LP | 1,531 | | | 1,457 | | | 74 | | | 3,050 | | | 2,850 | | | 200 | |
| Deferred revenue impacts | Deferred revenue impacts | 28 | | | 24 | | | 4 | | | 40 | | | 48 | | | (8) | |
| Deferred revenue impacts | |
| Deferred revenue impacts | |
| Sales-type lease payments, net of income | Sales-type lease payments, net of income | 2 | | | 5 | | | (3) | | | 6 | | | 10 | | | (4) | |
Net interest and other financial costs(1) | (221) | | | (215) | | | (6) | | | (438) | | | (419) | | | (19) | |
| Sales-type lease payments, net of income | |
| Sales-type lease payments, net of income | |
Adjusted net interest and other financial costs(1) | |
Adjusted net interest and other financial costs(1) | |
Adjusted net interest and other financial costs(1) | |
| Maintenance capital expenditures, net of reimbursements | |
| Maintenance capital expenditures, net of reimbursements | |
| Maintenance capital expenditures, net of reimbursements | Maintenance capital expenditures, net of reimbursements | (21) | | | (39) | | | 18 | | | (65) | | | (53) | | | (12) | |
| Equity method investment maintenance capital expenditures paid out | Equity method investment maintenance capital expenditures paid out | (2) | | | (3) | | | 1 | | | (7) | | | (6) | | | (1) | |
| Equity method investment maintenance capital expenditures paid out | |
| Equity method investment maintenance capital expenditures paid out | |
| Other | |
| Other | |
| Other | Other | (2) | | | 8 | | | (10) | | | (3) | | | 17 | | | (20) | |
| DCF attributable to MPLX LP | DCF attributable to MPLX LP | 1,315 | | | 1,237 | | | 78 | | | 2,583 | | | 2,447 | | | 136 | |
| DCF attributable to MPLX LP | |
| DCF attributable to MPLX LP | |
| Preferred unit distributions | |
| Preferred unit distributions | |
| Preferred unit distributions | Preferred unit distributions | (23) | | | (31) | | | 8 | | | (51) | | | (63) | | | 12 | |
| DCF attributable to GP and LP unitholders | DCF attributable to GP and LP unitholders | $ | 1,292 | | | $ | 1,206 | | | $ | 86 | | | $ | 2,532 | | | $ | 2,384 | | | $ | 148 | |
| DCF attributable to GP and LP unitholders | |
| DCF attributable to GP and LP unitholders | |
(1) ExcludesRepresents Net interest and other financial costs excluding gain/loss on extinguishment of debt and amortization of deferred financing costs.
Three months ended June 30, 2023 compared to three months ended June 30, 2022
Total revenues and other income decreased $250 million in the second quarter of 2023 compared to the same period of 2022. The decrease was driven by lower product sales revenue as a result of lower NGL prices during the second quarter of 2023 as compared to the same period of 2022. The decrease was partially offset by higher throughput and rate escalations across the business and a $34 million increase in income from equity method investments primarily due to higher throughput.
Cost of revenues increased $25 million and rental cost of sales (including related party) decreased $32 million in the second quarter of 2023 compared to the same period of 2022. These offsetting variances reflect the modification of a gathering and compression agreement in the third quarter of 2022 (“Third-Party Lease Modification”) which resulted in a change in the presentation of expenses from rental cost of sales to cost of revenues.
Purchased product costs decreased $309 million in the second quarter of 2023 compared to the same period of 2022. This was primarily due to lower NGL prices of $393 million, partially offset by higher volumes of $90 million.
Interest expense, net of amounts capitalized increased $14 million in the second quarter of 2023 compared to the same period of 2022. This was primarily due to refinancing maturing debt with fixed rate debt at higher interest rates in 2022 and 2023 in addition to taking on incremental debt in order to finance the redemption of the Series B preferred units in the first quarter of 2023. Other financial costs also benefited from higher interest earned during the second quarter of 2023. Refer to the Liquidity and Capital Resources section for further information.
Six months ended June 30, 2023 compared to six months ended June 30, 2022
Total revenues and other income decreased $147 million in the first sixmonths of 2023 compared to the same period of 2022. The decrease was driven by lower product sales revenue as a result of lower NGL prices during the first six months of 2023 as compared to the same period of 2022. The decrease was partially offset by higher throughput and rate escalations across the business and a $69 million increase in income from equity method investments primarily due to higher throughput.
Cost ofThree months ended March 31, 2024 compared to three months ended March 31, 2023
Total revenues and other income increased $46 million and rental cost of sales (including related party) decreased $57$133 million in the first sixmonthsquarter of 20232024 compared to the same period of 2022. These offsetting variances reflect2023. The increase was driven by rate escalations, increased income due to higher throughput from our equity method investments, an increase of $23 million as a result of the modificationconsolidation of MarkWest Torñado GP, L.L.C. (“Torñado”) in December 2023 (the “Torñado Acquisition”), and a gathering$43 million increase in Other Income related to business interruption insurance proceeds and compression agreementa gain related to an equity method investment acquisition. Offsetting these increases were decreases in product sales revenue of $41 million, primarily related to lower NGL prices, and lower pipeline throughput during the thirdfirst quarter of 2022 (“Third-Party Lease Modification”) which resulted in a change in the presentation2024.
Cost of expenses from rental cost of sales to cost of revenues.
Purchased product costs decreased $370revenues increased $63 million in the first six monthsquarter of 20232024 compared to the same period of 2022.2023. This increase is attributable to higher operating costs and repairs and maintenance costs of $42 million in addition to $14 million of incremental costs related to the consolidation of Torñado in December 2023.
Purchased product costs decreased $37 million in the first quarter of 2024 compared to the same period of 2023. This was primarily due to lower NGL volumes of $23 million and lower NGL prices of $550 million, partially offset by higher volumes of $172$18 million.
Purchases - related partiesDepreciation and amortization increased $48$21 million in the first six monthsquarter of 20232024 compared to the same period of 2022.2023. This was primarily due to higher related-party purchased product costsincremental depreciation associated with assets acquired in conjunction with the Torñado Acquisition, as well as other assets placed in service subsequent to the first quarter of 2023.
General and higher transportation costs.
Depreciation and amortization decreased $17administrative expenses increased $20 million in the first sixthree months of 20232024 compared to the same period of 2022. This was primarily due to lower depreciation as a result of the derecognition of fixed assets in connection with the Third-Party Lease Modification in the third quarter of 2022. This decrease was partially offset by depreciation on new assets placed in service after the second quarter of 2022 and accelerated depreciation related to idled assets.
General and administrative expenses increased $18 million in the first sixmonths of 2023, compared to the same period of 2022 due to increased contractor services costs and higher employee costs from MPC, primarily higher employee costs.MPC.
Interest expense, net of amounts capitalized increased $40 million in the first six months of 2023 compared to the same period of 2022. This was primarily due to refinancing debt with fixed rate debt at higher interest rates in 2022 and 2023 in addition to taking on incremental debt in order to finance the redemption of the Series B preferred units in the first quarter of 2023. Other financial costs also benefited from higher interest earned during 2023. Refer to the Liquidity and Capital Resources section for further information.
Segment Results
We classify our business in the following reportable segments: L&S and G&P. We evaluate the performance of our segments using Segment Adjusted EBITDA. Segment Adjusted EBITDA represents Adjusted EBITDA attributable to the reportable segments. Amounts included in net income and excluded from Segment Adjusted EBITDA include: (i) depreciation and amortization; (ii) net interest and other financial costs; (iii) income/(loss) from equity method investments; (iv) distributions and adjustments related to equity method investments; (v) gain on sales-type leases; (vi) impairment expense; (vii)(vi) noncontrolling interests; and (viii)(vii) other adjustments, as applicable. These items are either: (i) believed to be non-recurring in nature; (ii) not believed to be allocable or controlled by the segment; or (iii) are not tied to the operational performance of the segment.
The tables below present information about Segment Adjusted EBITDA for the reported segments for the three and six months ended June 30, 2023March 31, 2024 and June 30, 2022.March 31, 2023.
L&S Segment
SecondFirst Quarter L&S Segment Financial Highlights (in millions)
| | Three Months Ended June 30, | | Six Months Ended June 30, |
| Three Months Ended March 31, | |
| Three Months Ended March 31, | |
| Three Months Ended March 31, | |
| (In millions) | |
| (In millions) | |
| (In millions) | (In millions) | 2023 | | 2022 | | Variance | | 2023 | | 2022 | | Variance |
| Service revenue | Service revenue | $ | 1,060 | | | $ | 1,010 | | | $ | 50 | | | $ | 2,093 | | | $ | 1,993 | | | $ | 100 | |
| Service revenue | |
| Service revenue | |
| Rental income | |
| Rental income | |
| Rental income | Rental income | 210 | | | 208 | | | 2 | | | 422 | | | 383 | | | 39 | |
| Product related revenue | Product related revenue | 3 | | | 7 | | | (4) | | | 8 | | | 11 | | | (3) | |
| Product related revenue | |
| Product related revenue | |
| Sales-type lease revenue | |
| Sales-type lease revenue | |
| Sales-type lease revenue | Sales-type lease revenue | 125 | | | 114 | | | 11 | | | 250 | | | 225 | | | 25 | |
| Income from equity method investments | Income from equity method investments | 82 | | | 59 | | | 23 | | | 153 | | | 111 | | | 42 | |
| Income from equity method investments | |
| Income from equity method investments | |
| Other income | |
| Other income | |
| Other income | Other income | 18 | | | 22 | | | (4) | | | 32 | | | 34 | | | (2) | |
| Total segment revenues and other income | Total segment revenues and other income | 1,498 | | | 1,420 | | | 78 | | | 2,958 | | | 2,757 | | | 201 | |
| Total segment revenues and other income | |
| Total segment revenues and other income | |
| Cost of revenues | |
| Cost of revenues | |
| Cost of revenues | Cost of revenues | 158 | | | 159 | | | (1) | | | 293 | | | 300 | | | (7) | |
| Purchases - related parties | Purchases - related parties | 263 | | | 258 | | | 5 | | | 507 | | | 497 | | | 10 | |
| Purchases - related parties | |
| Purchases - related parties | |
| Depreciation and amortization | Depreciation and amortization | 140 | | | 129 | | | 11 | | | 269 | | | 259 | | | 10 | |
| Depreciation and amortization | |
| Depreciation and amortization | |
| General and administrative expenses | |
| General and administrative expenses | |
| General and administrative expenses | General and administrative expenses | 51 | | | 43 | | | 8 | | | 100 | | | 86 | | | 14 | |
| | Other taxes | Other taxes | 20 | | | 20 | | | — | | | 39 | | | 41 | | | (2) | |
| | Other taxes | |
| | Other taxes | |
| Total costs and expenses | Total costs and expenses | 632 | | | 609 | | | 23 | | | 1,208 | | | 1,183 | | | 25 | |
| Total costs and expenses | |
| Total costs and expenses | |
| | Segment Adjusted EBITDA | |
| | Segment Adjusted EBITDA | |
| | | | Segment Adjusted EBITDA | Segment Adjusted EBITDA | 1,022 | | | 966 | | | 56 | | | 2,048 | | | 1,870 | | | 178 | |
| Capital expenditures | Capital expenditures | 110 | | | 81 | | | 29 | | | 178 | | | 158 | | | 20 | |
| Capital expenditures | |
| Capital expenditures | |
Investments in unconsolidated affiliates(1) | Investments in unconsolidated affiliates(1) | $ | 1 | | | $ | 10 | | | $ | (9) | | | $ | 16 | | | $ | 78 | | | $ | (62) | |
Investments in unconsolidated affiliates(1) | |
Investments in unconsolidated affiliates(1) | |
(1) The sixthree months ended June 30, 2022March 31, 2024 includes a contribution of $60$92 million to oura joint venture (“Dakota Access”) that owns and operates the Dakota Access Pipeline and Energy Transfer Crude Oil Pipeline projects, collectively referred to as the Bakken Pipeline joint venturesystem or DAPL, to fund our share of a debt repayment by the joint venture.
Three months ended June 30, 2023March 31, 2024 compared to three months ended June 30, 2022
Service revenue increased $50$34 million in the secondfirst quarter of 20232024 compared to the same period of 2022.2023. This was primarily driven by $58 million of higher pipeline tariff rates, increased pipeline throughput, and $12 million from refining logistics fee escalations. The increase was partially offset by a $22 million decrease of $8 million from changes in the presentation of revenue between service revenue, rentalrelated to lower pipeline throughput.
Rental income and sales-type lease revenue as a result of modifications to agreements with MPC.
Sales-type lease revenue increased $11$12 million in the secondfirst quarter of 20232024 compared to the same period of 2022.2023. This was primarily due to an increase of $7 million from changes in the presentation of revenue between service revenue, rental income
and sales-type lease revenue as a result of modifications to agreements with MPC, as well as from $3 million fromdriven by refining logistics due to fee escalations.
Income from equity method investments increased $23$18 million in the secondfirst quarter of 20232024 compared to the same period of 2022.2023. This was primarily driven by increased throughput on equity method investment pipeline systems.
Six months ended June 30, 2023 compared to six months ended June 30, 2022
Service revenueOther income increased $100$36 million in the first six monthsquarter of 20232024 compared to the same period of 2022.2023. This was primarily due to business interruption insurance proceeds and changes in presentation driven by higher pipeline tariff rates, increased pipelinethroughput,and $17 million from refining logistics fee escalations. These increases were partially offset by a decreasemodification of $39 million from changesan agreement with MPC in the presentationfirst quarter of revenue between service revenue, rental income and sales-type lease revenue driven by modifications to agreements with MPC.2024.
Rental incomePurchases - related parties increased $39$23 million in the first six monthsquarter of 20232024 compared to the same period of 2022. This was2023, primarily due to an increase of $21 million from changes in the presentation of revenue between service revenue, rental income and sales-type lease revenue driven by modifications to agreementsmodification of an agreement with MPC. There was alsoMPC and increased revenue of $13 millionemployee costs from refining logistics primarily due to fee escalations.MPC.
Sales-type lease revenueGeneral and administrative expenses increased $25$17 million in the first sixthree months of 20232024 compared to the same period of 2022. This was primarily2023, due to an increase of $18 million from changes in the presentation of revenue between service revenue, rental incomeincreased contractor services costs and sales-type lease revenue as a result of modifications to agreements with MPC, as well as an increase of $7 million from refining logistics due to fee escalations.
Income from equity method investments increased $42 million in the first six months of 2023 compared to the same period of 2022. This was primarily driven by increased throughput on equity method investment pipeline systems.
General and administrative expenses increased $14 million in the first six months of 2023 compared to the same period of 2022, due to increased costs from MPC, primarily higher employee costs.
L&S Operating Data
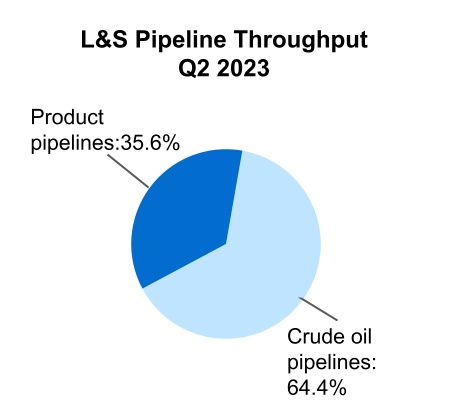
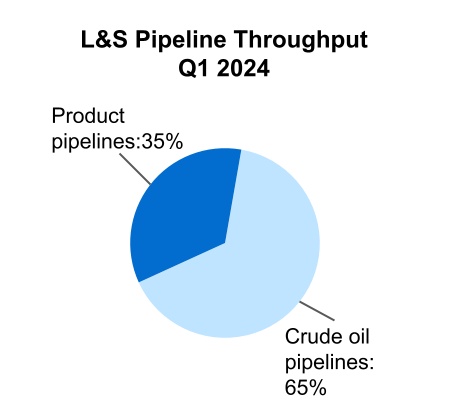
| | Three Months Ended
June 30, | | Six Months Ended
June 30, |
| 2023 | | 2022 | | 2023 | | 2022 |
| Three Months Ended
March 31, | |
| Three Months Ended
March 31, | |
| Three Months Ended
March 31, | |
| 2024 | |
| 2024 | |
| 2024 | |
| L&S | |
| L&S | |
| L&S | L&S | | | | | | | |
| Pipeline throughput (mbpd) | Pipeline throughput (mbpd) | |
| Pipeline throughput (mbpd) | |
| Pipeline throughput (mbpd) | |
| Crude oil pipelines | |
| Crude oil pipelines | |
| Crude oil pipelines | Crude oil pipelines | 3,834 | | | 3,674 | | | 3,739 | | | 3,527 | |
| Product pipelines | Product pipelines | 2,118 | | | 2,247 | | | 2,053 | | | 2,103 | |
| Product pipelines | |
| Product pipelines | |
| Total pipelines | |
| Total pipelines | |
| Total pipelines | Total pipelines | 5,952 | | | 5,921 | | | 5,792 | | | 5,630 | |
| Average tariff rates ($ per barrel)(1) | Average tariff rates ($ per barrel)(1) | |
| Average tariff rates ($ per barrel)(1) | |
| Average tariff rates ($ per barrel)(1) | |
| Crude oil pipelines | |
| Crude oil pipelines | |
| Crude oil pipelines | Crude oil pipelines | $ | 0.93 | | | $ | 0.86 | | | $ | 0.93 | | | $ | 0.89 | |
| Product pipelines | Product pipelines | 0.81 | | | 0.77 | | | 0.83 | | | 0.80 | |
| Product pipelines | |
| Product pipelines | |
| Total pipelines | Total pipelines | $ | 0.89 | | | $ | 0.82 | | | $ | 0.89 | | | $ | 0.85 | |
| Total pipelines | |
| Total pipelines | |
| | Terminal throughput (mbpd) | |
| | Terminal throughput (mbpd) | |
| | Terminal throughput (mbpd) | Terminal throughput (mbpd) | 3,180 | | | 3,101 | | | 3,136 | | | 3,021 | |
| | Marine Assets (number in operation)(2) | Marine Assets (number in operation)(2) | |
| Marine Assets (number in operation)(2) | |
| Marine Assets (number in operation)(2) | |
| Barges | |
| Barges | |
| Barges | Barges | 307 | | | 296 | | | 307 | | | 296 | |
| Towboats | Towboats | 27 | | | 23 | | | 27 | | | 23 | |
| Towboats | |
| Towboats | |
(1) Average tariff rates calculated using pipeline transportation revenues divided by pipeline throughput barrels. Transportation revenues include tariff and other fees, which may vary by region and nature of services provided.
(2) Represents total at end of period.
G&P Segment
SecondFirst Quarter G&P Segment Financial Highlights (in millions)
| | | | | | | | | | | | | | | | | | | | | | | | | | | | | | | | | | | |
| Three Months Ended June 30, | | Six Months Ended June 30, |
| (In millions) | 2023 | | 2022 | | Variance | | 2023 | | 2022 | | Variance |
| Service revenue | $ | 546 | | | $ | 505 | | | $ | 41 | | | $ | 1,071 | | | $ | 991 | | | $ | 80 | |
| Rental income | 52 | | | 92 | | | (40) | | | 103 | | | 173 | | | (70) | |
| Product related revenue | 467 | | | 860 | | | (393) | | | 1,031 | | | 1,521 | | | (490) | |
| Sales-type lease revenue | 33 | | | — | | | 33 | | | 67 | | | — | | | 67 | |
| Income from equity method investments | 63 | | | 52 | | | 11 | | | 126 | | | 99 | | | 27 | |
| Other income | 31 | | | 11 | | | 20 | | | 47 | | | 9 | | | 38 | |
| Total segment revenues and other income | 1,192 | | | 1,520 | | | (328) | | | 2,445 | | | 2,793 | | | (348) | |
| Cost of revenues | 219 | | | 225 | | | (6) | | | 419 | | | 423 | | | (4) | |
| Purchased product costs | 354 | | | 663 | | | (309) | | | 760 | | | 1,130 | | | (370) | |
| Purchases - related parties | 94 | | | 93 | | | 1 | | | 211 | | | 173 | | | 38 | |
| Depreciation and amortization | 170 | | | 181 | | | (11) | | | 337 | | | 364 | | | (27) | |
| General and administrative expenses | 38 | | | 39 | | | (1) | | | 78 | | | 74 | | | 4 | |
| Other taxes | 8 | | | 13 | | | (5) | | | 19 | | | 26 | | | (7) | |
| Total costs and expenses | 883 | | | 1,214 | | | (331) | | | 1,824 | | | 2,190 | | | (366) | |
| | | | | | | | | | | |
| | | | | | | | | | | |
| | | | | | | | | | | |
| | | | | | | | | | | |
| | | | | | | | | | | |
| | | | | | | | | | | |
| | | | | | | | | | | |
| | | | | | | | | | | |
| | | | | | | | | | | |
| Segment Adjusted EBITDA | 509 | | | 491 | | | 18 | | | 1,002 | | | 980 | | | 22 | |
| Capital expenditures | 143 | | | 95 | | | 48 | | | 266 | | | 190 | | | 76 | |
| Investments in unconsolidated affiliates | $ | 25 | | | $ | 36 | | | $ | (11) | | | $ | 61 | | | $ | 78 | | | $ | (17) | |
| | | | | | | | | | | | | | | | | | | | | | | |
| Three Months Ended March 31, | | |
| (In millions) | 2024 | | 2023 | | Variance | | | | | | |
| Service revenue | $ | 577 | | | $ | 525 | | | $ | 52 | | | | | | | |
| Rental income | 53 | | | 51 | | | 2 | | | | | | | |
| Product related revenue | 523 | | | 564 | | | (41) | | | | | | | |
| Sales-type lease revenue | 34 | | | 34 | | | — | | | | | | | |
| Income from equity method investments | 68 | | | 63 | | | 5 | | | | | | | |
| Other income | 35 | | | 16 | | | 19 | | | | | | | |
| Total segment revenues and other income | 1,290 | | | 1,253 | | | 37 | | | | | | | |
| Cost of revenues | 253 | | | 200 | | | 53 | | | | | | | |
| Purchased product costs | 369 | | | 406 | | | (37) | | | | | | | |
| Purchases - related parties | 105 | | | 117 | | | (12) | | | | | | | |
| Depreciation and amortization | 187 | | | 167 | | | 20 | | | | | | | |
| General and administrative expenses | 43 | | | 40 | | | 3 | | | | | | | |
| Other taxes | 14 | | | 11 | | | 3 | | | | | | | |
| Total costs and expenses | 971 | | | 941 | | | 30 | | | | | | | |
| | | | | | | | | | | |
| Segment Adjusted EBITDA | 537 | | | 493 | | | 44 | | | | | | | |
| Capital expenditures | 126 | | | 123 | | | 3 | | | | | | | |
| Investments in unconsolidated affiliates | $ | 27 | | | $ | 36 | | | $ | (9) | | | | | | | |
Three months ended June 30, 2023March 31, 2024 compared to three months ended June 30, 2022
Service revenue increased $41$52 million in the secondfirst quarter of 20232024 compared to the same period of 2022.2023. This was primarily due to higher volumes and higher throughput fee rates across all regions of $46 million in addition to an increase of $23 million driven by incremental revenues from the consolidation of Torñado in December 2023.
Product related revenue decreased $41 million in the first quarter of 2024 compared to the same period of 2023. This was primarily due to lower NGL prices across all regions of $45 million and lower NGL volumes in the Southwest of $20 million, partially offset by higher NGL volumes in the Rockies and Bakken of $26 million.
Income from equity method investments increased $5 million in the first quarter of 2024 compared to the same period of 2023. This was primarily due to higher volumes and higher throughput fee rates in the Utica and Marcellus and Rockies.of $13 million, partially offset by a $10 million decrease from the consolidation of operations as a result of the consolidation of Torñado in December 2023.
RentalOther income decreased $40 million and sales-type lease revenue increased $33$19 million in the secondfirst quarter of 20232024 compared to the same period of 2022. This was2023 primarily due to changes in the presentation of revenue between rental income and sales-type lease revenue as a result of the Third-Party Lease Modification in the third quarter of 2022 of $33 million. In addition, a contract modification decreased the amount of revenue allocated to Rental income in Southern Appalachia beginninggain on an equity method investment in the first quarter of 2023.2024.
Product related revenue decreased $393Cost of revenues increased $53 million in the secondfirst quarter of 20232024 compared to the same period of 2022.2023. This increase is attributable to higher operating costs and repairs and maintenance costs in the Marcellus, Rockies and Southwest of $42 million in addition to an increase of $14 million as a result of the consolidation of Torñado in December 2023.
Purchased product costs decreased $37 million in the first quarter of 2024 compared to the same period of 2023. This was primarily due to lower NGL prices across all regions of $450 million, partially offset by higher volumes in the Southwest of $49 million.
Income from equity method investments increased $11$23 million in the second quarter of 2023 compared to the same period of 2022. This was primarily due to higher volumes associated with several of our joint ventures in the Marcellus and Utica. Additionally, our joint venturelower NGL prices in the Southwest region added processing capacity in the fourth quarter of 2022 driving higher volumes over the prior period.
Other income increased $20Purchases - related parties decreased $12 million in the secondfirst quarter of 20232024 compared to the same period of 2022 due primarily2023. The decrease is attributable to a gain on disposal of assets recognizedlower pricing in the second quarter of 2023 of $13 million in addition to a loss on disposal of assets of $4 million recognized in the second quarter of 2022.Rockies partially offset by increased employee costs from MPC.
Cost of revenues decreased $6Depreciation and amortization increased $20 million in the secondfirst quarter of 20232024 compared to the same period of 2022. This decrease is attributable to lower operating costs and repairs and maintenance costs in the Rockies of $14 million, partially offset by higher operating costs in the Southwest of $8 million.
Purchased product costs decreased $309 million in the second quarter of 2023 compared to the same period of 2022.2023. This was primarily due to lower NGL prices of $393 million in the Southwest and Southern Appalachia, partially offset by higher volumes in the Southwest of $90 million.
Six months ended June 30, 2023 compared to six months ended June 30, 2022
Service revenue increased $80 million in the first six months of 2023 compared to the same period of 2022. This was primarily due to higher volumes, higher throughput fee rates and higher minimum volume commitments in the Marcellus and Rockies.
Rental income decreased $70 million and sales-type lease revenue increased $67 million in the first six months of 2023 compared to the same period of 2022. This was primarily due to changes in the presentation of revenue between rental income and sales-type lease revenue as a result of the Third-Party Lease Modification in the third quarter of 2022.
Product related revenue decreased $490 million in the first six months of 2023 compared to the same period of 2022. This was primarily due to lower prices across all regions of $648 million, partially offset by higher volumes in the Southwest of $147 million and changes in the fair value of our propane contracts of $10 million.
Income from equity method investments increased $27 million in the first six months of 2023 compared to the same period of 2022. This was primarily due to higher volumesincremental depreciation associated with several of our joint venturesassets acquired in the Marcellus and Utica. Additionally, our joint venture in the Southwest region added processing capacity in the fourth quarter of 2022 driving higher volumes over the prior period.
Other income increased $38 million in the first six months of 2023 compared to the same period of 2022 due primarily to a gain on disposal of assets recognized in the second quarter of 2023 of $13 million in addition to a loss on disposal of assets of $22 million recognized in the first half of 2022.
Purchased product costs decreased $370 million in the first six months of 2023 compared to the same period of 2022. This was primarily due to lower NGL prices of $550 million in the Southwest and Southern Appalachia, partially offset by higher volumes in the Southwest of $172 million.
Purchases - related parties increased $38 million in the first six months of 2023 compared to the same period of 2022. The increase is attributable to higher volumes and pricing on associated related-party purchased product costs in the Rockies and higher transportation costs from increased throughput in the Southwest.
Depreciation and amortization decreased $27 million in the first six months of 2023 compared to the same period of 2022. This was primarily due to lower depreciation as a result of the derecognition of fixed assets in connectionconjunction with the Third-Party Lease ModificationTorñado Acquisition in the third quarter of 2022. This decrease was partially offset by depreciation on newDecember 2023, as well as other assets placed in service aftersubsequent to the secondfirst quarter of 2022.2023.
G&P Operating Data
(1) Other includes Southern Appalachia, Bakken and Rockies Operations.
| | | | | | | | | | | | | | | | | | | | | | | |
| MPLX LP(1) | | MPLX LP Operated(2) |
| Three Months Ended
June 30, | | Three Months Ended
June 30, |
| 2023 | | 2022 | | 2023 | | 2022 |
| G&P | | | | | | | |
| Gathering Throughput (MMcf/d) | | | | | | | |
| Marcellus Operations | 1,321 | | | 1,287 | | | 1,321 | | | 1,287 | |
| Utica Operations | — | | | — | | | 2,326 | | | 1,943 | |
| Southwest Operations | 1,354 | | | 1,429 | | | 1,768 | | | 1,694 | |
| Bakken Operations | 160 | | | 148 | | | 160 | | | 148 | |
| Rockies Operations | 457 | | | 425 | | | 584 | | | 554 | |
| Total gathering throughput | 3,292 | | | 3,289 | | | 6,159 | | | 5,626 | |
| | | | | | | |
| Natural Gas Processed (MMcf/d) | | | | | | | |
| Marcellus Operations | 4,091 | | | 3,987 | | | 5,691 | | | 5,445 | |
| Utica Operations | — | | | — | | | 547 | | | 522 | |
| Southwest Operations | 1,517 | | | 1,449 | | | 1,848 | | | 1,638 | |
| Southern Appalachian Operations | 219 | | | 231 | | | 219 | | | 231 | |
| Bakken Operations | 159 | | | 142 | | | 159 | | | 142 | |
| Rockies Operations | 470 | | | 440 | | | 470 | | | 440 | |
| Total natural gas processed | 6,456 | | | 6,249 | | | 8,934 | | | 8,418 | |
| | | | | | | |
| C2 + NGLs Fractionated (mbpd) | | | | | | | |
Marcellus Operations(3) | 520 | | | 471 | | | 520 | | | 471 | |
Utica Operations(3) | — | | | — | | | 30 | | | 30 | |
| Southern Appalachian Operations | 11 | | | 12 | | | 11 | | | 12 | |
| Bakken Operations | 18 | | | 20 | | | 18 | | | 20 | |
| Rockies Operations | 4 | | | 3 | | | 4 | | | 3 | |
Total C2 + NGLs fractionated(4) | 553 | | | 506 | | | 583 | | | 536 | |
| | | | | | | | | | | | | | | | | | | | | | | |
| MPLX LP(1) | | MPLX LP Operated(2) |
| Six Months Ended
June 30, | | Six Months Ended
June 30, |
| 2023 | | 2022 | | 2023 | | 2022 |
| G&P | | | | | | | |
| Gathering Throughput (MMcf/d) | | | | | | | |
| Marcellus Operations | 1,342 | | | 1,300 | | | 1,342 | | | 1,300 | |
| Utica Operations | — | | | — | | | 2,393 | | | 1,879 | |
| Southwest Operations | 1,367 | | | 1,369 | | | 1,792 | | | 1,586 | |
| Bakken Operations | 158 | | | 147 | | | 158 | | | 147 | |
| Rockies Operations | 450 | | | 410 | | | 574 | | | 540 | |
| Total gathering throughput | 3,317 | | | 3,226 | | | 6,259 | | | 5,452 | |
| | | | | | | |
| Natural Gas Processed (MMcf/d) | | | | | | | |
| Marcellus Operations | 4,068 | | | 4,001 | | | 5,623 | | | 5,487 | |
| Utica Operations | — | | | — | | | 521 | | | 473 | |
| Southwest Operations | 1,460 | | | 1,416 | | | 1,784 | | | 1,589 | |
| Southern Appalachian Operations | 225 | | | 228 | | | 225 | | | 228 | |
| Bakken Operations | 156 | | | 143 | | | 156 | | | 143 | |
| Rockies Operations | 462 | | | 423 | | | 462 | | | 423 | |
| Total natural gas processed | 6,371 | | | 6,211 | | | 8,771 | | | 8,343 | |
| | | | | | | |
| C2 + NGLs Fractionated (mbpd) | | | | | | | |
Marcellus Operations(3) | 526 | | | 469 | | | 526 | | | 469 | |
Utica Operations(3) | — | | | — | | | 30 | | | 27 | |
| Southern Appalachian Operations | 11 | | | 11 | | | 11 | | | 11 | |
| Bakken Operations | 18 | | | 20 | | | 18 | | | 20 | |
| Rockies Operations | 3 | | | 4 | | | 3 | | | 4 | |
Total C2 + NGLs fractionated(4) | 558 | | | 504 | | | 588 | | | 531 | |
| | | | | | | | | | | | | | | | | | | | | | | |
| Three Months Ended
June 30, | | Six Months Ended
June 30, |
| 2023 | | 2022 | | 2023 | | 2022 |
| Pricing Information | | | | | | | |
| Natural Gas NYMEX HH ($ per MMBtu) | $ | 2.32 | | | $ | 7.50 | | | $ | 2.54 | | | $ | 6.04 | |
C2 + NGL Pricing ($ per gallon)(5) | $ | 0.63 | | | $ | 1.18 | | | $ | 0.70 | | | $ | 1.16 | |
| | | | | | | | | | | | | | | | | | | | | | | |
| MPLX LP(1) | | MPLX LP Operated(2) |
| Three Months Ended
March 31, | | Three Months Ended
March 31, |
| 2024 | | 2023 | | 2024 | | 2023 |
| G&P | | | | | | | |
| Gathering Throughput (MMcf/d) | | | | | | | |
| Marcellus Operations | 1,493 | | | 1,363 | | | 1,493 | | | 1,363 | |
| Utica Operations | — | | | — | | | 2,286 | | | 2,460 | |
| Southwest Operations | 1,601 | | | 1,381 | | | 1,601 | | | 1,816 | |
| Bakken Operations | 183 | | | 156 | | | 183 | | | 156 | |
| Rockies Operations | 562 | | | 442 | | | 663 | | | 564 | |
| Total gathering throughput | 3,839 | | | 3,342 | | | 6,226 | | | 6,359 | |
| | | | | | | |
| Natural Gas Processed (MMcf/d) | | | | | | | |
| Marcellus Operations | 4,325 | | | 4,045 | | | 5,926 | | | 5,553 | |
| Utica Operations | — | | | — | | | 777 | | | 494 | |
| Southwest Operations | 1,629 | | | 1,401 | | | 1,629 | | | 1,720 | |
| Southern Appalachia Operations | 221 | | | 230 | | | 221 | | | 230 | |
| Bakken Operations | 183 | | | 154 | | | 183 | | | 154 | |
| Rockies Operations | 635 | | | 454 | | | 635 | | | 454 | |
| Total natural gas processed | 6,993 | | | 6,284 | | | 9,371 | | | 8,605 | |
| | | | | | | |
| C2 + NGLs Fractionated (mbpd) | | | | | | | |
Marcellus Operations(3) | 553 | | | 533 | | | 553 | | | 533 | |
Utica Operations(3) | — | | | — | | | 44 | | | 28 | |
| Southern Appalachia Operations | 11 | | | 10 | | | 11 | | | 10 | |
| Bakken Operations | 19 | | | 19 | | | 19 | | | 19 | |
| Rockies Operations | 5 | | | 3 | | | 5 | | | 3 | |
Total C2 + NGLs fractionated(4) | 588 | | | 565 | | | 632 | | | 593 | |
(1) This column represents operating data for entities that have been consolidated into the MPLX financial statements.
(2) This column represents operating data for entities that have been consolidated into the MPLX financial statements as well as operating data for MPLX-operated equity method investments.
(3) Entities within the Marcellus and Utica Operations jointly own the Hopedale fractionation complex. Hopedale throughput is included in the Marcellus and Utica Operations and representrepresents each region’s utilization of the complex.
(4) Purity ethane makes up approximately 226255 mbpd and 189246 mbpd of MPLX LP consolidated total fractionated products for the three months ended June 30,March 31, 2024 and March 31, 2023, and June 30, 2022, respectively, and approximately 236 mbpd and 187 mbpd of total fractionated products for the six months ended June 30, 2023 and June 30, 2022, respectively. Purity ethane makes up approximately 232264 mbpd and 194253 mbpd of MPLX LP Operated total fractionated products for the three months ended June 30,March 31, 2024 and March 31, 2023, and June 30, 2022, respectively, and approximately 242 mbpd and 191 mbpdrespectively.
(5) | | | | | | | | | | | | | | | |
| Three Months Ended
March 31, | | |
| 2024 | | 2023 | | | | |
| Pricing Information | | | | | | | |
| Natural Gas NYMEX HH ($ per MMBtu) | $ | 2.09 | | | $ | 2.77 | | | | | |
C2 + NGL Pricing ($ per gallon)(1) | $ | 0.74 | | | $ | 0.77 | | | | | |
(1) C2 + NGL pricing based on Mont Belvieu prices assuming an NGL barrel of approximately 35 percent ethane, 35 percent propane, six percent Iso-Butane, 12 percent normal butane and 12 percent natural gasoline.
Seasonality
The volume of crude oil and refined products transported and stored utilizing our assets is affected by the level of supply and demand for crude oil and refined products in the markets served directly or indirectly by our assets. The majority of effects of seasonality on the L&S segment’s revenues are mitigated through the use of fee-based transportationcapacity-based agreements and storage services agreements with MPC that include minimum volume commitments.
In our G&P segment, we experience minimal impacts from seasonal fluctuations which impact the demand for natural gas and NGLs and the related commodity prices caused by various factors including variations in weather patterns from year to year. We are able to manage the seasonality impacts through the execution of our marketing strategy. Overall, our exposure to the seasonality fluctuations is limited due to the nature of our fee-based business.
Liquidity and Capital Resources
Cash Flows
Our cash and cash equivalents were $755$385 million at June 30, 2023March 31, 2024 and $238$1,048 million at December 31, 2022.2023. The change in cash and cash equivalents was due to the factors discussed below. Net cash provided by (used in) operating activities, investing activities and financing activities were as follows:
| | | | | | | | | | | |
| | Six Months Ended
June 30, |
| (In millions) | 2023 | | 2022 |
| Net cash provided by (used in): | | | |
| Operating activities | $ | 2,664 | | | $ | 2,612 | |
| Investing activities | (491) | | | (411) | |
| Financing activities | (1,656) | | | (1,916) | |
| Total | $ | 517 | | | $ | 285 | |
| | | | | | | | | | | |
| | Three Months Ended
March 31, |
| (In millions) | 2024 | | 2023 |
| Net cash provided by (used in): | | | |
| Operating activities | $ | 1,291 | | | $ | 1,227 | |
| Investing activities | (996) | | | (220) | |
| Financing activities | (958) | | | (852) | |
| Total | $ | (663) | | | $ | 155 | |
Net cash provided by operating activities increased $52$64 million in the first sixthree months of 20232024 compared to the same period of 2022,2023, primarily due to improved results from operations partially offset by higher favorable working capital changes during the first sixthree months of 20222024 compared to the same period of 2023.
Net cash used in investing activities increased $80$776 million in the first sixthree months of 20232024 compared to the same period of 2022,2023, primarily due to the Utica Midstream Acquisition in the first quarter of 2024, as well as higher capital spending. The increase in the first six monthsquarter of 2023 was partially offset by2024 also reflects higher contributions to equity method investments for the first half of 2022, which includedincluding a $60$92 million contribution to our Bakken Pipeline joint ventureDakota Access to fund our share of a scheduled debt repayment by the joint venture.
Net cash used in financing activities decreased $260increased $106 million in the first sixthree months of 20232024 compared to the same period of 2022.2023. The decreaseincrease was driven by net borrowings inprimarily due to the first halfreturn of 2023 as comparedcapital to net repayments in the first half of 2022, resulting in a decreased use of cash of $854 million. There was also lower spending onunitholders through the unit repurchase program of $135 million induring the first halfthree months of 20232024, as well as higher distributions paid to unitholders of $55 million during the first three months of 2024 compared to the same period of 2022. The decrease in the use of cash was partially offset by the use of $600 million to redeem the Series B units and by $127 million of higher distributions paid to unitholders during the first six months of 2023, compared to the same period of 2022, as a result of the 10 percent increase in our base distribution effective for the third quarter of 2022.2023.
Adjusted Free Cash Flow
The following table provides a reconciliation of Adjusted FCF and Adjusted FCF after distributions from net cash provided by operating activities for the three and six months ended June 30, 2023March 31, 2024 and June 30, 2022.March 31, 2023.
| | | Three Months Ended
June 30, | | Six Months Ended
June 30, |
| | Three Months Ended
March 31, | |
| | Three Months Ended
March 31, | |
| | Three Months Ended
March 31, | |
| (In millions) | |
| (In millions) | |
| (In millions) | (In millions) | | 2023 | | | 2022 | | 2023 | | 2022 |
Net cash provided by operating activities(1) | Net cash provided by operating activities(1) | | $ | 1,437 | | | | $ | 1,487 | | | $ | 2,664 | | | $ | 2,612 | |
Net cash provided by operating activities(1) | |
Net cash provided by operating activities(1) | |
| Adjustments to reconcile net cash provided by operating activities to adjusted free cash flow | Adjustments to reconcile net cash provided by operating activities to adjusted free cash flow | | | | |
| Net cash used in investing activities | | (271) | | | | (135) | | | (491) | | | (411) | |
| Adjustments to reconcile net cash provided by operating activities to adjusted free cash flow | |
| Adjustments to reconcile net cash provided by operating activities to adjusted free cash flow | |
Net cash used in investing activities(2) | |
Net cash used in investing activities(2) | |
Net cash used in investing activities(2) | |
| Contributions from MPC | |
| Contributions from MPC | |
| Contributions from MPC | Contributions from MPC | | 5 | | | | 7 | | | 13 | | | 17 | |
| | Distributions to noncontrolling interests | Distributions to noncontrolling interests | | (9) | | | | (10) | | | (19) | | | (19) | |
| Adjusted free cash flow | | 1,162 | | | | 1,349 | | | 2,167 | | | 2,199 | |
| | Distributions to noncontrolling interests | |
| | Distributions to noncontrolling interests | |
| Adjusted FCF | |
| Adjusted FCF | |
| Adjusted FCF | |
| | Distributions paid to common and preferred unitholders | Distributions paid to common and preferred unitholders | | (799) | | | | (735) | | | (1,620) | | | (1,493) | |
| Adjusted free cash flow after distributions | | $ | 363 | | | | $ | 614 | | | $ | 547 | | | $ | 706 | |
| | Distributions paid to common and preferred unitholders | |
| | Distributions paid to common and preferred unitholders | |
| Adjusted FCF after distributions | |
| Adjusted FCF after distributions | |
| Adjusted FCF after distributions | |
(1) The three months ended June 30, 2023March 31, 2024 and June 30, 2022March 31, 2023 include working capital drawsbuilds of $16062 million and $266$48 million, respectively. The six months ended June 30, 2023 and June 30, 2022 include working capital draws of $112 million and $148 million, respectively.
Debt and Liquidity Overview
On February 9, 2023, MPLX issued $1.6 billion aggregate principal amount of notes, consisting of $1.1 billion principal amount of 5.00 percent senior notes due 2033 (the “2033 Senior Notes”) and $500 million principal amount of 5.65 percent senior notes due 2053 (the “2053 Senior Notes”). The 2033 Senior Notes were offered at a price to the public of 99.170 percent of par with interest payable semi-annually in arrears, commencing on September 1, 2023. The 2053 Senior Notes were offered at a price to the public of 99.536 percent of par with interest payable semi-annually in arrears, commencing on September 1, 2023.
On February 15, 2023, MPLX used $600 million of the net proceeds from the offering of the 2033 Senior Notes and 2053 Senior Notes described above to redeem all of the outstanding Series B preferred units. On March 13, 2023, MPLX used the remaining proceeds from the offering, and cash on hand, to redeem all of MPLX’s and MarkWest’s $1.0 billion aggregate principal amount of 4.50 percent senior notes due July 2023, at par, plus accrued and unpaid interest.
Our intention is to maintain an investment-grade credit profile. As of June 30, 2023,March 31, 2024, the credit ratings on our senior unsecured debt were as follows:
| | | | | | | | |
| Rating Agency | | Rating |
| Moody’s | | Baa2 (stable outlook) |
| Standard & Poor’s | | BBB (stable outlook) |
| Fitch | | BBB (stable outlook) |
The ratings reflect the respective views of the rating agencies and should not be interpreted as a recommendation to buy, sell or hold our securities. Although it is our intention to maintain a credit profile that supports an investment grade rating, there is no assurance that these ratings will continue for any given period of time. The ratings may be revised or withdrawn entirely by the rating agencies if, in their respective judgments, circumstances so warrant. A rating from one rating agency should be evaluated independently of ratings from other rating agencies.
The agreements governing our debt obligations do not contain credit rating triggers that would result in the acceleration of interest, principal or other payments solely in the event that our credit ratings are downgraded. However, any downgrades in the credit ratings of our senior unsecured debt ratings to below investment grade ratings could, among other things, increase the applicable interest rates and other fees payable under the MPLX Credit Agreement and may limit our ability to obtain future financing, including refinancing existing indebtedness.
Our liquidity totaled $4.3$3.9 billion at June 30, 2023March 31, 2024 consisting of:
| | | | | | | | | | | | | | | | | |
| June 30, 2023 |
| (In millions) | Total Capacity | | Outstanding Borrowings | | Available
Capacity |
MPLX Credit Agreement(1) | $ | 2,000 | | | $ | — | | | $ | 2,000 | |
| | | | | |
| MPC Loan Agreement | 1,500 | | | — | | | 1,500 | |
| Total | $ | 3,500 | | | $ | — | | | 3,500 | |
| Cash and cash equivalents | | | | | 755 | |
| Total liquidity | | | | | $ | 4,255 | |
(1) Outstanding borrowings include less than $1 million in letters of credit outstanding under this facility.
| | | | | | | | | | | | | | | | | |
| March 31, 2024 |
| (In millions) | Total Capacity | | Outstanding Borrowings | | Available
Capacity |
| MPLX Credit Agreement | $ | 2,000 | | | $ | — | | | $ | 2,000 | |
| | | | | |
| MPC Loan Agreement | 1,500 | | | — | | | 1,500 | |
| Total | $ | 3,500 | | | $ | — | | | 3,500 | |
| Cash and cash equivalents | | | | | 385 | |
| Total liquidity | | | | | $ | 3,885 | |
We expect our ongoing sources of liquidity to include cash generated from operations and borrowings under our revolving credit facilities and access to capital markets. We believe that cash generated from these sources will be sufficient to meet our short-term and long-term funding requirements, including working capital requirements, capital expenditure requirements, contractual obligations, and quarterly cash distributions. Our material future obligations include interest on debt, payments of debt principal, purchase obligations including contracts to acquire plant, property and equipment, and our operating leases and service agreements. We may also, from time to time, repurchase our senior notes or preferred units in the open market, in tender offers, in privately negotiated transactions or otherwise in such volumes, at market prices and upon such other terms as we deem appropriate and execute unit repurchases under our unit repurchase program.
MPC manages our cash and cash equivalents on our behalf directly with third-party institutions as part of the treasury services that it provides to us under our omnibus agreement. From time to time, we may also consider utilizingutilize other sources of liquidity, including the formation of joint ventures or sales of non-strategic assets.
The MPLXMPLX’s credit agreement (the “MPLX Credit AgreementAgreement”) matures in July 2027 and contains certain representations and warranties, affirmative and restrictive covenants and events of default that we consider to be usual and customary for an agreement of this type. The financial covenant requires MPLX to maintain a ratio of Consolidated Total Debt as of the end of each fiscal quarter to Consolidated EBITDA (both as defined in the MPLX Credit Agreement) for the prior four fiscal quarters of no greater than 5.0 to 1.0 (or 5.5 to 1.0 during the six-month period following certain acquisitions). Consolidated EBITDA is subject to adjustments for certain acquisitions completed and capital projects undertaken during the relevant period. Other covenants restrict us and/or certain of our subsidiaries from incurring debt,
creating liens on assets and entering into transactions with affiliates. As of June 30, 2023,March 31, 2024, we were in compliance with this financial covenant with a ratio of Consolidated Total Debt to Consolidated EBITDA of 3.5 to 1.0, as well as all other covenants contained in the MPLX Credit Agreement.
Equity and Preferred Units Overview
Unit Repurchase Program
On August 2, 2022, we announced the board authorization for the repurchase of up to an additional $1.0 billion of MPLX common units held by the public. The authorization has no expiration date. We may utilize various methods to effect the repurchases, which could include open market repurchases, negotiated block transactions, tender offers, accelerated unit repurchases tender offers or open market solicitations for units, some of which may be effected through Rule 10b5-1 plans. The timing and amount of future repurchases if any, will dependdepends upon several factors, including market and business conditions, and such repurchases may be suspended, discontinued, or restarted at any time.
No | | | | | | | | | | | | | | | |
| Three Months Ended
March 31, | | |
| (In millions, except per unit data) | 2024 | | 2023 | | | | |
| Number of common units repurchased | 2 | | | — | | | | | |
Cash paid for common units repurchased(1) | $ | 75 | | | $ | — | | | | | |
Average cost per unit(1) | $ | 40.04 | | | $ | — | | | | | |
(1) Cash paid for common units were repurchased and average cost per unit includes commissions paid to brokers during the six months ended June 30, 2023. period.
As of June 30, 2023,March 31, 2024, we had $846$771 million remaining under the unit repurchase authorization.
RedemptionDuring the three months ended March 31, 2024, certain Series A preferred unitholders exercised their rights to convert their Series A preferred units into approximately 10 million common units. Approximately 17 million Series A preferred units remain outstanding as of theMarch 31, 2024. Series B Preferred Units
On February 15, 2023, MPLXA preferred unitholders exercised its righttheir rights to redeem all 600,000 outstandingconvert an additional 5 million Series A preferred units of 6.875 percent Fixed-to-Floating Rate Cumulative Redeemable Perpetual Preferred Units (the “Series B preferred units”). MPLX paid unitholders the Series B preferred unit redemption price of $1,000 per unit. See Note 5into common units subsequent to March 31, 2024, but prior to the unaudited consolidateddate the financial statements for more information.
Distributions on the Series B preferred units were payable semi-annually in arrears on the 15th day, or the first business day thereafter, of February and August of each year up to and including February 15, 2023. In accordance with these terms, MPLX made a final cash distribution of $21 million to Series B preferred unitholders on February 15, 2023, in conjunction with the redemption.
Distributions
We intend to pay a minimum quarterly distribution to the holders of our common units of $0.2625 per unit, or $1.05 per unit on an annualized basis, to the extent we have sufficient cash from our operations after the establishment of cash reserves and the payment of costs and expenses, including reimbursements of expenses to our general partner. The amount of distributions paid under our policy and the decision to make any distributions is determined by our general partner, taking into consideration the terms of our partnership agreement. Such minimum distribution would equate to $263 million per quarter, or $1,051 million per year, based on the number of common units outstanding at June 30, 2023.
On July 25, 2023,April 23, 2024, MPLX declared a cash distribution for the secondfirst quarter of 2023,2024, totaling $776$864 million, or $0.775$0.850 per common unit. This distribution will be paid on August 14, 2023May 13, 2024 to common unitholders of record on August 4, 2023.May 3, 2024. Although our partnership agreement requires that we distribute all of our available cash (as defined in the partnership agreement) each quarter, we do not otherwise have a legal obligation to distribute any particular amount per common unit. This rate will also be received by Series A preferred unitholders.
The allocation of total cash distributions is as follows for the three and six months ended June 30, 2023March 31, 2024 and June 30, 2022.March 31, 2023. MPLX’s distributions are declared subsequent to quarter end; therefore, the following table represents total cash distributions applicable to the period in which the distributions were earned.
| | Three Months Ended
June 30, | | Six Months Ended
June 30, |
| Three Months Ended
March 31, | |
| Three Months Ended
March 31, | |
| Three Months Ended
March 31, | |
| (In millions, except per unit data) | |
| (In millions, except per unit data) | |
| (In millions, except per unit data) | (In millions, except per unit data) | 2023 | | 2022 | | 2023 | | 2022 |
| Distribution declared: | Distribution declared: | | | | | | | |
| Distribution declared: | |
| Distribution declared: | |
| Limited partner units - public | Limited partner units - public | $ | 274 | | | $ | 257 | | | $ | 548 | | | $ | 514 | |
| Limited partner units - public | |
| Limited partner units - public | |
| Limited partner units - MPC | |
| Limited partner units - MPC | |
| Limited partner units - MPC | Limited partner units - MPC | 502 | | | 457 | | | 1,004 | | | 913 | |
| | Total LP distribution declared | Total LP distribution declared | 776 | | | 714 | | | 1,552 | | | 1,427 | |
| | Total LP distribution declared | |
| | Total LP distribution declared | |
| Series A preferred units | |
| Series A preferred units | |
| Series A preferred units | Series A preferred units | 23 | | | 21 | | | 46 | | | 42 | |
Series B preferred units(1) | Series B preferred units(1) | — | | | 10 | | | 5 | | | 21 | |
Series B preferred units(1) | |
Series B preferred units(1) | |
| Total distribution declared | |
| Total distribution declared | |
| Total distribution declared | Total distribution declared | $ | 799 | | | $ | 745 | | | 1,603 | | | 1,490 | |
| | Quarterly cash distributions declared per limited partner common unit | Quarterly cash distributions declared per limited partner common unit | $ | 0.775 | | | $ | 0.705 | | | $ | 1.5500 | | | $ | 1.4100 | |
| | Quarterly cash distributions declared per limited partner common unit | |
| | Quarterly cash distributions declared per limited partner common unit | |
(1) The sixthree months ended June 30,March 31, 2023 includes the portion of the $21 million distribution paid to the Series B preferred unitholders on February 15, 2023 that was earned during the period prior to redemption.
Capital Expenditures
Our operations are capital intensive, requiring investments to expand, upgrade, enhance or maintain existing operations and to meet environmental and operational regulations. Our capital requirements consist of growth capital expenditures and maintenance capital expenditures. Growth capital expenditures are those incurred for acquisitions or capital improvements that we expect will increase our operating capacity for volumes gathered, processed, transported or fractionated, decrease operating expenses within our facilities or increase operating income over the long term. Examples of growth capital expenditures include costs to develop or acquire additional pipeline, terminal, processing or storage capacity. In general, growth capital includes costs that are expected to generate additional or new cash flow for MPLX. In contrast, maintenance capital expenditures are those made to replace partially or fully depreciated assets, to maintain the existing operating capacity of our assets and to extend their useful lives, or other capital expenditures that are incurred in maintaining existing system volumes and related cash flows.
MPLX’s initial capital investment plan for 2023 totals $950 million,2024 is $1.1 billion, net of reimbursements, which includes growth capital of $800$950 million and maintenance capital of $150 million. The capital outlook excludes a $92 million equity method investment contribution made in March 2024 for the repayment of MPLX’s share of the Dakota Access joint venture’s debt. The contribution reduced our maximum potential undiscounted payments under the Contingent Equity Contribution Agreement on April 1, 2024 when Dakota Access made its scheduled debt payment. Growth capital expenditures and investments in affiliates during the sixthree months ended June 30, 2023March 31, 2024 were primarily for gas processing plants in the Marcellus and Permian basins and gathering projects in the Marcellus, Utica and Permian basins, as well as additions to our brown water marine fleet.basins. We continuously evaluate our capital plan and make changes as conditions warrant.
Our capital expenditures are shown in the table below:
| | | | Six Months Ended
June 30, | | Three Months Ended
March 31, |
| (In millions) | (In millions) | 2023 | | 2022 | (In millions) | 2024 | | 2023 |
| Capital expenditures: | Capital expenditures: | | | |
| Growth capital expenditures | Growth capital expenditures | $ | 366 | | | $ | 278 | |
Growth capital reimbursements(1) | (80) | | | (32) | |
| Growth capital expenditures | |
| Growth capital expenditures | |
| Growth capital reimbursements | |
| Investments in unconsolidated affiliates | Investments in unconsolidated affiliates | 77 | | | 156 | |
| | Capitalized interest | Capitalized interest | (6) | | | (5) | |
Total growth capital expenditures(2) | 357 | | | 397 | |
| Capitalized interest | |
| Capitalized interest | |
Total growth capital expenditures(1) | |
| Maintenance capital expenditures | Maintenance capital expenditures | 78 | | | 70 | |
| Maintenance capital reimbursements | Maintenance capital reimbursements | (13) | | | (17) | |
| Capitalized interest | (1) | | | — | |
| | Total maintenance capital expenditures | |
| Total maintenance capital expenditures | |
| Total maintenance capital expenditures | Total maintenance capital expenditures | 64 | | | 53 | |
| | Total growth and maintenance capital expenditures | Total growth and maintenance capital expenditures | 421 | | | 450 | |
Investments in unconsolidated affiliates(3) | (77) | | | (156) | |
| Total growth and maintenance capital expenditures | |
| Total growth and maintenance capital expenditures | |
Investments in unconsolidated affiliates(2) | |
| Growth and maintenance capital reimbursements(4) | 93 | | | 49 | |
| Increase in capital accruals | (12) | | | (54) | |
Growth and maintenance capital reimbursements(3) | |
Growth and maintenance capital reimbursements(3) | |
Growth and maintenance capital reimbursements(3) | |
| Decrease/(Increase) in capital accruals | |
| Capitalized interest | Capitalized interest | 7 | | | 5 | |
Additions to property, plant and equipment(3) | $ | 432 | | | $ | 294 | |
Additions to property, plant and equipment(2) | |
(1) Growth capital reimbursements include reimbursements from customers and our Sponsor. Prior periods have been updated to reflect these reimbursements to conform to the current period presentation.
(2) Total growth capital expenditures exclude $28$622 million of acquisitions, net of cash acquired, for the sixthree months ended June 30, 2022.March 31, 2024.
(3)(2) Investments in unconsolidated affiliates and additions to property, plant and equipment are shown as separate lines within investing activities in the Consolidated Statements of Cash Flows.
(4)(3) Growth capital reimbursements are generally included in changes in deferred revenue within operating activities in the Consolidated Statements of Cash Flows. Maintenance capital reimbursements are included in the Contributions from MPC line within financing activities in the Consolidated Statements of Cash Flows.
Contractual Cash Obligations
As of June 30, 2023,March 31, 2024, our contractual cash obligations included debt, finance and operating lease obligations, purchase obligations for services and to acquire property, plant and equipment, and other liabilities. During the sixthree months ended June 30, 2023, our debt obligations increased by $600 million due to the issuance of Senior Notes and use of proceeds described above in Liquidity and Capital Resources-Debt and Liquidity Overview. ThereMarch 31, 2024, there were no other material changes to our contractual obligations outside the ordinary course of business since December 31, 2022.
Off-Balance Sheet Arrangements
Off-balance sheet arrangements comprise those arrangements that may potentially impact our liquidity, capital resources and results of operations, even though such arrangements are not recorded as liabilities under GAAP. Our off-balance sheet arrangements are limited to guarantees that are described in Note 1416 of the unaudited consolidated financial statements and indemnities as disclosed in our Annual Report on Form 10-K for the year ended December 31, 2022.
Although these arrangements serve a variety of our business purposes, we are not dependent on them to maintain our liquidity and capital resources, and we are not aware of any circumstances that are reasonably likely to cause the off-balance sheet arrangements to have a material adverse effect on our liquidity and capital resources.
Transactions with Related Parties
At June 30, 2023,As of March 31, 2024, MPC owned our non-economic general partnershippartner and an approximate 64 percent limited partner interest in us. We perform a variety of services for MPC related to the transportation of crude and held approximately 65 percent of our outstanding common units.
Werefined products, including renewable diesel, via pipeline or marine, as well as terminal services, storage services and fuels distribution and marketing services, among others. The services that we provide MPC with crude oil, product pipeline, and trucking transportation servicesmay be based on regulated tariff/contractedtariff rates as well as storage, terminal, fuels distribution, and inland marine transportation services basedor on contracted rates. We also have agreements withIn addition, MPC under which we receive fees for operating MPC’s retained pipeline assets, providing managementperforms certain services for the marine business, and operating certain of MPC’s equity method investments. MPC provides us with certain services related to information technology, engineering, legal, accounting, treasury, human resources and other administrative services under employee services and omnibus services agreements.
The below table shows the percentage of Total revenues and other income as well as Total costs and expenses with MPC:
| | | | | | | | | | | | | | | | | | | | | | | |
| Three Months Ended
June 30, | | Six Months Ended
June 30, |
| 2023 | | 2022 | | 2023 | | 2022 |
| Total revenues and other income | 50 | % | | 45 | % | | 50 | % | | 46 | % |
| Total costs and expenses | 27 | % | | 23 | % | | 27 | % | | 24 | % |
| | | | | | | | | | | | | | | |
| Three Months Ended
March 31, | | |
| 2024 | | 2023 | | | | |
| Total revenues and other income | 49 | % | | 50 | % | | | | |
| Total costs and expenses | 27 | % | | 27 | % | | | | |
For further discussion of agreements and activity with MPC and related parties see Item 1. Business in our Annual Report on Form 10-K for the year ended December 31, 20222023 and Note 45 to the unaudited consolidated financial statements in this report.
Environmental Matters and Compliance Costs
We have incurred and may continue to incur substantial capital, operating and maintenance, and remediation expenditures as a result of environmental laws and regulations. If these expenditures, as with all costs, are not ultimately reflected in the prices of our products and services, our operating results will be adversely affected. We believe that substantially all of our competitors must comply with similar environmental laws and regulations. However, the specific impact on each competitor may vary depending on a number of factors, including, but not limited to, the age and location of its operating facilities.
As previously disclosed in our Annual Report on Form 10-K for the year ended December 31, 2022,2023, actual expenditures may vary as the number and scope of environmental projects are revised as a result of improved technology or changes in regulatory requirements. There have been no significantmaterial changes to our environmental matters and compliance costs duringsince our Annual Report on Form 10-K for the six monthsyear ended June 30,December 31, 2023.
Critical Accounting Estimates
As of June 30, 2023,March 31, 2024, there have been no significant changes to our critical accounting estimates since our Annual Report on Form 10-K for the year ended December 31, 2022.
Accounting Standards Not Yet Adopted
We have not identified any recent accounting pronouncements that are expected to have a material impact on our financial condition, results of operations or cash flows upon adoption. Accounting standards areAs discussed in Note 2 ofto the unaudited consolidated financial statements.
statements, certain new financial accounting pronouncements will be effective for our financial statements in the future.
Item 3. Quantitative and Qualitative Disclosures about Market Risk
We are exposed to market risks related to the volatility of commodity prices. We employ various strategies, including the potential use of commodity derivative instruments, to economically hedge the risks related to these price fluctuations. We are also exposed to market risks related to changes in interest rates. As of June 30, 2023,March 31, 2024, we did not have any open financial or commodity derivative instruments to hedge the economic risks related to interest rate fluctuations;fluctuations or the volatility of commodity prices, respectively; however, we continually monitor the market and our exposure and may enter into these arrangements in the future.
Commodity Price Risk
The information about commodity price risk for the three and six months ended June 30, 2023March 31, 2024 does not differ materially from that discussed in Item 7A. Quantitative and Qualitative Disclosures about Market Risk of our Annual Report on Form 10-K for the year ended December 31, 2022.
Outstanding Derivative Contracts and Sensitivity Analysis
See Notes 910 and 1011 to the unaudited consolidated financial statements for more information about the fair value measurement of our derivative instruments, including the natural gas embedded derivative, as well as the amounts recorded in our consolidated balance sheets and statements of income. We do not designate any of our commodity derivative instruments as hedges for accounting purposes.
Our open derivative positions at June 30, 2023 will expire at various times through 2023. We prepared a sensitivity analysis to estimate our exposure to market risk associated with our derivative instruments. Based on our open net positions at June 30, 2023, a 10 percent change in quoted market prices of our derivative instruments, assuming all other factors remain constant, could change the fair value of our derivative instruments and Income before income taxes by $2.0 million. This analysis may differ from actual results.
Interest Rate Risk and Sensitivity Analysis
Sensitivity analysis of the effect of a hypothetical 100-basis-point change in interest rates on outstanding third-party debt, excluding finance leases, is provided in the following table. Fair value of cash and cash equivalents, receivables, accounts payable and accrued interest approximate carrying value and are relatively insensitive to changes in interest rates due to the short-term maturity of the instruments. Accordingly, these instruments are excluded from the table.
| | (In millions) | (In millions) | Fair Value as of June 30, 2023(1) | | Change in Fair Value(2) | | Change in Income Before Income Taxes for the Three Months Ended June 30, 2023(3) | (In millions) | Fair Value as of March 31, 2024(1) | | Change in Fair Value(2) | | Change in Income Before Income Taxes for the Three Months Ended March 31, 2024(3) |
| Outstanding debt | Outstanding debt | | | | | |
| Fixed-rate | Fixed-rate | $ | 18,671 | | | $ | 1,523 | | | N/A |
| Fixed-rate | |
| Fixed-rate | | $ | 19,206 | | | $ | 1,507 | | | N/A |
Variable-rate(4) | Variable-rate(4) | $ | — | | | $ | — | | | $ | — | |
(1) Fair value was based on market prices, where available, or current borrowing rates for financings with similar terms and maturities.
(2) Assumes a 100-basis-point decrease in the weighted average yield-to-maturity at June 30, 2023.March 31, 2024.
(3) Assumes a 100-basis-point change in interest rates. The change to income before income taxes was based on the weighted average balance of all outstanding variable-rate debt for the sixthree months ended June 30, 2023.March 31, 2024.
(4) MPLX had no outstanding borrowings on the MPLX Credit Agreement as of June 30, 2023.
At June 30, 2023,March 31, 2024, our portfolio of third‑party debt consisted of fixed-rate instruments and outstanding borrowings, if any, under the MPLX Credit Agreement. The fair value of our fixed-rate debt is relatively sensitive to interest rate fluctuations. Our sensitivity to interest rate declines and corresponding increases in the fair value of our debt portfolio unfavorably affects our results of operations and cash flows only when we elect to repurchase or otherwise retire fixed-rate debt at prices above carrying value. Interest rate fluctuations generally do not impact the fair value of borrowings under our MPLX Credit Agreement, but may affect our results of operations and cash flows.
See Note 910 in the unaudited consolidated financial statements for additional information on the fair value of our debt.
Item 4. Controls and Procedures
Disclosure Controls and Procedures
An evaluation of the effectiveness of the design and operation of our disclosure controls and procedures (as defined in Rules 13a-15(e) and 15d-15(e) under the Securities Exchange Act of 1934, as amended) was carried out under the supervision and with the participation of our management, including the chief executive officer and chief financial officer of our general partner. Based upon that evaluation, the chief executive officer and chief financial officer of our general partner concluded that the design and operation of these disclosure controls and procedures were effective as of June 30, 2023,March 31, 2024, the end of the period covered by this report.
Changes in Internal Control Overover Financial Reporting
During the quarter ended June 30, 2023,March 31, 2024, there were no changes in our internal control over financial reporting that have materially affected, or are reasonably likely to materially affect, our internal control over financial reporting.
PartPART II – Other Information
Item 1. Legal Proceedings
We are the subject of, or a party to, a number of pending or threatened legal actions, contingencies and commitments involving a variety of matters, including laws and regulations relating to the environment. While it is possible that an adverse result in one or more of the lawsuits or proceedings in which we are a defendant could be material to us, based upon current information and our experience as a defendant in other matters, we believe that these lawsuits and proceedings, individually or in the aggregate, will not have a material adverse effect on our consolidated results of operations, financial position or cash flows.
Item 103 of Regulation S-K promulgated by the SEC requires disclosure of certain environmental matters when a governmental authority is a party to the proceedings and such proceedings involve potential monetary sanctions, unless we reasonably believe that the matter will result in no monetary sanctions, or in monetary sanctions, exclusive of interest and costs, of less than a specified threshold. We use a threshold of $1 million for this purpose.
There have been no material changes to the legal matters previously disclosed in our Annual Report on Form 10-K for the year ended December 31, 2022, or in our Quarterly Report on Form 10-Q for the quarter ended March 31, 2023.
Item 1A. Risk Factors
There have been no material changes from the risk factors previously disclosed in our Annual Report on Form 10-K for the year ended December 31, 2022.2023.
Item 2. Unregistered Sales of Equity Securities and Use of Proceeds
The following table sets forth a summary of our purchases during the quarter ended March 31, 2024, of equity securities that are registered by MPLX pursuant to Section 12 of the Securities Exchange Act of 1934, as amended.
| | | | | | | | | | | | | | | | | | | | | | | | | | |
| | | | | | | | Millions of Dollars |
| Period | | Total Number of Common Units Purchased | | Average Price
Paid per
Common Unit(1) | | Total Number of Common Units Purchased as Part of Publicly Announced Plans or Programs | | Maximum Dollar Value of Common Units that May Yet Be Purchased Under the Plans or Programs(2)(3) |
| 1/1/2024-1/31/2024 | — | | | $ | — | | | — | | | $ | 846 | |
| 2/1/2024-2/29/2024 | 609,120 | | | 39.40 | | | 609,120 | | | $ | 822 | |
| 3/1/2024-3/31/2024 | 1,263,797 | | | 40.36 | | | 1,263,797 | | | $ | 771 | |
| Total | 1,872,917 | | | $ | 40.04 | | | 1,872,917 | | | |
(2)On August 2, 2022, we announced the board authorization for the repurchase of up to $1 billion of MPLX common units held by the public. This unit repurchase authorization has no expiration date.
(3)The maximum dollar value remaining has been reduced by the payment of any commissions paid to brokers during the relevant period.
Item 5. Other Information
During the quarter ended June 30, 2023,March 31, 2024, no director or officer (as defined in Rule 16a-1(f) promulgated under the Exchange Act) of MPLX adopted or terminated a “Rule 10b5-1 trading arrangement” or “non-Rule 10b5-1 trading arrangement” (as each term is defined in Item 408 of Regulation S-K).
Item 6. Exhibits
| | | | | | | | | | | | | | | | | | | | | | | | | | | | | | | | | | | | | | | | | | | | |
| | | | | Incorporated by Reference From | | | | |
Exhibit
Number | | Exhibit Description | | Form | | Exhibit | | Filing Date | | SEC File No. | | Filed
Herewith | | Furnished
Herewith |
| 3.1 | | | | S-1 | | 3.1 | | | 7/2/2012 | | 333-182500 | | | | |
| 3.2 | | | | S-1/A | | 3.2 | | | 10/9/2012 | | 333-182500 | | | | |
| 3.3 | | | | 8-K | | 3.1 | | | 2/3/2021 | | 001-35714 | | | | |
| 10.1 | | | | | | | | | | | | X | | |
| 10.2 | | | | | | | | | | | | X | | |
| 10.3 | | | | | | | | | | | | X | | |
| 10.4 | | | | | | | | | | | | X | | |
| 31.1 | | | | | | | | | | | | X | | |
| 31.2 | | | | | | | | | | | | X | | |
| 32.1 | | | | | | | | | | | | | | X |
| 32.2 | | | | | | | | | | | | | | X |
| 101.INS | | XBRL Instance Document: The instance document does not appear in the interactive data file because its XBRL tags are embedded within the Inline XBRL document. | | | | | | | | | | | | |
| 101.SCH | | Inline XBRL Taxonomy Extension Schema Document. | | | | | | | | | | X | | |
| 101.CAL | | Inline XBRL Taxonomy Extension Calculation Linkbase Document. | | | | | | | | | | X | | |
| 101.DEF | | Inline XBRL Taxonomy Extension Definition Linkbase Document. | | | | | | | | | | X | | |
| 101.LAB | | Inline XBRL Taxonomy Extension Label Linkbase Document. | | | | | | | | | | X | | |
| 101.PRE | | Inline XBRL Taxonomy Extension Presentation Linkbase Document. | | | | | | | | | | X | | |
| 104 | | Cover Page Interactive Data File (formatted as Inline XBRL and contained in Exhibit 101). | | | | | | | | | | | | |
| | | | | | | | | | | | | | | | | | | | | | | | | | | | | | | | | | | | | | | | | | | | |
| | | | | Incorporated by Reference From | | | | |
Exhibit
Number | | Exhibit Description | | Form | | Exhibit | | Filing Date | | SEC File No. | | Filed
Herewith | | Furnished
Herewith |
| 3.1 | | | | S-1 | | 3.1 | | 7/2/2012 | | 333-182500 | | | | |
| 3.2 | | | | S-1/A | | 3.2 | | 10/9/2012 | | 333-182500 | | | | |
| 3.3 | | | | 8-K | | 3.1 | | 2/3/2021 | | 001-35714 | | | | |
| 10.1 | | | | | | | | | | | | X | | |
| 10.2 | | | | | | | | | | | | X | | |
| 31.1 | | | | | | | | | | | | X | | |
| 31.2 | | | | | | | | | | | | X | | |
| 32.1 | | | | | | | | | | | | | | X |
| 32.2 | | | | | | | | | | | | | | X |
| 101.INS | | XBRL Instance Document: The instance document does not appear in the interactive data file because its XBRL tags are embedded within the Inline XBRL document. | | | | | | | | | | | | |
| 101.SCH | | Inline XBRL Taxonomy Extension Schema Document. | | | | | | | | | | X | | |
| 101.CAL | | Inline XBRL Taxonomy Extension Calculation Linkbase Document. | | | | | | | | | | X | | |
| 101.DEF | | Inline XBRL Taxonomy Extension Definition Linkbase Document. | | | | | | | | | | X | | |
| 101.LAB | | Inline XBRL Taxonomy Extension Label Linkbase Document. | | | | | | | | | | X | | |
| 101.PRE | | Inline XBRL Taxonomy Extension Presentation Linkbase Document. | | | | | | | | | | X | | |
| 104 | | Cover Page Interactive Data File (formatted as Inline XBRL and contained in Exhibit 101). | | | | | | | | | | | | |
SIGNATURES
Pursuant to the requirements of the Securities Exchange Act of 1934, the registrant has duly caused this report to be signed on its behalf by the undersigned thereunto duly authorized.
| | | | | | | | | | | |
| MPLX LP | | |
| | | |
| By: | | MPLX GP LLC |
| | | Its general partner |
| | | |
Date: August 1, 2023April 30, 2024 | By: | | /s/ Kelly D. Wright |
| | | Kelly D. Wright |
| | | Vice President and Controller of MPLX GP LLC (the general partner of MPLX LP) |