
WASHINGTON,
þ QUARTERLY REPORT PURSUANT TO SECTION 13 OR 15(d) OF THE SECURITIES EXCHANGE ACT OF 1934
| ☑ | QUARTERLY REPORT PURSUANT TO SECTION 13 OR 15(d) OF THE SECURITIES EXCHANGE ACT OF 1934 | ||||
OR
o TRANSITION REPORT PURSUANT TO SECTION 13 OR 15(d) OF THE SECURITIES EXCHANGE ACT OF 1934
For the transition period from ________ to ________
Commission file number: 001-38175
Aspen Group, Inc.
(Exact name of registrant as specified in its charter)
|
| ||||
| For the transition period from ___________ to ___________ | |||||
| Delaware | 27-1933597 | |||||||||||||
| State or |
| I.R.S. Employer Identification No. | ||||||||||||
| 276 Fifth Avenue, Suite
|
| 10001 | |||||||||||
| Address of |
| Zip | |||||||||||
Registrants
number, including area code)
| Title of each class | Trading Symbol(s) | Name of each exchange on which registered | ||||||
| Common Stock, par value $0.001 | ASPU | The Nasdaq Stock Market (The Nasdaq Global Market) | ||||||
Large accelerated filer ¨ | Accelerated filer | ||||||||
| Non-accelerated filer |
| Smaller reporting company | |||||||
| Emerging growth company | ||||||||
☐
Class | Outstanding as of March | |||||||
Common Stock, $0.001 par value per share |
| |||||||
INDEX
| Page Number | |||||||||
| |||||||||
| |||||||||
| |||||||||
| |||||||||
| |||||||||
| |||||||||
| |||||||||
| |||||||||
| |||||||||
| |||||||||
| |||||||||
| |||||||||
| |||||||||
January 31, April 30, 2018 2017 (Unaudited) Assets Current assets: Cash and cash equivalents $ 3,803,080 $ 2,756,217 Restricted cash 190,506 — Accounts receivable, net of allowance of $544,492 and $328,864, respectively 8,592,958 4,434,862 Prepaid expenses 288,640 133,531 Promissory note receivable — 900,000 Other receivables 233,862 81,464 Accrued interest receivable — 8,000 Total current assets 13,109,046 8,314,074 Property and equipment: Call center equipment 96,305 53,748 Computer and office equipment 130,137 103,649 Furniture and fixtures 712,209 255,984 Software 2,590,297 2,131,344 3,528,948 2,544,725 Less accumulated depreciation and amortization (1,161,030 ) (1,090,010 ) Total property and equipment, net 2,367,918 1,454,715 Goodwill 5,011,432 — Intangible assets, net 9,916,667 — Courseware, net 137,557 145,477 Accounts receivable, secured - related party, net of allowance of $625,963, and $625,963, respectively 45,329 45,329 Long term contractual receivable 935,878 657,542 Other assets 585,206 56,417 Total assets $ 32,109,033 $ 10,673,554 January 31, April 30, 2018 2017 (Unaudited) Liabilities and Stockholders’ Equity Current liabilities: Accounts payable $ 1,273,990 $ 756,701 Accrued expenses 596,633 262,911 Deferred revenue 4,156,550 1,354,989 Refunds due students 730,722 310,576 Deferred rent, current portion 7,429 11,200 Convertible notes payable- related party, current portion 1,000,000 — Convertible notes payable, current portion 50,000 50,000 Other current liabilities 186,134 — Total current liabilities 8,001,458 2,746,377 Convertible note payable - related party 1,000,000 — Senior secured term loan, net of discount 6,769,932 — Warrant Liability — 52,500 Deferred rent 60,295 34,437 Total liabilities 15,831,685 2,833,314 Commitments and contingencies - See Note 7 — — Stockholders’ equity: Common stock, $0.001 par value; 250,000,000 shares authorized, 15,072,332 issued and 15,055,665 outstanding at January 31, 2018 13,504,012 issued and 13,487,345 outstanding at April 30, 2017 15,072 13,504 Additional paid-in capital 45,439,538 33,607,423 Treasury stock (16,667 shares) (70,000 ) (70,000 ) Accumulated deficit (29,107,262 ) (25,710,687 ) Total stockholders’ equity 16,277,348 7,840,240 Total liabilities and stockholders’ equity $ 32,109,033 $ 10,673,554 For the For the Three Months Ended Nine Months Ended January 31, January 31, 2018 2017 2018 2017 Revenues $ 5,701,958 $ 3,735,626 $ 14,796,483 $ 9,957,467 Operating expenses Cost of revenues (exclusive of depreciation and amortization shown separately below) 2,665,664 1,359,131 6,282,814 3,490,046 General and administrative 4,677,359 2,133,074 10,975,085 6,228,554 Program review settlement expense — 25,000 — 25,000 Depreciation and amortization 347,894 132,727 631,969 422,782 Total operating expenses 7,690,917 3,649,932 17,889,868 10,166,382 Operating (loss) income (1,988,959 ) 85,694 (3,093,385 ) (208,915 ) Other income (expense): Other income 46,179 1,684 88,067 3,047 Gain on extinguishment of warrant liability 52,500 — 52,500 — Interest expense (257,665 ) (80,001 ) (443,757 ) (175,662 ) Total other expense, net (158,986 ) (78,317 ) (303,190 ) (172,615 ) (Loss) income before income taxes (2,147,945 ) 7,377 (3,396,575 ) (381,530 ) Income tax expense (benefit) — — — — Net (loss) income $ (2,147,945 ) $ 7,377 $ (3,396,575 ) $ (381,530 ) Net (loss) income per share allocable to common stockholders - basic $ (0.15 ) $ 0.00 $ (0.25 ) $ (0.03 ) Net (loss) income per share allocable to common stockholders - diluted $ (0.15 ) $ 0.00 $ (0.25 ) $ (0.03 ) Weighted average number of common shares outstanding: basic 14,491,634 11,467,345 13,862,992 11,419,270 Weighted average number of common shares outstanding: diluted 14,491,634 13,040,970 13,862,992 11,419,270 2022 and 2021 Additional Total Common Stock Paid-In Treasury Accumulated Stockholders' Shares Amount Capital Stock Deficit Equity Balance at April 30, 2017 13,504,012 $ 13,504 $ 33,607,423 $ (70,000 ) $ (25,710,687 ) $ 7,840,240 Fees associated with equity raise — — (14,033 ) — — (14,033 ) Restricted stock issued for services 10,000 10 88,690 — — 88,700 Stock-based compensation — — 466,468 — — 466,468 Common stock issued for acquisition 1,203,209 1,203 10,214,041 — — 10,215,244 Common stock issued for cashless warrant exercises 162,072 162 (162 ) — — — Common stock issued for warrants exercised for cash 79,442 79 143,410 — — 143,489 Common stock issued for stock options exercised 113,597 114 455,273 — — 455,387 Warrants issued with senior secured term loan — — 478,428 — — 478,428 Net loss, for the Nine months ended January 31, 2018 — — — — (3,396,575 ) (3,396,575 ) Balance at January 31, 2018 15,072,332 $ 15,072 $ 45,439,538 $ (70,000 ) $ (29,107,262 ) $ 16,277,348 CHANGES IN STOCKHOLDERS’ EQUITY (CONTINUED) For the Nine months ended January 31, 2018 2017 Cash flows from operating activities: Net loss $ (3,396,575 ) $ (381,530 ) Adjustments to reconcile net loss to net cash used in operating activities: Bad debt expense (recovery) 298,144 (25,680 ) Gain on extinguishment of warrant liability (52,500 ) — Depreciation and amortization 631,969 422,782 Loss on asset disposal 27,590 — Stock-based compensation 466,468 253,833 Amortization of debt discounts 99,726 15,625 Amortization of prepaid shares for services 37,039 52,500 Warrant buyback expense — 206,000 Changes in operating assets and liabilities: Accounts receivable (4,534,118 ) (2,331,140 ) Prepaid expenses (59,451 ) 28,715 Accrued interest receivable (45,400 ) — Other receivables (152,398 ) — Other assets (528,789 ) (25,241 ) Accounts payable 366,044 875,110 Accrued expenses 218,476 105,111 Deferred rent 22,087 17,318 Refunds due students 420,146 124,912 Deferred revenue 2,340,461 562,643 Other liabilities 186,134 — Net cash used in operating activities (3,654,947 ) (99,042 ) Cash flows from investing activities: Cash paid in asset acquisition (2,589,719 ) — Proceeds from promissory note interest receivable 53,400 — Increase in restricted cash (190,506 ) — Purchases of courseware (33,369 ) (6,550 ) Purchases of property and equipment (1,171,473 ) (565,306 ) Proceeds from promissory note receivable 900,000 — Net cash used in investing activities (3,031,667 ) (571,856 ) Cash flows from financing activities: Warrant Buyback — (400,000 ) Borrowing of bank line of credit — 247,000 Payments for bank line of credit — (248,783 ) Borrowing of third party line of credit — 1,250,000 Third party line of credit financing costs — (60,000 ) Proceeds of warrant and stock options exercised 598,876 — Offering costs paid on debt financing (351,366 ) — Disbursements for equity offering costs (14,033 ) (4,017 ) Proceeds from senior secured term loan 7,500,000 — Net cash provided by financing activities 7,733,477 784,200 Net increase in cash 1,046,863 113,302 Cash at beginning of period 2,756,217 783,796 Cash at end of period $ 3,803,080 $ 897,098 CONSOLIDATED BALANCE SHEETSJanuary 31, 2022 April 30, 2021 (Unaudited) Assets Current assets: Cash and cash equivalents $ 5,969,286 $ 12,472,082 Restricted cash 1,433,397 1,193,997 Accounts receivable, net of allowance of $3,381,204 and $3,289,816, respectively 19,635,715 16,724,744 Prepaid expenses 1,375,628 1,077,831 Other current assets 31,032 68,529 Total current assets 28,445,058 31,537,183 Property and equipment: Computer equipment and hardware 1,486,201 956,463 Furniture and fixtures 2,153,124 1,705,101 Leasehold improvements 7,179,896 5,729,324 Instructional equipment 656,409 421,039 Software 9,829,329 8,488,635 Construction in progress 900 247,767 21,305,859 17,548,329 Less: accumulated depreciation and amortization (7,533,571) (4,892,987) Total property and equipment, net 13,772,288 12,655,342 Goodwill 5,011,432 5,011,432 Intangible assets, net 7,907,075 7,908,360 Courseware, net 289,680 187,296 Accounts receivable, net of allowance of $— and $625,963, respectively — 45,329 Long-term contractual accounts receivable 12,701,452 10,249,833 Deferred financing costs 88,393 18,056 Operating lease right of use assets, net 13,090,470 12,714,863 Deposits and other assets 523,898 479,212 Total assets $ 81,829,746 $ 80,806,906 (Continued)The accompanying condensed notes are an integral part of these unaudited consolidated financial statements.1ASPEN GROUP, INC. AND SUBSIDIARIESCONSOLIDATED BALANCE SHEETS (CONTINUED)January 31, 2022 April 30, 2021 (Unaudited) Liabilities and Stockholders’ Equity Liabilities: Current liabilities: Accounts payable $ 1,806,656 $ 1,466,488 Accrued expenses 2,079,249 2,040,896 Deferred revenue 6,182,781 6,825,014 Due to students 3,229,516 2,747,484 Operating lease obligations, current portion 2,106,981 2,029,821 Credit Facility 5,000,000 — Other current liabilities 136,027 307,921 Total current liabilities 20,541,210 15,417,624 Operating lease obligations, less current portion 17,317,396 16,298,808 Total liabilities 37,858,606 31,716,432 Commitments and contingencies – see Note 11 0 0 Stockholders’ equity: Preferred stock, $0.001 par value; 1,000,000 shares authorized, 0 issued and 0 outstanding at January 31, 2022 and April 30, 2021 — — Common stock, $0.001 par value; 40,000,000 shares authorized, 25,228,580 issued and 25,073,094 outstanding at January 31, 2022 25,066,297 issued and 24,910,811 outstanding at April 30, 2021 25,229 25,067 Additional paid-in capital 111,378,471 109,040,824 Treasury stock (155,486 at both January 31, 2022 and April 30, 2021) (1,817,414) (1,817,414) Accumulated deficit (65,615,146) (58,158,003) Total stockholders’ equity 43,971,140 49,090,474 Total liabilities and stockholders’ equity $ 81,829,746 $ 80,806,906 The accompanying condensed notes are an integral part of these unaudited consolidated financial statements.2CONSOLIDATED STATEMENTS OF OPERATIONS(Unaudited)Three Months Ended January 31, Nine Months Ended January 31, 2022 2021 2022 2021 Revenue $ 18,944,798 $ 16,624,837 $ 57,316,004 $ 48,761,444 Operating expenses: Cost of revenue (exclusive of depreciation and amortization shown separately below) 9,275,419 7,559,951 26,658,188 20,732,254 General and administrative 11,771,487 10,644,438 34,359,276 30,723,349 Bad debt expense 350,000 670,000 1,050,000 1,702,000 Depreciation and amortization 883,536 535,273 2,480,179 1,552,254 Total operating expenses 22,280,442 19,409,662 64,547,643 54,709,857 Operating loss (3,335,644) (2,784,825) (7,231,639) (5,948,413) Other income (expense): Interest expense (180,697) (33,539) (353,738) (2,018,664) Other income (expense), net 13,954 13,558 516,754 (116,820) Total other (expense) income, net (166,743) (19,981) 163,016 (2,135,484) Loss before income taxes (3,502,387) (2,804,806) (7,068,623) (8,083,897) Income tax expense 231,610 10,460 388,520 45,090 Net loss $ (3,733,997) $ (2,815,266) $ (7,457,143) $ (8,128,987) Net loss per share - basic and diluted $ (0.15) $ (0.11) $ (0.30) $ (0.35) Weighted average number of common stock outstanding - basic and diluted 25,041,733 24,544,334 24,971,056 23,354,036 The accompanying condensed notes are an integral part of these unaudited consolidated financial statements.3CONSOLIDATED STATEMENTSTATEMENTS OF CHANGES IN STOCKHOLDERS’ EQUITYFOR THE NINE MONTHS ENDED JANUARYThree Months Ended January 31, 2018(Unaudited)Common Stock Additional
Paid-In
CapitalTreasury
StockAccumulated
DeficitTotal
Stockholders’
EquityShares Amount Balance at October 31, 2021 25,148,194 $ 25,149 $ 110,526,729 $ (1,817,414) $ (61,881,149) $ 46,853,315 Stock-based compensation — — 700,697 — — 700,697 Common stock issued for stock options exercised for cash 41,667 41 134,959 — — 135,000 Common stock issued for vested restricted stock units 38,719 39 (39) — — — Amortization of warrant based cost — — 16,125 — — 16,125 Net loss — — — — (3,733,997) (3,733,997) Balance at January 31, 2022 25,228,580 $ 25,229 $ 111,378,471 $ (1,817,414) $ (65,615,146) $ 43,971,140 Common Stock Additional
Paid-In
CapitalTreasury
StockAccumulated
DeficitTotal
Stockholders’
EquityShares Amount Balance at October 31, 2020 24,416,539 $ 24,417 $ 105,092,551 $ — $ (53,022,751) $ 52,094,217 Stock-based compensation — — 701,170 — — 701,170 Common stock issued for stock options exercised for cash 447,134 447 2,180,352 (1,817,414) — 363,385 Common stock issued for vested restricted stock units 74,000 74 (74) — — — Common stock issued for services 2,000 2 19,898 — — 19,900 Amortization of warrant based cost — — 9,125 — — 9,125 Net loss — — — — (2,815,266) (2,815,266) Balance at January 31, 2021 24,939,673 $ 24,940 $ 108,003,022 $ (1,817,414) $ (55,838,017) $ 50,372,531 The accompanying condensed notes are an integral part of these unaudited consolidated financial statements.4CONSOLIDATED STATEMENTS OF CASH FLOWSNine Months Ended January 31, 2022 and 2021(Unaudited)(Continued)Common Stock Additional
Paid-In
CapitalTreasury
StockAccumulated
DeficitTotal
Stockholders’
EquityShares Amount Balance at April 30, 2021 25,066,297 $ 25,067 $ 109,040,824 $ (1,817,414) $ (58,158,003) $ 49,090,474 Stock-based compensation — — 1,965,567 — — 1,965,567 Common stock issued for stock options exercised for cash 58,419 58 190,976 — — 191,034 Common stock issued for cashless stock options exercised 30,156 30 (30) — — — Common stock issued for vested restricted stock units 73,708 74 (74) — — — Amortization of warrant based cost — — 43,708 — — 43,708 Warrants issued for deferred financing costs related to Credit Facility — — 137,500 — — 137,500 Net loss — — — — (7,457,143) (7,457,143) Balance at January 31, 2022 25,228,580 $ 25,229 $ 111,378,471 $ (1,817,414) $ (65,615,146) $ 43,971,140 Common Stock Additional
Paid-In
CapitalTreasury
StockAccumulated
DeficitTotal
Stockholders’
EquityShares Amount Balance at April 30, 2020 21,770,520 $ 21,771 $ 89,505,216 $ (70,000) $ (47,709,030) $ 41,747,957 Stock-based compensation — — 3,019,828 — — 3,019,828 Common stock issued for stock options exercised for cash 1,364,721 1,365 4,394,749 (1,817,414) — 2,578,700 Common stock issued for cashless stock options exercised 22,339 22 (22) — — — Common stock issued for conversion of Convertible Notes 1,398,602 1,399 9,998,601 — — 10,000,000 Common stock issued for vested restricted stock units 206,109 206 (206) — — — Common stock issued for warrants exercised for cash 192,049 192 1,081,600 — — 1,081,792 Common stock issued for services 2,000 2 19,898 — — 19,900 Modification charge for warrants exercised — — 25,966 — — 25,966 Amortization of warrant based cost — — 27,375 — — 27,375 Cancellation of Treasury Stock (16,667) (17) (69,983) 70,000 — — Net loss — — — — (8,128,987) (8,128,987) Balance at January 31, 2021 24,939,673 $ 24,940 $ 108,003,022 $ (1,817,414) $ (55,838,017) $ 50,372,531 The accompanying condensed notes are an integral part of these unaudited consolidated financial statements.
|
| For the |
| |||||
|
| Nine months ended |
| |||||
|
| January 31, |
| |||||
|
| 2018 |
|
| 2017 |
| ||
Supplemental disclosure of cash flow information: |
|
|
|
|
|
|
|
|
Cash paid for interest |
| $ | 316,781 |
|
| $ | 145,105 |
|
Cash paid for income taxes |
| $ | — |
|
| $ | — |
|
|
|
|
|
|
|
|
|
|
Supplemental disclosure of non-cash investing and financing activities |
|
|
|
|
|
|
|
|
Warrants issued as part of senior secured loan |
| $ | 478,428 |
|
| $ | — |
|
Assets acquired net of liabilities assumed for non-cash consideration |
| $ | 12,215,244 |
|
| $ | — |
|
Common stock issued for services |
| $ | — |
|
| $ | 62,002 |
|
Warrant derivative liability |
| $ | — |
|
| $ | 52,500 |
|
| Nine Months Ended January 31, | |||||||||||
| 2022 | 2021 | ||||||||||
| Cash flows from operating activities: | |||||||||||
| Net loss | $ | (7,457,143) | $ | (8,128,987) | |||||||
| Adjustments to reconcile net loss to net cash used in operating activities: | |||||||||||
| Bad debt expense | 1,050,000 | 1,702,000 | |||||||||
| Depreciation and amortization | 2,480,179 | 1,552,254 | |||||||||
| Stock-based compensation | 1,965,567 | 3,019,828 | |||||||||
| Amortization of warrant based cost | 43,708 | 27,375 | |||||||||
| Amortization of debt discounts | — | 1,550,854 | |||||||||
| Amortization of debt issue costs | 18,056 | 156,029 | |||||||||
| Amortization of deferred financing costs | 49,107 | — | |||||||||
| Modification charge for warrants exercised | — | 25,966 | |||||||||
| Loss on asset disposition | 36,445 | — | |||||||||
| Lease benefit | (96,450) | — | |||||||||
| Tenant improvement allowances received from landlords | 816,591 | — | |||||||||
| Common stock issued for services | — | 19,900 | |||||||||
| Changes in operating assets and liabilities: | |||||||||||
| Accounts receivable | (6,412,590) | (6,493,238) | |||||||||
| Prepaid expenses | (297,797) | (267,526) | |||||||||
| Other receivables | — | 23,097 | |||||||||
| Other current assets | 37,498 | (1,205,083) | |||||||||
| Accounts receivable, other | 45,329 | — | |||||||||
| Deposits and other assets | (44,686) | (185,599) | |||||||||
| Accounts payable | 340,168 | (349,882) | |||||||||
| Accrued expenses | 38,353 | 1,756,102 | |||||||||
| Due to students | 482,032 | (128,154) | |||||||||
| Deferred revenue | (642,233) | 1,887,377 | |||||||||
| Other current liabilities | (171,894) | (238,032) | |||||||||
| Net cash used in operating activities | (7,719,760) | (5,275,719) | |||||||||
| Cash flows from investing activities: | |||||||||||
| Purchases of courseware and accreditation | (161,262) | (31,330) | |||||||||
| Purchases of property and equipment | (3,573,408) | (2,877,758) | |||||||||
| Net cash used in investing activities | (3,734,670) | (2,909,088) | |||||||||
| Cash flows from financing activities: | |||||||||||
| Borrowings under the Credit Facility | 5,000,000 | — | |||||||||
| Proceeds from stock options exercised | 191,034 | 2,578,700 | |||||||||
| Proceeds from warrants exercised | — | 1,081,792 | |||||||||
| Net cash provided by financing activities | 5,191,034 | 3,660,492 | |||||||||
2022 profession. 2024. certification resulting from the ownership change of control in connection with the acquisition by AGI on December 1, 2017.6ASPEN GROUP, INC. AND SUBSIDIARIESCONSOLIDATED STATEMENTS OF CASH FLOWS (CONTINUED)(Unaudited)Nine Months Ended January 31, 2022 2021 Net decrease in cash, cash equivalents and restricted cash $ (6,263,396) $ (4,524,315) Cash, cash equivalents and restricted cash at beginning of period 13,666,079 17,906,765 Cash, cash equivalents and restricted cash at end of period $ 7,402,683 $ 13,382,450 Supplemental disclosure cash flow information: Cash paid for interest $ 258,630 $ 310,958 Cash paid for income taxes $ 13,520 $ 49,008 Supplemental disclosure of non-cash investing and financing activities: Common stock issued for conversion of Convertible Notes $ — $ 10,000,000 Warrants issued as part of Credit Facility $ 137,500 $ — The following table provides a reconciliation of cash and cash equivalents and restricted cash reported within the accompanying consolidated balance sheet to the total amounts shown in the accompanying unaudited consolidated statements of cash flows:January 31, 2022 April 30, 2021 Cash and cash equivalents $ 5,969,286 $ 12,472,082 Restricted cash 1,433,397 1,193,997 Total cash, cash equivalents and restricted cash $ 7,402,683 $ 13,666,079 The accompanying condensed notes are an integral part of these unaudited consolidated financial statements.7ASPEN GROUP, INC. AND SUBSIDIARIESCONDENSED NOTES TO CONSOLIDATED FINANCIAL STATEMENTSJANUARYJanuary 31, 2018(Unaudited)Note 1. Nature of Operations and LiquidityOverviewAspen Group, Inc. (together with its subsidiaries, the “Company” or “AGI”("AGI") is aan education technology holding company, whichcompany. AGI has two subsidiaries.2 subsidiaries, Aspen University Inc. (“("Aspen University”University") was, organized in 1987, and United States University Inc. (“USU”("United States University" or "USU") was formed May 2017.All references to the “Company”, “AGI”, “Aspen Group”, “we”, “our” and certain assets were acquired“us” refer to Aspen Group, Inc., unless the context otherwise indicates.AGI leverages its education technology infrastructure and liabilities assumedexpertise to allow its two universities, Aspen University and United States University, to deliver on December 1, 2017. (See Note 10)Aspen Group’sthe vision is to makeof making college affordable again in America.again. Because we believe higher education should be a catalyst to our students’ long-term economic success, we exert financial prudence by offering affordable tuition that is one of the greatest values in online higher education. In March 2014, Aspen University unveiled a monthly payment plan aimed at reversingAGI’s primary focus relative to future growth is to target the college-debt sentence plaguing working-class Americans. The monthly payment plan offers bachelor students (except RN to BSN) the opportunity to pay their tuition at $250/month for 72 months ($18,000),high growth nursing bachelor students (RN to BSN) $250/month for 39 months ($9,750), master students $325/month for 36 months ($11,700) and doctoral students $375/month for 72 months ($27,000), interest free, thereby giving students a monthly payment tuition payment option versus taking out a federal financial aid loan.United States University (USU) began offering monthly payment plans in the summer of 2017. Today, monthly payment plans are available for the RN to BSN program ($250/month), MBA/M.A.Ed/MSN programs ($325/month), and the MSN-FNP program ($375/month).Since 1993, Aspen University has been nationally accredited by the Distance Education and Accrediting Council (“DEAC”), a nationalan institutional accrediting agency recognized by the U.S.United States Department of Education (the “DOE”). On February 25, 2015, the DEAC informed Aspen University that it had renewed its accreditation for five years to, through January 2019.Since 2009, USU has been regionallyinstitutionally accredited by WASC Senior College and University Commission. (“WSCUC”).Both universities are qualified to participate under the Higher Education Act of 1965, as amended (HEA) and the Federal student financial assistance programs (Title IV, HEA programs). USU has a provisional certification.COVID-19 UpdateNursing students represented 87% or 11,889 of the Company’s total student body of 13,724 students at the end of the third quarter of fiscal 2022. Of the 11,889 nursing students, 2,277 are BSN Pre-Licensure students located across our 4 metro locations (Phoenix, Austin, Tampa and Nashville). The remaining 9,612 nursing students are licensed registered nurses (RNs) studying to earn an advanced degree (RN to BSN, MSN, MSN-FNP or DNP degree programs). Therefore, these 9,612 post-licensure nursing students represent 70% of the Company’s total student body at the end of the third quarter and are the AGI students primarily affected by the COVID-19 pandemic.Starting in the second half of June 2021 and continuing through January 2022, the Company saw lower course starts than seasonally expected among our RN student body. For example, at Aspen University, course starts among RNs from June through January 2022 increased by approximately 3% year-over-year.By comparison, over the previous two full fiscal years (Fiscal Year 2021 and Fiscal Year 2020), course starts among RNs at Aspen University increased by an average of approximately 10% year-over-year.We cannot be certain what impact future COVID-19 variants will have on the Company’s results as we progress through the remainder of fiscal 2022.Basis of PresentationA. Interim Financial StatementsThe interim consolidated financial statements included herein have been prepared by the Company, without audit, pursuant to the rules and regulations of the Securities and Exchange Commission (the “SEC”). In the opinion of the Company’s management, all adjustments (consisting of normal recurring adjustments and reclassifications and non-recurring adjustments) necessary to present fairly our results of operations for the three and nine months ended January 31, 20182022 and 2017,2021, our cash flows for the nine months ended January 31, 20182022 and 2017,2021, and our financial position as of January 31, 20182022 have been made.8ASPEN GROUP, INC. AND SUBSIDIARIESCONDENSED NOTES TO CONSOLIDATED FINANCIAL STATEMENTSJanuary 31, 2022(Unaudited)The results of operations for such interim periods are not necessarily indicative of the operating results to be expected for the full year.Certain information and disclosures normally included in the notes to the annual consolidated financial statements have been condensed or omitted from these interim consolidated financial statements. Accordingly, these interim consolidated financial statements should be read in conjunction with the consolidated financial statements and notes thereto included in our Annual Report on Form 10-K for the periodfiscal year ended April 30, 20172021 as filed with the SEC on July 25, 2017.13, 2021. The April 30, 20172021 consolidated balance sheet is derived from those statements.7ASPEN GROUP, INC. AND SUBSIDIARIESCONDENSED NOTES TO CONSOLIDATED FINANCIAL STATEMENTSJANUARY 31, 2018(Unaudited)B. LiquidityAt January 31, 2018, the Company had a cash balance of $3,803,080 plus $190,506 in restricted cash.On July 25, 2017, the Company signed a $10 million senior secured term loan with Runway Growth Capital Fund (formerly known as GSV Growth Capital Fund). The Company drew $5 million under the facility at closing, with an additional $2.5 million drawn following the closing of the Company’s acquisition of substantially all the assets of United States University, including receipt of all required regulatory approvals, among other conditions to funding. Terms of the 4-year senior loan include a 10% over 3-month LIBOR per annum interest rate. (See Notes 5 and 10).
Principles
Use
The
and Restricted Cash
Goodwill and Intangibles
Goodwill represents the excess of purchase price over the fair market value of assets acquired and liabilities assumed from Educacion Significativa, LLC. Goodwill has an indefinite life and is not amortized. Goodwill is tested annually for impairment.
Intangibles represent both indefinite lived and definite lived assets. Accreditation and regulatory approvals and Trade name and trademarks are deemed to have indefinite useful lives and accordingly are not amortized but are tested annually for impairment. Student relationships and curriculums are deemed to have definite lives and are amortized accordingly.
8
ASPEN GROUP, INC. AND SUBSIDIARIES
CONDENSED NOTES TO CONSOLIDATED FINANCIAL STATEMENTS
JANUARY 31, 2018
(Unaudited)
Fair Value Measurements
Fair value is the exchange price that would be received for an asset or paid to transfer a liability (an exit price) in the principal or most advantageous market for the asset or liability in an orderly transaction between market participants. The Company classifies assets and liabilities recorded at fair value under the fair value hierarchy based upon the observability of inputs used in valuation techniques. Observable inputs (highest level) reflect market data obtained from independent sources, while unobservable inputs (lowest level) reflect internally developed market assumptions. The fair value measurements are classified under the following hierarchy:
Level 1—Observable inputs that reflect quoted market prices (unadjusted) for identical assets and liabilities in active markets;
Level 2—Observable inputs, other than quoted market prices, that are either directly or indirectly observable in the marketplace for identical or similar assets and liabilities, quoted prices in markets that are not active, or other inputs that are observable or can be corroborated by observable market data for substantially the full term of the assets and liabilities; and
Level 3—Unobservable inputs that are supported by little or no market activity that are significant to the fair value of assets or liabilities.
The estimated fair value of certain financial instruments, including cash and cash equivalents, accounts receivable, accounts payable and accrued expenses are carried at historical cost basis, which approximates their fair values because of the short-term nature of these instruments.
Refunds Due Students
The Company receives Title IV funds from the Department of Education to cover tuition and living expenses. After deducting tuition and fees, the Company sends checks for the remaining balances to the students.
institutions.
Revenues consist
The Company has revenues from students outside the United States representing 2.1% of the revenues for the quarter ended January 31, 2018.
Accounting for Derivatives
The Company evaluates its convertible instruments, options, warrants or other contracts to determine if those contracts or embedded components of those contracts qualify as derivatives to be separately accounted for under ASC Topic 815, “Derivatives and Hedging”. The result of this accounting treatment is that the fair value of the derivative is marked-to-market each balance sheet date and recorded as a liability. In the event that the fair value is recorded as a liability, the change in fair value is recorded in the statement of operations as other income (expense). Upon conversion, exercise, or other extinguishment (transaction) of a derivative instrument, the instrument is marked to fair value at the transaction date and then that fair value is recognized as an extinguishment gain or loss. Equity instruments that are initially classified as equity that become subject to reclassification under ASC Topic 815 are reclassified to liability at the fair value of the instrument on the reclassification date.
9
ASPEN GROUP, INC. AND SUBSIDIARIES
CONDENSED NOTES TO CONSOLIDATED FINANCIAL STATEMENTS
JANUARY 31, 2018
(Unaudited)
Business Combinations
We include the results of operations of businesses we acquire from the date of the respective acquisition. We allocate the purchase price of acquisitions to the assets acquired and liabilities assumed at fair value. The excess of the purchase price of an acquired business over the amount assigned to the assets acquired and liabilities assumed is recorded as goodwill. We expense transaction costs associated with business combinations as incurred.
As required to be disclosed for quarters with net income, basiccurriculum and diluted income per share foreducational delivery needs of its online and campus students regardless of geography. The Company's chief operating decision makers, its Chief Executive Officer, Chief Operating Officer and Chief Academic Officer, manage the three months ended January 31, 2017, were calculatedCompany's operations as follows:
|
| Basic |
|
| Diluted |
| ||
Numerator |
|
|
|
|
|
| ||
Net income applicable to common stock |
| $ | 7,377 |
|
| $ | 7,377 |
|
Convertible debt interest |
|
| — |
|
|
| 4,010 |
|
|
| $ | 7,377 |
|
| $ | 11,387 |
|
|
|
|
|
|
|
|
|
|
Denominator |
|
|
|
|
|
|
|
|
Weighted average common shares outstanding |
|
| 11,467,345 |
|
|
| 11,467,345 |
|
Convertible debt |
|
| — |
|
|
| 75,596 |
|
Warrants and options |
|
| — |
|
|
| 1,498,029 |
|
|
|
| 11,467,345 |
|
|
| 13,040,970 |
|
|
|
|
|
|
|
|
|
|
Net income per share |
| $ | 0.00 |
|
| $ | 0.00 |
|
a whole.
Pronouncement Not Yet Adopted
ASU 2017-04 - In January 2017,2022 for SEC filers that are eligible to be smaller reporting companies under the Financial Accounting Standards Board issued Accounting Standards Update No. 2017-04: "Intangibles - GoodwillSEC’s definition, as well as private companies and Other (Topic 350)” - to simplify how an entity is required to test goodwill for impairment by eliminating Step 2 from the goodwill impairment test. Step 2 measures a goodwill impairment loss by comparing the implied fair value of a reporting unit’s goodwill with the carrying amount of that goodwill. This guidance is effective for interim and annual reporting periods beginning after December 15, 2019.not-for-profit entities. The Company is currently evaluating the effects of this standard on its consolidated financial statements.
ASU 2016-02- In February 2016, the Financial Accounting Standards Board issued Accounting Standards Update No. 2016-02: “Leases (Topic 842)”whereby lessees will need to recognize almost all leases on their balance sheet as a right of use assetnew guidance and a lease liability. This guidance is effective for interim and annual reporting periods beginning after December 15, 2018. The Company expects this ASU will increase its assets and liabilities, but have no net material impact on its consolidated financial statements.
10
ASPEN GROUP, INC. AND SUBSIDIARIES
CONDENSED NOTES TO CONSOLIDATED FINANCIAL STATEMENTS
JANUARY 31, 2018
(Unaudited)
ASU 2014-09 - In May 2014, the Financial Accounting Standards Board issued Update No. 2014-09: “Revenue from Contracts with Customers (Topic 606)” which requires that an entity recognize revenue to depict the transfer of promised goods and services to customers in an amount that reflects the consideration to which the Company expects to be entitled in exchange for those goods or services. Since the issuance of the original standard, the FASB has issued several updates to the standard which i) clarify the application of the principal versus agent guidance; ii) clarify the guidance relating to performance obligations and licensing; iii) clarify assessment of the collectability criterion, presentation of sales taxes, measurement date for non-cash consideration and completed contracts at transaction; and iv) clarify narrow aspects of ASC 606 or corrects unintended application of the guidance. The new revenue recognition standard, amended by the updates, becomes effective in the first quarter of fiscal 2019 and is to be applied retrospectively using one of two prescribed methods. Early adoption is permitted. The Company currently plans to adopt the new standard effective May 1, 2018 and does not believeyet determined whether the adoption of thisthe new standard will have a material impact on its consolidated financial statements or the amount or timingmethod of its revenues.
|
| January 31, |
|
| April 30, |
| ||
|
| 2018 |
|
| 2017 |
| ||
Call center hardware |
| $ | 96,305 |
|
| $ | 53,748 |
|
Computer and office equipment |
|
| 130,137 |
|
|
| 103,649 |
|
Furniture and fixtures |
|
| 712,209 |
|
|
| 255,984 |
|
Software |
|
| 2,590,297 |
|
|
| 2,131,344 |
|
|
|
| 3,528,948 |
|
|
| 2,544,725 |
|
Accumulated depreciation and amortization |
|
| (1,161,030 | ) |
|
| (1,090,010 | ) |
Property and equipment, net |
| $ | 2,367,918 |
|
| $ | 1,454,715 |
|
the corresponding amount of accumulated depreciation is reversed. Any remaining difference between the two is recognized as either other income or expense.
|
| January 31, |
|
| April 30, |
| ||
|
| 2018 |
|
| 2017 |
| ||
Software |
| $ | 2,590,297 |
|
| $ | 2,131,344 |
|
Accumulated amortization |
|
| (1,012,655 | ) |
|
| (994,017 | ) |
Software, net |
| $ | 1,577,642 |
|
| $ | 1,137,327 |
|
following:
| January 31, 2022 | April 30, 2021 | ||||||||||
| Software | $ | 9,829,329 | $ | 8,488,635 | |||||||
| Accumulated amortization | (4,727,413) | (3,444,325) | |||||||||
| Software, net | $ | 5,101,916 | $ | 5,044,310 | |||||||
|
| For the |
|
| For the |
| ||||||||||
|
| Three Months Ended January 31, |
|
| Nine Months Ended January 31, |
| ||||||||||
|
| 2018 |
|
| 2017 |
|
| 2018 |
|
| 2017 |
| ||||
|
|
|
|
|
|
|
|
|
|
|
|
| ||||
Depreciation and amortization Expense |
| $ | 150,596 |
|
| $ | 119,064 |
|
| $ | 407,346 |
|
| $ | 378,118 |
|
|
|
|
|
|
|
|
|
|
|
|
|
|
|
|
|
|
Software amortization Expense |
| $ | 121,695 |
|
| $ | 105,914 |
|
| $ | 341,825 |
|
| $ | 342,938 |
|
The following is a schedule of estimated future amortization expense of software at January 31, 2018:
Year Ending April 30, |
|
|
| |
2018 |
| $ | 127,811 |
|
2019 |
|
| 456,038 |
|
2020 |
|
| 386,196 |
|
2021 |
|
| 313,749 |
|
2022 |
|
| 293,848 |
|
Total |
| $ | 1,577,642 |
|
11
ASPEN GROUP, INC. AND SUBSIDIARIES
CONDENSED NOTES TO CONSOLIDATED FINANCIAL STATEMENTS
JANUARY 31, 2018
(Unaudited)
summarized below:
| Three Months Ended January 31, | Nine Months Ended January 31, | ||||||||||||||||||||||
| 2022 | 2021 | 2022 | 2021 | ||||||||||||||||||||
| Depreciation and amortization expense: | |||||||||||||||||||||||
| Property and equipment, excluding software | $ | 418,081 | $ | 158,110 | $ | 1,136,929 | $ | 490,868 | |||||||||||||||
| Software | $ | 443,284 | $ | 366,908 | $ | 1,283,088 | $ | 1,028,668 | |||||||||||||||
Courseware costs capitalized were $33,369 for and Accreditation
Courseware consisted of the following at January 31, 2018 and April 30, 2017:
|
| January 31, |
|
| April 30, |
| ||
|
| 2018 |
|
| 2017 |
| ||
Courseware |
| $ | 283,046 |
|
| $ | 271,777 |
|
Accumulated amortization |
|
| (145,489 | ) |
|
| (126,300 | ) |
Courseware, net |
| $ | 137,557 |
|
| $ | 145,477 |
|
Amortization expense of coursewarewrite-offs for the three and nine months ended January 31, 20182022 and 2017:
|
| For the |
|
| For the |
| ||||||||||
|
| Three Months Ended January 31, |
|
| Nine Months Ended January 31, |
| ||||||||||
|
| 2018 |
|
| 2017 |
|
| 2018 |
|
| 2017 |
| ||||
|
|
|
|
|
|
|
|
|
|
|
|
| ||||
Amortization expense |
| $ | 13,966 |
|
| $ | 13,663 |
|
| $ | 41,289 |
|
| $ | 44,664 |
|
The following2021.
| January 31, 2022 | April 30, 2021 | ||||||||||
| Courseware | $ | 569,483 | $ | 408,222 | |||||||
| Accreditation | 59,350 | 59,350 | |||||||||
| 628,833 | 467,572 | ||||||||||
| Accumulated amortization | (339,153) | (280,276) | |||||||||
| Courseware and accreditation, net | $ | 289,680 | $ | 187,296 | |||||||
| Three Months Ended January 31, | Nine Months Ended January 31, | ||||||||||||||||||||||
| 2022 | 2021 | 2022 | 2021 | ||||||||||||||||||||
| Amortization expense | $ | 21,744 | $ | 10,255 | $ | 58,877 | $ | 32,718 | |||||||||||||||
Year Ending April 30, |
|
|
| |
2018 |
| $ | 14,152 |
|
2019 |
|
| 56,143 |
|
2020 |
|
| 42,301 |
|
2021 |
|
| 15,336 |
|
2022 |
|
| 9,625 |
|
Total |
| $ | 137,557 |
|
2022
Note and Accounts Receivable
The Company will be required to begin making principal repayments upon the 24-month anniversary of the initial closing (July 24, 2019), and each month thereafter will repay 1/24th of the total loan amount outstanding. Should the Company achieve both annualized revenue growth of at least 30% and operating margin of at least 7.5% for any 12-month trailing period, thenissuance at the quarter-end of that 12-month trailing period, the Company may elect to extend the interest only period for the quarter immediately following the 12-month trailing period throughout the duration of the loan.
Additionally, the Company paid a 0.25% origination fee on the initial $5 million draw and paid another 0.25% origination fee upon the second $2.5 million draw, will be subject to a final payment fee of 3.25% of the principal lent, and issued 224,174 5-year warrants at an exercise price of $6.87.$5.85 per share. The relative fair value of the warrants was $478,428 and was recorded as debt discount along with other direct costs of the term loanis $137,500 and is being amortized to interest expense over the 14-month line of credit period. The fair value of the warrants are treated as deferred financing costs in the accompanying consolidated balance sheets at January 31, 2022 to be amortized over the term of the loan.
12
ASPEN GROUP, INC. AND SUBSIDIARIES
CONDENSED NOTES TO CONSOLIDATED FINANCIAL STATEMENTS
JANUARYCredit Facility. Total unamortized costs at January 31, 2018
(Unaudited)
2022 were $88,393. See Note 6. Convertible Notes – Related Party
On December 1, 2017,7. Stockholders’ Equity for additional information related to these warrants.
Note 7. Commitments and Contingencies
Employment Agreements
From time to time, the Company enters into employment agreements with certain of its employees. These agreements typically include bonuses, some of which are performance-based in nature. As of January 31, 2018, no performance bonuses have been earned.
Legal Matters
From time to time, we may be involved in litigation relating to claims arising out of our operations in the normal course of business. As of January 31, 2018, there were no pending or threatened lawsuits that could reasonably be expecteddeemed to have a material effectrelative fair value of $255,071 (the "2018 Cooperman Warrants"). These warrants were exercised on the results of our operations.
Regulatory Matters
June 8, 2020. The Company’s subsidiaries, Aspen University and United States University, are subject to extensive regulation by Federal and State governmental agencies and accrediting bodies. In particular, the Higher Education Act (the “HEA”) and the regulations promulgated thereunder by the DOE subject the subsidiaries to significant regulatory scrutiny on the basis of numerous standards that schools must satisfy to participate in the various types of federal student financial assistance programs authorized under Title IVfair value of the HEA.
On August 22, 2017,warrants along with the DOE informed Aspen Universityupfront Facility fee were treated as debt issue cost assets to be amortized over the term of its determination that the institution has qualified to participate underloan. As a result of the HEA andaforementioned note extension, the Federal student financial assistance programs (Title IV, HEA programs), and set a subsequent program participation agreement reapplication dateremainder of Marchthe unamortized costs of $9,722 were written off during the quarter ended October 31, 2021.
USU currently has provisional certification to participate in the Title IV Programs due to the business combination. The provisional certification allows the school to continue to receive Title IV funding as it did prior to the change Total unamortized costs at January 31, 2022 and April 30, 2021 were $0 and $18,056, respectively.
JANUARY
(Unaudited)
Return Equity Incentive Plan (the “2018 Plan”) that provide for the grant of Title IV Funds
An institution participatingshares in Title IV Programs must correctly calculatethe form of incentive stock options, non-qualified stock options, restricted shares, stock appreciation rights and RSUs to employees, consultants, officers and directors. The 2012 Plan expired March 15, 2022 and remains in effect for outstanding grants only, and is no longer available for new grants. On March 8, 2022 we transferred the 129,009 unused shares under the 2012 Plan to the 2018 Plan.
| Restricted Stock Units | Number of Shares | Weighted Average Grant Price | ||||||||||||
| Unvested balance outstanding, April 30, 2021 | 549,972 | $ | 6.58 | |||||||||||
| Granted | 514,142 | 5.62 | ||||||||||||
| Forfeits | (36,353) | 9.67 | ||||||||||||
| Vested | (75,124) | (1) | 4.54 | |||||||||||
| Expired | — | — | ||||||||||||
| Unvested balance outstanding, January 31, 2022 | 952,637 | $ | 4.84 | |||||||||||
| Warrants | Number of Shares | Weighted Average Exercise Price | Weighted Average Remaining Contractual Term | Aggregate Intrinsic Value | ||||||||||||||||||||||
| Balance Outstanding, April 30, 2021 | 374,174 | $ | 6.37 | 1.90 | $ | — | ||||||||||||||||||||
| Granted | 75,000 | $ | 6.23 | 4.55 | — | |||||||||||||||||||||
| Exercised | — | $ | — | — | — | |||||||||||||||||||||
| Surrendered | — | $ | — | — | — | |||||||||||||||||||||
| Expired | — | $ | — | — | — | |||||||||||||||||||||
| Balance Outstanding, January 31, 2022 | 449,174 | $ | 6.35 | 1.71 | $ | — | ||||||||||||||||||||
| Exercisable, January 31, 2022 | 424,174 | $ | 6.31 | 1.55 | $ | — | ||||||||||||||||||||
| OUTSTANDING WARRANTS | EXERCISABLE WARRANTS | |||||||||||||||||||||||||||||||
| Exercise Price | Weighted Average Exercise Price | Outstanding No. of Warrants | Weighted Average Exercise Price | Weighted Average Remaining Life In Years | Exercisable No. of Warrants | |||||||||||||||||||||||||||
| $ | 4.89 | $ | 4.89 | 50,000 | $ | 4.89 | 2.19 | 50,000 | ||||||||||||||||||||||||
| $ | 5.85 | $ | 5.85 | 50,000 | $ | 5.85 | 4.58 | 50,000 | ||||||||||||||||||||||||
| $ | 6.00 | $ | 6.00 | 100,000 | $ | 6.00 | 2.09 | 100,000 | ||||||||||||||||||||||||
| $ | 6.87 | $ | 6.87 | 224,174 | $ | 6.87 | 0.48 | 224,174 | ||||||||||||||||||||||||
| $ | 6.99 | $ | 6.99 | 25,000 | ||||||||||||||||||||||||||||
| 449,174 | 424,174 | |||||||||||||||||||||||||||||||
| Options | Number of Shares | Weighted Average Exercise Price | Weighted Average Remaining Contractual Term | Aggregate Intrinsic Value | ||||||||||||||||||||||
| Balance Outstanding, April 30, 2021 | 1,214,473 | $ | 6.24 | 1.88 | $ | 204,719 | ||||||||||||||||||||
| Granted | — | — | — | — | ||||||||||||||||||||||
| Exercised | (258,419) | 5.60 | — | — | ||||||||||||||||||||||
| Forfeited | (4,586) | 4.59 | — | — | ||||||||||||||||||||||
| Expired | (22,793) | 3.21 | — | — | ||||||||||||||||||||||
| Balance Outstanding, January 31, 2022 | 928,675 | $ | 6.84 | 1.41 | $ | — | ||||||||||||||||||||
| Exercisable, January 31, 2022 | 891,264 | $ | 6.92 | 1.38 | $ | — | ||||||||||||||||||||
| OUTSTANDING OPTIONS | EXERCISABLE OPTIONS | |||||||||||||||||||||||||||||||
| Exercise Price | Weighted Average Exercise Price | Outstanding Number of Options | Weighted Average Exercise Price | Weighted Average Remaining Life In Years | Exercisable Number of Options | |||||||||||||||||||||||||||
| $3.24 to $4.38 | $ | 4.14 | 115,890 | $ | 4.15 | 0.94 | 103,389 | |||||||||||||||||||||||||
| $4.50 to $5.20 | $ | 4.99 | 153,944 | $ | 5.03 | 1.77 | 137,394 | |||||||||||||||||||||||||
| $5.95 to $6.28 | $ | 5.95 | 28,000 | $ | 5.95 | 0.55 | 28,000 | |||||||||||||||||||||||||
| $7.17 to $7.55 | $ | 7.45 | 473,092 | $ | 7.46 | 1.57 | 465,092 | |||||||||||||||||||||||||
| $8.57 to $9.07 | $ | 8.98 | 157,749 | $ | 8.98 | 0.93 | 157,749 | |||||||||||||||||||||||||
| 928,675 | 891,624 | |||||||||||||||||||||||||||||||
| Three Months Ended January 31, | Nine Months Ended January 31, | ||||||||||||||||||||||
| 2022 | 2021 | 2022 | 2021 | ||||||||||||||||||||
Tuition - recognized over period of instruction | $ | 16,550,586 | $ | 14,580,439 | $ | 50,304,380 | $ | 42,922,429 | |||||||||||||||
Course fees - recognized over period of instruction | 1,981,470 | 1,834,251 | 5,967,581 | 5,220,308 | |||||||||||||||||||
Book fees - recognized at a point in time | — | 44,468 | 42,777 | 129,643 | |||||||||||||||||||
Exam fees - recognized at a point in time | 199,924 | 69,500 | 590,337 | 219,055 | |||||||||||||||||||
Service fees - recognized at a point in time | 212,818 | 96,179 | 410,929 | 270,009 | |||||||||||||||||||
| $ | 18,944,798 | $ | 16,624,837 | $ | 57,316,004 | $ | 48,761,444 | ||||||||||||||||
Subsequent to a compliance audit, USU recognized that it had not fully complied with all requirements for calculating and making timely returns of Title IV funds (R2T4). In 2016, USU had a material findingsummarized below:
| January 31, 2022 | April 30, 2021 | |||||||||||||
| ROU assets - Operating facility leases | $ | 15,958,721 | $ | 14,308,296 | ||||||||||
| Less: accumulated amortization | (2,868,251) | (1,593,433) | ||||||||||||
| Total ROU assets | $ | 13,090,470 | $ | 12,714,863 | ||||||||||
| January 31, 2022 | April 30, 2021 | |||||||||||||
| Total lease liabilities | $ | 22,509,568 | $ | 19,946,229 | ||||||||||
| Reduction of lease liabilities | (3,085,191) | (1,617,600) | ||||||||||||
| Total operating lease obligations | $ | 19,424,377 | $ | 18,328,629 | ||||||||||
Delaware Approval to Confer Degrees
Aspen Universityfollowing is a Delaware corporation. Delaware law requires an institutionschedule by fiscal years of future minimum lease payments required under operating leases that have initial or remaining non-cancelable lease terms in excess of one year as of January 31, 2022
| Maturity of Lease Obligations | Lease Payments | |||||||
| 2022 (remaining) | $ | 1,139,587 | ||||||
| 2023 | 4,142,637 | |||||||
| 2024 | 4,018,977 | |||||||
| 2025 | 3,802,960 | |||||||
| 2026 | 3,908,722 | |||||||
| Thereafter | 11,963,226 | |||||||
| Total future minimum lease payments | 28,976,109 | |||||||
| Less: imputed interest | (9,551,732) | |||||||
| Present value of operating lease liabilities | $ | 19,424,377 | ||||||
| Balance Sheet Classification | January 31, 2022 | April 30, 2021 | ||||||||||||
| Operating lease obligations, current portion | $ | 2,106,981 | $ | 2,029,821 | ||||||||||
| Operating lease obligations, less current portion | 17,317,396 | 16,298,808 | ||||||||||||
| Total operating lease liabilities | $ | 19,424,377 | $ | 18,328,629 | ||||||||||
| Other Information | January 31, 2022 | |||||||
| Weighted average remaining lease term (in years) | 6.97 | |||||||
| Weighted average discount rate | 12 | % | ||||||
USU is alsoreserve of approximately $300,000 for the estimate of the 2013 through 2021 tax year foreign income tax liability. Additionally, for the 2022 tax year, the Company recorded a Delaware corporation and is inreserve of approximately $75,000 for the process of obtaining Delaware approval.
Common Stock
Effective May 24, 2017,11. Commitments and Contingencies
JANUARY 31, 2018
(Unaudited)
Warrants
A summary of the Company’s warrant activity during the nine months ended
|
|
|
|
|
|
|
| Weighted |
|
|
|
| ||||
|
|
|
|
| Weighted |
|
| Average |
|
|
|
| ||||
|
|
|
|
| Average |
|
| Remaining |
|
| Aggregate |
| ||||
|
| Number of |
|
| Exercise |
|
| Contractual |
|
| Intrinsic |
| ||||
Warrants |
| Shares |
|
| Price |
|
| Term |
|
| Value |
| ||||
Balance outstanding, April 30, 2017 |
|
| 914,123 |
|
| $ | 2.82 |
|
|
| 1.6 |
|
| $ | 1,100,203 |
|
Granted |
|
| 224,174 |
|
|
| 6.87 |
|
|
| 5.0 |
|
|
| 307,118 |
|
Exercised |
|
| (356,267 | ) |
|
| 0.55 |
|
|
| — |
|
|
| — |
|
Forfeited |
|
| — |
|
|
| — |
|
|
| — |
|
|
| — |
|
Expired |
|
| (38,257 | ) |
|
| — |
|
|
| — |
|
|
| — |
|
Balance outstanding, January 31, 2018 |
|
| 743,773 |
|
| $ | 4.08 |
|
|
| 2.1 |
|
| $ | 3,095,502 |
|
|
|
|
|
|
|
|
|
|
|
|
|
|
|
|
|
|
Exercisable, January 31, 2018 |
|
| 743,773 |
|
| $ | 4.08 |
|
|
| 2.1 |
|
| $ | 3,095,502 |
|
In connection with the Senior Secured Term Loan that was finalized on July 25, 2017, the Company issued 224,174 5-year warrants at an exercise price2022
The Company issued 241,514 shares of Common Stock in conjunction with the cash and cashless exercise of 356,267 warrants. The Company received $143,489 in conjunction with the cash exercises.
Stock Incentive Plan and Stock Option Grants to Employees and Directors
On March 13, 2012, the Company adopted the 2012 Equity Incentive Plan (the “Plan”) that provides for the grant of 1,691,667 shares effective November 2015, 2,108,333 shares effective June 2016 and 3,500,000 shares effective July 2017,our operations in the formnormal course of incentive stock options, non-qualified stock options, restricted shares, stock appreciation rights and restricted stock units to employees, consultants, officers and directors.business. As of January 31, 2018,2022, except as discussed below, there were 622,454no other pending or threatened lawsuits that could reasonably be expected to have a material effect on the results of our consolidated operations and there are no proceedings in which any of our directors, officers or affiliates, or any registered or beneficial shareholder, is an adverse party or has a material interest adverse to our interest.
| ||||||||
| ||||||||
|
| |||||||
|
|
| ||||||
|
|
| ||||||
|
| |||||||
The Company utilized the simplified method to estimate the expected life for stock options granted to employees. The simplified method was used as the Company does not have sufficient historical data regarding stock option exercises. The expected volatility is basedsignificant regulatory scrutiny on the averagebasis of numerous standards that schools must satisfy to participate in the various types of federal student financial assistance programs authorized under Title IV of the expected volatilities fromHEA.
15
JANUARY 31, 2018
(Unaudited)
A summary of the Company’s stock option activity for employees and directors during the nine months ended
|
|
|
|
| Weighted |
|
| Average |
|
|
|
| ||||
|
|
|
|
| Average |
|
| Remaining |
|
| Aggregate |
| ||||
|
| Number of |
|
| Exercise |
|
| Contractual |
|
| Intrinsic |
| ||||
Options |
| Shares |
|
| Price |
|
| Term |
|
| Value |
| ||||
Balance outstanding, April 30, 2017 |
|
| 2,097,384 |
|
| $ | 1.86 |
|
|
| 2.7 |
|
| $ | 12,489,871 |
|
Granted |
|
| 844,000 |
|
| $ | 3.53 |
|
|
| 3.4 |
|
|
| 1,867,740 |
|
Exercised |
|
| (63,838 | ) |
| $ | 3.13 |
|
|
| — |
|
|
| — |
|
Forfeited |
|
| — |
|
|
| — |
|
|
| — |
|
|
| — |
|
Expired |
|
| — |
|
|
| — |
|
|
| — |
|
|
| — |
|
Balance outstanding, January 31, 2018 |
|
| 2,877,546 |
|
| $ | 3.52 |
|
|
| 3.24 |
|
| $ | 17,658,268 |
|
|
|
|
|
|
|
|
|
|
|
|
|
|
|
|
|
|
Exercisable, January 31, 2018 |
|
| 1,083,484 |
|
| $ | 2.22 |
|
|
| 2.07 |
|
| $ | 8,727,757 |
|
On May 13, 2017,also subject to regulation by self-regulatory bodies such as accreditors and by state regulators in certain states including states where the Company granted its executive officershas a total of 500,000 five-year options to purchase shares of the Company’s common stock under the Plan. The options vest annually over three years, subject to continued employment at each applicable vesting date,physical presence. For certain recent information, see Note 12. Subsequent Events.
In May 2017, the Company issued 5,500 stock options to various employees at exercise prices ranging from $4.95 to $5.10 per share.
Effective June 11, 2017, the Company granted the Chief Academic Officer 30,000 five-year options. The options vest quarterly over a three-year period in 12 equal quarterly increments with the first vesting date being September 11, 2017, subject to continued employment on each applicable vesting date. The options are exercisable at $6.28 per share and the fair value is $54,000.
On August 21, 2017, 53,000 options were issued to 26 employees with an exercise price of $5.95 per share and a fair value of $90,630.
On January 4, 2018, 180,000 options were issued to the board of directors with an exercise price of $9.07 per share and a fair value of $421,200.
On January 14, 2018, 75,500 options were issued to employees with an exercise price of $8.57 per share and a fair value of $152,510.
During the nine months ended January 31, 2018, the company issued 113,597 shares of common stock in conjunction with the exercise of 63,838 stock options. The company received $455,387 related to these exercises.
As of January 31, 2018, there was $1,474,855 of unrecognized compensation costs related to nonvested share-based compensation arrangements. That cost is expected to be recognized over a weighted-average period of 2.0 years.
The Company recorded compensation expense of $466,468 and $253,833 for the nine months ended January 31, 2018 and 2017, respectively, in connection with stock options.
Note 9. Related Party Transactions
See Note 6 for discussion of convertible notes payable to a related party.
16
ASPEN GROUP, INC. AND SUBSIDIARIES
CONDENSED NOTES TO CONSOLIDATED FINANCIAL STATEMENTS
JANUARY 31, 2018
(Unaudited)
Note 10 – Acquisition of USU
On December 1, 2017 certain assets were acquired and certain liabilities assumed from Educacion Significativa, LLC (dba United States University) by United States University Inc. United States University, Inc. isderive a wholly owned subsidiaryportion of Aspen Group Inc. (“AGI”) and was set up for purposes of finalizing the asset purchase transaction. For purposes of purchase accounting, Aspen Group, Inc. is referred to as the acquirer. Aspen Group, Inc. acquired the assets and assumed the liabilities of Educacion Significativa, LLC (dba United States University) for a purchase price of approximately $14.8 million. The purchase consideration consisted of a cash payment of $2,500,000 less an adjustment for working capital of approximately $110,000 plus approximately $200,000 of additional costs paid to/on behalf of and for the benefittheir revenue from financial aid received by its students under programs authorized by Title IV of the seller, a convertible noteHEA, which are administered by the US Department of $2,000,000Education. When students seek funding from the federal government, they receive loans and 1,203,209 shares of AGI stock valued at the quoted closing price of $8.49 per share as of November 30, 2017. The stock consideration represents $10,215,244 of the purchase consideration.
The acquisition was accounted for by AGI in accordance with the acquisition method of accounting pursuantgrants to ASC 805 “Business Combinations” and pushdown accounting was applied to record the fair value of the assets acquired and liabilities assumed on United States University, Inc. Under this method, the purchase price is allocated to the identifiable assets acquired and liabilities assumed based onfund their estimated fair values at the date of acquisition. The excess of the amount paid over the estimated fair values of the identifiable net assets was $5,011,432 which has been reflected in the balance sheet as goodwill.
The following is a summary of the estimated fair value of the assets acquired and liabilities assumed at the date of acquisition:
|
| Purchase Price Allocation |
|
| Useful Life |
| ||
Cash and cash equivalents |
| $ | — |
|
|
|
| |
Current assets acquired |
|
| 244,465 |
|
|
|
|
|
Other assets acquired |
|
| 176,667 |
|
|
|
|
|
Intangible assets |
|
|
|
|
|
|
|
|
Accreditation and regulatory approvals |
|
| 6,200,000 |
|
|
|
|
|
Trade name and trademarks |
|
| 1,700,000 |
|
|
|
|
|
Student relationships |
|
| 2,000,000 |
|
| 2 years |
| |
Curriculum |
|
| 200,000 |
|
| 1 year |
| |
Goodwill |
|
| 5,011,432 |
|
|
|
|
|
Less: Current liabilities assumed |
|
| (727,601 | ) |
|
|
|
|
Total purchase price |
| $ | 14,804,963 |
|
|
|
|
|
We determined the fair value of assets acquired and liabilities assumed based on assumptions that reasonable market participants would use while employing the concept of highest and best use of the respective items. We usededucation under the following assumptions,Title IV Programs: (1) the majority of which include significant unobservable inputs (Level 3),Federal Direct Loan program, or Direct Loan; (2) the Federal Pell Grant program, or Pell; (3) Federal Work Study and valuation methodologies to determine fair value:
·
Intangibles - We used the multiple period excess earnings method to value the Accreditation and regulatory approvals. The Trade name and trademarks were valued using the relief-from-royalty method, which represents the benefit of owning these intangible assets rather than paying royalties for their use. The Student relationships were valued using the excess earnings method. The curriculum was valued using the replacement cost approach.
·
Other assets and liabilities - The carrying value of all other assets and liabilities approximated fair value at the time of acquisition.
The goodwill resulting from the acquisition may become deductible for tax purposes in the future. The goodwill resulting from the acquisition is principally attributable to the future earnings potential associated with enrollment growth and other intangibles that do not qualify for separate recognition such as the assembled workforce.
We have selected an April 30th annual goodwill impairment test date.
17
ASPEN GROUP, INC. AND SUBSIDIARIES
CONDENSED NOTES TO CONSOLIDATED FINANCIAL STATEMENTS
JANUARY 31, 2018
(Unaudited)
We assigned an indefinite useful life to the accreditation and regulatory approvals and the trade name and trademarks as we believe they have the ability to generate cash flows indefinitely. In addition, there are no legal, regulatory, contractual, economic or other factors to limit the intangibles’ useful life and we intend to renew the intangibles, as applicable, and renewal can be accomplished at little cost. We determined all other acquired intangibles are finite-lived and we are amortizing them on either a straight-line basis or using an accelerated method to reflect the pattern in which the economic benefits of the assets are expected to be consumed. Amortization for the period of inception through January 31, 2018 was $183,333.
The expected benefits from the business acquisition will allow USU, Inc. to achieve its vision of making college affordable again on a much broader scale along with providing various accreditations.
The Company is in the process of completing its accounting and valuations of USU, Inc. and accordingly, the estimated fair values and allocation of purchase price noted above is provisional pending the final valuation of the assets acquired and liabilities assumed which will not exceed one-year in accordance with ASC 805.
The total acquisition costs that AGI incurred was approximately $1,050,000, of which approximately $200,000 was incurred in(4) Federal Supplemental Opportunity Grants. For the fiscal year ended April 30, 20172021, 44.72% of Aspen University’s and $850,000 was incurred33.81% for United States University's cash-basis revenue for eligible tuition and fees were derived from Title IV Programs.
The resultsamount of operationsunearned Title IV Program funds that have been disbursed to students who withdraw from their educational programs before completion and must return those unearned funds in a timely manner, no later than 45 days of USU are included in the Company’s consolidated statement of operations from the date of acquisition of December 1, 2017. The following supplemental unaudited pro forma combined information assumesthe school determines that the acquisitions had occurred asstudent has withdrawn. Under the DOE regulations, failure to make timely returns of the beginningTitle IV Program funds for 5% or more of each period present:
|
| For the Year Ended |
|
| For the Nine Months Ended |
| ||
|
| (unaudited) |
|
| (unaudited) |
| ||
Revenue |
| $ | 18,038,474 |
|
| $ | 10,719,546 |
|
Net Loss |
| $ | (5,444,205 | ) |
| $ | (3,521,086 | ) |
Loss per common share- basic and diluted |
| $ | (0.47 | ) |
|
| $(0.26 | ) |
The pro forma financial information is not necessarily indicative of the results that would have occurred if these acquisitions had occurredstudents sampled on the dates indicated or thatinstitution's annual compliance audit in either of its two most recently completed fiscal years can result in the future.
Aspen’s pre-licensure BSN program is offered asArizona Board of Nursing regarding our future status, and until we have a full-time, three-year (nine semester) program that is specifically designed for students who do not currently hold a state nursing license and have no prior nursing experience. Aspen will admit students into three tracks; 1) High school graduates with no prior college credits, 2) students that have less than 48 general education prerequisites completed, and 3) students that have completed all 48 general education prerequisite credits and are ready to enterformal agreement in place we won’t be publicly commenting on the core Nursing courses and clinical experiences.
Related to that announcement, matter.
2024. WSCUC. students at both universities. Of the 11,889 students seeking nursing degrees, 9,612 are Registered Nurses (RNs) studying to earn an advanced degree, including 6,839 at Aspen University and 2,773 at USU, while the remaining 2,277 nursing students are enrolled in Aspen University’s Aspen University United States University Q3 FY’2018 Q3 FY’2018 New Student Enrollments 1,164 103 ** Active Student Body 6,066 446 -College of Nursing Students 4,401 326 Monthly Payment Method Students 4,194 204 New Student Enrollments Active Degree Seeking Student Body* Fiscal quarter end July 31, 2016 621 3,252 Fiscal quarter end October 31, 2016 811 3,726 Fiscal quarter end January 31, 2017 825 4,064 Fiscal quarter end April 30, 2017 986 4,681 Fiscal quarter end July 31, 2017 1,025 5,015 Fiscal quarter end October 31, 2017 1,255 5,641 Fiscal quarter end January 31, 2018 1,164 6,066 Total Degree-Seeking Active Student Body Nursing Degree- Seeking Active Student Body Nursing Degree-Seeking Active Student Body (%) Quarter ended October 31, 2016 3,726 2,538 68 % Quarter ended January 31, 2017 4,064 2,899 71 % Quarter ended April 30, 2017 4,681 3,363 72 % Quarter ended July 31, 2017 5,015 3,569 71 % Quarter ended October 31, 2017 5,641 4,068 72 % Quarter ended January 31, 2018 6,066 4,401 73 % option to attend their weekend immersions at three different metro locations: San Diego, Phoenix and Tampa. CPE/RPE Analysis * 6 Months Out 12 Months Out 2 Years Out 3 Years Out 4+ Years Out Courses completed 2.24 3.52 5.28 6.48 8 Average RPE $1,974 $3,078 $4,630 $5,684 $7,000 RPE % earned 28% 44% 66% 81% 100% Marketing efficiency ratio** 2.3x 3.5x 5.3x 6.5x 8.0x * Projection ** Based on current $876 CPE (six month rolling CPE average) operations as a percentage of revenue (differences due to rounding): and promotional costs for Q3 Fiscal 2022 were $4,352,271 or 23% of revenue compared to $3,644,856 or 22% of revenue for Q3 Fiscal 2021, an increase of $707,415 or 19%. You should read the following discussion in conjunction with our unaudited consolidated financial statements, which are included elsewhere in this Form 10-Q. Management’s Discussion and Analysis of Financial Condition and Results of Operations containThis Quarterly Report on Form 10-Q contains forward-looking statements that reflect our plans, estimates, and beliefs. Our actual results could differ materially from those discussed in the forward-looking statements. FactorsSee "Cautionary Note Regarding Forward Looking Statements" for more information.Key TermsIn connection with the management of our businesses, we identify, measure and assess a variety of operating metrics. The principal metrics we use in managing our businesses are set forth below:Operating Metrics•Lifetime Value ("LTV") - Lifetime Value as the weighted average total amount of tuition and fees paid by every new student that could cause or contribute to these differences include those discussedenrolls in the Risk Factors containedCompany’s universities, after giving effect to attrition.•Bookings - defined by multiplying LTV by new student enrollments for each operating unit.•Average Revenue per Enrollment ("ARPU") - defined by dividing total bookings by total enrollments for each operating unit.Operating costs and expenses•Cost of revenue - consists of instructional costs and services and marketing and promotional costs.◦Instructional costs - consist primarily of costs related to the administration and delivery of the Company's educational programs. This expense category includes compensation costs associated with online faculty, technology license costs and costs associated with other support groups that provide services directly to the students and are included in cost of revenue.◦Marketing and promotional costs - include costs associated with producing marketing materials and advertising, and outside sales costs. Such costs are generally affected by the Annual Reportcost of advertising media, the efficiency of the Company's marketing and recruiting efforts, and expenditures on Form 10-K filed on July 25, 2017 with the Securitiesadvertising initiatives for new and Exchange Commission,existing academic programs. Non-direct response advertising activities are expensed as incurred, or the SEC.All referencesfirst time the advertising takes place, depending on the type of advertising activity and are included in cost of revenue.•General and administrative expense - consists primarily of compensation expense (including stock-based compensation expense) and other employee-related costs for personnel engaged in executive and academic management and operations, finance, legal, tax, information technology and human resources, fees for professional services, financial aid processing costs, non-capitalizable courseware and software costs, corporate taxes and facilities costs.Non-GAAP financial measures:•Earnings Before Interest, Taxes, Depreciation and Amortization ("EBITDA") - is a non-GAAP financial measure. See "Non-GAAP Financial Measures" for a reconciliation of net loss to “we,” “our,” “us,” “AGI,”EBITDA for the three and “Aspen” refernine months ended January 31, 2022 and 2021.•Adjusted Earnings Before Interest, Taxes, Depreciation and Amortization ("Adjusted EBITDA")- is a non-GAAP financial measure. See "Non-GAAP Financial Measures" for a reconciliation of net loss to Adjusted EBITDA for the three and nine months ended January 31, 2022 and 2021.•Adjusted EBITDA Margin - is a non-GAAP financial measure. See "Non-GAAP Financial Measures" for a reconciliation of net loss to Adjusted EBITDA for the three and nine months ended January 31, 2022 and 2021.24Company OverviewAspen Group, Inc. and its subsidiaries,is an education technology holding company. It operates two universities, Aspen University Inc. (“("Aspen University”University") and United States University Inc. (“USU”("United States University" or "USU").All references to the “Company”, “AGI”, “Aspen Group”, “we”, “our” and “us” refer to Aspen Group, Inc., unless the context otherwise indicates.Company OverviewAspen Group, Inc. (together withAGI leverages its subsidiaries, the “Company” or “AGI”) is a holding company. AGI haseducation technology infrastructure and expertise to allow its two subsidiaries,universities, Aspen University Inc. (“Aspen University”) organized in 1987 and United States University, Inc. (“USU”). On March 13, 2012,to deliver on the Company was recapitalized in a reverse merger.Aspen Group’s vision is to makeof making college affordable again in America.again. Because we believe higher education should be a catalyst to our students’ long-term economic success, we exert financial prudence by offering affordable tuition that is one of the greatest values in online higher education. AGI’s primary focus relative to future growth is to target the high growth nursing profession.In March 2014, Aspen University unveiled abegan offering monthly payment plans available to all students across every online degree program offered by Aspen University. The monthly payment plan aimed at reversingis designed so that students will make one payment per month, and that monthly payment is applied towards the college-debt sentence plaguing working-class Americans.total cost of attendance (tuition and fees, excluding textbooks). The monthly payment plan offers bacheloronline undergraduate students (except RN to BSN) the opportunity to pay their tuition and fees at $250/month, for 72 months ($18,000), nursing bachelor students (RN to BSN) $250/month for 39 months ($9,750),online master students $325/month, for 36 months ($11,700) and online doctoral students $375/month, for 72 months ($27,000), interest free, thereby giving students a monthly payment tuition payment option versus taking out a federal financial aid loan.United States University (USU)USU began offering monthly payment plans in the summer of 2017. Today, monthly payment plans are available for the online RN to BSN program ($250/month), online MBA/M.A.Ed/MAEd/MSN programs ($325/month), online hybrid Bachelor of Arts in Liberal Studies, Teacher Credentialing tracks approved by the California Commission on Teacher Credentialing ($350/month), and the MSN-FNP program ($375/month).Since 1993, Aspen University has been nationally accredited by the Distance Education and Accrediting Council (“DEAC”),DEAC, a national accrediting agency recognized by the U.S. Department of Education (the “DOE”).and the Council for Higher Education Accreditation. On February 25, 2015,2019, the DEAC informed Aspen University that it had renewed its accreditation for five years to January 2019.Since 2009, USU has been regionally accredited by WASC Senior College and University Commission. (“WSCUC”).Both universities are qualified to participate under the Higher Education Act of 1965, as amended (HEA) and the Federal student financial assistance programs (Title IV, HEA programs).AGI Student Population Overview*Aspen University’sOverviewAGI’s overall active degree-seeking student body increased(includes both Aspen University and USU) grew 2% year-over-year by 49% during the fiscal quarter endedto 13,724 as of January 31, 2018,2022 from 4,064 to 6,066 students. United States University’s (USU’s) active degree-seeking student body grew from 212 to 44613,407 as of January 31, 2021 and students seeking nursing degrees were 11,889 or an increase87% of 110% from May, 2017 to January, 2018, highlighted by the College of Nursing growing to 326 students which now represents 73% of USU’s total active student body.most popular school is also its SchoolBSN Pre-Licensure program in the Phoenix, Austin, Tampa, Nashville and Atlanta metros.The chart below shows five quarters of Nursing, which represents 73% of Aspen’s total active student body similar to USU. Aspen’s Schoolresults. Active student body is comprised of Nursing grew from 2,899 to 4,401 student’s year-over-year, which represented 75% of Aspen’s active degree-seeking student body growth. At January 31, 2018, Aspen’s School of Nursing included 2,869 active students, in the RN to BSN program and 1,532 active students in the MSN program, RN to MSN Bridge program, or DNP program.*Note: “Active Degree-Seeking Students” are defined as degree-seeking students who were enrolled in a course duringat the end of the third quarter reported,of fiscal year 2022 or are registered for an upcoming course.25**Enrollment results for the two month period from December 1, 2017 – January 31, 2018.Aspen University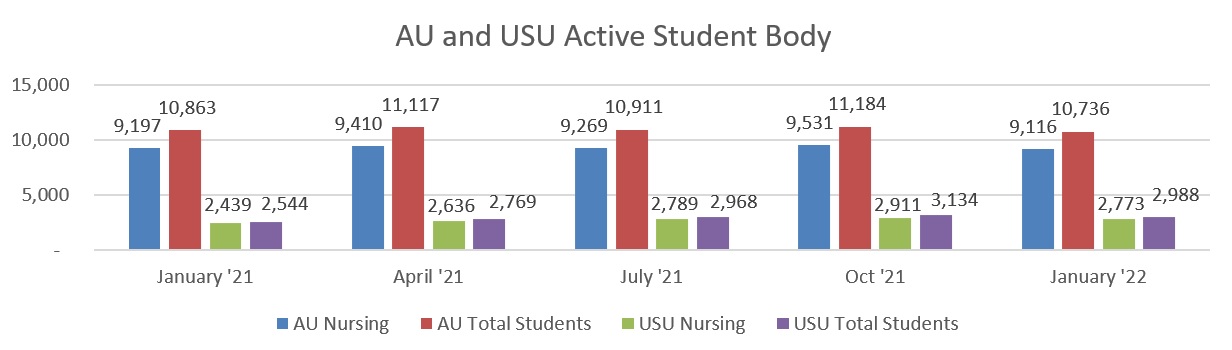 AGI New Student
 Enrollment and Active Degree Seeking Student Body GrowthSince the launch of the BSN marketing campaign in November, 2014, Aspen University’s growth rate ofEnrollmentsOn a Company-wide basis, new student enrollments has accelerated significantly. Below iswere down 16% year-over-year, primarily as a quarterly analysisresult of three factors.First, as previously announced, Aspen University dropped advertising spend in the BSN pre-licensure program in the Phoenix metro down to a maintenance spend through January 2022, causing enrollments in that metro to drop by 51% year-over-year.*Second, enrollments at USU were down 10% year-over-year given the impact of the growthongoing COVID-19 pandemic as prospective nursing post-licensure students continue to delay their education goals on a short-term basis as they continued to care for COVID patients.Third, in addition to Aspen University also seeing a COVID effect among prospective nursing post-licensure students, Aspen’s 2.0 business plan called for a $1.3 million annual reduction of ad spend in fiscal 2022 in Aspen’s post-licensure Nursing + Other unit which in the third quarter equated to a 14% drop in ad spend year-over-year. Consequently, given the drop in ad spend and the COVID effect, enrollments in the Aspen University’sNursing + Other unit dropped by 18% year-over-year.In summary, and to provide additional context, excluding the 51% drop in enrollments in the Phoenix metro (BSN pre-licensure program) and the 18% drop in enrollments in Aspen University's Nursing + Other unit, total enrollments for the Company would have been down by approximately 1% year-over-year.*Note: Beginning in the month of February 2022, Aspen University has temporarily suspended advertising spend and new pre-licensure student enrollments in the Phoenix metro.New student enrollments for the past five quarters are shown below:Q3'21 Q4'21 Q1'22 Q2'22 Q3'22 Aspen University 1,593 1,593 1,601 1,750 1,301 USU 536 589 675 630 481 Total 2,129 2,182 2,276 2,380 1,782 Bookings Analysis and ARPUOn a year-over-year basis, Q3 Fiscal 2022 Bookings decreased 20%, to $26.3 million from $33.0 million in the prior year. As previously discussed, the proactive Phoenix pre-licensure enrollment reduction, planned post licensure marketing reductions and the recent COVID surge caused Bookings to decrease year-over-year.On a year-over-year basis, Q3 Fiscal 2022 ARPU decreased 5% from the prior year period due primarily to a decrease in new enrollments at Aspen University in the pre-licensure program and Nursing + Other.26Third Quarter Bookings1 and Average Revenue Per Enrollment (ARPU)1Q3'21 Enrollments Q3'21 Bookings 1Q3'22 Enrollments Q3'22 Bookings 1Percent Change Total Bookings & ARPU 1Aspen University 1,593 $ 23,476,050 1,301 $ 17,776,050 USU 536 $ 9,551,520 481 $ 8,571,420 Total 2,129 $ 33,027,570 1,782 $ 26,347,470 (20) % ARPU $ 15,513 $ 14,785 (5) % _____________________1 “Bookings” are defined by multiplying Lifetime Value (LTV) by new student enrollments for each operating unit. “Average Revenue Per Enrollment” (ARPU) is defined by dividing total Bookings by total new student enrollments for each operating unit.During the Q3 Fiscal 2022, the Company continued to focus its growth capital almost exclusively on its two licensure degree programs which have higher lifetime values. Set forth below is the description of these two key licensure degree programs.Bachelor of Science in Nursing (BSN) Pre-Licensure ProgramAspen’s Pre-licensure BSN program provides students with opportunities to become a BSN-educated nurse and learn the essential skills needed to practice as well asa professional registered nurse (RN). Skills lab, clinical simulation, seminars and community-based clinical experiences anchor the curriculum. Upon completion of their studies, students are eligible to take the National Council Licensure Examination (NCLEX) in the state or territory in which they choose to practice (the NCLEX is the national registered nurse examination used by all states for potential registered nursing licensure). Students provide their state board of nursing applicable forms to the School of Nursing, which completes them on behalf of the individual student, and take the exam in the state in which they choose to practice. Upon passing the NCLEX, students then work with their state Board of Nursing to finalize their professional licensure.We designed this program for students who do not currently hold a state registered nurse license and have little to no prior nursing experience. For students with no prior college credits, the total cost of attendance is $52,175 ($41,445 Tuition, $10,730 Fees), not including textbooks.Phoenix, AZ Campus LocationsAspen University began offering the BSN Pre-Licensure program in July 2018 at its initial campus in Phoenix, Arizona.As a result of overwhelming demand in the Phoenix metropolitan area, in January 2019 Aspen University began offering both day (July, November, March) and evening/weekend (January, May, September) terms, equaling six term starts per year. In September 2019, Aspen University opened a second campus in the Phoenix metropolitan area in partnership with HonorHealth.Note that Aspen University previously announced that it has voluntarily suspended new student enrollments and the formation of new cohorts immediately (starting with February 2022 cohort) after receiving guidance from the Arizona State Board of Nursing at its January 28, 2022 meeting. We will not form any additional nursing cohorts in the Phoenix metropolitan without prior approval from the Board of Nursing.Atlanta, GAOn January 20, 2022, the Company announced that Aspen University received the final required state and board of registered nursing regulatory approvals for their new BSN Pre-Licensure campus location in Atlanta, Georgia. The Atlanta site was occupied by the University of Phoenix, located at 859 Mt. Vernon Highway NE, Suite 100, which is situated just off Interstate 285 in the Sandy Springs suburb in the inner ring of Atlanta. Aspen University will begin enrolling first-year Pre-Professional Nursing (“PPN”) students in Atlanta starting in February 2022 and Nursing Core students (Years 2-3) in September 2022.Austin, TXAspen University’s BSN Pre-Licensure program in Austin is based in the Frontera Crossing office building located at 101 W. Louis Henna Boulevard in the suburb of Round Rock. The building is situated at the junction of Interstate 35 and State Highway 45, one of the most heavily trafficked freeway exchanges in the metropolitan area with visibility to approximately 143,362 cars per day. Aspen University's initial PPN nursing student enrollments began on the September 29, 2020 semester start date.27Tampa, FLAspen University’s BSN Pre-Licensure program in Tampa is located at 12802 Tampa Oaks Boulevard. The building is visible from the intersection of Interstate 75 and East Fletcher Avenue, near the University of South Florida, providing visibility to approximately 126,500 cars per day. Aspen University's initial PPN nursing student enrollments began on the December 8, 2020 semester start date.Nashville, TNOn March 8, 2021, the Company announced that Aspen University received the final required state and board of registered nursing regulatory approvals for their new BSN Pre-Licensure campus location in Nashville, Tennessee, with permission to commence marketing and begin to enroll first-year PPN students effective immediately. Aspen University's initial PPN nursing student enrollments began on the April 27, 2021 semester start date.USU Master of Science in Nursing-Family Nurse Practitioner (MSN-FNP)USU offers a number of nursing degree programs and other degree programs in health sciences, business & technology and education. Its primary enrollment program is its MSN-FNP which is designed for BSN-prepared registered nurses who are seeking a Nurse Practitioner license. The MSN-FNP is an online-hybrid 48-credit degree program with 100% of the curriculum online, including the curricular component to complete 540 clinical and 32 lab hours.While MSN-FNP lab hours have been done at USU’s San Diego facility through the end of calendar 2020, the rapid growth of the active degree seeking student body overMSN-FNP program has caused AGI to open two additional immersion locations in 2021. Specifically, the past seven quarters, includingCompany built-out an additional suite on the recent quarter ending January 31, 2018.Aspen University Revenue SummaryBelow is a summaryground floor of our main facility in Phoenix (by the nursing active degree-seeking student body as a percentage ofairport). Consequently, students now have the total active degree-seeking student body over the past six fiscal quarters.Accounts Receivable - Monthly Payment Programs OverviewSince the March 2014 monthlyPlan ("MPP")The Company offers several payment plan announcement, 69% of Aspen University’s courses are now paid through monthly payment methods (based on courses started over the last 90 days). Aspen offers two monthly payment programs,options to its students including a monthly payment plan (MPP), installment plans and financial aid. Our growth in accounts receivable over the last several years has predominantly been a result of students taking advantage of our groundbreaking monthly payment plan which studentswe introduced in 2014 at Aspen University and subsequently in Fiscal Year 2018 at USU. At January 31, 2022, Gross MPP accounts receivable was 89% of total gross accounts receivable. Of the Gross MPP accounts receivable, approximately 50% was generated at each AU and USU.The Monthly Payment Plan, offered by both Aspen University and United State University, is a private education loan with a 0% fixed rate of interest (0% APR) and no down payment. Each month the student will make payments every monthone payment of $250, $325, $350 or $375 (depending on the program) until the program is paid for. The attractive aspect of being able to pay for a degree over a fixed period (36, 39 or 72 months depending onof time has fueled the growth of this plan. MPP is designed so students can build the cost of their degree program), andinto their monthly budget.Long-Term Accounts ReceivableWhen a monthly installment plan in which students pay three monthly installments (day 1, day 31 and day 61 afterstudent signs up for the start of each course).As of January 31, 2018, Aspen University had a total of 4,194 active students paying tuition through a monthly payment method of which 3,901 active students are paying through a monthly payment plan, there is a contractual amount that the Company can expect to earn over the life of the student’s program. This full contractual amount cannot be recorded as an account receivable upon enrollment. As a student takes a class, revenue is earned over that eight-week class. Some students accelerate their program, taking two classes every eight-week period, and 293that increases the student’s accounts receivable balance. If any portion of that balance will be paid in a period greater than 12 months, that portion is reflected as long-term accounts receivable.As a result of the growing acceptance of our monthly payment plans, our long-term accounts receivable balance has grown from $10,249,833 at April 30, 2021 to $12,701,452 at January 31, 2022. These are MPP students who make monthly payments over 36, 39 and 72 months. The average student completes their academic program in 30 months; therefore, most of the Company’s accounts receivable are short-term. However, when students graduate earlier than the 30 month average completion duration, they transition to long-term accounts receivable. Also, long-term account receivable includes the impact of USU's 72-month payment plan. These are the primary factors that have driven an increase in long-term accounts receivable.28Here is a graphic of both short-term and long-term receivables, as well as contractual value:A B C Payments owed for classes taken where payment plans for classes are less than 12 months, less monthly payments received Payments owed for classes taken where payment plans are greater than 12 months Expected classes
to be taken over
balance of program.Short-Term
Accounts ReceivableLong-term
Accounts ReceivableNot recorded in
financial statementsThe Sum of A, B and C will equal the total cost of the program. COVID-19 UpdateNursing students represented 87% or 11,889 of the Company’s total student body of 13,724 students at the end of the third quarter of fiscal 2022. Of the 11,889 nursing students, 2,277 are BSN Pre-Licensure students located across our four metro locations (Phoenix, Austin, Tampa and Nashville). The remaining 9,612 nursing students are payinglicensed registered nurses (RNs) studying to earn an advanced degree (RN to BSN, MSN, MSN-FNP or DNP degree programs). Therefore, these 9,612 post-licensure nursing students represent 70% of the Company’s total student body at the end of the third quarter and are the AGI students primarily affected by the COVID-19 pandemic.Starting in the second half of June 2021 and continuing through a monthly installment plan. Additionally,January 2022, the Company saw lower course starts than seasonally expected among our RN student body. For example, at Aspen University, is currently projecting to addcourse starts among RNs from June through January 2022 increased by approximately 120 active students/month net to its monthly payment programs through3% year-over-year.By comparison, over the previous two full fiscal year 2018. The total contractual value ofyears (Fiscal Year 2021 and Fiscal Year 2020), course starts among RNs at Aspen University’s monthly payment plan students now exceeds $35 million which currently delivers monthly recurring tuition cash paymentsUniversity increased by an average of approximately $1,000,000.Finally,10% year-over-year.We cannot be certain what impact future COVID-19 variants will have on the Company’s results as a consequencewe progress through the remainder of monthly payment programs becomingFiscal Year 2022.Results of OperationsSet forth below is the payment methoddiscussion of choice among the majorityresults of Aspen’s degree-seeking student body, our HEA, Title IV Program revenue dropped from 25%operations of total cash receipts in fiscal year 2016 to 21% for fiscal year 2017.Marketing Efficiency AnalysisAspen has developed a marketing efficiency ratio to continually monitor the performance of its business model.Revenue per Enrollment (RPE)Marketing Efficiency Ratio =—————————————Cost per Enrollment (CPE)Cost per Enrollment (CPE)The Cost per Enrollment measures the marketing investment spent in a given quarter, divided by the number of new student enrollments achieved in that given quarter, in order to obtain an average CPECompany for the quarter measured.Revenue per Enrollment (RPE)The Revenue per Enrollment takes each quarterly cohort of new degree-seeking student enrollments, and measures the amount of earned revenue including tuition and fees to determine the average RPE for the cohort measured. For the later periods of a cohort, in particular students four years or older, we have used reasonable projections based off of historical results to determine the amount of revenue we will earn in later periods of the cohort.We created the reporting to track the CPE and RPE starting in 2012 and can accurately predict the CPE and RPE for each new student cohort. Our current CPE/RPE Marketing Efficiency Ratio is reflected in the below table.Quarterly New Student Cohort Actuals Data:The average RPE is approximately $7,000. Of the $7,000, $6,400 of the RPE is earned through tuition, with the remaining $600 on average earned through miscellaneous fees (includes annual technology fee, withdrawal fees, graduation fees, proctored exams, course specific fees, etc.)Aspen is projecting to average a Marketing Efficiency Ratio of 8.0x, in other words an 8.0x return on our marketing investment. Third-party companies in the higher education industry that manage the Enrollment and Marketing functions on behalf of Universities (also referred to as Managed Services companies) reportedly average 3-4x return on their marketing investments, meaning that Aspen’s business model is currently performing at approximately double the efficiency level of that sector.Results of OperationsFor the Quarter Ended January 31, 2018 Compared with the Quarter Ended January 31, 2017RevenueRevenue from operations for the quarterthree months ended January 31, 20182022 (“2018 Quarter”Q3 Fiscal 2022”) increasedcompared to $5,701,958 from $3,735,626 for the quarterthree months ended January 31, 20172021 (“2017 Quarter”Q3 Fiscal 2021”), an increase of $1,966,332 or 53%.Cost of Revenues (exclusive of amortization)The Company’s cost of revenues consists of instructional costs and services and sales and marketing costs.Instructional Costs and ServicesInstructional costs and services for the 2018 Quarter rose to $1,196,949 from $694,884 for the 2017 Quarter, an increase of $502,065 or 72%. Instructional costs and services for the 2018 Quarter as a percentage of revenue was 21% as compared to 19% for the 2017 Quarter. Sales and MarketingSales and marketing costs for the 2018 Quarter were $1,468,715 compared to $664,247 for the 2017 Quarter, an increase of $804,468 or 121%. The Company expects marketing and promotional costs to rise in future periods, given we expect to increase monthly marketing spend to over $600,000 during the next fiscal year. In addition, this increase is partially attributed to the addition of an outside sales force of 9 representatives and those salaries and benefits are included in the 2018 Quarter numbers.Gross Profit was 51% of revenues or $2,900,633 for the 2018 Quarter as compared to 60% of revenues or $2,256,918 for the 2017 Quarter. The reasons for the change are reflected in the individual expense items described above.Costs and ExpensesGeneral and AdministrativeGeneral and Administrative costs for the 2018 Quarter were $4,677,359 compared to $2,133,074 during the 2017 Quarter, an increase of $2,544,285 or 119%. General and Administrative costs as a percentage of revenue for the 2018 Quarter was 82% compared to 57% during the 2017 quarter. The Company incurred $610,219 of one-time costs directly related to the USU acquisition. Excluding the $610,219 one-time USU acquisition expenses, G&A increased sequentially by $900,750. The acquisition of United States University accounted for over three-quarters of the G&A increase, as the company’s non-faculty full-time staff rose from 110 to 142 employees. The majority of the remaining increase was a one-time expense of legal fees related to the HEMG NJ bankruptcy proceeding in which the company is a creditor.Aspen University also recorded $100,000 as a bad debt reserve, an increase reflective of the increase in revenue and students paying by monthly plans.Depreciation and AmortizationDepreciation and amortization costs for the 2018 Quarter rose to $347,894 from $132,727 for the 2017 Quarter, an increase of $215,167 or 162%. This increase is substantially due to the amortization of intangible assets from the purchase of USU.Other Expense, netOther expense, net for the 2018 Quarter increased to $158,986 from $78,317 in the 2017 Quarter, an increase of $80,669 or 103%. This increase is due to interest paid on the credit facility.Income TaxesIncome taxes expense (benefit) for the comparable years was $0 as Aspen Group experienced operating losses in both periods. As management made a full valuation allowance against the deferred tax assets stemming from these losses, there was no tax benefit recorded in the statement of operations in both periods.Net Income (Loss)Net loss for 2018 Quarter was ($2,147,945) as compared to income of $7,377 for the 2017 Quarter, a decrease of $2,155,322. In the 2018 Quarter, the results for USU have been included as well as all of the costs associated with the acquisition.For the Nine Months Ended January 31, 2018 Compared with the Nine Months Ended January 31, 2017RevenueRevenue from operations for the nine months ended January 31, 20182022 (“2018 Period”9M Fiscal 2022”) increasedcompared to $14,796,483 from $9,957,467 for the nine months ended January 31, 20172021 (“2017 Period”9M Fiscal 2021”), an increaseThe following table presents selected consolidated statement of $4,839,016 or 49%.29Three Months Ended January 31, Nine Months Ended January 31, 2022 2021 2022 2021 Revenue 100 % 100 % 100 % 100 % Operating expenses: Cost of revenue (exclusive of depreciation and amortization shown separately below) Instructional costs and services 26 % 24 % 25 % 22 % Marketing and promotional costs 23 % 22 % 22 % 21 % Total cost of revenue (exclusive of depreciation and amortization shown separately below) 49 % 45 % 47 % 43 % General and administrative 62 % 64 % 60 % 63 % Bad debt expense 2 % 4 % 2 % 3 % Depreciation and amortization 5 % 3 % 4 % 3 % Total operating expenses 118 % 117 % 113 % 112 % Operating loss (18) % (17) % (13) % (12) % Other income (expense): Interest expense (1) % — % (1) % (4) % Other income (expense), net — % — % 1 % — % Total other (expense) income, net (1) % — % — % (4) % Loss before income taxes (18) % (17) % (12) % (17) % Income tax expense 1 % — % 1 % — % Net loss (20) % (17) % (13) % (17) % RevenueThree Months Ended January 31, Nine Months Ended January 31, 2022 $ Change % Change 2021 2022 $ Change % Change 2021 AU $ 13,027,338 $ 1,167,164 10% $ 11,860,174 $ 39,035,841 $ 4,401,315 13% $ 34,634,526 USU 5,917,460 1,152,797 24% 4,764,663 18,280,163 4,153,245 29% 14,126,918 Revenue $ 18,944,798 $ 2,319,961 14% $ 16,624,837 $ 57,316,004 $ 8,554,560 18% $ 48,761,444 Q3 Fiscal 2022 compared to Q3 Fiscal 2021AU revenue increased 10% in Q3 Fiscal 2022 compared to Q3 Fiscal 2021 due primarily to Aspen’s BSN Pre-Licensure program, the AU degree program with the highest LTV.USU revenue increased 24% in Q3 Fiscal 2022 compared to Q3 Fiscal 2021 due primarily to USU's MSN-FNP program, the USU degree program with the highest concentration of students and the highest LTV.The Company expects the majority of its revenue growth in future periods to be derived from these two degree programs as we continue prioritizing our highest LTV degree programs to achieve our long-term growth plans.9M Fiscal 2022 compared to 9M Fiscal 2021AU and USU revenue increased 13% and 29% in 9M Fiscal 2022 compared to 9M Fiscal 2021, respectively, primarily due to the factors described above in the three month discussion.30Cost of Revenuesrevenue (exclusive of amortization)The Company’s cost of revenues consists ofdepreciation and amortization shown separately below)Three Months Ended January 31, Nine Months Ended January 31, 2022 $ Change % Change 2021 2022 $ Change % Change 2021 Cost of Revenue (exclusive of depreciation and amortization shown separately below) $9,275,419 $1,715,468 23% $7,559,951 $26,658,188 $5,925,934 29% $20,732,254 Q3 Fiscal 2022 compared to Q3 Fiscal 2021Instructional Costs and ServicesConsolidated instructional costs and services for Q3 Fiscal 2022 increased to $4,923,148 or 26% of revenue from $3,915,095 or 24% of revenue for Q3 Fiscal 2021, an increase of $1,008,053 or 26%.AU instructional costs and salesservices was 25% and 22% of AU revenue for Q3 Fiscal 2022 and Q3 Fiscal 2021, respectively. As a percentage of revenue, instructional costs and services increased due primarily to an increase in faculty compensation costs related to the faculty hiring in the BSN Pre-Licensure campus locations in Phoenix, Austin, Tampa and Nashville, and increases in student technology license costs.USU instructional costs and services was 28% and 27% of USU revenue for Q3 Fiscal 2022 and Q3 Fiscal 2021, respectively. As a percentage of revenue, instructional costs and services have increased due to the increased number of immersions with associated faculty and supplies cost.Marketing and PromotionalConsolidated marketing costs.AU marketing and promotional costs represented 22% and 20% of AU revenue for Q3 Fiscal 2022 and Q3 Fiscal 2021, respectively. As a percentage of revenue, marketing and promotional costs have increased due primarily to the advertising spending increase directed to the new pre-licensure metropolitan locations.USU marketing and promotional costs was 20% and 21% of USU revenue for Q3 Fiscal 2022 and Q3 Fiscal 2021, respectively.Corporate marketing costs were $327,697 for Q3 Fiscal 2022 compared to $250,474 for Q3 Fiscal 2021, an increase of $77,223 or 31%. 9M Fiscal 2022 compared to 9M Fiscal 2021Instructional Costs and ServicesInstructionalConsolidated instructional costs and services for the 2018 Period rose9M Fiscal 2022 increased to $2,893,818$14,259,622 or 25% of revenue from $1,701,945$10,698,056 or 22% of revenue for the 2017 Period,9M Fiscal 2021, an increase of $1,191,873$3,561,566 or 70%33%.SalesAU instructional costs and MarketingSalesservices were 25% and 21% of AU revenue for 9M Fiscal 2022 and 9M Fiscal 2021, respectively. As a percentage of revenue, instructional costs and services increased primarily due to the factors described above in the three month discussion.USU instructional costs and services was 25% of USU revenue for both 9M Fiscal 2022 and 9M Fiscal 2021, respectively.Marketing and PromotionalConsolidated marketing and promotional costs for the 2018 Period9M Fiscal 2022 were $3,388,996 from $1,788,101$12,398,566 or 22% of revenue compared to $10,034,198 or 21% of revenue for the 2017 Period,9M Fiscal 2021, an increase of $1,600,895$2,364,368 or 90%24%.AU marketing and promotional represented 21% and 20% of AU revenue for 9M Fiscal 2022 and 9M Fiscal 2021, respectively. As a percentage of revenue, marketing and promotional costs increased due primarily to the planned advertising spending31increase throughout Fiscal Year 2022, targeted primarily to our highest LTV program. The Company expects salesmajority of the year-over-year advertising spending increase is directed to the new pre-licensure metro locations: Austin, Nashville and Tampa.USU marketing to riseand promotional costs was 17% and 18% of USU revenue for 9M Fiscal 2022 and 9M Fiscal 2021, respectively.Corporate marketing and promotional costs was $994,681 in future periods, given we expect to increase monthly marketing spend to over $600,000 during the 2019 fiscal year.Gross Profit rose to $8,513,669 for the 2018 Period from $6,467,421 for the 2017 Period. The reasons for the change are reflected in the individual expense items described above.Costs and ExpensesGeneral and AdministrativeGeneral and administrative costs for the 2018 Period were $10,975,0859M Fiscal 2022 compared to $6,228,554 during the 2017 Period,$757,877 in 9M Fiscal 2021, an increase of $4,746,531$236,804 or 76%31%.Depreciation The increase in marketing and AmortizationDepreciation and amortizationpromotional costs for the 2018 Period increased to $631,969 from $422,782 for the 2017 Period, an increase of $209,187 or 49%.Other Income (Expense)Other expense increased to ($303,190) from ($172,615), an increase of $130,575 or 76%. This increase is primarily due to interest paid ongraduation production costs for the credit facility. Other income increasedOctober 2021 ceremony.General and administrativeThree Months Ended January 31, Nine Months Ended January 31, 2022 $ Change % Change 2021 2022 $ Change % Change 2021 General and administrative $11,771,487 $1,127,049 11% $10,644,438 $34,359,276 $3,635,927 12% $30,723,349 Q3 Fiscal 2022 compared to $140,567 from $1,684,Q3 Fiscal 2021AU general and administrative expense was 36% and 36% of AU revenue for Q3 Fiscal 2022 and Q3 Fiscal 2021, respectively. As a percentage of revenue, general and administrative expense remained flat.USU general and administrative costs was 43% and 44% of USU revenue for Q3 Fiscal 2022 and Q3 Fiscal 2021, respectively. As a percentage of revenue, general and administrative expense decreased due primarily to a decrease in compensation and facilities costs.Corporate general and administrative costs was $4.5 million in Q3 Fiscal 2022 and $4.2 million in Q3 Fiscal 2021, an increase of $0.2 million, or 5%. The increase was primarily due to the interest income earned on the $900,000 promissory note from increases in professional fees, facilities costs and insurance expense, partially offset by a decrease in merchant fees.9M Fiscal 2022 compared to 9M Fiscal 2021AU general and administrative expense was 35% and 34% of Aspen University revenue for 9M Fiscal 2022 and 9M Fiscal 2021, respectively. As a percentage of revenue, general and administrative expense increased due primarily to increases in compensation and other employee-related costs, facilities costs, professional fees and merchant fees.USU general and from the releaseadministrative expense was 41% and 42% of the warrant derivative liabilityUSU revenue for 9M Fiscal 2022 and 9M Fiscal 2021, respectively. As a percentage of $52,500.Income TaxesIncome taxesrevenue, general and administrative expense (benefit)decreased due primarily to higher revenue for the 2018 Period9M Fiscal 2022 and 2017 Perioda decreases in merchant fees, partially offset by increases in compensation and other employee-related costs, facilities costs, professional fees and technology costs.Corporate general and administrative expense was $0 as Aspen Group experienced operating losses$13.1 million in both periods. As management made9M Fiscal 2022 and 9M Fiscal 2021, respectively. General and administrative expense remained flat year-over-year due to planned Corporate cost control.Bad debt expenseThree Months Ended January 31, Nine Months Ended January 31, 2022 $ Change % Change 2021 2022 $ Change % Change 2021 Bad debt expense $350,000 $(320,000) (48)% $670,000 $1,050,000 $(652,000) (38)% $1,702,000 For both the three and nine months ended January 31, 2022 compared to the three and nine months ended January 31 2020, bad debt expense decreased as a full valuation allowancepercentage of total revenue. Based on our review of accounts receivable and historical write-off trends, the Company evaluated its reserve methodology and adjusted reserves for AU and USU accordingly. At AU and USU, approximately $766,000 and $146,000 of student accounts receivable were written off against the deferred tax assets stemming from these losses, there was no tax benefit recorded inaccounts receivable allowance during 9M Fiscal 2022.32Depreciation and amortizationThree Months Ended January 31, Nine Months Ended January 31, 2022 $ Change % Change 2021 2022 $ Change % Change 2021 Depreciation and amortization $883,536 $348,263 65% $535,273 $2,480,179 $927,925 60% $1,552,254 For both the statement of operations in both periods.Net LossNet loss for the 2018 Period was ($3,396,575) asthree and nine months ended January 31, 2022 compared to ($381,530) for the 2017 Period,three and nine months ended January 31 2021, the increase in depreciation is primarily due to investments in new campuses, including capital expenditures of leasehold improvements and computer equipment, and an increase in amortization of internally developed capitalized software placed into service to support the lossCompany's services and the opening of $3,015,045.Other (expense) income, netThree Months Ended January 31, Nine Months Ended January 31, 2022 $ Change % Change 2021 2022 $ Change % Change 2021 Other (expense) income, net $(166,743) $(146,762) 735% $(19,981) $163,016 $2,298,500 NM $(2,135,484)
| Three Months Ended January 31, | Nine Months Ended January 31, | ||||||||||||||||||||||||||||||||||||||||||||||
| 2022 | $ Change | % Change | 2021 | 2022 | $ Change | % Change | 2021 | ||||||||||||||||||||||||||||||||||||||||
| Income tax expense | $231,610 | $221,150 | 2114% | $10,460 | $388,520 | $343,430 | 762% | $45,090 | |||||||||||||||||||||||||||||||||||||||
The following
AGI defines Adjusted EBITDA as earnings (or loss) from operations before the items in the table below including non-recurring charges of $85,853. Adjusted EBITDA is an important measure of our operating performance because it allows management, investors and analysts to evaluate and assess our core operating results from period-to-period after removing the impact of items of a non-operational nature that affect comparability.
Our management recognizes that the non-GAAP financial measures have inherent limitations because of the excluded items described below.
| Three Months Ended January 31, | Nine Months Ended January 31, | ||||||||||||||||||||||
| 2022 | 2021 | 2022 | 2021 | ||||||||||||||||||||
| Net loss | $ | (3,733,997) | $ | (2,815,266) | $ | (7,457,143) | $ | (8,128,987) | |||||||||||||||
| Interest expense, net | 180,642 | 33,436 | 350,838 | 2,018,176 | |||||||||||||||||||
| Taxes | 231,610 | 10,460 | 388,520 | 45,090 | |||||||||||||||||||
| Depreciation and amortization | 883,536 | 535,273 | 2,480,179 | 1,552,254 | |||||||||||||||||||
| EBITDA | (2,438,209) | (2,236,097) | (4,237,606) | (4,513,467) | |||||||||||||||||||
| Bad debt expense | 350,000 | 670,000 | 1,050,000 | 1,702,000 | |||||||||||||||||||
| Stock-based compensation | 700,697 | 701,170 | 1,965,567 | 3,019,828 | |||||||||||||||||||
| Non-recurring charges - Severance | — | — | 19,665 | 44,000 | |||||||||||||||||||
| Non-recurring (income) charges - Other | 49,310 | — | (345,056) | 375,437 | |||||||||||||||||||
| Adjusted EBITDA | $ | (1,338,202) | $ | (864,927) | $ | (1,547,430) | $ | 627,798 | |||||||||||||||
| Net loss Margin | (20)% | (17)% | (13)% | (17)% | |||||||||||||||||||
| Adjusted EBITDA Margin | (7)% | (5)% | (3)% | 1% | |||||||||||||||||||
| Three Months Ended January 31, 2022 | |||||||||||||||||||||||
| Consolidated | AGI Corporate | AU | USU | ||||||||||||||||||||
| Net income (loss) | $ | (3,733,997) | $ | (5,020,149) | $ | 941,437 | $ | 344,715 | |||||||||||||||
| Interest expense, net | 180,642 | 180,682 | — | (40) | |||||||||||||||||||
| Taxes | 231,610 | 951 | 230,660 | (1) | |||||||||||||||||||
| Depreciation and amortization | 883,536 | 47,536 | 738,172 | 97,828 | |||||||||||||||||||
| EBITDA | (2,438,209) | (4,790,980) | 1,910,269 | 442,502 | |||||||||||||||||||
| Bad debt expense | 350,000 | — | 225,000 | 125,000 | |||||||||||||||||||
| Stock-based compensation | 700,697 | 616,166 | 56,880 | 27,651 | |||||||||||||||||||
| Non-recurring charges - Severance | — | — | — | — | |||||||||||||||||||
| Non-recurring charges - Other | 49,310 | 49,310 | — | — | |||||||||||||||||||
| Adjusted EBITDA | $ | (1,338,202) | $ | (4,125,504) | $ | 2,192,149 | $ | 595,153 | |||||||||||||||
| Net income (loss) Margin | (20)% | NM | 7% | 6% | |||||||||||||||||||
| Adjusted EBITDA Margin | (7)% | NM | 17% | 10% | |||||||||||||||||||
| Three Months Ended January 31, 2021 | |||||||||||||||||||||||
| Consolidated | AGI Corporate | AU | USU | ||||||||||||||||||||
| Net income (loss) | $ | (2,815,266) | $ | (4,537,882) | $ | 1,375,359 | $ | 347,257 | |||||||||||||||
| Interest expense, net | 33,436 | 33,516 | — | (80) | |||||||||||||||||||
| Taxes | 10,460 | 3,600 | 6,800 | 60 | |||||||||||||||||||
| Depreciation and amortization | 535,273 | 15,540 | 492,303 | 27,430 | |||||||||||||||||||
| EBITDA | (2,236,097) | (4,485,226) | 1,874,462 | 374,667 | |||||||||||||||||||
| Bad debt expense | 670,000 | — | 610,000 | 60,000 | |||||||||||||||||||
| Stock-based compensation | 701,170 | 692,244 | (12,468) | 21,394 | |||||||||||||||||||
| Non-recurring charges - Severance | — | — | — | — | |||||||||||||||||||
| Non-recurring charges - Other | — | — | — | — | |||||||||||||||||||
| Adjusted EBITDA | $ | (864,927) | $ | (3,792,982) | $ | 2,471,994 | $ | 456,061 | |||||||||||||||
| Net income (loss) Margin | (17)% | NM | 12% | 7% | |||||||||||||||||||
| Adjusted EBITDA Margin | (5)% | NM | 21% | 10% | |||||||||||||||||||
| Nine Months Ended January 31, 2022 | |||||||||||||||||||||||
| Consolidated | AGI Corporate | AU | USU | ||||||||||||||||||||
| Net income (loss) | $ | (7,457,143) | $ | (14,537,849) | $ | 4,605,707 | $ | 2,474,999 | |||||||||||||||
| Interest expense, net | 350,838 | 353,193 | (1,739) | (616) | |||||||||||||||||||
| Taxes | 388,520 | 3,363 | 383,867 | 1,290 | |||||||||||||||||||
| Depreciation and amortization | 2,480,179 | 116,720 | 2,082,972 | 280,487 | |||||||||||||||||||
| EBITDA | (4,237,606) | (14,064,573) | 7,070,807 | 2,756,160 | |||||||||||||||||||
| Bad debt expense | 1,050,000 | — | 725,000 | 325,000 | |||||||||||||||||||
| Stock-based compensation | 1,965,567 | 1,732,412 | 149,773 | 83,382 | |||||||||||||||||||
| Non-recurring charges - Severance | 19,665 | — | — | 19,665 | |||||||||||||||||||
| Non-recurring (income) charges - Other | (345,056) | 107,635 | (452,691) | — | |||||||||||||||||||
| Adjusted EBITDA | $ | (1,547,430) | $ | (12,224,526) | $ | 7,492,889 | $ | 3,184,207 | |||||||||||||||
| Net income (loss) Margin | (13)% | NM | 12% | 14% | |||||||||||||||||||
| Adjusted EBITDA Margin | (3)% | NM | 19% | 17% | |||||||||||||||||||
| Nine Months Ended January 31, 2021 | |||||||||||||||||||||||
| Consolidated | AGI Corporate | AU | USU | ||||||||||||||||||||
| Net income (loss) | $ | (8,128,987) | $ | (15,929,868) | $ | 5,892,892 | $ | 1,907,989 | |||||||||||||||
| Interest expense, net | 2,018,176 | 2,018,258 | — | (82) | |||||||||||||||||||
| Taxes | 45,090 | 14,250 | 30,580 | 260 | |||||||||||||||||||
| Depreciation and amortization | 1,552,254 | 42,023 | 1,424,030 | 86,201 | |||||||||||||||||||
| EBITDA | (4,513,467) | (13,855,337) | 7,347,502 | 1,994,368 | |||||||||||||||||||
| Bad debt expense | 1,702,000 | — | 1,522,000 | 180,000 | |||||||||||||||||||
| Stock-based compensation | 3,019,828 | 2,768,687 | 135,166 | 115,975 | |||||||||||||||||||
| Non-recurring charges - Severance | 44,000 | 44,000 | — | — | |||||||||||||||||||
| Non-recurring charges - Other | 375,437 | 375,437 | — | — | |||||||||||||||||||
| Adjusted EBITDA | $ | 627,798 | $ | (10,667,213) | $ | 9,004,668 | $ | 2,290,343 | |||||||||||||||
| Net income (loss) Margin | (17)% | NM | 17% | 14% | |||||||||||||||||||
| Adjusted EBITDA Margin | 1% | NM | 26% | 16% | |||||||||||||||||||
|
| For the Quarters Ended |
| |||||
|
| January 31, |
| |||||
|
| 2018 |
|
| 2017 |
| ||
Net income (loss) |
| $ | (2,147,945 | ) |
| $ | 7,377 |
|
Interest expense, net of interest income |
|
| 211,486 |
|
|
| 78,317 |
|
Depreciation & amortization |
|
| 347,894 |
|
|
| 132,727 |
|
EBITDA (loss) |
|
| (1,588,565 | ) |
|
| 218,421 |
|
Bad debt expense |
|
| 132,644 |
|
|
| (25,680 | ) |
Acquisition expense |
|
| 610,219 |
|
|
| — |
|
Non-recurring charges |
|
| 85,853 |
|
|
| 146,809 |
|
Stock-based compensation |
|
| 162,544 |
|
|
| 96,498 |
|
Adjusted EBITDA (Loss) |
| $ | (597,305 | ) |
| $ | 436,048 |
|
| Three Months Ended January 31, | Nine Months Ended January 31, | ||||||||||||||||||||||
| 2022 | 2021 | 2022 | 2021 | ||||||||||||||||||||
| Revenue | $ | 18,944,798 | $ | 16,624,837 | $57,316,004 | $48,761,444 | |||||||||||||||||
| Cost of Revenue | 9,275,419 | 7,559,951 | 26,658,188 | 20,732,254 | |||||||||||||||||||
| Adjusted Gross Profit | 9,669,379 | 9,064,886 | 30,657,816 | 28,029,190 | |||||||||||||||||||
| Less amortization expense included in cost of revenue: | |||||||||||||||||||||||
| Intangible asset amortization | 22,174 | 10,255 | 60,162 | 32,718 | |||||||||||||||||||
| Call center software/website amortization | 419,026 | 363,030 | 1,255,169 | 1,024,790 | |||||||||||||||||||
| Total amortization expense included in cost of revenue | 441,200 | 373,285 | 1,315,331 | 1,057,508 | |||||||||||||||||||
| GAAP Gross Profit | $ | 9,228,179 | $ | 8,691,601 | $29,342,485 | $26,971,682 | |||||||||||||||||
| GAAP Gross Profit as a percentage of revenue | 49% | 52% | 51% | 55% | |||||||||||||||||||
| Adjusted Gross Profit as a percentage of revenue | 51% | 55% | 53% | 57% | |||||||||||||||||||
|
| For the |
| |||||
|
| Nine Months Ended |
| |||||
|
| January 31, |
| |||||
|
| 2018 |
|
| 2017 |
| ||
|
|
|
|
|
|
| ||
Net cash used in operating activities |
| $ | (3,654,947 | ) |
| $ | (99,042 | ) |
Net cash used in investing activities |
|
| (3,031,667 | ) |
|
| (571,856 | ) |
Net cash provided by financing activities |
|
| 7,733,477 |
|
|
| 784,200 |
|
Net increase in cash and cash equivalents |
| $ | 1,046,863 |
|
| $ | 113,302 |
|
| Nine Months Ended January 31, | |||||||||||
| 2022 | 2021 | ||||||||||
| Net cash (used in) provided by | |||||||||||
| Operating activities | $ | (7,719,760) | $ | (5,275,719) | |||||||
| Investing activities | (3,734,670) | (2,909,088) | |||||||||
| Financing activities | 5,191,034 | 3,660,492 | |||||||||
| Net decrease in cash | $ | (6,263,396) | $ | (4,524,315) | |||||||
Net cash used in operating activities during the 2017 Period totaled ($99,042) and resulted primarily by non-cash items of $925,740 and a net change in operating assets and liabilities of ($668,252), reduced by the net loss of $381,530. The most significant item change operating assets and liabilities was an increase in accounts receivable of $2,331,140 which is primarily attributedaccrued marketing due to the growth in revenues from students paying through the monthly payment plan. The most significant non-cash items were depreciation and amortization expense of $422,782 and stock compensation expense of $253,833.
timing.
equipment of $3.6 million primarily due to investments in leasehold improvements, computer equipment and hardware and Company developed software. Purchases of courseware and accreditation were $0.2 million. A significant portion of cash used for investing activities relates to the opening of new campus locations.
computer equipment and hardware, Company developed software and new campuses; and purchases of courseware and accreditation of $31,330.
Credit Facility and proceeds from stock options exercised of $191,034.
associated with the Term Loan and Revolving Credit Facility.
Historically, our primary source of liquidity is cash receipts from tuition and the issuances of debt and equity securities. More recently, we were able to secure traditional non-convertible debt. The primary uses of cash are payroll related expenses, professional expenses, and instructional and marketing expenses. We did issue a convertible note as part of the USU purchase price since the seller wanted the potential for capital appreciation and required part of the purchase price evidenced by a convertible note. On July 25, 2017, the Company finalized a $10 million senior secured term loan, $5 million of which was funded at the close and $2.5 million with the closing of the USU acquisition.
As of March 15, 2018, the Company had a cash balance of approximately $3.7 million. With the cash from the Company’s senior secured term loan of $10 million in total (of which $7.5 million has been funded) and the growth in the Company revenues, the Company believes that it has sufficient cash to allow the Company to meet its operational expenditures for at least the next 12 months.
Our cash balances are kept liquid to support our growing infrastructure needs. The majority of our cash is concentrated in large financial institutions.
In response to financial reporting release FR-60, Cautionary Advice Regarding Disclosure About Critical Accounting Policies, from the SEC, we have selected our more subjective accounting estimation processes for purposes of explaining the methodology used in calculating the estimate, in addition to the inherent uncertainties pertaining to the estimate and the possible effects on our financial condition. There
Related Party Transactions
See Note 9 to"Critical Accounting Policies and Estimates" of our Annual Report on Form 10-K for the unaudited consolidated financial statements included hereinfiscal year ended April 30, 2021 and listed here below:
Doubtful Accounts Receivable
We do
New Accounting Pronouncements
See Note 2 to our unaudited consolidated financial statements included herein for discussionarrangements as of recent accounting pronouncements.
January 31, 2022.
Not applicable.
ITEM 4. CONTROLS AND PROCEDURESPROCEDURES.40Evaluation of Disclosure Controls and Procedures. Our management carried out an evaluation, with the participation of our Principal Executive Officer and Principal Financial Officer, required by Rule 13a-15 or 15d-15 of the Securities Exchange Act of 1934 (the “Exchange Act”) of the effectiveness of our disclosure controls and procedures as defined in Rule 13a-15(e) or 15d-15(e) under the Exchange Act. Based on their evaluation, our Principal Executive Officer and Principal Financial Officer concluded that our disclosure controls and procedures are effective as of the end of the period covered by this report to ensure that information required to be disclosed by us in the reports that we file or submit under the Exchange Act is recorded, processed, summarized and reported within the time periods specified in the SEC’s rules and forms and is accumulated and communicated to our management, including our Principal Executive Officer and Principal Financial Officer, as appropriate to allow timely decisions regarding required disclosure.Changes in Internal Control Over Financial Reporting. There were no changes in our internal control over financial reporting as defined in Rule 13a-15(f) or 15d-15(f) under the Exchange Act that occurred during the period covered by this report that have materially affected, or are reasonably likely to materially affect, our internal control over financial reporting.41
From time to time,time-to-time, we may be involved in litigation relating to claims arising out of our operations in the normal course of business. There were no material changes to our legalOther than the previously disclosed receipt of payment of $498,120 as a final distribution by the bankruptcy trustee in HEMG bankruptcy proceedings, as described in the Company’s Form 10-K during the period covered by this report. report, there were no material changes to the description of legal proceedings set forth in our Annual Report on Form 10-K for the fiscal year ended April 30, 2021.
The information presented below updates, and should be read in conjunction with, the risk factors and information disclosed in our Annual Report on Form 10-K for the fiscal year ended April 30, 2021.If we are unable to smaller reporting companies.satisfy the probation terms following the execution of a mutually acceptable consent agreement with the Arizona Board of Nursing, our future results of operations could be materially and adversely affected.Our largest subsidiary, Aspen University Inc., is based in Phoenix, Arizona. Approximately 12% of its enrollments are students in its BSN Pre-Licensure nursing programs at two campus locations in Phoenix. On January 28, 2022, Aspen University voluntarily agreed to cease enrollments in the pre-nursing and core nursing programs at its Arizona Pre-licensure campuses effective immediately related to an investigation by the Arizona Board of Nursing resulting from student complaints, unacceptable NCLEX first-time pass rates in CY’2021, among other issues. Aspen University will continue the suspension of enrollments in the pre-nursing and core nursing programs at its Arizona Pre-licensure campuses at least until it has successfully negotiated a consent agreement with the Arizona Board of Nursing which will outline the terms of the impending probation. Once the probation period begins and until the probation period ends, should Aspen University not successfully satisfy the probation terms, future results of operations could be materially and adversely affected.Aspen University has also entered into a Stipulated Agreement with the Arizona State Board for Private Postsecondary Education which includes a requirement to post a letter of credit or surety bond for $18.3 million within 45 days (approximately April 21st).Because of the Russian invasion of Ukraine, the effect on the capital markets and the economy is uncertain, and we may have to deal with a recessionary economy and economic uncertainty including possible adverse effects upon our business.As a result of the Russian invasion of Ukraine, certain events are beginning to effect the global and United States economy including increased inflation, substantial increases in the prices of oil and gas, large Western companies ceasing to do business in Russia and uncertain capital markets with declines in leading market indexes. The duration of this war and its impact are at best uncertain and continuation may result in Internet access issues if Russia, for example, began illicit cyber activities. Ultimately the economy may turn into a recession with uncertain and potentially severe impacts upon public companies and us. We cannot predict how this will affect our business but the impact may be adverse.
ITEM 2. UNREGISTERED SALES OF EQUITY SECURITIES AND USE OF PROCEEDSFrom November 1, 2017, to January 31, 2018, 87,470 shares were issuedOther than as set forth in connection with the cashless exercise"Item 5. Other Information" which is incorporated herein by reference, all recent sales of 178,917 warrants with exercise prices ranging from 3.99 to 6.00 per share. Theseunregistered securities were issued without registration under the Securities Act of 1933 in reliance upon the exemption provided in Section 3(a)(9) thereunder.From November 1, 2017 to January 31, 2018, 64,584 shares were issued in connection with the exercise of warrants with exercise prices ranging from $2.40 to $6.00 per share. The Company received $162,504 from these cash exercises. During the quarter ended January 31, 2018, 5,000 shares of common stock were issued to each of two consultants working on the Arizona campus initiative. These securities were issued without registration under the Securities Act of 1933 in reliance upon the exemption provided in Section 4(a)(2) and Rule 506(b) thereunder.
None.
Not applicable.
ITEM 5. OTHER INFORMATIONAs of March 8, 2022, the 2012 Equity Incentive Plan (the “2012 Plan”) had 129,009 shares of common stock available to be issued under the 2012 Plan. The 2012 Plan expires on March 15, 2022. On March 8, 2022 the Company increased the 201842Table of ContentsNot applicable.Equity Incentive Plan (the “2018 Plan”) by an additional 129,009 shares of common stock available for awards under the 2018 Plan and transferred the remaining 129,009 unused awards under the 2012 Plan to the 2018 Plan.On March 14, 2022 ,the Company issued (i) Revolving Promissory Note and Security Agreements (the “Revolver Notes”) in the principal amount of up to $20 million in the aggregate and (ii) Convertible Promissory Note and Security Agreements (the “Convertible Notes”, and together with the Revolver Notes, collectively, the “Notes”) in the principal amount of up to $10 million in the aggregate, to two unaffiliated lenders (the “Lenders”).The Convertible Notes mature five years from the issuance date and pay interest monthly at the rate of 12% per annum. The Convertible Notes are convertible into up to 10,000,000 shares of the Company’s common stock at each lender’s option at a conversion price of $1.00 per share any time after the issuance date. In addition, the Convertible Notes are mandatorily convertible into shares of common stock if the closing price of the Company’s common stock is at least $2.00 per share for 30 consecutive trading days. This mandatory conversion is subject to each Lender’s 9.9% beneficial ownership limitation and subject to the Nasdaq combined 19.99% requirement until the Company’s stockholders approve further conversion.The Revolver Notes will require monthly interest payments on sums borrowed at the rate of 12% per annum. No sums have been borrowed as of the date of the Quarterly Report on Form 10-Q. Currently, the Company does not anticipate making drawdowns on the revolving credit line. The Company paid a 1% commitment fee ($200,000) at closing and if the Revolver Notes have not been terminated by September 14, 2022, it must pay another 1% commitment fee.Pursuant to the Notes, all future indebtedness incurred by the Company, other than indebtedness expressly permitted by the Notes, will be subordinated to the Notes and the Prior Credit Facility, as defined below, with an exception for acquisitions of software and equipment under purchase money agreements and capital leases.The Company’s obligations under the Loan Agreements are secured by a first priority lien in certain deposit accounts of the Company, all current and future accounts receivable of the Company’s subsidiaries, certain of the deposit accounts of the Company and its subsidiaries and a pledge of the common stock of the Company held by its chief executive officer (the “Collateral”).On March 14, 2022, in connection with the issuance of the Notes, the Company also entered into an intercreditor agreement (the “Intercreditor Agreement”) among the Company, the Lenders and the lender under a prior credit facility dated November 5, 2018 (as amended, the “Prior Credit Facility”). The Intercreditor Agreement provides among other things that the Company’s obligations under, and the security interests in the Collateral granted pursuant to, the Note and the Prior Credit Facility shall rank pari passu to one another.In connection with the issuance of the Notes, the Company also entered into an Investors/Registration Rights Agreement with the Lenders (the “Registration Rights Agreement”) whereby, upon request of either Lender on or after August 15, 2022 the Company must file and obtain and maintain the effectiveness of a registration statement registering the shares of common stock issued or issuable upon conversion of the Convertible Notes.On March 14, 2022, the Company entered into an amendment with the lender pursuant to the Prior Credit Facility (the “Amendment”) to extend the maturity date of the Prior Credit Facility by one year to November 4, 2023.On March 14, 2022, the Company entered into a letter agreement with the Lenders (the “Letter Agreement”). Pursuant to the Letter Agreement, the Company and its subsidiaries made certain representations and warranties to the Lenders. The Letter Agreement also contained certain conditions precedent to the closing of the transactions.The foregoing description of the terms of the Revolver Notes, the Convertible Notes, Investor Rights Agreement, the Registration Rights Agreement, the Amendment, the Letter Agreement and the transactions contemplated thereby, does not purport to be complete and is qualified in its entirety by reference to the form of the Revolver Note, the form of the Convertible Note, the form of Intercreditor Agreement, the form of Investors/Registration Rights Agreement, the form of the Amendment, and the Form of Letter Agreement, copies which are filed as Exhibits 10.1, 10.2, 10.3, 10.4, 10.5, and 10.6, respectively, to this Quarterly Report on Form 10-Q and are incorporated herein by reference.
See the Exhibit Index at the end of this report.43SIGNATURESPursuant to the requirementsTable of the Securities Exchange Act of 1934, the registrant has duly caused this report to be signed on its behalf by the undersigned hereunto duly authorized.Aspen Group, Inc.March 15, 2018By:/s/ Michael MathewsMichael MathewsChief Executive Officer(Principal Executive Officer)March 15, 2018By:/s/ Janet GillJanet GillChief Financial Officer(Principal Financial Officer)
EXHIBIT INDEX
|
|
|
|
| Incorporated by Reference |
| Filed or Furnished | |||||
Exhibit # |
| Exhibit Description |
|
| Form |
| Date |
|
| Number |
| Herewith |
3.1 |
|
|
| 10-Q |
| 3/9/17 |
|
| 3.1 |
|
| |
3.2 |
|
|
|
|
|
|
|
|
|
| Filed | |
4.1 |
|
|
| 8-K |
| 12/1/17 |
|
| 4.1 |
|
| |
10.1 |
| Employment Agreement with Michael Mathews dated November 2, 2016* |
|
| 10-Q |
| 3/9/17 |
|
| 10.1 |
|
|
10.2 |
|
|
| 8-K |
| 7/28/17 |
|
| 10.1 |
|
| |
10.3 |
|
|
| 8-K |
| 7/28/17 |
|
| 10.2 |
|
| |
10.4 |
|
|
| 8-K |
| 7/28/17 |
|
| 10.3 |
|
| |
10.5 |
|
|
| 10-Q |
| 9/14/17 |
|
| 10.4 |
|
| |
10.6 |
|
|
| 10-K |
| 7/25/17 |
|
| 10.1 |
|
| |
10.7 |
|
|
| 8-K |
| 6/15/17 |
|
| 10.1 |
|
| |
10.8 |
|
|
| 8-K |
| 5/18/17 |
|
| 10.1 |
|
| |
10.9 |
| Employment Agreement dated November 24, 2014 - Gerard Wendolowski* |
|
| 10-K |
| 7/28/15 |
|
| 10.19 |
|
|
10.10 |
|
|
| 10-K |
| 7/28/15 |
|
| 10.18 |
|
| |
10.11 |
|
|
|
|
|
|
|
|
|
| Filed | |
10.12 |
|
|
| 8-K |
| 4/10/17 |
|
| 10.1 |
|
| |
10.13 |
|
|
| 8-K |
| 5/30/17 |
|
| 10.1 |
|
| |
10.14 |
|
|
| 8-K |
| 4/10/17 |
|
| 10.2 |
|
| |
10.15 |
|
|
| 8-K |
| 9/7/16 |
|
| 2.1 |
|
| |
10.16 |
|
|
| 8-K |
| 9/7/16 |
|
| 2.2 |
|
| |
10.17 |
|
|
| 8-K |
| 9/7/16 |
|
| 3.1 |
|
| |
10.18 |
|
|
| 10-K |
| 7/27/16 |
|
| 10.4 |
|
| |
10.19 |
| Letter Agreement with Warrant Holders for Reduced Exercise Price and Early Exercise 2016 |
|
| 10-K |
| 7/27/16 |
|
| 10.19 |
|
|
31.1 |
|
|
|
|
|
|
|
|
|
| Filed | |
31.2 |
|
|
|
|
|
|
|
|
|
| Filed | |
32.1 |
| Certification of Principal Executive and Principal Financial Officer (906) |
|
|
|
|
|
|
|
|
| Furnished** |
101.INS |
| XBRL Instance Document |
|
|
|
|
|
|
|
|
| Filed |
101.SCH |
| XBRL Taxonomy Extension Schema Document |
|
|
|
|
|
|
|
|
| Filed |
101.CAL |
| XBRL Taxonomy Extension Calculation Linkbase Document |
|
|
|
|
|
|
|
|
| Filed |
101.DEF |
| XBRL Taxonomy Extension Definition Linkbase Document |
|
|
|
|
|
|
|
|
| Filed |
101.LAB |
| XBRL Taxonomy Extension Label Linkbase Document |
|
|
|
|
|
|
|
|
| Filed |
101.PRE |
| XBRL Taxonomy Extension Presentation Linkbase Document |
|
|
|
|
|
|
|
|
| Filed |
———————
Incorporated by Reference Filed or
Furnished
HerewithExhibit # Exhibit Description Form Date Number Certificate of Incorporation, as amended 10-K 7/9/19 3.1 Bylaws, as amended 10-Q 3/15/18 3.2 Form of Revolving Promissory Note and Security Agreement+ Filed Form of Convertible Promissory Note and Security Agreement+ Filed Form of Intercreditor Agreement Filed Form of Investors/Registration Rights Agreement Filed Form of Third Amendment to the Amended and Restated Revolving Promissory Note and Security Agreement dated as of November 5, 2018 Filed Form of Letter Agreement+ Filed Amendment No. 4 to the Aspen Group, Inc. 2018 Equity Incentive Plan* Filed Amendment No. 3 to the Aspen Group, Inc. 2018 Equity Incentive Plan* DEF 14A 11/5/21 Annex A Warrant dated July 21, 2021 10-Q 9/14/21 10.1 Employment Agreement, effective August 16, 2021, by the Company and Matthew LaVay* 8-K 8/16/21 10.1 Certification of Principal Executive Officer (302) Filed Certification of Principal Financial Officer (302) Filed Certification of Principal Executive and Principal Financial Officer (906) Furnished** 101.INS Inline XBRL Instance Document - the instance document does not appear in the Interactive Data File because its XBRL tags are embedded within the Inline XBRL document 101.SCH Inline XBRL Taxonomy Extension Schema Document Filed 101.CAL Inline XBRL Taxonomy Extension Calculation Linkbase Document Filed 101.DEF Inline XBRL Taxonomy Extension Definition Linkbase Document Filed 101.LAB Inline XBRL Taxonomy Extension Label Linkbase Document Filed 101.PRE Inline XBRL Taxonomy Extension Presentation Linkbase Document Filed 104 Cover Page Interactive Data File (formatted as Inline XBRL and contained in Exhibit 101)
Management contract or compensatory plan or arrangement.
This exhibit is being furnished rather than filed and shall not be deemed incorporated by reference into any filing, in accordance with Item 601 of Regulation S-K.
Certain schedules appendices and exhibits to this agreementother attachments have been omitted. The Company undertakes to furnish the omitted in accordance with Item 601(b)(2) of Regulation S-K. A copy of any omitted schedule and/or exhibit will be furnished supplementallyschedules and attachments to the Securities and Exchange Commission staff upon request.
29
| Aspen Group, Inc. | |||||||||||
| March 15, 2022 | By: | /s/ Michael Mathews | |||||||||
| Michael Mathews Chief Executive Officer (Principal Executive Officer) | |||||||||||
| March 15, 2022 | By: | /s/ Matthew LaVay | |||||||||
| Matthew LaVay Chief Financial Officer (Principal Financial Officer) | |||||||||||
| March 15, 2022 | By: | /s/ Robert Alessi | |||||||||
| Robert Alessi Chief Accounting Officer (Principal Accounting Officer) | |||||||||||