STRATEGIC EDUCATION, INC.
STRAYER EDUCATION, INC.
FORM 10-Q
| PART I — FINANCIAL INFORMATION | ||||||
| ||||||
|
|
|
|
|
|
|
|
|
|
|
|
|
|
|
|
|
| December 31, 2016 |
| September 30, 2017 |
| ||
ASSETS |
|
|
|
|
|
|
|
Current assets: |
|
|
|
|
|
|
|
Cash and cash equivalents |
| $ | 129,245 |
| $ | 150,483 |
|
Tuition receivable, net |
|
| 20,532 |
|
| 20,626 |
|
Income taxes receivable |
|
| — |
|
| 2,734 |
|
Other current assets |
|
| 10,766 |
|
| 12,917 |
|
Total current assets |
|
| 160,543 |
|
| 186,760 |
|
Property and equipment, net |
|
| 73,124 |
|
| 74,335 |
|
Deferred income taxes |
|
| 31,096 |
|
| 34,609 |
|
Goodwill |
|
| 20,744 |
|
| 20,744 |
|
Other assets |
|
| 13,189 |
|
| 12,127 |
|
Total assets |
| $ | 298,696 |
| $ | 328,575 |
|
|
|
|
|
|
|
|
|
LIABILITIES & STOCKHOLDERS’ EQUITY |
|
|
|
|
|
|
|
Current liabilities: |
|
|
|
|
|
|
|
Accounts payable and accrued expenses |
| $ | 41,132 |
| $ | 50,514 |
|
Income taxes payable |
|
| 1,883 |
|
| — |
|
Deferred revenue |
|
| 16,691 |
|
| 21,784 |
|
Other current liabilities |
|
| 133 |
|
| — |
|
Total current liabilities |
|
| 59,839 |
|
| 72,298 |
|
Other long-term liabilities |
|
| 50,483 |
|
| 40,788 |
|
Total liabilities |
|
| 110,322 |
|
| 113,086 |
|
|
|
|
|
|
|
|
|
Commitments and contingencies |
|
|
|
|
|
|
|
Stockholders’ equity: |
|
|
|
|
|
|
|
Common stock, par value $0.01; 20,000,000 shares authorized; 11,093,489 and 11,167,425 shares issued and outstanding at December 31, 2016 and September 30, 2017, respectively |
|
| 111 |
|
| 112 |
|
Additional paid-in capital |
|
| 35,453 |
|
| 44,021 |
|
Retained earnings |
|
| 152,810 |
|
| 171,356 |
|
Total stockholders’ equity |
|
| 188,374 |
|
| 215,489 |
|
Total liabilities and stockholders’ equity |
| $ | 298,696 |
| $ | 328,575 |
|
| December 31, 2018 | September 30, 2019 | ||||||
| ASSETS | |||||||
| Current assets: | |||||||
| Cash and cash equivalents | $ | 311,732 | $ | 397,094 | |||
| Marketable securities | 37,121 | 33,455 | |||||
| Tuition receivable, net | 55,694 | 50,964 | |||||
| Income taxes receivable | — | 6,970 | |||||
| Other current assets | 15,814 | 17,130 | |||||
| Total current assets | 420,361 | 505,613 | |||||
| Property and equipment, net | 122,677 | 116,489 | |||||
| Right-of-use lease assets | — | 93,208 | |||||
| Marketable securities, non-current | 37,678 | 26,532 | |||||
| Intangible assets, net | 328,344 | 286,844 | |||||
| Goodwill | 732,540 | 732,075 | |||||
| Other assets | 19,429 | 20,435 | |||||
| Total assets | $ | 1,661,029 | $ | 1,781,196 | |||
| LIABILITIES & STOCKHOLDERS’ EQUITY | |||||||
| Current liabilities: | |||||||
| Accounts payable and accrued expenses | $ | 85,979 | $ | 86,092 | |||
| Income taxes payable | 419 | — | |||||
| Contract liabilities | 38,733 | 45,571 | |||||
| Lease liabilities | — | 26,167 | |||||
| Total current liabilities | 125,131 | 157,830 | |||||
| Deferred income tax liabilities | 59,358 | 57,016 | |||||
| Lease liabilities, non-current | — | 83,067 | |||||
| Other long-term liabilities | 51,316 | 38,624 | |||||
| Total liabilities | 235,805 | 336,537 | |||||
| Commitments and contingencies | |||||||
| Stockholders’ equity: | |||||||
| Common stock, par value $0.01; 32,000,000 shares authorized; 21,743,498 and 21,964,505 shares issued and outstanding at December 31, 2018 and September 30, 2019, respectively | 217 | 220 | |||||
| Additional paid-in capital | 1,306,653 | 1,306,353 | |||||
| Accumulated other comprehensive income | 32 | 447 | |||||
| Retained earnings | 118,322 | 137,639 | |||||
| Total stockholders’ equity | 1,425,224 | 1,444,659 | |||||
| Total liabilities and stockholders’ equity | $ | 1,661,029 | $ | 1,781,196 | |||
3
|
|
|
|
|
|
|
|
|
|
|
|
|
|
|
|
|
|
|
|
|
|
|
|
|
|
|
|
|
| For the three months ended |
| For the nine months ended |
| ||||||||
|
| September 30, |
| September 30, |
| ||||||||
|
| 2016 |
| 2017 |
| 2016 |
| 2017 |
| ||||
Revenues |
| $ | 102,156 |
| $ | 108,512 |
| $ | 321,809 |
| $ | 336,144 |
|
Costs and expenses: |
|
|
|
|
|
|
|
|
|
|
|
|
|
Instruction and educational support |
|
| 56,295 |
|
| 56,987 |
|
| 176,175 |
|
| 180,059 |
|
Marketing |
|
| 25,388 |
|
| 26,790 |
|
| 61,434 |
|
| 64,734 |
|
Admissions advisory |
|
| 4,691 |
|
| 5,318 |
|
| 13,171 |
|
| 14,813 |
|
General and administration |
|
| 10,952 |
|
| 11,193 |
|
| 33,211 |
|
| 36,017 |
|
Total costs and expenses |
|
| 97,326 |
|
| 100,288 |
|
| 283,991 |
|
| 295,623 |
|
Income from operations |
|
| 4,830 |
|
| 8,224 |
|
| 37,818 |
|
| 40,521 |
|
Investment income |
|
| 115 |
|
| 303 |
|
| 327 |
|
| 737 |
|
Interest expense |
|
| 161 |
|
| 162 |
|
| 481 |
|
| 481 |
|
Income before income taxes |
|
| 4,784 |
|
| 8,365 |
|
| 37,664 |
|
| 40,777 |
|
Provision for income taxes |
|
| 1,906 |
|
| 2,138 |
|
| 14,580 |
|
| 13,670 |
|
Net income |
| $ | 2,878 |
| $ | 6,227 |
| $ | 23,084 |
| $ | 27,107 |
|
Earnings per share: |
|
|
|
|
|
|
|
|
|
|
|
|
|
Basic |
| $ | 0.27 |
| $ | 0.58 |
| $ | 2.18 |
| $ | 2.54 |
|
Diluted |
| $ | 0.27 |
| $ | 0.56 |
| $ | 2.14 |
| $ | 2.43 |
|
Weighted average shares outstanding: |
|
|
|
|
|
|
|
|
|
|
|
|
|
Basic |
|
| 10,616 |
|
| 10,701 |
|
| 10,608 |
|
| 10,671 |
|
Diluted |
|
| 10,828 |
|
| 11,210 |
|
| 10,803 |
|
| 11,174 |
|
| For the three months ended September 30, | For the nine months ended September 30, | ||||||||||||||
| 2018 | 2019 | 2018 | 2019 | ||||||||||||
| Revenues | $ | 160,945 | $ | 241,747 | $ | 392,082 | $ | 733,365 | |||||||
| Costs and expenses: | |||||||||||||||
| Instructional and support costs | 103,079 | 132,527 | 240,830 | 397,281 | |||||||||||
| General and administration | 61,976 | 72,303 | 125,494 | 204,816 | |||||||||||
| Amortization of intangible assets | 10,278 | 15,417 | 10,278 | 46,251 | |||||||||||
| Merger and integration costs | 29,620 | 1,500 | 37,791 | 11,698 | |||||||||||
| Impairment of intangible assets | 13,119 | — | 19,304 | — | |||||||||||
| Total costs and expenses | 218,072 | 221,747 | 433,697 | 660,046 | |||||||||||
| Income (loss) from operations | (57,127 | ) | 20,000 | (41,615 | ) | 73,319 | |||||||||
| Other income | 1,110 | 3,243 | 1,846 | 10,695 | |||||||||||
| Income (loss) before income taxes | (56,017 | ) | 23,243 | (39,769 | ) | 84,014 | |||||||||
| Provision (benefit) for income taxes | (3,236 | ) | 6,551 | (1,643 | ) | 31,413 | |||||||||
| Net income (loss) | $ | (52,781 | ) | $ | 16,692 | $ | (38,126 | ) | $ | 52,601 | |||||
| Earnings (loss) per share: | |||||||||||||||
| Basic | $ | (2.97 | ) | $ | 0.77 | $ | (2.90 | ) | $ | 2.42 | |||||
| Diluted | $ | (2.97 | ) | $ | 0.75 | $ | (2.90 | ) | $ | 2.38 | |||||
| Weighted average shares outstanding: | |||||||||||||||
| Basic | 17,799 | 21,806 | 13,141 | 21,694 | |||||||||||
| Diluted | 17,799 | 22,129 | 13,141 | 22,096 | |||||||||||
| For the three months ended September 30, | For the nine months ended September 30, | ||||||||||||||
| 2018 | 2019 | 2018 | 2019 | ||||||||||||
| Net income (loss) | $ | (52,781 | ) | $ | 16,692 | $ | (38,126 | ) | $ | 52,601 | |||||
| Other comprehensive income (loss): | |||||||||||||||
| Unrealized gains (losses) on marketable securities, net of tax | (22 | ) | (2 | ) | (22 | ) | 415 | ||||||||
| Comprehensive income (loss) | $ | (52,803 | ) | $ | 16,690 | $ | (38,148 | ) | $ | 53,016 | |||||
4
STRAYERSTRATEGIC EDUCATION, INC.
|
|
|
|
|
|
|
|
|
|
|
|
|
|
|
|
|
|
|
|
|
|
|
|
|
|
|
|
|
|
|
|
|
|
|
|
|
|
| Additional |
|
|
|
|
|
|
| |
|
| Common Stock |
| Paid-in |
| Retained |
|
|
|
| |||||
|
| Shares |
| Par Value |
| Capital |
| Earnings |
| Total |
| ||||
Balance at December 31, 2015 |
| 11,027,177 |
| $ | 110 |
| $ | 24,738 |
| $ | 118,008 |
| $ | 142,856 |
|
Tax shortfall associated with stock-based compensation arrangements |
| — |
|
| — |
|
| (51) |
|
| — |
|
| (51) |
|
Restricted stock grants, net of forfeitures |
| 66,781 |
|
| 1 |
|
| (1) |
|
| — |
|
| — |
|
Stock-based compensation |
| — |
|
| — |
|
| 7,330 |
|
| — |
|
| 7,330 |
|
Net income |
| — |
|
| — |
|
| — |
|
| 23,084 |
|
| 23,084 |
|
Balance at September 30, 2016 |
| 11,093,958 |
| $ | 111 |
| $ | 32,016 |
| $ | 141,092 |
| $ | 173,219 |
|
|
|
|
|
|
|
|
|
|
|
|
|
|
|
|
|
|
|
|
|
|
|
|
|
|
|
|
|
|
|
|
|
|
|
|
|
|
|
| Additional |
|
|
|
|
|
|
| |
|
| Common Stock |
| Paid-in |
| Retained |
|
|
|
| |||||
|
| Shares |
| Par Value |
| Capital |
| Earnings |
| Total |
| ||||
Balance at December 31, 2016 |
| 11,093,489 |
| $ | 111 |
| $ | 35,453 |
| $ | 152,810 |
| $ | 188,374 |
|
Restricted stock grants, net of forfeitures |
| 73,936 |
|
| 1 |
|
| (1) |
|
| — |
|
| — |
|
Stock-based compensation |
| — |
|
| — |
|
| 8,569 |
|
| — |
|
| 8,569 |
|
Common stock dividends |
| — |
|
| — |
|
| — |
|
| (8,561) |
|
| (8,561) |
|
Net income |
| — |
|
| — |
|
| — |
|
| 27,107 |
|
| 27,107 |
|
Balance at September 30, 2017 |
| 11,167,425 |
| $ | 112 |
| $ | 44,021 |
| $ | 171,356 |
| $ | 215,489 |
|
| For the three months ended September 30, 2018 | ||||||||||||||||||||||
| Common Stock | Additional Paid-in Capital | Retained Earnings | Accumulated Other Comprehensive Income (Loss) | Total | ||||||||||||||||||
| Shares | Par Value | |||||||||||||||||||||
| Balance at June 30, 2018 | 11,306,527 | $ | 113 | $ | 53,015 | $ | 170,712 | $ | — | $ | 223,840 | |||||||||||
| Issuance of stock in connection with the acquisition of Capella Education Company | 10,263,775 | 103 | 1,236,858 | — | — | 1,236,961 | ||||||||||||||||
| Filing fee related to new stock issuance | — | — | (147 | ) | — | — | (147 | ) | ||||||||||||||
| Stock-based compensation | — | — | 5,098 | — | — | 5,098 | ||||||||||||||||
| Exercise of stock options, net | 131,779 | 1 | 6,830 | — | — | 6,831 | ||||||||||||||||
| Issuance of restricted stock, net | 5,518 | — | (426 | ) | — | — | (426 | ) | ||||||||||||||
| Common stock dividends ($0.50 per share) | — | — | — | (11,024 | ) | — | (11,024 | ) | ||||||||||||||
| Unrealized losses on marketable securities, net of tax | — | — | — | — | (22 | ) | (22 | ) | ||||||||||||||
| Net loss | — | — | — | (52,781 | ) | — | (52,781 | ) | ||||||||||||||
| Balance at September 30, 2018 | 21,707,599 | $ | 217 | $ | 1,301,228 | $ | 106,907 | $ | (22 | ) | $ | 1,408,330 | ||||||||||
| For the three months ended September 30, 2019 | ||||||||||||||||||||||
| Common Stock | Additional Paid-in Capital | Retained Earnings | Accumulated Other Comprehensive Income (Loss) | Total | ||||||||||||||||||
| Shares | Par Value | |||||||||||||||||||||
| Balance at June 30, 2019 | 21,948,563 | $ | 219 | $ | 1,305,148 | $ | 132,060 | $ | 449 | $ | 1,437,876 | |||||||||||
| Stock-based compensation | — | — | 3,021 | — | — | 3,021 | ||||||||||||||||
| Exercise of stock options, net | 12,795 | 1 | (1,565 | ) | — | — | (1,564 | ) | ||||||||||||||
| Issuance of restricted stock, net | 3,147 | — | (251 | ) | — | — | (251 | ) | ||||||||||||||
| Common stock dividends ($0.50 per share) | — | — | — | (11,113 | ) | — | (11,113 | ) | ||||||||||||||
| Unrealized losses on marketable securities, net of tax | — | — | — | — | (2 | ) | (2 | ) | ||||||||||||||
| Net income | — | — | — | 16,692 | — | 16,692 | ||||||||||||||||
| Balance at September 30, 2019 | 21,964,505 | $ | 220 | $ | 1,306,353 | $ | 137,639 | $ | 447 | $ | 1,444,659 | |||||||||||
5
STOCKHOLDERS’
EQUITY
|
|
|
|
|
|
|
|
|
| For the Nine Months Ended |
| ||||
|
| September 30, |
| ||||
|
| 2016 |
| 2017 |
| ||
Cash flows from operating activities: |
|
|
|
|
|
|
|
Net income |
| $ | 23,084 |
| $ | 27,107 |
|
Adjustments to reconcile net income to net cash provided by operating activities: |
|
|
|
|
|
|
|
Amortization of gain on sale of assets |
|
| (211) |
|
| (133) |
|
Amortization of deferred rent |
|
| (919) |
|
| (1,351) |
|
Amortization of deferred financing costs |
|
| 197 |
|
| 197 |
|
Depreciation and amortization |
|
| 13,276 |
|
| 13,718 |
|
Deferred income taxes |
|
| (5,543) |
|
| (3,728) |
|
Stock-based compensation |
|
| 7,330 |
|
| 8,569 |
|
Changes in assets and liabilities: |
|
|
|
|
|
|
|
Tuition receivable, net |
|
| 425 |
|
| (454) |
|
Other current assets |
|
| (3,895) |
|
| (2,151) |
|
Other assets |
|
| (2,264) |
|
| 1,200 |
|
Accounts payable and accrued expenses |
|
| 2,825 |
|
| 9,711 |
|
Income taxes payable and income taxes receivable |
|
| (4,854) |
|
| (4,401) |
|
Deferred revenue |
|
| 5,940 |
|
| 5,386 |
|
Other long-term liabilities |
|
| (5,284) |
|
| (9,298) |
|
Net cash provided by operating activities |
|
| 30,107 |
|
| 44,372 |
|
|
|
|
|
|
|
|
|
Cash flows from investing activities: |
|
|
|
|
|
|
|
Purchases of property and equipment |
|
| (7,501) |
|
| (14,573) |
|
Cash used in acquisition, net of cash acquired |
|
| (7,635) |
|
| — |
|
Net cash used in investing activities |
|
| (15,136) |
|
| (14,573) |
|
|
|
|
|
|
|
|
|
Cash flows from financing activities: |
|
|
|
|
|
|
|
Payments of contingent consideration |
|
| (1,358) |
|
| — |
|
Common dividends paid |
|
| — |
|
| (8,561) |
|
Net cash used in financing activities |
|
| (1,358) |
|
| (8,561) |
|
Net increase in cash and cash equivalents |
|
| 13,613 |
|
| 21,238 |
|
Cash and cash equivalents — beginning of period |
|
| 106,889 |
|
| 129,245 |
|
Cash and cash equivalents — end of period |
| $ | 120,502 |
| $ | 150,483 |
|
Noncash transactions: |
|
|
|
|
|
|
|
Purchases of property and equipment included in accounts payable |
| $ | 112 |
| $ | 749 |
|
| For the nine months ended September 30, 2018 | ||||||||||||||||||||||
| Common Stock | Additional Paid-in Capital | Retained Earnings | Accumulated Other Comprehensive Income (Loss) | Total | ||||||||||||||||||
| Shares | Par Value | |||||||||||||||||||||
| Balance at December 31, 2017 | 11,167,425 | $ | 112 | $ | 47,079 | $ | 162,006 | $ | — | $ | 209,197 | |||||||||||
| Impact of adoption of new accounting standard | — | — | — | (171 | ) | — | (171 | ) | ||||||||||||||
| Issuance of stock in connection with the acquisition of Capella Education Company | 10,263,775 | 103 | 1,236,858 | — | — | 1,236,961 | ||||||||||||||||
| Filing fee related to new stock issuance | — | — | (147 | ) | — | — | (147 | ) | ||||||||||||||
| Stock-based compensation | — | — | 11,035 | — | — | 11,035 | ||||||||||||||||
| Exercise of stock options, net | 131,779 | 1 | 6,830 | — | — | 6,831 | ||||||||||||||||
| Issuance of restricted stock, net | 144,620 | 1 | (427 | ) | — | — | (426 | ) | ||||||||||||||
| Common stock dividends ($1.00 per share) | — | — | — | (16,802 | ) | — | (16,802 | ) | ||||||||||||||
| Unrealized losses on marketable securities, net of tax | — | — | — | — | (22 | ) | (22 | ) | ||||||||||||||
| Net loss | — | — | — | (38,126 | ) | — | (38,126 | ) | ||||||||||||||
| Balance at September 30, 2018 | 21,707,599 | $ | 217 | $ | 1,301,228 | $ | 106,907 | $ | (22 | ) | $ | 1,408,330 | ||||||||||
| For the nine months ended September 30, 2019 | ||||||||||||||||||||||
| Common Stock | Additional Paid-in Capital | Retained Earnings | Accumulated Other Comprehensive Income (Loss) | Total | ||||||||||||||||||
| Shares | Par Value | |||||||||||||||||||||
| Balance at December 31, 2018 | 21,743,498 | $ | 217 | $ | 1,306,653 | $ | 118,322 | $ | 32 | $ | 1,425,224 | |||||||||||
| Stock-based compensation | — | — | 8,947 | 83 | — | 9,030 | ||||||||||||||||
| Exercise of stock options, net | 103,364 | 2 | (1,774 | ) | — | — | (1,772 | ) | ||||||||||||||
| Issuance of restricted stock, net | 117,643 | 1 | (7,473 | ) | — | — | (7,472 | ) | ||||||||||||||
| Common stock dividends ($1.50 per share) | — | — | — | (33,367 | ) | — | (33,367 | ) | ||||||||||||||
| Unrealized gains on marketable securities, net of tax | — | — | — | — | 415 | 415 | ||||||||||||||||
| Net income | — | — | — | 52,601 | — | 52,601 | ||||||||||||||||
| Balance at September 30, 2019 | 21,964,505 | $ | 220 | $ | 1,306,353 | $ | 137,639 | $ | 447 | $ | 1,444,659 | |||||||||||
6
| For the nine months ended September 30, | |||||||
| 2018 | 2019 | ||||||
| Cash flows from operating activities: | |||||||
| Net income (loss) | $ | (38,126 | ) | $ | 52,601 | ||
| Adjustments to reconcile net income (loss) to net cash provided by (used in) operating activities: | |||||||
| Amortization of deferred financing costs | 209 | 250 | |||||
| Amortization of investment discount/premium | 132 | 286 | |||||
| Depreciation and amortization | 29,107 | 78,862 | |||||
| Deferred income taxes | (4,443 | ) | 971 | ||||
| Stock-based compensation | 11,781 | 9,075 | |||||
| Impairment of intangible assets | 19,304 | — | |||||
| Changes in assets and liabilities: | |||||||
| Tuition receivable, net | 8,227 | 2,258 | |||||
| Other current assets | 2,223 | (921 | ) | ||||
| Other assets | (581 | ) | (727 | ) | |||
| Accounts payable and accrued expenses | (8,949 | ) | (2,022 | ) | |||
| Income taxes payable and income taxes receivable | (7,868 | ) | (7,125 | ) | |||
| Contract liabilities | (21,946 | ) | 10,311 | ||||
| Other long-term liabilities | (3,717 | ) | (2,412 | ) | |||
| Net cash provided by (used in) operating activities | (14,647 | ) | 141,407 | ||||
| Cash flows from investing activities: | |||||||
| Net cash acquired in acquisition | 168,387 | — | |||||
| Purchases of property and equipment | (16,028 | ) | (27,769 | ) | |||
| Purchases of marketable securities | (11,346 | ) | (17,769 | ) | |||
| Maturities of marketable securities | 5,842 | 32,860 | |||||
| Other investments | (167 | ) | (878 | ) | |||
| Net cash provided by (used in) investing activities | 146,688 | (13,556 | ) | ||||
| Cash flows from financing activities: | |||||||
| Common dividends paid | (16,802 | ) | (33,297 | ) | |||
| Net payments for stock awards | 6,372 | (9,195 | ) | ||||
| Payment of deferred financing costs | (1,162 | ) | — | ||||
| Net cash used in financing activities | (11,592 | ) | (42,492 | ) | |||
| Net increase in cash, cash equivalents, and restricted cash | 120,449 | 85,359 | |||||
| Cash, cash equivalents, and restricted cash — beginning of period | 156,448 | 312,237 | |||||
| Cash, cash equivalents, and restricted cash — end of period | $ | 276,897 | $ | 397,596 | |||
| Noncash transactions: | |||||||
| Purchases of property and equipment included in accounts payable | $ | 2,975 | $ | 1,821 | |||
STRAYER
| 1. | Nature of Operations |
2. Significant Accounting Policies
Note 15.
| 2. | Significant Accounting Policies |
Revenue Recognition
At the start of each academic term or program, a liability (deferred revenue) is recorded for academic services to be provided and a tuition receivable is recorded for the portion of the tuition not paid in advance. Any cash received priorcosts attributable to the startcorporate offices. Bad debt expense incurred on delinquent student account balances is also included in instructional and support costs.
The Company’s refund policy typically permits students who complete less than half of a course to receive a partial refund of tuition for that course. Refunds reduce the tuition revenue that would have otherwise been recognized for that student. Since the University’s academic terms coincide with the Company’s financial reporting periods, nearly all refunds are processed and
7
recorded within the same quarter as the corresponding revenue. The amount of tuition revenue refundable to students may vary based on the student’s state of residence. Unused books and related academic materials may be returned for a full refund within 21 days of the start of class; however, purchases of electronic content are not refundable if downloaded. Revenues derived from fees are not eligible for a refund.
Graduation Fund
In the third quarter of 2013, the University introduced the Graduation Fund, which allows new undergraduate students to earn tuition credits that are redeemable in the final year of a student’s course of study if he or she successfully remains in the program. New students registering in credit-bearing courses in any undergraduate program receive one free course for every three courses that are successfully completed. Students must meet all of the University’s admission requirements, and must be enrolled in a bachelor’s degree program. The Company’s employees and their dependents are not eligible for the program. Students who have more than one consecutive term of non-attendance lose any Graduation Fund credits earned to date, but may earn and accumulate new credits if the student is reinstated or readmitted by the University in the future.
Revenue from students participating in the Graduation Fund is recorded in accordance with the Revenue Recognition Topic, ASC 605-50. The Company defers the value of benefits estimated to be redeemed in the future based on the underlying revenue transactions that result in progress by the student toward earning the benefit. The Company’s estimate of the benefits that will be redeemed in the future is based on its historical experience of student persistence toward completion of a course of study within this program and similar programs. Each quarter, the Company assesses its methodologies and assumptions underlying these estimates and, to date, any adjustments to the estimates have not been material. The amount estimated to be redeemed in the next 12 months is $19.3 million and is included in deferred revenue as a current liability in the unaudited condensed consolidated balance sheets.
The table below presents activity in the Graduation Fund for the ninethree months ended September 30, 2016 and 2017 (in thousands):
|
|
|
|
|
|
|
|
|
|
| September 30, |
|
| September 30, |
| ||
|
| 2016 |
|
| 2017 |
| ||
Balance at beginning of period |
| $ | 20,937 |
|
| $ | 29,499 |
|
Revenue deferred |
|
| 14,753 |
|
|
| 17,494 |
|
Benefit redeemed |
|
| (9,139) |
|
|
| (12,551) |
|
Balance at end of period |
| $ | 26,551 |
|
| $ | 34,442 |
|
| New Classification | ||||||||||||||||||||||||||||||||
| March 31, 2018 | June 30, 2018 | September 30, 2018 | December 31, 2018 | |||||||||||||||||||||||||||||
| Prior Classification | I&SC | G&A | I&SC | G&A | I&SC | G&A | I&SC | G&A | ||||||||||||||||||||||||
| Instruction and educational support | $ | 63,776 | $ | — | $ | 64,690 | $ | — | $ | 93,290 | $ | — | $ | 118,320 | $ | — | ||||||||||||||||
| Admissions advisory | 4,676 | — | 4,609 | — | 9,789 | — | 12,392 | — | ||||||||||||||||||||||||
| Marketing | — | 20,124 | — | 21,113 | — | 46,165 | — | 49,577 | ||||||||||||||||||||||||
| General and administration | — | 11,218 | — | 11,063 | — | 15,811 | — | 18,964 | ||||||||||||||||||||||||
Total reclassified costs and expenses(1) | $ | 68,452 | $ | 31,342 | $ | 69,299 | $ | 32,176 | $ | 103,079 | $ | 61,976 | $ | 130,712 | $ | 68,541 | ||||||||||||||||
(1) | This amount excludes the amortization of intangible assets, merger and integration costs, and impairment of intangible assets expense line items on the condensed consolidated statements of income as those expense line items were not impacted by the operating expense reclassification. |
| As of September 30, | |||||||
| 2018 | 2019 | ||||||
| Cash and cash equivalents | $ | 276,382 | $ | 397,094 | |||
| Restricted cash included in other current assets | 15 | 2 | |||||
| Restricted cash included in other assets | 500 | 500 | |||||
| Total cash, cash equivalents, and restricted cash shown in the statement of cash flows | $ | 276,897 | $ | 397,596 | |||
8
The Company’s tuition receivable and allowance for doubtful accounts were as follows as of December 31, 20162018 and September 30, 20172019 (in thousands):
|
|
|
|
|
|
|
| |||||||
|
| December 31, 2016 |
| September 30, 2017 |
| December 31, 2018 | September 30, 2019 | |||||||
Tuition receivable |
| $ | 30,733 |
| $ | 33,183 |
| $ | 84,151 | $ | 82,494 | |||
Allowance for doubtful accounts |
|
| (10,201) |
|
| (12,557) |
| (28,457 | ) | (31,530 | ) | |||
Tuition receivable, net |
| $ | 20,532 |
| $ | 20,626 |
| $ | 55,694 | $ | 50,964 | |||
|
|
|
|
|
|
|
|
|
|
|
|
|
| |||||||||||||||
|
| For the three months ended |
| For the nine months ended |
| |||||||||||||||||||||||
|
| September 30, |
| September 30, |
| For the three months ended September 30, | For the nine months ended September 30, | |||||||||||||||||||||
|
| 2016 |
| 2017 |
| 2016 |
| 2017 |
| 2018 | 2019 | 2018 | 2019 | |||||||||||||||
Allowance for doubtful accounts, beginning of period |
| $ | 9,981 |
| $ | 11,760 |
| $ | 10,024 |
| $ | 10,201 |
| $ | 15,048 | $ | 30,733 | $ | 12,687 | $ | 28,457 | |||||||
Additions charged to expense |
|
| 3,865 |
|
| 5,364 |
|
| 11,069 |
|
| 14,835 |
| 9,864 | 12,111 | 22,851 | 35,893 | |||||||||||
| Adjustment to value of acquired receivables | 6,601 | — | 6,601 | 2,207 | ||||||||||||||||||||||||
Write-offs, net of recoveries |
|
| (4,052) |
|
| (4,567) |
|
| (11,299) |
|
| (12,479) |
| (6,118 | ) | (11,314 | ) | (16,744 | ) | (35,027 | ) | |||||||
Allowance for doubtful accounts, end of period |
| $ | 9,794 |
| $ | 12,557 |
| $ | 9,794 |
| $ | 12,557 |
| $ | 25,395 | $ | 31,530 | $ | 25,395 | $ | 31,530 | |||||||
Fair Value
The Fair Value Measurement Topic, ASC 820-10 (“ASC 820-10”), establishes a framework for measuring fair value, establishes a fair value hierarchy based upon
|
|
|
|
|
|
The Company’s assets and liabilities that are subject to fair value measurement are categorized in oneimplicit interest rate for most of the three levels above. Fair values areCompany's leases cannot be readily determined, the Company uses its incremental borrowing rate based on the inputsinformation available at the measurement dates,commencement date in determining the present value of lease payments. Lease expense for lease payments is recognized on a straight-line basis over the lease term for operating leases.
additional information.
During
9
recoverability of goodwill assigned to NYCDA and performed Step 1 of the goodwill impairment test as well as a quantitative impairment test of the indefinite-lived intangible asset. Based on these tests, the Company determined the fair value of NYCDA exceeded its carrying value and there was no impairment of the goodwill and indefinite-lived intangible asset assigned to NYCDA as of September 30, 2017.
Authorized Stock
Stock-Based Compensation
��
As required by the Stock Compensation Topic, ASC 718, the Company measures and recognizes compensation expense for all share-based payment awards made to employees and directors, including employee stock options, restricted stock, restricted stock units, and employee stock purchases related to the Company’s Employee Stock Purchase Plan, based on estimated fair values. Stock-based compensation expense recognized in the unaudited consolidated statements of income for each of the three and nine months ended September 30, 2016 and 2017 is based on awards ultimately expected to vest and, therefore, has been adjusted for estimated forfeitures. The Company estimates forfeitures at the time of grant and revises the estimate, if necessary, in subsequent periods if actual forfeitures differ from those estimates. The forfeiture rate used is based on historical experience. The Company also assesses the likelihood that performance criteria associated with performance-based awards will be met. If it is determined that it is more likely than not that performance criteria will not be achieved, the Company revises its estimate of the number of shares it believes will ultimately vest.
Effective January 1, 2017, the Company adopted ASU No. 2016-09, Compensation – Stock Compensation (Topic 718): Improvements to Employee Share-Based Payment Accounting (“ASU 2016-09”). ASU 2016-09 impacts several aspects of the accounting for share-based payment transactions, including classification of certain items on the consolidated statement of cash flows and accounting for income taxes. Specifically, ASU 2016-09 requires excess tax benefits and tax deficiencies to be recognized as income tax expense or benefit in earnings, which may introduce significant volatility to the Company’s provision for income taxes. Also, all tax-related cash flows resulting from share-based payments will now be reported as operating activities in the statement of cash flows. The Company has elected to apply this cash flow guidance prospectively and there was no impact to the prior period presentation. In addition, pursuant to ASU 2016-09 the Company has elected to continue to estimate forfeitures ratably over the life of awards. The adoption of ASU 2016-09 has not materially impacted the Company’s financial statements. See note 6 for additional information.
16, 2019.
10
Set forth below is a reconciliation of shares used to calculate basic and diluted earnings (loss) per share for the three and nine months ended September 30, 20162018 and 20172019 (in thousands):
|
|
|
|
|
|
|
|
|
| |||||||||||
|
| For the three months ended |
| For the nine months ended |
| |||||||||||||||
|
| September 30, |
| September 30, |
| For the three months ended September 30, | For the nine months ended September 30, | |||||||||||||
|
| 2016 |
| 2017 |
| 2016 |
| 2017 |
| 2018 | 2019 | 2018 | 2019 | |||||||
Weighted average shares outstanding used to compute basic earnings per share |
| 10,616 |
| 10,701 |
| 10,608 |
| 10,671 |
| |||||||||||
| Weighted average shares outstanding used to compute basic earnings (loss) per share | 17,799 | 21,806 | 13,141 | 21,694 | ||||||||||||||||
Incremental shares issuable upon the assumed exercise of stock options |
| — |
| 38 |
| — |
| 38 |
| — | 44 | — | 65 | |||||||
Unvested restricted stock and restricted stock units |
| 212 |
| 471 |
| 195 |
| 465 |
| — | 279 | — | 337 | |||||||
Shares used to compute diluted earnings per share |
| 10,828 |
| 11,210 |
| 10,803 |
| 11,174 |
| |||||||||||
| Shares used to compute diluted earnings (loss) per share | 17,799 | 22,129 | 13,141 | 22,096 | ||||||||||||||||
The Company provides for deferred(Loss)
The Income Taxes Topic, ASC 740, requires the company to determine whether uncertain tax positions should be recognized within the Company’s financial statements. The Company recognizes interest and penalties, if any, related to uncertain tax positions in income tax expense. Uncertain tax positions are recognized when a tax position, based solely on its technical merits, is determined to be more likely than not to be sustained upon examination. Upon determination, uncertain tax positions are measured to determine the amount of benefit that is greater than 50% likely to be realized upon ultimate settlement with a taxing authority that has full knowledge of all relevant information. A tax position is derecognized if it no longer meets the more likely than not threshold of being sustained.
The tax years 2014-2016 remain open for Federal tax examination and the tax years 2013-2016 remain open to examination by state and local taxing jurisdictions in which the Company is subject.
consists of unrealized gains and losses on available-for-sale marketable securities, net of tax. As of December 31, 2018 and September 30, 2019, the balance of accumulated other comprehensive income was $32,000, net of tax of $10,000 and $447,000, net of tax of $157,000, respectively. There were 0 reclassifications out of accumulated other comprehensive income to net income (loss) for the three and nine months ended September 30, 2019.
Recent
and accounting for performance conditions and for share-based payments after vesting. The Company is finalizing its assessmentadopted this guidance as of key revenue streams, including a comparison of current accounting policies and practices to the new standard, and is determining the appropriate changes to business processes and controls. Based on its evaluation to date, the Company believes that under the new standard the allocation of revenue to certain performance obligations may result in changes in the timing of revenue recognition between interim periods for one of its performance obligations. However, any changes associatedJanuary 1, 2019 with the adoption of ASU 2014-09 are not expected to have a significant impact on annual revenue recognized, and are not expected to have ano material impact on the Company’sits unaudited condensed consolidated financial statements. The Company plans to adopt ASU 2014-09 using the modified retrospective approach and accordingly will complete the analysis of
11
the cumulative effect adjustment to retained earnings and prepare enhanced disclosures pertaining to revenue recognition for the quarterly and annual filings beginning in the first quarter of 2018.
In February 2016, the FASB issuedRecently Issued Accounting Standards Update (“ASU”) No. 2016-02, Leases (Topic 842) (“ASU 2016-02”). The new guidance requires the recognition of right-of-use assets and lease liabilities on the balance sheet for most leases. Under current guidance, operating leases are off-balance sheet. ASU 2016-02 also requires more extensive quantitative and qualitative disclosures about leasing arrangements. ASU 2016-02 applies to fiscal periods beginning after December 15, 2018, using the modified retrospective method, with early adoption permitted. The Company anticipates that the impact of ASU 2016-02 on its consolidated balance sheet will be material as the Company will record significant asset and liability balances in connection with its leased properties.
Not Yet Adopted
In November 2016, the FASB issued ASU No. 2016-18, Statement of Cash Flows: Restricted Cash (Topic 230) (“ASU 2016-18”). Under ASU 2016-18, an entity should include in its cash and cash-equivalent balances in the statement of cash flows those amounts that are deemed to be restricted cash and restricted cash equivalents. The standard will be effective for fiscal years beginning after December 15, 2017, including interim periods within those fiscal years, and the Company does not expect adoption of ASU 2016-18 to have a material impact on its consolidated financial statements.
In January 2017, the FASB issued ASU No. 2017-04, Intangibles - Goodwill and Other: Simplifying the Test for Goodwill Impairment, which simplifies the subsequent measurement of goodwill. The amendments in this update should be adopted on a prospective basis for the annual or any interim goodwill impairment tests beginning after December 15, 2019, though early adoption is permitted. The Company is evaluating the impact this standard will have on its financial condition, results of operations, and disclosures.
3. Acquisition of New York Code and Design Academy
| 3. | Merger with Capella Education Company |
Fair value of Company common stock issued in exchange for CEC outstanding shares(1) | $ | 1,209,483 | |
| Fair value of Company equity-based awards issued in exchange for CEC equity-based awards | 27,478 | ||
| Total fair value of consideration transferred | $ | 1,236,961 | |
(1) | The Company issued 10,263,775 common shares at a market price of $117.84 in exchange for each issued and outstanding share of CEC common stock. |
The purchase price included $2.4 million paid up front in cash, plus contingent cash payments of (a) up to $12.5 million payable based on NYCDA’s results of operations over a five-year period (the “Earnout”), and (b) $5.5 million payable based on NYCDA’s receipt of state regulatory permits. Pursuant to the Acquisition, $1.0 million of the Earnout may be accelerated upon receipt of one of the state regulatory permits. The Company recorded total contingent consideration of $14.5 million at the time of acquisition. In April 2016 and August 2016, NYCDA received the state regulatory permits and the Company paid $6.0 and $0.5 million of contingent consideration to the sellers, respectively.
In addition, the Company paid a total of $4.6 million to two of NYCDA’s founders who are required to remain employed for at least three years from the acquisition date. If either of them terminates employment voluntarily, or is terminated for cause (as defined), he is required to reimburse the Company his respective portion of the retention amount. This amount was classified as prepaid compensation and is amortized to compensation expense over three years.
Total potential cash payments for the Acquisition, including the contingent cash payments and prepaid compensation, could total $25.0 million.
12
The allocation of the purchase price was as follows (in thousands):
| ||||
| ||||
|
| |||
|
| |||
| ||||
| ||||
|
| |||
| ||||
| ||||
| ||||
| ||||
| ||||
|
|
The fair value of the Earnout was originally measured by applying a probability discounted cash flow model based on significant inputs not observable in the market (Level 3 inputs). Key assumptions include a discount rate of 4.5% and expected future value of payments, at the time, of $12.5 million. Following its initial recognition, the Company assesses the carrying value of the Earnout to the fair value of the remaining payments. Fair value is then adjusted as necessary to reflect revisions to the business plan, expectations relative to achieving the performance targets over the earnout period, and the impact of the discount rate. No adjustment to the Earnout was recorded in the three and nine months ended September 30, 2016. During the three months ended June 30, 2017, the Company updated its near-term revenue projections for NYCDA and reduced the balance of the contingent consideration by $2.3 million. During the three months ended September 30, 2017, following delays in implementing its marketing strategy to enroll new students,2019, the Company further updated its revenue projections duringfinalized the Earnout measurement period resulting in a reduction in the contingent consideration balance by an additional $5.5 million. The fair value of assets acquired and liabilities assumed. Measurement period adjustments were reflected in the Earnout atperiods in which the adjustments occurred. During the three months ended December 31, 2018, the Company recorded measurement period adjustments that reduced cash and cash equivalents, other assets, and deferred income taxes by $0.5 million, $1.4 million, and $0.1 million, respectively. These adjustments resulted in a $1.8 million increase to goodwill recognized in connection with the CEC merger during the three months ended December 31, 2018. During the nine months ended September 30, 2017 is zero,2019, the Company recorded measurement period adjustments that reduced deferred income taxes and current assets by $3.8 million and $1.9 million, respectively, and increased current liabilities and long-term liabilities by $1.3 million and $0.1 million, respectively. These adjustments resulted in a $0.5 million decrease to goodwill recognized in connection with the maximum possible amount that could be paid is $11.5 million.
CEC merger during the nine months ended September 30, 2019. All measurement period adjustments are reflected in the fair value of assets acquired and liabilities assumed in the table below.
| Cash and cash equivalents | $ | 167,859 | |
| Marketable securities | 31,419 | ||
| Tuition receivable | 36,716 | ||
| Income taxes receivable | 163 | ||
| Other current assets | 9,041 | ||
| Marketable securities, non-current | 34,700 | ||
| Property and equipment, net | 53,182 | ||
| Other assets | 14,556 | ||
| Intangible assets | 349,800 | ||
| Goodwill | 725,275 | ||
| Total assets acquired | 1,422,711 | ||
| Accounts payable and accrued expenses | (48,103 | ) | |
| Contract liabilities | (39,000 | ) | |
| Deferred income taxes | (96,320 | ) | |
| Other long-term liabilities | (2,327 | ) | |
| Total liabilities assumed | (185,750 | ) | |
| Total consideration | $ | 1,236,961 | |
| Fair Value | Weighted Average Useful Life in Years | ||||
| Trade names | $ | 183,800 | Indefinite | ||
| Student relationships | 166,000 | 3 | |||
| $ | 349,800 | ||||
| Three Months Ended September 30, 2018 | Nine Months Ended September 30, 2018 | ||||||
| Revenue | $ | 224,641 | $ | 679,309 | |||
| Net income (loss) | (14,146 | ) | 10,606 | ||||
| ||
| 4. |
|
| For the three months ended September 30, | For the nine months ended September 30, | ||||||||||||||
| 2018 | 2019 | 2018 | 2019 | ||||||||||||
| Strayer University Segment | |||||||||||||||
| Tuition, net of discounts, grants and scholarships | $ | 107,773 | $ | 123,259 | $ | 328,476 | $ | 371,176 | |||||||
Other(1) | 6,698 | 4,578 | 15,168 | 13,630 | |||||||||||
| Total Strayer University Segment | 114,471 | 127,837 | 343,644 | 384,806 | |||||||||||
| Capella University Segment | |||||||||||||||
| Tuition, net of discounts, grants and scholarships | 40,749 | 105,623 | 40,749 | 322,157 | |||||||||||
Other(1) | 3,043 | 4,926 | 3,043 | 15,261 | |||||||||||
| Total Capella University Segment | 43,792 | 110,549 | 43,792 | 337,418 | |||||||||||
Non-Degree Programs Segment(2) | 2,682 | 3,361 | 4,646 | 11,141 | |||||||||||
| Consolidated revenue | $ | 160,945 | $ | 241,747 | $ | 392,082 | $ | 733,365 | |||||||
| ||
(1) | Other |
4. Restructuring
(2) | Non-Degree Programs revenue is primarily comprised of tuition revenue and placement fee revenue. |
services. The Company applies the five-step revenue model under ASC 606 to determine when revenue is earned and recognized.
| For the nine months ended September 30, | |||||||
| 2018 | 2019 | ||||||
| Balance at beginning of period | $ | 37,400 | $ | 43,329 | |||
| Revenue deferred | 18,791 | 21,358 | |||||
| Benefit redeemed | (15,792 | ) | (17,947 | ) | |||
| Balance at end of period | $ | 40,399 | $ | 46,740 | |||
| 5. | Restructuring and Related Charges |
13
The following details the changes in the Company’s restructuring liability for lease and related costs during the nine months ended September 30, 20162018 and 20172019 (in thousands):
|
|
|
|
|
|
|
| September 30, |
| September 30, |
| ||
| 2016 |
| 2017 |
| ||
Balance at beginning of period(1) | $ | 20,055 |
| $ | 11,985 |
|
Adjustments(2) |
| (1,695) |
|
| 375 |
|
Payments |
| (4,434) |
|
| (2,884) |
|
Balance at end of period(1) | $ | 13,926 |
| $ | 9,476 |
|
| Lease and Related Costs, Net | Severance and Other Employee Separation Costs | Total | |||||||||
| Balance at December 31, 2017 | $ | 8,781 | $ | — | $ | 8,781 | |||||
Restructuring and other charges(1) | — | 13,088 | 13,088 | ||||||||
| Payments | (2,069 | ) | (439 | ) | (2,508 | ) | |||||
Adjustments(2) | 107 | — | 107 | ||||||||
| Balance at September 30, 2018 | $ | 6,819 | $ | 12,649 | $ | 19,468 | |||||
Balance at December 31, 2018(3) | $ | 6,540 | $ | 14,347 | $ | 20,887 | |||||
Restructuring and other charges(1) | — | 2,334 | 2,334 | ||||||||
| Payments | — | (7,841 | ) | (7,841 | ) | ||||||
Adjustments(2) | (6,540 | ) | — | (6,540 | ) | ||||||
Balance at September 30, 2019(3) | $ | — | $ | 8,840 | $ | 8,840 | |||||
(1) | Restructuring and other charges were $0.2 million and $2.3 million for the three and nine months ended September 30, 2019, respectively, and $13.1 million for both the three and nine months ended September 30, 2018. Restructuring and other charges are included in Merger and integration costs on the unaudited condensed consolidated statements of income. |
(2) | For the three and nine months ended September 30, 2018, adjustments include accretion of interest on lease costs, partially offset by changes in the timing and expected income from subleases. For the three and nine months ended September 30, 2019, adjustments represent the impact of adopting ASC 842 on January 1, 2019. In accordance with ASC 842, the lease related restructuring liability balance as of December 31, 2018 was netted against the initial ROU lease asset recognized upon adoption. Asset retirement obligations related to these restructured properties are also included in the adjustments amount. |
(3) | The current portion of restructuring liabilities was |
| Amortized Cost | Gross Unrealized Gain | Gross Unrealized (Losses) | Estimated Fair Value | ||||||||||||
| Corporate debt securities | $ | 40,148 | $ | 207 | $ | (6 | ) | $ | 40,349 | ||||||
| Tax-exempt municipal securities | 13,936 | 131 | (29 | ) | 14,038 | ||||||||||
| Variable rate demand notes | 5,600 | — | — | 5,600 | |||||||||||
| Total | $ | 59,684 | $ | 338 | $ | (35 | ) | $ | 59,987 | ||||||
| Amortized Cost | Gross Unrealized Gain | Gross Unrealized (Losses) | Estimated Fair Value | ||||||||||||
| Corporate debt securities | $ | 48,202 | $ | 12 | $ | (284 | ) | $ | 47,930 | ||||||
| Tax-exempt municipal securities | 22,858 | 45 | (34 | ) | 22,869 | ||||||||||
| Variable rate demand notes | 4,000 | — | — | 4,000 | |||||||||||
| Total | $ | 75,060 | $ | 57 | $ | (318 | ) | $ | 74,799 | ||||||
| December 31, 2018 | September 30, 2019 | ||||||
| Due within one year | $ | 37,121 | $ | 33,455 | |||
| Due after one year through five years | 37,678 | 26,532 | |||||
| Total | $ | 74,799 | $ | 59,987 | |||
| For the three months ended September 30, | For the nine months ended September 30, | ||||||||||||||
| 2018 | 2019 | 2018 | 2019 | ||||||||||||
| Maturities of marketable securities | $ | 5,842 | $ | 10,300 | $ | 5,842 | $ | 32,860 | |||||||
| Total | $ | 5,842 | $ | 10,300 | $ | 5,842 | $ | 32,860 | |||||||
| For the three months ended September 30, | For the nine months ended September 30, | ||||||
| 2019 | 2019 | ||||||
| Lease cost: | |||||||
| Operating lease cost | $ | 7,022 | $ | 22,520 | |||
| Short-term lease cost | 234 | 674 | |||||
| Sublease income | (681 | ) | (2,128 | ) | |||
| Total lease costs | $ | 6,575 | $ | 21,066 | |||
| As of September 30, 2019 | ||
| Lease term and discount rate: | ||
| Weighted-average remaining lease term (years) | 5.7 | |
| Weighted-average discount rate | 4.20 | % |
| For the nine months ended September 30, | |||
| 2019 | |||
| Other information (in thousands): | |||
| Cash paid for amounts included in the measurement of lease liabilities | $ | 24,982 | |
| Right-of-use assets obtained in exchange for operating lease liabilities | $ | 4,082 | |
| Leasehold improvements obtained in exchange for TIAs paid directly to third parties | $ | 2,156 | |
| Year Ending September 30, | |||
| 2020 | $ | 30,365 | |
| 2021 | 25,692 | ||
| 2022 | 17,443 | ||
| 2023 | 12,121 | ||
| 2024 | 10,442 | ||
| Thereafter | 27,470 | ||
Total lease payments(1) | $ | 123,533 | |
| Less: interest | (14,299 | ) | |
| Present value of lease liabilities | $ | 109,234 | |
|
Minimum Rental Commitments(1) | |||
| 2019 | $ | 33,600 | |
| 2020 | 28,399 | ||
| 2021 | 23,485 | ||
| 2022 | 13,770 | ||
| 2023 | 10,316 | ||
| Thereafter | 32,745 | ||
| Total | $ | 142,315 | |
5. Fair Value Measurement
(1) | Amounts are based on the accounting guidance in ASC 840, Leases, that was superseded upon the Company's adoption of ASC 842 on January 1, 2019. |
| 8. | Fair Value Measurement |
|
|
|
|
|
|
|
|
|
|
|
|
|
|
|
|
|
|
| Fair Value Measurements at Reporting Date Using |
| |||||||
|
|
|
|
| Quoted Prices in |
| Significant |
|
|
|
| ||
|
|
|
|
| Active Markets |
| Other |
| Significant |
| |||
|
|
|
|
| for Identical |
| Observable |
| Unobservable |
| |||
|
| September 30, |
| Assets/Liabilities |
| Inputs |
| Inputs |
| ||||
|
| 2017 |
| (Level 1) |
| (Level 2) |
| (Level 3) |
| ||||
Assets: |
|
|
|
|
|
|
|
|
|
|
|
|
|
Money market funds |
| $ | 15,199 |
| $ | 15,199 |
| $ | — |
| $ | — |
|
|
|
|
|
|
|
|
|
|
|
|
|
|
|
Liabilities: |
|
|
|
|
|
|
|
|
|
|
|
|
|
Deferred payments |
| $ | 4,424 |
| $ | — |
| $ | — |
| $ | 4,424 |
|
| Fair Value Measurements at Reporting Date Using | |||||||||||||||
| September 30, 2019 | Quoted Prices in Active Markets for Identical Assets/Liabilities (Level 1) | Significant Other Observable Inputs (Level 2) | Significant Unobservable Inputs (Level 3) | ||||||||||||
| Assets: | |||||||||||||||
| Money market funds | $ | 41,818 | $ | 41,818 | $ | — | $ | — | |||||||
| Marketable securities: | |||||||||||||||
| Corporate debt securities | 40,349 | — | 40,349 | — | |||||||||||
| Tax-exempt municipal securities | 14,038 | — | 14,038 | — | |||||||||||
| Variable rate demand notes | 5,600 | — | 5,600 | — | |||||||||||
| Total assets at fair value on a recurring basis | $ | 101,805 | $ | 41,818 | $ | 59,987 | $ | — | |||||||
| Liabilities: | |||||||||||||||
| Deferred payments | $ | 3,558 | $ | — | $ | — | $ | 3,558 | |||||||
|
|
|
|
|
|
|
|
|
|
|
|
|
| |||||||||||||||
|
|
|
|
| Fair Value Measurements at Reporting Date Using |
| ||||||||||||||||||||||
|
|
|
|
| Quoted Prices in |
| Significant |
|
|
|
| |||||||||||||||||
|
|
|
|
| Active Markets |
| Other |
| Significant |
| ||||||||||||||||||
|
|
|
|
| for Identical |
| Observable |
| Unobservable |
| ||||||||||||||||||
|
| December 31, |
| Assets/Liabilities |
| Inputs |
| Inputs |
| Fair Value Measurements at Reporting Date Using | ||||||||||||||||||
|
| 2016 |
| (Level 1) |
| (Level 2) |
| (Level 3) |
| December 31, 2018 | Quoted Prices in Active Markets for Identical Assets/Liabilities (Level 1) | Significant Other Observable Inputs (Level 2) | Significant Unobservable Inputs (Level 3) | |||||||||||||||
Assets: |
|
|
|
|
|
|
|
|
|
|
|
|
| |||||||||||||||
Money market funds |
| $ | 5,103 |
| $ | 5,103 |
| $ | — |
| $ | — |
| $ | 1,791 | $ | 1,791 | $ | — | $ | — | |||||||
| Marketable securities: | ||||||||||||||||||||||||||||
| Corporate debt securities | 48,430 | — | 48,430 | — | ||||||||||||||||||||||||
| Tax-exempt municipal securities | 22,869 | — | 22,869 | — | ||||||||||||||||||||||||
| Variable rate demand notes | 4,000 | — | 4,000 | — | ||||||||||||||||||||||||
| Total assets at fair value on a recurring basis | $ | 77,090 | $ | 1,791 | $ | 75,299 | $ | — | ||||||||||||||||||||
|
|
|
|
|
|
|
|
|
|
|
|
|
| |||||||||||||||
Liabilities: |
|
|
|
|
|
|
|
|
|
|
|
|
| |||||||||||||||
Deferred payments |
| $ | 11,741 |
| $ | — |
| $ | — |
| $ | 11,741 |
| $ | 4,120 | $ | — | $ | — | $ | 4,120 | |||||||
|
|
|
|
14
Marketable securities – Classified in Level 2 and valued using readily available pricing sources for comparable instruments utilizing observable inputs from active markets. The Company does not hold securities in inactive markets.
|
The Company did not change its valuation techniques associated with recurring fair value measurements from prior periods and nodid not transfer assets or liabilities were transferred between levels of the fair value hierarchy during the nine months ended September 30, 20162018 or 2017.
2019.
|
|
|
|
|
|
|
| |||||||
|
|
|
|
|
| |||||||||
|
| September 30, 2016 |
| September 30, 2017 |
| As of September 30, | ||||||||
Balance at beginning of period |
| $ | 3,278 |
| $ | 11,741 |
| |||||||
| 2018 | 2019 | |||||||||||||
| Balance as of the beginning of period | $ | 4,514 | $ | 4,120 | ||||||||||
Amounts paid |
|
| (7,358) |
|
| (1,133) |
| (1,412 | ) | (1,579 | ) | |||
Contingent consideration in connection with NYCDA acquisition |
|
| 14,500 |
|
| — |
| |||||||
Other adjustments to fair value |
|
| 1,920 |
|
| (6,184) |
| 1,264 | 1,017 | |||||
Balance at end of period |
| $ | 12,340 |
| $ | 4,424 |
| $ | 4,366 | $ | 3,558 | |||
6. Stock Options, Restricted Stock and Restricted Stock Units
On May 5, 2015,
| 9. | Goodwill and Intangible Assets |
In February 2017, the Company’s Boardgoodwill by segment as of Directors approved grants of 67,599 shares of restricted stock to certain employees. These shares, which vest over a four-year period, were granted pursuant to the 2015 Plan. The Company’s stock price closed at $81.66 on the date of these grants.
In May 2017, the Company’s Board of Directors approved grants of 7,541 shares of restricted stock. These shares, which vest annually over a three-year period, were awarded to non-employee members of the Company’s Board of Directors, as part of the Company’s annual director compensation program and the 2015 Plan. The Company’s stock price closed at $86.83 on the date of these grants.
Dividends paid on unvested restricted stock are reimbursed to the Company if the recipient forfeits his or her shares as a result of termination of employment prior to vesting in the award, unless waived by the Board of Directors.
Restricted Stock and Restricted Stock Units
The table below sets forth the restricted stock and restricted stock units activity forSeptember 30, 2019 (in thousands):
| Strayer University | Capella University | Non-Degree Programs | Total | ||||||||||||
| Balance as of December 31, 2018 | $ | 337,381 | $ | 395,159 | $ | — | $ | 732,540 | |||||||
| Additions | — | — | — | — | |||||||||||
| Impairments | — | — | — | — | |||||||||||
| Adjustments | — | (465 | ) | — | (465 | ) | |||||||||
| Balance as of September 30, 2019 | $ | 337,381 | $ | 394,694 | $ | — | $ | 732,075 | |||||||
|
|
|
|
|
|
|
|
| Number of shares or units |
| Weighted- average Grant price |
| |
Balance, December 31, 2016 |
| 727,100 |
| $ | 97.53 |
|
Grants |
| 75,140 |
|
| 82.18 |
|
Vested shares |
| (84,718) |
|
| 66.60 |
|
Forfeitures |
| (1,204) |
|
| 62.28 |
|
Balance, September 30, 2017 |
| 716,318 |
| $ | 99.64 |
|
15
Stock Options
The tablethe respective reporting unit below sets forthits carrying amount. No events or circumstances occurred in the stock option activitythree and other stock option information as of and for the nine months ended September 30, 2017:
|
|
|
|
|
|
|
|
|
|
|
|
|
|
|
|
|
| Weighted- |
|
|
| ||
|
|
|
|
|
| average |
|
|
| ||
|
|
|
| Weighted- |
| remaining |
| Aggregate |
| ||
|
| Number of |
| average |
| contractual |
| intrinsic value(1) |
| ||
|
| shares |
| exercise price |
| life (years) |
| (in thousands) |
| ||
Balance, December 31, 2016 |
| 100,000 |
| $ | 51.95 |
| 4.1 |
| $ | 2,868 |
|
Grants |
| — |
|
| — |
|
|
|
|
|
|
Exercises |
| — |
|
| — |
|
|
|
|
|
|
Forfeitures/Expirations |
| — |
|
| — |
|
|
|
|
|
|
Balance, September 30, 2017 |
| 100,000 |
| $ | 51.95 |
| 3.3 |
| $ | 3,532 |
|
Exercisable, September 30, 2017 |
| 100,000 |
| $ | 51.95 |
| 3.3 |
| $ | 3,532 |
|
Intangible Assets
|
The Company’s finite-lived intangible assets are comprised of student relationships, which are being amortized on a straight-line basis over a three-year useful life. Straight-line amortization expense for finite-lived intangible assets reflects the pattern in which the assets' economic benefits are consumed over their estimated useful lives. Amortization expense related to finite-lived intangible assets was $13.8 million and $41.5 million for the three and nine months ended September 30, 2019, respectively. Indefinite-lived intangible assets not subject to amortization consist of trade names. The Company assigned an indefinite useful life to its trade name intangible assets, as it is believed these assets have the ability to generate cash flows indefinitely. In addition, there are no legal, regulatory, contractual, economic or other factors to limit the useful life of the trade name intangibles. The Company assesses indefinite-lived intangible assets at least annually for impairment during the fourth quarter, or more frequently if events occur or circumstances change between annual tests that would | |||||||||||||||||||||||||||||||||||||||||||||||||||||||||||||||||||||||||||||||||||||||||||||||||||||||||||||||||||||||||||||||||||||||||||||||||||||||||||||||||||||||||||||||||||||||||||||||||||||||||||||||||||||||||||||||||||
Valuation and Expense Information under Stock Compensation Topic ASC 718
At September 30, 2017, total stock-based compensation cost which has not yet been recognized was $17.8 million for unvested restricted stock, restricted stock units, and stock option awards. This cost is expected to be recognized over the next 24 months on a weighted-average basis. Awards of approximately 561,000 shares of restricted stock and restricted stock units are subject to performance conditions. The accrual for stock-based compensation for performance awards is based on the Company’s estimates that such performance criteria are probable of being achieved over the respective vesting periods. Such a determination involves judgment surrounding the Company’s ability to maintain regulatory compliance. If the performance targets are not reached during the respective vesting period, or it is determined it is more likely than not reduce the fair value of the respective asset below its carrying amount. No events or circumstances occurred in the three and nine months ended September 30, 2019 to indicate an impairment to indefinite-lived intangible assets. Accordingly, there were 0 impairment charges related to indefinite-lived intangible assets recorded during the three and nine months ended September 30, 2019. During the three and nine months ended September 30, 2018, the Company recorded impairment charges of $2.0 million and $5.4 million, respectively, related to the NYCDA trade name based on a quantitative impairment analysis performed. The indefinite-lived intangible asset impairment charge represented the excess of the carrying value of the NYCDA trade name over its estimated fair value and is reflected within the Impairment of intangible assets line in the unaudited condensed consolidated statements of income.
| 10. | Long-Term Debt |
| 11. | Other Long-Term Liabilities |
| December 31, 2018 | September 30, 2019 | ||||||
| Contract liabilities, net of current portion | $ | 23,880 | $ | 27,233 | |||
| Deferred payments related to acquisitions | 5,904 | 4,837 | |||||
| Employee separation costs | 6,800 | 2,681 | |||||
| Deferred rent and other facility costs | 6,837 | 1,880 | |||||
| Loss on facilities not in use | 4,332 | — | |||||
| Lease incentives | 2,300 | — | |||||
| Other | 1,263 | 1,993 | |||||
| Other long-term liabilities | $ | 51,316 | $ | 38,624 | |||
0 lease incentive long-term liability balance as of September 30, 2019.
| 12. | Equity Awards |
|
|
|
|
|
|
|
|
|
|
|
|
|
| |||||||||||||||
|
| For the three months ended |
| For the nine months ended |
| |||||||||||||||||||||||
|
| September 30, |
| September 30, |
| For the three months ended September 30, | For the nine months ended September 30, | |||||||||||||||||||||
|
| 2016 |
| 2017 |
| 2016 |
| 2017 |
| 2018 | 2019 | 2018 | 2019 | |||||||||||||||
Instruction and educational support |
| $ | 522 |
| $ | 548 |
| $ | 678 |
| $ | 1,363 |
| |||||||||||||||
Marketing |
|
| — |
|
| — |
|
| — |
|
| — |
| |||||||||||||||
Admissions advisory |
|
| — |
|
| — |
|
| — |
|
| — |
| |||||||||||||||
| Instructional and support costs | $ | 703 | $ | 945 | $ | 1,821 | $ | 2,820 | ||||||||||||||||||||
General and administration |
|
| 1,882 |
|
| 2,366 |
|
| 6,652 |
|
| 7,206 |
| 2,869 | 2,077 | 7,688 | 5,888 | |||||||||||
| Merger and integration costs | 2,272 | (523 | ) | 2,272 | 367 | |||||||||||||||||||||||
Stock-based compensation expense included in operating expense |
|
| 2,404 |
|
| 2,914 |
|
| 7,330 |
|
| 8,569 |
| 5,844 | 2,499 | 11,781 | 9,075 | |||||||||||
Tax benefit |
|
| 957 |
|
| 1,151 |
|
| 2,857 |
|
| 3,384 |
| 1,607 | 651 | 3,253 | 2,333 | |||||||||||
Stock-based compensation expense, net of tax |
| $ | 1,447 |
| $ | 1,763 |
| $ | 4,473 |
| $ | 5,185 |
| $ | 4,237 | $ | 1,848 | $ | 8,528 | $ | 6,742 | |||||||
| 13. | Income Taxes |
16
7. Other Long-Term Liabilities
Other long-term liabilities consist of the following (in thousands):
|
|
|
|
|
|
|
|
|
| December 31, 2016 |
| September 30, 2017 |
| ||
Deferred revenue, net of current portion |
| $ | 17,981 |
| $ | 18,274 |
|
Deferred rent and other facility costs |
|
| 8,251 |
|
| 7,406 |
|
Loss on facilities not in use |
|
| 7,813 |
|
| 6,227 |
|
Deferred payments related to acquisitions |
|
| 13,754 |
|
| 5,979 |
|
Lease incentives |
|
| 2,684 |
|
| 2,902 |
|
Other long-term liabilities |
| $ | 50,483 |
| $ | 40,788 |
|
Deferred Revenue
The Company provides for certain scholarship2018 and awards programs, such as the Graduation Fund (see Note 2 for additional information), that can be redeemed in the future by students after meeting certain eligibility requirements. The Company also has licensed certain of its non-credit bearing course content to a third party. Long-term deferred revenue represents the amount of revenue under these arrangements that the Company expects will be realized after one year.
Deferred Rent and Other Facility Costs and Loss on Facilities Not in Use
The Company records a liability for lease costs of campuses and non-campus facilities that are not currently in use (see Note 4). For facilities still in use, the Company records rent expense on a straight-line basis over the initial term of a lease. The difference between the rent payment and the straight-line rent expense is recorded as a liability.
Deferred Payments Related to Acquisitions
In the first quarter of 2016, the Company acquired NYCDA and entered into deferred payment arrangements with the sellers in connection with this transaction. In April and August 2016, NYCDA received state regulatory permits and the Company subsequently paid $6.0$0.2 million and $0.5 million of deferred payments to the sellers, respectively. The fair value of the deferred payment arrangements at September 30, 2017 is zero, and the maximum possible amount that could be paid is $11.5 million. See Note 3 for further information on the NYCDA deferred payments.
In 2011, the Company acquired certain assets and entered into deferred payment arrangements with the sellers. The deferred payment arrangements are valued at approximately $3.4 million and $3.2 million as of December 31, 2016 and September 30, 2017, respectively. In addition, one of the sellers contributed $2.8 million to the Company representing the seller’s continuing interest in the assets acquired.
Lease Incentives
In conjunction with the opening of new campuses or renovating existing ones, the Company, in some instances, was reimbursed by the lessors for improvements made to the leased properties. In accordance with ASC 840-20, the underlying assets were capitalized as leasehold improvements and a liability was established for the reimbursements. The leasehold improvements and the liability are amortized on a straight-line basis over the corresponding lease terms, which generally range from five to ten years.
8. Income Taxes
The Company had $0.3 million of unrecognized tax benefits at September 30, 2017, resulting from tax positions taken during the nine months ended September 30, 2017. In addition, the Company recognized approximately $0.3 million of benefits in each of the nine months ended September 30, 2016 and 2017 related to tax positions taken during prior years. The Company did not incur expense for interest and penalties in the nine months ended September 30, 2017, and recorded approximately $0.1 million of expense for interest and penalties in the nine months ended September 30, 2016.
The Company does not expect its unrecognized tax benefits will be realized. If amounts accrued are different than amounts ultimately assessed by taxing authorities, the Company would record an adjustment to income tax expense. The Company does not anticipate significant changes to other unrecognized tax benefits.
17
The Company paid $25.0$10.9 million and $21.8$36.6 million in income taxes during the nine months ended September 30, 20162018 and 2017,2019, respectively.
9.Litigation
From time
| For the three months ended September 30, | For the nine months ended September 30, | ||||||||||||||
| 2018 | 2019 | 2018 | 2019 | ||||||||||||
| Limited partnership investments, beginning of period | $ | — | $ | 14,490 | $ | — | $ | 13,449 | |||||||
| Additions from merger | 14,153 | — | 14,153 | — | |||||||||||
| Capital contributions | 166 | 366 | 166 | 878 | |||||||||||
| Equity in net income of limited partnerships | — | 706 | — | 2,260 | |||||||||||
| Distributions | — | — | — | (1,025 | ) | ||||||||||
| Limited partnership investments, end of period | $ | 14,319 | $ | 15,562 | $ | 14,319 | $ | 15,562 | |||||||
| For the three months ended September 30, | For the nine months ended September 30, | ||||||||||||||
| 2018 | 2019 | 2018 | 2019 | ||||||||||||
| Revenues | |||||||||||||||
| Strayer University | $ | 114,471 | $ | 127,837 | $ | 343,644 | $ | 384,806 | |||||||
| Capella University | 43,792 | 110,549 | 43,792 | 337,418 | |||||||||||
| Non-Degree Programs | 2,682 | 3,361 | 4,646 | 11,141 | |||||||||||
| Consolidated revenues | $ | 160,945 | $ | 241,747 | $ | 392,082 | $ | 733,365 | |||||||
| Income (loss) from operations | |||||||||||||||
| Strayer University | $ | 11,904 | $ | 18,689 | $ | 44,215 | $ | 68,268 | |||||||
| Capella University | (14,326 | ) | 18,643 | (14,326 | ) | 63,918 | |||||||||
| Non-Degree Programs | (1,688 | ) | (415 | ) | (4,131 | ) | (918 | ) | |||||||
| Amortization of intangible assets | (10,278 | ) | (15,417 | ) | (10,278 | ) | (46,251 | ) | |||||||
| Merger and integration costs | (29,620 | ) | (1,500 | ) | (37,791 | ) | (11,698 | ) | |||||||
| Impairment of intangible assets | (13,119 | ) | — | (19,304 | ) | — | |||||||||
| Consolidated income (loss) from operations | $ | (57,127 | ) | $ | 20,000 | $ | (41,615 | ) | $ | 73,319 | |||||
| 16. | Litigation |
10. Regulation
ultimate outcome of such matters will not, individually or in the aggregate, have a material adverse effect on its consolidated financial position, results of operations or cash flows. However, depending on the amount and timing, an unfavorable resolution of some or all of these matters could materially affect future results of operations in a particular period.
| 17. | Regulation |
Gainful Employment
UnderUniversities. While the Department of Education has recently issued revisions to its regulations, Congress is also considering reauthorization of the Higher Education Act of 1965, as amended (“HEA”). If Congress enacts amendments to the HEA, they may supersede the Department’s regulations in various respects and require further changes to those regulations.
2019.
| ||
| • |
|
|
|
In addition, a program that doesdid not pass either of the debt-to-earnings metrics and that hashad an annual income rate between 8% and 12%, or a discretionary income rate between 20% and 30%, iswas considered to be in a warning zone. A program failsfailed if the program’s graduates havehad an annual income rate of 12% or greater and a discretionary income rate of 30% or greater. A program would becomebecame Title IV-ineligible for three years if it failsfailed both metrics for two out of three consecutive years, or failsfailed to pass at least one1 metric for four consecutive award years. The regulations provide a means by which an institution may challenge the Department’s calculation of any of the debt metrics prior to loss of Title IV eligibility. On January 8, 2017, Strayer University and Capella University received its final 2015 debt-to-earnings measures. None of Strayer’sStrayer University or Capella University programs failed the debt-to-earnings metrics. TwoNaN active Strayer University programs, the Associate in Arts in Accounting and Associate in Arts in Business Administration, areand 1 active Capella University program, the Master of Science in Marriage and Family Counseling/Therapy, were “in the zone,” which means each program remainsof those 3 programs remained fully eligible unless (1) either programeligible. The Department has announced that because it no longer has a combination of zone and failing designations for four consecutive years, in which casedata-sharing agreement with the U.S. Social Security Administration to receive earnings data, it would become Title IV-ineligible in the fifth year; or (2) either program fails the metrics for two out of three consecutive years, in which case the program could become ineligible for the following award year.
If an institution is notified by the Secretary of Education that a program could become ineligible, based on its final rates, for the next award year:
|
|
|
|
The new regulations also require institutions annuallyunable to report student- and program-level data to the Department, and comply with additional disclosure requirements. Final regulations adopted by the Department, which generally became effective on July 1, 2011, require an institution to use a template designed by the Department to disclose to prospective students, with respect to
18
each gainful employment program, occupations that the program prepares students to enter, total cost of the program, on-time graduation rate, job placement rate, if applicable, and the median loan debt of program completers for the most recently completed award year. The regulations that became effective July 1, 2015 expanded upon those existing disclosure requirements, and institutions were expected to update their disclosure templates to comply by January 1, 2017. However, the Department delayed the requirements until April 3, 2017 and then until July 1, 2017. On June 30, 2017, the Department further delayed, until July 1, 2018, the requirements that an institution include the disclosure template, or a link thereto, in its gainful employment program promotional materials and directly distribute the disclosure templates to prospective students. The Department did not change the July 1, 2017 effective date for the requirement to provide an updated disclosure template, or a link thereto, on gainful employment program web pages. The University is in compliance with that requirement.
In addition,calculate any subsequent debt-to-earnings measures under the gainful employment regulations requirein 2019.
Under the gainful employment regulations, an institution may establish a new program’s Title IV eligibility by updating the list of the institution’s programs maintained by the Department. However, an institution may not update its listDepartment of eligible programs to include a failing or zone program that the institution voluntarily discontinued or that became ineligible, or a gainful employment program that is substantially similar to such a program, until three years after the loss of eligibility or discontinuance.
The requirements associated with the gainful employment regulations may substantially increase the Company’s administrative burdens and could affect the University’s program offerings, student enrollment, persistence, and retention. Further, although the regulations provide opportunities for an institution to correct any potential deficiencies in a program prior to the loss of Title IV eligibility, the continuing eligibility of the University’s academic programs will be affected by factors beyond management’s control such as changes in the University’s graduates’ income levels, changes in student borrowing levels, increases in interest rates, changes in the percentage of former students who are current in the repayment of their student loans, and various other factors. Even if the University were able to correct any deficiency in the gainful employment metrics in a timely manner, the disclosure requirements associated with a program’s failure to meet at least one metric may adversely affect student enrollments in that program and may adversely affect the reputation of the University.
Education.
Certain other portions of the 2016 final regulations, which relate to authorization of foreign locations, went into effect on July 1, 2018. On April 26, 2019, in litigation brought to challenge the Department’s delayed implementation of the 2016 final regulations, a judge found that the delay was improper and ordered that the rules regarding state authorization of programs offered through distance education take effect on May 26, 2019. The 2016 final regulations remain in effect until the new final rules, described below, take effect.
The
19
suspending its participation in Title IV programs, could lead to litigation, and could harm theStrayer University or Capella University’s reputation. The Company believes that theStrayer University isand Capella University are in compliance with these requirements.
Hackbright Academy and DevMountain
11. Subsequent Event
On October 29, 2017, the Company, Sarg Sub Inc., a Minnesota corporation and a direct, wholly owned subsidiary of the Company (“Merger Sub”), and Capella Education Company, a Minnesota corporation (“Capella”), entered into an Agreement and Plan of Merger (the “Merger Agreement”). Pursuant to the Merger Agreement, and subject to the satisfaction or waiver of the conditions specified therein, Merger Sub will be merged with and into Capella (the “Merger”), with Capella surviving as a direct, wholly owned subsidiary of the Company.
At the effective time of the Merger (the “Effective Time”), each share of common stock of Capella (“Capella Common Stock”) issued and outstanding immediately prior to the Effective Time (other than the shares that are owned by Capella, the Company, Merger Sub or any wholly owned subsidiary of Capella, the Company or Merger Sub) will be converted into the right to receive 0.875 of a newly issued share of common stock of the Company (the “Company Common Stock”) (“Merger Consideration”). No fractional shares of Company Common Stock will be issued in the Merger, and Capella shareholders will receive cash in lieu of fractional shares as part of the Merger Consideration, as specified in the Merger Agreement.
The respective boards of directors of the Company and Capella have unanimously approved the Merger Agreement, and the board of directors of Capella has agreed to recommend that Capella’s shareholders adopt the Merger Agreement. In addition, the board of directors of the Company has agreed to recommend that the Company’s stockholders approve the issuance of shares of Company Common Stock in the Merger and the amendment to the Company certificate of incorporation to, among other things (i) change the Company’s name to “Strategic Education, Inc.” and (ii) increase the number of shares of Company Common Stock that the Company is authorized to issue to 32,000,000 shares to, among other things, allow for the payment of the Merger Consideration.
The consummation of the Merger is subject to customary closing conditions, including, but not limited to, (i) the approval of Company stockholders and Capella stockholders, (ii) the expiration or termination of the waiting period under the Hart-Scott-Rodino Antitrust Improvements Act of 1976, and (iii) the receipt of certain regulatory approvals from educational agencies
20
(including the Department of Education and Capella University’s accreditor). The parties expect the Merger will be completed in the third quarter of 2018.
The Merger Agreement provides for certain termination rights for both Capella and the Company. Upon termination of the Merger Agreement under certain specified circumstances (including to accept a superior proposal), the Company may be required to pay Capella a termination fee of $25,000,000, and upon termination of the Merger Agreement under certain specified circumstances (including to accept a superior proposal), Capella may be required to pay the Company a termination fee of $25,000,000. In addition, if the Merger Agreement is terminated by either party as a result of Capella’s failure to obtain stockholder approval, or is terminated by the Company due to Capella’s breach of its representations and covenants and such breach would result in the closing conditions not being satisfied, then Capella may be required to reimburse transaction expenses up to $8,000,000. The Company may be required to reimburse transaction expenses up to $8,000,000 in reciprocal circumstances.
21
statements, except as required by law. Critical Accounting Policies and Estimates the portion of the tuition not paid in advance. Any cash received prior to the start of an academic term or program is recorded as a contract liability. cash and the term is complete. term until cash is received and the term is complete. methodologies for estimating bad debts in consideration of actual experience. If the financial condition of our students were to deteriorate, resulting in evidence of impairment of their ability to make required payments for tuition payable to us, additional allowances or write-offs may be required. For the third quarter of nine month periods ended September 30, 2019. 2019. Net income (loss). Net income 2019. Net income (loss). Net income increased greater than 1.75:1.00. Borrowings under 2019. We had no borrowings outstanding during each of the nine months ended September 30, 2019 and September 30, 2018. amortization expense. 2018. 2019. 2018. Payments Due By Period Less than 1 1-3 3-5 More than Total Year Years Years 5 Years Operating leases $ 119,061 $ 31,782 $ 49,750 $ 26,384 $ 11,145 3.1 31.1 31.2 32.1 32.2 101. INS XBRL Instance Document 101. SCH XBRL Schema Document 101. CAL XBRL Calculation Linkbase Document 101. DEF XBRL Definition Linkbase Document 101. LAB XBRL Label Linkbase Document 101. PRE XBRL Presentation Linkbase Document Pursuant to the requirements of the Securities Exchange Act of 1934, the registrant has duly caused this report to be signed on its behalf by the undersigned thereunto duly authorized. By: /s/ Daniel W. Jackson Daniel W. Jackson Executive Vice President and Chief Financial Officer Date: the pace of growth of student enrollment, our continued compliance with Title IV of the Higher Education Act, and the regulations thereunder, as well as regional accreditation standards and state regulatory requirements, rulemaking by the Department of Education and increased focus by the U. S.U.S. Congress on for-profit education institutions, the pace of growth of student enrollment, competitive factors, risks associated with the opening of new campuses, risks associated with the offering of new educational programs and adapting to other changes, risks associated with the acquisition of existing educational institutions, risks relating to the timing of regulatory approvals, our ability to implement our growth strategy, the risk that the benefits of the merger with Capella Education Company, including expected synergies, may not be fully realized or may take longer to realize than expected, the risk that the combined company may experience difficulty integrating employees or operations, risks associated with the ability of our students to finance their education in a timely manner, and general economic and market conditions. Further information about these and other relevant risks and uncertainties may be found in Part I, “Item 1A. Risk Factors” of the Company’s Annual Report on Form 10-K and itsin the Company’s other filings with the Securities and Exchange Commission, including in Part II, “Item 1A. Risk Factors” in the Company’s Quarterly Reports on Form 10-Q for the quarters ended March 31, 2017 and June 30, 2017, and in this Quarterly Report on Form 10-Q.Commission. The Company undertakes no obligation to update or revise forward-looking statements.www.strayereducation.com.www.strategiceducation.com. The information on our website is not incorporated by reference in this Quarterly Report on Form 10-Q, and our web address is included as an inactive textual reference only. We make available, free of charge through our website, our Annual Report on Form 10-K, Quarterly Reports on Form 10-Q, Current Reports on Form 8-K and amendments to those reports filed or furnished pursuant to Section 13(a) or 15(d) of the Securities Exchange Act of 1934 as soon as reasonably practicable after we electronically file such material with, or furnish it to, the Securities and Exchange Commission.We areholding company that ownsseeks to provide the most direct path between learning and employment through campus-based and online post-secondary education offerings and through programs to develop job-ready skills for high-demand markets. We operate primarily through our wholly-owned subsidiaries Strayer University (the “University”and Capella University, both accredited post-secondary institutions of higher education. Our operations also include certain non-degree programs, mainly focused on software and application development.January 13, 2016,SEI after completion of the New York Codemerger, and Design Academy (“NYCDA”). Theawards held by former employees of CEC who left before completion of the merger were settled upon completion of the merger as specified in the merger agreement.education whichlearning that offers undergraduate and graduate degree programs in business administration, accounting, information technology, education, health services administration, public administration, and criminal justice at 76 physical campuses, predominantly located in the eastern United States, and online. NYCDAStrayer University is accredited by the Middle States Commission on Higher Education (“Middle States” or “Middle States Commission”), one of the seven regional collegiate accrediting agencies recognized by the Department. By offering its programs both online and in physical classrooms, Strayer University provides non-degree coursesits working adult students flexibility and convenience.primarilycourses.campusesover 2,000 colleges and universities.New York Cityplace to provide the most direct path between learning and Philadelphia, PA. NYCDA’s results of operations are includedemployment for our students. We focus on innovation continually to differentiate ourselves in our results from the acquisition date.Mostmarkets and drive growth by supporting student success, producing affordable degrees, optimizing our comprehensive marketing strategy, serving a broader set of our revenue comes fromstudents’ professional needs, and establishing new growth platforms. Technology and the University, which derives approximately 96%talent of its revenue from tuition for educational programs, whether deliveredour faculty and employees enable these strategies. We believe these strategies and enablers will allow us to continue to deliver high quality, affordable education, resulting in person at a physical campus or delivered online. The academic year of the University is divided into four quarters, which approximately coincide with the four quarters of the calendar year. Students at the University and at NYCDA make payment arrangements for the tuition for each course at the time of enrollment. Tuition revenue is recognized ratablycontinued growth over the courselong-term. We will continue to invest in these enablers to strengthen the foundation and future of instruction. If a student withdraws from a course priorour business. We also believe our enhanced scale and capabilities allow us to completion,continue to focus on innovative cost and revenue synergies, while improving the University refunds a portion of the tuition depending on when the withdrawal occurs. Tuition revenue is shown net of any refunds, withdrawals, corporate discounts, employee tuition discounts and scholarships. The University also derives revenue from other sources such as textbook-related income, certificate revenue, certain academic fees, licensing revenue, and other income, which are all recognized when earned.Tuition receivable and deferred revenue forvalue provided to our students are recorded upon the start of the course, which for the University is the start of the academic term. Because the University’s academic quarters coincide with the calendar quarters, at the end of the fiscal quarter (and academic term), tuition receivable generally represents amounts due from students for educational services already provided and deferred revenue generally represents advance payments for academic services to be provided in the future. Based upon past experience and judgment, the University establishes an allowance for doubtful accounts with respect to accounts22receivable. Any uncollected account more than one year past due is charged against the allowance. Accounts less than one year past due are reserved according to the length of time the balance has been outstanding. In establishing reserve amounts, we also consider the status of students as to whether or not they are currently enrolled for the next term, as well as the likelihood of recovering balances that have previously been written off, based on historical experience. Bad debt expense as a percentage of revenues for the third quarter of 2016 and 2017 was 3.8% and 4.9%, respectively.Below is a description of the nature of the consolidated costs included in our operating expense categories:·Instruction and educational support expenses generally contain items of expense directly attributable to educational activities. This expense category includes salaries and benefits of faculty and academic administrators, as well as administrative personnel who support faculty and students. Instruction and educational support expenses also include costs of educational supplies and facilities, including rent for campus facilities, certain costs of establishing and maintaining computer laboratories and all other physical plant and occupancy costs, with the exception of costs attributable to the corporate offices. Bad debt expense incurred on delinquent student account balances is also included in instruction and educational support expenses.·Marketing expenses include the costs of advertising and production of marketing materials and related personnel costs.·Admissions advisory expenses include salaries, benefits and related costs of personnel engaged in admissions.·General and administration expenses include salaries and benefits of management and employees engaged in accounting, human resources, legal, regulatory compliance, and other corporate functions, along with the occupancy and other related costs attributable to such functions.Investment income consists primarily of earnings and realized gains or losses on investments and interest expense consists of interest incurred on our outstanding borrowings, unused revolving credit facility fees, and amortization of deferred financing costs.equipment;equipment and intangible assets; redemption rates for scholarship programs;programs and valuation of contract liabilities; fair value of future contractual operating lease obligations for facilities that have been closed; incremental borrowing rates; valuation of deferred tax assets, goodwill, and intangible assets; forfeiture rates and achievability of performance targets for stock-based compensation plans; and accrued expenses. Management bases its estimates and judgments on historical experience and various other factors and assumptions that are believed to be reasonable under the circumstances, the results of which form the basis for making judgments regarding the carrying values of assets and liabilities that are not readily apparent from other sources. Management regularly reviews its estimates and judgments for reasonableness and may modify them in the future. Actual results may differ from these estimates under different assumptions or conditions.theStrayer University offers itsand Capella University offer educational programs primarily on a quarter system having four academic terms, which generally coincide with our quarterly financial reporting periods. NYCDA’s revenues are recognized as services are provided, generally ratably over the length of a course. Approximately 96% of the University’sour revenues during the nine months ended September 30, 20172019 consisted of tuition revenue. Capella University offers monthly start options for new students, who then transition to a quarterly schedule. Capella University also offers its FlexPath program, which allows students to determine their 12-week billing session schedule after they complete their first course. Tuition revenue for all students is recognized ratably over the course of instruction as the University providesUniversities and the schools offering non-degree programs provide academic services, in a given term, whether delivered in person at a physical campus or online. Tuition revenue is shown net of any refunds, withdrawals, corporate discounts, scholarships, and employee tuition discounts. The UniversityUniversities also derivesderive revenue from other sources such as textbook-related income, certificate revenue, certain academic fees, licensing revenue, and other income, which are all recognized when earned. In accordance with ASC 606, materials provided to students in connection with their enrollment in a course are recognized as revenue when control of those materials transfers to the student. At the start of each academic term or program, a contract liability (deferred revenue) is recorded for academic services to be provided, and a tuition receivable is recorded for23deferred revenue.UniversityUniversities finance their education in a variety of ways, and historically about three quarters of our students have participated in one or more financial aid programs provided through Title IV of the Higher Education Act. In addition, many of our working adult students finance their own education or receive full or partial tuition reimbursement from their employers. Those students who are veterans or active duty military personnel have access to various additional government-funded educational benefit programs.ten-weeksix- to twelve-week period, depending on the University and course type, and is followed by an exam. Students who withdraw from a course may be eligible for a refund of tuition charges based on the timing of the withdrawal. We use the student’s last date of attendance for this purpose. Student attendance is based on physical presence in class for on-ground classes. For online classes, attendance consists of logging into one’s course shell and performing an academically-related activity (e.g., engaging in a discussion post or taking a quiz). otherwise been recognized for that student. Since the University’sUniversities’ academic terms coincide with our financial reporting periods for most programs, nearly all refunds are processed and recorded in the same quarter as the corresponding revenue. For certain programs where courses may overlap a quarter-end date, the Company estimates a refund rate and does not recognize the related revenue until the uncertainty related to the refund is resolved. The amountportion of tuition revenue refundable to students may vary based on the student’s state of residence. undergraduate students who withdraw from all their courses during the quarter of instruction, we reassess collectibility of tuition and fees for revenue recognition purposes. In addition, we cease revenue recognition when a student fully withdraws from all of his or her courses in the academic term. Tuition charges billed in accordance with our billing schedule may be greater than the pro rata revenue amount, but the additional amounts are not recognized as revenue unless they are collected in cash.of Education and then may seek payment from the withdrawn student of prorated tuition or other amounts charged to him or her. Loss of financial aid eligibility during an academic term is rare and would normally coincide with the student’s withdrawal from the institution. As discussed above, we cease revenue recognition upon a student’s withdrawal from all of his or her classes in an academic term.completed. Revenue and the value of the benefit earned by students participatingcompleted in prior years. The performance obligation associated with free courses that may be redeemed in the Graduation Fundfuture is recognizedvalued based on a systematic and rational allocation of the cost of honoring the benefit earned to each of the underlying revenue transactions that result in progress by the student toward earning the benefit. The estimated value of awards under the Graduation Fund that will be recognized in the future is based on historical experience of students’ persistence in completing their course of study and earning a degree.degree and the tuition rate in effect at the time it was associated with the transaction. Estimated redemption rates of eligible students vary based on their term of enrollment. As of September 30, 2017,2019, we had deferred $34.4$46.7 million for estimated redemptions earned under the Graduation Fund, as compared to $29.5$43.3 million at December 31, 2016.2018. Each quarter, we assess our methodologies and assumptions underlying our estimates for persistence and estimated redemptions based on actual experience. To date, any adjustments to our estimates have not been material. However, if actual persistence or redemption rates change, adjustments to the reserve may be necessary and could be material.242017,2019, our bad debt expense was 4.9%5.0% of revenue, compared to 3.8%6.1% for the same period in 2016.2018. A change in our allowance for doubtful accounts of 1% of gross tuition receivable as of September 30, 20172019 would have changed our income from operations by approximately $0.4$0.8 million.Accrued leaserelated costsintangible assets — We estimate potential sublease incomeGoodwill represents the excess of the purchase price of an acquired business over the amount assigned to the assets acquired and vacancy periodsliabilities assumed. Indefinite-lived intangible assets, which include trade names, are recorded at fair market value on their acquisition date. Goodwill and indefinite-lived intangible assets are assessed at least annually for space that is notimpairment. Through our acquisition of CEC in use, adjusting our estimates whenthe third quarter of 2018, we had significant additions to goodwill and tradename intangible assets. The acquired goodwill was allocated to the Strayer University and Capella University reporting units. No events or circumstances change. If our estimates change or if we enter into subleases at rates that are substantially different than our current estimates, we will adjust our liability for leaseoccurred in the three and related costs. During the nine months ended September 30, 20172019 to indicate an impairment to goodwill or indefinite-lived intangible assets. Accordingly, no impairment charges related to goodwill or indefinite-lived intangible assets were recorded during the three and 2016, we reducednine month periods ended September 30, 2019.liabilityfinite-lived intangible assets for leases by approximately $0.3 millionimpairment whenever events or changes in circumstances indicate that the carrying amount of an asset may not be recoverable. If such assets are not recoverable, a potential impairment loss is recognized to the extent the carrying amount of the assets exceeds the fair value of the assets. No impairment charges related to finite-lived intangible assets were recorded during the three and $2.0 million, respectively. contingent consideration, certain of our accrued expenses, and income tax liabilities. We estimate the useful lives of our property and equipment assess goodwill and intangible assets for impairment, and periodically review our assumed forfeiture rates and ability to achieve performance targets for stock-based awards and adjust them as necessary. Should actual results differ from our estimates, revisions to our contingent consideration, accrued expenses, carrying amount of goodwill and intangible assets, stock-based compensation expense, and income tax liabilities may be required.2017,2019, we generated $108.5$241.7 million in revenue a 6% increase compared to 2016, principally due to a 7% increase$160.9 million in total enrollment and partially offset by a 1% decline in revenue per student. Income2018. Our income from operations was $8.2$20.0 million for the third quarter of 2017. During2019 compared to a loss from operations of $57.1 million in 2018 due primarily to the thirdinclusion of a full quarter of 2017, we recorded approximately $2.1 millionCEC's results in net benefitsour consolidated results of operations as well as higher revenues due to enrollment growth and lower merger related to a reduction in the value of contingent consideration payable under the NYCDA acquisition, partially offset by nonrecurring personnel costs associated with a one-time staff reduction program. Income from operations for the third quarter of 2016 was $4.8 million, which includes a $0.2 million noncash benefit to reduce our liability for leases on facilities no longer in use.and impairment charges. Net income in the third quarter of 20172019 was $6.2$16.7 million including approximately $2.4 compared to net loss of $52.8 million for the same period in 2018. Diluted earnings per share was $0.75 compared to diluted loss per share of $2.97 for the same period in 2018. For the nine months ended September 30, 2019, we generated $733.4 million in after-tax benefits from the nonrecurring adjustments described above,revenue, compared to $2.9$392.1 million for the same period in 2016, which reflected approximately $0.12018. Our income from operations was $73.3 million in after-tax benefits fromfor the nonrecurring adjustments described above. Diluted earnings per share was $0.56nine months ended September 30, 2019 compared to $0.27a loss from operations of $41.6 million for the same period in 2016. Diluted2018. Net income was $52.6 million for the nine months ended September 30, 2019 compared to net loss of $38.1 million for the same period in 2018, and diluted earnings per share was $2.38 in the nine months ended September 30, 2019 compared to diluted loss per share of $2.90 for the third quartersame period in 2018.2017financial information for 2019 and 2016 was $0.342018, we use certain financial measures including Adjusted Income from Operations, Adjusted Net Income, and $0.25Adjusted Diluted Earnings per share, respectively, afterShare that are not required by or prepared in accordance with accounting principles generally accepted in the nonrecurring adjustments Key enrollment trendsUnited States of America (“GAAP”). These measures, which are considered “non-GAAP financial measures” under SEC rules, are defined by quarterus to exclude the following:the University were as follows:Enrollment% Change vs Prior Year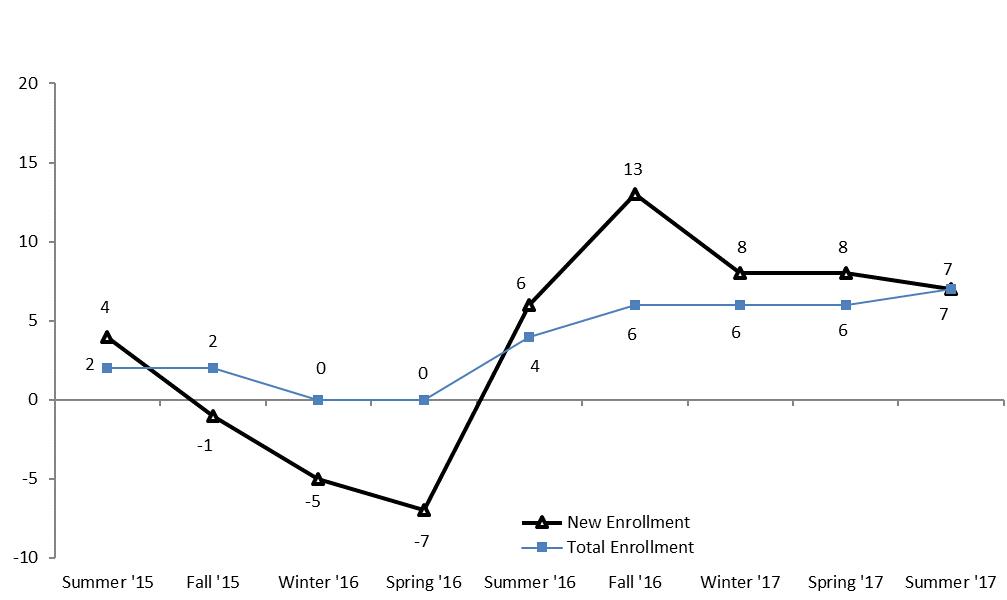
25Since 2013, we have introduced a number of initiatives in responseintangible assets related to the variability inCompany's acquisition of the New York Code and Design Academy,enrollment. Recognizing that affordability iscore operations, andimportant factor in a prospective student’s decision to seek a college degree, we reducedadditional understanding of our business and operating results, including underlying trends associated with the University undergraduate tuition for new students by 20% beginning in our 2014 winter academic term. We also introduced the Graduation Fund in mid-2013, whereby qualifying students can receive one free course for every three courses successfully completed. The free coursesCompany’s ongoing operations.redeemablenot defined in the student’s final academic year. In 2015, we launched Strayer@Work, which workssame manner by all companies and may not be comparable with Fortune 1000 companiesother similarly titled measures of other companies. Non-GAAP financial measures may be considered in addition to, structure customized education and training programsbut not as a substitute for their employees, often with significant discountsor superior to, our published tuition rates. In January 2016, we acquired NYCDA, which charges variable tuition by program based onGAAP results. A reconciliation of these measures to the number of hours of instruction. These initiatives had a net negative impact on revenue per student, which declined 1% in 2016, andmost directly comparable GAAP measures is expected to decrease slightly in 2017, by approximately 2%.Three Months Ended September 30, 2017 Compared to Three Months Ended September 30, 2016Enrollment. Total enrollments at the University for the summer term 2017 increased to 41,679 students,provided below.38,813 for the summer term 2016. New student enrollments increased by 7%, and continuing student enrollments increased by 8%.Revenues. Revenues increased 6% to $108.5operations was $36.9 million in the third quarter of 2017 from $102.22019 compared to 2016, principally due2019 compared to total$16.9 million in 2018, and adjusted diluted earnings per share was $1.28 in the third quarter of 2019 compared to $0.92 in 2018. Adjusted income from operations was $131.3 million in the nine months ended September 30, 2019 compared to $52.0 million for the same period in 2018. Adjusted net income was $100.3 million in the nine months ended September 30, 2019 compared to $40.7 million for the same period in 2018, and adjusted diluted earnings per share was $4.54 in the nine months ended September 30, 2019 compared to $2.97 for the same period in 2018. Non-GAAP Adjustments Income (loss) from operations $ 20,000 $ — $ 15,417 $ 1,500 $ — $ — $ — $ 36,917 Other income, net 3,243 — — — — (706 ) — 2,537 Income (loss) before income taxes 23,243 — 15,417 1,500 — (706 ) — 39,454 Provision (benefit) for income taxes 6,551 — — — — — 4,496 11,047 Net income (loss) $ 16,692 $ — $ 15,417 $ 1,500 $ — $ (706 ) $ (4,496 ) $ 28,407 Earnings per share: Basic $ 0.77 $ 1.30 Diluted $ 0.75 $ 1.28 Weighted average shares outstanding: Basic 21,806 21,806 Diluted 22,129 22,129 Non-GAAP Adjustments Income (loss) from operations $ (57,127 ) $ 26,214 $ 10,278 $ 29,620 $ 13,119 $ — $ — $ 22,104 Other income, net 1,110 — — — — — — 1,110 Income (loss) before income taxes (56,017 ) 26,214 10,278 29,620 13,119 — — 23,214 Provision (benefit) for income taxes (3,236 ) — — — — — 9,527 6,291 Net income (loss) $ (52,781 ) $ 26,214 $ 10,278 $ 29,620 $ 13,119 $ — $ (9,527 ) $ 16,923 Earnings (loss) per share: Basic $ (2.97 ) $ 0.95 Diluted $ (2.97 ) $ 0.92 Weighted average shares outstanding: Basic 17,799 17,799 Diluted 17,799 18,480 Non-GAAP Adjustments Income (loss) from operations $ 73,319 $ — $ 46,251 $ 11,698 $ — $ — $ — $ 131,268 Other income, net 10,695 — — — — (3,334 ) — 7,361 Income (loss) before income taxes 84,014 — 46,251 11,698 — (3,334 ) — 138,629 Provision (benefit) for income taxes 31,413 — — — — — 6,907 38,320 Net income (loss) $ 52,601 $ — $ 46,251 $ 11,698 $ — $ (3,334 ) $ (6,907 ) $ 100,309 Earnings per share: Basic $ 2.42 $ 4.62 Diluted $ 2.38 $ 4.54 Weighted average shares outstanding: Basic 21,694 21,694 Diluted 22,096 22,096 Non-GAAP Adjustments Income (loss) from operations $ (41,615 ) $ 26,214 $ 10,278 $ 37,791 $ 19,304 $ — $ — $ 51,972 Other income, net 1,846 — — — — — — 1,846 Income (loss) before income taxes (39,769 ) 26,214 10,278 37,791 19,304 — — 53,818 Provision (benefit) for income taxes (1,643 ) — — — — — 14,749 13,106 Net income (loss) $ (38,126 ) $ 26,214 $ 10,278 $ 37,791 $ 19,304 $ — $ (14,749 ) $ 40,712 Earnings (loss) per share: Basic $ (2.90 ) $ 3.10 Diluted $ (2.90 ) $ 2.97 Weighted average shares outstanding: Basic 13,141 13,141 Diluted 13,141 13,724 (1) Reflects a purchase accounting adjustment to record Capella University contract liabilities at fair value as a result of the Company's merger with CEC. (2) Reflects amortization and depreciation expense of intangible assets and software assets acquired through the Company’s merger with CEC. (3) Reflects transaction and integration charges associated with the Company's merger with CEC. (4) Reflects impairment of goodwill and intangible assets related to the Company's acquisition of the New York Code and Design Academy. (5) Reflects income recognized from the Company's investments in partnership interests and other investments. (6) Reflects tax impacts of the adjustments described above and discrete tax adjustments related to stock-based compensation and other adjustments, utilizing an adjusted effective tax rate of 28.0% and 27.6% for the three and nine months ended September 30, 2019 and an adjusted effective tax rate of 27.1% and 24.4% for the three and nine months ended September 30, 2018, respectively. of 7%, partially offsetmay be impacted negatively by a declinerecent change in the tuition benefits policy of one of Strayer University’s largest corporate partners. Capella University segment revenue per studentwas $110.5 million compared to $43.8 million in the prior year, which reflects activity after the completion of 1%. The declinethe CEC merger on August 1, 2018, and includes a $26.2 million purchase accounting reduction related to contract liabilities acquired in revenue per student is largely attributable to a new pricing structure which was implemented for the first quarter of 2014 which reduced tuition for new undergraduate students by approximately 20%, and gave eligible students access to the Graduation Fund. Revenues for undergraduate students increased 11%merger. Non-Degree Programs segment revenues were $3.4 million in the three months ended September 30, 2017, driven by an2019, compared to $2.7 million in the three months ended September 30, 2018. The increase in total undergraduate enrollmentNon-Degree Programs revenues for the three month period was primarily attributable to incremental revenues generated from the operations of 13%, partially offset by a decline in revenue per student of 2%. We expect this decline in revenue per student to continue at the undergraduate level as we enroll more new undergraduate students. For graduate students, revenues decreased 5% in 2017, driven by a decline in total graduate enrollment of 6%.InstructionHackbright, DevMountain, and educational support expenses. Instruction and educational support expenses increased $0.7 million to $57.0 millionSophia Learning, which were acquired in the third quarter of 2017 from $56.3CEC merger.third quarter of 2016,same period in the prior year, principally due to increases in bad debt expensethe inclusion of instructional and nonrecurring personnelsupport costs associated with a one-time staff reduction program, offset by a noncash adjustment to reduce the value of contingent consideration related to our acquisition of NYCDA. InstructionCEC. Consolidated instructional and educational support expensescosts as a percentage of revenues decreased to 52.5%54.8% in the third quarter of 20172019 from 55.1%64.0% in the third quarter of 2016.Marketing2018.MarketingConsolidated general and administration expenses increased $1.4 million, or 6%, to $26.8$72.3 million in the third quarter of 2017 from $25.42019 compared to $62.0 million in the third quarter of 2016,prior year, principally due to the inclusion of general and administration expenses of CEC, as well as increased investments in branding initiatives. Marketing expenses as a percentage of revenues decreased to 24.7% in 2017 from 24.9% in 2016.Admissions advisory expenses. Admissions advisory expenses increased $0.6 million, or 13%, to $5.3 million in the third quarter of 2017 from $4.7 million in the third quarter of 2016 due primarily to increased personnel costs. Admissions advisory expenses as a percentage of revenues increased to 4.9% in the third quarter of 2017 from 4.6% in the third quarter of 2016.Generalinitiatives and administration expenses. General and administration expenses increased $0.2 million to $11.2 million in the third quarter of 2017 from $11.0 million in the third quarter of 2016, related primarily to increased personnel and corporate compliance costs. Generalpartnerships with brand ambassadors. Consolidated general and administration expenses as a percentage of revenues decreased to 10.3%29.9% in the third quarter of 20172019 from 10.7%38.5% in the third quarter of 2016.Income from operations2018.Income from operations increased $3.4 million, or 70%,Amortization expense related to $8.2intangible assets acquired in the merger with CEC was $15.4 million in the third quarter of 20172019 compared to $10.3 million in 2018.$4.8operations. Income from operations was $20.0 million in the third quarter of 2019 compared to a loss from operations of $57.1 million in the third quarter of 2016.Investment2018, principally due to the inclusion of a full quarter of CEC's results in our consolidated results of operations as well as higher revenues due to enrollment growth and lower merger related costs and impairment charges. and interest expense. InvestmentOther income increased to $0.3$3.2 million in the third quarter of 20172019 compared to $0.1$1.1 million in the third quarter of 20162018, as a result of the inclusion of $0.7 million of investment income from partnership interests acquired in the CEC merger and other investments, higher yields on money markets and marketable securities, and an increase in our cash balances. Interest expense was $0.2 million in the third quarter of both 2017 and 2016. We have $150.0had $250.0 million available under our amended revolving credit facility and no borrowings outstanding as of September 30, 2017.taxes.taxes. Income tax expense was $2.1$6.6 million in the third quarter of 2017,2019, compared to $1.9a benefit for income taxes of $3.2 million in the third quarter of 2016.2018. Our effective tax rate for the quarter was 25.6% and was favorably impacted by28.2%, compared to 5.8% for the reductionsame period in the value of contingent consideration related to the NYCDA acquisition, which is not subject to income tax. We expect our effective2018. The tax rate including the effect of tax benefitsin 2018 included certain nondeductible charges associated with the vestingmerger and for the impairment of restricted stock and the impacts of the contingent considerationNYCDA goodwill. The tax rate for both periods reflects favorable discrete adjustments, referenced above,primarily related to be approximately 34.0% for 2017. tax windfalls recognized through share-based payment arrangements.26increased $3.3 million to $6.2was $16.7 million in the third quarter of 2017 from $2.92019 compared to net loss of $52.8 million in the third quarter of 20162018 due to the factors discussed above.20172019 Compared to the Nine Months Ended September 30, 2016Enrollment. Average enrollments at the University increased 6% to 42,826 students for the nine months ended September 30, 20172018 40,238 students for the same period in 2016.Revenues. Revenues increased 4%the prior year was primarily related to $336.1the inclusion of CEC revenue. In the Strayer University segment, revenues grew 12.0% to 20172019 from $321.8$343.6 million in the nine months ended September 30, 2016, principally2018, primarily due to total enrollment growth. Future enrollment and revenue growth of 6%, partially offsetmay be impacted negatively by a declinerecent change in the tuition benefits policy of one of Strayer University’sper studentwas $337.4 million compared to $43.8 million in the prior year, which reflects activity after the completion of 2%. The declinethe CEC merger on August 1, 2018, and includes a $26.2 million purchase accounting reduction related to contract liabilities acquired in revenue per student is largely attributable to a new pricing structure which was implemented for the first quarter of 2014 which reduced tuition for new undergraduate students by approximately 20%, and gave eligible students access to the Graduation Fund. Revenues for undergraduate students increased 10%merger. Non-Degree Programs segment revenues were $11.1 million in the nine months ended September 30, 2017, driven by an increase in total undergraduate enrollment of 13%, partially offset by a decline in revenue per student of 3%. We expect this decline in revenue per student to continue at the undergraduate level as we enroll more new undergraduate students. For graduate students, revenues decreased 7% in 2017, driven by a decline in total graduate enrollment of 8%, partially offset by an increase in revenue per student of 1%. The increase in graduate revenue per student was due primarily to increased average tuition per class2019, compared to 2016.Instruction and educational support expenses. Instruction and educational support expenses increased $3.9 or 2%, to $180.1 million in the nine months ended September 30, 20172018. The increase in revenues for the nine month period was primarily attributable to incremental revenues generated from $176.2the operations of Hackbright, DevMountain, and Sophia Learning, which were acquired in the CEC merger.2016. The increase primarily resulted2019 from increases$240.8 million in personnelthe nine months ended September 30, 2018, principally due to the inclusion of instructional and support costs associatedof CEC. Consolidated instructional and support costs as a percentage of revenues decreased to 54.2% in the nine months ended September 30, 2019 from 61.4% in the nine months ended September 30, 2018.a one-time staff reduction programbrand ambassadors. Consolidated general and increased bad debt expense, offset by adjustments to reduce the value of contingent consideration related to our acquisition of NYCDA. Instruction and educational supportadministration expenses as a percentage of revenues decreased to 53.6%27.9% in the nine months ended September 30, 20172019 from 54.7%32.0% in the nine months ended September 30, 2016.Marketing expenses2018.Marketing expenses increased $3.3Amortization expense related to intangible assets acquired in the merger with CEC was $46.3 million or 5%, to $64.7 million in the nine months ended September 30, 2017 from $61.42019 compared to $10.3 million for the same period in 2018.2016, principally due2019 compared to increased investments in branding initiatives. Marketing expenses as a percentage of revenues increased to 19.3%$37.8 million in the nine months ended September 30, 20172018, and reflect expenses for legal, accounting, integration support services and severance costs incurred in connection with the merger with CEC.19.1%operations. Income from operations was $73.3 million in the nine months ended September 30, 2016.Admissions advisory expenses. Admissions advisory expenses increased $1.62019 compared to loss from operations of or 12%, to $14.8 million in the nine months ended September 30, 2017 from $13.22018, principally due to the inclusion of CEC in our consolidated results of operations.2016, primarily due2019 compared to increased personnel costs. Admissions advisory expenses as a percentage of revenues increased to 4.4%$1.8 million in the nine months ended September 30, 2017 from 4.1% in the nine months ended September 30, 2016.General and administration expenses. General and administration expenses increased $2.8 million to $36.0 million in the nine months ended September 30, 2017 from $33.2 million in the nine months ended September 30, 2016. During the nine months ended September 30, 2016, we recorded a $2.0 million noncash benefit associated with adjustments to our reserve for leases on facilities no longer in use. General and administration expenses as a percentage of revenues increased to 10.7% in the nine months ended September 30, 2017 from 10.3% in the nine months ended September 30, 2016.Income from operations. Income from operations increased $2.7 million, or 7%, to $40.5 million in the nine months ended September 30, 2017 from $37.8 million in the nine months ended September 30, 2016.Investment income and interest expense. Investment income increased to $0.7 million in the nine months ended September 30, 2017 compared to $0.3 million in the nine months ended September 30, 2016,2018, as a result of the inclusion of $3.3 million of investment income from partnership interests acquired in the CEC merger and other investments, higher yields on money markets and marketable securities, and an increase in our cash balances. Interest expense was $0.5 million in both of the nine months ended September 30, 2017 and 2016. We have $150.0had $250.0 million available under our amended revolving credit facility and no borrowings outstanding as of September 30, 2017.decreased to $13.7was $31.4 million in the nine months ended September 30, 2017 from $14.62019 compared to a benefit of $1.6 million in the nine months ended September 30, 2016. This decrease reflects a tax surplus recorded in the current year associated with the vesting of certain shares of restricted stock. In addition, we recognized tax benefits resulting from the reduction in the value of contingent consideration related to the NYCDA acquisition. We expect our2018. Our effective tax rate includingfor the effect of tax benefits associated with the vesting of restricted stock and the impacts of the contingent consideration adjustments referenced above, to be approximately 34.0% for 2017nine months ended September 30, 2019 was 37.4%, compared to 39.3%4.1% for the nine months ended September 30, 2018. The tax rate was unfavorably impacted by changes in 2016.previously deferred compensation arrangements, resulting in a discrete charge of $11.5 million during the first quarter of 2019 to reduce the Company's deferred tax asset related to these arrangements. This charge is offset by favorable adjustments related to tax windfalls recognized through share-based payment arrangements.27$4.0to $52.6 million to $27.1 million in the nine months ended September 30, 20172019 from $23.1net loss of $38.1 million in the nine months ended September 30, 20162018 due to the factors discussed above.2017,2019, we had cash, and cash equivalents, and marketable securities of $150.5$457.1 million compared to $129.2$386.5 million at December 31, 20162018 and $120.5$347.8 million at September 30, 2016.2018. At September 30, 2017,2019, most of our cash was held in demand deposit accounts at high credit quality financial institutions.We are party to aagreementfacility (the “Amended Credit Facility”), which provides for a $150 millionsenior secured revolving credit facility and(the “Revolver”) in an aggregate principal amount of up to $250 million. The Amended Credit Facility provides the Company with an option, under certain conditions, to increase the commitments under the Revolver or establish one or more incremental term loans under certain conditions. The credit agreement has(each, an “Incremental Facility”) in an amount up to the sum of (x) $150 million and (y) if such Incremental Facility is incurred in connection with a maturity date of July 2, 2020. We hadpermitted acquisition, any amount so long as the Company’s leverage ratio (calculated on a trailing four-quarter basis) on a pro forma basis will be no borrowings outstanding under the revolving credit facility during each of the nine months ended September 30, 2016 and 2017, and as of September 30, 2017.revolving credit facilityAmended Credit Facility bear interest at LIBOR or a base rate, plus a margin ranging from 1.75%1.50% to 2.25%2.00%, depending on our leverage ratio. An unused commitment fee ranging from 0.25%0.20% to 0.35%0.30%, depending on our leverage ratio, accrues on unused amounts under the revolving credit facility.amounts. During each of the nine months ended September 30, 20172019 and 2016,2018, we paid unused commitment fees of $0.4 million and $0.3 million.million, respectively. We were in compliance with all applicable covenants related to the credit agreementAmended Credit Facility as of September 30, 2017.fromprovided by operating activities for the nine months ended September 30, 2017 increased to $44.42019 was $141.4 million, as compared to $30.1net cash used in operating activities of $14.6 million for the same period in 2016.2018. The increase in net cash from operating activities was largely due to the payment of retention agreementsincrease in connectionincome from operations following the merger with the NYCDA acquisition in January 2016, cash provided by changes in working capital,CEC, together with adjustments for non-cash charges for depreciation and the timing of income tax payments in 2017 compared to 2016.$14.6$27.8 million for the nine months ended September 30, 2017,2019, compared to $7.5$16.0 million for the same period in 2016.an annuala regular, quarterly cash dividend of $1.00$0.50 per share of common share, payable quarterly.stock for each of the first three quarters of 2019. During the nine months ended September 30, 2017,2019, we have paid a total of $8.6$33.3 million in cash dividends on our common stock. For the nine months ended September 30, 2017,2019, we did not repurchase any shares of common stock and, at September 30, 2017,2019, had $70$70.0 million in repurchase authorization to use through December 31, 2017.2017,2019, bad debt expense as a percentage of revenue was 4.9%5.0% compared to 3.8%6.1% for the third quarter of 2016. mostly demand deposit bank accounts and money market funds, which isare included in cash and cash equivalents at September 30, 20172019 and 2016.2018. We also hold marketable securities, which primarily include tax-exempt municipal securities and corporate debt securities. During the nine months ended September 30, 20172019 and 2016,2018, we earned interest income of $0.7$8.0 million and $0.3$2.4 million, respectively.The table below sets forth our contractual commitments associated with operating leases, excluding subleases as of September 30, 2017 (in thousands):2017,2019, a 1% increase or decrease in interest rates would not have a material impact on our future earnings, fair values, or cash flows related to investments in cash equivalents or interest earning marketable securities.Changing interest rates could also have a negative impact onamountCompany amended its prior credit facility to extend the maturity date of interest expense we incur. On July 2, 2015, we used approximately $116 million of our existing cash and cash equivalents to prepay our term loan and terminate an interest rate swap as part of an amendment to our credit and term loan agreement. The credit agreement provides for a $150 millionthe revolving credit facility from July 2, 2020 to August 1, 2023, and to increase available borrowings from $150 million to $250 million, with an option, subject to obtaining additional loan commitments and satisfaction of certain conditions, to increase the commitments under the revolving facility or establish one or more incremental term loans under certain conditions. The credit agreement has(each, an “Incremental Facility”) in an aggregate amount of up to the sum of (x) $150 million and (y) if such Incremental Facility is incurred in connection with a maturity date of July 2, 2020.permitted acquisition, any amount so long as the Company’s leverage ratio (calculated on a trailing four-quarter basis) on a pro forma basis will be no greater than 1.75:1.00. We had no borrowings outstanding under the revolving credit facility after prepayment of the term loan facility, andAmended Credit Facility as of September 30, 2017.2019. Borrowings under the revolving credit facilityAmended Credit Facility bear interest at LIBOR or a base rate, plus a margin ranging from 1.75%1.50% to 2.25%2.00%, depending on our leverage ratio. An unused commitment fee ranging from 0.25%0.20% to 0.35%0.30%, depending on our leverage ratio, accrues on unused amounts under the revolving credit facility.Amended Credit Facility. An increase in LIBOR would affect interest expense on any outstanding balance of the revolving credit facility. For every 100 basis points increase in LIBOR, we would incur an incremental $1.5$2.5 million in interest expense per year assuming the entire $150$250 million revolving credit facility was utilized.a) 2017.2019. Based upon such review, the Chief Executive Officer and Chief Financial Officer have concluded that the Company had in place, as of September 30, 2017, effective disclosure controls and procedures designed to ensure that information required to be disclosed by the Company (including consolidated subsidiaries) in the reports it files or submits under the Securities Exchange Act of 1934, as amended, and the rules thereunder, is recorded, processed, summarized and reported within the time periods specified in the Commission’s rules and forms. Disclosure controls and procedures include, without limitation, controls and procedures designed to ensure that information required to be disclosed by an issuer in reports it files or submits under the Securities Exchange Act is accumulated and communicated to the Company’s management, including its principal executive officer or officers and principal financial officer or officers, or persons performing similar functions, as appropriate to allow timely decisions regarding required disclosure.b) ThereOn August 1, 2018, the Company completed its acquisition of Capella Education Company. As noted under Item 9A, Controls and Procedures, contained in the Company’s Annual Report on Form 10-K for the year ended December 31, 2018, management’s assessment of, and conclusion on, the effectiveness of internal control over financial reporting did not include the internal controls of Capella Education Company. See Note 3, Merger with Capella Education Company in the condensed consolidated financial statements appearing in Part I, Item 1 of this report for a discussion of the acquisition and related financial data. Under guidelines established by the SEC, companies are permitted to exclude acquisitions from their assessment of internal control over financial reporting for a period of up to one year following an acquisition while integrating the acquired company. The Company is in the process of integrating Capella Education Company’s and the Company’s internal controls over financial reporting. As a result of these integration activities, certain controls will be evaluated and may be changed. Except as noted above, there have not been any changes in the Company’s internal control over financial reporting during the quarter ended September 30, 20172019 that have materially affected, or are reasonably likely to materially affect, the Company’s internal control over financial reporting.29From time to time, weThereFrom time to time, certain matters may arise that are no pendingother than ordinary and routine. The outcome of such matters is uncertain and we may incur costs in the future to defend, settle, or otherwise resolve them. We currently believe that the ultimate outcome of such matters will not, individually or in the aggregate, have a material legal proceedings to which weadverse effect on our consolidated financial position, results of operations or our property are subject.cash flows. However, depending on the amount and timing, an unfavorable resolution of some or all of these matters could materially affect future results of operations in a particular period.2016, and in our Quarterly Reports on Form 10-Q for the quarters ended March 31, 2017 and June 30, 2017,2018, which could materially affect our business, adversely affect the market price of our common stock and could cause you to suffer a partial or complete loss of your investment. There have been no material changes to the risk factors previously described in Part I, “Item 1A. Risk Factors” included in the Company’s Annual Report on Form 10-K for the year ended December 31, 2016, and in our Quarterly Reports on Form 10-Q for the quarters ended March 31, 2017 and June 30, 2017, except that we have updated two of the risk factors to reflect recent developments occurring after the filing of our Quarterly Report on Form 10-Q for the quarter ended June 30, 2017.2018. The risks described in our Annual Report on Form 10-K, as updated by our Quarterly Reports on Form 10-Q for the quarters ended March 31, 2017 and June 30, 2017, and this Quarterly Report on Form 10-Q, are not the only risks facing the Company. Additional risks and uncertainties not currently known to us or that we currently deem to be immaterial also could materially adversely affect our business. See “Cautionary Notice Regarding Forward-Looking Statements.”The following risk factors update and supersede the risk factors with the same captions in our Annual Report on Form 10-K for the year ended December 31, 2016, as updated by our Quarterly Reports on Form 10-Q for the quarters ended March 31, 2017 and June 30, 2017.We are subject to compliance reviews, which, if they resulted in a material finding of noncompliance, could affect our ability to participate in Title IV programs.Because we operate in a highly regulated industry, we are subject to compliance reviews and claims of noncompliance and related lawsuits by government agencies, accrediting agencies and third parties, including claims brought by third parties on behalf of the federal government. For example, the Department of Education regularly conducts program reviews of educational institutions that are participating in Title IV programs, and the Office of Inspector General of the Department of Education regularly conducts audits and investigations of such institutions. The Department of Education could limit, suspend, or terminate our participation in Title IV programs, place us on a more restrictive, slower payment method for receipt of Title IV program funds, or impose other penalties such as requiring us to make refunds, pay liabilities, or pay an administrative fine upon a material finding of noncompliance.The Department of Education conducted four campus-based program reviews of Strayer University’s administration of Title IV programs in three states and the District of Columbia, with one on-site review conducted August 18-20, 2014; one on-site review conducted September 8-11, 2014; and two on-site reviews conducted September 22-26, 2014. On October 21, 2014, the Department of Education issued an Expedited Final Program Review Determination Letter for one of the program reviews conducted the week of September 22, 2014, closing the program review with no further action required by us. On November 17, 2014, we received a Program Review Report for the program review conducted in August 2014, and provided a response to the Department of Education on December 15, 2014. On January 7, 2015, we received a Final Program Review Determination letter from that August 2014 review, closing the program review with no further action required by us. On March 24, 2015, the Company received a Program Review Report for another program review, and provided a response to the Department on April 21, 2015. On April 29, 2015, the Company received a Final Program Review Determination Letter closing the review and identifying a payment of less than $500 due to the Department of Education based on an underpayment on a return to Title IV calculation. The Company remitted payment, and received a letter from the Department on May 26, 2015, indicating that no further action was required and that the matter was closed. On September 15, 2015, the Company received a Program Review Report for the final program review, and provided a response to the Department on October 5, 2015. On January 5, 2016, the Company received a Final Program Review Determination Letter for the final program review, indicating that this program review was closed and no further action was required.If we fail to obtain recertification by the Department of Education when required, we would lose our ability to participate in Title IV programs.An institution generally must seek recertification from the Department of Education at least every six years and possibly more frequently depending on various factors, such as whether it is provisionally certified. The Department of Education may also review an institution’s continued eligibility and certification to participate in Title IV programs, or scope of eligibility and certification, in the event the institution undergoes a change in ownership resulting in a change of control or expands its activities in certain ways, such as the addition of certain types of new programs, or, in certain cases, changes to the academic credentials that it offers. In certain circumstances, the Department of Education must provisionally certify an institution. The Department of Education may withdraw our certification if it determines that we are not fulfilling material requirements for continued participation in Title IV programs. If the Department of Education does not renew, or withdraws our certification to participate in Title IV programs, our students would no longer be able to receive Title IV program funds, which would have a material adverse effect on our business.Each institution participating in Title IV programs must enter into a Program Participation Agreement with the Department of Education. Under the agreement, the institution agrees to follow the Department of Education’s rules and regulations governing Title IV programs. On October 13, 2017, the Department informed the University that it was approved to participate in Title IV programs with full certification through June 30, 2021.2017,2019, we did not repurchase any shares of common stock under our repurchase program. The remaining authorization for our common stock repurchases was $70.0 million as of September 30, 2017,2019, and is available for use through December 31, 2017.2019.None313.23.3Cover Page Interactive Data File (formatted as Inline XBRL and contained in Exhibit 101) 32STRAYERSTRATEGIC EDUCATION, INC. October 30, 201733