PART I - FINANCIAL INFORMATIONINFORMATION
ITEM 1. Financial Statements
ITEM 1. Financial Statements
GOLD RESOURCE CORPORATION
CONDENSED CONSOLIDATED INTERIM BALANCE SHEETS
SHEETS
(U.S. dollars in thousands, except share and per share amounts)
(Unaudited)
| | | | | | |
| | September 30, | | December 31, |
| | 2017 | | 2016 |
| | (Unaudited) | | |
ASSETS | | | | | | |
Current assets: | | | | | | |
Cash and cash equivalents | | $ | 15,832 | | $ | 14,166 |
Gold and silver rounds/bullion | | | 3,831 | | | 3,307 |
Accounts receivable | | | 3,664 | | | 630 |
Inventories, net | | | 9,890 | | | 8,946 |
Income tax receivable, net | | | 1,025 | | | 626 |
Prepaid expenses and other current assets | | | 1,822 | | | 1,587 |
Total current assets | | | 36,064 | | | 29,262 |
Property, plant and mine development, net | | | 79,447 | | | 70,059 |
Deferred tax assets, net | | | 18,645 | | | 17,580 |
Other non-current assets | | | 945 | | | 1,542 |
Total assets | | $ | 135,101 | | $ | 118,443 |
LIABILITIES AND SHAREHOLDERS' EQUITY | | | | | | |
Current liabilities: | | | | | | |
Accounts payable | | $ | 8,883 | | $ | 5,383 |
Loan payable, current | | | 562 | | | - |
Mining royalty taxes payable | | | 1,222 | | | 2,033 |
Accrued expenses and other current liabilities | | | 2,165 | | | 1,526 |
Total current liabilities | | | 12,832 | | | 8,942 |
Reclamation and remediation liabilities | | | 2,790 | | | 2,425 |
Loan payable, long-term | | | 1,789 | | | - |
Total liabilities | | | 17,411 | | | 11,367 |
Shareholders' equity: | | | | | | |
Common stock - $0.001 par value, 100,000,000 shares authorized: | | | | | | |
56,891,484 and 56,566,874 shares outstanding at September 30, 2017 and December 31, 2016, respectively | | | 57 | | | 57 |
Additional paid-in capital | | | 114,211 | | | 112,034 |
Retained earnings | | | 10,477 | | | 2,040 |
Treasury stock at cost, 336,398 shares | | | (5,884) | | | (5,884) |
Accumulated other comprehensive loss | | | (1,171) | | | (1,171) |
Total shareholders' equity | | | 117,690 | | | 107,076 |
Total liabilities and shareholders' equity | | $ | 135,101 | | $ | 118,443 |
| | | | | | |
| | As of | | As of |
| | March 31, | | December 31, |
| Note | 2024 | | 2023 |
ASSETS | | | | | | |
Current assets: | | | | | | |
Cash and cash equivalents | | $ | 5,662 | | $ | 6,254 |
Accounts receivable, net | | | 4,161 | | | 4,335 |
Inventories, net | 4 | | 9,849 | | | 9,294 |
Prepaid expenses and other current assets | 6 | | 6,033 | | | 6,612 |
Total current assets | | | 25,705 | | | 26,495 |
Property, plant, and mine development, net | 7 | | 135,775 | | | 138,626 |
Deferred tax assets, net | 5 | | 15,569 | | | 13,301 |
Other non-current assets | 8 | | 5,669 | | | 5,464 |
Total assets | | $ | 182,718 | | $ | 183,886 |
LIABILITIES AND SHAREHOLDERS’ EQUITY | | | | | | |
Current liabilities: | | | | | | |
Accounts payable | | $ | 9,082 | | $ | 8,378 |
Mining royalty taxes payable, net | | | 1,462 | | | 1,199 |
Accrued expenses and other current liabilities | 9 | | 1,555 | | | 1,748 |
Total current liabilities | | | 12,099 | | | 11,325 |
Reclamation and remediation liabilities | 11 | | 12,128 | | | 11,795 |
Gold and silver stream agreements liability | 10 | | 46,341 | | | 44,932 |
Deferred tax liabilities, net | 5 | | 13,926 | | | 14,077 |
Contingent consideration | 12 | | 3,598 | | | 3,548 |
Other non-current liabilities | 9 | | 1,851 | | | 1,516 |
Total liabilities | | | 89,943 | | | 87,193 |
| | | | | | |
Commitments and contingencies | 12 | | | | | |
| | | | | | |
Shareholders’ equity: | | | | | | |
Common stock - $0.001 par value, 200,000,000 shares authorized: | | | | | | |
88,790,474 and 88,694,038 shares issued and outstanding at March 31, 2024 and December 31, 2023, respectively | | | 89 | | | 89 |
Additional paid-in capital | | | 112,073 | | | 111,970 |
Accumulated deficit | | | (12,332) | | | (8,311) |
Treasury stock at cost, 336,398 shares | | | (5,884) | | | (5,884) |
Accumulated other comprehensive loss | | | (1,171) | | | (1,171) |
Total shareholders’ equity | | | 92,775 | | | 96,693 |
Total liabilities and shareholders’ equity | | $ | 182,718 | | $ | 183,886 |
The accompanying notes are an integral part of these condensed consolidated financial statements.Condensed Consolidated Interim Financial Statements.
1Gold Resource Corporation—Condensed Consolidated Interim Financial Statements and Notes (Unaudited)
4
GOLD RESOURCE CORPORATION
CONDENSED CONSOLIDATED INTERIM STATEMENTS OF OPERATIONS
(U.S. dollars in thousands, except share and per share amounts)
(Unaudited)
| | | | | | | |
| | | For the three months ended |
| | | March 31, |
| Note | | 2024 | | 2023 |
| | | | | | | |
Sales, net | 3 | | $ | 18,702 | | $ | 31,228 |
Cost of sales: | | | | | | | |
Production costs | | | | 16,108 | | | 19,850 |
Depreciation and amortization | | | | 4,210 | | | 7,254 |
Reclamation and remediation | | | | 553 | | | 195 |
Total cost of sales | | | | 20,871 | | | 27,299 |
Mine gross (loss) profit | | | | (2,169) | | | 3,929 |
Costs and expenses: | | | | | | | |
General and administrative expenses | | | | 901 | | | 1,193 |
Mexico exploration expenses | | | | 899 | | | 1,389 |
Michigan Back Forty Project expenses | | | | 205 | | | 450 |
Stock-based compensation | 16 | | | 219 | | | 597 |
Other expense, net | 17 | | | 1,515 | | | 1,469 |
Total costs and expenses | | | | 3,739 | | | 5,098 |
Loss before income taxes | | | | (5,908) | | | (1,169) |
Income taxes benefits | 5 | | | (1,887) | | | (134) |
Net loss | | | $ | (4,021) | | $ | (1,035) |
Net loss per common share: | | | | | | | |
Basic and diluted net loss per common share | 18 | | $ | (0.05) | | $ | (0.01) |
| | | | | | | |
Weighted average shares outstanding: | | | | | | | |
Basic and diluted | 18 | | | 88,707,430 | | | 88,405,935 |
| | | | | | | | | | | | |
| | Three months ended September 30, | | Nine months ended September 30, |
| | 2017 | | 2016 | | 2017 | | 2016 |
| | | | | | | | | | | | |
Sales, net | | $ | 31,122 | | $ | 21,367 | | $ | 76,849 | | $ | 64,968 |
Mine cost of sales: | | | | | | | | | | | | |
Production costs | | | 16,122 | | | 12,767 | | | 39,634 | | | 34,570 |
Depreciation and amortization | | | 3,762 | | | 3,189 | | | 10,271 | | | 9,049 |
Reclamation and remediation | | | 37 | | | 48 | | | 101 | | | 139 |
Total mine cost of sales | | | 19,921 | | | 16,004 | | | 50,006 | | | 43,758 |
Mine gross profit | | | 11,201 | | | 5,363 | | | 26,843 | | | 21,210 |
Costs and expenses: | | | | | | | | | | | | |
General and administrative expenses | | | 1,950 | | | 2,027 | | | 5,437 | | | 5,875 |
Exploration expenses | | | 1,457 | | | 881 | | | 3,415 | | | 2,027 |
Other expense (income), net | | | 110 | | | 74 | | | 1,183 | | | (1,170) |
Total costs and expenses | | | 3,517 | | | 2,982 | | | 10,035 | | | 6,732 |
Income before income taxes | | | 7,684 | | | 2,381 | | | 16,808 | | | 14,478 |
Provision for income taxes | | | 3,103 | | | 787 | | | 6,987 | | | 6,479 |
Net income | | $ | 4,581 | | $ | 1,594 | | $ | 9,821 | | $ | 7,999 |
Net income per common share: | | | | | | | | | | | | |
Basic | | $ | 0.08 | | $ | 0.03 | | $ | 0.17 | | $ | 0.15 |
Diluted | | $ | 0.08 | | $ | 0.03 | | $ | 0.17 | | $ | 0.14 |
Weighted average shares outstanding: | | | | | | | | | | | | |
Basic | | | 56,888,115 | | | 55,781,382 | | | 56,841,897 | | | 54,994,430 |
Diluted | | | 57,455,805 | | | 57,597,392 | | | 57,617,030 | | | 55,589,307 |
The accompanying notes are an integral part of these condensed consolidated financial statements.Condensed Consolidated Interim Financial Statements.
2Gold Resource Corporation—Condensed Consolidated Interim Financial Statements and Notes (Unaudited)
5
GOLD RESOURCE CORPORATION
CONDENSED CONSOLIDATED INTERIM STATEMENTS OF CHANGES IN SHAREHOLDERS’ EQUITY
(U.S. dollars in thousands, except share amounts)
(Unaudited)
| | | | | | | | | | | | | | | | | | | | |
| | Number of Common Shares | | Par Value of Common
Share | | Additional Paid-in Capital | | Accumulated (Deficit)/ Retained Earnings | | Treasury Stock | | Accumulated Other Comprehensive Loss | | Total Shareholders' Equity |
Balance, December 31, 2015 | | 54,603,104 | | $ | 55 | | $ | 96,766 | | $ | (948) | | $ | (5,884) | | $ | (1,171) | | $ | 88,818 |
Stock options exercised | | 169,999 | | | - | | | 391 | | | - | | | - | | | - | | | 391 |
Stock-based compensation | | - | | | - | | | 1,240 | | | - | | | - | | | - | | | 1,240 |
Dividends declared | | - | | | - | | | (271) | | | (1,399) | | | - | | | - | | | (1,670) |
Acquisitions | | 2,130,169 | | | 2 | | | 13,908 | | | - | | | - | | | - | | | 13,910 |
Net income | | - | | | - | | | - | | | 4,387 | | | - | | | - | | | 4,387 |
Balance, December 31, 2016 | | 56,903,272 | | $ | 57 | | $ | 112,034 | | $ | 2,040 | | $ | (5,884) | | $ | (1,171) | | $ | 107,076 |
Adjustment to beginning retained earnings as a result of adoption of ASU 2016-16 | | - | | | - | | | - | | | (533) | | | - | | | - | | | (533) |
Stock-based compensation | | - | | | - | | | 877 | | | - | | | - | | | - | | | 877 |
Common stock issued for vested restricted stock units | | 78,400 | | | - | | | - | | | - | | | - | | | - | | | - |
Common stock issued for the acquisition of mineral rights | | 246,210 | | | - | | | 1,300 | | | - | | | - | | | - | | | 1,300 |
Dividends declared | | - | | | - | | | - | | | (851) | | | - | | | - | | | (851) |
Net income | | - | | | - | | | - | | | 9,821 | | | - | | | - | | | 9,821 |
Balance, September 30, 2017 (unaudited) | | 57,227,882 | | $ | 57 | | $ | 114,211 | | $ | 10,477 | | $ | (5,884) | | $ | (1,171) | | $ | 117,690 |
| | | | | | | | | | | | | | | | | | | | |
| | For the three months ended March 31, 2024 and 2023 |
| | Number of
Common
Shares | | Par Value of
Common
Shares | | Additional Paid-
in Capital | | Retained
Earnings (Accumulated Deficit) | | Treasury
Stock | | Accumulated
Other
Comprehensive
Loss | | Total Shareholders’ Equity |
Balance, December 31, 2022 | | 88,734,507 | | $ | 89 | | $ | 111,024 | | $ | 7,706 | | $ | (5,884) | | $ | (1,171) | | $ | 111,764 |
Stock-based compensation | | - | | | - | | | 273 | | | - | | | - | | | - | | | 273 |
Common stock issued for vested restricted stock units | | 88,570 | | | - | | | - | | | - | | | - | | | - | | | - |
Surrender of stock for taxes due on vesting | | (18,137) | | | - | | | (11) | | | - | | | - | | | - | | | (11) |
Net loss | | - | | | - | | | - | | | (1,035) | | | - | | | - | | | (1,035) |
Balance, March 31, 2023 | | 88,804,940 | | $ | 89 | | $ | 111,286 | | $ | 6,671 | | $ | (5,884) | | $ | (1,171) | | $ | 110,991 |
| | | | | | | | | | | | | | | | | | | | |
Balance, December 31, 2023 | | 89,030,436 | | $ | 89 | | $ | 111,970 | | $ | (8,311) | | $ | (5,884) | | $ | (1,171) | | $ | 96,693 |
Stock-based compensation | | | | | - | | | 128 | | | - | | | - | | | - | | | 128 |
Common stock issued for vested restricted stock units | | 160,736 | | | - | | | - | | | - | | | - | | | - | | | - |
Surrender of stock for taxes due on vesting | | (64,300) | | | - | | | (25) | | | - | | | - | | | - | | | (25) |
Net loss | | | | | - | | | - | | | (4,021) | | | - | | | - | | | (4,021) |
Balance, March 31, 2024 | | 89,126,872 | | $ | 89 | | $ | 112,073 | | $ | (12,332) | | $ | (5,884) | | $ | (1,171) | | $ | 92,775 |
The accompanying notes are an integral part of these condensed consolidated financial statements.Condensed Consolidated Interim Financial Statements.
Gold Resource Corporation—Condensed Consolidated Interim Financial Statements and Notes (Unaudited)
6
GOLD RESOURCE CORPORATION
CONDENSED CONSOLIDATED INTERIM STATEMENTS OF CASH FLOWS
FLOWS
(U.S. dollars in thousands)
(Unaudited)
| | | | | | |
| | For the three months ended March 31, |
| Note | 2024 | | 2023 |
Cash flows from operating activities: | | | | | | |
Net loss | | $ | (4,021) | | $ | (1,035) |
Adjustments to reconcile net loss to net cash (used in) provided by operating activities: | | | | | | |
Deferred income tax benefit | | | (2,132) | | | (715) |
Depreciation and amortization | | | 4,582 | | | 7,276 |
Stock-based compensation | | | 219 | | | 597 |
Other operating adjustments, net | 20 | | (230) | | | 631 |
Changes in operating assets and liabilities: | | | | | | |
Accounts receivable | | | 174 | | | (49) |
Inventories | | | (211) | | | 1,741 |
Prepaid expenses and other current assets | | | 596 | | | 1,390 |
Other non-current assets | | | 104 | | | (42) |
Accounts payable and other accrued liabilities | | | 2,229 | | | (4,514) |
Cash settled liability awards | | | (67) | | | - |
Mining royalty and income taxes payable, net | | | 239 | | | (4,256) |
Net cash provided by operating activities | | | 1,482 | | | 1,024 |
| | | | | | |
Cash flows from investing activities: | | | | | | |
Capital expenditures | | | (1,994) | | | (3,136) |
Net cash used in investing activities | | | (1,994) | | | (3,136) |
| | | | | | |
Cash flows from financing activities: | | | | | | |
Other financing activities | | | (25) | | | (16) |
Net cash used in financing activities | | | (25) | | | (16) |
Effect of exchange rate changes on cash and cash equivalents | | | (55) | | | (127) |
| | | | | | |
Net decrease in cash and cash equivalents | | | (592) | | | (2,255) |
Cash and cash equivalents at beginning of period | | | 6,254 | | | 23,675 |
Cash and cash equivalents at end of period | | $ | 5,662 | | $ | 21,420 |
| | | | | | |
Supplemental Cash Flow Information | | | | | | |
Income and mining taxes paid | | $ | 66 | | $ | 4,501 |
Non-cash investing or financing activities | | | | | | |
Value of Common Shares issued for RSU Redemption | | $ | 37 | | $ | - |
Balance of capital expenditures in accounts payable | | $ | 295 | | $ | 1,303 |
| | | | | | |
| | Nine months ended September 30, |
| | 2017 | | 2016 |
| | | | | | |
Cash flows from operating activities: | | | | | | |
Net income | | $ | 9,821 | | $ | 7,999 |
Adjustments to reconcile net income to net cash from operating activities: | | | | | | |
Deferred income taxes | | | 3,033 | | | 250 |
Depreciation and amortization | | | 10,602 | | | 9,343 |
Stock-based compensation | | | 877 | | | 997 |
Other operating adjustments | | | 392 | | | (531) |
Changes in operating assets and liabilities: | | | | | | |
Accounts receivable | | | (3,034) | | | (2,092) |
Inventories | | | (945) | | | (657) |
Prepaid expenses and other current assets | | | 958 | | | 1,203 |
Accounts payable and other accrued liabilities | | | 3,319 | | | (2,774) |
Mining royalty and income taxes payable/receivable | | | (1,556) | | | 3,690 |
Other noncurrent assets | | | 36 | | | 64 |
Net cash provided by operating activities | | | 23,503 | | | 17,492 |
Cash flows from investing activities: | | | | | | |
Capital expenditures | | | (20,382) | | | (12,637) |
Proceeds from the sale of equity investments | | | - | | | 749 |
Other investing activities | | | (265) | | | (315) |
Net cash used in investing activities | | | (20,647) | | | (12,203) |
Cash flows from financing activities: | | | | | | |
Proceeds from the exercise of stock options | | | - | | | 391 |
Dividends paid | | | (852) | | | (818) |
Repayment of loan payable | | | (46) | | | - |
Repayment of capital leases | | | (21) | | | (606) |
Net cash used in financing activities | | | (919) | | | (1,033) |
Effect of exchange rate changes on cash and cash equivalents | | | (271) | | | (13) |
Net increase in cash and cash equivalents | | | 1,666 | | | 4,243 |
Cash and cash equivalents at beginning of period | | | 14,166 | | | 12,822 |
Cash and cash equivalents at end of period | | $ | 15,832 | | $ | 17,065 |
Supplemental Cash Flow Information | | | | | | |
Income and mining taxes paid | | $ | 2,764 | | $ | 256 |
Non-cash investing activities: | | | | | | |
Increase (decrease) in accrued capital expenditures | | $ | 510 | | $ | (2,764) |
Equipment purchased through loan payable | | | 2,397 | | | - |
Equipment purchased under capital lease | | | 21 | | | 300 |
Common stock issued for the acquisition of mineral rights | | $ | 1,300 | | $ | 13,910 |
The accompanying notes are an integral part of these condensed consolidated financial statements.Condensed Consolidated Interim Financial Statements.
4Gold Resource Corporation—Condensed Consolidated Interim Financial Statements and Notes (Unaudited)
7
GOLD RESOURCE CORPORATION
NOTES TO THE CONDENSED CONSOLIDATED INTERIM FINANCIAL STATEMENTS
September 30, 2017March 31, 2024
(Unaudited)
(Unaudited)
1. Basis of Preparation of Financial Statements
The interim Condensed Consolidated Interim Financial Statements (“interim financial statements”) of Gold Resource Corporation and its subsidiaries (collectively, the “Company”) are unaudited and have been prepared in accordance with the rules of the Securities and Exchange Commission (“SEC”) for interim statements. Certain information and footnote disclosures required by United States Generally Accepted Accounting Principles (“U.S. GAAP”) have been condensed or omitted althoughas permitted by such rules. However, the Company believes that the disclosures included are adequate to make the information presented not misleading. In the opinion of management, all adjustments (including normal recurring adjustments) and disclosures necessary for a fair presentation of these interim financial statements have been included. The results reported in these interim financial statements aredo not necessarily indicative ofindicate the results that may be reported for the entire year. These interim financial statements should be read in conjunction with the Company’s audited consolidated financial statements for the year ended December 31, 20162023 included in the Company’s annual report on Form 10-K.10-K (the “2023 Annual Report”). The year-end balance sheet data was derived from the audited financial statements. Unless otherwise noted, there have been no material changes to the footnotes from those accompanying the audited consolidated financial statements contained in the Company’s annual report on Form 10-K.2023 Annual Report.
2. RecentNew Accounting Pronouncements
Recently Adopted Accounting Pronouncements
Accounting Standards Update 2016-09—Compensation—Stock compensationThe FASB issued ASU 2023-07, Segment Reporting (Topic 718)280): Improvements to employee share-based payment accounting. On March 30, 2016,Reportable Segment Disclosures in November 2023, amending reportable segment disclosure requirements to include disclosure of incremental segment information on an annual and interim basis. Among the Financial Accounting Standards Board (“FASB”) issued guidance intended to improve the accounting for employee share-based payments. The standard affects all organizationsdisclosure enhancements are new disclosures regarding significant segment expenses that issue share-based payment awards to their employees and was part of the FASB’s Simplification Initiative. The objective of the Simplification Initiative is to identify, evaluate, and improve areas of U.S. GAAP for which cost and complexity can be reduced while maintaining or improving the usefulness of the informationare regularly provided to usersthe chief operating decision-maker and included within each reported measure of financial statements. The areas for simplification in this standard involve several aspectssegment profit or loss, as well as other segment items bridging segment revenue to each reported measure of the accounting for share-based payment transactions, including the income tax consequences, classification of awards as either equitysegment profit or liabilities, and classification on the statement of cash flows. For public business entities, the amendments in this standard are effective for annual periods beginning after December 15, 2016, and interim periods within those annual periods. Because of the Company’s current valuation allowance position, the adoption of this guidance, effective January 1, 2017, did not result in an adjustment to retained earnings as of December 31, 2016. Nor did it result in current tax expense or benefit related to vested stock-based awards for the nine months ended September 30, 2017. As a result, the Company did not exclude any excess tax benefits from the calculation of diluted earnings per share during the nine months ended September 30, 2017, and there was no method change to the cash flow presentation as required by the guidance. Please see Note 5 for more information.
Accounting Standards Update 2016-16 – Income Taxes, Intra-Entity Transfers of Assets Other Than Inventory (Topic 740).In October 2016, the FASB issued guidance intended to improve the accounting for the income tax consequences of intra-entity transfers of assets other than inventory by requiring an entity to recognize the income tax consequences when a transfer occurs, instead of when an asset is sold to an outside party.loss. The amendments in this guidance should be applied on a modified retrospective basis through a cumulative-effect adjustment directly to retained earnings as of the beginning of the period of adoption. The Company is required to adopt this new standard on January 1, 2018,ASU 2023-07 are effective for its fiscal year 2018 and for interim periods within that fiscal year. Early adoption is permitted as of the beginning of an annual reporting period for which interim or annual financial statements have not been issued. The Company elected to early adopt this guidance as of January 1, 2017 which resulted in the Company adjusting its deferred tax charge, previously reported in other long-term assets, to nil with the related offset to beginning retained earnings.
The net effect was a decrease of $0.5 million to other long-term assets and a corresponding decrease to beginning retained earnings.
Recently Issued Accounting Pronouncements
Accounting Standards Update (“ASU”) No. 2014-09—Revenue from Contracts with Customers (Topic 606). On May 28, 2014, the FASB issued guidance that requires an entity to recognize the amount of revenue to which it expects to be entitled for the transfer of promised goods or services to customers. This ASU was further amended in August 2015, March 2016, April 2016, May 2016 and December 2016 by ASU No. 2015-14, No. 2016-08, No. 2016-10, No. 2016-12 and No. 2016-20, respectively. The guidance provides a five-step approach to be applied to all contracts with customers and also requires expanded disclosures about revenue recognition.
The Company has performed an assessment of the revised guidance and the impacts on the Company’s Consolidated Financial Statements and disclosures. The Company has completed the review of all contracts and determined that the adoption of this guidance will not impact the timing of revenue recognition based on the Company’s determination of when control is transferred. Currently, revenue is recognized for contracts upon delivery of material to the customer and will not change under the new guidance.
The Company furthered its evaluation of variable consideration for concentrate sales related to the variable nature of the price and metal quantity. Based on its current analysis, the estimate of revenue recognized for concentrates will remain unchanged as sales will initially be recorded on a provisional basis based on the forward prices for the estimated month of settlement and the Company’s estimated metal quantities delivered based on weighing and assay data. The Company believes changes in the underlying weight and metal content are not significant to the sale as a whole and therefore do not preclude the recognition of revenue upon transfer of control.
Additionally, the Company completed its evaluation of the impacts of refining fee classification. The Company also determined that revenue will be recognized, net of treatment and refining charges when these payments are made to customers. This classification remains unchanged from current practice.
The Company will adopt the new guidance effective January 1, 2018. The guidance may be applied retrospectively for all periods presented or retrospectively with the cumulative effect of initially applying the guidance recognized at the date of initial application. The Company currently anticipates adopting the guidance retrospectively with the cumulative effect of initially applying the amended guidance recognized at January 1, 2018. As there are no changes to the Company’s current revenue recognition model, no changes will be made to prior period amounts or related prior period disclosures.
Accounting Standards Update No. 2016-02 Leases (Topic 842). In February 2016, the FASB issued a new standard regarding leases. Lessees will be required to recognize virtually all of their leases on the balance sheet, by recording a right-of-use asset and a lease liability. Public business entities are required to adopt the new leasing standard for fiscal years, and interim periods within those fiscal years beginning after December 15, 2018. For calendar year-end public companies, this means an adoption date of January 1, 2019.2023, and for interim periods within fiscal years beginning after December 15, 2024, and are applied retrospectively. Early adoption is permitted. The Company isWe are currently evaluating the impact of this update on itsour consolidated financial statements and disclosures.
3. GoldThe FASB issued ASU 2023-09, Income Taxes (Topic 740): Improvement to Income Tax Disclosures in December 2023, amending income tax disclosure requirements for the effective tax rate reconciliation and Silver Rounds/Bullion
income taxes paid. The Company periodically purchases goldamendments in ASU 2023-09 are effective for fiscal years beginning after December 15, 2024, and silver bullion on the open market for investment purposesare applied prospectively. Early adoption and to use in its dividend exchange program under which shareholders may exchange their cash dividends for minted gold and silver rounds. During the nine months ended September 30, 2017 and 2016, the Company purchased 215.85 ounces and nil ounces, respectively, of gold bullion. At September 30, 2017 and December 31, 2016, the Company’s holdings of rounds/bullion, using quoted market prices, consistedretrospective application of the following:
| | | | | | | | | | | | |
| | 2017 | | 2016 |
| | Gold | | Silver | | Gold | | Silver |
| | (in thousands, except ounces and per ounce) |
Ounces | | | 1,794 | | | 90,685 | | | 1,579 | | | 90,971 |
Per ounce | | $ | 1,283 | | $ | 16.86 | | $ | 1,159 | | $ | 16.24 |
Total | | $ | 2,302 | | $ | 1,529 | | $ | 1,830 | | $ | 1,477 |
4. Inventories, net
At September 30, 2017 and December 31, 2016, inventories, net consisted of the following:
| | | | | | |
| | 2017 | | 2016 |
| | (in thousands) |
Stockpiles - underground mine | | $ | 809 | | $ | 84 |
Stockpiles - open pit mine | | | 53 | | | 288 |
Concentrates and doré | | | 1,249 | | | 1,881 |
Materials and supplies (1) | | | 7,779 | | | 6,693 |
Total | | $ | 9,890 | | $ | 8,946 |
| (1)
| | Net of reserve for obsolescence of $637 at September 30, 2017 and December 31, 2016.
|
5. Income Taxes
The Company recorded income tax expense of $3.1 million and $7.0 million for the three and nine months ended September 30, 2017, respectively. For the three and nine months ended September 30, 2016, the Company recorded income tax expense of $0.8 million and $6.5 million, respectively.
In 2015, the Mexican government approved a 2016 Federal Revenue Act that provides tax incentives, including tax credits on Mexican Excise Duty (a.k.a., IEPS), for the acquisition of combustible fossil fuels to be used in productive processes. The Company’s Mexican operations utilize a significant amount of diesel fuel for power generation that qualifies for such tax credits. These tax credits can be applied against income taxes payable, as well as other income tax withholdings during the year. In the three and nine months ended September 30, 2017, the Company recorded $1.0 million and $2.6 million, respectively, of fuel tax credits to offset production costs and such credits were applied against the income tax payable. During the three and nine months ended September 30, 2016, the Company recorded $0.6 million and $2.3 million, respectively, of fuel tax credits to offset production costs and such credits were applied against the income tax payable and other taxes payable.
The Company has asserted permanent reinvestment of all Mexico undistributed earnings as of September 30, 2017. The impact of the planned annual dividends for 2017, net of foreign tax credits, is reflected in the estimated annual effective tax rate. The Company’s annualized effective rate differs from the statutory rate primarily due to planned annual dividends from our Mexican subsidiary as well as differences in statutory rates for income and mining taxes in Mexico.
In assessing the realizability of deferred tax assets, management considers whether it is more likely than not that some portion or all of the deferred tax assets will not be realized. The ultimate realization of deferred tax assets is dependent upon the generation of future taxable income during the periods in which those temporary differencesamendments are available for deduction. Management considers the scheduled reversal of deferred tax liabilities (includingpermitted. We are currently evaluating the impact of available carryback and carryforward periods), projected future taxable income and tax-planning strategies in making this assessment. Except as noted in the following paragraph, as of September 30, 2017, the Company believes it has sufficient positive evidence to conclude that its federal and foreign deferred tax assets are more likely than not to be realized. The Company has determined that the realization of its state deferred tax assets is not more likely that not to be realized and has a valuation allowance offsetting its state deferred tax assets.
As a result of the adoption of ASU 2016-09 in the first quarter of 2017, excess tax benefits and tax deficiencies will be prospectively classified to the statement of operations instead of additional paid-in capital. Upon adoption, the Company recorded a $4.2 million deferred tax asset related to previously unrecognized foreign tax credits but placed a valuation allowance against the full amount of the deferred tax asset due to the Company’s assessment of the realizability of these foreign tax credits. Thus, no net impact to theupdate on our consolidated financial statements was generated as a result of adoption of ASU 2016-09. The Company's effective tax rate for the three and nine months ended September 30, 2017 was not materially impacted by the adoption of ASU 2016-09.
As of September 30, 2017, the Company believes that it has no liability for uncertain tax positions.
6. Prepaid Expenses and Other Current Assets
At September 30, 2017 and December 31, 2016, prepaid expenses and other current assets consisted of the following:
| | | | | | |
| | 2017 | | 2016 |
| | (in thousands) |
Advances to suppliers | | $ | 175 | | $ | 122 |
Prepaid insurance | | | 821 | | | 531 |
Vendor deposits | | | 245 | | | 218 |
IVA taxes receivable, net | | | 69 | | | 489 |
Other current assets | | | 512 | | | 227 |
Total | | $ | 1,822 | | $ | 1,587 |
disclosures.
Gold Resource Corporation—Condensed Consolidated Interim Financial Statements and Notes (Unaudited)
8
7. Property, Plant and Mine Development, net
At September 30, 2017 and December 31, 2016, property, plant and mine development, net consisted of the following:
3. Revenue
The Company derives its revenue from the sale of doré and concentrates. The following table presents the Company’s net sales for each period presented, disaggregated by source:
| | | | | | |
| | For the three months ended March 31, |
| | 2024 | | 2023 |
|
| | (in thousands) |
Doré sales, net | | | | | | |
Gold | | $ | 24 | | $ | 1,725 |
Silver | | | 1 | | | 69 |
Less: Refining charges | | | (6) | | | (25) |
Total doré sales, net | | | 19 | | | 1,769 |
Concentrate sales | | | | | | |
Gold | | | 7,399 | | | 10,622 |
Silver | | | 5,068 | | | 6,573 |
Copper | | | 2,241 | | | 2,994 |
Lead | | | 1,364 | | | 2,965 |
Zinc | | | 4,122 | | | 9,551 |
Less: Treatment and refining charges | | | (1,577) | | | (3,159) |
Total concentrate sales, net | | | 18,617 | | | 29,546 |
Realized gain - embedded derivative, net (1) | | | 23 | | | 634 |
Unrealized gain (loss) - embedded derivative, net | | | 43 | | | (721) |
Total sales, net | | $ | 18,702 | | $ | 31,228 |
| | | | | | |
| | 2017 | | 2016 |
| | (in thousands) |
Asset retirement costs | | $ | 637 | | $ | 637 |
Construction-in-progress | | | 8,670 | | | 586 |
Furniture and office equipment | | | 1,632 | | | 1,580 |
Land | | | 242 | | | 230 |
Light vehicles and other mobile equipment | | | 2,072 | | | 1,914 |
Machinery and equipment | | | 21,530 | | | 20,293 |
Mill facilities and infrastructure | | | 9,847 | | | 9,643 |
Mineral interests and mineral rights (1) | | | 17,658 | | | 19,413 |
Mine development | | | 53,825 | | | 42,951 |
Software and licenses | | | 1,678 | | | 1,624 |
Subtotal (2) | | | 117,791 | | | 98,871 |
Accumulated depreciation and amortization | | | (38,344) | | | (28,812) |
Total | | $ | 79,447 | | $ | 70,059 |
| (1) | (1)
| | DuringCopper, lead, and zinc are co-products. In the Realized (loss) gain - embedded derivative, net, there is $22 thousand gain and a $0.4 million gain, respectively, related to the co-products for the three months ended September 30, 2017, the Company revised its temporary bookMarch 31, 2024 and tax differences in the basis of its Isabella Pearl property, which resulted in a $4.2 million decrease in property, plant and mine development, net and a corresponding increase in deferred tax assets, net.
2023. |
| (2)
| | Includes accrued capital expenditures of $0.5 million and nil at September 30, 2017 and December 31, 2016, respectively.
|
The Company recorded depreciation and amortization expense of $3.9 million and $10.6 million for the three and nine months ended September 30, 2017, respectively. The Company recorded depreciation and amortization expense of $3.3 million and $9.3 million for the three and nine months ended September 30, 2016, respectively.
8. Accrued Expenses and Other Current Liabilities
At September 30, 2017 and December 31, 2016, accrued expenses and other current liabilities consisted of the following:
| | | | | | |
| | 2017 | | 2016 |
| | (in thousands) |
Accrued insurance | | $ | 433 | | $ | 381 |
Accrued royalty payments | | | 1,465 | | | 1,043 |
Dividends payable | | | 95 | | | 94 |
Other payables | | | 172 | | | 8 |
Total | | $ | 2,165 | | $ | 1,526 |
9. Reclamation and Remediation
The Company’s reclamation and remediation obligations primarily relate to the Aguila Project. 4. Inventories, net
At March 31, 2024 and December 31, 2023, inventories, net, consisted of the following:
| | | | | | |
| | As of | | As of |
| | March 31, | | December 31, |
| | 2024 | | 2023 |
|
| | (in thousands) |
Stockpiles - underground mine | | $ | 467 | | $ | 534 |
Concentrates | | | 2,669 | | | 1,768 |
Doré, net | | | 171 | | | 169 |
Subtotal - product inventories | | | 3,307 | | | 2,471 |
Materials and supplies (1) | | | 6,542 | | | 6,823 |
Total | | $ | 9,849 | | $ | 9,294 |
| (1) | Net of reserve for obsolescence of $0.5 million both as of March 31, 2024 and December 31, 2023. |
5. Income Taxes
The Company recorded an income tax benefit of $1.9 million for the three months ended March 31, 2024. For the three months ended March 31, 2023, the Company recorded an income tax benefit of $0.1 million. In accordance with applicable accounting rules, the interim provision for taxes is calculated using the estimated consolidated annual effective tax rate. The consolidated effective tax rate is a function of the combined effective tax rates for the jurisdictions in which the Company operates. Variations in the relative proportions of jurisdictional income could result in fluctuations to the Company’s consolidated effective tax rate. At the federal level, the Company’s income in the U.S. is taxed at 21%, and a
Gold Resource Corporation—Condensed Consolidated Interim Financial Statements and Notes (Unaudited)
9
5% withholding tax applies to dividends received from Mexico. Income in Mexico is taxed at 37.5% (30% income tax and 7.5% mining tax), and Canada’s income is taxed at 26.5%, which results in a consolidated effective tax rate above statutory U.S. Federal rates. The U.S. and Canadian jurisdictions do not currently generate taxable income.
Mexico Mining Taxation
Mining entities in Mexico are subject to two mining duties, in addition to the 30% Mexico corporate income tax: (i) a “special” mining duty of 7.5% of taxable income as defined under Mexican tax law (also referred to as “mining royalty tax”) on extraction activities performed by concession holders, and (ii) the “extraordinary” mining duty of 0.5% on gross revenue from the sale of gold, silver, and platinum. The mining royalty tax generally applies to earnings before income tax, depreciation, depletion, amortization, and interest. In calculating the mining royalty tax, there are no corporate deductions related to depreciable costs from operational fixed assets. However, prospecting and exploration expenses are amortized using a 10% rate in a 10-year straight line. Both duties are tax deductible for income tax purposes. As a result, our effective tax rate applicable to the Company’s Mexican operations is higher than Mexico’s statutory rate.
The Company periodically transfers funds from its Mexican wholly owned subsidiary to the U.S. as dividends, which are subject to a 10% Mexico withholding tax, unless otherwise provided per a tax treaty. The current U.S.-Mexico tax treaty limits the dividend withholding tax between these countries to 5%, as long as specific requirements are met. Based on the Company’s understanding that it meets these requirements, the Company pays a 5% withholding tax on dividends paid from Mexico. The estimated annual effective tax rate reflects the impact of the planned annual dividends for 2023. As of March 31, 2024, the Company recorded a $0.1 million deferred tax liability related to the 5% withholding tax on funds available for transfer to the U.S. as dividends in the future are no longer deemed to be permanently reinvested in Mexico. If these funds are distributed to the U.S. from Mexico in the future, at that time, they will be subject to the 5% dividend withholding tax payment upon distribution.
In October 2023, the Company received a notification from the Mexican Tax Administration Services (“SAT”) with a sanction of 331 million pesos (approximately $19.9 million) as the result of a 2015 tax audit that began in 2021. The 2015 tax audit performed by SAT encompassed various tax aspects, including but not limited to intercompany transactions, mining royalty tax, and extraordinary mining tax. Management is in process of disputing this tax notification and sent a letter of protest to the tax authorities along with providing all requested documentation. Management intends to pursue legal avenues of protest, including filing a lawsuit with the Mexico court system, if necessary, to ensure that these adjustments are removed. Management believes the position taken on the 2015 income tax return meets the more likely than not threshold and that as of March 31, 2024 and December 31, 2023, the Company has no liability for uncertain tax positions. If the Company were to determine there was an unrecognized tax benefit, the Company would recognize the liability and related interest and penalties within income tax (benefit) provision.
6. Prepaid Expenses and Other Current Assets
At March 31, 2024 and December 31, 2023, prepaid expenses and other current assets consisted of the following:
| | | | | | |
| | As of | | As of |
| | March 31, | | December 31, |
| | 2024 | | 2023 |
|
| | (in thousands) |
Advances to suppliers | | $ | 148 | | $ | 266 |
Prepaid insurance | | | 487 | | | 1,103 |
Prepaid income tax | | | 4,651 | | | 4,589 |
Other current assets | | | 747 | | | 654 |
Total | | $ | 6,033 | | $ | 6,612 |
Prepaid income tax
Mexican tax statutes specify that the current year tax prepayments be calculated based on a coefficient for prior year earnings, regardless of current year results. Starting in the third quarter of each year, these same statutes allow companies
Gold Resource Corporation—Condensed Consolidated Interim Financial Statements and Notes (Unaudited)
10
to request a reduction of the coefficient, which adjusts for losses experienced in the current year. During 2023, DDGM had to prepay approximately $76 million pesos ($5 million) despite of the losses for the year. In 2024, these overpayments can be used to offset the required 2024 tax prepayments, and as a result, no income tax payments are expected in 2024.
Other current assets
A value added (“IVA”) tax in Mexico is assessed on the sales of products and purchases of materials and services. Businesses owe IVA taxes as the business sells a product and collects IVA taxes from its customers. Likewise, businesses are generally entitled to recover the taxes they have paid related to purchases of materials and services, either as a refund or credit to IVA tax payable. Amounts recorded as IVA taxes in the consolidated financial statements represent the net estimated IVA tax payable or receivable, since there is a legal right of offset of IVA taxes. As of March 31, 2024, this resulted in an asset balance of $0.3 million, included in Other current assets.
7. Property, Plant, and Mine Development, net
At March 31, 2024 and December 31, 2023, Property, Plant, and Mine Development, net consisted of the following:
| | | | | | |
| | As of | | As of |
| | March 31, | | December 31, |
| | 2024 | | 2023 |
|
| | (in thousands) |
Asset retirement costs (“ARO asset”) | | $ | 6,227 | | $ | 6,227 |
Construction-in-progress | | | 429 | | | 243 |
Furniture and office equipment | | | 1,783 | | | 1,781 |
Land | | | 9,033 | | | 9,033 |
Mineral interest | | | 79,543 | | | 79,543 |
Light vehicles and other mobile equipment | | | 2,118 | | | 2,126 |
Machinery and equipment | | | 42,981 | | | 42,887 |
Mill facilities and infrastructure | | | 36,396 | | | 36,396 |
Mine development | | | 117,023 | | | 115,230 |
Software and licenses | | | 1,554 | | | 1,554 |
Subtotal | | | 297,087 | | | 295,020 |
Accumulated depreciation and amortization | | | (161,312) | | | (156,394) |
Total | | $ | 135,775 | | $ | 138,626 |
The Company recorded depreciation and amortization expense of $4.2 million and $7.3 million for the three months ended March 31, 2024 and 2023, respectively.
8. Other Non-current Assets
At March 31, 2024 and December 31, 2023, other non-current assets consisted of the following:
| | | | | | |
| | As of | | As of |
| | March 31, | | December 31, |
| | 2024 | | 2023 |
|
| | (in thousands) |
Investment in Maritime | | $ | 1,909 | | $ | 1,596 |
Investment in Green Light Metals | | | 3,618 | | | 3,698 |
Other non-current assets | | | 142 | | | 170 |
Total | | $ | 5,669 | | $ | 5,464 |
Gold Resource Corporation—Condensed Consolidated Interim Financial Statements and Notes (Unaudited)
11
Investment in Maritime
On September 22, 2022, the Company invested 2.4 million Canadian Dollar (“C$”) (or $1.7 million) in the common shares of Maritime Resources Corp; the 47 million shares purchased represented 9.9% of the issued and outstanding shares of Maritime. As of March 31, 2024, the shares owned represent 7.9% of the issued and outstanding common shares of Maritime. As of March 31, 2024 and December 31, 2023, the fair value of the investment was $1.9 and $1.6 million, respectively.
Investment in Green Light Metals
On December 28, 2022, Gold Resource Corporation received 12.25 million common shares of Green Light Metals as a settlement for a promissory note receivable acquired with the Aquila Resources Inc. (“Aquila”) acquisition. This represented approximately 28.5% ownership in Green Light Metals at the time. As of March 31, 2024 and December 31, 2023, the fair value of this equity investment was $3.6 million and $3.7 million, respectively.
9. Accrued Expenses and Other Liabilities
At March 31, 2024 and December 31, 2023, accrued expenses and other liabilities consisted of the following:
| | | | | | |
| | As of | | As of |
| | March 31, | | December 31, |
| | 2024 | | 2023 |
|
| | (in thousands) |
Accrued royalty payments | | $ | 732 | | $ | 726 |
Share-based compensation liability - current | | | 72 | | | 67 |
Employee profit sharing obligation | | | 67 | | | 67 |
Other payables | | | 684 | | | 888 |
Total accrued expenses and other current liabilities | | $ | 1,555 | | $ | 1,748 |
| | | | | | |
Accrued non-current labor obligation | | $ | 1,504 | | $ | 1,167 |
Share-based compensation liability | | | 339 | | | 320 |
Other long-term liabilities | | | 8 | | | 29 |
Total other non-current liabilities | | $ | 1,851 | | $ | 1,516 |
10. Gold and Silver Stream Agreements
The following table presents the Company’s liabilities related to the Company’s Gold and Silver Stream Agreements with Osisko Bermuda Limited (“OBL”), a wholly owned subsidiary of Osisko Gold Royalties Ltd (TSX & NYSE: OR), as of March 31, 2024 and December 31, 2023:
| | | | | | |
| | As of | | As of |
| | March 31, | | December 31, |
| | 2024 | | 2023 |
|
| | (in thousands) |
Liability related to the Gold Stream Agreement | | $ | 21,553 | | $ | 21,002 |
Liability related to the Silver Stream Agreement | | | 24,788 | | | 23,930 |
Total liability | | $ | 46,341 | | $ | 44,932 |
Periodic interest expense is incurred based on an implied interest rate. The implied interest rate is determined based on the timing and probability of future production and a 6% discount rate. Interest expense is recorded to the Condensed Consolidated Statements of Operations and the gold and silver stream agreement liability on the Condensed Consolidated Interim Balance Sheets.
Gold Resource Corporation—Condensed Consolidated Interim Financial Statements and Notes (Unaudited)
12
The stream agreements contain customary provisions regarding default and security. In the event that our subsidiary defaults under the stream agreements, including by failing to achieve commercial production by an agreed upon date, it may be required to repay the deposit plus accumulated interest at a rate agreed with OBL. If the Company fails to do so, OBL may elect to enforce its remedies as a secured party and take possession of the assets that comprise the Back Forty Project.
Gold Streaming Agreement
In November 2017, Aquila entered into a stream agreement with OBL, pursuant to which OBL agreed to commit approximately $55 million to Aquila through a gold stream purchase agreement. In June 2020, Aquila amended its agreement with OBL, reducing the total committed amount to $50 million, as well as adjusting certain milestone dates under the gold stream to align with the current project development timeline. Aquila had received a total of $20 million of the committed funds at the time of the Gold Resource Corporation acquisition. Remaining deposits from OBL are $5 million upon receipt of permits required for the development and operation of the Back Forty Project and $25 million upon the first drawdown of an appropriate project debt finance facility. OBL has been provided a general security agreement over the Back Forty Project, which consists of the subsidiaries of Gold Resource Acquisition Sub. Inc., a 100% owned subsidiary of Gold Resource Corporation. The initial term of the agreement is for 40 years, automatically renewable for successive ten-year periods. The agreement is subject to certain operating and financial covenants, which are in good standing as of March 31, 2024. In March 2024, the Company secured an amendment to the stream agreement that deferred the required completion of certain operational milestones related to permitting from 2024 to 2026.
The $20 million received from OBL through March 31, 2024 is shown as a long-term liability on the Condensed Consolidated Interim Balance Sheets, along with an implied interest. The implied interest rate is applied on the OBL advance payments and calculated on the total expected life-of-mine production to be deliverable using an estimated gold price and a discount rate of 6%. As the remaining $30 million deposit is subject to the completion of specific milestones and the satisfaction of certain other conditions, this amount is not reflected on the Condensed Consolidated Interim Balance Sheets.
Per the terms of the gold stream agreement, OBL will purchase 18.5% of the refined gold from Back Forty (the “Threshold Stream Percentage”) until the Company has delivered 105,000 ounces of gold (the “Production Threshold”). Upon satisfaction of the Production Threshold, the Threshold Stream Percentage will be reduced to 9.25% of the refined gold (the “Tail Stream”). In exchange for the refined gold delivered under the Stream Agreement, OBL will pay the Company ongoing payments equal to 30% of the spot price of gold on the day of delivery, subject to a maximum payment of $600 per ounce. Where the market price of gold is greater than the price paid, the difference realized from the sale of the gold will be applied against the deposit received from OBL. Please see Note 12—Commitments and Contingencies in Item 1—Condensed Consolidated Interim Financial Statements and Notes (unaudited) for additional information.
Silver Stream Agreement
Through a series of contracts, Aquila executed a silver stream agreement with OBL to purchase 85% of the silver produced and sold at the Back Forty Project. A total of $17.2 million has been advanced under the agreement as of March 31, 2024. There are no future deposits remaining under the agreement. The initial term of the agreement is for 40 years, automatically renewable for successive ten-year periods. The agreement is subject to certain operating and financial covenants, which are in good standing as of March 31, 2024. In March 2024, the Company secured an amendment to the stream agreement that deferred the required completion of certain operational milestones related to permitting from 2024 to 2026.
Per the terms of the silver stream agreement, OBL will purchase 85% of the silver produced from the Back Forty Project at a fixed price of $4 per ounce of silver. Where the market price of silver is greater than $4 per ounce, the difference realized from the sale of the silver will be applied against the deposit received from Osisko.
The $17.2 million received from OBL through March 31, 2024 is shown as a long-term liability on the Condensed Consolidated Interim Balance Sheets and includes an implied interest rate. The implied interest rate is applied on the OBL advance payments and calculated on the total expected life-of-mine production to be deliverable using an estimated silver
Gold Resource Corporation—Condensed Consolidated Interim Financial Statements and Notes (Unaudited)
13
price and a discount rate of 6%. Please see Note 12—Commitments and Contingencies in Item 1—Condensed Consolidated Interim Financial Statements and Notes (unaudited) for additional information.
11. Reclamation and Remediation
The following table presents the changes in reclamation and remediation obligations for the ninethree months ended September 30, 2017March 31, 2024 and the year ended December 31, 2016:2023:
| | | | | | |
| | 2017 | | 2016 |
| | (in thousands) |
Reclamation liabilities – balance at beginning of period | | $ | 1,907 | | $ | 2,192 |
Changes in estimate | | | 10 | | | 82 |
Foreign currency exchange loss (gain) | | | 249 | | | (367) |
Reclamation liabilities – balance at end of period | | | 2,166 | | | 1,907 |
| | | | | | |
Asset retirement obligation – balance at beginning of period | | | 518 | | | 623 |
Changes in estimate | | | - | | | (21) |
Accretion expense | | | 35 | | | 23 |
Foreign currency exchange loss (gain) | | | 71 | | | (107) |
Asset retirement obligation – balance at end of period | | | 624 | | | 518 |
Total period end balance | | $ | 2,790 | | $ | 2,425 |
| | | | | | |
| | 2024 | | 2023 |
|
| | (in thousands) |
Reclamation liabilities – balance at beginning of period | | $ | 2,233 | | $ | 1,949 |
Foreign currency exchange loss | | | 29 | | | 284 |
Reclamation liabilities – balance at end of period | | | 2,262 | | | 2,233 |
| | | | | | |
Asset retirement obligation – balance at beginning of period (1) | | | 9,562 | | | 8,417 |
Changes in estimate (1) | | | - | | | (1,221) |
Liability for Aquila drillhole capping | | | - | | | 404 |
Accretion | | | 181 | | | 689 |
Foreign currency exchange loss | | | 123 | | | 1,273 |
Asset retirement obligation – balance at end of period | | | 9,866 | | | 9,562 |
Total period end balance | | $ | 12,128 | | $ | 11,795 |
| (1) | In 2023, the Company updated its closure plan study, which resulted in a $1.2 million decrease in the estimated liability and asset retirement costs. |
10. Loan Payable
On August 8, 2017,The Company’s undiscounted reclamation liabilities of $2.3 million and $2.2 million as of March 31, 2024 and December 31, 2023, respectively, are related to the Don David Gold Mine in Mexico. These represent reclamation liabilities that were expensed through 2013 before proven and probable reserves were established and the Company entered intowas considered to be a 48-month loan agreementdevelopment stage entity; therefore, most of the costs, including asset retirement costs, were not allowed to be capitalized as part of our property, plant, and mine development.
The Company’s asset retirement obligations reflect the additions to the asset for reclamation and remediation costs in the amountProperty, Plant, and Mine Development, post-2013 development stage status, which are discounted using a credit adjusted risk-free rate of $2.4 million for the purchase of certain equipment. The loan bears annual interest of 4.48%, is secured by the equipment, and requires monthly principal and interest payments of $0.05 million.8%. As of September 30, 2017, there is an outstanding balance of $2.4 million. Scheduled minimum repayments are $0.2March 31, 2024 and December 31, 2023, the Company’s asset retirement obligation was $9.9 million and $9.6 million, respectively, primarily related to the Don David Gold Mine in 2017, $0.6 million in 2018, $0.6 million in 2019, $0.6 million in 2020, and $0.4 million in 2021. The Company is subject to a repayment penalty, ranging from 1% to 3% of the outstanding loan balance at time of full repayment, depending of time of repayment. Mexico.
11.12. Commitments and Contingencies
Commitments
As of September 30, 2017,March 31, 2024 and December 31, 2023, the Company had outstanding cancellablehas equipment purchase contracts totaling $7.2 million. The contracts require payments during the equipment construction periods and the Company is required to reimburse the vendors for all costs up to the cancellation date, if cancelled.
12. Shareholders’ Equity
The Company declared and paidcommitments of approximately $0.9 million and $0.8 million, of dividends duringrespectively.
Contingent Consideration
With the nine months ended September 30, 2017 and 2016, respectively. On October 26, 2017, the Board of Directors declared a dividend on common stock totaling $0.1 million payable in November 2017.
On January 6, 2017,Aquila acquisition, the Company issued 59,642assumed a contingent consideration. On December 30, 2013, Aquila’s shareholders approved the acquisition of 100% of the shares of common stock as partialHudBay Michigan Inc. (“HMI”), a subsidiary of HudBay Minerals Inc. (“HudBay”), effectively giving Aquila 100% ownership in the Back Forty Project (the “HMI Acquisition”). Pursuant to the HMI Acquisition, HudBay’s 51% interest in the Back Forty Project was acquired in consideration for additional mineral rights for its Isabella Pearl project. At the time of issuance, the shares were valued at $5.03 per share, for an aggregate value of $0.3 million.
On January 17, 2017, the Company issued 186,568 shares of common stock as partial consideration for mineral rights at the East Camp Douglas property. At the time of issuance, the shares were valued at $5.36 per share, for an aggregate value of $1.0 million.
13. Equity Incentive Plans
The Company maintains an Equity Incentive Plan (“Incentive Plan”) that provides for the issuance of up to 5 millioncommon shares of common stock (plus additional shares that are terminated or forfeited underAquila, future milestone payments tied to the previous equity plan)development of the Back Forty Project and a 1% net smelter return royalty on production from certain land parcels in the formproject. The issuance of stock-based awards. The Incentive Plan was adopted in April 2016shares and became effective in June 2016 and replaced1% net smelter obligations were settled before the Amended and Restated Stock Option and Stock Grant Plan.
Company acquired Aquila.
10Gold Resource Corporation—Condensed Consolidated Interim Financial Statements and Notes (Unaudited)
14
During the nine months ended September 30, 2017, a total of 78,400 restricted stock units (“RSUs”) vested and shares were issued with an intrinsic value $0.3 million and a fair value of $0.4 million.
A total of 341,000 options with a term of 10 years were granted during the nine months ended September 30, 2017, of which 37,000 vested immediately and the remainder vest over a three year period. A total of 105,945 restricted stock units were granted during the nine months ended September 30, 2017, of which 14,964 vest within six months and the remainder vest over a three year period.
Stock-based compensation expense for stock options and RSUs is as follows:
| | | | | | | | | | | | |
| | Three months ended September 30, | | Nine months ended September 30, |
| | 2017 | | 2016 | | 2017 | | 2016 |
| | (in thousands) |
Stock options | | $ | 361 | | $ | 410 | | $ | 625 | | $ | 896 |
Restricted stock units | | | 133 | | | 101 | | | 252 | | | 101 |
Total | | $ | 494 | | $ | 511 | | $ | 877 | | $ | 997 |
Total stock-based compensation related to stock options and RSUs has been allocated between production costs, general and administrative expenses, and exploration expense as follows:
| | | | | | | | | | | | |
| | Three months ended September 30, | | Nine months ended September 30, |
| | 2017 | | 2016 | | 2017 | | 2016 |
| | (in thousands) |
Production costs | | $ | 37 | | $ | 55 | | $ | 66 | | $ | 172 |
General and administrative expenses | | | 429 | | | 450 | | | 769 | | | 819 |
Exploration expense | | | 28 | | | 6 | | | 42 | | | 6 |
Total | | $ | 494 | | $ | 511 | | $ | 877 | | $ | 997 |
The contingent consideration is composed of the following:
The value of future installments is based on C$9 million tied to the development of the Back Forty project as follows:
| a. | C$3 million payable on completion of any form of financing for purposes including the commencement of construction of Back Forty, up to 50% of the C$3 million can be paid, at the Company’s option in Gold Resource Corporation shares with the balance payable in cash; |
| b. | C$2 million payable in cash 90 days after the commencement of commercial production; |
| c. | C$2 million payable in cash 270 days after the commencement of commercial production, and; |
| a. | C$2 million payable in cash 450 days after the commencement of commercial production. |
Initially, the Company intended to pay the first C$3 million in 2023 to prevent HudBay’s 51% buy-back option in the Back Forty Project. Management later decided that it was more likely than not that HudBay would not exercise its buy-back option, and consequently, this amount was not paid. Additionally, since financing of the project is not expected in 2024, this liability was reclassified to long-term. As of the end of January 2024, by the contractual deadline, HudBay did not exercise its buy-back option, and thus, it is forfeited.
The total value of the contingent consideration as of March 31, 2024 and December 31, 2023 was $3.6 million and $3.5 million, respectively. The contingent consideration is adjusted for the time value of money and the likelihood of the milestone payments. Any future change in the value of the contingent consideration is recognized in other expense, net, in the Condensed Consolidated Statements of Operations.
The following table shows the change in the balance of the contingent consideration for the three months ended March 31, 2024 and the year ended December 31, 2023:
| | | | | | |
| | 2024 | | 2023 |
|
| | (in thousands) |
Beginning Balance of contingent consideration: | | | | | | |
Current contingent consideration | | $ | - | | $ | 2,211 |
Non-current contingent consideration | | | 3,548 | | | 2,179 |
| | $ | 3,548 | | $ | 4,390 |
| | | | | | |
Change in value of contingent consideration - Current | | | - | | | (2,211) |
Change in value of contingent consideration - Non-current | | | 50 | | | 1,369 |
| | | | | | |
Ending Balance of contingent consideration: | | | | | | |
Current contingent consideration | | $ | - | | $ | - |
Non-current contingent consideration | | | 3,598 | | | 3,548 |
| | $ | 3,598 | | $ | 3,548 |
Other Contingencies
The Company has certain other contingencies resulting from litigation, claims, and other commitments and is subject to various environmental and safety laws and regulations incident to the ordinary course of business. The Company currently has no basis to conclude that any or all of such contingencies will materially affect its financial position, results of operations, or cash flows. However, in the future, there may be changes to these contingencies, or additional contingencies may occur, any of which might result in an accrual or a change in current accruals recorded by the Company. There can be no assurance that the ultimate disposition of contingencies will not have a material adverse effect on the Company’s financial position, results of operations, or cash flows.
With the acquisition of Aquila Resources Inc. on December 10, 2021, the Company assumed substantial liabilities that relate to the gold and silver stream agreements with OBL. Under the agreements, OBL deposited a total of $37.2 million upfront in exchange for a portion of the future gold and silver production from the Back Forty Project. The stream agreements contain customary provisions regarding default and security. In the event that our subsidiary defaults under the stream agreements, including failing to achieve commercial production at a future date, it may be required to repay the
11Gold Resource Corporation—Condensed Consolidated Interim Financial Statements and Notes (Unaudited)
15
deposit plus accumulated interest at a rate agreed with OBL. If it fails to do so, OBL may be entitled to enforce its remedies as a secured party and take possession of the assets that comprise the Back Forty Project.
13. Shareholders’ Equity
The Company’s At-The-Market Offering Agreement with H.C. Wainwright & Co., LLC (the “Agent”), which was entered into in November 2019 (the “ATM Agreement”), pursuant to which the Agent agreed to act as the Company’s sales agent with respect to the offer and sale from time to time of the Company’s common stock having an aggregate gross sales price of up to $75.0 million, was renewed in June 2023. During both the three months ended March 31, 2024 and 2023, there were no shares of the Company’s common stock sold through the ATM Agreement. Subsequent to end of the first quarter, through May 2, 2024, an aggregate of 1,977,401 shares of the Company’s common stock were sold and settled through the ATM Agreement for net proceeds to the Company of $1.1 million, after deducting the Agent’s commissions and other expenses.
14. Derivatives
Embedded Derivatives
Concentrate Sales
Concentrate sales contracts contain embedded derivatives due to the provisional pricing terms for unsettled shipments.shipments pending final settlement. At the end of each reporting period, the Company records an adjustment to accounts receivable and revenuesales to reflect the mark-to-market adjustments for outstanding provisional invoices based on forward metal forward prices. Please see Note 17Note—19 Fair Value Measurement in Item 1—Condensed Consolidated Interim Financial Statements and Notes (unaudited) for additional information.
information on the realized and unrealized gain (loss) recorded to adjust accounts receivable and revenue.
The following table summarizes the Company’s unsettled sales contracts at September 30, 2017March 31, 2024 with the quantities of metals under contract subject to final pricing occurringexpected to occur through November 2017:June 2024:
| | | | | | | | | | | | | | | | |
| | | Gold | | | Silver | | | Copper | | | Lead | | | Zinc | |
| | | (ounces) | | | (ounces) | | | (tonnes) | | | (tonnes) | | | (tonnes) | |
| | | | | | | | | | | | | | | | | | | |
| | | Gold | | Silver | | Copper | | Lead | | Zinc | | | Total |
| | | (ounces) | | (ounces) | | (tonnes) | | (tonnes) | | (tonnes) | | | |
Under contract | | | 6,728 | | | 512,105 | | | 477 | | | 1,565 | | | 6,717 | | | 3,947 | | | 276,297 | | | 263 | | | 1,425 | | | 1,771 | | | |
Average forward (price per ounce or tonne) | | $ | 1,283 | | $ | 17.05 | | $ | 6,133 | | $ | 2,296 | | $ | 2,824 | |
Average forward price (per ounce or tonne) | | | $ | 2,070 | | $ | 23.37 | | $ | 8,518 | | $ | 2,069 | | $ | 2,453 | | | |
Unsettled sales contracts value (in thousands) | | | $ | 8,170 | | $ | 6,457 | | $ | 2,240 | | $ | 2,948 | | $ | 4,344 | | $ | 24,159 |
The Company manages credit risk by entering into arrangements with counterparties believed to be financially strong, and by requiring other credit risk mitigants, as appropriate. The Company actively evaluates the implicit creditworthiness of its counterparties, and monitors credit exposures.
15. Other Expense (Income)Employee Benefits
Effective October 2012, the Company adopted a profit-sharing plan (the “Plan”), net
Other expense (income), net, consistedwhich covers all U.S. employees. The Plan meets the requirements of a qualified retirement plan pursuant to the provisions of Section 401(k) of the following:Internal Revenue Code. The Plan also allows eligible employees to make tax deferred contributions to a retirement trust account up to 90% of their qualified wages, subject to the IRS annual maximums.
On April 23, 2021, a decree that reforms labor outsourcing in Mexico was published in the Federation’s Official Gazette. This decree amended the outsourcing provisions, whereby operating companies can no longer source their labor resources used to carry out the core business functions from service entities or third-party providers. Under Mexican law, employees are entitled to receive statutory profit sharing (Participacion a los Trabajadores de las Utilidades or “PTU”) payments. The required cash payment to employees in the aggregate is equal to 10% of their employer’s profit subject to
Gold Resource Corporation—Condensed Consolidated Interim Financial Statements and Notes (Unaudited)
16
PTU, which differs from profit determined under U.S. GAAP. Please see Note 9—Accrued Expenses and Other Liabilitiesin Item 1—Condensed Consolidated Interim Financial Statements and Notes (unaudited) for additional information.
16. Stock-Based Compensation
The Company’s compensation program comprises three main elements: (1) base salary, (2) an annual short-term incentive plan (“STIP”) award which may be in the form of cash or Deferred Share Units (“DSUs”) with immediate vesting, and (3) long-term equity-based incentive compensation (“LTIP”) in the form of Performance Share Units (“PSUs”), Restricted Share Units (“RSUs”), and stock options.
| | | | | | | | | | | | |
| | Three months ended September 30, | | Nine months ended September 30, |
| | 2017 | | 2016 | | 2017 | | 2016 |
| | (in thousands) |
Unrealized currency exchange loss | | $ | 165 | | $ | 259 | | $ | 138 | | $ | 57 |
Realized currency exchange (gain) loss | | | (111) | | | (44) | | | 882 | | | (183) |
Unrealized gain from gold and silver rounds/bullion, net (1) | | | (111) | | | (93) | | | (267) | | | (925) |
Loss (gain) from sale of investments, net (1) | | | - | | | 49 | | | - | | | (351) |
Loss on disposal of fixed assets | | | 163 | | | 9 | | | 462 | | | 523 |
Gain on insurance reimbursement | | | - | | | - | | | - | | | (620) |
Write down of materials and supplies inventory | | | - | | | - | | | - | | | 102 |
Other expense (income) | | | 4 | | | (106) | | | (32) | | | 227 |
Total | | $ | 110 | | $ | 74 | | $ | 1,183 | | $ | (1,170) |
The Gold Resource Corporation 2016 Equity Incentive Plan (the “Incentive Plan”) allows for the issuance of up to 5 million shares of common stock in the form of incentive and non-qualified stock options, stock appreciation rights, RSUs, stock grants, stock units, performance shares, PSUs, and DSUs.
The Company’s STIP for its management team provides annual award, which may be settled as a cash payable through the issuance of fully vested equity awards (such as fully vested stock grants or DSUs), or a combination of cash and stock awards (DSUs), upon achievement of specified performance metrics. As of March 31, 2024, the Company has a $0.8 million liability accrued for the 2023 and 2024 bonuses.
No stock options were granted, exercised, or forfeited during the three months ended March 31, 2024 and 2023.
No RSUs were granted during the three months ended March 31, 2024. RSUs of 612,059 were granted during the three months ended March 31, 2023. During the three months ended March 31, 2024, a total of 294,993 RSUs vested, for which 96,436 common shares were issued, with a fair value of $31,091. During the three months ended March 31, 2024, RSUs of 64,300 were withheld for taxes due to net settlement, and 134,257 RSUs were deferred. During the three months ended March 31, 2023, a total of 195,525 RSUs vested, from which 88,570 RSUs were redeemed, issuing 70,433 common shares with a fair value of $61,981. During the three months ended March 31, 2023, RSUs of 106,955 were deferred.
No PSUs were granted during the three months ended March 31, 2024. PSUs of 534,890 were granted during the three months ended March 31, 2023. PSUs cliff vest usually in three years based on the relative and absolute total shareholder return of a predetermined peer group and are expected to be settled in cash. During the three months ended March 31, 2024, 201,258 PSUs were paid out in cash of $0.1 million. No PSUs were paid out during the three months ended March 31, 2023.
During the three months ended March 31, 2024, no PSUs were forfeited due to employee terminations. There were 38,269 PSUs forfeitures during the same period in 2023. As of March 31, 2024 and 2023, the current liability balances related to PSUs were $0.1 million and $0.2 million, respectively, and the non-current liability balances related to PSUs were $0.1 million and $0.1 million, respectively.
DSUs of nil and 278,663, respectively, were granted to the Board of Directors during the three months ended March 31, 2024 and 2023, respectively. DSUs are vested immediately and redeemable in cash or shares at the earliest of 10 years or upon the eligible directors’ termination. Termination is deemed to occur on the earliest of: (1) the date of voluntary resignation or retirement of the director from the Board; (2) the date of death of the director; or (3) the date of removal of the director from the Board whether by shareholder resolution, failure to achieve re-election, or otherwise; and on which date the director is not a director or employee of the Company or any of its affiliates. These awards contain a cash settlement feature and are therefore classified as a liability and are marked to market each reporting period.
The Company may also issue DSUs for directors in lieu of board fees at their request. During the three months ended March 31, 2024 and 2023 DSUs of 64,584 and 13,649, respectively, were granted in lieu of board fees that are also subject to mark-to-market adjustment. During the three months ended March 31, 2024 and 2023, DSUs of nil and 212,407, respectively, were granted in lieu of executive bonuses. There were no DSU redemptions during the three months ended March 31, 2024 and 2023.
Gold Resource Corporation—Condensed Consolidated Interim Financial Statements and Notes (Unaudited)
17
| (1)
| | Gains and losses due to changes in the fair value are non-cash in nature until such time that they are realized through cash transactions. For additional information regarding the fair value measurements and investments, please see Note 17.
|
As of March 31, 2024 and 2023, the non-current liability balances related to DSUs were $0.3 million and $0.9 million, respectively. For the three months ended March 31, 2024, the changes in liabilities related to DSUs resulted in $0.1 million and $0.4 million, respectively, to stock-based compensation expense, respectively.
Stock-based compensation expense for the periods presented is as follows:
| | | | | |
| For the three months ended March 31, |
| 2024 | | 2023 |
|
| (in thousands) |
Stock options | $ | 22 | | $ | 120 |
Restricted stock units | | 106 | | | 153 |
Performance stock units | | 34 | | | (33) |
Deferred stock units | | 57 | | | 357 |
Total | $ | 219 | | $ | 597 |
16.
17. Other Expense, net
Other expense, net, for the periods presented consisted of the following:
| | | | | | |
| | For the three months ended March 31, |
| | 2024 | | 2023 |
|
| | (in thousands) |
Unrealized currency exchange (gain) loss (1) | | $ | (54) | | $ | 453 |
Realized currency exchange loss | | | 103 | | | 176 |
Realized and unrealized gain from gold and silver rounds, net | | | (8) | | | (9) |
Interest on streaming liabilities | | | 1,409 | | | 274 |
Severance | | | 359 | | | 610 |
Other (income) | | | (294) | | | (35) |
Total | | $ | 1,515 | | $ | 1,469 |
| (1) | Gains and losses due to changes in fair value are non-cash in nature until such time that they are realized through cash transactions. For additional information regarding the Company’s fair value measurements and investments, please see Note 19—Fair Value Measurement in Item 1—Condensed Consolidated Interim Financial Statements and Notes (unaudited) for additional information. |
18. Net IncomeLoss per Common Share
Basic earningsnet income per common share is calculated based on the weighted average number of common shares outstanding for the period. Diluted earnings per common share isare calculated based on the assumption that stock options and other dilutive securities outstanding, which have an exercise price less than the average market price of the Company’s common shares during the period, would have been exercised on the later of the beginning of the period or the date granted and that the funds obtained from the exercise were used to purchase common shares at the average market price during the period. All of the Company’s restricted stock unitsRSUs are consideredanti-dilutive due to the Company’s net loss for the period. Since PSUs and DSUs are expected to be dilutive.
cash settled, they are not included in the dilutive calculation.
The effect of the Company’s dilutive securities is calculated using the treasury stock method, and only those instruments that result in a reduction in net income per common share are included in the calculation. Options to purchase 3.1 million and 3.70.8 million shares of common stock at weighted average exercise pricesprice of $11.44 and $10.32$2.99 were outstanding as of March 31, 2024, but had no dilutive effect due to the net loss for the period. Options to purchase 1.5 million shares of common stock at September 30, 2017 and 2016, respectively, but were not included in the computation of diluteda weighted average common shares outstanding, as the exercise price of $2.90 were outstanding as of March 31, 2023 but had no dilutive effect due to the options exceedednet loss for the average price of the Company’s common stock during those periods, and therefore are anti-dilutive.
period.
12Gold Resource Corporation—Condensed Consolidated Interim Financial Statements and Notes (Unaudited)
18
Basic and diluted net income per common share is calculated as follows:
| | | | | |
| For the three months ended |
| March 31, |
| 2024 | | 2023 |
Numerator: | | | | | |
Net loss (in thousands) | $ | (4,021) | | $ | (1,035) |
| | | | | |
Denominator: | | | | | |
Basic and diluted weighted average common shares outstanding | | 88,707,430 | | | 88,405,935 |
| | | | | |
Basic and diluted net loss per common share | $ | (0.05) | | $ | (0.01) |
| | | | | | | | | | | | |
| | Three months ended September 30, | | Nine months ended September 30, |
| | 2017 | | 2016 | | 2017 | | 2016 |
| | |
Net income (in thousands) | | $ | 4,581 | | $ | 1,594 | | $ | 9,821 | | $ | 7,999 |
Basic weighted average shares of common stock outstanding | | | 56,888,115 | | | 55,781,382 | | | 56,841,897 | | | 54,994,430 |
Dilutive effect of stock-based awards | | | 567,690 | | | 1,816,010 | | | 775,133 | | | 594,877 |
Diluted weighted average common shares outstanding | | | 57,455,805 | | | 57,597,392 | | | 57,617,030 | | | 55,589,307 |
Net income per share: | | | | | | | | | | | | |
Basic | | $ | 0.08 | | $ | 0.03 | | $ | 0.17 | | $ | 0.15 |
Diluted | | $ | 0.08 | | $ | 0.03 | | $ | 0.17 | | $ | 0.14 |
17.
19. Fair Value Measurement
Fair value accounting establishes a fair value hierarchy that prioritizes the inputs to valuation techniques used to measure fair value. The hierarchy gives the highest priority to unadjusted quoted prices in active markets for identical assets or liabilities (Level 1 measurements) and the lowest priority to unobservable inputs (Level 3 measurements). The three levels of the fair value hierarchy are described below:
Level 1Unadjusted quoted prices in active markets that are accessible at the measurement date for identical, unrestricted assets or liabilities;
Level 2Quoted prices in markets that are not active, or inputs that are observable, either directly or indirectly, for substantially the full term of the asset or liability; and
Level 3Prices or valuation techniques that require inputs that are both significant to the fair value measurement and unobservable (supported by little or no market activity).
Level 1 | Unadjusted quoted prices in active markets that are accessible at the measurement date for identical, unrestricted assets or liabilities; |
Level 2 | Quoted prices in markets that are not active or inputs that are observable, either directly or indirectly, for substantially the full term of the asset or liability; and |
Level 3 | Prices or valuation techniques that require inputs that are both significant to the fair value measurement and unobservable (supported by little or no market activity). |
As required by accounting guidance, assets and liabilities are classified in their entirety based on the lowest level of input that is significant to the fair value measurement. These assets and liabilities are remeasured for each reporting period. The following table setstables set forth certain of the Company’s assets and liabilities measured at fair value by level within the fair value hierarchy as of September 30, 2017March 31, 2024 and December 31, 2016: 2023:
| | | | | | | | |
| | 2017 | | 2016 | | Input Hierarchy Level |
| | (in thousands) | |
Cash and cash equivalents: | | | | | | | | |
Bank deposits | | $ | 15,832 | | $ | 14,166 | | Level 1 |
Gold and silver rounds/bullion | | | 3,831 | | | 3,307 | | Level 1 |
Accounts receivable: | | | | | | | | |
Receivables from provisional concentrate sales | | | 3,664 | | | 630 | | Level 2 |
| | $ | 23,327 | | $ | 18,103 | | |
| | | | | | | | |
| | As of | | As of | | |
| | March 31, | | December 31, | | Input Hierarchy Level |
| | 2024 | | 2023 | | |
|
| | (in thousands) | | |
Cash and cash equivalents | | $ | 5,662 | | $ | 6,254 | | Level 1 |
Accounts receivable, net | | $ | 4,161 | | $ | 4,335 | | Level 2 |
Investment in equity securities-Maritime | | $ | 1,909 | | $ | 1,596 | | Level 1 |
Investment in equity securities-Green Light Metals | | $ | 3,618 | | $ | 3,698 | | Level 3 |
The following methods and assumptions were used to estimate the fair value of each class of financial instrument:
Cash and cash equivalents: Cash and cash equivalents consist primarily of cash deposits and are valued at cost, which approximatesapproximating fair value. Gold and silver rounds/bullion consist of precious metals used for investment purposes and in the dividend program which are valued using quoted market prices. Please see Note 3 for additional information. The Company determined that it was not practicable to estimate the fair value of its non-current investment in equity securities of $0.2 million and as such, it is reported at cost.
Trade accountsAccounts receivable, net: Accounts receivable, net include amounts due to the Company for shipmentsdeliveries of concentrates and doré sold to customers. Concentrate sales contracts provide for provisional pricing as specified in such contracts. These sales contain an embedded derivatives duederivative related to the provisional pricing termsmechanism which is bifurcated and accounted for unsettled shipments.as a derivative. At the end of each reporting period, the Company records an adjustment to accounts receivable and revenuesales to reflect the mark-to-market adjustments forof outstanding provisional invoices based on the forward prices.price curve. Because these provisionally priced
Gold Resource Corporation—Condensed Consolidated Interim Financial Statements and Notes (Unaudited)
19
sales have not yet settled as of the reporting date, the mark-to-market adjustment related to these invoices is included in accounts receivable as of each reporting date.
At March 31, 2024 and December 31, 2023, the Company had an unrealized gain of $0.3 million and an unrealized gain of $0.3 million, respectively, included in its accounts receivable on the accompanying Condensed Consolidated Interim Balance Sheets related to mark-to-market adjustments on the embedded derivatives. Please see Note 14 14—Derivatives in Item 1—Condensed Consolidated Interim Financial Statements and Notes (unaudited)for additional information.
Investment in equity securities—Maritime: On September 22, 2022, Gold Resource Corporation invested C$2.4 million (or $1.7 million) in the common shares of Maritime Resources Corp. (“Maritime”), ticker symbol MAE.V on TSX-V, in a private placement. The 47 million shares purchased represent less than 10% of the issued and outstanding shares of Maritime. As of March 31, 2024, the share price of Maritime was C$0.055, compared to C$0.045 as of December 31, 2023; therefore, an unrealized gain of $0.3 million was recorded.
Investment in equity securities—Green Light Metals: Upon maturity on December 28, 2022, the Company received 12,250,000 private shares of Green Light Metals, which settled the promissory note receivable from Green Light Metals. The shares received represented approximately 28.5% ownership at the time. Management chose to account for this investment using the fair value option; therefore, these securities are carried at fair value. As of March 31, 2024, the value of this equity investment was C$4.9 million ($3.6 million). The value of the issued shares was determined to be C$0.40 per share, which was based on the significant unobservable input of Green Light Metals equity transactions. For the three months ended March 31, 2024, there have been no gains or losses on the value of the shares the Company received, other than an immaterial foreign exchange loss.
Gains and losses related to changes in the fair value of these financial instruments were included in the Company’s Condensed Consolidated Interim Statements of Operations, as shown in the following table (in thousands):
| | | | | | | | | |
| | | For the three months ended March 31, | | Statements of Operations Classification |
| | | 2024 | | 2023 | | |
| Note | | | | | | | | |
Realized and unrealized derivative gain (loss), net | 14 | | $ | 66 | | $ | (87) | | Sales, net |
Realized/Unrealized Derivatives
The following tables summarize the Company’s realized/unrealized derivatives for the periods presented (in thousands):
| | | | | | | | | | | | | | | | | | |
| | Gold | | Silver | | Copper | | Lead | | Zinc | | Total |
For the three months ended March 31, 2024 | | | | | | | | | | | | | | | | | | |
Realized gain (loss) | | $ | 28 | | $ | (27) | | $ | 12 | | $ | (44) | | $ | 54 | | $ | 23 |
Unrealized gain (loss) | | | 112 | | | 80 | | | (2) | | | 59 | | | (206) | | | 43 |
Total realized/unrealized derivatives, net | | $ | 140 | | $ | 53 | | $ | 10 | | $ | 15 | | $ | (152) | | $ | 66 |
| | | | | | | | | | | | | | | | | | |
| | Gold | | Silver | | Copper | | Lead | | Zinc | | Total |
For the three months ended March 31, 2023 | | | | | | | | | | | | | | | | | | |
Realized gain | | $ | 114 | | $ | 149 | | $ | 54 | | $ | 94 | | $ | 223 | | $ | 634 |
Unrealized loss | | | (37) | | | (271) | | | (10) | | | (103) | | | (300) | | | (721) |
Total realized/unrealized derivatives, net | | $ | 77 | | $ | (122) | | $ | 44 | | $ | (9) | | $ | (77) | | $ | (87) |
13Gold Resource Corporation—Condensed Consolidated Interim Financial Statements and Notes (Unaudited)
20
18.20. Supplementary Cash Flow Information
Other operating adjustments and write-downs within the net cash provided by operations on the statementCondensed Consolidated Interim Statements of cash flowsCash Flows for the ninethree months ended September 30, 2017March 31, 2024 and 20162023 consisted of the following:
| | | | | | |
| | 2017 | | 2016 |
| | (in thousands) |
Unrealized gain on gold and silver rounds/bullion | | $ | (267) | | $ | (925) |
Unrealized foreign currency exchange loss | | | 138 | | | 57 |
Gain on sale of investments | | | - | | | (351) |
Loss on disposition of fixed assets | | | 462 | | | 523 |
Increase in reserve for inventory obsolescence | | | - | | | 102 |
Other | | | 59 | | | 63 |
Total other operating adjustments | | $ | 392 | | $ | (531) |
| | | | | | |
| | For the three months ended March 31, |
| | 2024 | | 2023 |
|
| | (in thousands) |
Unrealized gain on gold and silver rounds | | $ | (8) | | $ | (9) |
Unrealized foreign currency exchange (gain) loss | | | (54) | | | 453 |
Other | | | (168) | | | 187 |
Total other operating adjustments, net | | $ | (230) | | $ | 631 |
19.21. Segment Reporting
TheAs of March 31, 2024, the Company has organized its operations into twothree geographic regions. The geographic regions includeregions: Oaxaca, Mexico, Michigan, U.S.A., and Nevada, U.S.A.Corporate and representOther. Oaxaca, Mexico represents the Company’s operating segments. During the first quarter of 2017, theonly production stage property. Michigan, U.S.A. is an advanced exploration stage property. The Company began to make decisions about resources to be allocated to the operating segments. As a result, these operating segments represent the Company’s reportable segments. The prior periodsdoes not have any intersegment revenue, and all intercompany transactions have been conformedeliminated within each segment in order to reflectreport the change in presentation.net income (loss) on the basis that management uses internally for evaluating segment performance. The Company’s business activities that are not considered operating segmentsproduction stage or advanced exploration stage properties are included in Corporate and Other.
The financialfollowing table shows selected information from the Condensed Consolidated Interim Balance Sheets relating to the Company’s segments is as follows (in thousands)(in thousands):
| | | | | | | | | | | | |
| | | Mexico | | | Nevada | | | Corporate and Other | | | Consolidated |
Three months ended September 30, 2017 | | | | | | | | | | | | |
Revenue | | $ | 31,122 | | $ | - | | $ | - | | $ | 31,122 |
Exploration expense | | | 446 | | | 976 | | | 35 | | | 1,457 |
Capital expenditures | | | 5,869 | | | 2,274 | | | - | | | 8,143 |
| | | | | | | | | | | | |
| | | Mexico | | | Nevada | | | Corporate and Other | | | Consolidated |
Three months ended September 30, 2016 | | | | | | | | | | | | |
Revenue | | $ | 21,367 | | $ | - | | $ | - | | $ | 21,367 |
Exploration expense | | | 488 | | | 315 | | | 78 | | | 881 |
Capital expenditures | | | 2,342 | | | 3 | | | 21 | | | 2,366 |
| | | | | | | | | | | | |
| | | Mexico | | | Nevada | | | Corporate and Other | | | Consolidated |
Nine months ended September 30, 2017 | | | | | | | | | | | | |
Revenue | | $ | 76,849 | | $ | - | | $ | - | | $ | 76,849 |
Exploration expense | | | 1,050 | | | 2,253 | | | 112 | | | 3,415 |
Capital expenditures (1) | | | 15,983 | | | 8,618 | | | 9 | | | 24,610 |
| | | | | | | | | | | | |
| | | Mexico | | | Nevada | | | Corporate and Other | | | Consolidated |
Nine months ended September 30, 2016 | | | | | | | | | | | | |
Revenue | | $ | 64,968 | | $ | - | | $ | - | | $ | 64,968 |
Exploration expense | | | 1,094 | | | 710 | | | 223 | | | 2,027 |
Capital expenditures (2) | | | 9,971 | | | 35 | | | 167 | | | 10,173 |
| | | | | | | | | | | | |
| | Oaxaca,
Mexico | | Michigan,
USA | | Corporate
and Other | | Consolidated |
As of March 31, 2024 | | | | | | | | | | | | |
Total current assets | | $ | 25,079 | | $ | 71 | | $ | 555 | | $ | 25,705 |
Total non-current assets (1) | | | 61,813 | | | 93,178 | | | 2,022 | | | 157,013 |
Total assets | | $ | 86,892 | | $ | 93,249 | | $ | 2,577 | | $ | 182,718 |
Total current liabilities | | $ | 10,712 | | $ | 52 | | $ | 1,335 | | $ | 12,099 |
Total non-current liabilities | | | 13,229 | | | 64,096 | | | 519 | | | 77,844 |
Total shareholders’ equity | | | 62,951 | | | 29,101 | | | 723 | | | 92,775 |
Total liabilities and shareholders’ equity | | $ | 86,892 | | $ | 93,249 | | $ | 2,577 | | $ | 182,718 |
| | | | | | | | | | | | |
As of December 31, 2023 | | | | | | | | | | | | |
Total current assets | | $ | 25,155 | | $ | 116 | | $ | 1,224 | | $ | 26,495 |
Total non-current assets (1) | | | 62,368 | | | 93,287 | | | 1,736 | | | 157,391 |
Total assets | | $ | 87,523 | | $ | 93,403 | | $ | 2,960 | | $ | 183,886 |
Total current liabilities | | $ | 10,029 | | $ | 59 | | $ | 1,237 | | $ | 11,325 |
Total non-current liabilities | | | 12,559 | | | 62,792 | | | 517 | | | 75,868 |
Total shareholders’ equity | | | 64,935 | | | 30,552 | | | 1,206 | | | 96,693 |
Total liabilities and shareholders’ equity | | $ | 87,523 | | $ | 93,403 | | $ | 2,960 | | $ | 183,886 |
| (1) | (1)
| | Includes an increaseIn 2024, the total non-current assets included capital investments of $2.1 million in accruedOaxaca, Mexico, nil in Michigan, USA, and nil in Corporate and Other. In 2023, the total non-current assets included capital expendituresinvestments of $510$11.0 million in Oaxaca, Mexico, $0.4 million in Michigan, USA, and non-cash additions of $3,718; consolidated capital expenditures on a cash basis were $20,382.
nil in Corporate and Other. |
| (2)
| | Includes a decrease in accrued capital expenditures of $2,764 and a non-cash addition of $300; consolidated capital expenditures on a cash basis were $12,637.
|
The following table shows selected information from the Condensed Consolidated Interim Statements of Operations relating to the Company’s segments (in thousands):
14Gold Resource Corporation—Condensed Consolidated Interim Financial Statements and Notes (Unaudited)
21
| | | | | | | | | | | | |
| | Oaxaca,
Mexico | | Michigan,
USA | | Corporate
and Other | | Consolidated |
For the three months ended March 31, 2024 | | | | | | | | | | | | |
Sales, net | | $ | 18,702 | | | - | | | - | | $ | 18,702 |
Total mine cost of sales, including depreciation | | | 20,835 | | | 28 | | | 8 | | | 20,871 |
Exploration expense | | | 899 | | | 205 | | | - | | | 1,104 |
Total other costs and expenses, including G&A | | | 300 | | | 1,538 | | | 797 | | | 2,635 |
Income tax (benefit) provision | | | (1,803) | | | (154) | | | 70 | | | (1,887) |
Net loss | | $ | (1,529) | | $ | (1,617) | | $ | (875) | | $ | (4,021) |
| | | | | | | | | | | | |
For the three months ended March 31, 2023 | | | | | | | | | | | | |
Sales, net | | $ | 31,228 | | $ | - | | $ | - | | $ | 31,228 |
Total mine cost of sales, including depreciation | | | 26,660 | | | 14 | | | 625 | | | 27,299 |
Exploration expense | | | 1,389 | | | 450 | | | - | | | 1,839 |
Total other costs and expenses, including G&A | | | 631 | | | 244 | | | 2,384 | | | 3,259 |
Income tax provision (benefit) | | | 50 | | | (222) | | | 38 | | | (134) |
Net income (loss) | | $ | 2,498 | | $ | (486) | | $ | (3,047) | | $ | (1,035) |
22. Subsequent Events
Subsequent to end of the first quarter, through May 2, 2024, an aggregate of 1,977,401 shares of the Company’s common stock were sold and settled through the ATM Agreement for net proceeds to the Company of $1.1 million, after deducting the Agent’s commissions and other expenses.
Gold Resource Corporation—Condensed Consolidated Interim Financial Statements and Notes (Unaudited)
22
Total asset balances, excluding intercompany balances at September 30, 2017 and December 31, 2016 are as follows:
| | | | | | |
| | 2017 | | 2016 |
| | (in thousands) |
Mexico | | $ | 93,406 | | $ | 79,677 |
Nevada | | | 24,427 | | | 15,122 |
Corporate and Other | | | 17,268 | | | 23,644 |
Consolidated | | $ | 135,101 | | $ | 118,443 |
ITEM 2. Management’s Discussion and Analysis of Financial Condition and Results of Operations
Operations
The following discussion summarizes the results of operations of Gold Resource Corporation and its subsidiaries (“we”, “our”,we,” “our,” “us,” or “us”the “Company”) for the three and nine months ended September 30, 2017March 31, 2024 and compares those results towith the three and nine months ended September 30, 2016.March 31, 2023. It also analyzes ourthe Company’s financial condition at September 30, 2017as of March 31, 2024, and compares it to ourthe financial condition atas of December 31, 2016.2023. This discussion should be read in conjunction with the management’s discussion and analysis and the audited consolidated financial statements and footnotes for the year ended December 31, 2016 contained in our annual report on Form 10-K for the year ended December 31, 2016.2023 Annual Report.
The discussion also presents certain non-GAAP financial measures that are not prepared in accordance with U.S. Generally Accepted Accounting Principles (“non-GAAP”) but which are important to management in its evaluation of our operating results, and which are used by management to compare our performance with what we perceive to be peer group mining companies and are relied on as part of management’s decision-making process. Management believes these measures may also be important to investors in evaluating our performance. For a detailed description of each of the non-GAAP financial measures and a reconciliation to GAAP financial measures, please see the discussion below under “Non-GAAP Measures.
See Measures.” Also see Forward-Looking Statements at the end of this Item 2 for important information regarding statements contained herein.
Overview
Overview
We areGold Resource Corporation is a mining company whichthat pursues gold, silver, and silverother metal projects that are expected to haveachieve both low operating costs and high returns on capital. We are presently focused onThe Don David Gold Mine is our cornerstone asset comprised of six properties. The Company’s focus is to unlock the significant upside potential of this asset through optimization of the current operations, growing the existing resource by investing in exploration drilling, and identifying new opportunities near existing infrastructure. The primary mineral production from the Aguila Project and development of the new Mirador Mine on the Alta Gracia Project within our Oaxaca Mining Unit. Our processing facilities at the Aguila Project produce doré and concentrates primarily from ore minedcomes from the Arista underground mine. This mine which contains precious metals ofsupplies ore to our processing facilities to produce gold and silver doré and base metals of copper, lead, and zinc. Additionally, we are focused on exploration concentrates that also contain gold and advancement of our Nevada properties, including our Isabella Pearlsilver.
The Back Forty Project, whichwhen developed, is in advanced stages of engineering and permitting.
In our financial statements, we report the sale of precious and base metals as revenue and we periodically review our revenue streamsexpected to ensure that this treatment remains appropriate.
Precious metal gold equivalent, used periodically throughout this discussion, is determined by taking gold ounces produced or sold, plus silver ounces produced or sold converted to precious metal gold equivalent ounces using the gold to silver average price ratio for the period. Theproduce gold and silver average prices used to determine the gold to silver average price ratio are the actual metal prices realized from sales of ourdoré and copper and zinc concentrates bearing gold and silver. Please seeOptimization work related to metallurgy and the section titled Non-GAAP Measures below for additional information concerning cash cost per ounce measures.
Highlights
Highlights foreconomic model was completed during the third quarter of 2017 are included below2023 and discussed further in ourthe Company filed the Back Forty Project Technical Report Summary (S-K 1300) on October 26, 2023. Results of Operations:the work indicate a more robust economic project with no planned impacts to wetlands that is more protective of the environment, which should facilitate a successful mine permitting process. The Board continues to evaluate options in order to develop the Back Forty Project.
Review of Strategic Alternatives
Notwithstanding the technical successes noted above, in light of the continued challenges facing the Company, the Company’s Board of Directors has decided to initiate a formal review process, with the assistance of outside financial and legal advisors, to evaluate strategic alternatives for the Company. The comprehensive process is underway and will evaluate a broad range of options to maximize shareholder value, including a potential sale or merger of the Company.
There is no deadline or definitive timetable for completion of the strategic alternatives review process, and there can be no assurance regarding the results or outcome of this review. The Company does not intend to comment further on this strategic review process until it has been completed or the Company determines that a disclosure is required by law or otherwise deemed appropriate.
Gold Resource Corporation—Management’s Discussion and Analysis of Financial Condition and Results of Operations
23
| | |
Removing Loose Rock | ·
| DDGM is focused on safety, efficiency, and cost-saving initiatives, while emphasizing strong leadership and collaboration. The safety efforts have resulted in zero lost time injuries for the quarter. Leadership training programs have been successfully implemented, empowering leaders to enhance team productivity and safety. Union leaders and contractors continue to actively participate in safety programs, fostering a cooperative work community. | Ending working capitalProcessing plant throughput was $23.3 million;reduced to cope with a variation in the make-up water quality supplied from the tailings storage facility decant pond. Preparations during the quarter for the closure of the tailings storage facility reduced the make-up water supply to the plant, which in turn affected pH levels in that water supplied to the three floatation circuits. Each circuit operates optimally at a different pH (6-6.5 slightly acidic and 10.5-11 highly alkaline); however, during the transition to a smaller tailings decant pond as part of the closure preparations, controlling the pH levels became a challenge. This resulted in the use of additional reagents to control pH levels, and due to the less-than-optimal conditions, recoveries were lower than expected. A full review is planned for the second quarter of 2024, followed by modifications to improve the processing recoveries.
|
| ·
| | Cash balance was $15.8 million;
|
| ·
| | Net income was $4.6 millionTo ensure long-term sustainability and profitability, DDGM has implemented cost-saving measures starting in 2023, including a 10% reduction in headcount, minimizing crusher usage during peak hours, improving mining cycle efficiencies, and enhancing drilling and bolting processes. These measures optimize operations without compromising safety or $0.08 per share;productivity.
|
| ·
| | Total cash cost after by-product credits per precious metal gold equivalent ounce sold was $2;
|
| ·
| | Total all-in sustaining cost per precious metal gold equivalent ounce sold was $639.Lastly, DDGM’s persistent commitment to safety, efficiency, leadership development, collaboration with unions and contractors, and cost-saving initiatives positions the company for continued success. The company remains dedicated to delivering value to shareholders, while maintaining responsible and sustainable mining practices.
|
DDGM Exploration Update
Exploration and Development Activities
Exploration activities are performed on ourOur portfolio of exploration properties in Oaxaca, Mexico and Nevada, U.S.A. All of the properties that make up our Oaxaca Mining Unitthe Don David Gold Mine are located along what is known asa 55-kilometer trend of the San Jose structural corridor which runs north 70 degrees west. Our properties comprise 55 continuous kilometers of thisin the Sierra Madre Sur mountain range. This northwest trending structural corridor which spans three historic mining districts within the state of Oaxaca. Regional surface exploration activity continues on several properties with a goal of defining additional priority drill targets, demonstrating our commitment to long-term investment in Oaxaca. Our Nevada Mining Unit properties areOaxaca, Mexico.
During the first quarter of 2024, underground infill drilling continued from accessible areas using one dedicated contract diamond drill rig from drill stations within the Arista mine, targeting the Three Sisters and Gloria vein systems to further define, expand and upgrade the Mineral Resources in close proximitythese recently discovered zones. A second diamond drill rig, owned and operated by DDGM, was allocated to each other as well as other major gold depositsgrade control drilling, providing additional information for improved ore definition and detailed geologic model improvements aimed at bolstering mining efficiencies and ensuring the delivery of the highest-quality (NSR) ore to the process plant.
Gold Resource Corporation—Management’s Discussion and Analysis of Financial Condition and Results of Operations
24
The underground drill program continues to advance our 2024 exploration objectives of identifying new mineralization and defining and upgrading additional Mineral Resources identified during the previous drilling campaign. First quarter drill results will be incorporated into a 2024 resource estimate update. Preliminary calculations show a positive increase in tonnage along with higher grades in the Walker Lane Mineral Belt whichThree Sisters and Gloria vein systems. Upon the completion of an additional 250 meters of exploration development scheduled to begin in the second quarter of 2024, expansion drilling will resume with the goal of expanding the Three Sisters and Gloria vein systems along strike to the north-west and down dip.
During the first quarter of 2024, nine infill drill holes were completed, for a total of 3,390 meters, while fifteen grade control drill holes were completed for a total of 1,286 meters. One geotechnical drill hole was also drilled for a total of 115 meters. The positive initial results from the ongoing exploration drilling campaign have validated the continued investment of capital in exploration during 2024 and have further bolstered the area’s potential for future mineral exploration.
Exploration drilling in the first quarter of 2024 targeted the following zones at the Arista mine:
| o | Building upon the successful 2023 expansion and infill drilling programs of the Three Sisters and recently discovered Gloria vein systems, infill drilling continued to strategically prioritize these areas for drill targeting in the first quarter of 2024. Infill drilling of the Three Sisters and Gloria vein systems continued from Level 3 with the primary objective of upgrading the Mineral Resources of these areas. Due to their proximity to existing mine infrastructure, these areas will provide efficient and quick access to near-term mine production opportunities. To date, the Three Sisters and Gloria vein systems have been drill tested over a strike length of more than 700 meters, with both systems remaining open along strike to the northwest, as well as up- and down-dip. |
| o | During the first quarter of 2024, grade control drilling focused on validating near-term production opportunities not previously realized within the Arista mine. Grade control drilling during the first quarter focused on the upper levels of the Arista vein system from Level 1 targeting the upper-central zones of the Splay 31, Arista and Aire veins as well as in the Switchback system from Level 28 targeting the Sofia vein. Definition of these zones allows mining operations increased flexibility in scheduling, ensuring improved operating efficiencies. |
|
|
|
Hole No. 524005: Sandy 2 vein (338.57 – 343.54 m; 4.97 m). Three Sisters / Gloria infill drilling Q1 2024. 4.70 m estimated true width of 14.13 g/t Au, 125 g/t Ag [15.75 g/t AuEq], 0.32% Cu, 2.83% Pb, 7.13% Zn [690 $/t NSR] |
Gold Resource Corporation—Management’s Discussion and Analysis of Financial Condition and Results of Operations
25
Regional exploration during the first quarter of 2024 continued to focus on evaluating and prioritizing advanced stage projects located along the 55-kilometer trend in the San Jose structural corridor. These projects include Alta Gracia, Margaritas, Chamizo, El Rey, and Jabali, all situated within the 55.1 square kilometers of concession holdings controlled by the Don David Gold Mine. Additionally, other prospects in the vicinity of the Arista mine are knownbeing re-evaluated for their significantnear-term potential, with the goal of defining additional priority drill targets. A regional geologic map to outline of the DDGM concession holdings with the advanced stage project locations is provided below.
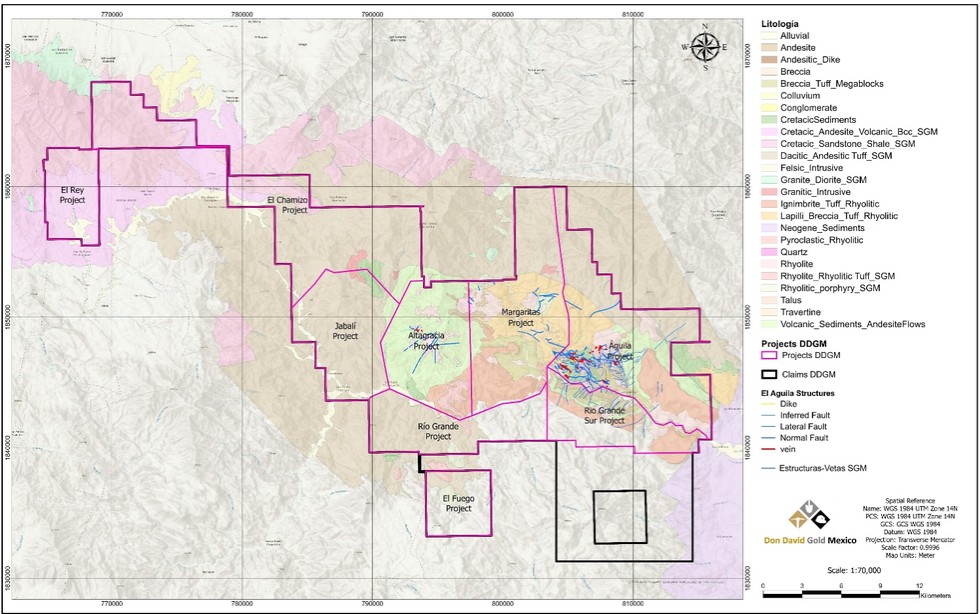
Regional Geologic Map Showing Advanced Stage Exploration Project Locations
Gold Resource Corporation—Management’s Discussion and high-grade gold-silver production from historic mines.Analysis of Financial Condition and Results of Operations
26
Results of Operations
Don David Gold Mine
Oaxaca Mining Unit, Mexico
The Aguila Project: Our mineMine activities during the thirdfirst quarter of 2017 continued to focus on2024 included development and ore extraction from the Arista and Switchback vein systems. Exploration activities during the quarter mainly focused on underground exploration drilling at the Switchback vein system in the Arista Mine. The Switchback drilling program continued to target further expansion and delineation of the multiple high-grade parallel veins for reserve definition, expansion and mine plan optimization. The Switchback vein system remains open on strike and vertical extent. Eight underground diamond drill holes totaling 2,676 meters were completed during the third quarter of 2017. Also during the third quarter, data compilation, review and field studies were conducted in a prospective exploration target area located in the southern portion of the Aguila Project.
Alta Gracia property: Mirador Mine development and access to previously identified mineralization at Alta Gracia continued during the third quarter of 2017. Exploration activities during the quarter included 1) interpretation of results from surface drilling completed earlier this year, 2) surveying, detailed geological mapping, and rock chip channel sampling of Alta Gracia historic underground workings, and 3) construction of a drilling access road to an exploration target area on the Alta Gracia property.
Margaritas property: During the third quarter of 2017, interpretation of results from previous surface drilling, surveying, detailed geological mapping and rock chip channel sampling were conducted for the Margaritas property.
Nevada Mining Unit, U.S.A.
Isabella Pearl Project: Project permitting continued during the third quarter. Our goal remains to advance the project into production at the earliest possible date, subject to permit timing and funding. We are targeting the production of gold doré from a potential open pit heap leach operation. We have received Nevada Department of Environmental Protection approvals and are now awaiting the Bureau of Land Management regulatory permit approvals to move the project forward. During the quarter, reconnaissance geological mapping and rock chip sampling delineated a new, surface high-grade gold target area located along strike to the northwest of the Isabella Pearl deposit currently targeted for development.
Mina Gold property: During the third quarter of 2017, we completed fourteen reverse circulation drill holes totaling 1,900 meters on the Mina Gold property. This surface drilling program targeted expansion to depth of known surface high-grade gold mineralization on our patented claims. Additional reverse circulation drilling, environmental baseline studies, and a preliminary engineering evaluation are also targeted for the Mina Gold property during the fourth quarter of 2017 and early 2018.
Gold Mesa property: Reverse circulation drilling continued at Gold Mesa during the third quarter of 2017. The program continued to target expansion of several areas of surface and near surface high-grade gold mineralization discovered during previous drilling programs. During the quarter, twelve shallow holes totaling 356 meters were drilled on the Gold Mesa property.
East Camp Douglas property: We continued to review historical geological, exploration and mining data on the East Camp Douglas property during the third quarter of 2017. A systematic rock chip sampling program covering a more than one square kilometer area of gold-bearing silicified volcanic rocks on the East Camp Douglas property commenced during the quarter.
Results of Operations
mine.
The following table summarizes our results of operations:
| | | | | | | | | | | | |
| | Three months ended September 30, | | Nine months ended September 30, |
| | 2017 | | 2016 | | 2017 | | 2016 |
| | (in thousands) |
Sales, net | | $ | 31,122 | | $ | 21,367 | | $ | 76,849 | | $ | 64,968 |
Mine gross profit | | | 11,201 | | | 5,363 | | | 26,843 | | | 21,210 |
General and administrative expenses | | | 1,950 | | | 2,027 | | | 5,437 | | | 5,875 |
Exploration expenses | | | 1,457 | | | 881 | | | 3,415 | | | 2,027 |
Other expense (income) | | | 110 | | | 74 | | | 1,183 | | | (1,170) |
Income before income taxes | | | 7,684 | | | 2,381 | | | 16,808 | | | 14,478 |
Provision for income taxes | | | 3,103 | | | 787 | | | 6,987 | | | 6,479 |
Net income | | $ | 4,581 | | $ | 1,594 | | $ | 9,821 | | $ | 7,999 |
Sales, net
Metal sales of $31.1 million for the third quarter of 2017 increased by $9.8 million, or 46%, when compared to the same period in 2016. Our increase in net sales was primarily a result of higher volume and prices for base metals and lower treatment charges due to more favorable contract terms. For the three months ended September 30, 2017, average realized prices for base metals increased from the same period in 2016 as follows: copper by 32% to $6,341 per tonne, lead by 23% to $2,349 per tonne, and zinc by 21% to $2,936 per tonne. During the same period, the average metal prices for gold and silver decreased by 4% and 18%, respectively, from 2016 prices.
Metal sales for the nine months ended September 30, 2017 were $76.8 million as compared to $65.0 million for the same period of 2016, representing an $11.8 million increase. The increase is primarily attributable to an increase in base metal realized prices and volumes and lower treatment charges, partially offset by lower precious metals sales.
Please see the Production and Sales Statistics table below for additional information regarding our mineral sales statistics.
Production
For the third quarter of 2017, gold and silvercertain production were 6,465 ounces and 392,153 ounces, respectively, as compared to 6,066 and 431,335 ounces over the same period in 2016. Gold grade for the third quarter increased by 12% over the same period in 2016 while silver grades decreased by 9%. Production during the quarter was impacted by higher grades of gold and base metals as a function of the particular areas of the mine where the ore was extracted. The development of a high-grade area in the Arista vein system was also completed during the quarter which allowed for higher-grade ore feed.
For the nine months ended September 30, 2017, the Company produced 18,908 and 1,217,713 ounces of gold and silver, respectively, as compared to 22,540 and 1,437,975 ounces of gold and silver, respectively, over the same period in 2016. The decrease in gold and silver production over the nine month period compared to that of 2016 was the result
of lower average grades processed as a result of the particular areas being developed and mined. Ore grades in the Arista Mine vary depending on the mining locations and mining techniques being utilized during a particular quarter or quarters. Fourth quarter 2017 production is expected to benefit from the mining of higher-grade areas and veins within the Arista Mine.
During the quarter ended September 30, 2017, we processed 1,346 ore tonnes per day compared to 1,278 ore tonnes per day for the same period in 2016, representing an increase of 5%. During the quarter, the agitated leach plant produced at approximately 48% of our targeted throughput of 150 tonnes per day, which is the average throughput level targeted for the remainder of 2017 and into early 2018. Lower than plan mill throughput and lower silver grades resulted in lower than anticipated silver production from Mirador for the quarter. Going forward, production is expected to improve as we develop more working faces, mine additional areas, and continue to optimize the recently commissioned leach plant.
On a precious metal gold equivalent basis, our mill production totaled 11,637 ounces and 35,630 ounces for the third quarter and first nine months of 2017, respectively, compared to 12,763 ounces and 42,281 ounces for same periods of 2016. Please see the Production and Sales Statistics table below for additional information regarding our mineral production statistics.
During the three months ended September 30, 2017, we sold 5,672 gold ounces and 371,754 silver ounces at a total cash cost per ounce, after by-product credits, of $2 as a result of strong base metal sales during the quarter. Please see Non-GAAP Measures below for additional information concerning the cash cost per ounce measures.
The following Production and Sales Statistics table summarizes certain informationstatistics about our mining operationsDon David Gold Mine for the periods indicated:
| | | | | | |
| | For the three months ended March 31, |
| | 2024 | | 2023 |
Arista Mine | | | | | | |
Milled | | | | | | |
Tonnes Milled | | | 98,889 | | | 116,721 |
Grade | | | | | | |
Average Gold Grade (g/t) | | | 1.89 | | | 2.33 |
Average Silver Grade (g/t) | | | 88 | | | 94 |
Average Copper Grade (%) | | | 0.37 | | | 0.37 |
Average Lead Grade (%) | | | 1.25 | | | 1.73 |
Average Zinc Grade (%) | | | 2.82 | | | 3.88 |
Recoveries | | | | | | |
Average Gold Recovery (%) | | | 79.3 | | | 80.9 |
Average Silver Recovery (%) | | | 90.3 | | | 91.2 |
Average Copper Recovery (%) | | | 76.0 | | | 77.1 |
Average Lead Recovery (%) | | | 65.7 | | | 77.0 |
Average Zinc Recovery (%) | | | 82.7 | | | 84.7 |
Combined | | | | | | |
Tonnes Milled (1) | | | 98,889 | | | 117,781 |
Tonnes Milled per Day (2) | | | 1,328 | | | 1,420 |
Metal production | | | | | | |
Gold (ozs.) | | | 4,757 | | | 7,171 |
Silver (ozs.) | | | 251,707 | | | 322,676 |
Copper (tonnes) | | | 280 | | | 336 |
Lead (tonnes) | | | 812 | | | 1,559 |
Zinc (tonnes) | | | 2,310 | | | 3,837 |
Metal produced and sold | | | | | | |
Gold (ozs.) | | | 3,557 | | | 6,508 |
Silver (ozs.) | | | 216,535 | | | 294,815 |
Copper (tonnes) | | | 264 | | | 332 |
Lead (tonnes) | | | 667 | | | 1,417 |
Zinc (tonnes) | | | 1,682 | | | 3,060 |
Percentage payable metal | | | | | | |
Gold (%) | | | 75 | | | 91 |
Silver (%) | | | 86 | | | 91 |
Copper (%) | | | 94 | | | 99 |
Lead (%) | | | 82 | | | 91 |
Zinc (%) | | | 73 | | | 80 |
| | | | | | | | | | | | |
Production and Sales Statistics |
| | Three months ended September 30, | | Nine months ended September 30, |
| | 2017 | | 2016 | | 2017 | | 2016 |
Milled | | | | | | | | | | | | |
Tonnes Milled (1) | | | 114,678 | | | 113,945 | | | 329,798 | | | 331,423 |
Tonnes Milled per Day (2) | | | 1,346 | | | 1,278 | | | 1,282 | | | 1,269 |
Grade | | | | | | | | | | | | |
Average Gold Grade (g/t) | | | 2.09 | | | 1.86 | | | 2.10 | | | 2.36 |
Average Silver Grade (g/t) | | | 117 | | | 128 | | | 125 | | | 146 |
Average Copper Grade (%) | | | 0.35 | | | 0.24 | | | 0.32 | | | 0.31 |
Average Lead Grade (%) | | | 1.73 | | | 1.18 | | | 1.44 | | | 1.18 |
Average Zinc Grade (%) | | | 5.04 | | | 3.45 | | | 4.19 | | | 3.71 |
Recoveries | | | | | | | | | | | | |
Average Gold Recovery (%) | | | 84 | | | 89 | | | 85 | | | 90 |
Average Silver Recovery (%) | | | 91 | | | 92 | | | 92 | | | 92 |
Average Copper Recovery (%) | | | 72 | | | 78 | | | 76 | | | 77 |
Average Lead Recovery (%) | | | 73 | | | 74 | | | 75 | | | 72 |
Average Zinc Recovery (%) | | | 80 | | | 82 | | | 83 | | | 84 |
Mill production (before payable metal deductions) (3) | | | | | | | | | | | | |
Gold (ozs.) | | | 6,465 | | | 6,066 | | | 18,908 | | | 22,540 |
Silver (ozs.) | | | 392,153 | | | 431,335 | | | 1,217,713 | | | 1,437,975 |
Copper (tonnes) | | | 291 | | | 213 | | | 804 | | | 777 |
Lead (tonnes) | | | 1,449 | | | 1,000 | | | 3,583 | | | 2,847 |
Zinc (tonnes) | | | 4,628 | | | 3,232 | | | 11,447 | | | 10,306 |
Payable metal sold | | | | | | | | | | | | |
Gold (ozs.) | | | 5,672 | | | 6,683 | | | 17,521 | | | 21,096 |
Silver (ozs.) | | | 371,754 | | | 410,337 | | | 1,121,870 | | | 1,337,668 |
Copper (tonnes) | | | 328 | | | 200 | | | 769 | | | 739 |
Lead (tonnes) | | | 1,389 | | | 893 | | | 3,299 | | | 2,629 |
Zinc (tonnes) | | | 4,326 | | | 2,480 | | | 9,452 | | | 8,503 |
Average metal prices realized (4) | | | | | | | | | | | | |
Gold ($ per oz.) | | | 1,289 | | | 1,339 | | | 1,262 | | | 1,271 |
Silver ($ per oz.) | | | 17.00 | | | 20.79 | | | 17.33 | | | 17.45 |
Copper ($ per tonne) | | | 6,341 | | | 4,791 | | | 6,042 | | | 4,577 |
Lead ($ per tonne) | | | 2,349 | | | 1,908 | | | 2,293 | | | 1,808 |
Zinc ($ per tonne) | | | 2,936 | | | 2,421 | | | 2,790 | | | 2,012 |
Precious metal gold equivalent ounces produced (mill production) (3) | | | | | | | | | | | | |
Gold Ounces | | | 6,465 | | | 6,066 | | | 18,908 | | | 22,540 |
Gold Equivalent Ounces from Silver | | | 5,172 | | | 6,697 | | | 16,722 | | | 19,741 |
Total Precious Metal Gold Equivalent Ounces | | | 11,637 | | | 12,763 | | | 35,630 | | | 42,281 |
Precious metal gold equivalent ounces sold | | | | | | | | | | | | |
Gold Ounces | | | 5,672 | | | 6,683 | | | 17,521 | | | 21,096 |
Gold Equivalent Ounces from Silver | | | 4,901 | | | 6,371 | | | 15,411 | | | 18,364 |
Total Precious Metal Gold Equivalent Ounces | | | 10,573 | | | 13,054 | | | 32,932 | | | 39,460 |
Total cash cost before by-product credits per precious metal gold equivalent ounce sold (5) | | $ | 1,709 | | $ | 1,287 | | $ | 1,353 | | $ | 1,152 |
Total cash cost after by-product credits per precious metal gold equivalent ounce sold (5) | | $ | 2 | | $ | 623 | | $ | 181 | | $ | 511 |
Total all-in sustaining cost per precious metal gold equivalent ounce sold (5) | | $ | 639 | | $ | 757 | | $ | 664 | | $ | 765 |
Total all-in cost per precious metal gold equivalent ounce sold (5) | | $ | 756 | | $ | 902 | | $ | 768 | | $ | 919 |
| (1) | (1)
| | For the third quarter of 2017 and 2016 and first nine months of 2017 and 2016, this includes 2,108, 11,459, 42,079, and 38,764 tonnes, respectively of open pit ore.
|
| (2)
| | Based on actual days the mill operated during the period. |
| (2) | (3)
| | Mill production represents metalThe difference between what we report as “ounces/tonnes produced” and “payable ounces/tonnes sold” is attributable to the difference between the quantities of metals contained in the concentrates we produce versus the portion of those metals actually paid for according to the terms of our sales contracts. Differences can also arise from inventory changes incidental to shipping schedules, or variances in ore grades and recoveries, which impact the amounts of metals contained in concentrates produced at the mill, which is before payable metal deductions are levied by the buyer of our concentrates. Payable metal deduction quantities are defined in our contracts with the buyer of our concentrates and represent an estimate of metal contained in the concentrates which the buyer deducts from payment. There are inherent limitations and differences in the sampling method and assaying of estimated metal contained in concentrates that are shipped, and those contained metal estimates are derived from sampling methods and assaying throughout the mill production process. We monitor these differences to ensure that precious metal mill production quantities are materially correct.
sold. |
Gold Resource Corporation—Management’s Discussion and Analysis of Financial Condition and Results of Operations
27
First quarter 2024 compared to first quarter 2023
Production
During the three months ended March 31, 2024, total tonnes milled of 98,889 were 15% lower than in the same period in 2023. Metal production for gold, silver, copper, lead, and zinc decreased by 34%, 22%, 17%, 48%, and 40%, respectively, during the three months ended March 31, 2024 as compared to the same period last year as a result of the lower tonnes processed and the lower metal grades that was expected and in line with the 2024 mine plan.
Grades & Recoveries
During the three months ended March 31, 2024, all of the ore processed came from the Arista underground mine with an average gold grade of 1.89 g/t and silver grade of 88 g/t, compared to 2.33 g/t and 94 g/t, respectively, for the same period in 2023. In 2024, the average gold and silver grades were 19% and 6% lower, respectively. As shown in the Technical Report Summary for DDGM incorporated by reference in the 2023 Annual Report (the “Technical Report Summary”), the ore grades are expected to decline in 2024 in line with the life of mine average shown in the estimates of mineral reserves (as defined by subpart 1300 of Regulation S-K, “Mineral Reserve”) and mineral resources (as defined by subpart 1300 of Regulation S-K, “Mineral Resource”) tables contained therein (the “Mineral Reserve and Mineral Resource Tables”). As grades decline, recoveries are expected to decline as well. Our base metals average grades during the three months ended March 31, 2024 were 0.37% for copper, 1.25% for lead, and 2.82% for zinc. The lead and zinc grades were lower by 28% and 27%, respectively, as compared to same period in 2023. The copper grades were unchanged.
Gold and silver recoveries for the three months ended March 31, 2024 were 79.3% and 90.3%, respectively, reflecting a 2% decrease for gold and a 1% decrease for silver over the same period in 2023. Copper, lead, and zinc recoveries for the three months ended March 31, 2024 were 76.0%, 65.7%, and 82.7%, respectively. Recoveries for copper, lead, and zinc in the three months ended March 31, 2024 when compared to the same period in 2023 declined by 1%, 15%, and 2%, respectively. As shown in the Technical Report Summary incorporated by reference in the 2023 Annual Report, future recoveries and grades are expected to align with the life of mine average shown in the Mineral Reserve and Mineral Resource Tables.
Gold Resource Corporation—Management’s Discussion and Analysis of Financial Condition and Results of Operations
28
Sales Statistics
The following table summarizes certain sales statistics about the Don David Gold Mine operations for the periods indicated:
| | | | | | |
| | For the three months ended March 31, |
| | 2024 | | 2023 |
Net sales (in thousands) | | | | | | |
Gold | | $ | 7,423 | | $ | 12,347 |
Silver | | | 5,069 | | | 6,642 |
Copper | | | 2,241 | | | 2,994 |
Lead | | | 1,364 | | | 2,965 |
Zinc | | | 4,122 | | | 9,551 |
Less: Treatment and refining charges | | | (1,583) | | | (3,184) |
Realized and unrealized gain (loss) - embedded derivative, net | | | 66 | | | (87) |
Total sales, net | | $ | 18,702 | | $ | 31,228 |
Metal produced and sold | | | | | | |
Gold (ozs.) | | | 3,557 | | | 6,508 |
Silver (ozs.) | | | 216,535 | | | 294,815 |
Copper (tonnes) | | | 264 | | | 332 |
Lead (tonnes) | | | 667 | | | 1,417 |
Zinc (tonnes) | | | 1,682 | | | 3,060 |
Average metal prices realized (1) | | | | | | |
Gold ($ per oz.) | | $ | 2,094 | | $ | 1,915 |
Silver ($ per oz.) | | $ | 23.29 | | $ | 23.04 |
Copper ($ per tonne) | | $ | 8,546 | | $ | 9,172 |
Lead ($ per tonne) | | $ | 1,977 | | $ | 2,158 |
Zinc ($ per tonne) | | $ | 2,483 | | $ | 3,195 |
Gold equivalent ounces sold | | | | | | |
Gold Ounces | | | 3,557 | | | 6,508 |
Gold Equivalent Ounces from Silver | | | 2,408 | | | 3,547 |
Total AuEq oz | | | 5,965 | | | 10,055 |
| (1) | (4)
| | Average metal prices realized vary from the market metal prices due to final settlement adjustments from our provisional invoices when they are settled. Our average metal prices realized will therefore differ from the average market average metal prices in most cases. |
First quarter 2024 compared to first quarter 2023
| (5)
| | For a reconciliation of this non-GAAP measure to total mine cost of sales, which is the most comparable U.S. GAAP measure, please see Non-GAAP Measures.
|
the production and financial results for the first quarter of 2024, as compared to the first quarter of 2023, relate to the lower tonnes mined and changes in metal grades and recoveries. These results align with the 2024 mine plan and were considered in the 2024 guidance disclosed in the 2023 Annual Report. Financial results have also been impacted unfavorably by the strengthening Mexican peso and the substantially lower zinc price realized in 2024 as compared to 2023.
Other Financial ResultsMetal Sold
Mine gross profit. ForDuring the three and nine months ended September 30, 2017, mine gross profit increasedMarch 31, 2024, gold sales of 3,557 ounces, silver sales of 216,535 ounces, copper sales of 264 tonnes, lead sales of 667 tonnes, and zinc sales of 1,682 tonnes decreased by $5.8 million or 109%45%, 27%, 20%, 53% and $5.6 million or 27%,45% respectively, as compared to the same periodsperiod in 2016.2023. The increaselower metal production was expected due to mine sequencing.
Average metal prices realized
During the three months ended March 31, 2024, the average metal prices were $2,094 per ounce for gold, $23.29 per ounce for silver, $8,546 per tonne for copper, $1,977 per tonne for lead, and $2,483 per tonne for zinc. Compared to the
Gold Resource Corporation—Management’s Discussion and Analysis of Financial Condition and Results of Operations
29
same period in 2023, the average metal price for gold and silver increased by 9% and 1%, respectively, while copper, lead and zinc decreased by 7%, 8%, and 22%, respectively.
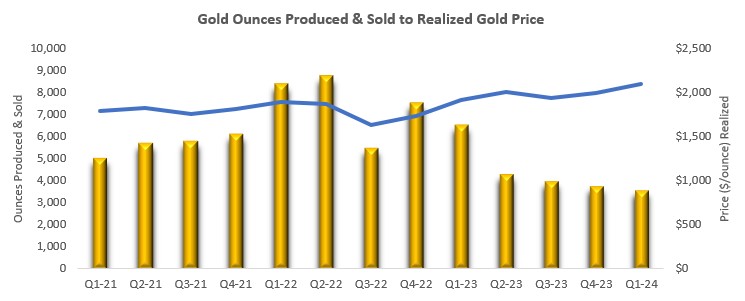
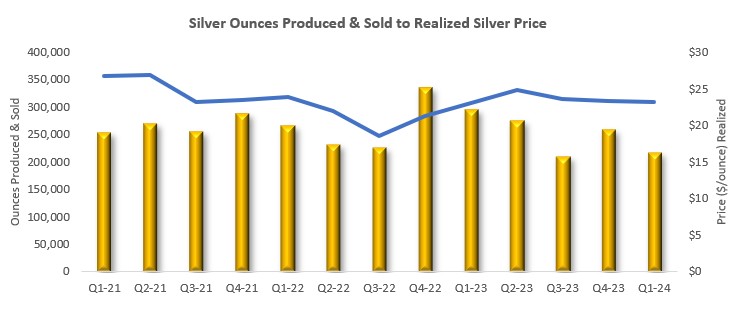
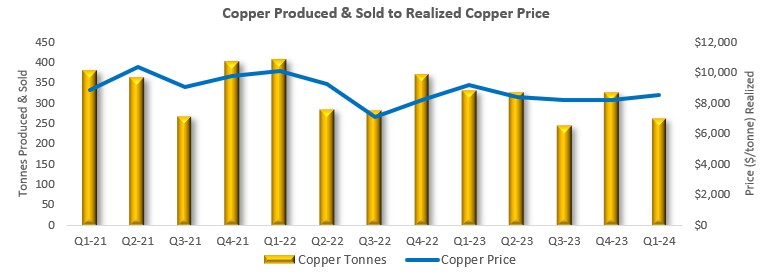
Gold Resource Corporation—Management’s Discussion and Analysis of Financial Condition and Results of Operations
30
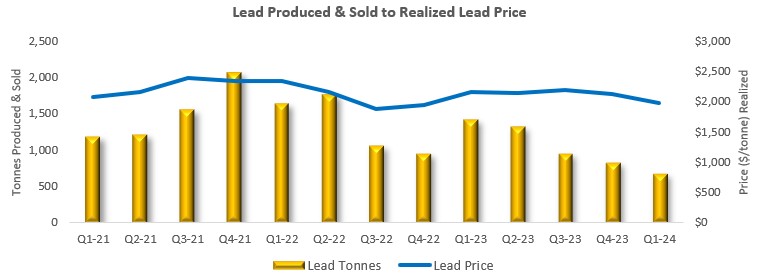

Financial Measures
The following table summarizes certain financial data of the Company for the periods indicated:
| | | | | | |
| | For the three months ended March 31, |
| | 2024 | | 2023 |
|
| | (in thousands) |
Doré and concentrate sales | | $ | 20,219 | | $ | 34,499 |
Less: Treatment and refining charges | | | (1,583) | | | (3,184) |
Realized/unrealized derivatives, net | | | 66 | | | (87) |
Sales, net | | | 18,702 | | | 31,228 |
Total cost of sales | | | 20,871 | | | 27,299 |
Mine gross (loss) profit | | | (2,169) | | | 3,929 |
Other costs and expenses, including tax: | | | 1,852 | | | 4,964 |
Net loss | | $ | (4,021) | | $ | (1,035) |
| | | | | | |
Other Non-GAAP Financial Measures: | | | | | | |
Total cash cost after co-product credits per AuEq oz sold (1) | | $ | 1,667 | | $ | 711 |
Total consolidated all-in sustaining cost after co-product credits per AuEq oz sold (1) | | $ | 2,295 | | $ | 1,221 |
Total all-in cost after co-product credits per AuEq oz sold (1) | | $ | 2,480 | | $ | 1,404 |
| (1) | For a detailed description of each of the non-GAAP financial measures and a reconciliation to GAAP financial measures, please see the discussion below under “Non-GAAP Measures”. |
Gold Resource Corporation—Management’s Discussion and Analysis of Financial Condition and Results of Operations
31
First quarter 2024 compared to first quarter 2023
Sales, net
Net sales of $18.7 million for DDGM for the three months ended March 31, 2024 decreased by $12.5 million, or 40%, when compared to the same period in 2023. The decrease in 2024 net sales is the result of decreased sales volumes and lower realized metal prices for base metals, as outlined in the sales statistics table above. Additionally, treatment and refining charges during the three months ended March 31, 2024 decreased by 50% as a result of the decline in first quarter 2024 production as compared to first quarter 2023 production.
Total cost of sales
Total cost of sales of $20.8 million for the three months ended March 31, 2024 decreased by 24% from $27.3 million for the same period in 2023. The $6.4 million decrease was primarily related to a $3.7 million decrease in production cost and a $3.0 million decrease in depreciation expense. Production costs of $16.1 million for the three months ended March 31, 2024 are 19% lower than the production costs of $19.9 million for the same period in 2023. Although the cost of sales and production costs were lower during the first quarter of 2024 compared to the same period in 2023, the cost of sales as a percentage of revenue was 25% higher realized basebecause the increased power rates and the strengthening of the peso negatively impacted production costs.
Mine gross (loss) profit
For the three months ended March 31, 2024, the Company had a mine gross loss of $2.2 million, compared to a mine gross profit of $3.9 million three months ended March 31, 2023. Mine gross profit decreased by $6.1 million, or 155%, compared to the same period in 2023. The increase in loss was primarily due to a $12.5 million, or 40% decrease in net sales, partially offset bya $3.7 million, or 19% decrease in production costs and a $3.0 million, or 42% decrease in depreciation and amortization expenses.
The relationship between sales and the cost of sales, and therefore mine gross profit, is not perfectly correlated to the tonnes of ore processed. While both sales and the cost of sales are impacted by the tonnes of ore processed, other factors, such as the grade of ore processed, metal commodity prices, and operating costs have a significant impact on mine gross profit. In the first quarter of 2024, the tonnes of ore processed decreased by 15%, and the total cost of sales decreased by 24% compared to the first quarter of 2023 due to a 9% lower cost per tonne processed; however, net sales decreased by 40%.
We expect grades to vary from period to period based upon the potential for unplanned changes to the annual mine plan. The gold grades are expected to trend downwards over time, toward the average grade of 1.29 g/t (exclusive of silver, copper, lead, and zinc contained grades), reflected in our mineral reserve estimate. However, as mine development progresses and infill drilling occurs, opportunities to access upgraded resources or refine mining methods and reduce dilution may have a favorable impact on future mined ore grades.
Gold Resource Corporation—Management’s Discussion and Analysis of Financial Condition and Results of Operations
32
Net (loss) income
For the three months ended March 31, 2024, we recorded a net loss of $4.0 million, compared to a net loss of $1.0 million during the same period in 2023. The $3.0 million increase in net loss is mainly attributable to the 40% decrease in net sales.
Other Costs and Expenses, Including Taxes
| | | | | | | |
| | For the three months ended March 31, | |
| | 2024 | | 2023 | |
|
| | (in thousands) | |
Other costs and expenses: | | | | | | | |
General and administrative expenses | | $ | 901 | | $ | 1,193 | |
Mexico exploration expenses | | | 899 | | | 1,389 | |
Michigan Back Forty Project expenses | | | 205 | | | 450 | |
Stock-based compensation | | | 219 | | | 597 | |
Other (income) expense, net | | | 1,515 | | | 1,469 | |
Total other costs and expenses | | | 3,739 | | | 5,098 | |
Income tax benefits | | | (1,887) | | | (134) | |
Total other costs, including taxes | | $ | 1,852 | | $ | 4,964 | |
First quarter 2024 compared to first quarter 2023
General and administrative expenses: For the three months ended March 31, 2024 and 2023, general and administrative expenses were $0.9 million and $1.2 million, respectively. The 25% decrease in cost is expected due to the cost saving measures the Company implemented for 2024.
DDGM Exploration expenses: For the three months ended March 31, 2024, exploration expenses in DDGM totaled $0.9 million, compared to $1.4 million for the same period in 2023. Exploration activities in Oaxaca, Mexico, decreased compared to the same period in 2023 primarily due to the reduction in expansion drilling and underground exploration development.
Back Forty Project expenses: For the three months ended March 31, 2024, costs for the Back Forty Project were $0.2 million, compared to $0.5 million for the same period in 2023. The 54% decrease is due to the completion of the optimization work in the third quarter of 2023 and not actively progressing the project in 2024.
Stock-based compensation: Stock-based compensation decreased by $0.4 million for the three months ended March 31, 2024 compared to the same period in 2023. This decrease is mainly due to the timing of issuance of new grants, which is still under the Board of Directors’ review.
Other expense, net: For both the three months ended March 31, 2024 and 2023, the Company incurred $1.5 million of other expenses. Please see Note 17 - Other expense, net in Item 1—Condensed Consolidated Interim Financial Statements and Notes (unaudited) for a detailed breakdown.
Income tax benefits: For the three months ended March 31, 2024, income tax benefit was $1.9 million, compared to $0.1 million income tax benefit for the same period in 2023. The increase in income tax benefit for the three months ended March 31, 2024 is due to the $4.7 million higher loss before income taxes compared to the same period in 2023.
Gold Resource Corporation—Management’s Discussion and Analysis of Financial Condition and Results of Operations
33
Other Non-GAAP Financial Measures
First quarter 2024 compared to first quarter 2023
Total cash cost after co-product credits per AuEq oz sold: For the three months ended March 31, 2024, the total cash cost after co-product credits per AuEq oz sold is $1,667 compared to $711 for the same period in 2023. The increase is due to the lower amount of co-product credits we received during the first quarter of 2024, and the 41% decrease in the total number of AuEq ounces sold, offset by a 50% decrease in total treatment and refining charges as a result of more favorable contract terms.
General and administrative expenses. For the decline in first quarter and nine months ended September 30, 2017, general and administrative expenses totaled $2.0 million and $5.4 million, respectively, compared to $2.0 million and $5.9 million, respectively, for the same periods in 2016. The decrease in the nine months ended September 30, 2017 of $0.5 million was due to a lower IT support costs and lower tax and audit fees.
Exploration expenses. For the three and nine months ended September 30, 2017, exploration expenses totaled $1.5 million and $3.4 million2024 production as compared to $0.9 million and $2.0 million forfirst quarter 2023 production. Although production costs were lower in the three and nine months ended September 30, 2016, respectively. The $0.6 and $1.4 million increase for the three and nine months ended September 30, 2017, respectively, was primarily the result of increased spending at our Isabella Pearl property.
Other expense (income). For the three and nine months ended September 30, 2017, we recorded other expense of $0.1 million and $1.2 million, respectively, compared to other expense of $0.1 million and other income of $1.2 million for the three and nine months ended September 30, 2016, respectively. The $2.4 million change in nine months ended September 30, 2017 was a result of a decrease in unrealized foreign currency gains as the Mexican peso strengthened in 2017 as compared to 2016. Additionally, we recognized no gains on investments in 2017 as the Company sold its investments in 2016. Please see Note 15 to the Condensed Consolidated Financial Statements for additional information.
Provision for income taxes. For the three and nine months ended September 30, 2017, our provision for income tax was $3.1 million and $7.0 million, respectively, compared to $0.8 million and $6.5 million for the three and nine months ended September 30, 2016, respectively. The increase of $2.3 in taxes for the thirdfirst quarter of 2017 is commensurate with our increase in income for period as2024 compared to the same period last year, the strengthening peso and increased energy costs negatively impacted production costs and, therefore, the cost per tonne processed and the total cash cost after co-product credits per AuEq oz sold.
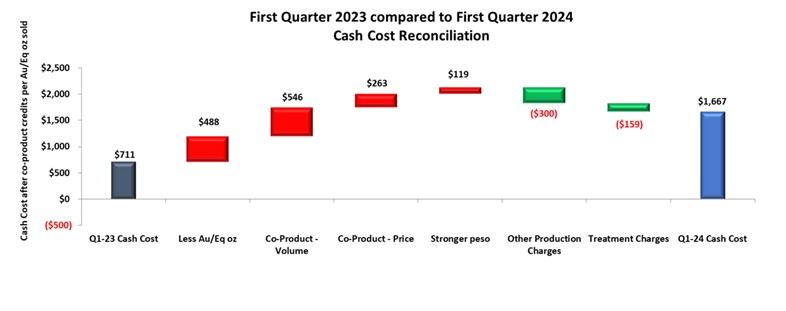
Total consolidated all-in sustaining cost after co-product credits per AuEq oz sold: For the three months ended March 31, 2024, the total consolidated all-in sustaining cost after co-product credits per AuEq oz sold was $2,295 compared to $1,221 for the same period in 2016. Please seeNote 52023. The increase directly relates to the Condensed Consolidatedhigher cash costs per ounce discussed above.
Total all-in cost after co-product credits per AuEq oz sold: For the three months ended March 31, 2024, the total all-in cost after co-product credits per AuEq oz sold was $2,480 compared to $1,404 for the same period in 2023. The increase is due to the higher all-in sustaining costs discussed above.
For a detailed description of each of the non-GAAP financial measures and a reconciliation to GAAP financial measures, please see the discussion below under “Non-GAAP Measures.”
Gold Resource Corporation—Management’s Discussion and Analysis of Financial StatementsCondition and Results of Operations
34
2024 Capital and Exploration Investment Summary
| | | | | | | |
| | | For the three months ended March 31, 2024 | 2024 full year guidance |
| | | | (in thousands) | | | |
Sustaining Investments: | | | | | | | |
Underground Development | Capital | | $ | 1,350 | | | |
Other Sustaining Capital | Capital | | | 282 | | | |
Infill Drilling | Capitalized Exploration | | | 441 | | | |
Surface and Underground Exploration Development & Other | Capitalized Exploration | | | 2 | | | |
Subtotal of Sustaining Investments: | | | | 2,075 | | $ | 8.8 - 11.0 million |
Growth Investments: | | | | | | | |
DDGM growth: | | | | | | | |
Surface Exploration / Other | Exploration | | | 899 | | | |
Back Forty growth: | | | | | | | |
Back Forty Project Optimization & Permitting | Exploration | | | 205 | | | |
Subtotal of Growth Investments: | | | | 1,104 | | $ | 3.2 - 5.2 million |
Total Capital and Exploration: | | | $ | 3,179 | | $ | 12.0 - 16.2 million |
The Company’s investment in Mexico in the first quarter of 2024 totaled $3.0 million. Our investment in Mexico is focused on favorably impacting our environment, social, and governance programs while creating operational efficiencies and sustainability.
Gold Resource Corporation—Management’s Discussion and Analysis of Financial Condition and Results of Operations
35
Underground and Exploration Development:
Mine development during the quarter included ramps, access to different areas of the deposit and ventilation shafts. No exploration or infill development was completed during the first quarter of 2024 as all drilling is being done from existing infrastructure developed in 2023. Additional exploration development is scheduled for the second and third quarters of 2024. As part of ongoing safety initiatives, the Company also invested in additional information. ground support and improved ventilation for the mine.
|
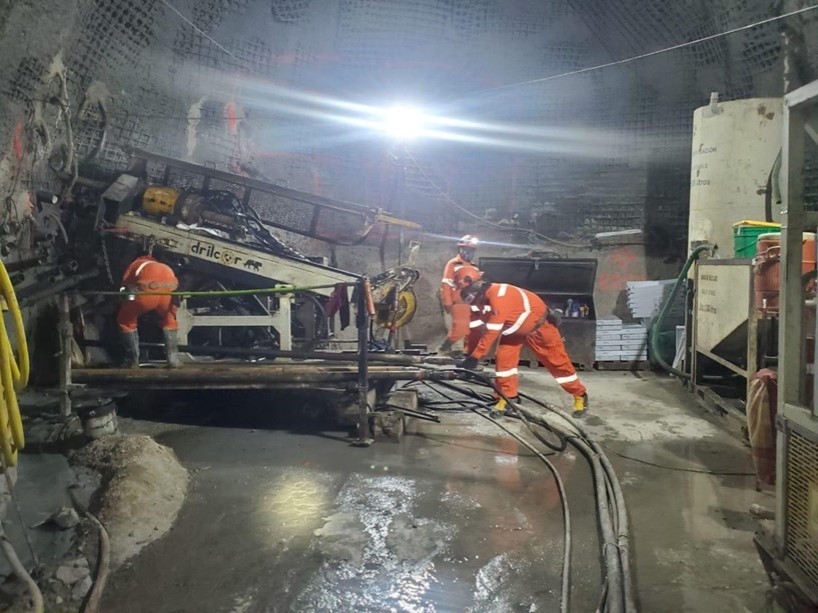
|
Underground contract drill rig; Level 3 – Arista Mine drilling Three Sisters / Gloria vein systems |
Gold Resource Corporation—Management’s Discussion and Analysis of Financial Condition and Results of Operations
36
Non-GAAP Measures
Throughout this report, we have provided information prepared or calculated according to U.S. GAAP and have referenced somecertain non-GAAP performance measures whichthat we believe will assist with understanding the performance of theour business. These measures are based on precious metal gold equivalent ounces sold and include (i) cash cost before by-productafter co-product credits per ounce total cash cost after by-product credits per ounce, totaland (ii) all-in sustaining cost after co-product credits (“AISC”) per ounce, (“AISC”) and (iii) all-in cost after co-product credits per ounce (“AIC”).ounce. Because the non-GAAP performance measures do not have any standardized meaning prescribed by U.S. GAAP, they may not be comparable to similar measures presented by other companies. Accordingly, these measures should not be considered in isolation or as a substitute for, measures of performance prepared in accordance with U.S. GAAP. These non-GAAP measures are not necessarily indicative of operating profit or cash flow from operations as determined under GAAP.
For financial reporting purposes, we report the sale of base metals as part of our revenue. Revenue generated from the sale of base metals in our concentrates is considered a co-product of our gold and silver production for the purpose of calculating our total cash cost after co-product credits for our Don David Gold Mine. We periodically review our revenues to ensure that our reporting of primary products and co-products is appropriate. Because we consider copper, lead, and zinc to be co-products of our precious metal production, the value of these metals continues to be applied as a reduction to total cash costs in our calculation of total cash cost after co-product credits per precious metal gold equivalent ounce sold. Likewise, we believe identifying copper, lead, and zinc as co-product credits is appropriate due to their lower per unit economic value contribution compared to the precious metals and since gold and silver are the primary products we intend to produce.
Total cash cost after by-productco-product credits is a measure developed by the Gold Institutein an effort to provide a uniform standard for industry comparison purposes. The guidance was first issued in 1996purposes, and revised in November 1999. AISC and AIC are calculated based on guidance from the World Gold Council issued in June 2013.
Total cash cost before by-product credits includes all direct and indirect production costs related to our production of metals (including mining, milling and other plant facility costs, smelter treatment and refining charges, royalties, and site
general and administrative costs) less stock-based compensation allocated to production costs plus treatment and refining costs.
Total cash cost after by-product creditsit includes total cash cost before by-productco-product credits, less by-productco-product credits, or revenues earned from base metals.
AISC includes total cash cost after by-productco-product credits plus other costs related to sustaining production, including allocated sustaining general and administrative expenses and sustaining capital expenditures. We determined sustaining capital expenditures as those capital expenditures that are necessary to maintain current production and execute the current mine plan. AISC is calculated based on the current guidance from the World Gold Council.
AICTotal all-in cost after co-product credits includes all-in sustaining coststotal AISC as described above, plus other growth investments, including exploration expenses and non-sustaining capital expenditures, exploration expense,expenditures.
Gold Resource Corporation—Management’s Discussion and allocated corporate generalAnalysis of Financial Condition and administrative expenses related to the Oaxaca Mining Unit. Capital expenditures and exploration expenses related to projects in our Oaxaca Mining Unit are classified as non-sustaining. Exploration and capital expenditures to develop new properties outside our Oaxaca Mining Unit are excluded from this calculation.Results of Operations
37
Cash cost before by-product credits per ounce, total cash cost after by-product credits per ounce, AISC and AIC are calculated by dividing the relevant costs, as determined using the cost elements noted above, by precious metal gold equivalent ounces sold for the periods presented.
Reconciliations to U.S. GAAP
The following table provides a reconciliationbelow present reconciliations between the most comparable GAAP measure of total cash cost after by-product credits to total mineTotal cost of sales (a U.S. GAAP measure) as presented in the Condensed Consolidated Statements of Operations:
| | | | | | | | | | | | |
| | Three months ended September 30, | | Nine months ended September 30, |
| | 2017 | | 2016 | | 2017 | | 2016 |
| | (in thousands) |
Total cash cost after by-product credits | | $ | 30 | | $ | 8,126 | | $ | 5,985 | | $ | 20,226 |
Treatment and refining charges | | | (1,987) | | | (4,082) | | | (4,997) | | | (11,078) |
By-product credits | | | 18,043 | | | 8,668 | | | 38,580 | | | 25,250 |
Depreciation and amortization | | | 3,762 | | | 3,189 | | | 10,271 | | | 9,049 |
Reclamation and remediation | | | 36 | | | 48 | | | 101 | | | 139 |
Stock-based compensation allocated to production costs | | | 37 | | | 55 | | | 66 | | | 172 |
Total mine cost of sales | | $ | 19,921 | | $ | 16,004 | | $ | 50,006 | | $ | 43,758 |
The following table presents a reconciliation ofto the non-GAAP measures of total cash cost before by-product credits, total cashCash cost after by-productco-product credits, All-in sustaining cost after co-product credits for DDGM and AISC to AIC:for the Company, and All-in Cost after co-product credits for the three months ended March 31, 2024 and 2023:
| | | | | | | |
| Note | | For the three months ended March 31, |
| | | 2024 | | 2023 |
|
| | | | (in thousands, except oz and per AuEq oz sold) |
| | | | | | | |
Total cost of sales (1) | | | $ | 20,871 | | $ | 27,299 |
Less: Depreciation and amortization (1) | | | | (4,210) | | | (7,254) |
Less: Reclamation and remediation (1) | | | | (553) | | | (195) |
Refining charges for Doré sales | 3 | | | 6 | | | 25 |
Treatment and refining charges for Concentrate sales | 3 | | | 1,577 | | | 3,159 |
Co-product credits: | | | | | | | |
Concentrate sales - Copper | 3 | | | (2,241) | | | (2,994) |
Concentrate sales - Lead | 3 | | | (1,364) | | | (2,965) |
Concentrate sales - Zinc | 3 | | | (4,122) | | | (9,551) |
Realized (loss) gain for embedded derivatives - Copper | 19 | | | (12) | | | (54) |
Realized (loss) gain for embedded derivatives - Lead | 19 | | | 44 | | | (94) |
Realized gain for embedded derivatives - Zinc | 19 | | | (54) | | | (223) |
Total cash cost after co-product credits | | | $ | 9,942 | | $ | 7,153 |
Gold equivalent (AuEq) ounces sold (oz) | | | | 5,965 | | | 10,055 |
Total cash cost after co-product credits per AuEq oz sold | | | $ | 1,667 | | $ | 711 |
| | | | | | | |
Total cash cost after co-product credits from above | | | $ | 9,942 | | $ | 7,153 |
Sustaining Investments - Capital: | | | | | | | |
Underground Development (2) | | | | 1,350 | | | 1,296 |
Other Sustaining Capital (2) | | | | 282 | | | 475 |
Sustaining Investments - Capitalized Exploration: | | | | | | | |
Infill Drilling (2) | | | | 441 | | | 817 |
Surface and Underground Exploration Development & Other (2) | | | | 2 | | | 548 |
Reclamation and remediation (1) | | | | 553 | | | 195 |
DDGM all-in sustaining cost after co-product credits | | | $ | 12,570 | | $ | 10,484 |
AuEq ounces sold (oz) | | | | 5,965 | | | 10,055 |
DDGM all-in sustaining cost after co-product credits per AuEq oz sold | | | $ | 2,107 | | $ | 1,043 |
| | | | | | | |
DDGM all-in sustaining cost after co-product credits from above | | | $ | 12,570 | | $ | 10,484 |
Corporate Sustaining Expenses: | | | | | | | |
General and administrative expenses (1) | | | | 901 | | | 1,193 |
Stock-based compensation (1) | | | | 219 | | | 597 |
Consolidated all-in sustaining cost after co-product credits | | | $ | 13,690 | | $ | 12,274 |
AuEq ounces sold (oz) | | | | 5,965 | | | 10,055 |
Total consolidated all-in sustaining cost after co-product credits per AuEq oz sold | | | $ | 2,295 | | $ | 1,221 |
| | | | | | | |
Consolidated all-in sustaining cost after co-product credits from above | | | $ | 13,690 | | $ | 12,274 |
Growth Investments - Exploration: | | | | | | | |
Mexico exploration expenses (1) | | | | 899 | | | 1,389 |
Michigan Back Forty Project expenses (1) | | | | 205 | | | 450 |
Total all-in cost after co-product credits | | | $ | 14,794 | | $ | 14,113 |
AuEq ounces sold (oz) | | | | 5,965 | | | 10,055 |
Total all-in cost after co-product credits per AuEq oz sold | | | $ | 2,480 | | $ | 1,404 |
| | | | | | | | | | | | |
| | Three months ended September 30, | | Nine months ended September 30, |
| | 2017 | | 2016 | | 2017 | | 2016 |
| | (in thousands, except ounces sold and cost per precious metal gold equivalent ounce sold) |
Total cash cost before by-product credits (1) | | $ | 18,073 | | $ | 16,794 | | $ | 44,565 | | $ | 45,476 |
By-product credits (2) | | | (18,043) | | | (8,668) | | | (38,580) | | | (25,250) |
Total cash cost after by-product credits | | | 30 | | | 8,126 | | | 5,985 | | | 20,226 |
Sustaining capital expenditures | | | 6,737 | | | 1,750 | | | 15,908 | | | 10,040 |
Total all-in sustaining cost | | | 6,767 | | | 9,876 | | | 21,893 | | | 30,266 |
Non-sustaining capital expenditures | | | - | | | 611 | | | 9 | | | 2,597 |
Non-sustaining general and administrative expenses | | | 789 | | | 789 | | | 2,367 | | | 2,367 |
Non-sustaining exploration expense | | | 447 | | | 488 | | | 1,052 | | | 1,095 |
Total all-in cost | | $ | 8,003 | | $ | 11,764 | | $ | 25,321 | | $ | 36,325 |
| | | | | | | | | | | | |
Precious metal gold equivalent ounce sold (3) | | | 10,573 | | | 13,054 | | | 32,932 | | | 39,460 |
| | | | | | | | | | | | |
Total cash cost before by-product credits per precious metal gold equivalent ounce sold | | $ | 1,709 | | $ | 1,287 | | $ | 1,353 | | $ | 1,152 |
By-product credits per precious metal gold equivalent ounce sold | | | (1,707) | | | (664) | | | (1,172) | | | (641) |
Total cash cost after by-product credits per precious metal gold equivalent ounce sold | | | 2 | | | 623 | | | 181 | | | 511 |
Other sustaining expenditures per precious metal gold equivalent ounce sold | | | 637 | | | 134 | | | 483 | | | 254 |
Total all-in sustaining cost per precious metal gold equivalent ounce sold | | | 639 | | | 757 | | | 664 | | | 765 |
Non-sustaining expenditures per precious metal gold equivalent ounce sold | | | 117 | | | 145 | | | 104 | | | 154 |
Total all-in cost per precious metal gold equivalent ounce sold | | $ | 756 | | $ | 902 | | $ | 768 | | $ | 919 |
| (1) | (1)
Refer to Item 1—Condensed Consolidated Interim Financial Statements and Notes (unaudited): Condensed Consolidated Interim Statements of Operations. |
| (2) | | Production cost less stock-based compensation allocatedRefer to production cost plus treatmentItem 2—Management’s Discussion and refining charges.
Analysis of Financial Condition and Results of Operations – 2024 Capital and Exploration Investment Summary and the previously filed Item 2—Management’s Discussion and Analysis of Financial Condition and Results of Operations – 2023 Capital and Exploration Investment Summary. |
| (2)
| | Please see the tables below for a summary of our by-product revenue and by-product credit per precious metal equivalent ounces sold.
|
| (3)
| | Gold ounces sold, plus gold equivalent ounces of silver ounces sold converted to gold ounces using our realized gold price per ounce to silver price per ounce ratio.
|
22Gold Resource Corporation—Management’s Discussion and Analysis of Financial Condition and Results of Operations
38
Trending Highlights
| | | | | | |
| | | | | | |
| 2023 | | 2024 |
| Q1 | Q2 | Q3 | Q4 | | Q1 |
Operating Data | | | | | | |
Total tonnes milled | 117,781 | 113,510 | 116,626 | 111,254 | | 98,889 |
Average Grade | - | | | | | |
Gold (g/t) | 2.33 | 1.59 | 1.52 | 1.44 | | 1.89 |
Silver (g/t) | 94 | 86 | 73 | 85 | | 88 |
Copper (%) | 0.37 | 0.37 | 0.32 | 0.39 | | 0.37 |
Lead (%) | 1.73 | 1.64 | 1.29 | 1.39 | | 1.25 |
Zinc (%) | 3.88 | 3.72 | 3.24 | 2.95 | | 2.82 |
Metal production (before payable metal deductions) | | | | | | |
Gold (ozs.) | 7,171 | 4,637 | 4,443 | 4,077 | | 4,757 |
Silver (ozs.) | 322,676 | 289,816 | 247,159 | 282,487 | | 251,707 |
Copper (tonnes) | 336 | 334 | 276 | 341 | | 280 |
Lead (tonnes) | 1,559 | 1,389 | 1,048 | 1,072 | | 812 |
Zinc (tonnes) | 3,837 | 3,569 | 3,223 | 2,884 | | 2,310 |
Metal produced and sold | | | | | | |
Gold (ozs.) | 6,508 | 4,287 | 3,982 | 3,757 | | 3,557 |
Silver (ozs.) | 294,815 | 274,257 | 208,905 | 258,252 | | 216,535 |
Copper (tonnes) | 332 | 327 | 245 | 327 | | 264 |
Lead (tonnes) | 1,417 | 1,317 | 947 | 820 | | 667 |
Zinc (tonnes) | 3,060 | 3,141 | 2,571 | 2,182 | | 1,682 |
Average metal prices realized | | | | | | |
Gold ($ per oz.) | $ 1,915 | $ 2,010 | $ 1,934 | $ 1,985 | | $ 2,094 |
Silver ($ per oz.) | $ 23.04 | $ 24.93 | $ 23.61 | $ 23.14 | | $ 23.29 |
Copper ($ per tonne) | $ 9,172 | $ 8,397 | $ 8,185 | $ 8,205 | | $ 8,546 |
Lead ($ per tonne) | $ 2,158 | $ 2,153 | $ 2,196 | $ 2,122 | | $ 1,977 |
Zinc ($ per tonne) | $ 3,195 | $ 2,485 | $ 2,195 | $ 2,516 | | $ 2,483 |
Gold equivalent ounces sold | | | | | | |
Gold Ounces | 6,508 | 4,287 | 3,982 | 3,757 | | 3,557 |
Gold Equivalent Ounces from Silver | 3,547 | 3,402 | 2,550 | 3,011 | | 2,408 |
Total AuEq oz | 10,055 | 7,689 | 6,532 | 6,768 | | 5,965 |
Financial Data | | | | | | |
Total sales, net (in thousands) | $ 31,228 | $ 24,807 | $ 20,552 | $ 21,141 | | $ 18,702 |
Production Costs (in thousands) | $ 19,850 | $ 20,302 | $ 18,957 | $ 17,034 | | $ 16,108 |
Production Costs/Tonnes Milled | $ 169 | $ 179 | $ 163 | $ 153 | | $ 163 |
Operating Cash Flows (in thousands) | $ 1,024 | ($ 551) | ($ 7,475) | $ 1,783 | | $ 1,482 |
Net loss (in thousands) | ($ 1,035) | ($ 4,584) | ($ 7,341) | ($ 3,057) | | ($ 4,021) |
Loss per share - basic | ($ 0.01) | ($ 0.05) | ($ 0.08) | ($ 0.03) | | ($ 0.05) |
Gold Resource Corporation—Management’s Discussion and Analysis of Financial Condition and Results of Operations
39
The following tables summarizes our by-product revenue and by-product credit per precious metal gold equivalent ounce sold:
| | | | | | | | | | | | |
| | Three months ended September 30, | | Nine months ended September 30, |
| | 2017 | | 2016 | | 2017 | | 2016 |
| | (in thousands) |
By-product credits by dollar value: | | | | | | | | | | | | |
Copper sales | | $ | 2,080 | | $ | 959 | | $ | 4,646 | | $ | 3,384 |
Lead sales | | | 3,263 | | | 1,704 | | | 7,565 | | | 4,755 |
Zinc sales | | | 12,700 | | | 6,005 | | | 26,369 | | | 17,111 |
Total sales from by-products | | $ | 18,043 | | $ | 8,668 | | $ | 38,580 | | $ | 25,250 |
| | | | | | | | | | | | |
| | Three months ended September 30, | | Nine months ended September 30, |
| | 2017 | | 2016 | | 2017 | | 2016 |
By-product credits per precious metal gold equivalent ounce sold: | | | | | | | | | | | | |
Copper sales | | $ | 197 | | $ | 73 | | $ | 141 | | $ | 86 |
Lead sales | | | 309 | | | 131 | | | 230 | | | 121 |
Zinc sales | | | 1,201 | | | 460 | | | 801 | | | 434 |
Total by-product credits per precious metal gold ounces sold | | $ | 1,707 | | $ | 664 | | $ | 1,172 | | $ | 641 |
Liquidity and Capital Resources
As of September 30, 2017, we hadMarch 31, 2024, working capital of $23.3was $13.6 million, consisting of current assets of $36.1$25.7 million and current liabilities of $12.8$12.1 million. This represents an increase of $3.0a $1.6 million, or 11%, decrease from the working capital balance of $20.3$15.2 million atas of December 31, 2016.2023. The primary factor influencing the decrease in our working capital were the cash used in investing activities of $2.0 million as reported in the Condensed Consolidated Interim Statements of Cash Flows. Our working capital balance fluctuates as we use cash to fund our operations, financing and investing activities, including exploration, mine development, and income taxestaxes. We believe that as a result of our cash balances, the performance of our current and shareholder dividends.expected operations, and the current metals prices, we will be able to meet our known obligations and other potential cash requirements for the next 12 months.
Long-term liabilities assumed with the Aquila acquisition, capital requirements to develop the Back Forty Project, and potential project financing may have an impact on liquidity in the long term. These long-term liabilities are contingent upon the approval of the Back Forty Project by the Company’s Board of Directors and securing project financing. Project financing requirements will not be determined until the Company Board of Directors approves a decision to proceed on the Project. The Board continues to evaluate options that could lead to the development of the Project.
Cash and cash equivalents increased $1.7as of March 31, 2024 decreased to $5.7 million from $6.3 million as of December 31, 2023, a net decrease in cash of $0.6 million. The decrease is primarily due to $15.8$2.0 million duringcash used in investing activities, partially offset by the first nine months$1.5 million cash provided by operating activities.
Of the $5.7 million cash balance as of 2017.
March 31, 2024, $5.5 million was held in foreign subsidiaries, primarily held in U.S. dollar denominated accounts, with the remainder in foreign currencies readily convertible to U.S. dollars. The Don David Gold Mine’s primary source of liquidity is the sale of doré and concentrates. The Don David Gold Mine has been self-sustaining since production commencement in 2010 and has been a source of cash for U.S. operations and projects.
Net cash provided by operating activities of $23.5 million increased $6.0 million for the first ninethree months of 2017ended March 31, 2024 was $1.5 million, a 49% increase compared to the $1.0 million net cash provided by operating activities for the same period in 2023. While net sales decreased by 40% for the three months ended March 31, 2024, compared to the same period in 2016, primarily2023, due to an increase in net income.
lower grades and lower recoveries, production costs only decreased by 19% due to the strengthening of peso and higher inflation.
Net cash used in investing activities of $20.6 million increased $8.4$2.0 million for the first ninethree months of 2017 compared toended March 31, 2024 decreased from $3.1 million from the same period in 2016 due2023. The decrease is mainly attributed to increased mine developmentplanned reduction in our Arista Mineinvesting activities to reserve cash. Investing activities in both 2024 and the purchase of additional mineral rights and equipment at our Nevada Mining Unit.
2023 are mainly attributable to continued reinvestment in DDGM.
Net cash used in financing activities decreased $0.1 million for both the first ninethree months ended March 31, 2024 and 2023 were immaterial.
While current macro risk factors, such as economic uncertainties and supply chain interruptions have not had a significant adverse impact on exploration plans, results of 2017 compared tooperations, financial position, and cash flows during the same period in 2016 primarily due to proceeds of the exercise of stock options and the early repayment of capital leases which occurred in 2016.
Wecurrent fiscal year, future impacts are unknown at this time. However, we believe that ourthere is sufficient liquidity and capital resources are adequate to fund our operations and corporate activities for the foreseeable future.
The Company’s At The Market Offering Agreement with H.C. Wainwright & Co., LLC (the “Agent”), which was entered into in November 2019 (the “ATM Agreement”), pursuant to which the Agent agreed to act as the Company’s sales agent with respect to the offer and sale from time to time of the Company’s common stock having an aggregate gross sales price of up to $75.0 million, was renewed in June 2023. There were no ATM sales during the three months ended March 31, 2024 and 2023. Subsequent to end of the first quarter, through May 2, 2024, an aggregate of 1,977,401 shares of the Company’s common stock were sold and settled through the ATM Agreement for net proceeds to the Company of $1.1 million, after deducting the Agent’s commissions and other expenses.
Gold Resource Corporation—Management’s Discussion and Analysis of Financial Condition and Results of Operations
40
Accounting Developments
For a discussion of Recently Adoptedrecently adopted and Recently Issuedrecently issued accounting pronouncements, please see Note 2—New Accounting Pronouncements please see Note 2 to thein Item 1—Condensed Consolidated Interim Financial Statements and Notes (unaudited) above.
Contractual Obligations
Please see Note 11 to the Condensed Consolidated Financial Statements.
Critical Accounting Estimates
There have been no changes in our critical accounting estimates since December 31, 2016.
Forward-Looking Statements
This report contains or incorporates by reference “forward-looking statements,statements” within the meaning of Section 27A of the Securities Act of 1933 and Section 21E of the Securities Exchange Act of 1934. We use the words “anticipate,” as that term is used in federal securities laws, about our financial condition, results of operations“continue,” “likely,” “estimate,” “expect,” “may,” “could,” “will,” “project,” “should,” “believe,” and business. Thesesimilar expressions (including negative and grammatical variations) to identify forward looking statements. Such forward-looking statements include, among others: without limitation, statements regarding:
| ● | ·
Our strategy for significant future investment in Oaxaca, Mexico, and in Michigan, USA, for development and exploration activities; |
| ● | The expected timing for the Back Forty Project, including permitting, detailed engineering, and project financing; |
| ● | statements about ourExpectations regarding the likelihood of a successful mine permitting process at the Back Forty Project;
|
| ● | Our expectations regarding future grades and recoveries from mining at DDGM; |
| ● | Expectations regarding capital investment, exploration spending, and general and administrative costs; |
| ● | Future exploration plans at DDGM, including vein systems targeted for future exploration permitting,activity; |
| ● | Compliance with existing legal and plans for developmentregulatory requirements, including future asset reclamation costs; |
| ● | Estimates of our properties;Mineral Resources and Mineral Reserves; |
| ● | ·
| | statements concerningOur expectations regarding whether dividends will be paid in the benefits that we expect will result from our business activitiesfuture; and certain transactions that we contemplate or have completed, such as receipt of proceeds, decreased expenses and avoided expenses and expenditures; and
|
| ● | ·
| | statements ofOur ability to satisfy our expectations, beliefs, future plans and strategies, our targets, exploration activities, anticipated developmentsobligations and other matters that are not historical facts.
potential cash requirements over the next twelve months. |
TheseForward-looking statements may be made expressly in this document or may be incorporated by reference fromare neither historical facts nor assurances of future performance. Rather, they are based only on our current beliefs, expectations, and assumptions regarding the future of our business, future plans and strategies, projections, anticipated events and trends, the economy, and other documents that we will file with the SEC. You can find many of these statements by looking for words such as “believes,” “expects,” “targets,” “anticipates,” “estimates,” or similar expressions used in this report or incorporated by reference in this report.
Thesefuture conditions. Because forward-looking statements relate to the future, they are subject to numerous assumptions,inherent uncertainties, risks, and uncertaintieschanges in circumstances that may causeare difficult to predict, and many of which are outside of our control. Our actual results to be materially different from any future results expressed or implied in those statements. Because the statements are subject to risks and uncertainties, actual resultsfinancial condition may differ materially from those expressedindicated in the forward-looking statements. Therefore, you should not rely on any of these forward-looking statements. Important factors that could cause our actual results and financial condition to differ materially from those indicated in the forward-looking statements include, among others, the following:
| ● | Commodity price fluctuations; |
| ● | Mine protests and work stoppages; |
| ● | Rock formations, faults and fractures, water flow and possible CO2 gas exhalation, or other unanticipated geological challenges; |
| ● | Unexpected changes in business and economic conditions, including supply chain challenges, the rate of inflation, and their impact on operating and capital costs; |
| ● | Changes in interest rates and currency exchange rates; |
| ● | Adverse technological changes and cybersecurity threats; |
Gold Resource Corporation—Management’s Discussion and Analysis of Financial Condition and Results of Operations
41
| ● | Unanticipated increases in our operating costs and other costs of doing business; |
| ● | The Company’s inability to secure financing when needed; |
| ● | Access to land and availability of materials, equipment, supplies, labor and supervision, power, and water; |
| ● | Results of current and future feasibility studies; |
| ● | Interpretation of drill hole results and the geology, grade, and continuity of mineralization; |
| ● | Litigation by private parties or regulatory action by governmental entities; |
| ● | Acts of God, such as floods, earthquakes, and any other natural disasters; |
| ● | The inherent uncertainty of Mineral Resource and Mineral Reserve estimates; and |
| ● | Such other factors are discussed below under Item 1A—Risk Factors in Part II—Other Information. |
Many of these factors are beyond our ability to control or implied. We caution youpredict. Although we believe that the expectations reflected in our forward-looking statements are based on reasonable assumptions, such expectations may prove to be materially incorrect due to known and unknown risks and uncertainties. You should not to put undue relianceunduly rely on theseany of our forward-looking statements. These statements which speak only as of the date of this report. Further,Quarterly Report on Form 10-Q. Except as required by law, we are not obligated to publicly release any revisions to these forward-looking statements to reflect future events or developments. All subsequent written and oral forward-looking statements attributable to us and persons acting on our behalf are qualified in their entirety by the informationcautionary statements contained in this document or incorporated herein by reference is a statement of our present intentionsection and is basedelsewhere in this Quarterly Report on present facts and assumptions, which may change at any time and without notice, based on changes in such facts or assumptions.Form 10-Q.
Risk Factors Impacting Forward-Looking Statements
The important factors that could prevent us from achieving our stated goals and objectives include, but are not limited to, those set forth in other reports we have filed with the SEC, including our Form 10-K for the year ended December 31, 2016 and the following:
| ·
| | Changes in the worldwide price for gold and/or silver;
|
| ·
| | Volatility in the equities markets;
|
| ·
| | Adverse results from our exploration or production efforts;
|
| ·
| | Producing at rates lower than those targeted;
|
| ·
| | Political and regulatory risks;
|
| ·
| | Weather conditions, including unusually heavy rains;
|
| ·
| | Earthquakes or other unforeseen ground movements impacting mining or processing;
|
| ·
| | Failure to meet our revenue or profit goals or operating budget;
|
| ·
| | Decline in demand for our common stock;
|
| ·
| | Downward revisions in securities analysts’ estimates or changes in general market conditions;
|
| ·
| | Technological innovations by competitors or in competing technologies;
|
| ·
| | Investor perception of our industry or our prospects;
|
24Gold Resource Corporation—Management’s Discussion and Analysis of Financial Condition and Results of Operations
42
| ·
| | Actions by government central banks; and
|
| ·
| | General economic trends.
|
We undertake no responsibility or obligation to update publicly these forward-looking statements, but may do so in the future in written or oral statements. Investors should take note of any future statements made by us or on our behalf.
ITEM 3: Quantitative and Qualitative Disclosures about Market Risk
Our exposure to market risks includes, but is not limited to, the following risks: changes in commodity prices, foreign currency exchange rates, provisional sales contract risks, changes in interest rates, and equity price risks. WeCurrently, we do not use derivative financial instruments as part of an overall strategy to manage market risk; however,risk. However, we may consider such arrangements in the future as we evaluate our business and financial strategy.
Commodity Price Risk
TheThe results of our operations, cash flows, and financial condition largely depend in large part upon the market prices of gold, and silver, and to a lesser extent on base metal prices of copper, lead, and zinc. Gold and silverMetal prices fluctuate widely and are affected by numerous factors beyond our control. The level of interest rates, the rate of inflation, government fiscal and monetary policy, the stability of exchange rates, and the world supply of and demand for gold, silver, and other metals, among other factors, can all cause significant fluctuations in commodity prices. Such external economic factors are, in turn, influenced by changes in international investment patterns, monetary systems, and political developments. The metal price of gold and silver hasmarkets have fluctuated widely in recent years, and future price declines could cause a mineral project to become uneconomic, thereby having a material adverse effect on our business and financial condition. We haveCurrently, we are not entered intounitizing derivative contracts to protect the selling price for gold, silver, copper, lead, or silver.zinc. We may, in the future, more actively manage our exposure through additional derivative contracts, or other commodity price risk management programs, although we have no intention of doing so in the near-term.
near term.
In addition to materially adversely affecting our reserve estimates, results of operations and/or our financial condition, declining gold and silver prices could require a reassessment of the feasibility of a project. Even if a project is ultimately determined to be economically viable, the need to conduct such a reassessment may cause delays in the implementation of a project.
Foreign Currency Risk
Our foreign operation sells its gold, silver, copper, lead, and zinc production based on U.S. dollar metal prices. Fluctuations in foreign currency exchange rates do not have a material impact on our revenue since gold, silver, copper, lead, and zinc are sold worldwide in U.S. dollars.
Foreign currency exchange rate fluctuations can increase or decrease our costs to the extent that we pay costs in currencies other than the U.S. dollar.Dollar. We are primarily impacted by Mexican peso rate changes relative to the U.S. Dollar.Dollar, as we incur some costs in the Mexican peso. When the value of the peso rises in relation to the U.S. Dollar, some of our costs in Mexico may increase, thus materially adversely affecting our operating results. Alternatively, when the value of the peso drops in relation to the USU.S. Dollar, peso-denominated costs in Mexico will decrease in U.S. Dollar terms. These fluctuations do not impact our revenues since we sell our metals in U.S. dollars. Future fluctuations may give rise to foreign currency exposure, which may affect our financial results.
results. Approximately 50% to 60% of expenses are paid in currencies other than the U.S. dollar.
We have not utilized market-risk sensitive instruments to manage our exposure to foreign currency exchange rates butrates. However, we may, in the future, actively manage our exposure to foreign currency exchange rate risk.
Gold Resource Corporation
43
Provisional Sales Contract Risk
We enter into concentrate sales contracts, which, in general, provide for a provisional payment to us based upon provisional assays and prices. The provisionally priced sales contracts contain an embedded derivative that is required to be separated from the host contract for accounting purposes. The host contract is the receivable from the sale of concentrates determined at the average forwardquoted metal prices at the time of sale.shipment delivery to the customer. The embedded derivative, which is the final settlement based on a future price, does not qualify for hedge accounting, and the marked-to-market adjustments are
recorded in net salesis adjusted to market through revenue each period prior to settlement. Changes in the prices of metals between the shipment delivery and the final settlement.settlement date will result in adjustments to revenues related to the sales of concentrate previously recorded upon shipment delivery. Please seeNote 14 to the14—Derivatives in Item 1—Condensed Consolidated Interim Financial Statements and Notes (unaudited) above for additional information.
Interest Rate Risk
We consider our interest rate risk exposure to be insignificant at this time, as our interest rate is related and embedded in immaterial payments for office leases.
Equity Price Risk
We have, in the past, sought and may in the future, seek to acquire additional funding bythrough the sale of common stock and other equity. The price of our common stock has been volatile in the past and may also be volatile in the future. As a result, there is a risk that we may not be able to sell our common stock at an acceptable price should the need for new equity funding arise.arise.
ITEM 4: Controls and Procedures
Evaluation of Disclosure Controls and Procedures
During the fiscal period covered by this report, our management, with the participation of our Chief Executive Officer and Chief Financial Officer, carried out an evaluationevaluated of the effectiveness of the design and operation of our disclosure controls and procedures (as defined in Rules 13a-15(e) and 15d-15(e) of the Securities Exchange Act of 1934, as amended (the “Exchange Act”))amended). Based on such evaluation, our Chief Executive Officer and Chief Financial Officer have concluded that, as of the end of the period covered by this report, our disclosure controls and procedures were effective to ensurein ensuring that information required to be disclosed by us in reports that we file or submit under the Exchange Act are recorded, processed, summarized and reported within the required time periods and are designed to ensure that information required to be disclosed in our reports is accumulated and communicated to our management, including our Chief Executive Officer and Chief Financial Officer as appropriate, to allow timely decisions regarding required disclosure.
Changes in Internal Control Over Financial Reporting
There were no changes that occurred during the three months ended September 30, 2017March 31, 2024 that have materially affected, or are reasonably likely to materially affect, our internal control over financial reporting.
PART II – OTHER INFORMATION
INFORMATION
ITEM 1: Legal Proceedings
In February 2020, a local Ejido community (who claim to be an indigenous community) filed an injunction against the Mexican federal government through which they demanded the cancellation of several concession titles. The federal government ordered a suspension to prevent work related to excavating, drilling, opening tunnels and exploiting the mineral resources on the surface and subsoil of the concessions named in the injunction. Presently, the Don David Gold Mine does not perform such works in the named concessions in lands of the indigenous community. The lawsuit filed in February 2020 has not progressed to a final ruling.
Gold Resource Corporation
44
We know of no other material, existing or pending legal proceedings against us, nor are we involved as a plaintiff in any material proceeding or pending litigation.
ITEM 1A: Risk Factors
Item 1A. Risk Factors of the 2023 Annual Report includes a discussion of our known material risk factors, other than risks that could apply to any issuer or offering. There have been no material changes from the risk factors described in the 2023 Annual Report.
ITEM 2:Unregistered Sales of Equity Securities and Use of Proceeds
None.
ITEM 3: Defaults upon Senior Securities
None.
| (a)
| | In September 2011, our Board of Directors authorized a share repurchase of up to $20.0 million with no pre-established end date. During the first nine months of 2017 we did not repurchase any shares of our common stock on the open market.
|
ITEM 4: Mine Safety Disclosures
While the Company owns an advanced exploration project in Michigan, USA, the project is not yet subject to the Mine Safety and Health Administration jurisdiction and therefore, the mine safety disclosure requirements are not applicable.
ITEM 5: Other Information
None.
ITEM 6: Exhibits
The following exhibits are filed or furnished herewith:herewith or incorporated herein by reference:
* | This document is not being “filed” for purposes of Section 18 of the Securities Exchange Act of 1934, as amended, or otherwise subject to the liabilities of that Section. Registration Statements or other documents filed with the SEC shall not incorporate this exhibit by reference, except as otherwise expressly stated in such filing. |
*This document is not being “filed” for purposes of Section 18 of the Securities Exchange Act of 1934, as amended, or otherwise subject to the liabilities of that Section. Registration Statements or other documents filed with the SEC shall not incorporate this exhibit by reference, except as otherwise expressly stated in such filing.
27Gold Resource Corporation
45
SIGNATURES
Exhibit Index
The following exhibits are filed or furnished herewith:
*This document is not being “filed” for purposes of Section 18 of the Securities Exchange Act of 1934, as amended, or otherwise subject to the liabilities of that Section. Registration Statements or other documents filed with the SEC shall not incorporate this exhibit by reference, except as otherwise expressly stated in such filing.
SIGNATURES
In accordance with Section 13 or 15(d) of the Exchange Act of 1934, the Company has caused this Report to be signed on its behalf by the undersigned, thereunto duly authorized.
| | | |
| | GOLD RESOURCE CORPORATION |
| | | |
Dated: October 31, 2017May 2, 2024 | | | /s/ Jason D. Reid Allen Palmiere |
| | By: | Jason D. Reid,Allen Palmiere,
|
| | | Chief Executive Officer,
President and PresidentDirector |
| | |
| | |
| | |
| |
| | | |
Dated: October 31, 2017May 2, 2024 | | | /s/ John A. LabateChet Holyoak |
| | By: | John A. Labate,Chet Holyoak,
|
| | | Chief Financial Officer |
29Gold Resource Corporation
46