ub
AXT, INC.
CONDENSED CONSOLIDATED STATEMENTS OF OPERATIONS
(Unaudited, in thousands, except per share data)
|
|
|
|
|
|
|
|
|
| September 30, |
| December 31, |
| ||
|
| 2017 |
| 2016 |
| ||
|
|
|
|
|
|
|
|
ASSETS |
|
|
|
|
|
|
|
Current assets: |
|
|
|
|
|
|
|
Cash and cash equivalents |
| $ | 48,078 |
| $ | 36,152 |
|
Short-term investments |
|
| 20,524 |
|
| 11,415 |
|
Accounts receivable, net of allowances of $857 and $1,013 as of September 30, 2017 and December 31, 2016 |
|
| 20,877 |
|
| 14,453 |
|
Inventories |
|
| 40,768 |
|
| 40,152 |
|
Related party notes receivable – current |
|
| 57 |
|
| — |
|
Prepaid expenses and other current assets |
|
| 5,682 |
|
| 5,114 |
|
Total current assets |
|
| 135,986 |
|
| 107,286 |
|
Long-term investments |
|
| 9,685 |
|
| 6,156 |
|
Property, plant and equipment, net |
|
| 42,255 |
|
| 27,805 |
|
Related party notes receivable – long-term |
|
| — |
|
| 157 |
|
Other assets |
|
| 11,696 |
|
| 12,842 |
|
Total assets |
| $ | 199,622 |
| $ | 154,246 |
|
LIABILITIES AND STOCKHOLDERS’ EQUITY |
|
|
|
|
|
|
|
Current liabilities: |
|
|
|
|
|
|
|
Accounts payable |
| $ | 9,499 |
| $ | 6,691 |
|
Accrued liabilities |
|
| 9,284 |
|
| 9,260 |
|
Total current liabilities |
|
| 18,783 |
|
| 15,951 |
|
Long-term portion of royalty payments |
|
| 144 |
|
| 575 |
|
Other long-term liabilities |
|
| 278 |
|
| 330 |
|
Total liabilities |
|
| 19,205 |
|
| 16,856 |
|
Commitments and contingencies (Note 12) |
|
|
|
|
|
|
|
Stockholders’ equity: |
|
|
|
|
|
|
|
Preferred stock Series A, $0.001 par value; 2,000 shares authorized; 883 shares issued and outstanding as of September 30, 2017 and December 31, 2016 (Liquidation preference of $6.8 million and $6.6 million as of September 30, 2017 and December 31, 2016) |
|
| 3,532 |
|
| 3,532 |
|
Common stock, $0.001 par value; 70,000 shares authorized; 38,891 and 33,032 shares issued and outstanding as of September 30, 2017 and December 31, 2016 |
|
| 39 |
|
| 33 |
|
Additional paid-in capital |
|
| 228,516 |
|
| 194,177 |
|
Accumulated deficit |
|
| (57,971) |
|
| (64,985) |
|
Accumulated other comprehensive income |
|
| 2,275 |
|
| 253 |
|
Total AXT, Inc. stockholders’ equity |
|
| 176,391 |
|
| 133,010 |
|
Noncontrolling interests |
|
| 4,026 |
|
| 4,380 |
|
Total stockholders’ equity |
|
| 180,417 |
|
| 137,390 |
|
Total liabilities and stockholders’ equity |
| $ | 199,622 |
| $ | 154,246 |
|
| | | | | | |
|
| Three Months Ended | ||||
| | March 31, | ||||
| | 2024 |
| 2023 | ||
| | | | | | |
Revenue | | $ | 22,688 | | $ | 19,405 |
Cost of revenue | |
| 16,594 | |
| 14,295 |
Gross profit | |
| 6,094 | |
| 5,110 |
Operating expenses: | | | | | | |
Selling, general and administrative | |
| 6,227 | |
| 5,952 |
Research and development | |
| 3,214 | |
| 3,595 |
Total operating expenses | |
| 9,441 | |
| 9,547 |
Loss from operations | |
| (3,347) | |
| (4,437) |
Interest expense, net | |
| (349) | |
| (397) |
Equity in income of unconsolidated joint ventures | |
| 890 | |
| 1,034 |
Other income, net | |
| 1,032 | |
| 282 |
Loss before provision for income taxes | |
| (1,774) | |
| (3,518) |
Provision for income taxes | |
| 274 | |
| 148 |
Net loss | |
| (2,048) | |
| (3,666) |
Less: Net (income) loss attributable to noncontrolling interests and redeemable noncontrolling interests | |
| (35) | |
| 318 |
Net loss attributable to AXT, Inc. | | $ | (2,083) | | $ | (3,348) |
Net loss attributable to AXT, Inc. per common share: | | | | | | |
Basic | | $ | (0.05) | | $ | (0.08) |
Diluted | | $ | (0.05) | | $ | (0.08) |
Weighted-average number of common shares outstanding: | | | | | | |
Basic | |
| 42,987 | |
| 42,498 |
Diluted | |
| 42,987 | |
| 42,498 |
See accompanying notes to condensed consolidated financial statements.
34
AXT, INC.
CONDENSED CONSOLIDATED STATEMENTS OF OPERATIONS
(Unaudited, in thousands, except per share data)thousands)
|
|
|
|
|
|
|
|
|
|
|
|
|
|
|
|
| Three Months Ended |
| Nine Months Ended |
|
| ||||||||
|
| September 30, |
| September 30, |
|
| ||||||||
|
| 2017 |
| 2016 |
| 2017 |
| 2016 |
|
| ||||
|
|
|
|
|
|
|
|
|
|
|
|
|
|
|
Revenue |
| $ | 28,168 |
| $ | 21,872 |
| $ | 72,341 |
| $ | 61,080 |
|
|
Cost of revenue |
|
| 17,035 |
|
| 14,294 |
|
| 47,664 |
|
| 42,222 |
|
|
Gross profit |
|
| 11,133 |
|
| 7,578 |
|
| 24,677 |
|
| 18,858 |
|
|
Operating expenses: |
|
|
|
|
|
|
|
|
|
|
|
|
|
|
Selling, general and administrative |
|
| 4,484 |
|
| 3,313 |
|
| 12,219 |
|
| 10,106 |
|
|
Research and development |
|
| 1,410 |
|
| 1,566 |
|
| 3,553 |
|
| 4,419 |
|
|
Restructuring charge |
|
| — |
|
| — |
|
| — |
|
| 226 |
|
|
Total operating expenses |
|
| 5,894 |
|
| 4,879 |
|
| 15,772 |
|
| 14,751 |
|
|
Income from operations |
|
| 5,239 |
|
| 2,699 |
|
| 8,905 |
|
| 4,107 |
|
|
Interest income, net |
|
| 122 |
|
| 105 |
|
| 334 |
|
| 303 |
|
|
Equity in loss of unconsolidated joint ventures |
|
| (266) |
|
| (581) |
|
| (1,387) |
|
| (1,437) |
|
|
Other (expense) income, net |
|
| (349) |
|
| 164 |
|
| (403) |
|
| 682 |
|
|
Income before provision for income taxes |
|
| 4,746 |
|
| 2,387 |
|
| 7,449 |
|
| 3,655 |
|
|
Provision for income taxes |
|
| 181 |
|
| 176 |
|
| 661 |
|
| 713 |
|
|
Net income |
|
| 4,565 |
|
| 2,211 |
|
| 6,788 |
|
| 2,942 |
|
|
Less: Net (income) loss attributable to noncontrolling interests |
|
| (146) |
|
| 18 |
|
| 226 |
|
| 480 |
|
|
Net income attributable to AXT, Inc. |
| $ | 4,419 |
| $ | 2,229 |
| $ | 7,014 |
| $ | 3,422 |
|
|
Net income attributable to AXT, Inc. per common share: |
|
|
|
|
|
|
|
|
|
|
|
|
|
|
Basic |
| $ | 0.11 |
| $ | 0.07 |
| $ | 0.19 |
| $ | 0.10 |
|
|
Diluted |
| $ | 0.11 |
| $ | 0.07 |
| $ | 0.18 |
| $ | 0.10 |
|
|
Weighted average number of common shares outstanding: |
|
|
|
|
|
|
|
|
|
|
|
|
|
|
Basic |
|
| 38,499 |
|
| 32,110 |
|
| 36,999 |
|
| 32,043 |
|
|
Diluted |
|
| 40,095 |
|
| 33,138 |
|
| 38,469 |
|
| 32,615 |
|
|
| | | | | | | | |
| | Three Months Ended | | | ||||
| | March 31, | | | ||||
|
| 2024 |
| 2023 |
|
| ||
| | | | | | | | |
Net loss | | $ | (2,048) | | $ | (3,666) | | |
Other comprehensive income (loss), net of tax: | | | | | | | | |
Change in foreign currency translation gain (loss), net of tax | |
| (2,010) | |
| 887 | | |
Change in unrealized gain on available-for-sale debt investments, net of tax | |
| 7 | |
| 111 | | |
Total other comprehensive income (loss), net of tax | |
| (2,003) | |
| 998 | | |
Comprehensive loss attributable to AXT, Inc. | |
| (4,051) | |
| (2,668) | | |
Less: Comprehensive loss attributable to noncontrolling interests and redeemable noncontrolling interests | |
| 341 | |
| 178 | | |
Comprehensive loss attributable to AXT, Inc. | | $ | (3,710) | | $ | (2,490) | | |
See accompanying notes to condensed consolidated financial statements.
45
AXT, INC.
CONDENSED CONSOLIDATED STATEMENTS OF COMPREHENSIVE INCOME
(Unaudited, in thousands)
| | | | | | | |
| | Three Months Ended | | ||||
| | March 31, | | ||||
|
| 2024 |
| 2023 | | ||
Cash flows from operating activities: | | | | | | | |
Net Loss | | $ | (2,048) | | $ | (3,666) | |
Adjustments to reconcile net loss to net cash used in operating activities: | | | | | | | |
Depreciation and amortization | |
| 2,192 | |
| 2,118 | |
Amortization of marketable securities premium | |
| — | |
| 7 | |
Stock-based compensation | |
| 809 | |
| 915 | |
(Gain) Loss on disposal of equipment | |
| — | |
| 5 | |
Equity in income of unconsolidated joint ventures | |
| (890) | |
| (1,034) | |
Deferred tax assets | | | 40 | | | (10) | |
Changes in operating assets and liabilities: | | | | | | | |
Accounts receivable | |
| (6,076) | |
| 7,982 | |
Inventories | |
| (720) | |
| (1,466) | |
Prepaid expenses and other current assets | |
| (375) | |
| 1,965 | |
Other assets | |
| 65 | |
| (1,055) | |
Accounts payable | |
| 815 | |
| (3,351) | |
Accrued liabilities | |
| (558) | |
| (1,568) | |
Other long-term liabilities | |
| (2,060) | |
| (2,376) | |
Net cash used in operating activities | |
| (8,806) | |
| (1,534) | |
Cash flows from investing activities: | | | | | | | |
Purchases of property, plant and equipment | |
| (4,392) | |
| (3,616) | |
Proceeds from sales and maturities of available-for-sale debt securities | |
| 480 | |
| 2,903 | |
Net cash used in investing activities | |
| (3,912) | |
| (713) | |
Cash flows from financing activities: | | | | | | | |
Proceeds from common stock options exercised | |
| 20 | |
| 8 | |
Proceeds from short-term bank loans | |
| 12,858 | |
| 18,372 | |
Payments on short-term bank loans | | | (16,541) | | | (12,810) | |
Proceeds from capital increase in subsidiary shares from noncontrolling interests | | | — | | | 203 | |
Proceeds from long-term loan | | | 5,831 | | | — | |
Payments on long-term loan | | | (168) | | | — | |
Net cash provided by financing activities | |
| 2,000 | |
| 5,773 | |
Effect of exchange rate changes on cash and restricted cash | |
| 204 | |
| 19 | |
Net increase (decrease) in cash and restricted cash | |
| (10,514) | |
| 3,545 | |
Cash and restricted cash at the beginning of the year | |
| 50,114 | |
| 41,348 | |
Cash and restricted cash at the end of the period | | $ | 39,600 | | $ | 44,893 | |
Supplemental disclosure of non-cash flow information: | | | | | | | |
Notes receivables paid to purchase fixed assets | | $ | 1,377 | | $ | — | |
Investment in subsidiary shares from noncontrolling interest | | $ | — | | $ | 72 | |
Consideration payable in connection with construction in progress, included in accrued liabilities | | $ | 21 | | $ | — | |
|
|
|
|
|
|
|
|
|
|
|
|
|
|
|
|
|
|
|
|
|
|
|
|
|
|
|
|
|
|
|
|
|
|
|
|
|
|
|
|
|
|
|
| Three Months Ended |
| Nine Months Ended |
| ||||||||
|
| September 30, |
| September 30, |
| ||||||||
|
| 2017 |
| 2016 |
| 2017 |
| 2016 |
| ||||
|
|
|
|
|
|
|
|
|
|
|
|
|
|
Net income |
| $ | 4,565 |
| $ | 2,211 |
| $ | 6,788 |
| $ | 2,942 |
|
Other comprehensive income (loss), net of tax: |
|
|
|
|
|
|
|
|
|
|
|
|
|
Change in foreign currency translation gain (loss), net of tax |
|
| 1,135 |
|
| (233) |
|
| 2,457 |
|
| (1,801) |
|
Change in unrealized gain (loss) on available-for-sale investments, net of tax |
|
| 27 |
|
| (112) |
|
| (98) |
|
| (253) |
|
Total other comprehensive income (loss), net of tax |
|
| 1,162 |
|
| (345) |
|
| 2,359 |
|
| (2,054) |
|
Comprehensive income |
|
| 5,727 |
|
| 1,866 |
|
| 9,147 |
|
| 888 |
|
Less: Comprehensive (income) loss attributable to noncontrolling interests |
|
| (326) |
|
| 48 |
|
| (111) |
|
| 681 |
|
Comprehensive income attributable to AXT, Inc. |
| $ | 5,401 |
| $ | 1,914 |
| $ | 9,036 |
| $ | 1,569 |
|
See accompanying notes to condensed consolidated financial statements.
5
AXT, INC.
CONDENSED CONSOLIDATED STATEMENTS OF CASH FLOWS
(Unaudited, in thousands)
|
|
|
|
|
|
|
|
|
| Nine Months Ended |
| ||||
|
| September 30, |
| ||||
|
| 2017 |
| 2016 |
| ||
Cash flows from operating activities: |
|
|
|
|
|
|
|
Net income |
| $ | 6,788 |
| $ | 2,942 |
|
Adjustments to reconcile net income to net cash provided by operating activities: |
|
|
|
|
|
|
|
Depreciation and amortization |
|
| 3,361 |
|
| 3,620 |
|
Amortization of marketable securities premium |
|
| 124 |
|
| 85 |
|
Impairment charge on equity investee |
|
| 313 |
|
| — |
|
Stock-based compensation |
|
| 961 |
|
| 789 |
|
Realized gain on sale of available-for-sale securities |
|
| (77) |
|
| (429) |
|
Gain on disposal of equipment |
|
| — |
|
| (5) |
|
Loss from equity method investments, net |
|
| 1,074 |
|
| 1,437 |
|
Changes in operating assets and liabilities: |
|
|
|
|
|
|
|
Accounts receivable |
|
| (6,206) |
|
| (72) |
|
Inventories |
|
| (66) |
|
| (1,092) |
|
Prepaid expenses and other current assets |
|
| (587) |
|
| (1,259) |
|
Other assets |
|
| 64 |
|
| 435 |
|
Accounts payable |
|
| 2,589 |
|
| 949 |
|
Accrued liabilities |
|
| (107) | * |
| (1,301) | * |
Other long-term liabilities, including royalties |
|
| (241) |
|
| (591) |
|
Net cash provided by operating activities |
|
| 7,990 |
|
| 5,508 |
|
Cash flows from investing activities: |
|
|
|
|
|
|
|
Purchases of equipment |
|
| (16,557) |
|
| (2,200) |
|
Proceeds from sale of equipment |
|
| — |
|
| 35 |
|
Purchases of available-for-sale securities |
|
| (26,093) |
|
| (10,784) |
|
Proceeds from sales and maturities of available-for-sale securities |
|
| 13,310 |
|
| 12,316 |
|
Repayment of related party notes receivable |
|
| 108 |
|
| — |
|
Net cash used in investing activities |
|
| (29,232) |
|
| (633) |
|
Cash flows from financing activities: |
|
|
|
|
|
|
|
Proceeds from issuance of common stock and options exercised, net of issuance costs |
|
| 33,384 |
|
| 428 |
|
Dividends paid by joint ventures to their minority shareholders |
|
| (465) |
|
| (39) |
|
Net cash provided by financing activities |
|
| 32,919 |
|
| 389 |
|
Effect of exchange rate changes on cash and cash equivalents |
|
| 249 |
|
| (478) |
|
Net increase in cash and cash equivalents |
|
| 11,926 |
|
| 4,786 |
|
Cash and cash equivalents at the beginning of the period |
|
| 36,152 |
|
| 24,875 |
|
Cash and cash equivalents at the end of the period |
| $ | 48,078 |
| $ | 29,661 |
|
* Dividend accrued but not paid by one of our consolidated subsidiaries of $521 and $520 was included in accrued liabilities as of September 30, 2017 and September 30, 2016, respectively.
See accompanying notes to condensed consolidated financial statements.
6
AXT, INC.
NOTES TO CONDENSED CONSOLIDATED FINANCIAL STATEMENTS
(Unaudited)
Note 1. Basis of Presentation
The accompanying condensed consolidated financial statements of AXT, Inc. (“AXT,” the “Company,” “we,” “us,” and “our” refer to AXT, Inc. and all of its consolidated subsidiaries) are unaudited, and have been prepared in accordance with accounting principles generally accepted in the United States of America (“U.S. GAAP”) for interim financial information and with the instructions to Form 10-Q and Article 10 of Regulation S-X. Accordingly, this interim quarterly financial report does not include all disclosures required by accounting principles generally accepted in the United States of America.U.S. GAAP. In the opinion of our management, the unaudited condensed consolidated financial statements reflect all adjustments, consisting only of normal recurring adjustments, considered necessary to present fairly the financial position, results of operations and cash flows of AXT, and our consolidated subsidiariesInc. for all periods presented.
Certain reclassifications have been made to prior periods’ financial statements to conform to the current period presentation. These reclassifications did not result in any change in previously reported net income or total assets.
Our management has made a number of estimates and assumptions relating to the reporting of assets and liabilities and the disclosure of contingent assets and liabilities to prepare these condensed consolidated financial statements in conformity with accounting principles generally acceptedU.S. GAAP. Due to the COVID-19 pandemic, there has been uncertainty and disruption in the United States of America.global economy and financial markets. These estimates and assumptions may change as new events occur and additional information is obtained. Actual results could differ materially from those estimates.
The results of operations for the three and nine months ended September 30, 2017March 31, 2024 are not necessarily indicative of the results to be expected in the future or for the full fiscal year. It is recommended that these condensed consolidated financial statements be read in conjunction with our consolidated financial statements and the notes thereto included in our 20162023 Annual Report on Form 10-K filed with the Securities and Exchange Commission (the “SEC”) on February 27, 2017 and our quarterly reports on Form 10-Q for the three months ended March 31, 2017 and June 30, 2017 filed with the SEC on May 8, 2017 and August 4, 2017, respectively. 15, 2024.
The condensed consolidated financial statements include the accounts of AXT and our wholly-owned subsidiary,consolidated subsidiaries, Beijing Tongmei Xtal Technology Co., Ltd. (“Tongmei”), and our majority-owned, or significantly controlled subsidiaries, Beijing JiYa Semiconductor MaterialAXT-Tongmei, Inc. (“AXT-Tongmei”), Baoding Tongmei Xtal Technology Co., Ltd. (“Baoding Tongmei”), ChaoYang Tongmei Xtal Technology Co., Ltd. (“ChaoYang Tongmei”), ChaoYang LiMei Semiconductor Technology Co., Ltd. (“ChaoYang LiMei”), ChaoYang XinMei High Purity Semiconductor Materials Co., Ltd. (“ChaoYang XinMei”), Nanjing JinMei Gallium Co., Ltd. (“JinMei”), ChaoYang JinMei Gallium Ltd. (“ChaoYang JinMei”), ChaoYang ShuoMei High Purity Semiconductor Materials Co., Ltd. (“ChaoYang ShuoMei”), MaAnShan JinMei Gallium Ltd., (“MaAnShan JinMei”) and Beijing BoYu Semiconductor Vessel Craftwork Technology Co., Ltd. (“BoYu”). All significant inter‑companyinter-company accounts and transactions have been eliminated. Investments in business entities in which we do not have controlling interests, but have the ability to exercise significant influence over operating and financial policies (generally 20-50% ownership), are accounted for by the equity method. As of March 31, 2024 and December 31, 2023, we have three companies accounted for by the equity method. In May 2023, we reduced our ownership in Emeishan Jia Mei High Purity Metals Co., Ltd. (“Jia Mei”) from 25% to 10% by selling a portion of our Jia Mei shares to an unrelated third party for approximately $827,000. As a result of our decreased ownership and the fact that we do not have the ability to exercise significant influence over Jia Mei’s operations, as of May 2023, we no longer reported Jia Mei as an equity investment in our condensed consolidated balance sheets. Our Jia Mei investment was re-measured to fair value at the time of sale. Any future changes to the fair value are recognized through net income (“fair value method”). For partially-ownedthe majority-owned subsidiaries that we consolidate, we reflect the noncontrolling interest of the portion we do not own as either noncontrolling interests in stockholder’s equity or as redeemable noncontrolling interests in temporary equity on our condensed consolidated balance sheets in stockholders’ equity and in our condensed consolidated statements of operations.
When warranted by favorable market conditions, we intend to construct facilities at the ChaoYang LiMei location to provide us with additional production capacity. For the three months ended March 31, 2024, expenses associated with ChaoYang LiMei had a de minimis impact on our condensed consolidated financial statements.
In February 2021, Tongmei signed a joint venture agreement with certain investors to fund a new company, ChaoYang XinMei. The agreement called for a total investment of approximately $3.0 million, of which Tongmei would
7
fund approximately $1.8 million for a 58.5 percent ownership of ChaoYang XinMei. In February 2021, Tongmei and the investors completed the initial funding of approximately $1.5 million. Tongmei’s portion of the investment was approximately $0.9 million. In May 2021, Tongmei and the investors completed the funding of the remaining balance of approximately $1.5 million. Tongmei’s portion of the final investment was approximately $0.9 million, for a total investment of approximately $1.8 million for a 58.5 percent ownership of ChaoYang XinMei. In September 2021 and October 2021, ChaoYang XinMei received funding from a minority investor of $0.9 million and $1.0 million, respectively. In December 2021 and January 2022, ChaoYang XinMei received funding from Tongmei of $1.4 million and $1.4 million, respectively. In January 2022, the China local government certified this additional funding in ChaoYang XinMei as an equity investment. In April 2022, Tongmei entered into a capital increase agreement (the “Capital Increase Agreement”) with minority investors to further invest approximately $4.5 million in ChaoYang XinMei. Tongmei’s portion of the investment was approximately $2.6 million, of which $1.1 million was invested in April 2022 and $0.8 million was invested in May 2022. The minority investors’ portion of the investment was approximately $1.9 million, of which $0.7 million was invested in April 2022 and $0.6 million was invested in May 2022. As a result, noncontrolling interests increased $1.4 million and redeemable noncontrolling interests increased $0.1 million. In July 2022, Tongmei and the minority investors further invested $0.8 million and $0.6 million in ChaoYang XinMei, respectively. This completed the investment obligations under the Capital Increase Agreement. As a result, noncontrolling interests increased $610,000 and redeemable noncontrolling interests increased $57,000. Tongmei’s ownership remained at 58.5% after these equity investments.
In April 2022, ChaoYang JinMei signed a joint venture agreement with certain investors to fund a new company, ChaoYang ShuoMei, our consolidated subsidiary (the “ChaoYang ShuoMei Joint Venture Agreement”). The ChaoYang ShuoMei Joint Venture Agreement called for a total investment of approximately $4.4 million, of which ChaoYang JinMei would fund approximately $3.3 million for a 75 percent ownership of ChaoYang ShuoMei. In July and August 2022, ChaoYang JinMei completed the initial funding of $1.0 million in ChaoYang ShuoMei. In August 2022, the investor invested $334,000 in ChaoYang ShuoMei. As a result, noncontrolling interests increased $406,000 and redeemable noncontrolling interests increased $73,000. In January 2023, ChaoYang ShuoMei received $0.5 million in funding from ChaoYang JinMei and $0.2 million in funding from one of the minority investors. As a result, noncontrolling interests increased $0.2 million and redeemable noncontrolling interests increased $36,000. In May 2023, ChaoYang ShuoMei received $1.0 million in funding from ChaoYang JinMei and $0.3 million in funding from one of the minority investors. As a result, noncontrolling interests increased $0.4 million and redeemable noncontrolling interests increased $75,000. In August 2023, ChaoYang ShuoMei received $0.6 million in funding from ChaoYang JinMei and $0.2 million in funding from one of the minority investors. As a result, noncontrolling interests increased $0.2 million and redeemable noncontrolling interests increased $44,000. ChaoYang JinMei has completed its investment obligations under the ChaoYang ShuoMei Joint Venture Agreement. ChaoYang JinMei’s ownership of ChaoYang ShuoMei remained at 75% after these equity investments.
In April 2022, Tongmei signed a joint venture agreement with certain investors to fund a new company, ChaoYang KaiMei Quartz Co., Ltd. (“ChaoYang KaiMei”) (the “ChaoYang KaiMei Joint Venture Agreement”), which called for a total investment of approximately $7.6 million, of which Tongmei would fund approximately $3.0 million for a 40 percent ownership of ChaoYang KaiMei. In July 2022, Tongmei and the investors completed the initial funding of approximately $2.2 million. Tongmei’s portion of the investment was approximately $0.9 million. In January 2023, Tongmei made an investment of $0.9 million to ChaoYang KaiMei. In each of July 2023 and August 2023, Tongmei made an investment of approximately $0.6 million in ChaoYang KaiMei. In September 2023, Tongmei entered into another joint venture agreement with the same group of investors. This new agreement called for additional investment of approximately $5.6 million, with Tongmei committing to fund approximately $2.3 million. In December 2023, Tongmei made its initial additional investment of approximately $0.6 million in ChaoYang KaiMei. These contributions culminated in the fulfillment of all of Tongmei’s financial obligations under the ChaoYang KaiMei Joint Venture Agreement. Tongmei’s ownership of ChaoYang KaiMei remained at 40% after these equity investments.
All activities for MaAnShan JinMei ceased during the first half of 2022 and the subsidiary was subsequently dissolved in May 2022. The dissolution of MaAnShan JinMei had a de minimis impact on the condensed consolidated results.
8
During the quarter ended December 31, 2020, Tongmei entered into two sets of definitive transaction documents, each consisting of a capital increase agreement along with certain supplemental agreements in substantially the same form (collectively, the “Capital Investment Agreements”), with several private equity investors in China.
In preparation for Tongmei’s application for a listing of shares in an initial public offering (the “IPO”) on the Shanghai Stock Exchange’s Sci-Tech innovAtion boaRd (the “STAR Market”), in late December 2020, we reorganized our entity structures in China. JinMei and BoYu and their subsidiaries were assigned to Tongmei and effectively merged with Tongmei although they retained their own respective legal entity status and are wholly owned subsidiaries of Tongmei. The 33% minority interest stakeholders of BoYu converted their ownership to a 7.59% minority interest in Tongmei. The 8.5% minority interest stakeholders, employees of JinMei, converted their ownership to a 0.38% minority interest in Tongmei. Further, a number of employees, key managers and contributors purchased a 0.4% minority interest in Tongmei. Additionally, Baoding Tongmei and ChaoYang Tongmei, were assigned to Tongmei as wholly owned subsidiaries. In 2020, the private equity funds (the “Investors”) had transferred approximately $48.1 million of new capital to Tongmei. An additional investment of approximately $1.5 million of new capital was funded in January 2021. Under China regulations these investments must be formally approved by the appropriate government agency and are not deemed to be dilutive until such approval is granted. The government approved the approximately $49 million investment in its entirety on January 25, 2021, at which time the Investors owned a redeemable noncontrolling interest in Tongmei of 7.28%. As of March 31, 2024, Tongmei’s noncontrolling interests and redeemable noncontrolling interests totaled approximately 14.5%. We remain the controlling stakeholder of Tongmei and hold a majority of the board of director positions of Tongmei. In June 2021, we sold AXT-Tongmei to Tongmei for $1. Since Tongmei is 85.5% owned by us, and the transaction was between common interest holders, the transaction was accounted for at net book value and resulted in an increase of $1.2 million to noncontrolling interests and $1.2 million to redeemable noncontrolling interests.
Note 2. Investments and Fair Value Measurements
Our cash and cash equivalents consist of cash and instruments with original maturities of less than three months. Our investments consist of instruments with original maturities of more than three months.months. As of September 30, 2017March 31, 2024 and December 31, 2016,2023, our cash cash equivalents and debt investments are classified as follows (in thousands):
| | | | | | | | | | | | | | | | | | | | | | | | | |
| | March 31, 2024 | | December 31, 2023 |
| ||||||||||||||||||||
|
| | |
| Gross |
| Gross |
| | |
| | |
| Gross |
| Gross |
| | |
| ||||
| | Amortized | | Unrealized | | Unrealized | | Fair | | Amortized | | Unrealized | | Unrealized | | Fair |
| ||||||||
|
| Cost |
| Gain |
| (Loss) |
| Value |
| Cost |
| Gain |
| (Loss) |
| Value |
| ||||||||
Classified as: | | | | | | | | | | | | | | | | | | | | | | | | | |
Cash and restricted cash | | $ | 39,600 | | $ | — | | $ | — | | $ | 39,600 | | $ | 50,114 | | $ | — | | $ | — | | $ | 50,114 | |
Investments (available-for-sale): | | | | | | | | | | | | | | | | | | | | | | | | | |
Certificates of deposit 1 | |
| 1,680 | |
| — | | | (13) | |
| 1,667 | |
| 2,160 | |
| — | | | (20) | |
| 2,140 | |
Total cash, restricted cash and investments | | $ | 41,280 | | $ | — | | $ | (13) | | $ | 41,267 | | $ | 52,274 | | $ | — | | $ | (20) | | $ | 52,254 | |
Contractual maturities on investments: | | | | | | | | | | | | | | | | | | | | | | | | | |
Due within 1 year 2 | | $ | 1,680 | | | | | | | | $ | 1,667 | | $ | 2,160 | | | | | | | | $ | 2,140 | |
| | $ | 1,680 | | | | | | | | $ | 1,667 | | $ | 2,160 | | | | | | | | $ | 2,140 | |
|
|
|
|
|
|
|
|
|
|
|
|
|
|
|
|
|
|
|
|
|
|
|
|
|
|
|
| September 30, 2017 |
| December 31, 2016 |
| ||||||||||||||||||||
|
|
|
|
| Gross |
| Gross |
|
|
|
|
|
|
| Gross |
| Gross |
|
|
|
| ||||
|
| Amortized |
| Unrealized |
| Unrealized |
| Fair |
| Amortized |
| Unrealized |
| Unrealized |
| Fair |
| ||||||||
|
| Cost |
| Gain |
| (Loss) |
| Value |
| Cost |
| Gain |
| (Loss) |
| Value |
| ||||||||
Classified as: |
|
|
|
|
|
|
|
|
|
|
|
|
|
|
|
|
|
|
|
|
|
|
|
|
|
Cash |
| $ | 47,054 |
| $ | — |
| $ | — |
| $ | 47,054 |
| $ | 23,948 |
| $ | — |
| $ | — |
| $ | 23,948 |
|
Cash equivalents: |
|
|
|
|
|
|
|
|
|
|
|
|
|
|
|
|
|
|
|
|
|
|
|
|
|
Certificates of deposit 1 |
|
| 1,024 |
|
| — |
|
| — |
|
| 1,024 |
|
| 12,204 |
|
| — |
|
| — |
|
| 12,204 |
|
Total cash and cash equivalents |
|
| 48,078 |
|
| — |
|
| — |
|
| 48,078 |
|
| 36,152 |
|
| — |
|
| — |
|
| 36,152 |
|
Investments (available-for-sale): |
|
|
|
|
|
|
|
|
|
|
|
|
|
|
|
|
|
|
|
|
|
|
|
|
|
Certificates of deposit 2 |
|
| 6,618 |
|
| 1 |
|
| (12) |
|
| 6,607 |
|
| 8,999 |
|
| 1 |
|
| (20) |
|
| 8,980 |
|
Corporate bonds |
|
| 23,644 |
|
| — |
|
| (42) |
|
| 23,602 |
|
| 8,479 |
|
| — |
|
| (47) |
|
| 8,432 |
|
Corporate equity securities |
|
| — |
|
| — |
|
| — |
|
| — |
|
| 48 |
|
| 111 |
|
| — |
|
| 159 |
|
Total investments |
|
| 30,262 |
|
| 1 |
|
| (54) |
|
| 30,209 |
|
| 17,526 |
|
| 112 |
|
| (67) |
|
| 17,571 |
|
Total cash, cash equivalents and investments |
| $ | 78,340 |
| $ | 1 |
| $ | (54) |
| $ | 78,287 |
| $ | 53,678 |
| $ | 112 |
| $ | (67) |
| $ | 53,723 |
|
Contractual maturities on investments: |
|
|
|
|
|
|
|
|
|
|
|
|
|
|
|
|
|
|
|
|
|
|
|
|
|
Due within 1 year 3 |
| $ | 20,549 |
|
|
|
|
|
|
| $ | 20,524 |
| $ | 11,325 |
|
|
|
|
|
|
| $ | 11,415 |
|
Due after 1 through 5 years 4 |
|
| 9,713 |
|
|
|
|
|
|
|
| 9,685 |
|
| 6,201 |
|
|
|
|
|
|
|
| 6,156 |
|
|
| $ | 30,262 |
|
|
|
|
|
|
| $ | 30,209 |
| $ | 17,526 |
|
|
|
|
|
|
| $ | 17,571 |
|
| 1. |
|
|
| Certificates of deposit with original maturities of more than three months. |
| 2. |
| Classified as “Short-term investments” in our condensed consolidated balance sheets. |
|
|
We manage our debt investments as a single portfolio of highly marketable securities that is intended to be available to meet our current cash requirements. We have no investments in auction rate securities. Certificates of deposit and corporate bonds are typically held until maturity. Corporate equity securities have no maturity and may be sold at any time. Our holding of corporate equity securities consists of common stock of GCS Holdings, Inc. (“GHI”) (previously Global Communication Semiconductors, Inc.), a Taiwan publicly-traded company. We began classifying GHI as an available-for-sale security in
Historically, the second quarter of 2015 when we determined that there was sufficient trading volume in the exchange for the stock to be deemed readily marketable.
During the three months ended March 31, 2017, we sold the remainder of our GHI stock; therefore, there were no GHI transactions in the three months ended September 30, 2017. During the nine months ended September 30, 2017, our cash proceeds from sales of GHI stock were $125,000. Our cost was $48,000 and our gross realized gain from sales of GHI stock was $77,000. As of September 30, 2017, we no longer hold any GHI stock.
During the three months ended September 30, 2016, we sold some of our GHI stock and our cash proceeds from sales of available-for-sale-investments were $113,000. Our cost was $29,000 and our gross realized gain from sales of available-for-sale-investments was $84,000. During the nine months ended September 30, 2016, we sold some of our GHI stock and our cash proceeds from sales of available-for-sale investments were $581,000. Our cost was $152,000 and our gross realized gain from sales of available-for-sale investments was $429,000.
8
The gross unrealized losses related to our portfolio of available-for-sale debt securities were immaterial, and primarily due to changes in interest ratesnormal market fluctuations and market andnot due to increased credit conditionsrisk or other valuation concerns. There was an insignificant amount of the underlying securities. We have determined that the gross unrealized losses on our available-for-sale debt securities as of September 30, 2017 areMarch 31, 2024, and historically, such gross unrealized losses have been temporary in nature.nature and we believe that it is
9
probable the principal and interest will be collected in accordance with the contractual terms. We periodically review our debt investment portfolio at least quarterly, or when there are changes in credit risks or other potential valuation concerns, to identify and evaluate investments that have indications of possible impairment.whether an allowance for credit losses or impairment would be necessary. Factors considered in determining whether a loss is temporary include the magnitude of the decline in market value, the length of time the market value has been below cost (or adjusted cost), credit quality, and our ability and intent to hold the securities for a period of time sufficient to allow for any anticipated recovery in market value.
A portion of our investments would generate a loss if we sold them on September 30, 2017. The following table summarizes the fair value and gross unrealized losses related to available-for-sale debt securities, aggregated by investment category and length of time that individual securities have been in a continuous unrealized loss position as of September 30, 2017March 31, 2024 (in thousands):
|
|
|
|
|
|
|
|
|
|
|
|
|
|
|
|
|
|
|
| |||||||||||||||||||||||||||||||||
|
| In Loss Position |
| In Loss Position |
| Total In |
| |||||||||||||||||||||||||||||||||||||||||||||
|
| < 12 months |
| > 12 months |
| Loss Position |
| |||||||||||||||||||||||||||||||||||||||||||||
|
|
|
|
| Gross |
|
|
|
| Gross |
|
|
|
| Gross |
| ||||||||||||||||||||||||||||||||||||
|
| Fair |
| Unrealized |
| Fair |
| Unrealized |
| Fair |
| Unrealized |
| |||||||||||||||||||||||||||||||||||||||
As of September 30, 2017 |
| Value |
| (Losses) |
| Value |
| (Losses) |
| Value |
| (Losses) |
| |||||||||||||||||||||||||||||||||||||||
| | | | | | | | | | | | | | | | | | | | |||||||||||||||||||||||||||||||||
| | In Loss Position | | In Loss Position | | Total In |
| |||||||||||||||||||||||||||||||||||||||||||||
| | < 12 months | | > 12 months | | Loss Position |
| |||||||||||||||||||||||||||||||||||||||||||||
| | | | | Gross | | | | | Gross | | | | | Gross |
| ||||||||||||||||||||||||||||||||||||
| | Fair | | Unrealized | | Fair | | Unrealized | | Fair | | Unrealized |
| |||||||||||||||||||||||||||||||||||||||
As of March 31, 2024 |
| Value |
| (Losses) |
| Value |
| (Losses) |
| Value |
| (Losses) |
| |||||||||||||||||||||||||||||||||||||||
Investments: |
|
|
|
|
|
|
|
|
|
|
|
|
|
|
|
|
|
|
| | | | | | | | | | | | | | | | | | | | ||||||||||||||
Certificates of deposit |
| $ | 2,564 |
| $ | (6) |
| $ | 2,344 |
| $ | (6) |
| $ | 4,908 |
| $ | (12) |
| | $ | — | | $ | — | | $ | 1,667 | | $ | (13) | | $ | 1,667 | | $ | (13) | | ||||||||||||||
Corporate bonds |
|
| 23,602 |
|
| (42) |
|
| — |
|
| — |
|
| 23,602 |
|
| (42) |
| |||||||||||||||||||||||||||||||||
Total in loss position |
| $ | 26,166 |
| $ | (48) |
| $ | 2,344 |
| $ | (6) |
| $ | 28,510 |
| $ | (54) |
| | $ | — | | $ | — | | $ | 1,667 | | $ | (13) | | $ | 1,667 | | $ | (13) | | ||||||||||||||
The following table summarizes the fair value and gross unrealized losses related to available-for-sale debt securities, aggregated by investment category and length of time that individual securities have been in a continuous unrealized loss position as of December 31, 20162023 (in thousands):
|
|
|
|
|
|
|
|
|
|
|
|
|
|
|
|
| ||||||||||||||||||||||
|
| In Loss Position |
| In Loss Position |
| Total In |
| |||||||||||||||||||||||||||||||
|
| < 12 months |
| > 12 months |
| Loss Position |
| |||||||||||||||||||||||||||||||
|
|
|
| Gross |
|
|
| Gross |
|
|
| Gross |
| |||||||||||||||||||||||||
|
| Fair |
| Unrealized |
| Fair |
| Unrealized |
| Fair |
| Unrealized |
| |||||||||||||||||||||||||
As of December 31, 2016 |
| Value |
| (Loss) |
| Value |
| (Loss) |
| Value |
| (Loss) |
| |||||||||||||||||||||||||
| | | | | | | | | | | | | | | | | | |||||||||||||||||||||
| | In Loss Position | | In Loss Position | | Total In |
| |||||||||||||||||||||||||||||||
| | < 12 months | | > 12 months | | Loss Position |
| |||||||||||||||||||||||||||||||
|
|
| |
| Gross |
| |
| Gross |
| |
| Gross |
| ||||||||||||||||||||||||
| | Fair | | Unrealized | | Fair | | Unrealized | | Fair | | Unrealized |
| |||||||||||||||||||||||||
As of December 31, 2023 | | Value | | (Loss) | | Value | | (Loss) | | Value | | (Loss) |
| |||||||||||||||||||||||||
Investments: |
|
|
|
|
|
|
|
|
|
|
|
|
|
|
|
|
|
|
| | | | | | | | | | | | | | | | | | | |
Certificates of deposit |
| $ | 5,211 |
| $ | (20) |
| $ | 1,200 |
| $ | — |
| $ | 6,411 |
| $ | (20) |
| | $ | — | | $ | — | | $ | 2,140 | | $ | (20) | | $ | 2,140 | | $ | (20) | |
Corporate bonds |
|
| 5,037 |
|
| (35) |
|
| 3,395 |
|
| (12) |
|
| 8,432 |
|
| (47) |
| |||||||||||||||||||
Total in loss position |
| $ | 10,248 |
| $ | (55) |
| $ | 4,595 |
| $ | (12) |
| $ | 14,843 |
| $ | (67) |
| | $ | — | | $ | — | | $ | 2,140 | | $ | (20) | | $ | 2,140 | | $ | (20) | |
Restricted Cash
We maintain restricted cash in connection with cash balances temporarily restricted for regular business operations. These balances have been excluded from the Company’s cash balance. As of March 31, 2024, $13.8 million was included in restricted cash in our condensed consolidated balance sheets.
Investments in Privately-held Raw Material Companies
We have made strategic investments in private companies located in China in order to gain access at a competitive cost to raw materials that are critical to our substrate business (see Note 7). The investment balances for all of thesethe non-consolidated companies including minority investments indirectly in privately-held companies made by our consolidated subsidiaries, are accounted for under the equity method, and included in “Other assets” in the condensed consolidated balance sheets, and totaled $10.1$13.2 million and $11.3$12.5 million as of September 30, 2017March 31, 2024 and December 31, 2016,2023, respectively. As of September 30, 2017,March 31, 2024, there were seventhree companies accounted for under the equity method. There were no impairment charges in the three months ended September 30, 2017. The nine months ended September 30, 2017 include an impairment chargeOne of $313,000 forour equity investments, Beijing JiYa Semiconductor Material Co., Ltd. (“JiYa”), determined one of their equity investments was fully impaired and wrote the gallium companies. During the first quarter of 2017, management determined that it is unlikely that this company will recover from the difficult pricing environment and we had written the investmentasset balance down to zero. We hadThis resulted in a $754,000 impairment charge in our second quarter 2023 financial results. Except as mentioned above, there were no impairment charges for the remainder of these investments during the three and nine months ended September 30, 2016.March 31, 2024 and 2023.
In May 2023, we reduced our ownership in Jia Mei from 25% to 10% by selling a portion of our Jia Mei shares to an unrelated third party for approximately $827,000. As a result of our decreased ownership and the fact that we do not have the ability to exercise significant influence over Jia Mei’s operations, we adopted the fair value method of accounting to report on the investment in Jia Mei. Our investments under the fair value method are reviewed for other-than-temporary declines in value on a quarterly basis. We monitor our investments for impairment and record reductions
910
in carrying value when events or changes in circumstances indicate that the carrying value may not be recoverable. As of March 31, 2024, our investments in this unconsolidated company had a carrying value of $551,000 and were included in “Other assets” in the condensed consolidated balance sheets. As a result of the share sale, we recognized a gain of $575,000. Additionally, in accordance with Accounting Standards Codification (“ASC”) 321-10-35-2, we adjusted the investment in Jia Mei to its fair value at the time of the sale, which resulted in a gain of $383,000. The gain resulting from the sale and the subsequent remeasurement was incorporated as a component of “Equity in income of unconsolidated joint ventures” in the condensed consolidated statements of operations in the second quarter of 2023.
Fair Value Measurements
We invest primarily in money market accounts, certificates of deposits, corporate bonds and notes, government securities and government securities. Accounting Standards Codification (“ASC”) Topicmoney market accounts. We review our debt investment portfolio for credit loss at least quarterly or when there are changes in credit risk or other potential valuation concerns. As of March 31, 2024 and December 31, 2023, the total unrealized loss, net of tax, included in accumulated other comprehensive income was immaterial. We believe it is probable the principal and interest will be collected in accordance with the contractual terms, and the unrealized loss on these securities was due to normal market fluctuations, and not due to increased credit risk or other valuation concerns. ASC 820, Fair Value Measurements and Disclosures (“ASC 820”), establishes three levels of inputs that may be used to measure fair value. Level 1 instrument valuations are obtained from real-time quotes for transactions in active exchange markets of the asset or identical assets. Level 2 instrument valuations are obtained from readily-available,readily- available, observable pricing sources for comparable instruments. Level 3 instrument valuations are obtained from unobservable inputs in which there is little or no market data, which require us to develop our own assumptions. On a recurring basis, we measure certain financial assets and liabilities at fair value, primarily consisting of our short-term and long-term debt investments.
The type of instrument valued based on quoted market prices in active markets includeincludes our money market funds, which are generally classified within Level 1 of the fair value hierarchy. Other than corporate equity securities which are based on quoted market prices and classified as Level 1, weWe classify our available-for-sale debt securities, including certificates of deposit and corporate bonds, as having Level 2 inputs. The valuation techniques used to measure the fair value of these financial instruments having Level 2 inputs were derived from bank statements, quoted market prices, broker or dealer statements or quotations, or alternative pricing sources with reasonable levels of price transparency.
We place short-term foreign currency hedges that are intended to offset the potential cash exposure related to fluctuations in the exchange rate between the United States dollar and Japanese Yen.yen. We measure the fair value of these foreign currency hedges at each month end and quarter end using current exchange rates and in accordance with generally accepted accounting principles.U.S. GAAP. At quarter end, any foreign currency hedges not settled are netted in “Accrued liabilities” on the condensed consolidated balance sheetsheets and classified as Level 3 assets and liabilities. As of September 30, 2017March 31, 2024, the net change in fair value from the placement of the hedge to settlement at each month end during the quarter had a de minimis impact toon the condensed consolidated results.
There were no changes in valuation techniques or related inputs in the three and nine months ended September 30, 2017.March 31, 2024. There have been no transfersbetweenfair value measurements levels during the three and nine months ended September 30, 2017.March 31, 2024.
The following table summarizes our financial assets and liabilities measured at fair value on a recurring basis in accordance with ASC 820 as of September 30, 2017March 31, 2024 (in thousands):
|
|
|
|
|
|
|
|
|
|
|
|
|
| |||||||||||||
|
|
|
|
| Quoted Prices in |
|
|
|
| Significant |
| |||||||||||||||
|
|
|
|
| Active Markets of |
| Significant Other |
| Unobservable |
| ||||||||||||||||
|
| Balance as of |
| Identical Assets |
| Observable Inputs |
| Inputs |
| |||||||||||||||||
|
| September 30, 2017 |
| (Level 1) |
| (Level 2) |
| (Level 3) |
| |||||||||||||||||
| | | | | | | | | | | | | | |||||||||||||
|
| | |
| Quoted Prices in |
| | | | Significant |
| |||||||||||||||
| | | | | Active Markets of | | Significant Other | | Unobservable |
| ||||||||||||||||
| | Balance as of | | Identical Assets | | Observable Inputs | | Inputs |
| |||||||||||||||||
|
| March 31, 2024 |
| (Level 1) |
| (Level 2) |
| (Level 3) |
| |||||||||||||||||
Assets: |
|
|
|
|
|
|
|
|
|
|
|
|
| | | | | | | | | | | | | |
Cash equivalents and investments: |
|
|
|
|
|
|
|
|
|
|
|
|
| |||||||||||||
Investments: | | | | | | | | | | | | | | |||||||||||||
Certificates of deposit |
| $ | 7,631 |
| $ | — |
| $ | 7,631 |
| $ | — |
| | $ | 1,667 | | $ | — | | $ | 1,667 | | $ | — | |
Corporate bonds |
|
| 23,602 |
|
| — |
|
| 23,602 |
|
| — |
| |||||||||||||
Total |
| $ | 31,233 |
| $ | — |
| $ | 31,233 |
| $ | — |
| | $ | 1,667 | | $ | — | | $ | 1,667 | | $ | — | |
1011
The following table summarizes our financial assets and liabilities measured at fair value on a recurring basis in accordance with ASC 820 as of December 31, 20162023 (in thousands):
|
|
|
|
|
|
|
|
|
|
|
|
|
| |||||||||||||
|
|
|
|
| Quoted Prices in |
|
|
|
| Significant |
| |||||||||||||||
|
|
|
|
| Active Markets of |
| Significant Other |
| Unobservable |
| ||||||||||||||||
|
| Balance as of |
| Identical Assets |
| Observable Inputs |
| Inputs |
| |||||||||||||||||
|
| December 31, 2016 |
| (Level 1) |
| (Level 2) |
| (Level 3) |
| |||||||||||||||||
| | | | | | | | | | | | | | |||||||||||||
|
| | |
| Quoted Prices in |
| | | | Significant |
| |||||||||||||||
| | | | | Active Markets of | | Significant Other | | Unobservable |
| ||||||||||||||||
| | Balance as of | | Identical Assets | | Observable Inputs | | Inputs |
| |||||||||||||||||
|
| December 31, 2023 |
| (Level 1) |
| (Level 2) |
| (Level 3) |
| |||||||||||||||||
Assets: |
|
|
|
|
|
|
|
|
|
|
|
|
| | | | | | | | | | | | | |
Cash equivalents and investments: |
|
|
|
|
|
|
|
|
|
|
|
|
| |||||||||||||
Investments: | | | | | | | | | | | | | | |||||||||||||
Certificates of deposit |
| $ | 21,184 |
| $ | — |
| $ | 21,184 |
| $ | — |
| | $ | 2,140 | | $ | — | | $ | 2,140 | | $ | — | |
Corporate bonds |
|
| 8,432 |
|
| — |
|
| 8,432 |
|
| — |
| |||||||||||||
Corporate equity securities |
|
| 159 |
|
| 159 |
|
| — |
|
| — |
| |||||||||||||
Total |
| $ | 29,775 |
| $ | 159 |
| $ | 29,616 |
| $ | — |
| | $ | 2,140 | | $ | — | | $ | 2,140 | | $ | — | |
Items Measured at Fair Value on a Nonrecurring Basis
Certain assets that are subject to nonrecurring fair value measurements are not included in the table above. These assets include investments in privately-held companies accounted for by the equity or costfair value method (See(see Note 7). There were no impairment charges in the three months ended September 30, 2017. The nine months ended September 30, 2017 include an impairment charge of $313,000 for one of the gallium companies. During the first quarter of 2017, management determined that it is unlikely that this company will recover from the difficult pricing environment and we had written the investment down to zero. Except as mentioned, weWe did not record any other-than-temporary impairment charges for the remainder of these investments during the three and nine months ended September 30, 2017March 31, 2024 and 2016.2023, respectively.
Note 3. Inventories
The components of inventories are summarized below (in thousands):
|
|
|
|
|
|
|
| |||||||
|
| September 30, |
| December 31, |
| |||||||||
|
| 2017 |
| 2016 |
| |||||||||
| | | | | | | | |||||||
| | March 31, | | December 31, | | |||||||||
|
| 2024 |
| 2023 |
| |||||||||
Inventories: |
|
|
|
|
|
|
| | | | | | | |
Raw materials |
| $ | 21,000 |
| $ | 17,485 |
| | $ | 28,501 | | $ | 32,910 | |
Work in process |
|
| 17,178 |
|
| 20,410 |
| |
| 54,281 | |
| 50,008 | |
Finished goods |
|
| 2,590 |
|
| 2,257 |
| |
| 3,161 | |
| 3,585 | |
|
| $ | 40,768 |
| $ | 40,152 |
| |||||||
| | $ | 85,943 | | $ | 86,503 | | |||||||
As of September 30, 2017March 31, 2024 and December 31, 2016,2023, carrying values of inventories were net of inventory reserves of $12.9$22.2 million and $12.0$21.9 million, respectively, for excess and obsolete inventory and $263,000$213,000 and $254,000,$78,000, respectively, for lower of cost or net realizable value reserves.
Note 4. Property, Plant and Equipment, Net
The components of our property, plant and equipment are summarized below (in thousands):
|
|
|
|
|
|
|
| |||||||
|
| September 30, |
| December 31, |
| |||||||||
|
| 2017 |
| 2016 |
| |||||||||
| | | | | | | | |||||||
| | March 31, | | December 31, | | |||||||||
| | 2024 | | 2023 | | |||||||||
Property, plant and equipment: |
|
|
|
|
|
|
| | | | | | | |
Machinery and equipment, at cost |
| $ | 42,970 |
| $ | 41,254 |
| | $ | 66,472 | | $ | 65,918 | |
Less: accumulated depreciation and amortization |
|
| (40,017) |
|
| (37,311) |
| | | (42,065) | | | (42,112) | |
Building, at cost |
|
| 31,327 |
|
| 29,600 |
| | | 124,200 | | | 125,786 | |
Less: accumulated depreciation and amortization |
|
| (10,951) |
|
| (9,654) |
| | | (23,791) | | | (23,339) | |
Leasehold improvements, at cost |
|
| 5,351 |
|
| 4,942 |
| |
| 7,470 | |
| 7,596 | |
Less: accumulated depreciation and amortization |
|
| (4,093) |
|
| (3,608) |
| | | (6,014) | | | (5,984) | |
Construction in progress |
|
| 17,668 |
|
| 2,582 |
| |
| 36,850 | |
| 38,483 | |
|
| $ | 42,255 |
| $ | 27,805 |
| |||||||
| | $ | 163,122 | | $ | 166,348 | | |||||||
11
As of September 30, 2017,March 31, 2024, the balance of construction in processprogress was $17.7$36.9 million, of which $13.6$29.4 million was fromrelated to our buildings in our new Dingxing location, $1.5and Kazuo locations, $2.9 million was for manufacturing equipment purchases not yet placed in service and $2.6$4.6 million was from ourfor construction in processprogress for our other consolidated subsidiaries. As of December 31, 2023, the balance of construction in progress was $38.5 million, of which $31.2
12
million was for our buildings in our new Dingxing and Kazuo locations, $3.1 million was for manufacturing equipment purchases not yet placed in service and $4.2 million was for our construction in progress for our other consolidated subsidiaries.
Note 5. Accrued Liabilities
The components of accrued liabilities are summarized below (in thousands):
|
|
|
|
|
|
|
| |||||||
|
| September 30, |
| December 31, |
| |||||||||
|
| 2017 |
| 2016 |
| |||||||||
| | | | | | | | |||||||
| | March 31, | | December 31, | | |||||||||
|
| 2024 |
| 2023 |
| |||||||||
Accrued compensation and related charges | | $ | 2,941 | | $ | 3,707 | | |||||||
Preferred stock dividends payable |
| $ | 2,901 |
| $ | 2,901 |
| | | 2,901 | | | 2,901 | |
Accrued compensation and related charges |
|
| 1,449 |
|
| 2,610 |
| |||||||
Advance from customers |
|
| 771 |
|
| 238 |
| |||||||
Current portion of royalty payments |
|
| 575 |
|
| 575 |
| |||||||
Payable in connection with construction in progress | | | 1,613 | | | 7,249 | | |||||||
Other tax payable | | | 652 | | | 493 | | |||||||
Advances from customers | | | 535 | | | 305 | | |||||||
Accrued product warranty | | | 495 | | | 703 | | |||||||
Accrued professional services |
|
| 541 |
|
| 583 |
| | | 471 | | | 868 | |
Dividends payable by consolidated joint ventures |
|
| 521 |
|
| 499 |
| |||||||
Current portion of operating lease liabilities | | | 463 | | | 458 | | |||||||
Other personnel-related costs | | | 276 | | | 286 | | |||||||
Accrued income taxes |
|
| 330 |
|
| 203 |
| | | 272 | | | — | |
Accrued product warranty |
|
| 138 |
|
| 251 |
| |||||||
Accrual for sales returns | | | 34 | | | 39 | | |||||||
Other accrued liabilities |
|
| 2,058 |
|
| 1,400 |
| | | 2,044 | | | 2,010 | |
|
| $ | 9,284 |
| $ | 9,260 |
| |||||||
| | $ | 12,697 | | $ | 19,019 | | |||||||
| | | | | | | | |||||||
Note 6. Related Party Transactions
In August 2011,September 2021 and October 2021, our consolidated joint venture, Beijing JiYa Semiconductor Material Co., Ltd. (“JiYa”), entered intosubsidiary, ChaoYang XinMei, received funding from a non-interest bearing note agreementminority investor of $0.9 million and $1.0 million, respectively. As of December 31, 2021, $1.9 million was included in the amount of $1.6 million for a loan to one of its equity investment entities. The original term of the loan was for two years and ten months with three periodic principal payments required. After various amendments to the terms of the note, in December 2013, the parties agreed to delay all principal repayment until December 2017. In December 2016, we determined that this receivable was in substance an investment and began re-classifying this long termshort-term loan from “Related party notes receivable – long-term” to “Other assets” in our consolidated balance sheets. As of September 30, 2017 and December 31, 2016, we included $1.2 million and $1.4 million in “Other assets” in our condensed consolidated balance sheets, respectively.
JiYa also purchases raw materials from one of its equity investment entities for production in the ordinary course of business. As of September 30, 2017 and December 31, 2016, amounts payable of $1.8 million and $1.8 million, respectively, were included in “Accounts payable” in our condensed consolidated balance sheets.
JiYa also sold raw materials to one of its equity investment entities for production in the ordinary course of business. As of September 30, 2017 and December 31, 2016, amounts receivable of $326,000 and $313,000, respectively, were included in “Accounts receivable”noncontrolling interest in our condensed consolidated balance sheets. DuringIn December 2021 and January 2022, the three months ended December 31, 2016, we deemedsame subsidiary received funding from Tongmei of $1.4 million and $1.4 million, respectively. In January 2022, the collectionChina local government certified this additional funding in ChaoYang XinMei as an equity investment. As a result, noncontrolling interests increased $2.2 million and redeemable noncontrolling interests increased $0.2 million. Short-term loan from noncontrolling interest decreased to $0. In April 2022, Tongmei entered into the Capital Increase Agreement with minority investors to further invest $4.5 million in ChaoYang XinMei. In April 2022 and May 2022, ChaoYang XinMei received funding from Tongmei of $1.1 million and $0.8 million, respectively, as equity investments. In April 2022 and May 2022, the outstanding amount to be improbableminority investors invested $0.7 million and established an allowance$0.6 million, respectively. As a result, noncontrolling interests increased $1.4 million and redeemable noncontrolling interests increased $0.1 million. In July 2022, Tongmei and the minority investors further invested $0.8 million and $0.6 million in full. There have since been no additional sales made on credit toChaoYang XinMei, respectively. This completed the customerinvestment obligations under the Capital Increase Agreement. As a result, noncontrolling interests increased $610,000 and as ofredeemable noncontrolling interests increased $57,000. Tongmei’s ownership remained at 58.5% after these equity investments.
In September 30, 2017 the existing outstanding amount continues to be fully reserved.
Beginning in 2012,2022, our consolidated joint venture, Nanjing JinMei Gallium Co., Ltd. (“JinMei”), is contractually obligated under an agency sales agreementsubsidiary, ChaoYang LiMei completed the sale of land and its attached buildings to sell raw material on behalf of its equity investment entity. JinMei bills the customers and remits the receipts, net of its portions of sales commission, to this equity investment entity. For the three months ended September 30, 2017 and 2016, JinMei has recorded $2,000 and $0, respectively, income from agency sales. For the nine months ended September 30, 2017 and 2016, Jin Mei has recorded $3,000 and $1,000 income from agency sales, respectively, which were included in “Other (expense) income, net” in the condensed consolidated statements of operations.
In March 2012, our wholly-owned subsidiary, Beijing Tongmei Xtal Technology Co., Ltd. (“Tongmei”), entered into an operating lease for the land it owns with our consolidated joint venture, Beijing BoYu Semiconductor Vessel Craftwork Technology Co., Ltd. (“BoYu”). The lease agreement for the land of approximately 22,081 square feet
12
commenced on January 1, 2012 for a term of 10 years with annual lease payments of $24,000 subject to a 5% increase at each third year anniversary. The annual lease payment is due by January 31st of each year.
Tongmei has paid certain amounts on behalf of Donghai County Dongfang High Purity Electronic Materials Co., Ltd. (“Dongfang”), its equity investment entity, to purchase materials. The original agreement was signed between Tongmei and Dongfang in 2014 and the date of repayment was set as December 31, 2015. In 2015, both parties agreed to delay the date of repayment to December 31, 2017. During the three months ended September 30, 2017, the repayment of principle and interest totaling $55,000 was received by our wholly-owned subsidiary. As of September 30, 2017, the balance of $57,000 was included in “Related party notes receivable – current”. As of December 31, 2016, the balance of $107,000 was included in “Related party notes receivable – long-term” in our condensed consolidated balance sheets.
In April 2014, Tongmei loaned an additional $44,000 to Dongfang. The loan bears interest at 6.15% per annum and comes due on December 31, 2017. During the three months ended June 30, 2017, the repayment of the principal and interest totaling $53,000 was received by our wholly-owned subsidiary. As of September 30, 2017 and December 31, 2016, this balance, including both principal and accrued interest, was $0 and $50,000, respectively, and was included in “Related party notes receivable – long-term” in our condensed consolidated balance sheets.
Tongmei also purchases raw materials from Dongfang for production in the ordinary course of business. As of September 30, 2017 and December 31, 2016, amounts payable of $0 and $210,000, respectively, were included in “Accounts payable” in our condensed consolidated balance sheets.
Tongmei purchases raw materials from one of our equity investment entities, Emei Shan Jiamei Materials Co. Ltd. (“Jiamei”)entity, ChaoYang KaiMei, for production in the ordinary coursea total consideration of business.$1.5 million. In January 2023, ChaoYang KaiMei paid to ChaoYang LiMei $1.5 million. As of September 30, 2017 and December 31, 2016, amounts payable of $0 and $377,000, respectively, were included in “Accounts payable” in our condensed consolidated balance sheets.
Tongmei also purchases raw materials from one of our equity investment entities, Xilingol Tongli Germanium Refine Co. Ltd. (“Tongli”), for production in the ordinary course of business. As of September 30, 2017 and December 31, 2016, amounts payable of $433,000 and $246,000, respectively, were included in “Accounts payable” in our condensed consolidated balance sheets.
In July 2017, Tongmei, provided an inter-company loan to JinMei in the amount of $751,000 in preparation for the acquisition of the land use rights and the construction of a new building. The inter-company loan carries an interest rate of 4.9% per annum and is due in three installments between December 2021 and December 2023. JinMei is in the process of relocating its headquarters and manufacturing operations to an alternative location. Currently, JinMei has identified a site as a possible candidate and the estimated costs for the land use rights acquisition and facility construction is expected to be approximately $6 million.
In April 2016, our consolidated joint venture, BoYu, provided a personal loan of $177,000 to one of its executive employees. This loan is secured by the executive employee’s shares in BoYu. The loan bears interest at 2.75% per annum. Principal and accrued interest are due on March 31, 2019. During the three months ended June 30, 2017, the repayment of the principal and interest totaling $180,000 were received by our consolidated joint venture. As of September 30, 2017 and December 31, 2016, these balances, including both principal and accrued interest, were2024, $0 and $179,000, respectively, andmillion was included in “Prepaid expenses and other current assets” in our condensed consolidated balance sheets.
Tongmei also purchases raw materials from one of JiYa’s equity investment entities for production in the ordinary course of business. As of September 30, 2017 and December 31, 2016, amounts payable of $0 and $146,000, respectively, were included in “Accounts payable” in our condensed consolidated balance sheets.
Beijing Kaide Quartz Co. Ltd. (“Kaide”) has been a supplier of customized quartz tubes to the Company since 2004. Beijing XiangHeMing Trade Co. Ltd. (“XiangHeMing”) is a significant shareholder of Kaide. XiangHeMing was previously owned by, among others, certain immediate family members of Davis Zhang, our former President, China Operations, until at least sometime in 2004, at which time the official Chinese government records indicate that Mr.
13
Zhang’s immediate family members transferred their ownership of XiangHeMing to a third party. However, we are currently unable to conclusively determine whether Mr. Zhang’s immediate family members retained any economic interest in XiangHeMing after the transfer. As of September 30, 2017 and December 31, 2016, amounts payable to Kaide of $579,000 and $323,000, respectively, were included in “Accounts payable” in our condensed consolidated balance sheets.
Our Related Party Transactions Policy seeks to prohibit all conflicts of interest in transactions between related parties and us, unless they have been approved by our Board of Directors. This policy applies to all of our employees, directors, and our consolidated subsidiaries. Our executive officers retain board seats on the board of directors of the companies in which we have invested in our China joint ventures. See Note 7 for further details.
13
Note 7. Investments in Privately-Held Raw Material Companies
We have made strategic investments in private companies located in China in order to gain access at a competitive cost to raw materials that are critical to our substrate business. We have six direct investments. Our consolidated subsidiaries have also made investments in private companies. We have four indirect investments. These companies form part of our overall supply chain.chain strategy.
The six directAs of March 31, 2024, the investments are summarized below (in thousands):
|
|
|
|
|
|
|
|
|
|
|
| |||||||||||
|
| Investment Balance as of |
|
|
|
|
| |||||||||||||||
|
| September 30, |
| December 31, |
| Accounting |
| Ownership |
| |||||||||||||
| | | | | | | | | | | | |||||||||||
| | Investment Balance as of | | | | | | |||||||||||||||
| | March 31, | | December 31, | | Accounting | | Ownership | * | |||||||||||||
Company |
| 2017 |
| 2016 |
| Method |
| Percentage |
|
| 2024 |
| 2023 |
| Method |
| Percentage | | ||||
Nanjing JinMei Gallium Co., Ltd. | | $ | 592 | | $ | 592 |
| Consolidated |
| ** 85.5 | % | |||||||||||
ChaoYang JinMei Gallium Co., Ltd. | | | 1,820 | | | 1,820 | | Consolidated | | ** 85.5 | % | |||||||||||
Beijing BoYu Semiconductor Vessel Craftwork Technology Co., Ltd. | |
| 1,346 | |
| 1,346 |
| Consolidated |
| ** 85.5 | % | |||||||||||
ChaoYang ShuoMei High Purity Semiconductor Materials Co., Ltd. | | | 3,122 | | | 3,122 | | Consolidated | | **** 75.0 | % | |||||||||||
ChaoYang XinMei High Purity Semiconductor Materials Co., Ltd. | | | 7,331 | | | 7,331 | | Consolidated |
| *** 58.5 | % | |||||||||||
| | $ | 14,211 | | $ | 14,211 | | | | | | |||||||||||
| | | | | | | | | | | | |||||||||||
Beijing JiYa Semiconductor Material Co., Ltd. |
| $ | 3,331 |
| $ | 3,331 |
| Consolidated |
| 46 | % | | $ | 4,105 | | | 3,806 | | Equity | | 39 | % |
Nanjing JinMei Gallium Co., Ltd. |
|
| 592 |
|
| 592 |
| Consolidated |
| 83 | % | |||||||||||
Beijing BoYu Semiconductor Vessel Craftwork Technology Co., Ltd. |
|
| 1,346 |
|
| 1,346 |
| Consolidated |
| 70 | % | |||||||||||
|
| $ | 5,269 |
| $ | 5,269 |
|
|
|
|
| |||||||||||
|
|
|
|
|
|
|
|
|
|
|
| |||||||||||
Donghai County Dongfang High Purity Electronic Materials Co., Ltd. |
| $ | 1,445 |
| $ | 1,498 |
| Equity |
| 46 | % | |||||||||||
Xilingol Tongli Germanium Co. Ltd. |
|
| 3,522 |
|
| 4,000 |
| Equity |
| 25 | % | |||||||||||
Xiaoyi XingAn Gallium Co., Ltd. | | | 5,995 | | | 5,516 | | Equity | | ** 25 | % | |||||||||||
ChaoYang KaiMei Quartz Co., Ltd. | | | 3,098 | | | 3,154 | | Equity | | ***** 40 | % | |||||||||||
| | $ | 13,198 | | $ | 12,476 | | | | | | |||||||||||
| | | | | | | | | | | | |||||||||||
Emeishan Jia Mei High Purity Metals Co., Ltd. |
|
| 1,048 |
|
| 1,101 |
| Equity |
| 25 | % | |
| 551 | |
| 551 |
| Fair value |
| ****** 10 | % |
|
| $ | 6,015 |
| $ | 6,599 |
|
|
|
|
| |||||||||||
| | $ | 551 | | $ | 551 | | | | | | |||||||||||
| | | | | | | | | | | | |||||||||||
Our* Thesepercentages reflect the ownership of JiYa is 46%. We continue to consolidate JiYa as we arecurrently in effect upon the founding and largest shareholder, appoint the general manager and controller and have the ability to exercise control in substance over the long-term strategic decisions made. Our Chief Executive Officer is chairmancompletion of the JiYa boardreorganization in China and the ownership in effect upon the completion of the new capital funding by private equity investors in January 2021.
** In preparation for Tongmei’s application for a listing of shares in an IPO on the STAR Market, in late December 2020 we reorganized our entity structures in China. JinMei and BoYu and their subsidiaries, previously organized under AXT, Inc., were assigned to Tongmei and effectively merged with Tongmei although they retained their own respective legal entity status and are wholly owned subsidiaries of Tongmei. The 33% minority interest stakeholders of BoYu converted their ownership to a 7.59% minority interest in Tongmei. The 8.5% minority interest stakeholders, employees of JinMei, converted their ownership to a 0.38% minority interest in Tongmei. Further, a number of employees, key managers and contributors, purchased a 0.4% minority interest in Tongmei. In 2020, the Investors transferred approximately $48.1 million of new capital to Tongmei. An additional investment of approximately $1.5 million of new capital was funded in early January 2021. Under China regulations these investments must be formally approved by the appropriate government agency and are not deemed to be dilutive until such approval is granted. The government approved the approximately $49 million investment in its entirety on January 25, 2021 at which time the Investors owned a redeemable noncontrolling interest in Tongmei of 7.28%. As of March 31, 2024, Tongmei’s noncontrolling interests and redeemable noncontrolling interests totaled approximately 14.5%. AXT remains the controlling stakeholder of Tongmei and holds a majority of the Board of Director positions of Tongmei.
*** In February 2021, Tongmei signed a joint venture agreement with certain investors to fund ChaoYang XinMei.
**** In April 2022, ChaoYang JinMei signed a joint venture agreement with certain investor to fund a new company, ChaoYang ShuoMei.
***** In April 2022, Tongmei signed a joint venture agreement with certain investors to fund a new company, ChaoYang KaiMei.
****** In May 2023, we sold 15% of our equity investments in Jia Mei to a third party. We now own 10% of Jia Mei and account for it under the fair value method.
In May 2023, we reduced our ownership in Jia Mei from 25% to 10% by selling a portion of our Jia Mei shares to an unrelated third party for approximately $827,000. Considering our decreased ownership and we no longer have appointed one other representative, Davis Zhang,significant influence over its operations and financial policies, we adopted the fair value method of accounting to serve report
14
on the board. Mr. Zhang was an executive officer of AXT for 27 years. Further, our Chief Financial Officer, Gary Fischer, is on the board of supervisors of JiYa.
Our ownership of JinMei is 83%. We continue to consolidate JinMei as we haveinvestment in Jia Mei. As a controlling financial interest and have majority controlresult of the board. Our Chief Executive Officer is chairmanshare sale, we recognized a gain of $575,000. Additionally, in accordance with ASC321-10-35-2, we adjusted the investment in Jia Mei to its fair value at the time of the JinMei boardsale. The gain resulting from the sale and we have appointed two other representativesthe subsequent remeasurement was incorporated as a component of “Equity in income of unconsolidated joint ventures”in the consolidated statements of operations in the second quarter of 2023. The gain from the sale and the subsequent remeasurement includes the following:
| | | |
| | Amount | |
|
| (in thousands) | |
Fair value of the consideration received | | $ | 779 |
Foreign income tax withholding | | | 48 |
Carrying value of 15% of Emeishan Jia Mei High Purity Metals Co., Ltd. | | | (252) |
Gain recognized on sale of 15% of Emeishan Jia Mei High Purity Metals Co., Ltd. | | $ | 575 |
| | | |
| | | |
| | Amount | |
| | (in thousands) | |
Fair value of the retained investment in Emeishan Jia Mei High Purity Metals Co., Ltd. | | $ | 551 |
Carrying value of retained noncontrolling investment (10%) | | | (168) |
Gain on retained noncontrolling investment due to remeasurement (10%) | | $ | 383 |
The Jia Mei investment is reviewed for other-than-temporary declines in value on a quarterly basis. We did not record any other-than-temporary impairment charges for Jia Mei investment during the three months ended March 31, 2024.
In November 2023, our 46% equity ownership interest in Donghai County Dongfang High Purity Electronic Materials Co., Ltd. (“Dongfang”) was sold to serve ona third party for consideration valued at approximately $0.6 million, including raw materials, equipment, and vehicle. As a result, our equity ownership interest of Dongfang decreased from 46% to 0%. The loss resulting from the board. sale was incorporated as a component of “Equity in income of unconsolidated joint ventures” in the consolidated statements of operations in the fourth quarter of 2023. The loss from the sale includes the following:
| | | |
| | Amount | |
|
| (in thousands) | |
Fair value of the consideration received | | $ | 585 |
Carrying value of 46% of Donghai County Dongfang High Purity Electronic Materials Co., Ltd. | | | (1,710) |
Loss recognized on sale of 46% of Donghai County Dongfang High Purity Electronic Materials Co., Ltd. | | $ | (1,125) |
Our ownership of BoYu is 70%. We continue to consolidate BoYu as we have a controlling financial interest and have majority control of the board. Our Chief Executive Officer is chairman of the BoYu board and we have appointed two other representatives to serve on the board.
Although we have representation on the board of directors of each of thesethe privately held raw material companies, the daily operations of each of these companies are managed by local management and not by us. Decisions concerning their respective short-term strategy and operations, ordinary course of business capital expenditures and decisions concerning sales of finished products,product, are made by local management with regular guidance and input from us.
14
During the three months ended September 30, 2017 and 2016, the three consolidated joint ventures generated an income of $860,000 and $399,000, respectively, of which a gain of $146,000 and a loss of $18,000, respectively, were allocated to noncontrolling interests, resulting in an income of $714,000 and $417,000 respectively, to our net income. During the nine months ended September 30, 2017 and 2016, the three consolidated joint ventures generated an income of $1.1 million and a loss of $82,000, respectively, of which a loss of $0.2 million and $480,000 respectively, were allocated to noncontrolling interests, resulting in an income of $1.3 million and an income of $398,000, respectively, to our net income.
For AXT’s three direct minority investment entities that are not consolidated, the investment balances are included in “Other assets” in our condensed consolidated balance sheets and totaled $6.0$13.2 million and $6.6$12.5 million as of September 30, 2017March 31, 2024 and December 31, 2016. We own 46%2023, respectively. As of theMarch 31, 2024, our ownership interests in one of these companiesinChaoYang KaiMei, JiYa, Xiaoyi XingAn Gallium Co., Ltd (“Xiaoyi XingAn”) and Jia Mei were 40%, 39%, 25% in each of the other two companies., and 10%, respectively. These three companiesminority investment entities are not considered variable interest entities because:
| ● |
| all |
| ● |
| our voting power is proportionate to our ownership interests; |
15
| ● |
| we only recognize our respective share of the losses and/or residual returns generated by the companies if they occur; and |
| ● |
| we do not have controlling financial interest in, do not maintain operational or management control of, do not control the board of directors of, and are not required to provide additional investment or financial support to any of these companies. |
We also maintain four minority investments indirectly in privately-held companies through our consolidated joint ventures. JiYa holds three investments and JinMei holdsIn June 2022, we received a $1.3 million dividend from BoYu. In July 2022, we received a $1.5 million dividend from one investment. These minority investments are accounted for under the equity method in the books of our consolidated joint ventures. Asequity investment entities, Xiaoyi XingAn. In August 2022, we received a $125,000 dividend from one of September 30, 2017our equity investment entities, JiYa. In April 2023 and December 31, 2016, our consolidated joint ventures included these minority investments in “Other assets” in our condensed consolidated balance sheets withNovember 2023, Xiaoyi XingAn distributed a carrying valuedividend of $4.2$1.8 million, and $4.7JiYa distributed dividends of $2.0 million and $0.5 million, respectively. We have no current intentions to distribute to our investors earnings under our corporate structure. All of these distributions were paid to the PRC companies and the minority shareholders.
There were no impairment charges in the three months ended September 30, 2017. The nine months ended September 30, 2017 include an impairment charge of $313,000 for one of the gallium companies. During the first quarter of 2017, management determined that it is unlikely that this company will recover from the difficult pricing environment and we had written the investment down to zero.
AXT’s three direct minority investment entities and the three minority investments of JiYa and the one minority investment of JinMei are not consolidated and are accounted for under the equity method. Excluding one fully impaired entity, theThe equity investment entities had the following summarized incomestatements of operations information (in thousands) for the three and nine months ended September 30, 2017March 31, 2024 and 2016.2023:
| | | | | | | | |
| | | | | | | | |
| | Three Months Ended | | | ||||
| | March 31, | | | ||||
|
| 2024 |
| 2023 |
|
| ||
Net revenue | | $ | 8,104 | | $ | 7,974 | | |
Gross profit | | $ | 3,929 | | $ | 2,906 | | |
Operating income | | $ | 3,371 | | $ | 2,009 | | |
Net income | | $ | 3,138 | | $ | 3,945 | | |
|
|
|
|
|
|
|
|
|
|
|
|
|
|
|
| Three Months Ended |
| Nine Months Ended |
| ||||||||
|
| September 30, |
| September 30, |
| ||||||||
|
| 2017 |
| 2016 |
| 2017 |
| 2016 |
| ||||
Net revenue |
| $ | 4,209 |
| $ | 6,813 |
| $ | 15,571 |
| $ | 17,565 |
|
Gross profit (loss) |
| $ | 177 |
| $ | (1,494) |
| $ | 976 |
| $ | (1,929) |
|
Operating loss |
| $ | (1,054) |
| $ | (2,354) |
| $ | (2,685) |
| $ | (4,894) |
|
Net loss |
| $ | (1,130) |
| $ | (2,321) |
| $ | (3,653) |
| $ | (5,419) |
|
Our portion of the entity lossincome and losses from these seven minority investment entities that are not consolidated and are accounted for under the equity method were $266,000was an income of $0.9 million and $581,000$1.0 million, respectively, for the three months ended September 30, 2017March 31, 2024 and 2016, respectively.Our portion of the entity loss, including impairment charges, from these seven minority investment entities that are not consolidated and are accounted for under the equity method were a loss of $1.4 million and $1.4 million for the nine months ended September 30, 2017 and 2016, respectively.2023.
1516
Note 8. Stockholders’ Equity
Condensed Consolidated StatementStatements of Changes in Stockholders’ Equity
(in thousands)
|
|
|
|
|
|
|
|
|
|
|
|
|
|
|
|
|
|
|
|
|
|
|
|
|
|
|
|
|
|
|
|
|
|
|
| Accumulated |
|
|
|
|
|
|
| ||||||||
|
|
|
|
|
|
|
|
|
|
|
|
|
| Other |
| AXT, Inc |
|
|
| Total |
| ||||
|
| Preferred |
| Common |
| Additional |
| Accumulated |
| Comprehensive |
| Stockholders’ |
| Noncontrolling |
| Stockholders’ |
| ||||||||
|
| Stock |
| Stock |
| Paid-In Capital |
| Deficit |
| Income |
| Equity |
| Interests |
| Equity |
| ||||||||
Balance as of December 31, 2016 |
| $ | 3,532 |
| $ | 33 |
| $ | 194,177 |
| $ | (64,985) |
| $ | 253 |
| $ | 133,010 |
| $ | 4,380 |
| $ | 137,390 |
|
Common stock options exercised |
|
| — |
|
| 1 |
|
| 1,522 |
|
| — |
|
| — |
|
| 1,523 |
|
| — |
|
| 1,523 |
|
Stock-based compensation |
|
| — |
|
| — |
|
| 961 |
|
| — |
|
| — |
|
| 961 |
|
| — |
|
| 961 |
|
Issuance of common stock, net of stock issuance costs of $2,639 |
|
| — |
|
| 5 |
|
| 31,856 |
|
| — |
|
| — |
|
| 31,861 |
|
| — |
|
| 31,861 |
|
Net income (loss) |
|
| — |
|
| — |
|
| — |
|
| 7,014 |
|
| — |
|
| 7,014 |
|
| (226) |
|
| 6,788 |
|
Dividends declared by joint ventures |
|
| — |
|
| — |
|
| — |
|
| — |
|
| — |
|
| — |
|
| (465) |
|
| (465) |
|
Other comprehensive income |
|
| — |
|
| — |
|
| — |
|
| — |
|
| 2,022 |
|
| 2,022 |
|
| 337 |
|
| 2,359 |
|
Balance as of September 30, 2017 |
| $ | 3,532 |
| $ | 39 |
| $ | 228,516 |
| $ | (57,971) |
| $ | 2,275 |
| $ | 176,391 |
| $ | 4,026 |
| $ | 180,417 |
|
The changes in stockholders’ equity by component for the three months ended March 31, 2024 are as follows:
| | | | | | | | | | | | | | | | | | | | | | | | | |
|
|
|
|
|
|
|
|
|
| Accumulated | | | | | | | | ||||||||
| | | | | | | | | | | | | | Other | | AXT, Inc. |
|
|
| Total | | ||||
|
| Preferred |
| Common |
| Additional |
| Accumulated |
| Comprehensive | | Stockholders’ |
| Noncontrolling |
| Stockholders’ | | ||||||||
|
| Stock |
| Stock |
| Paid-In Capital |
| Deficit |
| Income (Loss) |
| Equity |
| Interests |
| Equity |
| ||||||||
Balance as of December 31, 2023 |
| $ | 3,532 |
| $ | 44 |
| $ | 238,452 |
| $ | (32,040) |
| $ | (5,999) | | $ | 203,989 |
| $ | 23,494 |
| $ | 227,483 | |
Common stock options exercised | | | — | | | — | | | 20 | | | — | | | — | | | 20 | | | — | | | 20 | |
Investment in subsidiary with noncontrolling interest | | | — | | | — | | | — | | | — | | | — | | | — | | | — | | | — | |
Investment in subsidiary with redeemable noncontrolling interest | | | — | | | — | | | — | | | — | | | — | | | — | | | — | | | — | |
Noncontrolling interest portion of Tongmei stock-based compensation | | | — | | | — | | | (24) | | | — | | | — | | | (24) | | | 13 | | | (11) | |
Stock-based compensation | | | — | | | — | | | 614 | | | — | | | — | | | 614 | | | — | | | 614 | |
Tongmei stock-based compensation | | | — | | | — | | | 195 | | | — | | | — | | | 195 | | | — | | | 195 | |
Net loss | | | — | | | — | | | — | | | (2,083) | | | — | | | (2,083) | | | 106 | | | (1,977) | |
Other comprehensive income | | | — | | | — | | | — | | | — | | | (1,627) | | | (1,627) | | | (187) | | | (1,814) | |
Balance as of March 31, 2024 | | $ | 3,532 | | $ | 44 | | $ | 239,257 | | $ | (34,123) | | $ | (7,626) | | $ | 201,084 | | $ | 23,426 | | $ | 224,510 | |
Net loss and Other comprehensive loss attributable to redeemable noncontrolling interests were $71,000 and $189,000, respectively, for the three months ended March 31, 2024 and are not shown in the table above.
The changes in stockholders’ equity by component for the three months ended March 31, 2023 are as follows:
| | | | | | | | | | | | | | | | | | | | | | | | |
|
|
|
|
|
|
|
|
|
| Accumulated | | | | | | | ||||||||
| | | | | | | | | | | | | | Other | | AXT, Inc. |
|
|
| Total | ||||
|
| Preferred |
| Common |
| Additional |
| Accumulated |
| Comprehensive | | Stockholders’ |
| Noncontrolling |
| Stockholders’ | ||||||||
|
| Stock |
| Stock |
| Paid-In Capital |
| Deficit |
| Income (Loss) |
| Equity |
| Interests |
| Equity | ||||||||
Balance as of December 31, 2022 |
| $ | 3,532 |
| $ | 44 |
| $ | 235,308 |
| $ | (14,159) |
| $ | (3,118) | | $ | 221,607 |
| $ | 23,293 |
| $ | 244,900 |
Common stock options exercised | | | — | | | — | | | 8 | | | — | | | — | | | 8 | | | — | | | 8 |
Investment in subsidiary with noncontrolling interest | | | — | | | — | | | (36) | | | — | | | — | | | (36) | | | 239 | | | 203 |
Investment in subsidiary with redeemable noncontrolling interest | | | — | | | — | | | (36) | | | — | | | — | | | (36) | | | — | | | (36) |
Noncontrolling interest portion of Tongmei stock-based compensation | | | — | | | — | | | 33 | | | — | | | — | | | 33 | | | (16) | | | 17 |
Stock-based compensation | | | — | | | — | | | 717 | | | — | | | — | | | 717 | | | — | | | 717 |
Tongmei stock-based compensation | | | — | | | — | | | 198 | | | — | | | — | | | 198 | | | — | | | 198 |
Net loss | | | — | | | — | | | — | | | (3,348) | | | — | | | (3,348) | | | (169) | | | (3,517) |
Other comprehensive income | | | — | | | — | | | — | | | — | | | 858 | | | 858 | | | 70 | | | 928 |
Balance as of March 31, 2023 | | $ | 3,532 | | $ | 44 | | $ | 236,192 | | $ | (17,507) | | $ | (2,260) | | $ | 220,001 | | $ | 23,417 | | $ | 243,418 |
Net loss and Other comprehensive income attributable to redeemable noncontrolling interests were $149,000 and $70,000, respectively, for the three months ended March 31, 2023, and are not shown in the table above.
17
There were no reclassification adjustments from accumulated other comprehensive income (loss) for the three and nine months ended September 30, 2017March 31, 2024 and 20162023.
Stock Repurchase Program
On October 27, 2014, our Board of Directors approved a stock repurchase program pursuant to which we may repurchase up to $5.0 million of our outstanding common stock. These repurchases can be made from time to time in the open market and are funded from our existing cash balances and cash generated from operations. During 2015, we repurchased approximately 908,000 shares at an average price of $2.52 per share for a total purchase price of approximately $2.3 million under the stock repurchase program. No shares were repurchased during 2016.from 2016 through 2023. During the three and nine months ended September 30, 2017,March 31, 2024, we did not repurchase any shares under the approved stock repurchase program. As of September 30, 2017,March 31, 2024, approximately $2.7 million remained available for future repurchases under this program. Currently, we do not plan to repurchase additional shares.
16
Note 9. Stock-Based Compensation
We account for stock-based compensation in accordance with the provisions of ASC topicTopic 718, Compensation-Stock Compensation (“ASC 718”), which established accounting for stock-based awards exchanged for employee services. Stock-based compensation cost is measured at each grant date, based on the fair value of the award, and is recognized as expense over the employee’s requisite service period of the award. All of our stock compensation is accounted for as an equity instrument.
The following table summarizes compensation costs related to our stock-based awards (in thousands, except per share data):
| | | | | | | |
| | Three Months Ended | | ||||
| | March 31, | | ||||
|
| 2024 |
| 2023 |
| ||
Cost of revenue | | $ | 105 | | $ | 105 | |
Selling, general and administrative | |
| 553 | |
| 632 | |
Research and development | |
| 151 | |
| 178 | |
Net effect on net income (loss) | | $ | 809 | | $ | 915 | |
|
|
|
|
|
|
|
|
|
|
|
|
|
|
|
| Three Months Ended |
| Nine Months Ended |
| ||||||||
|
| September 30, |
| September 30, |
| ||||||||
|
| 2017 |
| 2016 |
| 2017 |
| 2016 |
| ||||
Cost of revenue |
| $ | 7 |
| $ | 5 |
| $ | 22 |
| $ | 15 |
|
Selling, general and administrative |
|
| 280 |
|
| 238 |
|
| 788 |
|
| 651 |
|
Research and development |
|
| 52 |
|
| 38 |
|
| 151 |
|
| 123 |
|
Total stock-based compensation |
|
| 339 |
|
| 281 |
|
| 961 |
|
| 789 |
|
Tax effect on stock-based compensation |
|
| — |
|
| — |
|
| — |
|
| — |
|
Net effect on net income |
| $ | 339 |
| $ | 281 |
| $ | 961 |
| $ | 789 |
|
As of September 30, 2017,March 31, 2024, the unamortized compensation costs related to unvested stock options granted to employees under our stock option plan was approximately $1.4 million, net of estimated forfeitures of $167,000. These costs will be amortized on a straight-line basis over a weighted-average period of approximately 2.4 years and will be adjusted for subsequent changes in estimated forfeitures.$0. We did not capitalize any stock-based compensation to inventory as of September 30, 2017March 31, 2024 and December 31, 20162023 due to the immateriality of the amount.
We estimate the fair value of stock options using the Black-Scholes valuationoption pricing model, consistent with the provisions of ASC 718. There were no options granted in the three months ended September 30, 2017March 31, 2024 and 2016. There were 60,000 and 68,000 options with weighted-average grant date fair values of $2.76 and $1.01 granted in the nine months ended September 30, 2017 and 2016, respectively. The fair values of our stock options granted to employees for the three and nine months ended September 30, 2017 were estimated using the following weighted-average assumptions:2023.
|
|
|
|
|
|
|
|
|
| Three Months Ended |
| Nine Months Ended |
|
|
|
|
| September 30, |
| September 30, |
|
|
|
|
| 2017 |
| 2017 |
|
|
|
Expected term (in years) |
| — |
| 5.9 |
|
|
|
Volatility |
| — | % | 46.71 | % |
|
|
Expected dividend |
| — | % | — | % |
|
|
Risk-free interest rate |
| — | % | 2.08 | % |
|
|
1718
The following table summarizes the stock option transactions during the ninethree months ended September 30, 2017March 31, 2024 (in thousands, except per share data):
| | | | | | | | | | | |
| | | | | | | Weighted- | | | | |
|
| |
| | |
| average |
| | |
|
| | | | Weighted- | | Remaining | | | |
| |
| | Number of | | average | | Contractual | | Aggregate |
| ||
| | Options | | Exercise | | Life | | Intrinsic |
| ||
Stock Options |
| Outstanding |
| Price |
| (in years) |
| Value |
| ||
Balance as of January 1, 2024 | | 1,198 | | $ | 5.10 |
| 4.09 | | $ | 14 | |
Granted |
| — | |
| — | | | | | | |
Exercised |
| (9) | | | 2.20 | | | | | | |
Canceled and expired |
| — | | | — | | | | | | |
Balance as of March 31, 2024 |
| 1,189 | | $ | 5.12 |
| 3.88 | | $ | 684 | |
Options vested as of March 31, 2024 and unvested options expected to vest, net of forfeitures |
| 1,189 | | $ | 5.12 |
| 3.88 | | $ | 684 | |
Options exercisable as of March 31, 2024 |
| 1,189 | | $ | 5.12 |
| 3.88 | | $ | 684 | |
|
|
|
|
|
|
|
|
|
|
|
|
|
|
|
|
|
|
| Weighted- |
|
|
|
|
|
|
|
|
|
|
| average |
|
|
|
|
|
|
|
| Weighted- |
| Remaining |
|
|
|
| |
|
| Number of |
| average |
| Contractual |
| Aggregate |
| ||
|
| Options |
| Exercise |
| Life |
| Intrinsic |
| ||
Stock Options |
| Outstanding |
| Price |
| (in years) |
| Value |
| ||
|
|
|
|
|
|
|
|
|
|
|
|
Balance as of January 1, 2017 |
| 3,294 |
| $ | 3.38 |
| 7.23 |
| $ | 5,301 |
|
Granted |
| 60 |
|
| 5.95 |
|
|
|
|
|
|
Exercised |
| (481) |
|
| 3.17 |
|
|
|
|
|
|
Canceled and expired |
| (24) |
|
| 3.31 |
|
|
|
|
|
|
Balance as of September 30, 2017 |
| 2,849 |
| $ | 3.47 |
| 6.98 |
| $ | 16,173 |
|
Options vested as of September 30, 2017 and unvested options expected to vest, net of forfeitures |
| 2,806 |
| $ | 3.46 |
| 6.95 |
| $ | 15,964 |
|
Options exercisable as of September 30, 2017 |
| 1,591 |
| $ | 3.26 |
| 5.83 |
| $ | 9,366 |
|
The aggregate intrinsic value in the table above represents the total pretax intrinsic value, based on our closing price of $9.15$4.59 on September 30, 2017,March 28, 2024, which would have been received by the option holder had all option holders exercised their options on that date.
Restricted stock awards
A summary of activity related to restricted stock awards for the ninethree months ended September 30, 2017March 31, 2024 is presented below (in thousands, except per share data):
| | | | | | |
|
| |
| Weighted-Average |
| |
| | | | Grant Date |
| |
Stock Awards |
| Shares |
| Share Value |
| |
Non-vested as of January 1, 2024 | | 1,220 | | $ | 3.75 | |
Granted |
| — | | $ | — | |
Vested |
| (7) | | $ | 12.37 | |
Forfeited | | — | | $ | — | |
Non-vested as of March 31, 2024 |
| 1,213 | | $ | 3.69 | |
|
|
|
|
|
|
|
|
|
|
| Weighted-Average |
| |
|
|
|
| Grant Date |
| |
Stock Awards |
| Shares |
| Fair Value |
| |
Non-vested as of January 1, 2017 |
| 325 |
| $ | 3.27 |
|
Granted |
| 71 |
| $ | 7.96 |
|
Vested |
| (74) |
| $ | 3.22 |
|
Forfeited |
| — |
| $ | — |
|
Non-vested as of September 30, 2017 |
| 322 |
| $ | 4.32 |
|
As of September 30, 2017,March 31, 2024, the unamortized compensation costs related to unvested restricted stock awards was approximately $1.1$3.5 million, which is to be amortized on a straight-line basis over a weighted-average period of approximately 1.3 years.
At-Risk, Performance Shares
In March 2023 and February 2024, the Company issued at-risk, performance shares classified as equity awards. Expense is recognized quarterly on a straight-line method over the requisite service period, based on the probability of achieving the specified financial performance metric, with changes in expectations recognized as an adjustment to earnings in the period of change. Compensation cost is not recognized for at-risk, performance shares that do not vest because service or performance conditions are not satisfied and any previously recognized compensation cost is reversed. At-risk, performance shares are eligible to receive dividend equivalents under the Company’s 2015 Equity Incentive Plan (the “Plan”), as determined by the Board of Directors. The Company will recognize forfeitures as they occur.
The Company’s at-risk, performance shares are classified as equity and contain performance and service conditions that must be satisfied for an employee to receive the shares. The financial performance metric for the at-risk, performance shares issued in February 2022 is based upon year-end 2021 actual results as compared to the Company’s year-end actual results in 2022. The financial performance metrics for the at-risk, performance shares issued in March 2023 are based upon the Company’s year-end actual results in 2023. The financial performance metric for the at-risk, performance shares issued in February 2024 is based upon the Company’s year-end actual results in 2024. All performance shares, if earned, are still subject to annual vesting over a four-year period, except that no shares are vested
1819
on the first anniversary because the performance measurement is based on year-end results for the year 2023 and 2024, respectively.
The fair value of the at-risk, performance shares is determined based on the closing price of the Company’s common stock on the first day after the public issuance of the Company’s earnings release for the most recent fiscal quarter, following the Compensation Committee and Board of Directors approval, which is considered the grant date. The fair value per share of the at-risk, performance shares classified as equity awards granted in February 2024 and March 2023 was $2.28 and $3.71, respectively.
On February 15, 2022, the Compensation Committee recommended, and the Board approved, the grant to Dr. Morris Young of 114,320 at-risk, performance shares under the Plan. On February 15, 2022, the Compensation Committee approved the grant to Gary Fischer of 32,100 at-risk, performance shares under the Plan. If the performance financial metric is less than 50% achieved these shares are forfeited. If the performance financial metric is between 50% and 200% achieved, then a corresponding pro rata portion of the 114,320 shares issued to Dr. Young would be eligible to vest and a corresponding pro rata portion of the 32,100 shares issued to Mr. Fischer would be eligible to vest. Any shares that are not eligible to vest are forfeited. If the target financial metric exceeds 200%, then the maximum number of at-risk performance shares that would be eligible to vest is 114,320 for Dr. Young and 32,100 for Mr. Fischer. On February 14, 2023, the Compensation Committee met and certified the year-over-year annual revenue growth rate achieved for fiscal year 2022, expressed as a percentage, was 2.7%. Therefore, none of the at-risk performance shares became eligible to vest.
On March 15, 2023, the Compensation Committee recommended, and the Board approved, the grant to Dr. Morris Young of 223,590 at-risk, performance shares under the Plan. On March 15, 2023, the Compensation Committee approved the grant to Gary Fischer of 77,600 at-risk, performance shares under the Plan. If the minimum financial metric for fiscal year 2023 is achieved, then based upon a performance formula, a corresponding portion of the 223,590 shares issued to Dr. Young would be eligible to vest and a corresponding portion of the 77,600 shares issued to Mr. Fischer would be eligible to vest. If the target financial metric was exceeded and an additional financial metric for fiscal year 2023 is achieved, then additional shares above the target number of shares are earned based on such performance formula and the maximum number of additional shares earned is capped at 100% of the target. If the minimum financial metric for fiscal year 2023 is not achieved, then these awards are forfeited. On February 20, 2024, the Compensation Committee met and certified that the minimum revenue metric for fiscal year 2023 was not achieved. Therefore, none of the at-risk performance shares became eligible to vest.
On February 20, 2024, the Compensation Committee recommended, and the Board approved, the grant to Dr. Morris Young of 223,590 at-risk, performance shares under the Plan. On February 20, 2024, the Compensation Committee approved the grant to Gary Fischer of 77,600 at-risk, performance shares under the Plan. If the minimum financial metric for fiscal year 2024 is achieved, then based upon a performance formula, a corresponding portion of the 223,590 shares issued to Dr. Young would be eligible to vest and a corresponding portion of the 77,600 shares issued to Mr. Fischer would be eligible to vest. If the target financial metric is exceeded, then additional shares above the target number of shares are earned based on such performance formula and the maximum number of additional shares earned is capped at 100% of the target. If the minimum financial metric for fiscal year 2024 is not achieved, then these awards are forfeited.
A summary of the status of our unvested at-risk, performance shares as of March 31, 2024 is presented below (in thousands, except per share data):
| | | | | |
|
| |
| Weighted-Average | |
| | | | Grant Date | |
Stock Awards |
| Shares |
| Share Value | |
Non-vested as of January 1, 2024 | | 38 | | $ | 15.37 |
Granted (1) |
| 151 | | $ | 2.28 |
Vested |
| — | | $ | — |
Forfeited | | — | | $ | — |
Non-vested as of March 31, 2024 |
| 189 | | $ | 4.91 |
20
| (1) | The number of shares presented is based on achieving 100% of the targeted financial performance metric as defined in the at-risk, performance shares agreement. |
As of March 31, 2024, there was $0.4 million of unrecognized compensation expense related to unvested at-risk, performance shares that is expected to be recognized over a weighted-average period of 1.81 years.
Note 10. Net IncomeLoss Per Share
Basic net income (loss) per share is computed using the weighted-average number of common shares outstanding during the periods less shares of common stock subject to repurchase and non-vested stock awards. Diluted net income (loss) per share is computed using the weighted-average number of common shares outstanding and potentially dilutive common shares outstanding during the periods. The dilutive effect of outstanding stock options and restricted stock awards is reflected in diluted earnings per share by application of the treasury stock method. Potentially dilutive common shares consist of common shares issuable upon the exercise of stock options and vesting of restricted stock awards. Potentially dilutive common shares are excluded from the computation of weighted-average number of common shares outstanding in net loss years, as their effect would be anti-dilutive to the computation.
A reconciliation of the numerators and denominators of the basic and diluted net income loss per share calculations is as follows (in thousands, except per share data):
| | | | | | | |
| | Three Months Ended | | ||||
| | March 31, | | ||||
|
| 2024 |
| 2023 |
| ||
Numerator: | | | | | | | |
Net loss attributable to AXT, Inc. | | $ | (2,083) | | $ | (3,348) | |
Less: Preferred stock dividends | |
| (44) | |
| (44) | |
Net loss available to common stockholders | | $ | (2,127) | | $ | (3,392) | |
Denominator: | | | | | | | |
Denominator for basic net income (loss) per share - weighted-average common shares | |
| 42,987 | |
| 42,498 | |
Effect of dilutive securities: | | | | | | | |
Common stock options | |
| — | |
| — | |
Restricted stock awards | |
| — | |
| — | |
Denominator for dilutive net income (loss) per common shares | |
| 42,987 | |
| 42,498 | |
Net income (loss) attributable to AXT, Inc. per common share: | | | | | | | |
Basic | | $ | (0.05) | | $ | (0.08) | |
Diluted | | $ | (0.05) | | $ | (0.08) | |
| | | | | | | |
Options excluded from diluted net income (loss) per share as the impact is anti-dilutive | |
| 1,189 | |
| 1,203 | |
Restricted stock excluded from diluted net income (loss) per share as the impact is anti-dilutive | |
| 1,401 | |
| 1,081 | |
|
|
|
|
|
|
|
|
|
|
|
|
|
|
|
| Three Months Ended |
| Nine Months Ended |
| ||||||||
|
| September 30, |
| September 30, |
| ||||||||
|
| 2017 |
| 2016 |
| 2017 |
| 2016 |
| ||||
Numerator: |
|
|
|
|
|
|
|
|
|
|
|
|
|
Net income attributable to AXT, Inc |
| $ | 4,419 |
| $ | 2,229 |
| $ | 7,014 |
| $ | 3,422 |
|
Less: Preferred stock dividends |
|
| (44) |
|
| (44) |
|
| (132) |
|
| (132) |
|
Net income available to common stockholders |
| $ | 4,375 |
| $ | 2,185 |
| $ | 6,882 |
| $ | 3,290 |
|
Denominator: |
|
|
|
|
|
|
|
|
|
|
|
|
|
Denominator for basic net income per share - weighted average common shares |
|
| 38,499 |
|
| 32,110 |
|
| 36,999 |
|
| 32,043 |
|
Effect of dilutive securities: |
|
|
|
|
|
|
|
|
|
|
|
|
|
Common stock options |
|
| 1,416 |
|
| 827 |
|
| 1,283 |
|
| 425 |
|
Restricted stock awards |
|
| 180 |
|
| 201 |
|
| 187 |
|
| 147 |
|
Denominator for dilutive net income per common shares |
|
| 40,095 |
|
| 33,138 |
|
| 38,469 |
|
| 32,615 |
|
Net income attributable to AXT, Inc. per common share: |
|
|
|
|
|
|
|
|
|
|
|
|
|
Basic |
| $ | 0.11 |
| $ | 0.07 |
| $ | 0.19 |
| $ | 0.10 |
|
Diluted |
| $ | 0.11 |
| $ | 0.07 |
| $ | 0.18 |
| $ | 0.10 |
|
|
|
|
|
|
|
|
|
|
|
|
|
|
|
Options excluded from diluted net income per share as the impact is anti-dilutive |
|
| 68 |
|
| 652 |
|
| 573 |
|
| 910 |
|
Restricted stock excluded from diluted net income per share as the impact is anti-dilutive |
|
| 34 |
|
| — |
|
| 11 |
|
| — |
|
The 883,000 shares of $0.001 par value Series A preferred stock issued and outstanding as of September 30, 2017March 31, 2024 and December 31, 2016,2023, valued at $3,532,000, are non-voting and non-convertible preferred stock with a 5.0% cumulative annual dividend rate payable when declared by the boardBoard of directorsDirectors and a $4 per share liquidation preference over common stock, which must be paid before any distribution is made to common stockholders. These preferred shares were issued to Lyte Optronics, Inc. stockholders in connection with the completion of our acquisition of Lyte Optronics, Inc. on May 28, 1999.
19
Note 11. Segment Information and Foreign Operations
Segment Information
We operate in one segment for the design, development, manufacture and distribution of high-performance compound and single element semiconductor substrates and sale of raw materials integral to these substrates. In
21
accordance with ASC topicTopic 280, Segment Reporting, our chief operating decision-makerdecision maker has been identified as ourthe Chief Executive Officer, who reviews operating results to make decisions about allocating resources and assessing performance for the Company. Since we operate in one segment, all financial segment and product line information can be found in the condensed consolidated financial statements.
Product Information
The following table represents revenue amounts (in thousands) by product type:
|
|
|
|
|
|
|
|
|
|
|
|
|
|
| ||||||||
|
| Three Months Ended |
| Nine Months Ended |
|
| ||||||||||||||||
|
| September 30, |
| September 30, |
|
| ||||||||||||||||
|
| 2017 |
| 2016 |
| 2017 |
| 2016 |
|
| ||||||||||||
| | | | | | | | |||||||||||||||
| | Three Months Ended | | | ||||||||||||||||||
| | March 31, | | | ||||||||||||||||||
|
| 2024 |
| 2023 |
| |||||||||||||||||
Product Type: |
|
|
|
|
|
|
|
|
|
|
|
|
|
| | | | | | | | |
Substrates |
| $ | 22,377 |
| $ | 17,050 |
| $ | 58,095 |
| $ | 49,629 |
|
| | $ | 16,903 | | $ | 13,489 | | |
Raw Materials and Others |
|
| 5,791 |
|
| 4,822 |
|
| 14,246 |
|
| 11,451 |
|
| ||||||||
Raw Materials and Other | |
| 5,785 | |
| 5,916 | | | ||||||||||||||
Total |
| $ | 28,168 |
| $ | 21,872 |
| $ | 72,341 |
| $ | 61,080 |
|
| | $ | 22,688 | | $ | 19,405 | | |
Geographical Information
The following table represents revenue amounts (in thousands) reported for products shipped to customers in the corresponding geographic region:
| | | | | | | | |
| | Three Months Ended | | | ||||
| | March 31, | | | ||||
|
| 2024 |
| 2023 |
|
| ||
Geographical region: | | | | | | | | |
China | | $ | 11,517 | | $ | 8,102 | | |
Taiwan | | | 4,582 | | | 2,471 | | |
Japan | |
| 990 | |
| 1,535 | | |
Asia Pacific (excluding China, Taiwan and Japan) | | | 798 | | | 1,091 | | |
Europe (primarily Germany) | | | 3,725 | | | 3,570 | | |
North America (primarily the United States) | |
| 1,076 | |
| 2,636 | | |
Total | | $ | 22,688 | | $ | 19,405 | | |
|
|
|
|
|
|
|
|
|
|
|
|
|
|
|
|
| Three Months Ended |
| Nine Months Ended |
|
| ||||||||
|
| September 30, |
| September 30, |
|
| ||||||||
|
| 2017 |
| 2016 |
| 2017 |
| 2016 |
|
| ||||
China |
| $ | 7,203 |
| $ | 4,766 |
| $ | 17,949 |
| $ | 12,041 |
|
|
Europe (primarily Germany) |
|
| 6,192 |
|
| 4,995 |
|
| 17,638 |
|
| 13,946 |
|
|
Taiwan |
|
| 5,986 |
|
| 2,995 |
|
| 13,499 |
|
| 11,779 |
|
|
Japan |
|
| 3,694 |
|
| 3,499 |
|
| 9,696 |
|
| 8,096 |
|
|
Asia Pacific (excluding China, Taiwan and Japan) |
|
| 2,934 |
|
| 3,239 |
|
| 7,650 |
|
| 8,391 |
|
|
North America (primarily the United States) |
|
| 2,159 |
|
| 2,378 |
|
| 5,909 |
|
| 6,827 |
|
|
Total |
| $ | 28,168 |
| $ | 21,872 |
| $ | 72,341 |
| $ | 61,080 |
|
|
Long-lived assets consist primarily of property, plant and equipment and operating lease right-of-use assets, and are attributed to the geographic location in which they are located. Long-lived assets, net of depreciation, by geographic region were as follows (in thousands):
| | | | | | | |
| | As of | | ||||
| | March 31, | | December 31, | | ||
|
| 2024 |
| 2023 |
| ||
Long-lived assets by geographic region, net of depreciation: | | | | | | | |
North America | | $ | 1,562 | | $ | 1,631 | |
China | |
| 164,217 | |
| 167,516 | |
| | $ | 165,779 | | $ | 169,147 | |
|
|
|
|
|
|
|
|
|
| As of |
| ||||
|
| September 30, |
| December 31, |
| ||
|
| 2017 |
| 2016 |
| ||
Long-lived assets by geographic region, net of depreciation: |
|
|
|
|
|
|
|
North America |
| $ | 1,542 |
| $ | 318 |
|
China |
|
| 40,713 |
|
| 27,487 |
|
|
| $ | 42,255 |
| $ | 27,805 |
|
20
Significant Customers
Two customers, Landmark and Osram Opto,One customer represented 16% and 10% respectively,12% of our revenue for the three months ended September 30, 2017 while one customer, IQE Group,March 31, 2024 and no customers represented 12% 10% of our revenue for the three months ended September 30, 2016.March 31, 2023. Our top five customers, although not the same five customers for each period, represented 39%33% and 38%28% of our revenue for the three months ended September 30, 2017March 31, 2024 and 2016,2023, respectively.
Two customers, Landmark and Osram Opto, represented 12% and 11%, respectively, of our revenue for the nine months ended September 30, 2017 while two customers, IQE Group and Landmark, represented 11% and 10%, respectively, of our revenue for the nine months ended September 30, 2016. Our top five customers, although not the same five customers for each period, represented 37% and 40% of our revenue for the nine months ended September 30, 2017 and 2016, respectively.
We perform ongoing credit evaluations of our customers’ financial condition, and limit the amount of credit extended when deemed necessary, but generally do not require collateral. One customerNo customers accounted for 13%10% of our accounts receivable balance as of September 30, 2017March 31, 2024, while one customer and no customers accounted for 13%more than 10% of our accounts receivable balance as of December 31, 2016. 2023.
22
Note 12. Commitments and Contingencies
Indemnification Agreements
We have entered into indemnification agreements with our directors and officers that require us to indemnify our directors and officers against liabilities that may arise by reason of their status or service as directors or officers, other than liabilities arising from willful misconduct of a culpable nature; to advance their expenses incurred as a result of any proceeding against them as to which they could be indemnified; and to obtain directors’ and officers’ insurance if available on reasonable terms, which we currently have in place.
Product Warranty
We provide warranties for our products for a specific period of time, generally twelve months, against material defects. We provide for the estimated future costs of warranty obligations in cost of sales when the related revenue is recognized. The accrued warranty costs represent the best estimate at the time of sale of the total costs that we expect to incur to repair or replace product parts that fail while still under warranty. The amount of accrued estimated warranty costs areis primarily based on historical experience as to product failures as well as current information on repair costs. On a quarterly basis, we review the accrued balances and update the historical warranty cost trends.
The following table reflects the change in our warranty accrual which is included in “Accrued liabilities” onin the condensed consolidated balance sheets, during the three and nine months ended September 30, 2017March 31, 2024 and 20162023 (in thousands):
| | | | | | | |
| | Three Months Ended | | ||||
| | March 31, | | ||||
|
| 2024 |
| 2023 |
| ||
Beginning accrued product warranty | | $ | 703 | | $ | 669 | |
Accruals for warranties issued | |
| 57 | |
| 544 | |
Adjustments related to pre-existing warranties including expirations and changes in estimates | |
| (210) | |
| 25 | |
Cost of warranty repair | |
| (55) | |
| (323) | |
Ending accrued product warranty | | $ | 495 | | $ | 915 | |
|
|
|
|
|
|
|
|
|
|
|
|
|
|
|
| Three Months Ended |
| Nine Months Ended |
| ||||||||
|
| September 30, |
| September 30, |
| ||||||||
|
| 2017 |
| 2016 |
| 2017 |
| 2016 |
| ||||
Beginning accrued warranty and related costs |
| $ | 130 |
| $ | 330 |
| $ | 251 |
| $ | 497 |
|
Accruals for warranties issued |
|
| 7 |
|
| 3 |
|
| 77 |
|
| 26 |
|
Adjustments related to pre-existing warranties including expirations and changes in estimates |
|
| 18 |
|
| (57) |
|
| (114) |
|
| (188) |
|
Cost of warranty repair |
|
| (17) |
|
| (10) |
|
| (76) |
|
| (69) |
|
Ending accrued warranty and related costs |
| $ | 138 |
| $ | 266 |
| $ | 138 |
| $ | 266 |
|
21
Contractual Obligations
We lease certain office space, warehouse facilitiesIn 2020, we and equipment under long-term operating leases expiring at various dates through December 2025. The majority of our lease obligations relates to our lease agreement for the facility in Fremont, California with approximately 19,467 square feet, which expires in 2017. We have an option to extend the lease for an additional three years. In May 2017, we exercised this option and the lease was extended for an additional three years. All terms remain the same and this lease will expire in 2020.
Wea competitor entered into a royaltycross license and covenant agreement with a competitor effective December 3, 2010 with(the “Cross License Agreement”), which has a term of eight years, terminatingthat began on January 1, 2020 and expires on December 31, 2018. We2029. The Cross License Agreement is a fixed-cost cross license and our related companiesnot a variable-cost cross license that is based on revenue or units. Under the Cross License Agreement, we are granted a worldwide, nonexclusive, royalty bearing, irrevocable licenseobligated to certain patents for the term of the agreement. We shall pay up to $7.0 million of royaltymake annual payments over eight years that began in 2011 based on future royalty bearing sales. This royalty agreement contains a clause that allows us to claim a credit, starting in 2013, in the event that the royalty bearing sales for the year are lower than a pre-determined amount set forth in this agreement.10-year period.
The following table summarizes our contractual obligations as of September 30, 2017 (in thousands):
|
|
|
|
|
|
|
|
|
|
|
|
|
|
|
|
|
|
| Payments due by period |
| |||||||||||||
|
|
|
|
|
|
|
| 1-3 |
| 4-5 |
| More than |
| |||
Contractual Obligations |
| Total |
| Less than 1 year |
| years |
| years |
| 5 years |
| |||||
Operating leases |
| $ | 651 |
| $ | 202 |
| $ | 350 |
| $ | 93 |
| $ | 6 |
|
Royalty agreement |
|
| 719 |
|
| 575 |
|
| 144 |
|
| — |
|
| — |
|
Total |
| $ | 1,370 |
| $ | 777 |
| $ | 494 |
| $ | 93 |
| $ | 6 |
|
Land Purchase and Investment Agreement
We are in thehave established a wafer process of relocating our gallium arsenide production line toin Dingxing, China. In addition to a land rights and building purchase agreement that we entered into with a private real estate development company to acquire our new manufacturing facility, we also entered into a cooperation agreement with the Dingxing local government. In addition to pledging its full support and cooperation, the Dingxing local government will issue certain credits or rebates to us as we achieve certain milestones. We, in turn, agreed to hire local workers over time, pay taxes when due and eventually demonstrate a total investment of approximately $90 million in value, assets and capital. The investment will include cash paid for the land and buildings, cash on deposit in our name at local banks, the gross value of new and used equipment (including future equipment that might be used for indium phosphide and germanium substrates production), the deemed value for our customer list or the end user of our substrates, (forfor example, the end users of the 3-D sensing VCSELs)VCSELs (vertical cavity surface emitting lasers), a deemed value for employment of local citizens, a deemed value for our proprietary process technology, other intellectual property, other intangibles and additional items of value. There is no timeline or deadline by which this must be accomplished, rather it is a good faith covenant entered into between AXT and the Dingxing local government. Further, there is no specific penalty contemplated if either party breaches the agreement, howeveragreement. However, the agreement does state that each party has a right to seek from the other party compensation for
23
losses. Under certain conditions, the Dingxing local government may purchase the land and building at the appraised value. We believe that such cooperation agreements are normal, customary and usual in China and that the future valuation is flexible. We have a similar agreement with the city of Kazuo, China, although on a smaller scale. The total investment targeted by AXT in Kazuo is approximately $15$15 million in value, assets and capital. In addition, BoYu has a similar agreement with the city of Kazuo. The total investment targeted by BoYu in Kazuo is approximately $8 million in value, assets and capital.
Purchase Obligations with Penalties for Cancellation
In the normal course of business, we issue purchase orders to various suppliers. In certain cases, we may incur a penalty if we cancel the purchase order. As of September 30, 2017,March 31, 2024, we do not have any outstanding purchase orders that will incur a penalty if cancelled by the Company.
Legal Proceedings
22
From time to time we may be involved in judicial or administrative proceedings concerning matters arising in the ordinary course of business. We do not expect that any of these matters, individually or in the aggregate, will have a material adverse effect on our business, financial condition, cash flows or results of operations.
Note 13. Foreign Exchange Transaction Gains/LossesOther Income (expense), Net
WeOther income (expense), net for the three months ended March 31, 2024 and 2023, includes a grant of $1.0 million and $0.5 million, respectively, from government agencies as awards for technological innovation.
In addition, we incurred a foreign currency transaction exchange gain of $58,000 and a loss of $339,000 and a gain of $83,000$213,000 for the three months ended September 30, 2017March 31, 2024 and 2016,2023, respectively.We incurred a foreign currency transaction exchange loss of $414,000 and a gain of $327,000 for the nine months ended September 30, 2017 and 2016, respectively. These amounts are included in “Other (expense) income, net” on our condensed consolidated statements of operations.
Note 14. Income Taxes
We account for income taxes in accordance with ASC topicTopic 740, Income Taxes (“ASC 740”), which requires that deferred tax assets and liabilities be recognized using enacted tax rates for the effect of temporary differences between the book and tax bases of recorded assets and liabilities. ASC 740 also requires that deferred tax assets be reduced by a valuation allowance if it is more likely than not that a portion of the deferred tax asset will not be realized.
We provide for income taxes based upon the geographic composition of worldwide earnings and tax regulations governing each region, particularly China. The calculation of tax liabilities involves significant judgment in estimating the impact of uncertainties in the application of complex tax laws, particularly in foreign countries such as China.
We recognize interest and penalties related to uncertain tax positions in income tax expense. Income tax expense for the three and nine months ended September 30, 2017March 31, 2024 includes no interest and penalties. As of September 30, 2017,March 31, 2024, we have no accrued interest and penalties related to uncertain tax positions. We file income tax returns in the U.S. federal, various states and foreign jurisdictions. Currently, there is no tax audit in any of the jurisdictions and we do not expect there will be any significant change to this.
Provision for income taxes for the three and nine months ended September 30, 2017March 31, 2024 was mostly related to our wholly owned China subsidiarysubsidiaries and our three partially owned subsidiaries in China. Besides theIncome taxes and certain state tax liabilities, no income taxes, or benefits have been provided for our U.S. operations as most of the income in the U.S. had been fully offset by utilization of federal and state net operating loss carryforwards.
Under the 2017 Tax Cuts and Jobs Act, research and experimental (“R&E”), expenditures incurred or paid for tax years beginning after December 31, 2021 will no longer be immediately deductible for tax purposes. Instead, businesses are now required to capitalize and amortize R&E expenditures over a period of five years for research conducted within the U.S. or 15 years for research conducted in a foreign jurisdiction. We capitalize the R&E expense incurred by our China subsidiaries and amortize it over 15 years.
24
On June 29, 2020, California Governor Gavin Newsom signed Assembly Bill 85 (“AB 85”) into law as part of the California 2020 Budget Act, which temporarily suspends the use of California net operating losses and imposes a cap on the amount of business incentive tax credits that companies can utilize against their net income for tax years 2020, 2021, and 2022. We analyzed the provisions of AB 85 and determined there was no impact on our provision for income taxes for the current period and will continue to evaluate the impact, if any, AB 85 may have on theCompany’s condensed consolidated financial statements and disclosures.
Note 15. Revenue
Revenue Recognition
We manufacture and sell high-performance compound semiconductor substrates including indium phosphide, gallium arsenide and germanium wafers, and our consolidated subsidiaries sell certain raw materials, including high purity gallium (7N Ga), pyrolytic boron nitride (pBN) crucibles and boron oxide (B2O3). After we ship our products, there are no remaining obligations or customer acceptance requirements that would preclude revenue recognition. Our products are typically sold pursuant to purchase orders placed by our customers, and our terms and conditions of sale do not require customer acceptance. We account for a contract with a customer when there is a legally enforceable contract, which could be the customer’s purchase order, the rights of the parties are identified, the contract has commercial terms, and collectibility of the contract consideration is probable. The majority of our contracts have a single performance obligation to transfer products and are short term in nature, usually less than six months. Our revenue is measured based on the consideration specified in the contract with each customer in exchange for transferring products that are generally based upon a negotiated formula, list or fixed price. Revenue is recognized when control of the promised goods is transferred to our customer, which is either upon shipment from our dock, receipt at the customer’s dock, or removal from consignment inventory at the customer’s location, in an amount that reflects the consideration we expect to be entitled to receive in exchange for those goods.
We have elected to account for shipping and handling as activities to fulfill the promise to transfer the goods. Shipping and handling fees billed to customers in a sales transaction are recorded as an offset to shipping and handling expenses. Sales taxes and value added taxes in foreign jurisdictions that are collected from customers and remitted to governmental authorities are accounted for on a net basis and, therefore, are excluded from revenue.
We do not provide training, installation or commissioning services. We provide for future returns based on historical data, prior experience, current economic trends and changes in customer demand at the time revenue is recognized. We do not recognize any asset associated with the incremental cost of obtaining revenue generating customer contracts. As such, sales commissions are expensed as incurred, given that the expected period of benefit is less than one year.
Contract Balances
Contract assets are recorded when we have a conditional right to consideration for our completed performance under the contracts. Accounts receivables are recorded when the right to this consideration becomes unconditional. We believe the fair value of our accounts receivable approximates its carrying value due to its short maturities and nominal credit risk. We do not have any material contract assets as of March 31, 2024. In some contracts we require payment in advance of shipment, per a billing schedule reflected in our customer contracts, and the payment is recorded as a contract liability. The following table reflects the contract liabilities balance, which is included in “Accrued liabilities” on the condensed consolidated balance sheets, as of March 31, 2024 and December 31, 2023 (in thousands):
25
| | | | | | | |
| | March 31, | | December 31, | | ||
| | 2024 | | 2023 | | ||
Contract liabilities | | $ | 535 | | $ | 305 | |
During the three months ended March 31, 2024, the Company recognized $127,000 of revenue that was included in the contract balances as of December 31, 2023. During the three months ended March 31, 2023, the Company recognized $286,000 of revenue that was included in the contract balances as of December 31, 2022. | | | | | | | |
Disaggregated Revenue
In general, revenue disaggregated by product types and geography (see Note 11) is aligned according to the nature and economic characteristics of our business and provides meaningful disaggregation of our results of operations. Since we operate in one segment, all financial segment and product line information can be found in the condensed consolidated financial statements.
Note 16. Loans and Line of Credit
Our bank loans and credit facilities typically have a term of 12 months or less and are included in “Short-term loans” in our condensed consolidated balance sheets. The following table represents short-term bank loans as of March 31, 2024 and December 31, 2023 (in thousands, except interest rate data):
| | | | | | | | | | | | |
| | | Loan | Interest | | | | | | December 31, | | March 31, |
Subsidiary | Bank | | Detail | Rate | | Start Date | | Due Date | | 2023 | | 2024 |
Tongmei | Bank of China (1) | $ | 1,848 | 3.5 | % | January-23 | | January-24 | $ | 1,795 | $ | - |
| | | 2,184 | 2.8 | % | March-23 | | March-24 | | 2,118 | | - |
| | | 376 | 2.7 | % | September-23 | | September-24 | | 386 | | 378 |
| | | 876 | 3.5 | % | November-23 | | November-24 | | 876 | | 858 |
| | | 1,003 | 3.5 | % | November-23 | | November-24 | | 1,003 | | 985 |
| Bank of China (2) | | 2,911 | 3.5 | % | January-23 | | January-24 | | 2,825 | | - |
| | | 2,770 | 3.0 | % | January-24 | | January-25 | | - | | 2,770 |
| Bank of Communications (1) | | 1,455 | 3.3 | % | January-23 | | January-24 | | 1,414 | | - |
| | | 1,380 | 3.8 | % | May-23 | | May-24 | | 1,414 | | 1,386 |
| | | 1,373 | 3.8 | % | July-23 | | May-24 | | 1,414 | | 1,386 |
| China Merchants Bank (1) | | 4,367 | 3.7 | % | January-23 | | January-24 | | 4,235 | | - |
| | | 1,386 | 3.5 | % | January-24 | | January-25 | | - | | 1,386 |
| | | 692 | 3.5 | % | February-24 | | February-25 | | - | | 692 |
| Bank of Beijing (3) | | 2,290 | 4.2 | % | January-23 | | January-24 | | 2,220 | | - |
| | | 3,541 | 3.2 | % | June-23 | | May-24 | | 3,626 | | 3,560 |
| | | 1,380 | 3.2 | % | June-23 | | February-24 | | 1,414 | | - |
| | | 1,414 | 3.0 | % | December-23 | | December-24 | | 1,414 | | 1,386 |
| | | 3,600 | 3.0 | % | March-24 | | February-25 | | - | | 3,600 |
| | | 1,386 | 3.0 | % | March-24 | | December-24 | | - | | 1,386 |
| Industrial Bank (1) | | 2,757 | 4.3 | % | June-23 | | June-24 | | 2,825 | | 2,770 |
| | | 2,744 | 4.3 | % | July-23 | | July-24 | | 2,825 | | 2,770 |
| | | 2,744 | 4.3 | % | September-23 | | September-24 | | 2,825 | | 2,770 |
| NingBo Bank (1) | | 2,744 | 4.2 | % | August-23 | | September-24 | | 2,820 | | 2,765 |
| | | 1,271 | 4.3 | % | November-23 | | November-24 | | 1,271 | | 1,246 |
| | | 2,825 | 4.3 | % | December-23 | | December-24 | | 2,825 | | 2,770 |
| | | 1,647 | 4.3 | % | January-24 | | January-25 | | - | | 1,647 |
| Industrial and Commercial Bank of China (1) | | 2,744 | 3.3 | % | September-23 | | September-24 | | 2,825 | | 2,770 |
| NanJing Bank (1) | | 2,752 | 3.8 | % | October-23 | | October-24 | | 2,752 | | 2,700 |
BoYu | Industrial and Commercial Bank of China (4) | | 1,414 | 2.7 | % | December-23 | | December-24 | | 1,414 | | 1,386 |
| Bank of China (1) | | 1,204 | 2.4 | % | January-23 | | January-24 | | 849 | | - |
| NingBo Bank (1) | | 1,414 | 3.3 | % | November-23 | | May-24 | | 1,414 | | 1,386 |
| Industrial Bank (1) | | 688 | 3.6 | % | September-23 | | September-24 | | 708 | | 692 |
| Bank of Communications (1) | | 1,414 | 3.0 | % | November-23 | | May-24 | | 1,414 | | 1,386 |
| NanJing Bank (1) | | 1,386 | 3.5 | % | January-24 | | January-25 | | - | | 1,386 |
| Loan Balance | | | | | | | | $ | 52,921 | $ | 48,217 |
26
Collateral for the above bank loans and line of credit
| (1) | Not collateralized. |
| (2) | ChaoYang LiMei time deposit. |
| (3) | AXT time deposit. |
| (4) | BoYu’s land use rights and its building located at its facility in Tianjin, China. In addition, the December 2023 loan attracts a guarantee fee amounting to 0.7% of the loan amount. |
Long-term Loans
On January 30, 2024, the Company secured a new line of credit amounting to $9.7 million, structured as a five-year bank loan. The credit facility bears interest at a rate of 6.5% per annum on the amount drawn from the line of credit. The credit facility is collateralized by the real estate properties owned by ChaoYang Tongmei. In January 2024, the Company borrowed $5.8 million against the credit facility. The intended use of the credit facility is for construction projects. As of March 31, 2024, $5.6 million is included in “Other long-term liabilities” and $277,000 is included in “Short-term loans” in our consolidated balance sheets.
In December 2023, one of our consolidated subsidiaries, ChaoYang XinMei secured a loan of approximately $2.1 million from an unrelated financing company. According to the agreement, ChaoYang XinMei temporarily transferred ownership of its production line and related equipment to the financing company, while retaining the right to use the property for production. At the end of the 30-month contractual period, ChaoYang XinMei holds the option to repurchase the production line and related equipment for $14.00. As of March 31, 2024, $1.4 million associated with this financing arrangement is included in “Other long-term liabilities” and $554,000 is included in “Short-term loans” in our consolidated balance sheets.
As of March 31, 2024, the maturities of our long-term loan liabilities in five years (excluding short-term loans) are as follows (in thousands):
| | |
Maturity of long term loans |
| |
2025 | $ | 1,038 |
2026 | | 1,315 |
2027 | | 969 |
2028 | | 1,246 |
2029 | | 2,371 |
In summary, short-term loans of $49.0 million included under “Short-term loans” in our condensed consolidated balance sheet at March 31, 2024, consisted of $48.2 million of short-term bank loans and $0.8 million of the current portion of long-term debt. Long-term loans of $7.0 million included under “Other long-term liabilities” in our condensed consolidated balance sheet at March 31, 2024 consisted of $5.6 million in a five-year bank loan and $1.4 million in a loan secured by ChaoYang XinMei.
Note 17. Leases
We lease certain equipment, office space, warehouse and facilities under long-term operating leases expiring at various dates through July 2029. The majority of our lease obligations relate to our lease agreement for our facility in Fremont, California with approximately 19,467 square feet, which was scheduled to expire in 2020. Under the terms of the facility lease agreement, in May 2020, we were granted an extension to the term of the lease for an additional three years. Furthermore, in September 2023, we entered into another agreement to extend the lease for an additional five years, commencing December 2023. There are no variable lease payments, residual value guarantees or any restrictions or covenants imposed by the facility lease. The remaining lease obligations relate to a nitrogen system to be used during the manufacturing process for our facility in Dingxing, China. The equipment lease became effective in August 2019 and will expire in July 2029. There are no variable lease payments, residual value guarantees or any restrictions or covenants imposed by the equipment lease. All other operating leases have a term of 12 months or less.
Leases are classified as either finance leases or operating leases. A lease is classified as a finance lease if any one of the following criteria are met: the lease transfers ownership of the asset by the end of the lease term, the lease
27
contains an option to purchase the asset that is reasonably certain to be exercised, the lease term is for a major part of the remaining useful life of the asset or the present value of the lease payments equals or exceeds substantially all of the fair value of the asset. A lease is classified as an operating lease if it does not meet any one of these criteria. All of our leases are classified as operating leases and substantially all of our operating leases are comprised of equipment and office space leases. None of our leases are classified as finance leases.
For all leases at the lease commencement date, a right-of-use asset and a lease liability are recognized. The right-of-use asset represents the right to use the leased asset for the lease term. The lease liability represents the present value of the lease payments under the lease.
The right-of-use asset is initially measured at cost, which primarily comprises the initial amount of the lease liability, plus any initial direct costs incurred, consisting mainly of brokerage commissions, less any lease incentives received. All right-of-use assets are reviewed for impairment. The lease liability is initially measured at the present value of the lease payments, discounted using the interest rate implicit in the lease or, if that rate cannot be readily determined, our secured incremental borrowing rate for the same term as the underlying lease.
Lease payments included in the measurement of the lease liability comprise the following: the fixed noncancelable lease payments, payments for optional renewal periods where it is reasonably certain the renewal period will be exercised, and payments for early termination options unless it is reasonably certain the lease will not be terminated early.
Lease expense for operating leases consists of the lease payments plus any initial direct costs, primarily brokerage commissions, and is recognized on a straight-line basis over the lease term.
We have elected not to recognize right-of-use assets and lease liabilities for short-term leases that have a term of 12 months or less. The effect of short-term leases on our right-of-use asset and lease liability was not material.
As of March 31, 2024, the maturities of our operating lease liabilities (excluding short-term leases) are as follows (in thousands):
| | |
Maturity of Lease Liabilities |
| |
2024 | $ | 440 |
2025 | | 599 |
2026 | | 613 |
2027 | | 627 |
2028 | | 610 |
Thereafter | | 150 |
Total minimum lease payments | | 3,039 |
Less: Interest | | (365) |
Present value of lease obligations | | 2,674 |
Less: Current portion, included in accrued liabilities | | (463) |
Long-term portion of lease obligations | $ | 2,211 |
The weighted-average remaining lease term and the weighted-average discount rate for our operating leases as of each date is as follows:
| | | | | |
| | March 31, | | December 31, | |
| | 2024 | | 2023 | |
Weighted-average remaining lease term (years) | | 4.97 | | 5.22 | |
Weighted-average discount rate | | 5.14 | % | 5.14 | % |
28
Supplemental cash flow information related to leases where we are the lessee is as follows (in thousands):
| | | | | | | |
| | Three Months Ended | | ||||
| | March 31, | | ||||
| | 2024 | | 2023 | | ||
Cash paid for amounts included in the measurement of lease liabilities: | | | | | | | |
Operating cash flows from operating leases | | $ | 146 | | $ | 147 | |
The components of lease expense are as follows (in thousands) within our condensed consolidated statements of operations:
| | | | | | |
| | Three Months Ended | ||||
| | March 31, | ||||
| | 2024 | | 2023 | ||
Operating lease | | $ | 153 | | $ | 129 |
Short-term lease expense | | | 41 | | | 34 |
Total | | $ | 194 | | $ | 163 |
Note 18. Redeemable Noncontrolling Interests
As discussed in Note 1, during the quarter ended December 31, 2020, Tongmei entered into the Capital Investment Agreements with Investors that invested approximately $48.1 million in the form of redeemable noncontrolling interests representing 7.06% of the outstanding shares of Tongmei. An additional investment of approximately $1.5 million of new capital was funded in early January 2021. Under China regulations these investments must be formally approved by the appropriate government agency and are not deemed to be dilutive until such approval is granted. The government approved the entire approximately $49 million investment on January 25, 2021, at which time the Investors owned a redeemable noncontrolling interest in Tongmei of 7.28%. The initial carrying amount of the redeemable noncontrolling interest was recorded at fair value on the date of issuance of Tongmei’s common stock, net of issuance costs and presented in temporary equity on the condensed consolidated balance sheets. This classification is due to the existence of certain contingencies that could result in potential redemption at the fixed purchase price as described below. We currently do not believe that this is probable thus no amortization of the issuance costs has been recorded.
Pursuant to the Capital Investment Agreements with the Investors, each Investor has the right to require AXT to redeem any or all Tongmei shares held by such Investor at the original purchase price paid by such Investor, without interest, in the event the IPO fails to pass the audit of the Shanghai Stock Exchange, is not approved by the Chinese Securities Regulatory Commission (“CSRC”) or Tongmei cancels the IPO application. The aggregate redemption amount is approximately $49 million, subject to the foreign exchange rate variable at time of redemption.
Tongmei submitted its IPO application to the Shanghai Stock Exchange in December 2021 and it was formally accepted for review on January 10, 2022. The Shanghai Stock Exchange approved the IPO application on July 12, 2022. On August 1, 2022, the CSRC accepted for review Tongmei’s IPO application. The STAR Market IPO remains subject to review and approval by the CSRC and other authorities. The process of going public on the STAR Market includes several periods of review and, therefore, is a lengthy process. Subject to review and approval by the CSRC and other authorities, Tongmei hopes to accomplish this goal in the coming months. The listing of Tongmei on the STAR Market will not change the status of AXT as a U.S. public company.
29
The components of the change in redeemable noncontrolling interests for the three and nine months ended September 30, 2017 due to the lossMarch 31, 2024 are presented in the U.S. and the uncertainty of generating future profit in the U.S., which has resulted in our deferred tax asset being fully reserved.following table (in thousands):
| | |
Balance as of January 1, 2024 | $ | 41,663 |
Equity issuance costs incurred | | 18 |
Stock-based compensation attributable to redeemable noncontrolling interests | | 15 |
Net loss attributable to redeemable noncontrolling interests | | (71) |
Effect of foreign currency translation on redeemable noncontrolling interests | | (855) |
Effect of foreign currency translation attributable to redeemable noncontrolling interests | | (189) |
Balance as of March 31, 2024 | $ | 40,581 |
Note 15. Whistleblower Complaint and Investigation
On February 23, 2015, the Board of Directors announced that, pursuant to an anonymous whistleblower complaint, our Audit Committee had conducted an investigation of certain potential related-party transactions involving Davis Zhang, our former President, China Operations. The investigation did not conclude that there was any intentional misconduct by Mr. Zhang, or that he received any improper benefit from these transactions. Further, the investigation did not reveal any inaccuracies in our financial statements resulting from these transactions. However, the investigation identified certain historical related-party transactions that were not previously disclosed in our filings with the SEC. We filed a Current Report on Form 8-K with the SEC on February 23, 2015 to disclose such historical related-party transactions.
On February 20, 2015, the Board waived any potential inconsistencies with our Code of Conduct and Ethics arising from the transactions identified in the investigation. Also, the Audit Committee approved the related-party nature of such transactions to the extent it had not previously approved such transactions. The Board and Audit Committee specified that such waiver and approval would have retroactive effect to the date of commencement of the transactions covered by such waiver and approval. We incurred approximately $1.8 million of professional service fees during the course of this investigation.
Note 16. Restructuring Charges
In the second quarter of 2016, we restructured the operations of JiYa, which resulted in a reduction in force of 28 positions that were no longer required to support production and operations. Accordingly, we recorded a restructuring charge of approximately $226,000 related to the reduction in force for severance-related expenses. As of June 30, 2016, we had completed this restructuring plan and the reduction in force.
23
During the three and nine months ended September 30, 2017 and 2016, we incurred no restructuring charges, except as mentioned above.
Note 17.19. Recent Accounting Pronouncements
In May 2014,November 2023, the Financial Accounting StandardStandards Board (“FASB”) issued Accounting Standards Update (“ASU”) 2014-09, which appliesreleased ASU 2023-07— Segment Reporting (Topic 280): Improvements to any entity that either enters into contracts with customersReportable Segment Disclosures, aiming to transfer goods or services or enters into contracts forenhance the transfertransparency and relevance of non-financial assets, unless those contracts are within the scope of other standards, superseding the existing revenue recognition requirementssegment information provided in ASC Topic 605 “Revenue Recognition.” Pursuant to ASU 2014-09, an entity should recognize revenue to depict the transfer of promised goods or services to customers in an amount that reflects the consideration to which the entity expects to be entitled in exchange, as applied through a multi-step process to achieve that core principle. Subsequently, the FASB approved a deferral included in ASU 2015-14 that permits public entities to apply the amendments in ASU 2014-09 for annual reporting periods beginning after December 15, 2017, including interim reporting periods therein, and that would also permit public entities to elect to adopt the amendments as of the original effective date as applicable to reporting periods beginning after December 15, 2016.
The FASB has since issued additional updates of its new standard on revenue recognition issued in May 2014. In March 2016, an amendment was issued to clarify the implementation guidance on principal versus agent consideration. The guidance requires entities to determine whether the nature of its promise to provide goods or services to a customer is performed in a principal or agent capacity and to recognize revenue in a gross or net manner based on its principal/agent designation. In April 2016, amendments were issued to clarify the identification of performance obligations and the licensing implementation guidance in the initial standard. Amendments were issued in May 2016 related to its guidance on assessing collectability, presentation of sales tax, noncash consideration, and completed contracts and contract modification at transition, which reduce the potential for diversity in practice, and the cost and complexity of application at transition and on an ongoing basis. The new guidance allows for the amendment to be applied either retrospectively to each prior reporting period presented or retrospectively as a cumulative-effect adjustment as of the date of adoption. We are currently evaluating the impact that the adoption of ASU 2014-09 and ASU 2015-14 may have on our condensed consolidated financial statements and have not elected a transition method as of the period ended September 30, 2017.
In July 2015, the FASB issued ASU 2015-11, Simplifying the Measurement of Inventory, amending ASC 330. Upon adoption, this topic supersedes the existing guidance under ASC 330 and aims to simplify the subsequent measurement of inventory. Currently, inventory can be measured at the lower of cost or market, which could result in several potential outcomes, as market could be replacement cost, net realizable value or net realizable value less an approximately normal profit margin. The major amendments would be as follows: 1. Inventory should be measured at the lower of cost or net realizable value. 2. Net realizable value is the estimated selling price in the ordinary course of business less reasonably predictable costs of completion, disposal and transportation. 3. The amendment does not apply to inventory measured under LIFO or the retail inventory method. 4. The amendment does apply to all other inventory, which includes inventory measured via FIFO or average cost. We adopted this guidance effective January 1, 2017 and it did not have a significant impact on our condensed consolidated financial statements.
In January 2016, the FASB issued ASU 2016-01, which made changes to the accounting for financial instruments that primarily affect equity investments, financial liabilities under the fair value option, and the presentation and disclosure requirements for financial instruments. The amendments in this update supersede the guidance to classify equity securities with readily determinable fair values into different categories (that is, tradingrequire that a public entity disclose significant segment expenses, and profit or available-for-sale)loss and require equity securities to be measured at fair value with changes in the fair value recognized through net income. The standard amends financial reporting by providing relevant information aboutassets, among other disclosures, for each reportable segment, on an entity’s equity investments and reducing the number of items that are recognized in other comprehensive income. This update will be effective for annual periods beginning after December 15, 2017, and interim periods within those annual periods. We are currently assessing the impact of the future adoption of this standard on our condensed consolidated financial statements.
In February 2016, the FASB issued ASU 2016-02, which replaces the existing guidance for leases.basis. The new standard establishes a right-of-use (ROU) model that requires a lessee to record a ROU asset and a lease liability on the
24
balance sheet for all leases with terms longer than twelve months. Leases will be classified as either finance or operating, with classification affecting the pattern of expense recognition in the income statement. The guidanceupdate is effective for fiscal years beginning after December 15, 2018, including2023, and interim periods within those fiscal years and requires retrospective application. We will adopt in fiscal 2019 and are currently evaluating the impactbeginning after December 15, 2024. Adoption of the guidancenew standard will have an immaterial effect on our condensed consolidated financial statements.
In March 2016, theDecember 2023, FASB issued ASU No. 2016-07, which eliminates2023-09— Income Taxes (Topic 740): Improvements to Income Tax Disclosures, to help investors better understand an entity’s exposure to potential changes in jurisdictional tax legislation and the requirementensuing risks and opportunities. Furthermore, the update improves to retrospectively apply the equity method in previous periods when an investor initially obtains significant influence over an investee. Under the amended guidance, the investor should apply the equity method prospectively from the date the investment qualifies for the equity method.assess income tax information that affects cash flow forecasts and capital allocation decisions. The guidanceupdate is effective for fiscal yearspublic business entities for annual periods beginning after December 15, 2016, including interim periods within those fiscal years with early application permitted. We adopted this guidance effective January 1, 2017. The adoption2024, on a prospective basis. Adoption of thisthe new standard did notwill have a significant impactan immaterial effect on our condensed consolidated financial statements.
In March 2016,2024, FASB released ASU 2024-01— Compensation—Stock Compensation (Topic 718). The update adds an illustrative example aimed at clarifying the FASB issued ASU No. 2016-09, which simplifies several aspectsscope application of the accounting for share-based paymenta profit interest award transactions, including the accounting for income taxes, forfeitures and statutory tax withholding requirements, as well as classification in the statement of cash flows. ASU 2016-09accordance with Topic 718. The update is effective for fiscal yearsannual periods beginning after December 15, 2016, including interim periods. We adopted this guidance effective January 1, 2017. The Company's adoption of this standard did not have a significant impact on its condensed consolidated financial statements. No excess income tax benefit or tax deficiencies have been recorded as a result of the adoption2024, and there will be no change to accumulated deficit with respect to previously unrecognized excess tax benefits. The Company is electing to continue to account for forfeitures on an estimated basis. We have elected to present the condensed consolidated statements of cash flows on a prospective transition method and no prior periods have been adjusted.
In August 2016, the FASB issued ASU No. 2016-15, which reduces diversity in practice where the FASB was either unclear or did not provide specific guidance for classifying cash payments and receipts in the statement of cash flows for eight specific transactions. The guidance is effective for fiscal years beginning after December 15, 2017, including interim periods within those fiscal years and requires retrospective application with early application permitted. We are currently evaluating the impactannual periods. Adoption of the future adoption of thisnew standard will have an immaterial effect on our condensed consolidated financial statements.
Note 20. Subsequent Event
In October 2016, the FASB issued ASU No. 2016-16, which clarifies the accountingApril 2024, Tongmei obtained $691,000 in a new one-year bank loan with an annual interest rate of 3.5%. The bank loan is unsecured.
On May 6, 2024, a putative shareholder class action was filed in U.S. District Court for the currentEastern District of New York. Nowakowsky vs. AXT, Inc., 1:24-cv-03341-DLI-JRC. Named as defendants are the Company, Morris Young, and deferred income taxes for an intra-entity transferGary Fischer. The case alleges claims under the Securities Exchange Act of an asset other than inventory. The guidance is effective for fiscal years beginning after December 15, 2017, including periods within those fiscal years and requires retrospective application with early application permitted. We are currently evaluating1934. That Court has ordered the impact of the future adoption of this standard on our condensed consolidated financial statements.
In January 2017, the FASB issued ASU No. 2017-01, which clarifies the definition of a business with the objective of adding guidancecase to assist entities with evaluating whether transactions should be accounted for as acquisitions (or disposals) of assets or businesses. The definition of a business affects many areas of accounting including acquisitions, disposals, goodwill, and consolidation. The guidance is effective for fiscal years beginning after December 15, 2017, including periods within those fiscal years and requires retrospective application with early application permitted. We are currently evaluating the impact of the future adoption of this standard on our condensed consolidated financial statements.
In May 2017, the FASB issued ASU No. 2017-09, Compensation - Stock Compensation (Topic 718): Scope of Modification Accounting. The guidance provides clarity and reduces diversity in practice and cost and complexity when accounting for a changetransferred to the terms or conditionsNorthern District of a share-based payment award. The guidanceCalifornia, where the Company’s headquarters is effective for fiscal years beginning after December 15, 2017. We are currently evaluating the impact the adoption of this ASU will have on our condensed consolidated financial statements.located.
2530
Note 18. Subsequent Events
On October 7, 2017, Wilson Lin, Ph.D. notified us of his decision to resign as our Chief Operating Officer, effective October 5, 2017. In connection with his resignation, Dr. Lin and the Company entered into a Separation Agreement and Release, dated as of October 19, 2017 (the “Separation Agreement”). The Separation Agreement provides for (i) the release of all claims by Dr. Lin in favor of the Company and other releasees; (ii) cash severance equal to 12 months of Dr. Lin’s base salary, for a total of $300,000, less applicable withholdings; and (iii) up to 12 months of Company-paid insurance premiums (COBRA) to continue Dr. Lin’s group health insurance coverage for himself and his eligible dependents.
On November 2, 2017, our consolidated joint venture, Boyu, raised additional capital in the amount of $2 million in cash from a third-party investor through the issuance of shares equivalent to 10% ownership of Boyu. Our ownership of Boyu was diluted from 70% to 63%. We continued to exercise control over Boyu and accordingly no gain was recognized as a result of this equity transaction.
26
ITEM 2. MANAGEMENT’S DISCUSSIONDISCUSSION AND ANALYSIS OF FINANCIAL CONDITION AND RESULTS OF OPERATIONS
This quarterly reportQuarterly Report on Form 10-Q of AXT, Inc. (“AXT”, “the Company”, “we,” “us,” and “our” refer to AXT, Inc. and its consolidated subsidiaries) contains forward-looking statements within the meaning of Section 27A of the Securities Act of 1933, as amended, and Section 21E of the Securities Exchange Act of 1934, as amended.amended (the “Exchange Act”). Statements relating to our expectations regarding results of operations, market and customer demand andfor our products, customer qualifications of our products, our ability to expand our markets or increase sales, emerging applications using chips or devices fabricated on our substrates, including the use of InP wafer substrates in artificial intelligence (“AI”) applications, the development and adoption of new products, applications, enhancements or technologies, the life cycles of our products and applications, product yields and gross margins, expense levels, the impact of the adoption of certain accounting pronouncements, our investments in capital projects, ramping production at our abilitynew sites, potential severance costs with respect to relocateany reduction in our gallium arsenide production line in a timely and orderly manner,work force, our ability to have new customers re-qualifyqualify substrates from theour new manufacturing locationlocations in Dingxing, China, our ability to utilize or increase our manufacturing capacity, and our belief that we have adequate cash and investments to meet our needs over the next 12 months are forward-looking statements. Additionally, statements regarding completing steps in connection with the proposed listing of shares of our wafer manufacturing company, Beijing Tongmei Xtal Technology Co., Ltd. (“Tongmei”), on the Shanghai Stock Exchange’s Sci-Tech innovAtion boaRd (the “STAR Market”), being accepted to list shares of Tongmei on the STAR Market, the timing and completion of such listing of shares of Tongmei on the STAR Market are forward-looking statements. Words such as “expects,” “anticipates,” “intends,” “plans,” “believes,” “seeks,” “estimates,” “goals,” “should,” “continues,” “would,” “could” and similar expressions or variations of such words are intended to identify forward‑lookingforward-looking statements, but are not the exclusive means of identifying forward‑lookingforward-looking statements in this quarterly report.Quarterly Report on Form 10-Q. Additionally, statements concerning future matters such as our strategy and plans, industry trends and the impact of trends, tariffs and trade wars, geopolitical tensions, export restrictions in China, the potential or expected impact of the COVID-19 pandemic on our business, results of operations and financial condition, mandatory factory shutdowns in China, changes in policies and regulations in China and economic cycles on our business are forward-looking statements.
Our forward-looking statements are based upon assumptions that are subject to uncertainties and factors relating to the Company’s operations and business environment, which could cause actual results to differ materially from those expressed or implied in the forward-looking statements contained in this Quarterly Report on Form 10-Q. These uncertainties and factors include, but are not limited to: the withdrawal, cancellations or requests for redemptions by private equity funds in China of their investments in Tongmei, the administrative challenges in satisfying the requirements of various government agencies in China in connection with the investments in Tongmei and the listing of shares of Tongmei on the STAR Market, continued open access to companies to list shares on the STAR Market, investor enthusiasm for new listings of shares on the STAR Market and geopolitical tensions between China and the United States. Additional uncertainties and factors include, but are not limited to: the timing and receipt of significant orders; the cancellation of orders and return of product; emerging applications using chips or devices fabricated on our substrates; end-user acceptance of products containing chips or devices fabricated on our substrates; our ability to bring new products to market; product announcements by our competitors; the ability to control costs and improve efficiency; the ability to utilize our manufacturing capacity; product yields and their impact on gross margins; the relocation of manufacturing lines and ramping of production; possible factory shutdowns as a result of air pollution in China; COVID-19 or other outbreaks of a contagious disease; the availability of current COVID-19 vaccines; tariffs and other trade war issues; export restrictions in China; the financial performance of our partially owned supply chain companies; policies and regulations in China; and other factors as set forth in this Quarterly Report on Form 10-Q, including those set forth under the section entitled “Risk Factors” in Item 1A below. All forward-looking statements are based upon management’s views as of the date of this quarterly reportQuarterly Report on Form 10-Q and are subject to risks and uncertainties that could cause actual results to differ materially from historical results or those anticipated in such forward-looking statements. Such risks and uncertainties include those set forth under the section entitled “Risk Factors” in Item 1A below, as well as those discussed elsewhere in this quarterly report,Quarterly Report on Form 10-Q and identify important factors that could disrupt or injure our business or cause actual results to differ materially from those predicted in any such forward-looking statementsstatements.
These forward-looking statements are not guarantees of future performance. Readers are cautioned not to place undue reliance on these forward-looking statements, which speak only as of the date hereof. Readers are urged to carefully review and consider the various disclosures made in this report,Quarterly Report on Form 10-Q, which attempt to advise interested parties of the risks and factors that may affect our business, financial condition, results of operations and prospects. We undertake no obligation to revise or update any forward‑lookingforward-looking statements in order to reflect any development, event or circumstance that may arise after the date of this report. Quarterly Report on Form 10-Q. This discussion should be read in conjunction with Management’s Discussion and Analysis of Financial Condition and Results of Operations included in our
31
Annual Report on Form 10-K for the year ended December 31, 20162023 and the condensed consolidated financial statements included elsewhere in this report.Quarterly Report on Form 10-Q.
Overview
27
Overview
AXT Inc. (“AXT”, “we,” “us,” and “our” refer to AXT, Inc. and its consolidated subsidiaries) is a worldwide materials science company that develops and produces high-performance compound and single element semiconductor substrates, also known as wafers. OurTwo of our consolidated subsidiaries produce and sell certain raw materials some of which are used in our substrate manufacturing process and some of which are sold to other companies.
Our substrate wafers are used when a typical silicon substrate wafer cannot meet the conductiveperformance requirements of a chip.semiconductor or optoelectronic device. The dominant substrates used in producing semiconductor chips and other electronic circuits are made from silicon. However, certain chips may become too hot or perform their function too slowly if silicon is used as the base material. In addition, optoelectronic applications, such as LED lighting and chip-based lasers, do not use silicon substrates because they require a wave form frequency that cannot be achieved using silicon. Alternative or specialty materials are used to replace silicon as the preferred base in these situations. Our wafers provide such alternative or specialty materials. We do not design or manufacture the chips. We add value by researching, developing and producing the specialty material wafers. We have two product lines: specialty material substrates and raw materials integral to these substrates. Our compound substrates combine indium with phosphorous (indium phosphide: InP) or gallium with arsenic (gallium arsenide: GaAs). Our single element substrates are made from germanium (Ge).
Our raw materials include both raw gallium
InP is a high-performance semiconductor wafer substrate used in broadband and purified gallium.fiber optic applications, 5G infrastructure and data center connectivity. Data centers use InP devices for high-speed optical data transmission. We use purified galliumbelieve the growth of AI applications will increase the need for high-speed data transfer, which may lead to an increase in producing ourInP substrate demand from such data centers. Currently, InP substrates are being used in certain consumer products, including proximity sensors in mobile devices, biometric wearables and other health monitoring applications. In recent years, InP demand has increased. Semi-insulating GaAs substrates are used to create various high-speed microwave components, including power amplifier chips used in cell phones, satellite communications and sell bothbroadcast television applications. Semi-conducting GaAs substrates are used to create opto-electronic products, such as light emitting diodes (LEDs) that are used in a wide range of applications, including automotive lighting, horticulture, signage, display, sensors and machine vision. Semi-conducting GaAs substrates are also used in making industrial lasers. GaAs wafers could also be used for making vertical cavity surface emitting lasers (VCSELs) for facial recognition and micro-LEDs targeting improved screen technology. Ge substrates are used in applications such as solar cells for space and terrestrial photovoltaic applications.
Our supply chain strategy includes several consolidated raw gallium and purified gallium in the open market to othermaterial companies. One of these consolidated companies for use in magnetic materials, high temperature thermometers and growing single crystal ingots including gallium arsenide, gallium nitride, gallium antimonide, gallium phosphide and other materials and alloys. We also produceproduces pyrolytic boron nitride (pBN) crucibles used in the high temperature (typically in the range 500 C to 1,500 C) growth process of single crystal ingots, andeffusion rings when growing OLED (Organic Light Emitting Diode) tools, epitaxial layer growth in MOCVD (Metal-Organic Chemical Vapor Deposition) reactors and MBE (Molecular Beam Epitaxy) reactors. We use these pBN crucibles in our own ingot growth processes and they are also sell themsold in the open market to other companies. A second consolidated company converts raw gallium to purified gallium. We use purified gallium in producing our GaAs substrates and it is also sold in the open market to other companies for use in producing magnetic materials, high temperature thermometers, single crystal ingots, including gallium arsenide, gallium nitride, gallium antimonite and gallium phosphide ingots, and other materials and alloys. In addition to purified gallium, the second consolidated company also produces InP base material which we then use to grow single crystal ingots. Our substrate product group generated 81%63%, 75%79%, and 72%75% of our consolidated revenue and our raw materials product group generated 19%37%, 21%, and 25% for 2023, 2022, and 28% for 2016, 2015 and 2014,2021, respectively.
2832
The following chart shows our substrate groupproducts and their materials, diameters and illustrative applications and shows our raw materials group primary products and their illustrative uses and applications.
| ||||||
Products | | |||||
Substrate Group and Wafer Diameter |
| Sample of Applications | ||||
Indium Phosphide |
|
|
| |||
|
|
| ||||
|
| |||||
| • Data center connectivity using light/lasers | |||||
(InP) | | • High-speed data transfer in data centers to support AI applications | ||||
2”, 3”, 4” | | • 5G communications | ||||
| | • Fiber optic lasers and detectors | ||||
| | • Consumer devices | ||||
| | • Passive Optical Networks (PONs) | ||||
| | • Silicon photonics | ||||
| | • Photonic | ||||
| | • | Thermo-Photovoltaics (TPVs) | |||
| | • RF amplifier and switching (military wireless | ||||
|
| |||||
| • Infrared | |||||
| | • Lidar for robotics and autonomous vehicles | ||||
| | • Infrared thermal imaging | ||||
Gallium Arsenide | | • Wi-Fi devices | ||||
(GaAs - semi-insulating) |
| • IoT devices | ||||
1”, 2”, 3”, 4”, 5”, 6” | | • High-performance transistors | ||||
| | • Direct broadcast television | ||||
| | • Power amplifiers for wireless devices | ||||
|
|
| ||||
| ||||||
| • Satellite communications | |||||
| | • High efficiency solar cells for drones | and automobiles | |||
|
| • Solar cells | ||||
Gallium Arsenide | | • High brightness LEDs | ||||
(GaAs - semi-conducting) | | • Screen displays using micro-LEDs | ||||
1”, 2”, 3”, 4”, 5”, 6”, 8” | | • Printer head lasers and LEDs | ||||
| | • 3-D sensing using VCSELs | ||||
|
| | • Data center communication using VCSELs | |||
| | • Sensors for industrial robotics/Near-infrared sensors | ||||
|
| |||||
| ||||||
| ||||||
| ||||||
| • Laser machining, cutting and drilling | |||||
| | • Optical couplers | ||||
| | • High efficiency solar cells for drones and automobiles | ||||
| | • Other lasers | ||||
| | • Night vision goggles | ||||
| | • Lidar for robotics and autonomous vehicles | ||||
|
|
| | • | ||
Germanium |
|
| ||||
| ||||||
| • Multi-junction solar cells for satellites | |||||
(Ge) | | • Optical sensors and detectors | ||||
2”, 4”, 6” | | • Terrestrial concentrated photo voltaic (CPV) cells | ||||
| | • Infrared detectors | ||||
| | • Carrier wafer for LED | ||||
Raw Materials Group | | | ||||
6N+ and 7N+ purified gallium |
|
| ||||
| ||||||
| ||||||
| ||||||
| ||||||
| | • Key material in single crystal ingots such as: | ||||
| | - Gallium Arsenide (GaAs) | ||||
| | - Gallium Nitride (GaN) | ||||
| | - Gallium | ||||
| | - Gallium Phosphide (GaP) | ||||
Boron trioxide (B2O3) | | • Encapsulant in the ingot growth of III-V compound semiconductors | ||||
Gallium-Magnesium alloy |
| | • Used for the synthesis of organo-gallium compounds in epitaxial growth on semiconductor wafers | |||
pyrolytic boron nitride (pBN) crucibles | | • Used when growing single-crystal compound semiconductor ingots | ||||
| | • Used as effusion rings when growing OLED tools | ||||
pBN insulating parts | | • Used in MOCVD reactors | ||||
| | • Used when growing epitaxial layers in |
33
We manufacture allTable of Contents
All of our substrate products and raw material products are manufactured in the People’s Republic of China (PRC or China), which by our PRC subsidiaries and PRC joint ventures. The PRC generally has favorable costs for facilities and labor compared with comparable facilities in the United States, Europe or Japan. Our
29
supply chain includes partial ownership of 10raw material companies in China (subsidiaries/joint ventures). We believe this supply chain arrangement provides us with pricing advantages, reliable supply, market trend visibility and better sourcing lead-times for key raw materials central to manufacturing our substrates. In the event of industry-wide supply shortages we believe our vertically integrated supply chain strategy will be even more advantageous. Our subsidiaries and joint ventureraw material companies produce materials, including pure raw gallium (4N Ga), high purity gallium (6N and 7N Ga), starting material for InP, arsenic, germanium, germanium dioxide, pyrolytic boron nitride (pBN) crucibles and boron oxide (B2O3). Our ownership and the ownership held by our consolidated subsidiaries in these entities range from 83% to 20%. We have board representation in all 10 of these raw material companies. We consolidate the companies in which we have either a controlling financial interest, or majority financial interest combined with the ability to exercise substantive control over the operationoperations, or financial decisions, made by the subsidiary.of such companies. We use the equity method to account for companies in which we have smallernoncontrolling financial interest and have the ability to exercise significant influence, but not control, over the subsidiary.such companies. We purchase portions of the materials produced by these joint venture companies for our own use and they sell the remainder of their production to third parties.
In 2015, the Beijing city government announced its decision to move most of its offices to the Tongzhou district where our original manufacturing facility is currently located. The Beijing city government is expanding its offices into the area where our manufacturing facility is located and is in the process of movinghas moved thousands of government employees into this area.district. The Beijinggovernment has constructed showcase tower buildings and overseen the establishment of new apartment complexes, retail stores and restaurants. A large park, named Green Heart City Park, was built across the street from our facility and Universal Studios has developed an amusement park within a few miles of our facility. To create room and upgrade the district, the city government desires to upgrade this area and has applied pressure oninstructed virtually all existing manufacturing companies, including Tongmei, to relocate including us.all or some of their manufacturing lines. We are cooperating withwere instructed to relocate our gallium arsenide manufacturing lines. For reasons of manufacturing efficiency, we elected to also move part of our germanium manufacturing line. Our indium phosphide manufacturing line, as well as various administrative and sales functions, remain primarily at our original site.
Begun in 2017, the government and, in accordance with our relocation plan, are relocatingof our gallium arsenide production line. On September 12, 2017, we announced that we completed the purchase of a new manufacturing facilitylines is now completed. Our PRC subsidiary, Baoding Tongmei Xtal Technology Co., Ltd. (“Baoding Tongmei”), entered into volume production in city of Dingxing in the People’s Republic of China. Dingxing, located in the province of Hebei and under the jurisdiction of the prefecture-level city of Baoding, is approximately a 90-minute drive south of our current Beijing location. The Dingxing site is approximately 18.75 acres and currently has three existing buildings, which comprise approximately 140,000 sq. feet of production space and 50,000 sq. feet designated for offices and dormitories. We have already transferred single crystal growth furnaces to this site and, in October 2017, we produced our first single crystal growth ingot at this site. To enable rapid capacity expansion, we are developing plans to construct a fourth building at this site. Additional environmental permits, regulatory approvals and zoning conformance applications for the site are in process.
2020. To mitigate our risks and maintain our production schedule, we plan to movemoved our gallium arsenide equipment in stages so thatstages. By December 31, 2019, we will produce ourhad ceased all crystal growth for gallium arsenide products at both sitesin our original manufacturing facility in Beijing and then subsequently transfer increasing volumetransferred 100% of our ingot production to the new site. This approach will also minimize any disruption to our customers. We intend to complete this relocation by the end of 2018 or the first half of 2019. The relocationmanufacturing facility of our PRC subsidiary, ChaoYang Tongmei Xtal Technology Co., Ltd., (“ChaoYang Tongmei”), in Kazuo, a city approximately 250 miles from Beijing. We transferred our wafer processing equipment for gallium arsenide production line requiresto Baoding Tongmei’s new manufacturing facility in Dingxing, a city approximately 75 miles from Beijing. These new facilities enabled us to accurately executeexpand capacity and upgrade some of the equipment. In 2021 and 2022, we added additional equipment, including certain more advanced equipment. We have also invested in additional buildings to complement the initial construction and add capacity as needed. Our PRC subsidiaries also acquired sufficient land to enable them to add facilities, if needed in the future. We believe our success in the relocation plan. We expectand our ability to add capacity in the future gives us competitive advantages. In addition, a new level of technological sophistication in our manufacturing capabilities is enabling us to support the major trends that we believe are likely to drive demand for our major customers will wantproducts in the years ahead.
New customer qualifications and expanding capacity as needed require us to examine and qualifycontinue to diligently address the wafer substrates producedmany details that arise at the new site before placing volume purchase orders for products produced at the new site.each of our sites. A failure to properly execute our relocation planaccomplish this could result in disruption to our production and have a material adverse impact on our revenue, and our results of operations and our financial condition. If we fail to meet the product qualification and volume requirements of a customer, we may lose sales to that customer. Our reputation may also be damaged. Any loss of sales could have a material adverse effect on our revenue, and our results of operations and our financial condition.
On November 16, 2020, we announced a strategic initiative to access China’s capital markets by beginning a process to list shares of Tongmei in an initial public offering (the “IPO”) on the STAR Market, an exchange intended to support innovative companies in China. We formed and founded Tongmei in 1998 and believe Tongmei has grown into a company that will be an attractive offering on the STAR Market. To qualify for a STAR Market listing, the first major step in the process was to engage private equity firms in China (“Investors”) to invest funds in Tongmei. By December 31,
34
2020, Investors, which consist of 10 private equity funds, had entered into two sets of definitive transaction documents, each consisting of a capital increase agreement along with certain supplemental agreements in substantially the same form (collectively, the “Capital Investment Agreements”), with Tongmei for a total investment of approximately $48.1 million. The currency used in the investment transactions was the Chinese renminbi, which has been converted to approximate U.S. dollars for this Quarterly Report on Form 10-Q. The remaining investment of approximately $1.5 million of new capital was funded in January 2021. The government approved the approximately $49 million investment in its entirety on January 25, 2021. In lightexchange for an investment of approximately $49 million, the Investors received a 7.28% redeemable noncontrolling interest in Tongmei.
Pursuant to the Capital Investment Agreements with the Investors, each Investor has the right to require AXT to redeem any or all Tongmei shares held by such Investor at the original purchase price paid by such Investor, without interest, in the event the IPO fails to pass the audit of the increasing environmentalShanghai Stock Exchange, is not approved by the Chinese Securities Regulatory Commission (“CSRC”) or Tongmei cancels the IPO application. The aggregate redemption amount is approximately $49 million, subject to the foreign exchange rate variable at time of redemption.
Tongmei submitted its IPO application to the Shanghai Stock Exchange in December 2021 and it was formally accepted for review on January 10, 2022. The Shanghai Stock Exchange approved the IPO application on July 12, 2022. On August 1, 2022, the CSRC accepted for review Tongmei’s IPO application. The STAR Market IPO remains subject to review and approval by the CSRC and other authorities. The process of going public on the STAR Market includes several periods of review and, therefore, is a lengthy process. Subject to review and approval by the CSRC and other authorities, Tongmei hopes to accomplish this goal in the coming months. The listing of Tongmei on the STAR Market will not change the status of AXT as a U.S. public company.
An early step in the STAR Market IPO process involved certain entity reorganizations and alignment of assets under Tongmei. In this regard our two consolidated raw material companies, Nanjing JinMei Gallium Co., Ltd. (“JinMei”) and Beijing BoYu Semiconductor Vessel Craftwork Technology Co., Ltd. (“BoYu”) and their subsidiaries were assigned to Tongmei in December 2020. As of June 30, 2021, AXT-Tongmei, Inc., a wholly owned subsidiary of AXT, was assigned to Tongmei. The assignment to Tongmei of JinMei, BoYu and their subsidiaries, and AXT-Tongmei, Inc. increased the number of customers and employees attributable to Tongmei as well as increased Tongmei’s consolidated revenue.
We are neither a PRC operating company nor do we conduct our operations in China through the use of variable interest entities (“VIEs”). Recent statements and regulatory actions by China’s government on the use of VIEs and data security or anti-monopoly concerns have not impacted our ability to conduct our business or continue to list our common stock on the Nasdaq Global Select Market.
The following organization chart depicts the consolidated structure as of China’s centralMarch 31, 2024;
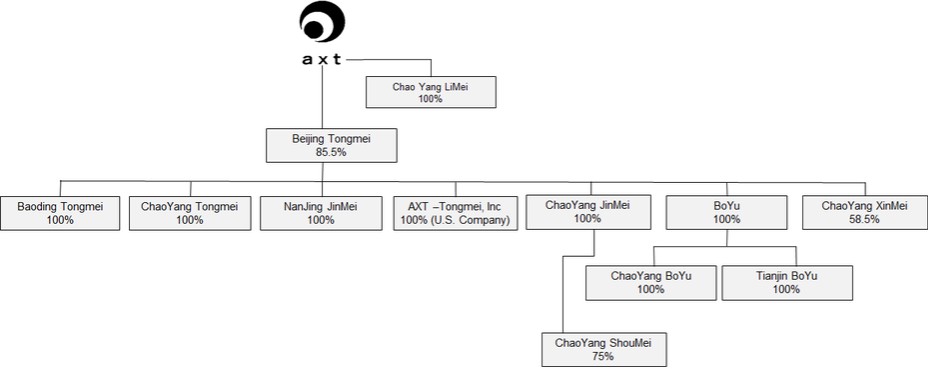
35
The businesses of our PRC subsidiaries and PRC joint ventures are subject to complex and rapidly evolving laws and regulations in the PRC, which can change quickly with little advance notice. The PRC government is a single party form of government with virtually unlimited authority and power to intervene in or influence commercial operations in China. In the past, we have experienced such intervention or influence by the PRC government and various regional agencies,a change in the rules and regulations in China when we formedwere instructed by the Beijing municipal government to relocate part of our manufacturing facility in Beijing and expect that such intervention or influence or change in the rules and regulations in China could occur in the future.
In the ordinary course of business, our PRC subsidiaries and PRC joint ventures require permits and licenses to operate in the PRC. Such permits and licenses include permits to use hazardous materials in manufacturing operations. From time to time, the PRC government issues new regulations, which may require additional actions on the part of our PRC subsidiaries and PRC joint ventures to comply. For example, on February 27, 2015, the China State Administration of Work Safety updated its list of hazardous substances. The previous list, which was published in 2002, did not restrict the materials that we use in our wafers. The new list added gallium arsenide. As a planresult of the newly published list, we were required to isolateseek additional permits. In the ordinary course of business, our first stepPRC subsidiaries and PRC joint ventures apply for permits as required. Any such intervention or influence or change in producing gallium arsenide, whichthe rules and regulations in China could result in a material change in our PRC operations and/or the value of our common stock or cause the value of such securities to significantly decline or be worthless.
In September 2018, the Trump Administration announced a list of thousands of categories of goods that became subject to tariffs when imported into the United States. This pronouncement imposed tariffs on the wafer substrates we imported into the United States. The initial tariff rate was 10% and subsequently was increased to 25%. Approximately 5% of our revenue derives from importing our wafers into the United States and we expect the volume to increase. For the three months ended March 31, 2024 and 2023, we paid approximately $65,000 and $447,000, respectively, in tariffs. The future impact of tariffs and trade wars is uncertain.
Effective as of August 1, 2023, the blending or synthesis of rawPRC government instituted a requirement for export licenses for gallium and raw arsenic (“poly synthesis”). The storage, handling,germanium-related materials and use of raw arsenic are environmentally sensitive operations, but once arsenicthe derivative products using these materials. Tongmei is blended with gallium at high temperature (approximately 1,000 degrees C), the arsenic toxicity level drops significantly. As such, we have acquired 8.5 acres in the city of Kazuo, located in the province of Liaoning near the Inner Mongolia Autonomous Region and under the jurisdiction of the prefecture-level city of Chaoyang. The government development agency overseeing this region has grantedrequired to us the required approvals and, as an incentive to us, will construct a building of approximately 69,000 sq. feet at our site. The construction of the building is expected to be completed in late 2017 or early 2018. At this site, we will be able to do both poly synthesis and single crystal growthapply for any of our products. Initially, we plan to begin withexport licenses for gallium arsenide and germanium wafer substrates and each application must state the blendedend use of the product exported. These regulations have required a new level of administration by Tongmei. In some cases, the PRC government has not issued the requisite licenses and our shipments have been delayed.
We have created a vertically integrated supply chain and transfer cash through our corporate structure in three ways. First, we capitalize our investments in our PRC subsidiaries. We licensed to our PRC subsidiaries intellectual property and received from our PRC subsidiaries royalty payments or one-time fees. Second, we use transfer pricing arrangements to buy from our PRC subsidiaries and PRC joint ventures wafers and raw materials. We review the terms of the transfer pricing arrangements annually with our independent registered public accounting firm. In the past, we sold to our PRC subsidiaries capital equipment that we purchased at the request of our PRC subsidiaries and for which we were reimbursed by the applicable PRC subsidiary. In recent years, Tongmei purchases capital equipment from suppliers in Taiwan, Japan, China, Europe or South Korea. Third, our PRC subsidiaries and PRC joint ventures pay dividends to entities within the Company’s corporate structure. For the three months ended March 31, 2024, the aggregate dividends paid to the Company, directly or to an intermediate entity within our corporate structure, by our PRC subsidiaries and PRC raw material joint ventures were $0. For the year ended December 31, 2023, the aggregate dividends paid to the Company, directly or to an intermediate entity within our corporate structure, by our PRC subsidiaries and PRC raw material joint ventures were approximately $4.3 million. For the year ended December 31, 2023, the aggregate dividends paid to minority shareholders by our PRC subsidiaries and PRC raw material joint ventures were approximately $0. All of these distributions were paid to our PRC subsidiaries and the minority shareholders. For the three months ended March 31, 2024 and the year ended December 31, 2023, no transfers, dividends, or distributions were made between the Company and its PRC subsidiaries, or to investors, except for the settlement of amounts owed under our transfer pricing arrangements in the ordinary course of business. We have no current intentions to distribute earnings to our investors under our corporate structure.
36
The cash generated from one PRC subsidiary is not used to fund another PRC subsidiary’s operations. None of our PRC subsidiaries has ever faced difficulties or limitations on its ability to transfer cash between our subsidiaries. We have cash management policies that dictate the amount of such funding.
We are subject to a number of unique legal and operational risks associated with our corporate structure, any of which could result in a material change in our operations and/or the value of our common stock or cause the value of such securities to significantly decline or be worthless. Please carefully read the section entitled “Risk Factors” in Item 1A below. In particular, the following risk factors address issues associated with our corporate structure:
| ● | Although we are a Delaware corporation and are neither a PRC operating company nor do we conduct our operations in China through the use of VIEs, in the event we inadvertently concluded that we do not require any permissions or approvals from the CSRC or other PRC central government authorities to complete a public offering of securities in the U.S. or applicable laws, regulations, or interpretations change, we may be required to obtain such permissions or approvals to complete such a public offering of securities. |
| ● | The PRC central government may intervene in or influence our PRC operations at any time and the rules and regulations in China can change quickly with little advance notice. |
| ● | The PRC central government may also exert more control over offerings conducted overseas and/or foreign investment in China-based issuers, which could result in a material change in our operations and/or the value of our common stock. |
| ● | Changes in China’s political, social, regulatory or economic environments may affect our financial performance. |
| ● | Joint venture raw material companies in China bring certain risks. |
| ● | Risks exist in utilizing our new gallium arsenide manufacturing sites efficiently. |
| ● | The Chinese central government is increasingly aware of air pollution and other forms of environmental pollution and their reform efforts can impact our manufacturing, including intermittent mandatory shutdowns. |
| ● | Shutdowns or underutilizing our manufacturing facilities may result in declines in our gross margins. |
| ● | Enhanced trade tariffs, import restrictions, export restrictions, Chinese regulations or other trade barriers may materially harm our business. |
| ● | If China places restrictions on freight and transportation routes and on ports of entry and departure this could result in shipping delays or increased costs for shipping. |
| ● | Our international operations are exposed to potential adverse tax consequence in China. |
| ● | We derive a significant portion of our revenue from international sales, and our ability to sustain and increase our international sales involves significant risks. |
| ● | The terms of the private equity raised in China as a first step toward an IPO on the STAR Market grant each Investor a right of redemption if Tongmei fails to achieve its IPO. |
| ● | We are subject to foreign exchange gains and losses that may materially impact our statement of operations. |
| ● | Although the audit report is prepared by an independent registered public accounting firm that is currently inspected fully by the Public Company Accounting Oversight Board (the “PCAOB”), there is no guarantee that future audit reports will be prepared by an independent registered public accounting firm that is completely inspected by the PCAOB. |
Our independent registered public accounting firm is BPM LLP (“BPM”), which is registered with the PCAOB. The Holding Foreign Companies Accountable Act (the “HFCA Act”) requires that the PCAOB determine whether it is unable to inspect or investigate completely registered public accounting firms located in a non-U.S. jurisdiction because of a position taken by one or more authorities in that jurisdiction. On December 16, 2021, the PCAOB issued a report on its determinations that the PCAOB is unable to inspect or investigate completely registered public accounting firms headquartered in the PRC and Hong Kong because of positions taken by PRC authorities in those jurisdictions. BPM is headquartered in the United States and not in the PRC or Hong Kong. As such, BPM is subject to the determinations announced by the PCAOB. Accordingly, the Company does not expect the HFCA Act, the Accelerating Holding Foreign Companies Accountable Act and the related regulations to affect the Company and does not expect to be identified by the Securities and Exchange Commission, or SEC, under the HFCA Act. On December 15, 2022, the PCAOB vacated its
37
2021 determinations that the positions taken by authorities in the PRC and Hong Kong prevented it from inspecting and investigating completely registered public accounting firms headquartered in those jurisdictions. See “Although the audit report is prepared by an independent registered public accounting firm that is currently inspected fully by the PCAOB, there is no guarantee that future audit reports will be shippedprepared by an independent registered public accounting firm that is completely inspected by the PCAOB” under the section entitled “Risk Factors” in Item 1A below for further information on risks related to Dingxing for the proprietary processing we use to grow single crystal gallium arsenide ingots. At this time we are not relocating our indium phosphide or germanium production linesforeign operations and are focused on gallium arsenide. In the future, we will evaluate and consider the possible relocation of our other production lines.dependence.
30
Critical Accounting Policies, Estimates and Change in Accounting Estimates
We prepare our condensed consolidated financial statements in accordance with accounting principles generally accepted in the United States of America.America (“U.S. GAAP”). Accordingly, we make estimates, assumptions and judgments that affect the amounts reported on our condensed consolidated financial statements. These estimates, assumptions and judgments about future events and their effects on our results cannot be determined with certainty, and are made based upon our historical experience and on other assumptions that are believed to be reasonable under the circumstances. These estimates may change as new events occur or additional information is obtained, and we may periodically be faced with uncertainties, the outcomes of which are not within our control and may not be known for a prolonged period of time.
We have identified the policies below as critical to our business operations and understanding of our financial condition and results of operations. Critical accounting policies are material to the presentation of our condensed consolidated financial statements and require us to make difficult, subjective or complex judgments that could have a material effect on our financial reports and results of operations. They may require us to make assumptions about matters that are highly uncertain at the time of the estimate. Different estimates that we could have used, or changes in the estimate that are reasonably likely to occur, may have a material impact on our financial condition or results of operations.
Revenue Recognition
We manufacture and sell high-performance compound semiconductor substrates including indium phosphide, semi-conducting and semi-insulating gallium arsenide and germanium wafers, and our three consolidated subsidiaries sell certain raw materials, including 99.99% pure gallium (4N Ga), high purity gallium (7N(6N and 7N Ga), pyrolytic boron nitride (pBN) crucibles and boron oxide (B2O3). After we ship our products, there are no remaining obligations or customer acceptance requirements that would preclude revenue recognition. Our products are typically sold pursuant to a purchase orderorders placed by our customers, and our terms and conditions of sale do not require customer acceptance. We recognizeaccount for a contract with a customer when there is a legally enforceable contract, which could be the customer’s purchase order, the rights of the parties are identified, the contract has commercial terms, and collectibility of the contract consideration is probable. The majority of our contracts have a single performance obligation to transfer products and are short term in nature, usually less than six months. Our revenue is measured based on the consideration specified in the contract with each customer in exchange for transferring products that are generally based upon shipment and transfera negotiated, formula, list or fixed price. Revenue is recognized when control of title of productsthe promised goods is transferred to our customers,customer, which is either upon shipment from our dock, receipt at the customer’s dock, or removal from consignment inventory at the customer’s location, providedin an amount that reflects the consideration we have received a valid purchase order, the price is fixed or determinable, title and risk of ownership have transferred, collection of resulting receivables is probable, and product returns are reasonably estimable. We do not provide training, installation or commissioning services.expect to be entitled to receive in exchange for those goods.
We provide for future returns based on historical experience, current economic trends and changes in customer demand at the time revenue is recognized.
Accounts Receivable and Allowance for Doubtful AccountsCredit Losses
Accounts receivable are recorded at the invoiced amount and are not interest bearing. We periodically review at least quarterly, or when there are changes in credit risks, the likelihood of collection on our accounts receivable balances and provide an allowance for doubtful accounts receivable primarily based uponcredit losses. We measure the age of these accounts.expected credit losses on a collective (pool) basis when similar delinquency status exists. We evaluate receivables from U.S. customers with an emphasis on balances in excess of 90 days and for receivables from customers located outside the U.S. with an emphasis on balances in excess of 120 days and establish a reserve allowance on the receivable balances if needed. The reason for the difference in the evaluation of receivables between foreign and U.S. customers is that U.S. customers have historically made payments in a shorter period of time than most foreign customers. Foreign business practices generally require us to allow customer payment terms that are longer than those accepted in the United States. We assess
38
In accordance with ASC 326-20’s current expected credit loss impairment model, we exercise judgment when determining the probabilityadequacy of collection based onour reserves as we evaluate historical bad debt trends, general economic conditions in the United States and internationally, and reasonable and supportable forecasts of future economic conditions. Uncollectible receivables are recorded as provision for credit losses when a numbercredit loss is expected through the establishment of factors, including the length of time a receivable balance hasan allowance, which would then be written off when all efforts to collect have been outstanding, our past history with the customerexhausted and their creditworthiness.
recoveries are recognized when they are received. As of September 30, 2017March 31, 2024 and December 31, 2016,2023, our accounts receivable, net balance was $20.9$25.1 million and $14.5$19.3 million, respectively, which was net of an allowance for doubtful accounts of $566,000$579,000 and $653,000,$579,000, respectively. If actual uncollectible accounts differ substantially from our estimates, revisions to the estimated allowance for doubtful accountscredit losses would be required, which could have a material impact on our financial results for the future periods.
31
The allowance for sales returns is also deducted from gross accounts receivable. As of September 30, 2017 and December 31, 2016, our allowance for sales returns was $291,000 and $360,000, respectively.
Warranty Reserve
We maintain a product warranty reserve based upon our claims experience during the prior twelve months and any pending claims and returns of which we are aware. Warranty costs are accrued at the time revenue is recognized. As of September 30, 2017March 31, 2024 and December 31, 2016,2023, accrued product warranties totaled $138,000$495,000 and $251,000,$703,000, respectively.
The decrease in accrued product warranties is primarily attributable to decreased claims for quality issues experienced by customers.a customer. If actual warranty costs or pending new claims differ substantially from our estimates, revisions to the estimated warranty liability would be required, which could have a material impact on our financial condition and results of operations for future periods.
Inventory Valuation
Inventories are stated at the lower of cost (approximated by standard cost) or net realizable value. Cost is determined using the weighted averageweighted-average cost method. Our inventory consists of raw materials as well as finished goods and work-in-processwork in process that include material, labor and manufacturing overhead costs. We routinely evaluate the levels of our inventory in light of current market conditions in order to identify excess and obsolete inventory, and we provide a valuation allowance for certain inventories based upon the age and quality of the product and the projections for sale of the completed products. As of September 30, 2017March 31, 2024 and December 31, 2016,2023, we had an inventory reserve of $12.9$22.2 million and $12.0$21.9 million, respectively, for excess and obsolete inventory and $263,000$213,000 and $254,000,$78,000, respectively, for lower of cost or net realizable value reserves. If actual demand for our products were to be substantially lower than estimated, additional inventory adjustments for excess or obsolete inventory might be required, which could have a material impact on our business, financial condition and results of operations.
Impairment of Investments
We classify marketable investments in debt and equity securities as available-for-sale debt securities in accordance with Accounting Standards Codification (“ASC”) topicTopic 320, Investments -Debt and Equity Securities (“ASC 320”). All available-for-sale debt securities with a quoted market value below cost (or adjusted cost) are reviewed in order to determine whether the decline is other-than-temporary. Factors considered in determining whether a loss is temporary include the magnitude of the decline in market value, the length of time the market value has been below cost (or adjusted cost), credit quality, and our ability and intent to hold the securities for a period of time sufficient to allow for any anticipated recovery in market value. We also review our debt investment portfolio at least quarterly, or when there are changes in credit risks or other potential valuation concerns to identify and evaluate whether an allowance for expected credit losses or impairment would be necessary.
We also invest in equity instruments of privately-held companies in China for business and strategic purposes. Investments in our unconsolidated PRC joint venture companies are classified as other assets and accounted for under either the equity or costfair value method, depending on whether we have the ability to exercise significant influence over theirthe joint venture company’s operations or financial decisions. We monitor our investments for impairment and record reductions in carrying value when events or changes in circumstances indicate that the carrying value may not be recoverable. Determination of impairment is highly subjective and is based on a number of factors, including an assessment of the strength of each company’s management, the length of time and extent to which the fair value has been less than our cost basis, the financial condition and near-term prospects of the company, fundamental changes to the
39
business prospects of the company, share prices of subsequent offerings, and our intent and ability to hold the investment for a period of time sufficient to allow for any anticipated recovery in our carrying value.
There were noFor the year ended December 31, 2023, one of our PRC joint venture raw material companies assessed one of its equity investments was fully impaired. We also divested our equity investment in a PRC joint venture. The impairment and divesture resulted in a total of $1.9 million in impairment charges in our financial results for the three monthsyear ended September 30, 2017. The nine months ended September 30, 2017 include an impairment charge of $313,000 for one of the gallium companies. During the first quarter of 2017, management determined it unlikely that this company will recover from the difficult pricing environment and we had written the investment down to zero. We hadDecember 31, 2023. Except as mentioned above, there were no impairment charges for the remainder of these investments during the three and nine months ended September 30, 2016.March 31, 2024 and 2023.
32
Fair Value of Investments
ASC 820, Fair Value Measurements and Disclosures (“ASC 820”) establishes three levels of inputs that may be used to measure fair value.
Level 1 instruments represent quoted prices in active markets. Therefore, determining fair value for Level 1 instruments does not require significant management judgment, and the estimation is not difficult.
Level 2 instruments include observable inputs other than Level 1 prices, such as quoted prices for identical instruments in markets with insufficient volume or infrequent transactions (less active markets), issuer bank statements, credit ratings, non-binding market consensus prices that can be corroborated with observable market data, model-derived valuations in which all significant inputs are observable or can be derived principally from or corroborated with observable market data for substantially the full term of the assets or liabilities, or quoted prices for similar assets or liabilities. These Level 2 instruments require more management judgment and subjectivity compared to Level 1 instruments, including:
| ● |
| Determining which instruments are most |
| ● |
| Determining which model-derived valuations to use in determining fair value requires management judgment. When observable market prices for |
Level 3 instruments include unobservable inputs to the valuation methodology that are significant to the measurement of fair value of assets or liabilities. The determination of fair value for Level 3 instruments requires the most management judgment and subjectivity.
We place short-term foreign currency hedges that are intended to offset the potential cash exposure related to fluctuations in the exchange rate between the United States dollar and Japanese yen. We measure the fair value of these foreign currency hedges at each month end and quarter end using current exchange rates and in accordance with generally accepted accounting principles.U.S. GAAP. At quarter end any foreign currency hedges not settled are netted in “Accrued liabilities” onin the condensed consolidated balance sheetsheets and classified as Level 3 assets and liabilities. As of September 30, 2017March 31, 2024, the net change in fair value from the placement of the hedge to settlement at each month end during the quarter had a de minimis impact to the condensed consolidated results.
There have been no transfers between fair value measurement levels during the three and nine months ended September 30, 2017March 31, 2024 and 2016.2023.
40
Impairment of Long-Lived Assets
We evaluate the recoverability of property, equipment and intangible assets in accordance with ASC topicTopic 360, Property, Plant and Equipment (“ASC 360”).Equipment. When events and circumstances indicate that long-lived assets may be impaired, we compare the carrying value of the long-lived assets to the projection of future undiscounted cash flows attributable to these assets. In the event that the carrying value exceeds the future undiscounted cash flows, we record an impairment charge against income equal to the excess of the carrying value over the assets’ fair value. Fair values are determined based on quoted market values, discounted cash flows or internal and external appraisals, as applicable. Assets held for sale are carried at the lower of carrying value or estimated net realizable value. We had no assets“Assets held for sale onsale” or any impairment of long-lived assets in the condensed consolidated balance sheets as of September 30, 2017March 31, 2024 and December 31, 2016.2023.
33
Stock-based Compensation
We account for stock-based compensation in accordance with ASC topicTopic 718, Stock-based Compensation (“ASC 718”). Share-based awards granted include stock options and restricted stock awards. We utilize the Black‑ScholesBlack-Scholes option pricing model to estimate the grant date fair value of stock options, which requires the input of highly subjective assumptions, including estimating stock price volatility and expected term. Historical volatility of our stock price was used while the expected term for our options was estimated based on historical option exercise behavior and post-vesting forfeitures of options, and the contractual term, the vesting period and the expected term of the outstanding options. Further, we apply an expected forfeiture rate in determining the amount of share-based compensation. We use historical forfeitures to estimate the rate of future forfeitures. Changes in these inputs and assumptions can materially affect the measure of estimated fair value of our stock compensation. The cost of restricted stock awards is determined using the fair value of our common stock on the date of grant.
The award of performance Restricted Stock covering Shares (the “Performance Award”) will be subject to vesting requirements relating to both the recipient of the Performance Award (the “Participant”) continuously remaining a Service Provider through specified dates and achievement of specified performance-based criteria (“Performance Criteria”). Any capitalized term not defined herein will have the meaning ascribed to such term in the 2015 Equity Incentive Plan. The Performance Criteria will be measured over the Company’s fiscal year 2023 or 2024.
The financial Performance Criteria are metrics based upon prior year-end actual results as compared to the Company’s current year-end actual results with respect to the 2023 Performance Awards or based upon the current year-end actual results with respect to the 2024 Performance Awards. All performance shares, if earned, are still subject to annual vesting over a four-year period except that no shares are vested on the first anniversary because the performance measurement is based on year-end results for the entire year.
We recognize the compensation costs net of an estimated forfeiture rate over the requisite service period of the options award, which is generally the vesting term of four years. Compensation expense for restricted stock awards is recognized over the vesting period, which is generally one, three or four years. Stock-based compensation expense is recorded in cost of revenue, research and development, and selling, general and administrative expenses.
In March 2016, the Financial Accounting Standards Board issued Accounting Standards Update (“ASU”) 2016-09, Improvements to Employee Share-Based Payment Accounting. This ASU affects entities that issue share-based payment awards to their employees. The ASU is designed to simplify several aspects of accounting for share-based payment award transactions which include the income tax consequences, classification of awards as either equity or liabilities, classification on the statement of cash flows and forfeiture rate calculations. ASU 2016-09 is effective for public companies for annual periods and interim periods within those annual periods beginning after December 15, 2016. We adopted this ASU as of January 1, 2017. The adoption of ASU 2016-09 did not have a material effect on our condensed consolidated financial statements.
Income Taxes
We account for income taxes in accordance with ASC topicTopic 740, Income Taxes (“ASC 740”), which requires that deferred tax assets and liabilities be recognized using enacted tax rates for the effect of temporary differences between the book and tax bases of recorded assets and liabilities. ASC 740 also requires that deferred tax assets be reduced by a valuation allowance if it is more likely than not that a portion of the deferred tax asset will not be realized. Our deferred tax assets have been reduced to zero by valuation allowance.
We provide for income taxes based upon the geographic composition of worldwide earnings and tax regulations governing each region, particularly China. The calculation of tax liabilities involves significant judgment in estimating the impact of uncertainties in the application of complex tax laws, particularly in foreign countries such as China.
41
See Note 14—“Income Taxes” in the notes to condensed consolidated financial statements for additional information.
Impact of the COVID-19 Pandemic
34
COVID-19 to be a pandemic, which continues to be an ongoing pandemic. In March 2020, the President of the United States declared the COVID-19 outbreak a national emergency. For much of the three months ended March 31, 2020, our manufacturing facilities in China were operating at reduced staffing levels to limit the risk of COVID-19 exposure for our employees. The Chinese government mandates have evolved, allowing us to return to full staffing levels at all three manufacturing locations in China. We are unable to accurately predict the full impact of the COVID-19 pandemic due to numerous uncertainties, including the severity of the disease, the duration of the outbreak, the potential resurgence of the outbreak as a result of variants in countries that had previously contained the outbreak, the availability of COVID-19 vaccines and the number of people who are vaccinated, the effect of the outbreak on transportation, such as reduced availability of air transport, port closures, and increased border controls or closures, the impact of the outbreak on our customers and additional actions that may be taken by government authorities to contain the outbreak, such as lockdowns in China that may require the temporary closure of one or more of our manufacturing facilities in China and travel restrictions between China and the U.S. that have disrupted our normal movement to and from China and impacted our efficiency. As a result of these factors, we believe that the COVID-19 pandemic has had and may continue to have a material adverse impact on our business, condensed consolidated results of operations and financial condition until the COVID-19 pandemic subsides and related public health measures are reduced or eliminated.
Results of Operations
Revenue
|
|
|
|
|
|
|
|
|
|
|
|
|
|
|
|
|
|
|
|
|
|
|
|
|
| |||||||||||||
|
| Three Months Ended |
|
|
|
|
|
|
| Nine Months Ended |
|
|
|
|
|
|
| |||||||||||||||||||||
|
| September 30, |
| Increase |
|
|
|
| September 30, |
| Increase |
|
|
|
| |||||||||||||||||||||||
| | | | | | | | | | | | | | |||||||||||||||||||||||||
| | Three Months Ended | | | | | | | | |||||||||||||||||||||||||||||
| | | | | | | | | | | | | | |||||||||||||||||||||||||
| | March 31, | | Increase | | | | | ||||||||||||||||||||||||||||||
| | 2024 |
| 2023 | | (Decrease) |
| % Change |
| | ||||||||||||||||||||||||||||
|
| 2017 |
| 2016 |
| (Decrease) |
| % Change |
|
| 2017 |
| 2016 |
| (Decrease) |
| % Change |
|
| |||||||||||||||||||
Product Type: |
| ($ in thousands) |
|
|
|
|
|
|
| ($ in thousands) |
|
|
|
|
|
|
| |||||||||||||||||||||
Product Type: | ||||||||||||||||||||||||||||||||||||||
Product Type: | ||||||||||||||||||||||||||||||||||||||
Product Type: | ||||||||||||||||||||||||||||||||||||||
Product Type: | ||||||||||||||||||||||||||||||||||||||
Product Type: | ||||||||||||||||||||||||||||||||||||||
Product Type: | ||||||||||||||||||||||||||||||||||||||
Product Type: | ||||||||||||||||||||||||||||||||||||||
Product Type: | ||||||||||||||||||||||||||||||||||||||
Product Type: | ||||||||||||||||||||||||||||||||||||||
Product Type: | ||||||||||||||||||||||||||||||||||||||
Product Type: | ||||||||||||||||||||||||||||||||||||||
Product Type: | ||||||||||||||||||||||||||||||||||||||
Product Type: | | ($ in thousands) | | | | | | | | |||||||||||||||||||||||||||||
Substrates |
| $ | 22,377 |
| $ | 17,050 |
| $ | 5,327 |
| 31.2 | % |
| $ | 58,095 |
| $ | 49,629 |
| $ | 8,466 |
| 17.1 | % |
| | $ | 16,903 | | $ | 13,489 | | $ | 3,414 |
| 25.3 | % | |
Raw Materials and Others |
|
| 5,791 |
|
| 4,822 |
|
| 969 |
| 20.1 | % |
|
| 14,246 |
|
| 11,451 |
|
| 2,795 |
| 24.4 | % |
| |||||||||||||
Raw materials and other | | | 5,785 | | | 5,916 | | | (131) |
| (2.2) | % | | |||||||||||||||||||||||||
Total revenue |
| $ | 28,168 |
| $ | 21,872 |
| $ | 6,296 |
| 28.8 | % |
| $ | 72,341 |
| $ | 61,080 |
| $ | 11,261 |
| 18.4 | % |
| | $ | 22,688 | | $ | 19,405 | | $ | 3,283 | | 16.9 | % | |
|
|
|
|
|
|
|
|
|
|
|
|
|
|
|
|
|
|
|
|
|
|
|
|
|
| |||||||||||||
Revenue increased $6.3$3.3 million, or 28.8%16.9%, to $28.2$22.7 million for the three months ended September 30, 2017March 31, 2024 from $21.9$19.4 million for the three months ended September 30, 2016.March 31, 2023. The substrate revenue increase for the three months ended September 30, 2017March 31, 2024 as compared to the same period in 20162023 was primarily the result of a higher demand for allGaAs wafer substrates due to increased demand across a number of ourapplications and higher demand for InP wafer substrates wafersreflecting strong growth from our major customers, resultingdata center applications and continued improvement in more than 15% growth in each of our wafer products in 2017 and stronger raw materialpassive optical networks. Raw materials sales performance from our consolidated subsidiaries. In general, the increase in our raw material sales and substrate sales resulted from higher overall units sold while average selling prices remained either flatdecreased $0.1 million, or in some cases, were down slightly. Our InP substrates revenue increased in2.2%, to $5.8 million for the three months ended September 30, 2017March 31, 2024 as compared to the same period in 2016 primarily due to the high demand driven by the growth2023. The decrease in data center connectivity applications while our Ge substrateraw materials revenue increased primarily due to more planned satellite launches in 2017.
Revenue increased $11.3 million, or 18.4%, to $72.3 million for the ninethree months ended September 30, 2017from $61.1 million for the nine months ended September 30, 2016. The revenue increase for the nine months ended September 30, 2017March 31, 2024 as compared to the same period in 20162023 was primarily the result of highera decrease in sales of pBN crucibles resulting from weaker market demand, for allpartially offset by increased sales of our substrates wafersrefined gallium resulting from our major customers, resulting in a ten percent or more growth in eachstronger market demand.
42
Revenue by Geographic Region
| | | | | | | | | | | | | | |||||||||||||
| | | | | | | | | | | ||||||||||||||||
| | Three Months Ended | | 2023 to 2024 | | | ||||||||||||||||||||
| | March 31, | | Increase | | | | | ||||||||||||||||||
|
| 2024 |
| 2023 |
| (Decrease) |
| % Change |
| | ||||||||||||||||
|
|
|
|
|
|
|
|
|
|
|
|
|
| |||||||||||||
|
| Three Months Ended |
|
|
|
|
|
|
| |||||||||||||||||
|
| September 30, |
| Increase |
|
|
|
| ||||||||||||||||||
|
| 2017 |
| 2016 |
| (Decrease) |
| % Change |
|
| ||||||||||||||||
|
| ($ in thousands) |
|
|
|
|
|
|
| |||||||||||||||||
| ||||||||||||||||||||||||||
| ||||||||||||||||||||||||||
| ||||||||||||||||||||||||||
| ||||||||||||||||||||||||||
| ||||||||||||||||||||||||||
| ||||||||||||||||||||||||||
| ||||||||||||||||||||||||||
| ||||||||||||||||||||||||||
| ||||||||||||||||||||||||||
| ||||||||||||||||||||||||||
| ||||||||||||||||||||||||||
| ||||||||||||||||||||||||||
| ||||||||||||||||||||||||||
| | ($ in thousands) | | | | | | | | |||||||||||||||||
China |
| $ | 7,203 |
| $ | 4,766 |
| $ | 2,437 |
| 51.1 | % |
| | $ | 11,517 | | $ | 8,102 | | $ | 3,415 |
| 42.2 | % | |
% of total revenue |
|
| 26 | % |
| 22 | % |
|
|
|
|
|
| |||||||||||||
Europe (primarily Germany) |
|
| 6,192 |
|
| 4,995 |
|
| 1,197 |
| 24.0 | % |
| |||||||||||||
% of total revenue |
|
| 22 | % |
| 23 | % |
|
|
|
|
|
| |
| 51 | % |
| 42 | % | | | | | | |
Taiwan |
|
| 5,986 |
|
| 2,995 |
|
| 2,991 |
| 99.9 | % |
| |
| 4,582 | |
| 2,471 | | | 2,111 | | 85.4 | % | |
% of total revenue |
|
| 21 | % |
| 14 | % |
|
|
|
|
|
| |
| 20 | % |
| 13 | % | | | | | | |
Japan |
|
| 3,694 |
|
| 3,499 |
|
| 195 |
| 5.6 | % |
| | | 990 | | | 1,535 | |
| (545) |
| (35.5) | % | |
% of total revenue |
|
| 13 | % |
| 16 | % |
|
|
|
|
|
| |
| 4 | % |
| 8 | % | | | | | | |
Asia Pacific (excluding China, Taiwan and Japan) |
|
| 2,934 |
|
| 3,239 |
|
| (305) |
| (9.4) | % |
| |
| 798 | |
| 1,091 | |
| (293) |
| (26.9) | % | |
% of total revenue |
|
| 10 | % |
| 15 | % |
|
|
|
|
|
| |
| 4 | % |
| 6 | % | | | | | | |
Europe (primarily Germany) | |
| 3,725 | |
| 3,570 | |
| 155 |
| 4.3 | % | | |||||||||||||
% of total revenue | |
| 16 | % |
| 18 | % | | | | | | | |||||||||||||
North America (primarily the United States) |
|
| 2,159 |
|
| 2,378 |
|
| (219) |
| (9.2) | % |
| | | 1,076 | | | 2,636 | | | (1,560) | | (59.2) | % | |
% of total revenue |
|
| 8 | % |
| 11 | % |
|
|
|
|
|
| | | 5 | % | | 13 | % | | | | | | |
Total revenue |
| $ | 28,168 |
| $ | 21,872 |
| $ | 6,296 |
| 28.8 | % |
| | $ | 22,688 | | $ | 19,405 | | $ | 3,283 |
| 16.9 | % | |
In aggregate, the combined revenue from the entire Asia marketRevenue in China increased $5.3 million to $19.8$3.4 million for the three months ended September 30, 2017, from $14.5March 31, 2024, primarily due to higher demand for our GaAs and InP wafer substrates and refined gallium, partially offset by lower demand for our Ge wafer substrates and pBN crucibles sold by one of our consolidated subsidiaries. Revenue in Taiwan increased $2.1 million, primarily due to higher demand for our GaAs and InP wafer substrates, partially offset by lower demand for our Ge wafer substrates. Revenue in Japan decreased $0.5 million, primarily due to lower demand for our GaAs and Ge wafer substrates and pBN crucibles sold by one of our consolidated subsidiaries, partially offset by higher demand for our InP wafer substrates. Revenue in Asia Pacific decreased $0.3 million, primarily due to decreased demand for our GaAs and InP wafer substrates and pBN crucibles sold by one of our consolidated subsidiaries, partially offset by higher demand for refined gallium sold by one of our consolidated subsidiaries. Revenue in Europe increased $0.2 million, primarily due to increased demand for our GaAs and Ge wafer substrates and pBN crucibles sold by one of our consolidated subsidiaries, partially offset by lower demand for our InP wafer substrates. Revenue in North America decreased $1.6 million, primarily due to lower demand for our InP, GaAs and Ge wafer substrates and pBN crucibles sold by one of our consolidated subsidiaries.
Gross Profit
| | | | | | | | | | | | | |
| Three Months Ended | | | | | | | | | ||||
| March 31, | | Increase | | | | | | |||||
| 2024 |
| 2023 |
| (Decrease) |
| % Change | | | | |||
| ($ in thousands) | | | | | | | | | ||||
Gross profit | $ | 6,094 | | $ | 5,110 | | $ | 984 |
| 19.3 | % | | |
Gross Profit % |
| 26.9 | % |
| 26.3 | % | | | | | | | |
Gross profit increased $1.0 million, or 19.3%, to $6.1 million for the three months ended September 30, 2016. The revenue increase in the Asia market for the three months ended September 30, 2017 as compared to the same period in
35
2016 was a result of higher demand for all of our substrates wafersMarch 31, 2024 from our major customers and stronger raw material sales performance from our consolidated subsidiaries. However, the increase in revenue from the Asia market was partially offset by the decrease of raw materials sales in Korea. Revenue from the Europe market increased $1.2 million in the three months ended September 30, 2017 as compared to the same period in 2016 as a result of a higher demand for all of our substrates wafers. Revenue from North America decreased $219,000 for the three months ended September 30, 2017 to $2.2 million from $2.4$5.1 million for the three months ended September 30, 2016 primarily from a lower demandMarch 31, 2023. The increase in pBN ingross profit is the United States.
|
|
|
|
|
|
|
|
|
|
|
|
|
|
|
| Nine Months Ended |
|
|
|
|
|
|
| ||||
|
| September 30, |
| Increase |
|
|
|
| |||||
|
| 2017 |
| 2016 |
| (Decrease) |
| % Change |
|
| |||
|
| ($ in thousands) |
|
|
|
|
|
|
| ||||
China |
| $ | 17,949 |
| $ | 12,041 |
| $ | 5,908 |
| 49.1 | % |
|
% of total revenue |
|
| 25 | % |
| 20 | % |
|
|
|
|
|
|
Europe (primarily Germany) |
|
| 17,638 |
|
| 13,946 |
|
| 3,692 |
| 26.5 | % |
|
% of total revenue |
|
| 24 | % |
| 23 | % |
|
|
|
|
|
|
Taiwan |
|
| 13,499 |
|
| 11,779 |
|
| 1,720 |
| 14.6 | % |
|
% of total revenue |
|
| 19 | % |
| 19 | % |
|
|
|
|
|
|
Japan |
|
| 9,696 |
|
| 8,096 |
|
| 1,600 |
| 19.8 | % |
|
% of total revenue |
|
| 13 | % |
| 13 | % |
|
|
|
|
|
|
Asia Pacific (excluding China, Taiwan and Japan) |
|
| 7,650 |
|
| 8,391 |
|
| (741) |
| (8.8) | % |
|
% of total revenue |
|
| 11 | % |
| 14 | % |
|
|
|
|
|
|
North America (primarily the United States) |
|
| 5,909 |
|
| 6,827 |
|
| (918) |
| (13.4) | % |
|
% of total revenue |
|
| 8 | % |
| 11 | % |
|
|
|
|
|
|
Total revenue |
| $ | 72,341 |
| $ | 61,080 |
| $ | 11,261 |
| 18.4 | % |
|
The combined revenue from China, Europe, Taiwan and Japan increased $12.9 million to $58.8 million for the nine months ended September 30, 2017 from $45.9 million for the nine months ended September 30, 2016. The revenue increase for the nine months ended September 30, 2017 as compared to the same period in 2016 was a result of an increase inhigher revenue for our substrate products and raw materials sales. Except for China, Taiwan and Japan,wafer substrates. Gross margin as a percentage of revenue from other Asia Pacific countries and North America decreased $1.7 million for the nine months ended September 30, 2017 to $13.6 million from $15.2 million for the nine months ended September 30, 2016. The revenue decrease from these countries for the nine months ended September 30, 2017 as compared to the same period in 2016 was primarilyincreased due to higher unit volume across all wafer substrate and a decreasefavorable shift in bothproduct mix.
43
Selling, General and substrate product sales in these regions which was partially offset by the increase of InP sales. Administrative Expenses
| | | | | | | | | | | | | |
| Three Months Ended | | | | | | | | | ||||
| March 31, | | Increase | | | | | | |||||
| 2024 |
| 2023 |
| (Decrease) |
| % Change | | | | |||
| ($ in thousands) | | | | | | | | | ||||
Selling, general and administrative expenses | $ | 6,227 | | $ | 5,952 | | $ | 275 |
| 4.6 | % | | |
% of total revenue |
| 27.4 | % |
| 30.7 | % | | | | | | | |
Gross Margin
|
|
|
|
|
|
|
|
|
|
|
|
|
|
|
|
|
|
|
|
|
|
|
| Three Months Ended |
|
|
|
|
|
| Nine Months Ended |
|
|
|
|
|
| ||||||||
| September 30, |
| Increase |
|
|
| September 30, |
| Increase |
|
|
| ||||||||||
| 2017 |
| 2016 |
| (Decrease) |
| % Change |
| 2017 |
| 2016 |
| (Decrease) |
| % Change |
| ||||||
| ($ in thousands) |
|
|
|
|
|
| ($ in thousands) |
|
|
|
|
|
| ||||||||
Gross profit | $ | 11,133 |
| $ | 7,578 |
| $ | 3,555 |
| 46.9 | % | $ | 24,677 |
| $ | 18,858 |
| $ | 5,819 |
| 30.9 | % |
Gross Margin % |
| 39.5 | % |
| 34.6 | % |
|
|
|
|
|
| 34.1 | % |
| 30.9 | % |
|
|
|
|
|
Gross profitSelling, general and administrative expenses increased $3.6$0.3 million, or 46.9%4.6%, to $11.1$6.2 million for the three months ended September 30, 2017March 31, 2024 from $7.6$6.0 million for the three months ended September 30, 2016. Gross profit increased primarily due to favorable product mix, higher production volume, overall improvements in yield and manufacturing efficiencies and lower raw material costs used in our wafer substrates for the three months ended September 30, 2017 as compared to the same period in 2016. However, the effect of these favorable factors was partially offset by higher excess and obsolescence charges in the three months ended September 30, 2017 as compared to the same period in 2016.
Gross profit increased $5.8 million, or 30.9%, to $24.7 million for the nine months ended September 30, 2017 from $18.9 million for the nine months ended September 30, 2016. Gross profit increased primarily due to lower raw material costs used in our wafer substrates, overall improvements in yield and manufacturing efficiencies and higher
36
production volume for the nine months ended September 30, 2017 as compared to the same period in 2016. However, the effect of these favorable factors was partially offset by higher manufacturing costs, including unfavorable job variances, incurred as we sought to make on-time shipments after the electrical fire in our Beijing facility on the evening of March 15, 2017 and higher excess and obsolescence charges in the nine months ended September 30, 2017 as compared to the same period in 2016.
Selling, General and Administrative Expenses
|
|
|
|
|
|
|
|
|
|
|
|
|
|
|
|
|
|
|
|
|
|
|
|
| Three Months Ended |
|
|
|
|
|
| Nine Months Ended |
|
|
|
|
|
|
| ||||||||
| September 30, |
| Increase |
|
|
| September 30, |
| Increase |
|
|
|
| ||||||||||
| 2017 |
| 2016 |
| (Decrease) |
| % Change |
| 2017 |
| 2016 |
| (Decrease) |
| % Change |
|
| ||||||
| ($ in thousands) |
|
|
|
|
|
| ($ in thousands) |
|
|
|
|
|
|
| ||||||||
Selling, general and administrative expenses | $ | 4,484 |
| $ | 3,313 |
| $ | 1,171 |
| 35.3 | % | $ | 12,219 |
| $ | 10,106 |
| $ | 2,113 |
| 20.9 | % |
|
% of total revenue |
| 15.9 | % |
| 15.1 | % |
|
|
|
|
|
| 16.9 | % |
| 16.5 | % |
|
|
|
|
|
|
Selling, general and administrative expenses increased $1.2 million, or 35.3%, to $4.5 million for the three months ended September 30, 2017 from $3.3 million for the three months ended September 30, 2016. 31, 2023. The higher selling, general and administrative expenses were primarily from higher sales commission associated with higher revenue, higher consulting, professional service feesan increase in compensation related expenses and personnel-related costs.outside commissions.
Selling, general and administrative expenses increased $2.1 million, or 20.9%, to $12.2 million for the nine months ended September 30, 2017 from $10.1 million for the nine months ended September 30, 2016. The higher selling, general and administrative expenses were primarily from higher consulting, professional service fees and personnel-related costs as well as from expenses incurred as a result of business interruption caused by the electrical fire in our Beijing facility on the evening of March 15, 2017.
Research and Development
| | | | | | | | | | | | | |
| Three Months Ended | | | | | | | | | ||||
| March 31, | | Increase | | | | | | |||||
| 2024 |
| 2023 |
| (Decrease) |
| % Change | | | | |||
| ($ in thousands) | | | | | | | | | ||||
Research and development | $ | 3,214 | | $ | 3,595 | | $ | (381) |
| (10.6) | % | | |
% of total revenue |
| 14.2 | % |
| 18.5 | % | | | | | | | |
|
|
|
|
|
|
|
|
|
|
|
|
|
|
|
|
|
|
|
|
|
|
|
|
| Three Months Ended |
|
|
|
|
|
| Nine Months Ended |
|
|
|
|
|
|
| ||||||||
| September 30, |
| Increase |
|
|
| September 30, |
| Increase |
|
|
|
| ||||||||||
| 2017 |
| 2016 |
| (Decrease) |
| % Change |
| 2017 |
| 2016 |
| (Decrease) |
| % Change |
|
| ||||||
| ($ in thousands) |
|
|
|
|
|
| ($ in thousands) |
|
|
|
|
|
|
| ||||||||
Research and development | $ | 1,410 |
| $ | 1,566 |
| $ | (156) |
| (10.0) | % | $ | 3,553 |
| $ | 4,419 |
| $ | (866) |
| (19.6) | % |
|
% of total revenue |
| 5.0 | % |
| 7.2 | % |
|
|
|
|
|
| 4.9 | % |
| 7.2 | % |
|
|
|
|
|
|
Research and development expenses decreased $156,000,$0.4 million, or 10.0%10.6%, to $1.4$3.2 million for the three months ended September 30, 2017March 31, 2024 from $1.6$3.6 million for the three months ended September 30, 2016.March 31, 2023. The decrease in research and development expenses for the three months ended September 30, 2017March 31, 2024 was primarily due to a reduction in new product testing costs as the reduced use of raw materials for product development at one of our consolidated subsidiaries and lower personnel-related costs.recycling project advanced.
Research and development expenses decreased $866,000, or 19.6% to $3.6 million for the nine months ended September 30, 2017 from $4.4 million for the nine months ended September 30, 2016. The decrease in research and development expenses for the nine months ended September 30, 2017 was primarily due to the reduced use of raw materials for product development at one of our consolidated subsidiaries and lower personnel-related costs. This decrease was partially offset by the increase of expenses incurred from our substrate and pBN research and development activities.Interest Expense, Net
| | | | | | | | | | | | | |
| Three Months Ended | | | | | | | | | ||||
| March 31, | | Increase | | | | | | |||||
| 2024 |
| 2023 |
| (Decrease) |
| % Change | | | | |||
| ($ in thousands) | | | | | | | | | ||||
Interest expense, net | $ | 349 | | $ | 397 | | $ | (48) |
| (12.1) | % | | |
% of total revenue |
| 1.5 | % |
| 2.0 | % | | | | | | | |
37
Interest Income, Net
|
|
|
|
|
|
|
|
|
|
|
|
|
|
|
|
|
|
|
|
|
|
|
|
| Three Months Ended |
|
|
|
|
|
| Nine Months Ended |
|
|
|
|
|
|
| ||||||||
| September 30, |
| Increase |
|
|
| September 30, |
| Increase |
|
|
|
| ||||||||||
| 2017 |
| 2016 |
| (Decrease) |
| % Change |
| 2017 |
| 2016 |
| (Decrease) |
| % Change |
|
| ||||||
| ($ in thousands) |
|
|
|
|
|
| ($ in thousands) |
|
|
|
|
|
|
| ||||||||
Interest income, net | $ | 122 |
| $ | 105 |
| $ | 17 |
| 16.2 | % | $ | 334 |
| $ | 303 |
| $ | 31 |
| 10.2 | % |
|
% of total revenue |
| 0.4 | % |
| 0.5 | % |
|
|
|
|
|
| 0.5 | % |
| 0.5 | % |
|
|
|
|
|
|
Interest income, net increased for three months and nine months ended September 30, 2017 as compared to the same period in 2016 primarily due to increased cash balances as a result of the secondary public offering in March 2017.
Equity in Loss of Unconsolidated Joint Ventures
|
|
|
|
|
|
|
|
|
|
|
|
|
|
|
|
|
|
|
|
|
|
|
|
| Three Months Ended |
|
|
|
|
|
| Nine Months Ended |
|
|
|
|
|
|
| ||||||||
| September 30, |
| (Increase) |
|
|
| September 30, |
| (Increase) |
|
|
|
| ||||||||||
| 2017 |
| 2016 |
| Decrease |
| % Change |
| 2017 |
| 2016 |
| Decrease |
| % Change |
|
| ||||||
| ($ in thousands) |
|
|
|
|
|
| ($ in thousands) |
|
|
|
|
|
|
| ||||||||
Equity in loss of unconsolidated joint ventures | $ | (266) |
| $ | (581) |
| $ | 315 |
| 54.2 | % | $ | (1,387) |
| $ | (1,437) |
| $ | 50 |
| 3.5 | % |
|
% of total revenue |
| (0.9) | % |
| (2.7) | % |
|
|
|
|
|
| (1.9) | % |
| (2.4) | % |
|
|
|
|
|
|
Equity in loss of unconsolidated joint ventures is the aggregate net loss from our seven minority-owned joint ventures that are not consolidated. Equity in loss of unconsolidated joint ventures decreased $315,000 to a loss of $266,000 for the three months ended September 30, 2017 from a loss of $581,000 for the three months ended September 30, 2016 as our unconsolidated joint ventures had reported better performance in the three months ended in September 30, 2017 as compared to the same period of 2016. There were no impairment charges in the three months ended September 30, 2017.
Equity in loss of unconsolidated joint ventures remained virtually unchanged at a loss of $1.4 million for the nine months ended September 30, 2017 and 2016. However, the nine months ended September 30, 2017 include an impairment charge of $313,000 for one of the gallium companies. During the first quarter of 2017, management determinedit is unlikely that this company will recover from the difficult pricing environment and we had written the investment down to zero. There were no impairment charges in the three months ended September 30, 2016.
Other (Expense) Income, Net
|
|
|
|
|
|
|
|
|
|
|
|
|
|
|
|
|
|
|
|
|
|
|
| Three Months Ended |
|
|
|
|
|
| Nine Months Ended |
|
|
|
|
|
| ||||||||
| September 30, |
| Increase |
|
|
| September 30, |
| Increase |
|
|
| ||||||||||
| 2017 |
| 2016 |
| (Decrease) |
| % Change |
| 2017 |
| 2016 |
| (Decrease) |
| % Change |
| ||||||
| ($ in thousands) |
|
|
|
|
|
| ($ in thousands) |
|
|
|
|
|
| ||||||||
Other (expense) income, net | $ | (349) |
| $ | 164 |
| $ | (513) |
| (312.8) | % | $ | (403) |
| $ | 682 |
| $ | (1,085) |
| (159.1) | % |
% of total revenue |
| (1.2) | % |
| 0.7 | % |
|
|
|
|
|
| (0.6) | % |
| 1.1 | % |
|
|
|
|
|
Other (expense) income,expense, net decreased $513,000$48,000, or 12.1%, to a loss of $349,000 for the three months ended September 30, 2017March 31, 2024 from income of $164,000$397,000 for the three months ended September 30, 2016. Other (expense) income, net decreased $1.1 million to a loss of $403,000 for the nine months ended September 30, 2017 from income of $682,000 for the nine months ended September 30, 2016. Other (expense) income,March 31, 2023. Interest expense, net decreased primarily due to a lower realized gain recognized from sales of GHI stock inincreased interest income during the three and nine months ended September 30, 2017March 31, 2024 as compared to the same periodsthree months ended March 31, 2023.
Equity in 2016. AsIncome of September 30, 2017, we no longer hold any GHI stock.Unconsolidated Joint Ventures
| | | | | | | | | | | | | |
| Three Months Ended | | | | | | | | | ||||
| March 31, | | Equity in Income | | | | |||||||
| 2024 |
| 2023 |
| Change |
| % Change | | | | |||
| ($ in thousands) | | | | | | | | | ||||
Equity in income of unconsolidated joint ventures | $ | 890 | | $ | 1,034 | | $ | (144) |
| (13.9) | % | | |
% of total revenue |
| 3.9 | % |
| 5.3 | % | | | | | | | |
The equity in income of unconsolidated joint venture companies was income of $0.9 million for the three months ended March 31, 2024 as compared to income of $1.0 million for the three months ended March 31, 2023. The decrease in income of $0.1 million is primarily due to lower net income at one raw gallium company.
3844
Other Income, Net
| | | | | | | | | | | | |
| Three Months Ended | | | | | | | | ||||
| March 31, | | Other Income | | | |||||||
| 2024 |
| 2023 |
| Change |
| % Change | | | |||
| ($ in thousands) | | | | | | | | ||||
Other income, net | $ | 1,032 | | $ | 282 | | $ | 750 | | 266.0 | % | |
% of total revenue |
| 4.5 | % |
| 1.5 | % | | | | | | |
Other income, net increased $750,000, or 266%, to an income of $1.0 million for the three months ended March 31, 2024 from an income of $282,000 for the three months ended March 31, 2023. Other income, net increased primarily due to compensation received from the China government by our consolidated subsidiaries for technological innovation of $957,000 in the three months ended March 31, 2024 compared to $473,000 in the three months ended March 31, 2023, and a foreign exchange gain of $58,000 in the three months ended March 31, 2024 compared to a loss of $213,000 in the three months ended March 31, 2023.
Provision for Income Taxes
| | | | | | | | | | | | | |||||||||||||||||||||||
| Three Months Ended | | | | | | | | |||||||||||||||||||||||||||
| March 31, | | Increase | | | | | ||||||||||||||||||||||||||||
| 2024 |
| 2023 |
| (Decrease) |
| % Change | | | ||||||||||||||||||||||||||
|
|
|
|
|
|
|
|
|
|
|
|
|
|
|
|
|
|
|
|
|
|
|
| ||||||||||||
|
|
|
|
|
|
|
|
|
|
|
|
|
|
|
|
|
|
|
|
|
|
|
| ||||||||||||
| Three Months Ended |
|
|
|
|
|
| Nine Months Ended |
|
|
|
|
|
|
| ||||||||||||||||||||
| September 30, |
| Increase |
|
|
| September 30, |
| Increase |
|
|
|
| ||||||||||||||||||||||
| 2017 |
| 2016 |
| (Decrease) |
| % Change |
| 2017 |
| 2016 |
| (Decrease) |
| % Change |
|
| ||||||||||||||||||
| ($ in thousands) |
|
|
|
|
|
| ($ in thousands) |
|
|
|
|
|
|
| ||||||||||||||||||||
| |||||||||||||||||||||||||||||||||||
| |||||||||||||||||||||||||||||||||||
| |||||||||||||||||||||||||||||||||||
| |||||||||||||||||||||||||||||||||||
| |||||||||||||||||||||||||||||||||||
| |||||||||||||||||||||||||||||||||||
| |||||||||||||||||||||||||||||||||||
| |||||||||||||||||||||||||||||||||||
| |||||||||||||||||||||||||||||||||||
| |||||||||||||||||||||||||||||||||||
| |||||||||||||||||||||||||||||||||||
| |||||||||||||||||||||||||||||||||||
| ($ in thousands) | | | | | | | | |||||||||||||||||||||||||||
Provision for income taxes | $ | 181 |
| $ | 176 |
| $ | 5 |
| 2.8 | % | $ | 661 |
| $ | 713 |
| $ | (52) |
| (7.3) | % |
| $ | 274 | | $ | 148 | | $ | 126 |
| 85.1 | % | |
% of total revenue |
| 0.6 | % |
| 0.8 | % |
|
|
|
|
|
| 0.9 | % |
| 1.2 | % |
|
|
|
|
|
|
| 1.2 | % |
| 0.8 | % | | | | | | |
Provision for income taxes for the three and nine months ended September 30, 2017 was $181,000 and $661,000, respectively, which were mostly relatedincreased $126,000, or 85.1%, to our China subsidiary and our three consolidated joint venture companies in China. Provision for income taxes remained virtually unchangeda provision of $274,000 for the three months ended September 30, 2017March 31, 2024 as compared to a provision of $148,000 for the same period in 2016.three months ended March 31, 2023. The tax expense recorded for the three months ended March 31, 2024 is the result of foreign taxes and certain state taxes. No income taxes or benefits have beentax is provided for our U.S. operations due toas most of the lossincome in the U.S. has been fully offset by utilization of federal and thestate net operating loss carryforwards. Additionally, there is uncertainty of generating future profit in the U.S., which havehas resulted in our deferred tax assets being fully reserved. Our estimated tax rate can vary greatly from year to year because of the change or benefit in the mix of taxable income between our U.S. and China basedChina-based operations.
Under the 2017 Tax Cuts and Jobs Act, research and experimental (“R&E”) expenditures incurred or paid for tax years beginning after December 31, 2021 will no longer be immediately deductible for tax purposes. Instead, businesses are now required to capitalize and amortize R&E expenditures over a period of five years for research conducted within the U.S. or 15 years for research conducted in a foreign jurisdiction. We capitalize the R&E expense in our China subsidiaries and amortize it over 15 years.
On August 16, 2022, President Biden signed the Inflation Reduction Act (the “Inflation Reduction Act”) into law finalizing a legislation intended to address inflation by paying down the national debt, lower consumer energy costs, providing incentives for the production of clean energy, and reducing healthcare costs. The Inflation Reduction Act imposes a 1% exercise tax on stock buy backs and a 15% minimum tax on corporations with over $1 billion in profit. The Inflation Reduction Act has no impact on us, since we have no plan to buy back additional shares of our common stock and our profit is not over $1 billion.
45
Net (Income) loss Attributable to Noncontrolling Interests and Redeemable Noncontrolling Interests
| | | | | | | | | | | | | ||||||||||||||||||||||||
| Three Months Ended | | Net (income) loss attributable to | | | |||||||||||||||||||||||||||||||
| | | | | | | noncontrolling interests and | | | |||||||||||||||||||||||||||
| March 31, |
| redeemable noncontrolling interests | | | |||||||||||||||||||||||||||||||
| 2024 | | 2023 | | Change | | % Change | | | |||||||||||||||||||||||||||
|
|
|
|
|
|
|
|
|
|
|
|
|
|
|
|
|
|
|
|
|
|
|
| |||||||||||||
| Three Months Ended |
|
|
|
|
|
| Nine Months Ended |
|
|
|
|
|
|
| |||||||||||||||||||||
| September 30, |
| (Increase) |
|
|
| September 30, |
| (Increase) |
|
|
|
| |||||||||||||||||||||||
| 2017 |
| 2016 |
| Decrease |
| % Change |
| 2017 |
| 2016 |
| Decrease |
| % Change |
|
| |||||||||||||||||||
| ($ in thousands) |
|
|
|
|
|
| ($ in thousands) |
|
|
|
|
|
|
| |||||||||||||||||||||
Noncontrolling interests | $ | 146 |
| $ | (18) |
| $ | 164 |
| 911.1 | % | $ | (226) |
| $ | (480) |
| $ | 254 |
| 52.9 | % |
| |||||||||||||
| ||||||||||||||||||||||||||||||||||||
| ||||||||||||||||||||||||||||||||||||
| ||||||||||||||||||||||||||||||||||||
| ||||||||||||||||||||||||||||||||||||
| ||||||||||||||||||||||||||||||||||||
| ||||||||||||||||||||||||||||||||||||
| ||||||||||||||||||||||||||||||||||||
| ||||||||||||||||||||||||||||||||||||
| ||||||||||||||||||||||||||||||||||||
| ||||||||||||||||||||||||||||||||||||
| ||||||||||||||||||||||||||||||||||||
| ||||||||||||||||||||||||||||||||||||
| ||||||||||||||||||||||||||||||||||||
| ($ in thousands) | | | | | | | | ||||||||||||||||||||||||||||
Net (income) loss attributable to noncontrolling interests and redeemable noncontrolling interests | $ | (35) | | $ | 318 | | $ | (353) |
| (111.0) | % | | | |||||||||||||||||||||||
% of total revenue |
| 0.5 | % |
| (0.1) | % |
|
|
|
|
|
| (0.3) | % |
| (0.8) | % |
|
|
|
|
|
|
| (0.2) | % |
| 1.6 | % | | | | | | | |
The decrease inNet (income) loss attributable to noncontrolling interests’ shareinterests and redeemable noncontrolling interests increased $353,000 or 111.0% to an income of losses$35,000 for the three and nine months ended September 30, 2017 as compared toMarch 31, 2024, from a loss of $318,000 for the same period in 2016 wasthree months ended March 31, 2023, primarily due to higher profitability from two of our three consolidated subsidiariesjoint venture companies in China which was partially offset with lower profitability from our other consolidated subsidiary in China.as sales increased.
Liquidity and Capital Resources
We consider cash and cash equivalents, short-term investments and long-term investments as liquid and available for use within two yearsone year in our current operations. Short-term investments and long-term investments are comprised of U.S. government securities, certificates of deposit and investment-grade corporate notes and bonds.
As of September 30, 2017,March 31, 2024, our principal source of liquidity was $78.3$41.3 million, which consisted of cash and restricted cash equivalents of $48.1$39.6 million short-termand investments of $20.5 million and long-term investments of $9.7$1.7 million. In the ninethree months ended September 30, 2017,March 31, 2024, cash and restricted cash equivalents increaseddecreased by $11.9$10.5 million and short-term and long-term investments increaseddecreased by $12.6$0.5 million. The increasedecrease in cash and restricted cash equivalents of $11.9$10.5 million in the ninethree months ended September 30, 2017March 31, 2024 was primarily due to net cash provided byused in operating activities of $8.0$8.8 million and net cash used in investing activities of $3.9 million, partially offset by net cash provided by financing activities of $32.9 million, primarily due to the net proceeds of $31.9 million received from the public offering of 5,307,692 shares of our common stock in March 2017 and proceeds of $1.5 million form the exercise of common stock options partially offset by the net dividends paid by our joint ventures of $0.5 million, which were partially offset by net cash used in investing activities of $29.2 million. As of September 30, 2017, we and our consolidated joint ventures held approximately $19.0 million in cash and investments in foreign bank accounts. This consists of $11.2 million held by our wholly owned subsidiary in China and $7.8 million held by our three partially-owned consolidated subsidiaries in China. Of this $19.0 million, approximately $12.3 million would not be available for use in the United States without paying United States income taxes. We believe that the current value of our net operating loss carryforwards would offset the taxes due.
As of September 30, 2016, our principal source of liquidity was $47.3 million which consisted of cash and cash equivalents of $29.7 million, short-term investments of $9.6 million and long-term investments of $8.1 million. In the
39
nine months ended September 30, 2016, cash and cash equivalents increased by $4.8 million and short-term and long-term investments decreased by $1.4 million. The increase in cash and cash equivalents of $4.8 million in the nine months ended September 30, 2016 was primarily due to net cash provided by operating activities of $5.5 million and net cash provided by financing activities of $0.4 million, which were partially offset by net cash used in investing activities of $0.6$2.0 million and the effect of exchange rate changes of $0.5$0.2 million. As of September 30, 2016,March 31, 2024, we and our consolidated joint ventures in China held approximately $19.8$34.7 million in cash and investments in foreign bank accounts. This consists
As of $14.1March 31, 2023, our principal source of liquidity was $53.6 million, heldwhich consisted of cash and restricted cash of $44.9 million and investments of $8.7 million. In the three months ended March 31, 2023, cash and restricted cash increased by $3.5 million and investments decreased by $2.8 million. The increase in cash and restricted cash of $3.5 million in the three months ended March 31, 2023 was primarily due to net cash provided by financing activities of $5.8 million and the effect of exchange rate changes of $19,000, partially offset by net cash used in operating activities of $1.5 million and net cash used in investing activities of $0.7 million. As of March 31, 2023, we and our wholly owned subsidiaryconsolidated joint ventures in China held approximately $40.4 million in cash and $5.7 million held by our three partially-owned consolidated subsidiariesinvestments in China. Of this $19.8 million, approximately $12.6 million would not be available for use in the United States without paying United States income taxes. foreign bank accounts.
Net cash provided byused in operating activities of $8.0$8.8 million for the ninethree months ended September 30, 2017March 31, 2024 was primarily comprised of a net change of $8.9 million in operating assets and liabilities, a net loss before income attributable to noncontrolling interest and redeemable noncontrolling interests of $6.8$2.0 million, adjustedand income from equity method investments of $0.9 million, partially offset by the adjustment for non-cash items of depreciation and amortization of $3.4$2.2 million and stock-based compensation of $0.8 million.
Net cash used in operating activities of $1.5 million for the three months ended March 31, 2023 was primarily comprised of a net loss onbefore income attributable to noncontrolling interest and redeemable noncontrolling interests of $3.7 million, income from equity method investments of $1.1$1.0 million, partially offset by the adjustment for non-cash items of depreciation and amortization of $2.1 million, stock-based compensation of $1.0$0.9 million impairment charge on equity investee of $0.3 million, which were partially offset byand a net change of $4.6$0.1 million in operating assets and liabilities.
46
Net cash provided by operatingused in investing activities of $5.5$3.9 million for the ninethree months ended September 30, 2016March 31, 2024 was primarily comprisedfrom the purchase of a net incomeproperty, plant and equipment of $2.9$4.4 million, adjusted for non-cash items of depreciation of $3.6 million, loss on equity method investments of $1.4 million and stock-based compensation of $0.8 million, which were partially offset by realized gain onproceeds from sales and maturities of investmentsavailable-for-sale debt securities of $0.4 million and a net change of $2.9 million in operating assets and liabilities.$0.5 million.
Net cash used in investing activities of $29.2$0.7 million for the ninethree months ended September 30, 2017March 31, 2023 was primarily from the purchase of marketable investment securities totaling $26.1 million and the purchase of property, plant and equipment of $16.6$3.6 million, which were partially offset by proceeds from maturitiessales and salesmaturities of available-for-sale debt securities of $13.3 million.
Net cash used in investing activities of $0.6 million for the nine months ended September 30, 2016 was primarily from the purchase of marketable investment securities totaling $10.8 million and the purchase of property, plant and equipment of $2.2 million, which were partially offset by proceeds from maturities and sales of available-for-sale securities of $12.3$2.9 million.
Net cash provided by financing activities was $32.9$2.0 million for the ninethree months ended September 30, 2017,March 31, 2024, which mainly consisted of $31.9 million net proceeds from the issuanceshort-term loans of 5,307,692 shares$12.9 million, long-term loan of $5.9 million and common stock as a resultoptions exercised of our March 2017 stock offering and net proceeds of $1.5 million on the issuance of common stock pursuant to stock option exercises, which were$20,000, partially offset by net dividends paid by our joint venturesrepayment of $0.5short-term loans of $16.5 million and repayment of long-term loan of $0.2 million.
Net cash provided by financing activities was $0.4$5.8 million for the ninethree months ended September 30, 2016,March 31, 2023, which mainly consisted of proceeds from short-term loans of $18.4 million, capital increase in subsidiary shares from noncontrolling interest of $0.2 million and common stock exercised. option exercised of $8,000, partially offset by repayment of short-term loan of $12.8 million.
On October 27, 2014, our Board of Directors approved a stock repurchase program pursuant to which we may repurchase up to $5.0 million of our outstanding common stock. These repurchases could be made from time to time in the open market and could be funded from our existing cash balances and cash generated from operations. During 2015, we repurchased approximately 908,000 shares at an average price of $2.52 per share for a total purchase price of approximately $2.3 million under the stock repurchase program. NoSince 2015, no shares were repurchased during 2016 under this program. During the ninethree months ended September 30, 2017,March 31, 2024, we did not repurchase any shares under the approved stock repurchase program. As of September 30, 2017,March 31, 2024, approximately $2.7 million remained available for future repurchases under this program. Currently, we do not plan to repurchase additional shares.
Dividends accrue on our outstanding Series A preferred stock, and are payable as and when declared by our boardBoard of directors.Directors. We have never paiddeclared or declaredpaid any dividends on the Series A preferred stock. By the terms of the Series A preferred stock, so long as any shares of Series A preferred stock are outstanding, neither the Company nor any subsidiary of the Company shall redeem, repurchase or otherwise acquire any shares of common stock, unless all accrued dividends on the Series A preferred stock have been paid. During 2013 and 2015, we repurchased shares of our outstanding common stock. As of December 31, 2015, the Series A preferred stock had cumulative dividends of $2.9
40
million and we include such cumulative dividends in “Accrued liabilities” in our condensed consolidated balance sheets. IfAt the time we are required to pay the cumulative dividends on the Series A preferred stock,this accrued liability, our cash and cash equivalents wouldwill be reduced. We account for the cumulative year to date dividends on the Series A preferred stock when calculating our earnings per share.
Occasionally, one of our PRC subsidiaries or PRC raw material joint ventures declares and pays a dividend. These dividends generally occur when the PRC joint venture declares a dividend for all of its shareholders. Dividends paid to the Company are subject to a 10% PRC withholding tax. The Company is required to obtain approval from the State Administration of Foreign Exchange (“SAFE”) to transfer funds in or out of the PRC. SAFE requires a valid agreement to approve the transfers, which are processed through a bank. Other than PRC foreign exchange restrictions, the Company is not subject to any PRC restrictions and limitations on its ability to distribute earnings from its businesses, including its PRC subsidiaries and PRC joint ventures, to the Company and its investors as well as the ability to settle amounts owed by the Company to its PRC subsidiaries and PRC joint ventures. If SAFE approval is denied the dividend payable to the Company would be owed but would not be paid.
For the three months ended March 31, 2024 and 2023, we were not paid any dividends, directly or to an intermediate entity within our corporate structure, by our PRC subsidiaries and PRC raw material joint. For the three months ended March 31, 2024 and 2023, there were no dividends paid to minority shareholders by our PRC subsidiaries or PRC raw material joint ventures. For the three months ended March 31, 2024, no transfers, dividends, or distributions have been made to date between the Company and its PRC subsidiaries, or to investors, except for the settlement of amounts owed under our transfer pricing arrangements in the ordinary course of business.
47
We have no current intentions to distribute to our investors earnings under our corporate structure. We settle amounts owed under our transfer pricing arrangements in the ordinary course of business.
The China central governmentcash generated from one PRC subsidiary is working withnot used to fund another PRC subsidiary’s operations. None of our PRC subsidiaries has ever faced difficulties or limitations on its ability to transfer cash between our subsidiaries. AXT has cash management policies that dictate the Beijing city government to design a master development planamount of such funding.
As one of the area where our manufacturing facility is located, which will result in the relocation of many of the manufacturing companies in our district. We have been asked to relocate our gallium arsenide production line. We are cooperating with the government and, in accordance with our relocation plan, are relocating our gallium arsenide production line. On September 12, 2017, we announced that we completed the purchase of a new manufacturing facility in city of Dingxing in the People’s Republic of China. The Dingxing site is approximately 18.75 acres and currently has three existing buildings, which comprise approximately 140,000 sq. feet of production space and 50,000 sq. feet designated for offices and dormitories. We have already transferred single crystal growth furnaces to this site and, in October 2017, we produced our first single crystal growth ingot at this site. To enable rapid capacity expansion, we are developing plans to construct a fourth building at this site. We do not yet have comprehensive construction bids for further modifications to the existing buildings, the fourth building or third party estimates for the complete relocation costs, but we believe these costs will be in the range of $25 million to $35 million which includes the amount we have already paid for the purchase of our new manufacturing facility. However, such costs could be more expensive than originally estimated, particularly as we are now contemplating a larger facility that will enable us to rapidly add furnaces and other necessary production equipment to serve the potential demand for 3D-sensing VCSELs and other high-end applications. Furthermore, we have acquired a second site in city of Kazuo, located in the province in Liaoning near the Inner Mongolia Autonomous Region, which will initially be used for the synthesis of raw gallium and raw arsenic. Additional environmental permits, regulatory approvals and zoning conformance applications are in process for both sites. Although the cost of this second site is less than $1.0 million, it was not contemplated in our original estimate.
One of our consolidated joint ventures, JinMei, issteps in the process of relocatinglisting Tongmei on the STAR Market and going public, we sold approximately 7.28% of Tongmei to private equity investors for approximately $49 million in the aggregate. Pursuant to the Capital Investment Agreements with the Investors, each Investor has the right to require AXT to redeem any or all Tongmei shares held by such Investor at the original purchase price paid by such Investor, without interest, in the event the IPO fails to pass the audit of the Shanghai Stock Exchange, is not approved by the CSRC or Tongmei cancels the IPO application. The aggregate redemption amount is approximately $49 million.
Tongmei submitted its headquartersIPO application to the Shanghai Stock Exchange, and manufacturing operationsit was formally accepted for review on January 10, 2022. The Shanghai Stock Exchange approved the IPO application on July 12, 2022. On August 1, 2022, the CSRC accepted for review Tongmei’s IPO application. The STAR Market IPO remains subject to an alternative location. Currently, JinMei has identifiedreview and approval by the CSRC and other authorities. The process of going public on the STAR Market includes several periods of review and, therefore, is a sitelengthy process. Subject to review and approval by the CSRC and other authorities, Tongmei expects to accomplish this goal in the coming months. The listing of Tongmei on the STAR Market will not change the status of AXT as a possible candidateU.S. public company.
Our bank loans and the estimated costscredit facilities typically have a term of 12 months or less and are included in “Short-term loans” in our condensed consolidated balance sheets. The following table represents short-term bank loans as of March 31, 2024 and December 31, 2023 (in thousands, except interest rate data):
| | | | | | | | | | | | |
48
| | | Loan | Interest | | | | | | December 31, | | March 31, |
Subsidiary | Bank | | Detail | Rate | | Start Date | | Due Date | | 2023 | | 2024 |
Tongmei | Bank of China (1) | $ | 1,848 | 3.5 | % | January-23 | | January-24 | $ | 1,795 | $ | - |
| | | 2,184 | 2.8 | % | March-23 | | March-24 | | 2,118 | | - |
| | | 376 | 2.7 | % | September-23 | | September-24 | | 386 | | 378 |
| | | 876 | 3.5 | % | November-23 | | November-24 | | 876 | | 858 |
| | | 1,003 | 3.5 | % | November-23 | | November-24 | | 1,003 | | 985 |
| Bank of China (2) | | 2,911 | 3.5 | % | January-23 | | January-24 | | 2,825 | | - |
| | | 2,770 | 3.0 | % | January-24 | | January-25 | | - | | 2,770 |
| Bank of Communications (1) | | 1,455 | 3.3 | % | January-23 | | January-24 | | 1,414 | | - |
| | | 1,380 | 3.8 | % | May-23 | | May-24 | | 1,414 | | 1,386 |
| | | 1,373 | 3.8 | % | July-23 | | May-24 | | 1,414 | | 1,386 |
| China Merchants Bank (1) | | 4,367 | 3.7 | % | January-23 | | January-24 | | 4,235 | | - |
| | | 1,386 | 3.5 | % | January-24 | | January-25 | | - | | 1,386 |
| | | 692 | 3.5 | % | February-24 | | February-25 | | - | | 692 |
| Bank of Beijing (3) | | 2,290 | 4.2 | % | January-23 | | January-24 | | 2,220 | | - |
| | | 3,541 | 3.2 | % | June-23 | | May-24 | | 3,626 | | 3,560 |
| | | 1,380 | 3.2 | % | June-23 | | February-24 | | 1,414 | | - |
| | | 1,414 | 3.0 | % | December-23 | | December-24 | | 1,414 | | 1,386 |
| | | 3,600 | 3.0 | % | March-24 | | February-25 | | - | | 3,600 |
| | | 1,386 | 3.0 | % | March-24 | | December-24 | | - | | 1,386 |
| Industrial Bank (1) | | 2,757 | 4.3 | % | June-23 | | June-24 | | 2,825 | | 2,770 |
| | | 2,744 | 4.3 | % | July-23 | | July-24 | | 2,825 | | 2,770 |
| | | 2,744 | 4.3 | % | September-23 | | September-24 | | 2,825 | | 2,770 |
| NingBo Bank (1) | | 2,744 | 4.2 | % | August-23 | | September-24 | | 2,820 | | 2,765 |
| | | 1,271 | 4.3 | % | November-23 | | November-24 | | 1,271 | | 1,246 |
| | | 2,825 | 4.3 | % | December-23 | | December-24 | | 2,825 | | 2,770 |
| | | 1,647 | 4.3 | % | January-24 | | January-25 | | - | | 1,647 |
| Industrial and Commercial Bank of China (1) | | 2,744 | 3.3 | % | September-23 | | September-24 | | 2,825 | | 2,770 |
| NanJing Bank (1) | | 2,752 | 3.8 | % | October-23 | | October-24 | | 2,752 | | 2,700 |
BoYu | Industrial and Commercial Bank of China (4) | | 1,414 | 2.7 | % | December-23 | | December-24 | | 1,414 | | 1,386 |
| Bank of China (1) | | 1,204 | 2.4 | % | January-23 | | January-24 | | 849 | | - |
| NingBo Bank (1) | | 1,414 | 3.3 | % | November-23 | | May-24 | | 1,414 | | 1,386 |
| Industrial Bank (1) | | 688 | 3.6 | % | September-23 | | September-24 | | 708 | | 692 |
| Bank of Communications (1) | | 1,414 | 3.0 | % | November-23 | | May-24 | | 1,414 | | 1,386 |
| NanJing Bank (1) | | 1,386 | 3.5 | % | January-24 | | January-25 | | - | | 1,386 |
| Loan Balance | | | | | | | | $ | 52,921 | $ | 48,217 |
Collateral for the land use rights acquisitionabove bank loans and line of credit
| (1) | Not collateralized. |
| (2) | ChaoYang LiMei time deposit. |
| (3) | AXT time deposit. |
| (4) | BoYu’s land use rights and its building located at its facility in Tianjin, China. In addition, the December 2023 loan attracts a guarantee fee amounting to 0.7% of the loan amount. |
On January 30, 2024, the Company secured a new line of credit amounting to $9.7 million, structured as a five-year bank loan. The credit facility construction is expected to be approximately $6 million. In July 2017, our wholly-owned subsidiary, Tongmei, provided an inter-company loan to JinMei inbears interest at a rate of 6.5% per annum on the amount drawn from the line of $751,000 in preparation forcredit. The credit facility is collateralized by the acquisitionreal estate properties owned by ChaoYang Tongmei. In January 2024, the Company borrowed $5.8 million against the credit facility. The intended use of the land use rights and thecredit facility is for construction of fixed assets. As of March 31, 2024, $5.6 million is included in “Other long-term liabilities” and $277,000 is included in “Short-term loans” in our consolidated balance sheets.
In December 2023, one of our consolidated subsidiaries, ChaoYang XinMei secured a new building. The inter-company loan carriesof approximately $2.1 million from an interest rateunrelated financing company. According to the agreement, ChaoYang XinMei temporarily transferred ownership of 4.9% per annum its production line and related equipment to the financing company, while retaining the right to use the property for production. At the end of the 30-month contractual period, ChaoYang XinMei holds the option to repurchase the production line and related equipment for $14.00. As of March 31, 2024, $1.4 million is dueincluded in “Other long-term liabilities” and $554,000 is included in “Short-term loans” in our consolidated balance sheets.
On July 27, 2021, we filed with the SEC a registration statement on June 30, 2023. Form S-3 (the “Shelf Registration Statement”), pursuant to which we may offer up to $60 million of common stock, preferred stock, debt securities, depositary shares, warrants, subscription rights, purchase contracts and/or units in one or more offerings and in any combination. A prospectus supplement, which we will provide each time we offer securities, will describe the specific
49
amounts, prices and terms of the securities we determine to offer. We currently expect to use the net proceeds from the sale of securities under the Shelf Registration Agreement for working capital, capital expenditures and other general corporate purposes. We may also use a portion of the net proceeds to acquire, license or invest in complementary products, technologies or businesses. On May 17, 2022, the SEC declared the Shelf Registration Statement effective.
We believe that we have adequate cash and investments to meet our operating needs and capital expenditures over the next twelve12 months. If our sales decrease, however, our ability to generate cash from operations will be adversely affected which could adversely affect our future liquidity, require us to use cash at a more rapid rate than expected, and require us to seek additional capital.
On October 24, 2016, we filed with the SEC a registration statement on Form S-3, pursuant to which we may offer up to $60 million of common stock, preferred stock, depositary shares, warrants, debt securities and/or units in one or more offerings and in any combination. On November 4, 2016, the SEC declared the registration statement effective. A prospectus supplement, which we will provide each time we offer securities, will describe the specific amounts, prices and terms of the securities we determine to offer.
On March 2, 2017, we filed with the SEC a final prospectus supplement, pursuant to which we offered and sold 5,307,692 shares of our common stock. The net proceeds will be used for the purchase of land and the construction of a building needed for the relocation of our gallium arsenide production line, for equipment capital expenditures, working capital for accounts receivable and inventory, possible acquisitions of complementary products, technologies or businesses and other general purposes.
Cash from operations could be affected by various risks and uncertainties, including, but not limited to those set forth below under the section entitled “Risk Factors” in Item 1A “Risk Factors.”below.
Contract to Purchase Goods and Services
41
certain goods and services are not considered to be part of our contractual obligations. We cannot determine the aggregate amount of such purchase orders that represent contractual obligations because purchase orders may represent authorizations to purchase rather than binding agreements. For the purposes of this disclosure, contractual obligations for purchase of goods or services are defined as agreements that are enforceable and legally binding and that specify all significant terms, including fixed or minimum quantities to be purchased; fixed, minimum, or variable price provisions; and the approximate timing of the transaction. Our purchase orders are based on our current needs and are fulfilled by our vendors within short time horizons. We also enter into contracts for outsourced services; however, the obligations under these contracts were not significant and the contracts generally contain clauses allowing for cancellation without significant penalty. Contractual obligations that are contingent upon the achievement of certain milestones would also not be included.
Contractual Obligations
Land Purchase and Operating LeasesInvestment Agreement
We lease certain office space, warehouse facilities and equipment under long-term operating leases expiring at various dates through December 2025. The majority of our lease obligations relates to our lease agreement for the facility in Fremont, California with approximately 19,467 square feet.
We entered intohave established a royalty agreement with a competitor effective December 3, 2010 with a term of eight years, terminating December 31, 2018. We and our related companies are granted a worldwide, nonexclusive, royalty bearing, irrevocable license to certain patents for the term of the agreement. We shall pay up to $7.0 million of royalty payments over eight years that began in 2011 based on future royalty bearing sales. This agreement contains a clause that allows us to claim credit, starting in 2013, in the event that the royalty bearing sales for the year is lower than a pre-determined amount set forth in this agreement.
Outstanding contractual obligations as of September 30, 2017 are summarized as follows (in thousands):
|
|
|
|
|
|
|
|
|
|
|
|
|
|
|
|
|
|
| Payments due by period |
| |||||||||||||
|
|
|
|
|
|
|
| 1-3 |
| 4-5 |
| More than |
| |||
Contractual Obligations |
| Total |
| Less than 1 year |
| years |
| years |
| 5 years |
| |||||
Operating leases |
| $ | 651 |
| $ | 202 |
| $ | 350 |
| $ | 93 |
| $ | 6 |
|
Royalty agreement |
|
| 719 |
|
| 575 |
|
| 144 |
|
| — |
|
| — |
|
Total |
| $ | 1,370 |
| $ | 777 |
| $ | 494 |
| $ | 93 |
| $ | 6 |
|
We are in the process of relocating our gallium arsenidewafer processing production line toin Dingxing, China. In addition to a land rights and building purchase agreement that we entered into with a private real estate development company to acquire our new manufacturing facility, we also entered into a cooperation agreement with the Dingxing local government. In addition to pledging its full support and cooperation, the Dingxing local government will issue certain tax credits or rebates to us as we achieve certain milestones. We, in turn, agreed to hire local workers over time, pay taxes when due and eventually demonstrate a total investment of approximately $90 million in value, assets and capital. The investment will include cash paid for the land and buildings, cash on deposit in our name at local banks, the gross value of new and used equipment (including future equipment that might be used for indium phosphide and germanium substrates production), the deemed value for our customer list or the end user of our substrates (for example, the end users of the 3-D sensing VCSELs), a deemed value for employment of local citizens, a deemed value for our proprietary process technology, other intellectual property, other intangibles and additional items of value. There is no timeline or deadline by which this must be accomplished, rather it is a good faith covenant entered into between AXT and the Dingxing local government. Further, there is no specific penalty contemplated if either party breaches the agreement, however the agreement does state that each party has a right to seek from the other party compensation for losses. Under certain conditions, the Dingxing local government may purchase the land and building at the appraised value. We believe that such cooperation agreements are normal, customary and usual in China and that the future valuation is flexible. We have a similar agreement with the city of Kazuo, China, although on a smaller scale. The total investment targeted by AXT in Kazuo is approximately $15 million in value, assets and capital.
Purchase orders or contracts for the purchase of certain goods and services are not included in the preceding table. We cannot determine the aggregate amount of such purchase orders that represent contractual obligations because purchase orders may represent authorizations to purchase rather than binding agreements. For the purposes of this table, contractual obligations for purchase of goods or services are defined as agreements that are enforceable and legally binding and that specify all significant terms, including fixed or minimum quantities to be purchased; fixed, minimum, or variable price provisions; and the approximate timing of the transaction. Our purchase orders are based on our current needs and are fulfilled by our vendors within short time horizons. We also enter into contracts for outsourced services; however, the obligations under these contracts were not significant and the contracts generally contain clauses allowing for cancellation without significant penalty. Contractual obligations that are contingent upon the achievement of certain milestones are not included in the table above.
42
Off-Balance Sheet Arrangements
As of September 30, 2017,March 31, 2024, we did not have any off-balance sheet financing arrangements and have never established any special purpose entities as defined under SEC Regulation S-K Item 303(a)(4)(ii).
Recent Accounting Pronouncements
For a description of recent accounting pronouncements, including the expected dates of adoption and estimated effects, if any, on our condensed consolidated financial statements, please see “Note 17 - Recent Accounting Pronouncements” in the Notes to Condensed Consolidated Financial Statements of this Form 10-Q.
4350
ITEM 3. QUANTITATIVE AND QUALITATIVEQUALITATIVE DISCLOSURES ABOUT MARKET RISK
Foreign Currency Risk
A significant portion of our business is conducted in currencies other than the U.S. dollar. Foreign exchange losses have had a material adverse effect on our operating results and cash flows in the past and could have a material adverse effect on our operating results and cash flows in the future. If we do not effectively manage the risks associated with foreign currencies,this currency risk, our revenue, cash flows and financial condition could be adversely affected. For example,During 2023 and 2022, we recorded a foreign exchange gain of $0.2 million and $1.6 million, respectively, and during 2014,2021 we recorded a net foreign exchange lossesloss of $1.0$0.4 million, included as part of other“Other income, (expense), netnet” in our condensed consolidated statements of operations. Although during 2016 and 2015, we recorded a foreign exchange gain of $232,000 and $717,000, respectively, we cannot guarantee to have the same gain in the future. We incur foreign currency transaction exchange gains and losses due to operations in general. In the future we may experience foreign exchange losses on our non-functional currency denominated receivables and payables to the extent that we have not mitigated our exposure. Foreign exchange losses could have a materialmaterially adverse effect on our operating results and cash flows.
Our product sales to Japanese customers are typically invoiced in Japanese yen. As such, we have foreign exchange exposure on our accounts receivable and on any Japanese yen denominated cash deposits. In 2014 and the first half of 2015, the Japanese yen depreciated against the dollar. The major portion of our 2014 exchange loss is attributable to the Japanese yen’s movement.
To partially protect us against fluctuations in foreign currency resulting from accounts receivable in Japanese yen, starting in 2015, we instituted a foreign currency hedging program. We place short term hedges that are intended to offset the potential cash exposure related to fluctuations in the exchange rate between the United States dollar and Japanese yen. We measure the fair value of these hedges at each month end and quarter end using current exchange rates and in accordance with generally accepted accounting principles.U.S. GAAP. At quarter end and year end any foreign currency hedges not settled are netted on the condensed consolidated balance sheet and consolidated balance sheet, respectively, and classified as Level 3 assets and liabilities. As of September 30, 2017March 31, 2024 and December 31, 2023, the net change in fair value from the placement of the hedge to settlement at each month end during the quarter had a de minimis impact to the condensed consolidated results.
The functional currency for our foreign operations is the Renminbi,renminbi, the local currency of China, and in the future we may establish short term hedges covering Renminbi.renminbi. Most of our operations are conducted in China and most of our costs are incurred in Chinese Renminbi,renminbi, which subjects us to fluctuations in the exchange rates between the U.S. dollar and the Chinese Renminbi.renminbi. We incur transaction gains or losses resulting from consolidation of expenses incurred in local currencies for our Chinese subsidiaries, as well as in translation of the assets and liabilities at each balance sheet date. Our financial results could be adversely affected by factors such as changes in foreign currency exchange rates or weak economic conditions in foreign markets, including the revaluation by China of the Renminbi,renminbi, and any future adjustments that China may make to its currency such as any move it might make to a managed float system with opportunistic interventions. We may also experience foreign exchange losses on our non-functional currency denominated receivables and payables.
We currently are using a hedging program to minimize the effects of currency fluctuations relating to the Japanese yen. While we may apply this program to other currencies, such as the Chinese Renminbi,renminbi, our hedging position is partial and may not exist at all in the future. It may not succeed in minimizing our foreign currency fluctuation risks. Our primary objective in holding these instruments is to reduce the volatility of earnings and cash flows associated with changes in foreign currency. The program is not designated for trading or speculative purposes. The company may choose not to hedge certain foreign exchange exposures for a variety of reasons, including but not limited to accounting considerations and the prohibitive economic cost of hedging particular exposures. However, even with our hedging program, we still experience losses on foreign exchange from time to time.
4451
Interest Rate Risk
Cash and restricted cash equivalents earning interest and certain variable rate debt instruments are subject to interest rate fluctuations. The following table sets forth the probable impact of a 10% change in interest rates (in thousands):
|
|
|
|
|
|
|
|
|
|
|
|
|
|
|
|
|
|
|
|
|
|
|
|
|
| Proforma 10% |
| Proforma 10% |
| ||
|
| Balance as of |
| Current |
| Projected Annual |
| Interest Rate |
| Interest Rate |
| ||||
|
| September 30, |
| Interest |
| Interest |
| Decline |
| Increase |
| ||||
Instrument |
| 2017 |
| Rate |
| Income |
| Income |
| Income |
| ||||
Cash and cash equivalents |
| $ | 48,078 |
| 0.11 | % | $ | 53 |
| $ | 48 |
| $ | 58 |
|
Investments in marketable debt |
|
| 30,209 |
| 1.91 | % |
| 577 |
|
| 519 |
|
| 635 |
|
|
|
|
|
|
|
| $ | 630 |
| $ | 567 |
| $ | 693 |
|
| | | | | | | | | | | | | | | |
|
| | |
| |
| | |
| Proforma 10% |
| Proforma 10% |
| ||
| | Balance as of | | Current | | Projected Annual | | Interest Rate | | Interest Rate |
| ||||
| | March 31, | | Interest | | Interest | | Decline | | Increase |
| ||||
Instrument | | 2024 | | Rate | | Income | | Income | | Income |
| ||||
Cash and restricted cash | | $ | 39,600 |
| 0.62 | % | $ | 246 | | $ | 221 | | $ | 271 | |
Investments in marketable debt securities | |
| 1,667 |
| 3.34 | % |
| 56 | |
| 50 | |
| 62 | |
| | | | | | | $ | 302 | | $ | 271 | | $ | 333 | |
The primary objective of our investment activities is to preserve principal while maximizing income without significantly increasing risk. Financial instruments that potentially subject us to concentration of credit risk consist primarily of cash, and cash equivalents, short-term investments, and trade accounts receivable. We invest primarily in money market accounts, certificates of deposits, corporate bonds and notes, and government securities. We are exposed to credit risks in the event of default by the issuers to the extent of the amount recorded on the condensed consolidated balance sheets. These securities are generally classified as available-for-sale and consequently are recorded on the balance sheet at fair value with unrealized gains or losses reported as a separate component of accumulated other comprehensive income (loss), net of estimated tax.tax, further reduced by a valuation allowance for expected credit losses, if any. Our cash cash equivalents and short-term investments and long-term investments are in high-quality instruments placed with major banks and financial institutions and commercial paper. We have no investments in auction rate securities.
Credit Risk
We perform ongoing credit evaluations of our customers’ financial condition, and limit the amount of credit extended when deemed necessary, but generally do not require collateral. The credit risk in our accounts receivable is mitigated by our credit evaluation process and the broad dispersion of sales transactions. One customerNo customers accounted for 13%10% of our accounts receivable balance as of September 30, 2017,March 31, 2024and the same customer accounted for 13% of our accounts receivable balance as of December 31, 2016. 2023.
Impairment of Equity Investment Risk
As part of our supply chain strategy, we maintain minority investments in privately-held raw material companies located in China either invested directly by us andor by one of our wholly-own subsidiary or indirectly through our three consolidated joint venture companies.supply chain companies in China. These minority investments are reviewed for other than temporarythan-temporary declines in value on a quarterly basis. These investments are classified as other assets in the condensed consolidated balance sheets and accounted for under either the equity or costfair value method, depending on whether we have the ability to exercise significant influence over theirthe raw material company’s operations or financial decisions. We monitor our investments for impairment and record reductions in carrying value when events or changes in circumstances indicate that the carrying value may not be recoverable. Reasons for other than temporaryother-than-temporary declines in value include whether the related company would have insufficient cash flow to operate for the next twelve months, significant changes in the operating performance and changes in market conditions. As of September 30, 2017 and December 31, 2016, we did not maintain any direct investments under the cost method, our directOur minority investments under the equity method totaled $6.0 million and $6.6 million, respectively, and our indirect minority investments by our consolidated joint ventures totaled $4.2 million and $4.7 million, respectively. In aggregate, as of September 30, 2017March 31, 2024 and December 31, 2016 the total of our direct2023 totaled $13.2 million and indirect investments in the seven companies$12.5 million, respectively. Our minority investment under the equityfair value method as of March 31, 2024 and December 31, 2023 totaled $10.1$0.6 million and $11.3$0.6 million, respectively. See Note 7 for a discussion on the new fair value method investment.
52
ITEM 4. CONTROLS AND PROCEDURES
Evaluation of Disclosure Controls and Procedures
Our management, with the participation of our Chief Executive Officer and our Chief Financial Officer, evaluated the effectiveness of the design and operation of our disclosure controls and procedures as of the end of the
45
period covered by this quarterly report.Quarterly Report on Form 10-Q. Based upon this evaluation, our Chief Executive Officer and Chief Financial Officer have concluded that our disclosure controls and procedures as defined under Exchange Act Rules 13a-15(e) and 15d-15(e) were effective at the reasonable assurance level to ensure that information required to be disclosed in our Securities Exchange Act reports is recorded, processed, summarized and reported within the time periods specified by the Securities and Exchange Commission and is accumulated and communicated to management, including our Chief Executive Officer and our Chief Financial Officer, as appropriate to allow timely decisions regarding required disclosure.
Our disclosure controls and procedures include components of our internal control over financial reporting. Management’s assessment of the effectiveness of our internal control over financial reporting is expressed at the level of reasonable assurance because a control system, no matter how well designed and operated, can provide only reasonable assurance that the control system’s objectives will be met.
Changes in Internal Control Over Financial Reporting
There were no changes in our internal control over financial reporting madeidentified in management’s evaluation pursuant to Rules 13a or 15(d) of the nineExchange Act that occurred during the three months ended September 30, 2017March 31, 2024 that hashave materially affected, or isare reasonably likely to materially affect, our internal control over financial reporting.
4653
PART II. OTHER INFORMATION
From time to time we may be involved in judicial or administrative proceedings concerning matters arising in the ordinary course of business. We do not expect that any of these matters, individually or in the aggregate, will have a material adverse effect on our business, financial condition, cash flows or results of operation.
For ease of reference, we have divided these risks and uncertainties into the following general categories:
| I. |
|
| II. | Risks Related to Our Business and Operations; |
| III. | Risks |
| IV. | Risks Related to Our Financial Results and Capital Structure; |
| V. | Risks Related to Our Intellectual Property; and |
| VI. | Risks Related to Compliance, Environmental Regulations and Other Legal Matters. |
| I. | Summary Risk Factors |
| ● | We are subject to a number of unique legal and operational risks associated with our |
| ● | The PRC central government may intervene in or influence our PRC operations at any time and the rules and regulations in China can change quickly with little advance notice. |
| ● | Although the audit report included in this Annual Report is prepared by an independent registered public accounting firm who is currently inspected fully by the Public Company Accounting Oversight Board (the “PCAOB”), there is no guarantee that future audit reports will be prepared by an independent registered public accounting firm that is completely inspected by the PCAOB. |
| ● | Our NASDAQ stock price is volatile and our stock price could decline. Unpredictable fluctuations in our operating results, changes and events in our end markets and global trends cause volatility in our stock price. |
| ● | COVID-19 or other contagious diseases may affect our business operations and financial performance. Lack of supply of current vaccines and resistance by some to be vaccinated could prolong COVID-19. |
| ● | Global economic and political conditions, including trade tariffs, import-export restrictions, and other restrictions, may have a negative impact on our business and financial results. |
| ● | Changes in China’s political, social, regulatory or economic environments may affect our financial performance. |
| ● | The Chinese central government is increasingly aware of air pollution and other forms of environmental pollution and their reform efforts can impact our manufacturing, including intermittent mandatory shutdowns. Shutdowns or underutilizing our manufacturing facilities may result in declines in our gross margins. |
| ● | Enhanced trade tariffs, import restrictions, export restrictions, Chinese regulations or other trade barriers may materially harm our business. |
| ● | If China places restrictions on freight and transportation routes and on ports of entry and departure this could result in shipping delays or increased costs for shipping. |
| ● | Our international operations are exposed to potential adverse tax consequence in China. |
| ● | Our gross margin has fluctuated historically and may decline or increase due to several factors. Factors such as product mix, unit volume, yields and other manufacturing efficiencies can cause our gross margin to decrease or increase from quarter to quarter. |
54
| ● |
|
| ● | The terms of the private equity raised by Tongmei in China grant each investor a right of redemption if the IPO fails to pass the audit of the Shanghai Stock Exchange, is not approved by the CSRC or Tongmei cancels the IPO application. This could result in disgorging the cash that we raised from the Investors. |
| ● |
|
| ● | Difficulties in accurately estimating market demand could result in over-investing in inventory, equipment and capacity expansion or losing market share if we do not invest sufficiently. |
| ● | Attracting and retaining tier one customers requires that we succeed in our research and development programs. Customers establish difficult to meet product specifications regarding defect densities, surface flatness, diameter size and other specifications pushing the boundaries of material science. We may not achieve these specifications. |
| ● | We are subject to foreign exchange gains and losses that materially impact our condensed consolidated statements of operations. Because we are a global company we are exposed to changes and swings in foreign exchange, particularly when currencies experience periods of volatility. |
| ● | Joint venture raw material companies in China bring certain risks. |
| ● | We derive a significant portion of our |
| II. |
| Risks |
|
|
|
|
I. Risks Related to Our General Business
Silicon substrates (wafers) are significantly lower in cost compared to substrates made from specialty materials, such as those that we produce, and new silicon-based technologies could allow silicon basedenable silicon-based substrates to replace specialty material basedmaterial-based substrates for certain applications.
Historically silicon wafers or substrates are less expensive than specialty material substrates, such as those that we produce. Electronic circuit designers will generally consider silicon first and only turn to alternative materials if silicon cannot provide the required functionality in terms of power consumption, speed, wave lengths or other specifications. Beginning in 2011, certain applications that had previously used GaAs substrates, specifically the RF chip in mobile phones, adopted a new silicon-based technology called Silicon On Insulator,silicon on insulator, or SOI. SOI technology uses a silicon-insulator-silicon layered substrate in place of conventional silicon substrates in semiconductor manufacturing. SOI substrates cost less than GaAs substrates and, although their performance is not as robust as GaAs substrates in terms of power consumption, heat generation and speed, they became acceptable in mobile phonephones and other applications that were previously dominated by GaAs substrates. The adoption of SOI resulted in decreased GaAs wafer demand, and decreased revenue. If SOI or similarnew silicon-based technologies gain more widespread market acceptance, or are used in more applications, our sales of specialty material basedmaterial-based substrates could be reduced and our business and operating results could be significantly and adversely affected.
Our gross margin has fluctuated historically and may decline due to several factors.
Our gross profit margin has fluctuated from period to period as a result of increases or decreases in total revenue, unit volume, shifts in product mix, shifts in the cost of raw materials, shifts in product mix,costs related to the relocation of our gallium arsenide and germanium production lines, including costs related to hiring additional manufacturing employees at our new locations, tariffs imposed by the U.S. government, the introduction of new products, decreases in average selling prices for products, utilization of our manufacturing capacity, fluctuations in manufacturing yields and our ability to reduce product costs. These factors and other variables change from period to period and these fluctuations are expected to continue in the future. For example, in the third quarter of 2022 our gross margin was 42.0% but it dropped to 10.7% in the third quarter of 2023 as a result of several of these factors.
We do not control the prices at which our subsidiaries and other joint venture companies sell their
55
Our raw material products to third parties. However, because wecompanies experience selling price volatility and purchase price volatility in acquiring base materials. We consolidate the results of threetwo of these raw material companies, with our own,and any reduction in their gross margins could have a significant, adverse impact on our overall gross margins. One or more of our companies has in the past sold, and may in the future sell, raw materials at significantly reduced prices in order to gain volume sales or sales to new customers. In addition, at some points in the last two years, the market price of gallium dropped below our per unit inventory cost and we incurred an inventory write down under the lower of cost or net realizable value accounting rules. In such events, our gross margin may be adversely impacted. In addition, one of our
47
consolidated subsidiaries has in the past been subject to capacity constraints requiring it to source product from other third party suppliers in order to meet customer demand, resulting in decreased gross margin and adversely impacting our consolidated gross margin. This joint venture may in the future continue to experience such capacity constraints, causing our gross margin, and consequently our operating results, to be adversely impacted.
UnderutilizingShutdowns or underutilizing our manufacturing facilities may result in declines in our gross margins.
An important factor in our success is the extent to which we are able to utilize the available capacity in our manufacturing facilities. A number of factors and circumstances may reduce utilization rates, including periods of industry overcapacity, low levels of customer orders, operating inefficiencies, mechanical failures and disruption of operations due to expansion, power interruptions, fire, flood, or other natural disasters or calamities.calamities or government-ordered mandatory factory shutdowns, including as a result of the COVID-19 pandemic. Severe air pollution in Beijing can trigger mandatory factory shutdowns. For example, in the first quarter of 2018, over 300 manufacturing companies, including Tongmei, were intermittently shut down by the local government for a total of ten days from February 27 to March 31, due to severe air pollution. Further, we have increased capacity by adding two new sites and this could reduce our utilization rate and increase our depreciation charges. Because many portions of our manufacturing costs are relatively fixed, high utilization rates are critical to our gross margins and operating results. If we fail to achieve acceptable manufacturing volumes or experience product shipment delays, our results of operations will be negatively affected. During periods of decreased demand, we have underutilized our manufacturing lines. If we are unable to improve utilization levels at our facilities during periods of decreased demand and correctly manage capacity, the fixed expense levels will have an adverse effect on our business, financial condition and results of operations. Our gross profit margins have fluctuated from period to period, and these fluctuations are expected to continueFor example, in the future. Ourthree months ended September 30, 2023, our revenue dropped to $17.4 million and our gross profit margin had fluctuated from 17.1% forwas only 10.7%.
If we are unable to utilize the quarter ended December 31, 2015available capacity in our manufacturing facilities, we may need to 37.1%implement a restructuring plan, which could have a material adverse effect on our revenue, our results of operations and our financial condition. For example, in the quarter ended December 31, 2016.
In 2013, we concluded that incoming orders were insufficient and that we were significantly underutilizing our factory capacity. As a result, in February 2014, we announced a restructuring plan with respect to our wholly-owned subsidiary, Beijing Tongmei Xtal Technology Co, Ltd., orChina company, Tongmei, in order to better align manufacturing capacity with demand. Under the restructuring plan, we postedrecorded a charge of approximately $907,000 in the first quarter of 2014.
If we receive fewer customer orders than forecasted or if our customers delay or cancel orders, we may not be able to reduce our manufacturing costs in the short-term and our gross margins would be negatively affected. In addition, lead times required by our customers are shrinking, which reduces our ability to forecast orders and properly balance our capacity utilization.
Global economic and political conditions, including trade tariffs, import-export restrictions, and other restrictions, may have a negative impact on our business and financial results.
In September 2018, the Trump Administration announced a list of thousands of categories of goods that became subject to tariffs when imported into the United States from China. This pronouncement imposed tariffs on wafer substrates we imported into the United States. The initial tariff rate was 10% and subsequently was increased to 25%. Approximately 5% of our revenue derives from importing our wafers into the United States. In the first quarter of 2024 we paid approximately $65,000 in tariffs. In the years ended December 31, 2023, 2022 and 2021 we paid approximately $1.0 million, $3.3 million and $1.3 million, respectively, in tariffs. The future impact of tariffs and trade wars is uncertain.
The economic and political conditions between China and the United States, in our view, create an unstable business environment. The United States has restricted access by certain Chinese technology companies to items produced domestically and abroad from U.S. technology and software, which may impact our ability to grow our revenue. Trade restrictions against China have resulted in a greater determination within China to be self-sufficient and produce more goods domestically. Government agencies in China may be encouraging and supporting the founding of
56
new companies, the addition of new products in existing companies and more vertical integration within companies. These factors could negatively impact our sales in China.
Our operations and financial results depend on worldwide economic and political conditions and their impact on levels of business spending, which has deteriorated significantly in many countries and regions. Uncertainties in the political, financial and credit markets and U.S. financial system may cause our customers to postpone deliveries. The COVID-19 virus remains an additional cause of uncertainty. Additionally, U.S. bank failures may affect our customers. Delays in the placement of new orders and extended uncertainties may reduce future sales of our products and services. The revenue growth and profitability of our business depends on the overall demand for our substrates. Because the end users of our products are primarily large companies whose businesses fluctuate with general economic and business conditions, a softening of demand for products that use our substrates, caused by a weakening economy, may result in decreased revenue. Customers may find themselves facing excess inventory from earlier purchases and may defer or reconsider purchasing products due to the downturn in their business and in the general economy. For example, global business conditions deteriorated in the second half of 2022. In the second quarter of 2022, our revenue totaled $39.5 million. In the fourth quarter of 2022, our revenue declined to $26.8 million and in the third quarter of 2023, our revenue further declined to $17.4 million. If market conditions deteriorate, we may experience increased collection times and greater write-offs, either of which could have a material adverse effect on our profitability and our cash flow.
Future tightening of credit markets and concerns regarding the availability of credit may make it more difficult for our customers to raise capital, whether debt or equity, to finance their purchases of capital equipment or of the products we sell. Delays in our customers’ ability to obtain such financing, or the unavailability of such financing, would adversely affect our product sales and revenue and, therefore, harm our business and operating results. We cannot predict the timing, duration of or effect on our business of any future economic downturn or the timing or strength of any subsequent recovery.
COVID-19 or other contagious diseases may affect our business operations and financial performance.
The spread of COVID-19 impacted our operations and financial performance. The outbreak of COVID has triggered references to the SARS outbreak, which occurred in 2003 and affected our business operations. Any severe occurrence of an outbreak of a contagious disease such as COVID-19, SARS, Avian Flu or Ebola may cause us or the government to temporarily close our manufacturing operations in China. In January 2020, virtually all companies in China were ordered to remain closed after the traditional Lunar New Year holiday ended, including our subsidiaries in China. In December 2022, the PRC government ended its zero-COVID policy. If there is a renewed surge of the COVID-19 pandemic in cities in which our PRC subsidiaries and PRC joint ventures are located, the Chinese government may require these companies to close again. If one or more of our key suppliers is required to close for an extended period, we might not have enough raw material inventories to continue manufacturing operations. In addition, travel restrictions between China and the U.S. were disrupted and this impacted our efficiency. In the future, if our manufacturing operations were closed for a significant period or we experience difficulty in shipping our products, we could lose revenue and market share, which would depress our financial performance and could be difficult to recapture. If one of our key customers is required to close for an extended period, this may delay the placement of new orders. As a result, our revenue would decline.
If we have low product yields, the shipment of our products may be delayed and our product cost and operating results may be adversely impacted.
A critical factor in our product cost is yield. Our products are manufactured using complex crystal growth and wafer processing technologies, and the number of usable wafer substrates we produce can fluctuate as a result of many factors, including:
| ● |
| poor control of furnace temperature and pressure; |
| ● |
| impurities in the materials used; |
| ● |
| contamination of the manufacturing environment; |
57
| ● |
| quality control and inconsistency in quality levels; |
| ● |
| lack of automation and inconsistent processing requiring manual manufacturing steps; |
| ● |
| substrate breakage during the manufacturing process; and |
| ● |
| equipment failure, power outages or variations in the manufacturing process. |
A currentAn example where yield is of special concern is for our six-inch semi-conducting gallium arsenide substrates, which can be used for manufacturing opto-electronic devices in cell phones, enabling 3-D sensing. This
48
application requiresindustrial lasers and LED lighting. These applications require very low defect densities, also called etch pit densities,EPD, and our yields will be lower than the yields achieved for the same substrate when it will be used in other applications. If we are unable to achieve the targeted quantity of low defect density substrates, then our manufacturing costs would increase and our gross margins would be negatively impacted.
In addition, we may modify our process to meet a customer specification, but this can impact our yields. If our yields decrease, our revenue could decline if we are unable to produce products to our customers’ requirements. At the same time, our manufacturing costs could remain fixed, or could increase. Lower yields negatively impact our gross margin. We have experienced product shipment delays and difficulties in achieving acceptable yields on both new and older products, and such delays and poor yields have adversely affected our operating results. We may experience similar problems in the future and we cannot predict when they may occur, or their duration or severity.
If our manufacturing processes result in defects in our products making them unfit for use by our customers, our products would be rejected, resulting in compensation costs paid to our customers, and possible disqualification. This could lead to revenue loss and market share loss.
Risks existProblems incurred in relocating our raw material companies or our investment partners could result in a material adverse impact on our financial condition or results of operations.
We have invested in raw material companies in China that produce materials, including 99.99% pure gallium arsenide(4N Ga), high purity gallium (6N and 7N Ga), arsenic, germanium, germanium dioxide, pyrolytic boron nitride (pBN) crucibles and boron oxide (B2O3). We purchase a portion of the materials produced by these companies for our use and they sell the remainder of their production to third parties. We consolidate the companies in which we have a majority or controlling financial interest and employ equity accounting for the companies in which we have a smaller ownership interest. Several of these companies occupy space within larger facilities owned and/or operated by one of the other investment partners. Several of these partners are engaged in other manufacturing activities at or near the same facility. In some facilities, we share access to certain functions, including water, hazardous waste treatment or air quality treatment. If a partner in any of these ventures experiences problems with its operations, or deliberately withholds or disrupts services, disruptions in the operations of our companies could occur, having a material adverse effect on the financial condition and results of operation in these companies, and correspondingly on our financial condition or results of operations.
For example, since gallium is a by-product of aluminum, our raw gallium company in China, which is housed in and receives services from an affiliated aluminum plant, could generate lower production and shipments of gallium as a result of reduced services provided by the aluminum plant. Accordingly, in order to meet customer supply obligations, our supply chain may have to source materials from another independent third-party supplier, resulting in higher costs and reduced gross margin.
The ChineseChina central government has imposed,tightened control over hazardous chemicals and other hazardous materials. Further, the central government encourages employees to report to the appropriate regulatory agencies possible safety or environmental violations, but there may imposenot be actual violations. Regular use in the future, manufacturing restrictions and regulations that require usnormal course of business of hazardous chemicals or hazardous materials or a company’s failure to move partmeet the ever-tightening standards for control of hazardous chemicals or hazardous materials could result in orders to shut down permanently, fines or other severe measures. Any such orders directed at one of our manufacturingraw material companies could result in impairment charges if the company is forced to close its business, cease operations or incurs fines or operating losses, which would have a material adverse effect on our financial results.
58
Further, some of our raw material companies share facilities with our raw material investment partners. If either company is deemed to a location outsidehave violated applicable laws, rules or regulations governing the use, storage, discharge or disposal of the Beijing areahazardous chemicals, their operations could be adversely affected and we could be subject to substantial liability for clean-up efforts, personal injury, fines or temporarily ceasesuspension or limit manufacturing. Such relocation, or other restrictions on manufacturing,termination of operations. Employees working for these companies could materiallybring litigation against us even though we are not directly controlling those operations. While we would expect to defend ourselves vigorously in any litigation that is brought against us, litigation is inherently uncertain and adversely impactit is possible that our business, financial condition, results of operations or cash flows could be affected. Even if we are not deemed responsible for the actions of the raw material companies or investment partners, litigation could be costly, time consuming to defend and divert management attention; in addition, if we are deemed to be the most financially viable of the partners, plaintiffs may decide to pursue us for damages.
Unforeseen manufacturing issues and restrictions at the new manufacturing sites could occur.
In 2015, the Beijing city government announced its decision to move most of its offices to the Tongzhou district where our financial condition.
original manufacturing facility is currently located. The Beijing city government is expanding its offices into the area where our manufacturing facility is located and is in the process of movinghas moved thousands of government employees into this area. The Beijing citydistrict. To create room and upgrade the district, the government desires to upgrade this area and has applied pressure oninstructed virtually all existing manufacturing companies, including Tongmei, to relocate including us.all or some of their manufacturing lines. We are cooperating with the government and, in accordance with our relocation plan, are relocatingwere instructed to move our gallium arsenide production line to the city of Dingxing, which is approximately a 90 minute drive south of our current Beijing facility. In addition, we have acquired a smaller site in Kazuo, located in the province of Liaoning near the Inner Mongolia Autonomous Region and under the jurisdictionmanufacturing lines out of the prefecture-level city of Chaoyang, which will initially be used forarea.
Although the synthesis of raw galliumrelocation is completed and raw arsenic. Additional environmental permits, regulatory approvals and zoning conformance applicationswe are in process for both sites. Given the fluidity and ever-increasing review of environmental and regulatory ordinances in China, there can be no assurance that these matters will be completed smoothly or at all.
The relocation of our gallium arsenidevolume production line requires us to accurately execute our relocation plan. We expect that our major customers will want to examine and qualify the wafer substrates produced at the new site before placing volume purchase orders for products producedsites, unforeseen manufacturing issues and restrictions at the new site.sites could occur. Problems could occur as we add capacity or comply with strict guidelines as customers perform their qualifications. All of this will require us to continue to diligently address the many details that arise at each of our new sites. A failure to properly execute our relocation planaccomplish this could result in disruption to our production and have a material adverse impact on our revenue, and our results of operations and our financial condition. If we fail to meet the product qualification and volume requirements of a customer, we may lose sales to that customer. Our reputation may also be damaged. Any loss of sales could have a material adverse effect on our revenue, and our results of operations and financial condition. For example, product qualification of our low EPD wafer substrates for 3-D sensing applications will be required and a failure to satisfy all of the qualification standards could result in no orders for this opportunity.
We expect many of the key employees who are employed at our current manufacturing facility to relocate to the Dingxing site or commute under a program we will design. There can be no assurances that the key employees will relocate or that we will be able to hire qualified employees for our new manufacturing facility. A loss of key employees and our inability to hire qualified employees for our new manufacturing facility could disrupt our production, which could materially and adversely impact our results of operations and our financial condition.
We do not yet have comprehensive construction bids for further modifications to the existing buildings, the fourth building or third party estimates for the complete relocation costs, but we believe these costs will be in the range of $25 million to $35 million, which includes the amount we have already paid for the purchase of our new manufacturing facility. However, such costs could be more expensive, particularly as we are now contemplating a larger
49
facility that will enable us to rapidly add furnaces and other necessary production equipment to serve the anticipated demand for 3-D sensing VCSELs and other high-end applications.
The Chinese government has in the past imposed temporary restrictions on manufacturing facilities, such as the restrictions imposed on polluting factories for the 2008 Olympics and the 2014 Asian Pacific Economic Cooperation event. These restrictions included a shut-downshutdown of the transportation of materials and power plants to reduce air pollution. To reduce air pollution in Beijing, the Chinese government has sometimes limited the construction of new, or expansion of existing, facilities by manufacturing companies in the Beijing area.area or required mandatory factory shutdowns. For example, in the first quarter of 2018, over 300 manufacturing companies, including Tongmei, were intermittently shut down by the local government for a total of ten days from February 27 to March 31 due to severe air pollution. If the government applies similar restrictions to us or requires mandatory factory shutdowns in the future, then such restrictions or shutdowns could have an adverse impact on our results of operations and our financial condition. Our ability to supply current or new orders could be significantly impacted. Customers could then be required to purchase products from our competitors, causing our competitors to take market share from us.
In addition, from time to time, the Chinese government issues new regulations, which may require additional actions on our part to comply. On February 27, 2015, the China State Administration of Work Safety updated its list of hazardous substances. The previous list, which was published in 2002, did not restrict the materials that we use in our wafers. The new list added gallium arsenide. As a result of the newly published list, we were instructedrequired to obtain a permit to continue to manufacture our gallium arsenide substrate wafers. The Beijing municipal authority accepted our permit application in May 2015, but has not issued to us the requisite permit while we continue to make preparations in good faith to relocate our gallium arsenide production. If our application is denied in the future before we complete our relocation, then our gallium arsenide production could be disrupted, which could materially and adversely impact our results of operations and our financial condition.seek additional permits.
If any of our facilities are damaged by occurrences such as fire, explosion, power outage or natural disaster, we might not be able to manufacture our products.
The ongoing operation of our manufacturing and production facilities in China is critical to our ability to meet demand for our products. If we are not able to use all or a significant portion of our facilities for prolonged periods for any reason, we would not be able to manufacture products for our customers. For example, a fire or explosion caused by our use of combustible chemicals and high temperatures during our manufacturing processes or power interruption caused by severe weather conditions could render some or all of our facilities inoperable for an indefinite period of time. Actions outside of our control, such as earthquakes or other natural disasters, could also damage our facilities, rendering them inoperable. If we are unable to operate our facilities and manufacture our products, we would lose customers and revenue and our business would be harmed.
On the evening of March 15, 2017, an electrical short-circuit fire occurred at our Beijing manufacturing facility. The electrical power supply supporting 2-inch, 3-inch and 4-inch gallium arsenide and germanium crystal growth was damaged and production in that area was stopped. In addition, a waste water pipe was damaged resulting in a halt to wafer processing for four days until the pipe could be repaired. We were able to rotate key furnace hardware and use some of the 6-inch capacity for smaller diameter crystal growth production to mitigate the impact of the fire and resume production. If we are unable to recover from a fire or natural disaster, our business and operating results could be materially and adversely affected.
Demand for our products may decrease if demand for the end-user applications decrease or if manufacturers downstream in our supply chain experience difficulty manufacturing, marketing or selling their products.
Our products are used to produce components for electronic and opto-electronic products. Accordingly, demand for our products is subject to the demand for end-user applications, including certain consumer applications, which utilize our products, as well asproducts. For example, we have developed an 8-inch gallium arsenide wafer targeting an application in a consumer product. Our customer recently informed us that its end-user customer has cancelled its project. Production of the intended product was scheduled to begin in 2025. While there may be other end users, this particular cancellation is
59
the loss of a potentially high-volume sales opportunity. Other factors affecting the ability of the manufacturers downstream in our supply chain to introduce and market their products successfully, including:include:
| ● |
|
| ● | the competition such manufacturers face in their particular industries; |
| ● |
|
| ● | the technical, manufacturing, sales, marketing and management capabilities of such manufacturers; |
50
| ● |
| the financial and other resources of such manufacturers; and |
| ● |
| the inability of such manufacturers to sell their products if they infringe |
If demand for the end-user applications for which our products are used decreases, or if manufacturers downstream in our supply chain are unable to develop, market and sell their products, demand for our products will decrease. For example, during 2019 widespread political and economic instability and trade war concerns resulted in a general slowdown and our revenue decreased significantly. Additionally, in the second half of 2016, manufacturers producing and selling passive optical network devices known as EPONs and GPONs experienced a slowdown in demand resulting in surplus inventory on hand. The slowdown persisted until late in 2017. This resulted in a slowdown of sales of our InP substrates.substrates used in the PON market. More recently, global business conditions deteriorated, beginning in the second half of 2022. In general, many companies purchased more inventory than needed, in part due to fears of shortages resulting from COVID. In the second quarter of 2022, our revenue totaled $39.5 million. In the fourth quarter of 2022 our revenue declined to $26.8 million, in the second quarter of 2023, our revenue declined to $18.6 million and in the third quarter of 2023, our revenue further declined to $17.4 million. We expect similar cycles of strong demand and thenfollowed by lower demand will occur for various InP, GaAs or Ge substrates in the future.
Our revenue, gross margins and profitabilityfinancial performance can be hurt if the average sales pricethere are unfavorable financial results in any of the variousour raw materials in our partially owned companies decreases.material companies.
Although theThe raw material companies in our vertically integrated supply chain have historically made a positive contribution to our financial performance, theperformance. However, if there are unfavorable changes in revenue, average selling prices, for manygross margins or operating expenses in one or more of the raw materials produced have continued to decline and have hadconsolidated companies, then this can result in a negative impact on our recentconsolidated revenue, gross margin and profitability. If the companies are accounted for under the equity method, then these changes can result in a reduction in Equity in Income of Unconsolidated Joint Venture Companies. In 2023 and 2022, the companies accounted for under the equity method of accounting contributed a gain of $1.9 million and $6.0 million, respectively, to our condensed consolidated financial performance.statements. In particular,2023, the average selling prices for 4N gallium and for germanium have been driven down by oversupply and, intotal includes impairment charges of $1.9 million. The last time the second half of 2015, 2016 and continuing into 2017, negatively impacted our financial results. In 2016, the seven companies accounted for under the equity method of accounting contributed a loss was 2019 with a loss of $2.0 million to our financial statements. Low selling prices for raw materials continue and will have a detrimental impact on our 2017 financial performance. There can be no assurance that the oversupply will be corrected by the market. Further, in several quarters over the past two years, one of our consolidated subsidiaries incurred a lower of cost or net realizable value inventory write down, which negatively impacted our consolidated gross margin. In the first quarter of 2017 we incurred an impairment charge of $313,000 against one of our partially owned suppliers, writing down our investment to zero value. If the pricing environment remains stressed by oversupply and our joint venture companies cannot reduce their production cost, then the reduced average selling prices of the raw materials produced by our joint venture companies will have a continuing adverse impact on our revenue, gross margins and net profit.$1.9 million.
Problems incurred in our 10 partially owned joint venture companies or investment partners could result in a material adverse impact on our financial condition or results of operations.
We have invested in 10 subsidiaries and joint venture companies in China that produce materials including 99.99% pure gallium (4N Ga), high purity gallium (7N Ga), arsenic, germanium, germanium dioxide, pyrolytic boron nitride (pBN) crucibles and boron oxide (B2O3). We purchase a portion of the materials produced by these companies for our use and they sell the remainder of their production to third parties. Our ownership and the ownership held by our consolidated subsidiaries in these entities ranges from 20% to 83%. We consolidate the companies in which we have a majority or controlling financial interest and employ equity accounting for the companies in which we have a smaller ownership interest. Several of these companies occupy space within larger facilities owned and/or operated by one of the other venture partners. Several of these venture partners are engaged in other manufacturing activities at or near the same facility. In some facilities, we share access to certain functions, including water, hazardous waste treatment or air quality treatment. If any of our joint venture partners in any of these ventures experiences problems with its operations, disruptions of our joint venture operations could result, having a material adverse effect on the financial condition and results of operation of our joint venture companies, and correspondingly on our financial condition or results of operations. For example, since gallium is a by-product of aluminum, our raw gallium joint venture in China, which is housed in and receives services from an affiliated aluminum plant, could generate lower production of gallium as a result of reduced services provided by the aluminum plant. Accordingly, in order to meet customer supply obligations, our supply chain may have to source materials from another independent third party supplier, resulting in reduced gross margin.
In addition, if any of our joint ventures or venture partners with which our joint ventures share facilities is deemed to have violated applicable laws, rules or regulations governing the use, storage, discharge or disposal of hazardous chemicals during manufacturing, research and development or sales demonstrations, the operations of our
51
joint ventures could be adversely affected and we could be subject to substantial liability for clean-up efforts, personal injury and fines or suspension or cessation of our joint venture operations as a result of the actions of the joint ventures or other venture partners. Employees working for our joint ventures or any of the other venture partners could bring litigation against us as a result of actions taken at the joint venture or venture partner facilities, even though we are not directly controlling the operations, including actions for exposure to chemicals or other hazardous materials at the facilities of our joint ventures or the facilities of any venture partner that are shared by our joint ventures. While we would expect to defend ourselves vigorously in any litigation that is brought against us, litigation is inherently uncertain and it is possible that our business, financial condition, results of operations or cash flows could be affected. Even if we are not deemed responsible for the actions of the joint ventures or venture partners, litigation could be costly, time consuming to defend and divert management attention; in addition, if we are deemed to be the most financially viable of the partners, plaintiffs may decide to pursue us for damages.
Since all of our partially owned companies reside in China, their activities could subject us to a number of risks associated with conducting operations internationally, including:
|
|
|
|
|
|
|
|
|
|
|
|
|
|
|
|
Intense competition in the markets for our products could prevent us from increasing revenue and sustainingachieving profitability.
The markets for our products are intensely competitive. We face competition for our wafer substrate products from other manufacturers of substrates, such as Sumitomo, JX, Freiberger, JX, Umicore, SumitomoVital and CCTC, and from companies, such as Qorvo and Skyworks, that are actively considering alternative materials to GaAs and marketing semiconductor devices using these alternative materials. We believe that at least two of our major competitors are shipping high volumes of GaAs substrates manufactured using a technique similar to our VGF technology. Other competitors may develop and begin using similar technology. Sumitomo and JX also compete with us in the InP market. If we are unable to compete effectively, our revenue may not increasedecrease and we may not achievemaintain profitability. We face many competitors that have a number of significant advantages over us, including:
| ● |
| greater name recognition and market share in the business; |
60
52
| ● |
| significantly greater financial, technical and marketing resources. |
Our competitors could develop new or enhanced products that are more effective than our products.
The level and intensity of competition has increased over the past years and we expect competition to continue to increase in the future. Competitive pressures have resulted in reductions in the prices of our products, and continued or increased competition could reduce our market share, require us to further reduce the prices of our products, affect our ability to recover costs and result in reduced gross margins.margins and profitability.
In addition, new competitors have and may continue to emerge, such as a crystal growing company established by a former employee in China that is supplying semi-conducting GaAs wafers to the LED market. Competition from sources such as this could increase, particularly if these competitors are able to obtain large capital investments. Further, recent trade tensions between China and the United States have resulted in a greater determination within China to be self-sufficient and produce more goods domestically. This could result in the formation of new competitors that would compete against the Company and adversely affect our financial results.
Cyber-attacks, system security risks and data protection issues could disrupt our internal operations and cause a reduction in revenue, increase in expenses, negatively impact our results of operation or result in other adverse consequences.
Like most technology companies, we could be targeted in cyber-attacks. We face a risk that experienced computer programmers and hackers may be able to penetrate our network security and misappropriate or compromise our confidential and proprietary information, potentially without being detected. Computer programmers and hackers also may be able to develop and deploy viruses, worms, and other malicious software programs that attack our information technology infrastructure and demand a ransom payment. The costs to us to eliminate or alleviate cyber or other security problems, bugs, viruses, worms, malicious software programs and security vulnerabilities could be significant, and our efforts to address these problems may not be successful and could result in interruptions and delays that may impede our sales, manufacturing, distribution, accounting or other critical functions.
Breaches of our security measures could create system disruptions or cause shutdowns or result in the accidental loss, inadvertent disclosure or unapproved dissemination of proprietary information or sensitive or confidential data about us. Cyber-attacks could use fraud, trickery or other forms of deception. A cyber-attack could expose us to a risk of loss or misuse of information, result in litigation and potential liability, damage our reputation or otherwise harm our business. In addition, the cost and operational consequences of implementing further data protection measures could be significant.
Portions of our information technology infrastructure might also experience interruptions, delays or cessations of service or produce errors in connection with systems integration or migration work that takes place from time to time, which may have a material impact on our business. We may not be successful in implementing new systems and transitioning data, which could cause business disruptions and be more expensive, time consuming, disruptive and resource-intensive than originally anticipated. Such disruptions could adversely impact our ability to fulfill orders and interrupt other processes. Delayed sales, lower margins or lost customers could adversely affect our financial results and reputation.
The average selling prices of our substrates may decline over relatively short periods, which may reduce our revenue and gross margins.
Since the market for our products is characterized by declining average selling prices resulting from various factors, such as increased competition, overcapacity, the introduction of new products and decreased sales of products incorporating our products, the average selling prices for our products may decline over relatively short time periods. We
61
have in the past experienced, and in the future may experience, substantial period-to-period fluctuations in operating results due to declining average selling prices. For example, for the year ended December 31, 2016,In certain years, we have experienced an average selling price decline of our substrate selling prices of approximately 5% to 10%, depending on the substrate product. It is possible that the pace of the decline of average selling prices could accelerate beyond these levels for certain products in a commoditizing market. We anticipate that average selling prices willmay decrease in the future in response to the unstable demand environment, product introductionsprice reductions by competitors, or us, or by other factors, including pricing pressures from significant customers. When our average selling prices decline, our revenue and gross profit decline, unless we are able to sell more products or reduce the cost to manufacture our products. We generally attempt to combat an average selling price decline by improving yields and manufacturing efficiencies and working to reduce the costs of our raw materials and of manufacturing our products. We have in the past, and may in the future, experience declining selling prices, which could negatively impact our revenues, gross profits and financial results. We, therefore,also need to sell our current products in increasing volumes to offset any decline in their average selling prices, and introduce new products, which we may not be able to do, or do on a timely basis.
We may be unableIn order to remain competitive, we must continually improve our processes, work to reduce the cost of manufacturing our products sufficiently to enable us to compete with others.and improve our yields and manufacturing efficiencies. Our cost reduction efforts may not allow us to keep pace with competitive pricing pressures andwhich could adversely affect our margins. In order to remain competitive, we must continually work to reduce the cost of manufacturing our products. There is no assurance that any changes effected by us will result in sufficient cost reductions to allow us to reduce the price of our products to remain competitive or improve our gross margins.
The loss of one or more of our tier one substrate customers would significantly hurt our operating results.
From time to time, sales to one or more of our tier one customers individually represent more than 10% of our revenue and if we were to lose a major customer the loss would negatively impact our revenue. Our customers are not obligated to purchase a specified quantity of our products or to provide us with binding forecasts of product purchases. In addition, our customers may reduce, delay or cancel orders. In the past, we have experienced a slowdown in bookings, significant push-outs and cancellation of orders from customers. If we lose a major customer or if a customer cancels, reduces or delays orders, our revenue would decline. In addition, customers that have accounted for significant revenue in the past may not continue to generate revenue for us in any future period. Any loss of customers or any delay in scheduled shipments of our products could cause revenue to fall below our expectations and the expectations of market analysts or investors, causing our stock price to decline.
We have made and may continue to make strategic investments in raw materials suppliers, which may not be successful and may result in the loss of all or part of our investment.
We have made direct investments or investments through our subsidiaries in raw material suppliers in China, which provide us with opportunities to gain supplies of key raw materials that are important to our substrate business. These affiliates each have a market beyond that provided by us. We may not have significant influence over every one of these companies and in some we have made only a strategic, minority investment. We may not be successful in achieving the financial, technological or commercial advantage upon which any given investment is premised, and we could end up losing all or part of our investment which would have a negative impact on our results of operations. In the first quarter of 2019, we incurred an impairment charge of $1.1 million for a germanium materials company in China in which we had a 25% ownership interest, writing down our investment to zero value. During the second quarter of 2023, one of our equity investments assessed one of its equity investments was fully impaired, leading to a $754,000 impairment charge in our financial results for the second quarter of 2023. In the fourth quarter of 2023, we divested another equity investment, incurring a net impairment charge of $1.1 million. A significant decline in the selling prices of raw materials began in 2015 and weakened some of these companies and their losses negatively impacted our financial results for several years. Further, the increasing concern and restrictions in China of hazardous chemicals and other hazardous materials could result in orders to shut down permanently, fines or other severe measures. Any such orders directed at one of our joint venture companies could result in impairment charges if the company is forced to close its business, cease operations or incurs fines, or operating losses, which would have a material adverse effect on our financial results.
62
If any of our facilities are damaged by occurrences such as fire, explosion, power outage or natural disaster, we might not be able to manufacture our products.
The ongoing operation of our manufacturing and production facilities is critical to our ability to meet demand for our products. If we are not able to use all or a significant portion of our facilities for prolonged periods for any reason, we would not be able to manufacture products for our customers. For example, a fire or explosion caused by our use of combustible chemicals, high furnace temperatures or, in the case of InP, high pressure during our manufacturing processes could render some of our facilities inoperable for an indefinite period of time. Actions outside of our control, such as earthquakes or other natural disasters, could also damage our facilities, rendering them inoperable. If we are unable to operate our facilities and manufacture our products, we would lose customers and revenue and our business would be harmed.
On the evening of March 15, 2017, an electrical short-circuit fire occurred at our Beijing manufacturing facility. The electrical power supply supporting 2-inch, 3-inch and 4-inch gallium arsenide and germanium crystal growth was damaged and production in that area was stopped. In addition, a wastewater pipe was damaged resulting in a halt to wafer processing for four days until the pipe could be repaired. We were able to rotate key furnace hardware and use some of the 6-inch capacity for smaller diameter crystal growth production to mitigate the impact of the fire and resume production. If we are unable to recover from a fire or natural disaster, our business and operating results could be materially and adversely affected.
Defects in our products could diminish demand for our products.
Our wafer products are complex and may contain defects, including defects resulting from impurities inherent in our raw materials or inconsistencies in our manufacturing processes. We have experienced quality control problems with some of our products, which caused customers to return products to us, reduce orders for our products, or both. If we experience quality control problems, or experience these or other manufacturing problems, in new products, customers may return product for credit, cancel or reduce orders or purchase products from our competitors and wecompetitors. We may be unable to maintain or increase sales to our customers and sales of our products could decline. Defects in our products could cause us to incur higher manufacturing costs and suffer product returns and additional service expenses, all of which could adversely impact our operating results. If new products developed by us contain defects when released, our customers may be dissatisfied and we may suffer negative publicity or customer claims against us, lose sales or experience delays in market acceptance of our new products.
53
Our substrate products have a long qualification cycle that makes it difficult to forecast our revenue.revenue from new customers or for new products sold to existing customers.
New customers typically place orders with us for our substrate products three months to a year or more after our initial contact with them. In addition, existing customers may be slow to purchase our products. The sale of our products is subject to our customers’ lengthy internal evaluation and approvalqualification processes. During this time, we may incur substantial expenses and expend sales,selling, marketing and management efforts while the customers evaluate our products. These expenditures may not result in sales of our products. If we do not achieve anticipated sales in a period as expected, we may experience an unplanned shortfall in our revenue. As a result, our operating results would be adversely affected. In addition, if we fail to meet the product qualification requirements of the customer, we may not have another opportunity to sell that product to that customer for many months or even years. In the current competitive climate, the average qualification and sales cycle for our products has lengthened even further and is expected to continue to make it difficult for us to forecast our future sales accurately. We anticipate that sales of any future substrate products will also have lengthy qualification periods and will, therefore, be subject to risks substantially similar to those inherent in the lengthy sales cycles of our current substrate products.
The loss of one or more of our key substrate customers would significantly hurt our operating results.
From time to time, sales to one or more of our customers individually represent more than 10% of our revenue and if we were to lose a major customer, the loss would negatively impact our revenue. Most of our customers are not obligated to purchase a specified quantity of our products or to provide us with binding forecasts of product purchases. In addition, our customers may reduce, delay or cancel orders at any time without any significant penalty. In the past, we have experienced a slowdown in bookings, significant push-outs and cancellation of orders from customers. If we lose a major customer or if a customer cancels, reduces or delays orders, or reduces the prices paid for our products, our revenue would decline. In addition, customers that have accounted for significant revenue in the past may not continue to generate revenue for us in any future period. Any loss of customers or any delay in scheduled shipments of our products could cause revenue to fall below our expectations and the expectations of market analysts or investors, causing our stock price to decline.
The cyclical nature of the semiconductor industry may limit our ability to maintain or increase net sales and operating results during industry downturns.
The semiconductor industry is highly cyclical and periodically experiences significant economic downturns characterized by diminished product demand, resulting in production overcapacity and excess inventory in the markets we serve. A downturn can result in lower unit volumes and rapid erosion of average selling prices. The semiconductor
63
industry has experienced significant downturns, often in connection with, or in anticipation of, maturing product cycles of both semiconductor companies’ and their customers’ products or a decline in general economic conditions. This may adversely affect our results of operations and the value of our business.
A recent example of a cyclical downcycle took shape in the second half of 2022 and has continued into 2024. Early in its history, COVID began to impact supply chains resulting in shortages. As a result, in 2021 and into 2022 almost all companies purchased more inventory than they needed as a safety precaution. In the second half of 2022 companies began to realize they were holding too much inventory and entered into the “inventory correction” period. Our consolidated revenue had reached $39.7 million in the first quarter of 2022. In the third quarter of 2023, our revenue had declined to $17.4 million.
Our continuing business depends in significant part upon manufacturers of electronic and opto-electronic compound semiconductor devices, as well as the current and anticipated market demand for these devices and products using these devices. As a supplier to the compound semiconductor industry, we are subject to the business cycles that characterize the industry. The timing, length and volatility of these cycles are difficult to predict. The compound semiconductor industry has historically been cyclical due to sudden changes in demand, the amount of manufacturing capacity and changes in the technology employed in compound semiconductors. The rate of changes in demand, including end demand, is high, and the effect of these changes upon us occurs quickly, exacerbating the volatility of these cycles. These changes have affected the timing and amounts of customers’ purchases and investments in new technology. These industry cycles create pressure on our revenue, gross margin and net income.
Our industry has in the past experienced periods of oversupply and that has resulted in significantly reduced prices for compound semiconductor devices and components, including our products, both as a result of general economic changes and overcapacity. When this occurs our operating results and financial condition are adversely affected. Oversupply causes greater price competition and can cause our revenue, gross margins and net income to decline. During periods of weak demand, customers typically reduce purchases, delay delivery of products and/or cancel orders of component parts such asfor our products. Further orderOrder cancellations, reductions in order size or delays in orders
54
could occur and would materially adversely affect our business and results of operations. Actions to reduce our costs may be insufficient to align our structure with prevailing business conditions. We may be required to undertake additional cost-cutting measures, and may be unable to invest in marketing, research and development and engineering at the levels we believe are necessary to maintain our competitive position. Our failure to make these investments could seriously harm our business.
We base our planned operating expenses in part on our expectations of future revenue, and aA significant portion of our operating expense isand manufacturing costs are relatively fixed. If revenue for a particular quarter is lower than we expect, we likely will be unable to proportionately reduce our operating expenses or fixed manufacturing costs for that quarter, which would harm our operating results.
If we do not successfully develop new product features and improvements and new products tothat respond to rapidly changing customer requirements, our ability to generate revenue, obtain new customers, and retain existing customers may suffer.
Our success depends on our ability to offer new product features, improved performance characteristics and new products, includingsuch as larger diameter substrates, low defect density substrates, thicker or thinner substrates, substrates with extreme surface flatness specifications, substrates that are manufactured with a doped crystal growth process or substrates that incorporate leading technology and other technological advances. In addition,This is an ongoing iterative research and development process performed by our newChina team in collaboration with our manufacturing managers. New products must meet customer needs and compete effectively on quality, price and performance. The markets for our products are characterized by rapid technological change, changing customer needs and evolving industry standards. If our competitors introduce products employing new technologies or performance characteristics, our existing products could become obsolete and unmarketable. During the past few years,Over time, we have seen our competitors selling more substrates manufactured using a crystal growth technology similar to ours, which has eroded our technological differentiation.
The development of new product features, improved performance characteristics and new products can be a highly complex process, and we may experience delays in developing and introducing new products.them. Any significant delay could cause us to fail to timely introduce and gain market acceptance of new products. Further, the costs involved in researching, developing and engineering new products could be greater than anticipated. If we fail to offer new products
64
or product enhancements or fail to achieve higher quality products, we may not generate sufficient revenue to offset our development costs and other expenses or meet our customers’ requirements.
We have made and may continue to make strategic investments in raw materials suppliers, which may not be successful and may result in the loss of all or part of our investment.
We have made direct investments or investments through our subsidiaries in ten raw material suppliers in China, which provide us with opportunities to gain supplies of key raw materials that are important to our substrate business. These affiliates each have a market beyond that provided by us. We do not have influence over all of these companies and in some we have made only a strategic, minority investment. We may not be successful in achieving the financial, technological or commercial advantage upon which any given investment is premised, and we could end up losing all or part of our investment. As a result of sharp declines in the average selling prices of raw materials in 2016 the seven companies accounted for under the equity method of accounting contributed a loss of $2.0 million to our financial statements. In the first quarter of 2017, we incurred an impairment charge of $313,000 against one of our partially owned suppliers, writing down our investment to zero value.
We purchase critical raw materials and parts for our equipment from single or limited sources, and could lose sales if these sources fail to fill our needs.
We depend on a limited number of suppliers for certain raw materials, components and equipment used in manufacturing our products, including key materials such as quartz tubing, and polishing solutions. Although several of these raw materials are purchased from suppliers in which we hold an ownership interest, weWe generally purchase these materials through standard purchase orders and not pursuant to long-term supply contracts, and no supplier guarantees supply of raw materials or equipment to us. If we lose any of our key suppliers, our manufacturing efforts could be significantly hampered and we could be prevented from timely producing and delivering products to our customers. Prior to investing in our subsidiaries and joint ventures, we sometimesWe have experienced delays obtaining critical raw materials and spare parts, including gallium, and we could experience such delays again in the future due to shortages of materials or
55
for other reasons and may be unable to obtain an adequate supply of materials.reasons. Delays in receiving equipment or materials could result in higher costs and cause us to delay or reduce production of our products. If we have to delay or reduce production, we could fail to meet customer delivery schedules and our revenue and operating results could suffer.
We may not be able to identify or form additional complementary raw material joint ventures.
Although we are not currently pursuing additional joint ventures, in the future, weWe might invest in additional joint venturesventure companies in order to remain competitive in our marketplace and ensure a supply of critical raw materials. However, we may not be able to identify additional complementary joint venture opportunities or, even once opportunities are identified, we may not be able to reach agreement on the terms of the business venture with the other investment partners. AdditionalFurther, geopolitical tensions and trade wars could result in government agencies blocking such new joint ventures. New joint ventures could require cash investments or cause us to incur contingentadditional liabilities or other expenses, any of which could adversely affect our financial condition and operating results.
If China places restrictions on freight and transportation routes and on port of entry and departure this could result in shipping delays or increased costs for shipping.
In August 2015, there was an explosion at the Port of Tianjin, China. As a result of this incident the government placed restrictions on importing certain materials and on freight routes used to transport these materials. We experienced some modest disruption from these restrictions. If the government were to place additional restrictions on the transportation of materials, then our ability to transport our raw materials or products could be limited and result in bottlenecks at shipping ports, affecting our ability to deliver products to our customers. During periods of such restrictions, we may increase our stock of critical materials (such as arsenic, gallium, and other chemicals) for use during the period that these restrictions are likely to last, which will increase our use of cash and increase our inventory level. Any of these restrictions could materially and adversely impact our results of operations and our financial condition.
The financial condition of our customers may affect their ability to pay amounts owed to us.
ManySome of our customers may be undercapitalized and cope with cash flow issues. Because of competitive market conditions, we frequentlymay grant our customers extended payment terms when selling products to them. Subsequent to our shipping a product,fulfilling an order, some customers have been unable to make payments when due, reducing our cash balances and causing us to incur charges to allow for a possibility that some accounts might not be paid. Customers may also be forcedWe observed an increase in our accounts receivable in the first quarter of 2020 and believe this has resulted from work stoppages, shelter-in-place orders and general cautiousness due to the COVID-19 pandemic. In the past, we have had some customers file for bankruptcy. If our customers do not pay their accountsamounts owed to us then we will be required to incur charges that would reduce our earnings.
We depend on the continuing efforts of our senior management team and other key personnel. If we lose members of our senior management team or other key personnel, or are unable to successfully recruit and train qualified personnel, our ability to manufacture and sell our products could be harmed.
Our future success depends on the continuing services of members of our senior management team and other key personnel. Our industry is characterized by high demand and intense competition for talent, and the turnover rate can be high. We compete for qualified management and other personnel with other specialty material companies and semiconductor companies. Our employees could leave our companythe Company with little or no prior notice and would be free to work for a competitor. If one or more of our senior executives or other key personnel were unable or unwilling to continue in their present positions, we may not be able to replace them easily or at all, and other senior management may be required to divert attention from other aspects of the business. The loss of any of these individuals or our ability to attract or retain qualified personnel could adversely affect our business.
Our results of operations may suffer if we do not effectively manage our inventory.
We must manage our inventory of raw materials, work-in-processwork in process and finished goods effectively to meet changing customer requirements, while keeping inventory costs down and improving gross margins. Although we seek
65
to maintain sufficient inventory levels of certain materials to guard against interruptions in supply and to meet our near term needs, and have to date been able to obtain sufficient supplies of materials in a timely manner, in the future, we may experience shortages of certain key materials. Alternatively, a sudden decline in demand could result in holding too much inventory which occurred in the second half of 2022. Some of our products and supplies have in the past, and may in the future,
56
become obsolete while in inventory due to changing customer specifications, or become excess inventory due to decreased demand for our products and an inability to sell the inventory within a foreseeable period. This would result in charges that reduce our gross profit and gross margin. Furthermore, if market prices drop below the prices at which we value inventory, we maywould need to take a charge for a reduction in inventory values in accordance with the lower of cost or net realizable value valuation rule. We have in the past had to take inventory valuation and impairment charges. Any future unexpected changes in demand or increases in costs of production that cause us to take additional charges for un-saleable, obsolete or excess inventory, or to reduce inventory values, couldwould adversely affect our results of operations.
Financial market volatility and adverse changes in the domestic and global economic environment could have a significant adverse impact on our business, financial condition and operating results.
We are subject to the risks arising from adverse changes and uncertainty in domestic and global economies. Uncertain global economic and political conditions and low or negative growth in China, Europe and the United States, along with volatility in the financial markets, increasing national debt and fiscal concerns in various regions, pose challenges to our industry. Currently China’s economy is slowing and this could impact our financial performance. Although we remain well-capitalized, the cost and availability of funds may be adversely affected by illiquid credit markets. Turbulence in U.S. and international markets and economies may adversely affect our liquidity, financial condition and profitability. Another severe or prolonged economic downturn could result in a variety of risks to our business, including:
|
|
|
|
|
|
|
|
|
|
In the past we experienced delays in customer purchasing decisions and disruptions in normal volume of customer orders that we believe were in part due to the uncertainties in the global economy and an adverse impact on consumer spending. During challenging and uncertain economic times and in tight credit markets, many customers delay or reduce technology purchases. Should similar events occur again, our business and operating results could be significantly and adversely affected.
Global economic and political conditions may have an impact on our business and financial condition in ways that we currently cannot predict.
Our operations and financial results depend on worldwide economic and political conditions and their impact on levels of business spending, which had deteriorated significantly in many countries and regions in previous years. Uncertainties in the financial and credit markets may cause our customers to postpone deliveries. Delays in the placement of new orders and extended uncertainties may reduce future sales of our products and services. The revenue growth and profitability of our business depends on the overall demand for our substrates, and we are particularly dependent on the market conditions for the wireless, solid‑state illumination, fiber optics and telecommunications industries. Because the end users of our products are primarily large companies whose businesses fluctuate with general economic and business conditions, a softening of demand for products that use our substrates, caused by a weakening economy, may result in decreased revenue. Customers may find themselves facing excess inventory from earlier purchases, and may defer or reconsider purchasing products due to the downturn in their business and in the general economy. If market conditions deteriorate, we may experience increased collection times and greater write-offs, either of which could have a material adverse effect on our profitability and our cash flow.
57
Future tightening of credit markets and concerns regarding the availability of credit may make it more difficult for our customers to raise capital, whether debt or equity, to finance their purchases of capital equipment or of the products we sell. Delays in our customers’ ability to obtain such financing, or the unavailability of such financing, would adversely affect our product sales and revenues and therefore harm our business and operating results. We cannot predict the timing, duration of or effect on our business of any future economic downturn or the timing or strength of any subsequent recovery.
The effect of terrorist threats and actions on the general economy could decrease our revenue.
Developed countriesCountries such as the United States and China continue to be on alert for terrorist activity. The potential near-near and long-term impact terrorist activities may have in regards to our suppliers, customers and markets for our products and the economy is uncertain. There may be embargos of ports or products, or destruction of shipments or our facilities, or attacks that affect our personnel. There may be other potentially adverse effects on our operating results due to significant events that we cannot foresee. Since we perform all of our manufacturing operations in China, terrorist activity or threats against U.S.‑owned enterprises are a particular concern to us.
II
| III. | Risks Related to International Aspects of Our Business |
The Chinese central government is increasingly aware of air pollution and other forms of environmental pollution and their reform efforts can impact our manufacturing, including intermittent mandatory shutdowns.
The Chinese central government is demonstrating strong leadership to International Aspectsimprove air quality and reduce environmental pollution. These efforts have impacted manufacturing companies through mandatory shutdowns, increased inspections and regulatory reforms. In the fourth quarter of 2017, many manufacturing companies in the greater Beijing area, including Tongmei, were instructed by the local government to cease most manufacturing for several days until the air quality improved. In the first quarter of 2018, from February 27 to March 31 over 300 manufacturing companies, including Tongmei, were again intermittently shut down by the local government for a total of ten days, or 30 percent of the remaining calendar days, due to severe air pollution. Our Business
We derive a significant portion ofshipments were delayed and our revenue from international sales, and our ability to sustain and increase our international sales involves significant risks.
Our revenue growth depends in part onfor the expansion of our international sales and operations. Typically over 80% of our revenue is from international sales.quarter was negatively impacted. We expect that salesmandatory factory shutdowns may occur in the future. If the frequency of such shutdowns increases, especially at the end of a quarter, or if the total number of days of shutdowns prevents us from producing enough wafers to ship, then these shutdowns will have a material adverse effect on our manufacturing output, revenue and factory utilization. Each of our raw material supply chain companies could also be impacted by environmental related orders from the central government.
Although we are a Delaware corporation and are neither a PRC operating company nor do we conduct our operations in China through the use of VIEs, in the event we inadvertently concluded that we do not require any permissions or approvals from the CSRC or other PRC central government authorities to complete a public offering of securities in the U.S. or applicable laws, regulations, or interpretations change, we may be required to obtain such permissions or approvals to complete such a public offering of securities.
We are a Delaware corporation and are neither a PRC operating company nor do we conduct our operations in China through the use of VIEs. All of our products are manufactured in the PRC by our PRC subsidiaries and PRC joint ventures. We believe that we do not require any permissions or approvals from the CSRC or other PRC central government authorities to complete a public offering of securities in the U.S. because we are a Delaware corporation with our principal corporate office in Fremont, California and the PRC laws and regulations that govern the listing of securities on a U.S. securities exchange apply to PRC companies. However, in the event that we inadvertently concluded that such permission or approvals are not required or applicable laws, regulations, or interpretations change and we are required to obtain such permissions or approvals in the future and we fail to obtain such permissions or approvals, then we may not be able to complete a public offering of securities in the U.S. We may also be pressured to delist our
66
securities, which would force the holders to sell these securities and could result in a material adverse effect on the value of these securities. We may face sanctions by the CSRC or other PRC central government authorities or pressure from the PRC government in various business matters for failure to obtain such permissions or approvals. These sanctions or pressure may include fines and penalties on our operations in China, limitations on our operating privileges in China, delays in or restrictions on the repatriation of the proceeds from a public offering of securities in the U.S. into the PRC, restrictions on or prohibition of the payments or remittance of dividends by our subsidiaries in China, or other actions that could have a material and adverse effect on our business, financial condition, results of operations, reputation and prospects, as well as the trading price of our common stock.
The PRC central government may intervene in or influence our PRC operations at any time and the rules and regulations in China can change quickly with little advance notice.
The businesses of our PRC subsidiaries and PRC joint ventures are subject to complex and rapidly evolving laws and regulations in the PRC, which can change quickly with little advance notice. The PRC central government is a single party form of government with virtually unlimited authority and power to intervene in or influence commercial operations in China. In the past, we have experienced such intervention or influence by the PRC central government and a change in the rules and regulations in China when we were instructed by the Beijing municipal government to relocate our gallium arsenide manufacturing facility in Beijing and expect that such intervention or influence or change in the rules and regulations in China could occur in the future.
In the ordinary course of business, our PRC subsidiaries and PRC joint ventures require permits and licenses to operate in the PRC. Such permits and licenses include permits to use hazardous materials in manufacturing operations. From time to time, the PRC government issues new regulations, which may require additional actions on the part of our PRC subsidiaries and PRC joint ventures to comply. For example, on February 27, 2015, the China State Administration of Work Safety updated its list of hazardous substances. The previous list, which was published in 2002, did not restrict the materials that we use in our wafers. The new list added gallium arsenide. As a result of the newly published list, we were required to seek additional permits. Any such intervention or influence or change in the rules and regulations in China could result in a material change in our PRC operations and/or the value of our common stock.
Enhanced trade tariffs, import restrictions, export restrictions, Chinese regulations or other trade barriers may materially harm our business.
On July 3, 2023, China adopted new export control regulations on gallium- and germanium-related materials and the derivative products using these materials, effective as of August 1, 2023, which require Tongmei to proceed to immediately seek permits from the applicable Chinese authorities to export gallium arsenide and germanium substrates. Indium phosphide substrates are not included in the new export control regulations, and, therefore, exports of indium phosphide will not require export approvals as part of these regulations. While Tongmei has received its initial China export permits to resume shipping gallium arsenide and germanium substrates to certain customers, outside the United States, particularly sales to customers in Japan, Taiwan and China,there can be no assurances that Tongmei will continue to represent a significant portion of our revenue.
All of our manufacturing facilitiesreceive China export permits to resume shipping gallium arsenide and most of our suppliers are also located outside the United States. Managing our overseas operations presents challenges, including periodic regional economic downturns, trade balance issues, varying business conditions and demands, political instability, variations in enforcement of intellectual property and contract rights in different jurisdictions, differences in the abilitygermanium substrates to develop relationships with suppliers and other local businesses, changes in U.S. and international laws andcustomers or that China will not adopt additional export control regulations including U.S. export restrictions, fluctuations in interest and currency exchange rates, the ability to provide sufficient levels of technical support in different locations, cultural differences and perceptions of U.S. companies, shipping delays and terrorist acts or acts of war, among other risks. Many of these challenges are present in China, which represents a large potential market for semiconductor devices. Global uncertainties with respect to: (i) economic growth rates in various countries; (ii) sustainability of demand for electronics products; (iii) capital spending by semiconductor manufacturers; (iv) price weakness for certain semiconductor devices; (v) changing and tightening environmental regulations and (vi) political instability in regions where we have operations may alsothat affect our business, financial condition and results of operations.
Our dependence on international sales involves a number of risks, including:
|
|
|
|
|
|
|
|
|
|
|
|
|
|
58
Our sales are denominated in U.S. dollars, except for sales to our Chinese customers which are denominated in Renminbi and our Japanese customers which are denominated in Japanese yen. Increases in the value of the U.S. dollar could increase the priceAll of our products in non-U.S. markets and make our products more expensive than competitors’ products in these markets.
Denominating some sales in Japanese yen subjects us to fluctuations in the exchange rates between the U.S. dollar and the Japanese yen. For example, in the second half of 2014, the exchange rate of Japanese yen to U.S. dollar moved from 101.55 to 119.95 from June 30, 2014 to December 31, 2014. As a result, in 2014 we incurred foreign currency transaction exchange losses whichwafer substrates are included in “other income (expense), net” on the condensed consolidated statements of operations of $1.0 million.
The functional currency of our Chinese subsidiary and joint ventures is the local currency. If we do not effectively manage the risks associated with international sales, our revenue, cash flows and financial condition could be adversely affected. We incur transaction gains or losses resulting from the purchase and sale activities denominated in foreign currencies other than functional currencies at the respective consolidated entities. We accumulate translation gain or losses resulting from marking certain balance sheet assets and liabilities to the current market rate for those consolidated entities whose functional currencies are other than the reporting currency, which are recorded as component of “Accumulated other comprehensive income” on the condensed consolidated balance sheets. Although we have instituted a foreign currency hedging program, we still experience losses and gains on foreign exchange from time to time.
Uncertainty regarding the United States’ foreign policy under the new administration could disrupt our business.
We manufacture our substratesmanufactured in China and in 2016,the years 2023, 2022 and 2021, sales to customers in North America, primarily in the U.S., were approximately 90%10%, 14% and 10% of our sales arerevenue, respectively. In September 2018, the Trump Administration announced a list of thousands of categories of goods that became subject to customers located outside oftariffs when imported into the United States from China. This pronouncement imposed tariffs on wafer substrates we imported into the United States. Further,The initial tariff rate was 10% and subsequently was increased to 25%. In the first quarter of 2024 we paid approximately $65,000 in tariffs. In the years 2023, 2022 and 2021, we paid approximately $1.0 million, $3.3 million and $1.3 million, respectively, in tariffs. The future impact of tariffs and trade wars is uncertain. We may be required to raise prices, which may result in the loss of customers and our business, financial condition and results of operations may be materially harmed. Additionally, it is possible that our business could be adversely impacted by retaliatory trade measures taken by China or other countries in response to existing or future tariffs, which could cause us to raise prices or make changes to our operations, which could materially harm our business, financial condition and results of operations.
67
The economic and political conditions between China and the United States, in our view, create an unstable business environment. The United States government has restricted access by certain Chinese technology companies to items produced domestically and abroad from U.S. technology and software, which may impact our ability to maintain or grow our revenue. Trade restrictions against China have partial ownership of 10 companiesresulted in a greater determination within China to be self-sufficient and produce more goods domestically. Government agencies in China as partmay be encouraging and supporting the founding of new companies, the addition of new products in existing companies and more vertical integration within companies. These factors have resulted in lower revenue from sales of our supply chain. The United States’ foreign policy underwafer substrates in China. Further, the new administration could create uncertaintycontinued threats of tariffs and caution in the international business community, resulting in possible disruptions in manufacturing, import/export,other trade tariffs, sales, investments or other business activity. Such disruptionsrestrictions could have an adversea generally disruptive impact on the global economy and, therefore, negatively impact our financial performance.sales.
Changes in tariffs, import or export restrictions, Chinese regulations or other trade barriers may reduce gross margins.
WeIn addition, we may incur increases in costs and other adverse business consequences, including losses of customers and revenue or decreased gross margins, due to changes in tariffs, import or export restrictions, otherfurther trade barriers, or unexpected changes in regulatory requirements, any of which could reduce our gross margins. For example,requirements. In addition, in July 2012, we received notice of retroactive value-added taxes (VATs) levied by the tax authorities in China, which applied for the period from July 1, 2011 to June 30, 2012. We expensed the retroactive VATs of approximately $1.3 million in the quarter ended June 30, 2012, which resulted in a decrease in our gross margins. These VATs will continue to negatively impact our gross margins for the future quarters. Given the relatively fluid regulatory environment in China and the United States, there could be additional tax or other regulatory changes in the future. Any such changes could directly and materially adversely impact our financial results and general business condition.
Our operating results dependCOVID-19 or other contagious diseases may affect our business operations and financial performance.
The spread of COVID-19 impacted our operations and financial performance. The outbreak of COVID has triggered references to the SARS outbreak, which occurred in large part on continued customer acceptance2003 and affected our business operations. Any severe occurrence of an outbreak of a contagious disease such as COVID-19, SARS, Avian Flu or Ebola may cause us or the government to temporarily close our manufacturing operations in China. In January 2020, virtually all companies in China were ordered to remain closed after the traditional Lunar New Year holiday ended, including our subsidiaries in China. In December 2022, the PRC government ended its zero-COVID policy. If there is a renewed surge of the COVID-19 pandemic in cities in which our PRC subsidiaries and PRC joint ventures are located, the Chinese government may require these companies to close again. If one or more of our substrate products manufactured inkey suppliers is required to close for an extended period, we might not have enough raw material inventories to continue manufacturing operations. In addition, travel restrictions between China and continued improvementsthe U.S. were disrupted and this impacted our efficiency. In the future, if our manufacturing operations were closed for a significant period or we experience difficulty in product quality.
We manufacture allshipping our products, we could lose revenue and market share, which would depress our financial performance and could be difficult to recapture. If one of our products in China, and source mostkey customers is required to close for an extended period, this may delay the placement of new orders. As a result, our raw materials in China. We have in the past experienced quality problems with our China‑manufactured products. Our previous quality problems caused us to lose market share to our competitors, as some of our customers reduced their orders from us until our wafer surface quality was as good and as consistent as that offered by our competitors and instead allocated their requirements for compound semiconductor substrates to our competitors. If we are unable to continue to achieve customer qualifications for our products, or if we are unable to control product quality, customers may not increase purchases of our products, our China facility will become underutilized, and we will be unable to achieve revenue growth.would decline.
59
Changes in China’s political, social, regulatory or economic environments may affect our financial performance.
Our financial performance may be affected by changes in China’s political, social, regulatory or economic environments. The role of the Chinese central and local governments in the Chinese economy is significant. The Beijing municipal government’s decision to move to the Tongzhou district, the original location of our China company, resulted in the city instructing virtually all existing manufacturing companies, including AXT, to relocate all or some of their manufacturing lines. We were instructed to move our gallium arsenide manufacturing line out of the area. Chinese policies toward hazardous materials, including arsenic, environmental controls, air pollution, economic liberalization, laws and policies affecting technology companies, foreign investment, currency exchange rates, taxation structure and other matters could change, resulting in greater restrictions on our ability to do business and operate our manufacturing facilities in China. We have observed a growing fluidity and tightening of regulations concerning hazardous materials, and other environmental controls.controls and air pollution. The Chinese government could revoke, terminate or suspend our operating licenses for reasons related to environmental control over the use of hazardous materials, air pollution, labor complaints, national security and similar reasons without compensation to us. IfFurther, the Chinesecentral government encourages employees to report to the appropriate regulatory agencies possible safety or environmental violations, but there may not be actual violations. In days of severe air pollution the government has ordered manufacturing companies to stop all production. For example, in the first quarter of 2018, from February 27 to March 31, over 300 manufacturing
68
companies, including us, were again intermittently shut down by the local government for a total of ten days due to take any of these actions, we would be prevented from conducting all or part ofsevere air pollution. Our shipments were delayed and our business.revenue for the quarter was negatively impacted. We expect that mandatory factory shutdowns may occur in the future. Any failure on our part to comply with governmental regulations could result in the loss of our ability to manufacture our products. Further, any imposition of surcharges or any increase in Chinese tax rates or reduction or elimination of Chinese tax benefits could hurt our operatingfinancial results.
The Beijing city government is expanding its offices into the area where our manufacturing facility is located
Financial market volatility and isadverse changes in the process of moving thousands of government employees into this area. The Beijing city government desires to upgrade this areadomestic, global, political and has applied pressure on manufacturing companies to relocate, including us. We are cooperating with the government and, in accordance with our relocation plan, are relocating our gallium arsenide production line to the city of Dingxing which is about 90 minutes south of our current facility. In addition, we have acquired a smaller site in Kazuo, located in the province of Liaoning near the Inner Mongolia Autonomous Region and under the jurisdiction of the prefecture-level city of Chaoyang, which will initially be used for the synthesis of raw gallium and raw arsenic. Additional environmental permits, regulatory approvals and zoning conformance applications are in process for both sites. In light of the increased focus in China on the use of hazardous materials and environmental issues there can be no assurance that these matters will be completed smoothly or at all.
The relocation of our gallium arsenide production line requires us to accurately execute our relocation plan. We expect that our major customers will want to examine and qualify the wafer substrates produced at the new site before placing volume purchase orders for products produced at the new site. A failure to properly execute our relocation planeconomic environment could result in disruption to our production and have a materialsignificant adverse impact on our business, financial condition and operating results.
We are subject to the risks arising from adverse changes and uncertainty in domestic and global economies. Uncertain global economic and political conditions or low or negative growth in China, Europe or the United States, along with volatility in the financial markets and U.S. financial system, increasing national debt and fiscal concerns in various regions and the adoption and availability of fiscal and monetary stimulus measures to counteract the impact of the COVID-19 pandemic, pose challenges to our industry. Currently China’s economy is slowing and this could impact our financial performance. In addition, tariffs, trade restrictions, trade wars, high levels of inflation, high interest rates, the Russian invasion of Ukraine, the Middle East conflict, the Red Sea shipping disruptions, Brexit, heightened tensions between the U.S. and China, and U.S. bank failures in 2023, among other factors, are creating an unstable environment and can disrupt or restrict commerce. Although we remain well-capitalized, the cost and availability of funds may be adversely affected by illiquid credit markets. Volatility in U.S. and international markets and economies may adversely affect our liquidity, financial condition and profitability. Another severe or prolonged economic downturn could result in a variety of risks to our business, including:
| ● | inventory corrections; |
| ● | increased volatility in our stock price; |
| ● | increased volatility in foreign currency exchange rates; |
| ● | delays in, or curtailment of, purchasing decisions by our customers or potential customers; |
| ● | increased credit risk associated with our customers or potential customers, particularly those that may operate in industries most affected by the economic downturn; and |
| ● | impairment of our tangible or intangible assets. |
A recent example of economic volatility took shape in the second half of 2022 and has continued into 2024. Early in its history, COVID began to impact supply chains resulting in shortages. As a result, in 2021 and into 2022 almost all companies purchased more inventory than needed as a safety net. In the second half of 2022 companies began to realize they had too much inventory and entered into the “inventory correction” period. Our consolidated revenue had reached $39.7 million in the first quarter of 2022. In the third quarter of 2023 our revenue had declined to $17.4 million. In the fourth quarter of 2018 and continuing in 2019, we experienced delays in customer purchasing decisions and disruptions in a normal volume of customer orders that we believe were in part due to the uncertainties in the global economy, resulting in an adverse impact on consumer spending. During challenging and uncertain economic times and in tight credit markets, many customers delay or reduce technology purchases. Should similar events occur again, our business and operating results could be significantly and adversely affected.
The PRC central government may also exert more control over offerings conducted overseas and/or foreign investment in China-based issuers, which could result in a material change in our operations and/or the value of our common stock.
The PRC central government may also exert more control over offerings conducted overseas and/or foreign investment in China-based issuers, which could result in a material change in our operations and/or the value of our common stock. The PRC central government may also seek to significantly limit or completely hinder our ability to offer
69
or continue to offer our securities to investors and financial condition.cause the value of such securities to significantly decline or be worthless.
Our international operations are exposed to potential adverse tax consequence in China.
Our international operations create a risk of potential adverse tax consequences. Taxes on income in our China-based companies are dependent upon acceptance of our operational practices and intercompany transfer pricing by local tax authorities as being on an arm's length basis. Due to inconsistencies among taxing authorities in application of the arm'sarm’s length standard, transfer pricing challenges by tax authorities could, if successful, materially increase our consolidated income tax expense. We are subject to tax audits in China and an audit could result in the assessment of additional income tax against us. This could have a material adverse effect on our operating results or cash flows in the period or periods for which that determination is made and could result in increases to our overall tax expense in subsequent periods. Various taxing agencies in China are increasingly focused on tax reform and other legislative action to increase tax revenue. In addition to risks regarding income tax we have in the past been retroactively assessed value added taxes (“VAT” or sales tax)“sales tax”) and such VAT assessments could occur again in the future.
Uncertainty regarding the United States’ foreign policy, particularly with regards to China, could disrupt our business.
We manufacture our substrates in China and, in the year ended December 31, 2023, approximately 90% of our sales were to customers located outside the United States. Further, we have partial ownership of raw material companies in China as part of our supply chain. The United States’ current foreign policy has created uncertainty and caution in the international business community, resulting in disruptions in manufacturing, import/export, trade tariffs, sales, investments and other business activity. Such disruptions have had an adverse impact on our financial performance and could continue in the future.
Dividends from within our corporate structure are subject to PRC withholding tax and SAFE approval.
Occasionally, one of our PRC subsidiaries or PRC raw material joint ventures declares and pays a dividend. These dividends generally occur when the PRC joint venture declares a dividend for all of its shareholders. We have no current intentions to distribute to our investors earnings under our corporate structure. Dividends paid to the Company are subject to a 10% PRC withholding tax. The Company is required to obtain approval from SAFE to transfer funds in or out of the PRC. SAFE requires a valid agreement to approve the transfers, which are processed through a bank. Other than PRC foreign exchange restrictions, the Company is not subject to any PRC restrictions and limitations on its ability to distribute earnings from its businesses. If SAFE approval is denied the dividend payable to the Company would be owed but would not be paid.
Our PRC subsidiaries and PRC joint ventures are subject to data security oversight.
Our PRC subsidiaries and PRC joint ventures are subject to oversight by the Cyberspace Administration of China (the “CAC”) regarding data security. Except for routine personal information necessary to process payroll and other benefits and emergency contact information, our PRC subsidiaries and PRC joint ventures do not collect or maintain personal information. All of our products are manufactured in the PRC by our PRC subsidiaries and PRC joint ventures. Although we are neither a PRC operating company nor do we conduct our operations in China through the use of VIEs, cybersecurity is increasingly a focus of the central government and the CAC could require AXT to comply with PRC cybersecurity regulations, which could cause us to make changes to our operations that could materially harm our business, financial condition and results of operations.
We derive a significant portion of our revenue from international sales, and our ability to sustain and increase our international sales involves significant risks.
Approximately 97% of our revenue is from international sales. We expect that sales to customers outside the United States, particularly sales to customers in Japan, Taiwan, Europe and China, will continue to represent a
70
significant portion of our revenue. Therefore, our revenue growth depends significantly on the expansion of our international sales and operations.
All of our manufacturing facilities and most of our suppliers are also located outside the United States. Managing our overseas operations presents challenges, including periodic regional economic downturns, trade balance issues, threats of trade wars, varying business conditions and demands, political instability, variations in enforcement of intellectual property and contract rights in different jurisdictions, differences in the ability to develop relationships with suppliers and other local businesses, changes in U.S. and international laws and regulations, including import and export restrictions, fluctuations in interest and currency exchange rates, the ability to provide sufficient levels of technical support in different locations, cultural differences and perceptions of U.S. companies, shipping delays and terrorist acts or acts of war, natural disasters and epidemics or pandemics, such as COVID-19, among other risks. Many of these challenges are present in China, which represents a large potential market for semiconductor devices. Global uncertainties with respect to: (i) economic growth rates in various countries; (ii) sustainability of demand for electronic products; (iii) capital spending by semiconductor manufacturers; (iv) price weakness for certain semiconductor devices; (v) changing and tightening environmental regulations; (vi) political instability in regions where we have operations and (vii) trade wars may also affect our business, financial condition and results of operations.
Our dependence on international sales involves a number of risks, including:
| ● | changes in tariffs, import restrictions, export restrictions, or other trade barriers; |
| ● | unexpected changes in regulatory requirements; |
| ● | longer periods to collect accounts receivable; |
| ● | foreign exchange rate fluctuations; |
| ● | changes in export license requirements; |
| ● | political and economic instability; and |
| ● | unexpected changes in diplomatic and trade relationships. |
Most of our sales are denominated in U.S. dollars, except for sales to our Chinese customers which are denominated in renminbi and our Japanese customers which are denominated in Japanese yen. We also have some small sales denominated in Euro. Increases in the value of the U.S. dollar could increase the price of our products in non-U.S. markets and make our products more expensive than competitors’ products in these markets.
We are subject to foreign exchange gains and losses that may materially impact our condensed consolidated statements of operations.
We are subject to foreign exchange gains and losses that may materially impact our condensed consolidated statements of operations. For example, in 2023 and 2022, we incurred foreign exchange gains of $169,000 and $1.6 million, respectively, and in 2021, we incurred a foreign exchange loss of $434,000.
The functional currency of our companies in China is the Chinese renminbi, the local currency. We can incur foreign exchange gains or losses when we pay dollars to one of our China-based companies or a third-party supplier in China. Similarly, if a company in China pays renminbi into one of our bank accounts transacting in dollars the renminbi will be converted to dollars and we can incur a foreign exchange gain or loss. Hedging renminbi will be considered in the future but it is complicated by the number of companies involved, the diversity of transactions and restrictions imposed by the banking system in China.
71
Sales to Japanese customers are denominated in Japanese yen. This subjects us to fluctuations in the exchange rates between the U.S. dollar and the Japanese yen and can result in foreign exchange gains and losses. This has been problematic in the past and, therefore, we instituted a foreign currency hedging program dealing with yen which has historically mitigated the gains and losses caused by fluctuations in the exchange rates.
Joint venture raw material companies in China bring certain risks.
Since our consolidated subsidiaries and all of our joint venture raw material companies operate in China, their activities could subject us to a number of risks associated with conducting operations internationally, including:
| ● | import and export restrictions; |
| ● | unexpected changes in regulatory requirements that may limit our ability to manufacture, export the products of these companies, sell into particular jurisdictions or impose multiple conflicting tax laws and regulations; |
| ● | the imposition of tariffs, trade barriers and duties; |
| ● | difficulties in managing geographically disparate operations; |
| ● | difficulties in enforcing agreements through non-U.S. legal systems; |
| ● | political and economic instability, civil unrest or war; |
| ● | terrorist activities that impact international commerce; |
| ● | difficulties in protecting our intellectual property rights, particularly in countries where the laws and practices do not protect proprietary rights to as great an extent as do the laws and practices of the United States; |
| ● | new or changing laws and policies affecting economic liberalization, foreign investment, currency convertibility or exchange rates, taxation or employment; |
| ● | new or changing PRC regulations and policies regarding data security and oversight by the CAC of our consolidated subsidiaries and all of our joint venture raw material companies; and |
| ● | nationalization of foreign-owned assets, including intellectual property. |
If China places restrictions on freight and transportation routes and on ports of entry and departure this could result in shipping delays or increased costs for shipping.
In August 2015, there was an explosion at the Port of Tianjin, China. As a result of this incident the government placed restrictions on importing certain materials and on freight routes used to transport these materials. We experienced some modest disruption from these restrictions. If the government were to place additional restrictions on the transportation of materials, then our ability to transport our raw materials or products could be limited and result in manufacturing delays or bottlenecks at shipping ports, affecting our ability to deliver products to our customers. During periods of such restrictions, we may increase our stock of critical materials (such as arsenic, gallium and other items) for use during the period that these restrictions are likely to last, which will increase our use of cash and increase our inventory level. Any of these restrictions could materially and adversely impact our results of operations and our financial condition.
72
Our operating results depend in large part on continued customer acceptance of our substrate products manufactured in China and continued improvements in product quality.
We manufacture all of our products in China, and source most of our raw materials in China. We have in the past experienced quality problems with our China manufactured products. Our previous quality problems caused us to lose market share to our competitors as some of our customers reduced their orders until our wafer surface quality was as good and as consistent as that offered by our competitors. If we are unable to continue to achieve customer qualifications for our products, or if we are unable to control product quality, customers may not increase purchases of our products, our China facilities will become underutilized, and we will be unable to achieve revenue growth.
If there are power shortages in China, we may have to temporarily close our China operations, which would adversely impact our ability to manufacture our products and meet customer orders, and would result in reduced revenue.
In the past, China has faced power shortages resulting in power demand outstripping supply in peak periods. Instability in electrical supply has caused sporadic outages among residential and commercial consumers causing the Chinese government to implement tough measures to ease the energy shortage. If further problems with power shortages occur in the future, we may be required to make temporary closures of our operations or of our subsidiary and joint venture operations.raw material companies. We may be unable to manufacture our products and would then be unable to meet customer orders except from finished goods inventory on hand. As a result, our revenue could be adversely impacted, and our relationships with our
60
customers could suffer, impacting our ability to generate future revenue. In addition, if power is shut off at any of our facilities at any time, either voluntarily or as a result of unplanned brownouts, during certain phases of our manufacturing process including our crystal growth phase, the work in process may be ruined and rendered unusable, causing us to incur costs that will not be covered by revenue, and negatively impacting our cost of revenue and gross margins.
An outbreakAlthough the audit report is prepared by an independent registered public accounting firm who is currently inspected fully by the PCAOB, there is no guarantee that future audit reports will be prepared by an independent registered public accounting firm that is completely inspected by the PCAOB.
Our independent registered public accounting firm, BPM, is registered with the PCAOB and is subject to regular inspections by the PCAOB to assess its compliance with the applicable professional standards. Although we have operations in China, a jurisdiction where the PCAOB was, until recently, unable to conduct inspections without the approval of the Chinese government authorities, our independent registered public accounting firm is currently inspected fully by the PCAOB.
Inspections of other independent registered public accounting firms conducted by the PCAOB outside China have at times identified deficiencies in those independent registered public accounting firms’ audit procedures and quality control procedures, which may be addressed as part of the inspection process to improve future audit quality. The lack of PCAOB inspections of audit work undertaken in China prevented the PCAOB from regularly evaluating independent registered public accounting firms’ audits and their quality control procedures. As a result, to the extent that any component of our independent registered public accounting firm’s work papers is or becomes located in China, such work papers may not be subject to inspection by the PCAOB. As a result, investors would be deprived of such PCAOB inspections, which could result in limitations or restrictions to our access of the U.S. capital markets.
As part of a contagious diseasecontinued regulatory focus in the United States on access to audit and other information currently protected by national law, in particular PRC laws, in June 2019, a bipartisan group of lawmakers introduced bills in both houses of the U.S. Congress which, if passed, would require the SEC to maintain a list of issuers for which PCAOB is not able to inspect or investigate the audit work performed by a non-U.S. independent registered public accounting firm completely. The proposed Ensuring Quality Information and Transparency for Abroad-Based Listings on our Exchanges Act prescribes increased disclosure requirements for these issuers and, beginning in 2025, the delisting from U.S. national securities exchanges such as Ebola, Severe Acute Respiratory Syndrome (SARS)the Nasdaq Global Select Market of issuers included on the SEC’s list for three consecutive years. It is unclear if this proposed legislation will be enacted. Furthermore, there have been recent deliberations within the U.S. government regarding potentially limiting or restricting companies based in China from accessing U.S. capital markets. On May 20, 2020, the Avian Flu may adversely impact our manufacturing operations and someU.S. Senate passed the HFCA Act, which includes requirements
73
Any reoccurrence of SARSfor the SEC to identify issuers whose audit work is performed by independent registered public accounting firms that the PCAOB is unable to inspect or an outbreakinvestigate completely because of a contagious disease,restriction imposed by a non-U.S. authority in the independent registered public accounting firms’ local jurisdiction. The U.S. House of Representatives passed the HFCA Act on December 2, 2020, and the HFCA Act was signed into law on December 18, 2020. Additionally, in July 2020, the U.S. President’s Working Group on Financial Markets issued recommendations for actions that can be taken by the executive branch, the SEC, the PCAOB or other federal agencies and department with respect to Chinese companies listed on U.S. stock exchanges and their independent registered public accounting firms, in an effort to protect investors in the United States. In response, on November 23, 2020, the SEC issued guidance highlighting certain risks (and their implications to U.S. investors) associated with investments in issuers based in China and summarizing enhanced disclosures the SEC recommends issuers based in China make regarding such risks. On March 18, 2021, the SEC adopted interim final rules to implement the HFCA Act, which requires the SEC to identify certain issuers that filed annual reports with audit reports issued by registered public accounting firms located in foreign jurisdictions and that the PCAOB is unable to inspect or investigate completely because of a position taken by an authority in those jurisdictions (the “Commission-Identified Issuers”). Specifically, the SEC implemented the submission and disclosure requirements of the HFCA Act. On December 2, 2021, the SEC issued amendments to finalize the interim final rules. Further, the SEC established procedures to identify Commission-Identified Issuers and prohibit the trading of the securities of Commission-Identified Issuers as Avian Flurequired by the HFCA Act. We will be required to comply with these rules if the SEC identifies us as a Commission-Identified Issuer. Under the HFCA Act, our securities may be prohibited from trading on the Nasdaq Global Select Market or Ebola, may cause usother U.S. stock exchanges if we are determined to temporarily closebe a Commission-Identified Issuer for three consecutive years, and this ultimately could result in our manufacturing operations. Similarly,common stock being delisted. Furthermore, on June 22, 2021, the U.S. Senate passed the Accelerating Holding Foreign Companies Accountable Act, which, if enacted, would amend the HFCA Act and require the SEC to prohibit an issuer’s securities from trading on any U.S. stock exchanges if the issuer is determined to be a Commission-Identified Issuer for two consecutive years instead of three. On December 15, 2021, the Accelerating Holding Foreign Companies Accountable Act was introduced to the U.S. House of Representatives. On September 22, 2021, the PCAOB adopted a final rule implementing the HFCA Act, which provides a framework for the PCAOB to use when determining, as contemplated under the HFCA Act, whether the PCAOB is unable to inspect or investigate completely independent registered public accounting firms located in a non-U.S. jurisdiction because of a position taken by one or more authorities in that jurisdiction and was approved by the SEC on November 5, 2021. On December 16, 2021, the PCAOB issued a report on its determinations that the PCAOB is unable to inspect or investigate completely registered public accounting firms headquartered in the PRC and Hong Kong because of positions taken by PRC authorities in those jurisdictions.
Beginning in March 2022, the SEC listed companies on either its conclusive list of issuers identified under the HFCA Act or its provisional list of issuers identified under the HFCA Act. Companies listed on the SEC’s conclusive list of issuers identified under the HFCA Act are determined to be Commission-Identified Issuers. The SEC did not list AXT, Inc. on either its conclusive list of issuers identified under the HFCA Act or its provisional list of issuers identified under the HFCA Act.
On December 15, 2022, the PCAOB vacated its 2021 determinations that the positions taken by authorities in the PRC and Hong Kong prevented it from inspecting and investigating completely registered public accounting firms headquartered in those jurisdictions. As a result, the SEC will not provisionally or conclusively identify an issuer as a Commission-Identified Issuer if it files an annual report with an audit report issued by a registered public accounting firm headquartered in either jurisdiction on or after December 15, 2022, until such time as the PCAOB issues a new determination. The SEC will continue to include any Commission-Identified Issuer on the provisional or conclusive list if they filed an annual report with an audit report issued by a registered public accounting firm headquartered in mainland China and Hong Kong prior to the PCAOB’s decision to vacate its 2021 determinations.
While an agreement has been reached among the CSRC, the SEC and the PCAOB regarding the inspection of PCAOB-independent registered public accounting firms in China, there can be no assurance that we will be able to comply with requirements imposed by U.S. regulators. If the PRC authorities do not fully perform their obligations under the agreement with the PCAOB in the future, or if authorities in the PRC otherwise take positions that render the PCAOB unable to inspect or investigate completely registered public accounting firms headquartered in the PRC and Hong Kong, the PCAOB will make determinations under the HFCA Act. Delisting of our key suppliers is requiredcommon stock would force holders of our common stock to close for an extended period, we might not have enough raw material inventories to continue manufacturing operations. In addition, while we possess management skills amongsell their shares. The market price of our common stock could be adversely affected as a
74
result of anticipated negative impacts of these executive or legislative actions upon, as well as negative investor sentiment towards, companies with operations in China staff that enable us to maintain our manufacturing operations with minimal on-site supervision from our U.S.‑based staff, our business could also be harmed if travel to or from China andare listed in the United States, is restrictedregardless of whether these executive or inadvisable. If our manufacturing operations were closed for a significant period, we could lose revenuelegislative actions are implemented and market share, which would depress our financial performance and could be difficult to recapture. Finally, if oneregardless of our key customers is required to close for an extended period, we might not be able to ship product to them, our revenue would decline and our financial performance would suffer.actual operating performance.
III
IV. Risks Related to Our Financial Results and Capital Structure
We may utilize our cash balances for relocation, expansion,relocating manufacturing lines, adding capacity, acquiring state-of-the-art equipment or to offsetoffsetting a business downturn resulting in the decline of our existing cash cash equivalents and investment balances, and if we need additional capital, those funds may not be available on acceptable terms, or at all.
Our liquidity is affected by many factors, including among others, the acquisition of the sites at Dingxing and Kazuo for the relocation of our gallium arsenide manufacturing operations,lines, the extentexpansion of our capacity to which we pursue on-goingmeet market demand, the acquisition of state-of-the-art equipment, other capital expenditures, operating activities, the leveleffect of our production, the level of profits or losses,exchange rate changes and other factors related to the uncertainties of the industry and global economies. Our relocation expenditures and any negative cash flow effects of these other factors willSuch matters could draw down our cash reserves, which could adversely affect our financial condition, require us to incur debt, reduce our value and possibly impinge our ability to raise debt and equity funding in the future, at a time when we might need to raise additional cash or elect to raise additional cash. Accordingly, there can be no assurance that events will not require us to seek additional capital or, if required, that such capital would be available on terms acceptable to us, if at all.
The terms of the private equity raised in China as a first step toward an IPO on the STAR Market grant each Investor a right of redemption if Tongmei fails to achieve its IPO.
Pursuant to the Capital Investment Agreements with the Investors, each Investor has the right to require AXT to redeem any or all Tongmei shares held by such Investor at the original purchase price paid by such Investor, without interest, in the event the IPO fails to pass the audit of the Shanghai Stock Exchange, is not approved by the CSRC or Tongmei cancels the IPO application. The aggregate redemption amount is approximately $49 million.
Tongmei submitted its IPO application to the Shanghai Stock Exchange and it was formally accepted for review on January 10, 2022. The Shanghai Stock Exchange approved the IPO application on July 12, 2022. On August 1, 2022, the CSRC accepted for review Tongmei’s IPO application. The STAR Market IPO remains subject to review and approval by the CSRC and other authorities. The process of going public on the STAR Market includes several periods of review and, therefore, is a lengthy process. Subject to review and approval by the CSRC and other authorities, Tongmei expects to accomplish this goal in the coming months. The listing of Tongmei on the STAR Market will not change the status of AXT as a U.S. public company. There can be no assurances that Tongmei will complete its IPO in 2024 or at all. In the event that investors exercise their redemption rights, we may be required to seek additional capital in order to redeem their Tongmei shares and there would be no assurances that such capital would be available on terms acceptable to us, if at all. Any redemptions could have a material adverse effect on our business, financial condition and results of operations.
Unpredictable fluctuations in our operating results could disappoint analysts or our investors, which could cause our stock price to decline.
We have experienced, and may continue to experience, significant fluctuations in our revenue, gross margins and earnings. Our quarterly and annual revenue and operating results have varied significantly in the past and may vary significantly in the future due to a number of factors, including:
| ● |
|
| ● | our ability to develop, manufacture and deliver high quality products in a timely and cost-effective manner; |
| ● | unforeseen disruptions at our new sites; |
75 |
|
|
| ● |
|
| ● | fluctuation of our manufacturing yields; |
| ● |
| decreases in the prices of our or our competitors’ products; |
| ● |
| fluctuations in demand for our products; |
| ● |
| the volume and timing of orders from our customers, and cancellations, push-outs and delays of customer orders once booked; |
61
| ● |
| decline in general economic conditions or downturns in the industry in which we compete; |
| ● |
| expansion of our manufacturing capacity; |
| ● |
| expansion of our operations in China; |
| ● |
| limited availability and increased cost of raw materials; |
| ● |
| costs incurred in connection with any future acquisitions of businesses or technologies; and |
| ● |
| increases in our expenses, including expenses for research and development. |
Due to these factors, we believe that period-to-period comparisons of our operating results may not be meaningful indicators of our future performance.
A substantial percentage of our operating expenses are fixed, and we may be unable to adjust spending to compensate for an unexpected shortfall in revenue. As a result, any delay in generating revenue could cause our operating results to fall below the expectations of market analysts or investors, which could also cause our stock price to decline.
If our operating results and financial performance do not meet the guidance that we have provided to the public, our stock price may decline.
We provide public guidance on our expected operating and financial results. Although we believe that this guidance provides our stockholders, investors and analysts with a better understanding of our expectations for the future, such guidance is comprised of forward-looking statements subject to the risks and uncertainties described in this reportReport and in our other public filings and public statements. Our actual results may not meet the guidance we have provided. If our operating or financial results do not meet our guidance or the expectations of investment analysts, our stock price may decline.
We have adopted certain anti-takeover measures that may make it more difficult for a third party to acquire us.
Our boardBoard of directorsDirectors has the authority to issue up to 800,000 shares of preferred stock in addition to the outstanding shares of Series A preferred stock and to determine the price, rights, preferences and privileges of those shares without any further vote or action by the stockholders. The rights of the holders of common stock will be subject to, and may be adversely affected by, the rights of the holders of any preferred stock that may be issued in the future. The issuance of shares of preferred stock could have the effect of making it more difficult for a third party to acquire a majority of our outstanding voting stock. We have no present intention to issue additional shares of preferred stock.
76
Provisions in our restated certificate of incorporation and amended and restated bylaws may have the effect of delaying or preventing a merger, acquisition or change of control, or changes in our management, which could adversely affect the market price of our common stock. The following are some examples of these provisions:
| ● |
| the division of our |
| ● |
| the right of our |
| ● |
| the ability of our |
| ● |
| the requirement that only our |
62
Furthermore, because we are incorporated in Delaware, we are subject to the provisions of Section 203 of the Delaware General Corporation Law. These provisions prohibit us from engaging in any business combination with any interested stockholder (a stockholder who owns 15% or more of our outstanding voting stock) for a period of three years following the time that such stockholder became an interested stockholder, unless:
| ● |
| 662/3% of the shares of voting stock not owned by the interested stockholder approve the merger or combination, or |
| ● |
| the |
Our common stock may be delisted from The Nasdaq Global Select Market, which could negatively impact the price of our common stock and our ability to access the capital markets.
Our common stock is listed on The Nasdaq Global Select Market. The bid price of our common stock has in the past closed below the $1.00 minimum per share bid price required for continued inclusion on The Nasdaq Global Select Market under Marketplace Rule 5450(a). If the bid price of our common stock remains below $1.00 per share for thirty consecutive business days, we could be subject to delisting from the Nasdaq Global Select Market.
Any delisting from The Nasdaq Global Select Market could have an adverse effect on our business and on the trading of our common stock. If a delisting of our common stock were to occur, our common stock would trade in the over-the-counter market and be quoted on a service such as those provided by OTC Markets Group, Inc. Such alternatives are generally considered to be less efficient markets, and our stock price, as well as the liquidity of our common stock, may be adversely impacted as a result. Delisting from The Nasdaq Global Select Market could also have other negative results, including the potential loss of confidence by customers, suppliers and employees, the loss of institutional investor interest and fewer business development opportunities, as well as the loss of liquidity for our stockholders.
Our ability to use our net operating loss carryforwards and certain other tax attributes may be limited.
As of December 31, 2016,2023, we had U.S. federal net operating loss carryforwards of approximately $178.4 million and state$40.2 million. We have net operating loss carryforwards of approximately $1.0 million, which begin expiring$115,000, primarily in varying amounts from 2017 through 2022 if unused.the state of California, as of December 31, 2023. We do not expect to utilize the loss carryforwards in the next several years unless Tongmei pays a dividend. Under Sections 382 and 383 of the Internal Revenue Code of 1986, as amended, if a corporation undergoes an “ownership change,” the corporation’s ability to use its pre-change net operating loss carryforwards and other pre-change tax attributes, such as research tax credits, to offset its post-change income and taxes may be limited. In general, an “ownership change” occurs if there is a cumulative change in our ownership by “5% shareholders” that exceeds 50 percentage points over a rolling three-year period. Similar rules may apply under state tax laws. We maymight have undergone prior ownership changes, and we may undergo ownership changes in the future, which may result in
77
limitations on our net operating loss carryforwards and other tax attributes. Any such limitations on our ability to use our net operating loss carryforwards and other tax attributes could adversely impact our business, financial condition and results of operations.
IV.V. Risks Related to Our Intellectual Property
Intellectual property infringement claims may be costly to resolve and could divert management attention.
Other companies may hold or obtain patents on inventions or may otherwise claim proprietary rights to technology necessary to our business. The markets in which we compete are comprised of competitors that in some cases hold substantial patent portfolios covering aspects of products that could be similar to ours. We could become subject to claims that we are infringing patent, trademark, copyright or other proprietary rights of others. We may incur expenses to defend ourselves against such claims or enter into cross license agreements that require us to pay royalty payments to resolve such claims. For example, in 2020, we and a competitor entered into a cross license and covenant agreement (the “Cross License Agreement”), which has a term that began on January 1, 2020 and expires on December 31, 2029. We have in the past been involved in lawsuits alleging patent infringement, and could in the future be involved in similar litigation. For example, we entered into a settlement agreement with Sumitomo in 2011 to settle its claim of patent infringement, which resulted in AXT paying them royalties.
63
If we are unable to protect our intellectual property, including our non-patented proprietary process technology, we may lose valuable assets or incur costly litigation.
We rely on a combination of patents, copyrights, trademarks, trade secrets and trade secret laws, non-disclosure agreements and other intellectual property protection methods to protect our proprietary technology. We believe that our internal, non-patented proprietary process technology methods, systems and processes are a valuable and critical element of our intellectual property. We must establish and maintain safeguards to avoid the theft of these processes. Our ability to establish and maintain a position of technology leadership also depends on the skills of our development personnel. Despite our efforts to protect our intellectual property, third parties can develop products or processes similar to ours. Our means of protecting our proprietary rights may not be adequate, and our competitors may independently develop similar technology, duplicate our products or design around our patents. We believe that at least two of our competitors ship GaAs substrates produced using a process similar to our VGF process. Our competitors may also develop and patent improvements to the VGF technology upon which we rely, and thus may limit any exclusivity we enjoy by virtue of our patents or trade secrets.
It is possible that pending or future United States or foreign patent applications made by us will not be approved, that our issued patents will not protect our intellectual property, or that third parties will challenge our ownership rights or the validity of our patents. In addition, the laws of some foreign countries may not protect our proprietary rights to as great an extent as do the laws of the United States and it may be more difficult to monitor the use of our intellectual property. Our competitors may be able to legitimately ascertain non-patented proprietary technology embedded in our systems. If this occurs, we may not be able to prevent the development of technology substantially similar to ours.
We may have to resort to costly litigation to enforce our intellectual property rights, to protect our trade secrets or know-how or to determine their scope, validity or enforceability. Enforcing or defending our proprietary technology is expensive, could cause us to divert resources and may not prove successful. Our protective measures may prove inadequate to protect our proprietary rights, and if we fail to enforce or protect our rights, we could lose valuable assets.
VVI. Risks Related to Compliance, Environmental Regulations and Other Legal and Administrative Matters
If we, or any of our partially owned supply chain companies, fail to comply with environmental and safety regulations, we may be subject to significant fines or forced to cease our operations; in addition, we could be subject to suits for personal injuries caused by hazardous materials.operations.
We are subject to federal, state and local environmental and safety laws and regulations in all of our operating locations, including laws and regulations of China, such as laws and regulations related to the development, manufacture and use of our products, the use of hazardous materials, the operation of our facilities, and the use of our real property.
78
These laws and regulations govern the use, storage, discharge and disposal of hazardous materials during manufacturing, research and development, and sales demonstrations. If we, or any of our partially owned supply chain companies, fail to comply with applicable regulations, we could be subject to substantial liability for clean-up efforts, personal injury, fines or suspension or be forced to close or temporarily cease our operations, and/or suspend or terminate the development, manufacture or use of certain of our products, the use of our facilities, or the use of our real property, each of which could have a material adverse effect on our business, financial condition and results of operations.
The Chinese central government is demonstrating strong leadership to improve air quality and reduce environmental pollution. The central government encourages employees to report to the appropriate regulatory agencies possible safety or environmental violations but there may not be actual violations. These efforts have impacted manufacturing companies through mandatory shutdowns, increased inspections and regulatory reforms. In the first quarter of 2018, from February 27 to March 31 over 300 manufacturing companies were again intermittently shut down by the local government for a total of ten days, or 30 percent of the remaining calendar days, due to severe air pollution. Our shipments were delayed and our revenue for the quarter was negatively impacted. We expect that mandatory factory shutdowns may occur in the future. If the frequency of such shutdowns increases, especially at the end of a quarter, or if the total number of days of shutdowns prevents us from producing enough wafers to ship, then the shutdowns will have a material adverse effect on our manufacturing output, revenue and factory utilization. We believe the relocation of our gallium arsenide and germanium manufacturing lines mitigates our exposure to factory shutdowns. Each of our raw material supply chain companies could also be impacted by environmental related orders from the central government.
In addition, from time to time, the Chinese government issues new regulations, which may require additional actions on our part to comply. OnFor example, on February 27, 2015, the China State Administration of Work Safety updated its list of hazardous substances. The previous list, which was published in 2002, did not restrict the materials that we use in our wafers. The new list added gallium arsenide. As a result of the newly published list, we were instructedrequired to obtain a permit to continue to manufacture our gallium arsenide substrate wafers. The Beijing municipal authority accepted our permit application in May 2015, but has not yet issued to us the requisite permit while we continue to show good faith and, more recently, significant progress in relocating our gallium arsenide production. If our application is denied in the future before we complete our relocation, then our gallium arsenide productionseek additional permits.
We could be disrupted, which could materially and adversely impact our results of operations and our financial condition.subject to suits for personal injuries caused by hazardous materials.
64
In 2005, a complaint was filed against us alleging personal injury, general negligence, intentional tort, wage loss and other damages, including punitive damages, as a result of exposure of plaintiffs to high levels of gallium arsenide in gallium arsenide wafers, and methanol. Other current and/or former employees could bring litigation against us in the future. Although we have put in place engineering, administrative and personnel protective equipment programs to address these issues, our ability to expand or continue to operate our present locations could be restricted or we could be required to acquire costly remediation equipment or incur other significant expenses if we were found liable for failure to comply with environmental and safety regulations. Existing or future changes in laws or regulations in the United States and China may require us to incur significant expenditures or liabilities, or may restrict our operations. In addition, our employees could be exposed to chemicals or other hazardous materials at our facilities and we may be subject to lawsuits seeking damages for wrongful death or personal injuries allegedly caused by exposure to chemicals or hazardous materials at our facilities.
Litigation is inherently uncertain and while we would expect to defend ourselves vigorously, it is possible that our business, financial condition, results of operations or cash flows could be affected in any particular period by litigation pending and any additional litigation brought against us. In addition, future litigation could divert management’s attention from our business and operations, causing our business and financial results to suffer. We could incur defense or settlement costs in excess of the insurance covering these litigation matters, or that could result in significant judgments against us or cause us to incur costly settlements, in excess of our insurance limits.limits.
We are subject to internal control evaluations and attestation requirements of Section 404 of the Sarbanes‑OxleySarbanes-Oxley Act.
Pursuant to Section 404 of the Sarbanes‑OxleySarbanes-Oxley Act of 2002, we must include in our Annual Report on Form 10-K a report of management on the effectiveness of our internal control over financial reporting. Ongoing compliance with this requirement is complex, costly and time-consuming.time-consuming and it extends to our companies in China. If: (1) we fail to maintain effective internal control over financial reporting; or (2) our management does not timely assess the adequacy
79
of such internal control, we could be subject to regulatory sanctions and the public’s perception of us may be adversely impacted.
We need to continue to improve or implement our systems, procedures and controls.
We rely on certain manual processes for data collection and information processing, as do our joint venture companies. If we fail to manage these procedures properly or fail to effectively manage a transition from manual processes to automated processes, our systems and controls may be disrupted. To manage our business effectively, we may need to implement additional management information systems, further develop our operating, administrative, financial and accounting systems and controls, add experienced senior level managers, and maintain close coordination among our executive, engineering, accounting, marketing, sales and operations organizations.
Item 2. Unregistered Sales of Equity SecuritiesSecurities and Use of Proceeds
Not applicable.
Item 3. Defaults upon Senior Securities
None
Item 4. Mine Safety Disclosures
Not applicable.
None
During our last fiscal quarter, no director or officer, as defined in Rule 16a-1(f) of the Exchange Act, adopted or terminated a “Rule 10b5-1 trading arrangement” or a “non-Rule 10b5-1 trading arrangement,” each as defined in Regulation S-K Item 408.
6580
a. Exhibits
Exhibit | | Description |
| | |
| |
|
| ||
31.1 | | |
| | |
31.2 | | |
| | |
| | |
| | |
| | |
101.INS | | Inline XBRL Instance. |
101.SCH | | Inline XBRL Taxonomy Extension Schema. |
101.CAL | | Inline XBRL Taxonomy Extension Calculation Linkbase. |
101.DEF | | Inline XBRL Taxonomy Extension Definition Linkbase. |
101.LAB | | Inline XBRL Taxonomy Extension Label Linkbase. |
101.PRE | | Inline XBRL Taxonomy Extension Presentation Linkbase. |
104 | | Cover Page Interactive Data File (formatted as inline XBRL and contained in Exhibit 101) |
(1)Incorporated by reference to exhibit 10.1 to registrant’s† The certifications attached as Exhibits 32.1 and 32.2 that accompany this Quarterly Report on Form 8-K10-Q are deemed furnished and not filed with the SECSecurities and Exchange Commission and are not to be incorporated by reference into any filing of AXT, Inc. under the Securities Act of 1933, as amended, or the Securities Exchange Act of 1934, as amended, whether made before or after the date of this Quarterly Report on August 22, 2017.Form 10-Q, irrespective of any general incorporation language contained in such filing.
*Management contract or compensatory plan.
6681
SIGNATURES
EXHIBIT INDEX
| ||
|
| |
|
| |
|
| |
|
| |
| ||
| ||
|
| |
|
| |
|
| |
|
| |
|
| |
|
|
(1)Incorporated by reference to exhibit 10.1 to registrant’s Form 8-K filed with the SEC on August 22, 2017.
*Management contract or compensatory plan
67
Pursuant to the requirements of the Securities Exchange Act of 1934, the registrant has duly caused this Report to be signed on its behalf by the undersigned, thereunto duly authorized.
| | |
| AXT, INC. | |
| | |
Dated: | By: | /s/ MORRIS S. YOUNG |
| | Morris S. Young |
| | Chief Executive Officer and Chairman of the Board of Directors |
| | (Principal Executive Officer) |
| | |
| | /s/ GARY L. FISCHER |
| | Gary L. Fischer |
| | Chief Financial Officer and Corporate Secretary |
| | (Principal Financial Officer andPrincipal Accounting Officer) |
6882