UNITED STATES
SECURITIES AND EXCHANGE COMMISSION
Washington, D.C. 20549
FORM 10-Q
(Mark One)
| |
☒ | QUARTERLY REPORT PURSUANT TO SECTION 13 OR 15(d) OF THE SECURITIES EXCHANGE ACT OF 1934 |
For the quarterly period ended September 30, 20172019
OR
| |
☐ | TRANSITION REPORT PURSUANT TO SECTION 13 OR 15(d) OF THE SECURITIES EXCHANGE ACT OF 1934 |
For the transition period from ________ to _________

DASEKE, INC.
(Exact name of registrant as specified in its charter)
| | | | |
Delaware
(State or Other Jurisdictionother jurisdiction of Incorporation)incorporation or organization) | | 001-37509
(Commission
File Number) | | 47-3913221
(IRS Employer
Identification No.) |
| | | | |
15455 Dallas Parkway, Suite 440
550
Addison, Texas | | 75001 |
(Address of Principal Executive Offices) | | (Zip Code) |
| | | | |
Registrant’s Telephone Number, Including Area Code: (972) 248-0412 Not applicable (Former name, former address and former fiscal year, if changed since last report) |
|
Indicate by check mark whether the registrant (1) has filed all reports required to be filed by Section 13 or 15(d) of the Securities Exchange Act of 1934 during the preceding 12 months (or for such shorter period that the registrant was required to file such reports), and (2) has been subject to such filing requirements for the past 90 days. Yes ☒ No ☐
Indicate by check mark whether the registrant has submitted electronically and posted on its corporate Web site, if any, every Interactive Data File required to be submitted and posted pursuant to Rule 405 of Regulation S-T (§ 232.405 of this chapter) during the preceding 12 months (or for such shorter period that the registrant was required to submit and post such files).Yes ☒ No ☐
Indicate by check mark whether the registrant is a large accelerated filer, an accelerated filer, a non-accelerated filer, smaller reporting company, or an emerging growth company. See the definitions of “large accelerated filer,” “accelerated filer,” “smaller reporting company” and “emerging growth company” in Rule 12b-2 of the Exchange Act.
| | | | |
☐ Large accelerated filer | | | | ☒ Accelerated filer |
☐ Non-accelerated filer (Do not check if a smaller | | | | ☐ Smaller reporting company)company |
| | | |
☐ Smaller reporting company | | | | ☒ Emerging growth company
|
If an emerging growth company, indicate by check mark if the registrant has elected not to use the extended transition period for complying with any new or revised financial accounting standards provided pursuant to Section 13(a) of the Exchange Act. ☐
Indicate by check mark whether the registrant is a shell company (as defined in Rule 12b-2 of the Exchange Act). Yes ☐ No ☒
| | |
Title of each class | Trading Symbol(s) | Name of each exchange on which registered |
Common Stock, par value $0.0001 per share | DSKE | The NASDAQ Capital Market |
Common shares of the registrant outstanding at November 6, 20178, 2019 were 44,392,349.64,589,075.
DASEKE, INC.
FORM 10-Q
For the Quarterly Period Ended September 30, 20172019
INDEX
Cautionary Note Regarding Forward-Looking Statements
This Quarterly Report on Form 10-Q (this Report) of Daseke, Inc. (Daseke or the Company) contains forward-looking statements within the meaning of the Private Securities Litigation Reform Act of 1995. Except as otherwise indicated by the context, references in this Report to “we,” “us” and “our” are to the consolidated business of the Company. All statements in this Report, including those made by the management of the Company, other than statements of historical fact, are forward-looking statements. These forward-looking statements are based on management’s estimates, projections and assumptions as of the date hereof. Forward-looking statements may contain words such as “may,” “will,” “expect,” “anticipate,” “continue,” “estimate,” “project,” “believe,” “plan,” “should,” “could,” “would,” “expect,” “plan,” “estimate,” “project,” “forecast,” “seek,” “target,” “anticipate,” “believe,” “estimate,” “predict,” “potential” and “continue,“potential,” the negative of these terms, or other comparable terminology. Examples of forward-lookingForward-looking statements may include statements regardingabout the Company’s goals; the Company’s financial strategy, liquidity and capital required for its business strategy and plans; the Company’s competition and government regulations; general economic conditions; and the Company’s future financial results, operating results, business strategies, projected costs, management’s plans and objectives for future acquisitions, and industry trends.results.
These forward-looking statements are based on information available as of the date of this Report (or, in the case of forward-looking statements incorporated herein by reference, as of the date of the applicable filed document), and current expectations, forecasts and assumptions. While management believes that these forward-looking statements are reasonable as and when made, there can be no assurance that future developments affecting us will be those that we anticipate.the Company anticipates. Accordingly, forward-looking statements should not be relied upon as representing the Company’s views as of any subsequent date, and the Company does not undertake any obligation to update forward-looking statements to reflect events or circumstances after the date they were made, whether as a result of new information, future events or otherwise, except as may be required under applicable securities laws. Accordingly, readers are cautioned not to place undue reliance on the forward-looking statements.
Forward-looking statements are subject to risks and uncertainties (many of which are beyond ourthe Company’s control) that could cause actual results to differ materially from ourthe Company’s historical experience and our present expectations or projections. Important factors that could cause actual results to differ materially from those in the forward-looking statements include, but are not limited to, general economic risks (such as downturns in customers’and business cycles and disruptions in capital and credit markets),risks, driver shortages and increases in driver compensation or owner-operator contracted rates, loss of senior management or key operating personnel, our ability to identify and execute future acquisitions successfully, seasonality and the impact of weather and other catastrophic events, fluctuations in the price or availability of diesel fuel, increased prices for, or decreases in the availability of, new revenue equipment and decreases in the value of used revenue equipment, ourthe failure of any restructuring actions and cost reduction initiatives that the Company undertakes to meet the expected results, the Company’s ability to generate sufficient cash to service all of ourthe Company’s indebtedness, restrictions in ourits existing and future debt agreements, increases in interest rates, changes in existing laws or regulations, including environmental and worker health safety laws and regulations and those relating to tax rates or taxes in general, the impact of governmental regulations and other governmental actions related to the Company and its operations, litigation and governmental proceedings, and insurance and claims expenses. For additional information regarding known material factors that could cause ourthe Company’s actual results to differ from ourits projected results, please see the Company’s filings with the Securities and Exchange Commission (the SEC), particularly the section titled “Risk“Item 1A. Risk Factors” in the Company’s CurrentAnnual Report on Form 8-K,10-K, filed with the SEC on March 3, 2017, as amended8, 2019, and the Company’s Quarterly Report on March 16, 2017 and May 4, 2017.Form 10-Q, filed with the SEC on August 5, 2019.
All forward-looking statements, expressed or implied, attributed to the Company or persons acting on its behalf are expressly qualified in their entirety by this cautionary statement. This cautionary statement should also be considered in connection with any subsequent written or oral forward-looking statements that the Company or persons acting on its behalf may issue.
Part I – FINANCIAL INFORMATION
Item 1. Financial Statements (Unaudited)
DASEKE, INC. AND SUBSIDIARIES
CONSOLIDATED BALANCE SHEETS
(Unaudited)
(In thousands,millions, except share and per share data)
| | | | | | | | | | | | |
| | September 30, | | December 31, | | September 30, | | December 31, |
| | 2017 | | 2016 | | 2019 | | 2018 |
ASSETS | | | | | | | | | | | | |
Current assets: | | | | | | | | | | | | |
Cash and cash equivalents | | $ | 112,510 | | $ | 3,695 | | $ | 79.6 | | $ | 46.0 |
Accounts receivable, net of allowance of $382 and $321 at September 30, 2017 and December 31, 2016, respectively | | | 106,081 | | | 54,177 | |
Accounts receivable, net of allowance of $2.6 at September 30, 2019 and $1.2 at December 31, 2018 | | | | 230.3 | | | 209.2 |
Drivers’ advances and other receivables | | | 2,809 | | | 2,632 | | | 8.0 | | | 5.5 |
Current portion of net investment in sales-type leases | | | 6,022 | | | 3,516 | | | — | | | 16.2 |
Parts supplies | | | 4,365 | | | 1,467 | | | 3.9 | | | 4.9 |
Income tax receivable | | | 111 | | | 719 | |
Prepaid and other current assets | | | 20,321 | | | 13,504 | | | 21.9 | | | 26.3 |
Total current assets | | | 252,219 | | | 79,710 | | | 343.7 | | | 308.1 |
| | | | | | | | | | | | |
Property and equipment, net | | | 369,199 | | | 318,747 | | | 463.1 | | | 572.7 |
Intangible assets, net | | | 77,541 | | | 71,653 | | | 111.0 | | | 208.8 |
Goodwill | | | 139,889 | | | 89,035 | | | 145.7 | | | 258.4 |
Right-of-use assets | | | | 97.0 | | | — |
Other long-term assets | | | 18,573 | | | 11,090 | | | 29.6 | | | 42.9 |
Total assets | | | 857,421 | | | 570,235 | | $ | 1,190.1 | | $ | 1,390.9 |
| | | | | | | | | | | | |
LIABILITIES AND STOCKHOLDERS’ EQUITY | | | | | | | | | | | | |
Current liabilities: | | | | | | | | | | | | |
Checks outstanding in excess of bank balances | | | 1,479 | | | 1,166 | |
Accounts payable | | | 12,493 | | | 4,788 | | $ | 24.0 | | $ | 22.2 |
Accrued expenses and other liabilities | | | 24,660 | | | 16,104 | | | 54.2 | | | 46.5 |
Accrued payroll, benefits and related taxes | | | 12,027 | | | 7,835 | | | 39.6 | | | 21.7 |
Accrued insurance and claims | | | 10,248 | | | 9,840 | | | 18.6 | | | 18.1 |
Current portion of long-term debt | | | 26,514 | | | 52,665 | | | 61.6 | | | 63.5 |
Other current liabilities | | | | 49.9 | | | 21.9 |
Total current liabilities | | | 87,421 | | | 92,398 | | | 247.9 | | | 193.9 |
| | | | | | | | | | | | |
Line of credit | | | — | | | 6,858 | |
Long-term debt, net of current portion | | | 395,841 | | | 208,372 | | | 639.1 | | | 622.7 |
Deferred tax liabilities | | | 114,900 | | | 92,815 | | | 66.2 | | | 126.8 |
Other long-term liabilities | | | 1,342 | | | 286 | | | 79.6 | | | 0.5 |
Subordinated debt | | | — | | | 66,443 | |
Total liabilities | | | 599,504 | | | 467,172 | | | 1,032.8 | | | 943.9 |
| | | | | | | | | | | | |
Commitments and contingencies (Note 15) | | | | | | | |
Commitments and contingencies (Note 14) | | | | | | | |
| | | | | | | | | | | | |
Stockholders’ equity: | | | | | | | | | | | | |
Series A convertible preferred stock, $0.0001 par value; 10,000,000 shares authorized; 650,000 shares issued with liquidation preference of $65,000 | | | 65,000 | | | — | |
Series B convertible preferred stock, $0.01 par value; 75,000 shares authorized; zero and 64,500 shares issued and outstanding at September 30, 2017 and December 31, 2016, respectively | | | — | | | 1 | |
Common stock, par value $0.0001 per share; 250,000,000 shares authorized, 44,480,232 and 20,980,961 shares issued and outstanding at September 30, 2017 and December 31, 2016, respectively | | | 4 | | | 1 | |
Series A convertible preferred stock, $0.0001 par value; 10,000,000 shares authorized; 650,000
shares issued with liquidation preference of $65.0 at September 30, 2019 and December 31, 2018 | | | | 65.0 | | | 65.0 |
Common stock, par value $0.0001 per share; 250,000,000 shares authorized, 64,583,275 and
64,455,174 shares issued and outstanding at September 30, 2019 and December 31, 2018, respectively | | | | — | | | — |
Additional paid-in-capital | | | 222,102 | | | 117,807 | | | 436.6 | | | 433.9 |
Accumulated deficit | | | (30,221) | | | (14,694) | | | (343.7) | | | (51.0) |
Accumulated other comprehensive income (loss) | | | 1,032 | | | (52) | |
Accumulated other comprehensive loss | | | | (0.6) | | | (0.9) |
Total stockholders’ equity | | | 257,917 | | | 103,063 | | | 157.3 | | | 447.0 |
Total liabilities and stockholders’ equity | | $ | 857,421 | | $ | 570,235 | | $ | 1,190.1 | | $ | 1,390.9 |
The accompanying notes are an integral part of the consolidated financial statements.
DASEKE, INC. AND SUBSIDIARIES
CONSOLIDATED STATEMENTS OF OPERATIONS AND COMPREHENSIVE INCOME (LOSS)
(Unaudited)
(In thousands,millions, except share and per share data)
| | | | | | | | | | | | | | | | | | | | | | | | |
| | Three Months Ended | | Nine Months Ended | | Three Months Ended | | Nine Months Ended |
| | September 30, | | September 30, | | September 30, | | September 30, |
| | 2017 | | 2016 | | 2017 | | 2016 | | 2019 | | 2018 | | 2019 | | 2018 |
Revenues: | | | | | | | | | | | | | | | | | | | | | | | | |
Freight | | $ | 171,245 | | $ | 135,415 | | $ | 446,454 | | $ | 398,466 | |
Company freight | | | $ | 205.2 | | $ | 206.9 | | $ | 618.2 | | $ | 511.4 |
Owner operator freight | | | | 118.3 | | | 122.6 | | | 351.1 | | | 330.7 |
Brokerage | | | 34,198 | | | 25,977 | | | 83,723 | | | 68,358 | | | 78.6 | | | 82.2 | | | 222.8 | | | 188.4 |
Logistics | | | 7,871 | | | — | | | 10,571 | | | — | | | 13.5 | | | 11.6 | | | 39.0 | | | 31.3 |
Fuel surcharge | | | 18,008 | | | 12,756 | | | 48,331 | | | 34,562 | | | 34.8 | | | 38.3 | | | 102.9 | | | 104.3 |
Total revenue | | | 231,322 | | | 174,148 | | | 589,079 | | | 501,386 | | | 450.4 | | | 461.6 | | | 1,334.0 | | | 1,166.1 |
| | | | | | | | | | | | | | | | | | | | | | | | |
Operating expenses: | | | | | | | | | | | | | | | | | | | | | | | | |
Salaries, wages and employee benefits | | | 64,955 | | | 49,298 | | | 174,253 | | | 149,861 | | | 127.7 | | | 114.8 | | | 371.1 | | | 287.7 |
Fuel | | | 24,734 | | | 17,296 | | | 64,423 | | | 49,076 | | | 34.1 | | | 38.9 | | | 105.3 | | | 103.7 |
Operations and maintenance | | | 35,132 | | | 27,874 | | | 86,332 | | | 72,933 | | | 56.8 | | | 51.5 | | | 164.7 | | | 126.4 |
Communications | | | 539 | | | 370 | | | 1,491 | | | 1,208 | | | 1.0 | | | 0.9 | | | 3.2 | | | 2.4 |
Purchased freight | | | 61,598 | | | 42,541 | | | 148,945 | | | 120,501 | | | 155.5 | | | 170.6 | | | 458.5 | | | 429.9 |
Administrative expenses | | | 8,619 | | | 5,221 | | | 24,019 | | | 17,711 | | | 21.4 | | | 16.1 | | | 54.7 | | | 41.3 |
Sales and marketing | | | 488 | | | 435 | | | 1,425 | | | 1,280 | | | 1.3 | | | 1.0 | | | 3.8 | | | 2.3 |
Taxes and licenses | | | 2,963 | | | 2,268 | | | 7,855 | | | 6,946 | | | 4.8 | | | 4.7 | | | 14.7 | | | 12.3 |
Insurance and claims | | | 6,351 | | | 5,065 | | | 15,516 | | | 13,648 | | | 13.4 | | | 12.7 | | | 38.1 | | | 32.4 |
Acquisition-related transaction expenses | | | 773 | | | — | | | 2,255 | | | 18 | | | — | | | 0.6 | | | — | | | 2.4 |
Depreciation and amortization | | | 19,805 | | | 16,998 | | | 53,758 | | | 50,515 | | | 38.3 | | | 36.8 | | | 119.5 | | | 93.8 |
(Gain) loss on disposition of revenue property and equipment | | | (339) | | | (495) | | | (513) | | | 158 | |
Impairment of revenue property and equipment | | | — | | | 1,195 | | | — | | | 1,195 | |
Gain on disposition of property and equipment | | | | (1.0) | | | (0.9) | | | (2.1) | | | (1.5) |
Impairment | | | | 306.8 | | | — | | | 306.8 | | | 2.8 |
Restructuring charges | | | | 6.9 | | | — | | | 6.9 | | | — |
Total operating expenses | | | 225,618 | | | 168,066 | | | 579,759 | | | 485,050 | | | 767.0 | | | 447.7 | | | 1,645.2 | | | 1,135.9 |
Income from operations | | | 5,704 | | | 6,082 | | | 9,320 | | | 16,336 | |
Income (loss) from operations | | | | (316.6) | | | 13.9 | | | (311.2) | | | 30.2 |
| | | | | | | | | | | | | | | | | | | | | | | | |
Other (income) expense: | | | | | | | | | | | | | |
Other expense (income): | | | | | | | | | | | | | |
Interest income | | | (76) | | | (4) | | | (130) | | | (40) | | | (0.3) | | | (0.2) | | | (0.7) | | | (1.2) |
Interest expense | | | 8,624 | | | 6,724 | | | 21,064 | | | 17,521 | | | 12.8 | | | 11.9 | | | 38.2 | | | 33.2 |
Write-off of unamortized deferred financing fees | | | — | | | — | | | 3,883 | | | — | |
Write-off of deferred financing fees | | | | 2.0 | | | — | | | 2.0 | | | — |
Other | | | (32) | | | (64) | | | (247) | | | (266) | | | — | | | (0.7) | | | (1.3) | | | (2.5) |
Total other expense | | | 8,516 | | | 6,656 | | | 24,570 | | | 17,215 | | | 14.5 | | | 11.0 | | | 38.2 | | | 29.5 |
| | | | | | | | | | | | | | | | | | | | | | | | |
Loss before provision (benefit) for income taxes | | | (2,812) | | | (574) | | | (15,250) | | | (879) | |
Income (loss) before benefit for income taxes | | | | (331.1) | | | 2.9 | | | (349.4) | | | 0.7 |
Provision (benefit) for income taxes | | | (2,862) | | | 683 | | | (3,448) | | | 607 | | | (57.8) | | | 0.7 | | | (60.4) | | | (14.2) |
Net income (loss) | | | 50 | | | (1,257) | | | (11,802) | | | (1,486) | | | (273.3) | | | 2.2 | | | (289.0) | | | 14.9 |
| | | | | | | | | | | | | | | | | | | | | | | | |
Other comprehensive income (loss): | | | | | | | | | | | | | | | | | | | | | | | | |
Unrealized income (loss) on interest rate swaps | | | — | | | 61 | | | 52 | | | (1) | |
Foreign currency translation adjustments | | | 526 | | | — | | | 1,032 | | | — | |
Foreign currency translation adjustments, net of tax of $0.1, $0.1, $(0.2) and $(0.1), respectively | | | | (0.2) | | | 0.3 | | | 0.3 | | | (0.6) |
Comprehensive income (loss) | | | 576 | | | (1,196) | | | (10,718) | | | (1,487) | | | (273.5) | | | 2.5 | | | (288.7) | | | 14.3 |
| | | | | | | | | | | | | | | | | | | | | | | | |
Net income (loss) | | | 50 | | | (1,257) | | | (11,802) | | | (1,486) | | | (273.3) | | | 2.2 | | | (289.0) | | | 14.9 |
Less dividends to Series A convertible preferred stockholders | | | (1,225) | | | — | | | (2,919) | | | — | | | (1.2) | | | (1.2) | | | (3.7) | | | (3.7) |
Less dividends to Series B convertible preferred stockholders | | | — | | | (1,243) | | | (806) | | | (3,729) | |
Net loss attributable to common stockholders | | $ | (1,175) | | $ | (2,500) | | $ | (15,527) | | $ | (5,215) | |
Net income (loss) attributable to common stockholders | | | $ | (274.5) | | $ | 1.0 | | $ | (292.7) | | $ | 11.2 |
| | | | | | | | | | | | | | | | | | | | | | | | |
Net loss per common share: | | | | | | | | | | | | | |
Net income (loss) per common share: | | | | | | | | | | | | | |
Basic and Diluted | | $ | (0.03) | | $ | (0.12) | | $ | (0.45) | | $ | (0.25) | | $ | (4.25) | | $ | 0.01 | | $ | (4.54) | | $ | 0.18 |
Weighted-average common shares outstanding: | | | | | | | | | | | | | | | | | | | | | | | | |
Basic and Diluted | | | 39,359,523 | | | 20,980,961 | | | 34,790,861 | | | 20,980,961 | | | 64,583,275 | | | 65,289,320 | | | 64,525,777 | | | 60,413,694 |
| | | | | | | | | | | | | | | | | | | | | | | | |
Dividends declared per Series A convertible preferred share | | $ | 1.91 | | $ | — | | $ | 2.59 | | $ | — | | $ | 1.91 | | $ | 1.91 | | $ | 5.72 | | $ | 5.72 |
Dividends declared per Series B convertible preferred share | | $ | — | | $ | 18.75 | | $ | 12.50 | | $ | 18.75 | |
The accompanying notes are an integral part of the consolidated financial statements.
DASEKE, INC. AND SUBSIDIARIES
CONSOLIDATED STATEMENT OF CHANGES IN STOCKHOLDERS’ EQUITY
Nine Months Ended September 30, 20172019
(Unaudited)
(In thousands,millions, except share data)
| | | | | | | | | | | | | | | | | | | | | | | | | | | |
| | Series A Convertible | | Series B Convertible | | | | | | | | | | | | Accumulated | | | |
| | Preferred Stock | | Preferred Stock | | Common Stock | | | | | | | Other | | | |
| | | | | | | | Par | | | | Par | | Additional | | Accumulated | | Comprehensive | | | |
| | Shares | | Amount | | Shares | | Value | | Shares | | Value | | Paid- In Capital | | Deficit | | Income (Loss) | | Total |
Balance, January 1, 2017 as previously reported | | — | | $ | — | | 64,500 | | $ | 1 | | 145,495 | | $ | 1 | | $ | 117,807 | | $ | (14,694) | | $ | (52) | | $ | 103,063 |
Effect of reverse acquisition | | — | | | — | | — | | | — | | 20,835,466 | | | 1 | | | — | | | — | | | — | | | 1 |
Balance at January 1, 2017 | | — | | | — | | 64,500 | | | 1 | | 20,980,961 | | | 2 | | | 117,807 | | | (14,694) | | | (52) | | | 103,064 |
Income on interest rate swaps | | — | | | — | | — | | | — | | — | | | — | | | — | | | — | | | 52 | | | 52 |
Series B convertible preferred stock dividend | | — | | | — | | — | | | — | | — | | | — | | | — | | | (806) | | | — | | | (806) |
Repurchase of common shares | | — | | | — | | — | | | — | | (3,616,781) | | | (1) | | | (36,167) | | | — | | | — | | | (36,168) |
Conversion of Series B convertible preferred stock to common shares | | — | | | — | | (64,500) | | | (1) | | 9,301,150 | | | 1 | | | — | | | — | | | — | | | — |
Shares assumed by legal acquirer | | — | | | — | | — | | | — | | 11,050,630 | | | 1 | | | 83,639 | | | — | | | — | | | 83,640 |
Settlement of legal acquirer transaction costs | | — | | | — | | — | | | — | | — | | | — | | | (19,063) | | | — | | | — | | | (19,063) |
Issuance of Series A convertible preferred stock | | 650,000 | | | 65,000 | | — | | | — | | — | | | — | | | — | | | — | | | — | | | 65,000 |
Issuance of common stock | | — | | | — | | — | | | — | | 6,764,272 | | | 1 | | | 74,685 | | | — | | | — | | | 74,686 |
Series A convertible preferred stock dividend | | — | | | — | | — | | | — | | — | | | — | | | — | | | (2,919) | | | — | | | (2,919) |
Stock-based compensation expense | | — | | | — | | — | | | — | | — | | | — | | | 1,201 | | | — | | | — | | | 1,201 |
Foreign currency translation adjustments | | — | | | — | | — | | | — | | — | | | — | | | — | | | — | | | 1,032 | | | 1,032 |
Net loss | | — | | | — | | — | | | — | | — | | | — | | | — | | | (11,802) | | | — | | | (11,802) |
Balance at September 30, 2017 | | 650,000 | | $ | 65,000 | | — | | $ | — | | 44,480,232 | | $ | 4 | | $ | 222,102 | | $ | (30,221) | | $ | 1,032 | | $ | 257,917 |
| | | | | | | | | | | | | | | | | | | | | | |
| | Series A Convertible | | | | | | | | | | | | Accumulated | | | |
| | Preferred Stock | | Common Stock | | | | | | | Other | | | |
| | | | | | | | Par | | Additional | | Accumulated | | Comprehensive | | | |
| | Shares | | Amount | | Shares | | Value | | Paid- In Capital | | Deficit | | Income (Loss) | | Total |
Balance at January 1, 2019 | | 650,000 | | $ | 65.0 | | 64,455,174 | | $ | — | | $ | 433.9 | | $ | (51.0) | | $ | (0.9) | | $ | 447.0 |
Vesting of restricted stock units | | — | | | — | | 14,498 | | | — | | | — | | | — | | | — | | | — |
Series A convertible preferred stock dividend | | — | | | — | | — | | | — | | | — | | | (1.2) | | | — | | | (1.2) |
Stock-based compensation expense | | — | | | — | | — | | | — | | | 1.0 | | | — | | | — | | | 1.0 |
Foreign currency translation adjustments | | — | | | — | | — | | | — | | | — | | | — | | | 0.1 | | | 0.1 |
Net loss | | — | | | — | | — | | | — | | | — | | | (9.3) | | | — | | | (9.3) |
Balance at March 31, 2019 | | 650,000 | | $ | 65.0 | | 64,469,672 | | $ | — | | $ | 434.9 | | $ | (61.5) | | $ | (0.8) | | $ | 437.6 |
Vesting of restricted stock units | | — | | | — | | 110,321 | | | — | | | (0.2) | | | — | | | — | | | (0.2) |
Series A convertible preferred stock dividend | | — | | | — | | — | | | — | | | — | | | (1.3) | | | — | | | (1.3) |
Stock-based compensation expense | | — | | | — | | — | | | — | | | 0.9 | | | — | | | — | | | 0.9 |
Foreign currency translation adjustments | | — | | | — | | — | | | — | | | — | | | — | | | 0.4 | | | 0.4 |
Net loss | | — | | | — | | — | | | — | | | — | | | (6.4) | | | — | | | (6.4) |
Balance at June 30, 2019 | | 650,000 | | $ | 65.0 | | 64,579,993 | | $ | — | | $ | 435.6 | | $ | (69.2) | | $ | (0.4) | | $ | 431.0 |
Vesting of restricted stock units | | — | | | — | | 3,282 | | | — | | | — | | | — | | | — | | | — |
Series A convertible preferred stock dividend | | — | | | — | | — | | | — | | | — | | | (1.2) | | | — | | | (1.2) |
Stock-based compensation expense | | — | | | — | | — | | | — | | | 1.0 | | | — | | | — | | | 1.0 |
Foreign currency translation adjustments | | — | | | — | | — | | | — | | | — | | | — | | | (0.2) | | | (0.2) |
Net loss | | — | | | — | | — | | | — | | | — | | | (273.3) | | | — | | | (273.3) |
Balance at September 30, 2019 | | 650,000 | | $ | 65.0 | | 64,583,275 | | $ | — | | $ | 436.6 | | $ | (343.7) | | $ | (0.6) | | $ | 157.3 |
The accompanying notes are an integral part of the consolidated financial statements.
DASEKE, INC. AND SUBSIDIARIES
CONSOLIDATED STATEMENT OF CHANGES IN STOCKHOLDERS’ EQUITY
Nine Months Ended September 30, 2018
(Unaudited)
(In millions, except share data)
| | | | | | | | | | | | | | | | | | | | | | |
| | Series A Convertible | | | | | | | | | | | | Accumulated | | | |
| | Preferred Stock | | Common Stock | | | | | | | Other | | | |
| | | | | | | | Par | | Additional | | Retained | | Comprehensive | | | |
| | Shares | | Amount | | Shares | | Value | | Paid- In Capital | | Earnings | | Income (Loss) | | Total |
Balance at January 1, 2018 | | 650,000 | | $ | 65.0 | | 48,712,288 | | $ | — | | $ | 277.9 | | $ | 7.3 | | $ | 1.0 | | $ | 351.2 |
Exercise of stock options | | — | | | — | | 5,000 | | | — | | | 0.1 | | | — | | | — | | | 0.1 |
Series A convertible preferred stock dividend | | — | | | — | | — | | | — | | | — | | | (1.2) | | | — | | | (1.2) |
Stock-based compensation expense | | — | | | — | | — | | | — | | | 0.9 | | | — | | | — | | | 0.9 |
Issuance of common stock | | — | | | — | | 8,545,000 | | | — | | | 84.5 | | | — | | | — | | | 84.5 |
Foreign currency translation adjustments | | — | | | — | | — | | | — | | | — | | | — | | | (0.3) | | | (0.3) |
Net loss | | — | | | — | | — | | | — | | | — | | | (0.8) | | | — | | | (0.8) |
Balance at March 31, 2018 | | 650,000 | | $ | 65.0 | | 57,262,288 | | $ | — | | $ | 363.4 | | $ | 5.3 | | $ | 0.7 | | $ | 434.4 |
Series A convertible preferred stock dividend | | — | | | — | | — | | | — | | | — | | | (1.3) | | | — | | | (1.3) |
Stock-based compensation expense | | — | | | — | | — | | | — | | | 0.9 | | | — | | | — | | | 0.9 |
Issuance of common stock | | — | | | — | | 1,612,979 | | | — | | | 15.4 | | | — | | | — | | | 15.4 |
Issuance of earnout shares | | — | | | — | | 5,000,000 | | | — | | | 48.2 | | | (48.2) | | | — | | | — |
Foreign currency translation adjustments | | — | | | — | | — | | | — | | | — | | | — | | | (0.6) | | | (0.6) |
Net income | | — | | | — | | — | | | — | | | — | | | 13.5 | | | — | | | 13.5 |
Balance at June 30, 2018 | | 650,000 | | $ | 65.0 | | 63,875,267 | | $ | — | | $ | 427.9 | | $ | (30.7) | | $ | 0.1 | | $ | 462.3 |
Exercise of warrants | | — | | | — | | 2 | | | — | | | — | | | — | | | — | | | — |
Vesting of restricted stock units | | — | | | — | | 74,713 | | | — | | | (0.4) | | | — | | | — | | | (0.4) |
Series A convertible preferred stock dividend | | — | | | — | | — | | | — | | | — | | | (1.2) | | | — | | | (1.2) |
Stock-based compensation expense | | — | | | — | | — | | | — | | | 0.9 | | | — | | | — | | | 0.9 |
Issuance of common stock | | — | | | — | | 495,389 | | | — | | | 4.4 | | | — | | | — | | | 4.4 |
Foreign currency translation adjustments | | — | | | — | | — | | | — | | | — | | | — | | | 0.3 | | | 0.3 |
Net income | | — | | | — | | — | | | — | | | — | | | 2.2 | | | — | | | 2.2 |
Balance at September 30, 2018 | | 650,000 | | $ | 65.0 | | 64,445,371 | | $ | — | | $ | 432.8 | | $ | (29.7) | | $ | 0.4 | | $ | 468.5 |
The accompanying notes are an integral part of the consolidated financial statements.
DASEKE, INC. AND SUBSIDIARIES
CONSOLIDATED STATEMENTS OF CASH FLOWS
(Unaudited)
(in thousands)millions)
| | | | | | | | | | | | |
| | Nine months ended | | Nine Months Ended |
| | September 30, | | September 30, |
| | 2017 | | 2016 | | 2019 | | 2018 |
Cash flows from operating activities | | | | | | | | | | | | |
Net loss | | $ | (11,802) | | $ | (1,486) | |
Adjustments to reconcile net loss to net cash provided by operating activities | | | | | | | |
Net income (loss) | | | $ | (289.0) | | $ | 14.9 |
Adjustments to reconcile net income (loss) to net cash provided by operating activities | | | | | | | |
Depreciation | | | 49,109 | | | 45,973 | | | 107.1 | | | 81.6 |
Amortization of intangible assets | | | 4,649 | | | 4,542 | | | 12.4 | | | 12.2 |
Amortization of deferred financing fees | | | 1,330 | | | 934 | | | 2.4 | | | 2.2 |
Non-cash operating lease expense | | | | 19.7 | | | — |
Write-off of deferred financing fees | | | 3,883 | | | — | | | 2.0 | | | — |
Stock-based compensation expense | | | 1,201 | | | — | | | 2.9 | | | 2.7 |
Deferred taxes | | | (4,849) | | | (245) | | | (60.4) | | | (16.1) |
Bad debt expense | | | 347 | | | 176 | | | 2.7 | | | 0.6 |
Non-cash interest expense | | | 92 | | | 805 | |
(Gain) loss on disposition of property and equipment | | | (513) | | | 158 | |
Gain on disposition of property and equipment | | | | (2.1) | | | (1.5) |
Gain on disposition of building | | | | — | | | (0.8) |
Deferred gain recognized on sales-type leases | | | (793) | | | (532) | | | — | | | (2.0) |
Impairment of revenue equipment | | | — | | | 1,195 | |
Impairment | | | | 306.8 | | | 2.8 |
Restructuring charges | | | | 6.9 | | | — |
Changes in operating assets and liabilities | | | | | | | | | | | | |
Accounts receivable | | | (28,567) | | | (7,156) | | | (23.5) | | | (57.5) |
Drivers’ advances and other receivables | | | 547 | | | (274) | | | (2.4) | | | (0.6) |
Payments received on sales-type leases | | | 3,774 | | | 2,776 | | | — | | | 10.5 |
Other current assets | | | (339) | | | 3,524 | |
Prepaid and other current assets | | | | (2.3) | | | (9.5) |
Accounts payable | | | 2,911 | | | 894 | | | 1.8 | | | (5.6) |
Accrued expenses and other liabilities | | | 5,478 | | | (2,176) | | | 4.4 | | | 12.9 |
Net cash provided by operating activities | | | 26,458 | | | 49,108 | | | 89.4 | | | 46.8 |
| | | | | | | | | | | | |
Cash flows from investing activities | | | | | | | | | | | | |
Purchase of property and equipment | | | (15,565) | | | (3,143) | |
Purchases of property and equipment | | | | (17.4) | | | (58.8) |
Proceeds from sale of property and equipment | | | 5,252 | | | 4,424 | | | 23.8 | | | 15.5 |
Cash paid in acquisitions, net of cash acquired | | | (91,133) | | | — | |
Cash paid for acquisitions, net of cash received | | | | — | | | (131.8) |
Net cash provided by (used in) investing activities | | | (101,446) | | | 1,281 | | | 6.4 | | | (175.1) |
| | | | | | | | | | | | |
Cash flows from financing activities: | | | | | | | | | | | | |
Checks outstanding in excess of bank balances | | | 313 | | | 317 | |
Advances on line of credit | | | 543,404 | | | 528,664 | | | 980.8 | | | 775.0 |
Repayments on line of credit | | | (550,261) | | | (528,603) | | | (980.8) | | | (763.9) |
Principal payments on and payoff of long-term debt | | | (231,817) | | | (59,656) | |
Proceeds from Term Loan Facility | | | 350,000 | | | 14,188 | |
Advances on long-term debt | | | | — | | | 6.1 |
Principal payments on long-term debt | | | | (57.8) | | | (41.0) |
Deferred financing fees | | | (14,411) | | | (1,788) | | | (0.4) | | | (1.0) |
Pay off of subordinated debt | | | (66,715) | | | — | |
Issuance of common stock | | | 128,184 | | | — | |
Repurchase of common stock | | | (36,168) | | | — | |
Issuance of Series A convertible preferred stock | | | 65,000 | | | — | |
Proceeds from issuance of common stock | | | | — | | | 84.2 |
Series A convertible preferred stock dividends | | | (1,680) | | | — | | | (3.7) | | | (3.7) |
Series B convertible preferred stock dividends | | | (2,016) | | | (3,628) | |
Net cash provided by (used in) financing activities | | | 183,833 | | | (50,506) | | | (61.9) | | | 55.7 |
| | | | | | | | | | | | |
Effect of exchange rates on cash and cash equivalents | | | (30) | | | — | | | (0.3) | | | — |
| | | | | | | | | | | | |
Net increase (decrease) in cash and cash equivalents | | | 108,815 | | | (117) | | | 33.6 | | | (72.6) |
Cash and cash equivalents – beginning of period | | | 3,695 | | | 4,886 | | | 46.0 | | | 90.7 |
Cash and cash equivalents – end of period | | $ | 112,510 | | $ | 4,769 | | $ | 79.6 | | $ | 18.1 |
The accompanying notes are an integral part of the consolidated financial statements.
DASEKE, INC. AND SUBSIDIARIES
CONSOLIDATED STATEMENTS OF CASH FLOWS – (Continued)
(Unaudited)
(in thousands)millions)
| | | | | | | | | | | | |
| | Nine months ended | | Nine Months Ended |
| | September 30, | | September 30, |
| | 2017 | | 2016 | | 2019 | | 2018 |
Supplemental disclosure of cash flow information | | | | | | | | | | | | |
Cash paid for interest | | $ | 20,916 | | $ | 15,637 | | $ | 35.6 | | $ | 31.0 |
Cash paid for income taxes | | $ | 629 | | $ | 942 | | | 1.6 | | | 1.8 |
| | | | | | | | | | | | |
Noncash investing and financing activities | | | | | | | | | | | | |
Property and equipment acquired with debt or capital lease obligations | | $ | 13,609 | | $ | 32,517 | |
Property and equipment acquired with debt or finance lease obligations | | | | 65.6 | | | 36.1 |
Accrued capital expenditures | | | | — | | | 5.9 |
Property and equipment sold for notes receivable | | $ | 412 | | $ | 408 | | | 0.4 | | | 0.4 |
Property and equipment transferred to sales-type lease | | $ | 7,042 | | $ | 6,193 | | | — | | | 8.4 |
Assets held for sale returned to property and equipment | | $ | — | | $ | 351 | |
Sales-type lease returns to property and equipment | | $ | 724 | | $ | 1,188 | | | — | | | 0.5 |
Sales-type lease assets acquired with debt or capital lease obligations | | | | — | | | 9.9 |
Sales-type lease assets sold for notes receivable | | $ | 21,488 | | $ | 18,609 | | | — | | | 46.2 |
Sales-type lease returns to sales-type lease assets | | $ | 13,795 | | $ | 12,026 | | | — | | | 24.0 |
Common stock issued in acquisitions | | $ | 11,079 | | $ | — | | | — | | | 19.7 |
Accrued Series A convertible preferred dividends | | $ | 1,239 | | $ | — | |
Accrued Series B convertible preferred dividends | | $ | — | | $ | 1,378 | |
Issuance of earnout shares | | | | — | | | 48.2 |
Right-of-use assets acquired | | | $ | 33.5 | | $ | — |
The accompanying notes are an integral part of the consolidated financial statements.
Table of Contents
DASEKE, INC. AND SUBSIDIARIES
NOTES TO CONSOLIDATED FINANCIAL STATEMENTS
(Unaudited)
NOTE 1 – NATURE OF OPERATIONS AND SUMMARY OF SIGNIFICANT ACCOUNTING POLICIES
Nature of Operations
The registrant was originally formed in April 2015 as a special purpose acquisition company (SPAC) under the name Hennessy Capital Acquisition Corp. II (Hennessy). As a SPAC, Hennessy had no operations and its purpose was to go public with the intention of merging withDaseke, Inc.’s (the Company or acquiring an operating company with the proceeds of the SPAC’s initial public offering (the IPO).
On February 27, 2017, Hennessy consummated the Business Combination (as defined and described in Note 2) with Daseke, Inc. Upon consummation of the Business Combination, Daseke, Inc. changed its name toDaseke) wholly-owned subsidiary Daseke Companies, Inc. and Hennessy changed its name to Daseke, Inc.
Daseke, Inc., was formedincorporated in December 2008 and began operations on January 1, 2009. Daseke is engaged in full service open-deck trucking that specializes primarily in flatbed truckload and heavy haul transportation of specialized items throughout the United States, and Canada and into Mexico with trailers.Mexico. The Company also provides logistical planning and warehousing services to customers. The Company is subject to regulation by the Department of Transportation, the Department of Defense, the Department of Energy, and various state regulatory authorities. Additionally, due toauthorities in the recent acquisition of R&R Trucking Holdings, LLC (see Note 3), theUnited States. The Company is also subject to regulationsregulation by the DepartmentMinistries of DefenseTransportation and the Department of Energy.
Unless expressly stated otherwise, references to the Company or Daseke refers to Daseke, Inc.Communications and its wholly owned subsidiaries, Hennessy refers to the registrant prior to the closing of the Business Combination, and Private Daseke refers to Daseke, Inc. and its subsidiaries prior to the closing of the Business Combination.various provincial regulatory authorities in Canada.
Basis of Presentation
These interim consolidated financial statements have been prepared in accordance with accounting principles generally accepted in the United States of America (GAAP) for interim financial information and with the instructions for Form 10-Q and Article 10 of Regulation S-X. Accordingly, they do not include all of the information and footnotes required by GAAP for complete financial statements. In the opinion of management, all adjustments (consisting of normal recurring accruals) considered necessary for a fair presentation have been included. Operating results for the three and nine month periodsmonths ended September 30, 20172019 are not necessarily indicative of the results that may be expected for the year ended December 31, 2017.2019.
The consolidated balance sheet as of December 31, 20162018 has been derived from the audited consolidated financial statements at that date. For additional information, including the Company’s significant accounting policies, refer to the consolidated financial statements and related footnotes for the year ended December 31, 20162018 as set forth in the Company’s CurrentAnnual Report on Form 8-K/A,10-K, filed with the SEC on March 16, 2017.8, 2019.
Certain items have been reclassified for presentation purposes to conform to the accounting policies of the consolidated entity. These reclassifications had no material impact on income from operations, net loss and comprehensive loss, the balance sheets or statements of cash flows.
Principles of Consolidation
The consolidated financial statements include the accounts of Daseke, Inc. and its wholly ownedwholly-owned subsidiaries. All significant intercompany balances and transactions have been eliminated in consolidation.
Use of Estimates
The preparation of the consolidated financial statements in accordance with GAAP requires management to make estimates and assumptions that affect the reported amounts of assets and liabilities and disclosure of contingent assets and liabilities at the date of the consolidated financial statements and the reported amounts of revenues and expenses during the reporting period. Actual results could differ from those estimates.
Table of Contents
DASEKE, INC. AND SUBSIDIARIES
NOTES TO CONSOLIDATED FINANCIAL STATEMENTS – (Continued)
(Unaudited)
NOTE 1 – NATURE OF OPERATIONS AND SUMMARY OF SIGNIFICANT ACCOUNTING POLICIES – (Continued)
Deferred Financing Fees
In conjunction with obtaining long-term debt, the Company incurred financing costs which are being amortized using the straight-line method, which approximates the effective interest rate method, over the terms of the obligations. As of September 30, 20172019 and December 31, 2016,2018, the balance of deferred financing feesfinance charges was $13.3$12.5 million and $4.1$16.2 million, respectively, which is included as a reduction of long-term debt, net of current portion in the consolidated balance sheets. Amortization expense was $0.5$0.9 million and $0.3$0.7 million for the three months ended September 30, 20172019 and 2016, respectively,2018, and $1.3$2.4 million and $0.9$2.2 million for the nine months ended September 30, 20172019 and 2016, respectively, which2018, respectively. Amortization expense is included in interest expense. In February 2017,expense in conjunction with new term loan financing discussed in Note 9,the consolidated statements of operations and comprehensive income (loss). During the third quarter of 2019, the Company incurred deferred financing costs of $14.2expensed $2.0 million and expensed unamortizedto write-off certain deferred financing fees totaling $3.9 million.due to unsuccessful efforts to restructure the debt facilities.
Impairment of Long-Lived Assets
Long-lived assets are reviewed for impairment at the asset group level whenever events or changes in circumstances indicate that the carrying value may not be recoverable. If the sum of the expected future undiscounted cash flow is less than the carrying amount of the asset, an impairment is indicated. A loss is then recognized for the difference, if any, between the fair value of the asset (as estimated by management using its best judgment) and the carrying value of the asset. If actual market value is less favorable than that estimated by management, additional write-downs may be required. In the three months ended September 30, 2019, the Company recognized asset impairments, which
are more fully described in Notes 2, 5 and 7.
Fair Value Measurements
The Company follows the accounting guidance for fair value measurements of financial assets and financial liabilities and for fair value measurements of nonfinancial items that are recognized or disclosed at fair value in the financial statements on a recurring basis. Fair value guidance defines fair value as the price that would be received to sell an asset or paid to transfer a liability in an orderly transaction between market participants at the measurement date. It also establishes a framework for measuring fair value and expands disclosures about fair value measurements. The three levels of the fair value framework are as follows:
Level 1 - Quoted market prices in active markets for identical assets or liabilities.
Level 2 - Observable market-based inputs or unobservable inputs that are corroborated by market data.
Level 3 - Unobservable inputs reflecting the reporting entity’s own assumptions or external inputs from inactive markets.
A financial asset or liability’s classification within the framework is determined based on the lowest level of input that is significant to the fair value measurement.
Contingent Consideration
The contingent consideration liabilities, included in other current liabilities on the consolidated balance sheet, represent future payment obligations for certain EBITDA thresholds related to the Company’s acquisitions over a defined period of time. See Note 3 for additional details on the future payment obligations connected to the Company’s acquisitions. The fair value of the Company’s interest rate swaps iscontingent consideration liabilities are determined using cash flow computer models with unobservable inputs,estimates based on discount rates that reflect the risk involved and the projected EBITDA of the acquired businesses, therefore the liability for interest rate swaps isliabilities are classified within Level 3 of the fair value framework. In conjunction with the Business Combination discussed in Note 2, the Company’s lone interest rate swap was terminated. AtThe balance of contingent consideration as of September 30, 2019 and December 31, 2016, the fair value of this liability2018 was $51,871$21.5 million and is classified in accrued expenses and other liabilities on the consolidated balance sheets. $21.9 million, respectively. The tablestable below areis a summary of the changes in the fair value of this liability for the three and nine months ended September 30, 20172019 and 20162018 (in thousands)millions):
| | | |
| | 2016
|
Balance at January 1, 2016
| | $
| (124)
|
Change in fair value
| | | (63)
|
| | | |
Balance at June 30, 2016
| | | (187)
|
Change in fair value
| | | 72
|
Balance at September 30, 2016
| | $
| (115)
|
| | | | | | |
| | Nine Months Ended |
| | September 30, |
| | 2019 | | 2018 |
Balance at beginning of period | | $ | 21.9 | | $ | 0.8 |
Fair value of earn-out liability for acquisition | | | — | | | 20.3 |
Change in fair value | | | (0.4) | | | (0.7) |
Balance at end of period | | $ | 21.5 | | $ | 20.4 |
| | | |
| | 2017
|
Balance at January 1, 2017
| | $
| (52)
|
Change in fair value
| | | 52
|
| | | |
Balance at June 30, 2017
| | | —
|
Change in fair value
| | | —
|
Balance at September 30, 2017
| | $
| —
|
Table of Contents
DASEKE, INC. AND SUBSIDIARIES
NOTES TO CONSOLIDATED FINANCIAL STATEMENTS – (Continued)
(Unaudited)
NOTE 1 – NATURE OF OPERATIONS AND SUMMARY OF SIGNIFICANT ACCOUNTING POLICIES – (Continued)
Stock-Based Compensation
Awards of equity instruments issued to employees and directors are accounted for under the fair value method of accounting and recognized in the consolidated statements of operations.operations and comprehensive income (loss). Compensation cost is measured for all stock-based awards at fair value on the date of grant and recognized using the straight-line method over the service period over which the awards are expected to vest.
Fair value of all time-vested options as of the date of grant is estimated using the Black-Scholes option valuation model, which was developed for use in estimating the fair value of traded options that have no vesting restrictions and are fully transferable. Option valuation models require the input of highly subjective assumptions, including the expected stock price volatility. Since the Company does not have a sufficient history of exercise behavior, expected term is calculated using the assumption that the options will be exercised ratably from the date of vesting to the end of the contractual term for each vesting tranche of awards. The risk-free interest rate is based on the U.S. Treasury yield curve for the period of the expected term of the stock option. Expected volatility is calculated using an index of publicly traded peer companies.
Fair values of nonvestednon-vested stock awards (restricted stock units) are equal to the market value of the common stock on the date of the award with compensation costs amortized over the vesting period of the award.
Segment Reporting
The Company determines its operating segments based on the information utilized by the chief operating decision maker to allocate resources and assess performance. Based on this information, the Company has determined it has twelvehad 16 operating segments as of September 30, 20172019 and eight operating segments as of September 30, 20162018 that are aggregated into two reportable segments: Flatbed Solutions, which delivers its services using primarily flatbed transportation equipment to meet the needs of high-volume, time-sensitive shippers, and Specialized Solutions, which delivers transportation and logistics solutions for super heavy haul, high-value customized and over-dimensional loads, many of which require engineering and customized equipment.
Earnings (Loss) Per Share
Basic earnings (loss) per common share is calculated by dividing net income (loss) attributable to common stockholders by the weighted average number of shares of common stock outstanding during the period. Diluted earnings (loss) per share reflect the potential dilution of earnings per share that could occur if securities or other contracts to issue common stock were exercised or converted into common stock or resulted in the issuance of common stock that then shared in the Company’s earnings (loss).
For the three and nine months ended September 30, 2017,2019 and 2018, shares of the Company’s 7.625% Series A Convertible Cumulative Preferred Stock (Series A Preferred Stock) were not included in the computation of diluted loss per share as their effects were anti-dilutive. For the three and nine months ended September 30, 2017 and 2016, shares of Private Daseke’s Series B Convertible Preferred Stock (Series B Preferred Stock)outstanding stock options were not included in the computation of diluted earnings (loss) per share as their effects were anti-dilutive. ForAdditionally, for the three and nine months ended September 30, 2017,2019 and 2018, there was no dilutive effect from the Merger Agreement earn-out provision (see Note 2)found in the Agreement and Plan of Merger, dated December 22, 2016, in which a wholly-owned subsidiary of Hennessy Capital Acquisition Corp. II (Hennessy) merged with and into Daseke, with Daseke surviving as a direct wholly-owned subsidiary of Hennessy, (the Merger Agreement) or the outstanding warrants to purchase shares of the Company’s common stock (the common stock purchase warrants).See Note 16 for the effects of non-vested restricted stock units on basic and diluted earnings per share under the two-class method.
Common Stock Purchase Warrants
The Company accounts for the issuance of common stock purchase warrants in connection with equity offerings in accordance with the provisions of the Accounting Standards Codification (ASC) 815, Derivatives and Hedging (ASC(Topic 815). The Company classifies as equity any contractscontract that (i) requirerequires physical settlement or net-share settlement or (ii) gives the Company a choice of net-cash settlement or settlement in its own shares (physical settlement or net-share settlement). The Company classifies as assets or liabilities any contractscontract that (i) requirerequires net-cash settlement (including a requirement to net-cash settle the contract if an event occurs and if that event is outside the control of the Company) or (ii) gives the counterparty a choice of net-cash settlement or settlement in shares (physical settlement or net-share settlement). See Note 11 for additional details on the common stock purchase warrants.
The Company assessed the classification of its common stock purchase warrants and determined that such instruments meet the criteria for equity classification at the time of issuance.
Table of Contents
DASEKE, INC. AND SUBSIDIARIES
NOTES TO CONSOLIDATED FINANCIAL STATEMENTS – (Continued)
(Unaudited)
NOTE 1 – NATURE OF OPERATIONS AND SUMMARY OF SIGNIFICANT ACCOUNTING POLICIES – (Continued)
Foreign Currency Gains and Losses
The functional currency for all operations except Canada is the U.S. dollar. The local currency is the functional currency for the Company’s operations in Canada. For these operations, assets and liabilities are translated at the rates of exchange on the consolidated balance sheet date, while income and expense items are translated at average rates of exchange during the period. The resulting gains or losses arising from the translation of accounts from the functional currency into U.S. dollars are included as a separate component of stockholders’ equity in accumulated other comprehensive income (loss) until a partial or complete liquidation of the Company’s net investment in the foreign operation.
From time to time, the Company’s foreign operations may enter into transactions that are denominated in a currency other than their functional currency (U.S. dollars).currency. These transactions are initially recorded in the functional currency of the operating company based on the applicable exchange rate in effect on the date of the transaction. Monthly, these transactions are remeasured to an equivalent amount of the functional currency based on the applicable exchange rate in effect on the remeasurement date. Any adjustment required to remeasure a transaction to the equivalent amount of functional currency is recorded in the consolidated statements of operations and comprehensive income (loss) of the foreign operating company as a component of foreign exchange gain or loss.
Assets Held for Sale
AssetsThrough December 31, 2018, assets held for sale iswere primarily comprised of revenue equipment in ourthe Company’s lease purchase program and is recorded as a component of prepaid and other current assets on the consolidated balance sheets. Assets held for sale at September 30, 2017 and December 31, 2016, totaled $7.1 million and $2.8 million, respectively. Assets held for sale arewere not subject to depreciation, and arewere recorded at the lower of depreciated carrying value or fair market value less selling costs. The Company expects to sell these assetsAssets held for sale as of December 31, 2018, totaled $3.6 million, consisting of $2.7 million for the Flatbed Solutions segment and $0.9 million for the Specialized Solutions.
Following the adoption of Accounting Standards Update (ASU) No. 2016-02, Leases (Topic 842), the revenue equipment in itsthe Company’s lease purchase program within twelve months of being classified asno longer meets the criteria for assets held for sale. See Note 2 for additional information on the adoption of ASU No. 2016-02.
Revenue and Expense Recognition
The Company’s revenue and related costs are recognized when the Company satisfies its performance obligation(s) transferring goods or services to the customer and the customer obtains control of such goods and services. With respect to freight, brokerage, logistics and fuel surcharge revenue, these conditions are met, and the Company recognizes company freight, owner operator freight, brokerage and fuel surcharge revenue, over time, and logistics revenue, as the services are provided. While the Company may enter into master service agreements with its customers, a contract is not established until the customer specifically requests the Company’s services and the Company accepts.
The Company evaluates each contract for distinct performance obligations. In the Company’s business, a typical performance obligation is the transportation of a load including any highly interrelated ancillary services.
The Company predominantly estimates the standalone selling price of its services based upon observable evidence, market conditions and other relevant inputs. The Company allocates the total transaction price to each distinct performance obligation based upon the relative standalone selling prices.
The Company’s customers simultaneously receive and consume the benefits of the Company’s contracts; therefore, revenue is recognized over time. This is a faithful depiction of the satisfaction of the performance obligation, as the customer does not need to re-perform the transportation services the Company has provided to date.
Generally, the Company’s customers are billed upon delivery of the freight or monthly and remit payment according to the approved payment terms.
Freight Revenue
Freight revenue is generated by hauling customer freight using company owned equipment (company freight) and owner-operator equipment (owner-operator freight). Freight revenue is the product of the number of revenue-generating miles driven and the rate per mile received from customers plus accessorial charges, such as loading and unloading freight, cargo protection, fees for detained equipment or fees for route planning and supervision.
Brokerage Revenue
The Company regularly engages third-party capacity providers to haul loads. The Company is primarily responsible for fulfilling the promise to provide load transportation services, and has discretion in setting prices, along with the risk to fulfill the contract to the customer. Based upon this evaluation, the Company has determined that it is the principal and therefore, records gross revenues and expenses for brokerage services.
Logistics Revenue
Logistics revenue is generated from a range of services, including value-added warehousing, loading and unloading, vehicle maintenance and repair, preparation and packaging, fuel management, and other fleet management solutions. The Company recognizes logistics revenue as services are completed.
Fuel Surcharge
Fuel surcharge revenue compensates the Company for fuel costs above a certain cost per gallon base. Generally, the Company receives fuel surcharges on the miles for which it is compensated by customers.
The Company has designated the following preference and practical expedients:
| · | | To not disclose remaining performance obligations when the expected performance obligation duration is one year or less. The vast majority of the Company’s services transfer control within a month of the inception of the contract with select specialized loads taking several months to allow for increased planning and permitting. |
| · | | Recognize the incremental costs of obtaining or fulfilling a contract as an expense when incurred, as the amortization period of a potential asset would be recognized in one year or less. |
| · | | Exclude taxes collected on behalf of government authorities from the Company’s measurement of transaction prices. Tax amounts are not included within net income or cost of sales. |
New Accounting Pronouncements
In July 2017, the Financial Accounting Standards Board (FASB) issued Accounting Standards Update (ASU)ASU 2017-11, Earnings per Share (Topic 260),; Distinguishing Liabilities from Equity (Topic 480); and Derivatives and Hedging (Topic 815). ASU 2017-11 provides guidance on accounting for financial instruments with down round features and clarifyclarifies the deferral of certain provisions in Topic 480. ASU 2017-11 will become effective for annual periods beginning after December 15, 2018 and interim periods within those periods. The Company is currently evaluating the impact of adoptingadopted this guidance.
In May 2017, the FASB issued ASU 2017-09, Compensation – Stock Compensation (Topic 718). ASU 2017-09 provides guidance about which changes to the terms or conditions of a share-based payment award requires the application of modification accounting. Modification accounting will apply unless the fair value of the modified award is the same as the original award, the vesting conditions of the modified award are the same as the original award and the classification of the modified award as an equity instrument or liability instrument is the same as the original award. ASU 2017-09 will become effective for annual periods beginning after December 15, 2017 and interim periods within those periods. Early adoption is permitted. The Company does not expect ASU 2017-09 to have a material impactpronouncement on its consolidated results of operations, financial condition, cash flows, or financial statement disclosures.
In January 2017, the FASB issued ASU 2017-04, Intangibles – Goodwill and Other (Topic 350). ASU 2017-04 removes the requirement to perform a hypothetical purchase price allocation to measure goodwill impairment. A goodwill impairment will now be the amount by which a reporting unit’s carrying value exceeds its fair value, not to exceed the carrying amount of goodwill. ASU 2017-04 is effective for fiscal years beginning December 15, 2019, with early adoption permitted for interim and annual goodwill impairment tests performed on testing dates after January 1, 2017, and applied prospectively. The Company does2019, which did not expect ASU 2017-04 to have a material impact on itsthe consolidated results of operations, financial condition, cash flows, or financial statement disclosures.statements.
Table of Contents
DASEKE, INC. AND SUBSIDIARIES
NOTES TO CONSOLIDATED FINANCIAL STATEMENTS – (Continued)
(Unaudited)
NOTE 1 – NATURE OF OPERATIONS AND SUMMARY OF SIGNIFICANT ACCOUNTING POLICIES – (Continued)
In August 2016, the FASB issued ASU 2016-15, Statement of Cash Flows (Topic 230). ASU 2016-15 provides new guidance intended to reduce diversity in practice in how certain cash receipts and payments are classified in the statement of cash flows, including debt prepayment or extinguishment costs, the settlement of contingent liabilities arising from a business combination, proceeds from insurance settlements, and distributions from certain equity method investees. ASU 2016-05 will become effective for fiscal years beginning after December 15, 2018 and interim periods within fiscal years beginning after December 31, 2019. Early adoption is permitted. ASU 2016-15 requires application using a retrospective transition method. The Company is currently evaluating the impact of adopting this guidance.
In June 2016, the FASB issued ASU No. 2016-13, Accounting for Credit Losses (Topic 326). ASU 2016-13 requires the use of an “expected loss” model on certain types of financial instruments. ASU 2016-13 is effective for fiscal years, and interim periods within those years, beginning after December 15, 2019, with early adoption permitted. The Company is currently evaluating the impact of adopting this guidance.guidance and does not believe it will have a material impact on the consolidated financial statements.
NOTE 2 – LEASES
Change in Accounting Principle
In MarchFebruary 2016, the FASB issued ASU 2016-09, Stock CompensationNo. 2016-02, Leases (Topic 718). ASU 2016-09842), which amends the FASB ASC and creates Topic 842 (ASC 842), Leases. On January 1, 2019, the Company adopted ASC 842, which is effective for interim and annual reporting periods beginning on or after December 15, 2018. This Topic requires thebalance sheet recognition of lease assets and lease liabilities for leases classified as operating leases under GAAP. Under the income tax effectsstandard, disclosures are required to meet the objective of awards inenabling users of financial statements to assess the income statement whenamount, timing, and uncertainty of cash flows arising from leases.
The Company has completed its evaluation of the awards vest or are settled, thus eliminating additional paid in capital pools. ASU 2016-09 also allows for the Company to repurchase morerequirements of ASC 842 and related amendments. As part of the Company’s sharesevaluation, management compiled and analyzed contracts, identified the full lease population, implemented and populated leasing software and implemented new controls associated with adopting and adhering to the standard, and reviewed its accounting practices for tax withholding purposes without triggering liability accounting. In addition, ASU 2016-09 allows for a policy electionrevenue equipment that it leased to account for forfeitures as they occur rather than on an estimated basis. ASU 2016-13 is effective for fiscal years, and interim periods within those years, beginning after December 15, 2016, with early adoption permitted. certain of its owner-operators.
The Company adopted this pronouncementguidance as of January 1, 2019, using the optional transition method and elected the option to not apply ASC 842 to comparative periods, which continue to be presented under the accounting standards in effect for those periods.
Lessee
The adoption of this standard had a material impact on Aprilthe Company’s financial position. Adoption of the new standard resulted in the recording of right-of-use assets and lease liabilities on the Company’s consolidated balance sheets of approximately $96.9 million and $96.9 million, respectively, as of January 1, 20172019. The right-of-use assets recorded on the balance sheet include primarily trucking facilities and election to account for forfeitures as they occurterminals and revenue equipment leases. The standard did not have a material impact on the Company’s consolidated resultsstatements of operations and comprehensive income (loss), however, there have been additions and modifications to its existing financial condition, cash flows or financial statement disclosures.
In February 2016, the FASB issued ASU 2016-02, Leases (Topic 842). ASU 2016-02 amends various aspects of existing guidance for leases. ASU 2016-02 requires an entity to recognize assets and liabilities arising from a lease for both financing and operating leases, along with additional qualitative and quantitative disclosures. The main difference between previous GAAP and the amended standard is the recognition of lease assets and lease liabilities of lessees on the balance sheet for those leases classified as operating leases under previous GAAP. ASU 2016-02 is effective for fiscal years beginning after December 15, 2018, with early adoption permitted. The Company is currently evaluating the effect this ASU will have on its consolidated financial position and results of operations.
In May 2014, the FASB issued ASU No. 2014-09, Revenue from Contracts with Customers (Topic 606). The core principle of the guidance is that an entity should recognize revenue to depict the transfer of promised goods or services to customers in an amount that reflects the consideration to which the entity expects to be entitled in exchange for those goods or services. In August 2015, the FASB issued updated guidance with ASU 2015-14 and deferred the effective date of ASU 2014-09 by one year. The guidance in ASU 2014-09 is effective for annual periods beginning after December 15, 2017, and interim periods within those annual periods.
In March 2016, the FASB issued an ASU that further clarifies guidance under ASU 2014-09 with respect to principal versus agent considerations in revenue from contracts with customers. In the second quarter of 2016, the FASB issued two ASUs that provide additional guidance when identifying performance obligations and licenses as well as allowing for certain narrow scope improvements and practical expedients. In May 2017, the FASB issued an ASU that provides guidance on the identification of the customer in a service concession arrangement. The guidance permits two methods of adoption: retrospectively to each prior reporting period presented (full retrospective), or retrospectively with the cumulative effect of initially applying the guidance recognized at the date of initial application (modified retrospective). The Company plans to adopt this new guidance in the first quarter of 2018 and would apply the modified retrospective method, which may result in a cumulative-effect adjustment to opening retained earnings with an insignificant change to revenue on a go-forward basis. The Company has completed its review of a sample of revenue contracts for all revenue sourcesdesignated the following preferences and has concluded that the new guidance will not have a material impact on its revenue recognition practices, business processes, systems and controls. The new guidance will result in changes to the timing of recognition for certain revenue streams, namely freight revenue, where a contract has not been completed by the end of a reporting period. Based on a review of our customer shipping arrangements, we currently believe the implementation of this standard will change our revenue recognition policy from recognizing revenue upon shipment completion to recognizing revenue over time based on the progress toward completion of shipments in transit at each period end.practical expedients:
| · | | To not reassess whether any expired or existing contracts contain a lease; |
| · | | Carryforward previous conclusions related to prior lease classification under the prior lease accounting standard to lease classification for existing leases under ASC 842; |
| · | | To not reassess initial indirect costs; |
Table of Contents
DASEKE, INC. AND SUBSIDIARIES
NOTES TO CONSOLIDATED FINANCIAL STATEMENTS – (Continued)
(Unaudited)
| · | | Elect the hindsight practical expedient related to lease term and impairment; |
| · | | Adopt the land easement practical expedient; |
NOTE 2 – BUSINESS COMBINATION
On February 27, 2017, Hennessy consummated the merger of Hennessy’s wholly-owned subsidiary with and into Daseke, Inc., with Daseke, Inc. surviving as a direct wholly-owned subsidiary of Hennessy (the Business Combination) pursuant to the Agreement and Plan of Merger, dated December 22, 2016 (the Merger Agreement). The aggregate consideration received by Private Daseke stockholders upon closing was $266.7 million, consisting of newly issued shares of common stock at a value of $10.00 per share. The Merger Agreement contains an earn-out provision through which Private Daseke stockholders could receive up to 15 million additional shares of common stock (with up to 5 million shares payable annually with respect to 2017, 2018 and 2019 performance). The full 15 million shares are only payable if (i) the annualized Adjusted EBITDA (giving effect to acquisitions and as defined in the Merger Agreement) for 2017, 2018 and 2019 is at least $140.0 million, $170.0 million and $200.0 million, respectively, and (ii) the closing share price of the Company’s common stock is at least $12.00, $14.00 and $16.00 for any 20 trading days in a consecutive 30 trading day period in 2017, 2018 and 2019, respectively. For each year, the 5 million earn-out shares will be prorated to the extent the annualized Adjusted EBITDA (giving effect to acquisitions and as defined in the Merger Agreement) exceeds 90% but represents less than 100%, of the applicable earn-out target.
Following the consummation of the Business Combination on February 27, 2017 (the Closing), there were 37,715,960 shares of common stock issued and outstanding, consisting of (i) 26,665,330 shares issued to Private Daseke stockholders pursuant to the Merger Agreement, (ii) 419,669 shares issued in a private placement that closed in conjunction with the Business Combination, (iii) 2,288,043 shares originally issued to Hennessy Capital Partners II LLC (the Sponsor) in a private placement that closed simultaneously with the consummation of the IPO, and (iv) 8,342,918 shares, following redemptions, which shares were originally issued in the IPO. In connection with the Business Combination, $65.0 million of Series A Preferred Stock (650,000 shares) were issued in a private placement.
In conjunction with the Closing, the Company entered into (i) a $350.0 million term loan credit facility (the Term Loan Facility), which consists of a $250.0 million term loan funded on the closing date of the Term Loan Facility and up to $100.0 million of term loans to be funded from time to time under a delayed draw term loan facility, and (ii) an asset-based revolving credit facility (the ABL Facility), in an aggregate maximum credit amount equal to $70.0 million (subject to availability under a borrowing base). See Note 9 for more information regarding the Term Loan Facility and the ABL Facility. Prior to the Closing, the Company had a credit facility consisting of a term loan (Senior Term Loan) and a revolving line of credit (Line of Credit).
DASEKE, INC. AND SUBSIDIARIES
| · | | To not separate the non-lease components of a contract from the lease component for its office equipment asset class; |
| · | | To not apply the recognition requirements to leases with terms of twelve months or less; and |
| · | | To apply the portfolio approach in determination of the incremental borrowing rate. |
The Company has capitalized operating and finance leases for various real estate including corporate offices, trucking facilities and terminals, warehouses, and tractor parking as well as various types of equipment including tractors, trailers, forklifts, and office equipment. New real estate lease agreements will typically have initial terms between 3 to 15 years and new equipment lease agreements will typically have initial terms of 3 to 9 years. Leases with an initial term of 12 months or less (short term leases) across all asset classes are not recorded on the balance sheet; the Company recognizes lease expense for these leases on a straight-line basis over the lease term.
NOTES TO CONSOLIDATED FINANCIAL STATEMENTS – (Continued)
(Unaudited)Some of the Company’s leases include one or more options to renew, with renewals that can extend the lease term from 1 to 5 years. The Company’s lease terms may include options to extend or terminate the lease when it is reasonably certain that the Company will exercise that option. The exercise of lease renewal options is at the Company’s sole discretion. Certain leases also include options to purchase the leased property. The depreciable life of assets and leasehold improvements are limited by the expected lease term, unless there is a transfer of title or purchase option reasonably certain of exercise. Rights and obligations related to lease agreements the Company has signed but that have not yet commenced are not material. The Company has certain lease agreements related to its revenue equipment that contain residual value guarantees. These residual value guarantees require the Company to return the revenue equipment at the end of the lease term in a certain condition as specified by the lessor in the lease agreement.
The Company determines whether an arrangement is classified as a lease at inception. The right-of-use assets and lease liabilities relating to operating leases are included in right-of-use assets, other current liabilities, and other long-term liabilities on the Company's consolidated balance sheets. The right-of-use assets and lease liabilities relating to finance leases are included in other long-term assets, current portion of long-term debt, and long-term debt, net of current portion on the Company's consolidated balance sheets. The Company's right-of-use assets represent its right to use the underlying assets for the lease term and the Company's right-of-use liabilities represent its obligation to make lease payments arising from the leases. Operating lease right-of-use assets and liabilities are recognized at commencement date based on the present value of lease payments over the lease term. The Company's capitalized operating lease agreements generally do not provide an implicit rate. The Company developed an incremental borrowing rate based on the information available at the commencement date regarding the interest rate applicable to collateralized borrowings for a period similar to the original lease period. The incremental borrowing rates were used in determining the present value of lease payments which is reflected as the lease liability.
The Company follows ASC 360, “Impairment or Disposal of Long-Lived Assets” guidance to determine whether right-of-use assets relating to operating and finance leases are impaired. The Company recorded impairment charges of $10.0 million to right-of-use assets relating to operating leases and $0.7 million to right-of-use assets relating to finance leases for the three and nine months ended September 30, 2019. See Note 5 for discussion on impairment charges.
The following table reflects the Company’s components of lease expenses for the three and nine months ended September 30, 2019 (in millions):
| | | | | | | | |
| | | | Three Months Ended | | Nine Months Ended |
| | Classification | | September 30, 2019 |
Operating lease cost | | | | | | | | |
Revenue equipment | | Operations and maintenance | | $ | 2.8 | | $ | 16.3 |
Real estate | | Administrative expense | | | 1.1 | | | 10.2 |
Total operating lease cost | | | | $ | 3.9 | | $ | 26.5 |
| | | | | | | | |
Finance lease cost | | | | | | | | |
Amortization of right-of-use assets | | Depreciation and amortization | | $ | 1.5 | | $ | 3.9 |
Interest on lease liabilities | | Interest expense | | | 0.2 | | | 0.7 |
Total finance lease cost | | | | $ | 1.7 | | $ | 4.6 |
| | | | | | | | |
Total lease cost(a) | | | | $ | 5.6 | | $ | 31.1 |
| (a) | | Short-term lease expense and variable lease expense are immaterial. |
NOTE 2 – BUSINESS COMBINATION – (Continued)The components of assets and liabilities for operating and finance leases are as follows as of September 30, 2019 (in millions):
| | | | | |
| | | | September 30, |
| | Classification | | 2019 |
Assets | | | | | |
Capitalized operating lease right-of-use assets | | Right-of-use assets | | $ | 97.0 |
Finance lease right-of-use assets | | Other long-term assets | | | 25.0 |
Total lease assets | | | | $ | 122.0 |
| | | | | |
Liabilities | | | | | |
Capitalized operating lease liabilities: | | | | | |
Current | | Other current liabilities | | $ | 28.4 |
Non-current | | Other long-term liabilities | | | 78.6 |
Total capitalized operating lease liabilities | | | | $ | 107.0 |
| | | | | |
Finance lease liabilities: | | | | | |
Current | | Current portion of long-term debt | | $ | 6.0 |
Non-current | | Long-term debt, net of current portion | | | 20.0 |
Total finance lease liabilities | | | | $ | 26.0 |
| | | | | |
Total lease liabilities | | | | $ | 133.0 |
The following table is a summary of supplemental cash proceeds and utilization of proceeds inflows related to leases for the Business Combinationnine months ended September 30, 2019 (in thousands)millions):
| | | |
Proceeds | | | |
| | | |
Public share proceeds(1) | | $ | 83,429 |
Issuance of Series A Preferred Stock | | | 65,000 |
Term Loan Facility | | | 250,000 |
Cash(2) | | | 3,209 |
Total proceeds | | | 401,638 |
| | | |
Use of Proceeds | | | |
| | | |
Repayment of Line of Credit(3) | | | 16,717 |
Repayment of Senior Term Loan(4) | | | 122,724 |
Repayment of equipment loans(5) | | | 89,488 |
Repayment of subordinated debt(6) | | | 67,460 |
Payment of deferred financing fees(7) | | | 14,148 |
Repurchase Main Street and Prudential shares(8) | | | 36,168 |
Hennessy transaction costs | | | 19,063 |
Daseke transaction costs(9) | | | 1,204 |
Total use of proceeds | | | 366,972 |
| | | |
Net cash received | | $ | 34,666 |
| | | |
| | Nine Months Ended |
| | September 30, |
| | 2019 |
Cash paid for amounts included in the measurement of lease liabilities: | | | |
Operating cash flows from capitalized operating leases | | $ | (26.0) |
Operating cash flows from finance leases | | | (0.6) |
Financing cash flows from finance leases | | | (4.4) |
Right-of-use assets obtained in exchange for lease obligations: | | | |
Capitalized operating lease right-of-use assets | | $ | 33.5 |
Finance lease right-of-use assets | | | 10.8 |
The following table is the future payments on leases as of September 30, 2019 (in millions):
| | | | | | | | | |
| | Capitalized | | | | | | |
| | Operating | | Finance | | | |
Year ending December 31, | | leases | | leases | | Total |
2019(1) | | $ | 9.1 | | $ | 1.9 | | $ | 11.0 |
2020 | | | 30.6 | | | 7.3 | | | 37.9 |
2021 | | | 23.5 | | | 6.8 | | | 30.3 |
2022 | | | 19.0 | | | 4.8 | | | 23.8 |
2023 | | | 13.7 | | | 5.3 | | | 19.0 |
2024 | | | 9.0 | | | 2.2 | | | 11.2 |
Thereafter | | | 18.4 | | | 1.0 | | | 19.4 |
Total lease payments | | | 123.3 | | | 29.3 | | | 152.6 |
Less: interest | | | (16.3) | | | (3.3) | | | (19.6) |
Present value of lease liabilities | | $ | 107.0 | | $ | 26.0 | | $ | 133.0 |
| (1) | | Three months ending December 31, 2019 |
The following table is a summary of weighted average lease terms and discount rates for leases as of September 30, 2019:
|
(1) - 8,342,918 public shares outstanding valued at $10.00 per share
| | | |
(2) - Daseke cash utilized for payment of deferred financing fees and transaction costs
| | 2019 |
(3) - includes payment of $59 accrued interest recognized in interest expenseWeighted-average remaining lease term (years)
| | | | |
(4) - includes payment of $422 accrued interest recognized in interest expenseCapitalized operating leases
| | | 5.16 | |
(5) - includes payment of $731 accrued interest recognized in interest expenseFinance leases
| | | 3.90 | |
(6) - includes payment of $745 accrued interest recognized in interest expenseWeighted-average discount rate
| | | | |
(7) - excludes $81 paid subsequent to the ClosingCapitalized operating leases
| | | 5.54 | % |
(8) - Hennessy repurchased Private Daseke shares held by Main Street Capital II, LP, Main Street Mezzanine Fund, LP, Main Street Capital Corporation, Prudential Capital Partners IV, L.P., Prudential Capital Partners (Parallel Fund) IV, L.P. and Prudential Capital Partners Management Fund IV, L.P.Finance leases
|
(9) - $0.8 million and $0.4 million expensed in fourth quarter 2016 and first quarter 2017, respectively
| | 4.38 | % |
The Business Combination wasfollowing table is the future payments under lease agreements as of December 31, 2018 prior to adoption of ASC 842 (in millions):
| | | | | | | | | |
| | Capital Leases | | Operating Leases |
| | | | | Revenue | | Office |
Year ending December 31, | | | | | Equipment | | and Terminals |
2019 | | $ | 5.7 | | $ | 19.5 | | $ | 11.9 |
2020 | | | 4.5 | | | 13.0 | | | 11.2 |
2021 | | | 4.3 | | | 5.7 | | | 9.5 |
2022 | | | 2.4 | | | 3.2 | | | 8.5 |
2023 | | | 2.9 | | | 0.3 | | | 6.6 |
Thereafter | | | 0.8 | | | — | | | 23.0 |
Total minimum lease payments | | $ | 20.6 | | $ | 41.7 | | $ | 70.7 |
Loan amount attributable to interest | | | (2.4) | | | | | | |
Total (Present value of minimum lease payments on capital leases) | | | 18.2 | | | | | | |
Less: current portion | | | (4.8) | | | | | | |
Long-term capital leases | | $ | 13.4 | | | | | | |
Lessor
The adoption of this standard had a material impact on the Company’s financial position, resulting in recording of additional property and equipment and reductions to net investment in sales-type leases and prepaid and other current assets on its consolidated balance sheets of approximately $59.4 million, $55.8 million, and $3.6 million, respectively. The additional assets recorded on the balance sheet in property and equipment include tractors and trailers leased or available for lease to owner-operators. The standard did not have a material impact on the Company’s consolidated statements of operations and comprehensive income (loss), however, there have been additions and modifications to its existing financial disclosures.
The Company leases tractors and trailers to certain of its owner-operators and accounts for these transactions as operating leases. Historically, the Company has accounted for these equipment leases as a reverse merger in accordance with GAAP.sales-type leases. Under this method of accounting, Hennessy isthe new guidance, the Company's equipment leases no longer qualify for sales-type lease treatment and are now treated as operating leases. This change in accounting treatment resulted in the “acquired” company. This determination was primarily basedderecognition of net investment in sales-type leases and recording the associated assets as if the agreements were always operating leases. The Company will no longer recognize a lease receivable, unearned interest income, or deferred gain related to sales-type leases and will recognize income from operating leases as payments are received. These leases typically have terms of 30 to 72 months and are collateralized by a security interest in the related revenue equipment. The Company recognizes income for these leases as payments are received over the lease term, which are reported in purchased freight on Private Daseke comprising the ongoingconsolidated statements of operations and comprehensive income (loss). The Company's equipment leases may include options for the lessee to purchase the equipment at the end of the combined company, Private Daseke’s senior management comprisinglease term or terminate the senior managementlease prior to the end of the combined company, and Private Daseke stockholders having a majoritylease term. When an asset reaches the end of its useful economic life, the Company disposes of the voting powerasset.
The Company recorded depreciation expense of the combined company. For accounting purposes, Private Daseke is deemed to be the accounting acquirer in the transaction$5.7 million and consequently, the transaction is treated as a recapitalization of Private Daseke (i.e., a capital transaction involving the issuance of stock by Hennessy$16.4 million on its assets leased under operating leases for the stock of Private Daseke). Accordingly,three and nine months ended September 30, 2019, respectively. Lease income from lease payments related to the consolidated assets, liabilitiesCompany's operating leases for the three and results of operations of Private Daseke are the historical financial statements of the combined company,nine months ended September 30, 2019, was $6.5 million and Hennessy’s assets, liabilities and results of operations are consolidated with Private Daseke beginning on the acquisition date.
In connection with the Closing, Daseke, Inc. changed its name to Daseke Companies, Inc. and Hennessy Capital Acquisition Corp. II changed its name to Daseke, Inc. Daseke, Inc.’s common stock and warrants began trading under the ticker symbols DSKE and DSKEW, respectively, on February 28, 2017.$18.0 million, respectively.
DASEKE, INC. AND SUBSIDIARIES
The following table is the future minimum receipts on leases as of September 30, 2019 (in millions):
| | | |
Twelve months ending September 30, | | Amount |
2020 | | $ | 25.8 |
2021 | | | 19.7 |
2022 | | | 11.9 |
2023 | | | 5.8 |
2024 | | | 1.7 |
Thereafter | | | 0.3 |
Total minimum lease receipts | | $ | 65.2 |
The components of the net investment in sales-type leases as of December 31, 2018 prior to the adoption of ASC 842 are as follows (in millions):
| | | |
| | 2018 |
Minimum lease receivable | | $ | 78.1 |
Deferred gain | | | (10.1) |
Net minimum lease receivable | | | 68.0 |
Unearned interest income | | | (12.3) |
Net investment in sales-type leases | | | 55.7 |
Current portion | | | (16.2) |
| | $ | 39.5 |
The following table is the future minimum receipts on leases as of December 31, 2018 prior to the adoption of ASC 842 (in millions):
| | | |
| | | |
Year ending December 31, | | Amount |
2019 | | $ | 16.2 |
2020 | | | 14.5 |
2021 | | | 11.0 |
2022 | | | 11.2 |
2023 | | | 2.6 |
Thereafter | | | 0.2 |
Total | | $ | 55.7 |
NOTES TO CONSOLIDATED FINANCIAL STATEMENTS – (Continued)
(Unaudited)
NOTE 3 – ACQUISITIONS
The Company is a leading consolidator of the open-deck freight market in North America. From itsDaseke Companies, Inc.’s inception in late 2008, the Company has successfullyand Daseke Companies, Inc. have acquired twelve20 open-deck trucking companies. NegotiationsTo date, the primary reason for each acquisition was to add resources and discussions with potential targets are an integral part of the Company’s operations,services in geographic areas, customers and markets that the Company may be in varying stages of the acquisition process, from infancywants to very mature, at any point in time.serve.
The following is a summary ofFor each acquisition, the preliminary allocation of the purchase price paid to the fair values of the net assets of the Company’s recent acquisitions (in thousands):
| | | | | | | | | | | | |
(all amounts in U.S. dollars) | | | | | | | | | | | |
| | | R&R | | | Steelman | | | Schilli | | Big Freight |
Accounts receivable | | $ | 5,129 | | $ | 4,383 | | $ | 8,798 | | $ | 4,914 |
Parts supplies | | | 149 | | | 90 | | | 1,681 | | | — |
Prepaid and other current assets | | | 1,515 | | | 2,296 | | | 4,701 | | | 576 |
Property and equipment | | | 16,887 | | | 11,100 | | | 41,423 | | | 11,492 |
Goodwill & Intangibles | | | 22,560 | | | 14,318 | | | 12,989 | | | 10,551 |
Other long-term assets | | | 156 | | | 5,013 | | | — | | | 121 |
Deferred tax liabilities | | | (5,238) | | | (2,763) | | | (14,598) | | | (3,571) |
Accounts payable and other liabilities | | | (2,920) | | | (15,612) | | | (27,634) | | | (6,294) |
Total | | $ | 38,238 | | $ | 18,825 | | $ | 27,360 | | $ | 17,789 |
The aggregate purchase price noted above was allocated to the major categories of assets acquired and liabilities assumed at estimated fair values as of the acquisition date, which were based, in part, upon outside preliminary appraisals for certain assets and subject to change when additional information concerning final asset and liability values is obtained.
The Company has not completed its assessments of the fair value of purchased intangible assets for the R&R and Steelman acquisitions, and no value has been allocated to them at this time. The Company has completed its assessments for the Schilli and Big Freight acquisitions and allocated the resulting fair values to intangible assets. The final purchase price allocations may result in adjustments to certain assets and liabilities, including the residual amount allocated to goodwill.
R&R Trucking Holdings, LLC
The following is a summary of the allocation of the purchase price paid to the fair values of the net assets, net of cash acquired, of the 2018 acquisitions (in millions):
| | | | | | | | | | | | |
(all amounts in U.S. dollars) | | | | | | | | | | | | |
| | Leavitt's | | Builders | | Kelsey Trail | | Aveda |
Accounts receivable | | $ | 1.9 | | $ | 8.4 | | $ | 2.3 | | $ | 37.3 |
Parts supplies | | | 0.1 | | | 0.3 | | | — | | | — |
Prepaid and other current assets | | | 0.4 | | | 1.5 | | | 0.4 | | | 2.5 |
Property and equipment | | | 8.5 | | | 29.4 | | | 9.2 | | | 89.8 |
Goodwill | | | 5.1 | | | 14.7 | | | 3.3 | | | 7.7 |
Intangible assets | | | 3.6 | | | 10.6 | | | 1.5 | | | 15.0 |
Other long-term assets | | | — | | | 0.5 | | | — | | | — |
Deferred tax liability | | | — | | | (9.2) | | | (2.7) | | | (6.7) |
Accounts payable and other liabilities | | | (4.9) | | | (19.9) | | | (8.0) | | | (30.0) |
Total consideration paid (net of cash acquired) | | $ | 14.7 | | $ | 36.3 | | $ | 6.0 | | $ | 115.6 |
Leavitt’s Freight Service
On SeptemberAugust 1, 20172018, the Company acquired 100% of the outstanding stockequity interests of R&R Trucking Holdings, LLC (R&R)Leavitt’s Freight Service, Inc. (Leavitt’s), based in Duenweg, Missouri.Springfield, Oregon. Total consideration paid was $38.4$14.9 million of cash, which was funded with cash on hand. The acquisition was treated as an asset purchase because Leavitt’s was a qualified subchapter S-subsidiary acquired directly from an S-corporation; therefore, the values assigned to the intangible assets and goodwill are deductible for tax purposes. Approximately $0.3 million of transaction expenses were incurred in the acquisition, which will be deductible for tax purposes because the transaction qualified as an asset purchase.
Builders Transportation
On August 1, 2018, the Company acquired 100% of the outstanding equity interests of Builders Transportation Co., LLC (Builders), based in Memphis, Tennessee. Total consideration paid was $36.3 million, consisting of $24.6$30.0 million in cash, 399,530 shares of Daseke common stock valued at $3.4 million and the Company assumed and repaidpayoff of $13.8$2.9 million of long-termoutstanding debt. The cash consideration was funded through a delayed drawwith cash on September 1, 2017 under the Term Loan Facility.hand. The acquisition was a stock purchase,purchase; therefore, the values assigned to the intangible assets and goodwill are not deductible for tax purposes. Approximately $0.4$0.2 million of transaction expenses were incurred in the acquisition, which are not deductible for tax purposes.
The Steelman CompaniesKelsey Trail Trucking
On July 1, 2017,2018, the Company acquired 100% of the outstanding stockequity interests of The Steelman Companies (Steelman)Kelsey Trail Trucking Ltd. (Kelsey Trail), based in Springfield, Missouri, forSaskatoon, Saskatchewan province, Canada. Total consideration of $18.8paid was $6.2 million, consisting of $11.2$5.3 million in cash and 746,17095,859 shares of Daseke common stock valued at $7.6$0.9 million. The fair value of the 746,170 shares issued was determined based on the closing price of the stock on the acquisition close date. The cash consideration was funded throughwith cash on hand. The acquisition was a stock purchase under GAAP. A Section 338(h)(10) election is being filed for certain of the entities acquired which will deem those acquisitions as an asset purchase for tax purposes, therefore approximately $13.0 million of the values assigned to the intangible assets and goodwill are expected to be deductible for tax purposes. Approximately $0.3 million of transaction expenses were incurred in the acquisition, which are not deductible for tax purposes.
Table of Contents
DASEKE, INC. AND SUBSIDIARIES
NOTES TO CONSOLIDATED FINANCIAL STATEMENTS – (Continued)
(Unaudited)
NOTE 3 – ACQUISITIONS – (Continued)
Schilli Transportation Services, Inc.
On May 1, 2017, the Company acquired 100% of the outstanding stock of Schilli Transportation Services, Inc. and certain of its affiliates (Schilli), based in Remington, Indiana. Total consideration paid was $27.4 million, consisting of $21.0 million in cash, 232,885 shares of Daseke common stock valued at $2.3 million and $4.0 million of long-term debt refinanced by the Company. The fair value of the 232,885 shares issued was determined based on the closing price of the stock on the acquisition close date. The cash consideration was funded through a delayed draw on May 1, 2017 under the Term Loan Facility. The acquisition was a stock purchase,purchase; therefore, the values assigned to the intangible assets and goodwill are not deductible for tax purposes. Approximately $0.4$0.1 million of transaction expenses were incurred in the acquisition, which are not deductible for tax purposes. During the first quarter of 2019, goodwill and deferred tax liability were decreased by $0.9 million to adjust the beginning balance of deferred taxes.
Big Freight Systems, Inc.Aveda Transportation and Energy Services
On May 1, 2017,June 6, 2018, the Company acquired 100%all of the outstanding stockcommon shares of Big Freight Systems,Aveda Transportation and Energy Services Inc. (Big Freight), based in Steinbach, Manitoba.a corporation existing under the laws of the Province of Alberta, Canada (Aveda), pursuant to the Agreement and the Plan of Arrangement (the Agreement). Total consideration paid was $16.7$118.7 million, consisting of $12.4$27.3 million in cash, 109,2481,612,979 shares of Daseke common stock valued at $1.1$15.4 million, and the Company assumed approximately $3.2payoff of $54.8 million of outstanding debt. The fair valueCompany will also pay to the holders of the 109,248Aveda common shares issued was determinedup to C$0.45 in cash per Aveda common share, contingent on and based on the closing price of the stock on the acquisition close date. Big Freight’s purchase agreement also contains an earn-out for additional cash consideration to be paid on the excess of each of 2017, 2018 and 2019’s earnings before interest, taxes, depreciation and amortization (EBITDA Amount) over 2016’sAveda’s Company EBITDA Amount (as defined in the purchase agreement), multiplied by 0.4. A contingent liability of $1.1 million was includedAgreement) meeting certain thresholds set forth in the allocation ofAgreement for the purchase price for this earn-out. The cash consideration was funded through a delayed drawperiod beginning June 1, 2018 and ending on May 1, 2017 under2019 or with agreement of the Term Loan Facility and cash on hand.parties, July 1, 2018 to June 30, 2019. The contingent consideration for this earn-out has been valued at an estimated $21.2 million. The Aveda acquisition was a stock purchase,purchase; therefore, the valuesvalue assigned to the intangible assets and goodwill are not deductible for tax purposes. Approximately $0.6$1.1 million of transaction expenses were incurred in the acquisition, which are not deductible for tax purposes. During the first quarter of 2019, goodwill and deferred tax liability were increased by $0.7 million to adjust the beginning balance of deferred taxes.
Supplemental Pro Forma Information (Unaudited)
The following supplemental pro forma financial information reflects the R&R, Steelman, Schilli and Big Freight acquisitions as if they occurred on January 1, 2016. This pro forma financial information has been presented for illustrative purposes only and is not necessarily indicative16
| | | | | | | | | | | | |
| | | | | | | | | | | | |
| | Three Months Ended September 30, | | Nine Months Ended September 30, |
(in thousands) | | 2017 | | 2016 | | 2017 | | 2016 |
| | | | | | | | | | | | |
Pro forma revenue | | $ | 241,135 | | $ | 230,092 | | $ | 690,449 | | $ | 666,014 |
Pro forma net income (loss) | | $ | 285 | | $ | (1,167) | | $ | (11,323) | | $ | 810 |
NOTE 4 – PREPAID AND OTHER CURRENT ASSETS
The components of prepaid expenses and other current assets are as follows as of September 30, 20172019 and December 31, 20162018 (in thousands).millions):
| | | | | | | | | | | | |
| | 2017 | | 2016 | | 2019 | | 2018 |
Insurance | | | $ | 8.3 | | $ | 7.4 |
Licensing, permits and tolls | | | | 5.5 | | | 5.6 |
Other assets | | | | 4.3 | | | 4.4 |
Other prepaids | | | | 2.3 | | | 3.9 |
Highway and fuel taxes | | | | 1.5 | | | 1.4 |
Assets held for sale | | $ | 7,112 | | $ | 2,812 | | | — | | | 3.6 |
Other assets | | | 2,529 | | | 3,546 | |
Insurance | | | 4,564 | | | 2,246 | |
Other prepaids | | | 1,562 | | | 1,104 | |
Licensing, permits and tolls | | | 3,031 | | | 2,772 | |
Highway and fuel taxes | | | 1,523 | | | 1,024 | |
| | $ | 20,321 | | $ | 13,504 | | $ | 21.9 | | $ | 26.3 |
Table of Contents
DASEKE, INC. AND SUBSIDIARIES
NOTES TO CONSOLIDATED FINANCIAL STATEMENTS – (Continued)
(Unaudited)
NOTE 5 – GOODWILL AND INTANGIBLE ASSETS
Goodwill represents the excess of the purchase price of all acquisitions over the estimated fair value of the net assets acquired. The Company performs an impairment test of goodwill annually as of October 311 or when impairment indicators arise. There
On July 30, 2019, the Company internally announced a plan to integrate three operating segments with three other operating segments (Project Synchronize or the Plan), which will reduce the number of operating segments from 16 to 13. The Plan was noimplemented to streamline and reduce the Company’s cost structure, improve asset utilization and capitalize on operational synergies. Additionally, the Company announced the planned implementation of Business Improvement Plans (BIP), which are expected to increase profitability by right-sizing trailer-to-tractor ratios, yielding management capacity allocations, and improving maintenance execution. On September 4, 2019, the Company announced a comprehensive restructuring plan (Project Pivot) intended to reduce its cost base, right size its organization and management team and increase and accelerate its previously announced operational improvement goals. As part of Project Pivot, the Company executed a new management restructuring and substantial corporate cost reduction plan. See Note 6 for additional details.
During the third quarter of 2019, the Company identified a triggering event following the announcement of Project Synchronize, BIP, Project Pivot and the decline of the Company’s stock price. As a result, the Company completed goodwill impairment identified for the three and nine months endedassets impairment analyses as of September 30, 2017. 2019 (see Note 7 for additional details). The preliminaryresult of the goodwill impairment analysis prepared in the third quarter was a non-cash goodwill impairment charge of $112.8 million, of which $105.0 million is not deductible for tax purposes. Goodwill impairment is recorded in impairment in the consolidated statements of operations and comprehensive income (loss).
The summary of changes in goodwill follows for the nine months ended September 30, 20172019 (in thousands).millions):
| | | | | | | | | |
| | Flatbed | | Specialized | | Total |
Goodwill balance at December 31, 2016 | | | 46,660 | | | 42,375 | | | 89,035 |
Goodwill acquired and adjustments to previously recorded goodwill | | | — | | | 50,207 | | | 50,207 |
Foreign currency translation adjustment | | | — | | | 647 | | | 647 |
Goodwill balance at September 30, 2017 | | $ | 46,660 | | $ | 93,229 | | $ | 139,889 |
| | | | | | | | | |
| | Flatbed | | Specialized | | Total |
Goodwill balance at December 31, 2018 | | $ | 101.5 | | $ | 156.9 | | $ | 258.4 |
Impairment | | | (38.7) | | | (74.1) | | | (112.8) |
Adjustments to previously recorded goodwill (net) | | | — | | | (0.3) | | | (0.3) |
Foreign currency translation adjustment | | | — | | | 0.4 | | | 0.4 |
Goodwill balance at September 30, 2019 | | $ | 62.8 | | $ | 82.9 | | $ | 145.7 |
During the third quarter of 2019, the Company recorded an impairment charge to intangible assets of $85.6 million for non-competition agreements, customer relationships and trade names categories of intangible assets.
Intangible assets consisted of the following atas of September 30, 20172019 and December 31, 20162018 (in thousands)millions):
| | | | | | | | | | | | | | | | | | | | | | | | | | | | | | | | | | | | | | | |
| | As of September 30, 2017 | | As of December 31, 2016 | | As of September 30, 2019 | | As of December 31, 2018 |
| | Intangible | | Accumulated | | Intangible | | Intangible | | Accumulated | | Intangible | | Intangible | | Accumulated | | | | Intangible | | Intangible | | Accumulated | | Intangible |
| | Assets | | Amortization | | Assets, net | | Assets | | Amortization | | Assets, net | | Assets | | Amortization | | Impairment | | Assets, net | | Assets | | Amortization | | Assets, net |
Non-competition agreements | | $ | 10,900 | | $ | (5,175) | | $ | 5,725 | | $ | 8,350 | | $ | (3,929) | | $ | 4,421 | | $ | 33.8 | | $ | (18.0) | | $ | (12.1) | | $ | 3.7 | | $ | 33.8 | | $ | (12.8) | | $ | 21.0 |
Customer relationships | | | 59,190 | | | (22,471) | | | 36,719 | | | 56,210 | | | (19,078) | | | 37,132 | | | 130.9 | | | (40.7) | | | (42.0) | | | 48.2 | | | 130.9 | | | (33.5) | | | 97.4 |
Trade names | | | 34,780 | | | — | | | 34,780 | | | 30,100 | | | — | | | 30,100 | | | 90.6 | | | — | | | (31.5) | | | 59.1 | | | 90.6 | | | — | | | 90.6 |
Foreign currency translation adjustment | | | — | | | 317 | | | 317 | | | — | | | — | | | — | | | — | | | — | | | — | | | — | | | (0.2) | | | — | | | (0.2) |
Total intangible assets | | $ | 104,870 | | $ | (27,329) | | $ | 77,541 | | $ | 94,660 | | $ | (23,007) | | $ | 71,653 | | $ | 255.3 | | $ | (58.7) | | $ | (85.6) | | $ | 111.0 | | $ | 255.1 | | $ | (46.3) | | $ | 208.8 |
As of September 30, 2017,2019, non-competition agreements and customer relationships had weighted average remaining useful lives of 2.632.8 and 7.814.6 years, respectively.
Amortization expense for intangible assets with definite lives was $1.8$4.2 million and $1.5$4.1 million for the three months ended September 30, 20172019 and 2016,2018, respectively, and $4.6$12.4 million and $4.5$12.2 million for the nine months ended September 30, 20172019 and 2016,2018, respectively. Projected
Future estimated amortization expense foris as follows (in millions):
| | | | | | |
| | Non-competition | | Customer |
Year ending December 31, | | Agreements | | Relationships |
2019(1) | | $ | 0.5 | | $ | 1.5 |
2020 | | | 1.5 | | | 5.9 |
2021 | | | 1.2 | | | 5.9 |
2022 | | | 0.5 | | | 5.9 |
2023 | | | — | | | 5.9 |
Thereafter | | | — | | | 23.1 |
Total | | $ | 3.7 | | $ | 48.2 |
| (1) | | Three months ending December 31, 2019 |
NOTE 6 – INTEGRATION AND RESTRUCTURING
As discussed in Note 5, the next fiveCompany implemented Project Synchronize and Project Pivot which resulted in recording of integration and restructuring costs. The integration and restructuring costs consist of assets impairments, employee-related costs, other transition and termination costs related to restructuring activities. Employee-related costs include severance, tax preparation, and relocation costs. Severance, tax preparation and relocation costs are expensed in accordance with ASC 420. Other transition and termination costs include fixed asset-related charges, contract and lease termination costs, professional fees, and other miscellaneous expenditures associated with the integration or restructuring activities, which are expensed as incurred. Costs are reported in restructuring charges in the consolidated statements of operations and comprehensive income (loss). The obligation related to employee separation costs is included in other current liabilities in the consolidated balance sheets.
The Company recorded $6.9 million of integration and restructuring expenses in connection with the Plan and Project Pivot in the three and nine months ended September 30, 2019 and the Company expects to incur the majority of the estimated remaining $1.5 million through the end of fiscal years ending December 31, 2017, 2018, 2019, 20202019. Estimated remaining charges of $0.5 million, $0.8 million and 2021$0.2 million are related to the Specialized Solutions segment, the Flatbed Solutions segment and corporate office, respectively. Total expected restructuring charges represent management’s best estimate to date. As the execution of the program is still in process, the amount and nature of actual restructuring charges incurred could vary from total expected charges. Any changes to the estimates of executing the Plan, the BIP and corporate restructuring will be $6.3 million, $6.5 million, $6.4 million, $5.6 millionreflected in our future results of operations.
The following table summarizes the integration and $5.1 million, respectively.restructuring costs as of September 30, 2019 (in millions):
| | | | | | | | | | | | | | | |
| | Severance | | Operating | | | | | | | |
| | and | | Lease | | Fixed Asset | | | | | |
| | Other Payroll | | Termination | | Impairment | | Other | | Total |
Specialized Solution | | | | | | | | | | | | | | | |
Costs accrued | | $ | 0.6 | | $ | 0.5 | | $ | 1.4 | | $ | 1.0 | | $ | 3.5 |
Amounts paid or charged | | | (0.4) | | | (0.5) | | | (1.4) | | | (1.0) | | | (3.3) |
Specialized Solution balance at September 30, 2019 | | | 0.2 | | | — | | | — | | | — | | | 0.2 |
Flatbed Solution | | | | | | | | | | | | | | | |
Costs accrued | | | — | | | — | | | 0.7 | | | 0.2 | | | 0.9 |
Amounts paid or charged | | | — | | | — | | | (0.7) | | | (0.2) | | | (0.9) |
Flatbed Solution balance at September 30, 2019 | | | — | | | — | | | — | | | — | | | — |
Corporate | | | | | | | | | | | | | | | |
Costs accrued | | | 2.5 | | | — | | | — | | | — | | | 2.5 |
Amounts paid or charged | | | (0.2) | | | — | | | — | | | — | | | (0.2) |
Corporate balance at September 30, 2019 | | | 2.3 | | | — | | | — | | | — | | | 2.3 |
Consolidated | | | | | | | | | | | | | | | |
Costs accrued | | | 3.1 | | | 0.5 | | | 2.1 | | | 1.2 | | | 6.9 |
Amounts paid or charged | | | (0.6) | | | (0.5) | | | (2.1) | | | (1.2) | | | (4.4) |
Consolidated balance at September 30, 2019 | | $ | 2.5 | | $ | — | | $ | — | | $ | — | | $ | 2.5 |
NOTE 67 – PROPERTY AND EQUIPMENT
In accordance with ASC 360, “Impairment or Disposal of Long-Lived Assets,” the Company reviews its definite lived long-lived assets whenever events or changes in circumstances indicate that the carrying amount of such assets may not be recoverable. If the carrying amount of an asset or group of assets exceeds its net realizable value, the asset will be written down to its fair value and the amount recognized for impairment is equal to the difference between the carrying value and the asset’s fair value.
During the third quarter of 2019, the Company recorded an impairment charge of $97.6 million to state property and equipment at fair value, which related to the Specialized Solutions segment of $58.6 million and the Flatbed Solutions segment of $39.0 million. The impairment charge is included in impairment in the consolidated statements of operations and comprehensive income (loss).
The components of property and equipment are as follows atas of September 30, 20172019 and December 31, 20162018 (in thousands)millions):
| | | | | | | | | | | | |
| | 2017 | | 2016 | | 2019 | | 2018 |
Revenue equipment | | $ | 474,544 | | $ | 398,394 | | $ | 620.4 | | $ | 734.0 |
Buildings and improvements | | | 50,546 | | | 43,000 | | | 65.1 | | | 61.9 |
Assets leased and available for lease to owner-operators | | | | 60.5 | | | — |
Furniture and fixtures, office and computer equipment and vehicles | | | 17,292 | | | 14,421 | | | 38.2 | | | 36.5 |
| | | 542,382 | | | 455,815 | | | 784.2 | | | 832.4 |
Accumulated depreciation | | | (173,183) | | | (137,068) | | | (321.1) | | | (259.7) |
| | $ | 369,199 | | $ | 318,747 | | $ | 463.1 | | $ | 572.7 |
Depreciation expense on property and equipment was $18.0$34.1 million and $15.5$32.8 million for the three months ended September 30, 20172019 and 2016,2018, respectively, and $49.1$107.1 million and $46.0$81.6 million for the nine months ended September 30, 20172019 and 2016,2018, respectively.
Table of Contents
DASEKE, INC. AND SUBSIDIARIES
NOTES TO CONSOLIDATED FINANCIAL STATEMENTS – (Continued)
(Unaudited)
NOTE 7 – SALES-TYPE LEASES
The Company leases revenue equipment Depreciation expense and accumulated depreciation on assets leased and available for lease to certain of its owner-operators was $5.7 million and accounts$16.4 million for these transactions as sales-type leases. These leases have terms ofthe three and nine months ended September 30, to 72 months and are collateralized by a security interest2019, respectively. Included in depreciation expense is the related revenue equipment. A minimum lease receivable is recorded, net of unearned interest income and deferred gain on saleimpact of the equipment. The gain is recognized as payments are collected, rather thanstep-up in the period the lease is recorded due to the uncertaintybasis of collection.
The componentsfixed assets resulting from acquisitions of the net investment in sales-type leases are as follows at September 30, 2017 and December 31, 2016 (in thousands):
| | | | | | |
| | 2017 | | 2016 |
Minimum lease receivable | | $ | 35,120 | | $ | 21,055 |
Deferred gain | | | (7,092) | | | (3,049) |
Net minimum lease receivable | | | 28,028 | | | 18,006 |
Unearned interest income | | | (3,848) | | | (3,671) |
| | | | | | |
Net investment in sales-type leases | | | 24,180 | | | 14,335 |
Current portion | | | (6,022) | | | (3,516) |
| | $ | 18,158 | | $ | 10,819 |
The long-term portion of sales-type leases is classified in other long-term assets on the consolidated balance sheets at September 30, 2017 and December 31, 2016.
Gain or loss on disposition of revenue equipment leased to owner-operators is included as a component of purchased freight in the consolidated statements of operations. The gains totaled approximately $0.5$5.5 million and $0.2$7.0 million for the three months ended September 30, 20172019 and 2016, respectively,2018, and $0.8$18.2 million and $0.5$16.4 million for the nine months ended September 30, 20172019 and 2016,2018, respectively.
NOTE 8 – ACCRUED EXPENSES AND OTHER LIABILITIES
The components of accrued expenses and other liabilities are as follows atas of September 30, 20172019 and December 31, 20162018 (in thousands)millions):
| | | | | | | | | | | | |
| | 2017 | | 2016 | | 2019 | | 2018 |
Brokerage and escorts | | $ | 6,732 | | $ | 3,559 | | $ | 18.8 | | $ | 12.6 |
Unvouchered payables | | | 4,892 | | | 2,587 | | | 12.4 | | | 11.7 |
Other accrued expenses | | | 5,339 | | | 3,956 | | | 9.7 | | | 8.0 |
Owner-operator deposits | | | 4,779 | | | 2,032 | | | 8.5 | | | 9.3 |
Sales and local taxes payable | | | | 2.3 | | | 3.3 |
Fuel and fuel taxes | | | | 1.9 | | | 1.2 |
Interest | | | 255 | | | 1,705 | | | 0.6 | | | 0.4 |
Dividends | | | 1,239 | | | 1,209 | |
Fuel | | | 995 | | | 711 | |
Fuel taxes | | | 429 | | | 345 | |
| | $ | 24,660 | | $ | 16,104 | | $ | 54.2 | | $ | 46.5 |
Table of Contents
DASEKE, INC. AND SUBSIDIARIES
NOTES TO CONSOLIDATED FINANCIAL STATEMENTS – (Continued)
(Unaudited)
NOTE 9 – LONG-TERM DEBT
Long-term debt consists of the following atas of September 30, 20172019 and December 31, 20162018 (in thousands)millions):
| | | | | | |
| | 2017 | | 2016 |
Senior debt | | | | | | |
| | | | | | |
Line of credit | | $ | — | | $ | 6,858 |
Term loan facility | | | 348,462 | | | — |
Senior term loan | | | — | | | 125,682 |
Equipment term loans | | | 82,668 | | | 111,882 |
Real estate term loan | | | — | | | 13,772 |
Capital leases | | | 4,540 | | | 13,818 |
| | | 435,670 | | | 272,012 |
Less current portion | | | (26,514) | | | (52,665) |
Less unamortized debt issuance costs | | | (13,315) | | | (4,117) |
Long-term portion | | | 395,841 | | | 215,230 |
| | | | | | |
Subordinated debt | | | | | | |
| | | | | | |
Main Street Capital Corporation | | | — | | | 21,660 |
Prudential Capital Partners | | | — | | | 21,492 |
LST Seller notes | | | — | | | 22,000 |
DTR Seller notes | | | — | | | 1,000 |
BHE Seller notes | | | — | | | 291 |
Total subordinated debt | | | — | | | 66,443 |
| | | | | | |
Total long-term debt | | $ | 395,841 | | $ | 281,673 |
| | | | | | |
| | 2019 | | 2018 |
Term loan facility | | $ | 489.7 | | $ | 493.5 |
Equipment term loans | | | 197.5 | | | 190.7 |
Finance and capital leases | | | 26.0 | | | 18.2 |
| | | 713.2 | | | 702.4 |
Less current portion | | | (61.6) | | | (63.5) |
Less unamortized debt issuance costs | | | (12.5) | | | (16.2) |
Total long-term debt | | $ | 639.1 | | $ | 622.7 |
Term Loan Facility
In conjunction with the close of the Business Combination on February 27, 2017, theThe Company entered into the $350.0has a $500.0 million Term Loan Facilityterm loan facility under a loan agreement with Credit Suisse AG, Cayman Islands Branch, as administrative agent, and the lenders party thereto. Thethereto (the Term Loan Facility consists of (i) a $250.0 million term loan funded on the closing date of the Term Loan Facility (the Closing Date Term Loan) and up to $100.0 million of term loans to be funded from time to time under a delayed draw feature available until February 27, 2018.
The size of the Term Loan Facility could increase from time to time pursuant to an uncommitted incremental facility in an aggregate amount for all such incremental loans and commitments up to the sum of (a) $65.0 million and (b) an uncapped amount based on the maximum first lien, secured and total leverage ratio-based formulas depending upon the security and ranking of the relevant incremental facility. The proceeds from the Closing Date Term Loan were used to partially refinance certain of the Company’s capital leases, purchase money debt, equipment and real estate financings and to pay transaction costs associatedFacility) with the Business Combination and refinance the Line of Credit and the Senior Term Loan.
The Term Loan Facility has a scheduled maturity date of February 27, 2024. Term loans under the Term Loan Facility are, at the Company’s election from time to time, comprised of alternate base rate loans (an ABR Borrowing) or adjusted LIBOR loans (a Eurodollar Rate Borrowing), with the applicable margins of interest being an alternate base rate (subject to a 2.00% floor) plus 4.50%4.00% per annum for ABR Borrowings and LIBOR (subject to a 1.00% floor) plus 5.50%5.00% per annum for Eurodollar Rate Borrowings.annum. At September 30, 2017,2019, the average interest rate on the Term Loan Facility was 6.6%7.4%.
The Term Loan Facility is secured by all assets of the Company, except those assets collateralizing equipment and certain real estate lenders debt and subject to certain customary exceptions.
Table of Contents
DASEKE, INC. AND SUBSIDIARIES
NOTES TO CONSOLIDATED FINANCIAL STATEMENTS – (Continued)
(Unaudited)
NOTE 9 – LONG-TERM DEBT – (Continued)
As amended on August 16, 2017, theThe Term Loan Facility contains a financial covenant requiring the Company to maintain a consolidated total leverage ratio as of the last day of any fiscal quarter of less than or equal to 4.25 to 1.00 commencing on June 30, 2017, stepping up to 4.75 to 1.00 on September 30, 2017, stepping down to 4.25 to 1.00 on March 31, 2018, stepping down to 4.00 to 1.00, on March 31, 2019 and stepping down to 3.75 to 1.00 on March 31, 2021. Additionally, as amended on August 16, 2017, the Term Loan Facility contains a pro forma total leverage ratio of less than or equal to 4.25 to 1.00 for term loans funded from the delayed draw feature. The consolidated total leverage ratio is defined as the ratio of (i) consolidated total debt minus unrestricted cash and cash equivalents and cash and cash equivalents restricted in favor of the administrative agent and the lenders, not to exceed $5 million, to (ii) consolidated adjustedAdjusted EBITDA for the trailing 12 month period (with customary add-backs permitted to consolidated adjustedAdjusted EBITDA, including in respect of synergies and cost-savings reasonably identifiable and factually supportable that are anticipated to be realized in an aggregate amount not to exceed 25% of consolidated adjustedAdjusted EBITDA and subject to other customary limitations).
The Term Loan Facility permits voluntarilyvoluntary prepayments of borrowings. In certain circumstances (subject to exceptions, exclusions and, in the case of excess cash flow, step-downs described below), the Company may also be required to make an offer to prepay the Term Loan Facility if it receives proceeds as a result of certain asset sales, debt issuances, casualty or similar events of loss, or if it has excess cash flow (defined as an annual amount calculated using a customary formula based on consolidated adjustedAdjusted EBITDA, including, among other things, deductions for (i) the amount of certain voluntary prepayments of the Term Loan Facility and (ii) the amount of certain capital expenditures, acquisitions, investments and restricted payments). The percentage of excess cash flow that must be applied as a mandatory prepayment is 50% with respect to the initial excess cash flow period (the fiscal year ending on December 31, 2018) and will be 50%, 25% or 0% for future excess cash flow periods for the year ending December 31, 2019 and beyond, depending upon the first lien leverage ratio.
The Term Loan Facility contains (i) certain customary affirmative covenants that, among other things, require compliance with applicable laws, periodic financial reporting and notices of material events, payment of taxes and other obligations, maintenance of property and insurance, and provision of additional guarantees and collateral, and (ii) certain customary negative covenants that, among other things, restrict the incurrence of additional indebtedness, liens on property, sale and leaseback transactions, investments, mergers, consolidations, liquidations and dissolutions, asset sales, acquisitions, the payment of distributions, dividends, redemptions and repurchases of equity interests, transactions with affiliates, prepayments and redemptions of certain other indebtedness, burdensome agreements, holding company limitations, changes in fiscal year and modifications of organizational documents.
ABL Facility
Also, in conjunction with the Closing on February 27, 2017, theThe Company entered intohas a five-year, senior secured asset-based revolving line of credit with an aggregate maximum credit amount equal to $70.0$100.0 million (subject to availability under a borrowing base equal to 85% of the Company’s eligible accounts receivable, 80% of the Company’s eligible unbilled accounts receivable and 50% of parts supplies) under a credit agreement with PNC Bank, National Association, as administrative agent and the lenders party thereto. The size of the ABL Facility could increase from time to timeFacility’s maximum credit amount may be increased by $30.0 million pursuant to an uncommitted accordion by an aggregate amount for all such increases of up to $30 million. The ABL Facility matures on February 27, 2022.accordion. The ABL Facility also provides for the issuance of letters of credit subject to certain restrictions and a sublimit of $20 million, as defined in the credit agreement. The ABL Facility matures on February 27, 2022. As of September 30, 2017,2019, the Company had no borrowings and $8.9a debit balance of $2.8 million, $13.9 million in letters of credit outstanding, under the ABL Facility and could incur approximately $70.0$84.6 million of additional indebtedness under the ABL Facility.
Borrowings under the ABL Facility bear interest at rates based upon the Company’s fixed charge coverage ratio and, at the Company’s election from time to time, either a base rate plus an applicable margin or an adjusted LIBOR rate plus an applicable margin. Margins on the ABL Facility are adjusted, if necessary to the applicable rates set forth in the following table corresponding to the fixed charge coverage ratio for the trailing 12 month period on the last day of the most recently completed fiscal quarter.
| | | | | | | | | | |
Fixed Charge Coverage Ratio | | Base Rate Margins | | LIBOR Rate Margins | | | Base Rate Margins | | LIBOR Rate Margins | |
Less than 1.25 to 1.00 | | 2.25 | % | 3.25 | % | | 2.25 | % | 3.25 | % |
Greater than or equal to 1.25 to 1.00, but less than 1.50 to 1.00 | | 1.75 | % | 2.75 | % | | 1.75 | % | 2.75 | % |
Greater than or equal to 1.50 to 1.00, but less than 1.75 | | 1.25 | % | 2.25 | % | |
Greater than or equal to 1.50 to 1.00, but less than 1.75 to 1.00 | | | 1.25 | % | 2.25 | % |
Greater than or equal to 1.75 to 1.00 | | 0.75 | % | 1.75 | % | | 0.75 | % | 1.75 | % |
Table of Contents
DASEKE, INC. AND SUBSIDIARIES
NOTES TO CONSOLIDATED FINANCIAL STATEMENTS – (Continued)
(Unaudited)
NOTE 9 – LONG-TERM DEBT – (Continued)The ABL Facility was amended on June 15, 2018, to adjust margins, if necessary, on the ABL Facility beginning in the fiscal quarter ended September 30, 2018, to the applicable rates set forth in the following table corresponding to the average RLOC Utilization for the trailing 12 month period on the last day of the most recently completed fiscal quarter. RLOC Utilization at a particular date shall mean an amount equal to (a)(i) outstanding amount of Revolving Advances plus (ii) the outstanding amount of the Swing Loans plus (iii) the aggregate Maximum Undrawn Amount of all outstanding Letters of Credit, divided by (b) Maximum Revolving Advance Amount, each as defined in the credit agreement.
| | | | | |
RLOC Utilization | | Base Rate Margins | | LIBOR Rate Margins | |
Less than 33.3% | | 0.50 | % | 1.50 | % |
Greater than or equal to 33.3%, but less than 66.6% | | 0.75 | % | 1.75 | % |
Greater than or equal to 66.6% | | 1.00 | % | 2.00 | % |
At September 30, 2019, the interest rate on the ABL Facility was 5.50%.
The ABL Facility is secured by all of the Company’s U.S. basedU.S.-based accounts receivable, parts supplies, cash and cash equivalents excluding proceeds of Term Loan Facility, securities and deposit accounts and other general assets not included in the Term Loan Facility collateral.
The ABL Facility contains (i) a financial covenant similar to the consolidated total leverage ratio required under the Term Loan Facility (but, as amended on August 31, 2017, in any event requiring a leverage ratio of less than or equal to 4.754.00 to 1.00 for the fiscal quarter, ended September 30, 2017, stepping down to 3.75 to 1.00 on March 31, 2021 in the same increments as the Term Loan Facility noted above) and (ii) during any period after a default or event of default or after excess availability falling below the greater of (x) $15.0 million and (y) 20% of the maximum credit amount, continuing until such time as no default or event of default has existed and excess availability has exceeded such amounts for a period of 60 consecutive days, a financial covenant requiring the Company to maintain a minimum consolidated fixed charge coverage ratio of 1.00x, tested on a quarterly basis. The Company’s fixed charge coverage ratio is defined as the ratio of (1) consolidated adjustedAdjusted EBITDA minus unfinanced capital expenditures, cash taxes and cash dividends or distributions, to (2) the sum of all funded debt payments for the four quarterfour-quarter period then ending (with customary add-backs permitted to consolidated adjustedAdjusted EBITDA).
The ABL Facility contains affirmative and negative covenants similar to those in the Term Loan Facility, together with such additional terms as are customary for a senior secured asset-based revolving credit facility.
As of September 30, 2017,2019, the Company was in compliance with all covenants contained in the Term Loan and ABL Facilities.
Line of Credit and Senior Term Loan
Prior to the Closing, the Company had a credit facility under a credit agreement with PNC, as agent, and other lenders party thereto (the PNC Credit Agreement), which included a revolving line of credit and a term loan. In August 2016, the PNC Credit Agreement was amended, increasing the borrowing capacity to an aggregate $212.1 million from $150.0 million, consisting of a $75.0 million revolving line of credit and a $137.1 million senior term loan. In conjunction with the amendment, the Company refinanced $73.0 million of equipment notes with various lenders under the PNC Credit Agreement. The line of credit was subject to a borrowing base equal to 85% of the Company’s eligible accounts receivable, 80% of the Company’s eligible unbilled accounts receivable and 50% of parts supplies.
As of December 31, 2016, borrowings on the line of credit bore interest at either (a) the Libor Rate (as defined in the credit agreement), plus a margin of 3.25%, or (b) the Base Rate (as defined in the credit agreement), plus a margin of 2.25%. The PNC revolving credit facility also provided for the issuance of up to $10 million in letters of credit. As of December 31, 2016, the Company had outstanding letters of credit thereunder totaling $4.1 million. Total availability under the line of credit was $33.0 million as of December 31, 2016. At December 31, 2016, the average interest rate on the line of credit was 4.5%.
As of December 31, 2016, the Senior Term Loan was due in monthly installments of $1,690,154, plus applicable interest at either (a) the Libor Rate (as defined in the credit agreement), plus a margin of 4.00%, or (b) the Base Rate (as defined in the PNC Credit Agreement), plus a margin of 3.00%. At December 31, 2016, the average interest rate on the Senior Term Loan was 4.4%.
Prior to the amendment in August 2016, debt on the Senior Term Loan had interest rates of either (a) the Libor Rate (as defined in the credit agreement), plus a margin of 3.75%, or (b) the Base Rate (as defined in the credit agreement), plus a margin of 2.75%.
Margins on the line of credit and Senior Term Loan were adjusted, if necessary to the applicable rates set forth in the following table corresponding to the fixed charge coverage ratio for the trailing twelve month period on the last day of the most recently completed fiscal quarter.
| | | | | | | | | |
| | Base Rate Margins | | LIBOR Rate Margins | |
Fixed Charge Coverage Ratio | | Line of Credit | | Senior Term Loan | | Line of Credit | | Senior Term Loan | |
Less than 1.25 to 1.00 | | 2.25 | % | 3.00 | % | 3.25 | % | 4.00 | % |
Greater than or equal to 1.25 to 1.00, but less than 1.50 to 1.00 | | 1.75 | % | 2.50 | % | 2.75 | % | 3.50 | % |
Greater than or equal to 1.50 to 1.00, but less than 1.75 | | 1.25 | % | 2.00 | % | 2.25 | % | 3.00 | % |
Greater than or equal to 1.75 to 1.00 | | 0.75 | % | 1.50 | % | 1.75 | % | 2.50 | % |
Table of Contents
DASEKE, INC. AND SUBSIDIARIES
NOTES TO CONSOLIDATED FINANCIAL STATEMENTS – (Continued)
(Unaudited)
NOTE 9 – LONG-TERM DEBT – (Continued)
The PNC Credit Agreement also contained a subjective acceleration clause, which permitted the lender to demand payment in the event of a material adverse change. Only the scheduled principal payments are being presented in the current portion of long-term obligations as the lender did not exercise the acceleration clause.
Borrowings under the PNC Credit Agreement were secured by all assets of the Company, except those assets collateralizing equipment and certain real estate lenders debt. The PNC Credit Agreement contained certain financial covenants, including a minimum fixed charge coverage ratio, a senior secured debt to consolidated earnings before interest, taxes, depreciation and amortization (EBITDA) ratio and a funded debt to consolidated EBITDA ratio.
Additionally, the PNC Credit Agreement contained negative covenants limiting, among other things, additional indebtedness, transactions with affiliates, additional liens, sales of assets, dividends, investments and advances, prepayments of debt, mergers and acquisitions, and other matters customarily restricted in such agreements. As of December 31, 2016, the Company was in compliance with all covenants contained in the PNC Credit Agreement.
The PNC Credit Agreement contained a required principal payment based on excess cash flow (as defined) beginning in fiscal 2016 and due 15 days following the delivery of the audited financial statements to PNC. No excess cash flow payment was required prior to refinancing in conjunction with the Business Combination.
Equipment Term Loans and Mortgages
As of September 30, 2017,2019, the Company had term loans collateralized by equipment in the aggregate amount of $79.0$194.2 million with thirty(30)32 lenders (Equipment Term Loans). The Equipment Term Loans bear interest at rates ranging from 1.5% to 6.8%10.7%, require monthly payments of principal and interest and mature at various dates through July 2024.January 2028. Certain of the Equipment Term Loans contain conditions, covenants, representations and warranties, events of default, and indemnification provisions applicable to the Company and certain of its subsidiaries that are customary for equipment financings, including, but not limited to, limitations on the incurrence of additional debt and the prepayment of existing indebtedness, certain payments (including dividends and other distributions to persons not party to its credit facility) and transfers of assets.
The Company had a construction loan with a balance of $8.8 million incurred to finance the construction of a new headquarters and terminal in Arlington, Washington which was repaid in February 2017 in conjunction with the Business Combination. See Note 2 for additional details on the Business Combination. The construction loan was collateralized by such property and buildings. The initial principal amount on February 19, 2015 of $7.8 million was increased on April 26, 2016 to $8.8 million. The construction loan earned interest at 3.25% payable monthly.
As of September 30, 2017,2019, the Company has a bank mortgage loan with a balance of $3.7$3.3 million incurred to finance the construction of the headquarters and terminal in Redmond, Oregon. The mortgage loan is collateralized by such property and buildings. The mortgage is payable in monthly installments of $15,776, including interest at 3.7% through November 2017.2020.
The interest rate and monthly payments will be adjusted on November 1, 2017 and 2020 to a rate of 2.5%, plus the three-year advance rate published by the Federal Home Loan Bank of Seattle in effect 45 days prior to November 1, 2017 and 2020 (which will not be less than 3.7%). The bank mortgage loan matures November 1, 2023.
Real Estate Term Loan
In April 2016, the Company refinanced $14.2 million of its Line of Credit with bank debt (Real Estate Term Loan) utilizing nine wholly-owned real estate assets which previously served as collateral on the PNC Term Loan. The Real Estate Term Loan was subordinate to the PNC Credit AgreementFinance and Equipment Term Loans and was due in monthly installments of $59,109 (based on 20 year amortization schedule), plus applicable interest at either (a) the Libor Rate (as defined in the loan agreement), plus a margin of 2.75%, or (b) the Default Rate (as defined in the loan agreement). The Company incurred debt issuance costs of $0.4 million, which were being amortized to interest expense over five years using the straight-line method. In conjunction with the Business Combination, the Real Estate Term Loan was repaid and all unamortized debt issuance costs written off to interest expense. See Note 2 for additional details on the Business Combination.
Table of Contents
DASEKE, INC. AND SUBSIDIARIES
NOTES TO CONSOLIDATED FINANCIAL STATEMENTS – (Continued)
(Unaudited)
NOTE 9 – LONG-TERM DEBT – (Continued)
Capital Leases
The Company leases certain equipment under long-term finance and capital lease agreements that expire on various dates through June 2024.May 2025. As of September 30, 2017 and December 31, 2016,2018, the book value of the property and equipment recorded under capital leases was $5.6 million and $24.1$16.6 million, net of accumulated depreciation of $5.0 million and $17.0 million, respectively.$7.8 million. Depreciation expense related to leasedcapital lease equipment was $0.6$0.8 million and $1.8$2.2 million for the three months ended September 30, 2017 and 2016, respectively, and $1.8 million and $5.3 million for the nine months ended September 30, 2017 and 2016,2018, respectively.
Main Street Capital Corporation
In 2013, Main Street Capital Corporation (Main Street) loaned the Company $20.0 million under a senior subordinated secured term loan (the Main Street Loan). The Main Street Loan was subordinate to the PNC Credit Agreement and Equipment Term Loans. Interest payments were due monthly through maturity at the rate of 12% per annum. Paid-in kind (PIK) interest, at a rate of 2.5% per annum, could have been paid monthly or accrued and added to the principal balance quarterly, at the option of the Company. For the nine months ended September 30, 2017 and year ended December 31, 2016, $0.1 million and $0.5 million, respectively, of accrued PIK interest was added to the principal balance and accrued PIK interest of $0.1 million was recorded in accrued expenses as of December 31, 2016. In conjunction with Business Combination, the Main Street Loan was repaid in February 2017. See Note 2 for additional detailsinformation on the Business Combination.finance leases.
Prudential Capital Partners
In 2013, the Company issued senior secured subordinated promissory notes in the initial aggregate principal amount of $20.0 million (PCP Subordinated Notes) to Prudential Capital Partners IV, L.P., Prudential Capital Partners (Parallel Fund) IV, L.P. and Prudential Capital Partners Management Fund IV, L.P. (collectively, the PCP Investors) pursuant to the Securities Purchase Agreement, dated as of November 12, 2013, by and among the Company, certain of its subsidiaries and the PCP Investors. The PCP Subordinated Notes were subordinate to the PNC Credit Agreement and Equipment Term Loans. Interest payments were due monthly through maturity at the rate of 12% per annum. PIK interest, at a rate of 2.5% per annum, could have been paid monthly or accrued and added to the principal balance quarterly, at the option of the Company. For the nine months ended September 30, 2017 and year ended December 31, 2016, $0.1 million and $0.5 million, respectively, of accrued PIK interest was added to the principal balance and $0.1 million accrued PIK interest was recorded in accrued expenses as of December 31, 2016. In conjunction with Business Combination, the PCP Subordinated Notes were repaid in February 2017. See Note 2 for additional details on the Business Combination.
The Main Street Loan and the PCP Subordinated Notes (Subordinated Debt) were collateralized by all assets of the Company, except those assets collateralizing the Equipment Term Loans. The Main Street Loan and the PCP Subordinated Notes contained certain financial covenants, including a minimum fixed charge coverage ratio, a senior secured debt to consolidated EBITDA ratio and a funded debt to consolidated EBITDA ratio. Additionally, they contained negative covenants limiting, among other things, additional indebtedness, capital expenditures, transactions with affiliates, additional liens, sales of assets, dividends, investments and advances, prepayments of debt, mergers and acquisitions, and other matters customarily restricted in such agreements. The Main Street Loan and the PCP Subordinated Notes were subject to a make-whole payment of 5.0% of the prepayment amount if such prepayment was made before the third anniversary of the agreements.
LST Seller
As part of the consideration paid to the seller of Lone Star Transportation, LLC and affiliates (LST), Daseke Lone Star, Inc. (a subsidiary of the Company) issued $22.0 million of subordinated notes (the LST Seller Notes). The LST Seller Notes bore interest at 10% payable monthly and were subordinate to the PNC Credit Agreement, Main Street Loan and PCP Subordinated Notes. In conjunction with the Business Combination, the LST Seller Notes were repaid in February 2017. See Note 2 for additional details on the Business Combination.
Table of Contents
DASEKE, INC. AND SUBSIDIARIES
NOTES TO CONSOLIDATED FINANCIAL STATEMENTS – (Continued)
(Unaudited)
NOTE 9 – LONG-TERM DEBT – (Continued)
DTR Sellers
As part of the consideration paid to the sellers of Davenport Transport & Rigging, LLC, LST issued $1.0 million of subordinated notes (the DTR Seller Notes). The DTR Seller Notes bore interest at 5% payable monthly and were subordinate to the PNC Credit Agreement, Main Street Loan and PCP Subordinated Notes. In conjunction with Business Combination, the DTR Seller Notes were repaid in February 2017. See Note 2 for additional details on the Business Combination.
BHE Sellers
As part of the consideration paid to the sellers of Bulldog Hiway Express (BHE), the Company issued $2.0 million of subordinated notes (the BHE Seller Notes). The BHE Seller Notes bore interest at 7% payable monthly. On December 19, 2016, a portion of the outstanding principal amount under the BHE Seller Notes was forgiven in exchange for the payment by the Company of certain pension liabilities of BHE. The BHE Seller Notes were subordinate to the PNC Credit Agreement and the Main Street Loan and the PCP Subordinated Notes. In conjunction with Business Combination, the BHE Seller Notes were repaid in February 2017. See Note 2 for additional details on the Business Combination.
Future Payments
Future principal payments on long-term debt as of September 30, 20172019 are as follows (in thousands)millions):
| | | | | | | | | | | | |
| | Term Loan Facility | | Equipment Term Loans | | Capital
Leases | | Total |
| | | | | | | | | | | | |
2017 | | $ | 3,485 | | $ | 20,875 | | $ | 2,387 | | $ | 26,747 |
2018 | | | 3,485 | | | 20,802 | | | 1,410 | | | 25,697 |
2019 | | | 3,485 | | | 17,226 | | | 822 | | | 21,533 |
2020 | | | 3,485 | | | 11,516 | | | 152 | | | 15,153 |
2021 | | | 3,485 | | | 5,037 | | | 61 | | | 8,583 |
Thereafter | | | 331,037 | | | 7,212 | | | 81 | | | 338,330 |
| | | | | | | | | | | | |
Total minimum lease payments | | | | | | | | | 4,913 | | | |
Loan amount attributable to interest | | | | | | | | | (373) | | | (373) |
| | | | | | | | | | | | |
Total (Present value of minimum lease payments on capital leases) | | $ | 348,462 | | $ | 82,668 | | | 4,540 | | $ | 435,670 |
Less current portion | | | | | | | | | (2,154) | | | |
Long-term capital leases | | | | | | | | $ | 2,386 | | | |
| | | | | | | | | | | | |
| | | | | | | | |
Twelve months ending September 30, | Term Loan Facility | | Equipment Term Loans | | Total |
| | | | | | | | |
2020 | $ | 5.0 | | $ | 50.2 | | $ | 55.2 |
2021 | | 2.5 | | | 43.3 | | | 45.8 |
2022 | | 2.5 | | | 37.4 | | | 39.9 |
2023 | | 11.2 | | | 26.6 | | | 37.8 |
2024 | | 2.5 | | | 28.9 | | | 31.4 |
Thereafter | | 466.0 | | | 11.1 | | | 477.1 |
Total long-term debt | $ | 489.7 | | $ | 197.5 | | $ | 687.2 |
| | | | | | | | |
NOTE 10 – INCOME TAXES
The Company’s statutory federal tax rate is 35%. State tax rates vary among states and range from approximately 1% to 6%, although some state rates are higher and a small number of states do not impose an income tax. The effective tax rates for the three months ended September 30, 20172019 and 20162018 were 101.8%17.4% and (119.0%)23.5%, respectively, and 22.6%17.3% and (69.1%(2,333.6%) for the nine months ended September 30, 20172019 and 2016,2018, respectively. The difference between the Company’s effective tax rate and the federal statutory rate primarily results from state income taxes and nondeductible expenses, including the effect of the per diem pay structure for drivers, transaction expenses and withdrawn Private Daseke IPO expenses. in 2019 non-deductible goodwill impairment. State tax rates vary among states and range from approximately 1% to 6%, although some state rates are higher and a small number of states do not impose an income tax.
Regarding the new tax on global intangible low-taxed income (GILTI), which became applicable in 2018 as part of the Tax Cuts and Jobs Act of 2017 (TCJA), the Company will treat GILTI as a period cost if and when incurred.
There were no changes in uncertain tax positions during the three and nine months ended September 30, 2017. As a result of the Business Combination, the Company had an Internal Revenue Code of 1986, as amended, section 382 ownership change, which will not impair the Company’s ability to utilize the net operating losses.2019.
Table of Contents
DASEKE, INC. AND SUBSIDIARIES
NOTES TO CONSOLIDATED FINANCIAL STATEMENTS – (Continued)
(Unaudited)
NOTE 11 – STOCKHOLDERS’ EQUITY
Common Stock
Common stock has voting rights – one vote for each share of common stock.
On September 19, 2017,February 14, 2018, the Company and certain stockholdersone of the Company (the Selling Stockholders)Company’s stockholders entered into an underwriting agreement (the Underwriting Agreement) with Cowen and Company, LLC and Stifel, Nicolaus & Company, Incorporated, and Cowen and Company, LLC, as representatives of the several underwriters named therein, (collectively, the Underwriters), in connection with an underwritten public offering (the Offering) of 5,292,0007,500,000 shares of the Company’s common stock, par value $0.0001 per share, including 4,882,167 shares of common stock to be sold by the Company and 409,833 shares of common stock to be sold by the Selling Stockholders, at a price to the public of $12.00$10.60 per share ($11.34 per share net of underwriting discounts and commissions).share. Pursuant to the Underwriting Agreement,underwriting agreement, the Company granted the Underwritersunderwriters a 30-day option to purchase up to an additional 793,8001,125,000 shares of common stock, which was exercised in full on September 20, 2017February 16, 2018 and closed simultaneously with the Offeringoffering on September 22, 2017.February 20, 2018. Net proceeds received by the Company from its sale of 5,675,967 shares of common stock were approximately $63.6$84.4 million, after deducting underwriting discounts and commissions and estimated offering expenses payable by the Company. As described in the prospectus supplement, dated September 19, 2017, filed with the SEC on September 20, 2017, theThe Company intends to usehas used the net proceeds from the Offeringoffering for general corporate purposes, which may include,including, among other things, working capital, capital expenditures, debt repayment or refinancing orrefinancing.
On June 1, 2018, after having met the financingearnout provisions contained in the Merger Agreement, the Company issued 5,000,000 shares of possiblethe Company’s common stock, par value $0.0001 per share, pro rata among the Private Daseke Stockholders (Earnout Shares).
The Earnout Shares were issued in reliance upon an exemption from the registration requirements of the Securities Act of 1933, as amended (the Securities Act), pursuant to Section 4(a)(2) thereof, which exempts transactions by an issuer not involving any public offering on the basis that the securities were offered and sold in a non-public offering to “accredited investors” (as defined in Rule 501(a) of Regulation D under the Securities Act). Private Daseke, which refers to Daseke, Inc. and its subsidiaries prior to the merger with Hennessy, engaged a purchaser representative to serve as the purchaser representative for two Private Daseke stockholders who were not “accredited investors,” which purchaser representative met all of the conditions set forth in Rule 501(i) of Regulation D, as required to comply with applicable federal securities laws in connection with the issuance of shares of the Company’s common stock to these two Private Daseke stockholders pursuant to the Merger Agreement.
On June 6, 2018, as part of the consideration paid for the Aveda acquisition, the Company issued 1,612,979 shares of Daseke common stock valued at $15.4 million. See Note 3 for additional details about the Aveda acquisition.
On July 1, 2018, as part of the consideration paid for the Kelsey Trail acquisition, the Company issued 95,859 shares of Daseke common stock valued at $0.9 million. See Note 3 for additional details about the Kelsey Trail acquisition.
On August 1, 2018, as part of the consideration paid for the Builders acquisition, the Company issued 399,530 shares of Daseke common stock valued at $3.4 million. See Note 3 for additional details about the Builders acquisition.
As of September 30, 2019, the Company has approximately 0.5 million shares of common stock reserved for future acquisitions.issuances of stock options and restricted stock units under the Company’s 2017 Omnibus Incentive Plan. See Note 12 for additional details about the Company’s stock-based compensation plan.
Preferred Stock
At the Closing, theThe Company has issued and outstanding 650,000 shares of Series A Preferred Stock for cashwith a redemption value of $65.0 million. Proceeds from the sales were part of the consideration received as part of a recapitalization and reverse acquisition completed in the Business Combination. See Note 2 for additional details about the Business Combination. The par value of Series A Preferred Stock is $0.0001 per share. Additional features of this preferred stock are as follows:
Under the Certificate of Designations, Preferences, Rights and Limitations of the Series A Preferred Stock (the Certificate of Designations), each share of Series A Preferred Stock will be convertible, at the holder’s option at any time, initially into approximately 8.6957 shares of the Company’s common stock (assuming a conversion price of approximately $11.50 per share), subject to specified adjustments as set forth in the Certificate of Designations. If any holder elects to convert its Series A Preferred Stock after the seven-year anniversary of the issue date, if the then-current Conversion Price (as defined in the Certificate of Designations) exceeds the Weighted Average Price (as defined in the Certificate of Designations) for the common stock during any ten consecutive Trading Days (as defined in the Certificate of Designations), at its option by delivery of a Notice of Conversion in accordance with Section 8(b) of the Certificate of Designations no later than five business days following such tenth consecutive Trading Day, to convert any or all of such holder’s shares of Series A Preferred Stock into, at the Company’s sole discretion, either common stock, cash or a combination of common stock and cash; provided, that the Company shall provide such converting holder notice of its election within two Trading Days of receipt of the Notice of Conversion; provided further, that in the event the Company elects to issue common stock for all or a portion of such conversion, the Conversion Rate for such conversion (subject to the limitations set forth in Section 11 of the Certificate of Designations) shall mean the quotient of the Liquidation Preference (as defined in the Certificate of Designations) divided by the average Weighted Average Price for the common stock during the 20 consecutive Trading Days commencing on the Trading Day immediately following the Trading Day on which the Company provided such notice. If the Company does not elect a settlement method prior to the deadline set forth in the Certificate of Designations, the Company shall be deemed to have elected to settle the conversion entirely in common stock. Based on the assumed conversion rate, a total of 5,652,1715,652,173 shares of Series A Preferred Stockcommon stock would be issuable upon conversion of all of the currently outstanding shares of Series A Preferred Stock.
Table of Contents
DASEKE, INC. AND SUBSIDIARIES
NOTES TO CONSOLIDATED FINANCIAL STATEMENTS – (Continued)
(Unaudited)
NOTE 11 – STOCKHOLDERS’ EQUITY – (Continued)
On or after the third anniversary of the initial issuance date but prior to the fifth anniversary of the initial issuance date, the Company will have the right, at its option, to give notice of its election to cause all outstanding shares of the Series A Preferred Stock to be automatically converted into shares of the Company’s common stock at the then-effective conversion rate, if the Weighted Average Price of Company’s common stock equals or exceeds 140% of the then-current conversion price for at least 20 trading20-trading days (whether or not consecutive) in a period of 30 consecutive trading days. On or after the fifth anniversary of the initial issuance date but prior to the seventh anniversary of the initial issuance date, the Company will have the right, at its option, to give notice of its election to cause all outstanding shares of the Series A Preferred Stock to be automatically converted into shares of Company’s common stock at the then-effective conversion rate, if the Weighted Average Price of Company’s common stock equals or exceeds 115% of the then-current conversion price for at least 20 trading20-trading days (whether or not consecutive) in a period of 30 consecutive trading days. On or after the seventh anniversary of the initial issuance date, the Company will have the right, at its option, to give notice of its election to cause all outstanding shares of the Series A Preferred Stock to be automatically converted into shares of Company’s common stock at the then-effective conversion rate, if the Weighted Average Price of Company’s common stock equals or exceeds the then-current conversion price for at least 10 consecutive trading days. If the Company undergoes certain fundamental changes (as more fully described in the Certificate of Designations but including, among other things, certain change-in-control transactions, recapitalizations, asset sales and liquidation events), each outstanding share of Series A Preferred Stock may, within 15 days following the effective date of such fundamental change and at the election of the holder, be converted into Company’s common stock at a conversion rate (subject to certain adjustments) equal to (i) the greater of (A) the sum of the conversion rate on the effective date of such fundamental change plus the additional shares received by holders of Series A Preferred Stock following such fundamental change (as set forth in the Certificate of Designations) and (B) the quotient of (x) $100.00, divided by (y) the greater of (1) the applicable holder stock price and (2) 66 2/3% of the closing sale price of the Company’s common stock on the issue date plus (ii) the number of shares of Company’s common stock that would be issued if any and all accumulated and unpaid dividends were paid in shares of Company’s common stock.
The Series A Preferred Stock contains limitations that prevent the holders thereof from acquiring shares of the Company’s common stock upon conversion that would result in (i) the number of shares beneficially owned by such holder and its affiliates exceeding 9.99% of the total number of shares of the Company’s common stock then outstanding or (ii) the Series A Preferred Stock being converted into more than 19.99% of the shares of the Company’s common stock outstanding on the initial issue date of the Series A Preferred Stock (subject to
appropriate adjustment in the event of a stock split, stock dividend, combination or other similar recapitalization) without, in the latter instance, stockholder approval of such issuance.
Additional features of the Series A Preferred Stock are as follows:
| a. | | Liquidation – In the event of liquidation, holders of Series A Preferred Stock have preferential rights to liquidation payments over holders of common stock. Holders of Series A Preferred Stock shall be paid out of the assets of the Company at an amount equal to $100 per share plus all accumulated and unpaid dividends. |
| b. | | Dividends – Dividends on the Series A Preferred Stock are cumulative at the Dividend Rate. The “Dividend Rate” is the rate per annum of 7.625% per share of Series A Preferred Stock on the liquidation preference ($100 per share). Dividends are payable quarterly in arrears in cash or, at the Company’s election and subject to the receipt of the necessary shareholder approval (to the extent necessary), in shares of the Company’s common stock. TheOn February 27, 2019 the Company’s board of directors declared a quarterly dividendsdividend of $0.68 per share on April 24, 2017, and $1.91 per share, on July 18, 2017, which were both thenwas paid on July 28, 2017. AsMarch 15, 2019. On May 21, 2019, the Company’s board of directors declared a second quarterly dividend of $1.91 per share, which was paid on June 15, 2019. On August 20, 2019 the Company’s board of directors declared a third quarterly dividend of $1.91 per share, which was paid on September 30, 2017, accrued dividends15, 2019.On February 27, 2018 the Company’s board of $1.2 million were recorded in accrued expenses and other liabilities.directors declared a quarterly dividend of $1.91 per share, which was paid on March 15, 2018. On May 22, 2018, the Company’s board of directors declared a second quarterly dividend of $1.91 per share, which was paid on June 20, 2018. On August 21, 2018 the Company’s board of directors declared a third quarterly dividend of $1.91 per share, which was paid on September 14, 2018. |
| c. | | Voting rights– Except as required by Delaware law, holders of the Series A Preferred Stock will have no voting rights except with respect to the approval of any material and adverse amendment to the Company’s certificate of incorporation, and certain significant holders of Series A Preferred Stock may have approval rights with respect to certain key economic terms of the Series A Preferred Stock, as set forth in the Certificate of Designations. |
Table of Contents
DASEKE, INC. AND SUBSIDIARIES
NOTES TO CONSOLIDATED FINANCIAL STATEMENTS – (Continued)
(Unaudited)
NOTE 11 – STOCKHOLDERS’ EQUITY – (Continued)
As of December 31, 2016, 64,500 shares of Series B Preferred Stock were issued and outstanding. Private Daseke’s board of directors declared quarterly dividends on the Series B Preferred Stock of $18.75 per share on October 13, 2016 and $12.50 per share on February 21, 2017. Both the October 13, 2016 and February 21, 2017 dividends were paid on February 27, 2017. As of December 31, 2016, accrued dividends of $1.2 million were recorded in accrued expenses and other liabilities.
In February 2017, in connection with, and immediately prior to, the Closing, the Series B Preferred Stock were converted into 9,301,150 shares of Private Daseke’s common stock.
Warrants
At September 30, 2017,2019, there were a total of 35,040,66435,040,658 warrants outstanding to purchase 17,520,33217,520,329 shares of the Company’s common stock.
Hennessy hasThe Company issued warrants (the Public Warrants) to purchase its common stock which were originally issued as part of units in the IPOinitial public offering (the Public Warrants)IPO) of Hennessy (as defined below). There are 19,959,90819,959,902 Public Warrants outstanding. Hennessy hasThe Company also issued 15,080,756 warrants (the Private Placement Warrants) to Sponsorthe sponsor in a private placement that closed simultaneously with the consummation of the IPO.
Each warrant entitles the registered holder to purchase one-half of one share of the Company’s common stock at a price of $5.75 per one-half of one share ($11.50 per whole share), subject to adjustment. The warrants may be exercised only for a whole number of shares of the Company’s common stock. No fractional shares will be issued upon exercise of the warrants. The warrants will expire on February 27, 2022, five years after the completion of the Business Combination,merger with Hennessy, or earlier upon redemption or liquidation. The Warrantswarrants are listed on the NASDAQ market under the symbol DSKEW.
The Company may call the Public Warrants for redemption at a price of $0.01 per warrant if, and only if, the reported last sale price of the Company’s common stock equals or exceeds $24.00 per share for any 20 trading20-trading days within a 30-trading day period ending on the third trading day prior to the date the Company sends the notice of redemption to the Public Warrant holders.
NOTE 12 – STOCK-BASED COMPENSATION
On February 27, 2017, the Company and Hennessy’s common stockholders approvedUnder the 2017 Omnibus Incentive Plan (the Plan), whereby the Company may grant awards of stock options, stock appreciation rights, restricted stock, restricted stock units, other stock-based awards and performance awards. Under the Plan, the Company is authorized to issue up to 4.5 million shares of common stock. All awards granted were authorized under the Plan.These awards generally vest annually on a pro-rata basis over a five-year period on the anniversary of each grant date. We also grant awards to our directors under the Plan. The awards granted to directors vest ratably over periods of one, two or five years annually on the anniversary of each grant date.
All stock-based compensation cost is measured at the grant date, based on the estimated fair value of the award, and is recognized on a straight-line basis as expense over the employees’ requisite service period. Forfeitures are recorded as a cumulative adjustment to stock-based compensation expense in the period forfeitures occur. Aggregate stock-based compensation charges, net of forfeitures, were $1.0 million and $0.9 million during the three months ended September 30, 2019 and 2018, respectively, and $2.9 million and $2.7 million during the nine months ended September 30, 2019 and 2018, respectively. These expenses are included as a component of salaries, wages and
employee benefits on the accompanying consolidated statements of operations and comprehensive income (loss). As of September 30, 2019, there was $4.9 million and $6.2 million of unrecognized stock-based compensation expense related to stock options and restricted stock units, respectively. This expense will be recognized over the weighted average periods of 3.1 years for stock options and 2.7 years for restricted stock units.
Stock Options
The following table summarizes stock option grants under the Plan during the nine months ended September 30, 2017:Plan:
| | | | | | | | | | | | | | | | | | | | | | | | |
Grantee Type | | # of
Options
Granted | | Issued and
Outstanding | | Vesting
Period | | Weighted
Average
Exercise
Price | | Weighted Average
Grant Date
Fair Value | | # of
Options
Granted | | Issued and
Outstanding | | Vesting
Period | | Weighted
Average
Exercise
Price | | Weighted Average
Grant Date
Fair Value
(Per Option) |
| | | | | | | | | | | | | | | | | | | | | | | | |
Director Group | | 150,000 | | 150,000 | | 5 years | | $ | 9.98 | | $ | 654,000 | | 150,000 | | 115,000 | | 5 years | | $ | 9.98 | | $ | 4.36 |
Employee Group | | 1,305,500 | | 1,296,500 | | 5 years | | $ | 9.99 | | $ | 5,652,740 | | 2,632,730 | | 2,363,874 | | 3-5 years | | $ | 8.56 | | $ | 3.70 |
Total | | | | 1,446,500 | | | | | | | | | | | | 2,478,874 | | | | | | | | |
Table of Contents
DASEKE, INC. AND SUBSIDIARIES
NOTES TO CONSOLIDATED FINANCIAL STATEMENTS – (Continued)
(Unaudited)
NOTE 12 – STOCK-BASED COMPENSATION – (Continued)
The Company’s calculations of the fair value of stock options granted during the nine months ended September 30, 20172019 were made using the Black-Scholes option-pricing model. The fair value of the Company’s stock option grants was estimated utilizing the following assumptions for the nine months ended September 30, 2017:2019:
| | |
Weighted average expected life | | 6.56.3 years
|
Risk-free interest rate | | 1.95%1.45% to 2.09%2.58%
|
Expected volatility | | 40.4%32.52% to 40.6%37.91%
|
Expected dividend yield | | 0.00% |
Since the Company does not have a sufficient history of exercise behavior, expected term is calculated using the assumption that the options will be exercised ratably from the date of vesting to the end of the contractual term for each vesting tranche of awards. Risk-freeThe risk-free interest rate is based on the U.S. Treasury yield curve for the period of the expected term of the stock option. Expected volatility is calculated using an index of publicly traded peer companies.
A summary of option activity under the Plan as of September 30, 2019 and changes during the nine months then ended are as follows:
| | | | | | | | | | |
| | Shares | | Weighted
Average
Exercise
Price | | Weighted
Average
Remaining
Contractual
Terms
(Years) | | Aggregate
Intrinsic
Value (in
millions) |
Outstanding as of January 1, 2019 | | 2,066,529 | | $ | 10.23 | | 8.5 | | $ | — |
Granted | | 631,136 | | | 3.20 | | | | | |
Forfeited or expired | | (218,791) | | | 9.42 | | | | | |
Outstanding as of September 30, 2019 | | 2,478,874 | | $ | 8.51 | | 8.2 | | $ | 0.1 |
| | | | | | | | | | |
Exercisable as of September 30, 2019 | | 631,939 | | $ | 10.27 | | 7.5 | | $ | — |
Vested and expected to vest as of September 30, 2019 | | 2,478,874 | | $ | 8.51 | | 8.2 | | $ | 0.1 |
The stock options’ maximum contract term is ten years. The total weighted average fair value of options granted during the nine months ended September 30, 2019 and 2018 was $0.8 million and $1.4 million, respectively.
Restricted Stock Units
Restricted stock units are nontransferable until vested and the holders are entitled to receive dividends with respect to the non-vested units. Prior to vesting, the grantees of restricted stock units are not entitled to vote the shares. Restricted stock unit awards vest in equal annual increments over the vesting period.
The following table summarizes restricted stock unit grants under the Plan during the nine months ended September 30, 2017:Plan:
| | | | | | | | | | | | | | | | |
Grantee Type | | # of
Restricted Stock
Units Granted | | Vesting
Period | | Grant Date
Fair Value | | # of
Restricted Stock
Units Granted | | Issued and Outstanding | | Vesting
Period | | Weighted
Average
Grant Date
Fair Value
(Per Unit) |
| | | | | | | | | | | | | | | | |
Director Group | | | 785,498 | | 730,838 | | 1-2 years | | $ | 2.75 |
Employee Group | | 876,123 | | 5 years | | $ | 8,340,691 | | 1,568,655 | | 512,973 | | 5 years | | $ | 10.59 |
Total | | | | | 1,243,811 | | | | | |
All stock-based compensation cost is measured at the grant date, based on the estimated fair value of the award, and is recognized on a straight-line basis as expense over the employees’ requisite service period. Forfeitures will be recorded as a cumulative adjustment to stock-based compensation expense in the period forfeitures are incurred.
Stock Options
A summary of option activity under the Plan as of September 30, 2017 and changes during the nine months then ended are as follows:
| | | | | | | | | | |
| | Shares | | Weighted
Average
Exercise
Price | | Weighted
Average
Remaining
Contractual
Terms
(Years) | | Aggregate
Intrinsic
Value (in
thousands) |
| | | | | | | | | | |
Outstanding as of January 1, 2017 | | — | | $ | — | | — | | $ | — |
Granted | | 1,455,500 | | | 9.99 | | 10.0 | | | — |
Exercised | | — | | | — | | — | | | — |
Forfeited or expired | | (9,000) | | | 9.98 | | — | | | 20 |
Outstanding as of September 30, 2017 | | 1,446,500 | | | 9.99 | | 9.4 | | | 4,425 |
| | | | | | | | | | |
Exercisable as of September 30, 2017 | | — | | $ | — | | — | | $ | — |
Table of Contents
DASEKE, INC. AND SUBSIDIARIES
NOTES TO CONSOLIDATED FINANCIAL STATEMENTS – (Continued)
(Unaudited)
NOTE 12 – STOCK-BASED COMPENSATION – (Continued)
Restricted Stock Units
A summary of restricted stock unit awards activity under the Plan as of September 30, 20172019 and changes during the nine months then ended are as follows:
| | | | | | | | | | |
| | Units | | Weighted
Average Grant
Date Fair
Value
(Per Unit) | | Units | | Weighted
Average Grant
Date Fair
Value
(Per Unit) |
| | | | | | | | | | |
Outstanding as of January 1, 2017 | | — | | $ | — | |
Non-vested as of January 1, 2019 | | | 841,361 | | $ | 10.44 |
Granted | | 876,123 | | | 9.52 | | 753,986 | | | 2.45 |
Vested | | — | | | — | | (179,314) | | | 10.22 |
Forfeited | | (155,334) | | | 9.66 | | (172,222) | | | 9.77 |
Outstanding as of September 30, 2017 | | 720,789 | | $ | 9.49 | |
Non-vested as of September 30, 2019 | | | 1,243,811 | | $ | 5.75 |
Aggregate stock-based compensation charges were $0.7 million and $1.2 million during the three and nine months ended September 30, 2017 and included as a component of salaries, wages and employee benefits on the accompanying consolidated statements of operations. As of September 30, 2017, there was $5.6 million of unrecognized stock-based compensation expense related to stock options which will be recognized over a weighted average period of 4.4 years.
NOTE 13 – DEFINED CONTRIBUTION PLAN
On January 1, 2015, the Company established the Daseke, Inc. 401(k) Retirement Plan (the Retirement Plan) and merged six separate plans into the Retirement Plan.. The Retirement Plan is a defined contribution plan and intended to qualify under ERISAthe Internal Revenue Code provisions of Section 401(k). Under the safe harbor matching requirements, the Company had expenses of $0.6$1.4 million and $0.5$0.9 million for the three months ended September 30, 20172019 and 20162018, respectively, and $1.8$4.2 million and $1.7$2.8 million for the nine months ended September 30, 20172019 and 2016,2018, respectively. The Company sponsored defined contribution profit-sharing plans, including 401(k) provisions, for substantially all employees of acquired companies whose plans were merged into the Retirement Plan effective January 1, 2019. Matching contributions for 401(k) defined contribution plans not yet merged into the Retirement Plan totaled approximately $47,000$0.1 million and $0.3 million for both the three and nine months ended September 30, 2017.2018, respectively.
NOTE 14 – INTEREST RATE SWAP
The Company, from time to time, uses interest rate swaps to manage risks related to interest rate movements. These interest rate swaps are reported at fair value on the consolidated balance sheets in accrued expenses and other liabilities.
The Company had an interest rate swap agreement which qualified for hedge accounting and accordingly was designated as a cash flow hedge. For this interest rate swap, the change in fair value on the effective portion of the hedge was recognized as a component of other comprehensive income. In conjunction with the Business Combination discussed in Note 2, this interest rate swap was terminated. At December 31, 2016, the fair value of this interest rate swap was a liability of $51,871.
The terms of the interest rate swap designated as a cash flow hedge at December 31, 2016 were as follows:
| | | | | | | | | | |
| | Notional | | Termination | | Interest Rate | | Interest Rate | |
Effective Date | | Amount | | Date | | Received | | Paid | |
11/12/2013 | | $ | 12,000,000 | | 4/30/2018 | | 0.6 | % | 3.63 | % |
Table of Contents
DASEKE, INC. AND SUBSIDIARIES
NOTES TO CONSOLIDATED FINANCIAL STATEMENTS – (Continued)
(Unaudited)
NOTE 1514 – COMMITMENTS AND CONTINGENCIES
Operating Leases
The Company leases certain office building facilities, terminal locations and revenue equipment under non-cancelable operating leases. Building and terminal rent expense under operating leases was $2.1 million and $0.7 million for the three months ended September 30, 2017 and 2016, respectively, and $4.5 million and $2.0 million for the nine months ended September 30, 2017 and 2016, respectively. Tractor, trailer and other revenue equipment rent expense under operating leases was $4.7 million and $3.5 million for the three months ended September 30, 2017 and 2016, respectively, and $12.7 million and $9.2 million for the nine months ended September 30, 2017 and 2016, respectively.
Letters of Credit
The Company had outstanding letters of credit atas of September 30, 20172019 totaling approximately $11.1$16.4 million, including those disclosed in Note 9. These letters of credit coverare related to liability and workers compensation insurance claims.
Contingencies
The Company is involved in certain claims and pending litigation arising in the normal course of business. These proceedings primarily involve claims for personal injury or property damage incurred in the transportation of freight or for personnel matters. The Company maintains liability insurance to cover liabilities arising from these matters but is responsible forto pay self-insurance and deductibles on such matters up to a certain threshold before the insurance is applied.
NOTE 1615 – REPORTABLE SEGMENTS
The Company evaluates the performance of the segments primarily based on their respective revenues and operating income. Accordingly, interest expense and other non-operating items are not reported in segment results. In addition, the Company has disclosed a corporate segment, which is not an operating segment and includes acquisition transaction expenses, corporate salaries, interest expense and other corporate administrative expenses and intersegment eliminations.
The Company’s operating segments also provide transportation and related services for one another. Such services are generally billed at cost, and no profit is earned. Such intersegment revenues and expenses are eliminated in the Company’s consolidated results. Intersegment revenues and expenses for the Flatbed Solutions segment totaled $0.7$2.9 million and $0.8$1.1 million for the three months ended September
30, 20172019 and 2016,2018, respectively, and $2.4$7.5 million and $1.5$3.2 million for the nine months ended September 30, 20172019 and 2016,2018, respectively.
Intersegment revenues and expenses for the Specialized Solutions segment totaled $1.2$4.7 million and $0.5$2.6 million for the three months ended September 30, 20172019 and 2016,2018, respectively, and $2.6$8.8 million and $2.0$6.5 million for the nine months ended September 30, 20172019 and 2016.
Table of Contents
DASEKE, INC. AND SUBSIDIARIES
NOTES TO CONSOLIDATED FINANCIAL STATEMENTS – (Continued)
(Unaudited)
NOTE 16 – REPORTABLE SEGMENTS– (Continued)2018, respectively.
The following tables reflect certain financial data of the Company’s reportable segments for the three and nine months ended September 30, 20172019 and 20162018 (in thousands)millions):
| | | | | | | | | | | | | | | | | | | | | | | | |
| | Flatbed | | Specialized | | | | | | | | Flatbed | | Specialized | | | | | | |
| | Solutions | | Solutions | | Corporate/ | | Consolidated | | Solutions | | Solutions | | Corporate/ | | Consolidated |
| | Segment | | Segment | | Eliminations | | Total | | Segment | | Segment | | Eliminations | | Total |
Three Months Ended September 30, 2017 | | | | | | | | | | | | | |
Three Months Ended September 30, 2019 | | | | | | | | | | | | | |
Total revenue | | $ | 85,592 | | $ | 147,631 | | $ | (1,901) | | $ | 231,322 | | $ | 169.8 | | $ | 288.0 | | $ | (7.4) | | $ | 450.4 |
Operating income | | | 4,755 | | | 7,159 | | | (6,210) | | | 5,704 | |
Company freight | | | | 55.2 | | | 155.4 | | | (5.4) | | | 205.2 |
Owner operator freight | | | | 71.1 | | | 49.1 | | | (1.9) | | | 118.3 |
Brokerage | | | | 23.6 | | | 54.5 | | | 0.5 | | | 78.6 |
Logistics | | | | 0.7 | | | 12.9 | | | (0.1) | | | 13.5 |
Fuel surcharge | | | | 19.2 | | | 16.1 | | | (0.5) | | | 34.8 |
Operating loss | | | | (107.9) | | | (187.6) | | | (21.1) | | | (316.6) |
Depreciation | | | 6,713 | | | 11,290 | | | 37 | | | 18,040 | | | 12.7 | | | 21.1 | | | 0.3 | | | 34.1 |
Amortization of intangible assets | | | 437 | | | 1,328 | | | — | | | 1,765 | | | 1.5 | | | 2.7 | | | — | | | 4.2 |
Impairment | | | | 113.2 | | | 193.6 | | | — | | | 306.8 |
Restructuring | | | | 0.9 | | | 3.5 | | | 2.5 | | | 6.9 |
Non-cash operating lease expense | | | | 1.7 | | | 4.6 | | | 0.1 | | | 6.4 |
Interest expense | | | | 2.8 | | | 3.2 | | | 6.8 | | | 12.8 |
Loss before income tax | | | | (110.6) | | | (191.0) | | | (29.5) | | | (331.1) |
Total assets | | | | 376.1 | | | 730.9 | | | 83.1 | | | 1,190.1 |
Cash capital expenditures | | | | (0.6) | | | 5.4 | | | 0.5 | | | 5.3 |
| | | | | | | | | | | | | |
Three Months Ended September 30, 2018 | | | | | | | | | | | | | |
Total revenue | | | $ | 181.5 | | $ | 283.9 | | $ | (3.8) | | $ | 461.6 |
Company freight | | | | 56.3 | | | 153.1 | | | (2.5) | | | 206.9 |
Owner operator freight | | | | 74.3 | | | 49.1 | | | (0.8) | | | 122.6 |
Brokerage | | | | 29.2 | | | 53.2 | | | (0.2) | | | 82.2 |
Logistics | | | | 0.8 | | | 10.8 | | | — | | | 11.6 |
Fuel surcharge | | | | 20.9 | | | 17.7 | | | (0.3) | | | 38.3 |
Operating income (loss) | | | | 12.2 | | | 11.8 | | | (10.1) | | | 13.9 |
Depreciation | | | | 7.7 | | | 25.0 | | | — | | | 32.7 |
Amortization of intangible assets | | | | 1.5 | | | 2.6 | | | — | | | 4.1 |
Interest expense | | | | 2.2 | | | 2.9 | | | 6.8 | | | 11.9 |
Income (loss) before income tax | | | 2,997 | | | 5,060 | | | (10,869) | | | (2,812) | | | 10.1 | | | 9.5 | | | (16.7) | | | 2.9 |
Total assets | | | 272,686 | | | 472,761 | | | 111,974 | | | 857,421 | | | 474.2 | | | 906.6 | | | 25.7 | | | 1,406.5 |
| | | | | | | | | | | | | |
Three Months Ended September 30, 2016 | | | | | | | | | | | | | |
Total revenue | | $ | 78,975 | | $ | 96,534 | | $ | (1,361) | | $ | 174,148 | |
Operating income | | | 3,794 | | | 5,739 | | | (3,451) | | | 6,082 | |
Depreciation | | | 7,161 | | | 8,303 | | | 40 | | | 15,504 | |
Amortization of intangible assets | | | 489 | | | 1,005 | | | — | | | 1,494 | |
Income (loss) before income tax | | | 1,708 | | | 3,917 | | | (6,199) | | | (574) | |
Total assets | | | 295,286 | | | 304,623 | | | 8,946 | | | 608,855 | |
| | | | | | | | | | | | | |
| | | | | | | | | | | | | |
| | Flatbed | | Specialized | | | | | | | |
| | Solutions | | Solutions | | Corporate/ | | Consolidated | |
| | Segment | | Segment | | Eliminations | | Total | |
Nine Months Ended September 30, 2017 | | | | | | | | | | | | | |
Total revenue | | $ | 253,794 | | $ | 340,289 | | $ | (5,004) | | $ | 589,079 | |
Operating income | | | 14,955 | | | 12,756 | | | (18,391) | | | 9,320 | |
Depreciation | | | 20,619 | | | 28,375 | | | 115 | | | 49,109 | |
Amortization of intangible assets | | | 1,310 | | | 3,339 | | | — | | | 4,649 | |
Income (loss) before income tax | | | 9,725 | | | 7,004 | | | (31,979) | | | (15,250) | |
| | | | | | | | | | | | | |
Nine Months Ended September 30, 2016 | | | | | | | | | | | | | |
Total revenue | | $ | 237,169 | | $ | 267,651 | | $ | (3,434) | | $ | 501,386 | |
Operating income | | | 14,041 | | | 14,689 | | | (12,394) | | | 16,336 | |
Depreciation | | | 21,219 | | | 24,637 | | | 117 | | | 45,973 | |
Amortization of intangible assets | | | 1,468 | | | 3,074 | | | — | | | 4,542 | |
Income (loss) before income tax | | | 9,517 | | | 9,907 | | | (20,303) | | | (879) | |
Cash capital expenditures | | | | 1.4 | | | 25.6 | | | 0.7 | | | 27.7 |
| | | | | | | | | | | | |
| | Flatbed | | Specialized | | | | | | |
| | Solutions | | Solutions | | Corporate/ | | Consolidated |
| | Segment | | Segment | | Eliminations | | Total |
Nine Months Ended September 30, 2019 | | | | | | | | | | | | |
Total revenue | | $ | 512.7 | | $ | 838.3 | | $ | (17.0) | | $ | 1,334.0 |
Company freight | | | 165.3 | | | 463.8 | | | (10.9) | | | 618.2 |
Owner operator freight | | | 213.1 | | | 142.4 | | | (4.4) | | | 351.1 |
Brokerage | | | 74.7 | | | 148.3 | | | (0.2) | | | 222.8 |
Logistics | | | 2.0 | | | 37.1 | | | (0.1) | | | 39.0 |
Fuel surcharge | | | 57.6 | | | 46.7 | | | (1.4) | | | 102.9 |
Operating loss | | | (98.5) | | | (168.8) | | | (43.9) | | | (311.2) |
Depreciation | | | 38.1 | | | 68.5 | | | 0.5 | | | 107.1 |
Amortization of intangible assets | | | 4.5 | | | 7.9 | | | — | | | 12.4 |
Impairment | | | 113.2 | | | 193.6 | | | — | | | 306.8 |
Restructuring | | | 0.9 | | | 3.5 | | | 2.5 | | | 6.9 |
Non-cash operating lease expense | | | 7.2 | | | 12.2 | | | 0.3 | | | 19.7 |
Interest expense | | | 8.1 | | | 9.8 | | | 20.3 | | | 38.2 |
Loss before income tax | | | (106.3) | | | (177.8) | | | (65.3) | | | (349.4) |
Cash capital expenditures | | | 2.3 | | | 13.6 | | | 1.5 | | | 17.4 |
| | | | | | | | | | | | |
Nine Months Ended September 30, 2018 | | | | | | | | | | | | |
Total revenue | | $ | 488.7 | | $ | 687.1 | | $ | (9.7) | | $ | 1,166.1 |
Company freight | | | 147.8 | | | 370.0 | | | (6.4) | | | 511.4 |
Owner operator freight | | | 205.9 | | | 126.7 | | | (1.9) | | | 330.7 |
Brokerage | | | 76.0 | | | 112.8 | | | (0.4) | | | 188.4 |
Logistics | | | 2.2 | | | 29.1 | | | — | | | 31.3 |
Fuel surcharge | | | 56.8 | | | 48.5 | | | (1.0) | | | 104.3 |
Operating income (loss) | | | 28.5 | | | 24.1 | | | (22.4) | | | 30.2 |
Depreciation | | | 21.4 | | | 60.1 | | | 0.1 | | | 81.6 |
Amortization of intangible assets | | | 4.4 | | | 7.8 | | | — | | | 12.2 |
Impairment | | | — | | | 2.8 | | | — | | | 2.8 |
Interest expense | | | 6.0 | | | 8.1 | | | 19.1 | | | 33.2 |
Income (loss) before income tax | | | 22.8 | | | 17.7 | | | (39.8) | | | 0.7 |
Cash capital expenditures | | | 3.8 | | | 54.0 | | | 1.0 | | | 58.8 |
NOTE 1716 – SUBSEQUENT EVENTSEARNINGS (LOSS) PER SHARE
| | | | | | | | | | | | |
| | Three Months Ended | | Nine Months Ended |
| | September 30, | | September 30, |
(in millions, except per share data) | | 2019 | | 2018 | | 2019 | | 2018 |
| | | | | | | | | | | | |
Numerator: | | | | | | | | | | | | |
Net income (loss) | | $ | (273.3) | | $ | 2.2 | | $ | (289.0) | | $ | 14.9 |
Less Series A preferred dividends | | | (1.2) | | | (1.2) | | | (3.7) | | | (3.7) |
Allocation of earnings to non-vested participating restricted stock units | | | — | | | — | | | — | | | (0.2) |
Net income (loss) attributable to common stockholders | | $ | (274.5) | | $ | 1.0 | | $ | (292.7) | | $ | 11.0 |
| | | | | | | | | | | | |
Denominator: | | | | | | | | | | | | |
Weighted-average shares outstanding | | | 64.6 | | | 64.3 | | | 64.5 | | | 59.4 |
Weighted average non-vested participating restricted stock units | | | — | | | 1.0 | | | — | | | 1.0 |
Denominator for basic and diluted EPS – weighted-average shares | | | 64.6 | | | 65.3 | | | 64.5 | | | 60.4 |
| | | | | | | | | | | | |
Basic and diluted earnings (loss) per share | | $ | (4.25) | | $ | 0.01 | | $ | (4.54) | | $ | 0.18 |
On October 17, 2017 the Company’s board of directors declared a quarterly dividend of $1.91 per share on 650,000 shares of Series A Preferred Stock outstanding as of August 15, 2017, or $1.2 million, which was paid on October 20, 2017.��
Item 2. Management’s Discussion and Analysis of Financial Condition and Results of Operations
Overview
Introductory Note
On February 27, 2017, Hennessy Capital Acquisition Corp. II (Hennessy), a special purpose acquisition corporation, consummated the merger of Hennessy’s wholly-owned subsidiary with and into Daseke, Inc. (Daseke or the Company), with Daseke, Inc. surviving as a direct wholly-owned subsidiary of Hennessy (the Business Combination). Upon consummation of the Business Combination, Daseke, Inc. changed its name to Daseke Companies, Inc. and Hennessy changed its name to Daseke, Inc.
Daseke is a leading provider and consolidator of transportation and logistics solutions focused exclusively on open deckflatbed and specialized (open-deck) freight in North America. The transportation and logistics market is one of the largest industries in the United States. The open deckflatbed and specialized freight market represented ancurrently represents approximately $133 billion subset10% of the more than 1.5 million trucks used in the broader transportation and logistics market in 2016. The U.S. open deck freight market is expected to grow to approximately $150 billion in 2017-2018 and to approximately $174 billion in 2019.market.
The Company believes it isprovides one of the largest owner of open deck equipment and the second largest provider of flatbed, open deckmost comprehensive transportation and logistics solutions by revenuesolution offerings in North America.the open-deck industry. The Company delivers a comprehensive and diverse offering of flatbed and specialized transportation and logistics solutions to approximately 4,8005,900 customers across the continental United States, Canada and Mexico through two reportable segments: Flatbed Solutions and Specialized Solutions. The Flatbed Solutions segment focuses on delivering transportation and logistics solutions that principally require the use of flatbed and retractable-sided transportation equipment, and the Specialized Solutions segment focuses on delivering transportation and logistics solutions that principally include super heavy haul, high-value customized, over-dimensional, step deck and removable gooseneck trailer solutions.require the use of specialized trailering transportation equipment.
Both of the Company’s reportable segments operate highly flexible business models comprised of company-owned tractors and trailers and asset-light operations (which consist of owner-operator transportation, freight brokerage and freight brokerage)logistics). The Company’s asset-based operations have the benefit of providing shippers with certainty of delivery and continuity of operations. Alternatively, the Company’s asset-light operations offer flexibility and scalability to meet customers’ dynamic needs and have lower capital expenditure requirements and fixed costs. Approximately 62.0% of freight, logistics and brokerage revenue for the nine months ended September 30, 2017 was derived from company-owned equipment and approximately 38.0% was derived from asset-light services.
Business Combination and Other Third Quarter Operational Overview
| · | | Total revenue of $450.4 million, a decrease of 2.4%, company freight of $205.2 million, a decrease of 0.8%, owner operator freight of $118.3 million, a decrease of 3.5% and brokerage freight of $78.6 million, a decrease of 4.4% compared to third quarter of 2018; |
| · | | Rate per mile for the three months ended September 30, 2019 was $1.90 for Flatbed Solutions segment and $3.54 for Specialized Solutions segment; |
| · | | Asset impairment charges totaled $306.8 million for the three months ended September 30, 2019 |
| · | | Operating loss of $316.6 million, compared with operating income of $13.9 million in third quarter of 2018; |
| · | | Net loss of $273.3 million, or $4.25 per basic and diluted share, compared with net income of $2.2 million, or $0.01 per basic and diluted share, in the third quarter of 2018; |
| · | | Total liquidity available at September 30, 2019 decreased by $23.5 million to $242.0 million from $265.5 million at December 31, 2018; and |
| · | | Material debt at September 30, 2019 increased by $12.7 million to $651.6 million from $638.9 at December 31, 2018. |
Recent Developments
On February 27, 2017, Hennessy consummatedJune 6, 2018, the mergerCompany acquired all of Hennessy’s wholly-owned subsidiary with and into Private Daseke, with Private Daseke surviving as a direct wholly-owned subsidiarythe outstanding common shares of Hennessy. The aggregateAveda, for total consideration received by Private Daseke stockholders upon closing was $266.7of $118.7 million, consisting of newly issued$27.3 million in cash, 1,612,979 shares of Daseke common stock valued at a value$15.4 million, the payoff of $10.00 per share. The Merger Agreement contains an earn-out provision through which Private Daseke stockholders could receive up to 15$54.8 million additionalof outstanding debt and contingent consideration of $21.2 million. Aveda transports equipment required for the exploration, development and production of petroleum resources in the United States and Canada, expanding the Specialized Segment.
On August 1, 2018, the Company acquired all of the outstanding shares of Builders based in Memphis, Tennessee for total consideration of $36.3 million, consisting of $30.0 million in cash, 399,530 shares of Daseke common stock (with up to 5valued at $3.4 million shares payable annually with respect to 2017, 2018 and 2019 performance). See Note 2the payoff of Notes to Consolidated Financial Statements for more information regarding$2.9 million of outstanding debt. Builders transports metals and building materials, expanding the Business Combination.Flatbed Segment.
On MayJuly 1 2017,and August 1, 2018, the Company completed mergersclosed two acquisitions to acquire 100% of the outstanding shares of the entities for aggregate consideration of $21.1 million, consisting of $20.1 million in cash and 95,859 shares of Daseke common stock valued at $0.9 million. Additionally, the Company assumed approximately $10.6 million of debt and capital lease obligations. These two acquisitions expand operations in the northwest United States and Canada, in the Flatbed and Specialized Segments.
On July 30, 2019, the Company internally announced a plan to integrate three operating segments with two leading open-deck specialized transportation companies:three other operating segments, Project Synchronize (the Plan), which will reduce the number of operating segments from 16 to 13. As a result of the Plan, Builders Transportation will merge into Hornady Transportation, Moore Freight Service into E.W. Wylie, and the Schilli Companies (Schilli), headquartered in Remington, Indiana,into Lone Star Transportation. The Plan is being implemented to streamline and Big Freight Systems Inc. (Big Freight), headquartered in Steinbach, Manitoba. On July 1, 2017,reduce the Company’s cost structure, improve asset utilization and capitalize on operational synergies.. Additionally, the Company completed a merger with The Steelman Companies (Steelman), headquarteredannounced the planned implementation of Business Improvement Plans, which are expected to increase profitability by yield management capacity allocation, right-sizing trailer-to-tractor ratios, and improving maintenance execution. These Plans are expected to improve annual operating income by $30.0 million in Springfield, Missouri. 2020.
On September 1, 2017,4, 2019, the Company completedannounced a merger with R&R Trucking Holdings, LLC (R&R)comprehensive restructuring plan (Project Pivot) intended to reduce its cost base, right size its organization and management team and increase and accelerate its previously announced operational improvement goals. As part of Project Pivot, basedthe Company has also executed a new management restructuring and substantial corporate cost reduction plan, which is expected to yield an additional $4 million in Duenweg, Missouri.run-rate benefits by the end of the first quarter of fiscal 2020.
How The Company Evaluates Its Operations
The Company uses a number of primary indicators to monitor its revenue and expense performance and efficiency, including Adjusted EBITDA, Free Cash Flow, Adjusted EBITDAR, free cash flowOperating Ratio and adjusted operating ratio,Adjusted Net Income (Loss), and its key drivers of revenue quality, growth, expense control and operating efficiency. Adjusted EBITDA, Free Cash Flow, Adjusted EBITDAR, free cash flowOperating Ratio and adjusted operating ratioAdjusted Net Income (Loss) are not recognized measures under GAAP and should not be considered alternatives to, or more meaningful than, net income (loss), cash flows from operating activities, operating income, operating ratio, operating margin or any other measure derived in accordance with GAAP. See “Non-GAAP Financial Measures” for more information on the Company’s use of these non-GAAP measures, as well as a description of the computation and reconciliation of the Company’s Adjusted EBITDA, Free Cash Flow, and Adjusted EBITDAR and free cash flowNet Income (Loss) to net income (loss) and adjusted operating ratioAdjusted Operating Ratio to operating ratio.
Revenue
The Company records four types of revenue: freight(company and owner operator), brokerage, logistics and fuel surcharge. Freight revenue is generated by hauling freight for the Company’s customers using its trucks or its owner-operators’ equipment. Generally, the Company’s customers pay for its services based on the number of miles in the most direct route between pick-up and delivery locations and other ancillary services the Company provides. Freight revenue is the product of the number of revenue-generating miles driven and the rate per mile the Company receives from customers plus accessorial charges, such as loading and unloading freight for its customers, cargo protection, fees for detaining its equipment or fees for route planning and supervision. Freight revenue is affected by fluctuations in North American economic activity as well as changes in specific customer demand, the level of capacity in the industry and driver availability.
The Company’s brokerage revenue is generated primarily by its use of third-party carriers when it needs capacity to move its customers’ loads. The main factor that affects brokerage revenue is the availability of the Company’s drivers and owner-operators (and hence the need for third-party carriers) and the rate for the load. Brokerage revenue is also affected by fluctuations in North American economic activity as well as changes in the level of capacity in the industry and driver availability.
Logistics revenue is generated from a range of services, including value-added warehousing, loading and unloading, vehicle maintenance and repair, preparation and packaging, fuel management, services, value-added warehousing and packaging, and other fleet management solutions. Logistics revenue is primarily driven by specific customer requirements for additional services and may fluctuate depending on customers’ utilization of these services due to changes in cargo specifications, delivery staging and fluctuations in the North American economic activity. The Company began recording logistics revenue as a result of the Recent Acquisitions.
Fuel surcharges are designed to compensate the Company for fuel costs above a certain cost per gallon base. Generally, the Company receives fuel surcharges on the miles for which it is compensated by customers. However, the Company continues to have exposure to increasing fuel costs related to empty miles, fuel efficiency due to engine idle time and other factors and to the extent the surcharge paid by the customer is insufficient. The main factors that affect fuel surcharge revenue are the price of diesel fuel and the number of loaded miles. In general, a declining energy and fuel price environment, such as in 2015 and mostthe first half of 2016,2019, negatively affects the Company’s fuel surcharge revenues, and conversely, an environment with rising fuel and energy prices benefits its fuel surcharge revenues. Although the Company’s surcharge programs vary by customer, they typically involve a computation based on the change in national or regional fuel prices. The Company’s fuel surcharges are billed on a laggingdelayed basis, meaning it typically bills customers in the current week based on a previous week’s applicable index. Therefore, in times of increasing fuel prices, the Company does not recover as much as it is currently paying for fuel. In periods of declining prices, the opposite is true. Also, its fuel surcharge programs typically require a specified minimum change in fuel cost to prompt a change in fuel surcharge revenue. Therefore, many of these programs have a time lag between when fuel costs change and when the change is reflected in fuel surcharge revenue.
Expenses
The Company’s most significant expenses vary with miles traveled and include driver wages, services purchased from owner-operators and other transportation providers (which are recorded on the “Purchased freight” line of the Company’s consolidated statements of operations)operations and comprehensive income (loss)) and fuel. Although driver-relatedDriver-related expenses vary with miles traveled, however the Company currently expects that its expenses relating to driver wages as a percentage of operating revenues, will increaseto remain stable in the near-term with or without changesas a result of driver wage increases implemented in total miles, duethe second half of 2018 to expected increases in average driver wages paid per mileaddress the shortage of qualified drivers in the general trucking industry.industry, compared to demand at that time. The expected increases inexpectation of stable driver wages paid per mile are due to current market conditions caused by a lackshippers’ downward pressure on rates resulting in some easing of qualified driverscapacity in the industry.
Maintenance and tire expenses and cost of insurance and claims generally vary with the miles the Company travels but also have a controllable component based on safety improvements, fleet age, efficiency and other factors. The Company’s primary fixed costs are depreciation of long-term assets (such as tractors, trailers and terminals), interest expense, rent and non-driver compensation.
The Company’s fuel surcharge programs help to offset increases in fuel prices but typically do not offset empty miles, idle time and out of route miles driven. As discussed above under “Revenue,” its fuel surcharge programs have a time lag between when fuel costs change and when the change is reflected in fuel surcharge revenue. Due to this time lag, the Company’s fuel expense, net of fuel surcharge, negatively impacts its operating income during periods of sharply rising fuel costs and positively impacts its operating income during periods of falling fuel costs. In general, due to the fuel surcharge programs, its operating income is less negatively affected by an environment with higher, stable fuel prices than an environment with lower fuel prices. In addition to its fuel surcharge programs, the Company believes the most effective protection against fuel cost increases is to maintain a fuel-efficient fleet by incorporating fuel efficiency measures. Also, the Company has arrangements with some of its significant fuel suppliers to buy the majority of its fuel at contracted pricing schedules that fluctuate with the market price of diesel fuel. The Company has not used derivatives as a hedge against higher fuel costs in the past but continues to evaluate this possibility.
Factors Affecting the Comparability of the Company’s Financial Results
Acquisitions
The Company has a long history of and intends to continue to acquire appropriate flatbed and specialized trucking companies. Negotiations and discussions with potential target companies are an integral part of the Company’s operations. These negotiations and discussions can be
in varying stages from infancy to very mature. Therefore, investors in Daseke’s stock should assume the Company is always evaluating, negotiating and performing diligence on potential acquisitions.
The comparability of the Company’s results of operations among the periods presented is impacted by the acquisitions listed below, which were completed in the second and third quarters of 2017.below. Also, as a result of the below acquisitions, the Company’s historical results of operations may not be comparable or indicative of future results.
Specialized Solutions Acquisitions
| · | | SchilliKelsey Trail Acquisition – Effective as of MayJuly 1, 2017, the2018, a Company subsidiary acquired all100% of the outstanding stockequity interests of SchilliKelsey Trail, to expandstrengthen and grow its presenceoperations in the Midwestern U.S. Schilli is part of the Company’s Specialized Solutions segment.Canada.
|
| · | | Big FreightAveda Acquisition – Effective as of May 1, 2017,June 6, 2018, the Company acquired all100% of the outstanding stockequity interests of Big FreightAveda, to expand its capabilities to include the specialized transportation of equipment required for the exploration, development and production of petroleum resources in the United States and Canada.
|
The Company refers to the acquisitions described above collectively as the “Specialized Solutions Acquisitions.”
Flatbed Solutions Acquisitions
| · | | Builders Acquisition – Effective August 1, 2018, the Company acquired 100% of the outstanding equity interests of Builders, to expand its presence into Canadain the steel and the power sports industry. Big Freight is part of the Company’s Specialized Solutions segment.construction materials markets. |
| · | | SteelmanLeavitt’s Acquisition – Effective as of JulyAugust 1, 2017, the2018, a Company subsidiary acquired all100% of the outstanding stockequity interests of SteelmanLeavitt’s, to strengthen its operations in Central Oregon and expand its presence in the Midwest and in both the power sports and heavy haul industries. Steelman is part of the Company’s Specialized Solutions segment.
|
| ·
| | R&R Acquisition – Effective as of September 1, 2017, the Company acquired all of the outstanding stock of R&R to expand the Company’s capabilities to include government and commercial arms, ammunition and explosives. R&R is part of the Company’s Specialized Solutions segment.lumber industry.
|
The Schilli, Big Freight, Steelman and R&R Acquisitions areCompany refers to the acquisitions described above collectively referred to as the Recent“Flatbed Solutions Acquisitions.”
The Business CombinationCompany refers to the Flatbed Solutions Acquisitions and Specialized Solutions Acquisitions described above collectively as the “Recent Acquisitions.”
The Company’s historical results of operations may not be comparable or indicative of results after the consummation of the Business Combination as a result of the following:
| ·
| | Decreased Leverage. As of December 31, 2016, after giving pro forma effect to the Business Combination, the Company would have had approximately $295.0 million of outstanding total indebtedness compared to the actual outstanding total indebtedness of $338.5 million, in each case, prior to debt issuance costs. For the year ended December 31, 2016, the Company’s pro forma interest expense would have been approximately $3.4 million lower than its historical interest expense.
|
| ·
| | Public Company Expenses. The Company incurred, and will continue to incur, direct, incremental general and administrative expenses as a result of being a publicly traded company, including, but not limited to, costs associated with annual and quarterly reports to stockholders, tax return preparation, independent auditor fees, investor relations activities, registrar and transfer agent fees, incremental director and officer liability insurance costs and independent director compensation. These direct, incremental general and administrative expenses, which the Company’s management estimates will total approximately $0.5 million annually, are not included in the Company’s historical financial results of operations.
|
| ·
| | Transaction Costs. During the nine months ended September 30, 2017, the Company expensed $2.0 million of transaction costs related to the Business Combination, compared to $0.3 million for the same period in 2016.
|
| ·
| | Deferred Financing Fees. During the first quarter of 2017, the Company expensed $3.9 million of unamortized deferred financing fees associated with debt refinanced in conjunction with the Business Combination. There were no such expenses for the nine months ended September 30, 2016.
|
Results of Operations
The following table sets forth items derived from the Company’s consolidated statements of operations and comprehensive income (loss) for the three months ended September 30, 20172019 and 20162018 in dollars and as a percentage of total revenue and the increase or decrease in the dollar amounts of those items.
| | | | | | | | | | | | | | | | | | | | | | | | | | | | | | |
| | Three Months Ended September 30, | | | | | | | Three Months Ended September 30, | | | | | |
| | 2017 | | 2016 | | Increase (Decrease) | | 2019 | | 2018 | | Increase (Decrease) |
(Dollars in thousands) | | $ | | % | | $ | | % | | $ | | % | |
(Dollars in millions) | | | $ | | % | | $ | | % | | $ | | % |
| | | | | | | | | | | | | | | | | | | | | | | | | | | | | | |
REVENUE: | | | | | | | | | | | | | | | | | | | | | | | | | | | | | | |
Freight | | $ | 171,245 | | 74.0 | | $ | 135,415 | | 77.8 | | $ | 35,830 | | 26.5 | |
Company freight | | | $ | 205.2 | | 45.6 | | $ | 206.9 | | 44.8 | | $ | (1.7) | | (0.8) |
Owner operator freight | | | | 118.3 | | 26.3 | | | 122.6 | | 26.6 | | | (4.3) | | (3.5) |
Brokerage | | | 34,198 | | 14.8 | | | 25,977 | | 14.9 | | | 8,221 | | 31.6 | | | 78.6 | | 17.5 | | | 82.2 | | 17.8 | | | (3.6) | | (4.4) |
Logistics | | | 7,871 | | 3.4 | | | — | | * | | | 7,871 | | * | | | 13.5 | | 3.0 | | | 11.6 | | 2.5 | | | 1.9 | | 16.4 |
Fuel surcharge | | | 18,008 | | 7.8 | | | 12,756 | | 7.3 | | | 5,252 | | 41.2 | | | 34.8 | | 7.7 | | | 38.3 | | 8.3 | | | (3.5) | | (9.1) |
Total revenue | | | 231,322 | | 100.0 | | | 174,148 | | 100.0 | | | 57,174 | | 32.8 | | | 450.4 | | 100.0 | | | 461.6 | | 100.0 | | | (11.2) | | (2.4) |
| | | | | | | | | | | | | | | | | | | | | | | | | | | | | | |
OPERATING EXPENSES: | | | | | | | | | | | | | | | | | | | | | | | | | | | | | | |
Salaries, wages and employee benefits | | | 64,955 | | 28.1 | | | 49,298 | | 28.3 | | | 15,657 | | 31.8 | | | 127.7 | | 28.4 | | | 114.8 | | 24.9 | | | 12.9 | | 11.2 |
Fuel | | | 24,734 | | 10.7 | | | 17,296 | | 9.9 | | | 7,438 | | 43.0 | | | 34.1 | | 7.6 | | | 38.9 | | 8.4 | | | (4.8) | | (12.3) |
Operations and maintenance | | | 35,132 | | 15.2 | | | 27,874 | | 16.0 | | | 7,258 | | 26.0 | | | 56.8 | | 12.6 | | | 51.5 | | 11.2 | | | 5.3 | | 10.3 |
Communications | | | 539 | | 0.2 | | | 370 | | 0.2 | | | 169 | | 45.7 | | | 1.0 | | 0.2 | | | 0.9 | | 0.2 | | | 0.1 | | 11.1 |
Purchased freight | | | 61,598 | | 26.6 | | | 42,541 | | 24.4 | | | 19,057 | | 44.8 | | | 155.5 | | 34.5 | | | 170.6 | | 37.0 | | | (15.1) | | (8.9) |
Administrative expenses | | | 8,619 | | 3.7 | | | 5,221 | | 3.0 | | | 3,398 | | 65.1 | | | 21.4 | | 4.8 | | | 16.1 | | 3.5 | | | 5.3 | | 32.9 |
Sales and marketing | | | 488 | | 0.2 | | | 435 | | 0.2 | | | 53 | | 12.2 | | | 1.3 | | 0.3 | | | 1.0 | | 0.2 | | | 0.3 | | 30.0 |
Taxes and licenses | | | 2,963 | | 1.3 | | | 2,268 | | 1.3 | | | 695 | | 30.6 | | | 4.8 | | 1.1 | | | 4.7 | | 1.0 | | | 0.1 | | 2.1 |
Insurance and claims | | | 6,351 | | 2.7 | | | 5,065 | | 2.9 | | | 1,286 | | 25.4 | | | 13.4 | | 3.0 | | | 12.7 | | 2.8 | | | 0.7 | | 5.5 |
Acquisition-related transaction expenses | | | 773 | | 0.3 | | | — | | * | | | 773 | | * | | | — | | — | | | 0.6 | | 0.1 | | | (0.6) | | (100.0) |
Depreciation and amortization | | | 19,805 | | 8.6 | | | 16,998 | | 9.8 | | | 2,807 | | 16.5 | | | 38.3 | | 8.5 | | | 36.8 | | 8.0 | | | 1.5 | | 4.1 |
Loss on disposition | | | (339) | | (0.1) | | | (495) | | (0.3) | | | 156 | | (31.5) | |
Gain on disposition of property and equipment | | | | (1.0) | | (0.2) | | | (0.9) | | (0.2) | | | (0.1) | | 11.1 |
Impairment | | | — | | * | | | 1,195 | | 0.7 | | | (1,195) | | (100.0) | | | 306.8 | | 68.1 | | | - | | — | | | 306.8 | | * |
Restructuring charges | | | | 6.9 | | 1.5 | | | - | | — | | | 6.9 | | * |
Total operating expenses | | | 225,618 | | 97.5 | | | 168,066 | | 96.5 | | | 57,552 | | 34.2 | | | 767.0 | | 170.3 | | | 447.7 | | 97.0 | | | 319.3 | | 71.3 |
Operating ratio | | | 97.5% | | | | | 96.5% | | | | | | | | | | 170.3% | | | | | 97.0% | | | | | | | |
Adjusted operating ratio(1) | | | 95.4% | | | | | 94.1% | | | | | | | | | | 97.0% | | | | | 94.5% | | | | | | | |
INCOME FROM OPERATIONS | | | 5,704 | | 2.5 | | | 6,082 | | 3.5 | | | (378) | | (6.2) | |
INCOME (LOSS) FROM OPERATIONS | | | | (316.6) | | (70.3) | | | 13.9 | | 3.0 | | | (330.5) | | (2,377.7) |
| | | | | | | | | | | | | | | | | | | | | | | | | | | | | | |
Other (income) expense: | | | | | | | | | | | | | | | | |
Other expense (income): | | | | | | | | | | | | | | | | |
Interest income | | | (76) | | * | | | (4) | | * | | | (72) | | 1,800.0 | | | (0.3) | | (0.1) | | | (0.2) | | - | | | (0.1) | | 50.0 |
Interest expense | | | 8,624 | | 3.7 | | | 6,724 | | 3.9 | | | 1,900 | | 28.3 | | | 12.8 | | 2.8 | | | 11.9 | | 2.6 | | | 0.9 | | 7.6 |
Write-off of unamortized deferred financing fees | | | — | | * | | | — | | * | | | — | | * | | | 2.0 | | 0.4 | | | — | | - | | | 2.0 | | * |
Other | | | (32) | | * | | | (64) | | * | | | 32 | | (50.0) | | | — | | - | | | (0.7) | | (0.2) | | | 0.7 | | (100.0) |
Total other expense | | | 8,516 | | 3.7 | | | 6,656 | | 3.8 | | | 1,860 | | 27.9 | | | 14.5 | | 3.2 | | | 11.0 | | 2.4 | | | 3.5 | | 31.8 |
| | | | | | | | | | | | | | | | | | | | | | | | | | | | | | |
Loss before provision for income taxes | | | (2,812) | | (1.2) | | | (574) | | (0.3) | | | (2,238) | | 389.9 | |
Provision for income taxes | | | (2,862) | | (1.2) | | | 683 | | 0.4 | | | (3,545) | | (519.0) | |
Income (loss) before benefit for income taxes | | | | (331.1) | | (73.5) | | | 2.9 | | 0.6 | | | (334.0) | | (11,517.2) |
Provision (benefit) for income taxes | | | | (57.8) | | (12.8) | | | 0.7 | | 0.2 | | | (58.5) | | (8,357.1) |
Net income (loss) | | $ | 50 | | - | | $ | (1,257) | | (0.7) | | $ | 1,307 | | (104.0) | | $ | (273.3) | | (60.7) | | $ | 2.2 | | 0.5 | | $ | (275.5) | | (12,522.7) |
| | | | | | | | | | | | | | | | |
OPERATING STATISTICS: | | | | | | | | | | | | | | | | |
Total miles (in millions)(2)(3) | | | | 124.2 | | | | | 121.3 | | | | | 2.9 | | 2.4 |
Company-operated tractors, as of quarter-end | | | | 3,736 | | | | | 3,799 | | | | | (63) | | (1.7) |
Owner-operated tractors, as of quarter-end | | | | 2,413 | | | | | 2,314 | | | | | 99 | | 4.3 |
Number of trailers, as of quarter-end | | | | 13,208 | | | | | 13,897 | | | | | (689) | | (5.0) |
| | | | | | | | | | | | | | | | |
Company-operated tractors, average for the quarter | | | | 3,744 | | | | | 3,690 | | | | | 54 | | 1.5 |
Owner-operated tractors, average for the quarter | | | | 2,395 | | | | | 2,332 | | | | | 63 | | 2.7 |
Total tractors, average for the quarter | | | | 6,139 | | | | | 6,022 | | | | | 117 | | 1.9 |
*indicates not meaningful.
| (1) | | Adjusted operating ratioOperating Ratio is not a recognized measure under GAAP. For a definition of adjusted operating ratioAdjusted Operating Ratio and reconciliation of adjusted operating ratioAdjusted Operating Ratio to operating ratio, see “Non-GAAP Financial Measures” below. |
| (2) | | Total miles includes company and owner operator and excludes brokerage. |
| (3) | | Miles are estimated based on information received as the date of filing. Miles may change quarter to quarter when final information is received from each operating segment. |
The following table sets forth the Company’s Specialized Solutions segment’s revenue, operating expenses, operating ratio, Adjusted Operating Ratio and operating income for the three months ended September 30, 2019 and 2018 in dollars and as a percentage of its Specialized Solutions segment’s total revenue and the increase or decrease in the dollar amounts of those items. The following table also sets forth certain operating statistics for the Company’s Specialized Solutions segment for the three months ended September 30, 2019 and 2018.
SPECIALIZED SOLUTIONS
| | | | | | | | | | | | | | | |
| | Three Months Ended September 30, | | | | | |
| | 2019 | | 2018 | | Increase (Decrease) |
(Dollars in millions) | | $ | | % | | $ | | % | | $ | | % |
| | | | | | | | | | | | | | | |
REVENUE(1): | | | | | | | | | | | | | | | |
Company freight | | $ | 155.4 | | 54.0 | | $ | 153.1 | | 53.9 | | $ | 2.3 | | 1.5 |
Owner operator freight | | | 49.1 | | 17.0 | | | 49.1 | | 17.3 | | | — | | - |
Brokerage | | | 54.5 | | 18.9 | | | 53.2 | | 18.7 | | | 1.3 | | 2.4 |
Logistics | | | 12.9 | | 4.5 | | | 10.8 | | 3.8 | | | 2.1 | | 19.4 |
Fuel surcharge | | | 16.1 | | 5.6 | | | 17.7 | | 6.2 | | | (1.6) | | (9.0) |
Total revenue | | | 288.0 | | 100.0 | | | 283.9 | | 100.0 | | | 4.1 | | 1.4 |
| | | | | | | | | | | | | | | |
OPERATING EXPENSES(1): | | | | | | | | | | | | | | | |
Salaries, wages and employee benefits | | | 82.6 | | 28.7 | | | 79.4 | | 28.0 | | | 3.2 | | 4.0 |
Fuel | | | 21.7 | | 7.5 | | | 25.2 | | 8.9 | | | (3.5) | | (13.9) |
Operations and maintenance | | | 43.3 | | 15.0 | | | 38.7 | | 13.6 | | | 4.6 | | 11.9 |
Purchased freight | | | 85.2 | | 29.6 | | | 84.0 | | 29.6 | | | 1.2 | | 1.4 |
Depreciation and amortization | | | 23.8 | | 8.3 | | | 27.6 | | 9.7 | | | (3.8) | | (13.8) |
Impairment | | | 193.6 | | 67.2 | | | — | | - | | | 193.6 | | * |
Restructuring | | | 3.5 | | 1.2 | | | — | | - | | | 3.5 | | * |
Other operating expenses | | | 21.9 | | 7.6 | | | 17.2 | | 6.1 | | | 4.7 | | 27.3 |
Total operating expenses | | | 475.6 | | 165.1 | | | 272.1 | | 95.8 | | | 203.5 | | 74.8 |
Operating ratio | | | 165.1% | | | | | 95.8% | | | | | | | |
Adjusted operating ratio(2) | | | 93.9% | | | | | 92.5% | | | | | | | |
INCOME (LOSS) FROM OPERATIONS | | $ | (187.6) | | (65.1) | | $ | 11.8 | | 4.2 | | $ | (199.4) | | (1,689.8) |
| | | | | | | | | | | | | | | |
OPERATING STATISTICS: | | | | | | | | | | | | | | | |
Total miles (in millions)(3)(4) | | | 57.8 | | | | | 57.2 | | | | | 0.6 | | 1.0 |
Company-operated tractors, at quarter-end | | | 2,472 | | | | | 2,436 | | | | | 36 | | 1.5 |
Owner-operated tractors, at quarter-end | | | 699 | | | | | 678 | | | | | 21 | | 3.1 |
Number of trailers, at quarter-end | | | 8,280 | | | | | 8,724 | | | | | (444) | | (5.1) |
| | | | | | | | | | | | | | | |
Company-operated tractors, average for the quarter | | | 2,479 | | | | | 2,446 | | | | | 33 | | 1.3 |
Owner-operated tractors, average for the quarter | | | 694 | | | | | 721 | | | | | (27) | | (3.7) |
Total tractors, average for the quarter | | | 3,173 | | | | | 3,167 | | | | | 6 | | |
*indicates not meaningful.
| (1) | | Includes intersegment revenues and expenses, as applicable, which are eliminated in the Company’s consolidated results. |
| (2) | | Adjusted Operating Ratio is not a recognized measure under GAAP. For a definition of Adjusted Operating Ratio and reconciliation of Adjusted Operating Ratio to operating ratio, see “Non-GAAP Financial Measures” below. |
| (3) | | Total miles includes company and owner operator and excludes brokerage. |
| (4) | | Miles are estimated based on information received as the date of filing. Miles may change quarter to quarter when final information is received from each operating segment. |
The following table sets forth the Company’s Flatbed Solutions segment’s revenue, operating expenses, operating ratio, adjusted operating ratioAdjusted Operating Ratio and operating income for the three months ended September 30, 20172019 and 20162018 in dollars and as a percentage of its Flatbed Solutions segment’s total revenue and the increase or decrease in the dollar amounts of those items. The following table also sets forth certain operating statistics for the Company’s Flatbed Solutions segment for the three months ended September 30, 20172019 and 2016.2018.
FLATBED SOLUTIONS
| | | | | | | | | | | | | | | | | | | | | | | | | | | | | | |
| | Three Months Ended September 30, | | | | | | | Three Months Ended September 30, | | | | | |
| | 2017 | | 2016 | | Increase (Decrease) | | 2019 | | 2018 | | Increase (Decrease) |
(Dollars in thousands) | | $ | | % | | $ | | % | | $ | | % | |
(Dollars in millions) | | | $ | | % | | $ | | % | | $ | | % |
| | | | | | | | | | | | | | | | | | | | | | | | | | | | | | |
REVENUE(1): | | | | | | | | | | | | | | | | | | | | | | | | | | | | | | |
Freight | | $ | 67,807 | | 79.2 | | $ | 64,281 | | 81.4 | | $ | 3,526 | | 5.5 | |
Company freight | | | $ | 55.2 | | 32.5 | | $ | 56.3 | | 31.0 | | $ | (1.1) | | (2.0) |
Owner operator freight | | | | 71.1 | | 41.9 | | | 74.3 | | 40.9 | | | (3.2) | | (4.3) |
Brokerage | | | 9,385 | | 11.0 | | | 7,410 | | 9.4 | | | 1,975 | | 26.7 | | | 23.6 | | 13.9 | | | 29.2 | | 16.1 | | | (5.6) | | (19.2) |
Logistics | | | — | | - | | | — | | - | | | — | | * | | | 0.7 | | 0.4 | | | 0.8 | | 0.4 | | | (0.1) | | (12.5) |
Fuel surcharge | | | 8,400 | | 9.8 | | | 7,284 | | 9.2 | | | 1,116 | | 15.3 | | | 19.2 | | 11.4 | | | 20.9 | | 11.5 | | | (1.7) | | (8.1) |
Total revenue | | | 85,592 | | 100.0 | | | 78,975 | | 100.0 | | | 6,617 | | 8.4 | | | 169.8 | | 100.0 | | | 181.5 | | 100.0 | | | (11.7) | | (6.4) |
| | | | | | | | | | | | | | | | | | | | | | | | | | | | | | |
OPERATING EXPENSES(1): | | | | | | | | | | | | | | | | | | | | | | | | | | | | | | |
Salaries, wages and employee benefits | | | 23,538 | | 27.5 | | | 23,233 | | 29.4 | | | 305 | | 1.3 | | | 35.0 | | 20.6 | | | 33.0 | | 18.2 | | | 2.0 | | 6.1 |
Fuel | | | 10,212 | | 11.9 | | | 9,401 | | 11.9 | | | 811 | | 8.6 | | | 12.5 | | 7.4 | | | 13.7 | | 7.5 | | | (1.2) | | (8.8) |
Operations and maintenance | | | 9,584 | | 11.2 | | | 8,710 | | 11.0 | | | 874 | | 10.0 | | | 13.2 | | 7.8 | | | 12.6 | | 6.9 | | | 0.6 | | 4.8 |
Purchased freight | | | 24,536 | | 28.7 | | | 20,169 | | 25.5 | | | 4,367 | | 21.7 | | | 77.8 | | 45.8 | | | 90.3 | | 49.8 | | | (12.5) | | (13.8) |
Depreciation and amortization | | | 7,150 | | 8.4 | | | 7,650 | | 9.7 | | | (500) | | (6.5) | | | 14.2 | | 8.4 | | | 9.2 | | 5.1 | | | 5.0 | | 54.3 |
Impairment | | | — | | - | | | — | | - | | | — | | * | | | 113.2 | | 66.7 | | | — | | - | | | 113.2 | | * |
Restructuring | | | | 0.9 | | 0.5 | | | — | | - | | | 0.9 | | * |
Other operating expenses | | | 5,817 | | 6.8 | | | 6,018 | | 7.6 | | | (201) | | (3.3) | | | 10.9 | | 6.4 | | | 10.5 | | 5.8 | | | 0.4 | | 3.8 |
Total operating expenses | | | 80,837 | | 94.4 | | | 75,181 | | 95.2 | | | 5,656 | | 7.5 | | | 277.7 | | 163.5 | | | 169.3 | | 93.3 | | | 108.4 | | 64.0 |
Operating ratio | | | 94.4% | | | | | 95.2% | | | | | | | | | | 163.5% | | | | | 93.3% | | | | | | | |
Adjusted operating ratio(2) | | | 93.5% | | | | | 93.9% | | | | | | | | | | 95.0% | | | | | 92.5% | | | | | | | |
INCOME FROM OPERATIONS | | $ | 4,755 | | 5.6 | | $ | 3,794 | | 4.8 | | $ | 961 | | 25.3 | |
INCOME (LOSS) FROM OPERATIONS | | | $ | (107.9) | | (63.5) | | $ | 12.2 | | 6.7 | | $ | (120.1) | | (984.4) |
| | | | | | | | | | | | | | | | | | | | | | | | | | | | | | |
OPERATING STATISTICS: | | | | | | | | | | | | | | | | | | | | | | | | | | | | | | |
Total miles | | | 36,646,345 | | | | | 37,767,726 | | | | | (1,121,381) | | (3.0) | |
Company-operated tractors | | | 1,144 | | | | | 1,162 | | | | | (18) | | (1.5) | |
Owner-operated tractors | | | 469 | | | | | 441 | | | | | 28 | | 6.3 | |
Number of trailers | | | 2,881 | | | | | 2,842 | | | | | 39 | | 1.4 | |
Total miles (in millions)(3)(4) | | | | 66.4 | | | | | 64.1 | | | | | 2.3 | | 3.6 |
Company-operated tractors, at quarter-end | | | | 1,264 | | | | | 1,363 | | | | | (99) | | (7.3) |
Owner-operated tractors, at quarter-end | | | | 1,714 | | | | | 1,636 | | | | | 78 | | 4.8 |
Number of trailers, at quarter-end | | | | 4,928 | | | | | 5,173 | | | | | (245) | | (4.7) |
| | | | | | | | | | | | | | | | |
Company-operated tractors, average for the quarter | | | | 1,265 | | | | | 1,244 | | | | | 21 | | 1.7 |
Owner-operated tractors, average for the quarter | | | | 1,701 | | | | | 1,611 | | | | | 90 | | 5.6 |
Total tractors, average for the quarter | | | | 2,966 | | | | | 2,855 | | | | | 111 | | 3.9 |
*indicates not meaningful.
| (1) | | Includes intersegment revenues and expenses, as applicable, which are eliminated in the Company’s consolidated results. |
| (2) | | Adjusted operating ratioOperating Ratio is not a recognized measure under GAAP. For a definition of adjusted operating ratioAdjusted Operating Ratio and reconciliation of adjusted operating ratioAdjusted Operating Ratio to operating ratio, see “Non-GAAP Financial Measures” below. |
| (3) | | Total miles includes company and owner operator and excludes brokerage. |
| (4) | | Miles are estimated based on information received as the date of filing. Miles may change quarter to quarter when final information is received from each operating segment. |
The following table sets forth the Company’s Specialized Solutions segment’s revenue, operating expenses, operating ratio, adjusted operating ratio and operating income for the three months ended September 30, 2017 and 2016 in dollars and as a percentage of its Specialized Solutions segment’s total revenue and the increase or decrease in the dollar amounts of those items. The following table also sets forth certain operating statistics for the Company’s Specialized Solutions segment for the three months ended September 30, 2017 and 2016.
SPECIALIZED SOLUTIONS
| | | | | | | | | | | | | | | |
| | Three Months Ended September 30, | | | | | |
| | 2017 | | 2016 | | Increase (Decrease) |
(Dollars in thousands) | | $ | | % | | $ | | % | | $ | | % |
| | | | | | | | | | | | | | | |
REVENUE(1): | | | | | | | | | | | | | | | |
Freight | | $ | 105,137 | | 71.2 | | $ | 72,367 | | 75.0 | | $ | 32,770 | | 45.3 |
Brokerage | | | 24,852 | | 16.8 | | | 18,579 | | 19.2 | | | 6,273 | | 33.8 |
Logistics | | | 7,886 | | 5.3 | | | — | | - | | | 7,886 | | * |
Fuel surcharge | | | 9,756 | | 6.6 | | | 5,588 | | 5.8 | | | 4,168 | | 74.6 |
Total revenue | | | 147,631 | | 100.0 | | | 96,534 | | 100.0 | | | 51,097 | | 52.9 |
| | | | | | | | | | | | | | | |
OPERATING EXPENSES(1): | | | | | | | | | | | | | | | |
Salaries, wages and employee benefits | | | 39,507 | | 26.8 | | | 24,714 | | 25.6 | | | 14,793 | | 59.9 |
Fuel | | | 14,521 | | 9.8 | | | 7,895 | | 8.2 | | | 6,626 | | 83.9 |
Operations and maintenance | | | 25,180 | | 17.1 | | | 18,927 | | 19.6 | | | 6,253 | | 33.0 |
Purchased freight | | | 38,965 | | 26.4 | | | 23,733 | | 24.6 | | | 15,232 | | 64.2 |
Depreciation and amortization | | | 12,618 | | 8.5 | | | 9,308 | | 9.6 | | | 3,310 | | 35.6 |
Impairment | | | — | | - | | | 1,195 | | 1.2 | | | (1,195) | | (100.0) |
Other operating expenses | | | 9,681 | | 6.6 | | | 5,023 | | 5.2 | | | 4,658 | | 92.7 |
Total operating expenses | | | 140,472 | | 95.2 | | | 90,795 | | 94.1 | | | 49,677 | | 54.7 |
Operating ratio | | | 95.2% | | | | | 94.1% | | | | | | | |
Adjusted operating ratio(2) | | | 92.6% | | | | | 91.2% | | | | | | | |
INCOME FROM OPERATIONS | | $ | 7,159 | | 4.8 | | $ | 5,739 | | 5.9 | | $ | 1,420 | | 24.7 |
| | | | | | | | | | | | | | | |
OPERATING STATISTICS: | | | | | | | | | | | | | | | |
Total miles | | | 38,948,331 | | | | | 24,266,511 | | | | | 14,681,820 | | 60.5 |
Company-operated tractors | | | 1,638 | | | | | 1,109 | | | | | 529 | | 47.7 |
Owner-operated tractors | | | 408 | | | | | 236 | | | | | 172 | | 72.9 |
Number of trailers | | | 4,813 | | | | | 3,394 | | | | | 1,419 | | 41.8 |
*indicates not meaningful.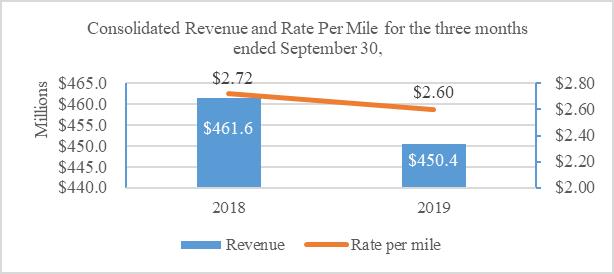
| (1)
| | Includes intersegment revenues and expenses, as applicable, which are eliminated in the Company’s consolidated results.
|
| (2)
| | Adjusted operating ratio is not a recognized measure under GAAP. For a definition of adjusted operating ratio and reconciliation of adjusted operating ratio to operating ratio, see “Non-GAAP Financial Measures” below.
|
Revenue. Total revenue increased 32.8%decreased 2.4% to $231.3$450.4 million for the three months ended September 30, 20172019 from $174.1$461.6 million for the three months ended September 30, 2016,2018, primarily due to the slow demand in the Flatbed Solutions segment, offset by theRecent Acquisitions.Acquisitions of $7.3 million. The changedecrease in total revenue, excluding the effect of the Recent Acquisitions, was an increasea decrease of $8.8$18.5 million, or 5.1%4.0%, due primarily to increasesdecreases in company freight, revenue, fuel surchargeowner operator freight and brokerage revenue. FreightCompany freight revenue, excluding the effect of the Recent Acquisitions increased $5.7of $5.3 million, decreased $6.9 million, or 4.2%3.4%, from $135.4$206.9 million for the three months ended September 30, 20162018 to $141.1$199.9 million for the three months ended September 30, 2017.2019. Owner operator freight revenue, excluding the effect of the Recent Acquisitions of $0.6 million, decreased $5.0 million, or 4.0%, from $122.6 million for the three months ended September 30, 2018 to $117.7 million for the three months ended September 30, 2019. Brokerage revenue, excluding the effect of the Recent Acquisitions of $0.5 million, decreased $4.2 million, or 5.1%, from $82.2 million for the three months ended September 30, 2018 to $78.0 million for the three months ended September 30, 2019. The decreases in company freight and owner operator freight revenue, excluding the Recent Acquisitions, were primarily a result of a 4.3% decrease in total miles driven and offset by a slight increase in rate per mile. Logistics increased $1.9 million, or 16.4%, from $11.6 million for the three months ended September 30, 2018 to $13.5 million for the three months ended September 30, 2019 as a result of increases in logistics activities. Fuel surcharges, excluding the effect of the Recent Acquisitions increasedof $0.9 million, decreased $4.4 million, or 11.4%, from $12.7$38.3 million for the three months ended September 30, 20162018 to $14.9$33.9 million for the three months ended September 30, 2017, an increase of 17.1%. Brokerage2019.
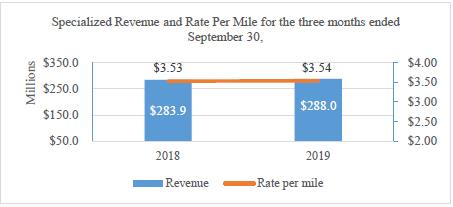
The Company’s Specialized Solutions segment’s revenue excluding the effect of the Recent Acquisitions, increased $0.9 million, or 3.6%, from $26.0was $288.0 million for the three months ended September 30, 20162019 as compared to $26.9$283.9 million for the three months ended September 30, 2017.2018, an increase of 1.4%, which was primarily due to the increase in company freight, brokerage and logistics revenue. Company freight revenue increased $2.3 million, or 1.5%, from $153.1 million for the three months ended September 30, 2018 to $155.4 million for the three months ended September 30, 2019. Owner operator freight revenue was flat at $49.1 million for the three months ended September 30, 2018 and for the three months ended September 30, 2019. Brokerage revenue increased $1.3 million, or 2.4%, from $53.2 million for the three months ended September 30, 2018 to $54.5 million for the three months ended September 30, 2019. The increase in overall freight revenue was primarily a result of a slight increase in rate per mile and miles driven compared to the same period in 2018. Logistics increased 19.4% to $12.9 million from $10.8 million compared to the same period in 2018 as a result of increases in logistics activites. Fuel surcharges decreased 9.0% compared to the same period in 2018.
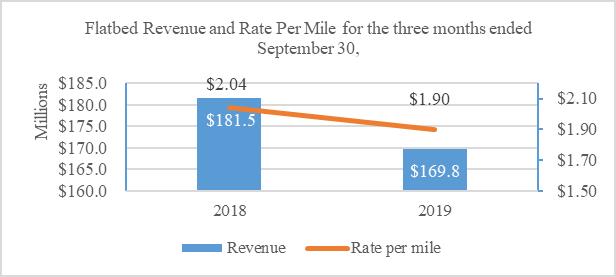
The Company’s Flatbed Solutions segment’s revenue was $85.6$169.8 million for the three months ended September 30, 2017 and $79.02019 as compared to $181.5 million for the three months ended September 30, 2016, an increase2018, a decrease of 8.4%. This increase6.4%, which was primarily athe result of increasesthe slow demand from the industrial industry. The decrease in rates, which produced increasesrevenue, excluding the effect of $3.5 million, or 5.5%, in freight revenue and $2.0 million, or 26.7%, in brokerage revenues despite 1.1 million fewer miles compared to the same period in 2016. The $1.1 million, or 15.3%, increase in fuel surcharge revenue also contributed to the increase in the Flatbed Solutions segment’sAcquisitions of $7.3 million, was 10.4%, or $18.9 million, due to decreases in company freight, owner operator freight and brokerage revenue.
The Company’s Specialized Company freight revenue, excluding the effect of the Flatbed Solutions segment’s revenue was $147.6Acquisitions of $5.3 million, decreased $6.5 million, or 11.5%, from $56.3 million for the three months ended September 30, 2017 and $96.52018 to $49.9 million for the three months ended September 30, 2016, an increase of 52.9%, which was primarily due to the Recent Acquisitions. The
increase in2019. Owner operator freight revenue, excluding the effect of the RecentFlatbed Solutions Acquisitions was an increase of $2.8$0.6 million, decreased $3.8 million, or 2.9%5.1%, primarily due to increases in freight revenue and fuel surcharge, partially offset by a slight decrease in brokerage revenues. Freight revenue, excluding the effect of the Recent Acquisitions, increased to $75.0from $74.3 million for the three months ended September 30, 2017 from $72.3 million for the same period in 2016, an increase of 3.7%. Fuel surcharges, excluding the effect of the Recent Acquisitions, increased2018 to $6.7$70.5 million for the three months ended September 30, 2017 from $5.6 million for the same period in 2016, an increase of 19.6%.2019. Brokerage revenue, excluding the effect of the RecentFlatbed Solutions Acquisitions of $0.5 million, decreased to $17.6$6.0 million, or 20.6%, from $29.2 million for the three months ended September 30, 2017 from $18.62018 to $23.1 million for the three months ended September 30, 2019. The decreases in company freight and owner operator freight, excluding the effect of the Flatbed Solutions Acquisitions, was a result of a 9.4% decrease in miles driven offset by a 0.8% increase in rate per mile compared to the same period in 2016, a decrease2018. Fuel surcharges, excluding the effect of 5.5%.
In both segments, the increase in fuel surcharge revenue wasFlatbed Solutions Acquisitions of $0.9 million, decreased $2.5 million, or 12.0%, from $20.9 million for the result of increases in fuel prices, which commenced inthree months ended September 30, 2018 to $18.3 million for the fourth quarter of 2016 and continued through the third quarter of 2017 with only a less than 1% decrease in fuel prices in the second quarter of 2017.three months ended September 30, 2019.
Salaries, Wages and Employee Benefits. Salaries, wages and employee benefits expense, which consists of compensation for all employees, is primarily affected by the number of miles driven by companyCompany drivers, the rate per mile paid to companyCompany drivers, employee benefits including, but not limited to, health care and workers’ compensation, and to a lesser extent, the number of, and compensation and benefits paid to, non-driver employees. In general, the Specialized Solutions segment drivers receive a higher driver pay per total mile than Flatbed Solutions segment drivers due to the former requiring a higher level of training and expertise. Driver pay rate increases implemented during the second half of 2018 to address the general driver shortage are reflected in results for the current quarter. The Company does not expect further driver pay rate increases given the current market and downward rate pressures.
Salaries, wages and employee benefits expense increased 31.8%11.2% to $65.0$127.7 million for the three months ended September 30, 20172019 from $49.3$114.8 million for the three months ended September 30, 2016,2018, primarily due to the Recent Acquisitions.Acquisitions and healthcare costs. The increase in salaries, wages and employee benefits expense, excluding the effect of the Recent Acquisitions of $2.9 million, was 5.5%8.6%, or $2.7$9.9 million, and was primarily due to increased employee compensation workers’ compensation premiums,due to an increase in headcount at the corporate office to support the scale and stock-based compensation, partially offset by a decreasestrategic growth of the Company, increases in workers’ compensation claims.
The Company’s Flatbed Solutions segment’shealthcare costs and one-time severance costs related to Project Pivot. Excluding the effect of the Recent Acquisitions, salaries, wages and employee benefits expense, was relatively flatas a percentage of consolidated revenue (excluding brokerage revenue), increased 3.9% for the three months ended September 30, 20172019 as compared to the three months ended September 30, 2016.same period in 2018.
The Company’s Specialized Solutions segment had a $14.8$3.2 million, or 59.9%4.0%, increase in salaries, wages and employee benefits expense for the three months ended September 30, 20172019 compared to the three months ended September 30, 2016,2018, primarily dueas a result of the higher driver pay rates and healthcare costs. Salaries, wages and employee benefits expense, as a percentage of Specialized Solutions revenue (excluding brokerage revenue), increased 1.0% for the three months ended September 30, 2019 as compared to the Recent Acquisitions. Thissame period in 2018.
The Company’s Flatbed Solutions segment had a $2.0 million, or 6.1%, increase excludingin salaries, wages and employee benefits expense for the three months ended September 30, 2019 compared to the three months ended September 30, 2018, primarily as a result of the Flatbed Solutions Acquisitions, which resulted in a $2.9 million increase. Excluding the effect of the RecentFlatbed Solutions Acquisitions, was 7.5%salaries, wages and employee benefit expense decreased 2.6%, or $1.9$0.9 million for the three months ended September 30, 2019 as compared to the three months ended September 30, 2018. Excluding the effect of the Flatbed Solutions Acquisitions, salaries, wages and was primarily dueemployee benefits expense, as a percentage of Flatbed Solutions revenue (excluding brokerage revenue), increased 1.4% for the three months ended September 30, 2019 as compared to increased employee compensation and stock-based compensation.the same period in 2018. This increase is a result of a decrease in revenue, excluding the impact of the Flatbed Solutions Acquisitions.
Fuel. Fuel expense consists primarily of diesel fuel expense for company-owned tractors and fuel taxes. The primary factors affecting fuel expense are the cost of diesel fuel, the miles per gallon realized with company equipment and the number of miles driven by companyCompany drivers.
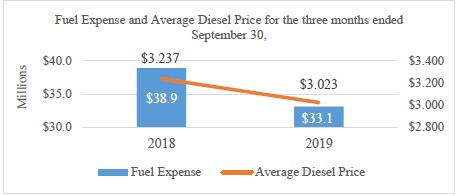
*Fuel expense excludes the effect of the Recent Acquisitions.
Total fuel expense increased $7.4decreased $4.8 million, or 43.0%12.3%, to $24.7$34.1 million for the three months ended September 30, 20172019 from $17.3$38.9 million for the three months ended September 30, 2016. This increase was primarily a result of the Recent Acquisitions and higher fuel prices. Excluding2018, excluding the effect of the Recent Acquisitions of $1.1 million, fuel expense increased 11.3%decreased 15.1%, or $2.0$5.9 million. This decrease was primarily due to a 6.6% decrease in average diesel prices period over period. The U.S. national average diesel fuel price, as published by the U.S. Department of Energy, was $2.615$3.023 for the three months ended September 30, 2017,2019, compared to $2.381$3.237 for the same period in 2016,2018. Total miles driven, excluding the Recent Acquisitions, decreased 4.3% for the three months ended September 30, 2019 as compared to the three months ended September 30, 2018.
The Company’s Specialized Solutions segment’s fuel expense decreased 13.9% to $21.7 million for the three months ended September 30, 2019 from $25.2 million for the three months ended September 30, 2018, primarily as the result of a 9.9% increase.decrease in average diesel prices and a decrease of 0.4% in company miles for the three months ended September 30, 2019 as compared to the three months ended September 30, 2018.
The Company’s Flatbed Solutions segment’s fuel expense increased 8.6%decreased 8.8% to $10.2$12.5 million for the three months ended September 30, 20172019 from $9.4$13.7 million for the three months ended September 30, 2016,2018, primarily as a result of higher fuel prices, partially offset by a 3.0% decrease in total miles.
The Company’s Specializedaverage diesel price. Excluding the effect of the Flatbed Solutions segment’sAcquisitions of $1.1 million, fuel expense increased 83.9% to $14.5 millionin the Flatbed Solutions segment decreased 16.9% or $2.3 million. Company miles, excluding the Flatbed Solutions Acquisitions, decreased 29.6% for the three months ended September 30, 2017 from $7.9 million for2019 as compared to the three months ended September 30, 2016, primarily as a result of the Recent Acquisitions, higher fuel prices and an increase in total miles. Excluding the effect of the Recent Acquisitions, fuel expense in the Specialized Solutions segment increased 14.5% to $9.0 million and total miles increased 2.3%.2018.
Operations and Maintenance. Operations and maintenance expense consists primarily of ordinary vehicle repairs and maintenance, costs associated with preparing tractors and trailers for sale or trade-in, driver recruiting, training and safety costs, permitting and pilot car fees and other general operations expenses. Operations and maintenance expense is primarily affected by the age of company-owned tractors and trailers, the number of miles driven in a period and driver turnover.
Operations and maintenance expense increased 26.0%10.3% to $35.1$56.8 million for the three months ended September 30, 20172019 from $27.9$51.5 million for the three months ended September 30, 2016,2018. After adjusting for the effect of the Recent Acquisitions, operations and maintenance expense increased 8.8% for the three months ended September 30, 2019 as compared to the three months ended September 30, 2018 due to an increase of $2.1 million for pilot car fees. Excluding the effect of the Recent Acquisitions, operations and maintenance expense, as a percentage of consolidated revenue (excluding brokerage revenue), increased 1.8% for the three months ended September 30, 2019 as compared to the same period in 2018 as a result of normal equipment trade cycles and related expenses.
The Company’s Specialized Solutions segment’s operations and maintenance expense increased $4.6 million, or 11.9%, for the three months ended September 30, 2019 as compared to the three months ended September 30, 2018 as a result of an increase of $2.0 million in pilot car and an increase in maintenance expense due to normal replacement cycles of tractors and trailers. Operations and maintenance expense, as a percentage of Specialized Solutions revenue (excluding brokerage revenue), increased 1.8% for the three months ended September 30, 2019 as compared to the same period in 2018.
The Company’s Flatbed Solutions segment’s operations and maintenance expense increased $0.6 million, or 4.8%, for the three months ended September 30, 2019 as compared to the three months ended September 30, 2018, primarily as a result of the Recent Acquisitions. OperatingFlatbed Solutions Acquisitions of $0.8 million. Excluding the effect of the Flatbed Solutions Acquisitions, operations and maintenance expense decreased $0.2 million, or 1.5%, for the three months ended September 30, 2019 as compared to the three months ended September 30, 2018, primarily as a result of a decrease in maintenance expense, due to a reduction of tractors in the Company’s fleet. Excluding the effect of the Flatbed Solutions Acquisitions, operations and maintenance expense, as a percentage of Flatbed Solutions revenue (excluding brokerage revenue), increased 4.7% after0.6% for the three months ended September 30, 2019 as compared to the same period in 2018.
Purchased Freight. Purchased freight expense consists of the payments to owner-operators, including fuel surcharge reimbursements, and payments to third-party capacity providers that haul loads brokered to them. Purchased freight expense generally takes into account changes in diesel fuel prices, resulting in lower payments during periods of declining fuel prices.
Total purchased freight expense decreased 8.9% from $170.6 million during the three months ended September 30, 2018 to $155.5 million during the three months ended September 30, 2019. Excluding the effect of the Recent Acquisitions of $0.9 million on purchased freight expense, total purchased freight expense decreased 9.4% to $154.5 million for the three months ended September 30, 2019. Purchased freight expense from owner-operators, excluding the Recent Acquisitions, decreased 4.6% from $102.4 million during the three months ended September 30, 2018 to $97.7 million during the three months ended September 30, 2019 as a result of a decrease in owner operator revenue. Purchased freight expense from third-party capacity providers, excluding the Recent Acquisitions, decreased 29.8% from $63.2 million during the three months ended September 30, 2018 to $44.4 million during the three months ended September 30, 2019, as a result of lower rates and decreased utilization of third-party capacity providers. Excluding the effect of the Recent Acquisitions, purchased freight expense, as a percentage of consolidated revenue, decreased 2.1% for the three months ended September 30, 2019 as compared to the same period in 2018.
The Company’s Specialized Solutions segment’s purchased freight expense increased 1.4% to $85.2 million during the three months ended September 30, 2019 from $84.0 million during the three months ended September 30, 2018. Purchased freight expense from owner-operators increased 4.2% from $35.0 million during the three months ended September 30, 2018 to $36.5 million during the three months ended September 30, 2019, primarily as a result of an increase in the utilization of owner operators. Purchased freight expense from third-party capacity providers decreased 28.4% from $41.6 million during the three months ended September 30, 2018 to $29.8 million during the three months ended September 30, 2019, as a result of a decreased in utilization of third-party capacity providers. Purchased freight expense, as a percentage of Specialized Solutions revenue, was flat for the three months ended September 30, 2019 as compared to the same period in 2018.
The Company’s Flatbed Solutions segment’s purchased freight expense decreased 13.8% to $77.8 million for the three months ended September 30, 2019 from $90.3 million for the three months ended September 30, 2018. Excluding the effect of the Flatbed Solutions Acquisitions, the Company’s Flatbed Solutions segment’s purchased freight expense decreased 14.9% to $76.8 million for the three months ended September 30, 2019 as compared to the three months ended September 30, 2018. Purchased freight expense from owner-operators, excluding the Flatbed Solutions Acquisitions, decreased 5.7% to $61.2 million for the three months ended September 30, 2019 from $64.9 million for the three months ended September 30, 2018, as a result of a decrease in owner operators revenue. Purchased freight expense from third-party capacity providers, excluding the Flatbed Solutions Acquisitions, decreased 33.4% from $21.6 million during the three months ended September 30, 2018 to $14.4 million during the three months ended September 30, 2019, primarily as a result of decreased utilization of third-party capacity providers. Excluding the effect of the Flatbed Solutions Acquisitions, purchased freight expense, as a percentage of Flatbed Solutions revenue, decreased 2.5% for the three months ended September 30, 2019 as compared to the same period in 2018.
Depreciation and Amortization. Depreciation and amortization expense consists primarily of depreciation for company-owned tractors and trailers and amortization of those financed with finance leases. The primary factors affecting these expense items include the size and age of company-owned tractors and trailers and the cost of new equipment. Amortization of intangible assets is also included in this expense.
Depreciation and amortization expense increased 4.1% to $38.3 million during the three months ended September 30, 2019 from $36.8 million during the three months ended September 30, 2018, as a result of the Recent Acquisitions of $0.7 million. Amortization of intangible assets and net impact of step-up in basis of acquired assets impact on expense was $4.2 million and $5.5 million, respectively. After adjusting for the effect of the Recent Acquisitions, depreciation and amortization expense increased 2.3% as a result of $5.7 million of depreciation expense recognized on assets available for lease and leased to owner-operators due to the impact of the adoption of ASC 842 for the three months ended September 30, 2019 as compared to the three months ended September 30, 2018, offset by an approximately 60 tractor decrease in the Company’s fleet.
The Company’s Specialized Solutions segment’s depreciation and amortization expense decreased 13.8% for the three months ended September 30, 2019 as compared to the three months ended September 30, 2018. Amortization of intangible assets and net impact of step-up in basis of acquired assets impact on expense was $2.7 million and $4.8 million, respectively. Depreciation and amortization expense decreased $3.8 million as a result of disposals in approximately 440 trailers, offset by $0.6 million of depreciation expense recognized on assets available for lease and leased to owner-operators due to the impact of the adoption of ASC 842 for the three months ended September 30, 2019 as compared to the three months ended September 30, 2018.
The Company’s Flatbed Solutions segment’s depreciation and amortization expense increased 54.3% for the three months ended September 30, 2019 as compared to the three months ended September 30, 2018. Amortization of intangible assets and net impact of step-up in basis of acquired assets impact on expense was $1.5 million and $0.7 million, respectively. Excluding the Flatbed Solutions Acquisitions, depreciation and amortization expense increased $4.4 million as a result of the impact of adoption of ASC 842 which resulted in the recognition of $5.1 million of depreciation expense on assets available for lease and leased to owner-operators, offset by the impact of a reduction of approximately 99 tractors in the segment’s fleet for the three months ended September 30, 2019 as compared to the three months ended September 30, 2018.
Taxes and Licenses. Operating taxes and licenses expense primarily represents the costs of taxes and licenses associated with the Company’s fleet of equipment and will vary according to the size of its equipment fleet. Taxes and license expense increased $0.1 million for the three months ended September 30, 2019. Excluding the effect of the Recent Acquisitions of $0.2 million, operating taxes and license expense, as a percentage of revenue, was 1.0% for the three months ended September 30, 2019 and 2018.
Insurance and Claims. Insurance and claims expense consists of insurance premiums and the accruals the Company makes for estimated payments and expenses for claims for bodily injury, property damage, cargo damage and other casualty events. The primary factor affecting the Company’s insurance and claims expense is seasonality (the Company typically experiences higher accident frequency in winter months), the frequency and severity of accidents, trends in the development factors used in its accruals and developments in large, prior-year claims. The frequency of accidents tends to increase with the miles the Company travels. Insurance and claims expense increased 5.5% to $13.4 million during the three months ended September 30, 2019 from $12.7 million during the three months ended September 30, 2018, partially as a result of the Recent Acquisitions of $0.3 million. Excluding the effect of the Recent Acquisitions, insurance and claims, as a percentage of revenue, increased 0.2% for the three months ended September 30, 2019 compared to the three months ended September 30, 2018.
Impairment. Impairment charges of $306.8 million were recognized in the three months ended September 30, 2019 related to goodwill, intangible assets, property and equipment and right-of-use assets recognized under ASC 842. Impairment charges for the Specialized Solutions segment totaled $193.6 million and for the Flatbed Solutions segment totaled $113.2 million.
Restructuring Costs. Restructuring costs of $6.9 million were recognized in the three months ended September 30, 2019 in connection with Project Synchronize and Project Pivot (the Plans). Restructuring costs for the Specialized Solutions segment totaled $3.5 million, for the Flatbed Solutions segment totaled $0.9 million, and for the corporate office totaled $2.5 million.
Operating Income (Loss). Operating loss was $316.6 million, or 70.3% of revenue, for the three months ended September 30, 2019 compared to operating income $13.9 million, or 3.0% of revenue, for the three months ended September 30, 2018, primarily as a result of impairment and restructuring charges. Net of these charges, operating loss was $2.9 million due to the decrease in revenue and increases in salaries and wages and maintenance expense offset by decreases in fuel and purchased freight.
The Company’s Specialized Solutions segment’s operating loss was $187.6 million, or 65.1% of revenue, for the three months ended September 30, 2019 compared to operating income $11.8 million, or 4.2% of revenue, for the three months ended September 30, 2018. The change in operating income (loss) as a percent of revenue is primarily a result of impairment and restructuring charges. Excluding these charges, operating income was $9.5 million, or 3.3% of revenue, a decrease of $2.3 million compared to the three months ended September 30, 2018 due to increases in salaries and wages, maintenance expense, purchased freight and insurance and claims.
The Company’s Flatbed Solutions segment’s operating loss was $107.9 million, or 63.5% of revenue, for the three months ended September 30, 2019 compared to operating income $12.2 million, or 6.7% of revenue, for the three months ended September 30, 2018, the decrease primarily as a result of impairment and restructuring charges. Net of these charges, operating income was $6.2 million, or 3.7% of revenue, a decrease of $6.0 million compared to the three months ended September 30, 2018 due to decreases in revenue and increases in salaries and wages, operations and maintenance, offset by a decrease in fuel and purchased freight.
Interest Expense. Interest expense consists of cash interest and amortization of debt issuance costs and fees and prepayment penalties. Interest expense increased 7.6% to $12.8 million during the three months ended September 30, 2019 from $11.9 million during the three months ended September 30, 2018. This increase was primarily attributable to higher interest rates on the Term Loan Facility and increases in equipment term loan and finance lease outstanding balances. The Company wrote off $2.0 million of deferred financing fees as a result of an unsuccessful debt refinancing during the three months ended September 30, 2019.
Income Tax. Provision for income taxes decreased from $0.7 million for the three months ended September 30, 2018 to a benefit for income taxes of $57.8 million for the three months ended September 30, 2019. The decrease is primarily the result of the tax impact of impairment charges of $52.2 million. The effective tax rate was 17.4% for the three months ended September 30, 2019, compared to 23.5% for the three months ended September 30, 2018. The effective income tax rate varies from the federal statutory rate primarily due to state income taxes and the impact of nondeductible permanent differences, including driver per diems and transaction expenses and in 2019 non-deductible goodwill impairment charges.
The following table sets forth items derived from the Company’s consolidated statements of operations and comprehensive income (loss) for the nine months ended September 30, 2019 and 2018 in dollars and as a percentage of total revenue and the increase or decrease in the dollar amounts of those items.
| | | | | | | | | | | | | | | |
| | Nine Months Ended September 30, | | | | | |
| | 2019 | | 2018 | | Increase (Decrease) |
(Dollars in millions) | | $ | | % | | $ | | % | | $ | | % |
| | | | | | | | | | | | | | | |
REVENUE: | | | | | | | | | | | | | | | |
Company freight | | $ | 618.2 | | 46.3 | | $ | 511.4 | | 43.9 | | $ | 106.8 | | 20.9 |
Owner operator freight | | | 351.1 | | 26.3 | | | 330.7 | | 28.4 | | | 20.4 | | 6.2 |
Brokerage | | | 222.8 | | 16.7 | | | 188.4 | | 16.2 | | | 34.4 | | 18.3 |
Logistics | | | 39.0 | | 2.9 | | | 31.3 | | 2.7 | | | 7.7 | | 24.6 |
Fuel surcharge | | | 102.9 | | 7.7 | | | 104.3 | | 8.9 | | | (1.4) | | (1.3) |
Total revenue | | | 1,334.0 | | 100.0 | | | 1,166.1 | | 100.0 | | | 167.9 | | 14.4 |
| | | | | | | | | | | | | | | |
OPERATING EXPENSES: | | | | | | | | | | | | | | | |
Salaries, wages and employee benefits | | | 371.1 | | 27.8 | | | 287.7 | | 24.7 | | | 83.4 | | 29.0 |
Fuel | | | 105.3 | | 7.9 | | | 103.7 | | 8.9 | | | 1.6 | | 1.5 |
Operations and maintenance | | | 164.7 | | 12.3 | | | 126.4 | | 10.8 | | | 38.3 | | 30.3 |
Communications | | | 3.2 | | 0.2 | | | 2.4 | | 0.2 | | | 0.8 | | 33.3 |
Purchased freight | | | 458.5 | | 34.4 | | | 429.9 | | 36.9 | | | 28.6 | | 6.7 |
Administrative expenses | | | 54.7 | | 4.1 | | | 41.3 | | 3.5 | | | 13.4 | | 32.4 |
Sales and marketing | | | 3.8 | | 0.3 | | | 2.3 | | 0.2 | | | 1.5 | | 65.2 |
Taxes and licenses | | | 14.7 | | 1.1 | | | 12.3 | | 1.1 | | | 2.4 | | 19.5 |
Insurance and claims | | | 38.1 | | 2.9 | | | 32.4 | | 2.8 | | | 5.7 | | 17.6 |
Acquisition-related transaction expenses | | | — | | - | | | 2.4 | | 0.2 | | | (2.4) | | (100.0) |
Depreciation and amortization | | | 119.5 | | 9.0 | | | 93.8 | | 8.0 | | | 25.7 | | 27.4 |
Gain on disposition of revenue property and equipment | | | (2.1) | | (0.2) | | | (1.5) | | (0.1) | | | (0.6) | | 40.0 |
Impairment | | | 306.8 | | 23.0 | | | 2.8 | | 0.2 | | | 304.0 | | 10,857.1 |
Restructuring charges | | | 6.9 | | 0.5 | | | — | | - | | | 6.9 | | * |
Total operating expenses | | | 1,645.2 | | 123.3 | | | 1,135.9 | | 97.4 | | | 509.3 | | 44.8 |
Operating ratio | | | 123.3% | | | | | 97.4% | | | | | | | |
Adjusted operating ratio(1) | | | 97.0% | | | | | 94.5% | | | | | | | |
INCOME (LOSS) FROM OPERATIONS | | | (311.2) | | (23.3) | | | 30.2 | | 2.6 | | | (341.4) | | (1,130.5) |
| | | | | | | | | | | | | | | |
Other expense (income): | | | | | | | | | | | | | | | |
Interest income | | | (0.7) | | (0.1) | | | (1.2) | | (0.1) | | | 0.5 | | (41.7) |
Interest expense | | | 38.2 | | 2.9 | | | 33.2 | | 2.8 | | | 5.0 | | 15.1 |
Write-off of unamortized deferred financing fees | | | 2.0 | | 0.1 | | | — | | - | | | 2.0 | | * |
Other | | | (1.3) | | (0.1) | | | (2.5) | | (0.2) | | | 1.2 | | (48.0) |
Total other expense | | | 38.2 | | 2.9 | | | 29.5 | | 2.5 | | | 8.7 | | 29.5 |
| | | | | | | | | | | | | | | |
Income (loss) before benefit for income taxes | | | (349.4) | | (26.2) | | | 0.7 | | 0.1 | | | (350.1) | | (50,014.3) |
Benefit for income taxes | | | (60.4) | | (4.5) | | | (14.2) | | (1.2) | | | (46.2) | | 325.4 |
Net income (loss) | | $ | (289.0) | | (21.7) | | $ | 14.9 | | 1.3 | | $ | (303.9) | | (2,039.6) |
| | | | | | | | | | | | | | | |
OPERATING STATISTICS: | | | | | | | | | | | | | | | |
Total miles (in millions)(2)(3) | | | 365.1 | | | | | 343.7 | | | | | 21.4 | | 6.2 |
Company-operated tractors, at period-end | | | 3,736 | | | | | 3,799 | | | | | (63) | | (1.7) |
Owner-operated tractors, at period-end | | | 2,413 | | | | | 2,314 | | | | | 99 | | 4.3 |
Number of trailers, at period-end | | | 13,208 | | | | | 13,897 | | | | | (689) | | (5.0) |
| | | | | | | | | | | | | | | |
Company-operated tractors, average for the period | | | 3,816 | | | | | 3,324 | | | | | 492 | | 14.8 |
Owner-operated tractors, average for the period | | | 2,339 | | | | | 2,142 | | | | | 197 | | 9.2 |
Total tractors, average for the period | | | 6,155 | | | | | 5,466 | | | | | 689 | | 12.6 |
*indicates not meaningful.
| (1) | | Adjusted Operating Ratio is not a recognized measure under GAAP. For a definition of Adjusted Operating Ratio and reconciliation of Adjusted Operating Ratio to operating ratio, see “Non-GAAP Financial Measures” below. |
| (2) | | Total miles includes company and owner operator and excludes brokerage. |
| (3) | | Miles are estimated based on information received as the date of filing. Miles may change quarter to quarter when final information is received from each operating segment. |
The following table sets forth the Company’s Specialized Solutions segment’s revenue, operating expenses, operating ratio, Adjusted Operating Ratio and operating income for the nine months ended September 30, 2019 and 2018 in dollars and as a percentage of its Specialized Solutions segment’s total revenue and the increase or decrease in the dollar amounts of those items. The following table also sets forth certain operating statistics for the Company’s Specialized Solutions segment for the nine months ended September 30, 2019 and 2018.
| | | | | | | | | | | | | | | |
| | Nine Months Ended September 30, | | | | | |
| | 2019 | | 2018 | | Increase (Decrease) |
(Dollars in millions) | | $ | | % | | $ | | % | | $ | | % |
| | | | | | | | | | | | | | | |
REVENUE(1): | | | | | | | | | | | | | | | |
Company freight | | $ | 463.8 | | 55.3 | | $ | 370.0 | | 53.8 | | $ | 93.8 | | 25.4 |
Owner operator freight | | | 142.4 | | 17.0 | | | 126.7 | | 18.4 | | | 15.7 | | 12.4 |
Brokerage | | | 148.3 | | 17.7 | | | 112.8 | | 16.4 | | | 35.5 | | 31.5 |
Logistics | | | 37.1 | | 4.4 | | | 29.1 | | 4.2 | | | 8.0 | | 27.5 |
Fuel surcharge | | | 46.7 | | 5.5 | | | 48.5 | | 7.2 | | | (1.8) | | (3.7) |
Total revenue | | | 838.3 | | 100.0 | | | 687.1 | | 100.0 | | | 151.2 | | 22.0 |
| | | | | | | | | | | | | | | |
OPERATING EXPENSES(1): | | | | | | | | | | | | | | | |
Salaries, wages and employee benefits | | | 246.4 | | 29.4 | | | 197.5 | | 28.7 | | | 48.9 | | 24.8 |
Fuel | | | 67.5 | | 8.1 | | | 66.7 | | 9.7 | | | 0.8 | | 1.2 |
Operations and maintenance | | | 123.6 | | 14.7 | | | 91.6 | | 13.3 | | | 32.0 | | 34.9 |
Purchased freight | | | 237.8 | | 28.4 | | | 192.1 | | 28.0 | | | 45.7 | | 23.8 |
Depreciation and amortization | | | 76.4 | | 9.1 | | | 67.9 | | 9.9 | | | 8.5 | | 12.5 |
Impairment | | | 193.6 | | 67.2 | | | 2.8 | | 0.4 | | | 190.8 | | 6,814.3 |
Restructuring | | | 3.5 | | 1.2 | | | — | | - | | | 3.5 | | * |
Other operating expenses | | | 58.3 | | 7.0 | | | 44.4 | | 6.5 | | | 13.9 | | 31.3 |
Total operating expenses | | | 1,007.1 | | 120.1 | | | 663.0 | | 96.5 | | | 344.1 | | 51.9 |
Operating ratio | | | 120.1% | | | | | 96.5% | | | | | | | |
Adjusted operating ratio(2) | | | 93.6% | | | | | 92.7% | | | | | | | |
INCOME (LOSS) FROM OPERATIONS | | $ | (168.8) | | (20.1) | | $ | 24.1 | | 3.5 | | $ | (192.9) | | (800.4) |
| | | | | | | | | | | | | | | |
OPERATING STATISTICS: | | | | | | | | | | | | | | | |
Total miles (in millions)(3)(4) | | | 169.1 | | | | | 163.3 | | | | | 5.8 | | 3.6 |
Company-operated tractors, at period-end | | | 2,472 | | | | | 2,436 | | | | | 36 | | 1.5 |
Owner-operated tractors, at period-end | | | 699 | | | | | 678 | | | | | 21 | | 3.1 |
Number of trailers, at period-end | | | 8,280 | | | | | 8,724 | | | | | (444) | | (5.1) |
| | | | | | | | | | | | | | | |
Company-operated tractors, average for the period | | | 2,492 | | | | | 2,173 | | | | | 319 | | 14.7 |
Owner-operated tractors, average for the period | | | 674 | | | | | 618 | | | | | 56 | | 9.1 |
Total tractors, average for the period | | | 3,166 | | | | | 2,791 | | | | | 375 | | |
*indicates not meaningful.
| (1) | | Includes intersegment revenues and expenses, as applicable, which are eliminated in the Company’s consolidated results. |
| (2) | | Adjusted Operating Ratio is not a recognized measure under GAAP. For a definition of Adjusted Operating Ratio and reconciliation of Adjusted Operating Ratio to operating ratio, see “Non-GAAP Financial Measures” below. |
| (3) | | Total miles includes company and owner operator and excludes brokerage. |
| (4) | | Miles are estimated based on information received as the date of filing. Miles may change quarter to quarter when final information is received from each operating segment. |
The following table sets forth the Company’s Flatbed Solutions segment’s revenue, operating expenses, operating ratio, Adjusted Operating Ratio and operating income for the nine months ended September 30, 2019 and 2018 in dollars and as a percentage of its Flatbed Solutions segment’s total revenue and the increase or decrease in the dollar amounts of those items. The following table also sets forth certain operating statistics for the Company’s Flatbed Solutions segment for the nine months ended September 30, 2019 and 2018.
| | | | | | | | | | | | | | | |
| | Nine Months Ended September 30, | | | | | |
| | 2019 | | 2018 | | Increase (Decrease) |
(Dollars in millions) | | $ | | % | | $ | | % | | $ | | % |
| | | | | | | | | | | | | | | |
REVENUE(1): | | | | | | | | | | | | | | | |
Company freight | | $ | 165.3 | | 32.2 | | $ | 147.8 | | 30.2 | | $ | 17.5 | | 11.8 |
Owner operator freight | | | 213.1 | | 41.6 | | | 205.9 | | 42.1 | | | 7.2 | | 3.5 |
Brokerage | | | 74.7 | | 14.6 | | | 76.0 | | 15.6 | | | (1.3) | | (1.7) |
Logistics | | | 2.0 | | 0.4 | | | 2.2 | | 0.5 | | | (0.2) | | (9.1) |
Fuel surcharge | | | 57.6 | | 11.2 | | | 56.8 | | 11.6 | | | 0.8 | | 1.4 |
Total revenue | | | 512.7 | | 100.0 | | | 488.7 | | 100.0 | | | 24.0 | | 4.9 |
| | | | | | | | | | | | | | | |
OPERATING EXPENSES(1): | | | | | | | | | | | | | | | |
Salaries, wages and employee benefits | | | 104.4 | | 20.4 | | | 86.9 | | 17.8 | | | 17.5 | | 20.1 |
Fuel | | | 37.8 | | 7.4 | | | 36.9 | | 7.6 | | | 0.9 | | 2.4 |
Operations and maintenance | | | 40.5 | | 7.9 | | | 34.4 | | 7.0 | | | 6.1 | | 17.7 |
Purchased freight | | | 237.8 | | 46.4 | | | 247.6 | | 50.7 | | | (9.8) | | (4.0) |
Depreciation and amortization | | | 42.6 | | 8.3 | | | 25.8 | | 5.3 | | | 16.8 | | 65.1 |
Impairment | | | 113.2 | | 22.1 | | | — | | - | | | 113.2 | | * |
Restructuring | | | 0.9 | | 0.2 | | | — | | - | | | 0.9 | | * |
Other operating expenses | | | 34.0 | | 6.6 | | | 28.6 | | 5.9 | | | 5.4 | | 18.9 |
Total operating expenses | | | 611.2 | | 119.2 | | | 460.2 | | 94.2 | | | 151.0 | | 32.8 |
Operating ratio | | | 119.2% | | | | | 94.2% | | | | | | | |
Adjusted operating ratio(2) | | | 95.7% | | | | | 93.1% | | | | | | | |
INCOME (LOSS) FROM OPERATIONS | | $ | (98.5) | | (19.2) | | $ | 28.5 | | 5.8 | | $ | (127.0) | | (445.6) |
| | | | | | | | | | | | | | | |
OPERATING STATISTICS: | | | | | | | | | | | | | | | |
Total miles (in millions)(3)(4) | | | 196.0 | | | | | 180.4 | | | | | 15.6 | | 8.6 |
Company-operated tractors, at period-end | | | 1,264 | | | | | 1,363 | | | | | (99) | | (7.3) |
Owner-operated tractors, at period-end | | | 1,714 | | | | | 1,636 | | | | | 78 | | 4.8 |
Number of trailers, at period-end | | | 4,928 | | | | | 5,173 | | | | | (245) | | (4.7) |
| | | | | | | | | | | | | | | |
Company-operated tractors, average for the period | | | 1,324 | | | | | 1,151 | | | | | 173 | | 15.0 |
Owner-operated tractors, average for the period | | | 1,665 | | | | | 1,524 | | | | | 141 | | 9.3 |
Total tractors, average for the period | | | 2,989 | | | | | 2,675 | | | | | 314 | | 11.7 |
*indicates not meaningful.
| (1) | | Includes intersegment revenues and expenses, as applicable, which are eliminated in the Company’s consolidated results. |
| (2) | | Adjusted Operating Ratio is not a recognized measure under GAAP. For a definition of Adjusted Operating Ratio and reconciliation of Adjusted Operating Ratio to operating ratio, see “Non-GAAP Financial Measures” below. |
| (3) | | Total miles includes company and owner operator and excludes brokerage. |
| (4) | | Miles are estimated based on information received as the date of filing. Miles may change quarter to quarter when final information is received from each operating segment. |
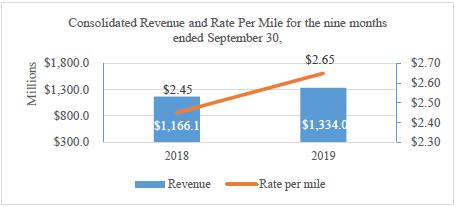
Revenue. Total revenue increased 14.4% to $1,334.0 million for the nine months ended September 30, 2019 from $1,166.1 million for the nine months ended September 30, 2018, primarily due to the Recent Acquisitions of $153.7 million. The increase in total revenue, excluding the effect of the Recent Acquisitions, was an increase of $14.2 million, or 1.2%, due primarily to increases in company freight, owner operator freight and brokerage revenue. Company freight revenue, excluding the effect of the Recent Acquisitions of $106.7 million, increased $0.1 million from $511.4 million for the nine months ended September 30, 2018 to $511.5 million for the nine months ended September 30, 2019. Owner operator freight revenue, excluding the effect of the Recent Acquisitions of $15.1 million, increased $5.2 million, or 1.6%, from $330.7 million for the nine months ended September 30, 2018 to $335.9 million for the nine months ended September 30, 2019. Brokerage revenue, excluding the effect of the Recent Acquisitions of $24.4 million, increased $10.0 million, or 5.3%, from $188.4 million for the nine months ended September 30, 2018 to $198.4 million for the nine months ended September 30, 2019, as a result of the growth in our brokerage operations. The increases in company freight and owner operator freight revenue, excluding the Recent Acquisitions, were primarily a result of a 3.9% increase in rate per mile and an increase in wind and oil energy projects, offset by a decrease of 3.1% in total miles. Logistics, excluding the effect of the Recent Acquisitions of $0.9 million, increased $6.8 million, or 21.9%, from $31.3 million for the nine months ended September 30, 2018 to $38.1 million for the nine months ended September 30, 2019 as a result of increases in logistics activities. Fuel surcharges, excluding the effect of the Recent Acquisitions of $6.5 million, decreased $7.9 million, or 7.5%, from $104.3 million for the nine months ended September 30, 2018 to $96.4 million for the nine months ended September 30, 2019.
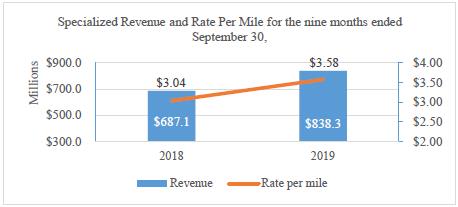
The Company’s Specialized Solutions segment’s revenue was $838.3 million for the nine months ended September 30, 2019 as compared to $687.1 million for the nine months ended September 30, 2018, an increase of 22.0%, which was primarily due to the Specialized Solutions Acquisitions. The increase in revenue, excluding the effect of the Specialized Solutions Acquisitions of $103.9 million, was an increase of $47.3 million, or 6.9%, primarily due to increases in company freight, owner operator freight, and brokerage revenue. Company freight revenue, excluding the effect of the Specialized Solutions Acquisitions of $71.2 million, increased $22.6 million, or 6.1%, from $370.0 million for the nine months ended September 30, 2018 to $392.6 million for the nine months ended September 30, 2019. Owner operator freight revenue, excluding the effect of the Specialized Solutions Acquisitions of $10.7 million, increased $5.0 million, or 3.9%, from $126.7 million for the nine months ended September 30, 2018 to $131.7 million for the nine months ended September 30, 2019. Brokerage revenue, excluding the effect of the Specialized Solutions Acquisitions of $20.2 million, increased $15.2 million, or 13.4%, from $112.8 million for the nine months ended September 30, 2018 to $128.0 million for the nine months ended September 30, 2019. The increases in company freight and owner operator freight revenue, excluding the effect of the Specialized Solutions Acquisitions, were a result of a 7.2% increase in rate per mile and an increase in wind and oil energy projects compared to the same period in 2018, offset by a 1.5% decrease of total miles. Logistics, excluding the effect of the Specialized Solutions Acquisition of $0.9 million, increased 24.2% compared to the same period in 2018 as a result of increases in logistics activities. Fuel surcharges, excluding the effect of the Specialized Solutions Acquisitions of $0.8 million, decreased 5.2% compared to the same period in 2018.
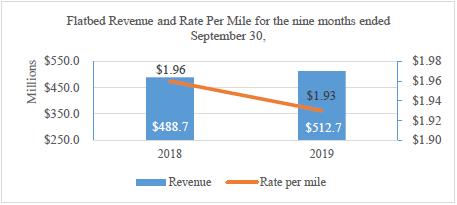
The Company’s Flatbed Solutions segment’s revenue was $512.7 million for the nine months ended September 30, 2019 as compared to $488.7 million for the nine months ended September 30, 2018, an increase of 4.9%, which was primarily the result of the Flatbed Solutions Acquisitions of $50.2 million. Revenue excluding the effect of the Flatbed Solutions Acquisitions decreased 5.3%, or $25.8 million, due to decreases in company freight revenue. Company freight revenue, excluding the effect of the Flatbed Solutions Acquisitions of $35.5 million, decreased $17.9 million, or 12.1%, from $147.8 million for the nine months ended September 30, 2018 to $129.8 million for the nine months ended September 30, 2019 due to a 16.8% decrease in company miles and offset by a 0.3% increase in rate per mile. Owner operator freight revenue, excluding the effect of the Flatbed Solutions Acquisitions of $4.4 million, increased $2.7 million, or 1.3%, from $205.9 million for the nine months ended September 30, 2018 to $208.7 million for the nine months ended September 30, 2019. The increases in owner-operator freight, excluding the effect of the Flatbed Solutions Acquisitions, was a result of a 4.0% increase in miles compared to the same period in 2018. Brokerage revenue, excluding the effect of the Flatbed Solutions Acquisitions of $4.1 million, decreased $5.4 million, or 7.1%, from $76.0 million for the nine months ended September 30, 2018 to $70.6 million for the nine months ended September 30, 2019. Fuel surcharges, excluding the effect of the Flatbed Solutions Acquisitions of $5.7 million, decreased $4.9 million, or 8.7%, from $56.8 million for the nine months ended September 30, 2018 to $51.8 million for the nine months ended September 30, 2019.
Salaries, Wages and Employee Benefits. Salaries, wages and employee benefits expense, which consists of compensation for all employees, is primarily affected by the number of miles driven by Company drivers, the rate per mile paid to Company drivers, employee benefits including, but not limited to, health care and workers’ compensation, and to a lesser extent, the number of, and compensation and benefits paid to, non-driver employees. In general, the Specialized Solutions segment drivers receive a higher driver pay per total mile than Flatbed Solutions segment drivers due to the former requiring a higher level of training and expertise. Driver pay rate increases implemented during the second half of 2018 to address the general driver shortage are reflected in results for the current period. The Company does not expect further driver pay rate increases given the current market and downward rate pressures.
Salaries, wages and employee benefits expense increased 29.0% to $371.1 million for the nine months ended September 30, 2019 from $287.7 million for the nine months ended September 30, 2018, primarily due to the Recent Acquisitions. The increase in salaries, wages and employee benefits expense, excluding the effect of the Recent Acquisitions of $55.1 million, was 9.8%, or $28.2 million, and was primarily due to increased employee compensation due to an increase in headcount at the corporate office to support the scale and strategic growth of the Company, increases in healthcare costs and one-time severance costs related to Project Pivot. Excluding the effect of the Recent Acquisitions, salaries, wages and employee benefits expense, as a percentage of consolidated revenue (excluding brokerage revenue), increased 2.7% for the nine months ended September 30, 2019 as compared to the same period in 2018.
The Company’s Specialized Solutions segment had a $48.9 million, or 24.8%, increase in salaries, wages and employee benefits expense for the nine months ended September 30, 2019 compared to the nine months ended September 30, 2018, primarily as a result of the Specialized Solutions Acquisitions of $34.8 million. The increase, excluding the effect of the Specialized Solutions Acquisitions, was 7.1%, or $14.1 million, and was primarily due to increased employee compensation, due to an increase in the number of Company drivers and higher driver pay rates implemented in the second half of 2018, and an increase in healthcare costs, as discussed above. Excluding the effect of the Specialized Solutions Acquisitions, salaries, wages and employee benefits expense, as a percentage of Specialized Solutions revenue (excluding brokerage revenue), increased 0.5% for the nine months ended September 30, 2019 as compared to the same period in 2018.
The Company’s Flatbed Solutions segment had a $17.5 million, or 20.1%, increase in salaries, wages and employee benefits expense for the nine months ended September 30, 2019 compared to the nine months ended September 30, 2018, primarily as a result of the Flatbed Solutions Acquisitions, which resulted in a $20.3 million increase. Excluding the effect of the Flatbed Solutions Acquisitions, salaries, wages and employee benefit expense decreased 3.3%, or $2.8 million for the nine months ended September 30, 2019 as compared to the nine months ended September 30, 2018. Excluding the effect of the Flatbed Solutions Acquisitions, salaries, wages and employee benefits expense, as a percentage of Flatbed Solutions revenue (excluding brokerage revenue), increased 0.4% for the nine months ended September 30, 2019 as compared to the same period in 2018. This increase is a result of higher driver pay rates implemented in the second half of 2018.
Fuel. Fuel expense consists primarily of diesel fuel expense for company-owned tractors and fuel taxes. The primary factors affecting fuel expense are the cost of diesel fuel, the miles per gallon realized with company equipment and the number of miles driven by Company drivers.
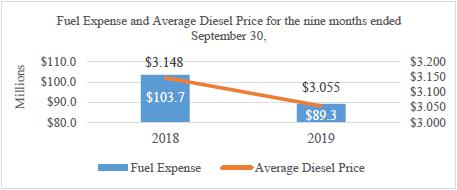
*Fuel expense excludes the effect of the Recent Acquisitions.
Total fuel expense increased $1.6 million, or 1.5%, to $105.3 million for the nine months ended September 30, 2019 from $103.7 million for the nine months ended September 30, 2018. This increase was primarily a result of the Recent Acquisitions of $16.0 million. Excluding the effect of the Recent Acquisitions, fuel expense decreased 13.8%, or $14.3 million. The U.S. national average diesel fuel price, as published by the U.S. Department of Energy, was $3.055 for the nine months ended September 30, 2019, compared to $3.148 for the same period in 2018, a 3% decrease. Company miles driven, excluding the Recent Acquisitions, decreased 7.3% for the nine months ended September 30, 2019 as compared to the nine months ended September 30, 2018.
The Company’s Specialized Solutions segment’s fuel expense increased 1.2% to $67.5 million for the nine months ended September 30, 2019 from $66.7 million for the nine months ended September 30, 2018, primarily as the result of the Specialized Solutions Acquisitions of $8.2 million. Excluding the effect of the Specialized Solutions Acquisitions, fuel expense in the Specialized Solutions segment decreased 11.1% to $59.3 million as a result of a decrease in average diesel fuel prices and a decrease of 1.6% in company miles for the nine months ended September 30, 2019 as compared to the nine months ended September 30, 2018.
The Company’s Flatbed Solutions segment’s fuel expense increased 2.4% to $37.8 million for the nine months ended September 30, 2019 from $36.9 million for the nine months ended September 30, 2018, primarily as a result of the Flatbed Solutions Acquisitions of $7.8 million. Excluding the effect of the Flatbed Solutions Acquisitions, fuel expense in the Flatbed Solutions segment decreased 18.7% or $6.9 million. Company miles, excluding the Flatbed Solutions Acquisitions, decreased 16.8% for the nine months ended September 30, 2019 as compared to the nine months ended September 30, 2018.
Operations and Maintenance. Operations and maintenance expense consists primarily of ordinary vehicle repairs and maintenance, costs associated with preparing tractors and trailers for sale or trade-in, driver recruiting, training and safety costs, permitting and pilot car fees and other general operations expenses. Operations and maintenance expense is primarily affected by the age of company-owned tractors and trailers, the number of miles driven in a period and driver turnover.
Operations and maintenance expense increased 30.3% to $164.7 million for the nine months ended September 30, 2019 from $126.4 million for the nine months ended September 30, 2018, primarily as a result of the Recent Acquisitions of $20.6 million. After adjusting for the effect of the Recent Acquisitions, operations and maintenance expense increased 14.0% for the nine months ended September 30, 2019 as compared to the nine months ended September 30, 2018. Excluding the effect of the Recent Acquisitions, operations and maintenance expense, as a percentage of consolidated revenue (excluding brokerage revenue), increased 1.7% for the nine months ended September 30, 2019 as compared to the same period in 2018 as a result of pilot car fees and normal equipment trade cycles and related expenses.
The Company’s Specialized Solutions segment’s operations and maintenance expense increased $32.0 million, or 34.9%, for the nine months ended September 30, 2019 as compared to the nine months ended September 30, 2018, as a result of the Specialized Solutions Acquisitions of $15.1 million. Excluding the effect of the Specialized Solutions Acquisitions, operations and maintenance expense increased $16.9 million, or 18.4%, for the nine months ended September 30, 2019 as compared to the nine months ended September 30, 2018, primarily as a result of increased pilot car and permit expenses and an increase in maintenance expense, due to normal replacement cycles of tractors and trailers. Excluding the effect of the Specialized Solutions Acquisitions, operations and maintenance expense, as a percentage of Specialized Solutions revenue (excluding brokerage revenue), increased 1.9% for the nine months ended September 30, 2019 as compared to the same period in 2018.
The Company’s Flatbed Solutions segment’s operations and maintenance expense increased $0.9$6.1 million, or 10.0%17.7%, for the threenine months ended September 30, 20172019 as compared to the threenine months ended September 30, 2016, primarily from increased maintenance and tire costs.
The Company’s Specialized Solutions segment’s operations and maintenance expense increased $6.3 million, or 33.0%, for the three months ended September 30, 2017 as compared to the three months ended September 30, 2016,2018, primarily as a result of the Recent Acquisitions.Flatbed Solutions Acquisitions of $5.4 million. Excluding the effect of the RecentFlatbed Solutions Acquisitions, operations and maintenance expense was relatively flatincreased $0.7 million, or 2.1%, for the threenine months ended September 30, 20172019 as compared to the threenine months ended September 30, 2016.2018, primarily as a result of an increase in maintenance expense, due to normal replacement cycles of tractors and trailers. Excluding the effect of the Flatbed Solutions Acquisitions, operations and maintenance expense, as a percentage of Flatbed Solutions revenue (excluding brokerage revenue), increased 0.6% for the nine months ended September 30, 2019 as compared to the same period in 2018.
Purchased Freight. Purchased freight expense consists of the payments to owner-operators, including fuel surcharge reimbursements, and payments to third-party capacity providers that haul loads brokered to them. Purchased freight expense generally takes into account changes in diesel fuel prices, resulting in lower payments during periods of declining fuel prices.
Total purchased freight expense increased 44.8%6.7% from $42.5$429.9 million during the threenine months ended September 30, 20162018 to $61.6$458.5 million during the threenine months ended September 30, 2017,2019, primarily as a result of the Recent Acquisitions.Acquisitions of $34.7 million. Excluding the effect of the Recent Acquisitions on purchased freight expense, total purchased freight expense increased 9.5%decreased 1.5% to $46.6$423.7 million for the threenine months ended September 30, 2017.2019. Purchased freight expense from owner-operators, excluding the Recent Acquisitions, increased 13.1%0.2% from $23.0$272.7 million during the threenine months ended September 30, 20162018 to $26.0$273.2 million during the threenine months ended September 30, 2017,2019, primarily as a result of increases in fuel surcharge reimbursements made to owner-operators as a result of higher fuel prices. Purchased freight expense from third-party capacity providers, excluding the Recent Acquisitions, increased 6.3% from $18.9 million during the three months ended September 30, 2016 to $20.0 million during the three months ended September 30, 2017, primarily as a result of the increase in rates on brokered loads.
The Company’s Flatbed Solutions segment’s purchased freight expense increased 21.7% to $24.5 million for the three months ended September 30, 2017 from $20.2 million for the three months ended September 30, 2016, primarily due to higher utilization of owner-operators and third party capacity providers in the Company’s Flatbed Solutions segment. Purchased freight expense from owner-operators increased 15.8% to $17.3 million for the three months ended September 30, 2017 from $14.9 million for the three months ended September 30, 2016 due to an increase in owner-operator loads. Purchased freight expense from third-party capacity providers increased 43.8% from $4.7 million during the three months ended September 30, 2016 to $6.7 million during the three months ended September 30, 2017, primarily as a resultutilization of the increase in brokered loads in the Company’s Flatbed Solutions segment.
The Company’s Specialized Solutions segment’s purchased freight expense increased 64.2% to $39.0 million during the three months ended September 30, 2017 from $23.7 million during the three months ended September 30, 2016, primarily as a result of the Recent Acquisitions. Excluding the effect of the Recent Acquisitions on purchased freight expense, total purchased freight expense increased 1.0% to $24.0 million for the three months ended September 30, 2017. Purchased freight expense from owner-operators, excluding the Recent Acquisitions, increased 8.1% to $8.8 million for the three months ended September 30, 2017 from $8.1 million for the three months ended September 30, 2016.owner operators. Purchased freight expense from third-party capacity providers, excluding the Recent Acquisitions, decreased 6.1%5.9% from $14.2$140.6 million during the threenine months ended September 30, 20162018 to $13.3$132.2 million during the threenine months ended September 30, 2017,2019, primarily as a result of decreased utilization of third-party capacity providers. Excluding the effect of the Recent Acquisitions, purchased freight expense, as a percentage of consolidated revenue, decreased 1.0% for the nine months ended September 30, 2019 as compared to the same period in 2018.
The Company’s Specialized Solutions segment’s purchased freight expense increased 23.8% to $237.8 million during the nine months ended September 30, 2019 from $192.1 million during the nine months ended September 30, 2018, primarily as a result of the Specialized Solutions Acquisitions of $27.9 million. Excluding the effect of the Specialized Solutions Acquisitions on purchased freight expense, total purchased freight expense increased 9.2% to $209.9 million for the nine months ended September 30, 2019. Purchased freight expense from owner-operators, excluding the Specialized Solutions Acquisitions, increased 2.9% from $95.9 million during the nine months ended September 30, 2018 to $98.6 million during the nine months ended September 30, 2019, primarily as a result of an increase in the utilization of owner operators. Purchased freight expense from third-party capacity providers, excluding the Specialized Solutions Acquisitions, increased 3.3% from $84.1 million during the nine months ended September 30, 2018 to $86.8 million during the nine months ended September 30, 2019, primarily as a result of higher rates and increased utilization of company driversthird-party capacity providers. Excluding the effect of the Specialized Solutions Acquisitions, purchased freight expense, as a percentage of Specialized Solutions revenue, increased 0.6% for the nine months ended September 30, 2019 as compared to the same period in 2018.
The Company’s Flatbed Solutions segment’s purchased freight expense decreased 4.0% to $237.8 million for the nine months ended September 30, 2019 from $247.6 million for the nine months ended September 30, 2018. Excluding the effect of the Flatbed Solutions Acquisition purchased freight expense of $6.8 million, the Company’s Flatbed Solutions segment’s purchased freight expense decreased 6.7% to $230.9 million for the nine months ended September 30, 2019 as compared to the nine months ended September 30, 2018. Purchased freight expense from owner-operators, excluding the Flatbed Solutions Acquisitions, decreased 2.8% to $174.5 million for the nine months ended September 30, 2019 from $179.6 million for the nine months ended September 30, 2018. Purchased freight expense from third-party capacity providers, excluding the Flatbed Solutions Acquisitions, decreased 3.6% from $56.4 million during the quarter.nine months ended September 30, 2018 to $54.4 million during the nine months ended September 30, 2019, primarily as a result of decreased utilization of third-party capacity providers. Excluding the effect of the Flatbed Solutions Acquisitions, purchased freight expense, as a percentage of Flatbed Solutions revenue, decreased 0.8% for the nine months ended September 30, 2019 as compared to the same period in 2018.
Depreciation and Amortization. Depreciation and amortization expense consists primarily of depreciation for company-owned tractors and trailers orand amortization of those financed with capitalfinance leases. The primary factors affecting these expense items include the size and age of company-owned tractors and trailers and the cost of new equipment. Amortization of intangible assets is also included in this expense.
Depreciation and amortization expense increased 16.5%27.4% to $19.8$119.5 million during the threenine months ended September 30, 20172019 from $17.0$93.8 million during the threenine months ended September 30, 2016,2018, primarily as a result of the Recent Acquisitions.Acquisitions of $19.5 million. Amortization of intangible assets and net impact of step-up in basis of acquired assets impact on expense was $12.4 million and $18.2 million, respectively. After adjusting for the effect of the Recent Acquisitions, depreciation and amortization expense decreased 7.0%, primarily as a result of a 1.2% reduction in company-owned tractors, excluding company-owned tractors of the Recent Acquisitions, combined with an increasing shift in utilization of operating leases to finance capital expenditures.
The Company’s Flatbed Solutions segment had a 6.5% decrease in depreciation and amortization expense for the three months ended September 30, 2017 as compared to the three months ended September 30, 2016 primarily as a result of a 1.5% reduction in company-owned tractors.
The Company’s Specialized Solutions segment had a 35.6% increase in depreciation and amortization expense for the three months ended September 30, 2017 as compared to the three months ended September 30, 2016 primarilyincreased $6.3 million as a result of the Recent Acquisitions. After adjustingimpact of adoption of ASC 842 which resulted in the recognition of $16.4 million of depreciation expense on assets available for lease and leased to owner-operators, offset by the impact of a reduction of approximately 60 tractors for the effect ofnine months ended September 30, 2019 as compared to the Recent Acquisitions, depreciation and amortization expense decreased 7.4%, primarily as a result of a 0.9% reduction in company-owned tractors, excluding company-owned tractors of the Recent Acquisitions, combined with an increasing shift in utilization of operating leases to finance capital expenditures.nine months ended September 30, 2018.
The Company’s Specialized Solutions segment’s depreciation and amortization expense increased 12.5% to $76.4 million for the nine months ended September 30, 2019 as compared to $67.9 million for the nine months ended September 30, 2018 primarily as a result of the Specialized Solutions Acquisitions. Amortization of intangible assets and net impact of step-up in basis of acquired assets impact on expense was $7.9 million and $16.6 million, respectively. After adjusting for the effect of the Specialized Solutions Acquisitions of $14.8 million, depreciation and amortization expense decreased $6.3 million as a result of a decrease in approximately 440 trailers, offset by $1.8 million of depreciation expense recognized on assets available for lease and leased to owner-operators due to the impact of the adoption of ASC 842 on assets available for lease and leased to owner-operators for the nine months ended September 30, 2019 as compared to the nine months ended September 30, 2018.
The Company’s Flatbed Solutions segment’s depreciation and amortization expense increased 65.1% to $42.6 million for the nine months ended September 30, 2019 as compared to $25.8 million for the nine months ended September 30, 2018. Amortization of intangible assets and net impact of step-up in basis of acquired assets impact on expense was $4.5 million and $1.6 million, respectively. Excluding the Flatbed Solutions Acquisitions of $4.7 million, depreciation and amortization expense increased $12.1 million as a result of the impact of adoption of ASC 842 which resulted in the recognition of $14.6 million of depreciation expense on assets available for lease and leased to owner-operators, offset by the impact of a reduction of approximately 100 tractors in the segment’s fleet for the nine months ended September 30, 2019 as compared to the nine months ended September 30, 2018.
Taxes and Licenses. Operating taxes and licenses expense primarily represents the costs of taxes and licenses associated with the Company’s fleet of equipment and will vary according to the size of its equipment fleet. Taxes and license expense increased from $2.3$12.3 million for the threenine months ended September 30, 20162018 to $3.0$14.7 million for the threenine months ended September 30, 2017.2019. Excluding the effect of the Recent Acquisitions of $2.5 million, operating taxes and license expense, as a percentage of revenue was 1.2%relatively flat for the threenine months ended September 30, 2017 and 1.3% for2019 as compared to the threenine months ended September 30, 2016.2018.
Insurance and Claims. Insurance and claims expense consists of insurance premiums and the accruals the Company makes for estimated payments and expenses for claims for bodily injury, property damage, cargo damage and other casualty events. The primary factorsfactor affecting the Company’s insurance and claims expense areis seasonality (the Company typically experiences higher accident frequency in winter months), the frequency and severity of accidents, trends in the development factors used in its accruals and developments in large, prior-year claims. The frequency of accidents tends to increase with the miles the Company travels. Insurance and claims expense increased 25.4%17.6% to $6.3$38.1 million during the threenine months ended September 30, 20172019 from $5.1$32.4 million during the threenine months ended September 30, 2016, primarily2018, partially as a result of the Recent Acquisitions.Acquisitions of $3.1 million. Excluding the effect of the Recent Acquisitions, insurance and claims, as a percentage of revenue, was 2.8%increased 0.3% for the nine months ended September 30, 2018 compared to the nine months ended September 30, 2019 due to increases in claims accruals and liability premiums.
Impairment. Impairment charges of $306.8 million were recognized in the nine months ended September 30, 2019 related to goodwill, intangible assets, property and equipment and right-of-use assets recognized under ASC 842. Impairment charges for the Specialized Solutions segment totaled $193.6 million and for the Flatbed Solutions segment totaled $113.2 million.
Restructuring Costs. Restructuring costs of $6.9 million were recognized in the three months ended September 30, 20172019 in connection with Project Synchronize and 2.9%Project Pivot (the Plans). Restructuring costs for the threeSpecialized Solutions segment totaled $3.5 million, for the Flatbed Solutions segment totaled $0.9 million and for the corporate office totaled $2.5 million.
Operating Income (Loss). Operating loss was $311.2 million, or 23.3% of revenue, for the nine months ended September 30, 2016.2019 compared to operating income $30.2 million, or 2.6% of revenue, for the nine months ended September 30, 2018, the decrease primarily a result of impairment and restructuring charges. Excluding these charges operating income was $2.5 million or 0.2% of revenue, a decrease of $27.7 million compared to the nine months ended September 30, 2018, primarily due to increases in owner operator freight and brokerage revenue which produces lower margins than company freight and increases in salaries and wages, fuel expense, operations and maintenance expense and depreciation and amortization as discussed above.
The Company’s Specialized Solutions segment’s operating loss was $168.8 million, or 20.1% of revenue, for the nine months ended September 30, 2019 compared to operating income of $24.1 million, or 3.5% of revenue, for the nine months ended September 30, 2018, primarily due to impairment and restructuring charges. Net of these charges, operating income was $28.3 million, or 3.4% of revenue, an increase of $4.2 million compared to the nine months ended September 30, 2018. The increase is due to an increase in the segment’s company freight and owner operator freight due to an increase in rate per mile and an increase in wind and oil energy projects and brokerage and logistics revenue, offset by the resulting increase in salaries and wages, fuel expense, maintenance expense, services purchased from owner-operators and third-party capacity providers and depreciation and amortization.
The Company’s Flatbed Solutions segment’s operating loss was $98.5 million, or 19.2% of revenue, for the nine months ended September 30, 2019 compared to operating income of $28.5 million, or 5.8% of revenue, for the nine months ended September 30, 2018, primarily as a result of impairment and restructuring charges. Net of these charges, operating income was $15.6 million, or 3.0% of revenue, a decrease of $12.9 milion compared to the nine months ended September 30, 2018. The decrease is due to a decrease in company rate per mile, increase in owner operator freight revenue with lower margins than company freight and increases in operations and maintenance, insurance and claims, salaries and wages and fuel costs.
Interest Expense. Interest expense consists of cash interest non-cash paid-in-kind interest,and amortization of relateddebt issuance costs and fees and prepayment penalties. Interest expense increased 28.3%15.1% to $8.6$38.2 million during the threenine months ended September 30, 20172019 from $6.7$33.2 million during the threenine months ended September 30, 2016.2018. This increase was primarily attributable to an increase in amortization of debt issuance costs and higher interest rates on the Term Loan Facility and increases in equipment term loan and finance lease outstanding balances. The Company wrote off $2.0 million of deferred financing fees as compared toa result of an unsuccessful debt outstanding in 2016 underrefinancing during the Senior Term Loan and Equipment Term Loans.nine months ended September 30, 2019.
Income Tax. ProvisionBenefit for income taxes decreasedincreased from $0.7$14.2 million for the threenine months ended September 30, 20162018 to a benefit of $2.9$60.4 million for the threenine months ended September 30, 2017.2019. The decreaseincrease is primarily the result of the increase in loss before provision for income tax impact of $2.2 million for the three months ended September 30, 2017 compared to the same period in 2016.impairment charges of $52.2 million. The effective tax rate was 101.8%17.3% for the threenine months ended September 30, 2017,2019, compared to (119.0%(2,333.6%) for the threenine months ended September 30, 2016.2018. The effective income tax rate varies from the federal statutory rate of 35% primarily due to state income taxes and the impact of nondeductible permanent differences, including driver per diems and transaction expenses, and withdrawn Private Daseke IPO expenses.in 2019 non-deductible goodwill impairment.
The following table sets forth items derived from the Company’s consolidated statements of operations for the nine months ended September 30, 2017 and 2016 in dollars and as a percentage of total revenue and the increase or decrease in the dollar amounts of those items.
| | | | | | | | | | | | | | | |
| | Nine Months Ended September 30, | | | | | |
| | 2017 | | 2016 | | Increase (Decrease) |
(Dollars in thousands) | | $ | | % | | $ | | % | | $ | | % |
| | | | | | | | | | | | | | | |
REVENUE: | | | | | | | | | | | | | | | |
Freight | | $ | 446,454 | | 75.8 | | $ | 398,466 | | 79.5 | | $ | 47,988 | | 12.0 |
Brokerage | | | 83,723 | | 14.2 | | | 68,358 | | 13.6 | | | 15,365 | | 22.5 |
Logistics | | | 10,571 | | 1.8 | | | — | | * | | | 10,571 | | * |
Fuel surcharge | | | 48,331 | | 8.2 | | | 34,562 | | 6.9 | | | 13,769 | | 39.8 |
Total revenue | | | 589,079 | | 100.0 | | | 501,386 | | 100.0 | | | 87,693 | | 17.5 |
| | | | | | | | | | | | | | | |
OPERATING EXPENSES: | | | | | | | | | | | | | | | |
Salaries, wages and employee benefits | | | 174,253 | | 29.6 | | | 149,861 | | 29.9 | | | 24,392 | | 16.3 |
Fuel | | | 64,423 | | 10.9 | | | 49,076 | | 9.8 | | | 15,347 | | 31.3 |
Operations and maintenance | | | 86,332 | | 14.7 | | | 72,933 | | 14.5 | | | 13,399 | | 18.4 |
Communications | | | 1,491 | | 0.3 | | | 1,208 | | 0.2 | | | 283 | | 23.4 |
Purchased freight | | | 148,945 | | 25.3 | | | 120,501 | | 24.0 | | | 28,444 | | 23.6 |
Administrative expenses | | | 24,019 | | 4.1 | | | 17,711 | | 3.5 | | | 6,308 | | 35.6 |
Sales and marketing | | | 1,425 | | 0.2 | | | 1,280 | | 0.3 | | | 145 | | 11.3 |
Taxes and licenses | | | 7,855 | | 1.3 | | | 6,946 | | 1.4 | | | 909 | | 13.1 |
Insurance and claims | | | 15,516 | | 2.6 | | | 13,648 | | 2.7 | | | 1,868 | | 13.7 |
Acquisition-related transaction expenses | | | 2,255 | | 0.4 | | | 18 | | * | | | 2,237 | | * |
Depreciation and amortization | | | 53,758 | | 9.1 | | | 50,515 | | 10.1 | | | 3,243 | | 6.4 |
(Gain) loss on disposition | | | (513) | | (0.1) | | | 158 | | * | | | (671) | | (424.7) |
Impairment | | | — | | | | | 1,195 | | 0.2 | | | (1,195) | | (100.0) |
Total operating expenses | | | 579,759 | | 98.4 | | | 485,050 | | 96.7 | | | 94,709 | | 19.5 |
Operating ratio | | | 98.4% | | | | | 96.7% | | | | | | | |
Adjusted operating ratio(1) | | | 96.2% | | | | | 94.2% | | | | | | | |
INCOME FROM OPERATIONS | | | 9,320 | | 1.6 | | | 16,336 | | 3.3 | | | (7,016) | | (42.9) |
| | | | | | | | | | | | | | | |
Other (income) expense: | | | | | | | | | | | | | | | |
Interest income | | | (130) | | * | | | (40) | | * | | | (90) | | 225.0 |
Interest expense | | | 21,064 | | 3.6 | | | 17,521 | | 3.5 | | | 3,543 | | 20.2 |
Write-off of unamortized deferred financing fees | | | 3,883 | | 0.7 | | | — | | * | | | 3,883 | | * |
Other | | | (247) | | * | | | (266) | | (0.1) | | | 19 | | (7.1) |
Total other expense | | | 24,570 | | 4.2 | | | 17,215 | | 3.4 | | | 7,355 | | 42.7 |
| | | | | | | | | | | | | | | |
Loss before benefit for income taxes | | | (15,250) | | (2.6) | | | (879) | | (0.2) | | | (14,371) | | 1,634.9 |
Benefit for income taxes | | | (3,448) | | (0.6) | | | 607 | | 0.1 | | | (4,055) | | (668.0) |
Net loss | | $ | (11,802) | | (2.0) | | $ | (1,486) | | (0.3) | | $ | (10,316) | | 694.2 |
*indicates not meaningful.
| (1)
| | Adjusted operating ratio is not a recognized measure under GAAP. For a definition of adjusted operating ratio and reconciliation of adjusted operating ratio to operating ratio, see “Non-GAAP Financial Measures” below.
|
The following table sets forth the Company’s Flatbed Solutions segment’s revenue, operating expenses, operating ratio, adjusted operating ratio and operating income for the nine months ended September 30, 2017 and 2016 in dollars and as a percentage of its Flatbed Solutions segment’s total revenue and the increase or decrease in the dollar amounts of those items. The following table also sets forth certain operating statistics for the Company’s Flatbed Solutions segment for the nine months ended September 30, 2017 and 2016.
FLATBED SOLUTIONS
| | | | | | | | | | | | | | | |
| | Nine Months Ended September 30, | | | | | |
| | 2017 | | 2016 | | Increase (Decrease) |
(Dollars in thousands) | | $ | | % | | $ | | % | | $ | | % |
| | | | | | | | | | | | | | | |
REVENUE(1): | | | | | | | | | | | | | | | |
Freight | | $ | 200,670 | | 79.1 | | $ | 194,855 | | 82.2 | | $ | 5,815 | | 3.0 |
Brokerage | | | 27,979 | | 11.0 | | | 22,482 | | 9.5 | | | 5,497 | | 24.5 |
Logistics | | | — | | - | | | — | | - | | | — | | * |
Fuel surcharge | | | 25,145 | | 9.9 | | | 19,832 | | 8.4 | | | 5,313 | | 26.8 |
Total revenue | | | 253,794 | | 100.0 | | | 237,169 | | 100.0 | | | 16,625 | | 7.0 |
| | | | | | | | | | | | | | | |
OPERATING EXPENSES(1): | | | | | | | | | | | | | | | |
Salaries, wages and employee benefits | | | 71,723 | | 28.3 | | | 71,325 | | 30.1 | | | 398 | | 0.6 |
Fuel | | | 30,594 | | 12.1 | | | 26,708 | | 11.3 | | | 3,886 | | 14.5 |
Operations and maintenance | | | 27,475 | | 10.8 | | | 24,599 | | 10.4 | | | 2,876 | | 11.7 |
Purchased freight | | | 70,211 | | 27.7 | | | 59,775 | | 25.2 | | | 10,436 | | 17.5 |
Depreciation and amortization | | | 21,929 | | 8.6 | | | 22,687 | | 9.6 | | | (758) | | (3.3) |
Impairment | | | — | | - | | | — | | - | | | — | | * |
Other operating expenses | | | 16,907 | | 6.7 | | | 18,034 | | 7.6 | | | (1,127) | | (6.2) |
Total operating expenses | | | 238,839 | | 94.1 | | | 223,128 | | 94.1 | | | 15,711 | | 7.0 |
Operating ratio | | | 94.1% | | | | | 94.1% | | | | | | | |
Adjusted operating ratio(2) | | | 93.1% | | | | | 92.2% | | | | | | | |
INCOME FROM OPERATIONS | | $ | 14,955 | | 5.9 | | $ | 14,041 | | 5.9 | | $ | 914 | | 6.5 |
| | | | | | | | | | | | | | | |
OPERATING STATISTICS: | | | | | | | | | | | | | | | |
Total miles | | | 112,318,418 | | | | | 114,115,490 | | | | | (1,797,072) | | (1.6) |
Company-operated tractors | | | 1,158 | | | | | 1,173 | | | | | (15) | | (1.3) |
Owner-operated tractors | | | 454 | | | | | 442 | | | | | 12 | | 2.7 |
Number of trailers | | | 2,916 | | | | | 2,877 | | | | | 39 | | 1.4 |
*indicates not meaningful.
| (1)
| | Includes intersegment revenues and expenses, as applicable, which are eliminated in the Company’s consolidated results.
|
| (2)
| | Adjusted operating ratio is not a recognized measure under GAAP. For a definition of adjusted operating ratio and reconciliation of adjusted operating ratio to operating ratio, see “Non-GAAP Financial Measures” below.
|
The following table sets forth the Company’s Specialized Solutions segment’s revenue, operating expenses, operating ratio, adjusted operating ratio and operating income for the nine months ended September 30, 2017 and 2016 in dollars and as a percentage of its Specialized Solutions segment’s total revenue and the increase or decrease in the dollar amounts of those items. The following table also sets forth certain operating statistics for the Company’s Specialized Solutions segment for the nine months ended September 30, 2017 and 2016.
SPECIALIZED SOLUTIONS
| | | | | | | | | | | | | | | |
| | Nine Months Ended September 30, | | | | | |
| | 2017 | | 2016 | | Increase (Decrease) |
(Dollars in thousands) | | $ | | % | | $ | | % | | $ | | % |
| | | | | | | | | | | | | | | |
REVENUE(1): | | | | | | | | | | | | | | | |
Freight | | $ | 250,255 | | 73.5 | | $ | 206,641 | | 77.2 | | $ | 43,614 | | 21.1 |
Brokerage | | | 55,820 | | 16.4 | | | 45,986 | | 17.2 | | | 9,834 | | 21.4 |
Logistics | | | 10,594 | | 3.1 | | | — | | - | | | 10,594 | | * |
Fuel surcharge | | | 23,620 | | 6.9 | | | 15,024 | | 5.6 | | | 8,596 | | 57.2 |
Total revenue | | | 340,289 | | 100.0 | | | 267,651 | | 100.0 | | | 72,638 | | 27.1 |
| | | | | | | | | | | | | | | |
OPERATING EXPENSES(1): | | | | | | | | | | | | | | | |
Salaries, wages and employee benefits | | | 97,880 | | 28.8 | | | 74,430 | | 27.8 | | | 23,450 | | 31.5 |
Fuel | | | 33,829 | | 9.9 | | | 22,368 | | 8.4 | | | 11,461 | | 51.2 |
Operations and maintenance | | | 57,990 | | 17.0 | | | 47,686 | | 17.8 | | | 10,304 | | 21.6 |
Purchased freight | | | 83,704 | | 24.6 | | | 64,161 | | 24.0 | | | 19,543 | | 30.5 |
Depreciation and amortization | | | 31,714 | | 9.3 | | | 27,711 | | 10.4 | | | 4,003 | | 14.4 |
Impairment | | | — | | - | | | 1,195 | | 0.4 | | | (1,195) | | (100.0) |
Other operating expenses | | | 22,416 | | 6.6 | | | 15,411 | | 5.8 | | | 7,005 | | 45.5 |
Total operating expenses | | | 327,533 | | 96.3 | | | 252,962 | | 94.5 | | | 74,571 | | 29.5 |
Operating ratio | | | 96.3% | | | | | 94.5% | | | | | | | |
Adjusted operating ratio(2) | | | 94.0% | | | | | 92.5% | | | | | | | |
INCOME FROM OPERATIONS | | $ | 12,756 | | 3.7 | | $ | 14,689 | | 5.5 | | $ | (1,933) | | (13.2) |
| | | | | | | | | | | | | | | |
OPERATING STATISTICS: | | | | | | | | | | | | | | | |
Total miles | | | 94,967,882 | | | | | 74,273,172 | | | | | 20,694,710 | | 27.9 |
Company-operated tractors | | | 1,382 | | | | | 1,091 | | | | | 291 | | 26.7 |
Owner-operated tractors | | | 294 | | | | | 241 | | | | | 53 | | 22.0 |
Number of trailers | | | 4,100 | | | | | 3,332 | | | | | 768 | | 23.0 |
*indicates not meaningful.
| (1)
| | Includes intersegment revenues and expenses, as applicable, which are eliminated in the Company’s consolidated results.
|
| (2)
| | Adjusted operating ratio is not a recognized measure under GAAP. For a definition of adjusted operating ratio and reconciliation of adjusted operating ratio to operating ratio, see “Non-GAAP Financial Measures” below.
|
Revenue. Total revenue increased 17.5% to $589.1 million for the nine months ended September 30, 2017 from $501.4 million for the nine months ended September 30, 2016, primarily as a result of the Recent Acquisitions. The change in total revenue, excluding the effect of the Recent Acquisitions, was an increase of $19.9 million, or 4.0%, due to increases in fuel surcharge, freight and brokerage revenue. Fuel surcharge revenue, excluding the effect of the Recent Acquisitions, increased from $34.6 million for the nine months ended September 30, 2016 to $43.9 million for the nine months ended September 30, 2017, an increase of 26.9%. Freight revenue, excluding the effect of the Recent Acquisitions, increased 1.6% to $404.7 million for the nine months ended September 30, 2017 from $398.5 million for the nine months ended September 30, 2016. Brokerage revenue, excluding the effect of the Recent Acquisitions, increased 6.3% to $72.7 million for the nine months ended September 30, 2017 from $68.3 million for the nine months ended September 30, 2016 due to less capacity.
The Company’s Flatbed Solutions segment’s revenue was $253.8 million for the nine months ended September 30, 2017 and $237.2 million for the nine months ended September 30, 2016, an increase of 7.0%. This increase was primarily a result of increases in rates, which produced increases of $5.8 million, or 3.0%, in freight revenue and $5.5 million, or 24.5%, in brokerage revenues despite 1.8 million fewer miles compared to the same period in 2016. The $5.3 million, or 26.8%, increase in fuel surcharge revenue also contributed to the increase in the Flatbed Solutions segment.
The Company’s Specialized Solutions segment’s revenue was $340.3 million for the nine months ended September 30, 2017 and $267.7 million for the nine months ended September 30, 2016, an increase of 27.1%, primarily as a result of the Recent Acquisitions. The increase in revenue, excluding the effect of the Recent Acquisitions, was $4.8 million, or 1.8%, primarily due to increases in fuel surcharge. Fuel
surcharges, excluding the effect of the Recent Acquisitions, increased 27.6% to $19.2 million for the nine months ended September 30, 2017 from $15.0 million for the same period in 2016. Freight revenue, excluding the effect of the Recent Acquisitions, increased less than 1.0% for the nine months ended September 30, 2017 compared to the same period in 2016 and brokerage revenue, excluding the effect of the Recent Acquisitions, decreased by 2.6% for the nine months ended September 30, 2017 compared to the same period in 2016.
In both segments, the increase in fuel surcharge revenue was the result of increases in fuel prices which commenced in the fourth quarter of 2016 and continued through the third quarter of 2017, with only a less than 1% decrease in fuel prices in the second quarter of 2017.
Salaries, Wages and Employee Benefits. Salaries, wages and employee benefits expense increased 16.3% to $174.3 million for the nine months ended September 30, 2017 from $149.9 million for the nine months ended September 30, 2016, primarily as a result of the Recent Acquisitions. The increase in salaries, wages and employee benefits expense, excluding the effect of the Recent Acquisitions, was 3.2%, or $4.9 million, and was primarily due to increased employee compensation, workers’ compensation premiums, and stock-based compensation, partially offset by a decrease in workers’ compensation claims.
The Company’s Flatbed Solutions segment’s salaries, wages and employee benefits expense was relatively flat for the nine months ended September 30, 2017 compared to the nine months ended September 30, 2016.
The Company’s Specialized Solutions segment had a $23.5 million, or 31.5%, increase in salaries, wages and employee benefits expense for the nine months ended September 30, 2017 compared to the nine months ended September 30, 2016, primarily as a result of the Recent Acquisitions. This increase, excluding the effect of the Recent Acquisitions, was 5.3%, or $3.9 million, and was primarily due to increased employee compensation, workers’ compensation premiums, and stock-based compensation, partially offset by a decrease in employee health insurance costs.
Fuel. Total fuel expense increased $15.3 million, or 31.3%, to $64.4 million for the nine months ended September 30, 2017 from $49.1 million for the nine months ended September 30, 2016. This increase was primarily a result of the Recent Acquisitions and higher fuel prices. Excluding the effect of the Recent Acquisitions, fuel expense increased 15.8% or $7.8 million. The U.S. national average diesel fuel price, as published by the U.S. Department of Energy, was $2.578 for the nine months ended September 30, 2017, compared to $2.250 for the same period in 2016, a 14.6% increase.
The Company’s Flatbed Solutions segment’s fuel expense increased 14.5% to $30.6 million for the nine months ended September 30, 2017 from $26.7 million for the nine months ended September 30, 2016, primarily as a result of higher fuel prices and partially offset by a 1.6% decrease in total miles.
The Company’s Specialized Solutions segment’s fuel expense increased 51.2% to $33.8 million for the nine months ended September 30, 2017 from $22.4 million for the nine months ended September 30, 2016, primarily as the result of the Recent Acquisitions and higher fuel prices. Excluding the effect of the Recent Acquisitions, fuel expense in the Specialized Solutions segment increased 17.4% to $26.3 million as a result of higher fuel prices and an increase in total miles.
Operations and Maintenance. Operations and maintenance expense increased 18.4% to $86.3 million for the nine months ended September 30, 2017 from $72.9 million for the nine months ended September 30, 2016, primarily as a result of the Recent Acquisitions. Operating and maintenance expense increased 6.9% after adjusting for the effect of the Recent Acquisitions.
The Company’s Flatbed Solutions segment’s operations and maintenance expense increased $2.9 million, or 11.7%, for the nine months ended September 30, 2017 as compared to the nine months ended September 30, 2016, primarily as a result of increased shop supplies, road maintenance, tire replacements, and tractor lease costs as the Company’s utilization of operating leases to finance tractor purchases increased in 2017.
The Company’s Specialized Solutions segment’s operations and maintenance expense increased $10.3 million, or 21.6%, for the nine months ended September 30, 2017 as compared to the nine months ended September 30, 2016, primarily as a result of the Recent Acquisitions. Excluding the effect of the Recent Acquisitions, operations and maintenance expense increased $2.0 million, or 4.1%, for the nine months ended September 30, 2017 as compared to the nine months ended September 30, 2016, primarily as a result of increased tractor lease costs as the Company’s utilization of operating leases to finance tractor purchases increased in 2017 and higher pilot car expenses for alternative energy projects and other over-dimension loads, partially offset by decreases in in-house maintenance, road maintenance, and tire replacement costs.
Purchased Freight. Total purchased freight expense increased 23.6% from $120.5 million during the nine months ended September 30, 2016 to $148.9 million during the nine months ended September 30, 2017, primarily as a result of the Recent Acquisitions. Excluding the effect of the Recent Acquisitions on purchased freight expense, total purchased freight expense increased 7.0% to $128.9 million for the nine months ended September 30, 2017. Purchased freight expense from owner-operators, excluding the Recent Acquisitions, increased
7.2% from $69.1 million during the nine months ended September 30, 2016 to $74.1 million during the nine months ended September 30, 2017, primarily as a result of increases in fuel surcharge reimbursements made to owner-operators as a result of higher fuel prices. Purchased freight expense from third-party capacity providers, excluding the Recent Acquisitions, increased 8.0% from $49.1 million during the nine months ended September 30, 2016 to $53.0 million during the nine months ended September 30, 2017, primarily as a result of the increase in rates on brokered loads.
The Company’s Flatbed Solutions segment’s purchased freight expense increased 17.5% to $70.2 million for the nine months ended September 30, 2017 from $59.8 million for the nine months ended September 30, 2016, primarily due to increases in total loads requiring higher utilization of owner-operators and third party capacity providers in the Company’s Flatbed Solutions segment. Purchased freight expense from owner-operators increased 10.6% to $49.2 million for the nine months ended September 30, 2017 from $44.4 million for the nine months ended September 30, 2016. Purchased freight expense from third-party capacity providers increased 39.1% from $13.5 million during the nine months ended September 30, 2016 to $18.8 million during the nine months ended September 30, 2017, primarily as a result of the increase in brokered loads in the Company’s Flatbed Solutions segment.
The Company’s Specialized Solutions segment’s purchased freight expense increased 30.5% to $83.7 million during the nine months ended September 30, 2017 from $64.2 million during the nine months ended September 30, 2016, as a result of the Recent Acquisitions. Excluding the effect of the Recent Acquisitions on purchased freight expense, total purchased freight expense decreased slightly to $63.7 million for the nine months ended September 30, 2017. Purchased freight expense from owner-operators, excluding the Recent Acquisitions, was relatively flat, increasing only 1.0% from the nine months ended September 30, 2016 to the nine months ended September 30, 2017. Purchased freight expense from third-party capacity providers, excluding the Recent Acquisitions, decreased 4.0% from $35.5 million during the nine months ended September 30, 2016 to $34.1 million during the nine months ended September 30, 2017, primarily as a result of increased utilization of company drivers during the current year.
Depreciation and Amortization. Depreciation and amortization expense increased 6.4% to $53.8 million during the nine months ended September 30, 2017 from $50.5 million during the nine months ended September 30, 2016, as a result of the Recent Acquisitions. After adjusting for the effect of the Recent Acquisitions, depreciation and amortization expense decreased 4.9%, primarily as a result of an increasing shift in utilization of operating leases to finance capital expenditures.
The Company’s Flatbed Solutions segment had a 3.3% decrease in depreciation and amortization expense for the nine months ended September 30, 2017 as compared to the nine months ended September 30, 2016 primarily as a result of a 1.3% reduction in company-owned tractors.
The Company’s Specialized Solutions segment had a 14.4% increase in depreciation and amortization expense for the nine months ended September 30, 2017 as compared to the nine months ended September 30, 2016 as a result of the Recent Acquisitions. After adjusting for the effect of the Recent Acquisitions, depreciation and amortization expense decreased 6.1%, primarily as a result of an increasing shift in utilization of operating leases to finance capital expenditures.
Taxes and Licenses. Taxes and license expense increased from $6.9 million for the nine months ended September 30, 2016 to $7.9 million for the nine months ended September 30, 2017. Excluding the effect of the Recent Acquisitions, operating taxes and license expense, as a percentage of revenue, was 1.3% for the nine months ended September 30, 2017 and 1.4% for the nine months ended September 30, 2016.
Insurance and Claims. Insurance and claims expense increased 13.7% to $15.5 million during the nine months ended September 30, 2017 from $13.6 million during the nine months ended September 30, 2016, primarily as a result of the Recent Acquisitions. Excluding the effect of the Recent Acquisitions, insurance and claims increased 1.6%, or $0.2 million. This increase can be primarily attributed to an increase in insurance premium rates, partially offset by a marginal decrease in total miles of 0.8% excluding miles from the Recent Acquisitions.
Interest Expense. Interest expense consists of cash interest, non-cash paid-in-kind interest, amortization of related issuance costs and fees and prepayment penalties. Interest expense increased 20.2% to $21.1 million during the nine months ended September 30, 2017 from $17.5 million during the nine months ended September 30, 2016. This increase was primarily attributable to an increase in amortization of debt issuance costs and higher interest rates on the Term Loan Facility as compared to debt outstanding in 2016 under the Senior Term Loan and Equipment Term Loans.
Income Tax. Income tax expense decreased from $0.6 million for the nine months ended September 30, 2016 to a benefit of $3.4 million for the nine months ended September 30, 2017. Excluding the effect of the Recent Acquisitions, the increase was primarily the result of the increase in loss before provision (benefit) for income taxes of $13.4 million for the nine months ended September 30, 2017 compared to the same period in 2016. The effective tax rate was 22.6% for the nine months ended September 30, 2017, compared to (69.1%) for the nine months ended September 30, 2016. The effective income tax rate varies from the federal statutory rate of 35% primarily due to state income taxes and the impact of nondeductible permanent differences, including driver per diems, transaction expenses and withdrawn Private Daseke IPO expenses.
Non-GAAP Financial Measures
Adjusted EBITDA, Adjusted EBITDAR and Free Cash Flow, Adjusted Operating Ratio and Adjusted Net Income (Loss)
Adjusted EBITDA, Free Cash Flow, Adjusted EBITDAROperating Ratio and free cash flowAdjusted Net Income (Loss) are not recognized measures under GAAP. The Company uses these non-GAAP measures as supplements to its GAAP results in evaluating certain aspects of its business, as described below.
Adjusted EBITDA
The Company defines Adjusted EBITDA as net income (loss) plus (i) depreciation and amortization, (ii) interest expense, includingand other fees and charges associated with indebtedness,financings, net of interest income, (iii) income taxes, (iv) acquisition-related transaction expenses (including due diligence costs, legal, accounting and other advisory fees and costs, retention and severance payments and financing fees and expenses), (v) business transformation costs, (vi) non-cash impairments, (vi) losses (gains) on sales of defective revenue equipment out of the normal replacement cycle,impairment, (vii) impairments related to defective revenue equipment sold out of the normal replacement cycle,restructuring charges, and (viii) initial public offering-related expenses (which offering Private Daseke withdrew at the end of 2015), (ix) expenses related to the Business Combination and related transactions, (x) non-cash stock and equity-compensation expense, and (xi) accounting charges resulting from accounting for the possible earn-out pursuant to the Business Combination. The Company defines Adjusted EBITDAR as Adjusted EBITDA plus tractor operating lease charges.expense.
The Company’s board of directors and executive management team use Adjusted EBITDA and Adjusted EBITDAR as a key measuresmeasure of its performance and for business planning. Adjusted EBITDA and Adjusted EBITDAR assistassists them in comparing its operating performance over various reporting periods on a consistent basis because they removeit removes from the Company’s operating results the impact of items that, in their opinion, do not reflect the Company’s core operating performance. Adjusted EBITDA and Adjusted EBITDAR also allowallows the Company to more effectively evaluate its operating performance by allowing it to compare the results of operations against its peers without regard to its or its peers’ financing method or capital structure. Adjusted EBITDAR is used to view operating results before lease charges as these charges can vary widely among trucking companies due to differences in the way that trucking companies finance their fleet acquisitions. The Company’s method of computing Adjusted EBITDA is substantially consistent with that used in its debt covenants and also is routinely reviewed by its management for that purpose.
The Company believes its presentation of Adjusted EBITDA and Adjusted EBITDAR is useful because they provideit provides investors and industry analysts the same information that the Company uses internally for purposes of assessing its core operating performance. However, Adjusted EBITDA and Adjusted EBITDAR areis not substitutesa substitute for, or more meaningful than, net income (loss), cash flows from operating activities, operating income or any other measure prescribed by GAAP, and there are limitations to using non-GAAP measures such as Adjusted EBITDA and Adjusted EBITDAR.EBITDA. Certain items excluded from Adjusted EBITDA and Adjusted EBITDAR are significant components in understanding and assessing a company’s financial performance, such as a company’s cost of capital, tax structure and the historic costs of depreciable assets. Also, other companies in its industry may define Adjusted EBITDA and Adjusted EBITDAR differently than the Company does, and as a result, it may be difficult to use Adjusted EBITDA Adjusted EBITDAR or similarly named non-GAAP measures that other companies may use to compare the performance of those companies to its performance. Because of these limitations, Adjusted EBITDA and Adjusted EBITDAR should not be considered measuresa measure of the income generated by the Company’s business or discretionary cash available to it to invest in the growth of its business. The Company’s management compensates for these limitations by relying primarily on the Company’s GAAP results and using Adjusted EBITDA supplementally.
A reconciliation of Adjusted EBITDA to net income (loss) for the three and Adjusted EBITDAR supplementally.nine months ended September 30, 2019 and 2018 is as follows:
| | | | | | | | | | | | |
| | Three Months Ended September 30, | | Nine Months Ended September 30, |
(Dollars in millions) | | 2019 | | 2018 | | 2019 | | 2018 |
| | | | | | | | | | | | |
Net income (loss) | | $ | (273.3) | | $ | 2.2 | | $ | (289.0) | | $ | 14.9 |
Depreciation and amortization | | | 38.3 | | | 36.8 | | | 119.5 | | | 93.8 |
Interest income | | | (0.3) | | | (0.2) | | | (0.7) | | | (1.2) |
Interest expense | | | 12.8 | | | 11.9 | | | 38.2 | | | 33.2 |
Write-off of deferred financing fees | | | 2.0 | | | — | | | 2.0 | | | — |
Income tax benefit | | | (57.8) | | | 0.7 | | | (60.4) | | | (14.2) |
Acquisition-related transaction expenses | | | — | | | 0.6 | | | — | | | 2.4 |
Business transformation costs | | | 6.8 | | | — | | | 6.8 | | | — |
Impairment | | | 306.8 | | | — | | | 306.8 | | | 2.8 |
Restructuring | | | 6.9 | | | — | | | 6.9 | | | — |
Stock based compensation | | | 1.0 | | | 0.9 | | | 2.9 | | | 2.7 |
Adjusted EBITDA | | $ | 43.2 | | $ | 52.9 | | $ | 133.0 | | $ | 134.4 |
Free Cash Flow
The Company defines freeFree Cash Flow as net cash flow as Adjusted EBITDAprovided by operating activities less net capital expenditures (capital expenditures lesspurchases of property and equipment, plus proceeds from sale of property and equipment sales). Itsas such amounts are shown on the face of the Statement of Cash Flows. The Company’s board of directors and executive management team use free cash flowFree Cash Flow to assess its performancethe Company’s liquidity and ability to repay maturing debt, fund operations and make additional investments. Free cash flow represents the cash that its business generates from operations, before taking into account cash movements that are non-operational. The Company believes its presentation of free cash flow isFree Cash Flow provides useful information to investors because it is onean important indicator of several indicators ofthe Company’s liquidity, including its ability to servicereduce net debt, make strategic investments, and/or return capitalpay dividends to its stockholders.common shareholders and repurchase stock. The Company also believes that free cash flow is one of several benchmarks used by investors and industry analysts for comparison of performance in its industry, although itsCompany’s measure of free cash flowFree Cash Flow may not be directly comparable to similar measures reported by other companies. Furthermore, free cash flowFree Cash Flow is not a substitute for, or more meaningful than, net income (loss), cash flows fromprovided by operating activities operating income ornor any other measure prescribed by GAAP, and there are limitations to using non-GAAP measures such as free cash flow.Free Cash Flow. Accordingly, free cash flowFree Cash Flow should not be considered a measure of the income generated by itsthe Company’s business or discretionary cash available to itthe Company to invest in the growth of its business. The Company’s management compensates for these limitations by relying primarily on the Company’s GAAP results and using free cash flowFree Cash Flow supplementally.
A reconciliation of Adjusted EBITDA, Adjusted EBITDAR and freeFree Cash Flow to cash flow to net income (loss)flows from operating activities for the three and nine months ended September 30, 20172019 and 20162018 is as follows:
| | | | | | | | | | | | |
| | Three Months Ended September 30, | | Nine Months Ended September 30, |
(In thousands) | | 2017 | | 2016 | | 2017 | | 2016 |
| | | | | | | | | | | | |
Net income (loss) | | $ | 50 | | $ | (1,257) | | $ | (11,802) | | $ | (1,486) |
Depreciation and amortization | | | 19,805 | | | 16,998 | | | 53,758 | | | 50,515 |
Interest income | | | (76) | | | (4) | | | (130) | | | (40) |
Interest expense | | | 8,624 | | | 6,724 | | | 24,947 | | | 17,521 |
Income tax provision (benefit) | | | (2,862) | | | 683 | | | (3,448) | | | 607 |
Acquisition-related transaction expenses | | | 773 | | | 16 | | | 2,255 | | | 289 |
Impairment | | | — | | | 1,195 | | | — | | | 1,195 |
Stock based compensation | | | 663 | | | — | | | 1,201 | | | — |
Withdrawn initial public offering-related expenses | | | — | | | 259 | | | — | | | 3,050 |
Net losses on sales of defective revenue equipment out of the normal replacement cycle | | | — | | | 22 | | | — | | | 718 |
Impairment on sales of defective revenue equipment out of the normal replacement cycle | | | — | | | — | | | — | | | 190 |
Expenses related to the Business Combination and related transactions | | | — | | | 344 | | | 2,034 | | | 344 |
Tractor operating lease charges | | | 4,448 | | | 3,610 | | | 12,366 | | | 9,324 |
Adjusted EBITDAR | | $ | 31,425 | | $ | 28,590 | | $ | 81,181 | | $ | 82,227 |
Less tractor operating lease charges | | | (4,448) | | | (3,610) | | | (12,366) | | | (9,324) |
Adjusted EBITDA | | $ | 26,977 | | $ | 24,980 | | $ | 68,815 | | $ | 72,903 |
Net capital expenditures | | | (14,930) | | | (10,549) | | | (23,922) | | | (31,236) |
Free cash flow | | $ | 12,047 | | $ | 14,431 | | $ | 44,893 | | $ | 41,667 |
| | | | | | | | | | | | |
| | Three Months Ended September 30, | | Nine Months Ended September 30, |
(Dollars in millions) | | 2019 | | 2018 | | 2019 | | 2018 |
Net cash provided by operating activities | | $ | 34.5 | | $ | 17.8 | | $ | 89.4 | | $ | 46.8 |
Purchases of property and equipment | | | (5.3) | | | (27.7) | | | (17.4) | | | (58.8) |
Proceeds from sale of property and equipment | | | 7.3 | | | 3.8 | | | 23.8 | | | 15.5 |
Free Cash Flow | | $ | 36.5 | | $ | (6.1) | | $ | 95.8 | | $ | 3.5 |
Adjusted Operating Ratio
Adjusted operating ratio is not a recognized measure under GAAP. The Company uses adjusted operating ratioAdjusted Operating Ratio as a supplement to its GAAP results in evaluating certain aspects of its business, as described below. The Company defines adjusted operating ratioAdjusted Operating Ratio as (a) total operating expenses (i) less, fuel surcharges, acquisition-related transaction expenses, non-cash impairment charges, unusual or non-regularly recurring expenses or recoveries, (ii) less, business transformation costs, and initial public offering-related expenses (which offering Daseke withdrew at the end of 2015) and (ii)(iii) further adjusted for the net impact of the step-up in basis resulting from acquisitions (such as increased depreciation and amortization expense), and amortization of identifiable intangible assets resulting from acquisitions, as a percentage of (b) total revenue excluding fuel surcharge revenue.
The Company’s board of directors and executive management team view adjusted operating ratio,Adjusted Operating Ratio, and its key drivers of revenue quality, growth, expense control and operating efficiency, as a very important measure of the Company’s performance. The Company believes fuel surcharge is often volatile and eliminating the impact of this source of revenue (by eliminating fuel surcharge from revenue and by netting fuel surcharge against fuel expense) affords a more consistent basis for comparing its results of operations between periods. The Company also believes excluding acquisition-related transaction expenses, additional depreciation and amortization expenses as a result of acquisitions, unusual or non-regularly recurring expenses or recoveries and non-cash impairments and withdrawn initial public offering-related expensesimpairment enhances the comparability of its performance between periods.
The Company believes its presentation of adjusted operating ratioAdjusted Operating Ratio is useful because it provides investors and industry analysts the same information that it uses internally for purposes of assessing its core operating profitability. However, adjusted operating ratioAdjusted Operating Ratio is not a substitute for, or more meaningful than, operating ratio, operating margin or any other measure derived solely from GAAP measures, and there are limitations to using non-GAAP measures such as adjusted operating ratio.Adjusted Operating Ratio. Although the Company believes that adjusted operating ratioAdjusted Operating Ratio can make an evaluation of its operating performance more consistentaccurately because it removes items that, in its opinion, do not reflect its core operations, other companies in its industry may define adjusted operating ratio differently than it does. As a result, it may be difficult to use adjustedAdjusted Operating Ratio or similarly named non-GAAP measures that other companies may use to compare the performance of those companies to the Company’s performance. The Company’s management compensates for these limitations by relying primarily on GAAP measures and using Adjusted Operating Ratio supplementally.
A reconciliation of Adjusted Operating Ratio to operating ratio for each of the three and nine months ended September 30, 2019 and 2018 is as follows:
| | | | | | | | | | | | |
| | Three Months Ended September 30, | | Nine Months Ended September 30, |
(Dollars in millions) | | 2019 | | 2018 | | 2019 | | 2018 |
| | | | | | | | | | | | |
Revenue | | $ | 450.4 | | $ | 461.6 | | $ | 1,334.0 | | $ | 1,166.1 |
Salaries, wages and employee benefits | | | 127.7 | | | 114.8 | | | 371.1 | | | 287.7 |
Fuel | | | 34.1 | | | 38.9 | | | 105.3 | | | 103.7 |
Operations and maintenance | | | 56.8 | | | 51.5 | | | 164.7 | | | 126.4 |
Purchased freight | | | 155.5 | | | 170.6 | | | 458.5 | | | 429.9 |
Depreciation and amortization | | | 38.3 | | | 36.8 | | | 119.5 | | | 93.8 |
Impairment | | | 306.8 | | | — | | | 306.8 | | | 2.8 |
Restructuring | | | 6.9 | | | — | | | 6.9 | | | — |
Other operating expenses | | | 40.9 | | | 35.1 | | | 112.4 | | | 91.6 |
Operating expenses | | | 767.0 | | | 447.7 | | | 1,645.2 | | | 1,135.9 |
Operating ratio | | | 170.3% | | | 97.0% | | | 123.3% | | | 97.4% |
Acquisition-related transaction expenses | | | — | | | 0.6 | | | — | | | 2.4 |
Business transformation costs | | | 6.8 | | | — | | | 6.8 | | | — |
Impairment | | | 306.8 | | | — | | | 306.8 | | | 2.8 |
Restructuring | | | 6.9 | | | — | | | 6.9 | | | — |
Amortization of intangible assets | | | 4.2 | | | 4.1 | | | 12.4 | | | 12.2 |
Net impact of step-up in basis of acquired assets | | | 5.5 | | | 7.0 | | | 18.2 | | | 16.4 |
Adjusted operating expenses | | $ | 436.8 | | $ | 436.0 | | $ | 1,294.1 | | $ | 1,102.1 |
Adjusted operating ratio | | | 97.0% | | | 94.5% | | | 97.0% | | | 94.5% |
A reconciliation of the Company’s Specialized Solutions segment’s Adjusted Operating Ratio to operating ratio for the three and nine months ended September 30, 2019 and 2018 is as follows:
| | | | | | | | | | | | |
| | Three Months Ended September 30, | | Nine Months Ended September 30, |
(Dollars in millions) | | 2019 | | 2018 | | 2019 | | 2018 |
| | | | | | | | | | | | |
Revenue(1) | | $ | 288.0 | | $ | 283.9 | | $ | 838.3 | | $ | 687.1 |
Salaries, wages and employee benefits | | | 82.6 | | | 79.4 | | | 246.4 | | | 197.5 |
Fuel | | | 21.7 | | | 25.2 | | | 67.5 | | | 66.7 |
Operations and maintenance | | | 43.3 | | | 38.7 | | | 123.6 | | | 91.6 |
Purchased freight | | | 85.2 | | | 84.0 | | | 237.8 | | | 192.1 |
Depreciation and amortization | | | 23.8 | | | 27.6 | | | 76.4 | | | 67.9 |
Impairment | | | 193.6 | | | — | | | 193.6 | | | 2.8 |
Restructuring | | | 3.5 | | | — | | | 3.5 | | | — |
Other operating expenses | | | 21.9 | | | 17.2 | | | 58.3 | | | 44.4 |
Operating expenses | | | 475.6 | | | 272.1 | | | 1,007.1 | | | 663.0 |
Operating ratio | | | 165.1% | | | 95.8% | | | 120.1% | | | 96.5% |
Business transformation costs | | | 0.7 | | | — | | | 0.7 | | | — |
Impairment | | | 193.6 | | | — | | | 193.6 | | | 2.8 |
Restructuring | | | 3.5 | | | — | | | 3.5 | | | — |
Amortization of intangible assets | | | 2.7 | | | 2.6 | | | 7.9 | | | 7.8 |
Net impact of step-up in basis of acquired assets | | | 4.8 | | | 6.9 | | | 16.6 | | | 15.5 |
Adjusted operating expenses | | $ | 270.3 | | $ | 262.6 | | $ | 784.8 | | $ | 636.9 |
Adjusted operating ratio | | | 93.9% | | | 92.5% | | | 93.6% | | | 92.7% |
| (1) | | Includes intersegment revenues and expenses, as applicable, which are eliminated in the Company’s consolidated results. |
A reconciliation of the Company’s Flatbed Solutions segment’s Adjusted Operating Ratio to operating ratio for the three and nine months ended September 30, 2019 and 2018 is as follows:
| | | | | | | | | | | | |
| | Three Months Ended September 30, | | Nine Months Ended September 30, |
(Dollars in millions) | | 2019 | | 2018 | | 2019 | | 2018 |
| | | | | | | | | | | | |
Revenue(1) | | $ | 169.8 | | $ | 181.5 | | $ | 512.7 | | $ | 488.7 |
Salaries, wages and employee benefits | | | 35.0 | | | 33.0 | | | 104.4 | | | 86.9 |
Fuel | | | 12.5 | | | 13.7 | | | 37.8 | | | 36.9 |
Operations and maintenance | | | 13.2 | | | 12.6 | | | 40.5 | | | 34.4 |
Purchased freight | | | 77.8 | | | 90.3 | | | 237.8 | | | 247.6 |
Depreciation and amortization | | | 14.2 | | | 9.2 | | | 42.6 | | | 25.8 |
Impairment | | | 113.2 | | | — | | | 113.2 | | | — |
Restructuring | | | 0.9 | | | — | | | 0.9 | | | — |
Other operating expenses | | | 10.9 | | | 10.5 | | | 34.0 | | | 28.6 |
Operating expenses | | | 277.7 | | | 169.3 | | | 611.2 | | | 460.2 |
Operating ratio | | | 163.5% | | | 93.3% | | | 119.2% | | | 94.2% |
Business transformation costs | | | 0.1 | | | — | | | 0.1 | | | — |
Impairment | | | 113.2 | | | — | | | 113.2 | | | — |
Restructuring | | | 0.9 | | | — | | | 0.9 | | | — |
Amortization of intangible assets | | | 1.5 | | | 1.5 | | | 4.5 | | | 4.4 |
Net impact of step-up in basis of acquired assets | | | 0.7 | | | — | | | 1.6 | | | 0.9 |
Adjusted operating expenses | | $ | 161.3 | | $ | 167.8 | | $ | 490.9 | | $ | 454.9 |
Adjusted operating ratio | | | 95.0% | | | 92.5% | | | 95.7% | | | 93.1% |
| (1) | | Includes intersegment revenues and expenses, as applicable, which are eliminated in the Company’s consolidated results. |
Adjusted Net Income (Loss)
The Company defines Adjusted Net Income (Loss) as net income (loss) adjusted for acquisition related transaction expenses, business transformation costs, non-cash impairments, amortization of intangible assets, the net impact of step-up in basis of acquired assets and unusual or non-regularly recurring expenses or recoveries.
The Company’s board of directors and executive management team use Adjusted Net Income (Loss) as a key measure of its performance and for business planning. Adjusted Net Income (Loss) assists them in comparing its operating performance over various reporting periods on a consistent basis because it removes from operating results the impact of items that, in its opinion, do not reflect the Company’s core operating performance. Adjusted Net Income (Loss) also allows the Company to more effectively evaluate its operating performance by allowing it to compare the results of operations against its peers without regard to its or its peers’ acquisition related items, such as acquisition-related transaction expenses, non-cash impairments, amortization of intangible assets and the net impact of the step up in basis of acquired assets, as well as removing the impact of unusual or non-regularly recurring expenses or recoveries.
The Company believes its presentation of Adjusted Net Income (Loss) is useful because it provides investors and industry analysts the same information that it uses internally for purposes of assessing its core operating performance. However, Adjusted Net Income (Loss) is not a substitute for, or more meaningful than, net income (loss) or any other measure derived solely from GAAP measures, and there are limitations to using non-GAAP measures such as Adjusted Net Income (Loss). Although the Company believes that Adjusted Net Income (Loss) can make an evaluation of its operating performance more consistent because it removes items that, in its opinion, do not reflect its core operations, other companies in its industry may define Adjusted Net Income (Loss) differently than it does. As a result, it may be difficult to use Adjusted Net Income (Loss) or similarly named non-GAAP measures that other companies may use to compare the performance of those companies to the Company’s performance. The Company’s management compensates for these limitations by relying primarily on its GAAP results and using adjusted operating ratioAdjusted Net Income (Loss) supplementally.
A reconciliation of adjusted operating ratioAdjusted Net Income to operating ratio for each of the three and nine months ended September 30, 2017 and 2016 is as follows:
| | | | | | | | | | | |
| Three Months Ended September 30, | | Nine Months Ended September 30, |
(Dollars in thousands) | 2017 | | 2016 | | 2017 | | 2016 |
| | | | | | | | | | | |
Total revenue | $ | 231,322 | | $ | 174,148 | | $ | 589,079 | | $ | 501,386 |
Fuel surcharge | | 18,008 | | | 12,756 | | | 48,331 | | | 34,562 |
Operating revenue, net of fuel surcharge | $ | 213,314 | | $ | 161,392 | | $ | 540,748 | | $ | 466,824 |
| | | | | | | | | | | |
Total operating expenses | $ | 225,618 | | $ | 168,066 | | $ | 579,759 | | $ | 485,050 |
Fuel surcharge | | 18,008 | | | 12,756 | | | 48,331 | | | 34,562 |
Acquisition-related transaction expenses | | 773 | | | 16 | | | 2,255 | | | 289 |
Impairment | | — | | | 1,195 | | | — | | | 1,195 |
Withdrawn initial public offering-related expenses | | — | | | 259 | | | — | | | 3,050 |
Expenses related to the Business Combination and related transactions | | — | | | 344 | | | 2,034 | | | 344 |
Net impact of step-up in basis of acquired assets | | 3,260 | | | 1,637 | | | 7,088 | | | 5,911 |
Adjusted operating expenses | $ | 203,577 | | $ | 151,859 | | $ | 520,051 | | $ | 439,699 |
| | | | | | | | | | | |
Operating ratio | | 97.5% | | | 96.5% | | | 98.4% | | | 96.7% |
Adjusted operating ratio | | 95.4% | | | 94.1% | | | 96.2% | | | 94.2% |
A reconciliation of the Company’s Flatbed Solutions segment’s adjusted operating ratio to operating rationet income (loss) for the three and nine months ended September 30, 20172019 and 20162018 is as follows:
| | | | | | | | | | | | |
| | Three Months Ended September 30, | | Nine Months Ended September 30, |
(Dollars in thousands) | | 2017 | | 2016 | | 2017 | | 2016 |
| | | | | | | | | | | | |
Total revenue(1) | | $ | 85,592 | | $ | 78,975 | | $ | 253,794 | | $ | 237,169 |
Fuel surcharge | | | 8,400 | | | 7,284 | | | 25,145 | | | 19,832 |
Operating revenue, net of fuel surcharge | | $ | 77,192 | | $ | 71,691 | | $ | 228,649 | | $ | 217,337 |
| | | | | | | | | | | | |
Total operating expenses | | $ | 80,837 | | $ | 75,181 | | $ | 238,839 | | $ | 223,128 |
Fuel surcharge | | | 8,400 | | | 7,284 | | | 25,145 | | | 19,832 |
Net impact of step-up in basis of acquired assets | | | 227 | | | 596 | | | 888 | | | 2,835 |
Adjusted operating expenses | | $ | 72,210 | | $ | 67,301 | | $ | 212,806 | | $ | 200,461 |
| | | | | | | | | | | | |
Operating ratio | | | 94.4% | | | 95.2% | | | 94.1% | | | 94.1% |
Adjusted operating ratio | | | 93.5% | | | 93.9% | | | 93.1% | | | 92.2% |
| | | | | | | | | | | | |
| | Three Months Ended September 30, | | Nine Months Ended September 30, |
(Dollars in millions) | | 2019 | | 2018 | | 2019 | | 2018 |
| | | | | | | | | | | | |
Net income (loss) | | $ | (273.3) | | $ | 2.2 | | $ | (289.0) | | $ | 14.9 |
Acquisition-related transaction expenses | | | — | | | 0.6 | | | — | | | 2.4 |
Business transformation costs | | | 6.8 | | | — | | | 6.8 | | | — |
Impairment | | | 306.8 | | | — | | | 306.8 | | | 2.8 |
Restructuring | | | 6.9 | | | — | | | 6.9 | | | — |
Amortization of intangible assets | | | 4.2 | | | 4.1 | | | 12.4 | | | 12.2 |
Net impact of step-up in basis of acquired assets | | | 5.5 | | | 7.0 | | | 18.2 | | | 16.4 |
Tax impact of impairments in 2019 and TCJA(1) tax rate change in 2018 | | | (52.2) | | | — | | | (52.2) | | | (12.6) |
Adjusted net income | | $ | 4.7 | | $ | 13.9 | | $ | 9.9 | | $ | 36.1 |
| (1) | | Includes intersegment revenuesTax Cuts and expenses, as applicable, which are eliminated in the Company’s consolidated results.Jobs Act.
|
A reconciliation of the Company’s Specialized Solutions segment’s adjusted operating ratio to Operating Ratio for the three and nine months ended September 30, 2017 and 2016 is as follows:
| | | | | | | | | | | | |
| | Three Months Ended September 30, | | Nine Months Ended September 30, |
(Dollars in thousands) | | 2017 | | 2016 | | 2017 | | 2016 |
| | | | | | | | | | | | |
Total revenue(1) | | $ | 147,631 | | $ | 96,534 | | $ | 340,289 | | $ | 267,651 |
Fuel surcharge | | | 9,756 | | | 5,588 | | | 23,620 | | | 15,024 |
Operating revenue, net of fuel surcharge | | $ | 137,875 | | $ | 90,946 | | $ | 316,669 | | $ | 252,627 |
| | | | | | | | | | | | |
Total operating expenses | | $ | 140,472 | | $ | 90,795 | | $ | 327,533 | | $ | 252,962 |
Fuel surcharge | | | 9,756 | | | 5,588 | | | 23,620 | | | 15,024 |
Impairment | | | — | | | 1,195 | | | — | | | 1,195 |
Net impact of step-up in basis of acquired assets | | | 3,033 | | | 1,040 | | | 6,200 | | | 3,076 |
Adjusted operating expenses | | $ | 127,683 | | $ | 82,972 | | $ | 297,713 | | $ | 233,667 |
| | | | | | | | | | | | |
Operating ratio | | | 95.2% | | | 94.1% | | | 96.3% | | | 94.5% |
Adjusted operating ratio | | | 92.6% | | | 91.2% | | | 94.0% | | | 92.5% |
(1)Includes intersegment revenues and expenses, as applicable, which are eliminated in the Company’s consolidated results.
Liquidity and Capital Resources and Capital Requirements
Overview
The Company’s business requires substantial amountsCompany had the following sources of cash to cover operating expenses as well as to fund items such as cash capital expenditures on its fleetliquidity available at September 30, 2019 and other assets, working capital changes, principal and interest payments on debt obligations, letters of credit to support insurance requirements and tax payments. The Company expects net capital expenditures to be approximately $35.0 million for 2017.December 31, 2018.
| | | | | | |
(Dollars in millions) | | September 30, 2019 | | December 31, 2018 |
| | | | | | |
Cash | | $ | 79.6 | | $ | 46.0 |
Working capital surplus | | | 77.8 | | | 131.7 |
Availability under line of credit | | | 84.6 | | | 87.8 |
Total | | $ | 242.0 | | $ | 265.5 |
The Company’s primary sources of liquidity have been provided by operations, issuances of capital stock and borrowings under its credit facility. The Company had the following sources of liquidity available at September 30, 2017 and December 31, 2016.
| | | | | | |
(In thousands) | | September 30, 2017 | | December 31, 2016 |
| | | | | | |
Cash | | $ | 112,510 | | $ | 3,695 |
Availability under line of credit | | | 70,000 | | | 32,958 |
Total | | $ | 182,510 | | $ | 36,653 |
Cash increased by $108.8 million from December 31, 2016 to September 30, 2017. This increase primarily resulted from proceeds of new debt financing and equities issued, net of debt repayments and share repurchases, in conjunction with the Business Combination. Net proceeds totaled $34.7 million. See Note 2 of Notes to Consolidated Financial Statements for more information. Additionally, on September 19, 2017,facilities. In February 2018, the Company raised $63.6 million fromcompleted an underwritten public offering of 5,675,9678,625,000 shares of the Company’s common stock for its common stock.own account. After deducting underwriting discounts and commissions and offering expenses payable by the Company, the Company received approximately $84.4 million of net proceeds from the offering, which the Company has been using for general corporate purposes, which may include, among other things, working capital, capital expenditures, debt repayment or refinancing, and support the Company’s acquisition strategy. See Note 11 of the Notes to the Consolidated Financial Statements for more information.
Cash increased by $33.6 million during the nine months ended September 30, 2019 as compared to December 31, 2018. This increase primarily resulted from net cash provided by operating activities. See below for more information.
As of September 30, 2017,2019 and December 31, 2018, the Company had a working capital surplus of $77.8 million and $131.7 million, respectively. The decrease in working capital surplus is due to the adoption of ASC 842 – Leases which increased other current liabilities by $28.4 million and increased accrued liabilities by $25.6 million.
As of September 30, 2019, the Company had no borrowings on its $100.0 million asset-based revolving line of credit (ABL Facility) and $13.9 million in outstanding letters of credit (discussed below), leaving $84.6 million available under the ABL Facility.
The Company has from time to time considered the possibility of a private offering of securities, which would not be registered under the Securities Act of 1933, as amended (the Securities Act), and which would be offered only to qualified institutional buyers pursuant to Rule 144A under the Securities Act and to persons outside the United States pursuant to Regulation S under the Securities Act. The proceeds of such an offering may be used for general corporate purposes, including the repayment of all or a portion of the Company’s term loan credit facility, repayment of outstanding balances on the ABL facility and to support the Company’s acquisition strategy. Also, in connection with such offering, the Company’s credit facilities may be amended or refinanced. There can be no assurance that the Company will conduct or complete such an offering.
The Company’s business requires substantial amounts of cash for operating expenses, including salaries and wages paid to employees, contract payments to independent contractors, insurance and claims payments, tax payments, and others. The Company also uses large amounts of cash and credit for the following activities:
Capital Expenditures
The Company follows a dual strategy of both owning assets and employing asset-light activities, the latter of which reduces the capital expenditures required to operate the business. Asset-light activities are conducted utilizing tractors and trailers provided by owner-operators and third-party carriers for significant portions of our flatbed and specialized services. Company-owned asset expenditures require substantial cash and financing (including finance and operating leases) to maintain a modern tractor fleet, refresh the trailer fleet, fund replacement and or growth in the revenue equipment fleet, and for the acquisition of real property and improvements to existing terminals and facilities. The Company had net cash capital receipts of approximately $6.4 million and financed $65.6 million of non-cash capital expenditures for the nine months ended September 30, 2019. The Company had the following capital assets activity in 2019 and 2018:
| | | | | | |
| | Nine Months Ended September 30, |
(Dollars in millions) | | 2019 | | 2018 |
| | | | | | |
Net cash capital expenditures (receipts) | | $ | (6.4) | | $ | 43.3 |
Total financed capital expenditures | | | 65.6 | | | 36.1 |
Accrued capital expenditures | | | — | | | 5.9 |
Transfers of property and equipment to sales-type lease assets | | | — | | | (8.4) |
Transfers of sales-type lease assets to property and equipment | | | — | | | 0.5 |
Property and equipment sold for notes receivable | | | (0.4) | | | (0.4) |
Total net capital assets additions | | $ | 58.8 | | $ | 77.0 |
The decrease in total net capital assets additions is due to timing of the Company’s replacement cycle for revenue equipment.
Additionally, the Company entered into operating leases for revenue equipment with terms of 2 to 5 years and real property with terms of 1.5 to 10 years having asset values at lease inception of $23.2 million and $10.3 million, respectively, for the nine months ended September 30, 2019.
ABL and Term Loan Facilities and Equipment Financing Agreements
As of September 30, 2019, the Company had (i) a $350.0$500.0 million senior secured term loan credit facility, consisting of a $250.0 million term loan, a $150 million tack-on loan and up to $100.0 million of term loans funded under a delayed draw term loan facility, and (ii) an asset-based senior secured revolving credit facility with an aggregate maximum credit amount equal to $70.0$100.0 million (subject to availability under a borrowing base). The delayed draw term loans are availablewere used to support the Company’s acquisition activities. See Note 9 of Notes to Consolidated Financial Statements for more information regarding the Term Loan Facility and the ABL Facility, the Senior Term Loan and the Line of Credit.Facility.
On August 16, 2017,The Company had $194.2 million of term loans and $26.0 million of finance leases collateralized primarily by revenue equipment, with terms of 48 to 60 months. Certain of the term loans contain conditions, covenants, representations and warranties, events of default, and indemnification provisions applicable to the Company obtained an amendmentand certain of its subsidiaries that are customary for equipment financings, including, but not limited to, limitations on the Term Loan Facility that increasedincurrence of additional debt and the delayed draw incurrence condition relatingprepayment of existing indebtedness, certain payments (including dividends and other distributions to pro forma total leverage ratiopersons not party to 4.25x from 3.50x, effective August 16, 2017 through the maturityits ABL Facility) and transfers of the delayed draw term loan facility in February 2018, which enabled the Company to access $60.5 million from the delayed draw term loan facility in the three months ended September 30, 2017. The Term Loan Facility amendment also increased the total leverage ratio covenant for the test periods ending September 30, 2017 and December 31, 2017 to 4.75x from 4.25x, with step-downs reverting to pre-amendment levels beginning in the test period ending March 31, 2018. On August 31, 2017, the Company obtained an amendment to the ABL Facility that, among other things, similarly modified the total leverage ratio covenant thereunder.
assets.
The Company believes it can finance its expected cash needs, including debt repayment, in the short-term with cash flows from operations and borrowings available under the ABL Facility. The Company expects that the Term Loan Facility and ABL Facility will provide sufficient credit availability to support its ongoing operations, fund its new debt service requirements, capital expenditures, and working capital needs. Over the long-term, the Company will continue to have significant capital requirements, and expects to devote substantial financial resources to grow its operations and fund its acquisition activities. As a result of these funding requirements, the Company likely will need to sell additional equity or debt securities or seek additional financing through additional borrowings, lease financing or equity capital.capital, though it is not likely that the Company will issue any common stock in the near term. The availability of financing or equity capital will depend upon the Company’s financial condition and results of operations as well as prevailing market conditions. If such additional borrowings, lease financing or equity capital is not available at the time it needs to incur such expenditures, then the Company may be required to extend the maturity of then outstanding indebtedness, rely on alternative financing arrangements or engage in asset sales.
Cash FlowsLetters of credit – Under the terms of the ABL Facility, lenders may issue up to $20 million of standby letters of credit on our behalf. Outstanding letters of credit reduce the availability on the $100 million ABL Facility. Standby letters of credit are generally issued for the benefit of regulatory authorities, insurance companies and state departments of insurance for the purpose of satisfying certain collateral requirements, primarily related to automobile, workers’ compensation, and general insurance liabilities.
Business combinations – The Company’s summary statementsstrategy has historically been to consolidate the open-deck transportation industry and it has used significant amounts of capital to acquire 20 businesses since Daseke Companies, Inc.’s inception in 2008. However, during 2019, the Company intends to focus on organic growth, increasing free cash flows information for the nine months ended September 30, 2017flow and 2016 is set forth in the table below:
| | | | | | |
| | Nine Months Ended September 30, |
(In thousands) | | 2017 | | 2016 |
| | | | | | |
Net cash provided by operating activities | | $ | 26,458 | | $ | 49,108 |
Net cash provided by (used in) investing activities | | $ | (101,446) | | $ | 1,281 |
Net cash provided by (used in) financing activities | | $ | 183,833 | | $ | (50,506) |
Operating Activities. Cash provided by the Company’s operating activities consists of net loss adjusted for certain non-cash items, including depreciation and amortization, deferred interest, gain/loss on disposal of property and equipment, deferred income taxes, deferred gain and interest recognized on sales-type leases, stock-based compensation, bad debt expense and the effect of changes in working capital and other activities.
Cash provided by operating activities was $26.5 million during the nine months ended September 30, 2017 and consisted of $11.8 million of net loss plus $59.3 million of non-cash items, consisting primarily of depreciation, amortization and stock-based compensation, partially offset by $4.8 million in deferred taxes, less $16.2 million of net cash used for working capital and other activities. Cash used for working capital and other activities during the nine months ended September 30, 2017 primarily reflect a $28.6 million increase in accounts receivable, $3.8 million in payments received on sales-type leases, and a $8.4 million increase in accounts payable and accrued expenses. Cash provided by operating activities was $49.1 million during the nine months ended September 30, 2016 and consisted of $1.5 million of net loss plus $53.3 million of non-cash items, consisting primarily of depreciation and amortization, less $2.4 million of net cash used for working capital and other activities. Cash used for working capital and other activities during the nine months ended September 30, 2016 primarily reflect a $7.2 million increase in accounts receivable, driver advances and other receivables, a $1.3 million decrease in accounts payable and accrued expenses, offset by a $3.5 million decrease in prepaid expenses and other assets and $2.8 million in payments received on sales-type leases.
The $22.9 million decrease in cash provided by operating activities during the nine months ended September 30, 2017 as compared with the nine months ended September 30, 2016, excluding the Recent Acquisitions, was primarily the result of a $4.7 million increase in net loss, a $4.1 million decrease in deferred tax liabilities, a $2.2 million decrease in depreciation, and a $10.9 million increase in net cash used for working capital and other activities.
Investing Activities. Cash flows from investing activities decreased from $1.3 million provided by investing activities for the nine months ended September 30, 2016margins, but will continue to $101.4 million used in investing activities for the nine months ended September 30, 2017 due to net cash paid for acquisitions of $91.1 million and an increase in net purchases of revenue equipment of $11.6 million in the nine months ended September 30, 2017 compared to the same period in 2016.
evaluate potential tuck-in
Total net capital expenditures fortransactions of its subsidiaries and any other sources of growth it considers in the nine months ended September 30, 2017 and 2016 are shown below:best interest of the Company.
| | | | | | |
| | Nine Months Ended September 30, |
(In thousands) | | 2017 | | 2016 |
| | | | | | |
Revenue equipment (tractors, trailers and trailer accessories) | | $ | 14,391 | | $ | 1,904 |
Buildings and building improvements | | | 174 | | | 401 |
Other | | | 1,000 | | | 838 |
Total cash capital expenditures | | $ | 15,565 | | $ | 3,143 |
Less: Proceeds from sales of property and equipment | | | 5,252 | | | 4,424 |
Net cash capital (proceeds) expenditures(1) | | $ | 10,313 | | $ | (1,281) |
| (1)
| | The Company acquires property and revenue equipment with debt and capital lease obligations. For the nine months ended September 30, 2017 and 2016, the Company incurred $13.6 million and $32.5 million, respectively, of debt and capital lease obligations to acquire property and revenue equipment.
|
The following tables provide details on the cash and noncash components of gross capital expenditures for the Company’s reportable segments for the three and nine months ended September 30, 2017 and 2016 (in thousands):
| | | | | | | | | | | | |
| | Flatbed | | Specialized | | | | | | |
| | Solutions | | Solutions | | Corporate/ | | Consolidated |
| | Segment | | Segment | | Eliminations | | Total |
Three Months Ended September 30, 2017 | | | | | | | | | | | | |
Cash flows from investing activities | | | | | | | | | | | | |
Purchases of property and equipment | | $ | 2,297 | | $ | 6,407 | | $ | 55 | | $ | 8,759 |
Proceeds from sale of property and equipment | | | (110) | | | (2,190) | | | — | | | (2,300) |
| | | | | | | | | | | | |
Noncash investing and financing activities | | | | | | | | | | | | |
Property and equipment acquired with debt or capital lease obligations | | | 2,298 | | | 6,172 | | | — | | | 8,470 |
Gross capital expenditures | | $ | 4,485 | | $ | 10,389 | | $ | 55 | | $ | 14,929 |
| | | | | | | | | | | | |
| | | | | | | | | | | | |
Three Months Ended September 30, 2016 | | | | | | | | | | | | |
Cash flows from investing activities | | | | | | | | | | | | |
Purchases of property and equipment | | $ | 326 | | $ | 1,029 | | $ | 19 | | $ | 1,374 |
Proceeds from sale of property and equipment | | | (164) | | | (281) | | | — | | | (445) |
| | | | | | | | | | | | |
Noncash investing and financing activities | | | | | | | | | | | | |
Property and equipment acquired with debt or capital lease obligations | | | 7,698 | | | 1,922 | | | — | | | 9,620 |
Gross capital expenditures | | $ | 7,860 | | $ | 2,670 | | $ | 19 | | $ | 10,549 |
| | | | | | | | | | | | |
| | | | | | | | | | | | |
| | Flatbed | | Specialized | | | | | | |
| | Solutions | | Solutions | | Corporate/ | | Consolidated |
| | Segment | | Segment | | Eliminations | | Total |
Nine Months Ended September 30, 2017 | | | | | | | | | | | | |
Cash flows from investing activities | | | | | | | | | | | | |
Purchases of property and equipment | | $ | 2,521 | | $ | 12,941 | | $ | 103 | | $ | 15,565 |
Proceeds from sale of property and equipment | | | (707) | | | (4,545) | | | — | | | (5,252) |
| | | | | | | | | | | | |
Noncash investing and financing activities | | | | | | | | | | | | |
Property and equipment acquired with debt or capital lease obligations | | | 4,839 | | | 8,770 | | | — | | | 13,609 |
Gross capital expenditures | | $ | 6,653 | | $ | 17,166 | | $ | 103 | | $ | 23,922 |
| | | | | | | | | | | | |
| | | | | | | | | | | | |
Nine Months Ended September 30, 2016 | | | | | | | | | | | | |
Cash flows from investing activities | | | | | | | | | | | | |
Purchases of property and equipment | | $ | 688 | | $ | 2,299 | | $ | 156 | | $ | 3,143 |
Proceeds from sale of property and equipment | | | (2,756) | | | (1,668) | | | — | | | (4,424) |
| | | | | | | | | | | | |
Noncash investing and financing activities | | | | | | | | | | | | |
Property and equipment acquired with debt or capital lease obligations | | | 15,019 | | | 17,498 | | | — | | | 32,517 |
Gross capital expenditures | | $ | 12,951 | | $ | 18,129 | | $ | 156 | | $ | 31,236 |
Financing Activities. Cash flows from financing activities increased from $50.5 million used in financing activities for the nine months ended September 30, 2016 to $183.8 million provided by financing activities for the nine months ended September 30, 2017. This increase was primarily a result of a recapitalization and refinancing of outstanding long-term debt in conjunction with the Business Combination. The recapitalization included $64.6 million of proceeds upon issuance of common stock and $65.0 million of proceeds upon issuance of Series A Preferred Stock, partially offset by $36.2 million in repurchases of common stock. Cash inflows from the recapitalization and proceeds from a new $250.0 million term loan (discussed under Material Debt below) were utilized in part for repayments of $66.7 million in subordinated debt, $211.1 million in long-term debt, $16.7 million on the line of credit and $14.2 million in financing fees. Excluding cash flows from the Business Combination, cash flows from financing activities included $6.9 million net repayments on the line of credit, $100.0 million advance on the delayed draw term loan facility, net of $16.6 million in repayments of long-term debt, $3.7 million Series A and Series B Preferred Stock dividends and proceeds of $63.6 million for the September 2017 issuance of common stock.
Material Debt
Overview
As of September 30, 2017,2019, the Company had the following material debt:
| · | | the Term Loan Facility and the ABL Facility; |
| · | | secured equipment loans and capitalfinance lease agreements; and |
| · | | bank mortgage secured by real estateestate. |
The amounts outstanding under such agreements were as follows as of September 30, 20172019 (in thousands)millions):
| | | | | | |
Term Loan Facility | | $ | 348,462 | | $ | 489.7 |
Mortgages | | | 3,730 | | | 3.3 |
Equipment term loans and capital leases | | | 83,478 | |
Equipment term loans | | | | 194.2 |
Finance lease obligations | | | | 26.0 |
Total long-term debt and capital leases | | | 435,670 | | | 713.2 |
Less: current portion | | | (26,514) | | | (61.6) |
Long-term debt and capital leases, less current portion | | $ | 409,156 | |
Long-term debt and finance leases obligations, less current portion | | | $ | 651.6 |
See Note 2 and Note 9 of the Notes to Consolidated Financial Statements included herein for information regarding the Company’s material debt.debt and finance lease obligations, respectively.
Off-Balance Sheet Arrangements
TheInformation about the Company’s financial condition, results of operations, liquidity, capital expenditures and capital resources are not materially affected by off-balance sheet transactions. Daseke had stand-bystandby letters of credit in the amount of $11.1 million at September 30, 2017. The letters of credit provide collateral primarily for liability insurance claims. Also, the Company leases certain revenue equipment, terminals and office building facilities under non-cancelable operating leases. Daseke’s rent expense under these leases for the nine months ended September 30, 2017 was approximately $17.2 million.
At September 30, 2017, there were 17,520,33217,520,329 shares of common stock issuable upon exercise of outstanding warrants.warrants is included in Note 14 and Note 11, respectively, of Notes to Consolidated Financial Statements included herein. See also Liquidity and Capital Resources above.
Cash Flows
The Company’s summary statements of cash flows information for the nine months ended September 30, 2019 and 2018 is set forth in the table below:
| | | | | | |
| | Nine Months Ended September 30, |
(Dollars in millions) | | 2019 | | 2018 |
| | | | | | |
Net cash provided by operating activities | | $ | 89.4 | | $ | 46.8 |
Net cash provided by (used in) investing activities | | $ | 6.4 | | $ | (175.1) |
Net cash provided by (used in) financing activities | | $ | (61.9) | | $ | 55.7 |
Operating Activities. Cash provided by the Company’s operating activities consists of net income or loss adjusted for certain non-cash items, including depreciation and amortization, deferred interest, gain/loss on disposal of property and equipment, deferred income taxes, deferred gain, non-cash operating lease expense, stock-based compensation, bad debt expense and the effect of changes in working capital and other activities.
Cash provided by operating activities was $89.4 million during the nine months ended September 30, 2019 and consisted of $289.0 million of net loss plus $400.4 million of non-cash items, consisting primarily of depreciation, amortization, non-cash operating lease expense, write-off of deferred financing fees, impairment, restructuring costs and stock-based compensation, less $22.0 million of net cash used for working capital and other activities. Cash used for working capital and other activities during the nine months ended September 30, 2019 reflect increases of $23.5 million in accounts receivable, $2.4 million in drivers’ advances and other receivables and $2.3 million in prepaid and other current assets, offset by a $1.8 million increase in accounts payable and $4.4 million increase in accrued expenses and other liabilities. Cash provided by operating activities was $46.8 million during the nine months ended September 30, 2018 and consisted of $14.9 million of net income plus $81.7 million of non-cash items, consisting primarily of depreciation, amortization, deferred taxes and stock-based compensation, less $49.8 million of net cash used for working capital and other activities. Cash used for working capital and other activities during the nine months ended September 30, 2018 primarily reflects a $57.5 million increase in accounts receivable, a $9.5 million increase in prepaid and other current assets, offset by a $5.6 million increase in accounts payable and accrued expenses and $10.5 million in payments received on sales-type leases.
The $42.6 million increase in cash provided by operating activities during the nine months ended September 30, 2019, as compared with the nine months ended September 30, 2018, was primarily the result of a $303.9 million increase in net loss, reduced by a $25.5 million increase in depreciation, $6.9 million in restructuring, $2.0 million in write-off of deferred financing fees, a $304.0 million increase in impairment and a $19.7 million increase in non-cash operating lease expense, increased by a $44.3 million decrease in deferred tax benefit. Net cash provided by working capital increased $27.8 million and other increases were $2.0 million for deferred gain recognized on sales-type leases and $0.8 million for the gain on disposition of building during the nine months ended September 30, 2018 which did not occur during the nine months ended September 30, 2019.
Investing Activities. Cash flows from investing activities increased from $175.1 million used in investing activities due to $131.8 million cash paid for Recent Acquisitions and net cash equipment purchases of $43.3 million for the nine months ended September 30, 2018 to $6.4 million provided by investing activities for the nine months ended September 30, 2019 due to a decrease of $41.4 million in cash equipment purchases and an increase of $8.3 million in cash receipts from sales of revenue equipment for the nine months ended September 30, 2019.
Total net cash capital expenditures (receipts) for the nine months ended September 30, 2019 and 2018 are shown below:
| | | | | | |
| | Nine Months Ended September 30, |
(Dollars in millions) | | 2019 | | 2018 |
| | | | | | |
Revenue equipment (tractors, trailers and trailer accessories) | | $ | 13.0 | | $ | 46.8 |
Buildings and building improvements | | | 1.5 | | | 8.4 |
Other | | | 2.9 | | | 3.6 |
Total cash capital expenditures | | | 17.4 | | | 58.8 |
Less: Proceeds from sales of property and equipment | | | 23.8 | | | 15.5 |
Net cash capital expenditures (receipts) | | $ | (6.4) | | $ | 43.3 |
Financing Activities. Cash flows from financing activities decreased from $55.7 million provided by financing activities for the nine months ended September 30, 2018 to $61.9 million used in financing activities for the nine months ended September 30, 2019. This decrease was primarily a result of proceeds of $84.2 million from issuance of common stock in the nine months ended September 30, 2018 and net debt repayments of $23.8 million. Cash flows from financing activities for the nine months ended September 30, 2019 included repayments of $57.8 million of long-term debt.
Inflation
Inflation can have an impact on the Company’s operating costs. A prolonged period of inflation could cause interest rates, fuel, wages and other costs to increase, which would adversely affect the Company’s results of operations unless freight rates correspondingly increase. The Company attempts to limit the effects of inflation through increases in freight rates, certain cost control efforts and limiting the effects of fuel prices through fuel surcharges and measures intended to reduce the consumption of fuel. Over the past three fiscal years, the effect of inflation has been immaterial.
Seasonality
In the transportation industry, results of operations generally show a seasonal pattern. The Company’s productivity decreases during the winter season because inclement weather impedes operations, end-users reduce their activity and certain shippers reduce their shipments during winter. At the same time, operating expenses increase and fuel efficiency decreases because of engine idling and harsh weather creating higher accident frequency, increased claims and higher equipment repair expenditures. The Company also may suffer from weather-related or other events such as tornadoes, hurricanes, blizzards, ice storms, floods, fires, earthquakes and explosions. These events may disrupt fuel supplies, increase fuel costs, disrupt freight shipments or routes, affect regional economies, destroy the Company’s assets, increase insurance costs or adversely affect the business or financial condition of its customers, any of which could adversely affect the Company’s results of operations or make such results more volatile.
Critical Accounting Policies
The Company’s significant accounting policies are described in Note 1 of Notes to Consolidated Financial Statements in the Company’s CurrentAnnual Report on Form 8-K/A10-K filed on March 16, 2017.8, 2019. The Company considers certain of these accounting policies to be “critical” to the portrayal of the Company’s financial position and results of operations, as they require the application of significant judgment by management. As a result, they are subject to an inherent degree of uncertainty. The Company identifies and discusses these “critical” accounting policies in the Management’s Discussion and Analysis of Financial Condition and Results of Operations section of the Company’s Current reportAnnual Report on Form 8-K/A10-K filed on March 16, 2017.8, 2019. Management bases its estimates and judgments on historical experience
and on various other factors that management believes to be reasonable under the circumstances, the results of which form the basis for making judgments about the carrying values of assets and liabilities that are not readily apparent from other sources. Actual results may differ from these estimates under different assumptions or conditions. On an ongoing basis, management evaluates its estimates and judgments, including those considered “critical.” Management has discussed the development, selection and evaluation of accounting estimates, including those deemed “critical,” and the associated disclosures in this Quarterly Report on Form 10-Q with the Audit Committee of the Company’s board of directors.
Item 3. Quantitative and Qualitative Disclosures About Market Risk
There have been no material changes in the Company’s market risk since December 31, 2016.2018. For further information on the Company’s market risk, refer to “Item 2.01. Completion of Acquisition or Disposition of Assets—Management’s Discussion and Analysis of Financial Condition and Results of Operations and Quantitative and Qualitative Disclosures About Market Risk—7A. Quantitative and Qualitative Disclosures About Market Risk” in the Company’s CurrentAnnual Report on Form 8-K/A10-K filed on March 16, 2017.8, 2019.
Item 4. Controls and Procedures
On February 27, 2017, Hennessy consummated the merger of Hennessy’s wholly-owned subsidiary, HCAC Merger Sub, Inc., with and into Daseke, Inc., with Daseke, Inc. surviving as a direct wholly-owned subsidiary of Hennessy. Upon the closing of the Business Combination on February 27, 2017, the sole business conducted by the Company is the business conducted by Daseke. Also, as a result of the Business
Combination, the internal control over financial reporting utilized by Daseke prior to the Business Combination became the internal control over financial reporting of the Company.
Evaluation of Disclosure Controls and Procedures
The Company carried outDisclosure controls and procedures are designed to ensure that information required to be disclosed in the Company’s reports filed or submitted under the Securities Exchange Act of 1934, as amended (the Exchange Act) is recorded, processed, summarized and reported within the time periods specified in the SEC’s rules and forms. Disclosure controls and procedures are designed, without limitation, to ensure that information required to be disclosed in company reports filed or submitted under the Exchange Act is accumulated and communicated to management, including the Company’s principal executive and financial officer, to allow timely decisions regarding required disclosure.
As of the end of the period covered by this Quarterly Report on Form 10-Q, the Company’s management conducted an evaluation, under the supervision and with the participation of its management, including the Chief Executive Officerprincipal executive and Chief Financial Officer,financial officer, of the effectiveness of the design and operation of the Company’s “disclosuredisclosure controls and procedures”procedures (as defined in Rule 13a-15(e) of the Securities and Exchange Act Rule 13a-15(e)) as of the end of the period covered by1934 (the Exchange Act)). Based on this report. Based upon that evaluation, the Chief Executive Officerprincipal executive and Chief Financial Officerfinancial officer concluded, due to material weaknesses in our internal control over financial reporting as described below, that the Company’sour disclosure controls and procedures were not effective as of September 30, 2017.2019.
During the quarter ended September 30, 2019 we determined management’s review of the completeness and accuracy of the impairment analysis prepared in coordination with our third-party valuation specialist did not operate at a sufficient level of precision to prevent or detect a material misstatement. Management considers this control deficiency to be a material weakness.
We are committed to remediating the control deficiency that gave rise to the material weakness described above. Management is responsible for implementing changes and improvements to internal control over financial reporting and for remediating the control deficiency that resulted in the material weakness.
With oversight from the Audit Committee, we will take significant steps to remediate our internal control deficiency in determining and recording asset impairments by enhancing our controls to ensure a proper level of review related to the completeness and accuracy of the specialist’s deliverables.
Some of the key remediation actions will include:
• Reviewing our impairment processes and controls to enhance the overall design of procedures performed on deliverables from the specialist
• Enhancing our management review controls to improve the precision of review around the key assumptions and inputs into the specialist’s models and resulting valuations and allocations
To complete the remediation, we plan, with oversight from the Audit Committee, to continue to:
• Evaluate the sufficiency of our accounting resources and personnel to determine whether additional resources are needed
• Evaluate whether further enhancements are needed to the design of our impairment procedures and controls
• Demonstrate consistent operating effectiveness of our management review controls over our asset impairment process over a sufficient time period
The material weakness will not be considered remediated until the applicable remedial controls operate for a sufficient period of time and management has concluded, through testing, that these controls are operating effectively. We expect that the remediation of this material
weakness will be completed in fiscal year 2020 due to the timing of the Company’s annual goodwill impairments testing date as of October 1 of each year.
Management’s Remediation
As previously described in Item 9A of our Annual Report on Form 10-K for the year ended December 31, 2018, we began implementing remediation plans to address the material weaknesses. The weaknesses will not be considered remediated, until the applicable controls operate for a sufficient period of time and management has concluded, through testing, that these controls are operating effectively. We expect that the remediation of these material weaknesses will be completed by the end of fiscal 2019.
Changes in Internal Control over Financial Reporting
There wereExcept as noted above, there have been no changes in the Company’sour internal control over financial reporting (as defined in RuleRules 13a-15(f) or 15d-15(f) of the Exchange Act) that occurred during the nine months ended September 30, 2017third quarter of fiscal 2019 that have materially affected, or are reasonably likely to materially affect, the Company’s internal control over financial reporting.
PART II. OTHER INFORMATION
Item 1. Legal Proceedings
The Company is party to a variety of legal proceedingsand its subsidiaries are involved in litigation and claims primarily arising in the normal course of business. Whilebusiness, which include claims for personal injury or property damage incurred in the resultstransportation of these proceedings cannot be predicted with certainty,freight. Based on its knowledge of the final outcomefacts and, in certain cases, advice of these proceedings areoutside counsel, the Company believes the resolution of claims and pending litigation will not expected to have a material adverse effect on the Company’s financial position, results of operations or cash flows.
Item 1A. Risk Factors
ThereOther than the risk factor included below, there have been no material changes in the risks facing the Company as described in the Company’s CurrentAnnual Report on Form 8-K10-K filed on March 3, 2017, as amended8, 2019.
We may not realize all the expected benefits of our restructuring plan and our restructuring plan may adversely affect our business operations.
In 2019, we initiated a plan to integrate three operating segments with three other operating segments (the Plan), which will reduce the number of our operating segments from 16 to 13. We have undertaken the Plan in an effort to streamline and reduce the Company’s cost structure, improve asset utilization and capitalize on March 16, 2017operational synergies. Additionally, the Company announced the planned implementation of Business Improvement Plans (BIP), which are expected to increase profitability by right-sizing trailer-to-tractor ratios, yielding management capacity allocations, and May 4, 2017.improving maintenance execution. In conjunction with its accelerated operational/cost improvement plan, the Company has also executed a new management restructuring and substantial corporate cost reduction plan. The Plan, BIP and corporate restructuring could result in significant disruptions to our operations, including adversely affecting the successful implementation and completion of our strategic objectives and the results of our operations. If we do not fully realize or maintain the anticipated benefits of the Plan, BIP and corporate restructuring, our business, financial condition and results of operations could be adversely affected.
Item 2. Unregistered Sales of Equity Securities and Use of Proceeds5. Other Information
DuringOn July 30, 2019, the Company internally announced a plan to integrate three operating segments with three other operating segments (the Plan), which will reduce the number of operating segments from 16 to 13. As a result of the Plan, Builders Transportation will merge into Hornady Transportation, Moore Freight Service into E.W. Wylie, and the Schilli Companies into Lone Star Transportation. The Plan is being implemented to streamline and reduce the Company’s cost structure, improve asset utilization and capitalize on operational synergies. Additionally, the Company announced the planned implementation of Business Improvement Plans, which are expected to increase profitability by right-sizing trailer-to-tractor ratios, yielding management capacity allocations, and improving maintenance execution. On September 4, 2019, the Company announced a comprehensive restructuring plan (Project Pivot) intended to reduce its cost base, right size its organization and management team and increase and accelerate its previously announced operational improvement goals. As part of Project Pivot, the Company executed a new management restructuring and substantial corporate cost reduction plan.The Company recorded $6.8 million of business transformation costs and $6.9 million restructuring expenses in connection with these three strategic actions in the three months ended September 30, 2017, in connection with,2019 and as partial consideration for, certain acquisitions,expects to incur the Company issued shares of common stock that were not registered under the Securities Act of 1933, as amended (the Securities Act), in reliance on the private offering exemption of Section 4(a)(2)majority of the Securities Act orestimated remaining $3.0 million of business transformation costs and $1.5 million of restructuring expenses through the private offering safe harbor provisionend of Rule 506 of Regulation D promulgated thereunder based on the following factors: (i) the number of offerees or purchasers, as applicable, (ii) the absence of general solicitation, (iii) investment representations obtained from those receiving shares offiscal 2019. Any changes to these three actions will be reflected the Company’s common stock, including with respect to their status as accredited investors, (iv) the provisionour future results of appropriate disclosure, and (v) the placement of restrictive legends on the certificates reflecting the securities. For additional information, see Note 3 of Notes to Consolidated Financial Statements.
operations.
Item 6. Exhibits
EXHIBIT INDEX
| | |
Exhibit No. | | Exhibit |
3.1
| |
3.1 | Second Amended and Restated Certificate of Incorporation (incorporated by reference to Exhibit 3.1 to the Current Report on Form 8-K filed by the registrant on March 3, 2017). |
| |
3.2 | By-Laws (incorporated by reference to Exhibit 3.1 to the Current Report on Form 8-K filed by the registrant on May 25, 2018). |
| |
3.2
| 3.3 | Certificate of Designations, Preferences, Rights and Limitations of 7.625% Series A Convertible Cumulative Preferred Stock (incorporated by reference to Exhibit 3.2 to the registrant’s Current Report on Form 8-K filed by the registrant on March 3, 2017). |
| | |
3.3
| 10.1*+ | Bylaws (incorporated by referenceFirst Amendment to Exhibit 3.3 to the registrant’s registration statementDaseke, Inc. 2017 Omnibus Incentive Plan (as amended and restated on Form S-1 (File No. 333-205152) filed by the registrant on June 22, 2015).May 26, 2017, effective as of February 27, 2017), effective as of September 6, 2019.
|
| | |
10.1
| 10.2+ | Amendment No. 1 to Term LoanSeparation Agreement, dated as of August 16, 2017, among26, 2019, by and between Don R. Daseke Companies, Inc.,and Daseke, Inc., Credit Suisse AG, Cayman Islands Branch, as administrative agent and collateral agent, and the lenders party thereto (incorporated by reference to Exhibit 10.1 to the Current Report on Form 8-K filed by the registrant on August 22, 2017)29, 2019).
|
| | |
10.2*
| 10.3+ | First Amendment to Fifth Amended and Restated Revolving Credit and SecuritySeparation Agreement, dated as of August 31, 2017,September 4, 2019, by and amongbetween Scott Wheeler and Daseke, Inc. Daseke Companies, Inc., each of its subsidiaries party thereto,(incorporated by reference to Exhibit 10.1 to the lenders party thereto and PNC Bank, National Association.Current Report on Form 8-K filed by the registrant on September 4, 2019).
|
| |
10.4+ | Transition and Separation Agreement, dated as of September 3, 2019, by and between Bharat Mahajan and Daseke, Inc. (incorporated by reference to Exhibit 10.2 to the Current Report on Form 8-K filed by the registrant on September 4, 2019). |
| |
10.5*+ | First Amendment to Employment Agreement, effective as of September 6, 2019, by and between Christopher Easter and Daseke, Inc. |
| |
10.6*+ | Non-Qualified Stock Option Award Agreement, dated September 6, 2019, by and between Christopher Easter and Daseke, Inc. |
| |
10.7*+ | Employment Agreement, dated as of September 19, 2019, by and between Brian Bonner and Daseke Inc. |
| |
10.8*+ | Restricted Stock Unit Award Agreement, dated as of September 19, 2019, by and between Brian Bonner and Daseke Inc. |
| |
31.1* | | Chief Executive Officer certification under Section 302 of Sarbanes-Oxley Act of 2002. |
| | |
31.2* | | Chief Financial Officer certification under Section 302 of Sarbanes-Oxley Act of 2002. |
| | |
32.1** | | Chief Executive Officer certification under Section 906 of Sarbanes-Oxley Act of 2002. |
| | |
32.2** | | Chief Financial Officer certification under Section 906 of Sarbanes-Oxley Act of 2002. |
| | |
101.INS* | | XBRL Instance Document. |
| | |
101.SCH* | | XBRL Taxonomy Extension Schema Document. |
| | |
101.CAL* | | XBRL Taxonomy Extension Calculation Linkbase Document. |
| | |
101.DEF* | | XBRL Taxonomy Extension Definition Linkbase Document. |
| | |
101.LAB* | | XBRL Taxonomy Extension Label Linkbase Document. |
| | |
101.PRE* | | XBRL Taxonomy Extension Presentation Linkbase Document. |
_____________________________
| |
* | Filed herewith. |
** | Furnished herewith. |
+ | Management contract or compensatory plan or arrangement. |
SIGNATURES
Pursuant to the requirements of the Securities Exchange Act of 1934, the registrant has duly caused this report to be signed on its behalf by the undersigned thereunto duly authorized.
| | |
DateDate: November 9, 201712, 2019
| DASEKE, INC. |
| | |
| By: | /s/ R. Scott WheelerChristopher Easter |
| Name: | R. Scott WheelerChristopher Easter
|
| Title: | Interim Chief Executive Vice PresidentOfficer and Chief FinancialOperating Officer |
| | (On behalf of the Registrant and as the Registrant’s Principal FinancialExecutive |
| | Officer) |