
| ☑ | QUARTERLY REPORT PURSUANT TO SECTION 13 OR 15 (d) OF THE SECURITIES EXCHANGE ACT OF 1934 | ||||
2024
| ☐ | TRANSITION REPORT PURSUANT TO SECTION 13 OR 15 (d) OF THE EXCHANGE ACT OF 1934 | ||||
_________
USA Technologies, Inc.
(Exact name of registrant as specified in its charter)
| Pennsylvania | 23-2679963 | |||||||
(State or other jurisdiction of incorporation or organization) | (I.R.S. Employer Identification No.) | |||||||
| 101 Lindenwood Drive | Malvern, | Pennsylvania | 19355 | ||||||||||||||
(Address of principal executive offices) | (Zip Code) | ||||||||||||||||
(Registrant’s telephone number, including area code)
| Title of Each Class | Trading Symbol | Name Of Each Exchange On Which Registered | ||||||
| Common Stock, no par value | CTLP | The NASDAQ Stock Market LLC | ||||||
☐
| Large accelerated filer |
| Accelerated filer |
| |||||||||
Non-accelerated filer |
| Smaller reporting company |
| |||||||||
Emerging growth company |
| |||||||||||
| Item 6. | Exhibits | ||||||||
|
|
|
|
|
|
|
|
| December 31, |
| June 30, | ||
($ in thousands, except shares) |
| 2017 |
| 2017 | ||
|
| (unaudited) |
| (audited) | ||
Assets |
|
|
|
|
|
|
Current assets: |
|
|
|
|
|
|
Cash and cash equivalents |
| $ | 15,386 |
| $ | 12,745 |
Accounts receivable, less allowance of $3,740 and $3,149, respectively |
|
| 15,472 |
|
| 7,193 |
Finance receivables, less allowance of $49 and $19, respectively |
|
| 5,517 |
|
| 11,010 |
Inventory |
|
| 11,215 |
|
| 4,586 |
Prepaid expenses and other current assets |
|
| 1,971 |
|
| 968 |
Total current assets |
|
| 49,561 |
|
| 36,502 |
|
|
|
|
|
|
|
Non-current assets: |
|
|
|
|
|
|
Finance receivables, less current portion |
|
| 11,215 |
|
| 8,607 |
Other assets |
|
| 1,120 |
|
| 687 |
Property and equipment, net |
|
| 12,622 |
|
| 12,111 |
Deferred income taxes |
|
| 14,774 |
|
| 27,670 |
Intangibles, net |
|
| 30,910 |
|
| 622 |
Goodwill |
|
| 64,449 |
|
| 11,492 |
Total non-current assets |
|
| 135,090 |
|
| 61,189 |
|
|
|
|
|
|
|
Total assets |
| $ | 184,651 |
| $ | 97,691 |
|
|
|
|
|
|
|
Liabilities and shareholders’ equity |
|
|
|
|
|
|
Current liabilities: |
|
|
|
|
|
|
Accounts payable |
| $ | 23,775 |
| $ | 16,054 |
Accrued expenses |
|
| 6,798 |
|
| 4,130 |
Line of credit, net |
|
| — |
|
| 7,036 |
Capital lease obligations and current obligations under long-term debt |
|
| 5,121 |
|
| 3,230 |
Income taxes payable |
|
| 6 |
|
| 10 |
Deferred revenue |
|
| 595 |
|
| — |
Deferred gain from sale-leaseback transactions |
|
| 198 |
|
| 239 |
Total current liabilities |
|
| 36,493 |
|
| 30,699 |
|
|
|
|
|
|
|
Long-term liabilities: |
|
|
|
|
|
|
Revolving credit facility |
|
| 10,000 |
|
| — |
Capital lease obligations and long-term debt, less current portion |
|
| 23,874 |
|
| 1,061 |
Accrued expenses, less current portion |
|
| 65 |
|
| 53 |
Deferred gain from sale-leaseback transactions, less current portion |
|
| 49 |
|
| 100 |
Total long-term liabilities |
|
| 33,988 |
|
| 1,214 |
|
|
|
|
|
|
|
Total liabilities |
| $ | 70,481 |
| $ | 31,913 |
|
|
|
|
|
|
|
Commitments and contingencies (Note 13) |
|
|
|
|
|
|
Shareholders’ equity: |
|
|
|
|
|
|
Preferred stock, no par value, 1,800,000 shares authorized, no shares issued |
|
| — |
|
| — |
Series A convertible preferred stock, 900,000 shares authorized, 445,063 issued and outstanding, with liquidation preferences of $19,109 and $18,775 at December 31, 2017 and June 30, 2017, respectively |
|
| 3,138 |
|
| 3,138 |
Common stock, no par value, 640,000,000 shares authorized, 53,619,898 and 40,331,645 shares issued and outstanding at December 31, 2017 and June 30, 2017, respectively |
|
| 307,053 |
|
| 245,999 |
Accumulated deficit |
|
| (196,021) |
|
| (183,359) |
Total shareholders’ equity |
|
| 114,170 |
|
| 65,778 |
Total liabilities and shareholders’ equity |
| $ | 184,651 |
| $ | 97,691 |
| ($ in thousands, except share data) | March 31, 2024 (Unaudited) | June 30, 2023 | ||||||||||||
| Assets | ||||||||||||||
| Current assets: | ||||||||||||||
| Cash and cash equivalents | $ | 50,197 | $ | 50,927 | ||||||||||
| Accounts receivable, net | 43,324 | 30,162 | ||||||||||||
| Finance receivables, net | 5,781 | 6,668 | ||||||||||||
| Inventory, net | 37,364 | 31,872 | ||||||||||||
| Prepaid expenses and other current assets | 8,327 | 3,754 | ||||||||||||
| Total current assets | 144,993 | 123,383 | ||||||||||||
| Non-current assets: | ||||||||||||||
| Finance receivables due after one year, net | 11,041 | 13,307 | ||||||||||||
| Property and equipment, net | 30,320 | 25,281 | ||||||||||||
| Operating lease right-of-use assets | 8,164 | 2,575 | ||||||||||||
| Intangibles, net | 26,687 | 27,812 | ||||||||||||
| Goodwill | 94,008 | 92,005 | ||||||||||||
| Other assets | 4,688 | 5,249 | ||||||||||||
| Total non-current assets | 174,908 | 166,229 | ||||||||||||
| Total assets | $ | 319,901 | $ | 289,612 | ||||||||||
| Liabilities, convertible preferred stock, and shareholders’ equity | ||||||||||||||
| Current liabilities: | ||||||||||||||
| Accounts payable | $ | 64,128 | $ | 52,869 | ||||||||||
| Accrued expenses | 24,824 | 26,276 | ||||||||||||
| Current obligations under long-term debt | 1,450 | 882 | ||||||||||||
| Deferred revenue | 1,893 | 1,666 | ||||||||||||
| Total current liabilities | 92,295 | 81,693 | ||||||||||||
| Long-term liabilities: | ||||||||||||||
| Deferred income taxes | 409 | 275 | ||||||||||||
| Long-term debt, less current portion | 36,647 | 37,548 | ||||||||||||
| Operating lease liabilities, non-current | 9,035 | 2,504 | ||||||||||||
| Total long-term liabilities | 46,091 | 40,327 | ||||||||||||
| Total liabilities | 138,386 | 122,020 | ||||||||||||
| Commitments and contingencies (Note 15) | ||||||||||||||
| Convertible preferred stock: | ||||||||||||||
| Series A convertible preferred stock, 900,000 shares authorized, 385,782 issued and outstanding, with liquidation preferences of $22,722 and $22,144 at March 31, 2024 and June 30, 2023, respectively | 2,720 | 2,720 | ||||||||||||
| Shareholders’ equity: | ||||||||||||||
| Common stock, no par value, 640,000,000 shares authorized, 72,799,266 and 72,664,464 shares issued and outstanding at March 31, 2024 and June 30, 2023, respectively | 481,467 | 477,324 | ||||||||||||
| Accumulated deficit | (302,665) | (312,452) | ||||||||||||
| Accumulated other comprehensive loss | (7) | — | ||||||||||||
| Total shareholders’ equity | 178,795 | 164,872 | ||||||||||||
| Total liabilities, convertible preferred stock, and shareholders’ equity | $ | 319,901 | $ | 289,612 | ||||||||||
|
|
|
|
|
|
|
|
|
|
|
|
|
|
| Three months ended |
| Six months ended | ||||||||
|
| December 31, |
| December 31, | ||||||||
($ in thousands, except shares and per share data) |
| 2017 |
| 2016 |
| 2017 |
| 2016 | ||||
Revenues: |
|
|
|
|
|
|
|
|
|
|
|
|
License and transaction fees |
| $ | 22,853 |
| $ | 16,639 |
| $ | 42,797 |
| $ | 33,004 |
Equipment sales |
|
| 9,653 |
|
| 5,117 |
|
| 15,326 |
|
| 10,340 |
Total revenues |
|
| 32,506 |
|
| 21,756 |
|
| 58,123 |
|
| 43,344 |
|
|
|
|
|
|
|
|
|
|
|
|
|
Costs of sales: |
|
|
|
|
|
|
|
|
|
|
|
|
Cost of services |
|
| 14,362 |
|
| 11,389 |
|
| 27,688 |
|
| 22,632 |
Cost of equipment |
|
| 8,943 |
|
| 4,033 |
|
| 14,033 |
|
| 8,211 |
Total costs of sales |
|
| 23,305 |
|
| 15,422 |
|
| 41,721 |
|
| 30,843 |
|
|
|
|
|
|
|
|
|
|
|
|
|
Gross profit |
|
| 9,201 |
|
| 6,334 |
|
| 16,402 |
|
| 12,501 |
|
|
|
|
|
|
|
|
|
|
|
|
|
Operating expenses: |
|
|
|
|
|
|
|
|
|
|
|
|
Selling, general and administrative |
|
| 8,329 |
|
| 5,785 |
|
| 15,075 |
|
| 12,593 |
Integration and acquisition costs |
|
| 3,335 |
|
| 8 |
|
| 4,097 |
|
| 109 |
Depreciation and amortization |
|
| 737 |
|
| 307 |
|
| 982 |
|
| 515 |
Total operating expenses |
|
| 12,401 |
|
| 6,100 |
|
| 20,154 |
|
| 13,217 |
|
|
|
|
|
|
|
|
|
|
|
|
|
Operating (loss) income |
|
| (3,200) |
|
| 234 |
|
| (3,752) |
|
| (716) |
|
|
|
|
|
|
|
|
|
|
|
|
|
Other income (expense): |
|
|
|
|
|
|
|
|
|
|
|
|
Interest income |
|
| 251 |
|
| 200 |
|
| 331 |
|
| 273 |
Interest expense |
|
| (494) |
|
| (201) |
|
| (703) |
|
| (413) |
Change in fair value of warrant liabilities |
|
| - |
|
| - |
|
| - |
|
| (1,490) |
Total other expense, net |
|
| (243) |
|
| (1) |
|
| (372) |
|
| (1,630) |
|
|
|
|
|
|
|
|
|
|
|
|
|
(Loss) income before income taxes |
|
| (3,443) |
|
| 233 |
|
| (4,124) |
|
| (2,346) |
(Provision) benefit for income taxes |
|
| (9,073) |
|
| - |
|
| (8,605) |
|
| 115 |
|
|
|
|
|
|
|
|
|
|
|
|
|
Net (loss) income |
|
| (12,516) |
|
| 233 |
|
| (12,729) |
|
| (2,231) |
Preferred dividends |
|
| - |
|
| - |
|
| (334) |
|
| (334) |
Net (loss) income applicable to common shares |
| $ | (12,516) |
| $ | 233 |
| $ | (13,063) |
| $ | (2,565) |
Net (loss) income per common share |
|
|
|
|
|
|
|
|
|
|
|
|
Basic |
|
| (0.24) |
|
| 0.01 |
|
| (0.26) |
|
| (0.07) |
Diluted |
|
| (0.24) |
|
| 0.01 |
|
| (0.26) |
|
| (0.07) |
Weighted average number of common shares outstanding |
|
|
|
|
|
|
|
|
|
|
|
|
Basic |
|
| 52,150,106 |
|
| 40,308,934 |
|
| 49,861,735 |
|
| 39,398,469 |
Diluted |
|
| 52,150,106 |
|
| 40,730,712 |
|
| 49,861,735 |
|
| 39,398,469 |
| Three months ended | Nine months ended | |||||||||||||||||||||||||
| March 31, | March 31, | |||||||||||||||||||||||||
| ($ in thousands, except share and per share data) | 2024 | 2023 | 2024 | 2023 | ||||||||||||||||||||||
| Revenues: | ||||||||||||||||||||||||||
| Subscription and transaction fees | $ | 59,207 | $ | 51,245 | $ | 170,371 | $ | 147,252 | ||||||||||||||||||
| Equipment sales | 8,690 | 9,111 | 25,568 | 32,216 | ||||||||||||||||||||||
| Total revenues | 67,897 | 60,356 | 195,939 | 179,468 | ||||||||||||||||||||||
| Costs of sales: | ||||||||||||||||||||||||||
| Cost of subscription and transaction fees | 32,926 | 29,577 | 96,539 | 90,149 | ||||||||||||||||||||||
| Cost of equipment sales | 8,064 | 7,886 | 23,849 | 33,823 | ||||||||||||||||||||||
| Total costs of sales | 40,990 | 37,463 | 120,388 | 123,972 | ||||||||||||||||||||||
| Gross profit | 26,907 | 22,893 | 75,551 | 55,496 | ||||||||||||||||||||||
| Operating expenses: | ||||||||||||||||||||||||||
| Sales and marketing | 5,747 | 3,154 | 14,256 | 8,888 | ||||||||||||||||||||||
| Technology and product development | 4,916 | 4,594 | 12,115 | 16,757 | ||||||||||||||||||||||
| General and administrative | 8,552 | 7,041 | 29,493 | 25,179 | ||||||||||||||||||||||
| Investigation, proxy solicitation and restatement expenses, net of insurance recoveries | — | (1,000) | — | (453) | ||||||||||||||||||||||
| Integration and acquisition expenses | 907 | — | 1,078 | 2,787 | ||||||||||||||||||||||
| Depreciation and amortization | 2,493 | 2,364 | 7,976 | 5,029 | ||||||||||||||||||||||
| Total operating expenses | 22,615 | 16,153 | 64,918 | 58,187 | ||||||||||||||||||||||
| Operating income (loss) | 4,292 | 6,740 | 10,633 | (2,691) | ||||||||||||||||||||||
| Other income (expense): | ||||||||||||||||||||||||||
| Interest income from cash and leases | 495 | 540 | 1,505 | 1,985 | ||||||||||||||||||||||
| Interest income (expense) from debt and tax liabilities | 162 | (263) | (1,947) | (1,258) | ||||||||||||||||||||||
| Other expense, net | (209) | (13) | (158) | (112) | ||||||||||||||||||||||
| Total other income (expense), net | 448 | 264 | (600) | 615 | ||||||||||||||||||||||
| Income (loss) before income taxes | 4,740 | 7,004 | 10,033 | (2,076) | ||||||||||||||||||||||
| Provision for income taxes | (84) | (56) | (246) | (123) | ||||||||||||||||||||||
| Net income (loss) | 4,656 | 6,948 | 9,787 | (2,199) | ||||||||||||||||||||||
| Preferred dividends | (289) | (289) | (578) | (623) | ||||||||||||||||||||||
| Net income (loss) applicable to common shares | $ | 4,367 | $ | 6,659 | $ | 9,209 | $ | (2,822) | ||||||||||||||||||
| Net earnings (loss) per common share | ||||||||||||||||||||||||||
| Basic | $ | 0.06 | $ | 0.09 | $ | 0.13 | $ | (0.04) | ||||||||||||||||||
| Diluted | 0.06 | 0.09 | 0.12 | (0.04) | ||||||||||||||||||||||
| Weighted average number of common shares outstanding used to compute net earnings (loss) per share applicable to common shares | ||||||||||||||||||||||||||
| Basic | 72,851,498 | 72,491,373 | 72,770,582 | 71,771,135 | ||||||||||||||||||||||
| Diluted | 74,068,437 | 72,866,221 | 74,054,820 | 71,771,135 | ||||||||||||||||||||||
4
USA Technologies,
(Unaudited)
|
|
|
|
|
|
|
|
|
|
|
|
|
|
|
|
|
|
| Series A |
|
|
|
|
|
| ||||||||
|
| Convertible |
|
|
|
|
|
| ||||||||
|
| Preferred Stock |
| Common Stock |
| Accumulated |
|
| ||||||||
($ in thousands, except shares) |
| Shares |
| Amount |
| Shares |
| Amount |
| Deficit |
| Total | ||||
Balance, June 30, 2017 |
| 445,063 |
| $ | 3,138 |
| 40,331,645 |
| $ | 245,999 |
| $ | (183,359) |
| $ | 65,778 |
Issuance of common stock in relation to public offering, net of offering costs incurred of $3,237 (a) |
| — |
|
| — |
| 9,583,332 |
|
| 39,888 |
|
| — |
|
| 39,888 |
Issuance of common stock as merger consideration(b) |
| — |
|
| — |
| 3,423,367 |
|
| 19,810 |
|
| — |
|
| 19,810 |
Stock based compensation |
| — |
|
| — |
| 281,554 |
|
| 1,356 |
|
| — |
|
| 1,356 |
Excess tax benefit from stock plans(c) |
| — |
|
| — |
| — |
|
| — |
|
| 67 |
|
| 67 |
Net loss |
| — |
|
| — |
| — |
|
| — |
|
| (12,729) |
|
| (12,729) |
Balance, December 31, 2017 |
| 445,063 |
| $ | 3,138 |
| 53,619,898 |
| $ | 307,053 |
| $ | (196,021) |
| $ | 114,170 |
|
|
|
|
|
|
See accompanying notes.
| Three months ended | Nine months ended | |||||||||||||||||||||||||
| March 31, | March 31, | |||||||||||||||||||||||||
| ($ in thousands) | 2024 | 2023 | 2024 | 2023 | ||||||||||||||||||||||
| Net income (loss) | $ | 4,656 | $ | 6,948 | $ | 9,787 | $ | (2,199) | ||||||||||||||||||
| Foreign currency translation adjustments | 17 | — | (7) | — | ||||||||||||||||||||||
| Other comprehensive income (loss) | 17 | — | (7) | — | ||||||||||||||||||||||
| Total comprehensive income (loss) | $ | 4,673 | $ | 6,948 | $ | 9,780 | $ | (2,199) | ||||||||||||||||||
USA Technologies,Cantaloupe, Inc.
| Convertible Preferred Stock | Common Stock | Accumulated Deficit | Accumulated Other Comprehensive Income (Loss) | Total Shareholders' Equity | ||||||||||||||||||||||||||||||||||||||||
| ($ in thousands, except share data) | Shares | Amount | Shares | Amount | ||||||||||||||||||||||||||||||||||||||||
| Balance, June 30, 2023 | 385,782 | $ | 2,720 | 72,664,464 | $ | 477,324 | $ | (312,452) | $ | — | $ | 164,872 | ||||||||||||||||||||||||||||||||
| Stock-based compensation | — | — | 20,801 | 1,934 | — | — | 1,934 | |||||||||||||||||||||||||||||||||||||
| Exercise of stock options | — | — | 10,000 | 74 | — | — | 74 | |||||||||||||||||||||||||||||||||||||
| Net income | — | — | — | — | 2,007 | — | 2,007 | |||||||||||||||||||||||||||||||||||||
| Balance, September 30, 2023 | 385,782 | 2,720 | 72,695,265 | 479,332 | (310,445) | — | 168,887 | |||||||||||||||||||||||||||||||||||||
| Stock-based compensation | — | — | 43,793 | 1,109 | — | — | 1,109 | |||||||||||||||||||||||||||||||||||||
| Other comprehensive loss | — | — | — | — | — | (24) | (24) | |||||||||||||||||||||||||||||||||||||
| Net income | — | — | — | — | 3,124 | — | 3,124 | |||||||||||||||||||||||||||||||||||||
| Balance, December 31, 2023 | 385,782 | 2,720 | 72,739,058 | 480,441 | (307,321) | (24) | 173,096 | |||||||||||||||||||||||||||||||||||||
| Stock-based compensation | — | — | 55,208 | 1,004 | — | — | 1,004 | |||||||||||||||||||||||||||||||||||||
| Exercise of stock options | — | — | 5,000 | 22 | — | — | 22 | |||||||||||||||||||||||||||||||||||||
| Other comprehensive income | — | — | — | — | — | 17 | 17 | |||||||||||||||||||||||||||||||||||||
| Net income | — | — | — | — | 4,656 | — | 4,656 | |||||||||||||||||||||||||||||||||||||
| Balance, March 31, 2024 | 385,782 | $ | 2,720 | 72,799,266 | $ | 481,467 | $ | (302,665) | $ | (7) | $ | 178,795 | ||||||||||||||||||||||||||||||||
| Convertible Preferred Stock | Common Stock | Accumulated Deficit | Accumulated Other Comprehensive Income (Loss) | Total Shareholders' Equity | ||||||||||||||||||||||||||||||||||||||||
| ($ in thousands, except share data) | Shares | Amount | Shares | Amount | ||||||||||||||||||||||||||||||||||||||||
| Balance, June 30, 2022 | 445,063 | $ | 3,138 | 71,188,053 | $ | 469,918 | $ | (313,085) | $ | — | $ | 156,833 | ||||||||||||||||||||||||||||||||
| Stock-based compensation | — | — | 30,077 | 1,318 | — | — | 1,318 | |||||||||||||||||||||||||||||||||||||
| Repurchase of Series A convertible preferred stock | (59,281) | (418) | — | (1,733) | — | — | (1,733) | |||||||||||||||||||||||||||||||||||||
| Net loss | — | — | — | — | (8,574) | — | (8,574) | |||||||||||||||||||||||||||||||||||||
| Balance, September 30, 2022 | 385,782 | 2,720 | 71,218,130 | 469,503 | (321,659) | — | 147,844 | |||||||||||||||||||||||||||||||||||||
| Stock-based compensation | — | — | 3,919 | 160 | — | — | 160 | |||||||||||||||||||||||||||||||||||||
| Common stock issued for acquisition | — | — | 1,240,920 | 3,942 | — | — | 3,942 | |||||||||||||||||||||||||||||||||||||
| Net loss | — | — | — | — | (573) | — | (573) | |||||||||||||||||||||||||||||||||||||
| Balance, December 31, 2022 | 385,782 | 2,720 | 72,462,969 | 473,605 | (322,232) | — | 151,373 | |||||||||||||||||||||||||||||||||||||
| Stock-based compensation | — | — | 46,292 | 1,410 | — | — | 1,410 | |||||||||||||||||||||||||||||||||||||
| Net income | — | — | — | — | 6,948 | — | 6,948 | |||||||||||||||||||||||||||||||||||||
| Balance, March 31, 2023 | 385,782 | $ | 2,720 | 72,509,261 | $ | 475,015 | $ | (315,284) | $ | — | $ | 159,731 | ||||||||||||||||||||||||||||||||
|
|
|
|
|
|
|
|
| Six months ended | ||||
|
| December 31, | ||||
($ in thousands) |
| 2017 |
| 2016 | ||
OPERATING ACTIVITIES: |
|
|
|
|
|
|
Net loss |
| $ | (12,729) |
| $ | (2,231) |
Adjustments to reconcile net loss to net cash provided by (used in) operating activities: |
|
|
|
|
|
|
Non-cash stock based compensation |
|
| 1,356 |
|
| 445 |
Gain on disposal of property and equipment |
|
| (83) |
|
| (31) |
Non-cash interest and amortization of debt discount |
|
| 86 |
|
| 26 |
Bad debt expense |
|
| 291 |
|
| 450 |
Depreciation and amortization |
|
| 3,476 |
|
| 2,564 |
Change in fair value of warrant liabilities |
|
| - |
|
| 1,490 |
Excess tax benefits |
|
| 67 |
|
| - |
Deferred income taxes, net |
|
| 8,537 |
|
| (115) |
Recognition of deferred gain from sale-leaseback transactions |
|
| (93) |
|
| (430) |
Changes in operating assets and liabilities: |
|
|
|
|
|
|
Accounts receivable |
|
| (5,290) |
|
| (2,347) |
Finance receivables |
|
| 7,958 |
|
| 2,119 |
Inventory |
|
| (5,822) |
|
| (2,689) |
Prepaid expenses and other current assets |
|
| (606) |
|
| (542) |
Accounts payable and accrued expenses |
|
| 6,950 |
|
| (3,840) |
Income taxes payable |
|
| 40 |
|
| (12) |
Net cash provided by (used in) operating activities |
|
| 4,138 |
|
| (5,143) |
|
|
|
|
|
|
|
INVESTING ACTIVITIES: |
|
|
|
|
|
|
Purchase of property and equipment, including rentals |
|
| (1,767) |
|
| (1,944) |
Proceeds from sale of property and equipment, including rentals |
|
| 157 |
|
| 61 |
Cash used for Cantaloupe acquisition |
|
| (65,181) |
|
| - |
Net cash used in investing activities |
|
| (66,791) |
|
| (1,883) |
|
|
|
|
|
|
|
FINANCING ACTIVITIES: |
|
|
|
|
|
|
Cash used in retirement of common stock |
|
| - |
|
| (31) |
Proceeds from exercise of common stock warrants |
|
| - |
|
| 6,193 |
Payment of debt issuance costs |
|
| (445) |
|
| - |
Proceeds from issuance of long-term debt |
|
| 25,100 |
|
| - |
Proceeds from revolving credit facility |
|
| 10,000 |
|
| - |
Issuance of common stock in public offering, net |
|
| 39,888 |
|
| - |
Repayment of capital lease obligations and long-term debt |
|
| (9,249) |
|
| (374) |
Net cash provided by financing activities |
|
| 65,294 |
|
| 5,788 |
|
|
|
|
|
|
|
Net increase (decrease) in cash and cash equivalents |
|
| 2,641 |
|
| (1,238) |
Cash and cash equivalents at beginning of year |
|
| 12,745 |
|
| 19,272 |
Cash and cash equivalents at end of period |
| $ | 15,386 |
| $ | 18,034 |
|
|
|
|
|
|
|
Supplemental disclosures of cash flow information: |
|
|
|
|
|
|
Interest paid in cash |
| $ | 557 |
| $ | 469 |
Income taxes paid in cash (refund), net |
| $ | - |
| $ | - |
Supplemental disclosures of noncash financing and investing activities: |
|
|
|
|
|
|
Equity issued in connection with Cantaloupe Acquisition |
| $ | 19,810 |
| $ | - |
Equipment and software acquired under capital lease |
| $ | 227 |
| $ | 272 |
| Nine months ended | ||||||||||||||
| March 31, | ||||||||||||||
| ($ in thousands) | 2024 | 2023 | ||||||||||||
| Cash flows from operating activities: | ||||||||||||||
| Net income (loss) | $ | 9,787 | $ | (2,199) | ||||||||||
| Adjustments to reconcile net income (loss) to net cash used in operating activities: | ||||||||||||||
| Stock based compensation | 4,047 | 2,889 | ||||||||||||
| Amortization of debt issuance costs and discounts | 93 | 87 | ||||||||||||
| Provision for expected losses | 3,423 | 1,823 | ||||||||||||
| Provision for inventory reserve | 92 | 25 | ||||||||||||
| Depreciation and amortization included in operating expenses | 7,976 | 5,029 | ||||||||||||
| Depreciation included in cost of subscription and transaction fees for rental equipment | 1,137 | 852 | ||||||||||||
| Non-cash lease expense | 1,070 | (429) | ||||||||||||
| Deferred income taxes | 134 | 72 | ||||||||||||
| Other | 527 | 363 | ||||||||||||
| Changes in operating assets and liabilities: | ||||||||||||||
| Accounts receivable | (16,471) | 9,589 | ||||||||||||
| Finance receivables | 3,038 | (653) | ||||||||||||
| Inventory | (5,584) | (8,245) | ||||||||||||
| Prepaid expenses and other assets | (3,762) | (746) | ||||||||||||
| Accounts payable and accrued expenses | 8,455 | (2,868) | ||||||||||||
| Operating lease liabilities | (655) | 183 | ||||||||||||
| Deferred revenue | 174 | 1 | ||||||||||||
| Net cash provided by operating activities | 13,481 | 5,773 | ||||||||||||
| Cash flows from investing activities: | ||||||||||||||
| Acquisition of business, net of cash acquired | (4,750) | (35,855) | ||||||||||||
| Capital expenditures | (9,175) | (12,634) | ||||||||||||
| Net cash used in investing activities | (13,925) | (48,489) | ||||||||||||
| Cash flows from financing activities: | ||||||||||||||
| Proceeds from long-term debt | — | 25,000 | ||||||||||||
| Repayment of long-term debt | (389) | (580) | ||||||||||||
| Contingent consideration paid for acquisition | — | (1,000) | ||||||||||||
| Proceeds from exercise of common stock options | 96 | — | ||||||||||||
| Repurchase of Series A Convertible Preferred Stock | — | (2,153) | ||||||||||||
| Net cash (used in) provided by financing activities | (293) | 21,267 | ||||||||||||
| Effect of currency exchange rate changes on cash and cash equivalents | 7 | — | ||||||||||||
| Net decrease in cash and cash equivalents | (730) | (21,449) | ||||||||||||
| Cash and cash equivalents at beginning of year | 50,927 | 68,125 | ||||||||||||
| Cash and cash equivalents at end of period | $ | 50,197 | $ | 46,676 | ||||||||||
Supplemental disclosures of cash flow information: | ||||||||||||||
| Interest paid in cash | $ | 2,628 | $ | 1,869 | ||||||||||
| Income taxes paid in cash | $ | 142 | $ | 44 | ||||||||||
| Common stock issued in business combination | $ | — | $ | 3,942 | ||||||||||
6
USA Technologies,Cantaloupe, Inc.
USA Technologies,
On November 9, 2017, the Company acquired all of the outstanding equity interests of Cantaloupe Systems, Inc. (“Cantaloupe”), pursuant to the Agreement and Plan of Merger (“Merger Agreement”). Cantaloupe is a premier provider of cloud and mobile solutions for vending, micro markets, and office coffee service. The acquisition expanded the Company’s existing platform to become an end-to-end enterprise platform integrating Cantaloupe’s Seed Cloud which provides cloud and mobile solutions for dynamic route scheduling, automated pre-kitting, responsive merchandising, inventory management, warehouse and accounting management, as well as cashless vending. The combined companies complete the value chain for customers by providing both top-line revenue generating services as well as bottom line business efficiency services to help operators of unattendedmicro-markets and smart retail, machines run their business better. The combination also marrieslaundromats, metered parking terminals, amusement and entertainment venues, IoT services and more.
INTERIM FINANCIAL INFORMATION
Preparation
BASIS OF PRESENTATION
Certain reclassifications of prior year’s data have been made to conform to current year’s presentation. As disclosed in Note 3, the Company incurred integration and acquisition expenses during the current period and deemed it appropriate to have such costs individually captioned within the statement of operations. Accordingly, the Company retrospectively reclassified integration and acquisition costs incurred in the corresponding periods from the previous fiscal year to conform to the current period’s presentation.
7
2. ACCOUNTING POLICIES
RECENT ACCOUNTING PRONOUNCEMENTS
Accounting pronouncements adopted in fiscal year 2018
In January 2017, the Financial Accounting Standards Board (the "FASB") issued Accounting Standards Update No. 2017-04 ("ASU 2017-04"), which eliminates Step 2 from the goodwill impairment test. Under ASU 2017-04, an entity should perform its annual, or interim, goodwill impairment test by comparing the fair value of aeach reporting unit with its carrying amount. An entity should recognize an impairment charge for the amount by which the carrying amount exceeds the reporting unit’s fair value; however, the loss recognized should not exceed the total amount of goodwill allocated to that reporting unit. Additionally, an entity should consider income tax effects from any tax deductible goodwill on the carrying amount of the reporting unit when measuring the goodwill impairment loss, if applicable. ASU 2017-04period. The resulting translation adjustment is effective for annual or any interim goodwill impairment tests in fiscal years beginning after December 15, 2019. We early adopted ASU 2017-04 for impairment tests to be performed on testing dates after July 1, 2017, which did not impact our consolidated financial statements.
In March 2016, the FASB issued ASU No. 2016-09, Compensation - Stock Compensation (Topic 718), Improvements to Employee Share-Based Payment Accounting, which modifies the accounting for certain aspects of share-based payments to employees. The new guidance requires excess tax benefits and tax deficiencies to be recorded in the income statement when stock awards vest or are settled. In addition, cash flows related to excess tax benefits are to be separately classified as an operating activity apart from other income tax cash flows. The standard also allows the Company to repurchase more of an employee’s vested shares for tax withholding purposes without triggering liability accounting, and clarifies that all cash payments made to tax authorities on an employee’s behalf for withheld shares should be presented as a financing activitycomponent of other comprehensive income (loss) and is included in accumulated comprehensive income (loss) within equity in our condensed consolidated balance sheets. Gains and losses on transactions denominated in currencies other than the statement of cash flows. The Company adopted this standard as of July 1, 2017.
The primary impact of adoption was the recognition of excess tax benefitsfunctional currency are generally included in the Company's provision fordetermining net income taxes which is applied prospectively starting July 1, 2017 in accordance with the guidance. Adoption of the new standard resulted in the recognition of $16 thousand of excess tax benefits in the Company's provision for income taxes for the six months ended December 31, 2017. Through June 30, 2017 excess tax benefits were reflected as a reduction of deferred tax assets via reducing actual operating loss carryforwards because such benefits had not reduced income taxes payable. Under the new standard the treatment of excess tax benefits changed and the cumulative excess tax benefits as of June 30, 2017 amounting to $67 thousand were credited to accumulated deficit.
The adoption of ASU No. 2016-09 did not impact our statement of cash flows forperiod. For the three and sixnine months ended DecemberMarch 31, 2016.
Accounting pronouncements to be adopted.
The Company is evaluating whether the effects of the following recent accounting pronouncements or any other recently issued, but not yet effective accounting standards, will have a material effect on the Company’s consolidated financial position, results of operations or cash flows.
In May 2014, the FASB issued ASU 2014-09, “Revenue from Contracts2024 and 2023, our transaction gains and losses were insignificant.
The Company’s project plan includes a three-phase approach to implementing this standard update. The Company is currently evaluating the impact of the potential changes identified by its initial phase one assessment work which included internal surveys of the business, holding revenue recognition workshops with sales and business unit finance leadership, and reviewing a representative sample of revenue arrangements across the business to initially identify a set of applicable qualitative revenue recognition changes related to the new standard update. During the quarter, the Company completed an acquisition of Cantaloupe and has commenced the phase one assessment of the recently acquired business.
8
The objectives for the second phase of the project will be to establish and document key accounting policies and assess disclosures, business process and control impacts resulting from the New Standard. New policies and procedures identified during phase two will be applied to both historical Company revenue streams and those of the recently acquired business to ensure compliance with the New Standard. Lastly, the objectives of phase three will comprise effectively implementing the new standard update and embedding the new accounting treatment into the Company’s business processes and controls to support the financial reporting requirements. Phase three is expected to be completed in the fourth quarter of fiscal year 2018.
The2023, the Company is still evaluatingpresented convertible preferred stock on its consolidated statements of shareholders’ equity and changed the impact that the New Standard will have on the Company’s consolidated financial statements and will be unable to quantify its impact until the third phasename of the project hasstatement to consolidated statements of convertible preferred stock and shareholders’ equity accordingly.Prior period amounts have been completed. The standard is expectedreclassified to impactconform to the Company’s revenue recognition processes, primarily in the areas of the allocation of contract revenues. An entity can electcurrent period presentation.
Income Tax Disclosures
In June 2016, the FASB issued ASU No. 2016-13, “Financial Instruments – Credit Losses (Topic 326).” The new guidance introduces the accounting for estimated credit losses pertainingalso remove disclosures related to certain typesunrecognized tax benefits and deferred taxes. ASU
In August 2016,2023, which is the FASB issued ASU No. 2016-15, “Statement of Cash Flows (Topic 230), Classification of Certain Cash Receipts and Cash Payments.” The new guidance makes eight targeted changes to how cash receipts and cash paymentsCompany's fiscal year 2025 annual reporting period. Interim disclosures are presented and classified in the statement of cash flows. This pronouncement will be effectiverequired for the Company beginning with the year ending June 30, 2019, and interim periods within that fiscal year. Early adoption is permitted, including adoption in an interim period. If an entity early adopts the amendments in an interim period, any adjustments should be reflected as of the beginning of the fiscal year that includes that interim period. An entity that elects early adoption must adopt all of the amendments in the same period. The new guidance requires adoption on a retrospective basis unless it is impracticable to apply, in which case the company would be required to apply the amendments prospectively as of the earliest date practicable. Upon adoption, the Company does not anticipate significant changes to the Company's existing accounting policies or presentation of the Statement of Cash Flows.
In January 2017, the FASB issued ASU No. 2017-01, “Business Combinations (Topic 805), Clarifying the Definition of a Business.” ASU 2017-01 provides guidance in ascertaining whether a collection of assets and activities is considered a business. Adoption of the amendment will be applied prospectively effective for annual periodsyears beginning after December 15, 2017 with2024, which is the Company's fiscal year 2026 interim reporting periods. Retrospective application is required for all prior periods presented, and early adoption permissible for specific transactions. Adoption is notpermitted. We are currently assessing the impact of the requirements on our consolidated financial statements and disclosures.
| Nine months ended March 31, | ||||||||||||||
| ($ in thousands) | 2024 | 2023 | ||||||||||||
| Beginning balance of allowance as of June 30 | $ | 10,815 | $ | 9,328 | ||||||||||
| Provision for expected losses | 958 | 1,044 | ||||||||||||
| Write-offs | (60) | (127) | ||||||||||||
| Balance at September 30 | 11,713 | 10,245 | ||||||||||||
| Provision for expected losses | 1,266 | 91 | ||||||||||||
| Write-offs | (134) | (214) | ||||||||||||
| Balance at December 31 | 12,845 | 10,122 | ||||||||||||
| Provision for expected losses | 1,085 | 296 | ||||||||||||
| Write-offs | (735) | — | ||||||||||||
| Balance at March 31 | $ | 13,195 | $ | 10,418 | ||||||||||
| ($ in thousands) | March 31, 2024 | June 30, 2023 | ||||||||||||
| Current finance receivables, net | $ | 5,781 | $ | 6,668 | ||||||||||
| Finance receivables due after one year, net | 11,041 | 13,307 | ||||||||||||
| Total finance receivables, net of allowance of $2,212 and $2,098, respectively | $ | 16,822 | $ | 19,975 | ||||||||||
| Leases by Origination | ||||||||||||||||||||||||||||||||||||||||||||
| ($ in thousands) | Up to 1 Year Ago | Between 1 and 2 Years Ago | Between 2 and 3 Years Ago | Between 3 and 4 Years Ago | Between 4 and 5 Years Ago | More than 5 Years Ago | Total | |||||||||||||||||||||||||||||||||||||
| Current | $ | 2,284 | $ | 7,423 | $ | 4,399 | $ | 1,225 | $ | 523 | $ | 25 | $ | 15,879 | ||||||||||||||||||||||||||||||
| 30 days and under | 12 | 70 | 87 | 40 | 72 | 42 | 323 | |||||||||||||||||||||||||||||||||||||
| 31-60 days | 6 | 48 | 65 | 31 | 45 | 40 | 235 | |||||||||||||||||||||||||||||||||||||
| 61-90 days | 5 | 43 | 54 | 26 | 40 | 35 | 203 | |||||||||||||||||||||||||||||||||||||
| Greater than 90 days | 41 | 716 | 436 | 65 | 272 | 864 | 2,394 | |||||||||||||||||||||||||||||||||||||
| Total finance receivables | $ | 2,348 | $ | 8,300 | $ | 5,041 | $ | 1,387 | $ | 952 | $ | 1,006 | $ | 19,034 | ||||||||||||||||||||||||||||||
| Leases by Origination | ||||||||||||||||||||||||||||||||||||||||||||
| ($ in thousands) | Up to 1 Year Ago | Between 1 and 2 Years Ago | Between 2 and 3 Years Ago | Between 3 and 4 Years Ago | Between 4 and 5 Years Ago | More than 5 Years Ago | Total | |||||||||||||||||||||||||||||||||||||
| Current | $ | 6,595 | $ | 6,505 | $ | 3,304 | $ | 1,306 | $ | 846 | $ | 829 | $ | 19,385 | ||||||||||||||||||||||||||||||
| 30 days and under | 66 | 73 | 69 | 52 | 22 | 68 | 350 | |||||||||||||||||||||||||||||||||||||
| 31-60 days | 53 | 40 | 32 | 42 | 19 | 71 | 257 | |||||||||||||||||||||||||||||||||||||
| 61-90 days | 60 | 52 | 26 | 32 | 16 | 71 | 257 | |||||||||||||||||||||||||||||||||||||
| Greater than 90 days | 155 | 132 | 197 | 233 | 271 | 836 | 1,824 | |||||||||||||||||||||||||||||||||||||
| Total finance receivables | $ | 6,929 | $ | 6,802 | $ | 3,628 | $ | 1,665 | $ | 1,174 | $ | 1,875 | $ | 22,073 | ||||||||||||||||||||||||||||||
| Nine months ended March 31, | ||||||||||||||
| ($ in thousands) | 2024 | 2023 | ||||||||||||
| Balance at June 30 | $ | 2,098 | $ | 760 | ||||||||||
| Provision for expected losses | 51 | 392 | ||||||||||||
| Write-offs | — | — | ||||||||||||
| Balance at September 30 | 2,149 | 1,152 | ||||||||||||
| Provision for expected losses | 108 | — | ||||||||||||
| Write-offs | — | (288) | ||||||||||||
| Balance at December 31 | 2,257 | 864 | ||||||||||||
| Provision for expected losses | (45) | — | ||||||||||||
| Write-offs | — | — | ||||||||||||
| Balance at March 31 | $ | 2,212 | $ | 864 | ||||||||||
| ($ in thousands) | |||||
| 2024 | $ | 7,096 | |||
| 2025 | 6,228 | ||||
| 2026 | 4,371 | ||||
| 2027 | 2,295 | ||||
| 2028 | 695 | ||||
| Thereafter | 14 | ||||
| Total amounts to be collected | 20,699 | ||||
| Less: interest | (1,665) | ||||
| Less: allowance for uncollectible receivables | (2,212) | ||||
| Total finance receivables | $ | 16,822 | |||
| ($ in thousands) | Balance Sheet Classification | As of March 31, 2024 | As of June 30, 2023 | |||||||||||||||||
| Assets: | Operating lease right-of-use assets | $ | 8,164 | $ | 2,575 | |||||||||||||||
| Liabilities: | ||||||||||||||||||||
| Current | Accrued expenses | $ | 738 | $ | 1,266 | |||||||||||||||
| Long-term | Operating lease liabilities, non-current | 9,035 | 2,504 | |||||||||||||||||
| Total lease liabilities | $ | 9,773 | $ | 3,770 | ||||||||||||||||
| ($ in thousands) | Nine months ended March 31, 2024 | Nine months ended March 31, 2023 | |||||||||
| Supplemental cash flow information: | |||||||||||
| Cash paid for amounts included in the measurement of operating lease liabilities | $ | 1,827 | $ | 1,793 | |||||||
| Non-cash activity: | |||||||||||
| Lease assets obtained in exchange for new operating lease liabilities | $ | 6,657 | $ | — | |||||||
| ($ in thousands) | Operating Leases | ||||
| Remainder of 2024 | $ | 321 | |||
| 2025 | 1,623 | ||||
| 2026 | 2,341 | ||||
| 2027 | 1,792 | ||||
| 2028 | 1,359 | ||||
| Thereafter | $ | 6,570 | |||
| Total lease payments | $ | 14,006 | |||
| Less: Imputed interest | (4,233) | ||||
| Present value of lease liabilities | $ | 9,773 | |||
| ($ in thousands) | March 31, 2024 | June 30, 2023 | ||||||||||||
| Cost | $ | 30,955 | 28,398 | |||||||||||
| Accumulated depreciation | (24,605) | (23,221) | ||||||||||||
| Net | $ | 6,350 | $ | 5,177 | ||||||||||
| As of March 31, | As of June 30, | |||||||||||||
| ($ in thousands) | 2024 | 2023 | ||||||||||||
| JPMorgan Credit Facility* | $ | 38,188 | $ | 38,563 | ||||||||||
| Other obligations | 36 | 50 | ||||||||||||
| Less: unamortized issuance costs and debt discount | (127) | (183) | ||||||||||||
| Total | 38,097 | 38,430 | ||||||||||||
| Less: debt and other financing arrangements, current | (1,450) | (882) | ||||||||||||
| Debt and other financing arrangements, noncurrent | $ | 36,647 | $ | 37,548 | ||||||||||
| Three months ended | Nine months ended | |||||||||||||||||||||||||
| March 31, | March 31, | |||||||||||||||||||||||||
| ($ in thousands) | 2024 | 2023 | 2024 | 2023 | ||||||||||||||||||||||
| JPMorgan Credit Facility* | 894 | 1,142 | 2,718 | 1,733 | ||||||||||||||||||||||
| Other interest (income) expense on tax liabilities | (1,056) | (879) | (771) | (475) | ||||||||||||||||||||||
| Total interest (income) expense, net on debt and tax liabilities | $ | (162) | $ | 263 | $ | 1,947 | $ | 1,258 | ||||||||||||||||||
9
| 2024 | $ | 568 | |||
| 2025 | 1,333 | ||||
| 2026 | 36,323 | ||||
| Principal amounts payable | 38,224 | ||||
| Unamortized issuance costs | (127) | ||||
| Total outstanding debt | $ | 38,097 | |||
| As of March 31, | As of June 30, | |||||||||||||
| ($ in thousands) | 2024 | 2023 | ||||||||||||
| Sales tax reserve | 10,793 | $ | 13,597 | |||||||||||
| Accrued compensation and related sales commissions | 3,112 | 4,069 | ||||||||||||
| Operating lease liabilities, current | 738 | 1,266 | ||||||||||||
| Accrued professional fees | 5,726 | 4,196 | ||||||||||||
| Accrued taxes and filing fees payable | 1,630 | 1,944 | ||||||||||||
| Other accrued expenses | 1,333 | 762 | ||||||||||||
| Consideration withheld for acquisitions* | 1,492 | 442 | ||||||||||||
| Total accrued expenses | $ | 24,824 | $ | 26,276 | ||||||||||
| As of March 31, 2024 | ||||||||||||||||||||||||||
| ($ in thousands) | Gross | Accumulated Amortization | Net | Amortization Period | ||||||||||||||||||||||
| Intangible assets: | ||||||||||||||||||||||||||
| Brand and tradenames | $ | 2,611 | $ | (1,747) | $ | 864 | 1 - 7 years | |||||||||||||||||||
| Developed technology | 20,462 | (12,868) | 7,594 | 5 - 6 years | ||||||||||||||||||||||
| Customer relationships | 27,224 | (8,995) | 18,229 | 5 - 18 years | ||||||||||||||||||||||
| Total intangible assets | $ | 50,297 | $ | (23,610) | $ | 26,687 | ||||||||||||||||||||
| Goodwill | 94,008 | — | 94,008 | Indefinite | ||||||||||||||||||||||
3. ACQUISITION OF CANTALOUPE SYSTEMS, INC.
As of June 30, 2023 ($ in thousands) Gross Accumulated
AmortizationNet Amortization
PeriodIntangible assets: Brand and tradenames 2,161 (1,414) 747 1 - 7 years Developed technology 20,188 (11,066) 9,122 5 - 6 years Customer relationships 24,714 (6,771) 17,943 5 - 18 years Total intangible assets $ 47,063 $ (19,251) $ 27,812 Goodwill 92,005 — 92,005 Indefinite
ordering platform. The acquisition expandedpositions Cantaloupe for expansion into the Company’s existing platform to become an end-to-end enterprise platform integrating Cantaloupe’s Seed Cloud which provides cloudlarge and mobile solutions for dynamic route scheduling, automated pre-kitting, responsive merchandising, inventory management, warehouserapidly growing sports, entertainment, and accounting management, as well as cashless vending. In addition to new technology and services, due to Cantaloupe’s existing customer base, the acquisition expands the Company’s footprint into new global markets.
The preliminary fair valuerestaurant sectors with a comprehensive suite of the purchase price consideration consisted of the following:
| ||
|
|
|
|
| |
|
|
|
|
|
|
|
The Company financed a portion of the purchase price with proceeds from a $25.0 million term loan (“Term Loan”) and $10.0 million of borrowings under a line of credit (“Revolving Credit Facility”), provided by JPMorgan Chase Bank, N.A., for an aggregate principal amount of $35.0 million. Refer to Note 9 for additional details.
10
The following table summarizes the fair value of total consideration transferred to the holders of all of the outstanding equity interests of Cantaloupe at the acquisition date of November 9, 2017:
|
|
|
|
|
| Cantaloupe | |
($ in thousands) |
| Systems, Inc. | |
Accounts receivable |
| $ | 3,232 |
Finance receivables, current portion |
|
| 1,640 |
Inventory |
|
| 782 |
Prepaid expense and other current assets |
|
| 682 |
Finance receivables, less current portion |
|
| 3,483 |
Other assets |
|
| 50 |
Property and equipment |
|
| 1,573 |
Intangibles |
|
| 30,800 |
Goodwill |
|
| 52,957 |
Total assets acquired |
|
| 95,199 |
Accounts payable |
|
| (1,591) |
Accrued expenses |
|
| (1,832) |
Deferred revenue |
|
| (626) |
Capital lease obligations and current obligations under long-term debt |
|
| (666) |
Capital lease obligations and long-term debt, less current portion |
|
| (1,134) |
Deferred income tax liabilities |
|
| (4,359) |
Total net assets acquired |
| $ | 84,991 |
| ($ in thousands) | Amount | ||||
| Cash and cash equivalents | $ | 84 | |||
| Property and equipment, net | 1,160 | ||||
| Intangible assets | 2,600 | ||||
| Other assets | 381 | ||||
| Total identifiable assets acquired | 4,225 | ||||
| Accounts payable | (442) | ||||
| Other liabilities | (52) | ||||
| Total liabilities assumed | (494) | ||||
| Total identifiable net assets | 3,731 | ||||
| Goodwill | 1,105 | ||||
| Fair value of total consideration transferred | $ | 4,836 | |||
basis over the estimated useful lives of the respective assets.
As a result of the acquisition of Cantaloupe, the Company incurred the following integration and acquisition costs and other one-time charges related to the acquisition in the three and six months ended December 31, 2017:
|
|
|
|
|
|
|
|
| Three months ended |
| Six months ended | ||
($ in thousands) |
| December 31, 2017 |
| December 31, 2017 | ||
Cost of equipment |
|
|
|
|
|
|
Acquired inventory fair market value step-up |
| $ | 23 |
| $ | 23 |
Operating expenses |
|
|
|
|
|
|
Integration and acquisition costs |
|
| 3,335 |
|
| 4,097 |
Interest expense |
|
|
|
|
|
|
Write-off of deferred financing costs |
|
| 55 |
|
| 55 |
Total integration and acquisition-related costs |
| $ | 3,413 |
| $ | 4,175 |
11
Supplemental disclosure of pro forma information
The following supplemental unaudited pro forma information presents the combined results of USAT and Cantaloupe as if the acquisition of Cantaloupe occurred on July 1, 2016. This supplemental pro forma information has been prepared for comparative purposes and does not purport to be indicative of what would have occurred had the acquisition been made on July 1, 2016, nor are they indicative of any future results.
The pro forma results include adjustments for the preliminary purchase accounting impact of the Cantaloupe acquisition (including, but not limited to, amortization associated with the acquired intangible assets, and the interest expense and amortization of deferred financing fees associated with the Term Loan and Revolving Credit Facility that were used to finance a portionabove allocation of the purchase price along withis provisional and is still subject to change within the related tax impacts) andmeasurement period. The final allocation of the alignmentpurchase price is expected to be completed as soon as practicable, but no later than one year from the date of accounting policies. Other material non-recurring adjustments are reflected in the pro forma and described below:
|
|
|
|
|
|
|
|
|
|
|
|
|
|
| Three months ended December 31, |
| Six months ended December 31, | ||||||||
(In thousands, except per share data) |
| 2017 |
| 2016 |
| 2017 |
| 2016 | ||||
Revenues |
| $ | 34,772 |
| $ | 27,521 |
| $ | 67,642 |
| $ | 54,704 |
Net loss attributable to USAT |
|
| (10,632) |
|
| (428) |
|
| (10,552) |
|
| (5,458) |
Net loss attributable to USAT common shares |
| $ | (10,632) |
| $ | (428) |
| $ | (10,886) |
| $ | (5,792) |
Net loss per share - basic and diluted |
|
| (0.20) |
|
| (0.01) |
|
| (0.20) |
|
| (0.11) |
Weighted average number of common shares outstanding - basic and diluted |
|
| 53,619,921 |
|
| 53,315,633 |
|
| 53,584,368 |
|
| 52,369,824 |
The supplemental unaudited pro forma earningsthat were expensed for the sixthree and nine months ended DecemberMarch 31, 2016 were adjusted to include $4.1 million of2024. These costs are recorded within integration and acquisition costs.
4. FINANCE RECEIVABLES
Finance receivables consistexpenses in the Condensed Consolidated Statements of Operations.
|
|
|
|
|
|
|
|
| December 31, |
| June 30, | ||
($ in thousands) |
| 2017 |
| 2017 | ||
Total finance receivables |
| $ | 16,732 |
| $ | 19,617 |
Less current portion |
|
| 5,517 |
|
| 11,010 |
Non-current portion of finance receivables |
| $ | 11,215 |
| $ | 8,607 |
| ($ in thousands) | |||||
| Closing cash consideration | $ | 36,605 | |||
| Stock consideration | 4,506 | ||||
| Fair value of total consideration transferred | $ | 41,111 | |||
| ($ in thousands) | Amount | ||||
| Cash and cash equivalents | $ | 391 | |||
| Accounts receivable | 1,780 | ||||
| Inventories | 2,011 | ||||
| Intangible assets | 15,538 | ||||
| Other assets | 629 | ||||
| Total identifiable assets acquired | 20,349 | ||||
| Accounts payable | (2,410) | ||||
| Tax liabilities | (3,033) | ||||
| Total liabilities assumed | (5,443) | ||||
| Total identifiable net assets | 14,906 | ||||
| Goodwill | 26,205 | ||||
| Fair value of total consideration transferred | $ | 41,111 | |||
|
|
|
|
|
|
|
|
| December 31, |
| June 30, | ||
($ in thousands) |
| 2017 |
| 2017 | ||
Performing |
| $ | 16,325 |
| $ | 19,515 |
Nonperforming |
|
| 407 |
|
| 102 |
Total |
| $ | 16,732 |
| $ | 19,617 |
12
Age Analysis of Past Due Finance Receivables
As of December 31, 2017
|
|
|
|
|
|
|
|
|
|
|
|
|
|
|
|
|
|
|
|
|
|
|
| 30 and Under |
| 31 – 60 |
| 61 – 90 |
| Greater than |
| Total |
|
|
| Total | |||||||
|
| Days Past |
| Days Past |
| Days Past |
| 90 Days Past |
| Non- |
|
|
| Finance | |||||||
($ in thousands) |
| Due |
| Due |
| Due |
| Due |
| Performing |
| Performing |
| Receivables | |||||||
QuickStart Leases |
| $ | 40 |
| $ | 85 |
| $ | 162 |
| $ | 120 |
| $ | 407 |
| $ | 16,325 |
| $ | 16,732 |
Age Analysis of Past Due Finance Receivables
As of June 30, 2017
|
|
|
|
|
|
|
|
|
|
|
|
|
|
|
|
|
|
|
|
|
|
|
| 30 and Under |
| 31 – 60 |
| 61 – 90 |
| Greater than |
| Total |
|
|
| Total | |||||||
|
| Days Past |
| Days Past |
| Days Past |
| 90 Days Past |
| Non- |
|
|
| Finance | |||||||
($ in thousands) |
| Due |
| Due |
| Due |
| Due |
| Performing |
| Performing |
| Receivables | |||||||
QuickStart Leases |
| $ | 29 |
| $ | 3 |
| $ | 35 |
| $ | 35 |
| $ | 102 |
| $ | 19,515 |
| $ | 19,617 |
5. INVENTORY
Inventory, net of reserves, was $11.2third-party valuation consultants. Amounts allocated to identifiable intangible assets included $7.5 million related to developed technology, $7.5 million related to customer relationships, and $4.6$0.5 million as of December 31, 2017 and June 30, 2017, respectively. Inventory consists of finished goods. The Company's inventories are valued at the lower of cost or net realizable value.
The Company establishes allowances for obsolescence of inventory based upon quality considerations and assumptions about future demand and market conditions.
related to trade names. The fair value of Cantaloupe inventoriesthe acquired includeddeveloped technology was determined using a multi-period excess earnings method. The fair market value step-up of $23 thousand. In the threeacquired customer relationships was determined using the with-and-without method which estimates the value using the cash flow impact in a scenario where the customer relationships are not in place. The significant unobservable inputs used in the valuation of the customer relationship asset and six months ended December 31, 2017,acquired developed technology asset are the revenue growth rates used in the development of the projected financial information used as an input to calculate those values and the discount rate applied. The recognized intangible assets will be amortized on a straight-line basis over the estimated useful lives of the respective assets. The estimated useful lives for developed technology, customer relationship, trade names were 5, 5 and 3 years, respectively.
6. EARNINGS PER SHARE
The calculationonly reporting unit.
|
|
|
|
|
|
|
|
|
|
|
|
|
|
|
|
|
|
| Three months ended December 31, | ||||||||||||||
|
| 2017 |
| 2016 | ||||||||||||
|
| Net Loss |
| Shares |
| Per-Share |
| Net Income |
| Shares |
| Per-Share | ||||
|
| (Numerator) |
| (Denominator) |
| Amount |
| (Numerator) |
| (Denominator) |
| Amount | ||||
Net (loss) income from continuing operations |
| $ | (12,516) |
|
|
|
|
|
| $ | 233 |
|
|
|
|
|
Less: Preferred stock dividends |
|
| - |
|
|
|
|
|
|
| - |
|
|
|
|
|
|
|
|
|
|
|
|
|
|
|
|
|
|
|
|
|
|
Basic EPS |
|
|
|
|
|
|
|
|
|
|
|
|
|
|
|
|
Net (loss) income available to common shareholders |
|
| (12,516) |
| 52,150,106 |
| $ | (0.24) |
|
| 233 |
| 40,308,934 |
| $ | 0.01 |
|
|
|
|
|
|
|
|
|
|
|
|
|
|
|
|
|
Effect of Dilutive Securities |
|
|
|
|
|
|
|
|
|
|
|
|
|
|
|
|
Incremental shares |
|
| - |
| - | (a) |
|
|
|
| - |
| 421,778 |
|
|
|
|
|
|
|
|
|
|
|
|
|
|
|
|
|
|
|
|
Diluted EPS |
|
|
|
|
|
|
|
|
|
|
|
|
|
|
|
|
Net (loss) income available to common shareholders plus assumed conversions |
| $ | (12,516) |
| 52,150,106 |
| $ | (0.24) |
| $ | 233 |
| 40,730,712 |
| $ | 0.01 |
13
|
|
|
|
|
|
|
|
|
|
|
|
|
|
|
|
|
|
| Six months ended December 31, | ||||||||||||||
|
| 2017 |
| 2016 | ||||||||||||
|
| Net Loss |
| Shares |
| Per-Share |
| Net Loss |
| Shares |
| Per-Share | ||||
|
| (Numerator) |
| (Denominator) |
| Amount |
| (Numerator) |
| (Denominator) |
| Amount | ||||
Net loss from continuing operations |
| $ | (12,729) |
|
|
|
|
|
| $ | (2,231) |
|
|
|
|
|
Less: Preferred stock dividends |
|
| (334) |
|
|
|
|
|
|
| (334) |
|
|
|
|
|
|
|
|
|
|
|
|
|
|
|
|
|
|
|
|
|
|
Basic EPS |
|
|
|
|
|
|
|
|
|
|
|
|
|
|
|
|
Net loss available to common shareholders |
|
| (13,063) |
| 49,861,735 |
| $ | (0.26) |
|
| (2,565) |
| 39,398,469 |
| $ | (0.07) |
|
|
|
|
|
|
|
|
|
|
|
|
|
|
|
|
|
Effect of Dilutive Securities |
|
|
|
|
|
|
|
|
|
|
|
|
|
|
|
|
Incremental shares |
|
| - |
| - | (a) |
|
|
|
| - |
| - | (a) |
|
|
|
|
|
|
|
|
|
|
|
|
|
|
|
|
|
|
|
Diluted EPS |
|
|
|
|
|
|
|
|
|
|
|
|
|
|
|
|
Net loss available to common shareholders plus assumed conversions |
| $ | (13,063) |
| 49,861,735 |
| $ | (0.26) |
| $ | (2,565) |
| 39,398,469 |
| $ | (0.07) |
|
|
The changes inabove table represents the average number of shares that were anti-dilutive in the three and six months ended December 31, 2017 compared to the same period last year, were due to warrants exercised in connection with our common stock during September 2016.
7. GOODWILL AND INTANGIBLES
Intangible asset balances and goodwill consistedfinal allocation of the following:
|
|
|
|
|
|
|
|
|
|
|
|
|
| As of December 31, 2017 |
|
| |||||||
|
|
|
| Accumulated |
|
|
| Amortization | |||
($ in thousands) |
| Gross |
| Amortization |
| Net |
| Period | |||
Intangible assets: |
|
|
|
|
|
|
|
|
|
|
|
Non-compete agreements |
|
| 2 |
|
| (2) |
|
| — |
| 2 years |
Brand and tradenames |
|
| 1,695 |
|
| (96) |
|
| 1,599 |
| 3 - 7 years |
Developed technology |
|
| 10,939 |
|
| (499) |
|
| 10,440 |
| 5 - 6 years |
Customer relationships |
|
| 19,049 |
|
| (178) |
|
| 18,871 |
| 10 - 18 years |
Total intangible assets |
| $ | 31,685 |
| $ | (775) |
| $ | 30,910 |
|
|
|
|
|
|
|
|
|
|
|
|
|
|
Goodwill |
|
| 64,449 |
|
| — |
|
| 64,449 |
| Indefinite |
|
|
|
|
|
|
|
|
|
|
|
|
Total intangible assets & goodwill |
| $ | 96,134 |
|
| (775) |
| $ | 95,359 |
|
|
14
|
|
|
|
|
|
|
|
|
|
|
|
|
| As of June 30, 2017 |
|
| |||||||
|
|
|
| Accumulated |
|
|
| Amortization | |||
($ in thousands) |
| Gross |
| Amortization |
| Net |
| Period | |||
Intangible assets: |
|
|
|
|
|
|
|
|
|
|
|
Non-compete agreements |
|
| 2 |
|
| (2) |
|
| — |
| 2 years |
Brand |
|
| 95 |
|
| (48) |
|
| 47 |
| 3 years |
Developed technology |
|
| 639 |
|
| (191) |
|
| 448 |
| 5 years |
Customer relationships |
|
| 149 |
|
| (22) |
|
| 127 |
| 10 years |
Total intangible assets |
| $ | 885 |
| $ | (263) |
| $ | 622 |
|
|
|
|
|
|
|
|
|
|
|
|
|
|
Goodwill |
|
| 11,492 |
|
| — |
|
| 11,492 |
| Indefinite |
|
|
|
|
|
|
|
|
|
|
|
|
Total intangible assets & goodwill |
| $ | 12,377 |
|
| (263) |
| $ | 12,114 |
|
|
Forcertain assets and liabilities of Delicious Nutritious LLC, doing business as Yoke Payments (“Yoke”), a micro market payments company. The acquisition of Yoke was accounted for as a business combination using the threeacquisition method of accounting which includes the results of operations of the acquired business from the date of acquisition. The purchase price of the acquired company is allocated between tangible and six months ended December 31, 2017, there was $472 thousand and $516 thousand in amortization expense related to intangible assets respectively,acquired and liabilities assumed from the acquired business based on their estimated fair values using primarily Level 3 inputs under ASC Topic 820, Fair Value Measurement, with the residual of the purchase price recorded as comparedgoodwill.
8. LINE OF CREDIT
During the fiscal year ended Junedeferred cash payment due on or before July 30, 2016, the Company entered into a Loan and Security Agreement and other ancillary documents (as amended, the “Heritage Loan Documents”) with Heritage Bank of Commerce (“Heritage Bank”), providing for a secured asset-based revolving line of credit in an amount of up to $12.0 million (the “Heritage Line of Credit”) at an interest rate calculated2022 based on the Federal Reserves’ Prime plus 2.25%. The Heritage Lineachievement of Credit and the Company’s obligations under the Heritage Loan Documents were secured by substantially all of the Company’s assets, including its intellectual property.
During March 2017,certain sales growth targets. On July 27, 2022, the Company entered intomade the third amendmentcash payment of $1 million in accordance with Heritage Bank that extended the maturity date of the Heritage Line of Credit from March 29, 2017 to September 30, 2018.
On November 9, 2017, the Company paid all amounts due in respect of principal, interest, and fees, and satisfied all of its obligations under the Loan and Security Agreement dated as of March 29, 2016, as amended, and ancillary agreements by and between the Company and Heritage Bank of Commerce. The Company recorded a charge of $55 thousand to write-off any remaining deferred financing costs related to the Heritage Line of Credit to interest expense for the three and six months ended December 31, 2017. Pursuant to such payment, all commitments of Heritage Bank of Commerce were terminated, and the Heritage Loan and Security Agreement was terminated. As such, there was no outstanding balance on the Heritage Line of Credit at December 31, 2017.
9. DEBT
Revolving Credit Facility and Term Loan
On November 9, 2017,agreement consideration.
| ($ in thousands) | Amount | ||||
| Consideration | |||||
| Cash | $ | 2,966 | |||
| Contingent consideration arrangement | 1,000 | ||||
| Fair value of total consideration transferred | 3,966 | ||||
| Recognized amounts of identifiable assets | |||||
| Total net assets acquired | 21 | ||||
| Identifiable intangible assets | 1,235 | ||||
| Total identifiable net assets | 1,256 | ||||
| Goodwill | $ | 2,710 | |||
The proceeds of the Term Loan and borrowings under the Revolving Credit Facility, in an aggregate principal amount equal to $35.0 million, were used by the Company to finance a portionfinal allocation of the purchase price, fornoting no material measurement period adjustments. Pro forma financial information of the acquisition of Cantaloupe ($27.8 million) and repay existing indebtednessis not presented due to Heritage Bank of Commerce ($7.2 million). Future borrowings under the Revolving Credit Facility may be used by the Company for working capital and general corporate purposesimmaterial impact of the financial results of Yoke in the Company's Consolidated Financial Statements.
| Three months ended March 31, | Nine months ended March 31, | ||||||||||||||||||||||||||||||||||
| ($ in thousands) | 2024 | 2023 | 2024 | 2023 | |||||||||||||||||||||||||||||||
| Transaction fees | $ | 40,034 | $ | 33,389 | $ | 114,956 | $ | 97,076 | |||||||||||||||||||||||||||
| Subscription fees | 19,173 | 17,856 | 55,415 | 50,176 | |||||||||||||||||||||||||||||||
| Subscription and transaction fees | $ | 59,207 | $ | 51,245 | $ | 170,371 | $ | 147,252 | |||||||||||||||||||||||||||
| Equipment sales | 8,690 | 9,111 | 25,568 | 32,216 | |||||||||||||||||||||||||||||||
| Total revenues | $ | 67,897 | $ | 60,356 | $ | 195,939 | $ | 179,468 | |||||||||||||||||||||||||||
| Three months ended March 31, | ||||||||||||||
| ($ in thousands) | 2024 | 2023 | ||||||||||||
| Deferred revenue, beginning of the period | $ | 1,788 | $ | 1,970 | ||||||||||
| Deferred revenue, end of the period | 1,893 | 1,894 | ||||||||||||
| Revenue recognized in the period from amounts included in deferred revenue at the beginning of the period | $ | 268 | $ | 94 | ||||||||||
| Nine months ended March 31, | ||||||||||||||
| ($ in thousands) | 2024 | 2023 | ||||||||||||
| Deferred revenue, beginning of the period | $ | 1,666 | $ | 1,893 | ||||||||||
| Deferred revenue, end of the period | 1,893 | 1,894 | ||||||||||||
| Revenue recognized in the period from amounts included in deferred revenue at the beginning of the period | $ | 475 | $ | 319 | ||||||||||
15
Loans under($ in thousands) As of March 31, 2024 Remainder of fiscal year 2024 $ 1,520 2025 5,941 2026 3,793 Thereafter — Total $ 11,254
AsCondensed Consolidated Balance Sheet. None of December 31, 2017, the outstanding balances for the Revolving Credit Facility and the Term Loanthese capitalized contract costs were $10.0 million and $24.6 million, respectively.
Other Long-Term Borrowings
The Company periodically enters into capital lease obligations to finance network servers, computers, office furniture and equipment related support for use in its daily operations. During the six months ended December 31, 2017, the Company entered into capital lease obligations totaling $227 thousand, comprised of monthly installments of $7 thousand due within three years. The value of the acquired equipment is included in property and equipment and depreciated accordingly.
In connection with the acquisition of Cantaloupe, the Company assumed debt of $1.8 million. At December 31, 2017, the debt is comprised of $550 thousand of promissory notes bearing an interest rate of a 5% and maturing on April 5, 2020 with principal and interest payments due monthly, $830 thousand of promissory notes bearing an interest rate of 10% and maturing on September 30, 2021 with principal and interest payments due quarterly, and $356 thousand of promissory notes bearing an interest rate of 12% and maturing on December 15, 2019 with principal and interest payments due quarterly.
10. FAIR VALUE OF FINANCIAL INSTRUMENTS
As of December 31, 2017, the Company held no level 1, level 2, or level 3 financial instruments.
As of June 30, 2016, 2.2 million warrants with a fair value of $3.7 million comprised the Company’s Level 3 financial instruments. The Level 3 financial instruments consisted of common stock warrants issued by the Company in March 2011 to purchase shares of the Company’s common stock. The Level 3 financial instruments included features requiring liability treatment of the warrants, with the fair value of the common stock based on valuations performed by an independent third-party valuation firm. The fair value was determined using proprietary valuation models using the quality of the underlying securities of the warrants, restrictions on the warrants and security underlying the warrants, time restrictions and precedent sale transactions completed in the secondary market or in other private transactions. During the three months ended September 30, 2016, all of the aforementioned warrants were exercised resulting in a $5.2 million reclassification to Common Stock and the net difference of $1.5 million was recorded as a loss on fair value associated with the warrant liability.
11. INCOME TAXES
On December 22, 2017, the “Tax Cuts and Jobs Act” (the “Act”) was signed into law. Substantially all of the provisions of the Act are effective for taxable years beginning after December 31, 2017. The Act includes significant changes to the Internal Revenue Code of 1986 (as amended, the “Code”), including amendments which significantly change the taxation of individuals, and business entities. The Act contains numerous provisions impacting the Company, the most significant of which reduces the Federal corporate statutory tax rate from 34% to 21%.
The staff of the US Securities and Exchange Commission (“SEC”) has recognized the complexity of reflecting the impacts of the Act, and on December 22, 2017 issued guidance in Staff Accounting Bulletin 118 (“SAB 118”), which clarifies accounting for income taxes under ASC 740 if information is not yet available or complete and provides for up to a one year period in which to complete the required analyses and accounting (the measurement period). SAB 118 describes three scenarios (or “buckets”) associated with a company’s status of accounting for income tax reform: (1) a company is complete with its accounting for certain effects of tax reform, (2) a company is able to determine a reasonable estimate for certain effects of tax reform and records that estimate as a provisional amount, or (3) a company is not able to determine a reasonable estimate and therefore continues to apply ASC 740, based on the provisions of the tax laws that were in effect immediately prior to the Act being enacted.
16
The various provisions under the Act deemed most relevant to the Company have been considered in preparation of its financial statements as of December 31, 2017. To the extent that clarifications or interpretations materialize in the future that would impact upon the effects of the Act incorporated into the December 31, 2017 financial statements, those effects will be reflected in the future as or if they materialize.
For the three and six months ended December 31, 2017, the Company recorded income tax provisions of $9,073 thousand and $8,605 thousand, respectively, (substantially all deferred income taxes) which include a charge of $6,592 thousand related to the Act. These provisions are based upon income (loss) before income taxes using an estimated negative annual effective income tax rate of 49.20%, which is primarily driven by the impact of permanent differences. The tax rate reduction related to the Act was treated as a discrete item in the tax provisions for the three and six months ended December 31, 2017.
The accounting for deferred income taxes in the acquisition of Cantaloupe did not consider the potential effects of IRS Code Section 382 relating to the limitation on use of operating loss carryforwards created by Cantaloupe for its changes in ownership because the analysis required for such determination has not yet been completed. If upon completion of such analysis there are limitations on the use of operating loss carryforwards created by Cantaloupe totaling approximately $13,271 thousand, the potential effect would be to record a valuation allowance in the opening balance sheet, as well as a tax benefit to reverse the provision recorded during the three months ended December 31, 2017 related to the rate reduction of the deferred tax assets acquired.
For the three and six months ended December 31, 2016, income tax benefits of $0 and $115 thousand, respectively, (substantially all deferred income taxes) were recorded. The benefits are based upon income (loss) before income taxes using an estimated annual effective income tax rate of 30% for the fiscal year ended June 30, 2017. However, such benefits actually calculated have been limited to $115 thousand pending the materialization of additional income before income taxes resulting in an increase of $30 thousand in valuation allowances for the calculated additional benefits. The benefits for the six months ended December 31, 2016 were reduced by a provision for the tax effect of the change in the fair value of warrant liabilities which was treated discretely. All of those warrants were exercised as of September 30, 2016.
12. EQUITY
On July 25, 2017, the Company closed its underwritten public offering of 9,583,332 shares of its common stock at a public offering price of $4.50 per share. The foregoing included the full exercise of the underwriters' option to purchase 1,249,999 additional shares from the Company. The gross proceeds to the Company from the offering, before deducting underwriting discounts and commissions and other offering expenses, was approximately $43.1 million.
On November 6, 2017, the Company entered into a Merger Agreement with Cantaloupe for cash and 3,423,367 shares of the company’s stock valued at $19.8 million. Refer to Footnote 3 for details on the Merger Agreement.
17
WARRANTS
During the three and sixnine months ended DecemberMarch 31, 2017, no warrants were exercised as compared to2024, amortization of capitalized contract costs was $0.2 million and $0.7 million, respectively. During the three and sixnine months ended DecemberMarch 31, 2016 where 2.42023, amortization of capitalized contract costs was $0.2 million warrants were exercised at $2.6058 per share, yielding proceeds of $6.2 million. The following table summarizes warrant activity for the three and six months ended December 31, 2017 and 2016:
|
|
|
|
|
|
|
|
|
|
| Three months ended |
| Six months ended | ||||
|
| December 31, |
| December 31, | ||||
|
| 2017 |
| 2016 |
| 2017 |
| 2016 |
Beginning balance |
| 23,978 |
| 68,978 |
| 23,978 |
| 2,445,653 |
Issued |
| — |
| — |
| — |
| — |
Exercised |
| — |
| (24,733) |
| — |
| (2,401,408) |
Expired |
| — |
| — |
| — |
| — |
Cancelled |
| — |
| (20,267) |
| — |
| (20,267) |
Ending balance |
| 23,978 |
| 23,978 |
| 23,978 |
| 23,978 |
STOCK OPTIONS
In July 2017, 135,000 stock options were granted for 11 employees vesting 1/3 on July 26, 2018, 1/3 on July 26, 2019 and 1/3 on July 26, 2020 expiring if not exercised prior to July 26, 2022. The options are intended to qualify as incentive stock options under Section 422 of the Internal Revenue Code of 1986, as amended.
In August 2017, the Company awarded stock options to its Chief Executive Officer (CEO) and Chief Financial Officer (CFO) to purchase up to 19,047 and 25,000 shares respectively of common stock at an exercise price of $5.25 per share. The CEO options vest on August 16, 2018, expiring if not exercised prior to August 16, 2024. The CFO options vest 1/3 on August 16, 2018, 1/3 on August 16, 2019 and 1/3 on August 16, 2020, expiring if not exercised prior to August 16, 2024. The CEO options are intended to qualify as incentive stock options under Section 422 of the Internal Revenue Code of 1986, as amended, and the CFO options are non-qualified stock options.
|
|
|
|
| ||||||||||||||||||||||||||||||
|
| Six months ended | ||||||||||||||||||||||||||||||||
|
| December 31, | ||||||||||||||||||||||||||||||||
|
| 2017 |
| 2016 | ||||||||||||||||||||||||||||||
| Nine months ended March 31, | Nine months ended March 31, | |||||||||||||||||||||||||||||||||
| 2024 | 2024 | 2023 | ||||||||||||||||||||||||||||||||
Expected volatility (percent) |
|
| 50.21 - 50.89 |
| 50.00 | Expected volatility (percent) | 52.6% - 69.7% | 74.6% - 77.6% | ||||||||||||||||||||||||||
Expected life (years) |
|
| 4.0 - 4.5 |
| 4.0 | |||||||||||||||||||||||||||||
Expected dividends |
|
| — |
| — | |||||||||||||||||||||||||||||
| Weighted average expected life (years) | Weighted average expected life (years) | 4.2 - 4.5 | 4.4 - 4.6 | |||||||||||||||||||||||||||||||
| Dividend yield (percent) | Dividend yield (percent) | 0.0 | % | 0.0 | % | |||||||||||||||||||||||||||||
Risk-free interest rate (percent) |
|
| 1.64 - 1.72 |
| 1.06 | Risk-free interest rate (percent) | 4.1% - 4.3% | 2.7% - 4.1% | ||||||||||||||||||||||||||
Number of options granted |
|
| 179,047 |
| 20,080 | |||||||||||||||||||||||||||||
Weighted average exercise price |
| $ | 5.66 |
| $ | 4.98 | ||||||||||||||||||||||||||||
Weighted average grant date fair value |
| $ | 2.42 |
| $ | 1.98 | ||||||||||||||||||||||||||||
18
COMMON STOCK
On July 1, 2017, $90 thousandThe Compensation Committee of the Board of Directors has established the performance metrics as a price target for the trading price of the Company’s common stock grants were awarded toin each non-employee Director based onapplicable fiscal year. The price target is achieved if the average closing price of the Company’s Common Stockcommon stock during any consecutive 30-trading-day period during the applicable fiscal year meets or exceeds: (i) $10.50 in the case of fiscal year 2021; (ii) $13.50 in the case of fiscal year 2022; (iii) $16.50 in the case of fiscal year 2023; and (iv) $19.50 in the case of fiscal year 2024. If at least 80% of the performance goals for an applicable fiscal year are achieved, the Compensation Committee may determine that the portion of the option eligible to vest based on June 8, 2017 (the date for which the stock grants were initially approved), for a total of 98,184 shares. The sharessuch fiscal year’s performance will vest ratably on a monthly basis overprorated basis. In so determining, the twoCompensation Committee will consider the Company’s performance relative to its market competitors and any other considerations deemed relevant by the Compensation Committee. The Compensation Committee’s guideline is generally that for every percentage point the achieved price falls below the price target, the percentage of the performance options eligible to vest in respect of the applicable fiscal year should be reduced by 2%, but the Compensation Committee may vary this formula in its sole discretion.
$0.5 million and $1.6 million, respectively. The total expense recognized for restricted stock awards for the three and nine months ended March 31, 2023 was $0.3 million and $1.3 million, respectively.
| Three months ended March 31, | ||||||||||||||
| ($ in thousands, except per share data) | 2024 | 2023 | ||||||||||||
| Numerator for basic and diluted loss per share | ||||||||||||||
| Net income (loss) | $ | 4,656 | 6,948 | |||||||||||
| Preferred dividends | (289) | $ | (289) | |||||||||||
| Net income (loss) applicable to common shareholders | 4,367 | 6,659 | ||||||||||||
Denominator for basic earnings (loss) per share - Weighted average shares outstanding | 72,851,498 | 72,491,373 | ||||||||||||
| Effect of dilutive potential common shares | 1,216,939 | 374,848 | ||||||||||||
Denominator for diluted earnings (loss) per share - Adjusted weighted average shares outstanding | 74,068,437 | 72,866,221 | ||||||||||||
| Basic earnings (loss) per share | $ | 0.06 | $ | 0.09 | ||||||||||
| Diluted earnings (loss) per share | $ | 0.06 | $ | 0.09 | ||||||||||
| Nine months ended March 31, | ||||||||||||||
| ($ in thousands, except per share data) | 2024 | 2023 | ||||||||||||
| Numerator for basic and diluted loss per share | ||||||||||||||
| Net income (loss) | 9,787 | $ | (2,199) | |||||||||||
| Preferred dividends | (578) | $ | (623) | |||||||||||
| Net income (loss) applicable to common shareholders | 9,209 | (2,822) | ||||||||||||
Denominator for basic earnings (loss) per share - Weighted average shares outstanding | 72,770,582 | 71,771,135 | ||||||||||||
| Effect of dilutive potential common shares | 1,284,238 | — | ||||||||||||
Denominator for diluted earnings (loss) per share - Adjusted weighted average shares outstanding | 74,054,820 | 71,771,135 | ||||||||||||
| Basic earnings (loss) per share | $ | 0.13 | $ | (0.04) | ||||||||||
| Diluted earnings (loss) per share | $ | 0.12 | $ | (0.04) | ||||||||||
LONG TERM INCENTIVE PLANS
The Board approved the Fiscal Year 2018 Long-Term Stock Incentive Plan (the “2018 LTI Stock Plan”) which provides that executive officers would be awarded shares of common stock of $1.73 million for an aggregate amount of $2.15 million that was included within the cash flows from financing activities in the condensed consolidated statements of cash flows. The remaining $0.3 million was deemed to be an amount in excess of the fair value of the preferred stock and was recorded within operating expenses in the condensed consolidated statements of operations and cash flows from operating activities in the condensed consolidated statements of cash flows.
The Company had long-term stock incentive plans (“LTI”) in prior fiscal years for its then executive officers. Stock based compensationthird party insurance carrier related to the LTI plans wasreimbursement of expenses associated with the closed SEC investigation of the Company's accounting practices from fiscal years 2017 and 2018. The settlement will be recognized as followsa gain in the three and six months ended December 31, 2017 and 2016:
|
|
|
|
|
|
|
|
|
|
|
|
|
|
| Three months ended |
| Six months ended | ||||||||
|
| December 31, |
| December 31, | ||||||||
($ in thousands, except per share data) |
| 2017 |
| 2016 |
| 2017 |
| 2016 | ||||
FY18 LTI Plan |
| $ | 273 |
| $ | — |
| $ | 489 |
| $ | — |
FY17 LTI Plan |
|
| 64 |
|
| 85 |
|
| 128 |
|
| 155 |
FY16 LTI Plan |
|
| 9 |
|
| 23 |
|
| 19 |
|
| 50 |
FY15 LTI Plan |
|
| — |
|
| 3 |
|
| — |
|
| 3 |
Total |
| $ | 346 |
| $ | 111 |
| $ | 636 |
| $ | 208 |
13. COMMITMENTS AND CONTINGENCIES
DuringCompany's consolidated financial statements in the current fiscal year, the Company expanded the leased space for its headquarters in Malvern, Pennsylvania to a total of 23,138 square feet. The company’s monthly base rent now is approximately $47 thousand with a lease expiration date of November 30, 2023.
Through the Cantaloupe acquisition, the Company absorbed a noncancelable operating lease pertaining to Cantaloupe’s headquarters based in San Francisco, California. The leased premise consists of approximately 8,400 square feet and calls for rental payments of approximately $46 thousand due each month through its January 31, 2020 expiration date.
19
From time to time, the Company is involved in various legal proceedings arising during the normal course of business. In the opinion of the Company’s management, these proceedings will not have a material adverse effect on the Company’s financial position, results of operations or cash flows.
14. SUBSEQUENT EVENTS
The Company has evaluated subsequent events that occurred through the date of the filing of this Form 10-Q. No significant events occurred subsequent to the balance sheet date and prior to the filing date of this Form 10-Q that would have a material impact on the Consolidated Financial Statements.
• whether we are able to fully remediate our material weaknesses in our internal controls over financial reporting or continue to experience material weaknesses in our internal controls over financial reporting in the future, and are not able to accurately or timely report our financial condition or results of operations; more. Company's fiscal year ends June 30. The Company generates Management’s Discussion and Analysis of Financial Condition and Results of Operations should be read in conjunction with the condensed consolidated financial statements and related notes included in this Form 10-Q.Forward-Looking StatementsThis Form 10-Q10‑Q contains certain forward-looking statements within the meaning of Section 21E of the Securities Exchange Act of 1934, as amended, regarding, among other things, the anticipated financial and operating results of the Company.Cantaloupe, Inc. For this purpose, forward-looking statements are any statements contained herein that are not statements of historical fact and include, but are not limited to, those preceded by or that include the words, “estimate,” “could,” “should,” “would,” “likely,” “may,” “will,” “plan,” “intend,” “believes,” “expects,” “anticipates,” “projected,” or similar expressions. Those statements are subject to known and unknown risks, uncertainties and other factors that could cause the actual results to differ materially from those contemplated by the statements. The forward-looking information is based on various factors and was derived using numerous assumptions. Important factors that could cause the Company’s actual results to differ materially from those projected include, for example:·general economic, market or business conditions unrelated to our operating performance;·the ability of the Company to raise funds in the future through sales of securities or debt financing in order to sustain its operations if an unexpected or unusual event would occur;·the ability of the Company to compete with its competitors to obtain market share;·whether the Company’s current or future customers purchase, lease, rent or utilize ePort devices or our other products in the future at levels currently anticipated by our Company;·whether the Company’s customers continue to utilize the Company’s transaction processing and related services, as our customer agreements are generally cancelable by the customer on thirty to sixty days’ notice;·the ability of the Company to satisfy its trade obligations included in accounts payable and accrued expenses;·the ability of the Company to sell to third party lenders all or a portion of our finance receivables;·the ability of a sufficient number of our customers to utilize third party financing companies under our QuickStart program in order to improve our net cash used by operating activities;·the incurrence by us of any unanticipated or unusual non-operating expenses which would require us to divert our cash resources from achieving our business plan;·the ability of the Company to predict or estimate its future quarterly or annual revenues and expenses given the developing and unpredictable market for its products;·the ability of the Company to retain key customers from whom a significant portion of its revenues are derived;·the ability of a key customer to reduce or delay purchasing products from the Company;·the ability of the Company to obtain widespread commercial acceptance of its products and service offerings such as ePort QuickConnect, mobile payment and loyalty programs;•general economic, market or business conditions unrelated to our operating performance, including inflation, rising interest rates, financial institution disruptions, public health emergencies and declines in consumer confidence and discretionary spending;20
• our ability to compete with our competitors and increase market share;• failure to comply with the financial covenants in the Amended JPMorgan Credit Facility;• our ability to raise funds in the future through sales of securities or debt financing in order to sustain operations in the normal course of business or if an unexpected or unusual event were to occur;• our ability to maintain compliance with rules and regulations applicable to our business operations and industry• disruptions in or inefficiencies to our supply chain and/or operations;• the risks related to the availability of, and cost inflation in, supply chain inputs, including labor, raw materials, packaging and transportation;•weather, climate conditions, natural disasters or other unexpected events;• whether our current or future customers purchase, lease, rent or utilize our devices, software solutions or our other products in the future at levels currently anticipated;• whether our customers continue to utilize the Company’s transaction processing and related services, as our customer agreements are generally cancellable by the customer on thirty to sixty days’ notice;•our ability to acquire and develop relevant technology offerings for current, new and potential customers and partners;•risks and uncertainties associated with our expansion into and our operations in Europe, Latin America and other foreign markets, including general economic conditions, policy changes affecting international trade, political instability, inflation rates, recessions, sanctions, foreign currency exchange rates and controls, foreign investment and repatriation restrictions, legal and regulatory constraints, civil unrest, armed conflict, war and other economic and political factors;• our ability to satisfy our trade obligations included in accounts payable and accrued expenses;•our ability to attract, develop and retain key personnel, or our loss of the services of our key executives;• the incurrence by us of any unanticipated or unusual non-operating expenses, which may require us to divert our cash resources from achieving our business plan;• our ability to predict or estimate our future quarterly or annual revenue and expenses given the developing and unpredictable market for our products;• our ability to integrate acquired companies into our current products and services structure;• our ability to add new customers and retain key existing customers from whom a significant portion of our revenue is derived;• the ability of a key customer to reduce or delay purchasing products from us;• our ability to obtain widespread commercial acceptance of our products and service offerings;25• whether any patents issued to us will provide any competitive advantages or adequate protection for our products, or would be challenged, invalidated or circumvented by others;·whether any patents issued to the Company will provide the Company with any competitive advantages or adequate protection for its products, or would be challenged, invalidated or circumvented by• our ability to operate without infringing the intellectual property rights of others;
• the ability of our products and services to avoid disruptions to our systems or unauthorized hacking or credit card fraud;·the ability of the Company to operate without infringing the intellectual property rights of others;
• geopolitical conflicts, such as the ongoing conflict between Russia and Ukraine, and the conflict between Israel and Hamas;·the ability of our products and services to avoid unauthorized hacking or credit card fraud;·
• the ability to remain in compliance with the continued listing standards of the Nasdaq Global Select Market (“Nasdaq”) and continue to remain as a member of the US Small-Cap Russell 2000®;·whether our suppliers would increase their prices, reduce their output or change their terms of sale; and
• whether our suppliers would increase their prices, reduce their output or change their terms of sale; and·our ability to obtain additional financing in the future for working capital, capital expenditures, acquisitions, general corporate purposes or other purposes may be impaired.• the risks associated with cyber attacks and data breaches.Although we believe that the expectations reflected in the forward-looking statements are reasonable, we cannot guarantee future results, levels of activity, performance, or achievements. Actual results or business conditions may differ materially from those projected or suggested in forward-looking statements as a result of various factors including, but not limited to, those described above.above, or those discussed under Part I, Item 1A. “Risk Factors” of our Annual Report on Form 10-K for the fiscal year ended June 30, 2023 (“2023 Form 10-K”). We cannot assure you that we have identified all the factors that create uncertainties. Moreover, new risks emerge from time to time and it is not possible for our management to predict all risks, nor can we assess the impact of all risks on our business or the extent to which any risk, or combination of risks, may cause actual results to differ from those contained in any forward-looking statements. Readers should not place undue reliance on forward-looking statements.Any forward-looking statement made by us in this Form 10-Q speaks only as of the date of this Form 10-Q. Unless required by law, we undertake no obligation to publicly revise any forward-looking statement to reflect circumstances or events after the date of this Form 10-Q or to reflect the occurrence of unanticipated events.OVERVIEW OF THE COMPANYUSA Technologies,Cantaloupe, Inc. was incorporated inis a global technology leader powering self-service commerce. With over a million active locations across the Commonwealthglobe processing more than a billion transactions every year, Cantaloupe is enabling businesses of Pennsylvania in January 1992. We are a provider of technology-enabledall sizes to provide self-service experiences for consumers. The company's vertically integrated solutions and value-added services that facilitate electronic payment transactions and consumer engagement services primarily within the unattended Point of Sale (“POS”) market. We are a leading provider in the small ticket, beverage and food vending industry and are expanding our solutions and services to other unattended market segments, such as amusement, commercial laundry, kiosk and others. Since our founding, we have designed and marketed systems and solutions that facilitate electronic payment options,fuel growth by offering micro-payments processing, enterprise cloud software, IoT technology, as well as telemetry Internetkiosk and POS innovations. Cantaloupe’s end-to-end platform increases consumer engagement and sales revenue through digital payments, consumer promotions and loyalty programs, while providing business owners increased profitability by leveraging software to drive efficiencies across an entire operation. Cantaloupe’s solutions are used by a wide variety of Things (“IoT”)consumer services in North America, Europe, Latin America, and machine-to-machine (“M2M”)Australia including vending machines, micro markets and smart retail, laundromats, metered parking terminals, amusement and entertainment venues, IoT services which include the ability to remotely monitor, control, and report on the results of distributed assets containing our electronic payment solutions. Historically, these distributed assets have relied on cash for payment in the form of coins or bills, whereas, our systems allow them to accept cashless payments such as through the use of credit or debit cards or other emerging contactless forms, such as mobile payment.The recent acquisition of Cantaloupe expanded the Company’s existing platform to become an end-to-end enterprise platform integrating Cantaloupe’s Seed Cloud which provides cloud and mobile solutions for dynamic route scheduling, automated pre-kitting, responsive merchandising, inventory management, warehouse and accounting management, as well as cashless vending. The combined companies complete the value chain for customers by providing both top-line revenue generating services as well as bottom line business efficiency services to help operators of unattended retail machines run their business better. The combination also marries the data-rich Seed system with USAT’s consumer benefits, providing operators with valuable consumer data that results in customized experiences. In addition to new technology and services, due to Cantaloupe’s existing customer base, the acquisition expands the Company’s footprint into new global markets.revenuerevenues in multiple ways. During the three and six months ended DecemberMarch 31, 2017,2024 and March 31, 2023, we derived 70.3%approximately 87% and 73.6% of our revenues85%, respectively, from recurring licensesubscription and transaction fees, related to our ePort Connect service or Seed Cloud solution and 29.7%13% and 26.4% of our revenue15%, respectively, from equipment sales, respectively. Connections tosales. During the nine months ended March 31, 2024 andMarch 31, 2023, we derived approximately 87% and 82%, respectively, from subscription and transaction fees and 13% and 18%, respectively, from equipment sales.Active Devices (as defined below) operating on the Company’s platform and using our service stemservices include those resulting from the sale or lease of our POSpoint of sale ("POS") electronic payment devices, telemetry devices or certified payment software or the servicing of similar third-party installed POS terminals. Connections to the ePort Connect serviceterminals or Seed Cloud solution are the most21significant driver of the Company’s revenues, particularly the recurring revenues from license and transaction fees.telemetry devices. Customers can obtain POS electronic payment devices from us in the following ways:·Purchasing devices•Purchasing hardware directly from the Company or one of its authorized resellers;·Financing devices under the Company’s QuickStart Program, which are non-cancellable sixty month sales-type leases, through an unrelated equipment financing company, if available, or directly from the Company; and·Renting devices under the Company’s JumpStart Program or Cantaloupe’s rental program, which are cancellable month-to-month operating leases.As of December 31, 2017, highlightsits authorized resellers;
|
|
|
|
|
|
|
|
|
|
|
|
•Revenues of $67.9 million, an increase of 12.5% year over year. The Company has net deferred tax assetsincrease was led by higher transaction fees and subscription fees revenue;
CRITICAL ACCOUNTING POLICIES
Ourread in conjunction with the condensed consolidated financial statements and related notes included in this Form
Revenue Recognition
Revenue from the sale or QuickStart lease of equipment is recognized on the terms of free-on-board shipping point. Activation fee revenue, if applicable, is recognized when the Company’sePort cashless payment device is initially activated for use onas well as Seed management services constitutes only one device.
ePort hardware is available to customers under the QuickStart program pursuant to which the customer would enter into a five-year non-cancelable lease with either the Company or a third-party financing companyacquisition expenses, and (ix) severance expenses that are non-recurring and are not indicative of our core operations.
22
contracts qualify for sales type lease accounting. Accordingly, the Company recognizes a portion of lease payments as interest income. At the end of the lease period, the customer would have the option to purchase the device at its residual value.
Long Lived Assets
In accordance with ASC 360, “Impairment or Disposal of Long-Lived Assets”, the Company reviews its definite lived long-lived assets whenever events or changes in circumstances indicate that the carrying amount of such assets may not be recoverable. If the carrying amount of an asset or group of assets exceeds its net realizable value, the asset will be written down to its fair value. In the period when the plan of sale criteria of ASC 360 are met, definite lived long-lived assets are reported as held for sale, depreciation and amortization cease, and the assets are reported at the lower of carrying value or fair value less costs to sell.
Goodwill and Intangible Assets
Goodwill represents the excess of cost over fair value of the net assets purchased in acquisitions. The Company accounts for goodwill in accordance with ASC 350, “Intangibles – Goodwill and Other”. Under ASC 350, goodwill is not amortized to earnings, but instead is subject to periodic testing for impairment. Testing for impairment is to be done at least annually and at other times if events or circumstances arise that indicate that impairment may have occurred.
Company intangible assets include non-compete agreements, brand, developed technology, and customer relationships. They are carried at cost less accumulated amortization, which is calculated on a straight-line basis over their estimated economic life. The Company reviews intangibles, subject to amortization, for impairment whenever events or changes in circumstances indicate that the carrying amount may not be recoverable.
Allowance for Doubtful Accounts
The Company maintains an allowance for doubtful accounts for estimated losses resulting from the inability of its customers to make required payments, including from a shortfall in the customer transaction fund flow from which the Company would normally collect amounts due.
The allowance is determined through an analysis of various factors including the aging of the accounts receivable, the strength of the relationship with the customer, the capacity of the customer transaction fund flow to satisfy the amount due from the customer, an assessment of collection costs and other factors. The allowance for doubtful accounts receivable is management’s best estimate as of the respective reporting date. The Company writes off accounts receivable against the allowance when management determines the balance is uncollectible and the Company ceases collection efforts. Management believes that the allowance recorded is adequate to provide for its estimated credit losses.
Valuation Allowance
The Company follows the provisions of FASB ASC 740, Accounting for Uncertainty in Income Taxes, which provides detailed guidance for the financial statement recognition, measurement and disclosure of uncertain tax positions recognized in the consolidated financial statements. Tax positions must meet a “more-likely-than-not” recognition threshold at the effective date to be recognized upon the adoption of ASC 740 and in subsequent periods.
Income taxes are computed using the asset and liability method of accounting. Under the asset and liability method, a deferred tax asset or liability is recognized for estimated future tax effects attributable to temporary differences and carryforwards. The measurement of deferred income tax assets is adjusted by a valuation allowance, if necessary, to recognize future tax benefits only to the extent that, based on available evidence, it is more likely than not such benefits will be realized. The Company recognizes interest and penalties, if any, related to uncertain tax positions in selling, general and administrative expenses. No interest or penalties related to uncertain tax positions were accrued or incurred during the three and six months ended December 31, 2017 and 2016.
Recent Accounting Pronouncements
See Note 2 to the interim Consolidated Financial Statements for a description of recent accounting pronouncements.
| As of and for the three months ended | |||||||||||||||||||||||||||||
| March 31, 2024 | December 31, 2023 | September 30, 2023 | June 30, 2023 | March 31, 2023 | |||||||||||||||||||||||||
| Devices: | |||||||||||||||||||||||||||||
| Active Devices (thousands) | 1,217 | 1,226 | 1,192 | 1,168 | 1,150 | ||||||||||||||||||||||||
| Customers: | |||||||||||||||||||||||||||||
| Active Customers | 30,670 | 30,027 | 29,670 | 28,584 | 27,598 | ||||||||||||||||||||||||
| Volumes: | |||||||||||||||||||||||||||||
| Total Number of Transactions (millions) | 283.3 | 286.7 | 283.6 | 278.6 | 267.8 | ||||||||||||||||||||||||
| Total Dollar Volume of Transactions (millions) | 767.4 | 730.1 | 724.8 | 703.5 | 653.6 | ||||||||||||||||||||||||
| Subscription and transaction fees - Trailing 12 months (thousands) | $ | 223,342 | $ | 215,380 | $ | 208,283 | $ | 200,223 | $ | 192,147 | |||||||||||||||||||
| Average revenue per unit (ARPU) | $ | 186.00 | $ | 181.91 | $ | 178.78 | $ | 173.39 | $ | 167.52 | |||||||||||||||||||
23
TRENDING QUARTERLY FINANCIAL DATA
The following tables show certain financial and non-financial data that management believes give readers insight into certain trends and relationships about the Company’s financial performance.
Five Quarter Select Key Performance Indicators including Connections
|
|
|
|
|
|
|
|
|
|
|
|
|
|
|
|
|
| As of and for the three months ended | |||||||||||||
|
| December 31, |
| September 30, |
| June 30, |
| March 31, |
| December 31, | |||||
|
| 2017 |
| 2017 |
| 2017 |
| 2017 |
| 2016 | |||||
Connections: |
|
|
|
|
|
|
|
|
|
|
|
|
|
|
|
Gross new connections |
|
| 317,000 |
|
| 28,000 |
|
| 70,000 |
|
| 40,000 |
|
| 25,000 |
% from existing customer base |
|
| 44% |
|
| 82% |
|
| 93% |
|
| 88% |
|
| 80% |
Net new connections (a) |
|
| 311,000 |
|
| 26,000 |
|
| 64,000 |
|
| 35,000 |
|
| 21,000 |
Total connections |
|
| 905,000 |
|
| 594,000 |
|
| 568,000 |
|
| 504,000 |
|
| 469,000 |
|
|
|
|
|
|
|
|
|
|
|
|
|
|
|
|
Customers: |
|
|
|
|
|
|
|
|
|
|
|
|
|
|
|
New customers added (a) |
|
| 1,800 |
|
| 550 |
|
| 300 |
|
| 500 |
|
| 500 |
Total customers |
|
| 15,050 |
|
| 13,250 |
|
| 12,700 |
|
| 12,400 |
|
| 11,900 |
|
|
|
|
|
|
|
|
|
|
|
|
|
|
|
|
Volumes: |
|
|
|
|
|
|
|
|
|
|
|
|
|
|
|
Total number of transactions (millions) |
|
| 144.8 |
|
| 121.1 |
|
| 114.8 |
|
| 104.9 |
|
| 100.1 |
Total volume (millions) |
| $ | 272.7 |
| $ | 239.2 |
| $ | 225.6 |
| $ | 202.5 |
| $ | 191.5 |
|
|
|
|
|
|
|
|
|
|
|
|
|
|
|
|
Financing structure of connections: |
|
|
|
|
|
|
|
|
|
|
|
|
|
|
|
JumpStart |
|
| 0.4% |
|
| 4.1% |
|
| 3.3% |
|
| 8.6% |
|
| 6.8% |
QuickStart & all others (b) |
|
| 99.6% |
|
| 95.9% |
|
| 96.7% |
|
| 91.4% |
|
| 93.2% |
Total |
|
| 100.0% |
|
| 100.0% |
|
| 100.0% |
|
| 100.0% |
|
| 100.0% |
|
|
|
|
Highlights of USAT’s connections for the quarter ended DecemberMarch 31, 20172024 include:
|
|
|
|
|
|
24
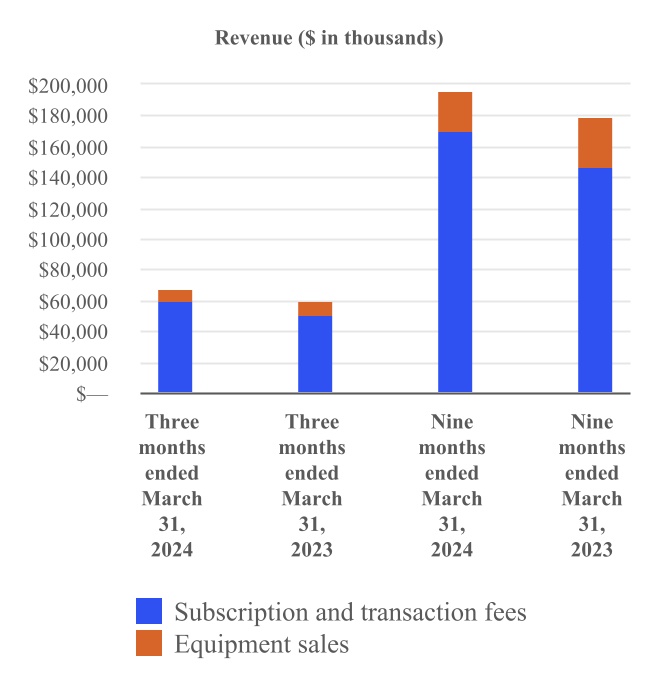
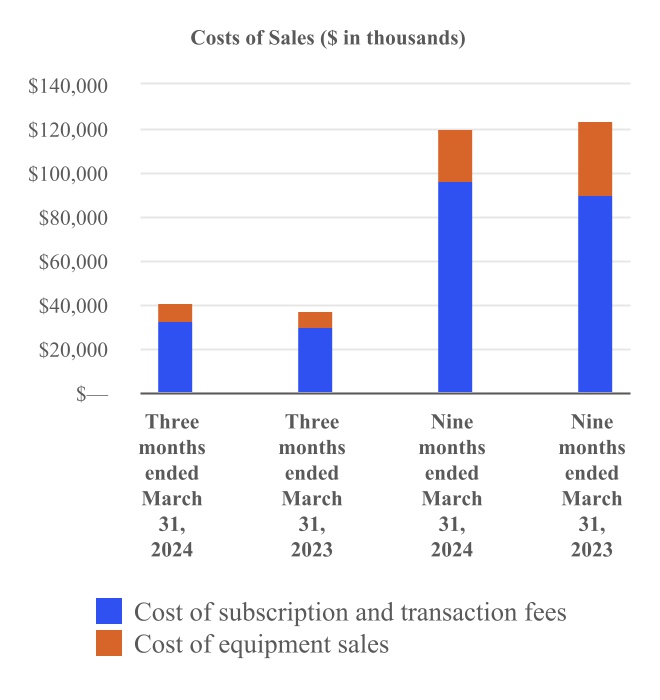
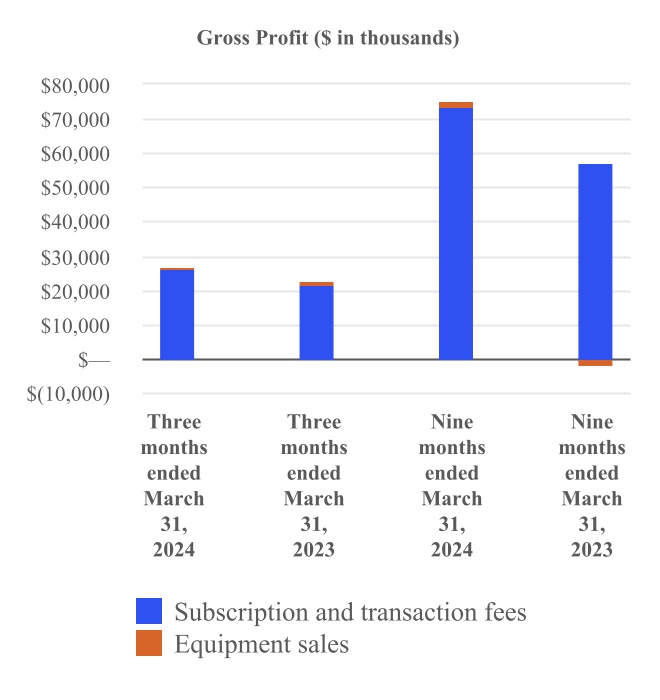
Revenue and Gross Profit
|
|
|
|
|
|
|
|
|
|
| For the three months ended December 31, |
| Percent | ||||
($ in thousands) |
| 2017 |
| 2016 |
| Change | ||
Revenues: |
|
|
|
|
|
|
|
|
License and transaction fees |
| $ | 22,853 |
| $ | 16,639 |
| 37.3% |
Equipment sales |
|
| 9,653 |
|
| 5,117 |
| 88.6% |
Total revenues |
|
| 32,506 |
|
| 21,756 |
| 49.4% |
|
|
|
|
|
|
|
|
|
Costs of sales: |
|
|
|
|
|
|
|
|
Cost of services |
|
| 14,362 |
|
| 11,389 |
| 26.1% |
Cost of equipment |
|
| 8,943 |
|
| 4,033 |
| 121.7% |
Total costs of sales |
|
| 23,305 |
|
| 15,422 |
| 51.1% |
|
|
|
|
|
|
|
|
|
Gross profit: |
|
|
|
|
|
|
|
|
License and transaction fees |
|
| 8,491 |
|
| 5,250 |
| 61.7% |
Equipment sales |
|
| 710 |
|
| 1,084 |
| (34.5%) |
Total gross profit |
| $ | 9,201 |
| $ | 6,334 |
| 45.3% |
For the three months ended December 31, Percent Category ($ in thousands) 2017 2016 Change Selling, general and administrative expenses $ 8,329 $ 5,785 Integration and acquisition costs 3,335 8 Depreciation and amortization 737 307 Total operating expenses $ 12,401 $ 6,100 For the three months ended December 31, Percent ($ in thousands) 2017 2016 Change Other income (expense): Interest income $ 251 $ 200 Interest expense (494) (201) Total other expense, net $ (243) $ (1) For the three months ended December 31, Percent ($ in thousands) 2017 2016 Change Provision for income taxes $ (9,073) $ - For the three months ended December 31, ($ in thousands) 2017 2016 Net (loss) income $ (12,516) $ 233 Less interest income (251) (200) Plus interest expense 494 201 Plus income tax provision 9,073 — Plus depreciation expense 1,512 1,220 Plus amortization expense 472 43 EBITDA (1,216) 1,497 Plus stock-based compensation 780 233 Plus integration and acquisition costs and inventory step-up 3,358 8 Adjustments to EBITDA 4,138 241 Adjusted EBITDA $ 2,922 $ 1,738 Three months ended December 31, ($ in thousands) 2017 2016 Operating (loss) income $ $ Plus integration and acquisition costs and inventory step-up Plus amortization expense Adjusted operating income $ $ Three months ended December 31, ($ in thousands) 2017 2016 Net (loss) income $ (12,516) $ 233 Non-GAAP adjustments: Non-cash portion of income tax provision (benefit) 9,073 — Amortization expense 472 43 Stock-based compensation 780 233 Litigation related professional fees — — Integration and acquisition-related costs 3,413 8 Non-GAAP net income $ 1,222 $ 517 For the six months ended December 31, Percent ($ in thousands) 2017 2016 Change Revenues: License and transaction fees $ 42,797 $ 33,004 Equipment sales 15,326 10,340 Total revenues 58,123 43,344 Costs of sales: Cost of services 27,688 22,632 Cost of equipment 14,033 8,211 Total costs of sales 41,721 30,843 Gross profit: License and transaction fees 15,109 10,372 Equipment sales 1,293 2,129 Total gross profit $ 16,402 $ 12,501 For the six months ended December 31, Percent Category ($ in thousands) 2017 2016 Change Selling, general and administrative expenses $ 15,075 $ 12,593 Integration and acquisition costs 4,097 109 Depreciation and amortization 982 515 Total operating expenses $ 20,154 $ 13,217 For the six months ended December 31, Percent ($ in thousands) 2017 2016 Change Other income (expense): Interest income $ 331 $ 273 Interest expense (703) (413) Change in fair value of warrant liabilities - (1,490) Total other expense, net $ (372) $ (1,630) For the six months ended December 31, Percent ($ in thousands) 2017 2016 Change (Provision) benefit for income taxes $ (8,605) $ 115 (7,583)% For the six months ended December 31, ($ in thousands) 2017 2016 Net loss $ (12,729) $ (2,231) Less interest income (331) (273) Plus interest expense 703 413 Plus income tax provision (benefit) 8,605 (115) Plus depreciation expense 2,960 2,477 Plus amortization expense 516 87 EBITDA (276) 358 Plus loss on fair value of warrant liabilities — 1,490 Plus stock-based compensation 1,356 445 Plus litigation related professional fees — 33 Plus integration and acquisition costs and inventory step-up 4,120 109 Adjustments to EBITDA 5,476 2,077 Adjusted EBITDA $ 5,200 $ 2,435 Six months ended December 31, ($ in thousands) 2017 2016 Operating loss $ $ Plus integration and acquisition costs and inventory step-up Plus amortization expense Adjusted operating income (loss) $ $ Six months ended December 31, ($ in thousands) 2017 2016 Net loss $ (12,729) $ (2,231) Non-GAAP adjustments: Non-cash portion of income tax benefit 8,605 (115) Fair value of warrant adjustment — 1,490 Amortization expense 516 87 Stock-based compensation 1,356 445 Litigation related professional fees — 33 Integration and acquisition-related costs 4,175 109 Non-GAAP net income (loss) $ 1,923 $ (182) our 2023 Form 10-K. 101 The following financial information from our Quarterly Report on Form 10-Q for the quarter ended Pursuant to the requirements of the Securities Exchange Act of 1934, the registrant has duly caused this report to be signed on its behalf by the undersigned thereunto duly authorized. Chief Executive Officer Chief Financial OfficerRevenue. Three months ended March 31, Change($ in thousands) 2024 2023 Amount Percentage Revenues: Subscription and transaction fees $ 59,207 $ 51,245 $ 7,962 15.5 % Equipment sales 8,690 9,111 (421) (4.6) % Total revenues 67,897 60,356 7,541 12.5 % Costs of sales: Cost of subscription and transaction fees 32,926 29,577 3,349 11.3 % Cost of equipment sales 8,064 7,886 178 2.3 % Total costs of sales 40,990 37,463 3,527 9.4 % Gross profit: Subscription and transaction fees 26,281 21,668 4,613 21.3 % Equipment sales 626 1,225 (599) 48.9 % Total gross profit $ 26,907 $ 22,893 $ 4,014 17.5 % Gross margin: Subscription and transaction fees 44.4 % 42.3 % Equipment sales 7.2 % 13.4 % Total gross margin 39.6 % 37.9 % Revenues.Total revenuerevenues increased $10.7by $7.5 million for the three months ended DecemberMarch 31, 20172024 compared to the same period in 2016.2023. The growthincrease in total revenue resulted fromrevenues is attributed to a $6.2$8.0 million increase in licensesubscription and transaction fee revenuefees, partially offset by a $0.4 million decrease in equipment sales.The increase in subscription and transaction fees was primarily driven by increased processing volumes with an approximately 17.4% increase in total dollar volumes of transactions for the current fiscal year quarter relative to the prior year quarter. There was an increase in the average revenue per unit and an increase in the total number of active devices relative to the same period in the prior year. Our subscription fees have increased 7.4% for the three months ended DecemberMarch 31, 20172024 compared to the same period in 2016,2023 which is attributed to a continued focus of management to grow our recurring subscription services to our customer base and a $4.5 million increase in equipment revenue for three months ended December 31, 2017 compared to the same period last year, both driven by an increase in connectionsour active devices compared to last year.The decrease in equipment sales in the current fiscal year quarter was due to the prior year still benefiting from the required upgrade to 4G compatible devices. Our equipment margin decreased during the current year quarter primarily driven by increased freight and supply chain costs associated with the Cantaloupe acquisition. Costanticipated ramp in international sales.Costs of sales. Cost Costs of sales increased by $7.9$3.5 million for the three months ended DecemberMarch 31, 20172024 compared to the prior year period. The increase in costs of sales was primarily due to a $3.3 million increase in subscription and transaction costs as a direct result of increased transaction processing fees corresponding with an increase in processing volumes.Gross margin. Total gross margin increased to 39.6% for the three months ended March 31, 2024 from 37.9% for the three months ended March 31, 2023. The increase was primarily a result of an increase in subscription and transaction fees which yield higher margins compared to equipment fees.31Operating ExpensesThree months ended March 31, Change Category ($ in thousands) 2024 2023 Amount Percentage Sales and marketing $ 5,747 $ 3,154 $ 2,593 82.2 % Technology and product development 4,916 4,594 322 7.0 % General and administrative expenses 8,552 7,041 1,511 21.5 % Investigation, proxy solicitation and restatement expenses, net of insurance recoveries — (1,000) 1,000 (100.0) % Integration and acquisition expenses 907 — 907 100.0 % Depreciation and amortization 2,493 2,364 129 5.5 % Total operating expenses $ 22,615 $ 16,153 $ 6,462 40.0 % Total operating expenses.Operating expenses increased 40.0% for the three months ended March 31, 2024 compared to the same period last year. The increase wasin 2023. This is largely driven by increased operating expenses related to the Cheq acquisition and professional service fees related to SOX remediation work. Additionally, prior year had a $3.0net $1 million increasebenefit related to insurance proceeds and expenses incurred in cost of servicesconnection with the 2019 Investigation. See further details on individual categories below.Sales and a $4.9 million increase in cost of equipment sales, both driven by an increase in connectionsmarketing. Sales and the Cantaloupe acquisition.Gross margin. The overall gross margin decreased 0.8% from 29.1% for the three months ended December 31, 2016 to 28.3% for the three months ended December 31, 2017. The decrease in the equipment margin, from 21.2% for the three months ended December 31, 2016 to 7.4% for the three months ended December 31, 2017, reflected our strategy of using equipment sales as an enabler for driving long-term, higher margin license and transaction fees. This decrease was partially offset by an increase in the license fee and transaction margin from 31.6% for the three months ended December 31, 2016 to 37.2% for the three months ended December 31, 2017, which was driven by the impact of the Cantaloupe acquisition. Operational Expenses44.0% 41,587.5% 140.1% 103.3% Selling, general and administrative expenses. Selling, general and administrativemarketing expenses increased approximately $2.5$2.6 million for the three months ended March 31, 2024 compared to the same period in 2023 due to increased compensation costs of approximately $1.3 million, and increased infrastructure, travel and entertainment costs of approximately $0.7 million to support our expanding business and service offerings in the United States and internationally. Additionally, marketing expense increased $0.6 million related to international expansion and the acquisition of Cheq.Technology and product development. Technology and product development expenses increased by $0.3 million for the three months ended March 31, 2024. The increase in the current year was driven by increased headcount partially offset by lower expensed personnel costs as we continued to invest in internal-use software which resulted in higher capitalized costs compared to the prior year.General and administrative expenses. General and administrative expenses increased by $1.5 million for the three months ended March 31, 2024 compared to the same period in 2023 primarily due to a $1.3 million increase in connection with non-recurring project work related to remediating previously identified material weaknesses in our internal controls over financial reporting, $0.6 million increase in bad debt expense, and a $0.4 million increase in compensation related expenses; partially offset by a reduction of $0.5 million to our sales tax liability and $0.2 million in other administrative expenses compared to the same period in the prior year.Integration and acquisition expenses. On February 1, 2024, the Company acquired all of the equity interests of Cheq Lifestyle Technology, Inc. ("Cheq"). For the three months ended March 31, 2024, the Company incurred integration and acquisition expenses of $0.9 million primarily due to professional services from accounting and legal advisors, as well as consulting services from Cheq predecessors. The Company did not incur integration and acquisition expenses during the three month period ended March 31, 2023.Depreciation and amortization. Depreciation and amortization expenses increased $0.1 million for the three months ended March 31, 2024 compared to the same period in 2023. The increase was primarily driven by the amortization of intangible assets associated with the acquisition of 32M in December 2022.Other Income, NetThree months ended March 31, Change ($ in thousands) 2024 2023 Amount Percentage Other income (expense): Interest income from cash and leases $ 495 $ 540 $ (45) (8.3) % Interest income (expense) from debt and tax liabilities 162 (263) 425 161.6 % Other (expense), net (209) (13) (196) (1,507.7) % Total other income, net $ 448 $ 264 $ 184 (69.7) % 32Other income, net. Other income increased $0.2 million for the three months ended March 31, 2017,2024 as compared to the same period in 2016. This change2023. Our interest expense from debt and tax liabilities decreased $0.4 million primarily due to the reduction of the interest component of the sales tax liability offset by incurred interest expense related to our outstanding debt balances. Decrease in interest income from cash and leases is primarily due to lower outstanding balances for our finance receivables. Other expense, net increased primarily due to foreign currency transaction losses.Nine Months Ended March 31, 2024 Compared to Nine Months Ended March 31, 2023Nine months ended March 31, Change ($ in thousands) 2024 2023 Amount Percent Revenues: Subscription and transaction fees $ 170,371 $ 147,252 $ 23,119 15.7 % Equipment sales 25,568 32,216 (6,648) (20.6) % Total revenues 195,939 179,468 16,471 9.2 % Costs of sales: Cost of subscription and transaction fees 96,539 90,149 6,390 7.1 % Cost of equipment sales 23,849 33,823 (9,974) (29.5) % Total costs of sales 120,388 123,972 (3,584) (2.9) % Gross profit: Subscription and transaction fees 73,832 57,103 16,729 29.3 % Equipment sales 1,719 (1,607) 3,326 (207.0) % Total gross profit $ 75,551 $ 55,496 $ 20,055 36.1 % Gross margin: Subscription and transaction fees 43.3 % 38.8 % Equipment sales 6.7 % (5.0) % Total gross margin 38.6 % 30.9 % Revenues. Total revenues increased by $16.5 million for the nine months ended March 31, 2024 compared to the same period in 2023. The increase in revenues was attributed to a $23.1 million increase in subscription and transaction fees, and a $6.6 million decrease in equipment sales.The increase in subscription and transaction fees was primarily driven by increased processing volumes, with an approximately 14% increase in total dollar volumes for the nine months ended March 31, 2024 compared to the same period in 2023. Our transaction fees increased $17.9 million, or 18.4%, due to an increase in the average price per transaction and total number of transactions relative to the same period in the prior year. Our subscription fees increased approximately $5.2 million, or 10.4% for the nine months ended March 31, 2024 compared to the same period in 2023 which was attributed to a continued focus of management to grow our recurring subscription services, the successful expansion of the Cantaloupe One program to our customer base, and the acquisition of 32M.The decrease in equipment sales in the current fiscal year period was primarily driven by decreased equipment shipments compared to the prior year fiscal period. In the prior year, our customers continued upgrading their devices to ensure compatibility with the emerging 4G network, resulting in a surge in equipment shipments. As of December 31, 2022, the 3G to 4G network upgrade has been fully completed in the U.S. market.Costs of sales. Costs of sales decreased $3.6 million for the nine months ended March 31, 2024 compared to the same period in 2023. The decrease was driven by a $10.0 million decrease in equipment costs partially offset by an increase of $6.4 million in subscription and transaction costs.The decrease in costs of sales for equipment was primarily driven by decreased equipment sales. The increased demand in the first half of the prior fiscal year was related to our customers upgrading their payment devices in anticipation of the 3G network discontinuation events described above (See 3G Network discontinuation and upgrade cycle section).33The increase in subscription and transaction costs was primarily driven by an increase in selling, generaltransaction processing fees corresponding with an increase in processing volumes and administrative costs incurredtotal dollar volume of transactions.Gross margin. Total gross margin increased to 38.6% for the nine months ended March 31, 2024 from 30.9% for the nine months ended March 31, 2023. The increase was primarily driven by improved gross margin on equipment sales. The prior year period experienced inflated cost within our supply chain due to unfavorable prices paid to secure certain key component parts to meet production and delivery timelines caused by a greater than anticipated surge in the demand for our ePort hardware products. The increased demand in the first half of fiscal year 2023 was related to Cantaloupe as well asour customers upgrading their payment devices in anticipation of the 3G to 4G network upgrade. This resulted in a negative 5% gross margin on equipment sales for the nine months ending March 31, 2023. Additionally, we had an increase in subscription and transaction fees which yield higher margins compared to equipment fees.Operating ExpensesNine months ended March 31, Change Category ($ in thousands) 2024 2023 Amount Percentage Sales and marketing $ 14,256 $ 8,888 5,368 60.4 % Technology and product development 12,115 16,757 (4,642) (27.7) % General and administrative expenses 29,493 25,179 4,314 17.1 % Investigation, proxy solicitation and restatement expenses — (453) 453 (100.0) % Integration and acquisition expenses 1,078 2,787 (1,709) (61.3) % Depreciation and amortization 7,976 5,029 2,947 58.6 % Total operating expenses $ 64,918 $ 58,187 $ 6,731 11.6 % Total operating expenses. Operating expenses increased approximately $6.7 million for the nine months ended March 31, 2024 compared to the same period in 2023. The increase was attributed to a $5.4 million increase in sales and marketing related consulting expenses, as we continue toa $4.3 million increase our market share in the cashless-transaction vending industry.Integrationgeneral and acquisition costs. Integrationadministrative expenses, a $2.9 million increase in depreciation and acquisition costsamortization, partially offset by a $4.6 million decrease in technology and product development expenses. See further details on individual categories below.Sales and marketing. Sales and marketing expenses increased $3.3approximately $5.4 million for the threenine months ended DecemberMarch 31, 20172024 compared to the same period in 2023 primarily due to higher sales and marketing employee headcount in the current year to support our expanding business in the United States and internationally, in addition to the execution of several marketing campaigns to introduce new product and service offerings leading to increased customer engagement.Technology and product development. Technology and product development decreased $4.6 million for the nine months ended March 31, 2024 compared to the same period in 2023. The decrease was driven by $2.6 million decrease in professional services related to expenses incurred in the prior year upgrading our network environment and platform. Decrease is also a result of $1 million in lower personnel costs as we continued to invest in internal-use software which resulted in higher capitalized costs compared to the prior year.General and administrative expenses. General and administrative expenses increased approximately $4.3 million for the nine months ended March 31, 2024, as compared to the same period in 2016, due2023. The increase in general and administrative expenses was primarily driven by a $3.8 million increase in personnel compensation cost as a result of our growing business, $1.7 million related to the costs incurredprofessional services related to remediating previously identified material weaknesses in connection with the acquisition25of Cantaloupe,our internal controls over financial reporting; partially offset by $8 thousand of acquisition costs incurreda $0.7 million decrease in the second quarter of fiscal year 2017 pertaining to the acquisition of VendScreen, Inc. (“VendScreen”). Depreciationadministrative expenses and amortization. Depreciation and amortization expenses increased approximatelya $0.4 million for the three months ended December 31, 2017 primarily duereduction to the amortization of intangible assets recognized in connection with the Cantaloupe acquisition. Other Expense, net25.5% 145.8% 24200.0% Other expense, net. Other expense, net increased $242 thousand for the three months ended December 31, 2017our sales tax reserve compared to the same period in 2016. Thethe prior year.Integration and acquisition. On February 1, 2024, the Company acquired Cheq Lifestyle Technology, Inc for $4.8 million in cash. During the nine months ended March 31, 2024, the Company incurred expenses of $1.0 million associated with both the closing of the acquisition and the initial integration of CHEQ operations. During the nine months ended March 31, 2023, the Company acquired Three Square Market Inc pursuant to the Purchase Agreement and incurred $2.8 million from accounting, legal and investing banking advisors related to the completion of the acquisition and post-acquisition integration.34Depreciation and amortization. During the nine months ended March 31, 2024, the Company had an increase wasin depreciation and amortization costs of $2.9 million compared to the same period in the prior year due to the acquisition of 32M in December 2022, increased depreciation from our Cantaloupe One program, and increased depreciation for our growing Internal-use software as various projects and initiatives are implemented. Our increase in internal-use software is attributable to management's focus on developing innovative technologies to further strengthen our network environment and platform.Other Income (Expense), NetNine months ended March 31, Change ($ in thousands) 2024 2023 Amount Percentage Other income (expense): Interest income from cash and leases $ 1,505 $ 1,985 (480) (24.2) % Interest income (expense) from debt and tax liabilities (1,947) (1,258) (689) 54.8 % Other (expense), net (158) (112) (46) 41.1 % Total other income (expense), net $ (600) $ 615 (1,215) (197.6) % Other income (expense), net. Other income (expense), net decreased $1.2 million for the nine months ended March 31, 2024 as compared to the same period in 2023 primarily driven by thean increase in interest incurred in connection with the Term Loanexpense from debt and Revolving Credit Facility utilized to fund a portiontax liabilities of the acquisition of Cantaloupe.Income Taxes100% Income taxes. For the three months ended December 31, 2017, an income tax provision of 9,073 thousand (substantially all deferred income taxes) was recorded which includes a charge of $6,592 thousand related$0.7 million due to the recent enactment of the U.S. Tax Cuts and Jobs Act. The tax provision is based upon income (loss) before income taxes using an estimated negative annual effective income tax rate of 49.20%, which is primarily driven by the impact of permanent differences. The tax rate reduction related to tax reform was treated as a discrete itemhigher outstanding debt balance in the tax provision for the three months ended December 31, 2017.For the three months ended December 31, 2016, no adjustment for thecurrent year and a decrease in interest income tax benefit (provision) (substantially all deferred income taxes) was recorded based upon loss before benefit for income taxes using an estimated annual effective income tax rate of 30.0% for the fiscal year ended June 30, 2017 net of a provision for the tax effect of the change in the fair value of warrant liabilities which was treated discretely.Reconciliation of Net (Loss) Incomeapproximately $0.5 million due to Adjusted EBITDA:lower outstanding balances on finance receivables.2635As used herein, Adjusted EBITDA represents net (loss) income before interest income, interest expense, income tax provision (benefit), depreciation, amortization, stock-based compensation expense,Non-GAAP Financial MeasuresWe use certain financial measures internally to evaluate our performance and non-recurring integrationmake financial and acquisition costsoperational decisions that were incurredare presented in connectiona manner that adjusts from their equivalent GAAP measures or that supplement the information provided by our GAAP measures. We use these adjusted results because we believe they more clearly highlight trends in our business that may not otherwise be apparent when relying solely on GAAP financial measures, since these measures eliminate from our results specific financial items that have less bearing on our core operating performance.We use these measures in communicating certain aspects of our results and performance, including in this Quarterly Report, and believe that these measures, when viewed in conjunction with the acquisition of Cantaloupe, including a charge for inventory fair value step-up, in the current fiscal yearour GAAP results and the acquisitionaccompanying reconciliations, can provide investors with greater transparency and a greater understanding of factors affecting our financial condition and results of operations than GAAP measures alone. In addition, we believe the VendScreen businesspresentation of these measures is useful to investors for making period-to-period comparisons of results because the previous fiscal year. We have excluded the non-cash expense, stock-based compensation, as it does not reflect the cash-based operations of the Company. We have excluded the integration and acquisition expenses incurred in connection with the Cantaloupe acquisition, including a charge for inventory fair value step-up, during the current fiscal year and the VendScreen transaction from the previous fiscal year in orderadjustments to allow for a more accurate comparison of the financial results to historical operations, as they pertain to period operational expenses thatGAAP are not a core functionreflective of our business. Adjusted EBITDA is a non-GAAP financial measure which is not required by or defined under GAAP (Generally Accepted Accounting Principles). The presentation of this financial measure is not intended to be consideredcore business performance. Furthermore, certain measures are utilized as metrics in isolation or as a substitute for theour executive offer and management incentive compensation plans.These financial measures prepared andare not presented in accordance with, GAAP, including the net income or net loss of the Company or net cash used in operating activities. Management recognizes that non-GAAPas an alternative to, GAAP financial measures have limitationsand may be different from non-GAAP measures used by other companies. We encourage investors to review the GAAP financial measures included in that they do not reflect allthis Quarterly Report, including our condensed consolidated financial statements, to aid in their analysis and understanding of the items associated with the Company’s net income or net loss as determinedour performance and in accordance with GAAP, and are not a substitute for or a measure of the Company’s profitability or net earnings. making comparisons.Adjusted EBITDA is presented because we believe it is useful to investors as a measure of comparative operating performance. Additionally, the Company utilizes (Non-GAAP)Adjusted EBTIDA as a metric in its executive officer and management incentive compensation plans.Reconciliation of Operating (Loss) Income to Adjusted Operating Income:(3,200) 234 3,358 8 472 43 630 285 As used herein, adjusted operatingearnings before income represents operating (loss) income before the non-recurring integration and acquisition costs incurred in connection with the acquisition of Cantaloupe, including a charge for inventory fair value step-up, and VendScreen transactiontaxes, depreciation, and amortization expenses related to our acquisition-related intangibles. We have excluded these non-recurring costs and amortization expenses in order to allow for a more accurate comparison of the financial results to historical operations and we believe such a comparison is useful to investors as a measure of comparative operating performance. This is the first financial period for which we have adjusted for the amortization expenses related to our acquisition-related intangibles, and we intend to make such adjustments for future financial periods. Reconciliation of Net (Loss) Income to Non-GAAP Net Income:As used herein, non-GAAP net income represents GAAP net (loss) income excluding costs or benefits relating to any non-cash portions of the Company’s income tax benefit, adjustment for fair value of warrant liabilities, non-recurring costs and expenses that were incurred in connection with the acquisition and integration of Cantaloupe, including a charge for inventory fair value step-up and write-off of deferred financing costs, during the current fiscal year and VendScreen during the prior fiscal year, and non-cash expenses for equity awards under our equity incentive plans. This is the first financial period for which we have adjusted for the non-cash expenses attributable to equity awards, and we intend to make such27adjustments for future financial periods. Management believes that non-GAAP net income is an important measure of USAT’s business. Non-GAAP net income(“Adjusted EBITDA”) is a non-GAAP financial measure which is not required by or defined under GAAP. The presentation of this financial measure is not intended to be considered in isolation orWe define Adjusted EBITDA as a substitute for the financial measures prepared and presented in accordance withU.S. GAAP including the net income or net loss of the Company or net(loss) before (i) interest income from cash provided by or (used in) operating activities. Management recognizes that non-GAAP financial measures have limitations in that they do not reflect all of the items associated with the Company’s net (loss) income as determined in accordance with GAAP, and are not a substitute for or a measure of the Company’s profitability or net earnings. Management uses the aforementioned non-GAAP measure to monitorleases, (ii) interest (income) expense on debt and evaluate ongoing operating results and trends and to gain an understanding of our comparative operating performance. We believe that this non-GAAP financial measure serves as a useful metric for our management and investors because they enable a better understanding of the long-term performance of our core business and facilitate comparisons of our operating results over multiple periods, and when taken together with the corresponding GAAP financial measures and our reconciliations, enhance investors’ overall understanding of our current and future financial performance. Additionally, the Company utilizes non-GAAP net income as a metric in its executive officer and management incentive compensation plans.Six Months Ended December 31, 2017 Compared to Six Months Ended December 31, 2016Revenue and Gross Profit29.7% 48.2% 34.1% 22.3% 70.9% 35.3% 45.7% (39.3%) 31.2% Revenue. Total revenue increased $14.8 million for the six months ended December 31, 2017 compared to the same period in 2016. The growth in total revenue resulted from a $9.8 million increase in license and transaction fee revenue for the six months ended December 31, 2017 compared to the same period in 2016, and a $5.0 million increase in equipment revenue for the six months ended December 31, 2017 compared to the same period last year; both driven by an increase in connections and the Cantaloupe acquisition. Cost of sales. Cost of sales increased $10.9 million for the six months ended December 31, 2017 compared to the same period last year. The increase was driven by a $5.1 million increase in cost of services and a $5.8 million increase in cost of equipment sales, both arising from an increase in connections and the Cantaloupe acquisition. Gross margin. The overall gross margin decreased 0.6% from 28.8% for the six months ended December 31, 2016 to 28.2% for the six months ended December 31, 2017. The decrease in the equipment margin, from 20.6% for the six months ended December 31, 2016 to 8.4% for the six months ended December 31, 2017 reflected our strategy of using equipment sales as an enabler for driving long-term, higher margin license and transaction fees. This decrease was partially offset by an increase in the license fee and transaction margin from 31.4% for the six months ended December 31, 2016 to 35.3% for the six months ended December 31, 2017 which was primarily driven by the impact of the Cantaloupe acquisition. 28Operational Expenses19.7% 3,658.7% 90.7% 52.5% Selling, general and administrative expenses. Selling, general and administrative expenses increased approximately $2.5 million for the six months ended December 31, 2017, as compared to the same period in 2016. This change was primarily driven by an increase in selling, general and administrative costs related to Cantaloupe as well as an increase in sales and marketing related consulting expenses as we continue to increase our market share in the cashless-transaction vending industry.Integration and acquisition costs. Integration and acquisition costs increased $4.0 million for the six months ended December 31, 2017 as compared to the same period in 2016, due to the $4.1 million incurred in connection with the acquisition of Cantaloupe, partially offset by $0.1 million of acquisition costs incurred in the same period of fiscal year 2017 pertaining to the acquisition of VendScreen. Depreciation and amortization. Depreciation and amortization expenses increased approximately $0.5 million for the six months ended December 31, 2017 primarily due to the amortization of intangible assets recognized in connection with the Cantaloupe acquisition. Other Expense, net21.2% 70.2% (100.0%) (77.2%) Other expense, net. Other expense, net decreased $1.3 million for the six months ended December 31, 2017 compared to the same period in 2016. The decrease was primarily driven by the change in fair value associated with the exercised warrants recognized during September 2016.Income TaxesIncome taxes. For the six months ended December 31, 2017, antax liabilities, (iii) income tax provision, of $8,605 thousand (substantially all deferred income taxes) was recorded which includes a charge of $6,592 thousand related to tax reform. The tax provision is based upon income (loss) before income taxes using an estimated negative annual effective income tax rate of 49.20%, which is primarily driven by the impact of permanent differences. The tax rate reduction related to tax reform was treated as a discrete item in the tax provision for the six months ended December 31, 2017.For the six months ended December 31, 2016, an income tax benefit of $115 thousand (substantially all deferred income taxes) was recorded based upon loss before benefit for income taxes using an estimated annual effective income tax rate of 30.0% for the fiscal year ending June 30, 2017 net of a provision for the tax effect of the change in the fair value of warrant liabilities which was treated discretely.29Reconciliation of Net Loss to Adjusted EBITDA:As used herein, Adjusted EBITDA represents net loss before interest income, interest expense, income tax provision (benefit),(iv) depreciation, (v) amortization, change in fair value of warrant liabilities,(vi) stock-based compensation expense, (vii) fees and non-recurring integration and acquisition-related costscharges, net of reimbursement from insurance proceeds, that were incurred in connection with the 2019 Investigation and financial statement restatement activities as well as proxy solicitation costs that are not indicative of our core operations, (viii) certain other significant infrequent or unusual losses and gains that are not indicative of our core operations such as integration and acquisition expenses, and (ix) severance expenses that are non-recurring and are not indicative of Cantaloupe, includingour core operations.36Below is a charge for inventory fair value step-up, in the current fiscal year and the acquisitionreconciliation of the VendScreen business the previous fiscal year. WeU.S. GAAP net income (loss) to Adjusted EBITDA (non-GAAP):Three months ended March 31, Nine months ended March 31, ($ in thousands) 2024 2023 2024 2023 U.S. GAAP net income (loss) $ 4,656 $ 6,948 $ 9,787 $ (2,199) Less: interest income from cash and leases (495) (540) (1,505) (1,985) Plus: interest (income) expense from debt and tax liabilities (162) 263 1,947 1,258 Plus: income tax provision 84 56 246 123 Plus: depreciation included in cost of subscription and transaction fees for rental equipment 415 297 1,137 852 Plus: depreciation and amortization in operating expenses 2,493 2,364 7,976 5,029 EBITDA 6,991 9,388 19,588 3,078 Plus: stock-based compensation (1)1,004 1,410 4,047 2,889 Plus: integration and acquisition expenses (2)907 — 1,078 2,787 Plus: remediation expenses (3)1,258 — 1,755 — Plus: investigation, proxy solicitation and restatement expenses, net of insurance recoveries (4)— (1,000) — (453) Plus: severance expenses (5)26 273 26 273 Adjustments to EBITDA 3,195 683 6,906 5,496 Adjusted EBITDA (non-GAAP) $ 10,186 $ 10,071 $ 26,494 $ 8,574 (1) As an adjustment to EBITDA, we have excluded the non-operating item, change in fair value of warrant liabilities, because it represents a non-cash gain or charge that is not related to the Company’s operations. We have excluded the non-cash expense, stock-based compensation, as it does not reflect theour cash-based operations of the Company. Weoperations.(2) As an adjustment to EBITDA, we have excluded the integration and acquisition expenses incurred in connection with business acquisitions as it does not represent recurring costs or charges related to our core operations.(3) As an adjustment to EBITDA, we have excluded expense incurred in connection with non-recurring work related to remediating previously identified material weaknesses in our internal control over financial reporting.(4) As an adjustment to EBITDA, we have excluded the Cantaloupe acquisition, including a charge for inventory fair value step-up, duringcosts and corresponding reimbursements related to the current fiscal year and the VendScreen transaction from the previous fiscal year in order to allow for a more accurate comparison of the financial results to historical operations, as2019 Investigation, because we believe that they pertain to period operational expensesrepresent charges that are not arelated to our core function of our business. Adjustedoperations.(5) As an adjustment to EBITDA, is a non-GAAP financial measure which is not required by or defined under GAAP (Generally Accepted Accounting Principles). The presentation of this financial measure is not intended to be considered in isolation or as a substitute for the financial measures prepared and presented in accordance with GAAP, including the net income or net loss of the Company or net cash used in operating activities. Management recognizes that non-GAAP financial measureswe have limitations in that they do not reflect all of the items associated with the Company’s net income or net loss as determined in accordance with GAAP, and are not a substitute for or a measure of the Company’s profitability or net earnings. Adjusted EBITDA is presented because we believe it is useful to investors as a measure of comparative operating performance. Additionally, the Company utilizes Adjusted EBTIDA as a metric in its executive officer and management incentive compensation plans.Reconciliation of Operating Loss to Adjusted Operating Income (Loss):(3,752) (716) 4,120 109 516 87 884 (520) As used herein, adjusted operating loss represents operating loss before the non-recurring integration and acquisition costs andexcluded expenses incurred in connection with the acquisition of Cantaloupe, including a charge for inventory fair value step-up, and VendScreen transaction, and the amortization expensesseverance related to our acquisition-related intangibles. We have excluded these non-recurring costs and expenses in order to allow for a more accurate comparison of the financial results to historical operations and we believe such a comparison is useful to investors as a measure of comparative operating performance. This is the first financial period for which we have adjusted for the amortization expenses related to our acquisition-related intangibles, and we intend to make such adjustments for future financial periods. 3037Reconciliation of Net Loss to Non-GAAP Net Income (Loss):As used herein, non-GAAP net income (loss) represents GAAP net income (loss) excluding costs or benefits relating to any non-cash portions of the Company’s income tax benefit, adjustment for fair value of warrant liabilities, professional fees incurred in connection with the class action litigation and the special litigation committee investigation, and non-recurring costs and expenses that were incurred in connection with the acquisition and integration of Cantaloupe, including a charge for inventory fair value step-up and a write-off of deferred financing costs, during the current fiscal year and VendScreen during the prior fiscal year. This is the first financial period for which we have adjusted for the non-cash expenses attributable to equity awards under our equity incentive plans, and we intend to make such adjustments for future financial periods. Management believes that non-GAAP net income (loss) is an important measure of USAT’s business. Non-GAAP net income (loss) is a non-GAAP financial measure which is not required by or defined under GAAP. The presentation of this financial measure is not intended to be considered in isolation or as a substitute for the financial measures prepared and presented in accordance with GAAP, including the net income or net loss of the Company or net cash provided by or (used in) operating activities. Management recognizes that non-GAAP financial measures have limitations in that they do not reflect all of the items associated with the Company’s net loss as determined in accordance with GAAP, and are not a substitute for or a measure of the Company’s profitability or net earnings. Management uses the aforementioned non-GAAP measure to monitor and evaluate ongoing operating results and trends and to gain an understanding of our comparative operating performance. We believe that this non-GAAP financial measure serves as a useful metric for our management and investors because they enable a better understanding of the long-term performance of our core business and facilitate comparisons of our operating results over multiple periods, and when taken together with the corresponding GAAP financial measures and our reconciliations, enhance investors’ overall understanding of our current and future financial performance. Additionally, the Company utilizes non-GAAP net income (loss) as a metric in its executive officer and management incentive compensation plans.LIQUIDITY AND CAPITAL RESOURCESSources and Uses of CashHistorically, we have financed our operations primarily through cash from operating activities, debt financings, and equity issuances. The Company's primary sources of capital available are cash and cash equivalents on hand of $50.2 million as of March 31, 2024 and the cash that we expect to be provided by operating activities was $4.1by the Company.The Company also has estimated and recorded for potential sales tax and related interest and penalty liabilities of $10.8 million in the aggregate as of March 31, 2024. The Company continues to evaluate these liabilities and the amount and timing of any such payments.The Company believes that its current financial resources will be sufficient to fund its current twelve-month operating budget from the date of issuance of these condensed consolidated financial statements. Our primary focus as part of our core operations to increase cash flow from operating activities is to prioritize collection efforts to reduce outstanding accounts receivable, utilize existing inventory to support equipment sales over the next year, focusing on various operational efficiencies to improve overall profitability of the business and continued to grow our business both domestically and internationally.Below are charts that reflect our cash liquidity and outstanding debt as of March 31, 2024 and June 30, 2023: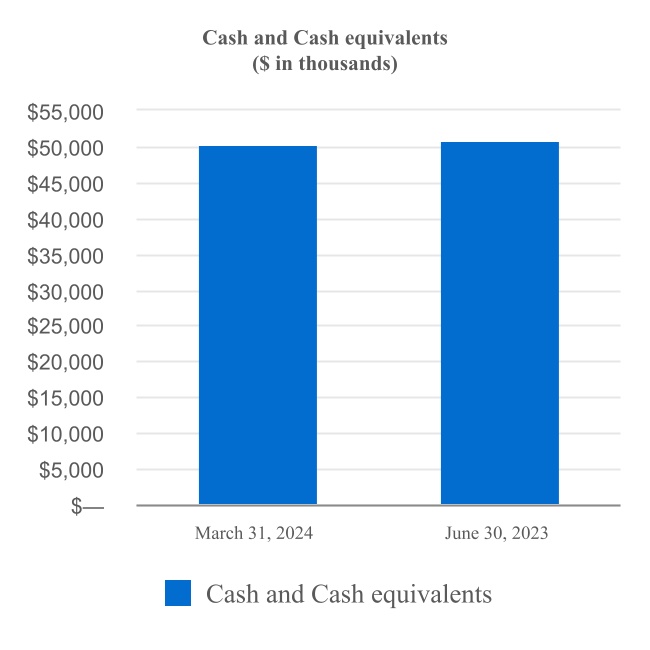
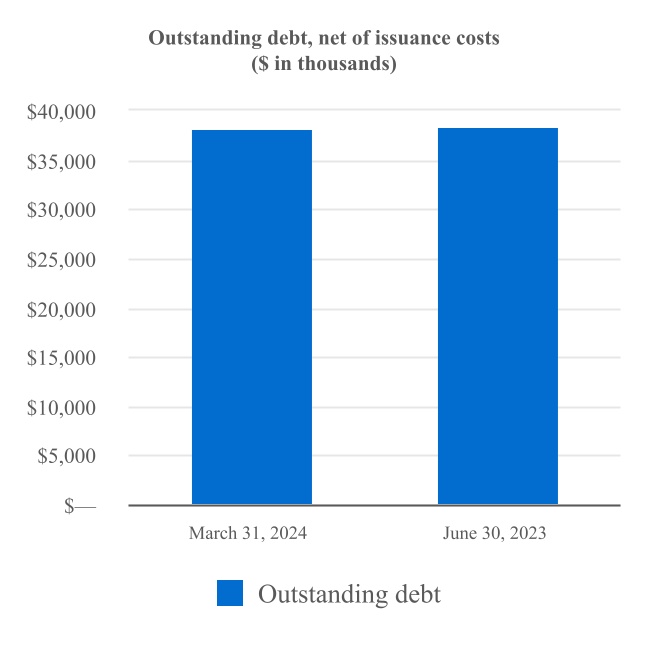 38Cash FlowsSee Condensed Consolidated Statement of Cash Flows in Part I, Item 1 of this Quarterly Report for details on the
 sixchanges in cash and cash equivalents classified by operating, investing and financing activities during our respective reporting periods.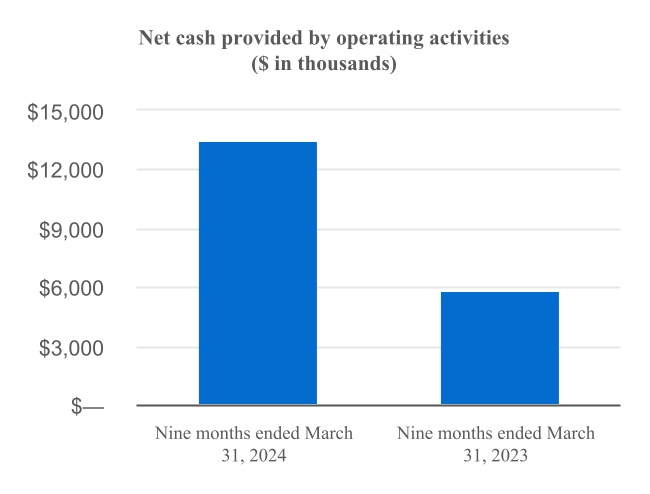 Net cash used in operating activitiesFor the nine months ended
 DecemberMarch 31, 2017 compared to cash of $5.1 million used in the same period in 2016. The $9.3 million increase in2024, net cash provided by operating activities was $13.5 million which reflects our net income of $9.8 million and non-cash operating charges of $18.5 million, partially offset by $14.8 million of cash utilized by working capital accounts. The change in working capital accounts was primarily driven by a cash inflow$16.5 million increase of $5.8 million from the payment for finance receivables related to a significant order received by us during the fourth quarter of the prior fiscal year as well as a cash inflow of $10.8 million related to the timing ofaccounts receivable and an increase in accounts payable and accrued expenses partially offsetof $8.5 million in the period. Increase in cash utilized by accounts receivable was a $2.8 million increase in merchant receivables due to timing differences relatedresult of increased sales during the nine months ended March 31, 2024 compared to the remittanceprior year period as well as the timing of credit cardthe cash receipts compared to the prior year period.For the nine months ended March 31, 2023, net cash used in operating activities was $5.8 million, which reflected our net loss of $2.2 million adjusted by $10.7 million in non-cash operating charges and $2.7 million of cash utilized by working capital accounts. The change in working capital accounts is primarily driven by cash used of $8.2 million to increase our inventory on hand and a $3.1decrease of accounts receivable of $9.6 million increase relatedin the period. Increase in inventory was driven by increased equipment sales as well as strategic planning to inventory duemitigate potential supply chain disruptions. Increase in cash provided by accounts receivable was a result of increased sales during the nine months ended March 31, 2023 compared to purchases madethe prior year period as well as the timing of the cash receipts compared to support the company’s anticipated future growth.Cashprior year period.Non-cash operating charges primarily consisted of stock-based compensation, depreciation of property and equipment, amortization of our intangible assets, and provisions for expected losses for the nine months ended March 31, 2024 and 2023.Net cash used in investing activitiesNet cash used in investing activities was $66.8$13.9 million for the sixnine months ended DecemberMarch 31, 2017 compared2024. We invested $9.2 million in property and equipment as the Company continued to $1.9focus on investing in innovative technologies and products, and increasing rental devices enrolled in the Company's Cantaloupe One program. Additionally, the Company invested $4.8 million through its CHEQ acquisition.Net cash used in investing activities was $48.5 million for the same periodnine months ended March 31, 2023. Increase in 2016. The $64.9 million increasecash used is primarily relateddue to netthe cash consideration paid for the 32M acquisition of Cantaloupe.Cash$35.9 million and $12.6 million for increased property and equipment balances driven primarily by the Company's continued focus on investing in technologies and products and increasing rental devices enrolled in the Company's Cantaloupe one program.Net cash provided by financing activitiesNet cash used in financing activities was $65.3$0.3 million for the sixnine months ended DecemberMarch 31, 2017 compared to $5.82024, which is primarily driven by debt repayments on the JPMorgan Credit Facility.39Net cash provided of financing activities was $21.3 million for the same period in 2016. The $59.5 million increasenine months ended March 31, 2023 which was primarily due to the public offering which closed in July 2017 with net proceedsborrowing of $39.9$25 million as well as an increasefrom our Credit Facility to fund a portion of $35.0the cash consideration for the 32M acquisition offset by $2.2 million relatedto repurchase our series A Convertible Stock and a $1 million payment for contingent consideration relating to the Term Loan and Revolving Credit Facility, partially offset by $6.2 million in proceeds received fromYoke acquisition.CONTRACTUAL OBLIGATIONSDuring the exercise of the warrants during the sixnine months ended September 30, 2016March 31, 2024, there were no significant changes to our contractual obligations from those disclosed in the section “Management’s Discussion and an increaseAnalysis of Financial Condition and Results of Operations” in repayments of debt during the six months ended December 31, 2017 of $8.9 million.31In September 2014, the Company reintroduced QuickStart, a program whereby our customers are able to purchase our ePort hardware via a five-year, non-cancellable finance agreement. Under the QuickStart program, the Company sells the equipment to customers and creates a long-term and current finance receivable for five-year agreements. In the third and fourth quarters of fiscal 2015, the Company signed vendor agreements with two finance companies, whereby our customers would enter into agreements directly with the finance companies as part of our QuickStart program. Under this scenario, the Company invoices the finance companyAnnual Report on Form 10-K for the equipment financed byfiscal year ended June 30, 2023.CRITICAL ACCOUNTING ESTIMATESThere have been no material changes to our customer, and typically receives full payment within thirty days. Priorcritical accounting estimates from those disclosed in our Annual Report on Form 10-K for the fiscal year ended June 30, 2023.Recent Accounting PronouncementsSee Note 2 - Summary of Significant Accounting Policies to the reintroductioncondensed consolidated financial statements for a description of QuickStart, the Company had financed its customers’ acquisition of ePort equipment primarily through the JumpStart rental program. Under Jumpstart, the Company records an investing capital expenditure cash outflow for the equipment provided and fixed assets on the balance sheet, and then receives rental income from a month-to-month lease. Customers who utilize third party finance companies in connection with the QuickStart program improve our cash flow from operations, and our QuickStart program reduces cash flow needed for investing activities otherwise incurred by us for our JumpStart program.Since entering into vendor agreements with two third-party finance companies, the majority of QuickStart sales consummated have been with customers entering into agreements directly with the finance companies. Our customers have shifted from acquiring our products via JumpStart, which accounted for 65% of our gross connections in fiscal year 2014, to QuickStart and sales under normal trade receivable terms, which accounted for 89%, 91%, and 93% of our gross connections in fiscal years 2015, 2016, and 2017 respectively. JumpStart was approximately 1% of our gross new connections for the six months ended December 31, 2017.The Company is continually seeking to expand its outside financing partners in order to accommodate expected growth.Sources of CashThe Company’s net working capital, which is defined as current assets less current liabilities, increased $7.3 million from $5.8 million as of June 30, 2017, to $13.1 million as of December 31, 2017. As of December 31, 2017, the Company’s primary sources of cash include:·Cash on hand of approximately $15.4 million;·$2.5 million available under the Revolving Credit Facility provided we continue to satisfy the various covenants set forth in the loan agreement, including the requirement to meet the minimum quarterly Total Leverage Ratio and Fixed Charge Coverage Ratio;·Sales to third party lenders of all or a portion of our $16.7 million of finance receivables which may occur in future quarters; and·Anticipated cash which may be provided by operating activities in future quarters.The Company believes its existing cash and available cash resources described above, would provide sufficient capital resources to operate its anticipated business over the next twelve months.Item 3. Quantitative and Qualitative Disclosures about Market Risk.There have been no significant changesRiskAs of March 31, 2024, we are exposed to our market risk since June 30, 2017. Forrelated to changes in interest rates on our outstanding borrowings. Our Amended JPMorgan Credit Facility has a discussionfour-year maturity. Interest on the Amended JPMorgan Credit Facility will be based, at the Company’s option, on a base rate or SOFR plus an applicable margin tied to the Company’s total leverage ratio and having ranges of between 2.50% and 3.00% for base rate loans and between 3.50% and 4.00% for SOFR loans. As of March 31, 2024, we have $38.2 million total outstanding borrowings, an increase of 100 basis points in SOFR Rate would result in a change in interest expense of $0.4 million per year.We are also exposed to market risk related to changes in interest rates on our cash investments. We invest our excess cash in money market funds that we believe are highly liquid and marketable in the short term. These investments earn a floating rate of interest and are not held for trading or other speculative purposes. Consequently, our exposure to market risk, referrisks for interest rate changes related to Part II, Item 7A. “Quantitativeour money market funds is not material. Market risks related to fluctuations of foreign currencies are not material and Qualitative Disclosures about Market Risk,” contained in our Annual Report on Form 10-K for the year ended June 30, 2017.we have no freestanding derivative instruments as of March 31, 2024.32(a) Disclosure Controls and ProceduresOur management evaluated, with the participation of our chief executive officer and chief financial officer, the effectiveness as of the end of the period covered by this Form 10-Q of our disclosure controls and procedures (as defined in Rule 13a-15(e) under the Securities Exchange Act of 1934 (the "Exchange Act")). We maintain disclosure controls and procedures to ensure that information required to be disclosed by us in the reports that we file or submit under the Securities Exchange Act of 1934, as amended (the “Exchange Act”), is recorded, processed, summarized and reported within the time periods specified in Securitiesthe SEC’s rules and Exchange Commission rules,forms, and that such information is accumulated and communicated to our management, including our chief executive officer and chief financial officer, to allow timely decisions regarding required disclosure.Our management, with the participation of our chief executive officer and chief financial officer, has evaluated the effectiveness as of the end of the period covered by this Form 10-Q of our disclosure controls and procedures as defined in Rule 13a-15(e) under the Exchange Act. Based on this evaluation, our management, including our chief executive officer and chief financial officer, has concluded that our disclosure controls and proceduresprocedures were not effective as of March 31, 2024, as a result of the endmaterial weaknesses in our internal control over financial reporting, which are described in Item 9A. of such period.(b) Changes in Internal Control over Financial ReportingThere wereOther than the remediation plan disclosed in Item 9A. of our 2023 Form 10-K, there have been no changes in ourthe Company’s internal controlscontrol over financial reporting that occurred during the fiscal quarter ended DecemberMarch 31, 20172024 that have materially affected, or are reasonably likely to materially affect, our internal controls over financial reporting.40We are in the process of executing remediation activities to alleviate the material weaknesses identified in the remediation plan disclosed in Item 9A. of our 2023 Form 10-K. The Company hired a public accounting firm to assist with the remediation efforts. As part of the remediation work performed specifically in the third quarter of fiscal year 2024, the Company implemented a series of control enhancements to remediate the material weaknesses for both business process and IT general controls. As of the filing date of our third quarter 2024 Form 10Q, the remediation of the prior year material weaknesses and overall operating effectiveness of our control environment remains subject to evaluation. The material weaknesses cannot be considered remediated until the related controls have operated for a sufficient period of time and until management has concluded, through testing, that the controls are operating effectively.41Part II - Other InformationItem 1. Legal ProceedingsThe information required by this Item is incorporated herein by reference to the Notes to condensed consolidated financial statements, Note 15 – Commitments and Contingencies in Part I, Item 1, of this Quarterly Report on Form 10-Q.Item 1A. Risk FactorsFor a discussion of the Company’s risk factors, see the information under the heading “Risk Factors” in the Company’s Annual Report on Form 10-K for the fiscal year ended June 30, 2023.Item 2. Unregistered Sales of Equity Securities and Use of ProceedsN/AItem 3. Defaults Upon Senior SecuritiesThere were no defaults on any senior securities. The total liquidation preference including accrued and unpaid dividends on our Series A Convertible Preferred Stock as of March 31, 2024 was $22.7 million. The dividend accrual dates for our Preferred Stock are February 1 and August 1. The annual cumulative dividend on our Preferred Stock is $1.50 per share.Item 4. Mine Safety DisclosuresN/AItem 5. Other Information Rule 10b5-1 Trading PlansDuring the fiscal quarter ended March 31, 2024, none of the Company's director or executive officers adopted, modified or terminated any contract, instruction or written plan for the purchase or sale of Company securities that was intended to satisfy the affirmative defense conditions of Rule 10b5-1(c) or any “non-Rule 10b5-1 trading arrangement.”42Exhibit
NumberDescription Number3.1 Description3.2 10.131.1* 10.210.331.131.232.132.2DecemberMarch 31, 2017,2024, filed with the SEC on February 8, 2018,May 9, 2024, is formatted in Inline Extensible Business Reporting Language (XBRL)(“iXBRL”): (1) the Condensed Consolidated Balance Sheets as of DecemberMarch 31, 20172024 and June 30, 2017,2023, (2) the Condensed Consolidated Statements of Operations for the three-month and six-monthnine-month periods ended DecemberMarch 31, 20172024 and 2016,2023, (3) the Condensed Consolidated Statements of Other Comprehensive Income (Loss) for the three-month and nine-month periods ended March 31, 2024 and 2023, (4) the Condensed Consolidated Statements of Convertible Preferred Stock and Shareholders’ Equity for the six-month periodthree-month and nine-month periods ended DecemberMarch 31, 2017, (4)2024 and 2023, (5) the Condensed Consolidated Statements of Cash Flows for the six-month periodnine-month periods ended DecemberMarch 31, 20172024 and 2016,2023, and (5)(6) the Notes to Condensed Consolidated Financial Statements.101.INS XBRL Instance Document - the instance document does not appear in the Interactive Data File because its XBRL tags are embedded within the Inline XBRL document 101.SCH* Inline XBRL Taxonomy Extension Schema 101.CAL* Inline XBRL Taxonomy Extension Calculation Linkbase 101.DEF* Inline XBRL Taxonomy Extension Definition Linkbase 101.LAB* Inline XBRL Taxonomy Extension Label Linkbase 101.PRE* Inline XBRL Taxonomy Extension Presentation Linkbase 104 The cover page from our Quarterly Report on Form 10-Q for the quarter ended March 31, 2024, filed with the SEC on May 9, 2024, is formatted as Inline iXBRL and contained in Exhibit 101. * Filed herewith.** Furnished herewith.3343Cantaloupe, Inc. Date: May 9, 2024 USA TECHNOLOGIES, INC.Ravi Venkatesan Date: February 9, 2018/s/ Stephen P. HerbertStephen P. Herbert,Date: May 9, 2024 /s/ Scott Stewart Date: February 9, 2018/s/ Priyanka SinghPriyanka Singh3444