UNITED STATES
SECURITIES AND EXCHANGE COMMISSION
WASHINGTON, D.C. 20549
FORM 10-Q
☒ Quarterly Report Pursuant to Section 13 or 15(d) of the Securities Exchange Act of 1934 for the period
ended SeptemberJune 30, 20192020
OR
☐ Transition Report Pursuant to Section 13 or 15(d) of the Securities Exchange Act of 1934
Commission File Number 0-21719
Steel Dynamics, Inc.
(Exact name of registrant as specified in its charter)
Indiana |
| 35-1929476 |
(State or other jurisdiction of incorporation or organization) | | (I.R.S. Employer Identification No.) |
| | |
7575 West Jefferson Blvd, Fort Wayne, IN | | 46804 |
(Address of principal executive offices) | | (Zip Code) |
Registrant’s telephone number, including area code: (260) 969-3500
Securities registered pursuant to Section 12(b) of the Act.
| | |
Title of each class | Trading Symbol | Name of each exchange on which registered |
Common Stock voting, $0.0025 par value | STLD | NASDAQ Global Select Market |
Indicate by check mark whether the registrant (1) has filed all reports required to be filed by Section 13 or 15(d) of the Securities Exchange Act of 1934 during the preceding 12 months (or for such shorter period that the registrant was required to file such reports), and (2) has been subject to such filing requirements for the past 90 days. Yes ⌧ No ◻
Indicate by check mark whether the registrant has submitted electronically every Interactive Data File required to be submitted pursuant to Rule 405 of Regulation S-T (§232.405 of this chapter) during the preceding 12 months (or for such shorter period that the registrant was required to submit such files). Yes ⌧ No ◻
Indicate by check mark whether the registrant is a large accelerated filer, an accelerated filer, a non-accelerated filer, a smaller reporting company, or an emerging growth company (see definitions of “large accelerated filer,” “accelerated filer,” “smaller reporting company,” and “emerging growth company” in Rule 12b-2 of the Exchange Act).
|
| Large accelerated filer ⌧ |
| Accelerated filer ◻ |
| Non-accelerated filer ◻ |
| | | | | | |
| | Smaller reporting company ☐ | | Emerging growth company ☐ | | |
If an emerging growth company, indicate by check mark if the registrant has elected not to use the extended transition period for complying with any new or revised financial accounting standards provided pursuant to Section 13(a) of the Exchange Act. ◻
Indicate by check mark whether the registrant is a shell company (as defined in Rule 12b-2 of the Exchange Act). Yes ☐ No⌧
As of October 28, 2019,July 31, 2020, Registrant had 215,452,169210,364,813 outstanding shares of common stock.
STEEL DYNAMICS, INC.
Table of Contents
PART I. Financial Information | ||
| ||
Page | ||
| | |
| Consolidated Balance Sheets as of | 1 |
| | |
| 2 | |
| | |
| 3 | |
| | |
| 4 | |
| | |
| 5 | |
| | |
Management’s Discussion and Analysis of Financial Condition and Results of Operations |
| |
| | |
| ||
| | |
| ||
| | |
| | |
| | |
| | |
| | |
| ||
| | |
| ||
| | |
| ||
| | |
| ||
| | |
| ||
| | |
| ||
| | |
| ||
| | |
|
| |
| | |
| ||
| | |
STEEL DYNAMICS, INC.
CONSOLIDATED BALANCE SHEETS
(in thousands, except share data)
| | | | | | | | | | | ||
| | | | | | | | | | | | |
| September 30, | | | December 31, | June 30, | | | December 31, | ||||
| 2019 | | | 2018 | 2020 | | | 2019 | ||||
Assets | (unaudited) | | | | (unaudited) | | | | ||||
Current assets | | | | | | | | | | | ||
Cash and equivalents | $ | 1,146,007 | | | $ | 828,220 | $ | 1,496,458 | | | $ | 1,381,460 |
Short-term investments | | 69,529 | | | | 228,783 | | 69,546 | | | | 262,174 |
Accounts receivable, net | | 983,515 | | | | 1,040,220 | | 841,593 | | | | 841,378 |
Accounts receivable-related parties | | 3,431 | | | | 3,536 | | 2,463 | | | | 2,958 |
Inventories | | 1,767,020 | | | | 1,859,168 | | 1,567,017 | | | | 1,689,043 |
Other current assets | | 50,818 | | | | 72,730 | | 39,043 | | | | 76,012 |
Total current assets | | 4,020,320 | | | | 4,032,657 | | 4,016,120 | | | | 4,253,025 |
| | | | | | | | | | | | |
Property, plant and equipment, net | | 3,031,731 | | | | 2,945,767 | | 3,587,450 | | | | 3,135,886 |
| | | | | | | | | | | | |
Intangible assets, net | | 249,598 | | | | 270,328 | | 313,520 | | | | 327,901 |
Goodwill | | 540,913 | | | | 429,645 | | 451,220 | | | | 452,915 |
Other assets | | 100,685 | | | | 25,166 | | 100,031 | | | | 106,038 |
Total assets | $ | 7,943,247 | | | $ | 7,703,563 | $ | 8,468,341 | | | $ | 8,275,765 |
Liabilities and Equity | | | | | | | | | | | | |
Current liabilities | | | | | | | | | | | | |
Accounts payable | $ | 518,909 | | | $ | 536,743 | $ | 696,845 | | | $ | 509,687 |
Accounts payable-related parties | | 9,720 | | | | 14,011 | | 5,087 | | | | 3,657 |
Income taxes payable | | 2,074 | | | | 7,468 | | 25,411 | | | | 2,014 |
Accrued payroll and benefits | | 181,785 | | | | 264,542 | | 148,055 | | | | 208,287 |
Accrued interest | | 47,945 | | | | 25,526 | | 11,859 | | | | 18,292 |
Accrued expenses | | 162,692 | | | | 146,613 | | 154,243 | | | | 175,405 |
Current maturities of long-term debt | | 82,150 | | | | 24,234 | | 73,926 | | | | 89,356 |
Total current liabilities | | 1,005,275 | | | | 1,019,137 | | 1,115,426 | | | | 1,006,698 |
| | | | | | | | | | | | |
Long-term debt | | 2,355,243 | | | | 2,352,489 | | 2,636,722 | | | | 2,644,988 |
Deferred income taxes | | 468,248 | | | | 435,838 | | 503,034 | | | | 484,169 |
Other liabilities | | 70,126 | | | | 8,870 | | 73,237 | | | | 75,055 |
Total liabilities | | 3,898,892 | | | | 3,816,334 | | 4,328,419 | | | | 4,210,910 |
| | | | | | | | | | | | |
Commitments and contingencies | | | | | | | | | | | ||
| | | | | | | | | | | ||
Redeemable noncontrolling interests | | 143,614 | | | 111,240 | | 152,414 | | | 143,614 | ||
| | | | | | | | | | | | |
Equity | | | | | | | | | | | | |
Common stock voting, $.0025 par value; 900,000,000 shares authorized; | | | | | | | | | | | ||
265,553,499 and 265,822,402 shares issued; and 215,740,572 and 225,272,174 | | | | | | |||||||
shares outstanding, as of September 30, 2019 and December 31, 2018, respectively | | 645 | | | 645 | |||||||
Treasury stock, at cost; 49,812,927 and 40,550,228 shares, | | | | | | |||||||
as of September 30, 2019 and December 31, 2018, respectively | | (1,469,078) | | | (1,184,243) | |||||||
266,072,787 and 266,072,787 shares issued; and 210,364,813 and 214,502,639 | | | | | | |||||||
shares outstanding, as of June 30, 2020 and December 31, 2019, respectively | | 646 | | | 646 | |||||||
Treasury stock, at cost; 55,707,974 and 51,570,148 shares, | | | | | | |||||||
as of June 30, 2020 and December 31, 2019, respectively | | (1,623,855) | | | (1,525,113) | |||||||
Additional paid-in capital | | 1,175,512 | | | | 1,160,048 | | 1,191,614 | | | | 1,181,012 |
Retained earnings | | 4,349,523 | | | | 3,958,320 | | 4,576,629 | | | | 4,419,296 |
Accumulated other comprehensive income | | 39 | | | | 301 | ||||||
Accumulated other comprehensive income (loss) | | 216 | | | | (7) | ||||||
Total Steel Dynamics, Inc. equity | | 4,056,641 | | | | 3,935,071 | | 4,145,250 | | | | 4,075,834 |
Noncontrolling interests | | (155,900) | | | | (159,082) | | (157,742) | | | | (154,593) |
Total equity | | 3,900,741 | | | | 3,775,989 | | 3,987,508 | | | | 3,921,241 |
Total liabilities and equity | $ | 7,943,247 | | | $ | 7,703,563 | $ | 8,468,341 | | | $ | 8,275,765 |
See notes to consolidated financial statements.
1
STEEL DYNAMICS, INC.
CONSOLIDATED STATEMENTS OF INCOME (UNAUDITED)
(in thousands, except per share data)
| | | | | | | | | | | | | | | | | | | ||||
| | | | | | | | | | | | | | | | | | | ||||
| Three Months Ended | | Nine Months Ended | Three Months Ended | | Six Months Ended | ||||||||||||||||
| September 30, | | September 30, | June 30, | | June 30, | ||||||||||||||||
| 2019 | | 2018 | | 2019 | | 2018 | 2020 | | 2019 | | 2020 | | 2019 | ||||||||
| | | | | | | | | | | | | | | | | | | ||||
Net sales | | | | | | | | | | | | | | | | | | | ||||
Unrelated parties | $ | 2,523,279 | | $ | 3,220,891 | | $ | 8,104,129 | | $ | 8,902,025 | $ | 2,092,964 | | $ | 2,766,364 | | $ | 4,664,508 | | $ | 5,580,850 |
Related parties | | 3,566 | | | 2,656 | | | 10,666 | | | 15,922 | | 1,341 | | | 4,151 | | | 4,897 | | | 7,100 |
Total net sales | | 2,526,845 | | | 3,223,547 | | | 8,114,795 | | 8,917,947 | | 2,094,305 | | 2,770,515 | | 4,669,405 | | 5,587,950 | ||||
| | | | | | | | | | | | | | | | | | | ||||
Costs of goods sold | | 2,167,006 | | | 2,537,466 | | | 6,900,220 | | | 7,116,368 | | 1,809,874 | | | 2,349,349 | | | 3,969,745 | | | 4,733,214 |
Gross profit | | 359,839 | | | 686,081 | | | 1,214,575 | | 1,801,579 | | 284,431 | | 421,166 | | 699,660 | | 854,736 | ||||
| | | | | | | | | | | | | | | | | | | ||||
Selling, general and administrative expenses | | 107,242 | | | 102,614 | | | 324,530 | | 310,076 | | 109,299 | | 106,250 | | 222,197 | | 217,288 | ||||
Profit sharing | | 17,848 | | | 45,304 | | | 64,396 | | 114,301 | | 9,092 | | 22,871 | | 30,546 | | 46,548 | ||||
Amortization of intangible assets | | 6,704 | | | 6,591 | | | 20,730 | | | 20,346 | | 7,190 | | | 7,013 | | | 14,381 | | | 14,026 |
Operating income | | 228,045 | | | 531,572 | | | 804,919 | | 1,356,856 | | 158,850 | | 285,032 | | 432,536 | | 576,874 | ||||
| | | | | | | | | | | | | | | | | | | ||||
Interest expense, net of capitalized interest | | 31,339 | | | 31,560 | | | 94,782 | | 94,968 | | 27,702 | | 32,321 | | 55,721 | | 63,443 | ||||
Other income, net | | (4,545) | | | (7,103) | | | (15,137) | | | (16,601) | |||||||||||
Other (income) expense, net | | 28,103 | | | (4,249) | | | 25,514 | | | (10,592) | |||||||||||
Income before income taxes | | 201,251 | | | 507,115 | | | 725,274 | | 1,278,489 | | 103,045 | | 256,960 | | 351,301 | | 524,023 | ||||
| | | | | | | | | | | | | | | | | | | ||||
Income tax expense | | 48,643 | | | 109,209 | | | 171,093 | | | 292,536 | | 24,280 | | | 60,214 | | | 81,700 | | | 122,450 |
Net income | | 152,608 | | | 397,906 | | | 554,181 | | 985,953 | | 78,765 | | 196,746 | | 269,601 | | 401,573 | ||||
| | | | | | | | | | | | | | | | | | | ||||
Net (income) loss attributable to noncontrolling interests | | (1,560) | | | 469 | | | (4,503) | | | 2,422 | |||||||||||
Net income attributable to noncontrolling interests | | (3,269) | | | (2,444) | | | (6,765) | | | (2,943) | |||||||||||
Net income attributable to Steel Dynamics, Inc. | $ | 151,048 | | $ | 398,375 | | $ | 549,678 | | $ | 988,375 | $ | 75,496 | | $ | 194,302 | | $ | 262,836 | | $ | 398,630 |
| | | | | | | | | | | | | | | | | | | ||||
| | | | | | | | | | | | | | | | | | | ||||
| | | | | | | | | | | | | | | | | | | ||||
Basic earnings per share attributable to Steel Dynamics, | | | | | | | | | | | | | | | | | | | ||||
Inc. stockholders | $ | 0.69 | | $ | 1.70 | | $ | 2.49 | | $ | 4.20 | $ | 0.36 | | $ | 0.88 | | $ | 1.24 | | $ | 1.79 |
| | | | | | | | | | | | | | | | | | | ||||
Weighted average common shares outstanding | | 217,873 | | | 234,208 | | | 221,145 | | | 235,483 | | 210,343 | | | 221,505 | | | 211,798 | | | 222,781 |
| | | | | | | | | | | | | | | | | | | ||||
Diluted earnings per share attributable to Steel Dynamics, Inc. | | | | | | | | | | | | | | | | | | | ||||
stockholders, including the effect of assumed conversions | | | | | | | | | | | | | | | | | | | ||||
when dilutive | $ | 0.69 | | $ | 1.69 | | $ | 2.47 | | $ | 4.17 | $ | 0.36 | | $ | 0.87 | | $ | 1.24 | | $ | 1.78 |
| | | | | | | | | | | | | | | | | | | ||||
Weighted average common shares and share equivalents outstanding | | 219,109 | | | 235,649 | | | 222,197 | | | 236,772 | | 211,378 | | | 222,519 | | | 212,701 | | | 223,741 |
| | | | | | | | | | | | | | | | | | | ||||
Dividends declared per share | $ | 0.2400 | | $ | 0.1875 | | $ | 0.7200 | | $ | 0.5625 | $ | 0.25 | | $ | 0.24 | | $ | 0.50 | | $ | 0.48 |
See notes to consolidated financial statements.
2
STEEL DYNAMICS, INC.
CONSOLIDATED STATEMENTS OF COMPREHENSIVE INCOME (UNAUDITED)
(in thousands)
| | | | | | | | | | | | | | | | | ||||||
| | | | | | | | | | | | | | | | | ||||||
| Three Months Ended | | Nine Months Ended | Three Months Ended | | Six Months Ended | ||||||||||||||||
| September 30, | | September 30, | June 30, | | June 30, | ||||||||||||||||
| 2019 | | 2018 | | 2019 | | 2018 | 2020 | | 2019 | | 2020 | | 2019 | ||||||||
| | | | | | | | | | | | | | | | | ||||||
Net income | $ | 152,608 | | $ | 397,906 | | $ | 554,181 | | $ | 985,953 | $ | 78,765 | | $ | 196,746 | | $ | 269,601 | | $ | 401,573 |
Other comprehensive income (loss) - net unrealized gain (loss) on | | | | | | | | | | | | | | | | | ||||||
cash flow hedging derivatives, net of income tax expense (benefit) | | (39) | | | 63 | | | (262) | | | (42) | |||||||||||
cash flow hedging derivatives, net of income tax | | 186 | | | (52) | | | 223 | | | (223) | |||||||||||
Comprehensive income | | 152,569 | | 397,969 | | 553,919 | | 985,911 | | 78,951 | | 196,694 | | 269,824 | | 401,350 | ||||||
| | | | | | | | | | | | | | | | | ||||||
Comprehensive (income) loss attributable to noncontrolling interests | | (1,560) | | | 469 | | | (4,503) | | | 2,422 | |||||||||||
Comprehensive income attributable to noncontrolling interests | | (3,269) | | | (2,444) | | | (6,765) | | | (2,943) | |||||||||||
Comprehensive income attributable to Steel Dynamics, Inc. | $ | 151,009 | | $ | 398,438 | | $ | 549,416 | | $ | 988,333 | $ | 75,682 | | $ | 194,250 | | $ | 263,059 | | $ | 398,407 |
See notes to consolidated financial statements.
3
STEEL DYNAMICS, INC.
CONSOLIDATED STATEMENTS OF CASH FLOWS (UNAUDITED)
(in thousands)
| | | | | | | | | | | |
| | | | | | | | | | | |
| Three Months Ended | | Nine Months Ended | ||||||||
| September 30, | | September 30, | ||||||||
| 2019 | | 2018 | | 2019 | | 2018 | ||||
| | | | | | | | | | | |
Operating activities: | | | | | | | | | | | |
Net income | $ | 152,608 | | $ | 397,906 | | $ | 554,181 | | $ | 985,953 |
| | | | | | | | | | | |
Adjustments to reconcile net income to net cash provided by | | | | | �� | | | | | | |
operating activities: | | | | | | | | | | | |
Depreciation and amortization | | 79,470 | | | 81,383 | | | 240,555 | | | 236,638 |
Equity-based compensation | | 8,841 | | | 7,978 | | | 33,229 | | | 28,860 |
Deferred income taxes | | 11,311 | | | 23,899 | | | 34,952 | | | 45,437 |
Other adjustments | | (1,116) | | | 312 | | | (952) | | | 197 |
Changes in certain assets and liabilities: | | | | | | | | | | | |
Accounts receivable | | 85,633 | | | (48,024) | | | 95,195 | | | (330,307) |
Inventories | | 35,479 | | | (69,885) | | | 139,889 | | | (240,908) |
Other assets | | 39 | | | (6,429) | | | 7,632 | | | (7,164) |
Accounts payable | | 1,111 | | | (14,883) | | | (54,167) | | | 100,368 |
Income taxes receivable/payable | | 6,293 | | | (31,127) | | | 19,715 | | | 55,414 |
Accrued expenses | | 64,533 | | | 79,310 | | | (83,001) | | | 49,920 |
Net cash provided by operating activities | | 444,202 | | | 420,440 | | | 987,228 | | | 924,408 |
| | | | | | | | | | | |
Investing activities: | | | | | | | | | | | |
Purchases of property, plant and equipment | | (154,131) | | | (70,668) | | | (293,687) | | | (176,477) |
Purchases of short-term investments | | (34,884) | | | (35,000) | | | (134,026) | | | (125,000) |
Proceeds from maturities of short-term investments | | 79,508 | | | 10,000 | | | 293,279 | | | 10,000 |
Acquisition of business, net of cash and restricted cash acquired | | (3,694) | | | (37,589) | | | (97,106) | | | (433,998) |
Other investing activities | | 2,746 | | | 576 | | | 4,023 | | | 1,462 |
Net cash used in investing activities | | (110,455) | | | (132,681) | | | (227,517) | | | (724,013) |
| | | | | | | | | | | |
Financing activities: | | | | | | | | | | | |
Issuance of current and long-term debt | | 128,230 | | | 110,041 | | | 374,686 | | | 327,670 |
Repayment of current and long-term debt | | (119,988) | | | (115,039) | | | (369,134) | | | (346,162) |
Dividends paid | | (52,751) | | | (44,081) | | | (148,493) | | | (125,146) |
Purchases of treasury stock | | (114,950) | | | (74,965) | | | (292,394) | | | (193,379) |
Other financing activities | | (1,527) | | | - | | | (7,259) | | | (8,324) |
Net cash used in financing activities | | (160,986) | | | (124,044) | | | (442,594) | | | (345,341) |
| | | | | | | | | | | |
Increase (decrease) in cash, cash equivalents, and restricted cash | | 172,761 | | | 163,715 | | | 317,117 | | | (144,946) |
Cash, cash equivalents, and restricted cash at beginning of period | | 978,779 | | | 726,424 | | | 834,423 | | | 1,035,085 |
| | | | | | | | | | | |
Cash, cash equivalents, and restricted cash at end of period | $ | 1,151,540 | | $ | 890,139 | | $ | 1,151,540 | | $ | 890,139 |
| | | | | | | | | | | |
| | | | | | | | | | | |
Supplemental disclosure information: | | | | | | | | | | | |
Cash paid for interest | $ | 9,115 | | $ | 8,643 | | $ | 71,702 | | $ | 70,498 |
Cash paid for income taxes, net | $ | 29,794 | | $ | 119,802 | | $ | 116,149 | | $ | 198,752 |
| | | | | | | | | | | |
| | | | | | | | | | | |
| Three Months Ended | | Six Months Ended | ||||||||
| June 30, | | June 30, | ||||||||
| 2020 | | 2019 | | 2020 | | 2019 | ||||
| | | | | | | | | | | |
Operating activities: | | | | | | | | | | | |
Net income | $ | 78,765 | | $ | 196,746 | | $ | 269,601 | | $ | 401,573 |
| | | | | | | | | | | |
Adjustments to reconcile net income to net cash provided by | | | | | | | | | | | |
operating activities: | | | | | | | | | | | |
Depreciation and amortization | | 78,721 | | | 80,911 | | | 158,980 | | | 161,085 |
Equity-based compensation | | 9,520 | | | 9,080 | | | 27,364 | | | 24,388 |
Deferred income taxes | | 14,634 | | | 11,550 | | | 20,561 | | | 23,641 |
Other adjustments | | 4,728 | | | (564) | | | 4,464 | | | 164 |
Changes in certain assets and liabilities: | | | | | | | | | | | |
Accounts receivable | | 154,352 | | | 70,624 | | | 280 | | | 9,562 |
Inventories | | 77,521 | | | 64,941 | | | 122,026 | | | 104,410 |
Other assets | | 11,137 | | | 7,292 | | | 9,596 | | | 7,593 |
Accounts payable | | 69,523 | | | (58,484) | | | 121,119 | | | (55,278) |
Income taxes receivable/payable | | 7,993 | | | (36,428) | | | 60,378 | | | 13,422 |
Accrued expenses | | (20,884) | | | 15,805 | | | (97,078) | | | (147,534) |
Net cash provided by operating activities | | 486,010 | | | 361,473 | | | 697,291 | | | 543,026 |
| | | | | | | | | | | |
Investing activities: | | | | | | | | | | | |
Purchases of property, plant and equipment | | (309,716) | | | (85,120) | | | (527,251) | | | (139,556) |
Purchases of short-term investments | | - | | | (49,465) | | | (149,359) | | | (99,142) |
Proceeds from maturities of short-term investments | | 149,648 | | | 109,034 | | | 341,988 | | | 213,771 |
Acquisition of business, net of cash and restricted cash acquired | | - | | | - | | | - | | | (93,412) |
Other investing activities | | 803 | | | 913 | | | 1,321 | | | 1,277 |
Net cash used in investing activities | | (159,265) | | | (24,638) | | | (333,301) | | | (117,062) |
| | | | | | | | | | | |
Financing activities: | | | | | | | | | | | |
Issuance of current and long-term debt | | 1,099,774 | | | 125,222 | | | 1,316,035 | | | 246,456 |
Repayment of current and long-term debt | | (1,103,814) | | | (133,875) | | | (1,339,571) | | | (249,146) |
Dividends paid | | (52,584) | | | (53,503) | | | (104,065) | | | (95,742) |
Purchases of treasury stock | | - | | | (93,136) | | | (106,529) | | | (177,444) |
Other financing activities | | (8,763) | | | (12) | | | (14,915) | | | (5,732) |
Net cash used in financing activities | | (65,387) | | | (155,304) | | | (249,045) | | | (281,608) |
| | | | | | | | | | | |
Increase in cash, cash equivalents, and restricted cash | | 261,358 | | | 181,531 | | | 114,945 | | | 144,356 |
Cash, cash equivalents, and restricted cash at beginning of period | | 1,240,984 | | | 797,248 | | | 1,387,397 | | | 834,423 |
| | | | | | | | | | | |
Cash, cash equivalents, and restricted cash at end of period | $ | 1,502,342 | | $ | 978,779 | | $ | 1,502,342 | | $ | 978,779 |
| | | | | | | | | | | |
| | | | | | | | | | | |
Supplemental disclosure information: | | | | | | | | | | | |
Cash paid for interest | $ | 59,668 | | $ | 53,981 | | $ | 68,453 | | $ | 62,587 |
Cash paid for income taxes, net | $ | 1,430 | | $ | 84,516 | | $ | 1,948 | | $ | 86,355 |
See notes to consolidated financial statements.
4
Note 1. Description of the Business and Significant Accounting Policies
Description of the Business
Steel Dynamics, Inc. (SDI), together with its subsidiaries (the company), is a domestic manufacturer of steel products and metals recycler. The company has 3 reportable segments: steel operations, metals recycling operations, and steel fabrication operations.
Steel Operations Segment. Steel operations include the company’s Butler Flat Roll Division, Columbus Flat Roll Division, The Techs galvanizing lines, Heartland Flat Roll Division, United Steel Supply, (acquired 75% equity interest March 1, 2019), Structural and Rail Division, Engineered Bar Products Division, Vulcan Threaded Products, Inc., Roanoke Bar Division, Steel of West Virginia, and Iron Dynamics, a liquid pig iron (scrap substitute) production facility that supplies solely the Butler Flat Roll Division. These operations include electric arc furnace steel mills, producing steel from ferrous scrap and scrap substitutes, utilizing continuous casting, automated rolling mills, with several downstream coating and bar processing lines. Steel operations accounted for 76%78% and 77%76% of the company’s consolidated external net sales during the three months ended SeptemberJune 30, 2020 and 2019, and 2018, respectively, and 76% and 75%of the company's consolidated external net sales during the ninesix months ended SeptemberJune 30, 20192020 and 2018, respectively.2019.
Metals Recycling Operations Segment. Metals recycling operations consists solely of OmniSource, LLC (OmniSource), and includes both ferrous and nonferrous processing, transportation, marketing, brokerage, and scrap management services. Metals recycling operations accounted for 11%7% and 12% of the company’s consolidated external net sales during the three months ended SeptemberJune 30, 20192020 and 2018,2019, respectively, and 10% and 12% and 14%of the company’s consolidated external net sales during the ninesix months ended SeptemberJune 30, 20192020 and 2018,2019, respectively.
Steel Fabrication Operations Segment. Steel fabrication operations include the company’s New Millennium Building Systems’ joist and deck plants located throughout the United States, and in Northern Mexico. Revenues from these plants are generated from the fabrication of trusses, girders, steel joists and steel deck used within the non-residential construction industry. Steel fabrication operations accounted for 10% and 8%9% of the company’s consolidated external net sales during the three months ended SeptemberJune 30, 20192020 and 2018,2019, respectively and 9% and 8% of the company’s consolidated external net sales during the ninesix months ended SeptemberJune 30, 20192020 and 2018,2019, respectively.
Other. Other operations consists of subsidiary operations that are below the quantitative thresholds required for reportable segments and primarily consist of smaller joint ventures, and the idle Minnesota ironmaking operations. Also included in “Other” are certain unallocated corporate accounts, such as the company’s senior securedunsecured credit facility, senior notes, certain other investments and certain profit sharing expenses.
Significant Accounting Policies
Principles of Consolidation. The consolidated financial statements include the accounts of SDI, together with its wholly- and majority-owned/majority-owned or controlled subsidiaries, after elimination of intercompany accounts and transactions. Noncontrolling and redeemable noncontrolling interests represent the noncontrolling owner’s proportionate share in the equity, income, or losses of the company’s majority-owned/majority-owned or controlled consolidated subsidiaries.
Use of Estimates. These consolidated financial statements are prepared in conformity with accounting principles generally accepted in the United States, and accordingly, include amounts that require management to make estimates and assumptions that affect the amounts reported in the consolidated financial statements and in the notes thereto. Significant items subject to such estimates and assumptions include the carrying value of property, plant and equipment, intangible assets, and goodwill; valuation allowances for credit losses for trade receivables, inventories and deferred income tax assets; unrecognized tax benefits; potential environmental liabilities; and litigation claims and settlements. Actual results may differ from these estimates and assumptions.
In the opinion of management, these financial statements reflect all normal recurring adjustments necessary for a fair presentation of the interim period results. These consolidated financial statements and notes should be read in conjunction with the audited financial statements and notes thereto included in the company’s Annual Report on Form 10-K for the year ended December 31, 2018.2019.
5
Note 1. Description of the Business and Significant Accounting Policies (Continued)
Cash and Equivalents, and Restricted Cash
Cash and equivalents include all highly liquid investments with a maturity of three months or less at the date of acquisition. Restricted cash and equivalents is primarily funds held in escrow as required by various insurance and government organizations. The balance of cash, cash equivalents and restricted cash in the consolidated statements of cash flows includes restricted cash of $5.9 million, $5.5 million, $6.2$5.9 million, $6.2 million, $5.8 million, $6.0 million, and $6.4$6.2 million at SeptemberJune 30, 2020, March 31, 2020, December 31, 2019, June 30, 2019, DecemberMarch 31, 2018, September 30, 2018, June 30, 2018,2019, and December 31, 2017,2018, respectively, which are recorded in Other Assets (noncurrent) in the company’s consolidated balance sheets.
Goodwill
The company’s goodwill consisted of the following at SeptemberJune 30, 2019,2020, and December 31, 2018,2019, (in thousands):
| | | | | | | | | | | | | | | ||
| | | | | | | | | | | | | | | ||
| | | September 30, | | December 31, | | | | June 30, | | December 31, | | ||||
| | | 2019 | | 2018 | | | | 2020 | | 2019 | | ||||
| | | | | | | | | | | | | | | ||
| Steel Operations Segment | | $ | 359,283 | | $ | 245,473 | | Steel Operations Segment | | $ | 272,133 | | $ | 272,133 | |
| Metals Recycling Operations Segment | | | 179,705 | | 182,247 | | Metals Recycling Operations Segment | | | 177,162 | | 178,857 | | ||
| Steel Fabrication Operations Segment | | | 1,925 | | | 1,925 | | Steel Fabrication Operations Segment | | | 1,925 | | | 1,925 | |
| | | $ | 540,913 | | $ | 429,645 | | | | $ | 451,220 | | $ | 452,915 | |
The company acquired a 75% equity interest in United Steel Supply on March 1, 2019 (refer to Note 2 Acquisition – United Steel Supply, LLC), resulting in a preliminary purchase price allocation in which $113.8 million of goodwill has been recorded in the Steel Operations Segment at September 30, 2019. Metals Recycling Operations segmentSegment goodwill decreased $2.5$1.7 million from December 31, 20182019 to SeptemberJune 30, 2019,2020, in recognition of the 20192020 tax benefit related to the normal amortization of the component of OmniSource tax-deductible goodwill in excess of book goodwill.
Recently Issued Accounting StandardsCredit Losses
In June 2016, the FASB issued ASU 2016-13, Financial Instruments - Credit Losses and it’sits subsequent corresponding updates: whichupdates (ASC 326), requires an entity to use a forward-looking expected loss model versus the current incurred loss model for most financial instruments, including accounts receivable. This new guidance is effective for annual and interim periods beginning after December 15, 2019, but can be early adopted. The company anticipates adopting ASU 2016-13 onadopted ASC 326 effective January 1, 2020. 2020, using the modified retrospective transition method, with no impact on the company’s financial position, results of operations or cash flows.
The company is working throughexposed to credit risk in the event of nonpayment of accounts receivable by customers. The company mitigates its adoption planexposure to evaluate policies, processescredit risk, which it generally extends on an unsecured basis, by performing ongoing credit evaluations and systemstaking further action if necessary, such as requiring letters of credit or other security interests to determinesupport the impact ASU 2016-13 willcustomer receivable. The allowance for credit losses for accounts receivable is based on the company’s reasonable estimate of known credit risks and historical experience, adjusted for current and anticipated economic and other pertinent factors affecting the company’s customers, that may differ from historical experience. Customer accounts receivable are written off when all collection efforts have in its consolidated financial statements and related disclosure.
Note 2. Acquisition – United Steel Supply, LLC
On March 1, 2019, the company purchased 75% of the equity interest of United Steel Supply, LLC (USS) for cash consideration of $93.4 million, plus a customary working capital transaction purchase price adjustment of $3.7 million in September 2019. Additionally, the company has an option to purchase,been exhausted and the sellers have the option to require the company to purchase, the remaining 25% equity interestamounts are deemed uncollectible.
At June 30, 2020, we reported $844.1 million of USSaccounts receivable, net of allowances for credit losses of $7.7 million. Changes in the future. Headquartered in Austin, Texas, USS is a leading distributor of painted Galvalume® flat roll steel usedallowance were not material for roofingthe three and siding applications, with distribution centers strategically located in Mississippi, Indiana, Arkansas, and Oregon. USS provides the company a new, complementary distribution channel and connects it to a rapidly growing industry segment with customers that do not traditionally purchase steel directly from a steel producer. USS’s operating results from and after March 1, 2019, are reflected in the company’s financial statements in the steel operations reporting segment.six-month periods ended June 30, 2020.
6
Note 2. Acquisition – United Steel Supply, LLC (Continued)
The aggregate purchase price was preliminarily allocated to the opening balance sheet of USS as of March 1, 2019, and updated in September 2019 upon the final working capital adjustment, as presented below. The following allocation of the purchase price (in thousands) is preliminary based on the information available to estimate the fair value of assets acquired and liabilities assumed. The accounting for the acquisition has not yet been completed because the company has not finalized the valuations of identifiable intangible assets, if any, and thus goodwill. The company anticipates finalizing the valuation of identifiable intangible assets by December 31, 2019.
| | | | | | | | | | | | |
| | | | September 30, | | | | | | | | |
| | | | 2019 Allocation | | | Adjustments | | | Initial Allocation | | |
| | Current assets, net of cash acquired | $ | 86,236 | | $ | (7,784) | | $ | 94,020 | | |
| | Property, plant & equipment | | 7,388 | | | - | | | 7,388 | | |
| | Intangible assets and goodwill | | 113,810 | | | 11,892 | | | 101,918 | | |
| | Total assets acquired | | 207,434 | | | 4,108 | | | 203,326 | | |
| | Liabilities assumed | | 77,954 | | | (3,270) | | | 81,224 | | |
| | Redeemable noncontrolling interest | | 32,374 | | | 3,684 | | | 28,690 | | |
| | Net cash consideration | $ | 97,106 | | $ | 3,694 | | $ | 93,412 | | |
Note 3. Leases
In February 2016, the FASB issued ASU 2016-02, Leases (ASC 842) and its subsequent corresponding updates; which established a new lease accounting model that requires lessees to recognize a right-of-use asset and related lease liability for most leases having lease terms of more than 12 months. The company adopted ASC 842 effective January 1, 2019, using the optional transition method, thereby applying the new guidance at the effective date, without retrospective application to prior periods. The company elected practical expedients permitted under the transition guidance which allowed the company to not reassess under the new standard its prior conclusions regarding lease identification and classification. The company elected to use hindsight when determining the lease term. The company also elected the short-term lease exemption, and did not recognize right-of-use assets and lease liabilities for short-term leases, those with lease commencement date terms of 12 months or less. The company recognized right-of-use assets and lease liabilities of $76.3 million, with no impact on retained earnings, in the consolidated balance sheet on January 1, 2019, and the standard did not have a significant impact on the company’s operating results or cash flows for the three and nine-month periods ended September 30, 2019.
The company has operating leases relating principally to transportation and other equipment, and some real estate. The company determines if an arrangement contains a lease at inception, which generally occurs when the arrangement identifies a specific asset that the company has the right to direct the use of and obtain substantially all of the economic benefit from use of the identified asset. Certain of our lease agreements contain rent escalation clauses (including fixed and index-based escalations), and options to extend or terminate the lease. For purposes of calculating operating lease obligations under the standard, the company’s lease terms include options to extend the lease when it is reasonably certain that the company will exercise such option. The company uses its incremental borrowing rate at lease commencement to determine the present value of lease payments. The incremental borrowing rate is the rate of interest the company could borrow on a collateralized basis over a similar term with similar payments. Operating lease expense is recognized on a straight-line basis over the lease term.
Operating lease right-of-use assets and lease obligations included in the consolidated balance sheet at September 30, 2019, are as follows (in thousands):
| | | | | |
| | Right of use assets under operating leases: | | | |
| | Other assets - noncurrent | $ | 74,843 | |
| | Lease obligations under operating leases: | | | |
| | Accrued liabilities | $ | 17,202 | |
| | Other liabilities - noncurrent | | 57,946 | |
| | | $ | 75,148 | |
7
Note 3. Leases (Continued)
The weighted average remaining lease term for our operating leases is six years and the weighted-average discount rate is 4.0% as of September 30, 2019. Future operating lease liabilities as of September 30, 2019, for the next five years and thereafter are as follows (in thousands):
| | | | | |
| | 2019 - for the remaining three months | $ | 19,954 | |
| | 2020 | | 17,120 | |
| | 2021 | | 13,719 | |
| | 2022 | | 10,636 | |
| | 2023 | | 7,506 | |
| | Thereafter | | 17,095 | |
| | Total undiscounted cash flows | | 86,030 | |
| | Less imputed interest | | (10,882) | |
| | Lease obligations under operating leases | $ | 75,148 | |
Operating lease expense included in the consolidated statements of income was $5.2 million and $15.0 million for the three and nine months ended September 30, 2019, respectively. Cash paid related to operating lease obligations was $5.2 million and $15.1 million for the three and nine months ended September 30, 2019, respectively. Variable lease costs were not material for the three and nine months ended September 30, 2019. Short-term lease expense included in the consolidated statements of income was $5.0 million and $14.8 million for the three and nine months ended September 30, 2019, respectively. Right-of-use assets obtained in exchange for new operating lease liabilities during the three and nine months ended September 30, 2019 were $1.4 million and $11.3 million, respectively.
Note 4.2. Earnings Per Share
Basic earnings per share is based on the weighted average shares of common stock outstanding during the period. Diluted earnings per share assumes the weighted average dilutive effect of common share equivalents outstanding during the period applied to the company’s basic earnings per share. Common share equivalents represent potentially dilutive restricted stock units, deferred stock units, restricted stock, and performance awards, and are excluded from the computation in periods in which they have an anti-dilutive effect. There were 0 anti-dilutive common share equivalents as of or for the three and nine-monthsix-month periods ended SeptemberJune 30, 20192020 and 2018.2019.
| | | | | | | | | | | | | | | | | | | | | | | | | | | | | | | | | | |
| | | | | | | | | | | | | | | | | | | | | | | | | | | | | | | | | | |
| Three Months Ended September 30, | Three Months Ended June 30, | ||||||||||||||||||||||||||||||||
| 2019 | | 2018 | 2020 | | 2019 | ||||||||||||||||||||||||||||
| | | | Weighted | | | | | | | | Weighted | | | | | | | Weighted | | | | | | | | Weighted | | | | ||||
| | | | Average | | | | | | | | Average | | | | | | | Average | | | | | | | | Average | | | | ||||
| Net Income | | Shares | | Per Share | | Net Income | | Shares | | Per Share | Net Income | | Shares | | Per Share | | Net Income | | Shares | | Per Share | ||||||||||||
| (Numerator) | | (Denominator) | | Amount | | (Numerator) | | (Denominator) | | Amount | (Numerator) | | (Denominator) | | Amount | | (Numerator) | | (Denominator) | | Amount | ||||||||||||
Basic earnings per share | $ | 151,048 | | | 217,873 | | $ | 0.69 | | $ | 398,375 | | | 234,208 | | $ | 1.70 | $ | 75,496 | | | 210,343 | | $ | 0.36 | | $ | 194,302 | | | 221,505 | | $ | 0.88 |
Dilutive common share equivalents | | - | | | 1,236 | | | | | | - | | | 1,441 | | | | | - | | | 1,035 | | | | | | - | | | 1,014 | | | |
Diluted earnings per share | $ | 151,048 | | | 219,109 | | $ | 0.69 | | $ | 398,375 | | | 235,649 | | $ | 1.69 | $ | 75,496 | | | 211,378 | | $ | 0.36 | | $ | 194,302 | | | 222,519 | | $ | 0.87 |
8
STEEL DYNAMICS, INC.
NOTES TO CONSOLIDATED FINANCIAL STATEMENTS (UNAUDITED)
| | | | | | | | | | | | | | | | | |
| | | | | | | | | | | | | | | | | |
| Six Months Ended June 30, | ||||||||||||||||
| 2020 | | 2019 | ||||||||||||||
| | | | Weighted | | | | | | | | Weighted | | | | ||
| | | | Average | | | | | | | | Average | | | | ||
| Net Income | | Shares | | Per Share | | Net Income | | Shares | | Per Share | ||||||
| (Numerator) | | (Denominator) | | Amount | | (Numerator) | | (Denominator) | | Amount | ||||||
Basic earnings per share | $ | 262,836 | | | 211,798 | | $ | 1.24 | | $ | 398,630 | | | 222,781 | | $ | 1.79 |
Dilutive common share equivalents | | - | | | 903 | | | | | | - | | | 960 | | | |
Diluted earnings per share | $ | 262,836 | | | 212,701 | | $ | 1.24 | | $ | 398,630 | | | 223,741 | | $ | 1.78 |
Note 4. Earnings Per Share (Continued)
| | | | | | | | | | | | | | | | | |
| | | | | | | | | | | | | | | | | |
| Nine Months Ended September 30, | ||||||||||||||||
| 2019 | | 2018 | ||||||||||||||
| | | | Weighted | | | | | | | | Weighted | | | | ||
| | | | Average | | | | | | | | Average | | | | ||
| Net Income | | Shares | | Per Share | | Net Income | | Shares | | Per Share | ||||||
| (Numerator) | | (Denominator) | | Amount | | (Numerator) | | (Denominator) | | Amount | ||||||
Basic earnings per share | $ | 549,678 | | | 221,145 | | $ | 2.49 | | $ | 988,375 | | | 235,483 | | $ | 4.20 |
Dilutive common share equivalents | | - | | | 1,052 | | | | | | - | | | 1,289 | | | |
Diluted earnings per share | $ | 549,678 | | | 222,197 | | $ | 2.47 | | $ | 988,375 | | | 236,772 | | $ | 4.17 |
Note 5.3. Inventories
Inventories are stated at lower of cost or net realizable value. Cost is determined using a weighted average cost method for raw materials and supplies, and on a first-in, first-out basis for other inventory. Inventory consisted of the following (in thousands):
| | | | | | | | | |
| | | September 30, | | December 31, | | | ||
| | | 2019 | | 2018 | | | ||
| | Raw materials | $ | 758,677 | | $ | 810,766 | | |
| | Supplies | | 492,604 | | | 436,828 | | |
| | Work in progress | | 156,443 | | | 195,224 | | |
| | Finished goods | | 359,296 | | | 416,350 | | |
| | Total inventories | $ | 1,767,020 | | $ | 1,859,168 | | |
| | | | | | | |
| June 30, | | December 31, | | | ||
| 2020 | | 2019 | | | ||
Raw materials | $ | 589,122 | | $ | 686,831 | | |
Supplies | | 483,323 | | | 498,298 | | |
Work in progress | | 150,139 | | | 154,669 | | |
Finished goods | | 344,433 | | | 349,245 | | |
Total inventories | $ | 1,567,017 | | $ | 1,689,043 | | |
Note 4. Debt
In June 2020, the company issued $400.0 million of 2.400% notes due 2025 and $500.0 million of 3.250% notes due 2031. The net proceeds from these notes were used to fund the June 2020 call and redemption of the $400.0 million outstanding principal amount of the company’s 5.250% senior notes due 2023 (“2023 Notes”) at a redemption price of 100.875%, and the $500.0 million outstanding principal amount of the company’s 5.500% senior notes due 2024 (“2024 Notes”) at a redemption price of 102.750%, plus accrued and unpaid interest to, but not including, the date of redemption. The company recorded expenses related to premiums, write off of unamortized debt issuance costs, and other expenses of approximately $22.8 million, which are reflected in other expenses in the consolidated statements of income for the three and six-months ended June 30, 2020.
7
Note 6.5. Changes in Equity
The following tables provide a reconciliation of the beginning and ending carrying amounts of total equity, equity attributable to stockholders of Steel Dynamics, Inc., and equity and redeemable amounts attributable to noncontrolling interests (in thousands) for each quarterly period in the nine monthsthree and six-month periods ended SeptemberJune 30, 20192020 and 2018:2019:
| | | | | | | | | | | | | | | | | | | | | | | | | | | | | | | | | | | | | | | | | | | | | | |
| | | | | | | | | | | | | | | | | | | | | | | | | | | | | | | | | | | | | | | | | | | | | | |
| Stockholders of Steel Dynamics, Inc. | | | | | | | | | | Stockholders of Steel Dynamics, Inc. | | | | | | | | | | ||||||||||||||||||||||||||
| | | | | | | | | | Accumulated | | | | | | | | | | | | | | | | Accumulated | | | | | | | ||||||||||||||
| | | | | Additional | | | | Other | | | | | | Redeemable | | | | | Additional | | | | Other | | | | | | Redeemable | ||||||||||||||||
| Common | | Treasury | | Paid-In | | Retained | | Comprehensive | | Noncontrolling | | Total | | Noncontrolling | Common | | Treasury | | Paid-In | | Retained | | Comprehensive | | Noncontrolling | | Total | | Noncontrolling | ||||||||||||||||
| Stock | | Stock | | Capital | | Earnings | | Loss | | Interests | | Equity | | Interests | Stock | | Stock | | Capital | | Earnings | | Loss | | Interests | | Equity | | Interests | ||||||||||||||||
Balances at December 31, 2018 | $ | 645 | | $ | (1,184,243) | | $ | 1,160,048 | | $ | 3,958,320 | | $ | 301 | | $ | (159,082) | | $ | 3,775,989 | | $ | 111,240 | |||||||||||||||||||||||
Balances at December 31, 2019 | $ | 646 | | $ | (1,525,113) | | $ | 1,181,012 | | $ | 4,419,296 | | $ | (7) | | $ | (154,593) | | $ | 3,921,241 | | $ | 143,614 | |||||||||||||||||||||||
Dividends declared | | - | | | - | | | - | | | (53,504) | | | - | | | - | | | (53,504) | | | - | | - | | | - | | | - | | | (52,585) | | | - | | | - | | | (52,585) | | | - |
Noncontrolling investors of USS | | - | | | - | | | - | | | - | | | - | | | - | | | - | | | 28,690 | | - | | | - | | | - | | | - | | | - | | | (7,504) | | | (7,504) | | | 7,400 |
Share repurchases | | - | | | (84,308) | | | - | | | - | | | - | | | - | | | (84,308) | | | - | | - | | | (106,529) | | | - | | | - | | | - | | | - | | | (106,529) | | | - |
Equity-based compensation | | - | | | 6,714 | | | 91 | | | (110) | | | - | | | - | | | 6,695 | | | - | | - | | | 6,834 | | | 2,764 | | | (169) | | | - | | | - | | | 9,429 | | | - |
Net income | | - | | | - | | | - | | | 204,328 | | | - | | | 499 | | | 204,827 | | | - | | - | | | - | | | - | | | 187,340 | | | - | | | 3,496 | | | 190,836 | | | - |
Other comprehensive loss, net of tax | | - | | | - | | | - | | | - | | | (171) | | | - | | | (171) | | | - | | - | | | - | | | - | | | - | | | 37 | | | - | | | 37 | | | - |
Balances at March 31, 2019 | | 645 | | | (1,261,837) | | | 1,160,139 | | | 4,109,034 | | | 130 | | | (158,583) | | | 3,849,528 | | | 139,930 | |||||||||||||||||||||||
Dividends declared | | - | | | - | | | - | | | (52,751) | | | - | | | - | | | (52,751) | | | - | |||||||||||||||||||||||
Share repurchases | | - | | | (93,136) | | | - | | | - | | | - | | | - | | | (93,136) | | | - | |||||||||||||||||||||||
Equity-based compensation | | - | | | 816 | | | 7,366 | | | (166) | | | - | | | - | | | 8,016 | | | - | |||||||||||||||||||||||
Net income | | - | | | - | | | - | | | 194,302 | | | - | | | 2,444 | | | 196,746 | | | - | |||||||||||||||||||||||
Other comprehensive loss, net of tax | | - | | | - | | | - | | | - | | | (52) | | | - | | | (52) | | | - | |||||||||||||||||||||||
Balances at June 30, 2019 | | 645 | | | (1,354,157) | | | 1,167,505 | | | 4,250,419 | | | 78 | | | (156,139) | | | 3,908,351 | | | 139,930 | |||||||||||||||||||||||
Balances at March 31, 2020 | | 646 | | | (1,624,808) | | | 1,183,776 | | | 4,553,882 | | | 30 | | | (158,601) | | | 3,954,925 | | | 151,014 | |||||||||||||||||||||||
Dividends declared | | - | | | - | | | - | | | (51,778) | | | - | | | - | | | (51,778) | | | - | | - | | | - | | | - | | | (52,591) | | | - | | | - | | | (52,591) | | | - |
Noncontrolling investors of USS | | - | | | - | | | - | | | - | | | - | | | (1,321) | | | (1,321) | | | 3,684 | | - | | | - | | | - | | | - | | | - | | | (2,410) | | | (2,410) | | | 1,400 |
Share repurchases | | - | | | (114,950) | | | - | | | - | | | - | | | - | | | (114,950) | | | - | | - | | | - | | | - | | | - | | | - | | | - | | | - | | | - |
Equity-based compensation | | - | | | 29 | | | 8,007 | | | (166) | | | - | | | - | | | 7,870 | | | - | | - | | | 953 | | | 7,838 | | | (158) | | | - | | | - | | | 8,633 | | | - |
Net income | | - | | | - | | | - | | | 151,048 | | | - | | | 1,560 | | | 152,608 | | | - | | - | | | - | | | - | | | 75,496 | | | - | | | 3,269 | | | 78,765 | | | - |
Other comprehensive loss, net of tax | | - | | | - | | | - | | | - | | | (39) | | | - | | | (39) | | | - | | - | | | - | | | - | | | - | | | 186 | | | - | | | 186 | | | - |
Balances at September 30, 2019 | $ | 645 | | $ | (1,469,078) | | $ | 1,175,512 | | $ | 4,349,523 | | $ | 39 | | $ | (155,900) | | $ | 3,900,741 | | $ | 143,614 | |||||||||||||||||||||||
Balances at June 30, 2020 | $ | 646 | | $ | (1,623,855) | | $ | 1,191,614 | | $ | 4,576,629 | | $ | 216 | | $ | (157,742) | | $ | 3,987,508 | | $ | 152,414 |
| | | | | | | | | | | | | | | | | | | | | | | |
| | | | | | | | | | | | | | | | | | | | | | | |
| Stockholders of Steel Dynamics, Inc. | | | | | | | | | | |||||||||||||
| | | | | | | | | | | | | Accumulated | | | | | | | | | | |
| | | | | | Additional | | | | Other | | | | | | Redeemable | |||||||
| Common | | Treasury | | Paid-In | | Retained | | Comprehensive | | Noncontrolling | | Total | | Noncontrolling | ||||||||
| Stock | | Stock | | Capital | | Earnings | | Loss | | Interests | | Equity | | Interests | ||||||||
Balances at December 31, 2018 | $ | 645 | | $ | (1,184,243) | | $ | 1,160,048 | | $ | 3,958,320 | | $ | 301 | | $ | (159,082) | | $ | 3,775,989 | | $ | 111,240 |
Dividends declared | | - | | | - | | | - | | | (53,504) | | | - | | | - | | | (53,504) | | | - |
Noncontrolling investors of USS | | - | | | - | | | - | | | - | | | | | | - | | | - | | | 28,690 |
Share repurchases | | - | | | (84,308) | | | - | | | - | | | - | | | - | | | (84,308) | | | - |
Equity-based compensation | | - | | | 6,714 | | | 91 | | | (110) | | | - | | | - | | | 6,695 | | | - |
Net income | | - | | | - | | | - | | | 204,328 | | | - | | | 499 | | | 204,827 | | | - |
Other comprehensive loss, net of tax | | - | | | - | | | - | | | - | | | (171) | | | - | | | (171) | | | - |
Balances at March 31, 2019 | | 645 | | | (1,261,837) | | | 1,160,139 | | | 4,109,034 | | | 130 | | | (158,583) | | | 3,849,528 | | | 139,930 |
Dividends declared | | - | | | - | | | - | | | (52,751) | | | - | | | - | | | (52,751) | | | - |
Share repurchases | | - | | | (93,136) | | | - | | | - | | | - | | | - | | | (93,136) | | | - |
Equity-based compensation | | - | | | 816 | | | 7,366 | | | (166) | | | - | | | - | | | 8,016 | | | - |
Net income | | - | | | - | | | - | | | 194,302 | | | - | | | 2,444 | | | 196,746 | | | - |
Other comprehensive loss, net of tax | | - | | | - | | | - | | | - | | | (52) | | | - | | | (52) | | | - |
Balances at June 30, 2019 | $ | 645 | | $ | (1,354,157) | | $ | 1,167,505 | | $ | 4,250,419 | | $ | 78 | | $ | (156,139) | | $ | 3,908,351 | | $ | 139,930 |
98
Note 6. Changes in Equity (Continued)
| | | | | | | | | | | | | | | | | | | | | | | |
| | | | | | | | | | | | | | | | | | | | | | | |
| Stockholders of Steel Dynamics, Inc. | | | | | | | | | | | | | ||||||||||
| | | | | | | | | | | | | Accumulated | | | | | | | | | | |
| | | | | | Additional | | | | Other | | | | | | Redeemable | |||||||
| Common | | Treasury | | Paid-In | | Retained | | Comprehensive | | Noncontrolling | | Total | | Noncontrolling | ||||||||
| Stock | | Stock | | Capital | | Earnings | | Loss | | Interests | | Equity | | Interests | ||||||||
Balances at December 31, 2017 | $ | 644 | | $ | (665,297) | | $ | 1,141,534 | | $ | 2,874,693 | | $ | - | | $ | (156,506) | | $ | 3,195,068 | | $ | 111,240 |
Dividends declared | | - | | | - | | | - | | | (44,269) | | | - | | | - | | | (44,269) | | | - |
Share repurchases | | - | | | (69,269) | | | - | | | - | | | - | | | - | | | (69,269) | | | - |
Equity-based compensation | | - | | | 3,866 | | | 1,337 | | | (71) | | | - | | | - | | | 5,132 | | | - |
Comprehensive and net income (loss) | | - | | | - | | | - | | | 227,551 | | | - | | | (2,076) | | | 225,475 | | | - |
Balances at March 31, 2018 | | 644 | | | (730,700) | | | 1,142,871 | | | 3,057,904 | | | - | | | (158,582) | | | 3,312,137 | | | 111,240 |
Dividends declared | | - | | | - | | | - | | | (44,080) | | | - | | | - | | | (44,080) | | | - |
Noncontrolling investors, net | | - | | | - | | | - | | | - | | | - | | | (3) | | | (3) | | | - |
Share repurchases | | - | | | (49,145) | | | - | | | - | | | - | | | - | | | (49,145) | | | - |
Equity-based compensation | | - | | | 757 | | | 6,496 | | | (110) | | | - | | | - | | | 7,143 | | | - |
Net income | | - | | | - | | | - | | | 362,449 | | | - | | | 123 | | | 362,572 | | | - |
Other comprehensive loss, net of tax | | - | | | - | | | - | | | - | | | (105) | | | - | | | (105) | | | - |
Balances at June 30, 2018 | | 644 | | | (779,088) | | | 1,149,367 | | | 3,376,163 | | | (105) | | | (158,462) | | | 3,588,519 | | | 111,240 |
Dividends declared | | - | | | - | | | - | | | (43,767) | | | - | | | - | | | (43,767) | | | - |
Noncontrolling investors, net | | - | | | - | | | - | | | - | | | - | | | - | | | - | | | - |
Share repurchases | | - | | | (74,965) | | | - | | | - | | | - | | | - | | | (74,965) | | | - |
Equity-based compensation | | - | | | 1 | | | 7,189 | | | (109) | | | - | | | - | | | 7,081 | | | - |
Net income | | - | | | - | | | - | | | 398,375 | | | - | | | (469) | | | 397,906 | | | - |
Other comprehensive loss, net of tax | | - | | | - | | | - | | | - | | | 63 | | | - | | | 63 | | | - |
Balances at September 30, 2018 | $ | 644 | | $ | (854,052) | | $ | 1,156,556 | | $ | 3,730,662 | | $ | (42) | | $ | (158,931) | | $ | 3,874,837 | | $ | 111,240 |
Note 7.6. Derivative Financial Instruments
The company is exposed to certain risks relating to its ongoing business operations. The company utilizes derivative instruments to mitigate commodity margin risk, and occasionally to mitigate foreign currency exchange rate risk, orand have in the past to mitigate interest rate fluctuation risk. The company routinely enters into forward exchange traded futures and option contracts to manage the price risk associated with nonferrous metals inventory as well as purchases and sales of nonferrous and ferrous metals (primarily aluminum and copper). The company offsets fair value amounts recognized for derivative instruments executed with the same counterparty under master netting agreements.
Commodity Futures Contracts. If the company is “long” on futures contracts, it means the company has more futures contracts purchased than futures contracts sold for the underlying commodity. If the company is “short” on a futures contract, it means the company has more futures contracts sold than futures contracts purchased for the underlying commodity. The following summarizes the company’s significant futures contract commitments as of SeptemberJune 30, 2019:2020:
| | | | | |
| | | | | |
| Commodity Futures | | Long/Short | | Metric Tons |
| Aluminum | | Long | |
|
| Aluminum | | Short | |
|
| Copper | | Long | |
|
| Copper | | Short | |
|
The following summarizes the location and amounts of the fair values reported on the company’s consolidated balance sheets as of June 30, 2020, and December 31, 2019, and gains and losses related to derivatives included in the company’s statement of income for the three and six-month periods ended June 30, 2020, and 2019 (in thousands):
| | | | | | | | | | | | | |
| | | | | | | | | | | | | |
| | | Asset Derivatives | | Liability Derivatives | ||||||||
| Balance sheet | | Fair Value | | Fair Value | ||||||||
| location | | June 30, 2020 | | December 31, 2019 | | June 30, 2020 | | December 31, 2019 | ||||
Derivative instruments designated as hedges | | | | | | | | | | | | | |
Commodity futures | Other current assets | | $ | 2,060 | | $ | 966 | | $ | 4,260 | | $ | 1,011 |
| | | | | | | | | | | | | |
Derivative instruments not designated as hedges | | | | | | | | | | | | | |
Commodity futures | Other current assets | | | 3,500 | | | 310 | | | 2,588 | | | 721 |
Total derivative instruments | | | $ | 5,560 | | $ | 1,276 | | $ | 6,848 | | $ | 1,732 |
The fair value of the above derivative instruments along with required margin deposit amounts with the same counterparty under master netting arrangements totaled $3.1 million at June 30, 2020, and $3.7 million at December 31, 2019, and are reflected in other current assets in the consolidated balance sheets.
| | | | | | | | | | | | | | | | |
| | | Amount of gain (loss) | | | | | Amount of gain (loss) | ||||||||
| | | recognized in income | | | | Location of gain | recognized in income | ||||||||
| | Location of gain | on derivatives for the | | | | (loss) recognized | on derivatives for the | ||||||||
| | (loss) recognized | three months ended | | Hedged items in | | in income on | three months ended | ||||||||
| | in income on | June 30, | | fair value hedge | | related hedged | June 30, | ||||||||
| | derivatives | 2020 | | 2019 | | relationships | | items | 2020 | | 2019 | ||||
Derivatives in fair value | | | | | | | | | | | | | | | | |
hedging relationships | | | | | | | | | | | | | | | | |
Commodity futures | | Costs of goods sold | $ | (3,287) | | $ | 591 | | Firm commitments | | Costs of goods sold | $ | (484) | | $ | 1,415 |
| | | | | | | | | Inventory | | Costs of goods sold | | 2,579 | | | (294) |
Derivatives not designated | | | | | | | | | | | | $ | 2,095 | | $ | 1,121 |
as hedging instruments | | | | | | | | | | | | | | | | |
Commodity futures | | Costs of goods sold | $ | (1,289) | | $ | 5,487 | | | | | | | | | |
109
Note 7.6. Derivative Financial Instruments (Continued)
The following summarizes the location and amounts of the fair values reported on the company’s consolidated balance sheets as of September 30, 2019, and December 31, 2018, and gains and losses related to derivatives included in the company’s statement of income for the three and nine-month periods ended September 30, 2019 and 2018 (in thousands):
| | | | | | | | | | | | | |
| | | | | | | | | | | | | |
| | | Asset Derivatives | | Liability Derivatives | ||||||||
| Balance sheet | | Fair Value | | Fair Value | ||||||||
| location | | September 30, 2019 | | December 31, 2018 | | September 30, 2019 | | December 31, 2018 | ||||
Derivative instruments designated as hedges | | | | | | | | | | | | | |
Commodity futures | Other current assets | | $ | 1,063 | | $ | 2,999 | | $ | 805 | | $ | 1,837 |
| | | | | | | | | | | | | |
Derivative instruments not designated as hedges | | | | | | | | | | | | | |
Commodity futures | Other current assets | | | 313 | | | 1,559 | | | 3,100 | | | 2,053 |
Total derivative instruments | | | $ | 1,376 | | $ | 4,558 | | $ | 3,905 | | $ | 3,890 |
The fair value of the above derivative instruments along with required margin deposit amounts with the same counterparty under master netting arrangements totaled $4.3 million at September 30, 2019, and $4.9 million at December 31, 2018, and are reflected in other current assets in the consolidated balance sheets.
| | | | | | | | | | | | | | |
| | | Amount of gain (loss) | | | | | Amount of gain (loss) | ||||||
| | | recognized in income | | | | Location of gain | recognized in income | ||||||
| | Location of gain | on derivatives for the | | | | (loss) recognized | on derivatives for the | ||||||
| | (loss) recognized | three months ended | | Hedged items in | | in income on | three months ended | ||||||
| | in income on | September 30, | | fair value hedge | | related hedged | September 30, | ||||||
| | derivatives | 2019 | 2018 | | relationships | | items | 2019 | 2018 | ||||
Derivatives in fair value | | | | | | | | | | | | | | |
hedging relationships | | | | | | | | | | | | | | |
Commodity futures | | Costs of goods sold | $ | 302 | $ | (8,943) | | Firm commitments | | Costs of goods sold | $ | (519) | $ | 5,111 |
| | | | | | | | Inventory | | Costs of goods sold | | (182) | | 1,753 |
Derivatives not designated | | | | | | | | | | | $ | (701) | $ | 6,864 |
as hedging instruments | | | | | | | | | | | | | | |
Commodity futures | | Costs of goods sold | $ | 4,536 | $ | 13,803 | | | | | | | | |
| | | | | | | | | | | | | | | | | | | | | | | | | | | | | | |
| | | Amount of gain (loss) | | | | | Amount of gain (loss) | | | Amount of gain (loss) | | | | | Amount of gain (loss) | ||||||||||||||
| | | recognized in income | | | | Location of gain | recognized in income | | | recognized in income | | | | Location of gain | recognized in income | ||||||||||||||
| | Location of gain | on derivatives for the | | | | (loss) recognized | on derivatives for the | | Location of gain | on derivatives for the | | | | (loss) recognized | on derivatives for the | ||||||||||||||
| | (loss) recognized | three months ended | | Hedged items in | | in income on | three months ended | | (loss) recognized | six months ended | | Hedged items in | | in income on | six months ended | ||||||||||||||
| | in income on | September 30, | | fair value hedge | | related hedged | September 30, | | in income on | June 30, | | fair value hedge | | related hedged | June 30, | ||||||||||||||
| | derivatives | 2019 | 2018 | | relationships | | items | 2019 | 2018 | | derivatives | 2020 | | 2019 | | relationships | | items | 2020 | | 2019 | ||||||||
Derivatives in fair value | | | | | | | | | | | | | | | | | | | | | | | | | | | | | | |
hedging relationships | | | | | | | | | | | | | | | | | | | | | | | | | | | | | | |
Commodity futures | | Costs of goods sold | $ | (560) | $ | 1,113 | | Firm commitments | | Costs of goods sold | $ | (603) | $ | 1,718 | | Costs of goods sold | $ | (2,449) | | $ | (862) | | Firm commitments | | Costs of goods sold | $ | 1,255 | | $ | (84) |
| | | | | | | | Inventory | | Costs of goods sold | | 245 | | (1,659) | | | | | | | | | Inventory | | Costs of goods sold | | 1,340 | | | 427 |
Derivatives not designated | | | | | | | | | | | $ | (358) | $ | 59 | | | | | | | | | | | | $ | 2,595 | | $ | 343 |
as hedging instruments | | | | | | | | | | | | | | | | | | | | | | | | | | | | | | |
Commodity futures | | Costs of goods sold | $ | 5,946 | $ | 19,523 | | | | | | | | | | Costs of goods sold | $ | 9,650 | | $ | 1,410 | | | | | | | | | |
Derivatives accounted for as fair value hedges had ineffectiveness resulting in gains of $69,000$2,400 and $5,000$1.2 million during the three-month periods ended SeptemberJune 30, 2020, and 2019, respectively, and 2018, respectively;losses of $59,000 and gains of $101,000 and losses of $10,500$32,000 during the nine-monthsix-month periods ended SeptemberJune 30, 2019,2020, and 2018,2019, respectively. Losses excluded from hedge effectiveness testing of $399,000 and $2.1$1.2 million increased cost of goods sold during the three-month periodsperiod ended SeptemberJune 30, 2019,2020 and 2018, respectively. Lossesgains of $1.7 million decreased cost of goods sold during the three-month period ended June 30, 2019. Gains excluded from hedge effectiveness testing of $918,000$205,000 decreased cost of goods sold during the six-month period ended June 30, 2020 and losses of $519,000 increased cost of goods sold during the nine-monthsix-month period ended SeptemberJune 30, 2019 and gains of $1.2 million decreased the cost of goods sold during the nine-month period ended September 30, 2018.
11
Note 7. Derivative Financial Instruments (Continued)
Derivatives accounted for as cash flow hedges resulted in net losses of $8,000 and net gains of $82,000$480,000 and $88,000 recognized in other comprehensive income for the three-month periods ended SeptemberJune 30, 2020, and 2019, and 2018, respectively; respectively, and net gains of $139,000$491,000 and net losses of $55,000$147,000 for the nine-monthsix-month periods ended SeptemberJune 30, 2020, and 2019, and 2018, respectively. NetNet gains of $43,000$236,000 and $483,000$157,000 were reclassified from accumulated other comprehensive income for the three and nine-monththree-month periods ended SeptemberJune 30, 2019.2020, and 2019, respectively, and net gains of $198,000 and $440,000 for the six-month periods ended June 30, 2020, and 2019, respectively. At SeptemberJune 30, 2019,2020, the company expects to reclassify $51,000all $284,000 of net gains on derivative instruments from accumulated other comprehensive income to earnings during the next 12 months due to the settlement of futures contracts.
Note 8.7. Fair Value Measurements
FASB accountingAccounting standards provide a comprehensive framework for measuring fair value and sets forth a definition of fair value and establishes a hierarchy prioritizing the inputs to valuation techniques, giving the highest priority to quoted prices in active markets for identical assets and liabilities and the lowest priority to unobservable value inputs. Levels within the hierarchy are defined as follows:
● | Level 1—Unadjusted quoted prices for identical assets and liabilities in active markets; |
● | Level 2—Quoted prices for similar assets and liabilities in active markets (other than those included in Level 1) which are observable for the asset or liability, either directly or indirectly; and |
● | Level 3—Valuations derived from valuation techniques in which one or more significant inputs or significant value drivers are unobservable. |
10
Note 7. Fair Value Measurements (Continued)
The following table sets forth financial assets and liabilities measured at fair value on a recurring basis in the consolidated balance sheet and the respective levels to which the fair value measurements are classified within the fair value hierarchy as of September
June 30, 2019,2020, and December 31, 20182019 (in thousands):
| | | | | | | | | | | | | | | | | ||||||
| | | | | | | | | | | | | | | | | ||||||
| | | | Quoted Prices | | Significant | | | | | | Quoted Prices | | Significant | | | ||||||
| | | | in Active | | Other | | Significant | | | | in Active | | Other | | Significant | ||||||
| | | | Markets for | | Observable | | Unobservable | | | | Markets for | | Observable | | Unobservable | ||||||
| | | | Identical Assets | | Inputs | | Inputs | | | | Identical Assets | | Inputs | | Inputs | ||||||
| Total | | (Level 1) | | (Level 2) | | (Level 3) | Total | | (Level 1) | | (Level 2) | | (Level 3) | ||||||||
September 30, 2019 | | | | | | | | | ||||||||||||||
June 30, 2020 | | | | | | | | | ||||||||||||||
Short-term investments | $ | 69,529 | | $ | - | | $ | 69,529 | | $ | - | $ | 69,546 | | $ | - | | $ | 69,546 | | $ | - |
Commodity futures – financial assets | | 1,376 | | | - | | | 1,376 | | | - | | 5,560 | | | - | | | 5,560 | | | - |
Commodity futures – financial liabilities | | 3,905 | | - | | 3,905 | | - | | 6,848 | | - | | 6,848 | | - | ||||||
| | | | | | | | | | | | | | | | | ||||||
December 31, 2018 | | | | | | | | | | | | |||||||||||
December 31, 2019 | | | | | | | | | | | | |||||||||||
Short-term investments | $ | 228,783 | | $ | - | | $ | 228,783 | | $ | - | $ | 262,174 | | $ | - | | $ | 262,174 | | $ | - |
Commodity futures – financial assets | | 4,558 | | | - | | | 4,558 | | | - | | 1,276 | | | - | | | 1,276 | | | - |
Commodity futures – financial liabilities | | 3,890 | | | - | | | 3,890 | | | - | | 1,732 | | | - | | | 1,732 | | | - |
The carrying amounts of financial instruments including cash and equivalents, and restricted cash approximate fair value (Level
(Level 1). The fair values of short-term investments and the commodity futures contracts are estimated by the use of quoted market prices, estimates obtained from brokers, and other appropriate valuation techniques based on references available (Level 2). The fair value of long-term debt, including current maturities, as determined by quoted market prices (Level 2), was approximately $2.5 billion and $2.4$2.8 billion at SeptemberJune 30, 20192020 and December 31, 2018, respectively2019, (with a corresponding carrying amount in the consolidated balance sheet of $2.5$2.7 billion at SeptemberJune 30, 20192020 and $2.4$2.8 billion at December 31, 2018)2019).
Note 9.8. Commitments and Contingencies
The company is involved in various routine litigation matters, including administrative proceedings, regulatory proceedings, governmental investigations, environmental matters, and commercial and construction contract disputes, none of which are expected to have a material impact on our financial condition, results of operations, or liquidity.
12
Note 10.9. Segment Information
The company’s operations are primarily organized and managed by reportable operating segments, which are steel operations, metals recycling operations, and steel fabrication operations. The segment operations are more fully described in Note 1 to the consolidated financial statements. Operating segment performance and resource allocations are primarily based on operating results before income taxes. The accounting policies of the reportable segments are consistent with those described in Note 1 to the consolidated financial statements. Intra-segment sales and any related profits are eliminated in consolidation. Amounts included in the category “Other” are from subsidiary operations that are below the quantitative thresholds required for reportable segments and primarily consist of smaller joint ventures, and the idle Minnesota ironmaking operations. Also included in “Other” are certain unallocated corporate accounts, such as the company’s senior securedunsecured credit facility, senior notes, certain other investments and certain profit sharing expenses.
11
Note 9. Segment Information (Continued)
The company’s segment results, including disaggregated revenue by segment to external, external non-United States, and other segment customers, are as follows (in thousands):
| | | | | | | | | | | | | | | | | | | | | | | | | | | | | ||||||||
| | | | | | | | | | | | | | | | | | | | | | | | | | | | | ||||||||
| | | | Metals | | Steel | | | | | | | | | | | | Metals | | Steel | | | | | | | | | ||||||||
For the three months ended | | Steel | | Recycling | | Fabrication | | | | | | | | �� | | Steel | | Recycling | | Fabrication | | | | | | | | | ||||||||
September 30, 2019 | | Operations | | Operations | | Operations | | Other | | Eliminations | | Consolidated | ||||||||||||||||||||||||
June 30, 2020 | | Operations | | Operations | | Operations | | Other | | Eliminations | | Consolidated | ||||||||||||||||||||||||
| | | | | | | | | | | | | | | | | | | | | | | | | | | | | ||||||||
Net sales - disaggregated revenue | | | | | | | | | | | | | | | | | | | | | | | | | | | | | ||||||||
External | | $ | 1,838,682 | | $ | 230,086 | | $ | 245,914 | | $ | 77,330 | | $ | - | | $ | 2,392,012 | | $ | 1,578,252 | | $ | 126,818 | | $ | 214,951 | | $ | 94,274 | | $ | - | | $ | 2,014,295 |
External Non-U.S. | | | 83,845 | | 50,823 | | 165 | | - | | | - | | | 134,833 | | | 49,775 | | 29,764 | | 300 | | 171 | | | - | | | 80,010 | ||||||
Other segments | | | 85,678 | | | 293,999 | | | 637 | | | 100 | | | (380,414) | | | - | | | 71,371 | | | 260,106 | | | 3,177 | | | - | | | (334,654) | | | - |
| | | 2,008,205 | | | 574,908 | | | 246,716 | | | 77,430 | | | (380,414) | | | 2,526,845 | | | 1,699,398 | | | 416,688 | | | 218,428 | | | 94,445 | | | (334,654) | | | 2,094,305 |
Operating income (loss) | | 234,683 | | (101) | | | 35,280 | | (42,441) | (1) | | 624 | (2) | | 228,045 | | 168,043 | | (8,715) | | | 27,155 | | (32,089) | (1) | | 4,456 | (2) | | 158,850 | ||||||
Income (loss) before income taxes | | 217,699 | | (1,159) | | | 34,080 | | (49,780) | | | 411 | | | 201,251 | | 151,012 | | (12,654) | | | 25,959 | | (65,445) | | | 4,173 | | | 103,045 | ||||||
Depreciation and amortization | | 63,170 | | 11,769 | | 2,941 | | 1,590 | | | - | | | 79,470 | | 60,686 | | 12,170 | | 2,737 | | 3,128 | | | - | | | 78,721 | ||||||||
Capital expenditures | | 40,818 | | 11,498 | | 3,759 | | 98,056 | | | - | | | 154,131 | | 301,179 | | 3,821 | | 2,364 | | 2,352 | | | - | | | 309,716 | ||||||||
| | | | | | | | | | | | | | | | | | | | | | | | | | | | | ||||||||
As of September 30, 2019 | | | | | | | | | | | | | | | | |||||||||||||||||||||
As of June 30, 2020 | | | | | | | | | | | | | | | | |||||||||||||||||||||
Assets | | $ | 5,119,419 | | $ | 972,493 | | $ | 414,835 | | $ | 1,513,798 | (3) | $ | (77,298) | (4) | $ | 7,943,247 | | $ | 5,533,365 | | $ | 867,866 | | $ | 397,070 | | $ | 1,718,951 | (3) | $ | (48,911) | (4) | $ | 8,468,341 |
| | | | | | | | | | | | | | | | | | | | | | | | | | | | | | | | | | |
| | | | | | | | | | | | | | | ||
Footnotes related to the three months ended September 30, 2019, segment results (in millions): | ||||||||||||||||
Footnotes related to the three months ended June 30, 2020, segment results (in millions): | Footnotes related to the three months ended June 30, 2020, segment results (in millions): | |||||||||||||||
| | | | | | | | | | | | | | | ||
(1) | Corporate SG&A | $ | (15.4) | | (2) | Gross profit increase from intra-company sales | $ | 0.4 | Corporate SG&A | $ | (14.5) | | (2) | Gross profit increase from intra-company sales | $ | 4.5 |
| Company-wide equity-based compensation | | (8.7) | | | | | Company-wide equity-based compensation | | (9.7) | | | | | ||
| Profit sharing | | (17.0) | | | | | Profit sharing | | (8.2) | | | | | ||
| Other, net | | (1.3) | | | | | Other, net | | 0.3 | | | | | ||
| | $ | (42.4) | | | | | | | $ | (32.1) | | | | | |
| | | | | | | | | | | | | | | | |
(3) | Cash and equivalents | $ | 1,072.5 | | (4) | Elimination of intra-company receivables | $ | (61.2) | Cash and equivalents | $ | 1,418.4 | | (4) | Elimination of intra-company receivables | $ | (35.5) |
| Short-term investments | | 69.5 | | | Elimination of intra-company debt | | (8.7) | Short-term investments | | 69.5 | | | Elimination of intra-company debt | | (6.5) |
| Accounts receivable | | 7.8 | | | Other | | (7.4) | Accounts receivable | | 11.4 | | | Other | | (6.9) |
| Inventories | | 36.5 | | | | $ | (77.3) | Inventories | | 26.9 | | | | $ | (48.9) |
| Property, plant and equipment, net | | 271.8 | | | | | | Property, plant and equipment, net | | 148.2 | | | | | |
| Intra-company debt | | 8.7 | | | | | | Intra-company debt | | 6.5 | | | | | |
| Other | | 47.0 | | | | | | Other | | 38.1 | | | | | |
| | $ | 1,513.8 | | | | | | | $ | 1,719.0 | | | | | |
1312
Note 10.9. Segment Information (Continued)
| | | | | | | | | | | | | | | | | | |
| | | | | | | | | | | | | | | | | | |
| | | | | Metals | | Steel | | | | | | | | | | ||
For the three months ended | | Steel | | Recycling | | Fabrication | | | | | | | | | | |||
September 30, 2018 | | Operations | | Operations | | Operations | | Other | | Eliminations | | Consolidated | ||||||
| | | | | | | | | | | | | | | | | | |
Net sales - disaggregated revenue | | | | | | | | | | | | | | | | | | |
External | | $ | 2,400,329 | | $ | 323,611 | | $ | 250,625 | | $ | 110,659 | | $ | - | | $ | 3,085,224 |
External Non-U.S. | | | 74,715 | | | 63,608 | | | - | | | - | | | - | | | 138,323 |
Other segments | | | 111,582 | | | 412,795 | | | 120 | | | 1,294 | | | (525,791) | | | - |
| | | 2,586,626 | | | 800,014 | | | 250,745 | | | 111,953 | | | (525,791) | | | 3,223,547 |
Operating income (loss) | | | 573,848 | | | 14,674 | | | 13,104 | | | (67,113) | (1) | | (2,941) | | | 531,572 |
Income (loss) before income taxes | | | 557,870 | | | 13,488 | | | 11,801 | | | (73,109) | | | (2,935) | (2) | | 507,115 |
Depreciation and amortization | | | 64,088 | | | 11,491 | | | 2,941 | | | 2,863 | | | - | | | 81,383 |
Capital expenditures | | | 57,074 | | | 11,603 | | | 1,395 | | | 596 | | | - | | | 70,668 |
| | | | | | | | | | | | | | | | | | |
| | | | | | | | |||||||||||||||||||
Footnotes related to the three months ended September 30, 2018, segment results (in millions): | ||||||||||||||||||||||||||
| | | | | | | | | ||||||||||||||||||
(1) | Corporate SG&A | $ | (13.8) | | (2) | Gross profit decrease from intra-company sales | $ | (2.9) | ||||||||||||||||||
| Company-wide equity-based compensation | | (7.8) | | | | | | | | | | | | | | | | | | | | ||||
| Profit sharing | | (43.4) | | | | | | | | | | | | | | | | | | | | ||||
| Other, net | | (2.1) | | | | | | | | | Metals | | Steel | | | | | | | | | ||||
For the three months ended | | Steel | | Recycling | | Fabrication | | | | | | | | | ||||||||||||
June 30, 2019 | | Operations | | Operations | | Operations | | Other | | Eliminations | | Consolidated | ||||||||||||||
| | $ | (67.1) | | | | | | | | | | | | | | | | | | | | ||||
Net sales - disaggregated revenue | | | | | | | | | | | | | | | ||||||||||||
External | | $ | 2,040,756 | | $ | 262,826 | | $ | 240,439 | | $ | 99,641 | | $ | - | | $ | 2,643,662 | ||||||||
External Non-U.S. | | | 65,595 | | 60,273 | | 985 | | - | | | - | | | 126,853 | |||||||||||
Other segments | | | 81,834 | | | 333,667 | | | - | | | 121 | | | (415,622) | | | - | ||||||||
| | | 2,188,185 | | | 656,766 | | | 241,424 | | | 99,762 | | | (415,622) | | | 2,770,515 | ||||||||
Operating income (loss) | | 291,411 | | 7,619 | | | 30,664 | | (49,153) | (1) | | 4,491 | (2) | | 285,032 | |||||||||||
Income (loss) before income taxes | | 274,155 | | 6,500 | | | 29,466 | | (57,438) | | | 4,277 | | | 256,960 | |||||||||||
Depreciation and amortization | | 63,150 | | 11,525 | | 2,974 | | 3,262 | | | - | | | 80,911 | ||||||||||||
Capital expenditures | | 43,575 | | 12,173 | | 3,019 | | 26,353 | | | - | | | 85,120 | ||||||||||||
| | | | | | | | | | | | | | | | | |
| | | | | | | | | | | | | | | | | | |
| | | | | | | | | | | | | | | | | | |
| | | | | Metals | | Steel | | | | | | | | | | ||
For the nine months ended | | Steel | | Recycling | | Fabrication | | | | | | | | | | |||
September 30, 2019 | | Operations | | Operations | | Operations | | Other | | Eliminations | | Consolidated | ||||||
| | | | | | | | | | | | | | | | | | |
Net sales - disaggregated revenue | | | | | | | | | | | | | | | | | | |
External | | $ | 5,918,189 | | $ | 778,637 | | $ | 714,782 | | $ | 290,219 | | $ | - | | $ | 7,701,827 |
External Non-U.S. | | | 235,259 | | | 176,508 | | | 1,201 | | | - | | | - | | | 412,968 |
Other segments | | | 243,107 | | | 1,013,574 | | | 826 | | | 469 | | | (1,257,976) | | | - |
| | | 6,396,555 | | | 1,968,719 | | | 716,809 | | | 290,688 | | | (1,257,976) | | | 8,114,795 |
Operating income (loss) | | | 835,172 | | | 24,480 | | | 86,567 | | | (148,514) | (1) | | 7,214 | | | 804,919 |
Income (loss) before income taxes | | | 784,873 | | | 20,846 | | | 82,897 | | | (169,914) | | | 6,572 | (2) | | 725,274 |
Depreciation and amortization | | | 188,832 | | | 34,733 | | | 8,882 | | | 8,108 | | | - | | | 240,555 |
Capital expenditures | | | 128,069 | | | 30,313 | | | 8,771 | | | 126,534 | | | - | | | 293,687 |
| | | | | | | | | | | | | | | | | | |
| | | | | | | | |
Footnotes related to the three months ended June 30, 2019, segment results (in millions): | ||||||||
| | | | | | | | |
(1) | Corporate SG&A | $ | (18.0) | | (2) | Gross profit increase from intra-company sales | $ | 4.5 |
| Company-wide equity-based compensation | | (8.4) | | | | | |
| Profit sharing | | (21.3) | | | | | |
| Other, net | | (1.5) | | | | | |
| | $ | (49.2) | | | | | |
| | | | | | | | |||||||||||||||||||
Footnotes related to the nine months ended September 30, 2019, segment results (in millions): | ||||||||||||||||||||||||||
| | | | | | | | | ||||||||||||||||||
(1) | Corporate SG&A | $ | (56.0) | | (2) | Gross profit increase from intra-company sales | $ | 6.6 | ||||||||||||||||||
| Company-wide equity-based compensation | | (26.1) | | | | | | | | | | | | | | | | | | | | ||||
| Profit sharing | | (61.3) | | | | | | | | | | | | | | | | | | | | ||||
| Other, net | | (5.1) | | | | | | | | | Metals | | Steel | | | | | | | | | ||||
For the six months ended | | Steel | | Recycling | | Fabrication | | | | | | | | | ||||||||||||
June 30, 2020 | | Operations | | Operations | | Operations | | Other | | Eliminations | | Consolidated | ||||||||||||||
| | $ | (148.5) | | | | | | | | | | | | | | | | | | | | ||||
Net sales - disaggregated revenue | | | | | | | | | | | | | | | ||||||||||||
External | | $ | 3,438,837 | | $ | 361,651 | | $ | 435,886 | | $ | 214,616 | | $ | - | | $ | 4,450,990 | ||||||||
External Non-U.S. | | | 130,896 | | 86,788 | | 300 | | 431 | | | - | | | 218,415 | |||||||||||
Other segments | | | 145,817 | | | 596,988 | | | 3,683 | | | 88 | | | (746,576) | | | - | ||||||||
| | | 3,715,550 | | | 1,045,427 | | | 439,869 | | | 215,135 | | | (746,576) | | | 4,669,405 | ||||||||
Operating income (loss) | | 456,437 | | (3,187) | | | 56,318 | | (78,444) | (1) | | 1,412 | (2) | | 432,536 | |||||||||||
Income (loss) before income taxes | | 424,567 | | (8,349) | | | 53,877 | | (119,685) | | | 891 | | | 351,301 | |||||||||||
Depreciation and amortization | | 123,113 | | 24,142 | | 5,485 | | 6,240 | | | - | | | 158,980 | ||||||||||||
Capital expenditures | | 494,452 | | 22,044 | | 6,453 | | 4,302 | | | - | | | 527,251 | ||||||||||||
| | | | | | | | | | | | | | | | | |
| | | | | | | | |
Footnotes related to the six months ended June 30, 2020, segment results (in millions): | ||||||||
| | | | | | | | |
(1) | Corporate SG&A | $ | (31.7) | | (2) | Gross profit increase from intra-company sales | $ | 1.4 |
| Company-wide equity-based compensation | | (17.9) | | | | | |
| Profit sharing | | (29.5) | | | | | |
| Other, net | | 0.7 | | | | | |
| | $ | (78.4) | | | | | |
1413
Note 10.9. Segment Information (Continued)
| | | | | | | | | | | | | | | | | | |
| | | | | | | | | | | | | | | | | | |
| | | | | Metals | | Steel | | | | | | | | | | ||
For the nine months ended | | Steel | | Recycling | | Fabrication | | | | | | | | | | |||
September 30, 2018 | | Operations | | Operations | | Operations | | Other | | Eliminations | | Consolidated | ||||||
| | | | | | | | | | | | | | | | | | |
Net sales - disaggregated revenue | | | | | | | | | | | | | | | | | | |
External | | $ | 6,360,177 | | $ | 1,001,267 | | $ | 669,500 | | $ | 326,086 | | $ | - | | $ | 8,357,030 |
External Non-U.S. | | | 362,083 | | | 198,778 | | | 56 | | | - | | | - | | | 560,917 |
Other segments | | | 281,828 | | | 1,236,830 | | | 788 | | | 1,565 | | | (1,521,011) | | | - |
| | | 7,004,088 | | | 2,436,875 | | | 670,344 | | | 327,651 | | | (1,521,011) | | | 8,917,947 |
Operating income (loss) | | | 1,441,904 | | | 62,027 | | | 47,039 | | | (186,137) | (1) | | (7,977) | | | 1,356,856 |
Income (loss) before income taxes | | | 1,390,074 | | | 57,458 | | | 42,898 | | | (203,970) | | | (7,971) | (2) | | 1,278,489 |
Depreciation and amortization | | | 184,998 | | | 34,602 | | | 8,785 | | | 8,253 | | | - | | | 236,638 |
Capital expenditures | | | 137,484 | | | 27,496 | | | 5,526 | | | 5,971 | | | - | | | 176,477 |
| | | | | | | | | | | | | | | | | | |
| | | | | | | | |||||||||||||||||||
Footnotes related to the nine months ended September 30, 2018, segment results (in millions): | ||||||||||||||||||||||||||
| | | | | | | | | ||||||||||||||||||
(1) | Corporate SG&A | $ | (44.0) | | (2) | Gross profit decrease from intra-company sales | $ | (8.0) | ||||||||||||||||||
| Company-wide equity-based compensation | | (24.8) | | | | | | | | | | | | | | | | | | | | ||||
| Profit sharing | | (109.6) | | | | | | | | | | | | | | | | | | | | ||||
| Other, net | | (7.7) | | | | | | | | | Metals | | Steel | | | | | | | | | ||||
For the six months ended | | Steel | | Recycling | | Fabrication | | | | | | | | | ||||||||||||
June 30, 2019 | | Operations | | Operations | | Operations | | Other | | Eliminations | | Consolidated | ||||||||||||||
| | $ | (186.1) | | | | | | | | | | | | | | | | | | | | ||||
Net sales - disaggregated revenue | | | | | | | | | | | | | | | ||||||||||||
External | | $ | 4,085,247 | | $ | 548,551 | | $ | 468,868 | | $ | 212,889 | | $ | - | | $ | 5,315,555 | ||||||||
External Non-U.S. | | | 145,674 | | 125,685 | | 1,036 | | - | | | - | | | 272,395 | |||||||||||
Other segments | | | 157,429 | | | 719,575 | | | 189 | | | 369 | | | (877,562) | | | - | ||||||||
| | | 4,388,350 | | | 1,393,811 | | | 470,093 | | | 213,258 | | | (877,562) | | | 5,587,950 | ||||||||
Operating income (loss) | | 600,489 | | 24,581 | | | 51,287 | | (106,073) | (1) | | 6,590 | (2) | | 576,874 | |||||||||||
Income (loss) before income taxes | | 567,174 | | 22,005 | | | 48,817 | | (120,134) | | | 6,161 | | | 524,023 | |||||||||||
Depreciation and amortization | | 125,662 | | 22,964 | | 5,941 | | 6,518 | | | - | | | 161,085 | ||||||||||||
Capital expenditures | | 87,251 | | 18,815 | | 5,012 | | 28,478 | | | - | | | 139,556 | ||||||||||||
| | | | | | | | | | | | | | | | | |
| | | | | | | | |
Footnotes related to the six months ended June 30, 2019, segment results (in millions): | ||||||||
| | | | | | | | |
(1) | Corporate SG&A | $ | (40.6) | | (2) | Gross profit increase from intra-company sales | $ | 6.6 |
| Company-wide equity-based compensation | | (17.4) | | | | | |
| Profit sharing | | (44.3) | | | | | |
| Other, net | | (3.8) | | | | | |
| | $ | (106.1) | | | | | |
Note 11. Condensed Consolidating Information
Certain 100% owned subsidiaries of SDI fully and unconditionally guaranteed jointly and severally all of the indebtedness relating to the issuance of the company’s senior unsecured notes due 2021, 2023, 2024, 2025 and 2026, at September 30, 2019. Following are the company’s condensed consolidating financial statements, including the guarantors, which present the financial position, results of operations, and cash flows of (i) SDI (in each case, reflecting investments in its consolidated subsidiaries under the equity method of accounting), (ii) the guarantor subsidiaries of SDI, (iii) the non-guarantor subsidiaries of SDI, and (iv) the eliminations necessary to arrive at the information on a consolidated basis. In October 2019, the Company’s corporate credit rating was upgraded to an investment grade credit level by all three credit rating agencies, resulting in all the referenced guarantees being automatically released pursuant to the applicable Indentures.
15
Note 11. Condensed Consolidating Information (Continued)
| | | | | | | | | | | | | | | |
| | | | | | | | | | | | | | | |
Condensed Consolidating Balance Sheets (in thousands) | | | | | | | | | | | | | |||
| | | | | | | | Combined | | Consolidating | | Total | |||
As of September 30, 2019 | | Parent | | Guarantors | | Non-Guarantors | | Adjustments | | Consolidated | |||||
Cash and equivalents | | $ | 1,070,215 | | $ | 64,398 | | $ | 11,394 | | $ | - | | $ | 1,146,007 |
Short-term investments | | | 69,529 | | | - | | | - | | | - | | | 69,529 |
Accounts receivable, net | | | 303,259 | | | 1,675,521 | | | 63,962 | | | (1,055,796) | | | 986,946 |
Inventories | | | 725,792 | | | 960,506 | | | 88,871 | | | (8,149) | | | 1,767,020 |
Other current assets | | | 29,754 | | | 17,464 | | | 4,548 | | | (948) | | | 50,818 |
Total current assets | | | 2,198,549 | | | 2,717,889 | | | 168,775 | | | (1,064,893) | | | 4,020,320 |
Property, plant and equipment, net | | | 966,715 | | | 1,902,414 | | | 162,602 | | | - | | | 3,031,731 |
Intangible assets, net | | | - | | | 249,598 | | | - | | | - | | | 249,598 |
Goodwill | | | - | | | 427,103 | | | 113,810 | | | - | | | 540,913 |
Other assets, including investments in subs | | | 2,723,786 | | | 61,910 | | | 6,420 | | | (2,691,431) | | | 100,685 |
Total assets | | $ | 5,889,050 | | $ | 5,358,914 | | $ | 451,607 | | $ | (3,756,324) | | $ | 7,943,247 |
| | | | | | | | | | | | | | | |
Accounts payable | | $ | 177,308 | | $ | 332,299 | | $ | 99,162 | | $ | (80,140) | | $ | 528,629 |
Accrued expenses | | | 228,600 | | | 316,684 | | | 16,694 | | | (167,482) | | | 394,496 |
Current maturities of long-term debt | | | 843 | | | 517 | | | 103,551 | | | (22,761) | | | 82,150 |
Total current liabilities | | | 406,751 | | | 649,500 | | | 219,407 | | | (270,383) | | | 1,005,275 |
Long-term debt | | | 2,330,968 | | | - | | | 147,310 | | | (123,035) | | | 2,355,243 |
Other liabilities | | | (905,310) | | | 1,087,758 | | | 34,290 | | | 321,636 | | | 538,374 |
Total liabilities | | | 1,832,409 | | | 1,737,258 | | | 401,007 | | | (71,782) | | | 3,898,892 |
| | | | | | | | | | | | | | | |
Redeemable noncontrolling interests | | | - | | | - | | | 143,614 | | | - | | | 143,614 |
| | | | | | | | | | | | | | | |
Common stock | | | 645 | | | 1,727,859 | | | 15,016 | | | (1,742,875) | | | 645 |
Treasury stock | | | (1,469,078) | | | - | | | - | | | - | | | (1,469,078) |
Additional paid-in-capital | | | 1,175,512 | | | 683,048 | | | 804,625 | | | (1,487,673) | | | 1,175,512 |
Retained earnings (deficit) | | | 4,349,523 | | | 1,210,749 | | | (756,755) | | | (453,994) | | | 4,349,523 |
Accumulated other comprehensive loss | | | 39 | | | - | | | - | | | - | | | 39 |
Total Steel Dynamics, Inc. equity | | | 4,056,641 | | | 3,621,656 | | | 62,886 | | | (3,684,542) | | | 4,056,641 |
Noncontrolling interests | | | - | | | - | | | (155,900) | | | - | | | (155,900) |
Total equity | | | 4,056,641 | | | 3,621,656 | | | (93,014) | | | (3,684,542) | | | 3,900,741 |
Total liabilities and equity | | $ | 5,889,050 | | $ | 5,358,914 | | $ | 451,607 | | $ | (3,756,324) | | $ | 7,943,247 |
16
Note 11. Condensed Consolidating Information (Continued)
| | | | | | | | | | | | | | | |
| | | | | | | | | | | | | | | |
| | | | | | | | Combined | | Consolidating | | Total | |||
As of December 31, 2018 | | Parent | | Guarantors | | Non-Guarantors | | Adjustments | | Consolidated | |||||
Cash and equivalents | | $ | 809,763 | | $ | 13,491 | | $ | 4,966 | | $ | - | | $ | 828,220 |
Short-term investments | | | 198,783 | | | 30,000 | | | - | | | - | | | 228,783 |
Accounts receivable, net | | | 340,439 | | | 1,635,168 | | | 26,655 | | | (958,506) | | | 1,043,756 |
Inventories | | | 793,174 | | | 1,038,702 | | | 39,214 | | | (11,922) | | | 1,859,168 |
Other current assets | | | 56,578 | | | 18,627 | | | 3,994 | | | (6,469) | | | 72,730 |
Total current assets | | | 2,198,737 | | | 2,735,988 | | | 74,829 | | | (976,897) | | | 4,032,657 |
Property, plant and equipment, net | | | 871,482 | | | 1,918,198 | | | 156,087 | | | - | | | 2,945,767 |
Intangible assets, net | | | - | | | 270,328 | | | - | | | - | | | 270,328 |
Goodwill | | | - | | | 429,645 | | | - | | | - | | | 429,645 |
Other assets, including investments in subs | | | 2,862,556 | | | 5,593 | | | 5,557 | | | (2,848,540) | | | 25,166 |
Total assets | | $ | 5,932,775 | | $ | 5,359,752 | | $ | 236,473 | | $ | (3,825,437) | | $ | 7,703,563 |
| | | | | | | | | | | | | | | |
Accounts payable | | $ | 209,156 | | $ | 330,156 | | $ | 74,353 | | $ | (62,911) | | $ | 550,754 |
Accrued expenses | | | 296,528 | | | 295,668 | | | 11,171 | | | (159,218) | | | 444,149 |
Current maturities of long-term debt | | | 793 | | | 1,355 | | | 51,079 | | | (28,993) | | | 24,234 |
Total current liabilities | | | 506,477 | | | 627,179 | | | 136,603 | | | (251,122) | | | 1,019,137 |
Long-term debt | | | 2,327,798 | | | 381 | | | 166,226 | | | (141,916) | | | 2,352,489 |
Other liabilities | | | (836,571) | | | 1,447,464 | | | 31,791 | | | (197,976) | | | 444,708 |
Total liabilities | | | 1,997,704 | | | 2,075,024 | | | 334,620 | | | (591,014) | | | 3,816,334 |
| | | | | | | | | | | | | | | |
Redeemable noncontrolling interests | | | - | | | - | | | 111,240 | | | - | | | 111,240 |
| | | | | | | | | | | | | | | |
Common stock | | | 645 | | | 1,727,859 | | | 15,016 | | | (1,742,875) | | | 645 |
Treasury stock | | | (1,184,243) | | | - | | | - | | | - | | | (1,184,243) |
Additional paid-in-capital | | | 1,160,048 | | | 683,048 | | | 695,502 | | | (1,378,550) | | | 1,160,048 |
Retained earnings (deficit) | | | 3,958,320 | | | 873,821 | | | (760,823) | | | (112,998) | | | 3,958,320 |
Accumulated other comprehensive income | | | 301 | | | - | | | - | | | - | | | 301 |
Total Steel Dynamics, Inc. equity | | | 3,935,071 | | | 3,284,728 | | | (50,305) | | | (3,234,423) | | | 3,935,071 |
Noncontrolling interests | | | - | | | - | | | (159,082) | | | - | | | (159,082) |
Total equity | | | 3,935,071 | | | 3,284,728 | | | (209,387) | | | (3,234,423) | | | 3,775,989 |
Total liabilities and equity | | $ | 5,932,775 | | $ | 5,359,752 | | $ | 236,473 | | $ | (3,825,437) | | $ | 7,703,563 |
| | | | | | | | | | | | | | | |
| | | | | | | | | | | | | | | |
Condensed Consolidating Statements of Operations (in thousands) | | | | | | | | | | | | | |||
| | | | | | | | | | | | | | | |
For the three months ended, | | | | | | | | Combined | | Consolidating | | Total | |||
September 30, 2019 | | Parent | | Guarantors | | Non-Guarantors | | Adjustments | | Consolidated | |||||
Net sales | | $ | 976,470 | | $ | 2,710,767 | | $ | 205,617 | | $ | (1,366,009) | | $ | 2,526,845 |
Costs of goods sold | | | 814,622 | | | 2,502,257 | | | 188,967 | | | (1,338,840) | | | 2,167,006 |
Gross profit | | | 161,848 | | | 208,510 | | | 16,650 | | | (27,169) | | | 359,839 |
Selling, general and administrative | | | 55,613 | | | 74,433 | | | 7,827 | | | (6,079) | | | 131,794 |
Operating income | | | 106,235 | | | 134,077 | | | 8,823 | | | (21,090) | | | 228,045 |
Interest expense, net of capitalized interest | | | 18,716 | | | 11,536 | | | 3,490 | | | (2,403) | | | 31,339 |
Other income, net | | | (5,394) | | | (1,574) | | | (196) | | | 2,619 | | | (4,545) |
Income before income taxes and | | | | | | | | | | | | | | | |
equity in net income of subsidiaries | | | 92,913 | | | 124,115 | | | 5,529 | | | (21,306) | | | 201,251 |
Income taxes | | | 23,625 | | | 29,965 | | | 128 | | | (5,075) | | | 48,643 |
| | | 69,288 | | | 94,150 | | | 5,401 | | | (16,231) | | | 152,608 |
Equity in net income of subsidiaries | | | 81,760 | | | - | | | - | | | (81,760) | | | - |
Net income attributable to noncontrolling interests | | | - | | | - | | | (1,560) | | | - | | | (1,560) |
Net income attributable to Steel Dynamics, Inc. | | $ | 151,048 | | $ | 94,150 | | $ | 3,841 | | $ | (97,991) | | $ | 151,048 |
17
Note 11. Condensed Consolidating Information (Continued)
| | | | | | | | | | | | | | | |
| | | | | | | | | | | | | | | |
For the three months ended, | | | | | | | | Combined | | Consolidating | | Total | |||
September 30, 2018 | | Parent | | Guarantors | | Non-Guarantors | | Adjustments | | Consolidated | |||||
Net sales | | $ | 1,304,801 | | $ | 3,540,381 | | $ | 144,145 | | $ | (1,765,780) | | $ | 3,223,547 |
Costs of goods sold | | | 956,735 | | | 3,163,110 | | | 142,005 | | | (1,724,384) | | | 2,537,466 |
Gross profit | | | 348,066 | | | 377,271 | | | 2,140 | | | (41,396) | | | 686,081 |
Selling, general and administrative | | | 78,824 | | | 78,694 | | | 2,974 | | | (5,983) | | | 154,509 |
Operating income (loss) | | | 269,242 | | | 298,577 | | | (834) | | | (35,413) | | | 531,572 |
Interest expense, net of capitalized interest | | | 18,559 | | | 12,489 | | | 3,134 | | | (2,622) | | | 31,560 |
Other income, net | | | (7,121) | | | (2,292) | | | (306) | | | 2,616 | | | (7,103) |
Income (loss) before income taxes and | | | | | | | | | | | | | | | |
equity in net income of subsidiaries | | | 257,804 | | | 288,380 | | | (3,662) | | | (35,407) | | | 507,115 |
Income taxes | | | 45,599 | | | 71,466 | | | 420 | | | (8,276) | | | 109,209 |
| | | 212,205 | | | 216,914 | | | (4,082) | | | (27,131) | | | 397,906 |
Equity in net income of subsidiaries | | | 186,170 | | | - | | | - | | | (186,170) | | | - |
Net loss attributable to noncontrolling interests | | | - | | | - | | | 469 | | | - | | | 469 |
Net income (loss) attributable to Steel Dynamics, Inc. | | $ | 398,375 | | $ | 216,914 | | $ | (3,613) | | $ | (213,301) | | $ | 398,375 |
| | | | | | | | | | | | | | | |
| | | | | | | | | | | | | | | |
For the nine months ended, | | | | | | | | Combined | | Consolidating | | Total | |||
September 30, 2019 | | Parent | | Guarantors | | Non-Guarantors | | Adjustments | | Consolidated | |||||
Net sales | | $ | 3,198,215 | | $ | 8,837,385 | | $ | 611,407 | | $ | (4,532,212) | | $ | 8,114,795 |
Costs of goods sold | | | 2,628,849 | | | 8,141,120 | | | 568,914 | | | (4,438,663) | | | 6,900,220 |
Gross profit | | | 569,366 | | | 696,265 | | | 42,493 | | | (93,549) | | | 1,214,575 |
Selling, general and administrative | | | 185,647 | | | 221,592 | | | 19,891 | | | (17,474) | | | 409,656 |
Operating income | | | 383,719 | | | 474,673 | | | 22,602 | | | (76,075) | | | 804,919 |
Interest expense, net of capitalized interest | | | 56,818 | | | 35,107 | | | 10,327 | | | (7,470) | | | 94,782 |
Other income, net | | | (17,752) | | | (4,746) | | | (753) | | | 8,114 | | | (15,137) |
Income before income taxes and | | | | | | | | | | | | | | | |
equity in net income of subsidiaries | | | 344,653 | | | 444,312 | | | 13,028 | | | (76,719) | | | 725,274 |
Income taxes | | | 81,422 | | | 107,384 | | | 495 | | | (18,208) | | | 171,093 |
| | | 263,231 | | | 336,928 | | | 12,533 | | | (58,511) | | | 554,181 |
Equity in net income of subsidiaries | | | 286,447 | | | - | | | - | | | (286,447) | | | - |
Net income attributable to noncontrolling interests | | | - | | | - | | | (4,503) | | | - | | | (4,503) |
Net income attributable to Steel Dynamics, Inc. | | $ | 549,678 | | $ | 336,928 | | $ | 8,030 | | $ | (344,958) | | $ | 549,678 |
| | | | | | | | | | | | | | | |
| | | | | | | | | | | | | | | |
For the nine months ended, | | | | | | | | Combined | | Consolidating | | Total | |||
September 30, 2018 | | Parent | | Guarantors | | Non-Guarantors | | Adjustments | | Consolidated | |||||
Net sales | | $ | 3,635,571 | | $ | 9,804,316 | | $ | 417,450 | | $ | (4,939,390) | | $ | 8,917,947 |
Costs of goods sold | | | 2,746,516 | | | 8,783,145 | | | 413,607 | | | (4,826,900) | | | 7,116,368 |
Gross profit | | | 889,055 | | | 1,021,171 | | | 3,843 | | | (112,490) | | | 1,801,579 |
Selling, general and administrative | | | 218,839 | | | 233,989 | | | 8,550 | | | (16,655) | | | 444,723 |
Operating income (loss) | | | 670,216 | | | 787,182 | | | (4,707) | | | (95,835) | | | 1,356,856 |
Interest expense, net of capitalized interest | | | 56,568 | | | 36,793 | | | 9,489 | | | (7,882) | | | 94,968 |
Other income, net | | | (18,299) | | | (5,612) | | | (565) | | | 7,875 | | | (16,601) |
Income (loss) before income taxes and | | | | | | | | | | | | | | | |
equity in net income of subsidiaries | | | 631,947 | | | 756,001 | | | (13,631) | | | (95,828) | | | 1,278,489 |
Income taxes | | | 127,083 | | | 187,794 | | | 530 | | | (22,871) | | | 292,536 |
| | | 504,864 | | | 568,207 | | | (14,161) | | | (72,957) | | | 985,953 |
Equity in net income of subsidiaries | | | 483,511 | | | - | | | - | | | (483,511) | | | - |
Net loss attributable to noncontrolling interests | | | - | | | - | | | 2,422 | | | - | | | 2,422 |
Net income (loss) attributable to Steel Dynamics, Inc. | | $ | 988,375 | | $ | 568,207 | | $ | (11,739) | | $ | (556,468) | | $ | 988,375 |
18
Note 11. Condensed Consolidating Information (Continued)
| | | | | | | | | | | | | | | |
Condensed Consolidating Statements of Cash Flows (in thousands) | | | | | | | | | | | | | |||
| | | | | | | | | | | | | | | |
For the nine months ended, | | | | | | | | Combined | | Consolidating | | Total | |||
September 30, 2019 | | Parent | | Guarantors | | Non-Guarantors | | Adjustments | | Consolidated | |||||
Net cash provided by operating activities | | $ | 368,148 | | $ | 624,223 | | $ | 18,893 | | $ | (24,036) | | $ | 987,228 |
Net cash used in investing activities | | | (116,470) | | | (78,193) | | | (7,740) | | | (25,114) | | | (227,517) |
Net cash provided by (used in) financing activities | | | 8,774 | | | (495,488) | | | (5,030) | | | 49,150 | | | (442,594) |
Increase in cash, cash equivalents and | | | | | | | | | | | | | | | |
restricted cash | | | 260,452 | | | 50,542 | | | 6,123 | | | - | | | 317,117 |
Cash, cash equivalents, and restricted cash | | | | | | | | | | | | | | | |
at beginning of period | | | 809,763 | | | 14,368 | | | 10,292 | | | - | | | 834,423 |
Cash, cash equivalents, and restricted cash | | | | | | | | | | | | | | | |
at end of period | | $ | 1,070,215 | | $ | 64,910 | | $ | 16,415 | | $ | - | | $ | 1,151,540 |
| | | | | | | | | | | | | | | |
| | | | | | | | | | | | | | | |
For the nine months ended, | | | | | | | | Combined | | Consolidating | | Total | |||
September 30, 2018 | | Parent | | Guarantors | | Non-Guarantors | | Adjustments | | Consolidated | |||||
Net cash provided by operating activities | | $ | 401,680 | | $ | 505,175 | | $ | 2,101 | | $ | 15,452 | | $ | 924,408 |
Net cash used in investing activities | | | (617,158) | | | (106,230) | | | (4,920) | | | 4,295 | | | (724,013) |
Net cash provided by (used in) financing activities | | | 77,165 | | | (405,499) | | | 2,740 | | | (19,747) | | | (345,341) |
Decrease in cash, cash equivalents and | | | (138,313) | | | (6,554) | | | (79) | | | - | | | (144,946) |
restricted cash | | | | | | | | | | | | | | | |
Cash, cash equivalents, and restricted cash | | | 1,002,230 | | | 20,748 | | | 12,107 | | | - | | | 1,035,085 |
at beginning of period | | | | | | | | | | | | | | | |
Cash, cash equivalents, and restricted cash | | | | | | | | | | | | | | | |
at end of period | | $ | 863,917 | | $ | 14,194 | | $ | 12,028 | | $ | - | | $ | 890,139 |
1914
ITEM 2. MANAGEMENT’S DISCUSSION AND ANALYSIS OF FINANCIAL CONDITION AND RESULTS OF OPERATIONS
Forward-Looking Statements
This report contains some predictive statements about future events, including statements related to conditions in domestic or global economies, conditions in the steel and recycled metals market places, Steel Dynamics’Dynamics' revenues, costs of purchased materials, future profitability and earnings, and the operation of new, existing or planned facilities. These statements, which we generally precede or accompany by such typical conditional words as "anticipate," "intend," "believe," "estimate," "plan," "seek,""anticipate", "intend", "believe", "estimate", "plan", "seek", "project", or "expect,""expect", or by the words "may," "will,""may", "will", or "should,""should", are intended to be made as “forward-looking,”"forward-looking", subject to many risks and uncertainties, within the safe harbor protections of the Private Securities Litigation Reform Act of 1995. These statements speak only as of this date and are based upon information and assumptions, which we consider reasonable as of this date, concerning our businesses and the environments in which they operate. Such predictive statements are not guarantees of future performance, and we undertake no duty to update or revise any such statements. Some factors that could cause such forward-looking statements to turn out differently than anticipated include: (1) the effects of uncertain economic conditions; (2) the effects of pandemics or other health issues, such as the recent novel coronavirus outbreak (COVID-19); (3) cyclical and changing industrial demand; (3)(4) changes in conditions in any of the steel or scrap-consuming sectors of the economy which affect demand for our products, including the strength of the non-residential and residential construction, automotive, manufacturing, appliance, pipe and tube,energy, and other steel-consuming industries; (4)(5) fluctuations in the cost of key raw materials and supplies (including steel scrap, iron units, zinc, graphite electrodes, and energy costs) and our ability to pass on any cost increases; (5)(6) the impact of domestic and foreign imports, including trade policy, restrictions, or agreements; (6)(7) unanticipated difficulties in integrating or starting up new, existingacquired or planned businesses or assets; (7)(8) risks and uncertainties involving product and/or technology development; and (8)(9) occurrences of unexpected plant outages or equipment failures.
More specifically, we refer you to our more detailed explanation of these and other factors and risks that may cause such predictive statements to turn out differently, as set forth in our most recent Annual Report on Form 10-K under the headings Special Note Regarding Forward-Looking Statements and Risk Factors for the year ended December 31, 2018,2019, in our quarterly reports on Form 10-Q, or in other reports which we from time to time file with the Securities and Exchange Commission. These reports are available publicly on the Securities and Exchange Commission website, www.sec.gov, and on our website, www.steeldynamics.com under “Investors – SEC Filings.”
Description of the Business
We are one of the largest domestic steel producers and metal recyclers in the United States based on current estimated annual steelmaking and coating capability and actual metals recycling volumes.volumes, with one of the most diversified, high-margin steel product portfolios. Our primary sourcesources of revenues isrevenue are from the manufacture and sale of steel products, the processing and sale of recycled ferrous and nonferrous metals, and the fabrication and sale of steel joists and deck products. We have three reportable segments: steel operations, metals recycling operations, and steel fabrication operations.
Operating Statement Classifications
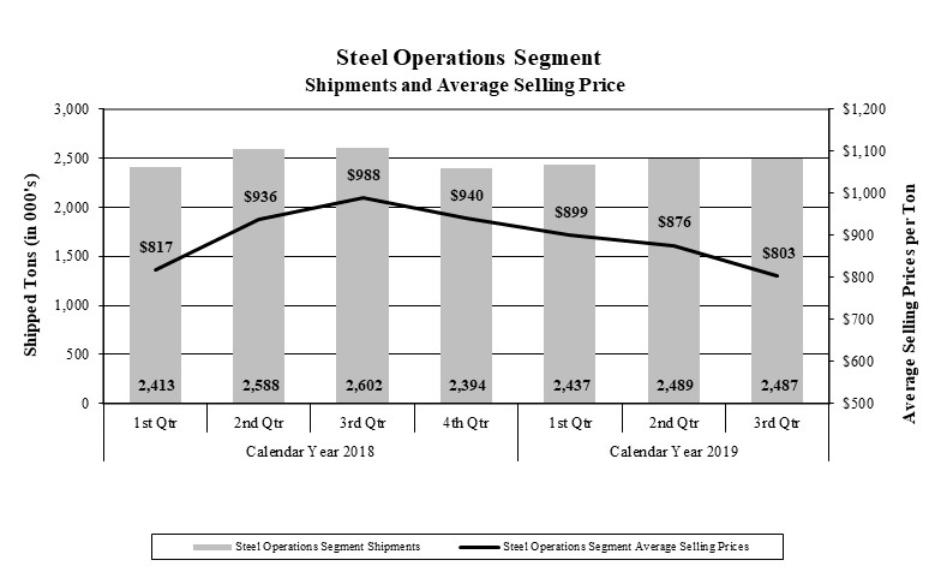
Net Sales. Net sales from our operations are a factor of volumes shipped, product mix and related pricing. We charge premium prices for certain grades of steel, product dimensions, certain smaller volumes, and for value-added processing or coating of our steel products. Except for the steel fabrication operations, we recognize revenues from sales and the allowance for estimated returns and claims from these sales at the point in time control of the product transfers to the customer, upon shipment or delivery. Our steel fabrication operations recognize revenues over time based on completed fabricated tons to date as a percentage of total tons required for each contract.
Costs of Goods Sold. Our costs of goods sold represent all direct and indirect costs associated with the manufacture of our products. The principal elements of these costs are scrap and scrap substitutes (which represent the most significant single component of our consolidated costs of goods sold), steel substrate, direct and indirect labor and related benefits, alloys, zinc, transportation and freight, repairs and maintenance, utilities such as electricity and natural gas, and depreciation.
Selling, General and Administrative Expenses. Selling, general and administrative expenses consist of all costs associated with our sales, finance and accounting, and administrative departments. These costs include, among other items, labor and related benefits, professional services, insurance premiums, and property taxes. Company-wide profit sharing and amortization of intangible assets are each separately presented in the statement of income.
Interest Expense, net of Capitalized Interest. Interest expense consists of interest associated with our senior credit facilities and other debt net of interest costs that are required to be capitalized during the construction period of certain capital investment projects.
15
Other (Income) Expense, (Income), net. Other income consists of interest income earned on our temporary cash deposits and short-term investments; any other non-operating income activity, including income from non-consolidated investments accounted for under the equity method. Other expense consists of any non-operating costs, such as certain acquisition and financing expenses.
Impact of COVID-19 on Our Business
In March 2020, the World Health Organization categorized the novel coronavirus (COVID-19) as a pandemic, and since that time, efforts to slow the contagion have impacted global economies. Countries, including the United States, issued “shelter in place” orders, temporarily closing non-essential businesses and restricting social interactions in an effort to slow the spread of COVID-19.
Due to use of steel in the broad infrastructure and defense framework of the United States, our business operations are designated “essential” as part of the critical infrastructure of the states where we operate. As a result, all of our locations continued to operate during the first half of 2020 and continue to operate.
Our teams are our most valued priority, and we have implemented numerous additional process and procedural initiatives to ensure the health and safety of our people, their families, and our communities. We have adjusted schedules to support social distancing, provided additional and more frequent sanitizing applications, provided additional protective measures, and many other items.
While the economic impact of COVID-19 negatively impacted our results of operations during the second quarter of 2020, we are unable to specifically quantify that impact or predict the ultimate impact it may have on our business, financial condition, results of operations, or cash flow for the remainder of 2020. The extent to which our operations may continue to be impacted by COVID-19 will depend on future developments, which are highly uncertain and cannot be accurately predicted, including the possibility of a resurgence or further spread of the virus. In addition, the duration of the pandemic and its eventual impact on world economies is not known or estimable. The COVID-19 pandemic significantly reduced the supply of scrap and the demand for some of our steel products during the second quarter 2020, and its continuation could continue to have similar impact. Certain of our suppliers and customers, such as those in the automotive, energy, and related industries, have experienced, and could further experience, temporary shutdowns or significant demand reductions. Reduced demand for our products or lack of ferrous scrap raw material supply due to shutdowns or slowdowns in manufacturing businesses could adversely affect our volumes, selling prices, and margins. However, our low, highly variable cost structure, our diversified value-added product offerings, and our downstream manufacturing businesses which are able to provide base-load “pull-through” volume for our steel operations, support our continued cash flow prospects.
Results Overview
Our consolidated results for the second quarter of 2020 were negatively impacted by the COVID-19 pandemic from the related temporary closures of numerous domestic steel consuming businesses. Domestic steel demand lagged during the second quarter 2020, driving lower steel shipments and selling values, as well as significantly lower scrap flows for our metals recycling operations. The non-residential construction market remained resilient, with construction activity largely intact during the quarter, resulting in steady second quarter 2020 shipments and selling prices for our fabrication operations compared to second quarter 2019.
Consolidated operating income decreased $126.2 million, or 44%, to $158.9 million for the second quarter 2020, compared to the second quarter 2019. Second quarter 2020 net income attributable to Steel Dynamics, Inc. decreased $118.8 million, or 61%, to $75.5 million, compared to the second quarter 2019, consistent with the decreased operating income, and due to the additional expenses and interest associated with our June 2020 refinancing of senior notes.
Consolidated operating income decreased $144.3 million, or 25%, to $432.5 million for the first half of 2020, compared to the first half of 2019. First half 2020 net income attributable to Steel Dynamics, Inc. decreased $135.8 million, or 34%, to $262.8 million, compared to the first half of 2019, consistent with the decreased operating income, and due to the additional expenses and interest associated with our June 2020 refinancing of senior notes.
2016
Acquisition of United Steel Supply, LLC
On March 1, 2019, we purchased 75% of the equity interest of United Steel Supply, LLC (USS) for cash consideration of $93.4 million, plus a customary working capital transaction purchase price adjustment of $3.7 million in September 2019. Additionally, we have an option to purchase, and the sellers have the option to require us to purchase, the remaining 25% equity interest of USS in the future. Headquartered in Austin, Texas, USS is a leading distributor of painted Galvalume® flat roll steel used for roofing and siding applications, with distribution centers strategically located in Mississippi, Indiana, Arkansas, and Oregon. USS provides us a new, complementary distribution channel and connects us to a rapidly growing industry segment with customers that do not traditionally purchase steel directly from a steel producer. USS’s operating results from and after March 1, 2019, are reflected in our financial statements in the steel operations reporting segment.
Results Overview
Our consolidated results for the third quarter of 2019 continued to be constrained by a challenging steel pricing environment, as well as sharply falling scrap prices. While underlying domestic steel demand remained intact, customers continued to be hesitant to place orders in a falling price environment, resulting in inventory destocking, in conjunction with further weakening scrap prices. Likewise, our metals recycling operations experienced decreased operating income in the third quarter of 2019 compared to 2018, due to the continued downward ferrous scrap pricing environment and resulting slower scrap flows, as well as lower copper and aluminum pricing. The non-residential construction market remained strong, with our fabrication operations metal margins expanding due to increased average selling prices coupled with decreased steel input costs.
Consolidated operating income decreased $303.5 million, or 57%, to $228.0 million for the third quarter 2019, compared to the record levels in the third quarter 2018. Third quarter 2019 net income attributable to Steel Dynamics, Inc. decreased $247.3 million, or 62%, to $151.0 million, compared to the third quarter 2018, consistent with the decreased operating income.
Consolidated operating income decreased $551.9 million, or 41%, to $804.9 million for the first nine months of 2019, compared to the record levels in the first nine months of 2018. First nine months 2019 net income attributable to Steel Dynamics, Inc. decreased $438.7 million, or 44%, to $549.7 million, compared to the first nine months of 2018, consistent with the decreased operating income.
Segment Operating Results 20192020 vs. 20182019 (dollars in thousands)
| | | | | | | | | | | | | | | | | | | | | | | | | | | | |||
| | | | | | | | | | | | | | | | | | | | | | | | | | | | |||
| Three Months Ended September 30, | | Nine Months Ended September 30, | Three Months Ended June 30, | | Six Months Ended June 30, | ||||||||||||||||||||||||
| 2019 | | % Change | | | 2018 | | 2019 | | % Change | | 2018 | 2020 | | % Change | | | 2019 | | 2020 | | % Change | | 2019 | ||||||
Net sales: | | | | | | | | | | | | | | | | | | | | | | | | | | | | |||
Steel Operations Segment | $ | 2,008,205 | | (22)% | | $ | 2,586,626 | | $ | 6,396,555 | | (9)% | | $ | 7,004,088 | $ | 1,699,398 | | (22)% | | $ | 2,188,185 | | $ | 3,715,550 | | (15)% | | $ | 4,388,350 |
Metals Recycling Operations Segment | | 574,908 | | (28)% | | | 800,014 | | | 1,968,719 | | (19)% | | | 2,436,875 | | 416,688 | | (37)% | | | 656,766 | | | 1,045,427 | | (25)% | | | 1,393,811 |
Steel Fabrication Operations Segment | | 246,716 | | (2)% | | | 250,745 | | | 716,809 | | 7% | | | 670,344 | | 218,428 | | (10)% | | | 241,424 | | | 439,869 | | (6)% | | | 470,093 |
Other | | 77,430 | | (31)% | | | 111,953 | | | 290,688 | | (11)% | | | 327,651 | | 94,445 | | (5)% | | | 99,762 | | | 215,135 | | 1% | | | 213,258 |
| | 2,907,259 | | | | 3,749,338 | | | 9,372,771 | | | | | 10,438,958 | | 2,428,959 | | | | 3,186,137 | | | 5,415,981 | | | | 6,465,512 | |||
Intra-company | | (380,414) | | | | | (525,791) | | | (1,257,976) | | | | | (1,521,011) | | (334,654) | | | | | (415,622) | | | (746,576) | | | | | (877,562) |
| $ | 2,526,845 | | (22)% | | $ | 3,223,547 | | $ | 8,114,795 | | (9)% | | $ | 8,917,947 | $ | 2,094,305 | | (24)% | | $ | 2,770,515 | | $ | 4,669,405 | | (16)% | | $ | 5,587,950 |
| | | | | | | | | | | | | | | | | | | | | | | | | | | | | | |
Operating income (loss): | | | | | | | | | | | | | | | | | | | | | | | | | | | | |||
Steel Operations Segment | $ | 234,683 | | (59)% | | $ | 573,848 | | $ | 835,172 | | (42)% | | $ | 1,441,904 | $ | 168,043 | | (42)% | | $ | 291,411 | | $ | 456,437 | | (24)% | | $ | 600,489 |
Metals Recycling Operations Segment | | (101) | | (101)% | | | 14,674 | | | 24,480 | | (61)% | | | 62,027 | | (8,715) | | (214)% | | | 7,619 | | | (3,187) | | (113)% | | | 24,581 |
Steel Fabrication Operations Segment | | 35,280 | | 169% | | | 13,104 | | | 86,567 | | 84% | | | 47,039 | | 27,155 | | (11)% | | | 30,664 | | | 56,318 | | 10% | | | 51,287 |
Other | | (42,441) | | 37% | | | (67,113) | | | (148,514) | | 20% | | | (186,137) | | (32,089) | | 35% | | | (49,153) | | | (78,444) | | 26% | | | (106,073) |
| | 227,421 | | | | 534,513 | | | 797,705 | | | | | 1,364,833 | | 154,394 | | | | 280,541 | | | 431,124 | | | | 570,284 | |||
Intra-company | | 624 | | | | | (2,941) | | | 7,214 | | | | | (7,977) | | 4,456 | | | | | 4,491 | | | 1,412 | | | | | 6,590 |
| $ | 228,045 | | (57)% | | $ | 531,572 | | $ | 804,919 | | (41)% | | $ | 1,356,856 | $ | 158,850 | | (44)% | | $ | 285,032 | | $ | 432,536 | | (25)% | | $ | 576,874 |
21
Steel Operations Segment |
Steel operations consist of our six electric arc furnace steel mills, producing sheet and long products steel from ferrous scrap and scrap substitutes, utilizing continuous casting and automated rolling mills, with numerous value-added downstream processing and coating lines, as well as IDI, our liquid pig iron production facility that solely supplies solely theour Butler Flat Roll Division. Our steel operations sell a diverse portfolio of value-added sheet and long products directly to end-users, steel fabricators, and service centers. These products are used in a wide variety of industry sectors,industries, including the construction, automotive, manufacturing, transportation, heavy equipment, and agriculture, and pipe and tube (including OCTG)energy markets. Steel operations accounted for 76%78% and 77%76% of our consolidated external net sales during the third quarterssecond quarter of 20192020 and 2018,2019, respectively, and 76% and 75% during the first nine monthshalf of 20192020 and 2018, respectively.2019.
Steel Operations Segment Shipments (tons):
| | | | | | | | | | | | | | | | | | | | | | |
| | | | | | | | | | | | | | | | | | | | | | |
| Three Months Ended September 30, | | Nine Months Ended September 30, | Three Months Ended June 30, | | Six Months Ended June 30, | ||||||||||||||||
| 2019 | | % Change | | 2018 | | 2019 | | % Change | | 2018 | 2020 | | % Change | | 2019 | | 2020 | | % Change | | 2019 |
| | | | | | | | | | | | | | | | | | | | | | |
Total shipments | 2,711,909 | | (2)% | | 2,756,920 | | 8,165,678 | | 2% | | 8,025,500 | 2,518,019 | | (9)% | | 2,769,358 | | 5,365,201 | | (2)% | | 5,453,769 |
Intra-segment shipments | (225,399) | | | | (154,837) | | (752,826) | | | | (422,488) | (257,219) | | | | (280,024) | | (510,696) | | | | (527,427) |
Steel Operations Segment shipments | 2,486,510 | | (4)% | | 2,602,083 | | 7,412,852 | | (3)% | | 7,603,012 | 2,260,800 | | (9)% | | 2,489,334 | | 4,854,505 | | (1)% | | 4,926,342 |
| | | | | | | | | | | | | | | | | | | | | | |
External shipments | 2,362,915 | | (5)% | | 2,489,133 | | 7,096,975 | | (3)% | | 7,296,871 | 2,152,856 | | (10)% | | 2,386,851 | | 4,648,020 | | (2)% | | 4,734,060 |
2217
Steel Operations Segment Results 20192020 vs. 20182019
Overall domesticThe COVID-19 pandemic negatively impacted our steel operations during the second quarter of 2020. The temporary closure of numerous steel consuming businesses such as automotive manufacturers and the related supply change drove lower selling prices and shipments, particularly for sheet steel products. Conversely, construction related steel demand remained steady during the third quarter of 2019, with continued strength in the automotive, construction and other industrial sectors.steady. However, a challenging steel pricing environment has continued throughout 2019, due to customer inventory destocking in conjunction with weakening scrap prices, which has led to decreasing steel selling prices compared to 2018. Steel operations segment shipments decreased 4%only 9% in the thirdsecond quarter 2019,2020, as compared to the same period in 2018.2019, and decreased only 12% from record first quarter 2020. Second quarter 2020 average selling prices decreased 14%, or $125 per ton, compared to 2019, reflecting the decreased steel demand during the quarter. Net sales for the steel operations decreased 22% in the thirdsecond quarter 20192020 when compared to the same period in 2018,2019, due primarily to decreases in shipments and overall steel selling prices, particularly in the sheet products, and decreased steel mill shipments.prices. Net sales for the steel operations decreased 9%15% in the first nine monthshalf of 20192020 when compared to the same period in 2018, again2019, due to decreasesthe decrease in steel demand due to the COVID-19 pandemic, negatively impacting both steel shipments and average steel selling prices, and steel segment shipments.primarily in the second quarter of 2020.
Metallic raw materials used in our electric arc furnaces represent our single most significant steel manufacturing cost, generally comprising approximately 50 to 60 percent60% of our steel mill operations’ manufacturing costs. Our metallic raw material cost per net ton consumed in our steel operations decreased $77,$50, or 22%16%, in the thirdsecond quarter 2019,2020, compared to the same period in 2018,2019, consistent with overall decreased domestic scrap pricing. In the first nine monthshalf of 2019,2020, our metallic raw material cost per ton decreased $31,$61, or 9%18% compared to the same period in 2018.2019.
As a result of average selling prices decreasing more than scrap costs, metal spread (which we define as the difference between average steel mill selling prices and the cost of ferrous scrap consumed in our steel mills) decreased 20%13% in the thirdsecond quarter 20192020 compared to the thirdsecond quarter 2018.2019. Due to this metal spread contraction, most notablycoupled with the decrease in sheet steel,shipments, operating income for the steel operations decreased 59%42%, to $234.7$168.0 million, in the thirdsecond quarter 2019,2020, compared to the record levels in the same period in 2018.2019. First nine months 2019half 2020 operating income decreased 42%24%, to $835.2$456.4 million, compared to the first nine monthshalf of 2018 record levels, again2019, due primarily to decreased metal spreads and to a lesser extent steel segment shipments.shipping volumes, which decreased only 2%.
Metals Recycling Operations Segment |
Metals recycling operations consists solelyconsist of OmniSource and includes bothour ferrous and nonferrous scrap metal processing, transportation, marketing, and brokerage services, strategically located primarily in close proximity to our steel mills and other end-user scrap consumers throughout largely the eastern half of the United States. In addition, OmniSourceour metals recycling operations designs, installs, and manages customized scrap management programs for industrial manufacturing companies at hundreds of locations throughout North America. Our steel mills utilize a large portion (approximately 65%) of the ferrous scrap sold by OmniSourceour metals recycling operations as raw material in our steelmaking operations,
18
and the remainder is sold to other consumers, such as other steel manufacturers and foundries. In the second quarter 2020, 75% of the metals recycling operations ferrous scrap was sold to our own steel mills, as scrap flow slowed and our steel mills were able to maintain 79% utilization compared to 55% estimated domestic steel mill utilization. Our metals recycling operations accounted for 11%7% and 12% of our consolidated external net sales during the third quarterssecond quarter of 20192020 and 2018,2019, respectively, and 12%10% and 14%12% during the first nine monthshalf of 20192020 and 2018,2019, respectively.
Metals Recycling Operations Segment Shipments:
| | | | | | | | | | | | | | | | | | | | | | |
| | | | | | | | | | | | | | | | | | | | | | |
| Three Months Ended September 30, | | Nine Months Ended September 30, | Three Months Ended June 30, | | Six Months Ended June 30, | ||||||||||||||||
| 2019 | | % Change | | 2018 | | 2019 | | % Change | | 2018 | 2020 | | % Change | | 2019 | | 2020 | | % Change | | 2019 |
Ferrous metal (gross tons) | | | | | | | | | | | | | | | | | | | | | | |
Total | 1,169,963 | | (10)% | | 1,304,164 | | 3,531,003 | | (10)% | | 3,908,079 | 802,070 | | (33)% | | 1,189,679 | | 1,994,214 | | (16)% | | 2,361,040 |
Inter-company | (773,828) | | (8)% | | (844,802) | | (2,326,550) | | (9)% | | (2,545,602) | (604,100) | | (21)% | | (764,202) | | (1,402,593) | | (10)% | | (1,552,722) |
External shipments | 396,135 | | (14)% | | 459,362 | | 1,204,453 | | (12)% | | 1,362,477 | 197,970 | | (53)% | | 425,477 | | 591,621 | | (27)% | | 808,318 |
| | | | | | | | | | | | | | | | | | | | | | |
Nonferrous metals (thousands of pounds) | | | | | | | | | | | | | | | | | | | | | | |
Total | 257,087 | | (7)% | | 277,332 | | 815,347 | | (4)% | | 852,994 | 166,914 | | (37)% | | 266,222 | | 438,992 | | (21)% | | 558,260 |
Inter-company | (31,419) | | | | (38,287) | | (105,198) | | | | (99,448) | (39,540) | | | | (34,671) | | (80,218) | | | | (73,779) |
External shipments | 225,668 | | (6)% | | 239,045 | | 710,149 | | (6)% | | 753,546 | 127,374 | | (45)% | | 231,551 | | 358,774 | | (26)% | | 484,481 |
Metals Recycling Operations Segment Results 20192020 vs. 20182019
Our metals recycling operations have beenwere also negatively impacted during 2019the second quarter of 2020 by consistently fallingthe COVID-19 pandemic. Decreased manufacturing activity during the quarter, primarily temporary closures of domestic automotive manufacturers and their related supply chain, resulted in reduced scrap flows. In addition, domestic steel mill utilization rates declined significantly, resulting in decreased ferrous and nonferrous scrap prices compared to 2018, as well as a somewhat softer steel market as customers were reluctant to purchase during a falling pricing environment, opting instead to defer purchases.demand. Net sales decreased 28%37% during the thirdsecond quarter of 20192020 compared to the same period in 2018,2019, driven primarily by the combination of decreased shipments and average selling prices.shipments. Ferrous shipments to our own steel mills decreased by 8%21% in the thirdsecond quarter 2019,2020, compared to the same period in 2018,2019, as our quarterly steel mill utilization percentage decreased from 98%89% to 87%79% year over year. Ferrous scrap average selling prices decreased 26%3% during the thirdsecond quarter 20192020 compared to the same period in 2018,2019, while average nonferrous average sellingscrap prices decreased 13%increased 7%. Ferrous metal spread (which we define as the difference
23
between average selling prices and the cost of purchased scrap) decreased 14%however increased 28%, as selling prices decreased moreless than unprocessed scrap procurement costs, while nonferrous metal spread decreased 8%21%. Metals recycling operations operating income decreased 101%214% to a loss of $100,000$8.7 million in the thirdsecond quarter 20192020 compared to the thirdsecond quarter 20182019 operating income of $14.7$7.6 million, due primarily to decreasedthe decrease in ferrous and nonferrous shipments and metal spread contraction.shipments.
Net sales for our metals recycling operations decreased 19%25% in the first nine monthshalf of 20192020 as compared to the same period in 2018,2019, driven by decreased pricingshipments and shipments.pricing. Ferrous scrap average selling prices decreased 16%6% during the first nine monthshalf of 20192020 compared to the same period in 2018,2019, while nonferrous average selling prices decreased 7%3%. Nonferrous metal spread decreased 2%24%, while ferrous metal spread decreased 12%increased 9% in the first nine monthshalf of 20192020 compared to the first nine monthshalf of 2018.2019. Metals recycling operations operating incomeloss in the first nine monthshalf of 20192020 of $24.5$3.2 million decreased 61%113% from the same period 2018first half of 2019 operating income of $62.0$24.6 million, due primarily to decreased ferrous and nonferrous shipments, and metal spread contraction.most notably in the second quarter 2020.
Steel Fabrication Operations Segment |
Steel fabrication operations include our New Millennium Building Systems joist and deck plants located throughout the United States and in Northern Mexico. Revenues from these plants are generated from the fabrication of steel joists, trusses, girders and steel deck used within the non-residentialnon-
19
residential construction industry. Steel fabrication operations accounted for 10% and 8%9% of our consolidated external net sales during the third quarterssecond quarter of 20192020 and 2018,2019, respectively, and 9% and 8% during the first nine monthshalf of 20192020 and 2018,2019, respectively.
Steel Fabrication Operations Segment Results 20192020 vs. 20182019
Net sales for the steel fabrication operations decreased 2%,10% during the thirdsecond quarter 20192020 compared to the same period in 2018,2019, as average selling prices were steady,decreased 11%, or $174 per ton, while shipments decreased slightly.increased 2%. Net sales for the segment increased $46.5 million, or 7%,decreased 6% during the first nine monthshalf of 2019,2020, compared to the same period in 2018,2019, as shipments decreased 2%increased 7%, whileand average selling prices increased $125decreased 13%, or $196 per ton, or 9%.ton. Our steel fabrication operations continue to leverage our national operating footprint to sustain market share.footprint. Market demand, orders and orders continuebacklog continued to be strong forin the second quarter 2020, indicating resilience of the non-residential construction project development; however, wet weathermarket during the first half of 2019 and other construction delays have somewhat restricted shipments in 2019 compared to 2018.COVID-19 pandemic.
24
The purchase of various steel products is the largest single cost of production for our steel fabrication operations, generally representing approximately two-thirds of the total cost of manufacturing. The average cost of steel consumed decreased 19%16% in the thirdsecond quarter 2019,2020, as compared to the same period in 2018.2019. As a result of steel costs decreasing less than selling prices per ton, metal spread (which we define as the difference between average selling prices and the cost of purchased steel) increased 35%decreased 5% in the thirdsecond quarter 20192020 compared to the same period in 2018. Operating2019, and operating income increased 169%decreased 11% to $35.3$27.2 million in the thirdsecond quarter 20192020 compared to the same period in 2018, due to the increase in metal spread.2019. For the first nine monthshalf of 2019,2020, operating income increased 84%10% to $86.6$56.3 million compared to the first nine monthshalf of 2018, due to2019, as increased average selling prices and decreased steel cost, asshipments more than offset the 2% decrease in metal spread increased 23% period over period.spread.
|
Other Operations |
ThirdSecond Quarter Consolidated Results 20192020 vs. 20182019
Selling, General and Administrative Expenses. Selling, general and administrative expenses of $107.2$109.3 million during the thirdsecond quarter 2019 increased 5% from $102.62020 were comparable to the $106.3 million during the thirdsecond quarter 2018,2019, representing 4.2%5% and 3.2%4% of net sales during each period, respectively. Profit sharing expense during the thirdsecond quarter of 20192020 of $17.8$9.1 million was down 61%60% from the $45.3$22.9 million during the same period in 2018, consistent with decreases2019. The company-wide profit sharing plan represents 8% of pretax earnings; therefore, our lower second quarter 2020 earnings resulted in pretax income from record levels in 2018.lower profit sharing.
Interest Expense, net of Capitalized Interest. During the thirdsecond quarter 2019,2020, interest expense of $31.3$27.7 million was comparable to the $31.6decreased 14% from $32.3 million during the thirdsecond quarter of 2018, on consistent debt levels.2019, due to increased capitalized interest in 2020 in conjunction with our new flat roll steel mill currently under construction in Sinton, Texas.
20
Income Tax Expense. ThirdSecond quarter 20192020 income tax expense of $48.6$24.3 million, at an effective income tax rate of 24.2%23.6%, was down 55%60% from the $109.2$60.2 million, at an effective income tax rate of 21.5%23.4%, during the thirdsecond quarter 2018,2019, consistent with decreased pretax income. The third quarter 2018 effective tax rate was lower than the third quarter 2019 effective tax rate due to certain discrete tax benefit items realized in the third quarter 2018.income before income taxes.
First NineSix Months Consolidated Results 20192020 vs. 20182019
Selling, General and Administrative Expenses. Selling, general and administrative expenses of $324.5$222.2 million during the first nine monthshalf of 2019 increased 5% from $310.02020 were comparable to the $217.3 million during the first nine monthshalf of 2018,2019, representing 4.0%5% and 3.5%4% of net sales, respectively. Profit sharing expense during the first nine monthshalf of 20192020 of $64.4$30.5 million decreased 44%34% from the $114.3$46.5 million during the same period in 2018, consistent with decreases2019. The company-wide profit sharing plan represents 8% of pretax earnings; therefore our lower first half 2020 earnings resulted in pretax income from record levels in 2018.
lower profit sharing.
Interest Expense, net of Capitalized Interest. During the first nine monthshalf of 2019 and 2018,2020, interest expense of $94.8$55.7 million was comparable to the $95.0decreased 12% from $63.4 million during the same periodfirst half of 2019 due to increased capitalized interest in 2018, on consistent debt levels.2020 in conjunction with our new electric arc furnace flat roll steel mill currently under construction in Sinton, Texas.
Income Tax Expense. First nine months 2019half 2020 income tax expense of $171.1$81.7 million, at an effective income tax rate of 23.6%23.3%, was down 42%33% from the $292.5$122.5 million, at an effective income tax rate of 22.9%23.4%, during the first nine monthshalf of 2018,2019, consistent with decreased pretax income.income before income taxes.
Liquidity and Capital Resources
Capital Resources and Long-term Debt. Our business is capital intensive and requires substantial expenditures for, among other things, the purchase and maintenance of equipment used in our steel, metals recycling, and steel fabrication operations, and to remain in compliance with environmental laws. Our short-term and long-term liquidity needs arise primarily from working capital requirements, capital expenditures, currently including those related to our flat roll steel mill under construction in Sinton, Texas, principal and interest payments related to our outstanding indebtedness (no significant principal payments until 2024), dividends to our shareholders, potential stock repurchases, and acquisitions. We have met these liquidity requirements primarily with cash provided by operations and long-term borrowings, and we also have availability under our unsecured Revolver. Our liquidity at SeptemberJune 30, 2019,2020, is as follows (in thousands):
| | | | | | | | | |
| | | | | | | | | |
| | | Cash and equivalents | | $ | 1,146,007 | | | |
| | | Short-term investments | | | 69,529 | | | |
| | | Revolver availability | | | 1,158,128 | | | |
| | | Total liquidity | | $ | 2,373,664 | | | |
25
In October 2019, our corporate credit rating was upgraded to an investment grade credit level by all three credit rating agencies.
| | | | | | | | | |
| | | | | | | | | |
��� | | | Cash and equivalents | | $ | 1,496,458 | | | |
| | | Short-term investments | | | 69,546 | | | |
| | | Revolver availability | | | 1,188,191 | | | |
| | | Total liquidity | | $ | 2,754,195 | | | |
Our total outstanding debt increased $60.7decreased $23.7 million during the first nine monthshalf of 20192020, primarily due to repayment of revolving debt assumed in conjunction withat two of our acquisition of USS.consolidated joint ventures. Our total long-term debt to capitalization ratio (representing our long-term debt, including current maturities, divided by the sum of our long-term debt, redeemable noncontrolling interests, and our total stockholders’ equity) was 37.6%39.6% and 37.9%40.2% at SeptemberJune 30, 2019,2020, and December 31, 2018,2019, respectively.
In June 2020, we issued $400.0 million of 2.400% notes due 2025 and $500.0 million of 3.250% notes due 2031. The net proceeds from these notes were used to fund the June 2020 call and redemption of the $400.0 million outstanding principal amount of the company’s 5.250% senior notes due 2023 and the $500.0 million outstanding principal amount of the company’s 5.500% senior notes due 2024. We recorded expenses related to premiums, write off of unamortized debt issuance costs, and other expenses of approximately $22.8 million, which are reflected in other expenses in the consolidated statements of income for the second quarter and first half 2020.
Our unsecured credit agreement has a senior securedunsecured revolving credit facility (Facility), which provides a $1.2 billion unsecured Revolver, and matures in June 2023.December 2024. Subject to certain conditions, we have the opportunity to increase the RevolverFacility size by at least $750.0$500.0 million. The Facility is guaranteed by certain of our subsidiaries. The Facility is secured by substantially all of our and our wholly-owned subsidiaries’ receivables and inventories, and by pledges of all shares of our wholly-owned subsidiaries’ capital stock or other equity interests, and intercompany debt held by us as collateral. Subsequent to our corporate credit rating upgrade, we began the process to release the collateral securing the Facility, which we expect to be released on or about November 12, 2019. Theunsecured Revolver is available to fund working capital, capital expenditures, and other general corporate purposes. The Facility contains financial covenants and other covenants pertaining to our ability (which may under certain circumstances be limited) to make capital expenditures; incur indebtedness;indebtedness and permit liens on property; enter into transactions with affiliates; make restricted payments or investments; enter into mergers, acquisitions or consolidations; conduct asset sales; pay dividends or distributions, or enter into other specified transactions and activities.property. Our ability to borrow funds within the terms of the unsecured Revolver is dependent upon our continued compliance with the financial and other covenants. At SeptemberJune 30, 2019,2020, we had $1.2 billion of availability on the Revolver, $41.9$11.8 million of outstanding letters of credit and other obligations which reduce availability, and there were no borrowings outstanding.
21
The financial covenants under our Facility state that we must maintain an interest coverage ratio of not less than 2.50:1.00. Our interest coverage ratio is calculated by dividing our last-twelve-months (LTM) consolidated adjusted EBITDA (earnings before interest, taxes, depreciation, amortization, and certain other non-cash transactions as allowed in the Facility) by our LTM gross interest expense, less amortization of financing fees. In addition, a net debt (as defined in the Facility) to LTM consolidated adjusted EBITDA (net debt leverage ratio)capitalization ratio of not more than 5.00:0.60:1.00 must be maintained. If the net debt leverage ratio exceeds 3.50:1:00 at any time, our ability to make certain payments as defined in the Facility (which includes cash dividends to stockholders and share purchases, among other things), is limited. At SeptemberJune 30, 2019,2020, our interest coverage ratio and net debt leverageto capitalization ratio were 12.22:9.45:1.00 and 1.20:0.40:1.00, respectively. We were, therefore, in compliance with these covenants at SeptemberJune 30, 2019,2020, and we anticipate we will continue to be in compliance during the next twelve months.
Working Capital. We generated cash flow from operations of $987.2$697.3 million in the first nine monthshalf of 2019.2020 compared to $543.0 million in the comparable 2019 period. Operational working capital (representing amounts invested in trade receivables and inventories, less current liabilities other than income taxes payable and debt) decreased $124.9$223.7 million, excluding the effect of acquired USS working capital, to $1.85$1.4 billion at SeptemberJune 30, 2019,2020, due primarily to decreased inventories and increased accounts receivable and inventories consistent with decreased sales and inventory costs.payable, generating operating cash flows during the first half of 2020.
Capital Investments. During the first nine monthshalf of 2019,2020, we invested $293.7$527.3 million in property, plant and equipment, primarily within our steel operations segment, compared with $176.5$139.6 million invested during the same period in 2018.2019. The increase in the first nine monthshalf of 20192020 versus the same 2018 period in 2019 relates primarily to theour new Sinton, Texas flat roll steel mill project.under construction in Sinton, Texas. We entered 2020 with sufficient liquidity of $2.8 billion to provide for our planned 2020 capital requirements, including those necessary to construct the Sinton steel mill. For the remainder of 2020, we are planning for capital investments to be roughly between $800 million and $850 million, of which the new flat roll steel mill in Sinton, Texas, represents approximately $700 million to $750 million.
Cash Dividends. As a reflection of continued confidence in our current and future cash flow generation ability and financial position, we increased our quarterly cash dividend by 28%4% to $0.2400$0.25 per share in the first quarter 20192020 (from $0.1875$0.24 per share in 2018)2019), resulting in declared cash dividends of $158.0$105.1 million during the first nine monthshalf of 2019,2020, compared to $132.1$106.3 million during the same period in 2018.2019. The decrease in declared cash dividends period over period was due to stock repurchases which took place throughout 2019 and into the first quarter of 2020, reducing our common stock shares outstanding. We paid cash dividends of $148.5$104.1 million and $125.1$95.7 million during the first nine monthshalf of 20192020 and 2018,2019, respectively. Our board of directors, along with executive management, approves the payment of dividends on a quarterly basis. The determination to pay cash dividends in the future is at the discretion of our board of directors, after taking into account various factors, including our financial condition, results of operations, outstanding indebtedness, current and anticipated cash needs and growth plans. In addition, the terms of our Facility and the indentures relating to our senior notes may restrict the amount of cash dividends we can pay.
Other. In August 2018, our board of directors authorized a share repurchase program of up to $750 million of our common stock. In February 2020, our board authorized an additional share repurchase program of up to $500 million. Under the share repurchase program,programs, purchases will take place, as and when, we determine in open market or private transactions made based upon the market price of our common stock, the nature of other investment opportunities or growth projects, our cash flows from operations, and general economic conditions. The share repurchase program doesprograms do not require us to acquire any specific number of shares, and may be modified, suspended, extended or terminated by us at any time. We acquired 4.14.4 million shares of our common stock for $115.0 million in the third quarter of 2019 pursuant to this program. We acquired 9.5 million shares of our common stock for $292.4$106.5 million in the first nine monthshalf of 2019,2020, all within the first quarter, fully expending the remaining purchases available under the 2018 program, leaving $106.8$444.0 million remaining available to purchase under the 2020 program. See Part II, Item 2. Unregistered Sales of Equity Securities and Use of Proceeds for additional information.
26
Our ability to meet our debt service obligations and reduce our total debt will depend upon our future performance which, in turn, will depend upon general economic, financial, business and businessthe ongoing COVID-19 pandemic conditions, along with competition, legislation and regulatory factors that are largely beyond our control. In addition, we cannot assure that our operating results, cash flows, access to credit markets and capital resources will be sufficient for repayment of our indebtedness in the future. We believe that based upon current levels of operations and anticipated growth, cash flows from operations, together with other available sources of funds, including if necessary borrowings under our Revolver, through its term,if necessary, will be adequate for the next twelve months for making required payments of principal and interest on our indebtedness, funding working capital requirements, and anticipated capital expenditures noted above.
ITEM 3. QUANTITATIVE AND QUALITATIVE DISCLOSURES ABOUT MARKET RISK
Commodity Risk
In the normal course of business, we are exposed to the market risk and price fluctuations related to the sale of our products and to the purchase of raw materials used in our operations, such as metallic raw materials, electricity, natural gas and its transportation services, fuel, air products, zinc, and electrodes. Our risk strategy associated with product sales has generally been to obtain competitive prices for our products and to allow operating results to reflect market price movements dictated by supply and demand.
Our risk strategy associated with the purchase of raw materials utilized within our operations has generally been to make some commitments with suppliers relating to future expected requirements for some commodities such as electricity, water, natural gas and
22
its transportation services, fuel, air products, zinc, and electrodes. Certain of these commitments contain provisions which require us to “take or pay” for specified quantities without regard to actual usage for periods of generally up to 5 years for physical commodity requirements and commodity transportation requirements, with some extending beyond, and for up to 13 remaining years for air products. We utilized such “take or pay” requirements during the past three years under these contracts, except for certain air products at our idle Minnesota ironmaking operations. We believe that production requirements will be such that consumption of the products or services purchased under these commitments will occur in the normal production process, other than certain air products related to our Minnesota ironmaking operations during the idle period.while idle. We also purchase electricity consumed at our Butler Flat Roll Division pursuant to a contract which extends through December 2020, which establishes an agreed fixed-rate energy charge per Mill/kWh consumed for each year through the expiration of the agreement.
WeIn our metals recycling and steel operations, we have certain fixed price contracts with various customers and suppliers for future delivery of nonferrous and ferrous metals. Our risk strategy has been to enter into base metal financial contracts with the goal to protect the profit margin, within certain parameters, that was contemplated when we entered into the transaction with the customer or vendor. At SeptemberJune 30, 2019,2020, we had a cumulative unrealized loss associated with these financial contracts of $2.5$1.3 million, substantially all of which have a settlement date within the next twelve months. We believe the customer contracts associated with the financial contracts will be fully consummated.
ITEM 4. CONTROLS AND PROCEDURES
(a) | Evaluation of Disclosure Controls and Procedures |
As required, we carried out an evaluation, under the supervision and with the participation of our principal executive officer and principal financial officer, of the effectiveness of our disclosure controls and procedures, as defined in Rulesrules 13a-15(e) and 15d-15(e) under the Securities Exchange Act of 1934, as amended (the Exchange Act). Based on this evaluation, our principal executive officer and principal financial officer concluded that, as of SeptemberJune 30, 2019,2020, the end of the period covered by this quarterly report, our disclosure controls and procedures were designed to provide and were effective to provide reasonable assurance that the information required to be disclosed by us in the reports we file or submit under the Exchange Act is recorded, processed, summarized and reported within the time periods specified in the applicable rules and forms, and that it is accumulated and communicated to our management, including our principal executive and principal financial officer,officers, as appropriate to allow timely decisions regarding required disclosure.
(b) | Changes in Internal Controls Over Financial Reporting |
No changechanges in our internal control over financial reporting (as defined in Rules 13a-15(f) and 15d-15(f) under the Exchange Act) occurred during the fiscal quarter ended SeptemberJune 30, 2019,2020, that has materially affected, or is reasonably likely to materially affect, our internal control over financial reporting.
2723
PART II OTHER INFORMATION
ITEM 1. LEGAL PROCEEDINGS
We are involved in various routine litigation matters, including administrative proceedings, regulatory proceedings, governmental investigations, environmental matters, and commercial and construction contract disputes, none of which are expected to have a material impact on our financial condition, results of operations, or liquidity.
We may also be involved from time to time in various governmental investigations, regulatory proceedings or judicial actions seeking penalties, injunctive relief, and/or remediation under federal, state and local environmental laws and regulations. The United States EPA has conducted such investigations and proceedings involving us, in some instances along with state environmental regulators, under various environmental laws, including RCRA, CERCLA, the Clean Water Act and the Clean Air Act. Some of these matters have resulted in fines or penalties, for which a total of $508,000$495,000 is recorded in our financial statements as of SeptemberJune 30, 2019.2020.
ITEM 1A. RISK FACTORS
NoExcept as stated below, no material changes have occurred to the indicated risk factors as disclosed in our Annual Report on Form 10-K for the year ended December 31, 2018.2019. Additionally, the impact of the COVID-19 pandemic could also exacerbate other risks discussed in the Risk Factors section of our Annual Report on Form 10-K for the year ended December 31, 2019.
Pandemics, epidemics, widespread illness or other health issues, such as the recent novel coronavirus outbreak (COVID-19) may adversely affect our business, results of operations, financial condition, cash flows, liquidity, and stock price.
The COVID-19 pandemic has and may continue to adversely affect our business, results of operations, financial condition, cash flows, liquidity and stock price. Other pandemics, epidemics, widespread illness or other health issues could also adversely affect us. The COVID-19 pandemic has resulted in various government actions globally, including United States federal and state governmental actions designed to slow the spread of the virus and its impacts. These actions have included quarantines, “shelter in place,” “stay at home” and “social distancing” orders, business shutdowns or restrictions, travel restrictions and other mitigation efforts, which, among other things, have impacted and may further impact demand for our products, as well as our supply chain. These measures, along with further voluntary measures by businesses and individuals, have impacted and may further impact our working conditions, productivity and operations, as well as those of our customers, suppliers, vendors and business partners. These mitigation measures have also adversely affected and may continue to adversely affect the United States and world economies, resulting in increased unemployment in the United States and the communities in which we operate. However, due to our variable compensation system that rewards productivity, as well as our low fixed cost structure, we have not and do not expect in the future to significantly reduce our workforce due to the COVID-19 pandemic.
We have been identified by governmental authorities as a critical infrastructure industry and have been deemed an essential business in all of the states in which we operate. This has permitted us to continue to advance our commitment to our customers and meet their demand by operating our business consistent with federal guidelines and state and local orders, including social distancing guidelines. Our teams are our most valued priority, and, we have implemented numerous process and procedural initiatives to ensure the health and safety of our people, their families and our communities. We have adjusted schedules to support social distancing, provided additional and more frequent sanitizing applications, provided additional protective measures, and many other items.. These health and safety initiatives have not and are not expected to have a material effect on our operations, but further required limitations and restrictions could adversely affect our results of operations.
Additionally, while we have not currently curtailed our operations, a prolonged COVID-19 pandemic could further materially reduce demand for our products and thus, reduce the productivity of our operations and have a negative impact on our business, results of operations, financial condition and cash flows. Certain of our suppliers and customers, such as those in the automotive, energy and related industries, have experienced temporary shutdowns or significant demand reductions, adversely affecting our operations. Further reduced demand for our products or raw material supply availability due to shutdowns or slowdowns in businesses could further adversely affect our volumes and margins, results of operations, financial condition and cash flows. Prolonged shutdowns of critical equipment suppliers, or their suppliers, to our planned capital improvements, including our under construction Sinton, Texas Flat Roll Steel Mill expected to commence operations mid-year 2021, could, if they were to occur, cause our planned expansions to be delayed. The COVID-19 pandemic has also caused volatility in the financial and capital markets, which has adversely affected our stock price and may adversely affect our ability to access and the costs associated with accessing the debt or equity capital markets, which could adversely affect our liquidity, which as of June 30, 2020 was approximately $2.8 billion, consisting of approximately $1.4 billion in cash and cash equivalents and short-term investments, and $1.2 billion in availability under our undrawn credit facility.
24
There is considerable uncertainty regarding the economic and industry impacts, including duration, from the COVID-19 pandemic and the measures introduced to curtail its spread and its impacts. Although these highly uncertain future impacts cannot be reasonably estimated at this time, general economic conditions, business closures, slow payments from customers, increased bankruptcies, and labor restrictions may adversely affect our business, results of operations, financial condition, cash flows, liquidity and stock price. Additionally, the impact of the COVID-19 pandemic could also exacerbate other risks to us, including those discussed in the Risk Factors section of our Annual Report on Form 10-K for the year ended December 31, 2019.
ITEM 2. UNREGISTERED SALES OF EQUITY SECURITIES AND USE OF PROCEEDS
We purchased the following equity securities registered by us pursuant to Section 12 of the Exchange Act during the three months ended September 30, 2019.None.
| | | | | | | | | | | | | | |
| | | | | | | | | | | | | | |
| Period | | Total Number of Shares Purchased | | Average Price Paid per Share | | Total Number of Shares Purchased as Part of Publicly Announced Program (1) | | Maximum Dollar Value of Shares That May Yet be Purchased Under the Program | |||||
| Quarter ended September 30, 2019 | | | | | | | | | | | | ||
| | | | | | | | | | | | | | |
| July 1 - 31 | | 246,100 | | | $ | 32.46 | | | 246,100 | | | $ | 213,715 |
| August 1 - 31 | | 3,509,700 | | | | 27.91 | | | 3,509,700 | | | | 115,749 |
| September 1 - 30 | | 302,186 | | | | 29.77 | | | 302,186 | | | | 106,754 |
| | | 4,057,986 | | | | | | | 4,057,986 | | | | |
ITEM 3. DEFAULTS UPON SENIOR SECURITIES
None.
ITEM 4. MINE SAFETY DISCLOSURES
Information required to be furnished pursuant to Item 4 concerning mine safety disclosure matters, if applicable, by Section 1503(a) of the Dodd-Frank Wall Street Reform and Consumer Protection Act and Item 104 of Regulation S-K (17 CFR 229.104), is included in Exhibit 95 to this quarterly report. There are no mine safety disclosures to report for the three months ended SeptemberJune 30, 2019,2020, therefore, no Exhibit 95 is required.
ITEM 5. OTHER INFORMATION
None.
2825
ITEM 6. EXHIBITS
Reference is made to the Exhibit Index preceding the signature page hereto, which Exhibit Index is hereby incorporated into this item.
EXHIBIT INDEX
HIDDEN_ROW | | |
Articles of Incorporation | ||
| | |
3.1 | ||
| | |
3.2 | ||
| | |
Executive Officer Certifications | ||
| | |
31.1* | ||
| | |
31.2* | ||
| | |
32.1* | ||
| | |
32.2* | ||
| | |
Instruments Defining the Rights of Security Holders, Including Indentures | ||
| ||
4.35 | | |
| | |
4.36 | | |
| | |
4.37 | ||
| ||
Other | ||
| | |
95** | ||
| | |
XBRL Documents | ||
| | |
101.INS* | XBRL Instance Document - the instance document does not appear in the Interactive Data File because its XBRL tags are embedded within the Inline XBRL document. | |
| | |
101.SCH* | XBRL Taxonomy Extension Schema Document | |
| | |
101.CAL* | XBRL Taxonomy Extension Calculation Document | |
| | |
101.DEF* | XBRL Taxonomy Definition Document |
26
| | |
101.LAB* | XBRL Taxonomy Extension Label Document | |
| | |
101.PRE* | XBRL Taxonomy Presentation Document | |
| | |
104 | Cover Page Interactive Data File – the cover page interactive data file does not appear in the Interactive Data File because its XBRL tags are embedded within the Inline XBRL document. |
* | Filed concurrently herewith |
** | Inapplicable for purposes of this report |
2927
SIGNATURE
Pursuant to the requirements of the Securities Exchange Act of 1934, the registrant has duly caused this report to be signed on its behalf by the undersigned, thereunto duly authorized.
| | |
|
| |
| | STEEL DYNAMICS, INC. |
| | |
| By: | /s/ Theresa E. Wagler |
| | Theresa E. Wagler |
| | Executive Vice President and Chief Financial Officer |
| | (Principal Financial Officer and Principal Accounting Officer) |
3028