UNITED STATES
SECURITIES AND EXCHANGE COMMISSION
Washington, D.C. 20549
FORM 10-Q
☒ | QUARTERLY REPORT PURSUANT TO SECTION 13 OR 15(d) OF THE SECURITIES EXCHANGE ACT OF 1934 |
For the quarterly period ended June 30, | |
| |
OR | |
| |
☐ | TRANSITION REPORT PURSUANT TO SECTION 13 OR 15(d) OF THE SECURITIES EXCHANGE ACT OF 1934 |
For the transition period from ______ to ______ |
Commission file number: 001-13425
Ritchie Bros. Auctioneers Incorporated
(Exact Name of Registrant as Specified in its Charter)
Canada |
| 98-0626225 |
(State or other jurisdiction of incorporation or organization) |
| (I.R.S. Employer Identification No.) |
|
| |
9500 Glenlyon Parkway |
|
|
Burnaby, British Columbia, Canada |
| V5J 0C6 |
(Address of Principal Executive Offices) |
| (Zip Code) |
(778) 331-5500
(Registrant’s Telephone Number, including Area Code)
Securities registered pursuant to Section 12(b) of the Act:
Title of each class | Trading Symbol(s) | Name of each exchange on which registered |
Common shares | RBA | New York Stock Exchange |
Common Share Purchase Rights | N/A | New York Stock Exchange |
Indicate by checkmark whether the registrant (1) filed all reports required to be filed by Section 13 or 15(d) of the Securities Exchange Act of 1934 during the preceding 12 months (or for such shorter period that the registrant was required to file such reports), and (2) has been subject to such filing requirements for the past 90 days. Yes ☒ No ◻
Indicate by check mark whether the registrant has submitted electronically every Interactive Data File required to be submitted pursuant to Rule 405 of Regulation S-T (§ 232.405 of this chapter) during the preceding 12 months (or for such shorter period that the registrant was required to submit such files). Yes ☒ No ◻
Indicate by check mark whether the registrant is a large accelerated filer, an accelerated filer, a non-accelerated filer, smaller reporting company, or an emerging growth company. See the definitions of “large accelerated filer,” “accelerated filer,” “smaller reporting company,” and “emerging growth company” in Rule 12b-2 of the Exchange Act.
Large accelerated filer | ☒ | Accelerated filer | ☐ | Non-accelerated filer | ☐ |
Smaller reporting company | ☐ | Emerging growth company | ☐ | | |
If an emerging growth company, indicate by check mark if the registrant has elected not to use the extended transition period for complying with any new or revised financial accounting standards provided pursuant to Section 13(a) of the Exchange Act. ◻
Indicate by check mark whether the registrant is a shell company (as defined in Rule 12b-2 of the Exchange Act):
Yes ☐ No ⌧
Indicate the number of shares outstanding of each of the issuer’s classes of common stock, as of the latest practical date: 110,371,456110,809,591 common shares, without par value, outstanding as of August 4, 2021.3, 2022.
RITCHIE BROS. AUCTIONEERS INCORPORATED
FORM 10-Q
For the quarter ended June 30, 20212022
INDEX
| | |
1 | ||
Management’s Discussion and Analysis of Financial Condition and Results of Operations |
| |
| ||
| ||
| ||
| ||
| ||
| ||
| ||
| ||
| ||
| ||
| ||
|
PART I – FINANCIAL INFORMATION
ITEM 1: CONSOLIDATED FINANCIAL STATEMENTS
Condensed Consolidated Income Statements
(Expressed in thousands of United States dollars, except share and per share data)
(Unaudited)
| | | | | | | | | | | | | |
| | Three months ended | | Six months ended | | ||||||||
| | June 30, | | June 30, | | ||||||||
|
| 2021 |
| 2020 |
| 2021 |
| 2020 | | ||||
Revenue: | | |
| | |
| | |
| | |
| |
Service revenue | | $ | 252,748 | | $ | 234,139 | | $ | 458,778 | | $ | 417,262 | |
Inventory sales revenue | |
| 143,613 | |
| 154,911 | |
| 269,138 | |
| 245,043 | |
Total revenue | |
| 396,361 | |
| 389,050 | |
| 727,916 | |
| 662,305 | |
| | | | | | | | | | | | | |
Operating expenses: | |
|
| |
|
| |
|
| |
|
| |
Costs of services | |
| 39,042 | |
| 39,448 | |
| 75,069 | |
| 78,803 | |
Cost of inventory sold | |
| 131,023 | |
| 143,134 | |
| 241,770 | |
| 224,719 | |
Selling, general and administrative expenses | |
| 111,819 | |
| 100,632 | |
| 227,897 | |
| 199,017 | |
Acquisition-related costs | |
| 3,049 | |
| — | |
| 5,971 | |
| — | |
Depreciation and amortization expenses | |
| 21,935 | |
| 17,857 | |
| 43,005 | |
| 37,150 | |
Gain on disposition of property, plant and equipment | |
| (175) | |
| (1,213) | |
| (243) | |
| (1,260) | |
Foreign exchange loss | |
| 151 | |
| 392 | |
| 428 | |
| 994 | |
Total operating expenses | |
| 306,844 | |
| 300,250 | |
| 593,897 | |
| 539,423 | |
Operating income | |
| 89,517 | |
| 88,800 | |
| 134,019 | |
| 122,882 | |
| | | | | | | | | | | | | |
Interest expense | |
| (8,867) | |
| (8,882) | |
| (17,813) | |
| (18,064) | |
Other income, net | |
| 1,196 | |
| 857 | |
| 2,198 | |
| 4,434 | |
Income before income taxes | |
| 81,846 | |
| 80,775 | |
| 118,404 | |
| 109,252 | |
| | | | | | | | | | | | | |
Income tax expense | | | 21,065 | | | 27,656 | | | 29,484 | | | 33,304 | |
Net income | | $ | 60,781 | | $ | 53,119 | | $ | 88,920 | | $ | 75,948 | |
| | | | | | | | | | | | | |
Net income attributable to: | |
|
| |
|
| |
|
| |
|
| |
Stockholders | | $ | 60,749 | | $ | 53,043 | | $ | 88,937 | | $ | 75,851 | |
Non-controlling interests | |
| 32 | |
| 76 | |
| (17) | |
| 97 | |
Net income | | $ | 60,781 | | $ | 53,119 | | $ | 88,920 | | $ | 75,948 | |
| | | | | | | | | | | | | |
Earnings per share attributable to stockholders: | |
|
| |
|
| |
|
| |
|
| |
Basic | | $ | 0.55 | | $ | 0.49 | | $ | 0.81 | | $ | 0.70 | |
Diluted | | $ | 0.55 | | $ | 0.49 | | $ | 0.80 | | $ | 0.69 | |
| | | | | | | | | | | | | |
Weighted average number of shares outstanding: | |
|
| |
|
| |
|
| |
|
| |
Basic | |
| 110,311,615 | |
| 108,387,490 | |
| 110,144,229 | |
| 108,818,903 | |
Diluted | |
| 111,334,184 | |
| 109,323,343 | |
| 111,302,711 | |
| 109,903,808 | |
| | | | | | | | | | | | | |
| | Three months ended | | Six months ended | | ||||||||
| | June 30, | | June 30, | | ||||||||
|
| 2022 |
| 2021 |
| 2022 |
| 2021 | | ||||
Revenue: | | |
| | |
| | |
| | |
| |
Service revenue | | $ | 286,502 | | $ | 252,748 | | $ | 531,363 | | $ | 458,778 | |
Inventory sales revenue | |
| 198,044 | |
| 143,613 | |
| 347,104 | |
| 269,138 | |
Total revenue | |
| 484,546 | |
| 396,361 | |
| 878,467 | |
| 727,916 | |
| | | | | | | | | | | | | |
Operating expenses: | |
|
| |
|
| |
|
| |
|
| |
Costs of services | |
| 45,039 | |
| 41,301 | |
| 84,054 | |
| 79,167 | |
Cost of inventory sold | |
| 176,171 | |
| 131,023 | |
| 307,753 | |
| 241,770 | |
Selling, general and administrative | |
| 144,277 | |
| 109,560 | |
| 270,883 | |
| 223,799 | |
Acquisition-related costs | |
| 3,399 | |
| 3,049 | |
| 13,036 | |
| 5,971 | |
Depreciation and amortization | |
| 24,298 | |
| 21,935 | |
| 48,523 | |
| 43,005 | |
Foreign exchange loss (gain) | |
| (158) | |
| 151 | |
| (322) | |
| 428 | |
Total operating expenses | |
| 393,026 | |
| 307,019 | |
| 723,927 | |
| 594,140 | |
Gain on disposition of property, plant and equipment | |
| 347 | |
| 175 | | | 170,167 | | | 243 | |
Operating income | |
| 91,867 | |
| 89,517 | |
| 324,707 | |
| 134,019 | |
| | | | | | | | | | | | | |
Interest expense | |
| (18,463) | |
| (8,867) | |
| (39,149) | |
| (17,813) | |
Change in fair value of derivatives, net | |
| — | |
| — | |
| 1,263 | |
| — | |
Other income, net | |
| 1,639 | |
| 1,196 | |
| 2,559 | |
| 2,198 | |
Income before income taxes | |
| 75,043 | |
| 81,846 | |
| 289,380 | |
| 118,404 | |
| | | | | | | | | | | | | |
Income tax expense | | | 21,632 | | | 21,065 | | | 57,868 | | | 29,484 | |
Net income | | $ | 53,411 | | $ | 60,781 | | $ | 231,512 | | $ | 88,920 | |
| | | | | | | | | | | | | |
Net income (loss) attributable to: | |
|
| |
|
| |
|
| |
|
| |
Stockholders | | $ | 53,365 | | $ | 60,749 | | $ | 231,459 | | $ | 88,937 | |
Non-controlling interests | |
| 46 | |
| 32 | |
| 53 | |
| (17) | |
Net income | | $ | 53,411 | | $ | 60,781 | | $ | 231,512 | | $ | 88,920 | |
| | | | | | | | | | | | | |
Earnings per share attributable to stockholders: | |
|
| |
|
| |
|
| |
|
| |
Basic | | $ | 0.48 | | $ | 0.55 | | $ | 2.09 | | $ | 0.81 | |
Diluted | | $ | 0.48 | | $ | 0.55 | | $ | 2.07 | | $ | 0.80 | |
| | | | | | | | | | | | | |
Weighted average number of shares outstanding: | |
|
| |
|
| |
|
| |
|
| |
Basic | |
| 110,760,339 | |
| 110,311,615 | |
| 110,705,182 | |
| 110,144,229 | |
Diluted | |
| 111,705,102 | |
| 111,334,184 | |
| 111,681,644 | |
| 111,302,711 | |
See accompanying notes to the condensed consolidated financial statements.
Condensed Consolidated Statements of Comprehensive Income
(Expressed in thousands of United States dollars)
(Unaudited)
| | | | | | | | | | | | | | | | | | | | | | | | | | |
| | Three months ended | | Six months ended | | | Three months ended | | Six months ended | | ||||||||||||||||
|
| June 30, | | June 30, | |
| June 30, | | June 30, | | ||||||||||||||||
| | 2021 |
| 2020 |
| 2021 |
| 2020 | | | 2022 |
| 2021 |
| 2022 |
| 2021 | | ||||||||
Net income | | $ | 60,781 | | $ | 53,119 | | $ | 88,920 | | $ | 75,948 | | | $ | 53,411 | | $ | 60,781 | | $ | 231,512 | | $ | 88,920 | |
Other comprehensive income (loss), net of income tax: | |
| | |
|
| | �� |
| |
|
| | |
| | |
|
| |
|
| |
|
| |
Foreign currency translation adjustment | |
| 1,468 | |
| 10,764 | |
| (8,892) | |
| (5,105) | | |
| (22,775) | |
| 1,468 | |
| (23,942) | |
| (8,892) | |
Total comprehensive income | | $ | 62,249 | | $ | 63,883 | | $ | 80,028 | | $ | 70,843 | | | $ | 30,636 | | $ | 62,249 | | $ | 207,570 | | $ | 80,028 | |
| | | | | | | | | | | | | | | | | | | | | | | | | | |
Total comprehensive income (loss) attributable to: | |
|
| |
|
| |
|
| |
|
| | |
|
| |
|
| |
|
| |
|
| |
Stockholders | | $ | 62,215 | | $ | 63,795 | | $ | 80,059 | | $ | 70,743 | | | $ | 30,612 | | $ | 62,215 | | $ | 207,549 | | $ | 80,059 | |
Non-controlling interests | |
| 34 | |
| 88 | |
| (31) | |
| 100 | | |
| 24 | |
| 34 | |
| 21 | |
| (31) | |
| | $ | 62,249 | | $ | 63,883 | | $ | 80,028 | | $ | 70,843 | | | $ | 30,636 | | $ | 62,249 | | $ | 207,570 | | $ | 80,028 | |
See accompanying notes to the condensed consolidated financial statements.
| |
Ritchie Bros. | 2 |
Condensed Consolidated Balance Sheets
(Expressed in thousands of United States dollars, except share data)
(Unaudited)
| | | | | | |
| | June 30, | | December 31, | ||
|
| 2021 |
| 2020 | ||
Assets | | | | | | |
| | | | | | |
Cash and cash equivalents | | $ | 301,757 | | $ | 278,766 |
Restricted cash | |
| 140,966 | |
| 28,129 |
Trade and other receivables | |
| 271,980 | |
| 135,001 |
Less: allowance for credit losses | | | (5,348) | | | (5,467) |
Inventory | |
| 85,930 | |
| 86,278 |
Other current assets | |
| 27,776 | |
| 27,274 |
Income taxes receivable | |
| 10,524 | |
| 6,797 |
Total current assets | |
| 833,585 | |
| 556,778 |
| | | | | | |
Property, plant and equipment | |
| 482,732 | |
| 492,127 |
Other non-current assets | |
| 146,890 | |
| 147,608 |
Intangible assets | |
| 292,444 | |
| 300,948 |
Goodwill | |
| 838,798 | |
| 840,610 |
Deferred tax assets | |
| 12,534 | |
| 13,458 |
Total assets | | $ | 2,606,983 | | $ | 2,351,529 |
| | | | | | |
Liabilities and Equity | |
|
| |
|
|
| | | | | | |
Auction proceeds payable | | $ | 445,090 | | $ | 214,254 |
Trade and other payables | |
| 221,738 | |
| 243,786 |
Income taxes payable | |
| 4,240 | |
| 17,032 |
Short-term debt | |
| 35,213 | |
| 29,145 |
Current portion of long-term debt | |
| 10,657 | |
| 10,360 |
Total current liabilities | |
| 716,938 | |
| 514,577 |
| | | | | | |
Long-term debt | |
| 625,832 | |
| 626,288 |
Other non-current liabilities | |
| 156,636 | |
| 153,000 |
Deferred tax liabilities | |
| 46,150 | |
| 45,265 |
Total liabilities | |
| 1,545,556 | |
| 1,339,130 |
| | | | | | |
Commitments and Contingencies (Note 21 and Note 22 respectively) | |
| | | | |
Stockholders' equity: | |
|
| |
|
|
Share capital: | |
|
| |
|
|
Common stock; 0 par value, unlimited shares authorized, issued and outstanding shares: 110,366,808 (December 31, 2020: 109,876,428) | |
| 215,666 | |
| 200,451 |
Additional paid-in capital | |
| 51,800 | |
| 49,171 |
Retained earnings | |
| 832,037 | |
| 791,918 |
Accumulated other comprehensive loss | |
| (43,173) | |
| (34,295) |
Stockholders' equity | |
| 1,056,330 | |
| 1,007,245 |
Non-controlling interest | |
| 5,097 | |
| 5,154 |
Total stockholders' equity | |
| 1,061,427 | |
| 1,012,399 |
Total liabilities and equity | | $ | 2,606,983 | | $ | 2,351,529 |
| | | | | | |
| | June 30, | | December 31, | ||
|
| 2022 |
| 2021 | ||
Assets | | | | | | |
| | | | | | |
Cash and cash equivalents | | $ | 367,289 | | $ | 326,113 |
Restricted cash | |
| 164,371 | |
| 102,875 |
Trade and other receivables | |
| 295,241 | |
| 150,895 |
Less: allowance for credit losses | | | (3,763) | | | (4,396) |
Inventory | |
| 124,964 | |
| 102,494 |
Other current assets | |
| 36,212 | |
| 64,346 |
Income taxes receivable | |
| 12,525 | |
| 19,895 |
Total current assets | |
| 996,839 | |
| 762,222 |
| | | | | | |
Restricted cash | | | — | | | 933,464 |
Property, plant and equipment | |
| 442,743 | |
| 449,087 |
Other non-current assets | |
| 168,360 | |
| 142,504 |
Intangible assets | |
| 332,615 | |
| 350,516 |
Goodwill | |
| 945,950 | |
| 947,715 |
Deferred tax assets | |
| 7,458 | |
| 7,406 |
Total assets | | $ | 2,893,965 | | $ | 3,592,914 |
| | | | | | |
Liabilities and Equity | |
|
| |
|
|
| | | | | | |
Auction proceeds payable | | $ | 493,688 | | $ | 292,789 |
Trade and other liabilities | |
| 254,514 | |
| 280,308 |
Income taxes payable | |
| 31,362 | |
| 5,677 |
Short-term debt | |
| 8,637 | |
| 6,147 |
Current portion of long-term debt | |
| 4,617 | |
| 3,498 |
Total current liabilities | |
| 792,818 | |
| 588,419 |
| | | | | | |
Long-term debt | |
| 639,755 | |
| 1,733,940 |
Other non-current liabilities | |
| 155,911 | |
| 147,260 |
Deferred tax liabilities | |
| 61,396 | |
| 52,232 |
Total liabilities | |
| 1,649,880 | |
| 2,521,851 |
| | | | | | |
Commitments and Contingencies (Note 22 and Note 23 respectively) | |
| | | | |
Stockholders' equity: | |
|
| |
|
|
Share capital: | |
|
| |
|
|
Common stock; 0 par value, unlimited shares authorized, issued and outstanding shares: 110,791,788 (December 31, 2021: 110,618,049) | |
| 235,244 | |
| 227,504 |
Additional paid-in capital | |
| 73,014 | |
| 59,535 |
Retained earnings | |
| 1,015,301 | |
| 839,609 |
Accumulated other comprehensive loss | |
| (79,883) | |
| (55,973) |
Stockholders' equity | |
| 1,243,676 | |
| 1,070,675 |
Non-controlling interest | |
| 409 | |
| 388 |
Total stockholders' equity | |
| 1,244,085 | |
| 1,071,063 |
Total liabilities and equity | | $ | 2,893,965 | | $ | 3,592,914 |
See accompanying notes to the condensed consolidated financial statements.
| |
Ritchie Bros. | 3 |
Condensed Consolidated Statements of Changes in Equity
(Expressed in thousands of United States dollars, except where noted)
(Unaudited)
| | | | | | | | | | | | | | | | | | | | | |
| | Attributable to stockholders |
| | |
| | |
| ||||||||||||
| | | | | | | Additional | | | | | Accumulated | | Non- | | | | | |||
| | Common stock | | paid-In | | | | | other | | controlling | | | | | ||||||
| | Number of | | | | | capital | | Retained | | comprehensive | | interest | | Total | | |||||
Three months ended June 30, 2021 |
| shares |
| Amount |
| ("APIC") |
| earnings |
| loss |
| ("NCI") |
| equity |
| ||||||
| | | | | | | | | | | | | | | | | | | | | |
Balance, March 31, 2021 | | 110,253,056 | | $ | 210,765 | | $ | 43,612 | | $ | 795,781 | | $ | (44,639) | | $ | 5,089 | | $ | 1,010,608 | |
Net income | | — | |
| — | |
| — | |
| 60,749 | |
| — | |
| 32 | |
| 60,781 | |
Other comprehensive loss | | — | |
| — | |
| — | |
| — | |
| 1,466 | |
| 2 | |
| 1,468 | |
| | — | |
| — | |
| — | |
| 60,749 | |
| 1,466 | |
| 34 | |
| 62,249 | |
Stock option exercises | | 113,290 | |
| 4,889 | |
| (910) | |
| — | |
| — | |
| — | |
| 3,979 | |
Issuance of common stock related to vesting of share units | | 462 | |
| 12 | |
| (30) | |
| — | |
| — | |
| — | |
| (18) | |
Share-based continuing employment costs related to business combination | | — | | | — | | | 2,678 | | | — | | | — | | | — | | | 2,678 | |
Stock option compensation expense | | — | |
| — | |
| 1,909 | |
| — | |
| — | |
| — | |
| 1,909 | |
Equity-classified share units expense | | — | |
| — | |
| 4,404 | |
| — | |
| — | |
| — | |
| 4,404 | |
Equity-classified share units dividend equivalents | | — | |
| — | |
| 137 | |
| (137) | |
| — | |
| — | |
| — | |
Cash dividends paid | | — | |
| — | |
| — | |
| (24,356) | |
| — | |
| (26) | |
| (24,382) | |
Balance, June 30, 2021 | | 110,366,808 | | $ | 215,666 | | $ | 51,800 | | $ | 832,037 | | $ | (43,173) | | $ | 5,097 | | $ | 1,061,427 | |
| | | | | | | | | | | | | | | | | | | | | |
| | | | | | | | | | | | | | | | | | | | | |
Three months ended June 30, 2020 | |
| |
|
| |
|
| |
|
| |
|
| |
|
| |
|
| |
| | | | | | | | | | | | | | | | | | | | | |
Balance, March 31, 2020 | | 108,198,739 | | $ | 153,801 | | $ | 46,147 | | $ | 714,816 | | $ | (74,959) | | $ | 5,166 | | $ | 844,971 | |
Net income |
| — | |
| — | |
| — | |
| 53,043 | |
| — | |
| 76 | |
| 53,119 | |
Other comprehensive loss |
| — | |
| — | |
| — | |
| — | |
| 10,752 | |
| 12 | |
| 10,764 | |
|
| — | |
| — | |
| — | |
| 53,043 | |
| 10,752 | |
| 88 | |
| 63,883 | |
Stock option exercises |
| 431,831 | | | 15,457 | |
| (3,086) | |
| — | |
| — | |
| — | |
| 12,371 | |
Issuance of common stock related to vesting of share units |
| (33) | | | (3) | |
| (7) | |
| — | |
| — | |
| — | |
| (10) | |
Stock option compensation expense |
| — | |
| — | |
| 1,543 | |
| — | |
| — | |
| — | |
| 1,543 | |
Equity-classified share units expense |
| — | |
| — | |
| 3,231 | |
| — | |
| — | |
| — | |
| 3,231 | |
Equity-classified share units dividend equivalents |
| — | |
| — | |
| 130 | |
| (130) | |
| — | |
| — | |
| — | |
Cash dividends paid |
| — | |
| — | |
| — | |
| (21,681) | |
| — | |
| — | |
| (21,681) | |
Balance, June 30, 2020 |
| 108,630,537 | | $ | 169,255 | | $ | 47,958 | | $ | 746,048 | | $ | (64,207) | | $ | 5,254 | | $ | 904,308 | |
��
| | | | | | | | | | | | | | | | | | | | | |
| | Attributable to stockholders |
| | |
| | |
| ||||||||||||
| | | | | | | Additional | | | | | Accumulated | | Non- | | | | | |||
| | Common stock | | paid-In | | | | | other | | controlling | | | | | ||||||
| | Number of | | | | | capital | | Retained | | comprehensive | | interest | | Total | | |||||
Three months ended June 30, 2022 |
| shares |
| Amount |
| ("APIC") |
| earnings |
| loss |
| ("NCI") |
| equity |
| ||||||
| | | | | | | | | | | | | | | | | | | | | |
Balance, March 31, 2022 | | 110,735,243 | | $ | 231,064 | | $ | 61,123 | | $ | 989,923 | | $ | (57,130) | | $ | 385 | | $ | 1,225,365 | |
Net income | | — | |
| — | |
| — | |
| 53,365 | |
| — | |
| 46 | |
| 53,411 | |
Other comprehensive loss | | — | |
| — | |
| — | |
| — | |
| (22,753) | |
| (22) | |
| (22,775) | |
| | — | |
| — | |
| — | |
| 53,365 | |
| (22,753) | |
| 24 | |
| 30,636 | |
Stock option exercises | | 55,935 | |
| 2,347 | |
| (471) | |
| — | |
| — | |
| — | |
| 1,876 | |
Issuance of common stock related to vesting of share units | | 610 | |
| 14 | |
| (43) | |
| — | |
| — | |
| — | |
| (29) | |
Share-based continuing employment costs related to business combinations | | — | |
| 1,819 | |
| 261 | |
| — | |
| — | |
| — | |
| 2,080 | |
Stock option compensation expense | | | | | — | | | 3,056 | | | | | | | | | | | | 3,056 | |
Equity-classified share units expense | | — | | | — | | | 8,794 | | | — | |
| — | |
| — | |
| 8,794 | |
Equity-classified share units divided equivalents | | — | | | — | | | 294 | | | (294) | |
| — | |
| — | |
| — | |
Cash dividends paid | | — | |
| — | |
| — | |
| (27,693) | |
| — | |
| — | |
| (27,693) | |
Balance, June 30, 2022 | | 110,791,788 | | $ | 235,244 | | $ | 73,014 | | $ | 1,015,301 | | $ | (79,883) | | $ | 409 | | $ | 1,244,085 | |
| | | | | | | | | | | | | | | | | | | | | |
| | | | | | | | | | | | | | | | | | | | | |
Three months ended June 30, 2021 | |
| |
|
| |
|
| |
|
| |
|
| |
|
| |
|
| |
| | | | | | | | | | | | | | | | | | | | | |
Balance, March 31, 2021 | | 110,253,056 | | $ | 210,765 | | $ | 43,612 | | $ | 795,781 | | $ | (44,639) | | $ | 5,089 | | $ | 1,010,608 | |
Net income |
| — | |
| — | |
| — | |
| 60,749 | |
| — | |
| 32 | |
| 60,781 | |
Other comprehensive income |
| — | |
| — | |
| — | |
| — | |
| 1,466 | |
| 2 | |
| 1,468 | |
|
| — | |
| — | |
| — | |
| 60,749 | |
| 1,466 | |
| 34 | |
| 62,249 | |
Stock option exercises |
| 113,290 | | | 4,889 | | | (910) | | | — | | | — | |
| — | |
| 3,979 | |
Issuance of common stock related to vesting of share units |
| 462 | | | 12 | | | (30) | | | — | | | — | |
| — | |
| (18) | |
Share-based continuing employment costs related to business combinations | | — | | | — | | | 2,678 | | | — | | | — | | | — | |
| 2,678 | |
Stock option compensation expense | | — | |
| — | | | 1,909 | | | — | | | — | |
| — | |
| 1,909 | |
Equity-classified share units expense |
| — | |
| — | | | 4,404 | | | — | | | — | |
| — | |
| 4,404 | |
Equity-classified share units dividend equivalents |
| — | |
| — | |
| 137 | |
| (137) | |
| — | |
| — | |
| — | |
Cash dividends paid |
| — | |
| — | | | — | | | (24,356) | | | — | |
| (26) | | | (24,382) | |
Balance, June 30, 2021 |
| 110,366,808 | | $ | 215,666 | | $ | 51,800 | | $ | 832,037 | | $ | (43,173) | | $ | 5,097 | | $ | 1,061,427 | |
| |
Ritchie Bros. | 4 |
Condensed Consolidated Statements of Changes in Equity
(Expressed in thousands of United States dollars, except where noted)
(Unaudited)
| | | | | | | | | | | | | | | | | | | | | |
|
| Attributable to stockholders |
| | | | | |
| ||||||||||||
| | | | | | | Additional | | | | | Accumulated | | Non- | | | | | |||
| | Common stock | | paid-In | | | | | other | | controlling | | | | | ||||||
| | Number of | | | | | capital | | Retained | | comprehensive | | interest | | Total | | |||||
Six months ended June 30, 2021 |
| shares |
| Amount |
| ("APIC") |
| earnings |
| loss |
| ("NCI") |
| equity |
| ||||||
| | | | | | | | | | | | | | | | | | | | | |
Balance, December 31, 2020 | | 109,876,428 | | $ | 200,451 | | $ | 49,171 | | $ | 791,918 | | $ | (34,295) | | $ | 5,154 | | $ | 1,012,399 | |
Net income | | — | |
| — | |
| — | |
| 88,937 | |
| — | |
| (17) | |
| 88,920 | |
Other comprehensive income (loss) | | — | |
| — | |
| — | |
| — | |
| (8,878) | |
| (14) | |
| (8,892) | |
| | — | |
| — | |
| — | |
| 88,937 | |
| (8,878) | |
| (31) | |
| 80,028 | |
Stock option exercises | | 311,153 | |
| 13,157 | |
| (2,458) | |
| — | |
| — | |
| — | |
| 10,699 | |
Issuance (forfeiture) of common stock related to vesting of share units | | 234,737 | |
| 2,058 | |
| (11,377) | |
| — | |
| — | |
| — | |
| (9,319) | |
Share-based continuing employment costs related to business combination | | (55,510) | | | — | | | 5,231 | | | — | | | — | | | — | | | 5,231 | |
Stock option compensation expense | | — | |
| — | |
| 3,770 | |
| — | |
| — | |
| — | |
| 3,770 | |
Equity-classified share units expense | | — | |
| — | |
| 7,182 | |
| — | |
| — | |
| — | |
| 7,182 | |
Equity-classified share units dividend equivalents | | — | |
| — | |
| 281 | |
| (281) | |
| — | |
| — | |
| — | |
Cash dividends paid | | — | |
| — | |
| — | |
| (48,537) | |
| — | |
| (26) | |
| (48,563) | |
Balance, June 30, 2021 | | 110,366,808 | | $ | 215,666 | | $ | 51,800 | | $ | 832,037 | | $ | (43,173) | | $ | 5,097 | | $ | 1,061,427 | |
| | | | | | | | | | | | | | | | | | | | | |
Six months ended June 30, 2020 |
|
| |
|
| |
|
| |
|
| |
|
| |
|
| |
|
| |
| | | | | | | | | | | | | | | | | | | | | |
Balance, December 31, 2019 |
| 109,337,781 | | $ | 194,771 | | $ | 52,110 | | $ | 714,051 | | $ | (59,099) | | $ | 5,154 | | $ | 906,987 | |
Net income |
| — | |
| — | |
| — | |
| 75,851 | |
| — | |
| 97 | |
| 75,948 | |
Other comprehensive loss |
| — | |
| — | |
| — | |
| — | |
| (5,108) | |
| 3 | |
| (5,105) | |
|
| — | |
| — | |
| — | |
| 75,851 | |
| (5,108) | |
| 100 | |
| 70,843 | |
Stock option exercises |
| 679,277 | |
| 24,141 | |
| (4,716) | |
| — | |
| — | |
| — | |
| 19,425 | |
Issuance of common stock related to vesting of share units |
| 138,791 | |
| 3,513 | |
| (7,451) | |
| — | |
| — | |
| — | |
| (3,938) | |
Stock option compensation expense |
| — | |
| — | |
| 2,730 | |
| — | |
| — | |
| — | |
| 2,730 | |
Equity-classified share units expense |
| — | |
| — | |
| 5,017 | |
| — | |
| — | |
| — | |
| 5,017 | |
Equity-classified share units dividend equivalents |
| — | |
| — | |
| 268 | |
| (268) | |
| — | |
| — | |
| — | |
Cash dividends paid |
| — | |
| — | |
| — | |
| (43,586) | |
| — | |
| — | |
| (43,586) | |
Shares repurchased | | (1,525,312) | | | (53,170) | | | — | | | — | | | — | | | — | | | (53,170) | |
Balance, June 30, 2020 |
| 108,630,537 | | $ | 169,255 | | $ | 47,958 | | $ | 746,048 | | $ | (64,207) | | $ | 5,254 | | $ | 904,308 | |
| | | | | | | | | | | | | | | | | | | | | |
|
| Attributable to stockholders |
| | | | | |
| ||||||||||||
| | | | | | | Additional | | | | | Accumulated | | Non- | | | | | |||
| | Common stock | | paid-In | | | | | other | | controlling | | | | | ||||||
| | Number of | | | | | capital | | Retained | | comprehensive | | interest | | Total | | |||||
Six months ended June 30, 2022 |
| shares |
| Amount |
| ("APIC") |
| earnings |
| loss |
| ("NCI") |
| equity |
| ||||||
| | | | | | | | | | | | | | | | | | | | | |
Balance, December 31, 2021 | | 110,618,049 | | $ | 227,504 | | $ | 59,535 | | $ | 839,609 | | $ | (55,973) | | $ | 388 | | $ | 1,071,063 | |
Net income | | — | |
| — | |
| — | |
| 231,459 | |
| — | |
| 53 | |
| 231,512 | |
Other comprehensive loss | | — | |
| — | |
| — | |
| — | |
| (23,910) | |
| (32) | |
| (23,942) | |
| | — | |
| — | |
| — | |
| 231,459 | |
| (23,910) | |
| 21 | |
| 207,570 | |
Stock option exercises | | 80,183 | |
| 3,554 | |
| (692) | |
| — | |
| — | |
| — | |
| 2,862 | |
Issuance of common stock related to vesting of share units | | 93,556 | |
| 2,367 | |
| (5,945) | |
| — | |
| — | |
| — | |
| (3,578) | |
Share-based continuing employment costs related to business combinations | | | | | 1,819 | | | 2,394 | | | — | |
| — | |
| — | | | 4,213 | |
Stock option compensation expense | | | | | — | | | 5,623 | | | — | |
| — | |
| — | | | 5,623 | |
Equity-classified share units expense | | — | |
| — | |
| 11,684 | |
| — | |
| — | |
| — | |
| 11,684 | |
Equity-classified share units dividend equivalents | | — | |
| — | |
| 415 | |
| (415) | |
| — | |
| — | |
| — | |
Cash dividends paid | | — | |
| — | |
| — | |
| (55,352) | |
| — | |
| — | |
| (55,352) | |
Balance, June 30, 2022 | | 110,791,788 | | $ | 235,244 | | $ | 73,014 | | $ | 1,015,301 | | $ | (79,883) | | $ | 409 | | $ | 1,244,085 | |
| | | | | | | | | | | | | | | | | | | | | |
Six months ended June 30, 2021 |
|
| |
|
| |
|
| |
|
| |
|
| |
|
| |
|
| |
| | | | | | | | | | | | | | | | | | | | | |
Balance, December 31, 2020 |
| 109,876,428 | | $ | 200,451 | | $ | 49,171 | | $ | 791,918 | | $ | (34,295) | | $ | 5,154 | | $ | 1,012,399 | |
Net income |
| — | |
| — | |
| — | |
| 88,937 | |
| — | |
| (17) | |
| 88,920 | |
Other comprehensive income |
| — | |
| — | |
| — | |
| — | |
| (8,878) | |
| (14) | |
| (8,892) | |
|
| — | |
| — | |
| — | |
| 88,937 | |
| (8,878) | |
| (31) | |
| 80,028 | |
Stock option exercises |
| 311,153 | | | 13,157 | | | (2,458) | | | — | | | — | |
| — | |
| 10,699 | |
Issuance (forfeiture) of common stock related to vesting of share units |
| 234,737 | | | 2,058 | | | (11,377) | | | — | | | — | |
| — | |
| (9,319) | |
Forfeiture of common stock related to business combinations |
| (55,510) | |
| — | | | — | | | — | | | — | |
| — | |
| — | |
Share-based continuing employment costs related to business combinations |
| — | | | — | | | 5,231 | | | — | | | — | | | — | |
| 5,231 | |
Stock option compensation expense |
| — | |
| — | | | 3,770 | | | — | | | — | |
| — | |
| 3,770 | |
Equity-classified share units expense | | — | |
| — | | | 7,182 | | | — | | | — | |
| — | |
| 7,182 | |
Equity-classified share units dividend equivalents | | — | |
| — | |
| 281 | |
| (281) | |
| — | |
| — | |
| — | |
Cash dividends paid | | — | |
| — | | | — | | | (48,537) | | | — | |
| (26) | | | (48,563) | |
Balance, June 30, 2021 |
| 110,366,808 | | $ | 215,666 | | $ | 51,800 | | $ | 832,037 | | $ | (43,173) | | $ | 5,097 | | $ | 1,061,427 | |
See accompanying notes to the condensed consolidated financial statements.
| |
Ritchie Bros. | 5 |
Condensed Consolidated Statements of Cash Flows
(Expressed in thousands of United States dollars)
(Unaudited)
| | | | | | | | | | | | | | |
Six months ended June 30, |
| 2021 |
| 2020 | |
| 2022 |
| 2021 | | ||||
Cash provided by (used in): |
| |
|
| |
|
|
| |
|
| |
|
|
Operating activities: |
| |
|
| |
|
|
| |
|
| |
|
|
Net income | | $ | 88,920 | | $ | 75,948 | | | $ | 231,512 | | $ | 88,920 | |
Adjustments for items not affecting cash: |
|
|
|
|
|
| |
|
|
|
|
| | |
Depreciation and amortization expenses | |
| 43,005 | |
| 37,150 | | |||||||
Stock-based compensation expense | |
| 16,183 | |
| 7,747 | | |||||||
Depreciation and amortization | |
| 48,523 | |
| 43,005 | | |||||||
Share-based payments expense | |
| 21,527 | |
| 16,183 | | |||||||
Deferred income tax expense | |
| 1,719 | |
| 6,657 | | |
| 9,480 | |
| 1,719 | |
Unrealized foreign exchange loss | |
| (65) | |
| 1,129 | | |||||||
Unrealized foreign exchange gain | |
| (1,965) | |
| (65) | | |||||||
Gain on disposition of property, plant and equipment | |
| (243) | |
| (1,260) | | |
| (170,167) | |
| (243) | |
Loss on redemption of the 2021 Notes | | | 4,792 | | | — | | |||||||
Amortization of debt issuance costs | |
| 1,443 | |
| 1,577 | | |
| 2,352 | |
| 1,443 | |
Amortization of right-of-use assets | | | 6,280 | | | 6,318 | | | | 8,586 | | | 6,280 | |
Gain on contingent consideration from equity investment | | | — | | | (1,700) | | |||||||
Change in fair value of derivatives | | | (1,263) | | | — | | |||||||
Other, net | |
| 1,568 | |
| 1,934 | | |
| 2,805 | |
| 1,568 | |
Net changes in operating assets and liabilities | |
| 52,577 | |
| 62,824 | | |
| 41,844 | |
| 52,577 | |
Net cash provided by operating activities | |
| 211,387 | |
| 198,324 | | |
| 198,026 | |
| 211,387 | |
Investing activities: | |
| | |
|
| | |
| | |
|
| |
Acquisition of Rouse, net of cash acquired | |
| 728 | |
| — | | |||||||
Acquisitions, net of cash acquired | |
| (63) | |
| 728 | | |||||||
Property, plant and equipment additions | |
| (4,616) | |
| (6,140) | | |
| (4,522) | |
| (4,616) | |
Proceeds on disposition of property, plant and equipment | |
| 342 | |
| 16,106 | | |
| 165,132 | |
| 342 | |
Intangible asset additions | |
| (17,361) | |
| (13,244) | | |
| (15,730) | |
| (17,361) | |
Issuance of loans receivable | | | (2,622) | | | (2,985) | | | | (6,093) | | | (2,622) | |
Repayment of loans receivable | | | 226 | | | 203 | | | | 1,554 | | | 226 | |
Distribution from equity investment | | | — | | | 4,212 | | |||||||
Proceeds on contingent consideration from equity investment | |
| — | |
| 1,700 | | |||||||
Net cash used in investing activities | |
| (23,303) | |
| (148) | | |||||||
Net cash provided by (used in) investing activities | |
| 140,278 | |
| (23,303) | | |||||||
Financing activities: | |
| | |
|
| | |
| | |
|
| |
Share repurchase | | | — | | | (53,170) | | |||||||
Dividends paid to stockholders | |
| (48,537) | |
| (43,586) | | |
| (55,352) | |
| (48,537) | |
Dividends paid to NCI | |
| (26) | |
| — | | |
| — | |
| (26) | |
Proceeds from exercise of options and share option plans | |
| 10,699 | |
| 19,425 | | |
| 2,862 | |
| 10,699 | |
Payment of withholding taxes on issuance of shares | |
| (9,155) | |
| (3,321) | | |
| (3,716) | |
| (9,155) | |
Net increase (decrease) in short-term debt | | | 6,842 | | | 15,858 | | | | 2,722 | | | 6,842 | |
Repayment of long-term debt | | | (5,328) | | | (8,633) | | | | (1,093,772) | | | (5,328) | |
Debt issue costs | |
| (3,677) | |
| — | | |||||||
Repayment of finance lease obligations | |
| (5,355) | |
| (4,384) | | |
| (5,390) | |
| (5,355) | |
Net cash used in financing activities | |
| (50,860) | |
| (77,811) | | |
| (1,156,323) | |
| (50,860) | |
Effect of changes in foreign currency rates on cash, cash equivalents, and restricted cash | |
| (1,396) | |
| (2,608) | | |
| (12,773) | |
| (1,396) | |
Increase | |
| 135,828 | |
| 117,757 | | |||||||
(Decrease) Increase | |
| (830,792) | |
| 135,828 | | |||||||
Beginning of period | |
| 306,895 | |
| 420,256 | | |
| 1,362,452 | |
| 306,895 | |
Cash, cash equivalents, and restricted cash, end of period | | $ | 442,723 | | $ | 538,013 | | | $ | 531,660 | | $ | 442,723 | |
See accompanying notes to the condensed consolidated financial statements.
| |
Ritchie Bros. | 6 |
1. General information
Ritchie Bros. Auctioneers Incorporated and its subsidiaries (collectively referred to as the “Company”, “Ritchie Bros.”, “we”, “us”, or “our”) provide a marketplace for insights, services and transaction solutions for commercial assets. The Company offers its customers end-to-end transaction solutions for used commercial and other durable assets through its omnichannel platform, which includes auctions, online marketplaces, listing services, and private brokerage services. The Company also offers a wide array of value-added services connected to commercial assets as well as asset management software and data as a service solutions to help customers make more accurate and reliable business decisions. Ritchie Bros. Auctioneers Incorporated is a company incorporated in Canada under the Canada Business Corporations Act, whose shares are publicly traded on the Toronto Stock Exchange (“TSX”) and the New York Stock Exchange (“NYSE”).
2. Significant accounting policies
(a) Basis of preparation
These unaudited condensed consolidated interim financial statements have been prepared in accordance with United States generally accepted accounting principles (“US GAAP”). They include the accounts of Ritchie Bros. Auctioneers Incorporated and its subsidiaries from their respective dates of formation or acquisition. All significant intercompany balances and transactions have been eliminated.
Certain information and footnote disclosure required by US GAAP for complete annual financial statements have been omitted and, therefore, these unaudited condensed consolidated interim financial statements should be read in conjunction with the Company’s audited consolidated financial statements for the year ended December 31, 2020,2021, included in the Company’s Annual Report on Form 10-K, filed with the Securities and Exchange Commission (“SEC”). These unaudited condensed consolidated interim financial statements follow the same accounting policies and methods of application as our most recent annual audited consolidated financial statements except as described in Note 2(b) “ New and amended accounting standards and accounting policies”. In the opinion of management, these unaudited condensed consolidated interim financial statements reflect all adjustments, consisting of normal recurring adjustments, which are necessary to present fairly, in all material respects, the Company’s consolidated financial position, results of operations, cash flows and changes in equity for the interim periods presented. The preparation of financial statements in conformity with US GAAP requires management to make estimates and assumptions that affect the amounts reported in the financial statements and accompanying notes. Actual results could differ from those estimates.
In March 2020,
On February 24, 2022, the World Health Organization declaredgeopolitical situation in Eastern Europe intensified with Russia’s invasion of Ukraine, sharply affecting economic and global financial markets. Subsequent economic sanctions of Russia have exacerbated ongoing economic challenges, including issues such as rising inflation and global supply chain disruption. The Company does not have any direct or significant operations in Russia or Ukraine, or any material operations in neighboring countries and only has limited number of direct customers in the outbreak of COVID-19 as a pandemic, which quickly spread throughout the world.effected region. The extent of the ongoing impactimpacts of the COVID-19 pandemicconflict on our operational and financial performance, the impact of higher fuel costs globally adding to inflationary pressures, including our ability to execute on our business strategies and initiatives and sustain our operations in Europe and globally, will depend on future developments, including the durationcontinued evolvement of military activity and spreadsanctions imposed with Russia’s invasion of Ukraine. Given the evolving nature of the pandemic in light of new variants, time of mass vaccine distribution, and any related restrictions placed by respective global governments, as well as supply and demand impacts driven by our consignor and buyer base, all of which are uncertain and cannot be easily predicted. Given the dynamic nature of this situation,crisis, the Company cannot currently reasonably estimate the impacts of COVID-19the conflict on its business operations, results of operations, cash flows or financial performance.
(b) Revenue recognition
Revenues are comprised of:Reclassification
Certain amounts in the prior period financial statements have been reclassified from selling, general and administrative expenses to cost of services for certain employee costs related to equipment inspections to conform to the presentation of the current period financial statements.
| |
Ritchie Bros. | 7 |
2. Significant accounting policies (continued)
(b) New and amended accounting standards and accounting policies
New accounting policies
Sale and leaseback
The transfer of the asset shall not be accounted for as a sale if the leaseback would be classified as a finance lease or a sales-type lease. For sale and leaseback transactions, the Company applies the requirements of ASC 606 Revenue recognition (continued)
from Contracts with Customers to determine whether the transfer of the asset should be accounted for as a sale and applies ASC 842 Leases when accounting for the sale and leaseback transactions. If the transfer of the asset is a sale, the Company derecognizes the underlying asset and recognizes the gain on sale of property, plant and equipment. The Company recognizes revenue when control ofa lease obligation arising from the promised goods or services is transferred to our customers, or upon completion of the performance obligation, in an amount that reflects the consideration we expect to be entitled to in exchange for those goods or services. A performance obligation is a promise in a contract to transfer a distinct good or service, or a series of distinct goods or services, to the customer. A contract’s transaction price is allocated to each distinct performance obligation and recognized as revenue when, or as, the performance obligation is satisfied. The transaction price is reduced by estimates of variable consideration such as volume rebates and discounts. All estimates, which are evaluated at each reporting period, are based on the Company’s historical experience, anticipated volumes, and best judgment. For auctions, revenue is recognized when the auction sale is completeleaseback and the Company has determined that the sale proceeds are collectible. Revenue is measured atcorresponding ROU asset. If the fair value of the consideration received or receivable and is shown net of value-added tax and duties.
Service revenues
Commissions from sales at the Company’s auctions represent the percentage earned by the Company on the gross proceeds from equipment and other assets sold at auction. The majority of the Company’s commissions are earned as a pre-negotiated fixed rate of the gross selling price. Other commissions from sales at the Company’s auctions are earned from underwritten commission contracts, when the Company guarantees a certain level of proceeds to a consignor.
The Company accepts equipment and other assets on consignment stimulating buyer interest through professional marketing techniques and matches sellers (also known as consignors) to buyers through the auction or private sale process. Prior to offering an item for sale on its online marketplaces, the Company also performs inspections.
Following the sale of the item, the Company invoices the buyer for the purchase price of thean asset taxes, and, if applicable, the buyer transaction fee, collects payment from the buyer, and remits the proceeds to the seller, net of the seller commissions, applicable taxes, and applicable fees. Commissions are calculated as a percentage of the winning bid price of the property sold at auction. Fees are also charged to sellers for listing and inspecting equipment. Other revenue earned in the process of conducting the Company’s auctions include administrative, documentation, and advertising fees.
With the final acceptance of the winning bid, the highest bidder becomes legally obligated to pay the full purchase price, which is the winning bid of the property purchased and the seller is legally obligated to relinquish the property in exchange for the winning bid price less any seller’s commissions. Commission and fee revenue are recognized on the date of the auction sale upon the final acceptance of the winning bid.
Under the standard terms and conditions of its auction sales, the Company isdoes not obligated to pay a consignor for property that has not been paid for by the buyer, provided the property has not been released to the buyer. If the buyer defaults on its payment obligation, also referred to as a collapsed sale, the sale is cancelled in the period in which the determination is made, and the property is returned to the consignor or placed in a later event-based or online auction. Historically, service revenues on cancelled sales have not been material.
Online marketplace commission revenue is reduced by a provision for disputes, which is an estimate of disputed items that are expected to be settled at a cost to the Company, related to settlements of discrepancies under the Company’s equipment condition certification program. The equipment condition certification refers to a written inspection report provided to potential buyers that reflects the condition of a specific piece of equipment offered for sale, and includes ratings, comments, and photographs of the equipment following inspection by one of the Company’s equipment inspectors.
The equipment condition certification provides that a buyer may file a written dispute claim during an eligible dispute period for consideration and resolution at the sole determination of the Company if the purchased equipment is not substantially in the condition represented in the inspection report. Typically disputes under the equipment condition certification program are settled with minor repairs or additional services, such as washing or detailing the item; the estimated costs of such items or services are included in the provision for disputes.
Commission revenue are recorded net of commissions owed to third parties, which are principally the result of situations when the commission is shared with a consignor in an auction guarantee risk and reward sharing arrangement.
|
|
|
|
2. Significant accounting policies (continued)
Service revenues (continued)
Underwritten commission contracts can take the form of guarantee contracts. Guarantee contracts typically include a pre-negotiated percentage of the guaranteed gross proceeds plus a percentage of proceeds in excess of the guaranteed amount. If actual auction proceeds are less than the guaranteed amount, commission is reduced; if proceeds are sufficiently lower, the Company can
incur a loss on the sale. Losses, if any, resulting from guarantee contracts are recorded in the period in which the relevant auction is completed. If a loss relating to a guarantee contract held at the period end to be sold after the period end is known or is probable and estimable at the financial statement reporting date, the loss is accrued in the financial statements for that period. The Company’s exposure from these guarantee contracts fluctuates over time.
Other services revenue also includes fees for refurbishment, logistical services, financing, appraisals, data subscriptions, fees associated with private market transactions and other ancillary service fees. Fees are recognized in the period in which the service is provided or the product is delivered to the customer.
Inventory sales revenue
Underwritten commission contracts can take the form of inventory contracts. Revenue related to inventory contracts is recognized in the period in which the sale is completed, title to the property passes to the purchaser and the Company has fulfilled any other obligations that may be relevant to the transaction. In its role as auctioneer, the Company auctions its inventory to equipment buyers through the auction process. Following the sale of the item, the Company invoices the buyer for the purchase price of the asset, taxes, and, if applicable, the buyer transaction fee, and collects payment from the buyer.
With the final acceptance of the winning bid, the highest bidder becomes legally obligated to pay the full purchase price, which is the winning bid price of the property purchased. Title to the property is transferred in exchange for the winning bid price, and if applicable, the buyer transaction fee plus applicable taxes.
(c) Costs of services
Costs of services incurred in earning A&M revenues are comprised of expenses incurred in direct relation to conducting auctions (“direct expenses”), earning online marketplace revenue, and earning other fee revenue. Direct expenses include direct labour, buildings and facilities charges, travel, advertising and promotion costs and fees paid to unrelated third parties who introduce the Company to equipment sellers who sell property at the Company’s auctions and marketplaces. Costs of services to operate our online marketplace revenue excludes hosting costs where we leverage a shared infrastructure that supports both our internal technology requirements and external sales to our customers.
Costs of services incurred to earn online marketplace revenue in addition to the costs listed above also include inspection costs. Inspections are generally performed at the seller’s physical location. The cost of inspections includes payroll costs and related benefits for the Company’s employees that perform and manage field inspection services, the related inspection report preparation and quality assurance costs, fees paid to contractors who perform field inspections, related travel and incidental costs for the Company’s inspection service organization, and office and occupancy costs for its inspection services personnel. Costs of earning online marketplace revenue also include costs for the Company’s customer support, online marketplace operations, logistics, title and lien investigation functions.
Costs of services incurred in earning other fee revenue include ancillary and logistical service expenses, direct labour (including commissions on sales), cloud infrastructure and hosting costs, software maintenance fees, and materials. Costs of services exclude depreciation and amortization expenses.
(d) Cost of inventory sold
Cost of inventory sold includes the purchase price of assets sold for the Company’s own account and is determined using a specific identification basis.
(e) Share-based payments
The Company classifies a share-based payment award as an equity or liability payment based on the substantive terms of the award and any related arrangement.
|
|
|
|
2. Significant accounting policies (continued)
(e) Share-based payments (continued)
Equity-classified share-based payments
The cost of equity-settled share-based payment arrangements is recorded based on the estimated fair-value at the grant date and charged to earnings over the vesting period.
Share unit plans
The Company has a senior executive performance share unit (“PSU”) plan and an employee PSU plan that provides for the award of PSUs to certain senior executives and employees, respectively, of the Company. The Company has the option to settle certain share unit awards in cash or shares and expects to settle them in shares. The cost of PSUs granted is measured at the fair value of the underlying PSUs at the grant date. PSUs vest based on the passage of time and achievement of performance criteria.
The Company also has a senior executive restricted share unit (“RSU”) plan and an employee RSU plan that provides for the award of RSUs to certain senior executives and employees, respectively, of the Company. The Company has the option to settle certain share unit awards in cash or shares and expects to settle them in shares. The cost of RSUs granted is measured at the fair value of the underlying RSUs based on the fair value of the Company’s common shares at the grant date. RSUs vest based on the passage of time and include restrictions related to employment.
The fair value of awards expected to vest under these plans is expensed over the respective remaining service period of the individual awards, on an accelerated recognition basis, with the corresponding increase to APIC recorded in equity. At the end of each reporting period, the Company revises its estimate of the number of equity instruments expected to vest. The impact of the revision of the original estimates, if any, is recognized in earnings, such that the consolidated expense reflects the revised estimate, with a corresponding adjustment to equity. Dividend equivalents on the equity-classified PSUs and RSUs are recognized as a reduction to retained earnings over the service period.
Stock option plans
The Company has three stock option compensation plans that provide for the award of stock options to selected employees, directors and officers of the Company. The cost of options granted is measured at the fair value of the underlying option at the grant date using the Black-Scholes option pricing model. The fair value of options expected to vest under these plans is expensed over the respective remaining service period of the individual awards, on an accelerated recognition basis, with the corresponding increase to APIC recorded in equity. Upon exercise, any consideration paid on exercise of the stock options and amounts fully amortized in APIC are credited to the common shares.
Liability-classified share-based payments
The Company maintains other share unit compensation plans that vest over a period of up to three years after grant. Under those plans, the Company is either required or expects to settle vested awards on a cash basis or by providing cash to acquire shares on the open market on the employee’s behalf, where the settlement amount is determined based on the average price of the Company’s common shares prior to the vesting date or, in the case of deferred share unit (“DSU”) recipients, following cessation of service on the Board of Directors.
These awards are classified as liability awards, measured at fair value at the date of grant and re-measured at fair value at each reporting date up to and including the settlement date. The determination of the fair value of the share units under these plans is described in note 19. The fair value of the awards is expensed over the respective vesting period of the individual awards with recognition of a corresponding liability. Changes in fair value after vesting are recognized through compensation expense. Compensation expense reflects estimates of the number of instruments expected to vest.
The impact of forfeitures and fair value revisions, if any, are recognized in earnings such that the cumulative expense reflects the revisions, with a corresponding adjustment to the settlement liability. Liability-classified share unit liabilities due within 12 months of the reporting date are presented in trade and other payables while settlements due beyond 12 months of the reporting date are presented in other non-current liabilities.
|
|
|
|
2. Significant accounting policies (continued)
(f) Leases
The Company determines if an arrangement is a lease at inception. The Company may have lease agreements with lease and non-lease components, which are generally accounted for separately. Additionally, for certain vehicle and equipment leases, management applies a portfolio approach to account for the right-of-use ("ROU") assets and liabilities for assets leased with similar lease terms.
Operating leases
Operating leases are included in other non-current assets, trade and other payables, and other non-current liabilities in our consolidated balance sheets if the initial lease term is greater than 12 months. For leases with an initial term of 12 months or less the Company recognizes those lease payments on a straight-line basis over the lease term.
ROU assets represent the right to use an underlying asset for the lease term and lease liabilities represent the obligation to make lease payments arising from the lease. Operating lease ROU assets and liabilities are recognized at commencement date based on the present value of lease payments over the lease term. As most of the Company’s leases do not provide an implicit rate, management uses the incremental borrowing rate based on the information available at commencement date in determining the present value of lease payments. Management uses the implicit rate when readily determinable. The Company includes lease payments for renewal or termination options in its determination of lease term, ROU asset, and lease liability when it is reasonably certain that the Company will exercise these options. Lease expense for lease payments is recognized on a straight-line basis over the lease term and are included in costs of services and selling, general and administrative ("SG&A") expenses.
Finance leases
Finance lease ROU assets and liabilities are included in property, plant and equipment, trade and other payables, and other non-current liabilities in our consolidated balance sheets.
Finance lease ROU assets and liabilities are recognized at commencement date based on the present value of lease payments over the lease term. As most of the Company’s leases do not provide an implicit rate, management uses the incremental borrowing rate based on the information available at commencement date in determining the present value of lease payments. Management uses the implicit rate when readily determinable. The Company includes lease payments for renewal, purchase options, or termination options in its determination of lease term, ROU asset, and lease liability when it is reasonably certain that the Company will exercise these options. Finance lease ROU assets are generally amortized over the lease term and are included in depreciation expense. The interest on the finance lease liabilities is included in interest expense.
(g) Inventories
Inventory consists of equipment and other assets purchased for resale in an upcoming live on site auction or online marketplace event. The Company typically purchases inventory for resale through a competitive process where the consignor or vendor has determined this to be the preferred method of disposition through the auction process. In addition, certain jurisdictions require auctioneers to hold title to assets and facilitate title transfer on sale. Inventory is valued at the lower of cost and net realizable value where net realizable value represents the expected sale price upon disposition less make-ready costs and the costs of disposal and transportation. As part of its government business, the Company purchases inventory for resale as part of its commitment to purchase certain surplus government property (note 21). The significant elements of cost include the acquisition price, in-bound transportation costs of the inventory, and make-ready costs to prepare the inventory for sale that are not selling expenses. Write-downs to the carrying value of inventory are recorded in cost of inventory sold on the consolidated income statement.
(h) Impairment of long-lived and indefinite-lived assets
Long-lived assets, comprised of property, plant and equipment, ROU assets, and intangible assets subject to amortization, are assessed for impairment whenever events or circumstances indicate that their carrying value may not be recoverable. For the purpose of impairment testing, long-lived assets are grouped and tested for recoverability at the lowest level that generates independent cash flows. An impairment loss is recognized when the carrying value of the assets or asset groups is greater than the future projected undiscounted cash flows. The impairment loss is calculated as the excess of the carrying value overequal the fair value of the asset, or asset group. Fair value is based on valuation techniques or third party appraisals. Significant estimatesif the payments for the lease are not at market rates, the Company will make adjustments to measure the sale proceeds at fair value. Any below-market terms are accounted for as a prepayment of lease payments and judgmentsany above- market terms are applied in determining these cash flowsaccounted for as additional financing provided by the buyer-lessor. If the transaction does not qualify for sale and fair values.
|
|
|
|
2. Significantleaseback accounting policies (continued)
(h) Impairment of long-livedtreatment, and indefinite-lived assets (continued)
Indefinite-lived intangible assets are tested annually for impairment as of December 31, and between annual tests if indicators of potential impairment exist. The Company has the option of performing a qualitative assessment to first determine whether the quantitative impairment test is necessary. This involves an assessment of qualitative factors to determine the existence of events or circumstances that would indicate whether it is more likely than not that the carrying amountcontrol of the indefinite-lived intangibleasset has not transferred, then the asset is less than its fair value. If the qualitative assessment indicates it is not more likely than not that the carrying amount is less than its fair value, a quantitative impairment test is not required. Where a quantitative impairment test is required, the procedure is to compare the indefinite-lived intangible asset’s fair value with its carrying amount. An impairmentderecognized, and no gain or loss is recognizedrecorded as the difference betweentransaction is accounted for as a financing transaction.
New and amended accounting standards
In October 2021, the indefinite-lived intangible asset’s carrying amountFASB issued ASU 2021-08, Business Combinations (Topic 805): Accounting for Contract Assets and its fair value.
(i) Goodwill
Goodwill representsContract Liabilities from Contracts with Customers. The update primarily addresses the excessaccounting for contract assets and contract liabilities from revenue contracts with customers acquired in a business combination. The update requires that an acquirer recognize and measure contract assets and contract liabilities acquired in a business combination in accordance with ASC 606 - Revenue from Contracts with Customers, whereas prior to the adoption of the purchase price of an acquired enterprise over the fair value assigned to theupdate, contract assets acquired and contract liabilities assumed in a business combination.
Goodwill is not amortized, but it is tested annually for impairmentcombination were recognized at the reporting unit level as of December 31, and between annual tests if indicators of potential impairment exist. The Company has the option of performing a qualitative assessment of a reporting unit to first determine whether the quantitative impairment test is necessary. This involves an assessment of qualitative factors to determine the existence of events or circumstances that would indicate whether it is more likely than not that the carrying amount of the reporting unit to which goodwill belongs is less than its fair value. If the qualitative assessment indicates it is not more likely than not that the reporting unit’s carrying amount is less than its fair value, a quantitative impairment test is not required.
If a quantitative impairment test is required, the procedure is to identify potential impairment by comparing the reporting unit’s fair value with its carrying amount, including goodwill. The reporting unit’s fair value is determined using various valuation approaches and techniques that involve assumptions based on what the Company believes a hypothetical marketplace participant would use in estimating fair value on the measurementacquisition date. An impairment loss is recognized as the difference between the reporting unit’s carrying amount and its fair value. If the difference between the reporting unit’s carrying amount and fair value is greater than the amount of goodwill allocated to the reporting unit, the impairment loss is restricted by the amountThe amendments in this update are effective for fiscal years beginning after December 15, 2022, including interim periods within those fiscal years. Early adoption of the goodwill allocatedamendments is permitted, including adoption in an interim period. An entity that early adopts in an interim period should apply the amendments (1) retrospectively to the reporting unit.
(j) Businessall business combinations
Business combinations are accounted for usingwhich the acquisition method. The purchase price is determined baseddate occurs on or after the fair valuebeginning of the assets transferred, liabilities incurred,fiscal year that includes the interim period of early application and equity interest issued,(2) prospectively to all business combinations that occur on or after considering any transactions that are separate from the business combination. The Company allocates the aggregate of the fair value of the purchase consideration transferred to the tangible and intangible assets acquired and the liabilities assumed on the basis of their fair values at the date of acquisition, with any excess recordedinitial application. The Company has early adopted the update as goodwill. The fair value determinations require judgmentof October 1, 2021 and may involvetherefore has applied the use of significant estimates and assumptions, especially with respectamendments to intangible assets and contingent liabilities. The purchase price allocation may be provisional during a measurement period of up to one year to provide reasonable time to obtain the information necessary to identify and measure the assets acquired and liabilities assumed. Any such measurement period adjustments are recognized to the assets and liabilities assumed, with the corresponding offset to goodwill, in the period inall acquisitions completed since January 1, 2021, which the adjustment amounts are determined. Acquisition-related costs associated withincludes only the acquisition are expensed as incurred.
|
|
|
|
2. Significant accounting policies (continued)
(k) New and amended accounting standards
In March 2020, the FASB issued an update to ASU 2020-04, Reference Rate Reform (Topic 848), Facilitation of the Effects of Reference Rate ReformSmartEquip, which was completed on Financial Reporting which addresses the effects of reference rate reform on financial reporting. ASU 2020-04 is effective for all entities as of March 12, 2020 through to December 31, 2022. If elected, and if certain criteria are met, this ASU requires less accounting analysis and recognition for modifications related to reference rate reform. The update issued provides optional expedients and exceptions for applying generally accepted accounting principles to contract modifications, hedging relationships, derivatives and other transactions affected by the reference rate reform that reference LIBOR or another reference rate expected to be discontinued.
It was announced in March 2021 that LIBOR rates are expected to cease to be published as early as December 31, 2021 and as late as June 30, 2023 depending on the jurisdiction and the term of the rate. As a result, we have assessed the impact of the expected reference rate reform on our consolidated financial statements. Currently, the Company has one contract, the Credit Agreement (see Note 16) that references LIBOR. Our Credit Agreement was modified on August 14, 2020 which included the addition of LIBOR-successor rate language related to the reference rate reform. The Credit Agreement’s modified reference rate reform language does not specify the LIBOR-successor rates to be used, however, it does allow the parties to agree on a successor rate once LIBOR ceases being published, without the requirement for the contract to be modified. As a result, the adoption of the ASU and the recent updates have not and are not expected to have a material impact on our consolidated financial statements. However, if applicable, the Company will use the optional expedients available when reference rate changes occur.November 2, 2021.
3. Significant judgments, estimates and assumptions
The preparation of financial statements in conformity with US GAAP requires management to make judgments, estimates and assumptions that affect the reported amounts of assets and liabilities and the disclosure of contingent liabilities at the date of the financial statements, and the reported amounts of revenues and expenses during the reporting period.
Future differences arising between actual results and the judgments, estimates and assumptions made by the Company at the reporting date, or future changes to estimates and assumptions, could necessitate adjustments to the underlying reported amounts of assets, liabilities, revenues and expenses in future reporting periods.
Judgments, estimates and underlying assumptions are evaluated on an ongoing basis by management and are based on historical experience and other factors, including expectations of future events that are believed to be reasonable under the circumstances. However, existing circumstances and assumptions about future developments may change due to market changes or circumstances and such changes are reflected in the assumptions when they occur.
Significant items subject to estimates includeand judgments during the recoverable amountssix months ended June 30, 2022 were made in accounting for the completed sale and leaseback transaction of goodwill and indefinite-lived intangible assets,our Bolton property (Note 15 & Note 21). The Company determined the useful livesfollowing estimates in calculating the gain on sale: the present value of long-lived assets and finite-lived intangible assets, share-based compensation, share-based continuing employment costs,market rental payments of the determination ofBolton property sold, the expected lease term in the leaseback arrangement and lease liabilities, deferred income taxes, reserves for tax uncertainties, and other contingencies. Accounting for business combinations requires estimates with respect to the fair valueCompany’s incremental borrowing rate based on information available at the commencement date of the assets acquired and liabilities assumed. Such estimates of fair value may require valuation methods which use significant estimates and assumptions. At the acquisition of Rouse Services LLC (“Rouse”), we estimated the fair value of the intangible assets acquired, using a valuation method, which required management to make estimates with respect to expected future cash flows and growth rates, gross margins, attrition rates, royalty rates, discount rates, terminal value, and forecast period. The Company based these estimates on historical and anticipated results, industry trends, economic analysis, and various other assumptions that it believes are reasonable, including assumptions as to future events.
As of June 30, 2021, the Company performed a qualitative assessment of the A&M, Rouse, and Mascus reporting units and the Company concluded there were no indicators of impairment.lease.
| |
Ritchie Bros. | 8 |
4. Seasonality
The Company’s operations are both seasonal and event driven. Revenues tendRevenue tends to be the highest during the second and fourth calendar quarters as the Company generally conducts more auctions during these quarters. Volumes tend to also be lower during the third quarter, as supply of used equipment is lower as it is actively being used and not available for sale. Late December through mid-February and mid-July through August are traditionally less active periods.
The restrictions imposed and effects of the overall economic environment as a result of the COVID-19 pandemic may continue to impact these trends.
|
|
|
|
5. Business combinations
Rouse acquisition
(a) | SmartEquip acquisition |
On December 8, 2020,November 2, 2021, the Company acquired all of the issued and outstanding unitscommon shares of RouseSmartEquip for a total cash purchase price of $173,743,000. During the first quarter of 2022, the Company finalized the net working capital adjustment under the purchase agreement and increased the purchase price by $63,000, resulting in a total purchase price of $251,724,000. The Company paid cash consideration$173,806,000.
SmartEquip is an innovative technology platform that supports customers' management of $250,265,000 of which $2,169,000 was placed in escrow. In the second quarter of 2021, the Company received a post-closing release from escrow of $728,000 related to net working capital adjustments, resulting in total net cash consideration paid of $249,537,000 as of June 30, 2021.
Rouse is a leading provider of construction equipment market data intelligencelifecycle and performance benchmarking solutions. Rouse provides appraisals to asset backed lenders, market intelligence and software to rental companies, contractors and dealers to optimize the usedintegrates parts procurement with both original equipment sales process, and comparisons of rental rates, utilization, and other key performance metrics to industry benchmarks for rental companiesmanufacturers and dealers. The combination of Rouse with the Company is expected to enhance the data analytics and service offerings available to customers.
The acquisition was accounted for in accordance with ASC 805, Business Combinations. The following table summarizes the fair valuepreliminary allocation of consideration transferred at the date of acquisition, as well as the final purchase price allocation ofto the fair value of assets acquired and liabilities assumed.
| | | |
|
| December 8, 2020 | |
Total cash consideration paid | | $ | 249,537 |
Equity consideration paid for pre-combination services | |
| 1,459 |
Final purchase price | | $ | 250,996 |
RouseSmartEquip purchase price allocation
| | | | |||
|
| December 8, 2020 | | | | |
Purchase price | | $ | 250,996 | | $ | 173,806 |
| |
|
| |
|
|
Assets acquired: | |
|
| |
|
|
Cash and cash equivalents | | $ | 226 | | $ | 2,039 |
Trade and other receivables | |
| 4,601 | |
| 2,926 |
Other current assets | | | 159 | | | 486 |
Property, plant and equipment | |
| 1,171 | |
| 120 |
Other non-current assets | |
| 3,741 | |
| 75 |
Deferred tax assets | |
| 7,584 | |
| 8,932 |
Intangible assets | |
| 79,300 | |
| 71,700 |
| |
|
| |
|
|
Liabilities assumed: | |
|
| |
|
|
Trade and other payables | |
| 5,630 | |||
Trade and other liabilities | |
| 1,239 | |||
Deferred revenue | | | 3,565 | |||
Other non-current liabilities | | | 3,188 | | | 119 |
Deferred tax liabilities | |
| 936 | |
| 18,192 |
| | | | | | |
Fair value of identifiable net assets acquired | |
| 87,028 | |
| 63,163 |
Goodwill acquired on acquisition | | $ | 163,968 | | $ | 110,643 |
The deferred tax assets are presented net of a $1,486,000 valuation allowance.
The following table summarizes the fair values of the identifiable intangible assets acquired:
| | | | | |
| | Fair value | | Weighted average | |
Asset | | at acquisition | | amortization period | |
Customer relationships | | $ | 50,700 | | 4 - 15 years |
Software and technology assets | | | 18,900 | | 7 years |
Trade names and trademarks | | | 1,000 | | 3 years |
Backlog | | | 1,100 | | 2 years |
Total | | $ | 71,700 | | 11.3 years |
| |
Ritchie Bros. |
|
5. Business combinations (continued)
RouseSmartEquip purchase price allocation (continued)
The following table summarizesamounts included in the SmartEquip provisional purchase price allocation are preliminary in nature and are subject to adjustment as additional information is obtained about the facts and circumstances that existed at the date of the acquisition. The final determination of the fair values of the identifiable intangiblecertain assets acquired:
| | | | | |
| | Fair value | | Weighted average | |
Asset | | at acquisition | | amortization period | |
Customer relationships | |
| 71,000 | | 15 years |
Software and technology assets | | | 7,500 | | 4 years |
Trade names and trademarks | | $ | 800 | | 2 years |
Total | | $ | 79,300 | | 13.8 years |
Duringand liabilities will be completed within the quarter ended March 31, 2021 the Company recorded an adjustment of $603,000 to increase the liabilities assumed and increase the goodwill acquired on acquisition. During the quarter ended June 30, 2021 the Company finalized the net working capital adjustment under the purchase agreement and reduced the purchase price by $728,000. The Company also recorded an adjustment of $1,677,000 to reduce the liabilities assumed on acquisition. These measurement period adjustments, sinceof up to one year from the acquisition resulted indate. Adjustments to the preliminary values during the measurement period may impact the amounts recorded as assets and liabilities with a total net decreasecorresponding adjustment to goodwill of $1,802,000.
The purchase price allocation has been finalized as of June 30, 2021. As at Q2, 2021, $1,169,000 continues toand will be heldrecognized in escrow until December 4, 2021 or until such date that a joint decision is made for the funds to be released.period in which the adjustments are determined.
Goodwill
Goodwill has been assigned and allocated to “Other” for segmented information purposes and is based on an analysis of the fair value of net assets acquired. Goodwill relates to benefits expected from the acquisition of Rouse’sSmartEquip’s business, its assembled workforce and associated technical expertise, as well as anticipated synergies from applying the Company’s auction expertise and transactional capabilities to Rouse’sSmartEquip’s existing customer base. The transaction is considered a taxablenon-taxable business combination and all of the goodwill is not deductible for tax purposes.
Transactions recognized separately from the acquisition of assets and assumptionassumptions of liabilities
At the date of acquisition, the Company issued 312,19363,971 common shares to certain previous unitholdersshareholders of RouseSmartEquip in return for their continuing employment service. The common shares are expected to vest at various vesting datesone third on each anniversary date of the acquisition over a three-year period from the date of acquisition as continuing employment services are provided to the Company. At the date of acquisition, the Company estimated that it will recognize a total fair value of $20,735,000$4,375,000 share-based continuing employment costs in acquisition-related costs over the vesting period, with an increase to additional paid-in capital, subject to continuing employment of those individuals. As and when the common shares vest, the Company will recognize the fair value of the issued common shares from additional paid-in capital to share capital.
During the three month period ended March 31, 2021, one of the previous unitholders of Rouse, who became an employee of the Company after the acquisition, terminated their employment contract which resulted in the forfeiture of 55,510 shares as no vesting conditions had been achieved and reversal of share based continuing employment costs of $98,000. As a result, as at June 30, 2021, the number of common shares expected to vest is 256,683 and the total unrecognized fair value of the share-based continuing employment costs expected to be recognized is $11,898,000capital (Note 18)19).
During the quarter ended June 30, 2021,2022, the Company recorded $3,049,000$668,000 of acquisition-related costs, for legal, advisory, integration and other professional fees,all of which included $2,678,000 ofrelated to share-based continuing employment costs.
(b) | Euro Auctions acquisition |
On August 9, 2021, the Company entered into a Sale and Purchase Agreement (“SPA”) pursuant to which it agreed to purchase Euro Auctions Limited, William Keys & Sons Holdings Limited, Equipment & Plant Services Ltd, and Equipment Sales Ltd. (collectively, “Euro Auctions”), each being a private limited company incorporated in Northern Ireland (the “Euro Auctions Acquisition”).
Under the terms of the SPA, the Company was to acquire all of the outstanding shares of Euro Auctions from their existing shareholders for approximately £775,000,000 (approximately $1.02 billion) cash consideration, to be paid on closing. On April 29, 2022, the Company made a decision to discontinue the Phase 2 review by the United Kingdom’s Competition and Markets Authority (“CMA”). The SPA automatically terminated on June 28, 2022. In addition, in April 2022, the Company terminated, without cost, its deal contingent forward currency contracts (Note 13) and on May 4, 2022, redeemed all of the 2021 Notes (Note 17) at a redemption price equal to 100% of the original offering price of the notes, plus accrued and unpaid interest..
| |
Ritchie Bros. |
|
6. Segmented information
The Company’s principal business activity is the management and disposition of used industrial equipment and other durable assets. The Company’s operations are comprised of 1 reportable segment and other business activities that are not reportable as follows:
● | Auctions and Marketplaces – This is the Company’s only reportable segment, which consists of the Company’s live |
● | Other includes the results of |
| | | | | | | | | | | | | | | | | | | | | | | | | | | | | | | | | | | | | |
| | Three months ended June 30, 2021 | | Six months ended June 30, 2021 | | | Three months ended June 30, 2022 | | Six months ended June 30, 2022 | ||||||||||||||||||||||||||||
|
| A&M |
| Other |
| Consolidated |
| A&M |
| Other |
| Consolidated | |
| A&M |
| Other |
| Consolidated |
| A&M |
| Other |
| Consolidated | ||||||||||||
Service revenue | | $ | 211,475 | | $ | 41,273 | | $ | 252,748 | | $ | 382,230 | | $ | 76,548 | | $ | 458,778 | | ||||||||||||||||||
Service revenue: | | | | | | | | | | | | | | | | | | | |||||||||||||||||||
Commissions | | $ | 136,403 | | $ | — | | $ | 136,403 | | $ | 252,778 | | $ | — | | $ | 252,778 | |||||||||||||||||||
Fees | | | 98,588 | | | 51,511 | | | 150,099 | | | 183,217 | | | 95,368 | | | 278,585 | |||||||||||||||||||
Total service revenue | | | 234,991 | | | 51,511 | | | 286,502 | | | 435,995 | | | 95,368 | | | 531,363 | |||||||||||||||||||
Inventory sales revenue | |
| 143,613 | |
| — | |
| 143,613 | |
| 269,138 | |
| — | |
| 269,138 | | |
| 198,044 | |
| — | |
| 198,044 | |
| 347,104 | |
| — | |
| 347,104 |
Total revenue | | $ | 355,088 | | $ | 41,273 | | $ | 396,361 | | $ | 651,368 | | $ | 76,548 | | $ | 727,916 | | | $ | 433,035 | | $ | 51,511 | | $ | 484,546 | | $ | 783,099 | | $ | 95,368 | | $ | 878,467 |
Costs of services | |
| 21,985 | |
| 17,057 | |
| 39,042 | |
| 43,575 | |
| 31,494 | |
| 75,069 | | |
| 28,985 | |
| 16,054 | |
| 45,039 | |
| 54,559 | |
| 29,495 | |
| 84,054 |
Cost of inventory sold | |
| 131,023 | |
| — | |
| 131,023 | |
| 241,770 | |
| — | |
| 241,770 | | |
| 176,171 | |
| — | |
| 176,171 | |
| 307,753 | |
| — | |
| 307,753 |
Selling, general and administrative expenses ("SG&A") | |
| 101,417 | |
| 10,402 | |
| 111,819 | |
| 205,762 | |
| 22,135 | |
| 227,897 | | ||||||||||||||||||
Selling, general and administrative | |
| 125,535 | |
| 18,742 | |
| 144,277 | |
| 234,346 | |
| 36,537 | |
| 270,883 | |||||||||||||||||||
Segment profit | | $ | 100,663 | | $ | 13,814 | | $ | 114,477 | | $ | 160,261 | | $ | 22,919 | | $ | 183,180 | | | $ | 102,344 | | $ | 16,715 | | $ | 119,059 | | $ | 186,441 | | $ | 29,336 | | $ | 215,777 |
Acquisition-related costs | |
|
| |
|
| |
| 3,049 | |
|
| |
|
| |
| 5,971 | | |
|
| |
|
| |
| 3,399 | |
|
| |
|
| |
| 13,036 |
Depreciation and amortization expenses ("D&A") | |
|
| |
|
| |
| 21,935 | |
|
| |
|
| |
| 43,005 | | ||||||||||||||||||
Gain on disposition of property, plant and equipment ("PPE") | |
|
| |
|
| |
| (175) | |
|
| |
|
| |
| (243) | | ||||||||||||||||||
Foreign exchange loss | |
|
| |
|
| |
| 151 | |
|
| |
|
| |
| 428 | | ||||||||||||||||||
Depreciation and amortization | |
|
| |
|
| |
| 24,298 | |
|
| |
|
| |
| 48,523 | |||||||||||||||||||
Foreign exchange gain | |
|
| |
|
| |
| (158) | |
|
| |
|
| |
| (322) | |||||||||||||||||||
Total operating expenses | | | | | | | | $ | 393,026 | | | | | | | | | 723,927 | |||||||||||||||||||
Gain on disposition of property, plant and equipment | |
|
| |
|
| |
| 347 | |
|
| |
|
| |
| 170,167 | |||||||||||||||||||
Operating income | |
|
| |
|
| | $ | 89,517 | |
|
| |
|
| | $ | 134,019 | | |
|
| |
|
| | $ | 91,867 | |
|
| |
|
| | $ | 324,707 |
Interest expense | |
|
| |
|
| |
| (8,867) | |
|
| |
|
| |
| (17,813) | | |
|
| |
|
| |
| (18,463) | |
|
| |
|
| |
| (39,149) |
Change in fair value of derivatives | | | | | | | | | — | | | | | | | | | 1,263 | |||||||||||||||||||
Other income, net | |
|
| |
|
| |
| 1,196 | |
|
| |
|
| |
| 2,198 | | |
|
| |
|
| |
| 1,639 | |
|
| |
|
| |
| 2,559 |
Income tax expense | |
|
| |
|
| |
| (21,065) | |
|
| |
|
| |
| (29,484) | | |
|
| |
|
| |
| (21,632) | |
|
| |
|
| |
| (57,868) |
Net income | |
|
| |
|
| | $ | 60,781 | |
|
| |
|
| | $ | 88,920 | | |
|
| |
|
| | $ | 53,411 | |
|
| |
|
| | $ | 231,512 |
| | | | | | | | | | | | | | | | | | | |
| | Three months ended June 30, 2020 | | Six months ended June 30, 2020 | | ||||||||||||||
|
| A&M |
| Other |
| Consolidated |
| A&M |
| Other |
| Consolidated | | ||||||
Service revenue | | $ | 199,648 | | $ | 34,491 | | $ | 234,139 | | $ | 354,391 | | $ | 62,871 | | $ | 417,262 | |
Inventory sales revenue | |
| 154,911 | |
| — | |
| 154,911 | |
| 245,043 | |
| — | |
| 245,043 | |
Total revenue | | $ | 354,559 | | $ | 34,491 | | $ | 389,050 | | $ | 599,434 | | $ | 62,871 | | $ | 662,305 | |
Costs of services | |
| 22,190 | |
| 17,258 | |
| 39,448 | |
| 47,285 | |
| 31,518 | |
| 78,803 | |
Cost of inventory sold | |
| 143,134 | |
| — | |
| 143,134 | |
| 224,719 | |
| — | |
| 224,719 | |
SG&A expenses | |
| 94,559 | |
| 6,073 | |
| 100,632 | |
| 186,144 | |
| 12,873 | |
| 199,017 | |
Segment profit | | $ | 94,676 | | $ | 11,160 | | $ | 105,836 | | $ | 141,286 | | $ | 18,480 | | $ | 159,766 | |
D&A expenses | |
|
| |
| | |
| 17,857 | |
|
| |
|
| |
| 37,150 | |
Gain on disposition of PPE | |
| | |
| | |
| (1,213) | |
|
| |
|
| |
| (1,260) | |
Foreign exchange loss | |
| | |
| | |
| 392 | |
|
| |
|
| |
| 994 | |
Operating income | |
| | |
| | | $ | 88,800 | |
|
| |
|
| | $ | 122,882 | |
Interest expense | |
| | |
|
| |
| (8,882) | |
|
| |
|
| |
| (18,064) | |
Other income, net | |
| | |
|
| |
| 857 | |
|
| |
|
| |
| 4,434 | |
Income tax expense | |
|
| |
|
| |
| (27,656) | |
|
| |
|
| |
| (33,304) | |
Net income | |
|
| |
|
| | $ | 53,119 | |
|
| |
|
| | $ | 75,948 | |
The Chief operating decision maker “CODM” does not evaluate the performance of the Company’s operating segments or assess allocation of resources based on segment assets and liabilities, nor does the Company classify liabilities on a segmented basis.
| | | | | | | | | | | | | | | | | | |
| | Three months ended June 30, 2021 | | Six months ended June 30, 2021 | ||||||||||||||
|
| A&M |
| Other |
| Consolidated |
| A&M |
| Other |
| Consolidated | ||||||
Service revenue: | | | | | | | | | | | | | | | | | | |
Commissions | | $ | 129,334 | | $ | — | | $ | 129,334 | | $ | 233,309 | | $ | — | | $ | 233,309 |
Fees | | | 83,334 | | | 40,080 | | | 123,414 | | | 151,430 | | | 74,039 | | | 225,469 |
Total service revenue | | | 212,668 | | | 40,080 | | | 252,748 | | | 384,739 | | | 74,039 | | | 458,778 |
Inventory sales revenue | |
| 143,613 | |
| — | |
| 143,613 | |
| 269,138 | |
| — | |
| 269,138 |
Total revenue | | $ | 356,281 | | $ | 40,080 | | $ | 396,361 | | $ | 653,877 | | $ | 74,039 | | $ | 727,916 |
Costs of services | |
| 25,176 | |
| 16,125 | |
| 41,301 | |
| 49,480 | |
| 29,687 | |
| 79,167 |
Cost of inventory sold | |
| 131,023 | |
| — | |
| 131,023 | |
| 241,770 | |
| — | |
| 241,770 |
Selling, general and administrative | |
| 99,215 | |
| 10,345 | |
| 109,560 | |
| 201,996 | |
| 21,803 | |
| 223,799 |
Segment profit | | $ | 100,867 | | $ | 13,610 | | $ | 114,477 | | $ | 160,631 | | $ | 22,549 | | $ | 183,180 |
Acquisition-related costs | |
| | |
|
| |
| 3,049 | |
|
| |
|
| |
| 5,971 |
Depreciation and amortization | |
|
| |
| | |
| 21,935 | |
|
| |
|
| |
| 43,005 |
Foreign exchange loss | |
| | |
| | |
| 151 | |
|
| |
|
| |
| 428 |
Total operating expenses | | | | | | | | $ | 307,019 | | | | | | | | | 594,140 |
Gain on disposition of property, plant and equipment | |
| | |
| | |
| 175 | |
|
| |
|
| |
| 243 |
Operating income | |
| | |
| | | $ | 89,517 | |
|
| |
|
| | $ | 134,019 |
Interest expense | |
| | |
|
| |
| (8,867) | |
|
| |
|
| |
| (17,813) |
Other income, net | |
| | |
|
| |
| 1,196 | |
|
| |
|
| |
| 2,198 |
Income tax expense | |
|
| |
|
| |
| (21,065) | |
|
| |
|
| |
| (29,484) |
Net income | |
|
| |
|
| | $ | 60,781 | |
|
| |
|
| | $ | 88,920 |
| |
Ritchie Bros. |
|
6. Segmented information (continued)
The Chief Operating Decision Maker does not evaluate the performance of the Company’s operating segments or assess allocation of resources based on segment assets and liabilities, nor does the Company classify liabilities on a segmented basis.
The Company’s geographic breakdown of total revenue and location is as follows:
| | | | | | | | | | | | | | | | ||||||||||||||||||
| | United | | | | | | |
| | | | | | | | | | | | | | | | | | | | | | | ||
| | States | | Canada | | Europe | | Other | | Consolidated | | United | | | | | | | | | |
| | | | | | ||||||
Total revenue for the three months ended: |
| |
|
| |
|
| |
|
| |
|
| |
| | States | | Canada | | Australia | | Europe | | Other | | Consolidated | ||||||
June 30, 2022 | | $ | 215,466 | | $ | 143,466 | | $ | 71,734 | | $ | 36,989 | | $ | 16,891 | | $ | 484,546 | |||||||||||||||
June 30, 2021 | | $ | 183,391 | | $ | 98,690 | | $ | 55,467 | | $ | 58,813 | | $ | 396,361 | | | 183,391 | |
| 98,690 | | | 44,514 | |
| 55,467 | |
| 14,299 | |
| 396,361 |
June 30, 2020 | | | 204,588 | |
| 97,990 | |
| 47,430 | |
| 39,042 | |
| 389,050 | ||||||||||||||||||
Total revenue for the six months ended: | |
| | | | | | | | | | | | | | |
| | | | | | | | | | | | | | | | |
June 30, 2022 | | $ | 463,416 | | $ | 208,699 | | $ | 100,809 | | $ | 74,809 | | $ | 30,734 | | $ | 878,467 | |||||||||||||||
June 30, 2021 | | $ | 390,805 | | | 147,168 | | $ | 102,643 | | $ | 87,300 | | $ | 727,916 | | | 390,805 | |
| 147,168 | | | 64,077 | |
| 102,643 | |
| 23,223 | |
| 727,916 |
June 30, 2020 | | | 395,118 | |
| 133,633 | |
| 73,768 | |
| 59,786 | |
| 662,305 |
7. Revenue
The Company’s revenue from the rendering of services is as follows:
| | | | | | | | | | | | | | | | | | | | | | | | | |
| | Three months ended | | Six months ended | | | Three months ended | | Six months ended | ||||||||||||||||
|
| June 30, | | June 30, | |
| June 30, | | June 30, | ||||||||||||||||
|
| 2021 | | 2020 | | 2021 | | 2020 | |
| 2022 | | 2021 | | 2022 | | 2021 | ||||||||
Service revenue: | | |
|
| |
|
| |
|
| |
| | | |
|
| |
|
| |
|
| |
|
Commissions | | $ | 129,334 | | $ | 125,465 | | $ | 233,309 | | $ | 218,950 | | | $ | 136,403 | | $ | 129,334 | | $ | 252,778 | | $ | 233,309 |
Fees | |
| 123,414 | |
| 108,674 | |
| 225,469 | |
| 198,312 | | |
| 150,099 | |
| 123,414 | |
| 278,585 | |
| 225,469 |
| |
| 252,748 | |
| 234,139 | |
| 458,778 | |
| 417,262 | | |
| 286,502 | |
| 252,748 | |
| 531,363 | |
| 458,778 |
Inventory sales revenue | |
| 143,613 | |
| 154,911 | |
| 269,138 | |
| 245,043 | | |
| 198,044 | |
| 143,613 | |
| 347,104 | |
| 269,138 |
| | $ | 396,361 | | $ | 389,050 | | $ | 727,916 | | $ | 662,305 | | | $ | 484,546 | | $ | 396,361 | | $ | 878,467 | | $ | 727,916 |
| |
Ritchie Bros. | 12 |
8. Operating expenses
Costs of services
| | | | | | | | | | | | | | | | | | | | | | | | | |
| | Three months ended | | Six months ended | | | Three months ended | | Six months ended | ||||||||||||||||
| | June 30, | | June 30, | | | June 30, | | June 30, | ||||||||||||||||
|
| 2021 |
| 2020 |
| 2021 |
| 2020 | |
| 2022 |
| 2021 |
| 2022 |
| 2021 | ||||||||
| | | | | | | | | | | | | |||||||||||||
Employee compensation expenses | | $ | 17,045 | | $ | 14,953 | | $ | 32,966 | | $ | 29,483 | |||||||||||||
Ancillary and logistical service expenses | | $ | 14,819 |
| $ | 16,060 | | $ | 27,088 |
| $ | 28,818 | | | | 13,446 |
| | 14,819 | | | 24,201 |
| | 27,088 |
Employee compensation expenses | | | 12,694 | |
| 11,311 | | | 25,385 | |
| 23,615 | | ||||||||||||
Buildings, facilities and technology expenses | | | 2,304 | |
| 2,076 | | | 5,005 | |
| 6,115 | | ||||||||||||
Travel, advertising and promotion expenses | | | 5,299 | |
| 6,161 | | | 9,817 | |
| 12,736 | | | | 7,200 | |
| 5,299 | | | 12,372 | |
| 9,817 |
Other costs of services | | | 3,926 | |
| 3,840 | | | 7,774 | |
| 7,519 | | | | 4,323 | |
| 3,926 | | | 7,636 | |
| 7,774 |
Buildings, facilities and technology expenses | | | 3,025 | |
| 2,304 | | | 6,879 | |
| 5,005 | |||||||||||||
| | $ | 39,042 | | $ | 39,448 | | $ | 75,069 | | $ | 78,803 | | | $ | 45,039 | | $ | 41,301 | | $ | 84,054 | | $ | 79,167 |
SG&A expensesSelling, general and administrative
| | | | | | | | | | | | | | | | | | | | | | | | | |
| | Three months ended | | Six months ended | | | Three months ended | | Six months ended | ||||||||||||||||
| | June 30, |
| June 30, | | | June 30, |
| June 30, | ||||||||||||||||
|
| 2021 |
| 2020 |
| 2021 |
| 2020 | |
| 2022 |
| 2021 |
| 2022 |
| 2021 | ||||||||
Wages, salaries and benefits | | $ | 70,191 | | $ | 64,453 | | $ | 148,987 | | $ | 124,541 | | | $ | 84,301 | | $ | 67,932 | | $ | 161,787 | | $ | 144,889 |
Share-based compensation expense | | | 7,540 | | | 6,354 | | | 11,318 | | | 8,761 | | | | 13,640 | | | 7,540 | | | 19,026 | | | 11,318 |
Buildings, facilities and technology expenses | |
| 17,479 |
| | 14,616 | |
| 34,822 | |
| 30,207 | | |
| 23,327 |
| | 17,479 | |
| 43,412 | |
| 34,822 |
Travel, advertising and promotion expenses | |
| 6,824 |
| | 4,817 | |
| 11,986 | |
| 15,086 | | |
| 9,392 |
| | 6,824 | |
| 17,366 | |
| 11,986 |
Professional fees | |
| 5,202 |
| | 4,577 | |
| 10,234 | |
| 9,024 | | |
| 7,616 |
| | 5,202 | |
| 17,363 | |
| 10,234 |
Other SG&A expenses | |
| 4,583 |
| | 5,815 | |
| 10,550 | |
| 11,398 | | ||||||||||||
Other selling, general and administrative | |
| 6,001 |
| | 4,583 | |
| 11,929 | |
| 10,550 | |||||||||||||
| | $ | 111,819 |
| $ | 100,632 | | $ | 227,897 | | $ | 199,017 | | | $ | 144,277 |
| $ | 109,560 | | $ | 270,883 | | $ | 223,799 |
Acquisition-related costs
| | | | | | | | | | | | |
| | Three months ended | | Six months ended | ||||||||
| | June 30, | | June 30, | ||||||||
|
| 2022 |
| 2021 |
| 2022 |
| 2021 | ||||
SmartEquip: | | | | | | | | | | | | |
Share-based continuing employment costs | | $ | 668 | | $ | — | | $ | 1,326 | | $ | — |
Other acquisition-related costs | | | — | | | — | | | 516 | | | — |
| | | | | | | | | | | | |
Euro Auctions: | | | | | | | | | | | | |
Other acquisition-related costs | | | 1,317 | | | — | | | 8,012 | | | — |
| | | | | | | | | | | | |
Rouse: | | | | | | | | | | | | |
Share-based continuing employment costs | | | 1,414 | | | 2,678 | | | 2,887 | | | 5,231 |
Other acquisition-related costs | | | — | | | 371 | | | 295 | | | 740 |
| | $ | 3,399 | | $ | 3,049 | | $ | 13,036 |
| $ | 5,971 |
Depreciation and amortization
| | | | | | | | | | | | |
| | Three months ended | | Six months ended | ||||||||
| | June 30, |
| June 30, | ||||||||
|
| 2022 |
| 2021 |
| 2022 |
| 2021 | ||||
Depreciation | | $ | 7,889 | | $ | 8,345 | | $ | 15,636 | | $ | 16,182 |
Amortization | |
| 16,409 | |
| 13,590 | |
| 32,887 | |
| 26,823 |
| | $ | 24,298 | | $ | 21,935 | | $ | 48,523 | | $ | 43,005 |
| |
Ritchie Bros. |
|
8. Operating expenses (continued)
Depreciation and amortization expenses
| | | | | | | | | | | | | |
| | Three months ended | | Six months ended | | ||||||||
| | June 30, |
| June 30, | | ||||||||
|
| 2021 |
| 2020 |
| 2021 |
| 2020 | | ||||
Depreciation expense | | $ | 8,345 | | $ | 7,536 | | $ | 16,182 | | $ | 15,573 | |
Amortization expense | |
| 13,590 | |
| 10,321 | |
| 26,823 | |
| 21,577 | |
| | $ | 21,935 | | $ | 17,857 | | $ | 43,005 | | $ | 37,150 | |
9. Income taxes
At the end of each interim period, the Company estimates the effective tax rate expected to be applicable for the full fiscal year. The estimate reflects, among other items, management’s best estimate of operating results. It does not include the estimated impact of foreign exchange rates or unusual and/or infrequent items, which may cause significant variations in the customary relationship between income tax expense and income before income taxes.
For the three months ended June 30, 2021,2022, income tax expense was $21,065,000$21,632,000, compared to an income tax expense of $27,656,000$21,065,000 for the same period in 2020.2021. The effective tax rate was 29% in the second quarter of 2022, compared to 26% in the second quarter of 2021, compared to 34% in the second quarter of 2020.
2021. The effective tax rate decreasedincreased in the three months ended June 30, 20212022 compared to the three months ended June 30, 20202021 primarily due to higher return to provision adjustments and higher income taxes related to tax uncertainties. Partially offsetting this increase was a lower estimate of non-deductible expenses.
For the six months ended June 30, 2022, income tax expense was $57,868,000, compared to an income tax expense of $29,484,000 for the same period in 2021. The effective tax rate was 20% for the six months ended June 30, 2022, compared to 25% for the six months ended June 30, 2021. The effective tax rate decreased in the six months ended June 30, 2022 compared to the six months ended June 30, 2021 primarily due to the non-taxable gain portion on the sale of a parcel of land including all buildings in Bolton, Ontario and a decrease in the estimate of non-deductible expenses.
Partially offsetting this decrease was a higher estimate of income taxed in jurisdictions with higher tax rates.
On April 8, 2020rates and a lower tax deduction for performance share units (“PSUs”) and restricted share units (“RSUs”) expenses that exceeded the United States Department of Treasury and the Internal Revenue Service (“IRS”) clarified income tax benefits related to hybrid financing arrangements would not be deductible (“Hybrid Interest”). The lower estimate of non-deductible expenses is primarily due to the net income tax benefits of approximately $6,228,000 in the twelve months ended December 31, 2019 and $1,072,000 in the three months ended March 31, 2020 which were no longer deductible and accordingly were reversed in the three months ended June 30, 2020.
For the six months ended June 30, 2021, income tax expense was $29,484,000, compared to an income tax expense of $33,304,000 for the same period in 2020. The effective tax rate was 25% for the six months ended June 30, 2021, compared to 30% for the six months ended June 30, 2020.compensation expense.
The effectiveCanada Revenue Agency (“CRA”) is currently conducting an audit of the Company’s 2014, 2015, 2017, and 2018 taxation years. Management believes that the Company is in full compliance with Canadian tax rate decreasedlaws. However, the CRA could challenge the manner in which the six months ended June 30, 2021 comparedCompany has filed its income tax returns and reported its income. In the event that the CRA challenges the manner in which the Company has filed its tax returns and reported its income, the Company will have the option to appeal any such decision. If the six months ended June 30, 2020 primarily due toCompany is not successful, however, the reasons described above. In addition, there wasCRA audit could potentially result in additional income taxes, penalties, and interest, which could have a higher tax deduction for share unit expenses in excess of compensation expense.
material adverse effect on the Company.
| |
Ritchie Bros. |
|
10. Earnings per share attributable to stockholders
Basic earnings per share (“EPS”) attributable to stockholders was calculated by dividing the net income attributable to stockholders by the weighted average (“WA”) number of common shares outstanding during the period. Diluted EPS attributable to stockholders was calculated by dividing the net income attributable to stockholders by the weighted average number of shares of common stock outstanding if the potentially dilutive securities had been issued. Potentially dilutive securities include unvested PSUs, unvested RSUs, and outstanding stock options. The dilutive effect of potentially dilutive securities is reflected in diluted EPS by application of the treasury stock method. Under the treasury stock method, an increase in the fair market value of the Company’s common stock can result in a greater dilutive effect from potentially dilutive securities.
| | | | | | | | | | | | | | | | | | | | | | | | | | | | | | | | |
| | Three months ended | | Six months ended | | Three months ended | | Six months ended | ||||||||||||||||||||||||
| | June 30, 2021 | | June 30, 2021 | | June 30, 2022 | | June 30, 2022 | ||||||||||||||||||||||||
| | Net income | | WA | | Per | | Net income | | WA | | Per | | Net income | | WA | | Per | | Net income | | WA | | Per | ||||||||
|
| attributable to |
| number |
| share | | attributable to |
| number |
| share |
| attributable to |
| number |
| share | | attributable to |
| number |
| share | ||||||||
|
| stockholders |
| of shares |
| amount |
| stockholders |
| of shares |
| amount |
| stockholders |
| of shares |
| amount | | stockholders |
| of shares |
| amount | ||||||||
Basic | | $ | 60,749 |
| 110,311,615 | | $ | 0.55 | | $ | 88,937 |
| 110,144,229 | | $ | 0.81 | | $ | 53,365 |
| 110,760,339 | | $ | 0.48 | | $ | 231,459 |
| 110,705,182 | | $ | 2.09 |
Effect of dilutive securities: | |
| |
| | |
| | |
| |
| | |
| | |
| |
| | |
| | |
| |
| | |
| |
Share units | |
| — |
| 322,371 | |
| — | |
| — |
| 450,752 | |
| | |
| — |
| 397,274 | |
| — | |
| — |
| 423,767 | |
| (0.01) |
Stock options | |
| — |
| 700,198 | |
| — | |
| — |
| 707,730 | |
| (0.01) | |
| — |
| 547,489 | |
| — | |
| — |
| 552,695 | |
| (0.01) |
Diluted | | $ | 60,749 |
| 111,334,184 | | $ | 0.55 | | $ | 88,937 |
| 111,302,711 | | $ | 0.80 | | $ | 53,365 |
| 111,705,102 | | $ | 0.48 | | $ | 231,459 |
| 111,681,644 | | $ | 2.07 |
| | | | | | | | | | | | | | | | | | | | | | | | | | | | | | | | |
| | Three months ended | | Six months ended | | Three months ended | | Six months ended | ||||||||||||||||||||||||
| | June 30, 2020 | | June 30, 2020 | | June 30, 2021 | | June 30, 2021 | ||||||||||||||||||||||||
| | Net income | | WA | | Per | | Net income | | WA | | Per | | Net income | | WA | | Per | | Net income | | WA | | Per | ||||||||
|
| attributable to |
| number |
| share | | attributable to |
| number |
| share |
| attributable to |
| number |
| share | | attributable to |
| number |
| share | ||||||||
|
| stockholders |
| of shares |
| amount |
| stockholders |
| of shares |
| amount |
| stockholders |
| of shares |
| amount |
| stockholders |
| of shares |
| amount | ||||||||
Basic | | $ | 53,043 | | 108,387,490 | | $ | 0.49 | | $ | 75,851 |
| 108,818,903 | | $ | 0.70 | | $ | 60,749 | | 110,311,615 | | $ | 0.55 | | $ | 88,937 |
| 110,144,229 | | $ | 0.81 |
Effect of dilutive securities: | | | | | | | | | |
| |
| | |
| | | | | | | | | | |
| |
| | |
| |
Share units | | | — | | 424,812 | | | — | |
| — |
| 505,443 | |
| — | | | — | | 322,371 | | | — | |
| — |
| 450,752 | |
| — |
Stock options | | | — | | 511,041 | | | — | |
| — |
| 579,462 | |
| (0.01) | | | — | | 700,198 | | | — | |
| — |
| 707,730 | |
| (0.01) |
Diluted | | $ | 53,043 | | 109,323,343 | | $ | 0.49 | | $ | 75,851 |
| 109,903,808 | | $ | 0.69 | | $ | 60,749 | | 111,334,184 | | $ | 0.55 | | $ | 88,937 |
| 111,302,711 | | $ | 0.80 |
| |
Ritchie Bros. |
|
11. Supplemental cash flow information
| | | | | | | |
Six months ended June 30, | | 2021 | | 2020 | | ||
Trade and other receivables |
| $ | (134,522) |
| $ | (191,182) | |
Inventory | | | (2,207) | | | 1,447 | |
Advances against auction contracts | | | (761) | | | 5,207 | |
Prepaid expenses and deposits | | | 3,157 | | | 1,980 | |
Income taxes receivable | | | (3,847) | | | 2,873 | |
Auction proceeds payable | | | 230,309 | | | 222,006 | |
Trade and other payables | | | (20,686) | | | 19,769 | |
Income taxes payable | | | (12,723) | | | 8,852 | |
Operating lease obligation | | | (6,329) | | | (6,167) | |
Other | | | 186 | | | (1,961) | |
Net changes in operating assets and liabilities |
| $ | 52,577 |
| $ | 62,824 | |
Net changes in operating assets and liabilities
| | | | | | | |
Six months ended June 30, | | 2021 | | 2020 | | ||
Interest paid, net of interest capitalized |
| $ | 16,387 |
| $ | 16,524 | |
Interest received | | | 635 | | | 1,265 | |
Net income taxes paid | | | 43,249 | | | 13,850 | |
| | | | | | | |
Non-cash purchase of property, plant and equipment under finance lease |
| | 4,568 |
| | 5,930 | |
Non-cash right of use assets obtained (reassessed) in exchange for new lease obligations |
| | 9,451 |
| | (139) | |
| | | | | | | |
Six months ended June 30, | | 2022 | | 2021 | | ||
Trade and other receivables |
| $ | (152,893) |
| $ | (134,522) | |
Inventory | | | (25,842) | | | (2,207) | |
Advances against auction contracts | | | (11,238) | | | (761) | |
Prepaid expenses and deposits | | | 20,774 | | | 3,157 | |
Income taxes receivable | | | 6,985 | | | (3,847) | |
Auction proceeds payable | | | 205,910 | | | 230,309 | |
Trade and other liabilities | | | (22,639) | | | (20,686) | |
Income taxes payable | | | 25,866 | | | (12,723) | |
Operating lease obligation | | | (6,936) | | | (6,329) | |
Other | | | 1,857 | | | 186 | |
Net changes in operating assets and liabilities |
| $ | 41,844 |
| $ | 52,577 | |
| | | | | | | |
| | June 30, | | December 31, | | ||
| | 2021 | | 2020 | | ||
Cash and cash equivalents |
| $ | 301,757 | | $ | 278,766 | |
Restricted cash | | | 140,966 | | | 28,129 | |
Cash, cash equivalents, and restricted cash |
| $ | 442,723 | | $ | 306,895 | |
Interest and tax payments
| | | | | | |
Six months ended June 30, | | 2022 | | 2021 | ||
Interest paid, net of interest capitalized |
| $ | 20,846 |
| $ | 16,387 |
Interest received | | | 1,415 | | | 635 |
Net income taxes paid | | | 13,855 | | | 43,249 |
| | | | | | |
Non-cash purchase of property, plant and equipment under finance lease |
| | 5,261 |
| | 4,568 |
Non-cash right of use assets obtained in exchange for new lease obligations |
| | 18,472 |
| | 9,451 |
Cash, cash equivalents, and restricted cash
| | | | | | | |
| | June 30, | | December 31, | | ||
| | 2022 | | 2021 | | ||
Cash and cash equivalents |
| $ | 367,289 | | $ | 326,113 | |
Restricted cash | | | | | | | |
Current | | | 164,371 | | | 102,875 | |
Non-current | | | — | | | 933,464 | |
Cash, cash equivalents, and restricted cash |
| $ | 531,660 | | $ | 1,362,452 | |
12. Fair value measurement
All assets and liabilities for which fair value is measured or disclosed in the consolidated financial statements are categorized within the fair value hierarchy, described as follows, based on the lowest level input that is significant to the fair value measurement or disclosure:
● | Level 1: Unadjusted quoted prices in active markets for identical assets or liabilities that the entity can access at measurement date; |
● | Level 2: Inputs other than quoted prices included in Level 1 that are observable for the asset or liability, either directly or indirectly; and |
● | Level 3: Unobservable inputs for the asset or liability. |
| |
Ritchie Bros. |
|
12. Fair value measurement (continued)
| | | | | | | | | | | | | | | | | | | | | | | | | | | | |
| | | | June 30, 2021 | | December 31, 2020 | | | | June 30, 2022 | | December 31, 2021 | ||||||||||||||||
| | | | Carrying | | | | | Carrying | | | | | | | Carrying | | | | | Carrying | | | | ||||
|
| Category |
| amount |
| Fair value |
| amount |
| Fair value |
| Category |
| amount |
| Fair value |
| amount |
| Fair value | ||||||||
Fair values disclosed: |
|
|
| |
|
| |
|
| |
|
| |
|
|
|
| |
|
| |
|
| |
|
| |
|
Cash and cash equivalents |
| Level 1 | | $ | 301,757 | | $ | 301,757 | | $ | 278,766 | | $ | 278,766 |
| Level 1 | | $ | 367,289 | | $ | 367,289 | | $ | 326,113 | | $ | 326,113 |
Restricted cash |
| Level 1 | |
| 140,966 | |
| 140,966 | |
| 28,129 | |
| 28,129 |
| Level 1 | |
| 164,371 | |
| 164,371 | |
| 1,036,339 | |
| 1,036,339 |
Loan receivables | | Level 2 | | | 8,355 | | | 8,849 | | | 5,798 | | | 6,438 | ||||||||||||||
Loans receivable | | Level 2 | | | 11,749 | | | 11,678 | | | 7,267 | | | 7,267 | ||||||||||||||
Derivative financial assets | | | | | | | | | | | | | | | ||||||||||||||
Deal contingent forward contract | | Level 3 | | | — | | | — | | | 751 | | | 751 | ||||||||||||||
Forward currency contracts | | Level 2 | | | 37 | | | 37 | | | — | | | — | ||||||||||||||
Derivative financial liabilities | | | | | | | | | | | | | | | ||||||||||||||
Deal contingent forward contract | | Level 3 | | | — | | | — | | | 2,005 | | | 2,005 | ||||||||||||||
Short-term debt |
| Level 2 | |
| 35,213 | |
| 35,213 | |
| 29,145 | |
| 29,145 |
| Level 2 | |
| 8,637 | |
| 8,637 | |
| 6,147 | |
| 6,147 |
Long-term debt | | | |
|
| |
|
| |
|
| |
|
| | | |
|
| |
|
| |
| | |
| |
Senior unsecured notes |
| Level 1 | |
| 493,625 | |
| 514,075 | |
| 492,734 | |
| 514,219 | ||||||||||||||
Senior unsecured notes (as defined in Note 17) |
| | |
|
| |
|
| |
| | |
| | ||||||||||||||
2016 Notes | | Level 1 | | | 495,434 | | | 489,800 | | | 494,531 | | | 508,125 | ||||||||||||||
2021 USD Notes | | Level 2 | | | — | | | — | | | 598,052 | | | 625,125 | ||||||||||||||
2021 CAD Notes | | Level 2 | | | — | | | — | | | 332,337 | | | 339,100 | ||||||||||||||
Term loan | | Level 2 | | | 95,425 | | | 95,910 | | | 97,812 | | | 98,420 | | Level 2 | | | 91,989 | | | 92,348 | | | 92,821 | | | 93,226 |
Long-term revolver loan |
| Level 2 | |
| 47,439 | |
| 47,506 | |
| 46,102 | |
| 46,184 | ||||||||||||||
Long-term revolver loans |
| Level 2 | |
| 56,949 | |
| 57,000 | |
| 219,699 | |
| 219,772 |
The carrying value of the Company’sCompany��s cash and cash equivalents, restricted cash, trade and other receivables, advances against auction contracts, loan receivables maturing within a year, auction proceeds payable, trade and other payables, and short-term debt approximate their fair values due to their short terms to maturity. The fair value of the loan receivables with a maturity date greater than one year isare determined by estimating discounted cash flows using market rates. The carrying valuevalues of the term loan and long-term revolver loan, before deduction of deferred debt issue costs, approximatesapproximate their fair valuevalues as the interest rates on the loans areis short-term in nature. The fair valuevalues of the senior unsecured notes isare determined by reference to a quoted market price.price of the notes traded in an over-the-counter broker market.
The Company holds derivative financial assets and liabilities that are required to be measured at fair value on a recurring basis. The fair values of the deal contingent forward contracts were determined using a probability weighted mark to market valuation and observable Level 2 inputs, including foreign currency spot exchange rates, forward pricing curves, and an unobservable Level 3 input, the expected date of settlement. The change in the valuation of the derivatives due to the range of possible expected settlement dates was not significant to the financial statements. The fair value of the forward currency contracts are determined using observable Level 2 inputs, including foreign currency spot exchange rates and forward pricing curves. The fair value considers the credit risk of the Company and its counterparties.
13. Derivative financial instruments
The Company’s derivative financial instruments are accounted for as derivatives under ASC 815, Derivatives and Hedging, and are classified in other current assets and other current liabilities. The Company has not applied hedge accounting to these instruments.
The Company enters into forward currency contracts from time to time to manage its exposure to foreign currency exchange rate fluctuations recognized by its subsidiaries on specific monetary loan receivables. During the three and six month periods ended June 30, 2022, a loss of $1,866,000 and $1,296,000 respectively was recognized for the change in fair values of the forward currency contracts within foreign exchange loss (gain) in the consolidated income statement.
The Company also held 2 deal contingent foreign exchange forward currency contracts to manage its exposure to foreign currency exchange rate fluctuations against the U.S. and Canadian dollar on £343,000,000 of the £775,000,000 purchase consideration for the proposed Euro Auctions Acquisition. The notional amounts of the derivative instruments were £216,000,000 (U.S. dollar forward) and £127,000,000 (Canadian dollar forward). These forward contracts were terminated by the Company in April 2022 at no cost.
| |
Ritchie Bros. | 17 |
13.14. Trade and other receivables
Trade receivables are generally secured by the equipment that they relate to as it is Company policy that equipment is not released until payment has been collected. The following table presents the activity in the allowance for expected credit losses for the period ended June 30, 2021:2022:
| | | |
Balance at December 31, |
|
|
|
Current period provision |
| |
|
Write-offs charged against the allowance |
| |
|
Balance at June 30, | | $ |
|
14.15. Other current assets
| | | | | | | | | | | | |
| | June 30, | | December 31, | | June 30, | | December 31, | ||||
|
| 2021 |
| 2020 |
| 2022 |
| 2021 | ||||
Advances against auction contracts | | $ | 7,117 | | $ | 6,487 | | $ | 14,783 | | $ | 4,102 |
Assets held for sale | |
| 242 | |
| — | |
| 323 | |
| 17,538 |
Prepaid expenses and deposits | |
| 20,417 | |
| 20,787 | |
| 21,069 | |
| 41,955 |
Derivative financial asset | | | 37 | | | 751 | ||||||
| | $ | 27,776 | | $ | 27,274 | | $ | 36,212 | | $ | 64,346 |
Assets held for sale
| | | |
Balance at December 31, 2021 |
| $ | 17,538 |
Reclassified from (to) property, plant and equipment | |
| (10,148) |
Disposal | |
| (7,067) |
Balance at June 30, 2022 | | $ | 323 |
On March 17, 2022, the Company completed the sale and leaseback of a parcel of land including all buildings, in Bolton, Ontario, for a total sale consideration of $208,195,000 Canadian dollars (approximately $165 million) net of closing and transaction costs, and recognized a gain on disposition of property, plant and equipment of $169,092,000. The net book value of the Bolton property was $7,067,000. The payments for the lease were not considered to be at market rates given an initial two year rent free period and, accordingly, the Company adjusted the sales proceeds and the gain to fair value. The Bolton property continues to be used for auction operations under the operating leaseback agreement until the completion of the acquisition and development of a replacement property located in Amaranth, Ontario. (Note 21)
As at December 31, 2021, the Company also classified vacant land in Casa Grande, Arizona with a net book value of $10,500,000 as an asset held for sale. During the quarter ended June 30, 2022, the Company assessed that the property no longer met the asset held for sale criteria and therefore reclassified the net book value of the property to property, plant and equipment.
15.16. Other non-current assets
| | | | | | | | | | | | |
| | June 30, | | December 31, | | June 30, | | December 31, | ||||
|
| 2021 |
| 2020 |
| 2022 |
| 2021 | ||||
Right-of-use assets | | $ | 119,592 | | $ | 116,503 | | $ | 134,219 | | $ | 114,414 |
Tax receivable | | | 9,717 | | | 11,050 | | | 10,641 | | | 10,289 |
Loans receivable | | | 4,241 | | | 4,870 | | | 7,199 | | | — |
Deferred debt issue costs | |
| 1,865 | |
| 2,263 | |
| 4,223 | |
| 5,236 |
Other | |
| 11,475 | |
| 12,922 | |
| 12,078 | |
| 12,565 |
| | $ | 146,890 | | $ | 147,608 | | $ | 168,360 | | $ | 142,504 |
The Company recognized a right-of-use asset of $16,587,000 as a result of the sale and leaseback transaction on the Bolton property in March 2022 (Note 15 and 21) and recognized a right-of-use asset of $9,020,000 as a result of a new lease signed on an auction site in Maltby, United Kingdom in June 2022 (Note 21).
| |
Ritchie Bros. | 18 |
16. Other non-current assets (continued)
Loans receivable
As at June 30, 2021,2022, the Company held two non-recoursefour financing lending arrangements withthat are fully collateralized and secured by certain equipment. These financing lending arrangements have a term of one to four years, which are fully collateralized and secured by certain equipment.years. In the event of default under these agreements, the Company will take possession of the equipment as collateral to recover its loans receivable balance. The loans receivable balance as at June 30, 20212022 was $8,355,000$11,749,000, of which $4,114,000$4,550,000 is recorded in trade and other receivables and $7,199,000 in non-current loans receivable (December 31, 2020: $5,797,000,2021: $7,267,000, of which $927,000$7,267,000 was recorded in trade and other receivables)receivables and NaN in non-current loans receivable). The expected credit loss allowance is not significant.
|
|
|
|
16.17. Debt
| | | | | | | | | | | | |
|
| Carrying amount |
| Carrying amount | ||||||||
| | June 30, | | December 31, | | June 30, | | December 31, | ||||
|
| 2021 |
| 2020 |
| 2022 |
| 2021 | ||||
Short-term debt | | $ | 35,213 | | $ | 29,145 | | $ | 8,637 | | $ | 6,147 |
| | | | | | | | | | | | |
Long-term debt: | |
|
| |
|
| |
|
| |
| |
| | | | | | | | | | | | |
Term loan and long-term revolver loan: | |
|
| |
|
| ||||||
Term loan denominated in Canadian dollars, secured, bearing interest at a weighted average rate of 2.66%, due in monthly installments of interest only and quarterly installments of principal, maturing in October 2023 | |
| 95,910 | |
| 98,420 | ||||||
Long-term revolver loan denominated in Canadian dollars, secured, bearing interest at a weighted average rate of 2.66%, due in monthly installments of interest only, maturing in October 2023 | |
| 47,506 | |
| 46,184 | ||||||
Revolving facilities and delayed-draw term loan facility: | |
|
| |
| | ||||||
Delayed-draw term loan denominated in Canadian dollars, secured, bearing interest at a weighted average rate of 3.08%, due in monthly installments of interest only, maturing in September 2026 | |
| 92,348 | |
| 93,283 | ||||||
Long-term revolver loan denominated in Canadian dollars, secured, bearing interest at a weighted average rate of 2.29%, due in monthly installments of interest only, maturing in September 2026 | |
| - | |
| 46,206 | ||||||
Long-term revolver loan denominated in Canadian dollars, secured, bearing interest at a weighted average rate of 2.29%, due in monthly installments of interest only, maturing in September 2026 | |
| - | |
| 56,492 | ||||||
Long-term revolver loan denominated in U.S. dollars, secured, bearing interest at a weighted average rate of 2.53%, due in monthly installments of interest only, maturing in September 2026 | |
| 57,000 | |
| 117,000 | ||||||
Less: unamortized debt issue costs | |
| (552) | |
| (690) | |
| (410) | |
| (463) |
| | | | | | | ||||||
Senior unsecured notes: | |
| | |
| | |
| | |
| |
Bearing interest at 5.375% due in semi-annual installments, with the full amount of principal due in January 2025 | |
| 500,000 | |
| 500,000 | ||||||
Bearing interest at 5.375% due in semi-annual installments, with the full amount of principal due in January 2025 (the "2016 Notes") | |
| 500,000 | |
| 500,000 | ||||||
Less: unamortized debt issue costs | |
| (4,566) | |
| (5,469) | ||||||
Bearing interest at 4.75% due in semi-annual installments, with the full amount of principal due in December 2031 (the "2021 USD Notes") | | | - | | | 600,000 | ||||||
Less: unamortized debt issue costs | | | - | | | (1,948) | ||||||
Bearing interest at 4.95% due in semi-annual installments, with the full amount of principal due in December 2029 (the "2021 CAD Notes") | | | - | | | 333,464 | ||||||
Less: unamortized debt issue costs | |
| (6,375) | |
| (7,266) | | | - | | | (1,127) |
Total long-term debt | |
| 636,489 | |
| 636,648 | |
| 644,372 | |
| 1,737,438 |
| | | | | | | | | | | | |
Total debt | | $ | 671,702 | | $ | 665,793 | | $ | 653,009 | | $ | 1,743,585 |
| | | | | | | | | | | | |
Long-term debt: | |
|
| |
|
| |
|
| |
|
|
Current portion | | $ | 10,657 | | $ | 10,360 | | $ | 4,617 | | $ | 3,498 |
Non-current portion | |
| 625,832 | |
| 626,288 | |
| 639,755 | |
| 1,733,940 |
Total long-term debt | | $ | 636,489 | | $ | 636,648 | | $ | 644,372 | | $ | 1,737,438 |
As at June 30, 2022, the Company had unused committed revolving credit facilities aggregating $673,459,000 that are available until September 2026 subject to certain covenant restrictions, unused uncommitted revolving credit facilities aggregating $5,000,000 that are available until October 2023, and unused uncommitted revolving credit facilities aggregating $5,000,000 with no maturity date.The Company was in compliance with all financial and other covenants applicable to the credit facilities at June 30, 2022.
| |
Ritchie Bros. | 19 |
17. Debt (continued)
Short-term debt
Short-term debt is comprised of drawings in different currencies on the Company’s committed revolving credit facilities and has a weighted average interest rate of 2.3%2.7% (December 31, 2020: 2.3%2021: 1.8%).
Long-term debt
a) |
On August 14, 2020,During 2016, the Company entered into an amendment of the Credit Agreement dated October 27, 2016, totaling US$630 milliona credit agreement with a syndicate of lenders comprising:lenders. The credit agreement is comprised of multicurrency revolving facilities (the “Revolving Facilities”) and a delayed-draw term loan facility (the “DDTL Facility”, together with the Revolving Facilities, the “Facilities”). The credit agreement was most recently amended in September 2021, which, among other things (i) extended the maturity date of the Facilities from October 27, 2023 to September 21, 2026, (ii) increased the total size of the Facilities provided under the Credit Agreement to up to $1,045,000,000, including $295,000,000 of commitments under the DDTL Facility, (iii) reduced the applicable margin for base rate loans and LIBOR loans at each pricing tier level, (iv) reduced the applicable percentage per annum used to calculate the commitment fee in respect of the unused commitments under the Facilities at each pricing tier level, and (v) included customary provisions to provide for the eventual replacement of LIBOR as a benchmark interest rate.
Immediately prior to the amendment, the aggregate principal amount outstanding under the DDTL Facility was $90,000,000 ($118,889,995 Canadian dollars). In connection with the amendment, the Company refinanced that amount with the proceeds from a borrowing under the DDTL Facility. Under the terms of the amendment, there are no mandatory principal repayments of borrowings under the DDTL Facility until the earlier of when the remaining $205,000,000 is drawn or the third quarter of 2022. The Company did not draw on the remaining $205,000,000 before it expired on June 28, 2022 and, therefore, mandatory principal repayments will begin in the third quarter of 2022. Once principal payments become mandatory, they are subject to an annual amortization rate of 5%, payable in quarterly installments, with the balance payable at maturity. As a result of the expiry of the DDTL Facility, the Company wrote off $710,000 of deferred debt issuance costs in the quarter recognized in non-current asset to interest expense.
As of June 30, 2022, the Company had unamortized deferred debt issue costs relating to the Facilities of $4,633,000.
b) | Senior unsecured notes |
2016 Notes
On December 21, 2016, the Company completed the offering of $500,000,000 aggregate principal amount of 5.375% senior unsecured notes due January 15, 2025 (the “Notes”“2016 Notes”). Interest on the 2016 Notes is payable semi-annually. The 2016 Notes are jointly and severally guaranteed on an unsecured basis, subject to certain exceptions, by certain of the Company’s subsidiaries. IronPlanet, Rouse, SmartEquip, and certain of their respective subsidiaries were added as additional guarantors in connection with the acquisitions of IronPlanet, Rouse and Rouse,SmartEquip, respectively.
2021 Notes
As at June 30,
On December 21, 2021, the Company had unused committed revolving credit facilities aggregating $448,349,000completed the offering of which $443,349,000 is availabletwo series of senior notes: (i) $600,000,000 aggregate principal amount of 4.750% senior notes due December 15, 2031 (the “2021 USD Notes”) and (ii) $425,000,000 Canadian dollar aggregate principal amount of 4.950% senior notes due December 15, 2029 (the “2021 CAD Notes”, and together with the 2021 USD Notes, the “2021 Notes”).
The gross proceeds from the 2021 Notes offering together with certain additional amounts including prepaid interest were placed into escrow accounts and were expected to be held in escrow until October 27, 2023 subjectthe completion of the proposed Euro Auctions Acquisition. On May 4, 2022, the Company redeemed all of the 2021 Notes at a redemption price equal to certain covenant restrictions.100% of the original offering price of the notes, plus accrued and unpaid interest. The Company was relieved of its obligations for the 2021 Notes upon redemption and therefore recognized the difference of $4,792,000 between the reacquisition price and the net carrying amount of the debt extinguished (which included unamortized deferred debt issuance costs) as a loss on redemption of the 2021 Notes in compliance with all financial and other covenants applicable tointerest expense in the credit facilities at June 30, 2021.
17. Other non-current liabilities
consolidated income statement.
| |
Ritchie Bros. |
|
| | | | | | |
| | June 30, | | December 31, | ||
|
| 2021 |
| 2020 | ||
Operating lease liability | | $ | 115,130 | | $ | 112,818 |
Tax payable | | | 18,624 | | | 19,706 |
Finance lease liability | |
| 16,265 | |
| 17,109 |
Other | |
| 6,617 | |
| 3,367 |
| | $ | 156,636 | | $ | 153,000 |
18. Other non-current liabilities
| | | | | | |
| | June 30, | | December 31, | ||
|
| 2022 |
| 2021 | ||
Operating lease liability | | $ | 118,737 | | $ | 109,882 |
Tax payable | | | 19,657 | | | 18,859 |
Finance lease liability | |
| 13,458 | |
| 13,983 |
Other | |
| 4,059 | |
| 4,536 |
| | $ | 155,911 | | $ | 147,260 |
19. Equity and dividends
Share capital
Common stock
Unlimited number of common shares, without par value.
Preferred stock
Unlimited number of senior preferred shares, without par value, issuable in series.
Unlimited number of junior preferred shares, without par value, issuable in series.
All issued shares are fully paid. NaN preferred shares have been issued.
Shares issued for business combinationcombinations
InThe Company has issued the following common shares in connection with the acquisitionacquisitions of Rouse the Company issued 312,193 common shares on December 8, 2020.and SmartEquip. These shares were issued to certain previous unitholders and employeesshareholders of Rouse and their vesting is subject to continuing employment with the Company over a three year period from the acquisition date. The fair value of these common shares was $71.09SmartEquip, based on the fair market value of the Company’s common shares onat the date of acquisition. During the first half of 2021, 55,510 common shares were forfeited.
As at June 30, 2021, the unrecognizedacquisition date. The Company records share-based continuing employment costs were $11,898,000, (June 30, 2020: $nil), whichin acquisition-related costs over the vesting period, with an increase to additional paid-in capital. The vesting of shares issued for business combinations is expectedsubject to be recognizedcontinuing employment with the Company over various dates over a weighted averagethree year period of 1.7 years.from their respective acquisition dates. As at June 30, 2021,and when the number of common shares which had not yet vested was 256,683.
Share repurchase
There were 0vest, the Company will recognize the fair value of the issued common shares repurchased during the three months ended June 30, 2021 (three months ended June 30, 2020: nil) and during the six months ended June 30, 2021 (six months ended June 30, 2020: 1,525,312 common shares repurchased for $53,170,000).
Dividends
Declared and paid
The Company declared and paid the following dividends during the six months ended June 30, 2021 and 2020:
| | | | | | | | | | | | |
|
| |
| Dividend |
| |
| Total |
| | ||
| | Declaration date | | per share | | Record date | | dividends | | Payment date | ||
| | | | | | | | | | | | |
Six months ended June 30, 2021: |
|
|
| |
|
|
|
| |
|
|
|
Fourth quarter 2020 | | January 22, 2021 | | $ | 0.2200 | | February 12, 2021 | | $ | 24,181 | | March 5, 2021 |
First quarter 2021 | | May 7, 2021 | | | 0.2200 | | May 26, 2021 | | | 24,279 | | June 16, 2021 |
| | | | | | | | | | | | |
Six months ended June 30, 2020: | |
| |
|
| |
| |
|
| |
|
Fourth quarter 2019 | | January 24, 2020 | | $ | 0.2000 | | February 14, 2020 | | $ | 21,905 | | March 6, 2020 |
First quarter 2020 | | May 6, 2020 | | | 0.2000 | | May 27, 2020 | | | 21,681 | | June 17, 2020 |
from additional paid-in capital to share capital.
| |
Ritchie Bros. |
|
18. Equity and dividends (continued)
Declared and undistributed
Subsequent to June 30, 2021, the Company’s Board of Directors declared a quarterly dividend of $0.25 cents per common share, payable on September 15, 2021 to stockholders of record on August 25, 2021. This dividend payable has not been recognized as a liability in the financial statements. The payment of this dividend will not have any tax consequences for the Company.
Foreign currency translation reserve
Foreign currency translation adjustments within other comprehensive income include intra-entity foreign currency transactions that are of a long-term investment nature, which generated a net gain of $1,095,000 and a net loss of $2,559,000 for the three and six months ended June 30, 2021 (2020: net gain of $5,158,000 and net loss of $2,334,000).
19. Share-based payments
Share-based payments consist of the following compensation costs:
| | | | | | | | | | | | | |
| | Three months ended |
| Six months ended | | ||||||||
| | June 30, | | June 30, | | ||||||||
|
| 2021 |
| 2020 |
| 2021 |
| 2020 | | ||||
SG&A expenses: |
| |
|
| |
|
| |
|
| |
| |
Stock option compensation expense | | $ | 1,909 | | $ | 1,543 | | $ | 3,770 | | $ | 2,730 | |
Equity-classified share units | | | 4,404 | | | 3,231 | | | 7,557 | | | 5,017 | |
Liability-classified share units | | | 526 | | | 971 | | | (1,389) | | | (185) | |
Employee share purchase plan - employer contributions | |
| 701 | |
| 610 | |
| 1,380 | |
| 1,199 | |
| | | 7,540 | | | 6,355 | | | 11,318 | | | 8,761 | |
Acquisition-related costs: | |
| | |
| | |
| | | | | |
Share-based continuing employment costs | |
| 2,678 | |
| — | |
| 5,231 | |
| — | |
| |
| 2,678 | |
| — | |
| 5,231 | |
| — | |
| | $ | 10,218 | | $ | 6,355 | | $ | 16,549 | | $ | 8,761 | |
Stock option plans
The Company has three stock option plans that provide for the award of stock options to selected employees, directors, and officers of the Company: a) Amended and Restated Stock Option Plan, b) IronPlanet 1999 Stock Plan, and c) IronPlanet 2015 Stock Plan.
Stock option activity for the six months ended June 30, 2021 is presented below:
| | | | | | | | | | | |
| | | | | | | WA | | | | |
| | Common | | WA | | remaining | | Aggregate | |||
| | shares under | | exercise | | contractual | | intrinsic | |||
|
| option |
| price |
| life (in years) |
| value | |||
Outstanding, December 31, 2020 |
| 1,985,754 | | $ | 34.95 | |
| 7.7 | | $ | 68,717 |
Granted |
| 690,353 | | | 54.88 | |
|
| |
|
|
Exercised |
| (311,153) | | | 34.38 | | | | | | 7,623 |
Forfeited |
| (23,808) | | | 46.88 | |
|
| |
|
|
Outstanding, June 30, 2021 |
| 2,341,146 | | | 40.78 | |
| 7.9 | | | 43,379 |
Exercisable, June 30, 2021 |
| 980,404 | | $ | 31.33 | |
| 6.3 | | $ | 27,402 |
|
|
|
|
19. Equity and dividends (continued)
Shares issued for business combinations (continued)
| | | | | | | | | | | | | | |
| Rouse | | SmartEquip | | Total | |||||||||
| | | | | | | | | |
| | | | |
| | | | | | | | | | | | | Weighted average | |
| Common | | Fair value | | Common | | Fair value |
| Common | | fair value | |||
| shares | | per common | | shares | | per common |
| shares | | per common | |||
| issued |
| shares |
| issued |
| shares |
| issued |
| shares | |||
Outstanding, December 31, 2021 | 189,665 | | $ | 71.09 | | 63,971 | | $ | 68.39 | | 253,636 | | $ | 70.41 |
Granted | — | | | — | | — | | | — | | — | | | — |
Vested | (27,816) | | | 71.09 | | — | | | — | | (27,816) | | | 71.09 |
Forfeited | — | | | — | | — | | | — | | — | | | — |
Outstanding, June 30, 2022 | 161,849 | | $ | 71.09 | | 63,971 | | $ | 68.39 | | 225,820 | | $ | 70.33 |
| | | | | | | | | | | | | | |
Outstanding, December 31, 2020 | 312,193 | | $ | 71.09 | | — | | $ | — | | 312,193 | | $ | 71.09 |
Granted | — | | | — | | — | | | — | | — | | | — |
Vested | — | | | — | | — | | | — | | — | | | — |
Forfeited | (55,510) | | | 71.09 | | — | | | — | | (55,510) | | | 71.09 |
Outstanding, June 30, 2021 | 256,683 | | $ | 71.09 | | — | | $ | — | | 256,683 | | $ | 71.09 |
| | | | | | | | | | | | | | |
In the three months ended June 30, 2022, the Company recognized $1,819,000 of share capital from additional paid-in capital for the portion of common shares previously issued in connection with the acquisition of Rouse that have vested as of June 30, 2022.
As at June 30, 2022, the unrecognized share-based continuing employment cost was $6,520,000 (June 30, 2021: $11,898,000), which is expected to be recognized over a weighted average period of 1.4 years.
Dividends
Declared and paid
The Company declared and paid the following dividends during the six months ended June 30, 2022 and 2021:
| | | | | | | | | | | | |
|
| |
| Dividend |
| |
| Total |
| | ||
| | Declaration date | | per share | | Record date | | dividends | | Payment date | ||
| | | | | | | | | | | | |
Six months ended June 30, 2022: |
|
|
| |
|
|
|
| |
|
|
|
Fourth quarter 2021 | | January 21, 2022 | | $ | 0.2500 | | February 11, 2022 | | $ | 27,659 | | March 4, 2022 |
First quarter 2022 | | May 6, 2022 | | | 0.2500 | | May 27, 2022 | | | 27,693 | | June 17, 2022 |
| | | | | | | | | | | | |
Six months ended June 30, 2021: | |
| |
|
| |
| |
|
| |
|
Fourth quarter 2020 | | January 22, 2021 | | $ | 0.2200 | | February 12, 2021 | | $ | 24,181 | | March 5, 2021 |
First quarter 2021 | | May 7, 2021 | | | 0.2200 | | May 26, 2021 | | | 24,279 | | June 16, 2021 |
Declared and undistributed
Subsequent to June 30, 2022, the Company’s Board of Directors declared a quarterly dividend of $0.27 cents per common share, payable on September 14, 2022 to stockholders of record on August 24, 2022. This dividend payable has not been recognized as a liability in the consolidated financial statements. The payment of this dividend is expected to not have any tax consequences for the Company.
Foreign currency translation reserve
Foreign currency translation adjustments within other comprehensive income include intra-entity foreign currency transactions that are of a long-term investment nature, which generated a net loss of $8,553,000 and $9,437,000 for the three and six months ended June 30, 2022 (2021: net gain of $1,095,000 and net loss of $2,559,000).
| |
Ritchie Bros. | 22 |
20. Share-based payments
Share-based payments (continued)consist of the following compensation costs:
| | | | | | | | | | | | | |
| | Three months ended |
| Six months ended | | ||||||||
| | June 30, | | June 30, | | ||||||||
|
| 2022 |
| 2021 |
| 2022 |
| 2021 | | ||||
Selling, general and administrative: |
| |
|
| |
|
| |
|
| |
| |
Stock option compensation expense | | $ | 3,056 | | $ | 1,909 | | $ | 5,623 | | $ | 3,770 | |
Equity-classified share units | | | 8,801 | | | 4,404 | | | 11,691 | | | 7,557 | |
Liability-classified share units | | | 1,075 | | | 526 | | | 319 | | | (1,389) | |
Employee share purchase plan - employer contributions | |
| 708 | |
| 701 | |
| 1,393 | |
| 1,380 | |
| | | 13,640 | | | 7,540 | | | 19,026 | | | 11,318 | |
Acquisition-related costs: | |
| | |
| | |
| | | | | |
Share-based continuing employment costs | |
| 2,080 | |
| 2,678 | |
| 4,213 | |
| 5,231 | |
| |
| 2,080 | |
| 2,678 | |
| 4,213 | |
| 5,231 | |
| | $ | 15,720 | | $ | 10,218 | | $ | 23,239 | | $ | 16,549 | |
Stock option plans
The significantCompany has the following three stock option plans that provide for the award of stock options and premium-priced stock options to selected employees, directors, and officers of the Company: (i) Amended and Restated Stock Option Plan, (ii) IronPlanet 1999 Stock Plan, and (iii) IronPlanet 2015 Stock Plan.
Stock option activity for the six months ended June 30, 2022 is presented below:
| | | | | | | | | | | | | | | | | | | | | |
| Stock options | | Premium-priced stock options | ||||||||||||||||||
| | | | | | WA | | | | | | | | | | WA | | | | ||
| Common | | WA | | remaining | | Aggregate | | Common | | WA | | remaining | | Aggregate | ||||||
| shares under | | exercise | | contractual | | intrinsic | | shares under | | exercise | | contractual | | intrinsic | ||||||
| option |
| price |
| life (in years) |
| value |
| option |
| price |
| life (in years) |
| value | ||||||
Outstanding, December 31, 2021 | 2,208,057 | | | 42.55 | | | 7.7 | | | 41,884 | | 1,017,064 | | | 91.24 | | | 5.7 | | | — |
Granted | 689,437 | | | 58.02 | |
| — | |
| — | | 119,157 | | | 91.37 | | | — | | | — |
Exercised | (80,183) | | | 35.70 | | | — | | | 1,964 | | — | | | — | | | — | | | — |
Forfeited | (36,126) | | | 42.85 | |
| — | |
| — | | (17,789) | | | 90.93 | |
| — | |
| — |
Outstanding, June 30, 2022 | 2,781,185 | | | 46.58 | | | 7.8 | | | 51,797 | | 1,118,432 | | | 91.26 | | | 5.2 | | | — |
Exercisable, June 30, 2022 | 1,307,090 | | | 37.42 | | | 6.5 | | | 36,130 | | — | | | — | |
| — | | | — |
Stock options
The Company uses the Black Scholes option pricing model to fair value stock options. Significant assumptions used to estimate the fair value of stock options granted during the six months ended June 30, 20212022 and 20202021 are presented in the following table on a weighted average basis:
| | | | | | | | | | |
Six months ended June 30, |
| 2021 |
| 2020 |
|
| 2022 |
| 2021 |
|
Risk free interest rate |
| 0.5 | % | 0.7 | % |
| 2.2 | % | 0.5 | % |
Expected dividend yield |
| 1.66 | % | 1.98 | % |
| 1.74 | % | 1.66 | % |
Expected lives of the stock options |
| 4 | years | 5 | years | �� | 4 | years | 4 | years |
Expected volatility |
| 32.3 | % | 27.8 | % |
| 31.7 | % | 32.3 | % |
As atAt June 30, 2021,2022, the unrecognized stock-based compensation cost related to the non-vested stock options was $8,979,000,$11,746,000, which is expected to be recognized over a weighted average period of 2.4 years.
| |
Ritchie Bros. | 23 |
20. Share-based payments (continued)
Premium-priced stock options
The Company also grants premium-priced stock options to the senior executives with exercise prices above the fair market value of the Company’s common shares on grant dates. The premium-priced stock options vest and become exercisable upon the third anniversary of their grant date. The premium-priced stock options granted in August and November 2021 expire on the sixth anniversary of their grant date, and those granted in June 2022 expire in August 2027 to coincide with the expiry of the August 2021 grant. The fair values of the premium-priced stock options were calculated on the grant date using a Monte Carlo simulation model. The weighted average estimated grant date fair value of premium-priced options during the three month period ended June 30, 2022 was $8.00 per option.
The significant assumptions used to estimate the fair values were as follows:
| | | | | |
Six months ended June 30, |
| 2022 |
| 2021 | |
Risk free interest rate |
| 3.0 | % | — | % |
Expected dividend yield |
| 1.63 | % | — | % |
Expected lives of the stock options | | 4 | years | — | years |
Expected volatility |
| 30.2 | % | — | % |
At June 30, 2022, the unrecognized stock-based compensation cost related to the premium-priced stock options was $7,380,000, which is expected to be recognized over a weighted average period of 2.4 years.
Share unit plans
Share unit activity for the six months ended June 30, 20212022 is presented below:
| | | | | | | | | | | | | | | | | | | | | | | | | | | | | | | | | | | | | |
| | Equity-classified awards | | Liability-classified awards | | Equity-classified awards | | Liability-classified awards | |||||||||||||||||||||||||||||
| | PSUs | | RSUs | | DSUs | | PSUs | | PSUs with Market Conditions | | RSUs | | DSUs | |||||||||||||||||||||||
| | | | WA grant | | | | WA grant | | | | | WA grant | | | | WA grant | | | | WA grant | | | | WA grant | | | | | WA grant | |||||||
| | | | date fair | | | | date fair | | | | | date fair | | | | date fair | | | | date fair | | | | date fair | | | | | date fair | |||||||
|
| Number |
| value |
| Number |
| value |
| | Number |
| value |
| Number |
| value |
| Number |
| value |
| Number |
| value |
| | Number |
| value | |||||||
Outstanding, December 31, 2020 |
| 542,676 | | $ | 38.09 |
| 134,937 | | $ | 39.14 |
| | 137,514 | | $ | 32.06 | |||||||||||||||||||||
Outstanding at December 31, 2021 |
| 523,618 | | $ | 45.90 | | 88,305 | | $ | 65.45 | | 79,112 | | $ | 54.96 |
| | 156,589 | | $ | 35.28 | ||||||||||||||||
Granted |
| 140,455 | |
| 56.69 |
| 29,525 | |
| 56.59 |
| | 9,362 | |
| 56.33 |
| 225,382 | |
| 58.66 | | 14,574 | |
| 69.92 | | 33,827 | |
| 57.68 |
| | 12,124 | |
| 56.78 |
Vested and settled |
| (161,248) | |
| 31.14 |
| (88,157) | |
| 33.20 |
| | — | |
| — |
| (93,241) | |
| 36.42 | | — | |
| — | | (22,349) | |
| 46.01 |
| | — | |
| — |
Forfeited |
| (13,765) | |
| 48.33 |
| (5,357) | |
| 60.16 |
| | — | |
| — |
| (3,474) | |
| 51.04 | | — | |
| — | | (3,891) | |
| 61.55 |
| | — | |
| — |
Outstanding, June 30, 2021 |
| 508,118 | | $ | 45.16 |
| 70,948 | | $ | 52.21 |
| | 146,876 | | $ | 33.61 | |||||||||||||||||||||
Outstanding at June 30, 2022 |
| 652,285 | | $ | 51.64 | | 102,879 | | $ | 66.08 | | 86,699 | | $ | 58.03 |
| | 168,713 | | $ | 36.82 |
The total market value of liability-classified share units vested and released during the first halfsix months of 20212022 was NaN (December(as at December 31, 2020:2021: NaN).
Senior executive and employee PSU plans
The Company grants PSUs under a senior executive PSU plan and an employee PSU plan (the “PSU Plans”). Under the PSU Plans, the number of PSUs that vest is conditional upon specified market, service, and/or performance vesting conditions being met. The PSU Plans allow the Company to choose whether to settle the awards in cash or in shares. The Company intends to settle by issuance of shares. With respect to settling in shares, the Company has the option to either (i) arrange for the purchase of shares on the open market on the employee’s behalf based on the cash value that otherwise would be delivered, or (ii) to issue a number of shares equal to the number of units that vest.
Fair values of equity-classified PSUs are estimated on grant date using the 20-day volume weighted averagemarket close price of the Company's common shares listed on the New York Stock Exchange.NYSE, as these are not subject to market vesting conditions.
As atAt June 30, 20212022, the unrecognized share unit expense related to equity-classified PSUsPSU’s was $14,431,000,$21,018,000, which is expected to be recognized over a weighted average period of 2.1 years.
| |
Ritchie Bros. | 24 |
20. Share-based payments (continued)
PSUs with market conditions
The Company also grants PSUs to senior executives with a market condition where vesting is conditional upon the total stockholder return performance of the Company’s stock relative to the performance of a peer group over a three year performance period from the date of grant. The PSUs granted in August and November 2021 have a three year performance period and the PSUs granted in June 2022 have approximately a 2 year performance period to coincide with the remaining performance period of the August 2021 grant. The fair value per PSU granted during the three month period ended June 30, 2022 of $69.92 was calculated on the grant date using the Monte Carlo simulation model which takes into consideration a required post-vesting holding period of one year with a discount value of $5.34 per PSU. The discount was calculated using the Chaffe Protective Put Method and an effective tax rate of 35%.
The significant assumptions used to estimate the fair value are presented in the following table:
| | | | | |
Six months ended June 30, |
| 2022 |
| 2021 | |
Risk free interest rate |
| 2.7 | % | — | % |
Expected dividend yield |
| 1.63 | % | — | % |
Expected lives of the PSUs | | 2 | years | — | years |
Expected volatility |
| 33.4 | % | — | % |
Average expected volatility of comparable companies | | 34.4 | % | — | % |
At June 30, 2022, the unrecognized share unit expense related to equity-classified PSUs with market conditions was $5,062,000, which is expected to be recognized over a weighted average period of 2.1 years.
RSUs
The Company has RSUrestricted share unit plans (RSU plans) that are equity-settled and not subject to market vesting conditions.
Fair values of RSUs are estimated on grant date using the 20-day volume weighted averagemarket close price of the Company's common shares listed on the New York Stock Exchange.NYSE.
As atAt June 30, 2021,2022, the unrecognized share unit expense related to equity-classified RSUs was $2,323,000,$2,849,000, which is expected to be recognized over a weighted average period of 1.6 years.
|
|
|
|
19. Share-based payments (continued)
DSUs
The Company has DSUdeferred share unit plans (DSU plans) that are cash-settled and not subject to market vesting conditions.
Fair values of DSUsdeferred share units (“DSUs”) are estimated on grant date and at each reporting date.date using the market close price of the Company’s common shares listed on the NYSE. DSUs are granted under the DSU plan to members of the Board of Directors. There is 0 unrecognized share unit expense related to liability-classified DSUs as they vest immediately and are expensed upon grant.
As atAt June 30, 2021,2022, the Company had a total share unit liability of $8,699,000 (December$10,976,000 (as at December 31, 2020: $9,597,000)2021: $10,056,000) in respect of share units under the DSU plans.
Employee share purchase plan
The Company has an employee share purchase plan that allows all employees that have completed two months of service to contribute funds to purchase common shares at the current market value at the time of share purchase. Employees may contribute up to 4% of their salary. The Company will match between 50% and 100% of the employee’s contributions, depending on the employee’s length of service with the Company.
20. Leases
The Company’s breakdown of lease expense is as follows:
| | | | | | | | | | | | |
| | Three months ended | | Six months ended | ||||||||
| | June 30, | | June 30, | ||||||||
| | 2021 | | 2020 | | 2021 | | 2020 | ||||
Operating lease cost | | $ | 4,392 | | $ | 3,969 | | $ | 8,992 | | $ | 8,470 |
Finance lease cost | |
| | | | | |
| | | | |
Amortization of leased assets | |
| 2,815 | | | 2,195 | |
| 5,403 | | | 4,309 |
Interest on lease liabilities | |
| 205 | | | 229 | |
| 426 | | | 462 |
Short-term lease cost | |
| 1,922 | | | 2,151 | |
| 4,583 | | | 5,031 |
Sublease income | |
| (15) | | | (148) | |
| (30) | | | (296) |
| | $ | 9,319 | | $ | 8,396 | | $ | 19,374 | | $ | 17,976 |
Operating leases
The Company has entered into commercial leases for various auction sites and offices located in North America, Europe, the Middle East, Australia and Asia. The majority of these leases are non-cancellable. The Company also has further operating leases for computer equipment, certain motor vehicles and small office equipment where it is not in the best interest of the Company to purchase these assets.
The majority of the Company’s operating leases have a fixed term with a remaining life between one month and 20 years, with renewal options included in the contracts. The leases have varying contract terms, escalation clauses and renewal options. Generally, there are no restrictions placed upon the lessee by entering into these leases, other than restrictions on use of property, sub-letting and alterations. At the inception of a lease, the Company determines whether it is reasonably certain to exercise a renewal option and includes the options in the determination of the lease term and the lease liability where it is reasonably certain to exercise the option. If the Company’s intention is to exercise an option subsequent to the commencement of the lease, the Company will re-assess the lease term. The Company has included certain renewal options in its operating lease liabilities for key property leases for locations that have strategic importance to the Company such as its Corporate Head Office. The Company has not included any purchase options available within its operating lease portfolio in its determination of its operating lease liability.
| |
Ritchie Bros. |
|
20.21. Leases (continued)
Operating leases (continued)
The future aggregate minimum lease payments under non-cancellable operating leases are as follows:
| | | |
Remainder of 2021 |
| $ | 7,344 |
2022 | |
| 15,542 |
2023 | |
| 13,986 |
2024 | |
| 10,855 |
2025 | |
| 10,711 |
Thereafter | |
| 108,715 |
Total future minimum lease payments | | $ | 167,153 |
less: imputed interest | |
| (40,780) |
Total operating lease liability | | $ | 126,373 |
less: operating lease liability - current | |
| (11,243) |
Total operating lease liability - non-current | | $ | 115,130 |
At June 30, 2021 the weighted average remaining lease term for operating leases is 14.6 years and the weighted average discount rate is 3.8%.
Finance leases
The Company has enteredenters into commercial leases for various auctions sites and offices, the majority of which are non-cancellable, and additional operating leases for computer equipment, motor vehicles and small office equipment. The majority of the Company’s operating leases have a fixed term with a remaining life between one month and 18 years, with renewal options included in the contracts. The leases have varying contract terms, escalation clauses and renewal options.
The Company also enters into finance lease arrangements for certain vehicles, computer and yard equipment and office furniture. Thefurniture, the majority of thethese leases have a fixed term with a remaining life of one month to six years with renewal options included in the contracts. In certain of these leases,
On March 17, 2022, the Company completed the sale and leaseback of its Bolton property, a parcel of land including all buildings, in Bolton, Ontario (Note 15). The Company intends to lease the Bolton property for a period of 28 months until such time that the replacement property is available for the relocation of the Company’s operations. The lease has thean initial rent-free period of two years and an option to purchaserenew the leasedlease for two additional one-year periods, during which time the lease is cancellable at one month’s notice. Upon completion of the sale, the Company recorded a $16,587,000 ROU asset at fair market value orrepresenting the right-of-use of the Bolton property for the estimated lease term and a stated residual value$4,477,000 long term lease liability representing the obligation to make lease payments arising from the operating lease at the end of the lease term. For certain leases such as vehicle leasesinitial two-year period.
On June 30, 2022, the Company has included renewal optionsalso recorded $9,020,000 in ROU asset and long term lease liability relating to a lease signed on its Maltby auction site in the determinationUnited Kingdom.
The Company’s breakdown of its lease liabilities.
As at June 30, 2021, the net carrying amount of computer and yard equipment and other assets under capital leasesexpense is $24,927,000 (December 31, 2020: $25,649,000), and is included in the total property, plant and equipment as disclosed on the consolidated balance sheets.
Assets recorded under finance leases are as follows:
| | | | | | | | | |
|
| | |
| Accumulated |
| Net book | ||
As at June 30, 2021 | | Cost | | depreciation | | value | |||
Computer equipment | | $ | 15,820 | | $ | (8,660) | | $ | 7,160 |
Yard and others | |
| 31,670 | |
| (13,903) | |
| 17,767 |
| | $ | 47,490 | | $ | (22,563) | | $ | 24,927 |
| | | | | | | | | |
|
| | |
| Accumulated |
| Net book | ||
As at December 31, 2020 | | Cost |
| depreciation | | value | |||
Computer equipment | | $ | 16,597 | | $ | (8,317) | | $ | 8,280 |
Yard and others | |
| 28,234 | |
| (10,865) | |
| 17,369 |
| | $ | 44,831 | | $ | (19,182) | | $ | 25,649 |
| | | | | | | | | | | |
| | Three months ended | | Six months ended | |||||||
| | June 30, | | June 30, | |||||||
| | 2022 | | 2021 | | 2022 | 2021 | ||||
Operating lease cost | | $ | 6,229 | | $ | 4,392 | | $ | 10,940 | $ | 8,992 |
Finance lease cost | |
| | | | | |
| | | |
Amortization of leased assets | |
| 2,616 | | | 2,815 | |
| 5,248 | | 5,403 |
Interest on lease liabilities | |
| 186 | | | 205 | |
| 360 | | 426 |
Short-term lease cost | |
| 2,901 | | | 1,922 | |
| 6,364 | | 4,583 |
Sublease income | |
| — | | | (15) | |
| — | | (30) |
| | $ | 11,932 | | $ | 9,319 | | $ | 22,912 | $ | 19,374 |
| | ||||||
|
| | | | | | |
20. Leases (continued)
Finance leases (continued)
The future aggregate minimum lease payments under non-cancellable finance leases are as follows:
| | | |
Remainder of 2021 |
| $ | 5,291 |
2022 |
| | 9,073 |
2023 |
| | 6,743 |
2024 |
| | 4,221 |
2025 |
| | 1,275 |
Thereafter |
| | 170 |
Total future minimum lease payments |
| $ | 26,773 |
less: imputed interest |
| | (1,049) |
Total finance lease liability |
| $ | 25,724 |
less: finance lease liability - current |
| | (9,459) |
Total finance lease liability - non-current |
| $ | 16,265 |
At June 30, 2021 the weighted average remaining lease term for finance leases is 3.1 years and the weighted average discount rate is 3.6%.
21.22. Commitments
Commitment for inventory purchasepurchases
In December 2017, theThe Company entered into a two-year non-rolling stock surplus contractwas awarded two new contracts with the U.S.United States Government Defense Logistics Agency (the “DLA”), the term of which was extended until June 1, 2021 at which point the contract was terminated. Under this contract, the Company committed to purchase between 150,000 and 245,900 assets with an expected minimum value of $11,104,000 and up to $51,028,000 annually to the extent that goods are available from the DLA. From January 1, 2021 to the end of the contract term, June 1, 2021, the Company purchased $18,390,000 under the contract. As at June 30, 2021, the Company has no further commitments under the contract as it has been terminated.
On on April 1, 2021, the DLA awarded two new contracts to the Company.2021. The new contracts (one for the Eastern portion of the United States and one for the Western portion of the United States) cover both surplus non-rolling and rolling stock. Both contracts commenced on June 1, 2021 and have a base term of two years with 3 one yearone-year renewal options.
During the first two years of the new contracts, the Company is committed to purchase on a combined basis up to either: (i) 600,000 assets, or (ii) assets with an expected minimum value of up to $77,000,000; whichever is less. As atAt June 30, 2021,2022, the Company has purchased 19,813263,503 assets with a total value of $4,244,000$54,520,000 pursuant to the two year period of this contract, which commenced on June 1, 2021.
22.
| |
Ritchie Bros. | 26 |
23. Contingencies
Legal and other claims
The Company is subject to legal and other claims that arise in the ordinary course of its business. Management does not believe that the results of these claims will have a material effect on the Company’s consolidated balance sheet or consolidated income statement.
Guarantee contracts
In the normal course of business, the Company will in certain situations guarantee to a consignor a minimum level of proceeds in connection with the sale at auction of that consignor’s equipment.
At June 30, 2021,2022, there were $131,872,000$30,791,000 of assets guaranteed under contract, of which 90%88% is expected to be sold prior to September 30, 2021,2022, with the remainder to be sold by December 31, 2022 (December(as at December 31, 2020: $22,773,0002021: $43,450,000 of which 23%61% was expected to be sold prior to the end of March 31, 20212022 with the remainder to be sold by December 31, 2021)2022).
The outstanding guarantee amounts are undiscounted and before estimated proceeds from sale at auction.
| |
Ritchie Bros. |
|
ITEM 2: MANAGEMENT’S DISCUSSION AND ANALYSIS OF FINANCIAL CONDITION AND RESULTS OF OPERATIONS
Cautionary Note Regarding Forward-Looking Statements
Forward-looking statements may appear throughout this report,Quarterly Report on Form 10-Q, including the following section “Management’s Discussion and Analysis of Financial Condition and Results of Operations”. Forward-looking statements are typically identified by such words as “aim”, “anticipate”, “believe”, “could”, “continue”, “estimate”, “expect”, “intend”, “may”, “ongoing”, “plan”, “potential”, “predict”, “will”, “should”, “would”, “could”, “likely”, “generally”, “future”, “long-term”, or the negative of these terms, and similar expressions intended to identify forward-looking statements. Forward-looking statements are based on current expectations and assumptions that are subject to risks and uncertainties that may cause actual results to differ materially, and include, among others, statements relating to:
● | our future strategy, objectives, targets, projections and performance; |
● | potential growth and market opportunities; |
● | potential future mergers and acquisitions; |
● | our ability to integrate potential acquisitions; |
● | the impact of our new initiatives, services, investments, and acquisitions on us and our customers; |
● | our future capital expenditures and returns on those expenditures; and |
● | financing available to us from our credit facilities or other sources, our ability to refinance borrowings, and the sufficiency of our working capital to meet our financial needs. |
While we have not described all potential risks related to our business and owning our common shares, the important factors discussed in “Part II, Item 1A: Risk Factors” of this Quarterly Report on Form 10-Q and in “Part I, Item 1A: Risk Factors” of our Annual Report on Form 10-K for the year ended December 31, 2020,2021, which is available on our website at www.rbauction.comhttps://investor.ritchiebros.com, on EDGAR at www.sec.gov, or on SEDAR at www.sedar.com, are among those that we consider may affect our performance materially or could cause our actual financial and operational results to differ significantly from our expectations. Except as required by applicable securities law and regulations of relevant securities exchanges, we do not intend to update publicly any forward-looking statements, even if our expectations have been affected by new information, future events or other developments.
Unless indicated otherwise, all tabular dollar amounts, including related footnotes, presented below are expressed in thousands of United States (“U.S.”) dollars.
We prepare our consolidated financial statements in accordance with United States generally accepted accounting principles (“US GAAP”). Except for Gross Transaction Value (“GTV”)1, which is a measure of operational performance and not a measure of financial performance, liquidity, or revenue, the amounts discussed below are based on our consolidated financial statements. Unless indicated otherwise, all tabular dollar amounts, including related footnotes, presented below are expressed in thousands of United States (“U.S.”) dollars.
In the accompanying analysis of financial information, we sometimes use information derived from consolidated financial data but not presented in our financial statements prepared in accordance with US GAAP. Certain of these data are considered “non-GAAP financial measures” under the SEC rules. The definitions of and reasons we use these non-GAAP financial measures and the reconciliations to their most directly comparable US GAAP financial measures are included either with the first use thereof or in the Non-GAAP Measures section within the MD&A.Management’s Discussion and Analysis of Financial Condition and Results of Operations. Non-GAAP financial measures referred to in this reportQuarterly Report on Form 10-Q are labeled as “non-GAAP measure” or designated as such with an asterisk (*). Please see pages 45-4951-53 for explanations of why we use these non-GAAP measures and the reconciliation to the most comparable GAAP financial measures.
Overview
Ritchie Bros. Auctioneers Incorporated (“Ritchie Bros.”, the “Company”, “we”, or “us”) (NYSE & TSX: RBA) was founded in 1958 in Kelowna, British Columbia, Canada and is a world leader in asset management technologies and disposition of commercial assets, selling $5.41$5.5 billion of used equipment and other assets during 2020.2021. Our expertise, unprecedented global reach, market insight,insights, and trusted portfolio of brands provide us with a unique position inwithin the used equipment market. We sell used equipment for our customers through our unreserved auctions at over 40 auction sites worldwide, which are also simulcast online to reach a global bidding audience and through our online marketplaces.
Through our unreserved auctions, online marketplaces, and private brokerage services, we sell a broad range of used and unused commercial assets, including earthmoving equipment, truck tractors, truck trailers, government surplus, oil and gas equipment and other industrial assets. Construction and heavy machinery comprise the majority of the equipment sold. Customers selling equipment through our sales channels include end users (such as construction companies), equipment dealers, original equipment manufacturers (“OEMs”) and other equipment owners (such as rental companies). Our customers participate in a variety of sectors, including heavy construction, transportation, agriculture, energy, and mining.
We also provide our customers with a wide array of other services aligned with our growth strategy to create a global marketplace for used equipment services and solutions. Our other services include equipment financing, asset appraisals and inspections, online equipment listing, logistical services, and ancillary services such as equipment refurbishment. Additionally, we offer our customers asset technology solutions to manage the end to end disposition process of their assets and provide market data intelligence to make more accurate and reliable business decisions.
1 GTV represents total proceeds from all items sold at our auctions and online marketplaces. GTV is not a measure of financial performance, liquidity, or revenue, and is not presented in our consolidated financial statements.
| |
Ritchie Bros. |
|
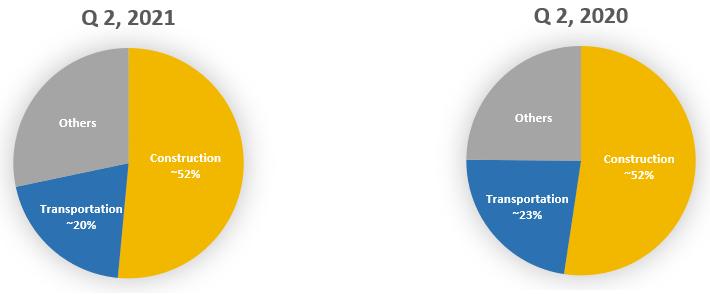
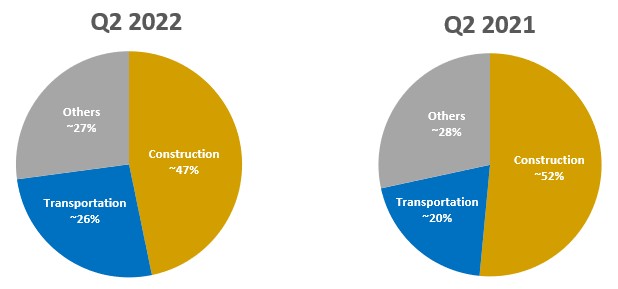
Through our unreserved auctions, online marketplaces, listings, and private brokerage services, we sell a broad range of primarily used commercial and industrial assets as well as government surplus. Construction and transportation assets comprise the majority of the equipment sold by GTV dollar value. Customers selling equipment through our sales channels include end users (such as construction companies), equipment dealers, original equipment manufacturers (“OEMs”) and other equipment owners (such as rental companies). Our customers participate in a variety of sectors, including construction, transportation, agriculture, energy, and natural resources.
We also provide our customers with a wide array of value added services aligned with our growth strategy to create a global marketplace for used equipment services and solutions. Our other services include access to equipment financing, asset appraisals and inspections, online equipment listing, logistical services, and ancillary services such as equipment refurbishment. We offer our customers asset technology solutions to manage the end to end disposition process of their assets and provide market data intelligence to make more accurate and reliable business decisions. Additionally, we offer our customers an innovative technology platform that supports equipment lifecycle management and parts procurement integration with both original equipment manufacturers and dealers, as well as software as a service platform for end-to-end parts procurement and digital catalogs and diagrams.
We operate globally with locations in more than 12 countries, including the U.S.,United States, Canada, the Netherlands, Australia, and the United Arab Emirates, and the Netherlands, andmaintain a presence in 48 countries where customers are able to sell from their own yards. In addition, we employ more than 2,600 full time2,700 full-time employees worldwide.
Discontinuation of the proposed acquisition of Euro Auctions
On August 9, 2021, we entered into a Sale and Purchase Agreement (“SPA”) pursuant to which we agreed to purchase Euro Auctions Limited, William Keys & Sons Holdings Limited, Equipment & Plant Services Ltd, and Equipment Sales Ltd. (collectively, “Euro Auctions”), each being a private limited company incorporated in Northern Ireland (the “Euro Auctions Acquisition”), for a purchase price of approximately £775 million (approximately $1.02 billion) in cash, which was to be paid on closing. On April 29, 2022, the Company announced its decision to discontinue the Phase 2 review by the Competition and Markets Authority (“CMA”). The SPA automatically terminated on June 28, 2022.
Impact of COVID-19 to our Business
In March 2020, the World Health Organization declared the outbreak of COVID-19 as a global pandemic which quickly spread(“COVID-19”).
In response, we transitioned all of our traditional live onsite auctions to online bidding utilizing our existing online bidding technology. As restrictions ease, we began to return to travel and to welcome in-person attendance at several of our live onsite auctions, and we continue to consider a transition back to our other onsite auction events throughout the world resultingyear. The health and welfare of our employees, customers and suppliers continues to be a top priority and we continue to operate with precautionary measures in significant global economic disruption that materially impacted several countries and regions in which we operate, including the United States, Canada, Europe, the Middle East, Australia and Asia. It has resulted in travel restrictions, economic uncertainty, and business slowdowns or shutdowns in affected areas and has negatively disrupted global manufacturing and workforce participation, including our own.place, as appropriate.
In Q2, 2021,the first six months of 2022, our ability to move equipment to and from our auction sites and across borders continues to vary regionallyhas improved with Asia and Australia continuing to be negatively impacted as regional governments continue to enforce travel restrictions and quarantine requirements. In these regions, the restrictions have also resultedrequirements continuing to lift particularly in some challenges in customer interactionsAustralia and challenges for our customersEurope, but with certain countries within Asia continuing to complete equipment inspections. In our International region, travel and quarantine restrictions are slowly being lifted as people become vaccinated, which is slowly driving up our auction volumes as equipment can be moved between borders more easily.experience lockdowns. In the United States and Canada, COVID-19 has not materially impacted on our ability to operate our businesses and move equipment. Globally, a recent surge inwe continued to see heightened shipping, fuel and freight costs combined with extended lead times, is making transportation of equipment both more costly and more challenging, which is negatively impacting the buying and selling behavioursbehaviour of our customers. Additionally, COVID-19 is still impactingin combination with various macro economic factors impacted the supply chains of new equipment production, which isin turn negatively affectingaffected the supply of used equipment being sold through allthroughout our regions, most predominantly in North America.America.
Our top priority regardingFor a further discussion of risks to our business and operating results arising from COVID-19, please refer to the COVID-19 pandemic remains the health and welfare“Risk Factors” section of our employees, customers, suppliers and others with whom we partner to runAnnual Report on Form 10-K for the year ended December 31, 2021.
Impact of Russia-Ukraine conflict on our business activities. We continue to adhere to all local government and jurisdictional safety guidelines, and, in some instances, we are applying additional over-and-above safety measures. Many of our employees continue to work from home on a temporary basis and travel continues to be quite limited given ongoing travel restrictions.Business
SinceOn February 24, 2022, the beginninggeopolitical situation in Eastern Europe intensified with Russia’s invasion of the COVID-19 pandemic, we continue to be able to operateUkraine, sharply affecting economic and serve our customers’ equipmentglobal financial markets. Subsequent economic sanctions on Russia have exacerbated ongoing economic challenges, including issues such as rising inflation, global supply chain disruption and immediate liquidity needs through our platform of auction technology solutions and online auction capabilities. In addition to running our IronPlanet weekly featured online auction, our online Marketplace-E solution and our GovPlanet online auctions, we modified our operationsincrease in March 2020 to transition all of our traditional live on site industrial auctions and events to online bidding. Buyers are generally still able to visit our auction sitesfuel prices.
The rise in advance of the auctions to conduct inspections and pick up equipment post auction, but we have not been holding live auction events in our theatres. As restrictions ease in the US and elsewhere we will be considering a transition backfuel cost has impacted us to some measure of in-person attendance at our on site auction events.
Our priority is to continue to support our employees, and we are actively monitoring the situation and changing dynamics in each of our respective regions and adjusting our operations as necessary. To this date, layoffs or furlough activities relatedextent due to the COVID-19 pandemic have been limitedsurge in scope.
The extenttransportation costs which has impacted both the cost and timing of the ongoing impactexport and import of the COVID-19 pandemic onequipment between countries globally and contributed to an increase in operating costs of our operational and financial performance, including our ability to execute our business strategies and initiatives, will depend on future developments, including the duration and spread of the pandemic in light of new variants, time of mass vaccine distribution, and any related restrictions placed by respective global governments, as well as supply and demand impacts driven by our consignor and buyer base, all of which are uncertain and cannot be easily predicted. Although at the time of this filing, we continue to operate our auctions in all regions, there is no assurance that our operations could not be impacted in the future.
We continue to actively monitor the evolving impact COVID-19 is having in the world and remain ready to take further actions or adjust our response based on any new governmental guidance or recommendations. It is unknown how long the pandemic will last, or whether we will see a resurgence of cases as new variants develop or spread, how many people are ultimately going to be affected by it, and the long-term implications to local or global economies. Equally, it is still not easily discernable to understand the real effects of the COVID-19 pandemic on equipment supply, buyer demand, and potential pricing volatility, or the potential impact on our buyers’ ability to pay or secure financing. Additionally, there is a level of uncertainty over the long-term impact the COVID-19 pandemic may have on our third party vendors, partners and the service providers with whom we currently do business with today. As such, given the ongoing nature of the COVID-19 pandemic, we are not able to reasonably estimate the future impacts on our business operations, results of operations, cash flows, financial performance or our ability to pay dividends.
| |
Ritchie Bros. |
|
equipment in our operations. Increases in European natural gas prices may also result in an acceleration of a slowdown in the economy, especially in Europe where, historically, Eastern European countries have contributed to importing and exporting equipment for our operations.
We do not have any operations in Russia or Ukraine, or any material operations in neighboring countries and only have a limited number of direct customers in the effected region. However, we cannot estimate the extent of the ongoing impacts of the conflict, other unforeseen conditions, future developments, including the continued evolvement of military activity and sanctions imposed with Russia’s invasion of Ukraine, which could adversely affect the domestic economy generally and our business specifically.
Service Offerings
We offer our equipment seller and buyer customers multiple distinct, complementary, multi-channel brand solutions that address the range of their needs. Our global customer base has a variety of transaction options, breadth of services, and the widest selection of used equipment available to them. For a complete listing of channels and brand solutions available under our Auctions & Marketplace ("A&M") segment, as well as our Other Services segment, please refer to our Annual Report on Form 10-K for the year ended December 31, 2020,2021, which is available on our website at www.rbauction.com, on EDGAR at www.sec.gov, or on SEDAR at www.sedar.com.
Contract options
We offer consignors several contract options to meet their individual needs and sale objectives. Through our A&M business, options include:
● | Straight commission contracts, where the consignor receives the gross proceeds from the sale less a pre-negotiated commission rate; |
● | Guarantee contracts, where the consignor receives a guaranteed minimum amount plus an additional amount if proceeds exceed a specified level; and |
● | Inventory contracts, where we purchase, take custody, and hold used equipment and other assets before they are resold in the ordinary course of business. |
We collectively refer to guarantee and inventory contracts as underwritten or “at-risk” contracts.
Value-added services
We also provide a wide array of value-added services to make the process of selling and buying equipment convenient for our customers, including repair and refurbishment services, financial services through Ritchie Bros. Financial Services (“RBFS”), logistical services through RB Logistics, end to end asset management and disposition services through RB Asset Solutions, as well as other services such as appraisals, insights, data intelligence and performance benchmarking solutions.
● | We also provide a wide array of value-added services to make the process of selling and buying equipment convenient for our customers, including repair and refurbishment services, financial services through Ritchie Bros. Financial Services (“RBFS”), logistical services through RB Logistics, end-to-end asset management and disposition services through RB Asset Solutions, as well as other services such as appraisals, insights, data intelligence and performance benchmarking solutions. We offer equipment listing services under the RitchieList brand in North America and Mascus brand in Europe to make private selling more efficient and safe for customers, including a secure transaction management service, complete with invoicing. We also provide an innovative technology platform that supports customers' management of the equipment lifecycle and integrates parts procurement with both original equipment manufacturers and dealers. |
Seasonality
Our GTV and associatedresulting A&M segment revenuesrevenue are affected by the seasonal nature of our business. GTV and our A&M segment revenuesrevenue tend to increase during the second and fourth calendar quarters, during which time we generally conduct more business than in the first and third calendar quarters. Given the operating leverage inherent in our business model, the second and fourth quarter also tend to produce higher operating margins, given the higher volume and revenue generated in those quarters.
The restrictions imposed and effects of the overall economic environment as a result of the COVID-19 pandemic may continue to impact these trends.
Revenue Mix Fluctuations
Our revenue is comprised of service revenue and inventory sales revenue. Service revenue from A&M segment activities includeincludes commissions earned at our auctions, online marketplaces, and private brokerage services, and various auction-related fees, including listing and buyer transaction fees. We also recognize revenues from our Other SegmentServices segment as fees within service revenue. Inventory sales revenue is recognized as part of our A&M activities and relates to revenues earned through our inventory contracts.
Inventory sales revenue can fluctuate significantly, as it changes based on whether our customers sell using a straight or guarantee commission contract, or an inventory contract at time of selling. Straight or guarantee commission contracts will result in the commission being recognized as service revenue, while inventory contracts will result in the gross transaction value of the equipment sold being recorded as inventory sales revenue with the related cost recognized in cost of inventory sold. As a result, a change in the revenue mix between service revenues and revenue from inventory sales revenue can have a significant impact on revenue growth percentages.
| |
Ritchie Bros. | 30 |
Performance Overview
Net income attributable to stockholders decreased 12% to $53.4 million, compared to $60.7 million in the second quarter of 2021. Diluted earnings per share (“EPS”) attributable to stockholders decreased 13% to $0.48 per share in the second quarter of 2022 as compared to $0.55 per share in the second quarter of 2021. Non-GAAP diluted adjusted EPS attributable to stockholders increased 10% to $0.74 per share in the second quarter of 2022 compared to $0.67 per share in the second quarter of 2021.
For the second quarter of 2022 as compared to the second quarter of 2021:
Consolidated results:
● | Total revenue increased 22% to $484.5 million |
o | Service revenue increased 13% to $286.5 million |
o | Inventory sales revenue increased 38% to $198.0 million |
● | Operating income increased 3% to $91.9 million |
● | Non-GAAP adjusted operating income increased 12% to $119.6 million |
● | Net income decreased 12% to $53.4 million |
● | Non-GAAP adjusted earnings before interest, taxes, depreciation and amortization (“EBITDA”) increased 11% to $136.2 million |
● | Cash provided by operating activities was $198.0 million for the first six months of 2022 |
● | Cash on hand at the end of the second quarter of 2022 was $531.7 million, of which $367.3 million was unrestricted, and restricted cash decreased 84% in the six month period ending June 30, 2022 as a result of the redemption of our 2021 Notes in the quarter for $931.0 million |
Auctions & Marketplaces segment results:
● | GTV increased 10% to $1.7 billion and increased 13% when excluding the impact of foreign exchange |
● | A&M total revenue increased 22% to $433.0 million |
o | Service revenue increased 10% to $235.0 million |
o | Inventory sales revenue increased 38% to $198.0 million |
Other Services segment results:
● | Other Services total revenue increased 29% to $51.5 million |
o | RBFS revenue increased 69% to $19.9 million |
o | SmartEquip revenue of $5.0 million was recognized in the second quarter of 2022, which was its second full quarter since its acquisition in November 2021 |
In addition, the total number of organizations activated on our business inventory management system (“IMS”), a gateway into our marketplace, increased by 50% as compared to the first quarter of 2022.
Other Company developments:
● | On June 2, 2022, the Company announced the appointment of Eric Jacobs as its Chief Financial Officer, effective June 6, 2022. Sharon Driscoll, the former Chief Financial Officer, is remaining with the Company in an advisory capacity to assist with the transition prior to her previously announced retirement. |
| |
Ritchie Bros. | 31 |
Results of Operations
Financial overview
| | | | | | | | | | | | | | | | | | | | |
| | Three months ended June 30, | | | Six months ended June 30, | | ||||||||||||||
| | | | | | % Change | | | | | | | | | % Change | | ||||
(in U.S. $000's, except EPS and percentages) |
| 2022 |
| 2021 |
| 2022 over 2021 |
| | 2022 |
| 2021 |
| 2022 over 2021 |
| ||||||
Service revenue: | | | | | | | | | | | | | | | | | | | | |
Commissions | | $ | 136,403 | | $ | 129,334 | | | 5 | % | | $ | 252,778 | | $ | 233,309 | | | 8 | % |
Fees | | | 150,099 | | | 123,414 | | | 22 | % | | | 278,585 | | | 225,469 | | | 24 | % |
Total service revenue | | | 286,502 | | | 252,748 | | | 13 | % | | | 531,363 | | | 458,778 | | | 16 | % |
Inventory sales revenue | | | 198,044 | | | 143,613 | | | 38 | % | | | 347,104 | | | 269,138 | | | 29 | % |
Total revenue | | | 484,546 | | | 396,361 | | | 22 | % | | | 878,467 | | | 727,916 | | | 21 | % |
Costs of services | |
| 45,039 | |
| 41,301 | |
| 9 | % | |
| 84,054 | |
| 79,167 | |
| 6 | % |
Cost of inventory sold | |
| 176,171 | |
| 131,023 | |
| 34 | % | |
| 307,753 | |
| 241,770 | |
| 27 | % |
Selling, general and administrative | |
| 144,277 | |
| 109,560 | |
| 32 | % | |
| 270,883 | |
| 223,799 | |
| 21 | % |
Total operating expenses | | | 393,026 | | | 307,019 | | | 28 | % | | | 723,927 | | | 594,140 | | | 22 | % |
Gain on disposition of property, plant and equipment | |
| 347 | |
| 175 | | | 98 | % | | | 170,167 | | | 243 | | | 69,928 | % |
Operating income | |
| 91,867 | |
| 89,517 | |
| 3 | % | |
| 324,707 | |
| 134,019 | |
| 142 | % |
Operating income as a % of total revenue | | | 19.0 | % | | 22.6 | % | | (360) | bps | | | 37.0 | % | | 18.4 | % | | 1,860 | bps |
Non-GAAP adjusted operating income | | | 119,579 | | | 106,973 | | | 12 | % | | | 208,439 | | | 164,748 | | | 27 | % |
Non-GAAP adjusted operating income as a % of total revenue | | | 24.7 | % | | 27.0 | % | | (230) | bps | | | 23.7 | % | | 22.6 | % | | 110 | bps |
Net income attributable to stockholders | |
| 53,365 | |
| 60,749 | |
| (12) | % | |
| 231,459 | |
| 88,937 | |
| 160 | % |
Non-GAAP adjusted net income attributable to stockholders | |
| 83,072 | |
| 74,545 | |
| 11 | % | |
| 134,035 | |
| 110,540 | |
| 21 | % |
Non-GAAP adjusted EBITDA | | | 136,219 | | | 122,970 | | | 11 | % | | | 192,624 | | | 195,874 | | | (2) | % |
Diluted earnings per share attributable to stockholders | | $ | 0.48 | | $ | 0.55 | | | (13) | % | | $ | 2.07 | | $ | 0.80 | | | 159 | % |
Non-GAAP diluted adjusted EPS attributable to stockholders | | $ | 0.74 | | $ | 0.67 | | | 10 | % | | $ | 1.20 | | $ | 0.99 | | | 21 | % |
Effective tax rate | |
| 28.8 | % |
| 25.7 | % |
| 310 | bps | |
| 20.0 | % |
| 24.9 | % |
| (490) | bps |
| | | | | | | | | | | | | | | | | | | | |
Total GTV | | | 1,684,276 | | | 1,527,642 | | | 10 | % | | | 3,123,381 | | | 2,802,182 | | | 11 | % |
Service GTV | | | 1,486,232 | | | 1,384,029 | | | 7 | % | | | 2,776,277 | | | 2,533,044 | | | 10 | % |
Service revenue as a % of total GTV | | | 17.0 | % | | 16.5 | % | | 50 | bps | | | 17.0 | % | | 16.4 | % | | 60 | bps |
Inventory GTV | | | 198,044 | | | 143,613 | | | 38 | % | | | 347,104 | | | 269,138 | | | 29 | % |
| | | | | | | | | | | | | | | | | | | | |
Service GTV as a % of total GTV - Mix | | | 88.2 | % | | 90.6 | % | | (240) | bps | | | 88.9 | % | | 90.4 | % | | (150) | bps |
Inventory sales revenue as a % of total GTV - Mix | | | 11.8 | % | | 9.4 | % | | 240 | bps | | | 11.1 | % | | 9.6 | % | | 150 | bps |
Certain amounts in the prior period have been reclassified from selling, general and administrative expenses to cost of services, refer to note 2(a) of the consolidated financial statements
Performance OverviewTotal GTV
Total GTV increased 10% to $1.7 billion in the second quarter of 2022 and increased 11% to $3.1 billion in the first six months of 2022. Total GTV increased 13% in each of second quarter of 2022 and the first six months of 2022, when excluding the impact of foreign exchange.
Net income
In second quarter of 2022, GTV increased year-over-year with consistently strong used equipment values, aided by inflation, partially offset by lower lot counts, unfavourable mix and an unfavourable impact of foreign exchange. In Canada, several large inventory packages in Western Canada and strong year-over-year performances at our agricultural events primarily contributed to the growth in GTV volume. Canada also benefited from higher GTV generated by RBFS via PurchaseSafe which provides escrow services for private brokered transactions. In the United States, we saw favourable year-over-year performances across a number of our auctions and began to see the results of our strategic growth initiatives, including from our local yards, and investments made in our sales teams in Texas. In International, Australia saw significant growth in GTV volume driven by a higher number of inventory packages and strong performances from a large new national auction event attributable primarily to stockholders increased 15% to $60.7 million, compared to $53.0 million in Q2 2020. Diluted earnings per share (“EPS”) attributable to stockholders increased 12% to $0.55 per share in Q2 2021 as compared to $0.49 per share in Q2 2020. Diluted adjusted EPS attributable to stockholders* increased 2% to $0.55 per share in Q1 2021 compared to $0.54 per share in Q2 2020.overall improved market conditions and the lifting of border restrictions.
For the second quarterfirst six months of 20212022, total GTV increased 11% driven by the same macro economic factors as compareddiscussed above, with higher volumes growth across all regions, despite a continued unfavourable supply environment. In Canada, GTV growth was driven by strong performances across several agricultural events, strong execution by our Canadian strategic accounts teams, higher volume from RBFS, and higher numbers of inventory packages as discussed above. In the United States, GTV volume increased primarily for the same reasons as discussed above. In addition, we saw a large dispersal of construction equipment in our Phoenix, Arizona auction and positive year-over year performance at our flagship Orlando, Florida event. In International, the increase in GTV volume was primarily driven by Australia for the same reasons as discussed above, as well as due to the second quarter of 2020:
Consolidated results:
Auctions & Marketplaces segment results:
Other Services segment results:
Other Company developments:
a new event in Corio, Victoria and two agricultural events.
| |
Ritchie Bros. | 32 |
Results of Operations
Financial overview
| | | | | | | | | | | | | | | | | | | | | |
| | Three months ended June 30, | | Six months ended June 30, | | | |||||||||||||||
| | | | | | | | % Change | | | | | | | | % Change | | | |||
(in U.S. $000's, except EPS and percentages) |
| 2021 |
| 2020 |
| 2021 over 2020 |
| | 2021 |
| 2020 |
| 2021 over 2020 |
| | ||||||
Service revenue: | | | | | | | | | | | | | | | | | | | | | |
Commissions | | $ | 129,334 | | $ | 125,465 | | | 3 | % | | $ | 233,309 | | $ | 218,950 | | | 7 | % | |
Fees | | | 123,414 | | | 108,674 | | | 14 | % | | | 225,469 | | | 198,312 | | | 14 | % | |
Total service revenue | | | 252,748 | | | 234,139 | | | 8 | % | | | 458,778 | | | 417,262 | | | 10 | % | |
Inventory sales revenue | | | 143,613 | | | 154,911 | | | (7) | % | | | 269,138 | | | 245,043 | | | 10 | % | |
Total revenue | | | 396,361 | | | 389,050 | | | 2 | % | | | 727,916 | | | 662,305 | | | 10 | % | |
Costs of services | |
| 39,042 | |
| 39,448 | |
| (1) | % | |
| 75,069 | |
| 78,803 | |
| (5) | % | |
Cost of inventory sold | |
| 131,023 | |
| 143,134 | |
| (8) | % | |
| 241,770 | |
| 224,719 | |
| 8 | % | |
Selling, general and administrative expenses | |
| 111,819 | |
| 100,632 | |
| 11 | % | |
| 227,897 | |
| 199,017 | |
| 15 | % | |
Operating expenses | | | 306,844 | | | 300,250 | | | 2 | % | | | 593,897 | | | 539,423 | | | 10 | % | |
Operating income | |
| 89,517 | |
| 88,800 | |
| 1 | % | |
| 134,019 | |
| 122,882 | |
| 9 | % | |
Operating income as a % of total revenue | | | 22.6 | % | | 22.8 | % | | (20) | bps | | | 18.4 | % | | 18.6 | % | | (20) | bps | |
Net income attributable to stockholders | |
| 60,749 | |
| 53,043 | |
| 15 | % | |
| 88,937 | |
| 75,851 | |
| 17 | % | |
Adjusted net income attributable to stockholders* | |
| 60,749 | |
| 59,271 | |
| 2 | % | |
| 88,937 | |
| 82,079 | |
| 8 | % | |
Diluted earnings per share attributable to stockholders | | $ | 0.55 | | $ | 0.49 | | | 12 | % | | $ | 0.80 | | $ | 0.69 | | | 16 | % | |
Diluted adjusted EPS attributable to stockholders* | | $ | 0.55 | | $ | 0.54 | | | 2 | % | | $ | 0.80 | | $ | 0.75 | | | 7 | % | |
Effective tax rate | |
| 25.7 | % |
| 34.2 | % |
| (850) | bps | |
| 24.9 | % |
| 30.5 | % |
| (560) | bps | |
| | | | | | | | | | | | | | | | | | | | | |
Total GTV | | | 1,527,642 | | | 1,493,982 | | | 2 | % | | | 2,802,182 | | | 2,641,006 | | | 6 | % | |
Service GTV | | | 1,384,029 | | | 1,339,071 | | | 3 | % | | | 2,533,044 | | | 2,395,963 | | | 6 | % | |
Service revenue as a % of total GTV | | | 16.5 | % | | 15.7 | % | | 80 | bps | | | 16.4 | % | | 15.8 | % | | 60 | bps | |
Inventory GTV | | | 143,613 | | | 154,911 | | | (7) | % | | | 269,138 | | | 245,043 | | | 10 | % | |
| | | | | | | | | | | | | | | | | | | | | |
Service revenue as a % of total revenue | | | 63.8 | % | | 60.2 | % | | 360 | bps | | | 63.0 | % | | 63.0 | % | | — | bps | |
Inventory sales revenue as a % of total revenue | |
| 36.2 | % |
| 39.8 | % |
| (360) | bps | |
| 37.0 | % |
| 37.0 | % |
| — | bps | |
Cost of inventory sold as a % of operating expenses | |
| 42.7 | % |
| 47.7 | % |
| (500) | bps | |
| 40.7 | % |
| 41.7 | % |
| (100) | bps | |
Service GTV as a % of total GTV - Mix | | | 90.6 | % | | 89.6 | % | | 100 | bps | | | 90.4 | % | | 90.7 | % | | (30) | bps | |
Inventory sales revenue as a % of total GTV - Mix | | | 9.4 | % | | 10.4 | % | | (100) | bps | | | 9.6 | % | | 9.3 | % | | 30 | bps | |
Total GTV
Total GTV increased 2% to $1.5 billion in Q2 2021 and increased 6% to $2.8 billion in the first half of 2021. Total GTV decreased 3% in Q2 2021 and increased 2% in the first half of 2021, when excluding the impact of foreign exchange.
In Q2 2021, GTV grew primarily in International and Canada, offset by lower volume in the US. All regions continued to experience very strong mix adjusted auction price performance due to high demand for used equipment, in part aided by our digital marketing efforts. However, despite higher mix adjusted pricing, we experienced headwinds due to negative mix impacts driven in part by older aged equipment in the transportation and construction sectors. This combined with auction calendar shifts of $52 million from the impact of the COVID-19 pandemic that were shifted from Q1 into Q2 2020 that did not repeat in Q2 2021 led to lower GTV. In International, the increased volumes were driven by an improved economic climate and the benefit from the use of new satellite yards in France, Germany and Australia coupled with a favourable foreign exchange impact partially offset by the auction shift of Caorso, Italy. In Canada, we benefited from a favourable foreign exchange impact, higher performance at our Toronto auction, and increased volume from providing escrow services for private brokered transactions in RBFS, offset by lower overall volumes in Edmonton and Grand Prairie as well as the shift of our Montreal auction. In the US, we saw lower volumes due to the shift of our Los Angeles auction, the non-repeat of a large supply contract, lower activity due to supply constraints mainly in our Fort Worth auction and Denver regional combined events. In addition, lower volumes in our US strategic accounts in the finance, OEM and transportation sectors also contributed to lower GTV, partially offset by positive online performance.
|
|
|
|
For the first half of 2021, total GTV increased 6% in line with favourable impact of foreign exchange, higher volumes in International partially offset by lower volumes in Canada and the US for the same reasons as discussed above. In addition, we saw lower volumes at the Orlando and Las Vegas, US auctions, and the non-repeat of a collector car event.
Total revenue
Total revenue increased 2%22% to $396.4$484.5 million in Q2 2021,the second quarter of 2022, with total service revenue increasing by 8%, offset by a decrease in13% and inventory sales revenue increasing by 7%38%. Total revenue increased 10%21% to $727.9$878.5 million for the first halfsix months of 2021.2022, with total service revenue increasing by 16% and inventory sales revenue increasing by 29%.
Foreign currency fluctuation also had a favourablean unfavourable impact on our revenue primarily due to the appreciationdepreciation of the Canadian dollar,Euro, the Australian dollar and the EuroCanadian dollar relative to the U.S. dollar.
Service Revenue
Q2 2021
In Q2 2021, total serviceService revenue increased 8% with fees revenue increasing 14% and commissions revenue increasing 3%. Service revenues compriseis comprised of commissions whichthat are earned on Serviceservice GTV, and Feesfees which are earned on total GTV, as well as from our other services such as Ancillary Services, RBFS, Rouse, Mascus, RB Logistics, and RB Asset Solutions.
Service GTV increased 3% to $1.4 billion in line with strong pricing, favourable foreign exchange, partially offset by unfavourable mix. By region, we saw higher GTV mainly in InternationalSolutions and Canada due to higher activity, offset by lower volumes in the US due to equipment supply constraints and mix. International saw significantly higher volumes in Australia, the Middle East, Spain and Italy, primarily as a result of improved market economic conditions and the lifting of border and travel restrictions from the recovery of the COVID-19 pandemic. The region also benefited from the shifting of the Polotitlan, Mexico auction and new satellite yards in Europe, slightly offset by the shifting of the Caorso, Italy auction. In Canada, Service GTV grew due to a strong foreign exchange impact, positive year-over-year performance in our Toronto auction, offset by the shifting of our Montreal auction and overall softer performance in Edmonton and Grand Prairie. In addition, Canada service GTV grew as a result of increased escrow services provided by RBFS for private brokered transactions through our Marketplace-E platform. In the US, Service GTV decreased due to the shifting of our Los Angeles auction, lower volumes in the Denver combined regional auction events as well as in our Fort Worth auction, and the non-repeat of a large supply contract. These decreases were partially offset by higher Service GTV sold through our online platform and in our GovPlanet business.SmartEquip.
Fees revenue increased 14%, mainly due to fee revenue fromIn the acquisitionsecond quarter of Rouse, higher fees driven by higher funded volume in RBFS, and higher buyer fees in line with higher GTV of 2%. Buyer fees also increased from the revised global buyer-fee structure implemented on May 1, 2021, the re-instatement of fees at the Canadian on-the-farm auctions which were waived in Q2 2020 as part of our COVID-19 pandemic response, as well as higher buyer fee structures in both Australia and in our GovPlanet business. These increases were partially offset by lower fees as a result of lower activity in our Ancillary services, lower fees on mix of lower proportion of small value lots and lower document fees in the US driven by a decline in the total number of titled lots sold.
Commissions revenue increased 3%, in line with the increase in Service GTV of 3%.
First half of 2021
For the first half of 2021,2022, total service revenue increased 10%13% with fees revenue increasing 14%22% and commissions revenue increasing 7%5%.
Service GTV increased 6%7% to $2.5$1.5 billion mainly in the United States and Canada. Fees revenue increased 22% with buyer fees growing faster than the GTV increase of 10%, reflecting the increase in buyer fee rates implemented in early 2022. Fees revenue also increased due to higher RBFS revenues on higher funded volumes, and the inclusion of fees from SmartEquip since its acquisition on November 2, 2021. Commissions revenue increased 5%, slightly less than the 7% increase in service GTV, primarily driven by the non-repeat of several high performing guarantee contracts in Canada, as well as a lower commissions revenue from a higher proportion of GTV contributed by RBFS from facilitating financing arrangements.
For the first six months of 2022, total service revenue increased 16% with fees revenue increasing 24% and commissions revenue increasing 8%. Service GTV increased 10% to $2.8 billion across all regions with increases in International and Canada offsetting lower performancesmost notably in the USUnited States and Canada. Fees revenue increased 24% with buyer fees growing faster than GTV of 11% for the same reasons as discussed above. In addition, lower Service GTV in the US was driven by lower volumes at our Orlando and Las Vegas auctions, and the non-repeat of a collector car event.
FeesCommissions revenue increased 14%8%, partially related toslightly less than the 10% increase in totalservice GTV of 6%. The remaining increase was due tofor the same reasons as discussed above, and partially offset by the reduction in fees revenue in the US resulting from the non-repeat of a collector car event.above.
Commissions revenue increased 7%, largely driven by the increase in Service GTV of 6%.
|
|
|
|
Inventory Sales Revenue
Inventory sales revenue as a percentage of total GTV decreasedincreased to 11.8% from 9.4% from 10.4% in Q2 2021the second quarter of 2022 and increased to 9.6%11.1% from 9.3%9.6% in the first halfsix months of 2021.2022.
In Q2 2021,the second quarter of 2022, inventory sales revenue decreased 7% representing a lower mix of volumes of inventory contracts, partially offset byincreased 38% primarily due to higher pricing. In both the US and Canada, an unfavourable supply environment impacted the volumes at our auctionsactivity in Fort Worth, US and Orlando, US and Edmonton, Canada. These decreases were partially offset by strongThe improved year-over-year performance in ourCanada was driven primarily by two large inventory contracts in the transportation sector. In International, region primarily driven by large private treaty transactionsinventory sales revenue grew in Australia and in the Middle East due tofrom higher volumes benefiting from overall improved economic conditions from the recovery of the COVID-19 pandemic. In addition, we saw increased volumesinventory contracts sold through our GovPlanet businessat a large new national auction event, as well as a result of the new non-rollingoverall improvement in market conditions and rolling stockthe lifting of border restrictions. In the United States, higher volume of inventory contracts effective June 1, 2021 andcontributed to higher volumes due to the government shutdowns in prior year in response to the COVID-19 pandemic.inventory sales revenue.
For the first halfsix months of 2021,2022, inventory sales revenue increased 10%29% primarily due toin the United States and Canada for the same reasons as discussed above. In addition, in the United States, inventory sales revenue also grew from a higher mixlarge dispersal of construction equipment in our Phoenix, Arizona auction, partially offset by a lower volume of inventory contracts as well as strong performances in International as discussed aboveour Orlando, Florida and the addition of several new auctions held across various countries in Europe.Atlanta, Georgia events.
Underwritten Contracts
We offer our customers the opportunity to use underwritten commission contracts to serve their disposition strategy needs, entering into such contracts where the risk and reward profile of the terms are agreeable. Our underwritten contracts, which includesinclude inventory and guarantee contracts decreasedincreased to 21.0% in the second quarter of 2022 compared to 17.6% in Q2 2021 compared to 24.6% in Q2 2020.the second quarter of 2021. For the first halfsix months of 2021,2022, our underwritten contracts were 16.3%19.2% compared to 20.4%16.3% in the prior period.
Operating Income
For Q2 2021,the second quarter of 2022, operating income increased 1%3% or $0.7$2.4 million to $89.5$91.9 million, primarily due to a favourable impact of foreign exchange fluctuation, flow through from higher service revenues, partially offset by higher selling, general and administrative expenses. Selling, general and administrative expenses increased due to higher short-term incentive expenses and incremental acquisition-related costsshare-based payments driven by strong performance. Share-based payments also increased as a result of a higher expense relating to share-based awards issued to senior executives, and depreciationhigher expense from the premium-priced options and amortization associatedPSU’s with market conditions granted in late 2021. We saw higher wages, salaries and benefits expenses driven by higher headcount, in part due to the acquisition of RouseSmartEquip, as well as to accelerate our growth initiatives and our
| |
Ritchie Bros. | 33 |
transformational journey to become a trusted global marketplace. Building, facilities and technology costs also increased mainly due to the amortization of the right-of-use asset of the Bolton property from the sale and lease back arrangement completed in Q4 2020. For the first halfquarter of 2021, operating income increased 9% or $11.1 million to $134.0 million, primarily for the same reasons above,2022, as well as higher costs as we shift to cloud-based solutions to improve customer experiences. In addition, we saw higher travel, advertising and promotion costs from increased activity in global travel as well as inflation, and higher marketing expenses to promote new initiatives. Professional fees also increased, primarily driven by our investment in new modern architecture to support our future marketplace and services strategy. Inflation also resulted in higher personnel and travel costs.
For the first six months of 2022, operating income increased 142% due to the inclusion of a gain of $169.1 million on property, plant and equipment from the sale of the Bolton property in the first quarter of 2022. Operating income increased 16%, when excluding the impact of the gain, primarily due to flow through from higher revenue, rates on inventory salespartially offset by higher severance costs relating to ongoing operations ofselling, general and administrative expenses mainly due the business.same reasons as discussed above.
Income tax expense and effective tax rate
At the end of each interim period, we estimate the effective tax rate expected to be applicable for the full fiscal year. The estimate reflects, among other items, management’s best estimate of operating results. It does not include the estimated impact of foreign exchange rates or unusual and/or infrequent items, which may cause significant variations in the customary relationship between income tax expense and income before income taxes.
For Q2 2021,the second quarter of 2022, income tax expense decreased 24%increased 3% to $21.1$21.6 million and our effective tax rate increased 310 bps to 28.8% as compared to the second quarter of 2021. For the first six months of 2022, income tax expense increased 96.3% to $57.9 million and our effective tax rate decreased 850490 bps to 25.7% as compared to Q2 2020. For the first half of 2021, income tax expense decreased 11% to $29.5 million and our effective tax rate decreased 560 bps to 24.9%20.0% as compared to the first halfsix months of 2020.2021.
DecreaseThe increase in the effective tax rate for Q2the second quarter of 2022 compared to the second quarter of 2021 was primarily due to higher return to provision adjustments and higher income taxes related to tax uncertainties. Partially offsetting this increase was a lower estimate of non-deductible expenses.
The decrease in the estimateeffective tax rate for the first six months of non-deductible expenses.2022 compared to the first six months of 2021 was primarily due to the non-taxable gain portion on the sale of the Bolton property. Partially offsetting this decrease was a higher estimate of income taxed in jurisdictions with higher tax rates.
On April 8, 2020 by the United States Department of Treasuryrates and the Internal Revenue Service (“IRS”) clarified income tax benefits related to hybrid financing arrangements would not be deductible (“Hybrid Interest”). Thea lower estimate of non-deductible expenses is primarily due to the net income tax benefits of approximately $6.2 million in the twelve months ended December 31, 2019 and $1.1 million in the three months ended March 31, 2020 which were no longer deductible and accordingly were reversed in the three months ended June 30, 2020.
Decrease in the first half of 2021 was primarily due to the reasons described above. In addition, there was a higher tax deduction for PSU and RSU share unit expenses in excess ofthat exceeded the related compensation expense.
|
|
|
|
Net income
In Q2the second quarter of 2022, net income attributable to stockholders decreased 12% to $53.4 million primarily due to higher interest expense, which included the loss on redemption of the 2021 Notes and certain related interest expense incurred in the quarter in connection with the discontinued Euro Auctions acquisition. For the first six months of 2022, net income attributable to stockholders increased 15%160% to $60.7$231.5 million, primarily relateddue to the decreasegain of $169.1 million on property, plant and equipment from the sale of the Bolton property recognized in the effective tax rate,first quarter of 2022, as discussed above, andwell as higher operating income. For the first half ofincome, offset by higher interest expense incurred on our 2021 net income attributable to stockholders increased 17% to $89.0 million, primarily for the same reasons noted above.Notes.
Diluted EPS
Diluted EPS attributable to stockholders increased 12%decreased 13% to $0.55$0.48 per share for Q2 2021the second quarter of 2022 and increased 16%159% to $0.80$2.07 per share for the first halfsix months of 2021.2022, in line with net income.
| |
Ritchie Bros. | 34 |
U.S. dollar exchange rate comparison
We conduct global operations in many different currencies, with our presentation currency being the U.SU.S. dollar. The following table presents the variance in select foreign exchange rates over the comparative reporting periods:
| | | | | | | | | | | | | | | | | | |
| | | | |
| | | % Change | | | | |
| | | % Change | | |
| | | | | | |
| 2021 over |
| | | | | | |
| 2022 over | |
Value of one local currency to U.S dollar |
| 2021 |
| 2020 |
| 2020 | | |||||||||||
Period-end exchange rate |
| |
|
| |
|
|
|
| |||||||||
Value of one local currency to U.S. dollar |
| 2022 |
| 2021 |
| 2021 | | |||||||||||
Period-end exchange rate - June 30, |
| |
|
| |
|
|
|
| |||||||||
Canadian dollar | | | 0.8067 | | | 0.7367 |
| 10 | % | | | 0.7768 | | | 0.8067 |
| (4) | % |
Euro | |
| 1.1857 | |
| 1.1235 |
| 6 | % | |
| 1.0477 | |
| 1.1857 |
| (12) | % |
Australian dollar | | | 0.7499 | | | 0.6902 | | 9 | % | | | 0.6898 | | | 0.7499 | | (8) | % |
| | | | | | | | | | | | | | | | | | |
Average exchange rate -Three months ended June 30, | |
| | |
| |
| |
| |||||||||
Average exchange rate - Three months ended June 30, | |
| | |
| |
| |
| |||||||||
Canadian dollar | | | 0.8139 | | | 0.7210 |
| 13 | % | | | 0.7836 | | | 0.8139 |
| (4) | % |
Euro | | | 1.2046 | |
| 1.1009 |
| 9 | % | | | 1.0658 | |
| 1.2046 |
| (12) | % |
Australian dollar | | | 0.7698 | | | 0.6557 | | 17 | % | | | 0.7151 | | | 0.7698 | | (7) | % |
| | | | | | | | | | | | | | | | | | |
Average exchange rate -Six months ended June 30, | |
| | |
| |
| |
| |||||||||
Average exchange rate - Six months ended June 30, | |
| | |
| |
| |
| |||||||||
Canadian dollar | | | 0.8139 | | | 0.7334 |
| 11 | % | | | 0.7864 | | | 0.8139 |
| (3) | % |
Euro | | | 1.2046 | |
| 1.1021 |
| 9 | % | | | 1.0941 | |
| 1.2046 |
| (9) | % |
Australian dollar | | | 0.7698 | | | 0.6572 | | 17 | % | | | 0.7194 | | | 0.7698 | | (7) | % |
For Q2 2021,the second quarter of 2022, foreign exchange had a favourablean unfavourable impact on total revenue and an unfavourablea favourable impact on expenses. These impacts were primarily due to the fluctuations in the Euro, Australian dollar and Canadian dollar and the Euro exchange rates relative to the U.S. dollar.
Non-GAAP Measures
As part of management’s non-GAAP measures, we may eliminate the financial impact of adjusting items which are after-tax effects of significant recurring and non-recurring items that we do not consider to be part of our normal operating results, such as acquisition-related costs, management reorganization costs, severance, retention, gains/losses on sale of an equity accounted for investment, plant and equipment, impairment losses, and certain other items, which we refer to as ‘adjusting items’. There were no adjusting items in Q2 2021 or Q2 2020.results.
AdjustedNon-GAAP adjusted net income attributed to stockholders (non-GAAP measure) increased 2%11% to $60.7$83.1 million in Q2 2021the second quarter of 2022 and increased 8%21% to $88.9$134.0 million for the first halfsix months of 2021.2022.
DilutedNon-GAAP diluted Adjusted EPS attributable to stockholders (non-GAAP measure) increased 2%10% to $0.55$0.74 per share in Q2 2021the second quarter of 2022 and increased 7%21% to $0.80$1.20 per share for the first halfsix months of 2021.2022.
Adjusted Earnings Before Interest, Taxes, Depreciation and Amortization (“EBITDA”) (non-GAAP measure)Non-GAAP adjusted EBITDA increased 5%11% to $112.3$136.2 million in Q2 2021the second quarter of 2022 and increased 9%23% to $178.6$241.1 million for the first halfsix months of 2021.2022.
Debt at the end of Q2the second quarter of 2022 represented 2.2 times net income as at and for the 12 months ended June 30, 2022, compared to debt at the second quarter of 2021, which represented 3.7 times net income as at and for the 12 months ended June 30, 2021. This compares to debt at Q2 2020, which represented 4.3 times net income as at and for the 12 months ended June 30, 2020. The decrease in this debt/net income multiplier was primarily due to higher operating income driving higher net income as at June 30, 2021 compared to June 30, 2020. Thenon-GAAP adjusted net debt/non-GAAP adjusted EBITDA (non-GAAP measure) was 1.00.7 times as at and for the 12 months ended June 30, 20212022, compared to 0.9 times as at and for the 12 months ended June 30, 2020.2021.
| |
Ritchie Bros. |
|
Segment Performance
We provide our customers with a wide array of services. The following table presents a breakdown of our consolidated results between the A&M segment and Other Services segment. A complete listing of channels and brand solutions under the A&M segment, as well as our Other Services segment, is available in our Annual Report on Form 10-K for the year ended December 31, 2020.2021.
| | | | | | | | | | | | | | | | | | | | | | | | | | | | | | | | | | | | | |
| | Three months ended June 30, 2021 | | Six months ended June 30, 2021 | | | Three months ended June 30, 2022 | | Six months ended June 30, 2022 | ||||||||||||||||||||||||||||
(in U.S $000's) |
| A&M |
| Other |
| Consolidated | | A&M |
| Other |
| Consolidated | |
| A&M |
| Other |
| Consolidated | | A&M |
| Other |
| Consolidated | ||||||||||||
Service revenue | | $ | 211,475 | | $ | 41,273 | | $ | 252,748 | | $ | 382,230 | | $ | 76,548 | | $ | 458,778 | | ||||||||||||||||||
Service revenue: | | | | | | | | | | | | | | | | | | | |||||||||||||||||||
Commissions | | $ | 136,403 | | $ | — | | $ | 136,403 | | $ | 252,778 | | $ | — | | $ | 252,778 | |||||||||||||||||||
Fees | | | 98,588 | | | 51,511 | | | 150,099 | | | 183,217 | | | 95,368 | | | 278,585 | |||||||||||||||||||
Total service revenue | | | 234,991 | | | 51,511 | | | 286,502 | | | 435,995 | | | 95,368 | | | 531,363 | |||||||||||||||||||
Inventory sales revenue | | | 143,613 | | | — | | | 143,613 | | | 269,138 | | | — | | | 269,138 | | | | 198,044 | | | — | | | 198,044 | | | 347,104 | | | — | | | 347,104 |
Total revenue | | | 355,088 | | | 41,273 | | | 396,361 | | | 651,368 | | | 76,548 | | | 727,916 | | | $ | 433,035 | | $ | 51,511 | | $ | 484,546 | | $ | 783,099 | | $ | 95,368 | | $ | 878,467 |
Ancillary and logistical service expenses | | | — | | | 14,819 | | | 14,819 | | | — | | | 27,088 | | | 27,088 | | | | — | | | 13,446 | | | 13,446 | | | — | | | 24,201 | | | 24,201 |
Other costs of services | | | 21,985 | | | 2,238 | | | 24,223 | | | 43,575 | | | 4,406 | | | 47,981 | | | | 28,985 | | | 2,608 | | | 31,593 | | | 54,559 | | | 5,294 | | | 59,853 |
Cost of inventory sold | |
| 131,023 | |
| — | |
| 131,023 | |
| 241,770 | |
| — | |
| 241,770 | | |
| 176,171 | |
| — | |
| 176,171 | |
| 307,753 | |
| — | |
| 307,753 |
SG&A expenses | |
| 101,417 | |
| 10,402 | |
| 111,819 | |
| 205,762 | |
| 22,135 | |
| 227,897 | | ||||||||||||||||||
Selling, general and administrative | |
| 125,535 | |
| 18,742 | |
| 144,277 | |
| 234,346 | |
| 36,537 | |
| 270,883 | |||||||||||||||||||
Segment profit | | | 100,663 | | | 13,814 | | | 114,477 | | | 160,261 | | | 22,919 | | | 183,180 | | | $ | 102,344 | | $ | 16,715 | | $ | 119,059 | | $ | 186,441 | | $ | 29,336 | | $ | 215,777 |
| | | | | | | | | | | | | | | | | | | | | | | | | | | | | | | | | | | | |
| | Three months ended June 30, 2020 | | Six months ended June 30, 2020 | | Three months ended June 30, 2021 | | Six months ended June 30, 2021 | ||||||||||||||||||||||||||||
(in U.S $000's) | | A&M |
| Other |
| Consolidated | | A&M |
| Other |
| Consolidated | | A&M |
| Other |
| Consolidated | | A&M |
| Other |
| Consolidated | ||||||||||||
Service revenue | | $ | 199,648 | | $ | 34,491 | | $ | 234,139 | | $ | 354,391 | | $ | 62,871 | | $ | 417,262 | ||||||||||||||||||
Service revenue: | | | | | | | | | | | | | | | | | | | ||||||||||||||||||
Commissions | | $ | 129,334 | | $ | — | | $ | 129,334 | | $ | 233,309 | | $ | — | | $ | 233,309 | ||||||||||||||||||
Fees | | | 83,334 | | | 40,080 | | | 123,414 | | | 151,430 | | | 74,039 | | | 225,469 | ||||||||||||||||||
Total service revenue | | | 212,668 | | | 40,080 | | | 252,748 | | | 384,739 | | | 74,039 | | | 458,778 | ||||||||||||||||||
Inventory sales revenue | | | 154,911 | | | — | | | 154,911 | | | 245,043 | | | — | | | 245,043 | | | 143,613 | | | — | | | 143,613 | | | 269,138 | | | — | | | 269,138 |
Total revenue | | | 354,559 | | | 34,491 | | | 389,050 | | | 599,434 | | | 62,871 | | | 662,305 | | $ | 356,281 | | $ | 40,080 | | $ | 396,361 | | $ | 653,877 | | $ | 74,039 | | $ | 727,916 |
Ancillary and logistical service expenses | | | — | | | 16,060 | | | 16,060 | | | — | | | 28,818 | | | 28,818 | | | — | | | 14,819 | | | 14,819 | | | — | | | 27,088 | | | 27,088 |
Other costs of services | | | 22,190 | | | 1,198 | | | 23,388 | | | 47,285 | | | 2,700 | | | 49,985 | | | 25,176 | | | 1,306 | | | 26,482 | | | 49,480 | | | 2,599 | | | 52,079 |
Cost of inventory sold | |
| 143,134 | |
| — | |
| 143,134 | |
| 224,719 | |
| — | |
| 224,719 | |
| 131,023 | |
| — | |
| 131,023 | |
| 241,770 | |
| — | |
| 241,770 |
SG&A expenses | |
| 94,559 | |
| 6,073 | |
| 100,632 | |
| 186,144 | |
| 12,873 | |
| 199,017 | ||||||||||||||||||
Selling, general and administrative | |
| 99,215 | |
| 10,345 | |
| 109,560 | |
| 201,996 | |
| 21,803 | |
| 223,799 | ||||||||||||||||||
Segment profit | | | 94,676 | | | 11,160 | | | 105,836 | | $ | 141,286 | | $ | 18,480 | | $ | 159,766 | | $ | 100,867 | | $ | 13,610 | | $ | 114,477 | | $ | 160,631 | | $ | 22,549 | | $ | 183,180 |
| |
Ritchie Bros. | 36 |
Auctions and Marketplaces Segment
Results of A&M segment operations are presented below for the comparative reporting periods.
| | | | | | | | | | | | | | | | | | | | | | | | | | | | | | | | | | | | | | |
| | Three months ended June 30, | | Six months ended June 30, | | | | Three months ended June 30, | | | Six months ended June 30, | | | |||||||||||||||||||||||||
| | | | | | | | % Change | | | | | | | | % Change | | | | | | | | | | % Change | | | | | | | | | % Change | | | |
|
| | | | | | | 2021 over |
| | | | | | | | 2021 over |
| |
| | | | | | | 2022 over |
| | | | | | | | 2022 over |
| |
(in U.S. $000's, except percentages) | | 2021 |
| 2020 | | 2020 | | | 2021 |
| 2020 | | 2020 | | | | 2022 |
| 2021 | | 2021 | | | 2022 |
| 2021 | | 2021 | | | ||||||||
Service revenue |
| $ | 211,475 | | $ | 199,648 | | 6 | % | | $ | 382,230 | | $ | 354,391 | | 8 | % | | |||||||||||||||||||
Service revenue: | | | | | | | | | | | | | | | | | | | | |||||||||||||||||||
Commissions | | $ | 136,403 | | $ | 129,334 | | 5 | % | | | 252,778 | | | 233,309 | | 8 | % | | |||||||||||||||||||
Fees | | | 98,588 | | | 83,334 | | 18 | % | | | 183,217 | | | 151,430 | | 21 | % | | |||||||||||||||||||
Total service revenue |
| | 234,991 | | | 212,668 | | 10 | % | | $ | 435,995 | | $ | 384,739 | | 13 | % | | |||||||||||||||||||
Inventory sales revenue |
| | 143,613 | | | 154,911 | | (7) | % | | | 269,138 | | | 245,043 | | 10 | % | |
| | 198,044 | | | 143,613 | | 38 | % | | | 347,104 | | | 269,138 | | 29 | % | |
Total revenue | | | 355,088 | | | 354,559 | | 0 | % | | | 651,368 | | | 599,434 | | 9 | % | | | $ | 433,035 | | $ | 356,281 | | 22 | % | | | 783,099 | | | 653,877 | | 20 | % | |
A&M service revenue as a % of total A&M revenue | | | 59.6 | % | | 56.3 | % | 330 | bps | | | 58.7 | % | | 59.1 | % | (40) | bps | | | | 54.3 | % | | 59.7 | % | (540) | bps | | | 55.7 | % | | 58.8 | % | (310) | bps | |
Inventory sales revenue as a % of total A&M revenue | | | 40.4 | % | | 43.7 | % | (330) | bps | | | 41.3 | % | | 40.9 | % | 40 | bps | | | | 45.7 | % | | 40.3 | % | 540 | bps | | | 44.3 | % | | 41.2 | % | 310 | bps | |
Costs of services | | | 21,985 | | | 22,190 | | (1) | % | | | 43,575 | | | 47,285 | | (8) | % | | | | 28,985 | | | 25,176 | | 15 | % | | | 54,559 | | | 49,480 | | 10 | % | |
Cost of inventory sold | | | 131,023 | | | 143,134 | | (8) | % | | | 241,770 | | | 224,719 | | 8 | % | | | | 176,171 | | | 131,023 | | 34 | % | | | 307,753 | | | 241,770 | | 27 | % | |
SG&A expenses | | | 101,417 | | | 94,559 | | 7 | % | | | 205,762 | | | 186,144 | | 11 | % | | |||||||||||||||||||
Selling, general and administrative | | | 125,535 | | | 99,215 | | 27 | % | | | 234,346 | | | 201,996 | | 16 | % | | |||||||||||||||||||
A&M segment expenses | | $ | 254,425 | | $ | 259,883 | | (2) | % | | $ | 491,107 | | $ | 458,148 | | 7 | % | | | $ | 330,691 | | $ | 255,414 | | 29 | % | | $ | 596,658 | | $ | 493,246 | | 21 | % | |
Cost of inventory sold as a % of A&M expenses | | | 51.5 | % | | 55.1 | % | (360) | bps | | | 49.2 | % | | 49.0 | % | 20 | bps | | | | 53.3 | % | | 51.3 | % | 200 | bps | | | 51.6 | % | | 49.0 | % | 260 | bps | |
A&M segment profit | | $ | 100,663 | | $ | 94,676 | | 6 | % | | $ | 160,261 | | $ | 141,286 | | 13 | % | | | $ | 102,344 | | $ | 100,867 | | 1 | % | | $ | 186,441 | | $ | 160,631 | | 16 | % | |
Total GTV | | | 1,527,642 | | | 1,493,982 | | 2 | % | | | 2,802,182 | | | 2,641,006 | | 6 | % | | | | 1,684,276 | | | 1,527,642 | | 10 | % | | | 3,123,381 | | | 2,802,182 | | 11 | % | |
A&M service revenue as a % of total GTV- Rate |
| | 13.8 | % | | 13.4 | % | 40 | bps | | | 13.6 | % | | 13.4 | % | 20 | bps | |
| | 14.0 | % | | 13.9 | % | 10 | bps | | | 14.0 | % | | 13.7 | % | 30 | bps | |
Gross Transaction Value
In response to the COVID-19, pandemic, in March 2020, we transitioned all our traditional live on siteonsite auctions to online bidding utilizing our existing online bidding technology and simultaneously ceased almost all public attendance at our live auction theaters. Our core online auction channels (IronPlanet.com, GovPlanet.com, Marketplace-E) continued to operate as usual. In 2022, we began to return to live in-person onsite bidding at some of our auction events, offering both onsite and online bidding.
To facilitate the live auction process, transitionwe have continued to a virtual platform and under strict safety guidelines, we enabledenable equipment drop off at our physical yards, prior to the online event, with buyers able to conduct inspections pre-auction and collect equipment post auction. In addition, where auctioneers were not able to attend a physical site, we used Timebalanced Timed Auctioned Lots (TAL)(“TAL”) solutions for selected Internationalindustrial and on-the-farm agriculture events.
We believe it is meaningful to consider revenue in relation to GTV. Total GTV and Service GTV by geographical regions, as well as GTV by sector, are presented below for the comparative reporting period.
GTV by Geography
| | | | | | | | | | | | | | | | | |
| | Three months ended June 30, | | | | Six months ended June 30, | | ||||||||||
| | | | | | | % Change | | | | | | | | | % Change | |
(in U.S. $000's, except percentages) |
| 2022 | |
| 2021 | | 2022 over 2021 | | | | 2022 |
| | 2021 | | 2022 over 2021 | |
Total GTV by Geography | | | | | | | | | | | | | | | | | |
United States | $ | 803,604 | | $ | 740,826 | | 8 | % | | $ | 1,723,456 |
| $ | 1,622,479 | | 6 | % |
Canada | | 626,389 | | | 551,075 | | 14 | % | | | 936,157 |
| | 761,687 | | 23 | % |
International | | 254,283 | | | 235,741 | | 8 | % | | | 463,768 |
| | 418,016 | | 11 | % |
Total GTV | | 1,684,276 | | | 1,527,642 | | 10 | % | | | 3,123,381 |
| | 2,802,182 | | 11 | % |
| | | | | | | | | | |
|
| |
| |
| |
Service GTV by Geography | | | | | | | | | | | | | | | |
|
|
United States | | 736,268 | | | 686,973 | | 7 | % | | | 1,567,428 |
| | 1,502,289 | | 4 | % |
Canada | | 586,945 | | | 543,147 | | 8 | % | | | 887,648 |
| | 744,044 | | 19 | % |
International | | 163,019 | | | 153,909 | | 6 | % | | | 321,201 |
| | 286,711 | | 12 | % |
Total Service GTV1 | | 1,486,232 | | | 1,384,029 | | 7 | % | | | 2,776,277 | | | 2,533,044 | | 10 | % |
| |
Ritchie Bros. | 37 |
GTV by Geography
| | | | | | | | | | | | | | | | | | |
| | Three months ended June 30, | | | | Six months ended June 30, | | | ||||||||||
| | | | | | | % Change | | | | | | | | | % Change | | |
(in U.S. $000's) |
| 2021 | |
| 2020 | | 2021 over 2020 | | | | 2021 |
| | 2020 | | 2021 over 2020 | | |
Total GTV by Geography | | | | | | | | | | | | | | | | | | |
United States | $ | 740,826 | | $ | 792,450 | | (7) | % | | $ | 1,622,479 |
| $ | 1,654,891 | | (2) | % | |
Canada | | 551,075 | | | 529,432 | | 4 | % | | | 761,687 |
| | 678,743 | | 12 | % | |
International | | 235,741 | | | 172,100 | | 37 | % | | | 418,016 |
| | 307,372 | | 36 | % | |
Total GTV | | 1,527,642 | | | 1,493,982 | | 2 | % | | | 2,802,182 |
| | 2,641,006 | | 6 | % | |
| | | | | | | | | | |
|
| |
| |
| | |
Service GTV by Geography | | | | | | | | | | | | | | | |
|
|
|
United States | | 686,973 | | | 720,253 | | (5) | % | | | 1,502,289 |
| | 1,525,747 | | (2) | % | |
Canada | | 543,147 | | | 510,306 | | 6 | % | | | 744,044 |
| | 651,422 | | 14 | % | |
International | | 153,909 | | | 108,512 | | 42 | % | | | 286,711 |
| | 218,794 | | 31 | % | |
Total Service GTV1 | | 1,384,029 | | | 1,339,071 | | 3 | % | | | 2,533,044 | | | 2,395,963 | | 6 | % | |
| | | | | | | | | | | | | | | | | | |
1 Service GTV is calculated as total GTV less inventory sales revenue | | | | | | | | | | | | | | | | | | |
GTV by Sector
The following pie charts illustrate the breakdown of total GTV by sector for Q2 2021the second quarter of 2022 compared to Q2 2020.the second quarter of 2021.
The construction sector includes heavy equipment such as trucks, excavators, cranes and dozers. TransportationThe transportation sector includes vehicles, buses, trailers and trucks that are used for transport. The other sector primarily includes equipment sold in the agricultural, forestry and energy industries.
In Q2the second quarter of 2022, total GTV mix compared to the second quarter of 2021 total GTVincreased by 6 percentage points in the transportation sector decreaseddriven by 3% compared to Q2 2020 and remained flat withinlarge inventory contracts in Canada, primarily offset by a 5 percentage points decrease in the construction sector.
Total auction metricsAuction Metrics
We review a number of metrics including the following key metrics, to evaluate our business, measure our performance and identify trends affecting our business, formulate business plans and make strategic decisions.business.
Number of auction sales days. We define auction sales days as the number of auction days per auction event. Each day an auction is held is an auction sales day. An auction can have multiple auction sales days.
|
|
|
|
Bids per lot sold. Each bid is completed electronically through our real-time online bidding system. A lot is defined as a single asset to be sold, or a group of assets bundled for sale as one unit. This metric calculates the total number of bids received for a lot divided by the total number of lots sold.
Total lots sold. We define a lot as a single asset to be sold, or a group of assets bundled for sale as one unit. Low value assets are sometimes bundled into a single lot, collectively referred to as “small value lots”.
| | | | | | | | | | | | | | | | | | | | | | | | | | | | |
| | Three months ended June 30, | | | Six months ended June 30, | | | Three months ended June 30, | | | Six months ended June 30, | | ||||||||||||||||
| | | | | | % Change | | | | | | | % Change | | | | | | | % Change | | | | | | | % Change | |
|
| 2021 |
| 2020 |
| 2021 over 2020 |
|
| 2021 |
| 2020 |
| 2021 over 2020 |
|
| 2022 |
| 2021 |
| 2022 over 2021 |
|
| 2022 |
| 2021 |
| 2022 over 2021 |
|
Number of auction sales days |
| 240 | | 226 | | 6 | % | | 333 |
| 313 | | 6 | % | ||||||||||||||
Bids per lot sold * |
| 27 |
| 25 | | 9 | % | | 28 |
| 23 | | 19 | % |
| 28 |
| 27 | | 4 | % | | 28 |
| 28 | | — | % |
Total lots sold * |
| 148,206 |
| 148,957 | | (1) | % | | 263,035 |
| 249,754 | | 5 | % |
| 144,167 |
| 148,206 | | (3) | % | | 249,934 |
| 263,035 | | (5) | % |
* Management reviews industrial equipment auction metrics excluding GovPlanet; as a result, GovPlanet business metrics are excluded from these metrics
The number of auction sales days increased 6% to 240 in Q2 2021. Auction sales days increased at a higher rate than total GTV increase of 2% due to less average GTV sold per sale day. For the first half of 2021, the number of auction sales days increased 6% to 333 in line with a 6% increase in total GTV.
The total number of bids per lot sold increased 9%4% to 2728 in Q2the second quarter of 2022 compared to the second quarter of 2021 and increased 19% to 28remained flat for the first halfsix months of 2021 driven by higher2022, reflecting continued strong demand for used equipment from buyers partly due to our increased marketing efforts.in a tight supply market.
The total lots sold decreased slightly3% to 144,167 in the second quarter of 2022 primarily impacted by 1%the tight supply market, the shift to 148,206a lower proportion of small value lots sold across all regions, as well as reduction in Q2 2021, in line with the decrease in total GTV of 3% when excluding the impact of foreign exchange,lot counts, partially offset by higher pricing.average selling prices. For the first halfsix months of 2021,2022, the total lots sold increaseddecreased 5% to 263,035249,934, primarily relatedfor the same reasons as discussed above.
| |
Ritchie Bros. | 38 |
A&M revenue
Total A&M revenue increased 22% to $433.0 million in the second quarter of 2022.
A&M revenue by geographical region are presented below:
| | | | | | | | | | | | | | | | |
| | Three months ended June 30, | | | | Six months ended June 30, | ||||||||||
| | | | | | % Change | | | | | | | | | % Change | |
(in U.S. $000's, except percentages) |
| 2022 |
| 2021 | | 2022 over 2021 | | | | 2022 |
| | 2021 | | 2022 over 2021 | |
A&M Revenue by Geography | | | | | | | | | | | | | | | | |
United States | | |
|
| | | | | | |
| |
| | | |
Service revenue | $ | 127,318 | $ | 112,183 | | 13 | % | | $ | 266,188 |
| $ | 236,388 | | 13 | % |
Inventory sales revenue |
| 67,337 |
| 53,853 | | 25 | % | | | 156,028 |
| | 120,190 | | 30 | % |
A&M revenue - United States |
| 194,655 |
| 166,036 | | 17 | % | | | 422,216 |
| | 356,578 | | 18 | % |
Canada |
|
|
|
| |
| | | |
|
| |
| |
| |
Service revenue |
| 80,702 |
| 76,021 | | 6 | % | | | 119,517 |
| | 104,080 | | 15 | % |
Inventory sales revenue |
| 39,444 |
| 7,928 | | 398 | % | | | 48,509 |
| | 17,643 | | 175 | % |
A&M revenue - Canada |
| 120,146 |
| 83,949 | | 43 | % | | | 168,026 |
| | 121,723 | | 38 | % |
International |
|
|
|
| |
| | | |
|
| |
| |
| |
Service revenue |
| 26,971 |
| 24,464 | | 10 | % | | | 50,290 |
| | 44,271 | | 14 | % |
Inventory sales revenue |
| 91,263 |
| 81,832 | | 12 | % | | | 142,567 |
| | 131,305 | | 9 | % |
A&M revenue - International |
| 118,234 |
| 106,296 | | 11 | % | | | 192,857 |
| | 175,576 | | 10 | % |
Total |
|
|
|
| |
| | | |
|
| |
| |
| |
Service revenue |
| 234,991 |
| 212,668 | | 10 | % | | | 435,995 |
| | 384,739 | | 13 | % |
Inventory sales revenue |
| 198,044 |
| 143,613 | | 38 | % | | | 347,104 |
| | 269,138 | | 29 | % |
Total A&M revenue |
| 433,035 |
| 356,281 | | 22 | % | | | 783,099 |
| | 653,877 | | 20 | % |
United States
In the second quarter of 2022, service revenue increased 13% partially due to the 7% increase in totalservice GTV. The remaining increase was primarily due to higher buyer fee rates implemented in early 2022. In addition, we saw positive rate performances in our straight commission contracts from a lower proportion of GTV sourced from strategic accounts. These increases were partially offset by lower buyer fees on a lower proportion of 6%small value lots.
For the first six months of 2022, service revenue increased 13% while Service GTV increased 4% primarily for the same reasons as discussed above. In addition, we saw lower fees associated with online inspections driven by lower online lot counts.
In the second quarter of 2022, inventory sales revenue increased 25% primarily due to higher volume of inventory contracts, including higher volumes sold through our GovPlanet business as a result of the new non-rolling and rolling stock contracts effective June 1, 2021. For the first six months of 2022, inventory sales revenue increased 30% primarily due to a large dispersal of construction equipment in our Phoenix, Arizona auction, as well as for the same reasons as discussed earlier. These increases were partially offset by a lower volume of inventory contracts in Orlando, Florida and Atlanta, Georgia auctions.
Canada
In the second quarter of 2022, service revenue increased 6%, slightly less than the 8% increase in Service GTV primarily driven by the non-repeat of several high performing guarantee contracts in the prior year, as well as lower commissions from a higher proportion of high value lots mainlyGTV contributed by RBFS. These were partially offset by an increase in fees from the US.higher buyer fee rates implemented in early 2022.
Online biddingFor the first six months of 2022, service revenue increased 15% while Service GTV increased 19%. Service revenue growth was lower than the increase in Service GTV primarily for the same reasons as discussed above.
Across all channels, 100%In the second quarter of total GTV was purchased2022, inventory sales revenue increased 398% primarily driven by online buyers in Q2 2021 and Q2 2020 which is a direct impact of the COVID-19 pandemic as we pivoted to 100% online bidding at our traditional live on site auctions where on site attendance was not permitted. As COVID 19-pandemic restrictions ease we will be considering a transition back to some measure of in-person attendance at our on site auction events in certain regions and plan to reintroduce in-person bidding for selecttwo large events, primarilyinventory contracts in the United States.transportation sector.
Productivity
The majorityFor the first six months of our business continues to be generated by our A&M segment operations. Sales Force Productivity within this segment is an operational statistic that we believe provides a gauge of the effectiveness of our Revenue Producers in increasing GTV. Revenue Producers is a term used to describe our revenue-producing2022, inventory sales personnel. This definition is comprised of Regional Sales Managers and Territory Managers.
Our Sales Force Productivityrevenue increased 175% primarily for the trailing 12-month period ended June 30, 2021 was $13.9 million per Revenue Producer compared to $12.2 million per Revenue Producer for the trailing 12-month period ended June 30, 2020.same reason.
| |
Ritchie Bros. | 39 |
International
A&M revenue
Total A&M revenue remained flat at $355.1 million in Q2 2021.
A&M revenue by geographical region are presented below:
| | | | | | | | | | | | | | | | |
| | Three months ended June 30, | | | Six months ended June 30, | |||||||||||
| | | | | | % Change | | | | | | | | % Change | ||
(in U.S. $000's, except percentages) | �� | 2021 |
| 2020 | | 2021 over 2020 | | | 2021 |
| | 2020 | | 2021 over 2020 | ||
A&M Revenue by Geography | | | | | | | | | | | | | | | | |
United States | | |
|
| | | | | | |
| |
| | | |
Service revenue |
| 111,047 |
| 115,796 | | (4) | % | | $ | 233,958 |
| $ | 236,134 | | (1) | % |
Inventory sales revenue |
| 53,853 |
| 72,196 | | (25) | % | | | 120,190 |
| | 129,144 | | (7) | % |
A&M revenue- United States |
| 164,900 |
| 187,992 | | (12) | % | | | 354,148 |
| | 365,278 | | (3) | % |
Canada |
|
|
|
| |
| | | |
|
| |
| |
| |
Service revenue |
| 75,964 |
| 67,357 | | 13 | % | | | 104,001 |
| | 85,917 | | 21 | % |
Inventory sales revenue |
| 7,928 |
| 19,126 | | (59) | % | | | 17,643 |
| | 27,321 | | (35) | % |
A&M revenue- Canada |
| 83,892 |
| 86,483 | | (3) | % | | | 121,644 |
| | 113,238 | | 7 | % |
International |
|
|
|
| |
| | | |
|
| |
| |
| |
Service revenue |
| 24,464 |
| 16,496 | | 48 | % | | | 44,271 |
| | 32,340 | | 37 | % |
Inventory sales revenue |
| 81,832 |
| 63,588 | | 29 | % | | | 131,305 |
| | 88,578 | | 48 | % |
A&M revenue- International |
| 106,296 |
| 80,084 | | 33 | % | | | 175,576 |
| | 120,918 | | 45 | % |
Total |
|
|
|
| |
| | | |
|
| |
| |
| |
Service revenue |
| 211,475 |
| 199,648 | | 6 | % | | | 382,230 |
| | 354,391 | | 8 | % |
Inventory sales revenue |
| 143,613 |
| 154,911 | | (7) | % | | | 269,138 |
| | 245,043 | | 10 | % |
A&M total revenue |
| 355,088 |
| 354,559 | | 0 | % | | | 651,368 |
| | 599,434 | | 9 | % |
United States
In Q2 2021, service revenue decreased 4% primarily due to the 5% decrease in Service GTV. The decrease was also due to lower fees driven by a lower proportionsecond quarter of small value lots, lower document fees as a result of the decline in the total number of titled lots sold and lower online listing fees. These decreases were primarily offset by higher buyer fees driven by the new buyer fee structure as well as positive rate performance in our GovPlanet business.
For the first half of 2021, service revenue decreased 1% primarily due to the 2% decrease in Service GTV for the same reasons as discussed above, as well as lower fees earned from a non-repeating collector car event in Q1 2020.
In Q2 2021, inventory sales revenue decreased 25% primarily from lower volumes of inventory contracts sourced at our Fort Worth and Orlando auctions driven by lower mix of volumes of inventory contracts and an unfavourable supply environment, partially offset by higher pricing. These decreases in our US region based auctions were partially offset by increased volumes sold through our GovPlanet business as a result of the new non-rolling and rolling stock contracts effective June 1, 2021 and higher volumes due to the government shutdowns in prior year in response to COVID-19 pandemic.
For the first half of 2021, inventory sales revenue decreased 7% primarily due to lower volumes of inventory contracts at our Fort Worth and Orlando auctions, partially offset by positive performance at our Houston auction and higher activity with improved rates in our GovPlanet business.
Canada
In Q2 2021,2022, service revenue increased 13%10% partially due to the 6% increase in Service GTV. The remaining increase was due to improved commission rates on both guarantee and straight commission contracts. In addition, the re-instatement of fees waived at the Canadian on-the-farm auctions in Q2 2020 as part of our COVID-19 pandemic response, higher buyer fees in Australia arising from the implementationa favourable mix of the newcontracts resulting in net higher buyer fee structure and higher proportion of low value lots contributed to a positive performance.fees rate.
For the first halfsix months of 2021,2022, service revenue increased 21% partially14% primarily due to 14%the 12% increase in Service GTV for the same reason as discussed above.
In the second quarter of 2022, inventory sales revenue increased 12%, mainly in Australia driven by a higher number of inventory contracts sold at a large new national auction event, as well as from the overall improvement in market conditions and the lifting of border restrictions.
For the first six months of 2022, inventory sales revenue increased 9% primarily driven by growth in Australia as discussed above, combined with the addition of one new event and two agricultural events.
Costs of services
A&M costs of services increased 15% to $29.0 million in the second quarter of 2022 compared to the second quarter of 2021 in line with total GTV increase of 10%. In addition, we incurred additional fees paid to third parties in connection with profit sharing arrangements on inventory packages.
For the first six months of 2022, A&M costs of services increased 10% to $54.6 million, in line with total GTV increase of 11% and for the same reason as discussed above. We also incurred higher building, facilities and technology expenses to support our flagship Orlando event, which returned to live in-person onsite bidding.
Cost of inventory sold
A&M cost of inventory sold increased 34% to $176.2 million in the second quarter of 2022 compared to the second quarter of 2021 primarily in line with 38% increase in inventory sales revenue. Cost of inventory sold increased at a lower rate than the increase in inventory sales revenue, indicating an increase in the revenue rates, primarily in Canada.
For the first six months of 2022, A&M cost of inventory sold increased 27% to $307.8 million primarily in line with the 29% increase in inventory sales revenue.
Selling, general and administrative
A&M selling, general and administrative increased 27% to $125.5 million in the second quarter of 2022 compared to the second quarter of 2021. This increase was primarily due to higher short-term incentive expenses and higher share-based payments driven by strong performance. Share-based payments also increased as a result of a higher expense relating to share-based awards issued to senior executives, and higher expense from the premium-priced options and PSU’s with market conditions granted in late 2021. Building, facilities and technology costs also increased mainly due to the amortization of the right-of-use asset of the Bolton property from the sale and lease back arrangement completed in the first quarter of 2022, as well as higher costs as we shift to cloud-based solutions to improve customer experiences. In addition, we saw higher wages, salaries and benefits expenses, as well as higher headcount to accelerate our growth initiatives and our transformational journey to become a trusted global marketplace. We also saw higher travel, advertising and promotion costs from increased activity in global travel, and higher marketing expenses to promote new initiatives. Inflation has also driven higher personnel and travel costs. Professional fees also increased primarily driven by our investment in new modern architecture to support our future marketplace and services strategy. These increases were partially offset by a favourable impact of foreign exchange.
For the first six months of 2022, A&M selling, general and administrative increased 16% to $234.3 million primarily due to higher building, facilities and technology costs, higher share-based payments, higher professional fees, higher wages, salaries and benefits expenses and travel, advertising and promotion for the same reasons as discussed above.
In Q2 2021, inventory sales revenue decreased 59% primarily due to lower mix of inventory contracts and equipment supply constraints in the energy sector contributing to lower year-over-year performance in our Edmonton auction, lower rate performances and the non-repeat of several large energy inventory contracts.
| |
Ritchie Bros. | 40 |
For the first halfOther Services Segment
Results of 2021, inventory sales revenue decreased 35% primarilyOther Services segment operations are presented below for the same reasons as discussed above, offset by several large new deals in the construction sector with strong rate performances in our Montreal auction in Q1 2021.comparative reporting periods.
| | | | | | | | | | | | | | | | | | |
| | Three months ended June 30, | | | Six months ended June 30, | | ||||||||||||
| | | | | | | | % Change | | | | | | | | | % Change | |
(in U.S. $000's, except percentages) |
| 2022 |
| 2021 | | 2022 over 2021 |
| | 2022 |
| 2021 | | 2022 over 2021 |
| ||||
Service revenue | | $ | 51,511 | | $ | 40,080 | | 29 | % | | $ | 95,368 | | $ | 74,039 | | 29 | % |
Ancillary and logistical service expenses | |
| 13,446 | |
| 14,819 | | (9) | % | |
| 24,201 | |
| 27,088 | | (11) | % |
Other costs of services | |
| 2,608 | |
| 1,306 | | 100 | % | |
| 5,294 | |
| 2,599 | | 104 | % |
Selling, general and administrative | |
| 18,742 | |
| 10,345 | | 81 | % | |
| 36,537 | |
| 21,803 | | 68 | % |
Other services profit | | $ | 16,715 | | $ | 13,610 | | 23 | % | | $ | 29,336 | | $ | 22,549 | | 30 | % |
International
In Q2 2021, servicethe second quarter of 2022, Other Services revenue increased 48%29% to $51.5 million primarily due to higher RBFS revenues of $8.1 million, and $5.0 million of second full quarter revenue recognized since the 42% increase in Service GTV. The remaining increase was due to higher buyer fees from the implementationacquisition of the new buyer fees structure and a higher buyer fee structure in Australia.SmartEquip on November 2, 2021. These increases were partially offset by lower ratesancillary revenue of $1.4 million driven by lower fees earned on our straight commission contracts.redeployment of assets in the United States.
ForIn the first halfsix months of 2021, service revenue increased 37% primary due to the 31% increase in Service GTV primarily for the same reasons as discussed above.
In Q2 2021, Inventory sales2022, Other Services revenue increased 29% driven by improved economic conditions, lifting of border restrictions, and easing of quarantine and travel requirements in Australia, Middle East and across several countries in Europe. We also saw improved performances in our auctions and an increase in the number of large private treaty deals in Australia.
For the first half of 2021, inventory sales revenue increased 48% primarily driven by the increases in Australia as discussed above, strong performances at our auctions across various countries in Europe with the addition of several new auctions. Improved economic conditions from the recovery of COVID-19 pandemic also contributed to the higher inventory revenue volumes.
Costs of services
A&M costs of services decreased 1% to $22.0$95.4 million in Q2 2021 compared to Q2 2020. This decrease was primarily driven by lower activity in line with lower GTV in the US, partially offset by higher costs to support the increased activity in our GovPlanet business and incremental costs to introduce the new satellite yards in Europe.
For the first half of 2021, A&M costs of services decreased 8% to $43.6 million primarily driven by cost savings in travel, advertising and promotion expense as a result of lower activity at our on site auctions due to the transition to online bidding, utilizationhigher RBFS revenues of TAL solution$14.6 million and implementation$9.7 million of travel restrictions due to COVID-19 pandemic. The decrease was further driven by lower activity in the US and cost reductions in building, facilities and technology expenses due to the non-repeat of costs incurred to support our Q1 2020 collector car event. Offsetting these decreases were higher costs in our GovPlanet business and in International in line with increased activity.
Cost of inventory sold
A&M cost of inventory sold decreased 8% to $131.0 million in Q2 2021 compared to Q2 2020 primarily in line with the 7% decrease in inventory sales revenue. Cost of inventory sold decreased at a higher rate than the decrease in inventory sales revenue indicating a slight increase in the revenue rates, primarily in our GovPlanet business.
For the first half of 2021, A&M cost of inventory sold increased 8% to $241.8 million primarily in line with the 10% increase in inventory sales revenue. Cost of inventory sold increased at a lower rate than the increase in inventory sales revenue, indicating an increase in the revenue rates, primarily in our GovPlanet business and the US region, partially offset by the International region.
SG&A expenses
A&M SG&A expenses increased 7% to $101.4 million in Q2 2021 compared to Q2 2020. The increase was primarily due to an unfavourable impact of foreign exchange fluctuation, higher wages, salaries and benefit expenses driven by higher headcount to support our growth initiatives. We also incurred higher advertising and promotion expenses to promote our global digital marketing efforts, and higher travel and entertainment costs as a result of increased travel as border and quarantine restrictions have started to ease.from SmartEquip. These increases were partially offset by lower short-termancillary revenue of $2.2 million.
Ancillary and long-term incentivelogistical service expenses decreased 9% to $13.4 million in the second quarter of 2022 and decreased 11% to $24.2 million in the first six months of 2022, in line with lower ancillary revenue. Other costs includingof services increased 100% to $2.6 million in the non-repeatsecond quarter of 2022 and increased 104% to $5.3 million in the first six months of 2022 mainly due to the inclusion of SmartEquip since its acquisition on November 2, 2021. Selling, general and administrative increased 81% to $18.7 million in the second quarter of 2022 and increased 68% to $36.5 million in the first six months of 2022, primarily in wages, salaries and benefits expenses due to the growth in our RBFS business, the inclusion of SmartEquip and higher headcount in Rouse to support our growth initiatives.
RBFS revenue increased 69% in the second quarter of 2022 and increased 70% in the first six months of 2022, driven by higher funded volumes and improved rate on fees earned from facilitating financing arrangements. In the second quarter of 2022, our funded volume, which represents the amount of lending brokered by RBFS, increased 51% to $298.0 million, and increased 57% when excluding the impact of foreign exchange. In the first six months of 2022, our funded volume increased 55% to $531.6 million, and increased 58% when excluding the impact of foreign exchange.
In the second quarter of 2022, Other Services profit increased 23% to $16.7 million mainly driven by RBFS. In the first six months of 2022, Other Services profit increased 30% to $29.3 million also driven by RBFS.
Additionally, in the first quarter of 2021, we launched a prior year one-time incentive accrualbusiness version of our IMS, which offers our customers end-to-end asset management and disposition services, data analytics, dashboards, branded e-commerce sites and multiple external sales channels to employees duringhelp our customers achieve optimal returns. We continue to grow the COVID-19 pandemic.number of organizations activated on IMS. During the second quarter of 2022, the number of organizations activated on our IMS increased by 50% compared to the first quarter of 2022.
As we evolve to a marketplace, we also facilitate retail and peer-to-peer auction events and equipment sale transactions via our online technology in exchange for hosting fees. During the second quarter of 2022, customers that used this service disposed of $31.9 million of assets, which is a decrease of 12% from the second quarter of 2021 primarily driven by an unfavourable supply environment. For the first halfsix months of 2021, A&M segment SG&A expenses increased 11%2022, this service facilitated transactions of $68.3 million, a 14% decrease as compared to $205.8 million primarily due to an unfavourable impact of foreign exchange, higher wages, salaries and benefit expenses, and an increase in short-term and long-term incentive costs due to strong performance. We also saw increases in share based payments and severance costs. These increases were partially offset by lower travel, advertising and entertainment expenses as travel restrictionsthe prior year for the most part continued to be implemented since the beginning of Q2 2020.
same reason mentioned above.
| |
Ritchie Bros. | 41 |
Other Services Segment
Results of Other Services segment operations are presented below for the comparative reporting periods.
| | | | | | | | | | | | | | | | | | | |
| | Three months ended June 30, | | | Six months ended June 30, | | | ||||||||||||
| | | | | | | | % Change | | | | | | | | | % Change | | |
(in U.S. $000's, except percentages) |
| 2021 |
| 2020 | | 2021 over 2020 |
| | 2021 |
| 2020 | | 2021 over 2020 |
| | ||||
Service revenue | | $ | 41,273 | | $ | 34,491 | | 20 | % | | $ | 76,548 | | $ | 62,871 | | 22 | % | |
Ancillary and logistical service expenses | |
| 14,819 | |
| 16,060 | | (8) | % | |
| 27,088 | |
| 28,818 | | (6) | % | |
Other costs of services | |
| 2,238 | |
| 1,198 | | 87 | % | |
| 4,406 | |
| 2,700 | | 63 | % | |
SG&A expenses | |
| 10,402 | |
| 6,073 | | 71 | % | |
| 22,135 | |
| 12,873 | | 72 | % | |
Other services profit | | $ | 13,814 | | $ | 11,160 | | 24 | % | | $ | 22,919 | | $ | 18,480 | | 24 | % | |
In Q2 2021, Other Services revenue increased 20% to $41.3 million primarily due to the increase in revenue from Rouse of $6.2 million, and higher RBFS revenues of $3.3 million, offset by lower ancillary revenue of $3.3 million mainly due to lower fees earned on refurbishment, transportation and redeployment of assets in the US.
In the first half of 2021, Other Services revenue increased 22% to $76.5 million due to the increase in revenue from Rouse of $11.8 million, higher RBFS revenues of $5.2 million, and RB Logistics revenues of $1.3 million driven by higher inventory sales in Europe requiring logistics as border restrictions have slowly been lifted. This increase was partially offset by lower ancillary revenue of $4.9 million and lower asset appraisal services revenue of $1.2 million.
Rouse was acquired on December 8, 2020 and this is the second full quarter of revenue recognized since acquisition. As a result, our costs of services and SG&A expenses have also increased.
RBFS revenue increased 39% in Q2 2021, driven by higher funded volume and improved rate on fees earned from facilitating financing arrangements as well as the growth in our PurchaseSafe service to provide escrow services to private brokered transactions. Some of the positive performance in RBFS also benefited from the favourable impact of foreign exchange fluctuation, as well as from a larger dedicated sales team driving increase volumes compared to the first half of 2020. In Q2 2021, our funded volume, which represents the amount of lending brokered by RBFS, increased 41% to $197.4 million, and increased 25% when excluding the impact of foreign exchange. In the first half of 2021, our funded volume increased 34% to $344.0 million, and increased 22% when excluding the impact of foreign exchange.
In Q2 2021, Other Services profit increased 24% to $13.8 million driven by our Rouse, RBFS, and Mascus operations. In the first half of 2021, Other Services profit increased 24% to $22.9 million primarily due to the same reasons.
Additionally, in the first quarter of 2021 we launched a business version of our inventory management system (“ IMS”) which offers our customers an end-to-end asset management and disposition services, data analytics, dashboards, branded e-commerce sites and multiple external sales channels to help our customers achieve the best possible returns. We continue to grow the number of organizations activated on IMS. During the second quarter of 2021, the number of organizations activated on our IMS increased by 34% compared to the first quarter of 2021.
As we evolve to a marketplace, we will also facilitate retail and peer-to-peer auction events and equipment sale transactions via our online technology in exchange for hosting fees. During the second quarter of 2021, customers that used this service disposed of $36.3 million of assets, which is an increase of 155% from Q2 2020. For the first half of 2021, this service facilitated transactions of $79.3 million, a 102% increase as compared to prior year.
|
|
|
|
Liquidity and Capital Resources
Our principal sources of liquidity are our cash provided by operating activities and borrowings from our revolving credit facilities, which we renewed on August 14, 2020.September 21, 2021.
In the first half of 2021, our operational liquidity was not materially impacted by the COVID-19 pandemic. Today weWe believe that our existing working capital and availability under our credit facilities are sufficient to satisfy our present operating requirements and contractual obligations. With future uncertainty due to COVID-19, we will continue to evaluateOur material short-term cash requirements include (i) inventory purchases, (ii) capital expenditures for intangible assets and property, plant and equipment (iii) payment of quarterly dividends on an as-declared basis, (iv) settlement of contracts with consignors and other suppliers, (v) personnel expenditures, with a majority of bonuses paid annually in the naturefirst quarter following each fiscal period, (vi) income tax payments, primarily paid in quarterly installments, (vii) lease payments, and extent(viii) principal payments on short-term and current portions of any impactslong-term debt, and (ix) interest payments related to our liquidity as events unfold. Our future growth strategies continuecurrent debt obligations. We also have inventory purchase commitments, related to include but are not limitedour GovPlanet business, which is described in Note 26 of our consolidated financial statements.
During the first quarter of 2022, we completed the sale and leaseback of the Bolton property for a total sale consideration and net proceeds of approximately $165.0 million. The proceeds from the sale were used to repay our revolving credit facilities. We have also leased back the Bolton property while we complete the acquisition and development of a replacement property and auction site located in Amaranth, Ontario over the next two to three years. We intend to fund the material cash requirement for the acquisition and development of the Amaranth property from cash flows from ongoing operations.
During the second quarter of 2022, as a result of the Company’s decision to discontinue the phase 2 review by the United Kingdom’s Competition and Markets Authority (“CMA”), the Company redeemed all of the 2021 Notes, which were held in escrow, at a redemption price equal to 100% of the original offering price of the notes, plus accrued and unpaid interest. As such, on May 4, 2022, the Company paid net proceeds of approximately $931 million to its bondholders.
Other long-term cash requirements include long-term debt principal repayments, which are disclosed according to maturity date in Note 21 in our A&M, RBFS, Rouse, and Mascus operating segments,Annual Report on Form 10-K for the year ended December 31, 2021, as well as otherinterest payments related to our non-current debt obligations. We are also committed under various letters of credit and provide certain guarantees in the normal course of business.
If we were to consider further acquisitions to deliver on our strategic growth opportunities including mergers and acquisitions.drivers, we may seek financing through equity markets or additional debt markets. The sale of equity securities may result in dilution to our shareholders. Issuance of preferred equity securities could provide for rights, preferences or privileges senior to those of our common stock. Further, this additional capital may not be available on reasonable terms, or at all.
We assess our liquidity based on our ability to generate cash and secure credit to fund operating, investing, and financing activities. Our liquidity is primarily affected by fluctuations in cash provided by operating activities, significant acquisitions of businesses, payment of dividends, share repurchases, our net capital spending1, and voluntary repayments of term debt. We believe our principal sources of liquidity, which include cash flow from operations, our current unused capacity under our revolving credit facilities of $683 million, is sufficient to fund our current operating activities and future growth strategies.
Cash provided by operating activities can fluctuate significantly from period to period due to factors such as differences in the timing, size and number of auctions during the period, the volume of our inventory contracts, the timing of the receipt of auction proceeds from buyers and of the payment of net amounts due to consignors, as well as the location of the auction with respect to restrictions on the use of cash generated therein.
Cash flows
| | | | | | | | | | |
| | Six months ended June 30, | | | ||||||
| | | | | | | | % Change | | |
(in U.S. $000's, except percentages) | | 2021 |
| 2020 | | 2021 over 2020 |
| | ||
Cash provided by (used in): |
| |
|
| |
| |
|
| |
Operating activities | | $ | 211,381 | | $ | 198,324 | | 7 | % | |
Investing activities | |
| (23,303) | |
| (148) | | 15,645 | % | |
Financing activities | |
| (50,861) | |
| (77,811) | | (35) | % | |
Effect of changes in foreign currency rates | |
| (1,389) | |
| (2,608) | | (47) | % | |
Net increase in cash, cash equivalents, and restricted cash | | $ | 135,828 | | $ | 117,757 | | 15 | % | |
Net cash provided by operating activities increased $13.1 million in the first half of 2021. This change was primarily due to increases in our net income and a net positive movement in our trade receivables related to the timing, size, and number of auctions over the comparative period. These increases were partially offset by negative cash flows driven by larger bonus payments, the timing of payments related to local payroll, consumption and income taxes, and an increase in inventory purchases related to our GovPlanet business over the comparative period.
Net cash used in investing activities increased $23.2 million in the first half of 2021. This change was due to lower cash proceeds from land sales and equity investments in the first half of 2021 compared to the first half of 2020. In the comparative period, we recognized net proceeds of $15.5 million on the sale of land in the United States, $4.2 million of proceeds on the distribution of equity investments, and $1.7 million of proceeds on contingent consideration from equity investments.
Net cash used in financing activities decreased $27.0 million in the first half of 2021. The primary driver of the change was that we did not do any share repurchases in the first half of 2021, whereas we spent $53.2 million in Q1 2020. Partially offsetting this change was a $9.0 million decrease in short-term debt draws, a $8.7 million decrease in cash generated from the issuance of share capital on exercise of stock options, and an increase of $5.8 million in withholding tax payments on the issuance of shares.
Dividend information
We declared a dividend of $0.22 per common share for each of the quarters ended June 30, 2020, September 30, 2020, December 31, 2020, and March 31, 2021. We have declared, but not yet paid, a dividend of $0.25 per common share for the quarter ended June 30, 2021. All dividends that we pay are “eligible dividends” for Canadian income tax purposes unless indicated otherwise.
1 | We calculate net capital spending as property, plant and equipment additions plus intangible asset additions less proceeds on disposition of property, plant and equipment. |
| |
Ritchie Bros. |
|
Cash flows
| | | | | | | | | |
| | Six months ended June 30, | | ||||||
| | | | | | | | % Change | |
| | | | | | | | | |
(in U.S. $000's, except percentages) | | 2022 |
| 2021 | | 2022 over 2021 |
| ||
Cash provided by (used in): |
| |
|
| |
| |
|
|
Operating activities | | $ | 198,026 | | $ | 211,381 | | (6) | % |
Investing activities | |
| 140,278 | |
| (23,303) | | (702) | % |
Financing activities | |
| (1,156,323) | |
| (50,861) | | 2,173 | % |
Effect of changes in foreign currency rates | |
| (12,773) | |
| (1,389) | | 820 | % |
Net (decrease) increase in cash, cash equivalents, and restricted cash | | $ | (830,792) | | $ | 135,828 | | (712) | % |
Net cash provided by operating activities decreased $13.4 million in the first six months of 2022, mainly due to lower cash inflows from the change in operating assets and liabilities. This change arose primarily due to the timing, size and number of auctions. We also saw a net higher outflow from inventory, with an increase in purchases in the United States partially offset by higher sales in International mainly in Australia, as well as an increase in advances paid against auction contracts for several consignment contracts in Europe, which are expected to be sold in the third quarter of 2022. These outflows were offset by cash inflows from income taxes for the accrual of the taxable gain portion on the sale of our Bolton property made in the first quarter of 2022, and lower-income tax payments as a result of timing of instalments. We also saw a positive net cash flow impact from prepaying in the fourth quarter of 2021 and the first quarter of 2022 interest on the 2021 Notes held in escrow and from lower bonus payments.
Net cash provided by investing activities increased $163.6 million in the first six months of 2022. This increase was primarily due to the sale of our Bolton property for total net cash proceeds of approximately $165.0 million.
Net cash used in financing activities increased $1.1 billion in the first six months of 2022, primarily due to the $931 million repayment of long-term debt as a result of the redemption of our 2021 Notes on May 4, 2022. We also made a $164.0 million repayment of debt on our long-term revolving credit facilities from the proceeds from the sale of the Bolton property in the first quarter of 2022. In addition, we also saw lower proceeds of $7.8 million from the exercise of stock options and higher dividends of $6.8 million paid to our shareholders compared to the comparative period in 2021. Partially offsetting these changes were a $15.4 million increase in draws on our short-term debt and a decrease of $5.4 million in withholding tax payments on the issuance of shares.
Dividend information
We declared a dividend of $0.25 per common share for each of the quarter ended June 30, 2021, September 30, 2021, December 31, 2021, and March 31, 2022. We have declared, but not yet paid, a dividend of $0.27 per common share for the quarter ended June 30, 2022. All dividends that we pay are “eligible dividends” for Canadian income tax purposes unless indicated otherwise.
Return on average invested capital
Our return on average invested capital is calculated as net income attributable to stockholders divided by our average invested capital. We calculate average invested capital over a trailing 12-month period by adding the average long-term debt over that period to the average stockholders’ equity over that period.
Return on average invested capital increased 140500 bps to 16.4% for the 12-month period ending June 30, 2022 from 11.4% for the 12-month period ending June 30, 2021 from 10.0% for the 12-month period ending June 30, 2020.2021. This increase is primarily due to an increase in net income attributable to stockholders over the comparative period.period, mainly driven by the gain from the sale of the Bolton property. This increase was offset by a higher average invested capital over the comparative period as a result of the senior notes issued into escrow on December 21, 2021. Return on invested capital (“ROIC”) excluding escrowed debt (non-GAAP measure) increased 180decreased 60 bps to 11.9%13.4% during the 12 months ended June 30, 20212022 compared to 10.1% for14.0% in 2021, primarily due to the 12 months period ending June 30, 2020.inclusion of the gain on the Bolton property in the non-GAAP adjusted average invested capital.
Credit facilities
On August 14, 2020, we entered intoWe have a credit agreement which is comprised of multicurrency revolving facilities (the “Revolving Facilities”) and a delayed-draw term loan facility (the “DDTL Facility”, together with the Revolving Facilities, the “Facilities”). The credit agreement was most recently amended andin September 2021, which, among other things (i) extended Credit Agreement. The Credit Agreement matures onthe maturity date of the Facilities from October 27, 2023 and provides credit facilities totaling US$630.0 million with a syndicateto September 21, 2026, (ii) increased the total size of lenders comprising:the Facilities provided under the Credit Agreement to up to $1.045 billion,
| |
Ritchie Bros. |
43 |
including $295.0 million of commitments under the DDTL Facility, (iii) reduced the applicable margin for base rate loans and LIBOR loans at each pricing tier level, (iv) reduced the applicable percentage per annum used to calculate the commitment fee in respect of the unused commitments under the Facilities at each pricing tier level, and (v) included customary provisions to provide for the eventual replacement of LIBOR as a benchmark interest rate.
Immediately prior to the amendment, the aggregate principal amount outstanding under the DDTL Facility was $90.0 million ($118.9 million CAD). In connection with the amendment, the Company refinanced that amount with the proceeds from a borrowing under the DDTL Facility. There are no mandatory principal repayments of borrowings under the DDTL Facility until the earlier of when the remaining $205.0 million is drawn or third quarter of 2022. The Company did not draw on the remaining $205,000,000 before it expired on June 28, 2022 and, therefore, mandatory principal repayments will begin in the third quarter of 2022. Once principal payments become mandatory, they are subject to an annual amortization rate of 5%, payable in quarterly installments, with the balance payable at maturity.
Credit facilities at June 30, 20212022 and December 31, 20202021 were as follows:
| | | | | | | | | | | | | | | | | | |
(in U.S. $000's, except percentages) |
| June 30, 2021 |
| December 31, 2020 |
| % Change |
|
| June 30, 2022 |
| December 31, 2021 |
| % Change |
| ||||
Committed |
| |
|
| |
|
|
| |
| |
|
| |
|
|
| |
Term loan facility | | $ | 95,910 | | $ | 98,420 |
| (3) | % | |||||||||
DDTL Facility | | $ | 92,349 | | $ | 298,284 |
| (69) | % | |||||||||
Revolving credit facilities | |
| 750,000 | |
| 750,000 |
| — | % | |||||||||
Uncommitted | | | | | | | | | | |||||||||
Revolving credit facilities | |
| 540,000 | |
| 540,000 |
| — | % | | | 10,000 | | | 10,000 | | — | % |
Total credit facilities | | $ | 635,910 | | $ | 638,420 |
| (0) | % | | $ | 852,349 | | $ | 1,058,284 |
| (19) | % |
Unused | |
|
| |
|
|
|
| | |
|
| |
|
|
|
| |
DDTL Facility | | $ | — | | $ | 205,000 |
| (100) | % | |||||||||
Revolving credit facilities | |
| 448,348 | |
| 455,124 |
| (1) | % | |
| 683,459 | |
| 525,581 |
| 30 | % |
Total credit facilities unused | | $ | 448,348 | | $ | 455,124 |
| (1) | % | | $ | 683,459 | | $ | 730,581 |
| (6) | % |
Debt covenants
We were in compliance with all financial and other covenants applicable to our credit facilities at June 30, 2021. Our debt covenants did not change as a result of amending our Credit Agreement.2022.
Our ability to borrow under our syndicated revolving credit facility is subject to compliance with financial covenants of a consolidated leverage ratio covenant and a consolidated interest coverage ratio covenant.ratio. In the event of sustained deterioration of global markets and economies, we expect the covenants pertaining to our leverage ratio would be the most restrictive to our ability to access funding under our credit agreement. We continue to assess the impact of the COVID-19 pandemic on our business and evaluate courses of action to maintain current levels of liquidity and compliance with our debt covenants.
|
|
|
|
|
Share repurchase program
On May 8, 2019, our Board of Directors authorized a share repurchase program for the repurchase of up to $100 million worth of our common shares, approved by the Toronto Stock Exchange, over a total period of 12 months. In Q1, 2020, we repurchased 1,525,312 common shares for $53,170,000 as part of this program until it ended on May 8, 2020.
On August 5, 2020, our Board of Directors authorized a share repurchase program for the repurchase of up to $100.0 million worth of our common shares, approved by the Toronto Stock Exchange, over a period of 12 months, ending August 23, 2021. No share repurchases were made during the six months ended June 30, 2021.
Off-Balance Sheet Arrangements
We have no off-balance sheet arrangements that have or are reasonably likely to have a current or future material effect on our financial condition, changes in financial condition, revenues or expenses, financial performance, liquidity, capital expenditures or capital resources.
|
|
|
|
Critical Accounting Policies, Judgments, Estimates and Assumptions
In preparing our consolidated financial statements in conformity with US GAAP, we must make decisions that impact the reported amounts and related disclosures. Such decisions include the selection of the appropriate accounting principles to be applied and the assumptions on which to base accounting estimates. In reaching such decisions, we apply judgments based on our understanding and analysis of the relevant circumstances and historical experience which takes into consideration the impact of COVID-19 pandemicand related circumstances. As ofat June 30, 2021,2022, other than the estimates in accounting for the sale and leaseback transaction related to the sale of our Bolton property in the first quarter of 2022, as described below, there were no material changes in our critical accounting policies, judgments, estimates and assumptions from those disclosed in our Annual Report on Form 10-K for the year ended December 31, 2020,2021, or in the notes to our consolidated financial statements included in “Part I, Item 1: Consolidated Financial Statements” in this Quarterly Report on Form 10-Q.
Effective JanuaryOctober 1, 2020,2021, we early adopted Topic 848, ASU 2021-08, Business Combinations (Topic 805): FacilitationAccounting for Contract Assets and Contract Liabilities from Contracts with Customers. The update primarily addresses the accounting for contract assets and contract liabilities from revenue contracts with customers acquired in a business combination. An entity that early adopts in an interim period should apply the amendments (i) retrospectively to all business combinations for which the acquisition date occurs on or after the beginning of the Effectsfiscal year that includes the interim period of Reference Rate Reformearly application and (ii) prospectively to all business combinations that occur on Financial Reporting, and in March 2020,or after the FASB issued an updatedate of initial application. We have applied the amendments to the standard. The standard provides relief for companies preparingSmartEquip acquisition, which was completed on November 2, 2021.
Significant items subject to estimates and judgements during the six month period ended June 30, 2022 were made in accounting for the discontinuationcompleted sale and leaseback transaction of reference rates such as LIBOR. This guidance is effective March 12, 2020 through to December 31, 2022. The adoptionour Bolton property. We determined the following estimates in calculating the gain on
| |
Ritchie Bros. | 44 |
sale: the present value of market rental payments of the ASUBolton property sold, the expected lease term in the leaseback arrangement and our incremental borrowing rate based on information available at the recent updates have not and are not expected to have a material impact on our consolidated financial statements.commencement date of the lease.
For a discussion of our new and amended accounting standards, refer to Note 22(b) of the financial statements, Summary of significant accounting policies.
Consolidated Financial Statements, Significant Accounting Policies.
Non-GAAP Measures
We reference various non-GAAP measures throughout this Quarterly Report on Form 10-Q. These measures do not have a standardized meaning and are, therefore, unlikely to be comparable to similar measures presented by other companies. The presentation of this financial information, which is not prepared under any comprehensive set of accounting rules or principles, is not intended to be considered in isolation of, or as a substitute for, the financial information prepared and presented in accordance with generally accepted accounting principles.US GAAP. Non-GAAP financial measures referred toincluded in this reportQuarterly Report on Form 10-Q are labeled as “non-GAAP measure” or designated as such with an asterisk (*).
Non-GAAP Adjusted Operating Income*Income Reconciliation
Adjusting
We believe that non-GAAP adjusted operating income*income provides useful information about the growth or decline of our operating income for the relevant financial period and eliminates the financial impact of adjusting items we do not consider to be part of our normal operating results.
Non-GAAP adjusted operating income eliminates the financial impact of adjusting items from operating income, which are significant recurring and non-recurring items that we do not consider to be part of our normal operating results, such as share-based payments expense, acquisition-related costs, amortization of acquired intangible assets, management reorganization costs, and certain other items, which we refer to as ‘adjusting items’“adjusting items”.
In 2021, we updated the calculation of non-GAAP adjusted operating income to add-back share-based payments expense, all acquisition-related costs (including any share based continuing employment costs recognized in acquisition-related costs), amortization of acquired intangible assets, and gain or loss on disposition of property, plant and equipment. We have also adjusted for certain non-recurring advisory, legal and restructuring costs. These adjustments have been applied retrospectively to all periods presented, as applicable.
The following table reconciles non-GAAP adjusted operating income*income to operating income, which is the most directly comparable GAAP measure in our consolidated incomefinancial statements.
| | | | | | | | | | | | | | | | | | | | | | | | | | | | | | | | | | | | | |
| | Three months ended June 30, | | | Six months ended June 30, | | | | Three months ended June 30, | | | Six months ended June 30, | | ||||||||||||||||||||||||
| | | | | | | | % Change | | | | | | | | | % Change | | | | | | | | | | % Change | | | | | | | | | % Change | |
(in U.S. $000's, except percentages) |
| 2021 | | 2020 | | 2021 over 2020 |
|
| 2021 | | 2020 | | 2021 over 2020 |
| |
| 2022 | | 2021 | | 2022 over 2021 |
|
| 2022 | | 2021 | | 2022 over 2021 |
| ||||||||
Operating income | | $ | 89,517 | | $ | 88,800 | | 1 | % | | $ | 134,019 | | $ | 122,882 | | 9 | % | | | $ | 91,867 | | $ | 89,517 | | 3 | % | | $ | 324,707 | | $ | 134,019 | | 142 | % |
Adjusted operating income* | | $ | 89,517 | | $ | 88,800 | | 1 | % | | $ | 134,019 | | $ | 122,882 | | 9 | % | | ||||||||||||||||||
Share-based payments expense | | | 13,640 | | | 7,540 | | 81 | % | | | 19,026 | | | 11,318 | | 68 | % | |||||||||||||||||||
Acquisition-related costs | | | 3,399 | | | 3,049 | | 11 | % | | | 13,036 | | | 5,971 | | 118 | % | |||||||||||||||||||
Amortization of acquired intangible assets | | | 8,426 | | | 6,802 | | 24 | % | | | 16,958 | | | 13,443 | | 26 | % | |||||||||||||||||||
Gain on disposition of property, plant and equipment and related costs | | | 1,153 | | | (175) | | (759) | % | | | (168,667) | | | (243) | | 69,310 | % | |||||||||||||||||||
Non-recurring advisory, legal and restructuring costs | | | 1,094 | | | 240 | | 356 | % | | | 3,379 | | | 240 | | 1,308 | % | |||||||||||||||||||
Non-GAAP adjusted operating income | | $ | 119,579 | | $ | 106,973 | | 12 | % | | $ | 208,439 | | $ | 164,748 | | 27 | % |
(1) | Please refer to |
(2) |
| |
Ritchie Bros. | 45 |
Non-GAAP Adjusted Net Income Attributable to Stockholders*Stockholders and Non-GAAP Diluted Adjusted EPS Attributable to Stockholders*Stockholders Reconciliation
We believe that non-GAAP adjusted net income attributable to stockholders*stockholders provides useful information about the growth or decline of our net income attributable to stockholders for the relevant financial period and eliminates the financial impact of adjusting items we do not consider to be part of our normal operating results. DilutedNon-GAAP diluted Adjusted EPS attributable to stockholders*stockholders eliminates the financial impact of adjusting items from net income attributable to stockholders which are after-tax effects of significant non-recurring or recurring items that we do not consider to be part of our normal operating results, such as share-based payments expense, acquisition-related costs, amortization of acquired intangible assets, management reorganization costs, and certain other items, which we refer to as ‘adjusting items’“adjusting items”.
In 2021, we updated the calculation of non-GAAP diluted adjusted EPS attributable to stockholders to add-back certain adjustments that have been applied retrospectively to all periods presented, as applicable (refer to non-GAAP adjusted operating income reconciliation above).
The following table reconciles non-GAAP adjusted net income attributable to stockholders*stockholders and non-GAAP diluted adjusted EPS attributable to stockholders*stockholders to net income attributable to stockholders and diluted EPS attributable to stockholders, which are the most directly comparable GAAP measures in our consolidated incomefinancial statements.
| | | | | | | | | | | | | | | | | | | |
| | Three months ended June 30, | | | Six months ended June 30, | | | ||||||||||||
| | | | |
| | | % Change | | | | | |
| | | % Change | | |
(in U.S. $000's, except share and |
| | |
| | | | | | | | | | | | |
| | |
per share data, and percentages) |
| 2021 |
| 2020 | | 2021 over 2020 | | | 2021 |
| 2020 | | 2021 over 2020 |
| | ||||
Net income attributable to stockholders | | $ | 60,749 | | $ | 53,043 | | 15 | % | | $ | 88,937 | | $ | 75,851 | | 17 | % | |
Current income tax adjusting item: | |
|
| |
|
| |
|
| |
|
| |
|
| |
|
| |
Change in uncertain tax provision | |
| — | |
| 766 | | (100) | % | |
| — | |
| 766 | | (100) | % | |
Deferred tax adjusting item: | |
|
| |
|
| |
|
| |
|
| |
|
| |
|
| |
Change in uncertain tax provision | |
| — | |
| 5,462 | | (100) | % | |
| — | |
| 5,462 | | (100) | % | |
Adjusted net income attributable to stockholders* | | $ | 60,749 | | $ | 59,271 | | 2 | % | | $ | 88,937 | | $ | 82,079 | | 8 | % | |
Weighted average number of dilutive shares outstanding | |
| 111,334,184 | |
| 109,323,343 |
| 2 | % | |
| 111,302,711 | |
| 109,903,808 |
| 1 | % | |
| | | | | | | | | | | | | | | | | | | |
Diluted earnings per share attributable to stockholders | | $ | 0.55 | | $ | 0.49 | | 12 | % | | $ | 0.80 | | $ | 0.69 | | 16 | % | |
Diluted adjusted EPS attributable to Stockholders* | | $ | 0.55 | | $ | 0.54 | | 2 | % | | $ | 0.80 | | $ | 0.75 | | 7 | % | |
| | | | | | | | | | | | | | | | | | |
(in U.S. $000's, except share and per share data, and percentages) | | Three months ended June 30, | | | Six months ended June 30, | | ||||||||||||
| | | | |
| | | % Change | | | | | |
| | | % Change | |
|
| 2022 |
| 2021 | | 2022 over 2021 | | | 2022 |
| 2021 | | 2022 over 2021 |
| ||||
Net income attributable to stockholders | | $ | 53,365 | | $ | 60,749 | | (12) | % | | $ | 231,459 | | $ | 88,937 | | 160 | % |
Share-based payments expense | | | 13,640 | | | 7,540 | | 81 | % | | | 19,026 | | | 11,318 | | 68 | % |
Acquisition-related costs | | | 3,399 | | | 3,049 | | 11 | % | | | 13,036 | | | 5,971 | | 118 | % |
Amortization of acquired intangible assets | | | 8,426 | | | 6,802 | | 24 | % | | | 16,958 | | | 13,443 | | 26 | % |
Gain on disposition of property, plant and equipment and related costs | | | 1,153 | | | (175) | | (759) | % | | | (168,667) | | | (243) | | 69,310 | % |
Loss on redemption of the 2021 Notes and certain related interest expense | | | 9,664 | | | — | | 100 | % | | | 9,664 | | | — | | 100 | % |
Change in fair value of derivatives | |
| — | |
| — | | — | % | |
| (1,263) | |
| — | | (100) | % |
Non-recurring advisory, legal and restructuring costs | |
| 1,094 | | | 240 | | 356 | % | | | 3,379 | | | 240 | | 1,308 | % |
Related tax effects of the above | | | (7,669) | | | (3,660) | | 110 | % | | | 10,443 | | | (9,126) | | (214) | % |
Non-GAAP adjusted net income attributable to stockholders | | $ | 83,072 | | $ | 74,545 | | 11 | % | | $ | 134,035 | | $ | 110,540 | | 21 | % |
Weighted average number of dilutive shares outstanding | |
| 111,705,102 | |
| 111,334,184 |
| 0 | % | |
| 111,681,644 | |
| 111,302,711 |
| 0 | % |
| | | | | | | | | | | | | | | | | | |
Diluted earnings per share attributable to stockholders | | $ | 0.48 | | $ | 0.55 | | (13) | % | | $ | 2.07 | | $ | 0.80 | | 159 | % |
Non-GAAP diluted adjusted EPS attributable to stockholders | | $ | 0.74 | | $ | 0.67 | | 10 | % | | $ | 1.20 | | $ | 0.99 | | 21 | % |
(1) | Please refer to |
(2) |
(3) |
Adjusted EBITDA*
We believe adjusted EBITDA* provides useful information about the growth or decline of our net income when compared between different financial periods.
The following table reconciles adjusted EBITDA* to net income, which is the most directly comparable GAAP measures in, or calculated from, our consolidated income statements:
| | | | | | | | | | | | | | | | | | | |
| | Three months ended June 30, | | | Six months ended June 30, | | | ||||||||||||
| | | | |
| | | % Change | | | | | |
| | | % Change | | |
|
| | |
| | | | 2021 over |
| | | |
| | | | 2021 over |
| |
(in U.S. $000's, except percentages) |
| 2021 |
| 2020 | | 2020 |
| | 2021 |
| 2020 | | 2020 |
| | ||||
Net income | | $ | 60,781 | | $ | 53,119 | | 14 | % | | $ | 88,920 | | $ | 75,948 | | 17 | % | |
Add: depreciation and amortization expenses | |
| 21,935 | |
| 17,857 |
| 23 | % | |
| 43,005 | |
| 37,150 |
| 16 | % | |
Add: interest expense | |
| 8,867 | |
| 8,882 |
| (0) | % | |
| 17,813 | |
| 18,064 |
| (1) | % | |
Less: interest income | |
| (332) | |
| (393) |
| (16) | % | |
| (634) | |
| (1,063) |
| (40) | % | |
Add: income tax expense | |
| 21,065 | |
| 27,656 |
| (24) | % | |
| 29,484 | |
| 33,304 |
| (11) | % | |
Adjusted EBITDA* | | $ | 112,316 | | $ | 107,121 | | 5 | % | | $ | 178,588 | | $ | 163,403 | | 9 | % | |
| |
Ritchie Bros. | 46 |
Non-GAAP Adjusted EBITDA
We believe non-GAAP adjusted EBITDA provides useful information about the growth or decline of our net income when compared between different financial periods. We use non-GAAP adjusted EBITDA as a key performance measure because we believe it facilitates operating performance comparisons from period to period.
In 2021, we updated the calculation of non-GAAP adjusted EBITDA to add-back certain adjustments which have been applied retrospectively to all periods presented, as applicable (refer to non-GAAP adjusted operating income reconciliation above).
The following table reconciles non-GAAP adjusted EBITDA to net income, which is the most directly comparable GAAP measure in, or calculated from, our consolidated financial statements:
| | | | | | | | | | | | | | | | | | |
| | Three months ended June 30, | | | Six months ended June 30, | | ||||||||||||
| | | | |
| | | % Change | | | | | |
| | | % Change | |
|
| | |
| | | | 2022 over |
| | | |
| | | | 2022 over |
|
(in U.S. $000's, except percentages) |
| 2022 |
| 2021 | | 2021 |
| | 2022 |
| 2021 | | 2021 |
| ||||
Net income | | $ | 53,411 | | $ | 60,781 | | (12) | % | | $ | 231,512 | | $ | 88,920 | | 160 | % |
Add: depreciation and amortization | |
| 24,298 | |
| 21,935 |
| 11 | % | |
| 48,523 | |
| 43,005 |
| 13 | % |
Add: interest expense | |
| 18,463 | |
| 8,867 |
| 108 | % | |
| 39,149 | |
| 17,813 |
| 120 | % |
Less: interest income | |
| (871) | |
| (332) |
| 162 | % | |
| (1,415) | |
| (634) |
| 123 | % |
Add: income tax expense | |
| 21,632 | |
| 21,065 |
| 3 | % | |
| 57,867 | |
| 29,484 |
| 96 | % |
EBITDA | |
| 116,933 | |
| 112,316 |
| 4 | % | |
| 375,636 | |
| 178,588 |
| 110 | % |
Share-based payments expense | | | 13,640 | | | 7,540 | | 81 | % | | | 19,026 | | | 11,318 | | 68 | % |
Acquisition-related costs | |
| 3,399 | |
| 3,049 |
| 11 | % | |
| 13,036 | |
| 5,971 |
| 118 | % |
Gain on disposition of property, plant and equipment and related costs | | | 1,153 | | | (175) | | (759) | % | | | (168,667) | | | (243) | | 69,310 | % |
Change in fair value of derivatives | |
| — | |
| — |
| — | % | |
| (1,263) | |
| — |
| (100) | % |
Non-recurring advisory, legal and restructuring costs | | | 1,094 | | | 240 | | 356 | % | | | 3,379 | | | 240 | | 1,308 | % |
Non-GAAP adjusted EBITDA | | $ | 136,219 | | $ | 122,970 | | 11 | % | | $ | 241,147 | | $ | 195,874 | | 23 | % |
(1) | Please refer to pages 51-53 for a summary of adjusting items during the three and six months ended June 30, 2022 and June 30, 2021. |
(2) | Non-GAAP adjusted EBITDA is calculated by adding back depreciation and amortization, interest expense, income tax expense, and subtracting interest income from net income, as well as adding back share-based payments expense, acquisition-related costs, and excluding the effects of any non-recurring or unusual adjusting items. |
| |
Ritchie Bros. | 47 |
Non-GAAP Adjusted Net Debt*Debt and Non-GAAP Adjusted Net Debt/Non-GAAP Adjusted EBITDA*EBITDA Reconciliation
We believe that comparing non-GAAP adjusted net debt/non-GAAP adjusted EBITDA*EBITDA on a trailing 12-month basis for different financial periods provides useful information about the performance of our operations as an indicator of the amount of time it would take us to settle both our short and long-term debt. We do not consider this to be a measure of our liquidity, which is our ability to settle only short-term obligations, but rather a measure of how well we fund liquidity. Measures of liquidity are noted under “Liquidity and Capital Resources”.
The following table reconciles non-GAAP adjusted net debt*debt to debt, non-GAAP adjusted EBITDA*EBITDA to net income, and non-GAAP adjusted net debt*/debt/ non-GAAP adjusted EBITDA*EBITDA to debt/ net income, respectively, which are the most directly comparable GAAP measures in, or calculated from, our consolidated financial statements.
| | | | | | | | | | | | | | | | | | | |
| | As at and for the 12 months ended June 30, | | | | As at and for the 12 months ended June 30, | | ||||||||||||
| | | | | | | | % Change | | | | | | | | | | % Change | |
(in U.S. $millions, except percentages) | | 2021 | | 2020 | | 2021 over 2020 | | | | 2022 | | 2021 | | 2022 over 2021 | | ||||
Short-term debt |
| $ | 35.2 |
| $ | 22.0 |
| 60 | % | |
| $ | 8.6 |
| $ | 35.2 |
| (76) | % |
Long-term debt | |
| 636.5 | |
| 632.0 | | 1 | % | | |
| 644.4 | |
| 636.5 | | 1 | % |
Debt | |
| 671.7 | |
| 654.0 | | 3 | % | | |
| 653.0 | |
| 671.7 | | (3) | % |
Less: Cash and cash equivalents | |
| (301.8) | |
| (389.7) | | (23) | % | | |||||||||
Adjusted net debt* | |
| 369.9 | |
| 264.3 | | 40 | % | | |||||||||
Less: cash and cash equivalents | |
| (367.3) | |
| (301.8) | | 22 | % | ||||||||||
Non-GAAP adjusted net debt | |
| 285.7 | |
| 369.9 | | (23) | % | ||||||||||
Net income | | $ | 183.3 | | $ | 152.7 | | 20 | % | | | $ | 294.4 | | $ | 183.3 | | 61 | % |
Add: depreciation and amortization expenses | |
| 80.8 | |
| 73.4 | | 10 | % | | |||||||||
Add: depreciation and amortization | |
| 93.4 | |
| 80.8 | | 16 | % | ||||||||||
Add: interest expense | |
| 35.3 | |
| 38.4 | | (8) | % | | |
| 58.3 | |
| 35.3 | | 65 | % |
Less: interest income | |
| (1.7) | |
| (3.1) | | (45) | % | | |
| (2.2) | |
| (1.7) | | 29 | % |
Add: income tax expense | |
| 61.7 | |
| 52.9 | | 17 | % | | |
| 81.8 | |
| 61.7 | | 33 | % |
Pre-tax adjusting items: | |
|
| |
|
| |
|
| | |||||||||
Share-based payment expense recovery | |
| — | |
| (4.1) | | (100) | % | | |||||||||
EBITDA | |
| 525.7 | |
| 359.4 | | 46 | % | ||||||||||
Share-based payments expense | |
| 30.8 | |
| 24.4 | | 26 | % | ||||||||||
Acquisition-related costs | |
| 5.2 | |
| — | | 100 | % | | |
| 37.3 | |
| 12.0 | | 211 | % |
Severance | |
| 4.3 | |
| — | | 100 | % | | |||||||||
Adjusted EBITDA* | | $ | 368.9 | | $ | 310.2 | | 19 | % | | |||||||||
Gain on disposition of property, plant and equipment and related costs | | | (169.9) | | | (0.5) | | 33,880 | % | ||||||||||
Change in fair value of derivatives | | | — | | | — | | — | % | ||||||||||
Non-recurring advisory, legal and restructuring costs | |
| 6.6 | |
| 4.2 | | 57 | % | ||||||||||
Non-GAAP adjusted EBITDA | | $ | 430.5 | | $ | 399.5 | | 8 | % | ||||||||||
Debt/net income | |
| 3.7 | x |
| 4.3 | x | (14) | % | | |
| 2.2 | x |
| 3.7 | x | (41) | % |
Adjusted net debt*/adjusted EBITDA* | |
| 1.0 | x |
| 0.9 | x | 11 | % | | |||||||||
Non-GAAP adjusted net debt/non-GAAP adjusted EBITDA | |
| 0.7 | x |
| 0.9 | x | (22) | % |
(1) | Please refer to |
(2) |
(3) |
(4) |
| |
Ritchie Bros. | 48 |
Operating Free Cash Flow*Flow (“OFCF”) Reconciliation
We believe OFCF*,OFCF, when compared on a trailing 12-month basis to different financial periods, provides an effective measure of the cash generated by our business and provides useful information regarding cash flows remaining for discretionary return to stockholders, mergers and acquisitions, or debt reduction. Our balance sheet scorecard includes OFCF*OFCF as a performance metric. OFCF*OFCF is also an element of the performance criteria for certain annual short-term and long-term incentive awards.
The following table reconciles OFCF*OFCF to cash provided by operating activities, which is the most directly comparable GAAP measure in, or calculated from, our consolidated statements of cash flows:
| | | | | | | | | | | |
| | 12 months ended June 30, | | | |||||||
| | | | | | | | % Change | | | |
(in U.S. $ millions, except percentages) |
| 2021 |
| 2020 | | 2021 over 2020 |
| | |||
Cash provided by operating activities | | $ | 270.9 | | $ | 370.8 | | | (27) | % | |
Property, plant and equipment additions | |
| 12.7 | |
| 15.1 | |
| (16) | % | |
Intangible asset additions | |
| 33.0 | |
| 28.5 | |
| 16 | % | |
Proceeds on disposition of property plant and equipment | |
| (0.6) | |
| (21.5) | |
| (97) | % | |
Net capital spending | | $ | 45.1 | | $ | 22.1 | | | 104 | % | |
OFCF* | | $ | 225.8 | | $ | 348.7 | | | (35) | % | |
| | | | | | | | | | |
| | 12 months ended June 30, | | |||||||
| | | | | | | | % Change | | |
(in U.S. $ millions, except percentages) |
| 2022 |
| 2021 | | 2022 over 2021 |
| |||
Cash provided by operating activities | | $ | 304.2 | | $ | 270.9 | | | 12 | % |
Property, plant and equipment additions | |
| 9.7 | |
| 12.7 | |
| (24) | % |
Intangible asset additions | |
| 32.0 | |
| 33.0 | |
| (3) | % |
Proceeds on disposition of property plant and equipment | |
| (166.7) | |
| (0.6) | |
| 27,683 | % |
Net capital spending | | $ | (125.0) | | $ | 45.1 | | | (377) | % |
OFCF | | $ | 429.2 | | $ | 225.8 | | | 90 | % |
(1) |
| |
Ritchie Bros. |
|
Non-GAAP Adjusted Net Income Attributable to Stockholders*Stockholders and ROIC*ROIC Reconciliation
We believe that comparing ROIC*ROIC on a trailing 12-month basis for different financial periods, provides useful information about the after-tax return generated by our investments.
The following table reconciles
In 2021, we updated the calculation of non-GAAP adjusted net income attributable to stockholders*stockholders to add-back certain adjustments that have been applied retrospectively to all periods presented, as applicable (refer to non-GAAP adjusted operating income reconciliation above).
The following table reconciles non-GAAP adjusted net income attributable to stockholders and ROIC*ROIC to net income attributable to stockholders and return on average invested capital which are the most directly comparable GAAP measures in, or calculated from, our consolidated financial statements:
| | | | | | | | | | | |
| | As at and for the 12 months ended June 30, | | | |||||||
| | | | |
| | | | | | |
|
| | |
| | |
| % Change |
| | |
(in U.S. $millions, except percentages) |
| 2021 |
| 2020 |
| 2021 over 2020 |
| | |||
Net income attributable to stockholders | | $ | 183.2 | | $ | 152.7 | | | 20 | % | |
Pre-tax adjusting items: | |
|
| |
|
| |
|
|
| |
Share-based payment expense recovery | | | — | | | (4.1) | | | (100) | % | |
Acquisition-related costs | |
| 5.2 | |
| — | |
| 100 | % | |
Severance | |
| 4.3 | |
| — | |
| 100 | % | |
Current income tax effect of adjusting items: | |
|
| |
|
| |
|
|
| |
Acquisition-related costs | | | (1.3) | | | — | | | (100) | % | |
Severance | |
| (1.1) | |
| — | |
| (100) | % | |
Current income tax adjusting item: | |
|
| |
|
| |
|
|
| |
Change in uncertain tax provision | |
| 1.5 | |
| 0.8 | |
| 88 | % | |
Deferred tax adjusting item: | |
|
| |
|
| |
|
|
| |
Change in uncertain tax provisions | |
| — | |
| 5.5 | |
| (100) | % | |
Adjusted net income attributable to stockholders* | | $ | 191.8 | | $ | 154.9 | | | 24 | % | |
Opening long-term debt | | $ | 632.0 | | $ | 704.9 | | | (10) | % | |
Ending long-term debt | |
| 636.5 | |
| 632.0 | | | 1 | % | |
Average long-term debt | | | 634.3 | | | 668.5 | | | (5) | % | |
Opening stockholders' equity | | $ | 899.1 | | $ | 830.7 | | | 8 | % | |
Ending stockholders' equity | |
| 1,056.3 | |
| 899.1 | | | 17 | % | |
Average stockholders' equity | |
| 977.7 | |
| 864.9 | | | 13 | % | |
Average invested capital | | $ | 1,612.0 | | $ | 1,533.4 | | | 5 | % | |
| | | | | | | | | | | |
Return on average invested capital | |
| 11.4 | % |
| 10.0 | % | | 140 | bps | |
ROIC* | |
| 11.9 | % |
| 10.1 | % | | 180 | bps | |
| | | | | | | | | | |
| | As at and for the 12 months ended June 30, | | |||||||
|
| | |
| | |
| % Change |
| |
(in U.S. $millions, except percentages) |
| 2022 |
| 2021 |
| 2022 over 2021 |
| |||
Net income attributable to stockholders | | $ | 294.4 | | $ | 183.2 | | | 61 | % |
Share-based payments expense | |
| 30.8 | |
| 24.4 | |
| 26 | % |
Acquisition-related costs | |
| 37.3 | |
| 12.0 | |
| 211 | % |
Amortization of acquired intangible assets | | | 31.5 | | | 24.1 | | | 31 | % |
Gain on disposition of property, plant and equipment and related costs | | | (169.9) | | | (0.5) | | | 33,880 | % |
Loss on redemption of the 2021 Notes and certain related interest expense | | | 9.7 | | | — | | | 100 | % |
Non-recurring advisory, legal and restructuring costs | |
| 6.6 | |
| 4.2 | |
| 57 | % |
Related tax effects of the above | |
| (0.8) | |
| (23.3) | |
| (97) | % |
Change in uncertain tax provision - tax effect | |
| — | |
| 1.5 | |
| (100) | % |
Non-GAAP adjusted net income attributable to stockholders | | $ | 239.6 | | $ | 225.6 | | | 6 | % |
Long-term debt - opening balance | | $ | 636.5 | | $ | 632.0 | | | 1 | % |
Long-term debt - ending balance | |
| 644.4 | |
| 636.5 | | | 1 | % |
Non-GAAP adjusted ending long-term debt | | | 644.4 | | | 636.5 | | | 1 | % |
Average long-term debt | | | 640.5 | | | 634.3 | | | 1 | % |
Non-GAAP adjusted average long-term debt | | | 640.5 | | | 634.3 | | | 1 | |
Stockholders' equity - opening balance | | $ | 1,056.3 | | $ | 899.1 | | | 17 | % |
Stockholders' equity - ending balance | |
| 1,244.1 | |
| 1,056.3 | | | 18 | % |
Average stockholders' equity | |
| 1,150.2 | |
| 977.7 | | | 18 | % |
Average invested capital | | $ | 1,790.8 | | $ | 1,612.0 | | | 11 | % |
| | | | | | | | | | |
Return on average invested capital | |
| 16.4 | % |
| 11.4 | % | | 500 | bps |
Non-GAAP ROIC | |
| 13.4 | % |
| 14.0 | % | | (60) | bps |
Non-GAAP ROIC excluding escrowed debt | | | 13.4 | % | | 14.0 | % | | (60) | bps |
(1) | Please refer to |
(2) | Return on average invested capital is calculated as net income attributable to stockholders divided by average invested capital. We calculate average invested capital as the average long-term debt and average stockholders’ equity over a trailing 12-month period. |
(3) |
(4) | Leases (Topic 842) requires lessees to recognize almost all leases, including operating leases, on the balance sheet through a right-of-use asset and a corresponding lease liability. The lease liability is not included in the calculation of debt. |
| |
Ritchie Bros. |
|
Adjusting Items Non-GAAP Measures
In 2021, we began adjusting for share-based payment expenses, amortization of acquired intangible assets and all gains or losses on disposition of property, plant and equipment, which we did not consider to be part of our normal operating results. These adjustments in 2021 have been applied retrospectively to all periods presented.
Adjusting items during the trailing 12-months ended June 30, 2022 were:
Recognized in the second quarter of 2022
● | $13.6 million share based payments expense. |
● | $3.4 million of acquisition-related costs related to the proposed acquisition of Euro Auctions and the completed acquisitions of SmartEquip and Rouse. |
● | $8.4 million amortization of acquired intangible assets primarily from the acquisitions of Iron Planet, SmartEquip, and Rouse. |
● | $1.2 million gain on disposition of property, plant and equipment and related costs includes a $1.3 million non-cash cost in the quarter relating to the adjustment made to recognize the Bolton property sale proceeds at fair value when calculating the $169.0 million gain on the Bolton property in the first quarter of 2022, and $0.1 million gain on disposition of property, plant and equipment in the quarter. |
● | $9.7 million loss on redemption of the 2021 Notes and certain related interest expense includes (a) $4.8 million of loss on redemption of the 2021 Notes due to a difference between the reacquisition price of the 2021 Notes and the net carrying amount of the extinguished debt (primarily the write off of the unamortized debt issuance costs), (b) $0.7 million of deferred debt issuance costs written off due to the expiry of the undrawn $205.0 million DDTL Facility in the quarter, and (c) non-recurring interest expense of $4.2 million incurred in the quarter relating to the 2021 Notes, which were redeemed as a result of the discontinued Euro Auctions acquisition in April 2022. |
● | $1.1 million of non-recurring advisory, legal and restructuring costs, which include $0.6 million of terminated and ongoing transaction and legal costs relating to mergers and acquisition activity, $0.3 million of severance and retention costs in connection with the restructuring of our information technology team driven by our strategy to build a new digital technology platform, and $0.2 million of advisory costs relating to a cybersecurity incident detected in the fourth quarter of 2021. |
Recognized in the first quarter of 2022
● | $5.4 million share based payments expense. |
● | $8.5 million amortization of acquired intangible assets primarily from the acquisitions of Iron Planet, SmartEquip, and Rouse. |
● | $169.8 million gain recognized on the disposition of property, plant and equipment of which $169.1 million related to the sale of a property located in Bolton, Ontario. |
● | $9.6 million of acquisition-related costs related to the proposed acquisition of Euro Auctions and the completed acquisitions of SmartEquip and Rouse. |
● | $1.3 million gain due to the change in fair value of derivatives to manage our exposure to foreign currency exchange rate fluctuations on the purchase consideration for the proposed acquisition of Euro Auctions. |
● | $2.3 million of non-recurring advisory, legal and restructuring costs, which include $0.9 million related to severance and retention costs in connection with the restructuring of our information technology team driven by our strategy to build a new digital technology platform, $0.5 million of terminated and ongoing transaction and legal costs relating to mergers and acquisition activity, $0.4 million of SOX remediation costs, and $0.6 million of advisory costs relating to a cybersecurity incident detected in the fourth quarter of 2021. |
| |
Ritchie Bros. | 51 |
Adjusting items duringRecognized in the trailing 12-months ended June 30,fourth quarter of 2021 were:
● | $6.2 million share based payments expense. |
● | $7.9 million amortization of acquired intangible assets primarily from the acquisitions of Iron Planet, SmartEquip, and Rouse. |
● | $14.0 million of acquisition-related costs related to the proposed acquisition of Euro Auctions and the completed acquisitions of SmartEquip and Rouse. |
● | $0.1 million gain recognized on the disposition of property, plant and equipment |
● | $1.3 million loss due to the change in fair value of derivatives to manage our exposure to foreign currency exchange rate fluctuations on the purchase consideration for the proposed acquisition of Euro Auctions. |
● | $2.6 million of non-recurring advisory, legal and restructuring costs, which include $1.4 million of terminated and ongoing transaction and legal costs relating to mergers and acquisition activity, $0.7 million of SOX remediation costs relating to our efforts to remediate the material weaknesses identified in 2020, and $0.5 million of advisory costs relating to a cybersecurity incident detected in the fourth quarter of 2021. |
Recognized in the third quarter of 2021
● | $5.6 million share based payments expense. |
● | $6.6 million amortization of acquired intangible assets primarily from the acquisitions of Iron Planet and Rouse. |
● | $10.3 million of acquisition-related costs related to the acquisitions of Rouse, and SmartEquip and proposed acquisition of Euro Auctions. |
● | $1.1 million gain recognized on the sale of a property in Denver, Colorado. |
● | $0.7 million of non-recurring advisory, legal and restructuring costs related to SOX remediation costs relating to our efforts to remediate the material weaknesses identified in 2020, which has been retrospectively applied to the third quarter of 2021. |
Recognized in the second quarter of 2021
● |
Recognized in the first quarter of 2021
Recognized in the fourth quarter of 2020
● | $ |
● | $3.0 million |
● | $ |
Recognized in the third quarter of 2020
● | $ |
Adjusting items during the trailing 12-months ended June 30, 2020 were:
Recognized in the second quarter of 2020
Recognized in the first quarter of 2020
Recognized in the fourth quarter of 2019
Recognized in the third quarter of 2019
| |
Ritchie Bros. |
|
Adjusting items during the trailing 12-months ended June 30, 2021 were:
Recognized in the first quarter of 2021
● | $3.8 million share based payments expense. |
● | $6.6 million amortization of acquired intangible assets primarily from the acquisitions of Iron Planet and Rouse. |
● | $2.9 million of acquisition-related costs related to the acquisition of Rouse. |
Recognized in the fourth quarter of 2020
● | $4.6 million share based payments expense. |
● | $5.6 million amortization of acquired intangible assets primarily from the acquisitions of Iron Planet and Rouse. |
● | $6.0 million of acquisition-related costs related to the acquisition of Rouse. |
● | $1.5 million of current income tax expense recognized related to an unfavourable adjustment to reflect final regulations published in the second quarter of 2020 regarding hybrid financing arrangements. |
Recognized in the third quarter of 2020
● | $8.6 million share based payments expense. |
● | $5.0 million amortization of acquired intangible assets primarily from the acquisitions of Iron Planet. |
● | $0.3 million gain recognized on the disposition of property, plant and equipment |
● | $3.9 million of severance costs, recognized in non-recurring advisory, legal and restructuring costs, related to the realignment of leadership to support the new global operations organization, in line with strategic growth priorities led by the new CEO. These severance costs were reclassified to non-recurring advisory, legal and restructuring costs in 2021. |
| |
Ritchie Bros. | 53 |
ITEM 3: QUANTITATIVE AND QUALITATIVE DISCLOSURES ABOUT MARKET RISK
There have been no material changes to our market risk during the six months ended June 30, 20212022 from those disclosed in Item 7A in our Annual Report on Form 10-K for the year ended December 31, 2020,2021, which is available on our website at www.rbauction.com, on EDGAR at www.sec.gov, or on SEDAR at www.sedar.com.
ITEM 4: CONTROLS AND PROCEDURES
Disclosure Controls and Procedures
Management of the Company, including the Chief Executive Officer (“CEO”) and Chief Financial Officer (“CFO”), have evaluated the effectiveness of the Company’s disclosure controls and procedures as at June 30, 2021.2022. The term “disclosure controls and procedures” means controls and other procedures established by the Company that are designed to ensure that information required to be disclosed by the Company in the reports that it files or submits under the Exchange Act is recorded, processed, summarized and reported within the time periods specified in the SEC’s rules and forms. Disclosure controls and procedures include, without limitation, controls and procedures designed to ensure that information required to be disclosed by the Company in the reports that it files or submits under the Exchange Act is accumulated and communicated to the Company’s management, including its CEO and CFO, as appropriate, to allow timely decisions regarding required disclosure.
Based upon their evaluation of the Company’s disclosure controls and procedures, the CEO and the CFO concluded that, as atof June 30, 2021, as a result of the material weaknesses described in Item 9A of the Form 10-K filed with the SEC on February 18, 2021 not having been remediated by the second quarter of 2021,2022, the disclosure controls are not effective to provide reasonable assurance that information required to be disclosed by the Company in the reports that it files or submits under the Exchange Act is accumulated and communicated to management, including the CEO and CFO, as appropriate, to allow timely decisions regarding required disclosure and are not effective to provide reasonable assurance that such information is recorded, processed, summarized and reported within the time periods specified by the SEC’s rules and forms.
TheOn November 2, 2021, the Company completed the acquisition of Rouse on December 8, 2020 and Rouse’sSmartEquip. SEC guidance permits management to exclude acquisitions from their assessment of internal control over financial reporting during the first year of an acquisition. The Company is in the process of incorporating SmartEquip into its system of internal control over financial reporting. SmartEquip’s total assets and revenues constituted 10.0%6.8% and 1.6%1.0%, respectively, of the Company’s total assets and revenues as shown in its consolidated financial statements as of and for the sixthree month period ended June 30, 2021. As the acquisition occurred in the fourth quarter of 2020, the Company excluded Rouse from the scope of its assessment over the effectiveness of its internal control over financial reporting. This exclusion is in accordance with the guidance issued by the Staff of the Securities and Exchange Commission that an assessment of a recently acquired business may be omitted from its scope in the year of acquisition, if specified conditions are satisfied.
Remediation Plan and Status of Material Weaknesses in Internal Control Over Financial Reporting
As previously disclosed in the Company’s Annual Report on Form 10-K filed with the SEC for the year ending December 31, 2020, the Company identified a material weakness over the review of the recording of manual journal entries in one of its geographies; specifically, controls were not operating effectively to ensure that journal entries were prepared with appropriate supporting documentation. Additionally, the Company identified a material weakness over the completeness and accuracy of key reports used in the performance of controls to address the occurrence and measurement of revenue.
A material weakness is a deficiency, or combination of deficiencies, in internal control over financial reporting, such that there is a reasonable possibility that a material misstatement of the Company’s annual or interim financial statements will not be prevented or detected on a timely basis.
The Company is committed to maintaining a strong internal control environment. In order to address the material weaknesses in internal control over financial reporting noted above, management with oversight and direction from the Audit Committee and the Board of Directors, began the implementation of remediation steps and initiatives in 2021 to remediate the material weaknesses. These efforts have included the following actions:
|
|
|
|
As we continue to develop and implement our remediation plan, additional remediation steps will be identified and adopted. We have also performed additional post-closing procedures and financial statement analysis whilst our disclosure controls and procedures are not effective.
We will consider the material weaknesses remediated after the applicable controls operate for a sufficient period of time, and management has concluded, through testing, that the controls are operating effectively.
As part of our continuous control improvement initiatives, and with the support of our advisors, we are also in the process of re-assessing and re-evaluating the design of our internal controls over financial reporting, which includes identifying ways in which we can automate some of our current manual processes.
The Company, including its CEO and CFO, does not expect that its internal controls and procedures will prevent or detect all error and all fraud. A control system, no matter how well conceived or operated, can provide only reasonable, not absolute, assurance that the objectives of the control system are met.2022.
Changes in Internal Control over Financial Reporting
Management, with the participation of the CEO and CFO, concluded that there were no changes in our internal control over financial reporting during the quarter ended June 30, 20212022 that have materially affected, or are reasonably likely to materially affect, the Company’s internal control over financial reporting.
We are continuing to take steps to remediate the material weaknesses in our internal control over financial reporting, as discussed above.
| |
Ritchie Bros. |
|
PART II – OTHER INFORMATION
ITEM 1: LEGAL PROCEEDINGS
We have no material legal proceedings pending, other than ordinary routine litigation incidental to the business, and we do not know of any material proceedings contemplated by governmental authorities.
ITEM 1A: RISK FACTORS
Our business is subject to a number of risks and uncertainties, and our past performance is no guarantee of our performance in future periods. In addition to the other information set forth in this Quarterly Report on Form 10-Q, you should carefully consider the risks and uncertainties discussed in “Part I, Item 1A: Risk Factors” of our Annual Report on Form 10-K for the year ended December 31, 2020,2021, which is available on our website at www.rbauction.com, on EDGAR at www.sec.gov, or on SEDAR at www.sedar.com, before purchasing our common shares. Our business could also be affected by additional risks not currently known to us or that we currently deem to be immaterial. If any of the risks actually occur, our business, financial condition and results of operations could materially suffer. As a result, the trading price of our common shares could decline, and you may lose all or part of your investment.
There were no material changes in risk factors during the three months or six months ended June 30, 2021.2022.
ITEM 2: UNREGISTERED SALES OF EQUITY SECURITIES AND USE OF PROCEEDS
On August 5, 2020, our Board of Directors authorized a share repurchase program for the repurchase of up to $100.0 million worth of our common shares, approved by the Toronto Stock Exchange, over a period of 12 months, ending August 23, 2021. No share repurchases were made during the six months ended June 30, 2021.None.
ITEM 3: DEFAULTS UPON SENIOR SECURITIES
None.
ITEM 4: MINE SAFETY DISCLOSURES
Not applicable.
ITEM 5: OTHER INFORMATION
None.
| |
Ritchie Bros. |
|
ITEM 6: EXHIBITS
Exhibits
The exhibits listed in below are filed as part of this Quarterly Report on Form 10-Q and incorporated herein by reference.
| | |
| | |
Exhibit | | |
Number |
| Document |
| | |
|
|
|
31.1 | | |
31.2 | | |
32.1 | | |
32.2 | | |
101 | | Interactive Data Files Pursuant to Rule 405 of Regulation S-T , for the Company’s Quarterly Report on Form 10-Q for the quarter ended June 30, |
104 | | Cover page from the Company’s Quarterly Report on Form 10-Q for the quarter ended June 30, |
| |
Ritchie Bros. |
|
SIGNATURES
Pursuant to the requirements of the Securities Exchange Act of 1934, the registrant has duly caused this report to be signed on its behalf by the undersigned, thereunto duly authorized.
RITCHIE BROS. AUCTIONEERS INCORPORATED | ||
| | |
| | |
Dated: August | By: | /s/ Ann Fandozzi |
| Ann Fandozzi | |
| Chief Executive Officer | |
| | |
Dated: August | By: | /s/ |
|
| |
| Chief Financial Officer |
| |
Ritchie Bros. |
|