Financial Data ( Gold Resource Corporation—Management’s Discussion and Analysis of Financial Condition and Results of Operations
39 Liquidity and Capital Resources
As of March 31, 2022, the2023, working capital of $32.4$24.1 million, consists of current assets of $60.7$40.7 million and current liabilities of $28.3$16.6 million. This represents a 10%13% or $3.0$2.7 million increase from the working capital balance of $29.3$21.4 million atas of December 31, 2021.2022. The primary factors influencing the increase in our working capital was a payment of the liability related to the mining royalty tax, as well as the cash provided by operating activities of $4.2$1.0 million, offset by $5.4$3.1 million of cash used in investing activities and liabilities related toas reported in the zinc zero cost collar.Condensed Consolidated Interim Statements of Cash Flows. Our working capital balance fluctuates as we use cash to fund our operations, financing and investing activities, including exploration, mine development, and income taxes, and shareholder dividends.taxes. We believe that as a result of our cash Gold Resource Corporation—Management’s Discussion and Analysis of Financial Condition and Results of Operations
30
balances, the performance of our current and expected operations, and the current metals prices, we will be able to meet our obligations and other potential cash requirements duringfor at least the next 12 months from the date of this report.
Long-term liabilities assumed with the Aquila acquisition, capital requirements to develop the Back Forty Project, and potential project financing may have an impact on liquidity in the long term. These long-term liabilities are contingent upon the approval of the Back Forty Project by the Company’s Board of Directors and securing project financing and achieving commercial production. We are currently preparing a feasibility study at our Back Fortyfinancing. Project with the goal of commencing commercial production in 2025. Depending on the capital requirements, project financing is currentlynot expected for 2023to be required any earlier than 2024 or 2024. 2025.
Cash and cash equivalents as of March 31, 20222023 decreased to $31.2$21.4 million from $33.7$23.7 million as of December 31, 2021,2022, a net decrease in cash of $2.5$2.3 million. The decrease is primarily due to cash from operations which was offset by cash spent on capital and exploration expenditures at DDGM and at the Back Forty Project. Project, and mining royalty tax payments for the 2022 tax years, offset by cash inflow from operations.
Of the $31.2$21.4 million cash balance as of March 31, 2022, $26.72023, $17.0 million was held in foreign subsidiaries, primarily held in U.S. dollar denominated accounts with the remainder in foreign currencies readily convertible to U.S. dollars. The Don David Gold Mine’s primary source of liquidity is the sale of doré and concentrates. The Don David Gold Mine has been self-sustaining since production commencement in 2010 and has provided excessbeen a source of cash for U.S. operations and projects.
Net cash provided by operating activities for the three months ended March 31, 20222023 was $4.2$1.0 million compared to $6.8$4.2 million for the same period in 2021. The decrease is primarily due2022. Investing activities are mainly attributable to changecontinued reinvestment in working capital. DDGM.
Net cash used in investing activities of $5.4$3.1 million for the three months ended March 31, 2022 increased by $0.52023 decreased from $5.4 million from the same period in 2021.2022. The increasedecrease is mainly attributableattributed to continued reinvestmentthe 2022 investment in DDGM. work to complete the commissioning of the filtration plant, the dry stack facility, and the gold regrind circuit.
Net cash used in financing activities for the three months ended March 31, 20222023 was a net outflow of $16 thousand compared to a net outflow of $1.1 million compared to a net outflow of $0.6 million for same period in 2021.2022. The change is primarily related to higher dividend payment and option exercise settled in cash in Q1 2022. the discontinuation of shareholder dividends.
While COVID-19 hascurrent macro risk factors, such as economic uncertainties and supply chain interruptions have not had a significant adverse impact on exploration plans, results of operations, financial position, and cash flows during the current fiscal year, future impacts are unknown at this time. However, we believe there is sufficient liquidity and capital resources to fund operations and corporate activities for the foreseeable future.
In May 2020, we filed a universal shelf registration statement with the SEC on Form S-3 for the proposed offering from time to time of up to $200,000,000 of our securities, including common stock, preferred stock, and/or warrants (the “Shelf Registration Statement”). We also entered into an At the Market Offering Agreement with H.C. Wainwright & Co., LLC pursuant to which we may sell shares of our common stock under the Shelf Registration Statement at market prices from time to time. However, pursuant to General Instruction I.A.3 of Form S-3, we are not eligible to use the Shelf Registration Statement at this timeuntil the 2022 Form 10-K is filed in 2023 due to the late filing of a Form 8-K including the historical financial statements related to our acquisition of Aquila Resources. Based on our current cash balances and the anticipated performance of our current and expected operations, we do not currently expect that the unavailability of our Shelf Registration Statement or our inability to utilize the ATM Agreement will have a material impact on our liquidityliquidity. Gold Resource Corporation—Management’s Discussion and Analysis of Financial Condition and Results of Operations
40 Accounting Developments
For a discussion of Recently Adopted and Recently Issued Accounting Pronouncements, please see Note - 2 Recently Adopted Accounting Standards in this Condensed Consolidated Interim Financial Statements and Notes.
Gold Resource Corporation—Management’s Discussion and Analysis of Financial Condition and Results of Operations
31
Forward-Looking Statements
This report contains “forward-looking statements” within the meaning of Section 27A of the Securities Act of 1933 and Section 21E of the Securities Exchange Act of 1934. We use the words “anticipate,” “continue,” “likely,” “estimate,” “expect,” “may,” “could,” “will,” “project,” “should,” “believe” and similar expressions (including negative and grammatical variations) to identify forward looking statements. Such forward-looking statements include, without limitation, statements regarding:
| ● | Our strategy for significant future investment in Oaxaca, Mexico and in Michigan, USA for development and exploration activities; |
| ● | The anticipated beneficial impacts of the recently constructed dry stack tailings facility; |
| ● | The expected completion datestiming for the Back Forty feasibility study, permitting, detailed engineering, and detailed engineering;project financing; |
| ● | Our estimated timing for completion of project financing and commencement of productionexpectations regarding future grades from mining at the Back Forty Project;DDGM; |
| ● | Expectations regarding gold recoveries upon completion of the DDGM gold regrind circuit; |
| ● | Our 2022 guidance for payable production, cash costs per ounce after co-product credits, and all-in sustaining costs per ounce after co-product credits; |
| ● | Expectations regarding 20222023 capital investment, exploration spending, and general and administrative costs; |
| ● | Future exploration plans at DDGM; |
| ● | Compliance with existing legal and regulatory requirements, including future asset reclamation costs; |
| ● | Estimates of Mineral Resources (“Mineral Resources”) and Mineral Reserves (“Mineral Reserves”); |
| ● | The sufficiency of our water rights; |
| ● | Our expectations regarding whether dividends will be paid in the future payment of dividends; |
| ● | Anticipated grades from future production; |
| ● | Our ability to locate another customer to purchase our products if the relationship with our existing customers is interrupted;future; and |
| ● | Our ability to satisfy our obligations and other potential cash requirements over the next twelve months. |
Forward-looking statements are neither historical facts nor assurances of future performance. Rather, they are based only on our current beliefs, expectations, and assumptions regarding the future of our business, future plans and strategies, projections, anticipated events and trends, the economy, and other future conditions. Because forward-looking statements relate to the future, they are subject to inherent uncertainties, risks, and changes in circumstances that are difficult to predict, and many of which are outside of our control. Our actual results and financial condition may differ materially from those indicated in the forward-looking statements. Therefore, you should not rely on any of these forward-looking statements. Important factors that could cause our actual results and financial condition to differ materially from those indicated in the forward-looking statements include, among others, the following:
| ● | The extent of the impact of the COVID-19 pandemic, including the duration, spread, severity, and any repeated resurgence of the COVID-19 pandemic, the duration and scope of related government orders and restrictions, the impact on our employees, and the extent of the impact of the COVID-19 pandemic on our mining operations; |
| ● | Commodity price fluctuations; |
| ● | Mine protests and work stoppages; |
| ● | Rock formations, faults and fractures, water flow and possible CO2 gas exhalation, or other unanticipated geological challenges; |
| ● | Unexpected changes in business and economic conditions, including supply chain challenges, the rate of inflation;inflation, and their impact on operating and capital costs; |
| ● | Changes in interest rates and currency exchange rates; |
Gold Resource Corporation—Management’s Discussion and Analysis of Financial Condition and Results of Operations
41 | ● | Adverse technological changes and cybersecurity threats; |
| ● | Unanticipated increases in our operating costs and other costs of doing business; |
| ● | Access to land and availability of materials, equipment, supplies, labor and supervision, power, and water; |
| ● | Results of current and future feasibility studies; |
Gold Resource Corporation—Management’s Discussion and Analysis of Financial Condition and Results of Operations
32
| ● | Interpretation of drill hole results and the geology, grade, and continuity of mineralization; |
| ● | Litigation by private parties or regulatory action by governmental entities; |
| ● | Acts of God, such as floods, earthquakes, and any other natural disasters; |
| ● | The inherent uncertainty of Mineral Resource and Mineral Reserve estimates; and |
| ● | Such other factors are discussed below under “Risk Factors”. |
Many of these factors are beyond our ability to control or predict. Although we believe that the expectations reflected in our forward-looking statements are based on reasonable assumptions, such expectations may prove to be materially incorrect due to known and unknown risks and uncertainties. You should not unduly rely on any of our forward-looking statements. These statements speak only as of the date of this quarterly report on Form 10-Q. Except as required by law, we are not obligated to publicly release any revisions to these forward-looking statements to reflect future events or developments. All subsequent written and oral forward-looking statements attributable to us and persons acting on our behalf are qualified in their entirety by the cautionary statements contained in this section and elsewhere in this Form 10-Q. Gold Resource Corporation—Management’s Discussion and Analysis of Financial Condition and Results of Operations
3342 ITEM 3: Quantitative and Qualitative Disclosures about Market Risk
Our exposure to market risks includes, but is not limited to, the following risks: changes in commodity prices, foreign currency exchange rates, provisional sales contract risks, changes in interest rates, and equity price risks. We do not use derivative financial instruments as part of an overall strategy to manage market risk; however, we may consider such arrangements in the future as we evaluate our business and financial strategy.
Commodity Price Risk
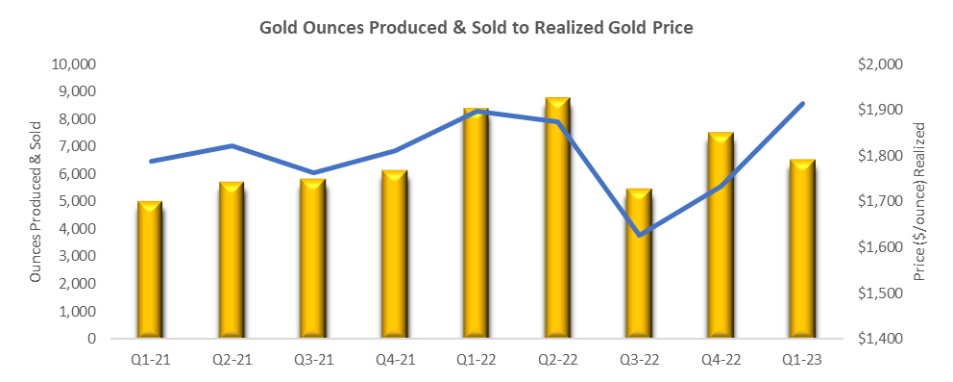
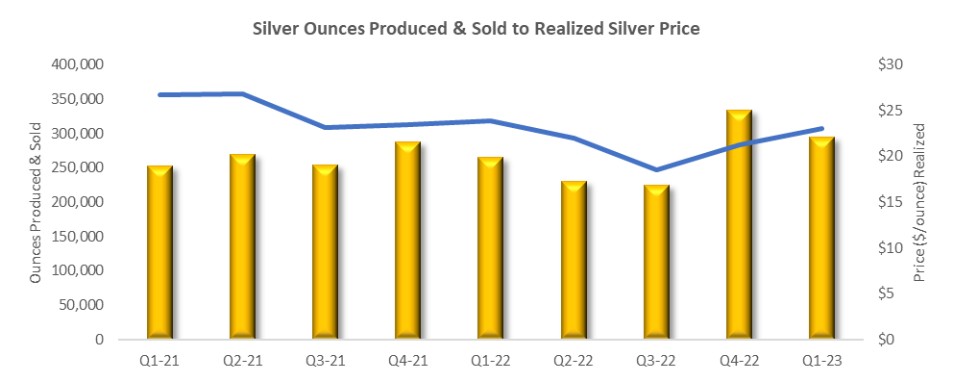
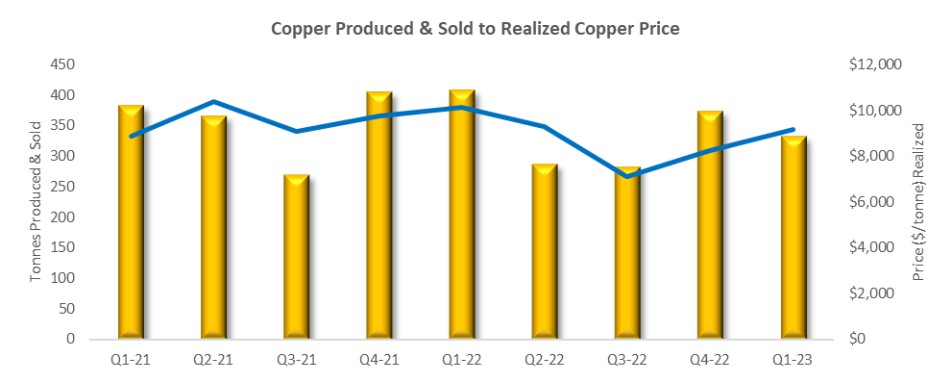
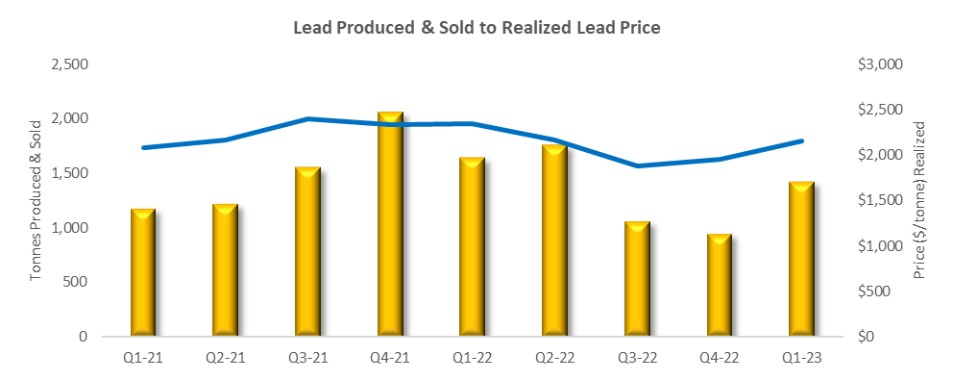
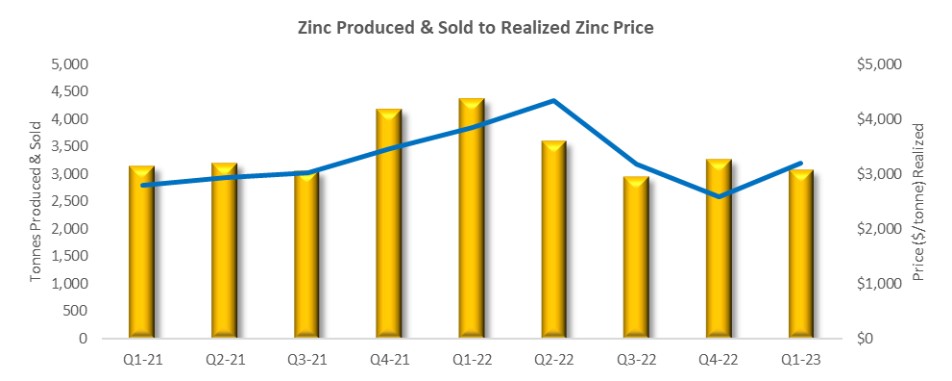
The results of our operations, cash flows, and financial condition depend in large part upon the market prices of gold, silver, copper, lead, and zinc. Metal prices fluctuate widely and are affected by numerous factors beyond our control. The level of interest rates, the rate of inflation, government fiscal and monetary policy, the stability of exchange rates, the world supply of and demand for gold, silver, and other metals, among other factors, can all cause significant fluctuations in commodity prices. Such external economic factors are in turn influenced by changes in international investment patterns, monetary systems, and political developments. The metal price markets have fluctuated widely in recent years, and future price declines could cause a mineral project to become uneconomic, thereby having a material adverse effect on our business and financial condition. We entered into a zinc zero cost collar to protect the selling price for zinc but have not entered into derivative contracts to protect the selling price for gold, silver, copper or lead. We may in the future more actively manage our exposure through additional derivative contracts, although we have no intention of doing so in the near-term. Effective May 18, 2021, the Company entered into a Trading Agreement with Auramet International LLC that govern non-exchange traded, over-the-counter, spot, forward, and option transactions on both a deliverable and non-deliverable basis involving various metals and currencies. Subsequently the Company entered into zinc zero cost collars. These derivatives are not designated as hedges. The zero cost collars arewere used to manage the Company’s near-term exposure to cash flow variability from zinc price risks. As of December 31, 2022, the Company’s hedge program concluded, but the Company may utilize similar programs in the future to manage near-term exposure to cash flow variability from metal prices. We do not currently use financial instruments with respect to any of the other base metal production.production either. In addition to materially adversely affecting our reserve estimates, results of operations and/or our financial condition, declining gold and silver prices could require a reassessment of the feasibility of a project. Even if a project is ultimately determined to be economically viable, the need to conduct such a reassessment may cause delays in the implementation of a project.
Foreign Currency Risk Our foreign operation sells its gold, silver, copper, lead, and zinc production based on U.S. dollar metal prices. Fluctuations in foreign currency exchange rates do not have a material impact on our revenue since gold, silver, copper, lead, and zinc are sold throughout the world in U.S. dollars. Foreign currency exchange rate fluctuations can increase or decrease our costs to the extent we pay costs in currencies other than the U.S. Dollar. We are primarily impacted by Mexican peso rate changes relative to the U.S. Dollar, as we incur some costs in the Mexican peso. When the value of the peso rises in relation to the U.S. Dollar, some of our costs in Mexico may increase, thus materially adversely affecting our operating results. Alternatively, when the value of the peso drops in relation to the U.S. Dollar, peso-denominated costs in Mexico will decrease in U.S. Dollar terms. These fluctuations do not impact our revenues since we sell our metals in U.S. Dollars. Future fluctuations may give rise to foreign currency exposure, which may affect our financial results. Approximately 50% to 60% of expenses are paid in currencies other than the U.S. dollar. We have not utilized market-risk sensitive instruments to manage our exposure to foreign currency exchange rates but may in the future actively manage our exposure to foreign currency exchange rate risk. Gold Resource Corporation
3443 Provisional Sales Contract Risk We enter into concentrate sales contracts which, in general, provide for a provisional payment to us based upon provisional assays and prices. The provisionally priced sales contracts contain an embedded derivative that is required to be separated from the host contract for accounting purposes. The host contract is the receivable from the sale of concentrates determined at the quoted metal prices at the time of shipment delivery to the customer. The embedded derivative, which does not qualify for hedge accounting, is adjusted to market through revenue each period prior to settlement. Changes in the prices of metals between the shipment delivery and final settlement date will result in adjustments to revenues related to the sales of concentrate previously recorded upon shipment delivery. Please see Note 14 - 14—Derivatives in this Condensed Consolidated Interim Financial Statements and Notes for additional information. Interest Rate Risk We consider our interest rate risk exposure to be insignificant at this time, as our interest rate is related and embedded in immaterial payments for office leases. Equity Price Risk We have in the past, and may in the future, seek to acquire additional funding through sale of common stock and other equity. The price of our common stock has been volatile in the past and may also be volatile in the future. As a result, there is a risk that we may not be able to sell our common stock at an acceptable price should the need for new equity funding arise.
ITEM 4: Controls and Procedures
Evaluation of Disclosure Controls and Procedures
OurDuring the fiscal period covered by this report, our management, with the participation of our Chief Executive Officer and Chief Financial Officer, carried out an evaluation of the effectiveness of the design and operation of our disclosure controls and procedures (as defined in Rules 13a-15(e) and 15d-15(e) of the Securities Exchange Act of 1934, as amended). Based on such evaluation, our Chief Executive Officer and Chief Financial Officer have concluded that, as of the end of the period covered by this report, our disclosure controls and procedures were effective to ensure that information required to be disclosed by us in reports that we file or submit under the Exchange Act are recorded, processed, summarized and reported within the required time periods and are designed to ensure that information required to be disclosed in theour reports that we file under the Securities Exchange Act of 1934, as amended (the "Exchange Act") is recorded, processed, summarized and reported within the time periods specified in the rules and forms of the Securities and Exchange Commission, and that such information is accumulated and communicated to our management, including our Chief Executive Officer and Chief Financial Officer as appropriate, to allow timely decisions regarding required disclosure. The Chief Executive Officer and the Chief Financial Officer, with assistance from management, have evaluated the effectiveness of disclosure controls and procedures as of March 31, 2022. This evaluation included consideration of the material weakness in internal controls over financial reporting that was identified and disclosed in our annual report on Form 10-K for the year ended December 31, 2021. Based on that evaluation, the Chief Executive Officer and the Chief Financial Officer have concluded that our disclosure controls and procedures were not effective as of March 31, 2022. Notwithstanding such material weakness in internal control over financial reporting, our management, including our Chief Executive Officer and our Chief Financial Officer, has concluded that our consolidated financial statements present fairly, in all material respects, our financial position, results of our operations and our cash flows for the periods presented in this quarterly report, in conformity with U.S. GAAP.
Material Weakness in Internal Control Over Financial Reporting
A material weakness is a deficiency, or a combination of deficiencies, in internal control over financial reporting, such that there is a reasonable possibility that a material misstatement of our annual or interim financial statements will not be prevented or detected on a timely basis.
Due to the Aquila acquisition at December 10, 2021, management performed review and approval controls related to the balances consolidated into the statement of financial position and statement of operations at December 31, 2021. The Aquila acquisition consisted of multiple complex valuations including the gold and silver stream agreements, the deferred tax liability and land. While multiple layers of approval and reasonableness tests were conducted, management prepared insufficient documentation related to the performance of these review controls to allow the independent registered public
Gold Resource Corporation
35
accounting firm to reperform the controls. Additionally, due to the timing of the acquisition, it was necessary to perform these review controls in a compressed timeframe, which resulted in an adjustment identified by the independent registered public accounting firm between balance sheet accounts.
Due to the complexity of the acquisition, limited timing from the close of the transaction and the inherent limitation of internal controls over financial reporting, management concluded that our internal control over financial reporting as of December 31, 2021, had a material weakness related to the operating effectiveness of review controls over the accounting for and valuation of acquired assets and liabilities in the application of the acquisition method of accounting for asset acquisitions. All other internal controls over financial reporting as of December 31, 2021 and March 31, 2022 remained effective. Management will continue to evaluate if any additional action is required to further resolve the material weakness.
Changes in Internal Control Over Financial Reporting
There were no changes that occurred during the three months ended March 31, 2022,2023, other than those enhancements to documentation discussed above, that have materially affected, or are reasonably likely to materially affect, our internal control over financial reporting.
PART II – OTHER INFORMATION ITEM 1: Legal Proceedings
We know of no material, existing or pending legal proceedings against us, nor are we involved as a plaintiff in any material proceeding or pending litigation.
In February 2020, a local Ejido community (who claim to be an indigenous community) filed an injunction against the Mexican federal government through which they demanded the cancellation of several concession titles. The federal government ordered a suspension to prevent work related to excavating, drilling, opening tunnels and exploiting the mineral resources on the surface and subsoil of the concessions named in the injunction. Presently, the Don David Gold Mine does Gold Resource Corporation
44 not perform such works in the named concessions in lands of the indigenous community. The lawsuit filed in February 2020 has not progressed to a final ruling.
ITEM 1A: Risk Factors
“Item 1A. Risk Factors” of our Form 10-K for the year ended December 31, 20212022 includes a discussion of our known material risk factors, other than risks that could apply to any issuer or offering. There have been no material changes from the risk factors described in our Form 10-K.
ITEM 2: Unregistered Sales of Equity Securities and Use of Proceeds
None
ITEM 3: Defaults upon Senior Securities
None
ITEM 4: Mine Safety Disclosures
While the Company owns an advanced exploration project in Michigan, USA, the project is not yet subject to the Mine Safety and Health Administration (“MSHA”) jurisdiction and therefore, the mine safety disclosure requirements are not applicable.
ITEM 5: Other Information
None Gold Resource Corporation
36
ITEM 6: Exhibits The following exhibits are filed or furnished herewith or incorporated herein by reference: * | This document is not being “filed” for purposes of Section 18 of the Securities Exchange Act of 1934, as amended, or otherwise subject to the liabilities of that Section. Registration Statements or other documents filed with the SEC shall not incorporate this exhibit by reference, except as otherwise expressly stated in such filing. |
Gold Resource Corporation
3745 SIGNATURES In accordance with Section 13 or 15(d) of the Exchange Act of 1934, the Company has caused this Report to be signed on its behalf by the undersigned, thereunto duly authorized. | | | | | | GOLD RESOURCE CORPORATION | | | | | Dated: May 9, 2022April 25, 2023 | | | /s/ Allen Palmiere | | | By: | Allen Palmiere, | | | | Chief Executive Officer,
President and Director | | | | | | | | | | | | | | Dated: May 9, 2022April 25, 2023 | | | /s/ Kimberly C. Perry | | | By: | Kimberly C. Perry, | | | | Chief Financial Officer |
Gold Resource Corporation
3846 | | | | | | | | |