Table of Contents

UNITED STATES

SECURITIES AND EXCHANGE COMMISSION

Washington, D.C. 20549

FORM 10-Q

QUARTERLY REPORT PURSUANT TO SECTION 13 OR 15(d) OF THE SECURITIES EXCHANGE ACT OF 1934

For the quarterly period ended June 30, 2022March 31, 2023

OR

TRANSITION REPORT PURSUANT TO SECTION 13 OR 15(d) OF THE SECURITIES EXCHANGE ACT OF 1934

For the transition period from ______ to ______

Commission file number: 001-13425

Graphic

Ritchie Bros. Auctioneers Incorporated

(Exact Name of Registrant as Specified in its Charter)

Canada


98-0626225

(State or other jurisdiction of incorporation or organization)


(I.R.S. Employer Identification No.)


9500 Glenlyon ParkwayTwo Westbrook Corporate Center, Suite 500,


BurnabyWestchester, British ColumbiaIllinois, CanadaUSA


V5J 0C660154

(Address of Principal Executive Offices)


(Zip Code)

(778708) 331-5500492-7000

(Registrant’s Telephone Number, including Area Code)

Securities registered pursuant to Section 12(b) of the Act:

Title of each class

Trading Symbol(s)

Name of each exchange on which registered

Common shares

RBA

New York Stock Exchange

Common Share Purchase Rights

N/A

New York Stock Exchange

Indicate by checkmark whether the registrant (1) filed all reports required to be filed by Section 13 or 15(d) of the Securities Exchange Act of 1934 during the preceding 12 months (or for such shorter period that the registrant was required to file such reports), and (2) has been subject to such filing requirements for the past 90 days. Yes No

Indicate by check mark whether the registrant has submitted electronically every Interactive Data File required to be submitted pursuant to Rule 405 of Regulation S-T (§ 232.405 of this chapter) during the preceding 12 months (or for such shorter period that the registrant was required to submit such files).  Yes No

Indicate by check mark whether the registrant is a large accelerated filer, an accelerated filer, a non-accelerated filer, smaller reporting company, or an emerging growth company. See the definitions of “large accelerated filer,” “accelerated filer,” “smaller reporting company,” and “emerging growth company” in Rule 12b-2 of the Exchange Act.

Large accelerated filer 

Accelerated filer 

Non-accelerated filer 

Smaller reporting company 

Emerging growth company 

If an emerging growth company, indicate by check mark if the registrant has elected not to use the extended transition period for complying with any new or revised financial accounting standards provided pursuant to Section 13(a) of the Exchange Act. 

Indicate by check mark whether the registrant is a shell company (as defined in Rule 12b-2 of the Exchange Act):

Yes No

Indicate the number of shares outstanding of each of the issuer’s classes of common stock, as of the latest practical date: 110,809,591181,790,031 common shares, without par value, outstanding as of August 3, 2022.May 9, 2023.

Table of Contents

RITCHIE BROS. AUCTIONEERS INCORPORATED

FORM 10-Q

For the quarter ended June 30, 2022March 31, 2023

INDEX

PART I – FINANCIAL INFORMATION

ITEM 1:

Consolidated Financial Statements

1

ITEM 2:

Management’s Discussion and Analysis of Financial Condition and Results of Operations

2836

ITEM 3:

Quantitative and Qualitative Disclosures About Market Risk

5466

ITEM 4:

Controls and Procedures

5466

PART II – OTHER INFORMATION

ITEM 1:

Legal Proceedings

5567

ITEM 1A:

Risk Factors

5567

ITEM 2:

Unregistered Sales of Equity Securities and Use of Proceeds

5574

ITEM 3:

Defaults Upon Senior Securities

5574

ITEM 4:

Mine Safety Disclosures

5574

ITEM 5:

Other Information

5574

ITEM 6:

Exhibits

5675

SIGNATURES

5776

Table of Contents

PART I – FINANCIAL INFORMATION

ITEM 1:           CONSOLIDATED FINANCIAL STATEMENTS

Condensed Consolidated Income Statements

(Expressed in thousandsmillions of United StatesU.S. dollars, except share and per share data)

(Unaudited)

Three months ended

Six months ended

June 30, 

June 30, 


2022


2021


2022


2021

Revenue:


Service revenue

$

286,502

$

252,748

$

531,363

$

458,778

Inventory sales revenue


198,044


143,613


347,104


269,138

Total revenue


484,546


396,361


878,467


727,916

Operating expenses:


Costs of services


45,039


41,301


84,054


79,167

Cost of inventory sold


176,171


131,023


307,753


241,770

Selling, general and administrative


144,277


109,560


270,883


223,799

Acquisition-related costs


3,399


3,049


13,036


5,971

Depreciation and amortization


24,298


21,935


48,523


43,005

Foreign exchange loss (gain)


(158)


151


(322)


428

Total operating expenses


393,026


307,019


723,927


594,140

Gain on disposition of property, plant and equipment


347


175

170,167

243

Operating income


91,867


89,517


324,707


134,019

Interest expense


(18,463)


(8,867)


(39,149)


(17,813)

Change in fair value of derivatives, net


1,263


Other income, net


1,639


1,196


2,559


2,198

Income before income taxes


75,043


81,846


289,380


118,404

Income tax expense

21,632

21,065

57,868

29,484

Net income

$

53,411

$

60,781

$

231,512

$

88,920

Net income (loss) attributable to:


Stockholders

$

53,365

$

60,749

$

231,459

$

88,937

Non-controlling interests


46


32


53


(17)

Net income

$

53,411

$

60,781

$

231,512

$

88,920

Earnings per share attributable to stockholders:


Basic

$

0.48

$

0.55

$

2.09

$

0.81

Diluted

$

0.48

$

0.55

$

2.07

$

0.80

Weighted average number of shares outstanding:


Basic


110,760,339


110,311,615


110,705,182


110,144,229

Diluted


111,705,102


111,334,184


111,681,644


111,302,711

See accompanying notes to the condensed consolidated financial statements.

Three months ended

March 31, 


2023


2022

Revenue:


Service revenue

$

343.6

$

244.9

Inventory sales revenue


168.8


149.0

Total revenue


512.4


393.9

Operating expenses:


Costs of services


76.4


39.0

Cost of inventory sold


151.5


131.6

Selling, general and administrative


148.2


126.6

Acquisition-related and integration costs


126.2


9.6

Depreciation and amortization


36.2


24.2

Total operating expenses


538.5


331.0

Gain on disposition of property, plant and equipment


1.2


169.8

Operating (loss) income


(24.9)


232.7

Interest expense


(20.9)


(20.7)

Interest income

6.3

0.5

Change in fair value of derivatives, net


1.3

Other income, net


2.4


0.3

Foreign exchange (loss) gain

(0.4)

0.2

(Loss) income before income taxes


(37.5)


214.3

Income tax (benefit) expense

(9.3)

36.2

Net (loss) income

$

(28.2)

$

178.1

Net (loss) income attributable to:


Controlling interests

$

(28.1)

$

178.1

Non-controlling interests


Redeemable non-controlling interests


(0.1)


Net (loss) income

$

(28.2)

$

178.1

Net (loss) income attributable to controlling interests

(28.1)

178.1

Cumulative dividends on Series A Senior Preferred Shares


(4.3)


Allocated earnings to Series A Senior Preferred Shares

(1.8)

Net (loss) income available to common stockholders

$

(34.2)

$

178.1

(Loss) earnings per share available to common stockholders:


Basic

$

(0.28)

$

1.61

Diluted

$

(0.28)

$

1.60

Weighted average number of shares outstanding:


Basic


120,487,251


110,647,700

Diluted


120,487,251


111,655,861

Ritchie Bros.

1

Table of Contents

See accompanying notes to the condensed consolidated financial statements.

Condensed Consolidated Statements of Comprehensive Income (Loss)

(Expressed in thousandsmillions of United StatesU.S. dollars)

(Unaudited)

Three months ended

Six months ended

Three months ended


June 30, 

June 30, 


March 31, 

2022


2021


2022


2021

2023


2022

Net income

$

53,411

$

60,781

$

231,512

$

88,920

Net (loss) income

$

(28.2)

$

178.1

Other comprehensive income (loss), net of income tax:


Foreign currency translation adjustment


(22,775)


1,468


(23,942)


(8,892)


15.1


(1.2)

Total comprehensive income

$

30,636

$

62,249

$

207,570

$

80,028

Total comprehensive (loss) income

$

(13.1)

$

176.9

Total comprehensive income (loss) attributable to:


Stockholders

$

30,612

$

62,215

$

207,549

$

80,059

Total comprehensive (loss) income attributable to:


Controlling interests

$

(13.0)

$

176.9

Non-controlling interests


24


34


21


(31)


Redeemable non-controlling interests

(0.1)

$

30,636

$

62,249

$

207,570

$

80,028

$

(13.1)

$

176.9

See accompanying notes to the condensed consolidated financial statements.

Ritchie Bros.

2

Table of Contents

Condensed Consolidated Balance Sheets

(Expressed in thousandsmillions of United StatesU.S. dollars, except share data)

(Unaudited)

June 30, 

December 31, 


2022


2021

Assets

Cash and cash equivalents

$

367,289

$

326,113

Restricted cash


164,371


102,875

Trade and other receivables


295,241


150,895

Less: allowance for credit losses

(3,763)

(4,396)

Inventory


124,964


102,494

Other current assets


36,212


64,346

Income taxes receivable


12,525


19,895

Total current assets


996,839


762,222

Restricted cash

933,464

Property, plant and equipment


442,743


449,087

Other non-current assets


168,360


142,504

Intangible assets


332,615


350,516

Goodwill


945,950


947,715

Deferred tax assets


7,458


7,406

Total assets

$

2,893,965

$

3,592,914

Liabilities and Equity


Auction proceeds payable

$

493,688

$

292,789

Trade and other liabilities


254,514


280,308

Income taxes payable


31,362


5,677

Short-term debt


8,637


6,147

Current portion of long-term debt


4,617


3,498

Total current liabilities


792,818


588,419

Long-term debt


639,755


1,733,940

Other non-current liabilities


155,911


147,260

Deferred tax liabilities


61,396


52,232

Total liabilities


1,649,880


2,521,851

Commitments and Contingencies (Note 22 and Note 23 respectively)


Stockholders' equity:


Share capital:


Common stock; 0 par value, unlimited shares authorized, issued and outstanding shares: 110,791,788 (December 31, 2021: 110,618,049)


235,244


227,504

Additional paid-in capital


73,014


59,535

Retained earnings


1,015,301


839,609

Accumulated other comprehensive loss


(79,883)


(55,973)

Stockholders' equity


1,243,676


1,070,675

Non-controlling interest


409


388

Total stockholders' equity


1,244,085


1,071,063

Total liabilities and equity

$

2,893,965

$

3,592,914

See accompanying notes to the condensed consolidated financial statements.

Ritchie Bros.

3

Table of Contents

Condensed Consolidated Statements of Changes in Equity

(Expressed in thousands of United States dollars, except where noted)

(Unaudited)

Attributable to stockholders


Additional

Accumulated

Non-

Common stock

paid-In

other

controlling

Number of

capital

Retained

comprehensive

interest

Total

Three months ended June 30, 2022


shares


Amount


("APIC")


earnings


loss


("NCI")


equity


Balance, March 31, 2022

110,735,243

$

231,064

$

61,123

$

989,923

$

(57,130)

$

385

$

1,225,365

Net income


53,365


46


53,411

Other comprehensive loss


(22,753)


(22)


(22,775)


53,365


(22,753)


24


30,636

Stock option exercises

55,935


2,347


(471)


1,876

Issuance of common stock related to vesting of share units

610


14


(43)


(29)

Share-based continuing employment costs related to business combinations


1,819


261


2,080

Stock option compensation expense

3,056

3,056

Equity-classified share units expense

8,794


8,794

Equity-classified share units divided equivalents

294

(294)


Cash dividends paid


(27,693)


(27,693)

Balance, June 30, 2022

110,791,788

$

235,244

$

73,014

$

1,015,301

$

(79,883)

$

409

$

1,244,085

Three months ended June 30, 2021


Balance, March 31, 2021

110,253,056

$

210,765

$

43,612

$

795,781

$

(44,639)

$

5,089

$

1,010,608

Net income


60,749


32


60,781

Other comprehensive income


1,466


2


1,468


60,749


1,466


34


62,249

Stock option exercises


113,290

4,889

(910)


3,979

Issuance of common stock related to vesting of share units


462

12

(30)


(18)

Share-based continuing employment costs related to business combinations

2,678


2,678

Stock option compensation expense


1,909


1,909

Equity-classified share units expense


4,404


4,404

Equity-classified share units dividend equivalents


137


(137)


Cash dividends paid


(24,356)


(26)

(24,382)

Balance, June 30, 2021


110,366,808

$

215,666

$

51,800

$

832,037

$

(43,173)

$

5,097

$

1,061,427

March 31, 

December 31,


2023


2022

Assets

Cash and cash equivalents

$

568.3

$

494.3

Restricted cash


138.7


131.6

Trade and other receivables


793.1


186.5

Less: allowance for credit losses

(4.1)

(3.3)

Prepaid consigned vehicle charges

23.0

Inventory


207.3


103.1

Other current assets


82.9


48.3

Income taxes receivable


20.5


2.6

Total current assets


1,829.7


963.1

Property, plant and equipment


1,144.9


459.1

Operating lease right-of-use assets

1,369.8

123.0

Other non-current assets


74.7


40.4

Intangible assets


2,670.6


322.7

Goodwill


4,769.1


948.8

Deferred tax assets


9.2


6.6

Total assets

$

11,868.0

$

2,863.7

Liabilities, Temporary Equity and Equity


Auction proceeds payable

$

629.7

$

449.0

Trade and other liabilities


558.4


258.7

Current operating lease liabilities

90.1

12.7

Income taxes payable


7.0


41.3

Short-term debt


23.6


29.1

Current portion of long-term debt


95.7


4.4

Total current liabilities


1,404.5


795.2

Long-term operating lease liabilities

1,266.4

111.9

Long-term debt


3,124.7


577.1

Other non-current liabilities


59.3


35.4

Deferred tax liabilities


658.5


54.0

Total liabilities


6,513.4


1,573.6

Temporary equity:

Series A Senior Preferred Shares; no par value, shares authorized, issued and outstanding at March 31, 2023: 485,000,000 (December 31, 2022: nil)

482.0

Redeemable non-controlling interest

8.8

Stockholders' equity:


Share capital:


Common stock; no par value, unlimited shares authorized, issued and outstanding shares: 181,788,431 (December 31, 2022: 110,881,363)


3,984.5


246.3

Additional paid-in capital


88.8


85.3

Retained earnings


858.2


1,043.2

Accumulated other comprehensive loss


(70.0)


(85.1)

Stockholders' equity


4,861.5


1,289.6

Non-controlling interests


2.3


0.5

Total stockholders' equity


4,863.8


1,290.1

Total liabilities, temporary equity and equity

$

11,868.0

$

2,863.7

See accompanying notes to the condensed consolidated financial statements.

Ritchie Bros.

43

Table of Contents

Condensed Consolidated Statements of Changes in Temporary Equity and Equity

(Expressed in millions of U.S. dollars, except where noted)

(Unaudited)


Attributable to stockholders


Additional

Accumulated

Non-

Common stock

paid-In

other

controlling

Number of

capital

Retained

comprehensive

interest

Total

Six months ended June 30, 2022


shares


Amount


("APIC")


earnings


loss


("NCI")


equity


Balance, December 31, 2021

110,618,049

$

227,504

$

59,535

$

839,609

$

(55,973)

$

388

$

1,071,063

Net income


231,459


53


231,512

Other comprehensive loss


(23,910)


(32)


(23,942)


231,459


(23,910)


21


207,570

Stock option exercises

80,183


3,554


(692)


2,862

Issuance of common stock related to vesting of share units

93,556


2,367


(5,945)


(3,578)

Share-based continuing employment costs related to business combinations

1,819

2,394


4,213

Stock option compensation expense

5,623


5,623

Equity-classified share units expense


11,684


11,684

Equity-classified share units dividend equivalents


415


(415)


Cash dividends paid


(55,352)


(55,352)

Balance, June 30, 2022

110,791,788

$

235,244

$

73,014

$

1,015,301

$

(79,883)

$

409

$

1,244,085

Six months ended June 30, 2021


Balance, December 31, 2020


109,876,428

$

200,451

$

49,171

$

791,918

$

(34,295)

$

5,154

$

1,012,399

Net income


88,937


(17)


88,920

Other comprehensive income


(8,878)


(14)


(8,892)


88,937


(8,878)


(31)


80,028

Stock option exercises


311,153

13,157

(2,458)


10,699

Issuance (forfeiture) of common stock related to vesting of share units


234,737

2,058

(11,377)


(9,319)

Forfeiture of common stock related to business combinations


(55,510)


Share-based continuing employment costs related to business combinations


5,231


5,231

Stock option compensation expense


3,770


3,770

Equity-classified share units expense


7,182


7,182

Equity-classified share units dividend equivalents


281


(281)


Cash dividends paid


(48,537)


(26)

(48,563)

Balance, June 30, 2021


110,366,808

$

215,666

$

51,800

$

832,037

$

(43,173)

$

5,097

$

1,061,427

Attributable to common stockholders

Redeemable

Additional

Accumulated

Non-

Senior A Senior Preferred Shares

non-

Common stock

paid-In

other

controlling

Number of

controlling

Number of

capital

Retained

comprehensive

interest

Total

Three months ended March 31, 2023


shares


Amount


interest


shares


Amount


("APIC")


earnings


loss


("NCI")


equity

Balance, December 31, 2022

$

$

110,881,363

$

246.3

$

85.3

$

1,043.2

$

(85.1)

$

0.5

$

1,290.1

Net loss


(0.1)


(28.1)


(28.1)

Other comprehensive income


15.1


15.1


(0.1)


(28.1)


15.1


(13.0)

Stock option exercises


19,277


0.8


(0.1)


0.7

Issuance of common stock related to vesting of share units


296,905


8.9


(21.3)


(12.4)

Issuance of common stock related to business combination

70,339,723

3,713.2

3,713.2

Share-based continuing employment costs related to business combinations


0.3


0.5


0.8

Replacement of share-based awards in business combination


13.1


13.1

Stock option compensation expense

2.6

2.6

Equity-classified share units expense

8.3


8.3

Equity-classified share units dividend equivalents

0.4

(0.4)


NCI acquired in business combination

8.9

1.8

1.8

Issuance of Series A Senior Preferred Shares and common stock, net of issuance costs


485,000,000


482.0


251,163


15.0


15.0

Participating dividends on Series A Senior Preferred Shares

(1.8)


(1.8)

Cumulative 5.5% dividends on Series A Senior Preferred Shares

(4.3)


(4.3)

Dividends paid to common stockholders


(150.4)


(150.4)

Balance, March 31, 2023

485,000,000

$

482.0

$

8.8

181,788,431

$

3,984.5

$

88.8

$

858.2

$

(70.0)

$

2.3

$

4,863.8

Balance, December 31, 2021

$

$

110,618,049

$

227.5

$

59.5

$

839.6

$

(56.0)

$

0.4

$

1,071.1

Net income


178.1


0.0


178.1

Other comprehensive loss


(1.2)


(1.2)


178.1


(1.2)


0.0


176.9

Stock option exercises


24,248


1.2


(0.2)


1.0

Issuance of common stock related to vesting of share units


92,946


2.4


(5.9)


(3.5)

Issuance (forfeiture) of common stock related to business combinations


Share-based continuing employment costs related to business combinations


2.1


2.1

Stock option compensation expense

2.6


2.6

Equity-classified share units expense


2.9


2.9

Equity-classified share units dividend equivalents


0.1

(0.1)


Dividends paid to common stockholders


(27.7)


(27.7)

Balance, March 31, 2022


$

$

110,735,243

$

231.1

$

61.1

$

989.9

$

(57.2)

$

0.4

$

1,225.4

See accompanying notes to the condensed consolidated financial statements.

Ritchie Bros.

54

Table of Contents

Condensed Consolidated Statements of Cash Flows

(Expressed in thousandsmillions of United StatesU.S. dollars)

(Unaudited)

Six months ended June 30, 


2022


2021

Cash provided by (used in):


Operating activities:


Net income

$

231,512

$

88,920

Adjustments for items not affecting cash:


Depreciation and amortization


48,523


43,005

Share-based payments expense


21,527


16,183

Deferred income tax expense


9,480


1,719

Unrealized foreign exchange gain


(1,965)


(65)

Gain on disposition of property, plant and equipment


(170,167)


(243)

Loss on redemption of the 2021 Notes

4,792

Amortization of debt issuance costs


2,352


1,443

Amortization of right-of-use assets

8,586

6,280

Change in fair value of derivatives

(1,263)

Other, net


2,805


1,568

Net changes in operating assets and liabilities


41,844


52,577

Net cash provided by operating activities


198,026


211,387

Investing activities:


Acquisitions, net of cash acquired


(63)


728

Property, plant and equipment additions


(4,522)


(4,616)

Proceeds on disposition of property, plant and equipment


165,132


342

Intangible asset additions


(15,730)


(17,361)

Issuance of loans receivable

(6,093)

(2,622)

Repayment of loans receivable

1,554

226

Net cash provided by (used in) investing activities


140,278


(23,303)

Financing activities:


Dividends paid to stockholders


(55,352)


(48,537)

Dividends paid to NCI


(26)

Proceeds from exercise of options and share option plans


2,862


10,699

Payment of withholding taxes on issuance of shares


(3,716)


(9,155)

Net increase (decrease) in short-term debt

2,722

6,842

Repayment of long-term debt

(1,093,772)

(5,328)

Debt issue costs


(3,677)


Repayment of finance lease obligations


(5,390)


(5,355)

Net cash used in financing activities


(1,156,323)


(50,860)

Effect of changes in foreign currency rates on cash, cash equivalents, and restricted cash


(12,773)


(1,396)

(Decrease) Increase


(830,792)


135,828

Beginning of period


1,362,452


306,895

Cash, cash equivalents, and restricted cash, end of period

$

531,660

$

442,723

Three months ended March 31, 


2023


2022

Cash provided by (used in):


Operating activities:


Net (loss) income

$

(28.2)

$

178.1

Adjustments for items not affecting cash:


Depreciation and amortization


36.2


24.2

Share-based payments expense


12.2


7.6

Deferred income tax (benefit) expense


(2.9)


12.4

Unrealized foreign exchange loss (gain)


4.8


(0.2)

Gain on disposition of property, plant and equipment


(1.2)


(169.8)

Loss on redemption of 2016 Notes

3.3

Amortization of debt issuance costs


0.9


0.8

Amortization of right-of-use assets

5.0

3.5

Change in fair value of derivatives

(1.3)

Gain on remeasurement of investment upon acquisition

(1.4)

Other, net


0.8


1.1

Net changes in operating assets and liabilities


(86.8)


128.7

Net cash (used in) provided by operating activities


(57.3)


185.1

Investing activities:


Acquisition of IAA, net of cash acquired


(2,759.1)


Acquisition of VeriTread, net of cash acquired

(24.7)

Acquisition of SmartEquip, net of cash acquired

(0.1)

Property, plant and equipment additions


(23.5)


(2.0)

Proceeds on disposition of property, plant and equipment


1.4


164.7

Intangible asset additions


(16.9)


(7.8)

Issuance of loans receivable

(0.9)

(1.1)

Repayment of loans receivable

0.7

1.2

Net cash (used in) provided by investing activities


(2,823.0)


154.9

Financing activities:


Issuance of Series A Senior Preferred Shares and common stock, net of issuance costs

496.9

Dividends paid to common stockholders


(150.4)


(27.7)

Dividends paid to Series A Senior Preferred shareholders

(4.9)

Proceeds from exercise of options and share option plans


0.7


1.0

Payment of withholding taxes on issuance of shares


(10.0)


(1.5)

Net (decrease) increase in short-term debt

(5.4)

15.4

Proceeds from long-term debt


3,175.0


Repayment of long-term debt

(501.1)

(162.7)

Payment of debt issue costs


(38.7)


(2.3)

Repayment of finance lease obligations


(3.6)


(2.5)

Net cash provided by (used in) financing activities


2,958.5


(180.3)

Effect of changes in foreign currency rates on cash, cash equivalents, and restricted cash


2.9


7.8

Increase


81.1


167.6

Beginning of period


625.9


1,362.5

Cash and cash equivalents, and restricted cash, end of period

$

707.0

$

1,530.1

See accompanying notes to the condensed consolidated financial statements.

Ritchie Bros.

65

Table of Contents

1.    General informationInformation

Ritchie Bros. Auctioneers Incorporated and its subsidiaries (collectively referred to as the “Company”, “Ritchie Bros.”, “we”, “us”, or “our”) provide a marketplace for insights, services and transaction solutions for commercial assets.assets and vehicles. The Company offers its customers end-to-end transaction solutions for used commercial and other durable assets through its omnichannel platform, which includes auctions, online marketplaces, listing services, and private brokerage services. The Company also offers a wide array of value-added services connected to commercial assets and vehicles as well as asset management software and data as a service solutions to help customers make more accurate and reliable business decisions.

On March 20, 2023, the Company acquired all the issued and outstanding shares of IAA, Inc. (“IAA”), which has been consolidated from the date of acquisition. IAA is a leading global digital marketplace connecting vehicle buyers and sellers and facilitates the marketing and sale of total loss, damaged and low-value vehicles for a full spectrum of sellers. IAA has more than 200 facilities throughout the United States, Canada and the United Kingdom.

On January 3, 2023, the Company also acquired a 75% interest in VeriTread LLC (“VeriTread”), which has been consolidated from the date the Company obtained control on January 18, 2023. VeriTread is a transportation technology company in the United States that provides an online marketplace solution for open deck transport, connecting shippers and service providers.

Ritchie Bros. Auctioneers Incorporated is a company incorporated in Canada under the Canada Business Corporations Act, whose shares are publicly traded on the Toronto Stock Exchange (“TSX”) and the New York Stock Exchange (“NYSE”) and the Toronto Stock Exchange (“TSX”). The Company moved its headquarters to Westchester, Illinois, United States from Burnaby, British Columbia, Canada after the close of the IAA acquisition.

2.    Significant accounting policiesAccounting Policies

(a) Basis of preparationPreparation

These unaudited condensed consolidated interim financial statements have been prepared in accordance with United States generally accepted accounting principles (“US GAAP”). They include the accounts of Ritchie Bros. Auctioneers Incorporated and its subsidiaries from their respective dates of formation, acquisition or acquisition.control. All significant intercompany balances and transactions have been eliminated.

Certain information and footnote disclosure required by US GAAP for complete annual financial statements have been omitted and, therefore, these unaudited condensed consolidated interim financial statements should be read in conjunction with the Company’s audited consolidated financial statements for the year ended December 31, 2021,2022, included in the Company’s Annual Report on Form 10-K, filed with the Securities and Exchange Commission (“SEC”). These unaudited condensed consolidated interim financial statements follow the same accounting policies and methods of application as our most recent annual audited consolidated financial statements except as described in Note 2(b) “ New“New Accounting Standards and amended accounting standards and accounting policies”Accounting Policies”. In the opinion of management, these unaudited condensed consolidated interim financial statements reflect all adjustments, consisting of normal recurring adjustments, which are necessary to present fairly, in all material respects, the Company’s consolidated financial position, results of operations, cash flows and changes in temporary equity and equity for the interim periods presented. The preparation of financial statements in conformity with US GAAP requires management to make estimates and assumptions that affect the amounts reported in the financial statements and accompanying notes. Actual results could differ from those estimates.

On February 24, 2022, the geopolitical situation in Eastern Europe intensified with Russia’s invasion of Ukraine, sharply affecting economic and global financial markets. Subsequent economic sanctions of Russia have exacerbated ongoing economic challenges, including issues such as rising inflation and global supply chain disruption. The Company does not have any direct or significant operations in Russia or Ukraine, or any material operations in neighboring countries and only has limited number of direct customersUnless otherwise indicated, all amounts in the effected region. The extent of the ongoing impacts of the conflict on our operationalfollowing tables are in millions except share and financial performance, the impact of higher fuel costs globally adding to inflationary pressures, including our ability to execute on our business strategies and initiatives and sustain our operations in Europe and globally, will depend on future developments, including the continued evolvement of military activity and sanctions imposed with Russia’s invasion of Ukraine. Given the evolving nature of the crisis, the Company cannot currently reasonably estimate the impacts of the conflict on its business operations, results of operations, cash flows or financial performance.per share amounts.

Reclassification

Ritchie Bros.

6

Table of Contents

2.    Significant Accounting Policies (continued)

Certain amounts(a) Basis of Preparation (continued)

Reclassifications

The following reclassifications have been made in the presentation of prior period financial statements have been reclassified from selling, general and administrative expenses to cost of services for certain employee costs related to equipment inspections to conform to the presentation of the current period financial statements.statements:

(i)reclassification in 2022 of $23.3 million from trade and other liabilities to auction proceeds payable relating to amounts payable to consignors from our auctions and marketplaces, which are held for various reasons beyond the typical payment terms of 21 days;

(ii)reclassification in 2022 of $122.9 million from other non-current assets to operating lease right-of-use assets, $12.7 million from trade and other liabilities to current operating lease liabilities, and $111.9 million from other non-current liabilities to long-term operating lease liabilities; and

(iii)reclassification of $0.2 million foreign exchange gain for the three-month period ended March 31, 2022, from operating income to below operating income.

(b) New Accounting Standards and Accounting Policies

The Company does not believe that any recently issued, but not yet effective, accounting pronouncements, if adopted, would have a material impact on its consolidated financial statements or disclosures.

These unaudited condensed consolidated interim financial statements should be read in conjunction with the audited annual financial statements, including the following accounting policies which have been disclosed to reflect the significant accounting policies of the combined Company following its business combinations (Note 5) and changes in the nature of the business and its operations:

Prepaid Consigned Vehicle Charges

Prepaid consigned vehicle charges include the inbound tow, titling costs and enhancement charges associated with a consigned vehicle. These prepaid charges are recorded in cost of services at the date the vehicle is sold and revenue is recognized.

Redeemable Non-controlling Interest

Redeemable non-controlling interest is classified as temporary equity on the consolidated balance sheet, as the holder may demand cash and put the non-controlling interest to the Company. Redeemable non-controlling interest is initially carried at its acquisition date fair value. If it becomes probable that the redeemable non-controlling interest will be redeemed, the Company then will recognize any change in its estimated redemption value immediately to retained earnings and adjust the carrying amount to equal the estimated redemption value at the end of each reporting period.

Redeemable Convertible Preferred Stock

Redeemable convertible preferred stock is classified as temporary equity on the consolidated balance sheet because it could become redeemable due to a change in control which would be outside of the Company’s control and requires a cash payment upon redemption. The redeemable convertible preferred stock is initially carried at fair value, and if redemption becomes probable, the Company will recognize any change in its estimated redemption value immediately to retained earnings and adjust the carrying amount to equal the estimated redemption value at the end of each reporting period. Direct and incremental costs incurred in connection with the issuance of redeemable convertible stock are recorded against the proceeds received and included in its initial carrying amount.

On February 1, 2023, the Company sold an aggregate of 485.0 million of redeemable convertible preferred stock, convertible into common stock, designated as Series A Senior Preferred Shares (“Series A Senior Preferred Shares”).

Ritchie Bros.

7

Table of Contents

2.    Significant accounting policiesAccounting Policies (continued)

(b) New Accounting Standards and amended accounting standards and accounting policiesAccounting Policies (continued)

New accounting policiesEarnings Per Share

SaleBasic earnings per share (“EPS”) is calculated based on the two-class method, given that the Company’s Series A Senior Preferred Shares are considered a participating security as it contractually entitles its holders to participate in the Company’s earnings. The two-class method is an earnings allocation method for computing earnings or losses per share when a Company’s capital structure includes common stock and leasebackparticipating securities. The two-class method determines earnings per share between holders of common stock and the Company’s participating preferred stock based on dividends declared and their respective participation rights in undistributed earnings.

Net income available to common stockholders is computed as: net income attributable to controlling interests less cumulative dividends on Series A Senior Preferred Shares and allocated earnings to participating securities. Basic EPS is calculated by dividing net income available to common stockholders by the weighted average common stock outstanding. Diluted EPS is calculated similarly, except that it is computed based upon the lower of the two-class method or the if-converted method, which includes the effects of the assumed conversion of the Series A Senior Preferred Shares, and the effect of shares issuable under the Company’s stock-based incentive plans if such effect is dilutive.

Revenue

The transfer of the asset shall not be accounted for as a sale if the leaseback would be classified as a finance lease or a sales-type lease. For sale and leaseback transactions, the Company applies the requirements of ASC 606 Revenue from Contracts with Customers to determine whether the transfer of the asset should be accounted for as a sale and applies ASC 842 Leases when accounting for the sale and leaseback transactions. If the transfer of the asset is a sale, the Company derecognizes the underlying asset and recognizes the gain on sale of property, plant and equipment. Revenues are comprised of:

Service revenue, including the following:
i.Revenue from commissions earned when the Company sells consigned assets at live and online bidding auctions or online marketplaces, and from private brokerage services where the Company acts as an agent for consignors of assets; and
ii.Revenue from buyer fees earned on the purchase of consigned assets or inventory at live and online bidding auctions or online marketplaces, and from private brokerage services, which are typically based on a tiered structure that increases with the sales price of the assets; and
iii.Revenue from marketplace services fees earned from auction related activities, such as document, listing and title search services, and from additional marketplaces services provided to customers, such as buyer towing, refurbishment, logistical and electronic title and liens processing, financing, appraisals, subscriptions for data, parts and software services, and other ancillary and transactional service fees.

Inventory sales revenue which consists of revenue relating to assets that are purchased by the Company and then resold through either our live and online bidding auctions, online marketplaces, or our private brokerage services.

The Company recognizes revenue when control of the promised goods or services is transferred to our customers, or upon completion of the performance obligation, in an amount that reflects the consideration we expect to be entitled to in exchange for those goods or services. A performance obligation is a leasepromise in a contract to transfer a distinct good or service, or a series of distinct goods or services, to the customer. A contract’s transaction price is allocated to each distinct performance obligation arising fromand recognized as revenue when, or as, the leasebackperformance obligation is satisfied. The transaction price is reduced by estimates of variable consideration such as volume rebates and discounts. All estimates, which are evaluated at each reporting period, are based on the Company’s historical experience, anticipated volumes, and best judgment. For auctions, revenue is recognized when the auction sale is complete, and the corresponding ROU asset. Ifperformance obligation is satisfied at the end of the auction process. Revenue is measured at the fair value of the consideration received or receivable and is shown net of value-added tax and duties.

Ritchie Bros.

8

Table of Contents

2.    Significant Accounting Policies (continued)

(b) New Accounting Standards and Accounting Policies (continued)

Revenue (continued)

The Company offers consignors several contract options:

Straight commission contracts, where the consignor receives the gross proceeds from the sale less a pre-negotiated commission rate;
Fixed fee commission contracts, where the consignor receives the gross proceeds from the sale less a fixed flat fee;
Guarantee contracts, where the consignor receives a guaranteed minimum amount plus an additional amount if proceeds exceed a specified level; and
Inventory contracts, where we purchase, take custody, and hold used equipment and other assets before they are resold in the ordinary course of business.

Service Revenue

The Company’s commissions are earned as a pre-negotiated fixed percentage rate of the gross selling price or as a fixed fee. Commissions are calculated as a percentage of the winning bid price of the property sold at auction or are fixed in value. Fixed fees are earned in auction contracts for sellers relating to the sale of vehicles and includes the remarketing of vehicles, including the inbound tow, processing, storage, titling, enhancing and sale at auction. Related costs are deferred and recognized at the time of sale. Other commissions from sales at the Company’s auctions are earned from underwritten commission contracts when the Company typically guarantees a certain level of proceeds to a consignor.

The Company accepts assets on consignment and stimulates buyer interest through professional marketing techniques by matching sellers (also known as consignors) to buyers through the auction or private sale process. Prior to offering an item for sale on its online marketplaces, the Company also performs inspections.

Buyer fees are calculated based on a tiered structure that increases with the sales price of the item sold.

Marketplace services fees earned in the process of conducting the Company’s auctions include administrative, documentation, and advertising fees as well as fees charged to sellers for listing and inspecting equipment. The Company also offers other services to customers such as transportation and logistics, storage, vehicle condition reporting, parts, data, inspections, appraisals, financing, and other ancillary services such as refurbishment, repairs, paint, make ready, towing, listings, and title and liens processing. Marketplace services fees also includes fixed registration fees from buyers of vehicles to access the auctions for a one- or two-year term in addition to the buyer fees paid upon the purchase of a vehicle.

With the final acceptance of the winning bid, the highest bidder becomes legally obligated to pay the full purchase price, which is the winning bid of the property purchased and the seller is legally obligated to relinquish the property in exchange for the winning bid less any seller’s commissions. Commission and fee revenue are recognized on the date of the auction sale upon the final acceptance of the winning bid. Registration fees to access certain vehicle auctions for a one- or two-year term are recognized ratably over the contract term.

Under the standard terms and conditions of its auction sales, except for contracts for the sale of an asset doesvehicles, the Company is not equalobligated to pay a consignor for property that has not been paid for by the fair valuebuyer, provided the property has not been released to the buyer. Under the standard terms and conditions of its vehicle auction sales, the Company in certain arrangements may have to pay a consignor for property that has not been paid for by the buyer. If the buyer defaults on its payment obligation, also referred to as a collapsed sale, the sale is cancelled in the period in which the determination is made, and the property is returned to the consignor or placed in a later event-based or online auction. The Company recognizes a provision for expected collapsed or cancelled sales, which is the Company’s best estimate of the asset, or ifservice revenues relating to transactions which may not complete and where the payments forbuyer may default on its obligation. The Company determines the lease are not at market rates, the Company will make adjustments to measure the sale proceeds at fair value. Any below-market terms are accounted for as a prepayment of lease paymentsprovision based on historical collapse experience, customer data and any above- market terms are accounted for as additional financing provided by the buyer-lessor. If the transaction does not qualify for salereasonable and leaseback accounting treatment, and controlsupportable forecasts of the asset has not transferred, then the asset is not derecognized,outcome of such transactions.

Ritchie Bros.

9

Table of Contents

2.    Significant Accounting Policies (continued)

(b) New Accounting Standards and no gain or loss is recorded as the transaction is accounted for as a financing transaction.Accounting Policies (continued)

New and amended accounting standards

In October 2021, the FASB issued ASU 2021-08, Business Combinations (Topic 805): Accounting for Contract Assets and Contract Liabilities from Contracts with Customers. The update primarily addresses the accounting for contract assets and contract liabilities from revenue contracts with customers acquired in a business combination. The update requires that an acquirer recognize and measure contract assets and contract liabilities acquired in a business combination in accordance with ASC 606 - Service Revenue from Contracts with Customers, whereas prior to the adoption of the update, contract assets acquired and contract liabilities assumed in a business combination were recognized at fair value on the acquisition date. The amendments in this update are effective for fiscal years beginning after December 15, 2022, including interim periods within those fiscal years. Early adoption of the amendments is permitted, including adoption in an interim period. An entity that early adopts in an interim period should apply the amendments (1) retrospectively to all business combinations for which the acquisition date occurs on or after the beginning of the fiscal year that includes the interim period of early application and (2) prospectively to all business combinations that occur on or after the date of initial application. The Company has early adopted the update as of October 1, 2021 and therefore has applied the amendments to all acquisitions completed since January 1, 2021, which includes only the acquisition of SmartEquip, which was completed on November 2, 2021.(continued)

Commission revenue is recorded net of commissions owed to third parties, which are principally the result of situations when the commission is shared with a consignor in an auction guarantee risk and reward sharing arrangement.

Underwritten commission contracts can take the form of guarantee contracts. Guarantee contracts typically include a pre-negotiated percentage of the guaranteed gross proceeds plus a percentage of proceeds in excess of the guaranteed amount. If actual auction proceeds are less than the guaranteed amount, commission is reduced; if proceeds are sufficiently lower, the Company can incur a loss on the sale. Losses, if any, resulting from guarantee contracts are recorded in the period in which the relevant auction is completed. If a loss relating to a guarantee contract held at the period end to be sold after the period end is known or is probable and estimable at the financial statement reporting date, the loss is accrued in the financial statements for that period. The Company’s exposure from these guarantee contracts fluctuates over time.

Marketplace services fees are recognized in the period in which the service is provided or the product is delivered to the customer.

Inventory Sales Revenue

Underwritten commission contracts can take the form of inventory contracts. Revenue related to inventory contracts is recognized in the period in which the sale is completed, title to the property passes to the buyer and the Company has fulfilled any other obligations that may be relevant to the transaction. In its role as auctioneer, the Company auctions its inventory to buyers through the auction process. Following the sale of the item, the Company invoices the buyer for the purchase price of the asset, taxes, and, if applicable, the buyer transaction fee, and collects payment from the buyer.

With the final acceptance of the winning bid, the highest bidder becomes legally obligated to pay the full purchase price, which is the winning bid of the property purchased. Title to the property is transferred in exchange for the winning bid price, and if applicable, the buyer transaction fee plus applicable taxes. In a private treaty transaction where inventory is sold in a private process or inventory contracts are sold on our online marketplaces, commission and fee revenue is recognized on the date the buyer has obtained control of the asset.

Ritchie Bros.

10

Table of Contents

2.    Significant Accounting Policies (continued)

(b) New Accounting Standards and Accounting Policies (continued)

Costs of Services

Costs of services incurred in earning revenue are comprised of expenses incurred in direct relation to conducting auctions (“direct expenses”), earning online marketplace revenue, and earning marketplace services fee revenue. Direct expenses include direct labor, buildings and facilities charges, subcontract services such as towing, service contract claims, and travel, advertising and promotion costs and fees paid to unrelated third parties who introduce the Company to equipment sellers who sell property at the Company's auctions and marketplaces. Direct expenses at auction yards which conduct regular weekly events include cost of full-time employees, part time labour, lease expense and maintenance. Costs of services to operate our online marketplace revenue excludes hosting costs where we leverage a shared infrastructure that supports both our internal technology requirements and external sales to our customers.

Costs of services incurred to earn online marketplace revenue in addition to the costs listed above also include inspection costs. Costs of earning online marketplace revenue also include costs for the Company’s customer support, online marketplace operations, logistics, and title and lien investigation functions.

Costs of services incurred in earning marketplace services revenue include ancillary and logistical service expenses, direct labor (including commissions on sales), cloud infrastructure and hosting costs, software maintenance fees, and materials. Costs of services exclude depreciation and amortization expenses.

Cost of Inventory Sold

Cost of inventory sold includes the purchase price of assets sold for the Company’s own account and is determined using a specific identification basis. Inventories are stated at the lower of cost or estimated realizable value. Cost includes the Company’s cost of acquiring ownership of the vehicle.

Trade and Other Receivables

Trade receivables principally include amounts due from customers as a result of live onsite and online auctions and online marketplace transactions and services. The recorded amount reflects the purchase price of the item sold, including the Company’s commission. The amounts due with respect to any consigned sales are generally deducted from the sales proceeds upon the eventual auction or other disposition of the asset. For vehicle sales, advance charges paid on a seller’s behalf are also included in trade receivables.

The allowance for credit losses is the Company’s best estimate of the amount of probable credit losses in existing accounts receivable. The Company determines the allowance based on historical write-off experience, customer economic data and reasonable and supportable forecasts of future economic conditions. The Company regularly reviews the allowance for credit losses and past due balances for collectability. Account balances are charged against the allowance when the Company believes that the receivable will not be recovered.

Self-insurance Reserves

The Company self-insures a portion of employee medical benefits, as well as a portion of its automobile, general liability and workers’ compensation claims. The Company has insurance coverage that limits the exposure on individual claims. The cost of the insurance is expensed over the contract periods. Utilizing historical claims experience, the Company records an accrual for the claims related to its employee medical benefits, automobile, general liability and workers’ compensation claims based upon the expected amount of all such claims, which includes the cost of claims that have been incurred but not reported.

Ritchie Bros.

11

Table of Contents

3.    Significant judgments, estimatesJudgments, Estimates and assumptionsAssumptions

The preparation of financial statements in conformity with US GAAP requires management to make judgments, estimates and assumptions that affect the reported amounts of assets and liabilities and the disclosure of contingent liabilities at the date of the financial statements, and the reported amounts of revenues and expenses during the reporting period.

Future differences arising between actual results and the judgments, estimates and assumptions made by the Company at the reporting date, or future changes to estimates and assumptions, could necessitate adjustments to the underlying reported amounts of assets, liabilities, revenues and expenses in future reporting periods.

Judgments, estimates and underlying assumptions are evaluated on an ongoing basis by management and are based on historical experience and other factors, including expectations of future events that are believed to be reasonable under the circumstances. However, existing circumstances and assumptions about future developments may change due to market changes or circumstances and such changes are reflected in the assumptions when they occur.

Significant items subject to estimates and judgments during the sixthree months ended June 30, 2022 were made in accountingMarch 31, 2023 related to the preliminary purchase price allocations for the completed saleacquisitions of IAA and leaseback transaction of our Bolton property (Note 15 & Note 21). The Company determinedVeriTread and the following estimates in calculating the gain on sale: the present value of market rental paymentsvaluation of the Bolton property sold,redeemable non-controlling interest recognized in connection with the expected lease term inacquisition of VeriTread.

Given the leaseback arrangement and the Company’s incremental borrowing rate based on information available at the commencement date of the lease.acquisition in relation to the reporting date, the fair value estimates of assets acquired and liabilities assumed is pending the completion of various items, including obtaining further information regarding the identification and valuation of all assets acquired and liabilities assumed.

Accounting for business combinations requires estimates with respect to the fair value of the assets acquired and liabilities assumed. Such estimates of fair value require valuation methods which rely on significant estimates and assumptions. In connection with the acquisitions of IAA and VeriTread, the valuation of intangible assets required significant estimates and assumptions and included estimates regarding future cash flows, growth rates, attrition rates, royalty rates, obsolescence rates, discount rates, terminal value and forecasted period assumptions, as applicable. The Company based these estimates on historical and anticipated results, industry trends, economic analysis, and various other assumptions that it believes are reasonable, including assumptions as to the occurrence of future events. In addition, in connection with the acquisition of IAA, the valuation of property, plant, and equipment required significant estimates and assumptions, including estimates regarding market value. Preliminary estimates were based on valuation market, income and cost approaches, as applicable.

In connection with the acquisition of VeriTread, management applied judgement and assessed that it is probable that the redeemable non-controlling interest will be redeemed at a future date. At the end of each reporting period, if redemption of the redeemable non-controlling interest continues to be probable, then the carrying value of the redeemable non-controlling interest is adjusted to its estimated redemption value as one of the allowable methods under the applicable accounting standards. The valuation of the redemption value at acquisition, and at each reporting period, requires management to assess whether VeriTread and the Company will be able to successfully achieve certain integration milestones and performance targets over a three-year period. The valuation of the estimated redemption value also includes estimates such as future cash flows, growth rates and discount rates, among others.

4.    Seasonality

The Company’s operations are both seasonal and event driven and can fluctuate from quarter to quarter. The volume of assets sold through our auctions and marketplaces is driven by the supply of assets available for sale as well as changes in severe weather conditions. During the third quarter, supply of assets is generally low as commercial and transportation equipment is actively being used and mild weather conditions and decreases in traffic volume can contribute to a decline in available supply of vehicles.  

Ritchie Bros.

812

Table of Contents

4.    Seasonality

The Company’s operations are both seasonal and event driven. Revenue tends to be the highest during the second and fourth calendar quarters as the Company generally conducts more auctions during these quarters. Volumes tend to also be lower during the third quarter, as supply of used equipment is lower as it is actively being used and not available for sale. Late December through mid-February and mid-July through August are traditionally less active periods.5.   Business Combinations

(a)IAA Acquisition

On March 20, 2023, the Company completed its acquisition of IAA for a total purchase price of $6.6 billion. The Company acquired IAA to create a leading omnichannel marketplace for vehicle buyers and sellers.

On November 7, 2022, the Company had entered into an Agreement and Plan of Merger and Reorganization, which was subsequently amended on January 22, 2023 (the “Merger Agreement”). Pursuant to the terms of the Merger Agreement, IAA stockholders received $12.80 per share in cash and 0.5252 shares of the Company for each share of IAA common stock they owned (the “Exchange Ratio”). As such, the Company paid $1.7 billion in cash consideration and issued 70.3 million shares of its common stock. In addition, the Company repaid $1.2 billion of IAA’s net debt, which included all outstanding borrowings and unpaid fees under IAA’s credit agreement and $500.0 million principal amount of IAA senior notes, at a redemption price equal to 102.75% of the principal amount plus accrued and unpaid interest.

IAA’s outstanding equity awards were also cancelled and exchanged into equivalent outstanding equity awards relating to the Company’s common stock, based on the equity award exchange ratio of 0.763139.

The purchase price was determined as follows:

Cash consideration

$

1,714.2

Fair value of common shares issued

3,713.0

Fair value of exchanged IAA equity awards attributable to pre-combination service

13.1

Reimbursement of sell-side acquisition costs

48.8

Repayment of IAA net debt

1,157.1

Total fair value of consideration transferred

$

6,646.2

The acquisition was accounted for in accordance with ASC 805, Business Combinations. The identifiable assets acquired and liabilities assumed were recorded at their estimated preliminary acquisition date fair values. The excess purchase price over the fair values of identifiable assets and liabilities is recorded as goodwill. The following table summarizes the preliminary allocation of the purchase price to the fair value of assets acquired and liabilities assumed.

Ritchie Bros.

13

Table of Contents

5.   Business combinationsCombinations (continued)

(a)SmartEquip acquisitionIAA Acquisition (continued)

IAA Preliminary Purchase Price Allocation


Purchase price

$

6,646.2

Assets acquired:


Cash and cash equivalents

161.0

Trade and other receivables


498.7

Prepaid consigned vehicle charges

8.7

Inventory

57.6

Other current assets

31.1

Property, plant and equipment


655.7

Operating lease right-of-use assets

1,252.5

Other non-current assets


34.8

Intangible assets


2,340.0


Liabilities assumed:


Auction proceeds payable

60.7

Trade and other liabilities


250.4

Current operating lease liability

78.0

Long-term operating lease liability

1,166.0

Other non-current liabilities

23.4

Deferred tax liabilities


604.2

Fair value of identifiable net assets acquired


2,857.4

Goodwill acquired on acquisition

$

3,788.8

The following table summarizes the preliminary fair values of the identifiable intangible assets acquired:

Preliminary fair value

Weighted average

Asset

at acquisition

amortization period

Customer relationships

$

2,030.0

9 years

Developed technology

150.0

6 years

Trade names and trademarks

160.0

6 years

Total

$

2,340.0

8.6 years

The purchase price has been preliminarily allocated to the assets acquired and liabilities assumed based on their estimated fair values as of the acquisition date. Given the date of the acquisition in relation to the reporting date, the fair value estimates of assets acquired and liabilities assumed is pending the completion of various items, including obtaining further information regarding the identification and valuation of all assets acquired and liabilities assumed.

Certain of the more significant balances that are not yet finalized include the valuation of property, plant and equipment, intangible assets (including goodwill), operating lease right-of-use assets and related lease liabilities, and related income tax considerations. Accordingly, management considers the balances above to be preliminary, and there could be adjustments to the consolidated financial statements in subsequent periods, including changes to depreciation and amortization expense related to the property, plant, and equipment and intangible assets acquired and their respective useful lives, among other adjustments. In addition, management has not completed the allocation of goodwill acquired to its reporting units.

The final determination of the fair values of the assets acquired and liabilities assumed will be completed within the measurement period of up to one year from the acquisition date.

Ritchie Bros.

14

Table of Contents

5.   Business Combinations (continued)

(a)IAA Acquisition (continued)

Goodwill

Goodwill recognized includes synergies expected to be achieved from the operations of the combined company, the assembled workforce of IAA and intangible assets that do not qualify for separate recognition. Expected synergies include both increased revenue opportunities and the cost savings from the planned integration of platform infrastructure, facilities, personnel, and systems. The transaction is considered a non-taxable business combination and the goodwill is not deductible for tax purposes.

Contributed Revenue and Net Income

The results of IAA’s operations are included in these consolidated financial statements from the date of acquisition. From the date of acquisition, the amount of IAA revenue and net income included in the consolidated income statement for the period from March 20, 2023 to March 31, 2023 was $80.0 and $2.9 million, respectively.

The following table includes unaudited pro forma financial information that presents the combined results of operations as if the IAA acquisition, the acquisition debt financing, and certain other related transactions had occurred on January 1, 2022, the beginning of the comparable annual period.

The unaudited pro forma information includes adjustments to amortization for intangible assets acquired, adjustments to interest expense for the additional indebtedness incurred to complete the acquisition, and transaction costs. The unaudited pro forma financial information for the three months ended March 31, 2022 also includes one-time acquisition-related expenses of $201.2 million, of which $50.5 million were IAA pre-acquisition transaction costs. The pro forma results do not include any anticipated synergies or other expected benefits of the acquisition.


Three months ended


Three months ended


March 31, 2023


March 31, 2022

Revenue

988.0

950.7

Net income

91.4

6.4

The unaudited pro forma information presented is for informational purposes only and is not necessarily indicative of our consolidated results of operations of the combined business had the acquisition actually occurred on January 1, 2022, nor of the results of our future operations of the combined business. The pro forma results are based on the preliminary purchase price allocation and will be updated to reflect the final amounts as the allocation is finalized during the measurement period.

Ritchie Bros.

15

Table of Contents

5.   Business Combinations (continued)

(b)VeriTread Acquisition

On November 2, 2021,January 3, 2023, the Company acquired all8,889,766 units of VeriTread, for $25.2 million cash consideration from its existing unitholders and acquired another 1,056,338 units through an investment of $3.0 million cash. As a result, the Company increased its investment in VeriTread to 75% and obtained control of VeriTread pursuant to an amended operating agreement on January 18, 2023. Immediately prior to the acquisition, the Company owned 11% of VeriTread, with an acquisition date fair value of $4.3 million based on the per unit purchase price, and therefore, upon remeasurements of its previously held interest, the Company recorded a gain of $1.4 million in other income, net at acquisition. VeriTread is a transportation technology company that provides an online marketplace solution for open deck transport, connecting shippers and service providers.

Concurrently, the Company entered into a put/call agreement with one of the issued and outstanding common sharesminority unitholders of SmartEquipVeriTread for a total cash purchase priceits remaining units, another 21% ownership interest. Pursuant to this agreement, the minority unitholder has rights, in certain circumstances, to put or sell its remaining units of $173,743,000. During the first quarter of 2022,VeriTread to the Company, finalizedsubject to VeriTread achieving certain performance targets at a pre-determined value or fair value, depending on the net working capital adjustment undertiming and targets achieved. The Company also has the right to call or purchase agreement and increased the purchase price by $63,000, resulting in a total purchase price of $173,806,000.

SmartEquip is an innovative technology platform that supports customers' managementremaining units of the equipment lifecycleminority unitholder upon achievement of certain integration milestones at fair value. The redeemable non-controlling interest is classified in temporary equity on the consolidated balance sheet, as the minority unitholder of VeriTread can put the remaining units to the Company for cash upon the achievement of certain performance targets, which is not within the control of the Company and integrates parts procurement with both original equipment manufacturers and dealers.is considered probable. An additional non-controlling interest of 4% held in VeriTread is classified within equity as that interest does not contain put/call options.

The acquisition was accounted for in accordance with ASC 805, Business Combinations. The following table summarizes the preliminary allocation of the purchase price to the fair value of assets acquired and liabilities assumed.

SmartEquip purchase price allocationVeriTread Preliminary Purchase Price Allocation

Purchase price

$

173,806


Assets acquired:


Cash and cash equivalents

$

2,039

Trade and other receivables


2,926

Other current assets

486

Property, plant and equipment


120

Other non-current assets


75

Deferred tax assets


8,932

Intangible assets


71,700


Liabilities assumed:


Trade and other liabilities


1,239

Deferred revenue

3,565

Other non-current liabilities

119

Deferred tax liabilities


18,192

Fair value of identifiable net assets acquired


63,163

Goodwill acquired on acquisition

$

110,643

The deferred tax assets are presented net of a $1,486,000 valuation allowance. 

Total cash consideration paid

$

28.1

Fair value of previously held interest

4.3

Purchase price

$

32.4


Assets acquired:


Cash and cash equivalents

3.4

Trade and other receivables, and other current assets


0.9

Intangible assets


14.7


Liabilities assumed:


Trade and other liabilities


1.1

Fair value of identifiable net assets acquired


17.9

Redeemable non-controlling interest

(8.9)

Non-controlling interest

(1.8)

Goodwill acquired on acquisition

$

25.2

The following table summarizes the preliminary fair values of the identifiable intangible assets acquired:

Fair value

Weighted average

Preliminary fair value

Weighted average

Asset

at acquisition

amortization period

at acquisition

amortization period

Customer relationships

$

50,700

4 - 15 years

$

7.2

5 years

Software and technology assets

18,900

7 years

7.1

7 years

Trade names and trademarks

1,000

3 years

0.4

2 years

Backlog

1,100

2 years

Total

$

71,700

11.3 years

$

14.7

5.9 years

Ritchie Bros.

916

Table of Contents

5.   Business combinationsCombinations (continued)

SmartEquip purchase price allocation (continued)

(b)VeriTread Acquisition (continued)

The amounts included in the SmartEquip provisionalVeriTread’s preliminary purchase price allocation are preliminary in nature and are subject to adjustment as additional information is obtained about the facts and circumstances that existed at the date of the acquisition. The final determination of the fair values of certain assets and liabilities will be completed within the measurement period of up to one year from the acquisition date. The purchase price will be finalized upon the determination of closing working capital and valuation of the intangible assets acquired. Adjustments to the preliminary values during the measurement period may impact the amounts recorded as assets and liabilities with a corresponding adjustment to goodwill and will be recognized in the period in which the adjustments are determined.

The results of VeriTread’s operations are included in these consolidated financial statements from the date of acquisition. Pro forma results have not been presented as such financial information would not be significantly different from historical results.

Goodwill

Goodwill has been assigned and allocated to “Other” for segmented information purposes and is based on an analysis of the fair value of net assets acquired. Goodwill relates to benefits expected from the acquisition of SmartEquip’sVeriTread’s business, its assembled workforce and associated technical expertise, as well as anticipated synergies from applying VeriTread’s transportation platform, network of transport carriers, equipment database and services to the Company’s auction expertisecustomer base. This acquisition is expected to accelerate the Company’s marketplace strategy, which brings services, insights, and transactional capabilitiestransaction solutions together to SmartEquip’s existingimprove the overall customer base.experience. The transaction is considered a non-taxable business combination and the goodwill is not deductible for tax purposes.

Transactions recognized separately from the acquisition of assets and assumptions of liabilities

At the date of acquisition, the Company issued 63,971 common shares to certain previous shareholders of SmartEquip in return for their continuing employment service. The common shares are expected to vest one third on each anniversary date of the acquisition over a three-year period as continuing employment services are provided to the Company. At the date of acquisition, the Company estimated that it will recognize a total fair value of $4,375,000 share-based continuing employment costs in acquisition-related costs over the vesting period, with an increase to additional paid-in capital, subject to continuing employment of those individuals. As and when the common shares vest, the Company will recognize the fair value of the issued common shares from additional paid-in capital to share capital (Note 19).

During the quarter ended June 30, 2022, the Company recorded $668,000 of acquisition-related costs, all of which related to share-based continuing employment costs.

(b)(c)Terminated Euro Auctions acquisitionAcquisition

On August 9, 2021, the Company entered into a Sale and Purchase Agreement (“SPA”) pursuant to which it agreed to purchase Euro Auctions Limited, William Keys & Sons Holdings Limited, Equipment & Plant Services Ltd, and Equipment Sales Ltd. (collectively, “Euro Auctions”), each being a private limited company incorporated in Northern Ireland (the “Euro Auctions Acquisition”).

Under the terms of the SPA, the Company was to acquire all of the outstanding shares of Euro Auctions from their existing shareholders for approximately £775,000,000£775.0 million (approximately $1.02 billion) cash consideration, to be paid on closing. On April 29, 2022, the Company made a decision to discontinue the Phase 2 review by the United Kingdom’s Competition and Markets Authority (“CMA”). The SPA automatically terminated on June 28, 2022. In addition, in April 2022, the Company terminated, without cost, its deal contingent forward currency contracts (Note 13) and on May 4, 2022, redeemed all of the 2021 Notes (Note 17)18) at a redemption price equal to 100% of the original offering price of the notes, plus accrued and unpaid interest..interest.

6.    Segment Information

The Company’s principal business activity is the management and disposition of used industrial equipment, vehicles and other durable assets. Effective as of the first quarter of 2023, the Company’s operations are comprised of one reportable segment following the acquisition of IAA on March 20, 2023. During the first quarter of 2023, senior management of the Company reassessed the organizational reporting structure of the Company and how to manage the combined business. As a result, the Company now operates in one operating and reportable segment to reflect the way the Chief Operating Decision Maker (“CODM”) reviews and assesses performance of the business and allocates resources. The long-term strategy for the Company is to sell Gross Transaction Value (“GTV”) while offering integrated marketplace services. The CODM does not evaluate the performance of the Company or assess allocation of resources at any level below the consolidated level or based on assets and liabilities.

The Company’s geographic breakdown of total revenue and location is as follows:

United 

Total revenue for the three months ended:


States


Canada


Australia


Europe


Other


Consolidated

March 31, 2023


$

360.1


$

68.3


$

19.1


$

50.7


$

14.2


$

512.4

March 31, 2022

248.0


65.2

29.1


37.8


13.8


393.9

Ritchie Bros.

1017

Table of Contents

7.    Revenue

The Company’s revenue from the rendering of services and the sale of inventory is as follows:

Three months ended


March 31, 


2023

2022

Commissions

$

130.6

$

116.4

Buyer fees


140.7


75.6

Marketplace services revenue

72.3

52.9

Total service revenue

343.6

244.9


Inventory sales revenue


168.8


149.0

Total revenue

$

512.4

$

393.9

Commissions are earned from consignors on the sale of consigned assets at auctions and online marketplaces, and private brokerage services. Buyer fees are fees earned from the purchase of consigned assets or from the sale of inventory at auctions and online marketplaces, and from private brokerage services. Marketplace services revenue includes fees earned from services provided to customers in marketplaces such as refurbishing, parts, data, transportation and logistics, inspection, appraisal, listings, financing and title and liens processing, as well as other auction-related fees.

6.    Segmented information8.    Operating Expenses

The Company’s principal business activity is the management and disposition of used industrial equipment and other durable assets. The Company’s operations are comprised of 1 reportable segment and other business activities that are not reportable as follows:

Auctions and Marketplaces – This is the Company’s only reportable segment, which consists of the Company’s live onsite auctions, its online auctions and marketplaces, and its brokerage service;
Other includes the results of Ritchie Bros. Financial Services (“RBFS”), Rouse, Mascus online services, SmartEquip, and the results from various value-added services and make-ready activities, including the Company’s equipment refurbishment services, and Ritchie Bros. Logistical Services (“RB Logistics”).

Three months ended June 30, 2022

Six months ended June 30, 2022


A&M


Other


Consolidated


A&M


Other


Consolidated

Service revenue:

Commissions

$

136,403

$

$

136,403

$

252,778

$

$

252,778

Fees

98,588

51,511

150,099

183,217

95,368

278,585

Total service revenue

234,991

51,511

286,502

435,995

95,368

531,363

Inventory sales revenue


198,044


198,044


347,104


347,104

Total revenue

$

433,035

$

51,511

$

484,546

$

783,099

$

95,368

$

878,467

Costs of services


28,985


16,054


45,039


54,559


29,495


84,054

Cost of inventory sold


176,171


176,171


307,753


307,753

Selling, general and administrative


125,535


18,742


144,277


234,346


36,537


270,883

Segment profit

$

102,344

$

16,715

$

119,059

$

186,441

$

29,336

$

215,777

Acquisition-related costs


3,399


13,036

Depreciation and amortization


24,298


48,523

Foreign exchange gain


(158)


(322)

Total operating expenses

$

393,026

723,927

Gain on disposition of property, plant and equipment


347


170,167

Operating income


$

91,867


$

324,707

Interest expense


(18,463)


(39,149)

Change in fair value of derivatives

1,263

Other income, net


1,639


2,559

Income tax expense


(21,632)


(57,868)

Net income


$

53,411


$

231,512

Acquisition-related and Integration Costs

Three months ended June 30, 2021

Six months ended June 30, 2021


A&M


Other


Consolidated


A&M


Other


Consolidated

Service revenue:

Commissions

$

129,334

$

$

129,334

$

233,309

$

$

233,309

Fees

83,334

40,080

123,414

151,430

74,039

225,469

Total service revenue

212,668

40,080

252,748

384,739

74,039

458,778

Inventory sales revenue


143,613


143,613


269,138


269,138

Total revenue

$

356,281

$

40,080

$

396,361

$

653,877

$

74,039

$

727,916

Costs of services


25,176


16,125


41,301


49,480


29,687


79,167

Cost of inventory sold


131,023


131,023


241,770


241,770

Selling, general and administrative


99,215


10,345


109,560


201,996


21,803


223,799

Segment profit

$

100,867

$

13,610

$

114,477

$

160,631

$

22,549

$

183,180

Acquisition-related costs


3,049


5,971

Depreciation and amortization


21,935


43,005

Foreign exchange loss


151


428

Total operating expenses

$

307,019

594,140

Gain on disposition of property, plant and equipment


175


243

Operating income


$

89,517


$

134,019

Interest expense


(8,867)


(17,813)

Other income, net


1,196


2,198

Income tax expense


(21,065)


(29,484)

Net income


$

60,781


$

88,920

Ritchie Bros.

11

TableAcquisition-related and integration costs consist of Contents

6.    Segmented information (continued)operating expenses incurred in connection with business combinations, such as due diligence, advisory, legal, integration, severance, acceleration of share-based payments expense and share-based continuing employment costs.

The Chief Operating Decision Maker does not evaluate the performancefollowing is a summary of the Company’s operating segments or assess allocation of resources based on segment assetsour acquisition-related and liabilities, nor does the Company classify liabilities on a segmented basis.integration costs:

Three months ended

March 31, 


2023


2022

IAA

Financing

$

30.0

$

Severance

14.0

Integration

5.1

Acceleration of share-based payments expense

5.0

Legal

9.5

Investment banking, consulting and other acquisition-related costs

61.6

125.2

SmartEquip

0.3

1.2

Euro Auctions

6.6

Rouse

0.5

1.8

VeriTread

0.2

Total acquisition-related and integration costs

$

126.2

$

9.6

The Company’s geographic breakdown of total revenue

Depreciation and location is as follows:Amortization

United 


Total revenue for the three months ended:

States

Canada

Australia

Europe

Other

Consolidated

June 30, 2022

$

215,466

$

143,466

$

71,734

$

36,989

$

16,891

$

484,546

June 30, 2021

183,391


98,690

44,514


55,467


14,299


396,361

Total revenue for the six months ended:


June 30, 2022

$

463,416

$

208,699

$

100,809

$

74,809

$

30,734

$

878,467

June 30, 2021

390,805


147,168

64,077


102,643


23,223


727,916

7.    Revenue

The Company’s revenue from the rendering of services is as follows:

Three months ended

Six months ended

Three months ended


June 30, 

June 30, 

March 31, 


2022

2021

2022

2021


2023


2022

Service revenue:


Commissions

$

136,403

$

129,334

$

252,778

$

233,309

Fees


150,099


123,414


278,585


225,469

Depreciation

$

11.5

$

7.7

Amortization


24.7


16.5


286,502


252,748


531,363


458,778

$

36.2

$

24.2

Inventory sales revenue


198,044


143,613


347,104


269,138

$

484,546

$

396,361

$

878,467

$

727,916

Ritchie Bros.

1218

Table of Contents

8.    Operating expenses

Costs of services

Three months ended

Six months ended

June 30, 

June 30, 


2022


2021


2022


2021

Employee compensation expenses

$

17,045

$

14,953

$

32,966

$

29,483

Ancillary and logistical service expenses

13,446


14,819

24,201


27,088

Travel, advertising and promotion expenses

7,200


5,299

12,372


9,817

Other costs of services

4,323


3,926

7,636


7,774

Buildings, facilities and technology expenses

3,025


2,304

6,879


5,005

$

45,039

$

41,301

$

84,054

$

79,167

Selling, general and administrative

Three months ended

Six months ended

June 30, 


June 30, 


2022


2021


2022


2021

Wages, salaries and benefits

$

84,301

$

67,932

$

161,787

$

144,889

Share-based compensation expense

13,640

7,540

19,026

11,318

Buildings, facilities and technology expenses


23,327


17,479


43,412


34,822

Travel, advertising and promotion expenses


9,392


6,824


17,366


11,986

Professional fees


7,616


5,202


17,363


10,234

Other selling, general and administrative


6,001


4,583


11,929


10,550

$

144,277


$

109,560

$

270,883

$

223,799

Acquisition-related costs

Three months ended

Six months ended

June 30, 

June 30, 


2022


2021


2022


2021

SmartEquip:

Share-based continuing employment costs

$

668

$

$

1,326

$

Other acquisition-related costs

516

Euro Auctions:

Other acquisition-related costs

1,317

8,012

Rouse:

Share-based continuing employment costs

1,414

2,678

2,887

5,231

Other acquisition-related costs

371

295

740

$

3,399

$

3,049

$

13,036


$

5,971

Depreciation and amortization

Three months ended

Six months ended

June 30, 


June 30, 


2022


2021


2022


2021

Depreciation

$

7,889

$

8,345

$

15,636

$

16,182

Amortization


16,409


13,590


32,887


26,823

$

24,298

$

21,935

$

48,523

$

43,005

Ritchie Bros.

13

Table of Contents

9.    Income taxesTaxes

At the end of each interim period, the Company estimates the effective tax rate expected to be applicable for the full fiscal year. The estimate reflects, among other items, management’s best estimate of operating results. It does not include the estimated impact of foreign exchange rates or unusual and/or infrequent items, which may cause significant variations in the customary relationship between income tax expense and income before income taxes.

For the three months ended June 30, 2022,March 31, 2023, income tax expensebenefit was $21,632,000,$9.3 million compared to an income tax expense of $21,065,000$36.2 million for the same period in 2021.2022. The effective tax rate was 29%25% in the secondfirst quarter of 2023, compared to 17% in the first quarter of 2022. A higher tax rate was observed in the first quarter of 2023 compared to the first quarter of 2022 compared to 26% in the second quarter of 2021. The effective tax rate increased in the three months ended June 30, 2022 compared to the three months ended June 30, 2021 primarily due to a higher return to provision adjustmentstax deduction for PSU and higher income taxesRSU share unit expenses that exceeded the related compensation expense, a benefit on the revaluation of opening deferred liabilities and a benefit related to Foreign-Derived Intangible Income that increased our income tax uncertainties.benefit. Partially offsetting this increase wasthese increases were a lowerhigher estimate of non-deductible expenses.

Forexpenses and the six months ended June 30, 2022, income tax expense was $57,868,000, compared to an income tax expensenon-recurrence of $29,484,000 for the same period in 2021. The effective tax rate was 20% for the six months ended June 30, 2022, compared to 25% for the six months ended June 30, 2021. The effective tax rate decreased in the six months ended June 30, 2022 compared to the six months ended June 30, 2021 primarily due to the non-taxable gain portion on the sale of a parcel of land including all buildings in Bolton, Ontario and a decrease in the estimate of non-deductible expenses.

Partially offsetting this decrease was a higher estimate of income taxed in jurisdictions with higher tax rates and a lower tax deduction for performance share units (“PSUs”) and restricted share units (“RSUs”) expenses that exceeded the related compensation expense.2022.

The Canada Revenue Agency (“CRA”) is currentlyhas been conducting an auditaudits of the Company’s 2014, 2015, 2017, 2018 and 20182019 taxation years. Management believes that the Company is in full compliance with Canadian tax laws. However, the CRA could challenge the manner in which the Company has filed its income tax returns and reported its income. In the event thatIf the CRA challenges the manner in which the Company has filed its tax returns and reported its income with respect to any of the audits, the Company will have the option to appeal any such decision. IfWhile the Company believes it is, and has been, in full compliance with Canadian tax laws and expects to vigorously contest any proposed assessments or any notice of assessments or reassessments received from the CRA, the Company is not successful, however,unable to predict the ultimate outcome of these audits and the final disposition of any appeals pertaining to such audits. If the CRA auditmakes an adverse determination and the Company is unsuccessful in appealing such determination reflected in any assessment or reassessment, then the Company could potentially result inincur additional income taxes, penalties, and interest, which could have a material adversenegative effect on its operations. 

On February 13, 2023, the Company.CRA issued a proposal letter to Ritchie Bros. Auctioneers (International) Ltd. asserting that one of its Luxembourg subsidiaries was resident in Canada from 2010 through 2015 and that its worldwide income should be subject to Canadian income taxation. The Luxembourg subsidiary was in operation from 2010 until 2020. In the event that the CRA issues a notice of assessment or reassessment, the Company expects to vigorously contest such notice as the Company disagrees with the assertion regarding Canadian residency. In the event that a court of competent jurisdiction makes a final determination that the income of the Luxembourg subsidiary for 2010 through 2015 was subject to Canadian income tax laws, the Company may ultimately be liable for additional total Canadian federal and provincial income tax of approximately $26.0 million - $30.0 million, exclusive of interest and penalties, for the period specified in the proposal letter. The CRA may also challenge the manner in which the Company has filed its tax returns and reported its income with respect to 2016 to 2020 taxation years and may assert that the income of the Luxembourg subsidiary was subject to Canadian income tax because the Luxembourg subsidiary was also resident in Canada during these years. The Company could then incur additional income taxes, penalties and interest which could have a material negative effect on its operations. 

The Company is expected to initially reply to the CRA’s proposal letter by June 13, 2023; however, the discussions with CRA could take numerous years to be ultimately resolved.

Ritchie Bros.

1419

Table of Contents

10.    Earnings per sharePer Share Attributable to Common Stockholders

Basic EPS attributable to stockholders

Basic earnings per share (“EPS”) attributable tocommon stockholders washas been calculated by dividing the net income attributableavailable to common stockholders by the weighted average (“WA”) number of common shares outstanding during the period. Diluted EPS attributable to common stockholders was calculated by dividing the net income attributableavailable to common stockholders by the weighted averageWA number of shares of common stock outstanding, if the potentially dilutive securities had been issued.

Potentially dilutive securities include unvested PSUs,Performance Share Units (“PSUs”), unvested RSUs,Restricted Share Units (“RSUs”), and outstanding stock options. The dilutive effect of potentially dilutive securities is reflected in diluted EPS by application of the treasury stock method. Under the treasury stock method, an increase in the fair market value of the Company’s common stock can result in a greater dilutive effect from potentially dilutive securities.

Three months ended

Six months ended

June 30, 2022

June 30, 2022

Net income

WA

Per

Net income

WA

Per


attributable to


number


share

attributable to


number


share


stockholders


of shares


amount

stockholders


of shares


amount

Basic

$

53,365


110,760,339

$

0.48

$

231,459


110,705,182

$

2.09

Effect of dilutive securities:


Share units


397,274


423,767


(0.01)

Stock options


547,489


552,695


(0.01)

Diluted

$

53,365


111,705,102

$

0.48

$

231,459


111,681,644

$

2.07

The WA shares outstanding used to calculate basic and diluted EPS attributable to common stockholders were not adjusted for the potential common shares to be issued to settle the cumulative dividend payments and allocated earnings attributable to the Series A Senior Preferred Shares as such amounts are expected to be cash settled at the Company’s election.

Three months ended

Six months ended

Three months ended

June 30, 2021

June 30, 2021

March 31, 

Net income

WA

Per

Net income

WA

Per

2023


2022

Net (loss) income available to common stockholders

$

(34.2)

$

178.1


attributable to


number


share

attributable to


number


share


stockholders


of shares


amount


stockholders


of shares


amount

Basic

$

60,749

110,311,615

$

0.55

$

88,937


110,144,229

$

0.81

Denominator:

Basic weighted average share outstanding

120,487,251

110,647,700

Effect of dilutive securities:


Share units

322,371


450,752


450,259

Stock options

700,198


707,730


(0.01)

557,902

Diluted average shares outstanding

120,487,251

111,655,861

Net (loss) income per share attributable to common shares:

Basic

$

(0.28)

$

1.61

Diluted

$

60,749

111,334,184

$

0.55

$

88,937


111,302,711

$

0.80

$

(0.28)

$

1.60

The following effect of dilutive securities is presented based on the amounts outstanding at period end, which were excluded from the computation of diluted net (loss) per share for the three months ended March 31, 2023 because the impact of including them would have been anti-dilutive.

Three months ended

March 31, 

2023

2022

Share units

631,409

Stock options

541,082

Preferred stock (as converted to common stock)

6,775,252

Total

7,947,743

Ritchie Bros.

1520

Table of Contents

11.    Supplemental cash flow informationCash Flow Information

Net changesChanges in operating assetsOperating Assets and liabilitiesLiabilities

Six months ended June 30,

2022

2021

Three months ended March 31,

2023

2022

Trade and other receivables


$

(152,893)


$

(134,522)


$

(104.3)


$

(142.3)

Prepaid consigned vehicle charges

(14.2)

Inventory

(25,842)

(2,207)

(46.4)

23.2

Advances against auction contracts

(11,238)

(761)

1.0

(5.0)

Prepaid expenses and deposits

20,774

3,157

(6.3)

12.2

Income taxes receivable

6,985

(3,847)

(16.0)

0.4

Auction proceeds payable

205,910

230,309

118.2

242.2

Trade and other liabilities

(22,639)

(20,686)

38.9

(19.2)

Income taxes payable

25,866

(12,723)

(40.8)

19.5

Operating lease obligation

(6,936)

(6,329)

Operating lease obligations

(10.9)

(2.7)

Other

1,857

186

(6.0)

0.4

Net changes in operating assets and liabilities


$

41,844


$

52,577


$

(86.8)


$

128.7

Interest and tax paymentsTax Payments

Six months ended June 30,

2022

2021

Three months ended March 31,

2023

2022

Interest paid, net of interest capitalized


$

20,846


$

16,387


$

20.4


$

19.2

Interest received

1,415

635

6.3

0.5

Net income taxes paid

13,855

43,249

50.9

4.1

Non-cash purchase of property, plant and equipment under finance lease


5,261


4,568


4.9


2.5

Non-cash right of use assets obtained in exchange for new lease obligations


18,472


9,451

Non-cash operating right of use assets obtained in exchange for new lease obligations


1.4


4.7

Cash, cash equivalents, and restricted cash

June 30, 

December 31, 

2022

2021

Cash and cash equivalents


$

367,289

$

326,113

Restricted cash

Current

164,371

102,875

Non-current

933,464

Cash, cash equivalents, and restricted cash


$

531,660

$

1,362,452

12.    Fair value measurementValue Measurement

All assets and liabilities for which fair value is measured or disclosed in the consolidated financial statements are categorized within the fair value hierarchy, described as follows, based on the lowest level input that is significant to the fair value measurement or disclosure:

Level 1: Unadjusted quoted prices in active markets for identical assets or liabilities that the entity can access at measurement date;
Level 2: Inputs other than quoted prices included in Level 1 that are observable for the asset or liability, either directly or indirectly; and
Level 3: Unobservable inputs for the asset or liability.

Ritchie Bros.

1621

Table of Contents

12.    Fair value measurementValue Measurement (continued)

June 30, 2022

December 31, 2021

Carrying

Carrying


Category


amount


Fair value


amount


Fair value

Fair values disclosed:


Cash and cash equivalents


Level 1

$

367,289

$

367,289

$

326,113

$

326,113

Restricted cash


Level 1


164,371


164,371


1,036,339


1,036,339

Loans receivable

Level 2

11,749

11,678

7,267

7,267

Derivative financial assets

Deal contingent forward contract

Level 3

751

751

Forward currency contracts

Level 2

37

37

Derivative financial liabilities

Deal contingent forward contract

Level 3

2,005

2,005

Short-term debt


Level 2


8,637


8,637


6,147


6,147

Long-term debt


Senior unsecured notes (as defined in Note 17)


2016 Notes

Level 1

495,434

489,800

494,531

508,125

2021 USD Notes

Level 2

598,052

625,125

2021 CAD Notes

Level 2

332,337

339,100

Term loan

Level 2

91,989

92,348

92,821

93,226

Long-term revolver loans


Level 2


56,949


57,000


219,699


219,772

March 31, 2023

December 31, 2022

Carrying

Carrying


Category


amount


Fair value


amount


Fair value

Fair values disclosed:


Loans receivable

Level 2

$

23.4

$

23.3

$

23.4

$

23.3

Derivative financial assets

Forward currency contracts

Level 2

0.2

0.2

0.2

0.2

Long-term debt


Senior secured and unsecured notes


2016 Notes

Level 1

496.3

491.9

2023 Secured Notes

Level 1

542.3

565.1

2023 Unsecured Notes

Level 1

788.8

835.5

Term loans

Level 2

1,889.3

1,909.8

85.2

85.5

The carrying value of the Company��s cash and cash equivalents, restricted cash, trade and other receivables, advances against auction contracts, loan receivables maturing within a year, auction proceeds payable, trade and other payables, and short-term debt approximate their fair values due to their short terms to maturity.

The fair value of the loan receivables with a maturity date greater than one year are determined by estimating discounted cash flows using market rates. The carrying values of the term loan and long-term revolver loan,loans, before deduction of deferred debt issueissuance costs, approximate their fair values as the interest rates on the loans is short-term in nature. The fair values of the senior secured and unsecured notes are determined by reference to a quoted market price of the notes traded in an over-the-counter broker market.

The Company holds derivative financial assets and liabilities that are required to be measured at fair value on a recurring basis. The fair values of the deal contingent forward contracts were determined using a probability weighted mark to market valuation and observable Level 2 inputs, including foreign currency spot exchange rates, forward pricing curves, and an unobservable Level 3 input, the expected date of settlement. The change in the valuation of the derivatives due to the range of possible expected settlement dates was not significant to the financial statements. The fair value of the forward currency contracts are determined using observable Level 2 inputs, including foreign currency spot exchange rates and forward pricing curves. The fair value considers the credit risk of the Company and its counterparties.

13. Derivative financial instrumentsFinancial Instruments

The Company’s derivative financial instruments are accounted for as derivatives under ASC 815, Derivatives and Hedging, and are classified in other current assets and other current liabilities. The Company has not applied hedge accounting to these instruments.

The Company enters into forward currency contracts from time to time to manage its exposure to foreign currency exchange rate fluctuations recognized by its subsidiaries on specific monetary loan receivables. During the three and six month periods ended June 30, 2022,first quarter of 2023, a loss of $1,866,000 and $1,296,000 respectively$0.2 million (March 31, 2022: $0.6 million) was recognized for the change in fair values of the forward currency contracts within foreign exchange loss (gain) in the consolidated income statement.

14. Trade and Other Receivables

The Company also held 2 deal contingent foreign exchange forward currency contracts to manage its exposure to foreign currency exchange rate fluctuations againstgenerally has possession of assets or asset titles collateralizing a significant portion of trade receivables.

The following table presents the U.S. and Canadian dollar on £343,000,000 ofactivity in the £775,000,000 purchase considerationallowance for expected credit losses for the proposed Euro Auctions Acquisition. The notional amounts of the derivative instruments were period ended March 31, 2023:

£216,000,000 (U.S. dollar forward) and £127,000,000 (Canadian dollar forward). These forward contracts were terminated by the Company in April 2022 at no cost.

Balance at December 31, 2022


$

3.3

Current period provision


1.5

Write-offs charged against the allowance


(0.7)

Balance at March 31, 2023

$

4.1

March 31, 

December 31,


2023


2022

Advanced charges receivable

$

361.6

$

Trade account receivable

397.4

143.8

Consumption taxes receivable


22.1

31.2

Other receivables

12.0

11.5

Trade and other receivables, gross

793.1

186.5

Less: allowance for credit losses


(4.1)


(3.3)

Trade and other receivables, net

$

789.0

$

183.2

Ritchie Bros.

1722

Table of Contents

14. Trade and other receivables

Trade receivables are generally secured by the equipment that they relate to as it is Company policy that equipment is not released until payment has been collected. The following table presents the activity in the allowance for expected credit losses for the period ended June 30, 2022:

Balance at December 31, 2021

$

(4,396)

Current period provision

(120)

Write-offs charged against the allowance

753

Balance at June 30, 2022

$

(3,763)

15.    Other current assetsCurrent Assets

June 30, 

December 31, 

March 31, 

December 31,


2022


2021


2023


2022

Advances against auction contracts

$

14,783

$

4,102

$

8.0

$

8.9

Assets held for sale


323


17,538


0.3

Prepaid expenses and deposits


21,069


41,955


74.7


38.9

Derivative financial asset

37

751

0.2

0.2

$

36,212

$

64,346

$

82.9

$

48.3

Assets held for sale

Balance at December 31, 2021


$

17,538

Reclassified from (to) property, plant and equipment


(10,148)

Disposal


(7,067)

Balance at June 30, 2022

$

323

On March 17, 2022, the Company completed the sale and leaseback of a parcel of land including all buildings, in Bolton, Ontario, for a total sale consideration of $208,195,000$208.2 million Canadian dollars (approximately $165$165.0 million) net of closing and transaction costs, and recognized a gain on disposition of property, plant and equipment of $169,092,000.$169.1 million as a component of gain on disposition of property, plant and equipment. The net book value of the Bolton property was $7,067,000.$7.1 million. The payments for the lease were not considered to be at market rates given an initial two year rent freetwo-year rent-free period and, accordingly, the Company adjusted the sales proceeds and the gain to fair value. The Bolton property continues to be used for auction operations under the operating leaseback agreement until the completion of the acquisition and development of a replacement property located in Amaranth, Ontario. (Note 21)

As at December 31, 2021,On March 30, 2023, the Company also classified vacant land in Casa Grande, Arizona with a net book value of $10,500,000 as an asset held for sale. During the quarter ended June 30, 2022, the Company assessed that the property no longer met the asset held for sale criteria and therefore reclassified the net book valuecompleted its purchase of the Amaranth property to property, plantfor a total purchase consideration of $23.1 million Canadian dollars (approximately $17.1 million) and equipment.

is proceeding with its development.

16.    Other non-current assetsNon-current Assets

June 30, 

December 31, 


2022


2021

Right-of-use assets

$

134,219

$

114,414

Tax receivable

10,641

10,289

Loans receivable

7,199

Deferred debt issue costs


4,223


5,236

Other


12,078


12,565

$

168,360

$

142,504

The Company recognized a right-of-use asset of $16,587,000 as a result of the sale and leaseback transaction on the Bolton property in March 2022 (Note 15 and 21) and recognized a right-of-use asset of $9,020,000 as a result of a new lease signed on an auction site in Maltby, United Kingdom in June 2022 (Note 21).

Ritchie Bros.

18

Table of Contents

16.    Other non-current assets (continued)

March 31, 

December 31,


2023


2022

Tax receivable

$

9.4

$

9.1

Loans receivable

15.1

15.3

Refundable deposits

24.3

Deferred debt issuance costs


5.1


3.9

Other


20.8


12.1

$

74.7

$

40.4

Loans receivableReceivable

As at June 30, 2022,

At March 31, 2023, the Company held fourparticipated in certain financing lending arrangements that are fully collateralized and secured by certain equipment. These financing lending arrangements have a term of one to four years. In the event of default under these agreements, the Company will take possession of the equipment as collateral to recover its loans receivable balance. The loans receivable balance as at June 30, 2022March 31, 2023 was $11,749,000,$23.4 million, of which $4,550,000$8.3 million is recorded in trade and other receivables and $7,199,000$15.1 million in non-current loans receivable (December 31, 2021: $7,267,000,2022: $23.4 million, of which $7,267,000$8.0 million was recorded in trade and other receivables and NaN$15.4 million in non-current loans receivable). The expected credit loss allowance is not significant.

Ritchie Bros.

23

Table of Contents

17. Trade and Other Payables

March 31, 

December 31,


2023


2022

Trade payables

$

139.1

$

54.3

Accrued liabilities


217.5


128.6

Social security and sales taxes payable


47.2


38.7

Net consumption taxes payable


16.3


14.5

Share unit liabilities


6.7


6.3

Book overdrafts

108.9

Other payables


22.7


16.3

$

558.4

$

258.7

Book overdrafts represent outstanding checks in excess of funds on deposit.

17.18.    Debt


Carrying amount


Carrying amount

June 30, 

December 31, 

March 31, 

December 31,


2022


2021


2023


2022

Short-term debt

$

8,637

$

6,147

$

23.6

$

29.1

Long-term debt:


Revolving facilities and delayed-draw term loan facility:


Delayed-draw term loan denominated in Canadian dollars, secured, bearing interest at a weighted average rate of 3.08%, due in monthly installments of interest only, maturing in September 2026


92,348


93,283

Long-term revolver loan denominated in Canadian dollars, secured, bearing interest at a weighted average rate of 2.29%, due in monthly installments of interest only, maturing in September 2026


-


46,206

Long-term revolver loan denominated in Canadian dollars, secured, bearing interest at a weighted average rate of 2.29%, due in monthly installments of interest only, maturing in September 2026


-


56,492

Long-term revolver loan denominated in U.S. dollars, secured, bearing interest at a weighted average rate of 2.53%, due in monthly installments of interest only, maturing in September 2026


57,000


117,000

Less: unamortized debt issue costs


(410)


(463)

Term loans:


DDTL Facility loan denominated in Canadian dollars, secured, bearing interest at a weighted average rate of 5.86%, due in monthly installments of interest and quarterly installments of principal, maturing in September 2026

85.5

Term Loan A Facility loan denominated in Canadian dollars, secured, bearing interest at a weighted average rate of 7.69%, due in monthly or quarterly installments of interest, dependent on the loan term and quarterly installments of principal which commenced on March 31, 2023, maturing in September 2026 ("CAD TLA Facility")


84.8


Term Loan A Facility loan denominated in US dollars, secured, bearing interest at a weighted average rate of 7.54%, due in monthly or quarterly installments of interest, dependent on the loan term and quarterly installments of principal commencing June 30, 2023, maturing in September 2026 ("USD TLA Facility")


1,825.0


Less: unamortized debt issuance costs


(20.5)


(0.4)

Senior unsecured notes:


Bearing interest at 5.375% due in semi-annual installments, with the full amount of principal due in January 2025 (the "2016 Notes")


500,000


500,000

Less: unamortized debt issue costs


(4,566)


(5,469)

Bearing interest at 4.75% due in semi-annual installments, with the full amount of principal due in December 2031 (the "2021 USD Notes")

-

600,000

Less: unamortized debt issue costs

-

(1,948)

Bearing interest at 4.95% due in semi-annual installments, with the full amount of principal due in December 2029 (the "2021 CAD Notes")

-

333,464

Less: unamortized debt issue costs

-

(1,127)

Senior secured and unsecured notes:


Senior unsecured notes bearing interest at 5.375% due in semi-annual installments, with the full amount of principal due in January 2025 (the "2016 Notes")


500.0

Less: unamortized debt issuance costs


(3.6)

Senior secured notes bearing interest at 6.75% due in semi-annual installments, with the full amount of principal due in March 2028 (the "2023 Secured Notes")


550.0


Less: unamortized debt issuance costs

(7.7)

Senior unsecured notes bearing interest at 7.75% due in semi-annual installments, with the full amount of principal due in March 2031 (the "2023 Unsecured Notes")


800.0


Less: unamortized debt issuance costs

(11.2)

Total long-term debt


644,372


1,737,438


3,220.4


581.5

Total debt

$

653,009

$

1,743,585

$

3,244.0

$

610.6

Long-term debt:


Current portion

$

4,617

$

3,498

$

95.7

$

4.4

Non-current portion


639,755


1,733,940


3,124.7


577.1

Total long-term debt

$

644,372

$

1,737,438

$

3,220.4

$

581.5

As at June 30, 2022,At March 31, 2023, the Company had unused committed revolving credit facilities aggregating $673,459,000$709.4 million that are available until September 2026 subject to certain covenant restrictions, unused uncommitted revolving credit facilities aggregating $5,000,000$5.0 million that are available until October 2023, and unused uncommitted revolving credit facilities aggregating $5,000,000$5.0 million with no maturity date. The Company was in compliance with all financial and other covenants applicable to the credit facilities at June 30, 2022.March 31, 2023.

Ritchie Bros.

24

Table of Contents

Ritchie Bros.

1925

Table of Contents

17.18.    Debt (continued)

Short-term debtDebt

Short-term debt is comprised of drawings in different currencies on the Company’s committed revolving credit facilities and has a weighted average interest rate of 2.7% (December6.5% at March 31, 2021: 1.8%2023 (at December 31, 2022: 5.8%).

Long-term debtDebt

a)Revolving facilities and delayed-draw term loan facilityTerm Loans

During 2016, the Company entered into a credit agreement with a syndicate of lenders.lenders (as amended and restated, supplemented or otherwise modified from time to time, the “Credit Agreement”). The credit agreementCredit Agreement is comprised of multicurrency revolving facilities (the “Revolving Facilities”) and a, the delayed-draw term loan facility (the “DDTL Facility”), and the Term Loan A facility (the “TLA Facility” and together with the Revolving Facilities and DDTL Facility, the “Facilities”). The credit agreement was most recently amended in September 2021, which, among other things (i) extended the maturity date of the Facilities from October 27, 2023 toCredit Agreement matures on September 21, 2026, (ii) increased the total size of the Facilities provided under the Credit Agreement to up to $1,045,000,000, including $295,000,000 of commitments under the DDTL Facility, (iii) reduced the applicable margin for base rate loans and LIBOR loans at each pricing tier level, (iv) reduced the applicable percentage per annum used to calculate the commitment fee in respect of the unused commitments under the Facilities at each pricing tier level, and (v) included customary provisions to provide for the eventual replacement of LIBOR as a benchmark interest rate.

Immediately prior to the amendment, the aggregate principal amount outstanding under the DDTL Facility was $90,000,000 ($118,889,995 Canadian dollars). In connection with the amendment, the Company refinanced that amount with the proceeds from a borrowing under the DDTL Facility. Under the terms of the amendment, there are no mandatory principal repayments of borrowings under the DDTL Facility until the earlier of when the remaining $205,000,000 is drawn or the third quarter of 2022. The Company did not draw on the remaining $205,000,000 before it expired on June 28, 2022 and, therefore, mandatory principal repayments will begin2026. Beginning in the third quarter of 2022. Once principal payments become mandatory, they are2022, the existing DDTL Facility, denominated in Canadian Dollars, was subject to an annual amortization rate of 5%, payable in quarterly installments, with the balance payable upon maturity.

In connection with the acquisition of IAA the Company entered into a debt commitment letter with certain financial institutions that committed to provide, subject to the terms and conditions, a bridge loan facility in an aggregate principal amount of up to $2.8 billion and a backstop revolving facility in an aggregate principal amount of up to $750.0 million. In December 2022, the Company subsequently amended the terms of its Credit Agreement which, among other things, permitted the acquisition of IAA and served to terminate the backstop commitments (including the revolving backstop facility and $88.9 million of bridge commitments that served as a backstop for its existing term loans under the credit agreement) and replaced an additional $1.8 billion of bridge commitments with further TLA Facility commitments.

On March 20, 2023, with the closing of the acquisition of IAA, $1.8 billion of the TLA Facility was funded at an adjusted term SOFR of 7.54%. The TLA Facility is comprised of a facility denominated in US dollars (“USD TLA Facility”) and a facility denominated in Canadian dollars (“CAD TLA Facility”). The Company’s existing Canadian dollar DDTL Facility loan of CAD $115.9 million was converted to a CAD TLA Facility loan, an alternative currency term rate loan, and continues to be subject to an annual amortization rate of 5%, payable in quarterly installments, with the balance payable upon maturity. Under the amended terms, mandatory principal repayments on the USD TLA Facility begin in the second quarter of 2023 and are subject to quarterly instalments of 1.25% of the $1.8 billion principal amount, with the balance payable at maturity. As a resultFurther, under the terms of the expiryamendment to the Credit Agreement made in December 2022, certain amended terms became effective including an increase to the total size of the DDTL Facility,Facilities to up to $2.7 billion, including $1.9 billion of commitments under the TLA Facility.

During the three months ended March 31, 2023 the Company wrote off $710,000 of deferredincurred debt issuance costs of $22.3 million in connection with the quarter recognizedamendment of the Credit Agreement and funding of the TLA Facility, of which $1.4 million is included in non-current asset to interest expense.assets, $20.3 million has been capitalized against the TLA Facility, and $0.6 million is recorded in acquisition-related and integration costs.

As of June 30, 2022,At March 31, 2023, the Company had $5.1 million unamortized deferred debt issue costs relating to the Revolving Facilities, all of $4,633,000.which is included in non-current assets.

b)Senior unsecured notesSecured and Unsecured Notes

2016 Notes

On December 21, 2016, the Company completed the offering of $500,000,000$500.0 million aggregate principal amount of 5.375% senior unsecured notes due January 15, 2025 (the “2016 Notes”). Interest

The 2016 Notes were redeemed on March 20, 2023 at 100.0% of their original offering price, plus accrued and unpaid interest. The Company was relieved of its obligations for the 2016 Notes is payable semi-annually. Theupon redemption and therefore recognized the difference of $3.3 million between the reacquisition price and the net carrying amount of the debt extinguished (which included unamortized deferred debt issuance costs) as a loss on redemption of the 2016 Notes are jointly and severally guaranteed on an unsecured basis, subject to certain exceptions, by certainin interest expense in the condensed consolidated income statement during the first quarter of the Company’s subsidiaries. IronPlanet, Rouse, SmartEquip, and certain2023.

Ritchie Bros.

26

Table of their respective subsidiaries were added as additional guarantors in connection with the acquisitions of IronPlanet, Rouse and SmartEquip, respectively.Contents

18.    Debt (continued)

Long-term Debt (continued)

b)Senior Secured and Unsecured Notes (continued)

2021 Notes

On December 21, 2021, in connection with the proposed acquisition of Euro Auctions, the Company completed the offering of two series of senior notes: (i) $600,000,000$600.0 million aggregate principal amount of 4.750% senior notes due December 15, 2031 (the “2021 USD Notes”) and (ii) $425,000,000$425.0 million Canadian dollar aggregate principal amount of 4.950% senior notes due December 15, 2029 (the “2021 CAD Notes”, and together with the 2021 USD Notes,(together the “2021 Notes”).

The gross proceeds from the 2021 Notes offering together with certain additional amounts including prepaid interest were placed into escrow accounts and were expected to be held in escrow until the completion of the proposed Euro Auctions Acquisition. On May 4, 2022, the Company redeemed all of the 2021 Notes at a redemption price equal to 100% of the original offering price of the notes, plus accrued and unpaid interest. The Company was relieved of its obligations for the 2021 Notes upon redemption and therefore recognized the difference of $4,792,000$4.8 million between the reacquisition price and the net carrying amount of the debt extinguished (which included unamortized deferred debt issuance costs) as a loss on redemption of the 2021 Notes in interest expense in the consolidated income statement.statement during the second quarter of 2022.

2023 Notes

On March 15, 2023, the Company completed the offering of (i) $550.0 million aggregate principal amount of 6.750% senior secured notes due March 15, 2028 (the “2023 Secured Notes”) and (ii) $800.0 million aggregate principal amount of 7.750% senior unsecured notes due March 15, 2031 (the “2023 Unsecured Notes”, and together with the 2023 Secured Notes, the “ 2023 Notes”). The gross proceeds of the 2023 Notes were released from escrow on March 20, 2023 and were used, along with the TLA Facility, to fund the acquisition of IAA.

Interest on the 2023 Notes is payable in cash semi-annually in arrears on March 15 and September 15 of each year, beginning on September 15, 2023.

The 2023 Secured Notes are jointly and severally guaranteed on a senior secured basis and the 2023 Unsecured Notes are jointly and severally guaranteed on a senior unsecured basis by certain of the Company’s subsidiaries.

The Company incurred total debt issuance costs of $19.0 million in connection with the issuance of the 2023 Secured Notes and 2023 Unsecured Notes, all of which has been capitalized and recorded as a reduction of the amounts outstanding under the 2023 Notes.

19.    Other Non-current Liabilities

March 31, 

December 31,


2023


2022

Tax payable

$

23.3

$

16.0

Finance lease liability


28.2


15.3

Other


7.8


4.1

$

59.3

$

35.4

Ritchie Bros.

2027

Table of Contents

18.    Other non-current liabilities

June 30, 

December 31, 


2022


2021

Operating lease liability

$

118,737

$

109,882

Tax payable

19,657

18,859

Finance lease liability


13,458


13,983

Other


4,059


4,536

$

155,911

$

147,260

19.20.    Temporary Equity, Equity and dividendsDividends

Share capitalCapital

Common stockStock

Unlimited number of common shares, without par value.

Preferred stockStock

Unlimited number of senior preferred shares, without par value, issuable in series.

Unlimited numberstock, of which 485,000,000 are designated as Series A Senior Preferred Shares, and junior preferred shares, without par value, issuable in series.

All issued shares are fully paid. NaN

In January 2023, the Company entered into a securities purchase agreement with Starboard Value LP and certain affiliates (together, “Starboard”) pursuant to which Starboard agreed to purchase $485.0 million of Series A Senior Preferred Shares, convertible into common shares of the Company, and $15.0 million of common shares of the Company. The transaction closed on February 1, 2023 (the “Issue Date”).

The Series A Senior Preferred Shares are convertible into common stock at an initial conversion price of $73.00 per share. The Series A Senior Preferred Shares carry an initial 5.5% preferred dividend, which is payable quarterly, in cash or in shares at the Company's option (“Preferential Dividends”), and are entitled to participate on an as-converted basis in the Company's regular quarterly common share dividends, subject to a $0.27 per share per quarter floor (“Participating Dividends”). On the fourth anniversary of the Series A Senior Preferred Shares Issue Date, holders will have the right to increase the preferred dividend to 7.50%, and on the ninth anniversary of the Series A Senior Preferred Shares Issue Date, holders will have the right to increase the preferred dividend to a fixed percentage equal to the greater of (a) 600 bps over the daily simple SOFR as then in effect and (b) 10.50%, subject, in each case, to the Company’s right to redeem the Series A Senior Preferred Shares for which a dividend rate increase has been issued.demanded (an “Increased Dividend Rate Demand”).

In connection with any Increased Dividend Rate Demand, subject to certain conditions, and upon 45 days’ notice to the holders, the Company will have the right to redeem all or any portion of the Series A Senior Preferred Shares then outstanding, at a price equal to 100% of the face amount of such Series A Senior Preferred Shares plus any accrued and unpaid dividends thereon. Additionally, at any time after the ninth anniversary of the Series A Senior Preferred Shares Issue Date, subject to certain conditions, and upon 45 days’ notice to the holders, the Company will have the right to redeem all or any portion of the Series A Senior Preferred Shares then outstanding, at a price equal to 100% of the face amount of such Series A Senior Preferred Shares plus any accrued and unpaid dividends thereon.

Upon consummation of one or more specified change of control transactions, the holders will have the right to require the Company to repurchase the Series A Senior Preferred Shares in cash provided, however, that each holder, at its option, may elect instead to convert its Series A Senior Preferred Shares into the applicable change of control consideration. In addition, the Company has the right to redeem the Series A Senior Preferred Shares in the event of a change of control transaction where the successor entity is not traded on certain eligible markets. The possible future redemption of the Series A Senior Preferred Shares as a result of a change in control has been assessed as not probable at March 31, 2023.

Holders of the Series A Senior Preferred Shares are entitled to vote together with the Common Shares on an as-converted basis on all matters permitted by applicable law, subject to certain exceptions to enable compliance with applicable antitrust law.

The Series A Senior Preferred Shares rank, with respect to rights as to dividends, distributions, redemptions and payments upon the liquidation, dissolution and winding up of the Company, (a) senior to all of the junior preferred shares of the Company, Common Shares and any other class or series of capital shares of the Company, issued for business combinationsor authorized after the Series A Senior Preferred Shares Issue Date, (b) on a parity basis with each other class or series of capital shares issued or authorized after the Series A Senior Preferred Shares Issue Date, and (c) junior with each other class or series of capital shares issued or authorized after the Series A Senior Preferred Shares Issue Date.

Ritchie Bros.

28

Table of Contents

20.    Temporary Equity, Equity and Dividends (continued)

Share-based Continuing Employment Costs

The Company has issued the following common shares in connection with the acquisitions of Rouse and SmartEquip. These shares were issued to certain previous unitholders and shareholders of Rouse and SmartEquip, based on the fair market value of the Company’s common shares at the acquisition date. The Company records share-based continuing employment costs in acquisition-related and integration costs over the vesting period, with an increase to additional paid-in capital. The vesting of shares issued for business combinations is subject to continuing employment with the Company over various dates over a three year period from their respective acquisition dates. As and when the common shares vest, the Company will recognize the fair value of the issued common shares from additional paid-in capital to share capital.

Rouse

SmartEquip

Total


Weighted average

Common

Fair value

Common

Fair value


Common

fair value

shares 

per common

shares 

per common


shares 

per common

issued


shares


issued


shares


issued


shares

Outstanding, December 31, 2022

85,560

$

71.09

42,646

$

68.39

128,206

$

70.19

Granted

Vested

(4,636)

71.09

(4,636)

71.09

Forfeited

Outstanding, March 31, 2023

80,924

$

71.09

42,646

$

68.39

123,570

$

70.16

Outstanding, December 31, 2021

189,665

$

71.09

63,971

$

68.39

253,636

$

70.41

Granted

Vested

Forfeited

Outstanding, March 31, 2022

189,665

$

71.09

63,971

$

68.39

253,636

$

70.41

At March 31, 2023, the Company recognized $0.3 million (2022: nil) of share capital from additional paid-in capital for the portion of common shares previously issued in connection with the acquisition of Rouse that have vested as of March 31, 2023.

Shares Issued for Business Combinations

At March 31, 2023, the unrecognized share-based continuing employment cost was $2.4 million (at December 31, 2022: $3.2 million), which is expected to be recognized over a weighted average period of 0.9 years.

Change in Non-controlling Interest

On January 3, 2023, in connection with the acquisition of VeriTread (Note 5), the Company increased its investment in VeriTread from 11% to 75% for a total purchase consideration of $28 million. The Company also entered into a put/call agreement with one of the minority unitholders under which the holder can put its remaining 21% interest in VeriTread to the Company, if certain performance targets are met. As the purchase of the remaining 21% interest from the minority unitholder is outside the control of the Company the redeemable non-controlling interest is classified in temporary equity on the consolidated balance sheet. As discussed in Note 3, management applied judgement and assessed that it is probable that the redeemable non-controlling interest will be redeemed at a future date and accordingly the carrying value of the redeemable non-controlling interest is adjusted to its estimated redemption value.

The Company also recognized an additional 4% non-controlling interest in VeriTread within equity as that interest does not contain put/call options.

Ritchie Bros.

2129

Table of Contents

20.    Temporary Equity, Equity and Dividends (continued)

Dividends

Declared and Paid

The Company declared and paid the following dividends to common stockholders during the three months ended March 31, 2023 and 2022:

Common Stock


Dividend  


Total


Declaration date

per share

Record date

dividends

Payment date

Special Dividend

March 6, 2023

$

1.0800

March 17, 2023

$

120.4

March 28, 2023

Fourth quarter 2022

January 20, 2023

$

0.2700

February 10, 2023

$

30.0

March 3, 2023

Fourth quarter 2021

January 21, 2022

$

0.2500

February 11, 2022

$

27.7

March 4, 2022

On March 7, 2023, the Company declared a special cash dividend of $1.08 per share, contingent on the closing of the acquisition of IAA, payable to stockholders of record at the close of business on March 17, 2023 (the “Special Dividend”). The Special Dividend was paid in cash on March 28, 2023 following the acquisition of IAA.

Preferred Stock

The Company recorded Preferential Dividends of $4.3 million to the holders of the Series A Senior Preferred Shares in the first quarter of 2023, of which $3.1 million was paid on March 15, 2023 and $1.2 million was accrued and unpaid at March 31, 2023, and Participating Dividends of $1.8 million on March 3, 2023.

Declared and Undistributed

Subsequent to March 31, 2023, the Company’s Board of Directors declared a quarterly dividend of $0.27 cents per common share, payable on June 20, 2023 to common stockholders of record on May 30, 2023.

Foreign Currency Translation Reserve

Foreign currency translation adjustments within other comprehensive income include intra-entity foreign currency transactions that are of a long-term investment nature, which generated a net gain of $1.3 million for the three months ended March 31, 2023 (three months ended 2022: net loss of $0.9 million).

21.    Share-based Payments

Share-based payments consist of the following compensation costs:

Three months ended

March 31, 


2023


2022

Selling, general and administrative:


Stock option compensation expense

$

2.6

$

2.6

Equity-classified share units

3.5

2.9

Liability-classified share units

(0.8)

Employee share purchase plan - employer contributions


0.6


0.7

6.7

5.4

Acquisition-related and integration costs:


Acceleration of share-based payments expense

5.0

Share-based continuing employment costs


1.0


2.1


6.0


2.1

$

12.7

$

7.5

Ritchie Bros.

30

Table of Contents

21.    Share-based Payments (continued)

Conversion of IAA Share Based Awards

In connection with the acquisition of IAA, IAA’s stock options, RSU and PRSU awards were cancelled and exchanged into 187,727 Company stock options and 366,379 Company RSU awards. The PRSU’s were replaced with RSU awards. At the closing of the acquisition of IAA, the converted share-based awards had an estimated aggregate fair value of $24.9 million, of which $4.8 million was attributable to post-combination services and will be recognized as share-based payment expense over the remaining service periods. The Company awards are subject to the same terms and conditions as applicable to the corresponding IAA equity awards held prior to the acquisition of IAA, including vesting terms, with the exception of any Company RSU awards that replace IAA’s PRSU awards, where vesting will no longer be subject to the achievement of performance goals and will be solely based on providing continued services to the Company through the end of the applicable service period.

IAA restricted stock awards and IAA phantom stock awards which were granted to non-employee directors of IAA, vested at closing of the acquisition of IAA and therefore do not have a future service requirement. Accordingly, the entire post-combination portion of such awards of $0.3 million has been recognized as share-based payment expense concurrent with the closing of the acquisition of IAA.

In addition, certain former executives of IAA were terminated in connection with the acquisition of IAA and their outstanding awards were fully accelerated as of the closing date. Accordingly, $4.3 million has been recognized as share-based payment expense concurrent with the closing of the acquisition of IAA.

Stock Option Plans

The Company has the following four stock option plans that provide for the award of stock options and premium-priced stock options to selected employees, directors, and officers of the Company: (i) Amended and Restated Stock Option Plan, (ii) IronPlanet 1999 Stock Plan, (iii) IronPlanet 2015 Stock Plan, and (iv) 2019 IAA Omnibus Stock and Incentive Plan.

The 2019 IAA Omnibus Stock and Incentive Plan was assumed by the Company as part of the acquisition of IAA.

Stock option activity for the three months ended March 31, 2023 is presented below:

Stock options

Premium-priced stock options

WA

WA

Common

WA

remaining

Aggregate

Common

WA

remaining

Aggregate

shares under

exercise

contractual

intrinsic

shares under

exercise

contractual

intrinsic

option


price


life (in years)


value


option


price


life (in years)


value

Outstanding, December 31, 2022

2,730,295

$

46.88

7.3

$

31.2

1,118,432

$

91.26

4.7

$

Granted


Assumed in IAA acquisition (Note 5)

187,727

50.96

1.7

Exercised

(19,729)

34.01

0.5

Forfeited

(52,978)

45.33


(38,635)

91.19


Outstanding, March 31, 2023

2,845,315

$

47.26

6.5

$

28.7

1,079,797

$

91.26

4.3

$

Exercisable, March 31, 2023

2,069,936

$

43.61

5.8

$

27.8

$


$

Ritchie Bros.

31

Table of Contents

19.    Equity and dividends21.    Share-based Payments (continued)

Shares issued for business combinations

Stock Option Plans (continued)

Stock Options

Rouse

SmartEquip

Total


Weighted average

Common

Fair value

Common

Fair value


Common

fair value

shares 

per common

shares 

per common


shares 

per common

issued


shares


issued


shares


issued


shares

Outstanding, December 31, 2021

189,665

$

71.09

63,971

$

68.39

253,636

$

70.41

Granted

Vested

(27,816)

71.09

(27,816)

71.09

Forfeited

Outstanding, June 30, 2022

161,849

$

71.09

63,971

$

68.39

225,820

$

70.33

Outstanding, December 31, 2020

312,193

$

71.09

$

312,193

$

71.09

Granted

Vested

Forfeited

(55,510)

71.09

(55,510)

71.09

Outstanding, June 30, 2021

256,683

$

71.09

$

256,683

$

71.09

InThe Company uses the Black Scholes option pricing model to fair value stock options. There were no stock options granted during the three month period ended March 31, 2023 other than the stock options assumed as part of the IAA acquisition. Significant assumptions used to estimate the fair value of stock options granted during the three months ended June 30,March 31, 2022 are presented in the Company recognized $1,819,000 of share capital from additional paid-in capital for the portion of common shares previously issued in connection with the acquisition of Rouse that have vested as of June 30, 2022.following table on a weighted average basis:

As at June 30,

Three months ended March 31, 

2022

Risk free interest rate

2.1

%

Expected dividend yield

1.75

%

Expected lives of the stock options

4

years

Expected volatility

31.7

%

At March 31, 2023, the unrecognized share-based continuing employmentstock-based compensation cost related to the non-vested stock options was $6,520,000 (June 30, 2021: $11,898,000),$4.8 million, which is expected to be recognized over a weighted average period of 1.41.8 years.

Dividends

Declared and paid

The Company declared and paidfair value of the assumed stock options is estimated on the IAA acquisition date using the Black-Scholes option pricing model. The weighted average fair value of the assumed options was $15.52. The significant assumptions used to estimate the fair value of these assumed stock options are presented in the following dividends during the six months ended June 30, 2022 and 2021:table on a weighted average basis:


Dividend  


Total


Declaration date

per share

Record date

dividends

Payment date

Six months ended June 30, 2022:


Fourth quarter 2021

January 21, 2022

$

0.2500

February 11, 2022

$

27,659

March 4, 2022

First quarter 2022

May 6, 2022

0.2500

May 27, 2022

27,693

June 17, 2022

Six months ended June 30, 2021:


Fourth quarter 2020

January 22, 2021

$

0.2200

February 12, 2021

$

24,181

March 5, 2021

First quarter 2021

May 7, 2021

0.2200

May 26, 2021

24,279

June 16, 2021

Three months ended March 31, 

2023

Risk free interest rate

3.9

%  

Expected dividend yield

2.05

%  

Expected lives of the stock options

2

years

Expected volatility

33.3

%  

Declared and undistributed

SubsequentPremium-priced Stock Options

The Company also grants premium-priced stock options to June 30, 2022,the senior executives with exercise prices above the fair market value of the Company’s Boardcommon shares on grant dates. The premium-priced stock options vest and become exercisable upon the third anniversary of Directors declaredtheir grant date. The fair values of the premium-priced stock options were calculated on the grant date using a quarterly dividend of $0.27 cents per common share, payable on September 14, 2022Monte Carlo simulation model. There were no premium-priced stock options granted during the three month period ended March 31, 2023 and 2022.

At March 31, 2023, the unrecognized stock-based compensation cost related to stockholders of record on August 24, 2022. This dividend payable has not been recognized as a liability in the consolidated financial statements. The payment of this dividendpremium-priced stock options was $4.6 million, which is expected to not have any tax consequences for the Company.

Foreign currency translation reserve

Foreign currency translation adjustments within other comprehensive income include intra-entity foreign currency transactions that arebe recognized over a weighted average period of a long-term investment nature, which generated a net loss of $8,553,000 and $9,437,000 for the three and six months ended June 30, 2022 (2021: net gain of $1,095,000 and net loss of $2,559,000).1.6 years.

Ritchie Bros.

2232

Table of Contents

20.21.    Share-based payments

Share-based payments consist of the following compensation costs:

Three months ended


Six months ended

June 30, 

June 30, 


2022


2021


2022


2021

Selling, general and administrative:


Stock option compensation expense

$

3,056

$

1,909

$

5,623

$

3,770

Equity-classified share units

8,801

4,404

11,691

7,557

Liability-classified share units

1,075

526

319

(1,389)

Employee share purchase plan - employer contributions


708


701


1,393


1,380

13,640

7,540

19,026

11,318

Acquisition-related costs:


Share-based continuing employment costs


2,080


2,678


4,213


5,231


2,080


2,678


4,213


5,231

$

15,720

$

10,218

$

23,239

$

16,549

Stock option plans

The Company has the following three stock option plans that provide for the award of stock options and premium-priced stock options to selected employees, directors, and officers of the Company: (i) Amended and Restated Stock Option Plan, (ii) IronPlanet 1999 Stock Plan, and (iii) IronPlanet 2015 Stock Plan.

Stock option activity for the six months ended June 30, 2022 is presented below:

Stock options

Premium-priced stock options

WA

WA

Common

WA

remaining

Aggregate

Common

WA

remaining

Aggregate

shares under

exercise

contractual

intrinsic

shares under

exercise

contractual

intrinsic

option


price


life (in years)


value


option


price


life (in years)


value

Outstanding, December 31, 2021

2,208,057

42.55

7.7

41,884

1,017,064

91.24

5.7

Granted

689,437

58.02


119,157

91.37

Exercised

(80,183)

35.70

1,964

Forfeited

(36,126)

42.85


(17,789)

90.93


Outstanding, June 30, 2022

2,781,185

46.58

7.8

51,797

1,118,432

91.26

5.2

Exercisable, June 30, 2022

1,307,090

37.42

6.5

36,130


Stock options

The Company uses the Black Scholes option pricing model to fair value stock options. Significant assumptions used to estimate the fair value of stock options granted during the six months ended June 30, 2022 and 2021 are presented in the following table on a weighted average basis:

Six months ended June 30, 


2022


2021


Risk free interest rate


2.2

%  

0.5

%

Expected dividend yield


1.74

%  

1.66

%

Expected lives of the stock options

��

4

years

4

years

Expected volatility


31.7

%  

32.3

%

At June 30, 2022, the unrecognized stock-based compensation cost related to the non-vested stock options was $11,746,000, which is expected to be recognized over a weighted average period of 2.4 years.

Ritchie Bros.

23

Table of Contents

20.    Share-based paymentsPayments (continued)

Premium-priced stock options

The Company also grants premium-priced stock options to the senior executives with exercise prices above the fair market value of the Company’s common shares on grant dates. The premium-priced stock options vest and become exercisable upon the third anniversary of their grant date. The premium-priced stock options granted in August and November 2021 expire on the sixth anniversary of their grant date, and those granted in June 2022 expire in August 2027 to coincide with the expiry of the August 2021 grant. The fair values of the premium-priced stock options were calculated on the grant date using a Monte Carlo simulation model. The weighted average estimated grant date fair value of premium-priced options during the three month period ended June 30, 2022 was $8.00 per option.

The significant assumptions used to estimate the fair values were as follows:

Six months ended June 30, 


2022


2021

Risk free interest rate


3.0

%  

%  

Expected dividend yield


1.63

%  

%  

Expected lives of the stock options

4

years

years

Expected volatility


30.2

%  

%  

At June 30, 2022, the unrecognized stock-based compensation cost related to the premium-priced stock options was $7,380,000, which is expected to be recognized over a weighted average period of 2.4 years.

Share unit plansUnit Plans

Share unit activity for the sixnine months ended June 30, 2022March 31, 2023 is presented below:

Equity-classified awards

Liability-classified awards

Equity-classified awards

Liability-classified awards

PSUs

PSUs with Market Conditions

RSUs

DSUs

PSUs

PSUs with Market Conditions

RSUs

DSUs

WA grant

WA grant

WA grant

WA grant

WA grant

WA grant

WA grant

WA grant

date fair

date fair

date fair

date fair

date fair

date fair

date fair

date fair


Number


value


Number


value


Number


value


Number


value


Number


value


Number


value


Number


value


Number


value

Outstanding at December 31, 2021


523,618

$

45.90

88,305

$

65.45

79,112

$

54.96


156,589

$

35.28

Outstanding, December 31, 2022


662,634

$

51.71

102,879

$

66.08

68,024

$

58.32


108,365

$

39.35

Granted


225,382


58.66

14,574


69.92

33,827


57.68


12,124


56.78


10,216


56.74


1,137


60.11


7,094


53.05

Assumed in IAA acquisition (Note 5)


366,379


52.79


Vested and settled


(93,241)


36.42


(22,349)


46.01


(283,086)


42.23


(23,986)


53.68


Forfeited


(3,474)


51.04


(3,891)


61.55


(4,123)


58.93


(1,459)


60.95


Outstanding at June 30, 2022


652,285

$

51.64

102,879

$

66.08

86,699

$

58.03


168,713

$

36.82

Outstanding at March 31, 2023


385,641

$

58.72

102,879

$

66.08

410,095

$

53.65


115,459

$

40.19

The total market value of liability-classified share units vested and released during the first sixthree months of 20222023 was NaN (as at December 31, 2021: NaN)nil (2022: nil).

Senior executiveExecutive and employeeEmployee PSU plansPlans

The Company grants PSUs under a senior executive PSU plan and an employee PSU plan (the “PSU Plans”). Under the PSU Plans, the number of PSUs that vest is conditional upon specified market, service, and/or performance vesting conditions being met. The PSU Plans allow the Company to choose whether to settle the awards in cash or in shares. The Company intends to settle by issuance of shares. With respect to settling in shares, the Company has the option to either (i) arrange for the purchase of shares on the open market on the employee’s behalf based on the cash value that otherwise would be delivered, or (ii) issue a number of shares equal to the number of units that vest.

Fair values of equity-classified PSUs are estimated on the grant date using the market close price of the Company's common shares listed on the NYSE, as these are not subject to market vesting conditions.

At June 30, 2022,March 31, 2023, the unrecognized share unit expense related to equity-classified PSU’s was $21,018,000,$11.2 million, which is expected to be recognized over a weighted average period of 2.11.7 years.

Ritchie Bros.

2433

Table of Contents

20.21.    Share-based paymentsPayments (continued)

PSUs with market conditionsMarket Conditions

The Company also grants PSUs to senior executives with a market condition where vesting is conditional upon the total stockholder return performance of the Company’s stock relative to the performance of a peer group over a three year performance period from the date of grant. TheThere were no PSUs with market conditions granted in August and November 2021 have a three year performance period and the PSUs granted in June 2022 have approximately a 2 year performance period to coincide with the remaining performance period of the August 2021 grant. The fair value per PSU granted during the three month period ended June 30, 2022 of $69.92 was calculated on the grant date using the Monte Carlo simulation model which takes into consideration a required post-vesting holding period of one year with a discount value of $5.34 per PSU. The discount was calculated using the Chaffe Protective Put MethodMarch 31, 2023 and an effective tax rate of 35%.2022.

The significant assumptions used to estimate the fair value are presented in the following table:

Six months ended June 30, 


2022


2021

Risk free interest rate


2.7

%  

%  

Expected dividend yield


1.63

%  

%  

Expected lives of the PSUs

2

years

years

Expected volatility


33.4

%  

%  

Average expected volatility of comparable companies

34.4

%  

%  

At June 30, 2022,March 31, 2023, the unrecognized share unit expense related to equity-classified PSUs with market conditions was $5,062,000,$3.1 million, which is expected to be recognized over a weighted average period of 2.11.4 years.

RSUs

The Company has restricted share unit plans (RSU plans) that are equity-settled and not subject to market vesting conditions.

Fair values of RSUs are estimated on grant date using the market close price of the Company's common shares listed on the NYSE.

At June 30, 2022,March 31, 2023, the unrecognized share unit expense related to equity-classified RSUs was $2,849,000,$5.8 million, which is expected to be recognized over a weighted average period of 1.61.5 years.

DSUs

The Company has deferred share unit plans (DSU plans) that are cash-settled and not subject to market vesting conditions.

Fair values of deferred share units (“DSUs”) are estimated on grant date and at each reporting date using the market close price of the Company’s common shares listed on the NYSE. DSUs are granted under the DSU plan to members of the Board of Directors. There is 0no unrecognized share unit expense related to liability-classified DSUs as they vest immediately and are expensed upon grant.

At June 30, 2022,March 31, 2023, the Company had a total share unit liability of $10,976,000 (as at$6.7 million (at December 31, 2021: $10,056,000)2022: $6.3 million) in respect of share units under the DSU plans.

Employee share purchase planShare Purchase Plan

The Company has an employee share purchase plan that allows all employees that have completed two months of service to contribute funds to purchase common shares atIn February 2023, the current market value atBoard approved the time of share purchase. Employees may contribute up to 4% of their salary. The Company will match between 50% and 100%suspension of the employee’s contributions, dependingCompany’s 1999 Employee Share Purchase Plan. On April 3, 2023, the Board adopted the Company’s 2023 Employee Stock Purchase Plan (the “2023 ESPP”), subject to shareholder approval. The 2023 ESPP is described in greater detail in the Company’s Proxy Statement filed on the employee’s length of service with the Company.Form DEF14A on EDGAR and SEDAR on April 11, 2023.   

Ritchie Bros.

25

Table of Contents

21.22.    Leases

The Company enters into commercial leases for various auctions sites, branches and offices, the majority of which are non-cancellable, and additional operating leases for computer equipment, motor vehicles and small office equipment. TheWith the exception of one lease expiring in 2092, the majority of the Company’s operating leases have a fixed term with a remaining life between one month and 1820 years, with renewal options included in the contracts. The leases have varying contract terms, escalation clauses and renewal options.

The Company also enters into finance lease arrangements for certain vehicles, computer and yard equipment, fixtures, and office furniture, the majority of these leases have a fixed term with a remaining life of one month to six years with renewal options included in the contracts.

On March 17, 2022, the Company completed the sale and leaseback of its Bolton property, a parcel of land including all buildings, in Bolton, Ontario (Note 15). The Company intends to lease the Bolton property for a period of 28 months until such time that the replacement property is available for the relocation of the Company’s operations. The lease has an initial rent-free period of two years and an option to renew the lease for two additional one-year periods, during which time the lease is cancellable at one month’s notice. Upon completion of the sale, the Company recorded a $16,587,000$16.6 million ROU asset representing the right-of-use of the Bolton property for the estimated lease term and a $4,477,000 long term$4.5 million long-term lease liability representing the obligation to make lease payments arising from the operating lease at the end of the initial two-year period.

On June 30, 2022, the Company also recorded $9,020,000$9.0 million in ROU asset and a long-term long term lease liability relating to a lease signed on its Maltby auction site in the United Kingdom. On September 28, 2022, the Company completed the purchase of the Maltby property for a purchase price of $13.5 million and as a result derecognized the ROU asset and long-term lease liability.

Ritchie Bros.

34

Table of Contents

22.    Leases (continued)

The Company’s breakdown of lease expense is as follows:

Three months ended

Six months ended

Three months ended

June 30, 

June 30, 

March 31, 

2022

2021

2022

2021

2023

2022

Operating lease cost

$

6,229

$

4,392

$

10,940

$

8,992

$

13.1

$

4.7

Finance lease cost


Amortization of leased assets


2,616

2,815


5,248

5,403


5.3

2.6

Interest on lease liabilities


186

205


360

426


0.4

0.2

Short-term lease cost


2,901

1,922


6,364

4,583


3.4

3.5

Sublease income


(15)


(30)


(0.1)

$

11,932

$

9,319

$

22,912

$

19,374

$

22.1

$

11.0

22.    Commitments

Commitment for inventory purchases

The Company was awarded two new contracts with the United States Government Defense Logistics Agency (the “DLA”) on April 1, 2021. The new contracts (one for the Eastern portion of the United States and one for the Western portion of the United States) cover both surplus non-rolling and rolling stock. Both contracts commenced on June 1, 2021 and have a base term of two years with 3 one-year renewal options. 

During the first two years of the contracts, the Company is committed to purchase on a combined basis up to either: (i) 600,000 assets, or (ii) assets with an expected minimum value of up to $77,000,000; whichever is less. At June 30, 2022, the Company has purchased 263,503 assets with a total value of $54,520,000 pursuant to the two year period of this contract, which commenced on June 1, 2021.

Ritchie Bros.

26

Table of Contents

23.    Contingencies

Legal and other claimsOther Claims

The Company is subject to legal and other claims that arise in the ordinary course of its business. Management does not believe that the results of these claims will have a material effect on the Company’s consolidated balance sheet or consolidated income statement.

Guarantee contractsContracts

In the normal course of business, the Company will in certain situations guarantee to a consignor a minimum level of proceeds in connection with the sale at auction of that consignor’s equipment.

At June 30, 2022,March 31, 2023, there were $30,791,000$90.1 million of assets guaranteed under contract, of which 88%97% is expected to be sold prior to SeptemberJune 30, 2022,2023, with the remainder to be sold by December 31, 2022 (as at2024 (at December 31, 2021: $43,450,0002022: $31.0 million of which 61%62% was expected to be sold prior to the end of March 31, 20222023 with the remainder to be sold by December 31, 2022)2023).

The outstanding guarantee amounts are undiscounted and before estimated proceeds from sale at auction.

Ritchie Bros.

2735

Table of Contents

ITEM 2:      MANAGEMENT’S DISCUSSION AND ANALYSIS OF FINANCIAL CONDITION AND RESULTS OF OPERATIONS

Cautionary Note Regarding Forward-Looking Statements

Forward-looking statements may appear throughout this Quarterly Report on Form 10-Q, including the following section “Management’s Discussion and Analysis of Financial Condition and Results of Operations”. Forward-looking statements are typically identified by such words as “aim”, “anticipate”, “believe”, “could”, “continue”, “estimate”, “expect”, “intend”, “may”, “ongoing”, “plan”, “potential”, “predict”, “will”, “should”, “would”, “could”, “likely”, “generally”, “future”, “long-term”, or the negative of these terms, and similar expressions intended to identify forward-looking statements. Forward-looking statements are based on current expectations and assumptions that are subject to risks and uncertainties that may cause actual results to differ materially, and may include, among others, statements relating to:

our future strategy, objectives, targets, projections and performance;
potential growth and market opportunities;
potential future mergers and acquisitions;
our ability to integrate potential acquisitions;acquisitions (including IAA, Inc. (“IAA”));
the impact of our new initiatives, services, investments, and acquisitions on us and our customers;
our future capital expenditures and returns on those expenditures; and
financing available to us from our credit facilities or other sources, our ability to refinance borrowings, and the sufficiency of our working capital to meet our financial needs.

While we have not described all potential risks related to our business and owning our common shares, the important factors discussed in “Part II, Item 1A: Risk Factors” of this Quarterly Report on Form 10-Q and in “Part I, Item 1A: Risk Factors” of our Annual Report on Form 10-K for the year ended December 31, 2021,2022, and in “Part II, Item 1A: Risk Factors” of this quarterly report on Form 10-Q, which isare available on our website at https://investor.ritchiebros.cominvestor.rbglobal.com, on EDGAR at www.sec.gov, or on SEDAR at www.sedar.com, are among those that we consider may affect our performance materially or could cause our actual financial and operational results to differ significantly from our expectations. Except as required by applicable securities law and regulations of relevant securities exchanges, we do not intend to update publicly any forward-looking statements, even if our expectations have been affected by new information, future events or other developments.

Unless indicated otherwise, all tabular dollar amounts, including related footnotes, presented below are expressed in thousands of United States (“U.S.”) dollars.

We prepare our consolidated financial statements in accordance with United States generally accepted accounting principles (“US GAAP”). Except for Gross Transaction Value (“GTV”)1, which is a measure of operational performance and not a measure of financial performance, liquidity, or revenue, the amounts discussed below are based on our consolidated financial statements.

Unless otherwise indicated, all amounts in the following tables are in millions except share and per share amounts.

In the accompanying analysis of financial information, we sometimes use information derived from consolidated financial data but not presented in our financial statements prepared in accordance with USU.S. GAAP. Certain of these data are considered “non-GAAP financial measures” under the SEC rules. The definitions of and reasons we use these non-GAAP financial measures and the reconciliations to their most directly comparable USU.S. GAAP financial measures are included either with the first use thereof or in the Non-GAAP Measures section within the Management’s Discussion and Analysis of Financial Condition and Results of Operations. Non-GAAP financial measures referred to in this Quarterly Report on Form 10-Q are labeled as “non-GAAP measure”. PleaseOperations (Please see pages 51-53 for explanations of why we use these non-GAAP measures and the reconciliation to the most comparable GAAP financial measures.62-64).

Overview

Ritchie Bros. Auctioneers Incorporated (“Ritchie Bros.”, the “Company”, “we”, or “us”) (NYSE & TSX: RBA) was founded in 1958 in Kelowna, British Columbia, Canada and is a world leader in asset management technologies and disposition offor commercial assets, selling $5.5 billion of used equipment, automotive and other assets during 2021.assets. Our expertise, unprecedented global reach, market insights, and trusted portfolio of brands provide us with a unique position within the used equipmentasset resale market.

1  GTV represents total proceeds from all itemsassets sold at our auctions, and online marketplaces.marketplaces or from private brokerage services. GTV is not a measure of financial performance, liquidity, or revenue, and is not presented in our consolidated financial statements.

Ritchie Bros.

2836

Table of Contents

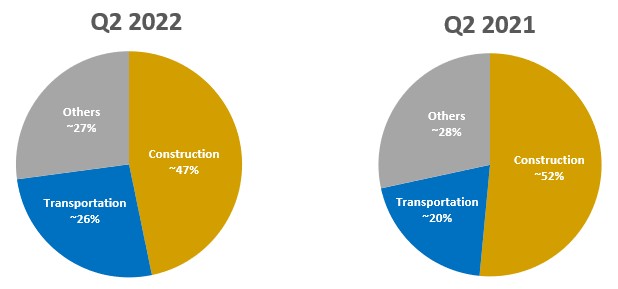
Through our unreserved and reserved auctions, online marketplaces, listings, and private brokerage services, we sell a broad range of primarily used commercial and industrial assets, vehicles as well as government surplus.surplus assets. Construction and commercial transportation assets and vehicles comprise the majority of the equipmentassets sold bybased on GTV dollar value.value, though we sell a wide variety of assets. Customers selling equipment through our sales channels include end users (such as construction companies), insurance companies, vehicle and equipment dealers, fleet lease companies, original equipment manufacturers (“OEMs”) and other equipmentasset owners (such as rental companies). Our customers participate in a variety of sectors, including construction, commercial transportation, automotive, agriculture, energy, and natural resources.

We also provide our customers with a wide array of value addedvalue-added services aligned with our growth strategy to create a global marketplace for used equipmentasset services and solutions. Our other services include access to equipment financing, asset appraisals and inspections, online equipment listing, transportation and logistical services, and ancillary services such as equipment refurbishment.refurbishment, towing, and title and lien processing. We offer our customers asset technology solutions to manage the end to endend-to-end disposition process of their assets and provide market data intelligence to make more accurate and reliable business decisions. Additionally, we offer our customers an innovative technology platform that supports equipmentvehicle merchandising, asset lifecycle management and parts procurement integration with both original equipment manufacturers and dealers, as well as software as a service platform for end-to-end parts procurement and digital catalogs and diagrams.

We operate globally with locations in 1213 countries, including the United States, Canada, the Netherlands,United Kingdom, Australia, and the United Arab Emirates, and the Netherlands, and maintain a presence in 4842 countries where customers are able tocan sell from their own yards. In addition, with the acquisition of IAA, we now employ more than 2,7007,600 full-time employees worldwide.

worldwide.

Discontinuation of the proposed acquisition of Euro Auctions

On August 9, 2021, we entered into a Sale and Purchase Agreement (“SPA”) pursuant to which we agreed to purchase Euro Auctions Limited, William Keys & Sons Holdings Limited, Equipment & Plant Services Ltd, and Equipment Sales Ltd. (collectively, “Euro Auctions”), each being a private limited company incorporated in Northern Ireland (the “Euro Auctions Acquisition”), for a purchase price of approximately £775 million (approximately $1.02 billion) in cash, which was to be paid on closing. On April 29, 2022, the Company announced its decision to discontinue the Phase 2 review by the Competition and Markets Authority (“CMA”). The SPA automatically terminated on June 28, 2022.

ImpactBusiness Combinations

Acquisition of COVID-19 to our BusinessIAA

InOn March 2020,20, 2023, we completed the World Health Organization declaredacquisition of IAA, a leading global digital marketplace connecting vehicle buyers and sellers with operations throughout the outbreakUnited States, Canada, and the United Kingdom. IAA facilitates the marketing and sale of COVID-19total loss, damaged and low-value vehicles for a full spectrum of sellers, including insurance companies, dealerships, fleet lease and rental car companies and charitable organizations. Additionally, IAA serves a global pandemic (“COVID-19”).buyer base with vehicles, vehicle rebuild requirements, replacement part inventory or scrap demand.

On November 7, 2022, we entered into an Agreement and Plan of Merger and Reorganization with IAA, which was subsequently amended on January 22, 2023 (the “Merger Agreement”). Pursuant to the terms of the Merger Agreement, IAA stockholders received $12.80 per share in cash and 0.5252 shares of the Company for each share of IAA common stock they owned (the “Exchange Ratio”). As such, we paid $1.7 billion in cash consideration and issued 70.3 million shares of its common stock. In response,addition, we transitioned allrepaid $1.2 billion of our traditional live onsite auctionsIAA’s net debt, including repayment of outstanding principal and associated accrued interest and prepayment costs under IAA’s credit agreement, and $500.0 million principal amount of IAA’s senior notes, at a redemption price equal to online bidding utilizing our existing online bidding technology. As restrictions ease, we began to return to travel102.75% of the principal amount plus accrued and to welcome in-person attendance at several of our live onsite auctions, and we continue to consider a transition back to our other onsite auction events throughout the year. The health and welfare of our employees, customers and suppliers continues to be a top priority and we continue to operate with precautionary measures in place, as appropriate.

In the first six months of 2022, our ability to move equipment to and from our auction sites and across borders has improved with travel restrictions and quarantine requirements continuing to lift particularly in Australia and Europe, but with certain countries within Asia continuing to experience lockdowns. In the United States and Canada, COVID-19 has not materially impacted our ability to operate our businesses and move equipment. Globally, we continued to see heightened shipping, fuel and freight costs combined with extended lead times, making transportation of equipment both more costly and more challenging, negatively impacting the buying and selling behaviour of our customers. Additionally, COVID-19 in combination with various macro economic factors impacted the supply chains of new equipment production, which in turn negatively affected the supply of used equipment being sold throughout our regions, most predominantly in North America.unpaid interest.

For a further discussion of risks to our business and operating results arising from COVID-19, please refer toFurther information regarding the “Risk Factors” section of our Annual Report on Form 10-K for the year ended December 31, 2021.transaction is described in Item 1 – Financial Statements: Note 5 – Business Combinations.

ImpactWe expect that the acquisition of Russia-Ukraine conflict onIAA will accelerate our Businessjourney to become the trusted global marketplace for insights, services and transaction solutions, as well as to diversify our customer base by providing us with a significant presence in the automotive vertical, an industry with strong fundamentals and proven secular growth. We expect that the combination will accelerate our growth and strategic vision to create a next-generation global marketplace for commercial assets and vehicles, supported by advanced technologies and data analytics. Additionally, our management team has extensive experience in the automotive and insurance ecosystem, which we expect will help shape the customer experience going forward. With enhanced scale and an expanded addressable market, we expect to be able to drive additional GTV growth through our platforms and auction sites, in turn generating more insights for our customers and expanding the adoption of our other high-margin tech-enabled services.

Acquisition of VeriTread

On February 24, 2022, the geopolitical situationJanuary 3, 2023, we acquired VeriTread LLC (“VeriTread”), a leading transportation technology company that provides an online marketplace solution for open deck transport, connecting shippers and service providers. We acquired 8,889,766 units of VeriTread for $25.2 million cash consideration from its existing unitholders and acquired another 1,056,338 units for $3.0 million cash. As a result, we increased our investment in Eastern Europe intensified with Russia’s invasionVeriTread from 11% to 75% and obtained control of Ukraine, sharply affecting economic and global financial markets. Subsequent economic sanctions on Russia have exacerbated ongoing economic challenges, including issues such as rising inflation, global supply chain disruption and increase in fuel prices.

The rise in fuel cost has impacted us to some extent due to the surge in transportation costs which has impacted both the cost and timing of export and import of equipment between countries globally and contributedVeriTread, pursuant to an increase inamended operating costs of ouragreement on January 18, 2023. 

Ritchie Bros.

2937

Table of Contents

VeriTread adds to our suite of services, supporting the needs of equipment owners throughout the equipment lifecycle by integrating transportation solutions directly into our new marketplace technology. We expect that the acquisition, in combination with our satellite yards, will allow us to further scale and accelerate our hybrid marketplace model through increased capacity optimization and seamless customer experiences.

Series A Senior Preferred Shares

In January 2023, the Company entered into a securities purchase agreement with Starboard Value LP and certain affiliates (together, “Starboard”) pursuant to which Starboard agreed to purchase $485.0 million of participating preferred stock convertible into common shares of the Company at an initial conversion price of $73.00 per share (“Series A Senior Preferred Shares”), and $15.0 million of common shares of the Company. The transaction closed on February 1, 2023.

The Series A Senior Preferred Shares carry an initial 5.5% preferred dividend, which is payable quarterly, and are entitled to participate on an as-converted basis in the Company's regular quarterly common share dividends, subject to a $0.27 per share per quarter floor. Holders will have the right to increase the preferred dividend on the fourth and ninth anniversary of the issue date, and upon any such dividend demand increase the Company will have the right to redeem all or any portion of the Series A Senior Preferred Shares then outstanding at a price equal to 100% of the face amount, plus any accrued and unpaid dividends thereon. This right is subject to certain conditions, and upon 45 days’ notice to the holder from the Company.

Impact of Inflation on Our Business

During the COVID-19 pandemic (“COVID-19”), we transitioned our traditional live onsite auctions to online bidding and experienced higher maintenance costs. While we have returned tolive in-person auction events at certain selected locations and pre-COVID levels of asset turnover, inflation continues to impact our global business operations in 2023 with higher costs in freight, fuel, supplies, labor, non-durable goods and consumables at our yards and in our operations. IncreasesIn addition, we have seen an increase in European natural gas priceslabor costs with the labor market remaining fairly strong. We expect inflationary pressures to continue throughout 2023. We will continue to evaluate operational productivity improvements that may also result in an accelerationoffset these pressures, while driving growth and strong financial performance. 

Ritchie Bros.

38

Table of a slowdown in the economy, especially in Europe where, historically, Eastern European countries have contributed to importing and exporting equipment for our operations.Contents

Service Offerings

We do not have any operations in Russia or Ukraine, or any material operations in neighboring countries and only have a limited number of direct customers in the effected region. However, we cannot estimate the extent of the ongoing impacts of the conflict, other unforeseen conditions, future developments, including the continued evolvement of military activity and sanctions imposed with Russia’s invasion of Ukraine, which could adversely affect the domestic economy generally and our business specifically.

Service Offerings

We offer our equipment seller and buyer customers multiple distinct, complementary, multi-channel brand solutions that address the range of their needs.buying and selling needs for equipment, vehicles and other types of assets. Our global customer base has a variety of transaction options, breadth of services, and the widest selection of used equipmentassets available to them. For a complete listing of

The table below illustrates the various channels and brand solutions available under our Auctions & Marketplace ("A&M") segment, as well as our Other Services segment, please refer to our Annual Report on Form 10-K forcustomers subsequent to the year ended December 31, 2021,acquisitions of IAA and VeriTread, which is available on our website at www.rbauction.com, on EDGAR at www.sec.gov, or on SEDAR at www.sedar.com.were completed in the first quarter of 2023.

Solution

Brand(s)

Description

Marketplaces & Features

RB Auction

Onsite and online marketplace for selling and buying used equipment

IronPlanet

Online marketplace for selling and buying used equipment

Marketplace-E

Online marketplace offering multiple price and timing options

GovPlanet

Online marketplace for the sale of government and military assets

IAA AuctionNow™

Our digital auction bidding and buying solution, which features inventory located at physical branches and offsite to a global buyer audience

IAA Buy Now™

Provides a unit for sale for a specific price using analytical data between scheduled auctions

IAA Custom Bid™

A digital bidding tool that provides buyer customers focused on recycling the ability to set pre-bids in an auction based on vehicle attributes

IAA Timed Auctions™

Offers a unit for sale for a specified period of time, allowing for competitive bidding and sale prior to a scheduled auction

Ritchie Bros. Private Treaty

Confidential, negotiated sale of large equipment

Financial Services

Ritchie Bros. Financial Services

Loan origination service that uses a brokerage model to match loan applicants with appropriate financial lending institutions

IAA Loan Payoff™

Mitigates the time-consuming process of managing a total loss claim requiring loan payoff and title release

Appraisal Services

Ritchie Bros. Appraisals

Unbiased, certified appraisal services

Inspection Services

Ritchie Bros. Inspections

Truck and lease return inspection services

IAA Inspection Services®

Remote inspections and appraisals for salvage vehicles

Listings Services

Ritchie List

Mascus

Online equipment listing service and B2B dealer portal

Refurbishing Services

Ritchie Bros. Refurbishing

Repair, paint, and other make-ready services

Ritchie Bros.

39

Table of Contents

Solution

Brand(s)

Description

Transportation & Logistics Services

Ritchie Bros. Logistics

End-to-end transportation and customs clearance solution for sellers and buyers with shipping needs

VeriTread Transport

An online transportation marketplace, connecting shippers and carriers

IAA Transport™

An integrated shipping solution allowing buyers to schedule shipment of vehicles during the checkout process

IAA Tow App™

Mobile dispatch solution that assists the tow network

Data Services

Rouse Services

A leading provider of construction equipment market intelligence

CSAToday®

Online reporting and analysis tool that gives seller customers the ability to manage their vehicle assets and monitor salvage performance.

IAA Market Value™

A solution for seller customers looking to estimate the values of their vehicles based on user-provided information and historical auction data

Parts Services

SmartEquip

Digital marketplace connecting equipment owners with parts manufacturers

Catastrophe Response Services

Catastrophe (CAT) Services™

Industry-leading strategic catastrophe response service focused on real estate capacity, operational execution, transportation logistics and vehicle merchandising and selling.

Title Services

IAA Title Services®

Full suite of title solutions services that facilitates title documentation, settlement and the title retrieval process.

Ritchie Bros.

40

Table of Contents

Contract optionsOptions

We offer consignors several contract options to meet their individual needs and sale objectives. Throughobjectives on our A&M business, optionsonsite and online marketplaces for selling used equipment or vehicles, which include:

Straight commission contracts, where the consignor receives the gross proceeds from the sale less a pre-negotiated commission rate;
Fixed commission contracts, where the consignor receives the gross proceeds from the sale less a pre-negotiated fixed commission fee;
Guarantee commission contracts, where the consignor receives a guaranteed minimum amount plus an additional amount if proceeds exceed a specified level; and
Inventory contracts, where we purchase, take custody, and hold used equipment and other assets before they are resold in the ordinary course of business.

We collectively refer to guarantee and inventory contracts as underwritten or “at-risk” contracts.

Value-added servicesServices

We also provide a wide array of value-added services to make the process of selling and buying equipment convenient for our customers, including repair and refurbishment services, financial services through Ritchie Bros. Financial Services (“RBFS”), logistical services through RB Logistics, end-to-end asset management and disposition services through RB Asset Solutions, as well as other services such as appraisals, insights, data intelligence and performance benchmarking solutions. We offer equipment listing services under the RitchieList brand in North America and Mascus brand in Europe to make private selling more efficient and safe for customers, including a secure transaction management service, complete with invoicing. We also provide an innovative technology platform that supports customers' management of the equipment lifecycle and integrates parts procurement with both original equipment manufacturers and dealers.

We also provide a wide array of value-added services to make the process of selling and buying equipment and vehicles convenient for our customers, including refurbishment services such as repair, paint and make-ready services, parts services to connect equipment owners with parts manufacturers, inspection and appraisals, financial services through Ritchie Bros. Financial Services (“RBFS”) and loan payoff services through IAA, end-to-end transportation and logistics services, as well as other services such as insights, data intelligence, performance benchmarking solutions, and title and liens processing. We offer equipment listing services under the RitchieList brand in North America and Mascus brand in Europe to make private selling more efficient and safer for customers, including a secure transaction management service, complete with invoicing. We also provide an innovative technology platform that supports customers' vehicle merchandising, manages the asset lifecycle and integrates procurement with both original equipment manufacturers (“OEM”) and dealers.

Seasonality

Our GTVoperations are both seasonal and resulting A&M segment revenue are affectedevent driven and can fluctuate from quarter to quarter. The volume of assets sold through our auctions and marketplaces is driven by the seasonal naturesupply of our business. GTVassets available for sale, as well as changes in severe weather conditions. During the third quarter, supply of assets is generally low as commercial and our A&M segment revenue tendtransportation equipment is actively being used and mild weather conditions and decreases in traffic volume can contribute to increase during the second and fourth calendar quarters, during which time we generally conduct more business thana decline in the first and third calendar quarters. Given the operating leverage inherent in our business model, the second and fourth quarter also tend to produce higher operating margins, given the higher volume and revenue generated in those quarters.available supply of vehicles.  

Revenue Mix Fluctuations

Our revenue is comprised of service revenue and inventory sales revenue. Service revenue includes: (1) commissions where a pre-negotiated commission or fixed fee is earned from A&M segment activities includes commissionsour consignors or sellers, (2) buyer fees earned at our auctions, online marketplaces, and private brokerage services, and (3) marketplace services fees earned from various services provided to buyers and sellers, which include ancillary, parts, data, towing, logistics, inspection, appraisal, online listing, financing and title and liens processing services, as well as auction-related fees, including listingservices such as documentation and buyer transaction fees. We also recognize revenues from our Other Services segment as fees within service revenue.title search services. Inventory sales revenue is recognized as part of our A&M activities and relates to revenuesrevenue earned through our inventory contracts.contracts and is recognized at the GTV of the assets sold, with the related cost recognized in cost of inventory sold.

Inventory salesOur revenue can fluctuate significantly, as it changes baseddepending on whether our customers sell using athe mix of sales arrangements completed during each period. Completed straight commission, fixed commission or guarantee commission contract, or an inventory contract at time of selling. Straight or guarantee commission contracts will result in the commission being recognized as service revenue based on a percentage of gross transaction value or based on a fixed value, while completed inventory contracts will result in the full gross transaction value of the equipmentassets sold being recorded as inventory sales revenue with the related cost recognized in cost of inventory sold.revenue. As a result, a change in the revenue mix between service revenues and revenue from inventory sales revenue can have a significant impact on our revenue growth percentages.

Ritchie Bros.

3041

Table of Contents

Performance Overview

Beginning in the first quarter of 2023, following the acquisition of IAA on March 20, 2023 and a change in our reporting structure, our operations are comprised of one operating and reportable segment.

The consolidated results presented below include the financial results of IAA for 11 days from its acquisition on March 20, 2023 and the financial results of VeriTread from its acquisition on January 18, 2023.

Net (loss) income attributableavailable to common stockholders for the first quarter of 2023 decreased 12%119% to $53.4a loss of $34.2 million, compared to $60.7$178.1 million inincome for the secondfirst quarter of 2021.2022. Diluted (loss) earnings per share (“EPS”) attributableavailable to common stockholders decreased 13%118% to $0.48$0.28 loss per share in the secondfirst quarter of 20222023 as compared to $0.55$1.60 earnings per share in the secondfirst quarter of 2021. Non-GAAP diluted2022. Diluted adjusted EPS attributableavailable to common stockholders increased 10%24% to $0.74$0.57 per share in the secondfirst quarter of 20222023 compared to $0.67$0.46 per share in the secondfirst quarter of 2021.2022.

Consolidated Results

For the secondfirst quarter of 20222023 as compared to the secondfirst quarter of 2021:2022:

Consolidated results:

Total revenue increased 22% to $484.5 million
oService revenue increased 13% to $286.5 million
oInventory sales revenue increased 38% to $198.0 million
Operating income increased 3% to $91.9 million
Non-GAAP adjusted operating income increased 12% to $119.6 million
Net income decreased 12% to $53.4 million
Non-GAAP adjusted earnings before interest, taxes, depreciation and amortization (“EBITDA”) increased 11% to $136.2 million
Cash provided by operating activities was $198.0 million for the first six months of 2022
Cash on hand at the end of the second quarter of 2022 was $531.7 million, of which $367.3 million was unrestricted, and restricted cash decreased 84% in the six month period ending June 30, 2022 as a result of the redemption of our 2021 Notes in the quarter for $931.0 million

Auctions & Marketplaces segment results:

GTV increased 10%32% to $1.7$1.9 billion, and increased 13%34% when excluding the impact of foreign exchange
A&M totalTotal revenue increased 22%30% to $433.0$512.4 million
oService revenue increased 10%40% to $235.0$343.6 million
oInventory sales revenue increased 38%13% to $198.0 million

Other Services segment results:

Other Services total revenue increased 29% to $51.5$168.8 million
oRBFS revenue increased 69%Net (loss) income decreased 116% to $19.9a loss of $28.2 million
oSmartEquip revenueAdjusted EBITDA increased 26% to $132.6 million
Cash on hand was $707.0 million, of $5.0which $568.3 million was recognized in the second quarter of 2022, which was its second full quarter since its acquisition in November 2021unrestricted

In addition, the total number of organizations activated on our business inventory management system (“IMS”), a gateway into our marketplace, increased by 50% as compared to the first quarter of 2022.

Other Company developments:Developments

On June 2, 2022,January 23, 2023, in connection with the Companysale of $485.0 million of participating Series A Senior Preferred Shares and $15.0 million of common stock investment from Starboard, we announced the appointment of Eric Jacobs as itsJeffrey Smith, Chief FinancialExecutive Officer effective June 6, 2022. Sharon Driscoll, the former Chief Financial Officer, is remainingof Starboard to our Board.
On March 19, 2023, in connection with the Company in an advisory capacityclose of the acquisition of IAA on March 20, 2023, our Board appointed Brian Bales, William Breslin, Timothy O’Day, and Michael Sieger as members to assist with the transition priorBoard. In addition, Mahesh Shah and Chris Zimmermen stepped down from the Board as of March 20, 2023. As a result of these changes, the board size increased from ten to her previously announced retirement.twelve members.

Ritchie Bros.

3142

Table of Contents

Results of Operations

Financial overviewOverview

Three months ended March 31, 

% Change

(in U.S. dollars in millions, except EPS and percentages)


2023


2022


2023 over 2022


Commissions

$

130.6

$

116.4

12

%

Buyer fees

140.7

75.6

86

%

Marketplace services revenue

72.3

52.9

37

%

Total service revenue

343.6

244.9

40

%

Inventory sales revenue

168.8

149.0

13

%

Total revenue

512.4

393.9

30

%

Costs of services


76.4


39.0


96

%

Cost of inventory sold


151.5


131.6


15

%

Selling, general and administrative


148.2


126.6


17

%

Acquisition-related and integration costs

126.2

9.6

1,215

%

Total operating expenses

538.5

331.0

63

%

Gain on disposition of property, plant and equipment


1.2


169.8

(99)

%

Operating income (loss)


(24.9)


232.7


(111)

%

Net (loss) income attributable to controlling interests

(28.1)

178.1

(116)

%

Net (loss) income available to common stockholders


(34.2)


178.1


(119)

%

Adjusted net income available to common stockholders


69.2


50.9


36

%

Adjusted EBITDA

132.6

104.9

26

%

Diluted (loss) earnings per share available to common stockholders

$

(0.28)

$

1.60

(118)

%

Diluted adjusted earnings per share available to common stockholders

$

0.57

$

0.46

24

%

Effective tax rate


24.8

%


16.9

%


790

bps

Total GTV

$

1,899.2

$

1,439.1

32

%

Service GTV

1,730.4

1,290.0

34

%

Total service revenue take rate

18.1

%

17.0

%

110

bps

Inventory GTV

168.8

149.0

13

%

Inventory return

$

17.3

$

17.4

(1)

%

Inventory rate

10.2

%

11.7

%

(150)

bps

Three months ended June 30, 

Six months ended June 30, 

% Change

% Change

(in U.S. $000's, except EPS and percentages)


2022


2021


2022 over 2021


2022


2021


2022 over 2021


Service revenue:

Commissions

$

136,403

$

129,334

5

%

$

252,778

$

233,309

8

%

Fees

150,099

123,414

22

%

278,585

225,469

24

%

Total service revenue

286,502

252,748

13

%

531,363

458,778

16

%

Inventory sales revenue

198,044

143,613

38

%

347,104

269,138

29

%

Total revenue

484,546

396,361

22

%

878,467

727,916

21

%

Costs of services


45,039


41,301


9

%


84,054


79,167


6

%

Cost of inventory sold


176,171


131,023


34

%


307,753


241,770


27

%

Selling, general and administrative


144,277


109,560


32

%


270,883


223,799


21

%

Total operating expenses

393,026

307,019

28

%

723,927

594,140

22

%

Gain on disposition of property, plant and equipment


347


175

98

%

170,167

243

69,928

%

Operating income


91,867


89,517


3

%


324,707


134,019


142

%

Operating income as a % of total revenue

19.0

%

22.6

%

(360)

bps

37.0

%

18.4

%

1,860

bps

Non-GAAP adjusted operating income

119,579

106,973

12

%

208,439

164,748

27

%

Non-GAAP adjusted operating income as a % of total revenue

24.7

%

27.0

%

(230)

bps

23.7

%

22.6

%

110

bps

Net income attributable to stockholders


53,365


60,749


(12)

%


231,459


88,937


160

%

Non-GAAP adjusted net income attributable to stockholders


83,072


74,545


11

%


134,035


110,540


21

%

Non-GAAP adjusted EBITDA

136,219

122,970

11

%

192,624

195,874

(2)

%

Diluted earnings per share attributable to stockholders

$

0.48

$

0.55

(13)

%

$

2.07

$

0.80

159

%

Non-GAAP diluted adjusted EPS attributable to stockholders

$

0.74

$

0.67

10

%

$

1.20

$

0.99

21

%

Effective tax rate


28.8

%


25.7

%


310

bps


20.0

%


24.9

%


(490)

bps

Total GTV

1,684,276

1,527,642

10

%

3,123,381

2,802,182

11

%

Service GTV

1,486,232

1,384,029

7

%

2,776,277

2,533,044

10

%

Service revenue as a % of total GTV

17.0

%

16.5

%

50

bps

17.0

%

16.4

%

60

bps

Inventory GTV

198,044

143,613

38

%

347,104

269,138

29

%

Service GTV as a % of total GTV - Mix

88.2

%

90.6

%

(240)

bps

88.9

%

90.4

%

(150)

bps

Inventory sales revenue as a % of total GTV - Mix

11.8

%

9.4

%

240

bps

11.1

%

9.6

%

150

bps

The following table presents the selected results of RBA and IAA.

Three months ended March 31, 2023

(in U.S. dollars in millions)


RBA


IAA *

Total

Commissions

$

118.0

$

12.5

$

130.6

Buyer fees

87.4

53.3

140.7

Marketplace services revenue

71.0

1.3

72.3

Total service revenue

276.4

67.1

343.6

Inventory sales revenue

156.0

12.8

168.8

Total revenue

$

432.4

$

79.9

$

512.4

Service GTV

$

1,428.4

$

302.0

$

1,730.4

Inventory GTV

156.0

12.8

168.8

Total GTV

1,584.4

314.8

1,899.2

Total service revenue take rate

17.4

%

21.3

%

18.1

%

Inventory return

15.7

1.6

17.3

Inventory rate

10.1

%

12.5

%

10.2

%

Certain amounts* Includes financial results of IAA in the prior period have been reclassified from selling, general and administrative expenses to cost of services, refer to note 2(a) of theour consolidated financial statements

Total GTV

Total GTV increased 10% to $1.7 billion in during the second quarter of 2022 and increased 11% to $3.1 billion in the first six months of 2022. Total GTV increased 13% in each of second quarter of 2022 and the first six months of 2022, when excluding the impact of foreign exchange.

In second quarter of 2022, GTV increased year-over-year with consistently strong used equipment values, aided by inflation, partially offset by lower lot counts, unfavourable mix and an unfavourable impact of foreign exchange. In Canada, several large inventory packages in Western Canada and strong year-over-year performances at our agricultural events primarily contributed to the growth in GTV volume. Canada also benefited from higher GTV generated by RBFS via PurchaseSafe which provides escrow servicesthree month period ending March 31, 2023 for private brokered transactions. In the United States, we saw favourable year-over-year performances across a number of our auctions and began to see the results of our strategic growth initiatives, including from our local yards, and investments made in our sales teams in Texas. In International, Australia saw significant growth in GTV volume driven by a higher number of inventory packages and strong performances from a large new national auction event attributable primarily to overall improved market conditions and the lifting of border restrictions.

11-day period since its acquisition on March 20, 2023.

For the first six months of 2022, total GTV increased 11% driven by the same macro economic factors as discussed above, with higher volumes growth across all regions, despite a continued unfavourable supply environment. In Canada, GTV growth was driven by strong performances across several agricultural events, strong execution by our Canadian strategic accounts teams, higher volume from RBFS, and higher numbers of inventory packages as discussed above. In the United States, GTV volume increased primarily for the same reasons as discussed above. In addition, we saw a large dispersal of construction equipment in our Phoenix, Arizona auction and positive year-over year performance at our flagship Orlando, Florida event. In International, the increase in GTV volume was primarily driven by Australia for the same reasons as discussed above, as well as due to a new event in Corio, Victoria and two agricultural events.

Ritchie Bros.

3243

Table of Contents

Total revenueGTV

Total GTV increased 32% to $1.9 billion in the first quarter of 2023 and increased 34% when excluding the impact of foreign exchange.

In the first quarter of 2023, GTV increased year-over year primarily from the inclusion of $314.8 million GTV from IAA for the 11-day period since its acquisition on March 20, 2023. Excluding IAA, our GTV increased 10% year-over-year driven by a continued rebound in lot volumes partially offset by an unfavourable impact of foreign exchange and lower average selling prices. In the United States, GTV volume increased primarily from the inclusion of IAA as well as from much higher volume driven by a strong execution by our strategic accounts team. In Canada, GTV volume decreased driven by softer year-over-year performances from the non-repeat of certain agricultural events and lower volume from our strategic accounts, coupled with the impact of unfavourable foreign exchange, partially offset by the inclusion of IAA. In International, the decrease in GTV volume was mainly driven by higher exports to North America, a non-repeat of an event in Australia and from the impact of unfavourable foreign exchange, partially offset by the inclusion of IAA.

Total Revenue

Total revenue increased 22%30% to $484.5$512.4 million in the secondfirst quarter of 2022,2023, with total service revenue increasing by 13%40% and inventory sales revenue increasing by 38%13%. Total revenue increased 21%These increases were partly driven by the inclusion of IAA which contributed approximately $80.0 million to $878.5 million forrevenues in the first six monthsquarter of 2022, with total service2023 post-acquisition.

Commissions include revenue increasing by 16%earned from consignors or sellers from the sale of assets from straight, fixed or guarantee commission contracts. Buyer fees include buyer fees earned from the sale of inventory or consigned equipment. Marketplace services revenue includes fees earned from value-added services provided to customers such as refurbishment, parts, data, transportation and inventory sales revenue increasing by 29%.logistics, inspection, appraisal online listing, financing and title and liens processing.

Foreign currency fluctuation also had an unfavourable impact on our revenue primarily due to the depreciation of the Euro, the Australian dollar, Canadian dollar, British pound sterling, and the Canadian dollarEuro relative to the U.S. dollar.

Service Revenue

Service revenue is comprised of commissions that are earned on serviceService GTV, andbuyer fees which are earned on total GTV, as well as revenues earned from our other services such as Ancillary Services, RBFS, Rouse, Mascus, RB Logistics, RB Asset Solutions and SmartEquip.marketplace services. In the first quarter of 2023, Service GTV increased 34% to $1.7 billion benefiting mostly in the United States from the inclusion of IAA.

In the secondfirst quarter of 2022,2023, total service revenue increased 13%40%, in line with higher Service GTV, with buyer fees increasing 86%, marketplace services revenue increasing 22%37%, and commissions increasing 12%.

Buyer fees increased 86% primarily as a result of the inclusion of IAA. We also saw higher buyer fees from minimum buyer fee rate increases implemented in early 2023, excluding IAA.

Marketplace services revenue increasing 5%. Service GTV increased 7% to $1.5 billion37% mainly driven from higher fees from increased activity in our ancillary services primarily in the United States, and Canada. Fees revenue increased 22%in line with buyer fees growing faster than the GTV increase of 10%, reflecting the increase in buyerGTV volume. In addition, we saw higher marketplace services revenue on transportation services from the acquisition of VeriTread in the beginning of 2023, as well as higher revenues from the growth in our data services in Rouse and in our parts services in SmartEquip. Excluding IAA, we also saw higher document fees earned from increases in document fee rates implemented in early 2022. Fees2023, as well as from the harmonization of document fee rates in our online marketplaces.

Commissions revenue also increased due to higher RBFS revenues on higher funded volumes, and12%, less than the 34% increase in Service GTV, mainly driven by the inclusion of fees from SmartEquip since its acquisitionIAA as IAA earns lower commission rates on November 2, 2021. Commissions revenue increased 5%, slightly less than the 7% increase in service GTV, primarily driven by the non-repeat of several high performing guarantee contracts in Canada, as well as a lower commissions revenue from a higher proportion of GTV contributed by RBFS from facilitating financing arrangements.

For the first six months of 2022, total service revenue increased 16% with fees revenue increasing 24% and commissions revenue increasing 8%. Service GTV increased 10% to $2.8 billion across all regionsthrough its fixed fee commission contracts with increases most notablyits consignors. In addition, we saw lower straight commission rate performances in the United States and Canada. Fees revenue increased 24% with buyer fees growing faster than GTV of 11% for the same reasons as discussed above.

Commissions revenue increased 8%, slightly less than the 10% increase in service GTV for the same reasons as discussed above.

attributable to higher volumes sold by our strategic accounts teams.

Inventory Sales Revenue

Inventory sales revenue as a percentage of total GTV increaseddecreased to 11.8%8.9% from 9.4% in the second quarter of 2022 and increased to 11.1% from 9.6%10.4% in the first six months of 2022.

In the second quarter of 2022, inventory sales revenue increased 38% primarily due to higher activity in Canada. The improved year-over-year performance in Canada was driven primarily by two large inventory contracts in the transportation sector. In International, inventory sales revenue grew in Australia from higher inventory contracts sold at a large new national auction event, as well as a result of the overall improvement in market conditions and the lifting of border restrictions. In the United States, higher volume of inventory contracts contributed to higher inventory sales revenue.

For the first six months of 2022, inventory sales revenue increased 29% primarily in the United States and Canada for the same reasons as discussed above. In addition, in the United States, inventory sales revenue also grew from a large dispersal of construction equipment in our Phoenix, Arizona auction, partially offset by a lower volume of inventory contracts in our Orlando, Florida and Atlanta, Georgia events.

Underwritten Contracts

We offer our customers the opportunity to use underwritten commission contracts to serve their disposition strategy needs, entering into such contracts where the risk and reward profile of the terms are agreeable. Our underwritten contracts, which include inventory and guarantee contracts increased to 21.0% in the second quarter of 2022 compared to 17.6% in the second quarter of 2021. For the first six months of 2022, our underwritten contracts were 19.2% compared to 16.3% in the prior period.

Operating Income

For the second quarter of 2022, operating income increased 3% or $2.4 million to $91.9 million, primarily due to flow through from higher revenues, partially offset by higher selling, general and administrative expenses. Selling, general and administrative expenses increased due to higher short-term incentive expenses and share-based payments driven by strong performance. Share-based payments also increased as a result of a higher expense relating to share-based awards issued to senior executives, and higher expense from the premium-priced options and PSU’s with market conditions granted in late 2021. We saw higher wages, salaries and benefits expenses driven by higher headcount, in part due to the acquisition of SmartEquip, as well as to accelerate our growth initiatives and our2023.

Ritchie Bros.

3344

Table of Contents

transformational journeyIn the first quarter of 2023, inventory sales revenue increased 13% mainly due to becomethe inclusion of IAA. We also saw higher inventory sales revenue in the United States as a trustedresult of a higher mix of inventory packages sourced from our strategic accounts team. These increases were partially offset by the non-repeat of a large inventory package dispersal of construction equipment. In International, we benefited from improved market conditions and the lifting of border restrictions post COVID-19 in the prior period, resulting in a softer year-over-year performance in the current quarter.

Costs of Services

In the first quarter of 2023, costs of services increased 96% to $76.4 million, mainly due to the inclusion of IAA for the 11-day period since its acquisition. Cost of services for IAA include direct expenses at auction yards which conduct regular weekly events, and includes employee compensation expenses, building and facility costs including operating lease costs for auction sites, as well as title, search and towing in providing services to buyers. We also saw higher costs from our ancillary services, in line with higher ancillary revenue, as well as higher employee compensation expenses from an increase in temporary contractors to support higher inspection activity, in line with GTV and lot count growth, mainly in the United States.

Cost of Inventory Sold

In the first quarter of 2023, cost of inventory sold increased 15% to $151.5 million primarily in line with a 13% increase in inventory sales revenue. Cost of inventory sold increased at a higher rate than the increase in inventory sales revenue, as a result of softer performances on our inventory contracts, primarily in Canada, offset by higher inventory rates from IAA.

Selling, General and Administrative

In the first quarter of 2023, selling, general and administrative increased 17% to $148.2 million, driven by higher travel, advertising and promotion costs from increased activity in global marketplace.travel, particularly within the sales group. We also saw higher meetings and conferences costs incurred to facilitate meetings with customers and attend certain conferences and tradeshow events, as well as higher marketing costs to promote new sales initiatives. Wages, salaries and benefit expenses also increased, driven by an increase in headcount to accelerate our sales growth initiatives. Building, facilities and technology costs also increased mainly due to the amortization of the right-of-use asset of the Bolton property from the sale and lease back arrangement completed innear the end of the first quarter of 2022, as well asand higher technology costs as we continue to shift to cloud-based solutions to improve customer experiences. In addition, selling, general and administrative expenses also increased in the period partly driven by the inclusion of expenses from IAA. These increases were partially offset by a favourable impact of foreign exchange.

Acquisition-related and Integration Costs

In the first quarter of 2023, acquisition-related and integration costs increased 1,215% to $116.6 million given the significant financing, legal, investment banking, advisory, and consulting costs incurred to complete the acquisition of IAA on March 20, 2023. In connection with the close of the acquisition of IAA, we sawalso incurred higher travel, advertising and promotionseverance costs from increased activity in global travel as well as inflation,to certain key executives of IAA and higher marketing expensesshare-based payments expense due to promote new initiatives. Professional fees also increased, primarily driven by our investment in new modern architecture to support our future marketplace and services strategy. Inflation also resulted in higher personnel and travel costs.the acceleration of their share-based payment awards.

Operating (Loss) Income

For the first six monthsquarter of 2022,2023, operating (loss) income increased 142% duedecreased 111% or $257.8 million to the inclusiona loss of a gain of$24.9 million, primarily driven by the $169.1 million gain recognized on property, plant and equipment from the sale of theour Bolton property in the first quarter of 2022. Operating income increased 16%, when excluding2022 that did not recur in the impactcurrent period, the increase of $116.6 million in acquisition-related and integration costs to complete the gain, primarily due to flow through fromacquisition of IAA as discussed above, and higher revenue,cost of services and SG&A. These decreases were partially offset by higher selling, general and administrative expenses mainly due the same reasons as discussed above.flow through of revenue.

Income tax expenseTax Expense and effective tax rateEffective Tax Rate

At the end of each interim period, we estimate the effective tax rate expected to be applicable for the full fiscal year. The estimate reflects, among other items, management’s best estimate of operating results. It does not include the estimated impact of foreign exchange rates or unusual and/or infrequent items, which may cause significant variations in the customary relationship between income tax expense and income before income taxes.

For the secondfirst quarter of 2022,2023, income tax expense increased 3%decreased by 126% to $21.6$9.3 million tax benefit and our effective tax rate increased 310780 bps to 28.8% as compared to the second quarter of 2021. For the first six months of 2022, income tax expense increased 96.3% to $57.9 million and our effective tax rate decreased 490 bps to 20.0%24.8% as compared to the first six monthsquarter of 2021.2022.

The increase in the effective tax rate for the second quarter of 2022 compared to the second quarter of 2021 was primarily due to higher return to provision adjustments and higher income taxes related to tax uncertainties. Partially offsetting this increase was a lower estimate of non-deductible expenses.

The decrease in the effective tax rate for the first six months of 2022 compared to the first six months of 2021 was primarily due to the non-taxable gain portion on the sale of the Bolton property. Partially offsetting this decrease was a higher estimate of income taxed in jurisdictions with higher tax rates and a lower tax deduction for PSU and RSU share unit expenses that exceeded the related compensation expense.

Net income

In the second quarter of 2022, net income attributable to stockholders decreased 12% to $53.4 million primarily due to higher interest expense, which included the loss on redemption of the 2021 Notes and certain related interest expense incurred in the quarter in connection with the discontinued Euro Auctions acquisition. For the first six months of 2022, net income attributable to stockholders increased 160% to $231.5 million, primarily due to the gain of $169.1 million on property, plant and equipment from the sale of the Bolton property recognized in the first quarter of 2022, as well as higher operating income, offset by higher interest expense incurred on our 2021 Notes.

Diluted EPS

Diluted EPS attributable to stockholders decreased 13% to $0.48 per share for the second quarter of 2022 and increased 159% to $2.07 per share for the first six months of 2022, in line with net income.

Ritchie Bros.

3445

Table of Contents

The increase in the effective tax rate for the first quarter of 2023 was primarily due to a higher tax deduction for PSU and RSU share unit expenses that exceeded the related compensation expense, a benefit on the revaluation of opening deferred liabilities and a benefit related to Foreign-Derived Intangible Income that increased our income tax benefit.

Partially offsetting these increases were a higher estimate of non-deductible expenses and the non-recurrence of the non-taxable gain portion on the sale of a parcel of land including all buildings in Bolton, Ontario in 2022.

Net (Loss) Income

In the first quarter of 2023, net (loss) income attributable to controlling interests decreased 116% to a loss of $28.2 million driven by a decrease in operating income to an operating loss in the current period, higher interest expense from a rise in interest rates and higher debt to fund the acquisition of IAA. This decrease in net income was partially offset by an income tax benefit due to a higher effective tax rate, as discussed above.

Diluted (Loss) EPS

Diluted (loss) EPS available to common stockholders decreased 118% to $0.28 loss per share for the first quarter of 2023 compared to $1.60 earnings per share in the first quarter of 2022. The decrease was primarily due to a decrease in net income as described above and the increase in number of shares issued for the acquisition of IAA.

In addition, in February 2023, we issued $485.0 million of Series A Senior Preferred Shares and $15.0 million of common shares to Starboard. The preferred equity is considered a participating security, and as a result, beginning in the first quarter of 2023, the Company calculated Diluted EPS using the two-class method, which includes the effects of the assumed conversion of the Series A Senior Preferred Shares to common shares, as well as the effect of any shares issuable under the Company’s stock-based incentive plans, if such effect is dilutive. Under this method, earnings are allocated to holders of common stock and preferred stock based on dividends declared and their respective participation rights in undistributed earnings. During the first quarter of 2023, as a result, our net income available to common stockholders decreased, which further contributed to the decrease in Diluted EPS.

Ritchie Bros.

46

Table of Contents

U.S. dollar exchange rate comparisonDollar Exchange Rate Comparison

We conduct global operations in many different currencies, with our presentation currency being the U.S. dollar. The following table presents the variance in select foreign exchange rates over the comparative reporting periods:


% Change


% Change


2022 over


2023 over

Value of one local currency to U.S. dollar


2022


2021


2021


2023


2022


2022

Period-end exchange rate - June 30,


Period-end exchange rate – March 31,


Canadian dollar

0.7768

0.8067


(4)

%

0.7410

0.7994


(7)

%

Euro


1.0477


1.1857


(12)

%


1.0881


1.1074


(2)

%

British pound sterling

1.2343

1.3148

(6)

%

Australian dollar

0.6898

0.7499

(8)

%

0.6684

0.7491

(11)

%

Average exchange rate - Three months ended June 30,


Average exchange rate – Three months ended March 31,


Canadian dollar

0.7836

0.8139


(4)

%

0.7397

0.7892


(6)

%

Euro

1.0658


1.2046


(12)

%

1.0732


1.1225


(4)

%

British pound sterling

1.2146

1.3421

(10)

%

Australian dollar

0.7151

0.7698

(7)

%

0.6841

0.7236

(5)

%

Average exchange rate - Six months ended June 30,


Canadian dollar

0.7864

0.8139


(3)

%

Euro

1.0941


1.2046


(9)

%

Australian dollar

0.7194

0.7698

(7)

%

For the secondfirst quarter of 2022,2023, foreign exchange had an unfavourable impact on total revenue and a favourable impact on expenses. These impacts were primarily due to the fluctuations in the Canadian dollar, the Euro, Australian dollarBritish pound sterling, and CanadianAustralian dollar exchange rates relative to the U.S. dollar.

Non-GAAP Measures

As part of management’s non-GAAP measures, we may eliminate the financial impact of adjusting items which are after-tax effects of significant recurring and non-recurring items that we do not consider to be part of our normal operating results.

Non-GAAP adjusted net income attributed to stockholders increased 11% to $83.1 million in the second quarter of 2022 and increased 21% to $134.0 million for the first six months of 2022.

Non-GAAP diluted Adjusted EPS attributable to stockholders increased 10% to $0.74 per share in the second quarter of 2022 and increased 21% to $1.20 per share for the first six months of 2022.

Non-GAAP adjusted EBITDA increased 11% to $136.2 million in the second quarter of 2022 and increased 23% to $241.1 million for the first six months of 2022.

Debt at the end of the second quarter of 2022 represented 2.2 times net income as at and for the 12 months ended June 30, 2022, compared to debt at the second quarter of 2021, which represented 3.7 times net income as at and for the 12 months ended June 30, 2021. The non-GAAP adjusted net debt/non-GAAP adjusted EBITDA was 0.7 times as at and for the 12 months ended June 30, 2022, compared to 0.9 times as at and for the 12 months ended June 30, 2021.

Ritchie Bros.

35

Table of Contents

Segment Performance

We provide our customers with a wide array of services. The following table presents a breakdown of our consolidated results between the A&M segment and Other Services segment. A complete listing of channels and brand solutions under the A&M segment, as well as our Other Services segment, is available in our Annual Report on Form 10-K for the year ended December 31, 2021.

Three months ended June 30, 2022

Six months ended June 30, 2022

(in U.S $000's)


A&M


Other


Consolidated

A&M


Other


Consolidated

Service revenue:

Commissions

$

136,403

$

$

136,403

$

252,778

$

$

252,778

Fees

98,588

51,511

150,099

183,217

95,368

278,585

Total service revenue

234,991

51,511

286,502

435,995

95,368

531,363

Inventory sales revenue

198,044

198,044

347,104

347,104

Total revenue

$

433,035

$

51,511

$

484,546

$

783,099

$

95,368

$

878,467

Ancillary and logistical service expenses

13,446

13,446

24,201

24,201

Other costs of services

28,985

2,608

31,593

54,559

5,294

59,853

Cost of inventory sold


176,171


176,171


307,753


307,753

Selling, general and administrative


125,535


18,742


144,277


234,346


36,537


270,883

Segment profit

$

102,344

$

16,715

$

119,059

$

186,441

$

29,336

$

215,777

Three months ended June 30, 2021

Six months ended June 30, 2021

(in U.S $000's)

A&M


Other


Consolidated

A&M


Other


Consolidated

Service revenue:

Commissions

$

129,334

$

$

129,334

$

233,309

$

$

233,309

Fees

83,334

40,080

123,414

151,430

74,039

225,469

Total service revenue

212,668

40,080

252,748

384,739

74,039

458,778

Inventory sales revenue

143,613

143,613

269,138

269,138

Total revenue

$

356,281

$

40,080

$

396,361

$

653,877

$

74,039

$

727,916

Ancillary and logistical service expenses

14,819

14,819

27,088

27,088

Other costs of services

25,176

1,306

26,482

49,480

2,599

52,079

Cost of inventory sold


131,023


131,023


241,770


241,770

Selling, general and administrative


99,215


10,345


109,560


201,996


21,803


223,799

Segment profit

$

100,867

$

13,610

$

114,477

$

160,631

$

22,549

$

183,180

Ritchie Bros.

3647

Table of Contents

Auctions and Marketplaces Segment

Results of A&M segment operations are presented below for the comparative reporting periods.Key Operating Metrics

Three months ended June 30, 

Six months ended June 30, 

% Change

% Change


2022 over


2022 over


(in U.S. $000's, except percentages)

2022


2021

2021

2022


2021

2021

Service revenue:

Commissions

$

136,403

$

129,334

5

%  

252,778

233,309

8

%

Fees

98,588

83,334

18

%  

183,217

151,430

21

%

Total service revenue


234,991

212,668

10

%  

$

435,995

$

384,739

13

%

Inventory sales revenue


198,044

143,613

38

%  

347,104

269,138

29

%

Total revenue

$

433,035

$

356,281

22

%  

783,099

653,877

20

%

A&M service revenue as a % of total A&M revenue

54.3

%  

59.7

%  

(540)

bps

55.7

%  

58.8

%  

(310)

bps

Inventory sales revenue as a % of total A&M revenue

45.7

%  

40.3

%  

540

bps

44.3

%  

41.2

%  

310

bps

Costs of services

28,985

25,176

15

%  

54,559

49,480

10

%

Cost of inventory sold

176,171

131,023

34

%  

307,753

241,770

27

%

Selling, general and administrative

125,535

99,215

27

%  

234,346

201,996

16

%

A&M segment expenses

$

330,691

$

255,414

29

%  

$

596,658

$

493,246

21

%

Cost of inventory sold as a % of A&M expenses

53.3

%  

51.3

%

200

bps

51.6

%  

49.0

%

260

bps

A&M segment profit

$

102,344

$

100,867

1

%  

$

186,441

$

160,631

16

%

Total GTV

1,684,276

1,527,642

10

%  

3,123,381

2,802,182

11

%

A&M service revenue as a % of total GTV- Rate


14.0

%  

13.9

%

10

bps

14.0

%  

13.7

%

30

bps

We regularly review a number of metrics, including the following key operating metrics, to evaluate our business, measure our performance, identify trends affecting our business, and make operating decisions. We believe these key operating metrics are useful to investors because management uses these metrics to assess the growth of our business and the effectiveness of our operational strategies.

We define our key operating metrics as follows:

Gross transaction value: Represents total proceeds from all items sold at the Company’s auctions and online marketplaces. GTV is not a measure of financial performance, liquidity, or revenue, and is not presented in the Company’s consolidated financial statements.

Total service revenue take rate: Total service revenue divided by total GTV

Inventory return: Inventory sales revenue less cost of inventory sold.

Inventory rate: Inventory return divided by inventory sales revenue.

Total lots sold: A single asset to be sold, or a group of assets bundled for sale as one unit. Low value assets are sometimes bundled into a single lot, collectively referred to as “small value lots”.

Historically, we reported total lots sold excluding our GovPlanet business metrics. However, beginning in the first quarter of 2023, with the change in management organizational structure and the acquisition of IAA, management has begun to review all auction metrics of the combined businesses, including GovPlanet. In addition, historically, the total bids per lot sold metric was used by management as a key metric. Beginning in the first quarter of 2023, the metric was discontinued as it is no longer considered meaningful when reviewing the auction metrics of the combined business and of our one reportable segment.

Non-GAAP Measures

As part of management’s non-GAAP measures, we may eliminate the financial impact of certain items that we do not consider to be part of our normal operating results.

Adjusted operating income increased 27% to $112.4 million in the first quarter of 2023.

Adjusted net income available to common stockholders increased 36% to $69.2 million in the first quarter of 2023.

Diluted adjusted EPS available to common stockholders increased 24% to $0.57 per share in the first quarter of 2023.

Adjusted EBITDA increased 26% to $132.6 million in the first quarter of 2023.

Ritchie Bros.

48

Table of Contents

Gross Transaction Value

In response to COVID-19, in March 2020, we transitioned all our traditional onsite auctions to online bidding utilizing our existing online bidding technology and simultaneously ceased almost all public attendance at our live auction theaters. Our core online auction channels (IronPlanet.com, GovPlanet.com, Marketplace-E) continued to operate as usual. In 2022, we began to return to live in-person onsite bidding at some of our auction events, offering both onsite and online bidding.

To facilitate the auction process, we have continued to enable equipment drop off at our physical yards, with buyers able to conduct inspections pre-auction and collect equipment post auction. In addition, we balanced Timed Auctioned Lots (“TAL”) solutions for selected industrial and on-the-farm agriculture events.

We believe it is meaningful to consider revenue in relation to GTV. Total GTV and Service GTVrevenue by geographical regions, as well as GTV by sector,geography are presented below, for thealong with comparative reporting period.periods.

GTV by Geography

Three months ended June 30, 

Six months ended June 30, 

Three months ended March 31, 

% Change

% Change

% Change

(in U.S. $000's, except percentages)


2022


2021

2022 over 2021

2022


2021

2022 over 2021

(in U.S. dollars in millions, except percentages)


2023


2022

2023 over 2022

Total GTV by Geography

United States

$

803,604

$

740,826

8

%

$

1,723,456


$

1,622,479

6

%

$

1,400.9

$

919.8

52

%

Canada

626,389

551,075

14

%

936,157


761,687

23

%

291.9

309.8

(6)

%

International

254,283

235,741

8

%

463,768


418,016

11

%

206.4

209.5

(1)

%

Total GTV

1,684,276

1,527,642

10

%

3,123,381


2,802,182

11

%

$

1,899.2

$

1,439.1

32

%


Service GTV by Geography


United States

736,268

686,973

7

%

1,567,428


1,502,289

4

%

$

1,297.9


$

831.1

56

%

Canada

586,945

543,147

8

%

887,648


744,044

19

%

277.6

300.7

(8)

%

International

163,019

153,909

6

%

321,201


286,711

12

%

154.9

158.2

(2)

%

Total Service GTV1

1,486,232

1,384,029

7

%

2,776,277

2,533,044

10

%

$

1,730.4

$

1,290.0

34

%

1 Service GTV is calculated as total GTV less inventory sales revenue

Revenue by Geography

Three months ended March 31, 

% Change

(in U.S. dollars in millions, except percentages)


2023


2022

2023 over 2022

United States


Service revenue

$

257.2

$

159.4

61

%

Inventory sales revenue


103.0

88.7

16

%

Total revenue – United States


360.2


248.1

45

%

Canada


Service revenue

53.9

56.1

(4)

%

Inventory sales revenue


14.4

9.1

58

%

Total revenue – Canada


68.3

65.2

5

%

International


Service revenue

32.5

29.4

11

%

Inventory sales revenue


51.4


51.2

0

%

Total revenue – International


83.9


80.6

4

%

Total


Service revenue

343.6

244.9

40

%

Inventory sales revenue


168.8


149.0

13

%

Total revenue

$

512.4

$

393.9

30

%

United States

In the first quarter of 2023, service revenue increased 61%, partially due to the 56% increase in Service GTV, which reflects the inclusion of IAA, as well as much higher volume driven by a strong execution by our strategic accounts team. Excluding IAA, we also saw higher buyer fees driven by higher minimum buyer fee rates implemented in early 2023 for sales of commercial and transportation equipment. Marketplace service revenue increased due to increased activity in our ancillary services, in line with increase in GTV volume. Excluding IAA, we also saw higher document fees from increases in document fees implemented in early 2023 and the harmonization of document fees in our online marketplaces implemented in Q4 2022. In addition, marketplace services revenue also increased due to the inclusion of the acquisition of VeriTread from its acquisition in the beginning of 2023, and revenue growth from our data services in Rouse and parts services in SmartEquip. These increases were partially offset by a softer straight commission rate performance due to a higher proportion of GTV sourced from our strategic accounts. In addition, we saw softer guarantee rate performance from the non-repeat of several high performing guarantee contracts.

In the first quarter of 2023, inventory sales revenue increased 16% primarily driven by a higher volume of inventory contracts sourced from our strategic accounts group, partially offset by the non-repeat of a large inventory package dispersal of construction equipment.

Ritchie Bros.

49

Table of Contents

Canada

In the first quarter of 2023, service revenue decreased 4% while Service GTV decreased 8%. Service revenue decreased at a slower rate than Service GTV primarily due to stronger straight commission rate performances from a lower mix of agriculture sales due to the non-repeat of certain agricultural events, as well as the inclusion of IAA, partially offset by softer performances on our guarantee contracts.

In the first quarter of 2023, inventory sales revenue increased 58% primarily due to favourable year-over-year performances in our Eastern Canada region.

International

In the first quarter of 2023, service revenue increased 11% while Service GTV decreased 2%. The increase in service revenue was primarily due to higher marketplace services revenue from increased activity from our ancillary services, as well as higher buyer fees from higher minimum buyer fee rates implemented in early 2023 for sales of commercial and transportation equipment, as well as due to the inclusion of IAA.

In the first quarter of 2023, inventory sales revenue remained flat. We saw softer year-over-year performances as in the prior period, we benefited from increased inventory sales revenue from improved market conditions and the lifting of border restrictions post COVID-19, including the non-repeat of an event in Australia, offset by the inclusion of inventory revenue from IAA.

GTV by Sector

The following table illustrates the breakdown of total GTV by sector for the first quarter of 2023 compared to the first quarter of 2022.

The automotive sector includes all consumer automotive vehicles.The commercial construction and transportation sector includes heavy equipment such as excavators, dozers, lift and material handling, vocational and commercial trucks and trailers. The other sector primarily includes assets and equipment sold in the agricultural, forestry and energy industries, and government surplus assets, as well as smaller consumer recreational transportation items. All sectors include salvage and non-salvage transactions.

Three months ended March 31, 

% Change

(in U.S. dollars in millions, except percentages)

2023


2022


2023 over 2022


Automotive

$

331.7

$

39.2

746

%  

Commercial construction and transportation

1,190.0

1,026.2

16

%  

Other

377.5


373.7

1

%  

$

1,899.2

$

1,439.1

32

%  

In the first quarter of 2023, total GTV mix compared to the first quarter of 2022 increased by 750% in the automotive sector, mainly due to the inclusion of IAA. GTV mix increased by 16% in the commercial construction and transportation sector mainly in the United States driven by volume sourced in strategic accounts.

Total Lots Sold by Sector

The following table illustrates the breakdown of total lots sold by sector for the first quarter of 2023 compared to the first quarter of 2022.

Three months ended March 31, 

% Change

(in '000's of lots sold, except percentages)

2023


2022


2023 over 2022


Automotive

87.5

4.1

2,034

%  

Commercial construction and transportation

56.6

39.2

44

%  

Other

105.2


84.0

25

%  

249.3

127.3

96

%  

In the first quarter of 2023, the total lots sold mix compared to the first quarter of 2022 increased by 2,053% in the automotive sector due to the inclusion of lots sold from IAA. Total lots sold mix increased in the commercial construction and transportation sector by 44% and increased by 26% in the other assets sector, primarily in the United States, driven by an increase in lot counts sold.

Ritchie Bros.

50

Table of Contents

Credit Facilities

We have a credit agreement which is comprised of multicurrency revolving facilities (the “Revolving Facilities”) and a delayed-draw term loan facility (the “DDTL Facility”), and the Term Loan A facility (the “TLA Facility” and together with the Revolving Facilities and DDTL Facility, the “Facilities”).

In connection with the IAA acquisition, the Company entered into a debt commitment letter with certain financial institutions that committed to provide, subject to the terms and conditions, a bridge loan facility in an aggregate principal amount of up to $2.8 billion and a backstop revolving facility in an aggregate principal amount of up to $750.0 million. The Company subsequently amended the terms of its Credit Agreement which, among other things, permitted the acquisition of IAA and served to terminate the backstop commitments (including the revolving backstop facility and $88.9 million of bridge commitments that served as a backstop for its existing term loans under the credit agreement) and replaced an additional $1.8 billion of bridge commitments with the TLA Facility.

The Credit Agreement was amended in December 2022, which, among other things, (i) permitted the proposed merger with IAA, (ii) provided commitments for the TLA Facility in an aggregate principal amount of up to $1.8 billion to be used to finance, in part, the IAA acquisition, and (iii) provided the Company the ability to borrow up to $200.0 million of the Revolving Facilities under the Credit Agreement on a limited conditionality basis to finance, in part, the IAA acquisition.

On March 20, 2023, with the acquisition of IAA, the TLA Facility of $1.8 billion was funded at an adjusted term SOFR of 7.54%. The TLA Facility is comprised of a facility denominated in US dollars (“USD TLA Facility”) and a facility denominated in Canadian dollars (“CAD TLA Facility”). The Company’s existing DDTL Facility of CAD $115.9 million was refinanced and converted to the CAD TLA Facility, an alternative currency term rate loan.

Credit facilities at March 31, 2023 and December 31, 2022 were as follows:

(in U.S. dollars in millions, except percentages)


March 31, 2023


December 31, 2022


% Change


Committed


DDTL Facility

$

$

85.5


(100)

%

Term Loan A Facility (denominated in Canadian dollars)

84.8

100

%

Term Loan A Facility (denominated in US dollars)

1,825.0

100

%

Revolving credit facilities


750.0


750.0


%

Uncommitted

Revolving credit facilities

10.0

10.0

%

Total credit facilities

$

2,669.8

$

845.5


216

%

Unused


Revolving credit facilities


709.4


709.8


(0)

%

Total credit facilities unused

$

709.4

$

709.8


(0)

%

Revolving Credit Facilities

At March 31, 2023, of the $760.0 million in revolving credit facilities, $750.0 million relates to our syndicated credit facility and $10.0 million relates to credit facilities in certain foreign jurisdictions.

On March 31, 2023, we had $719.4 million of unused revolving credit facilities, which consisted of:

$709.4 million under our Credit Agreement that expires on September 21, 2026;

$5.0 million under a foreign credit facility that expires on October 27, 2023; and

$5.0 million under a foreign demand credit facility that has no maturity date.

Ritchie Bros.

3751

Table of Contents

GTV by SectorTerm Loan Facility

The following pie charts illustrate the breakdown of total GTV by sector for the second quarter of 2022 comparedamendment to the second quarter of 2021.

The construction sector includes heavy equipment such as trucks, excavators, cranes and dozers. The transportation sector includes vehicles, buses, trailers and trucks that are used for transport. The other sector primarily includes equipment sold in the agricultural, forestry and energy industries.

In the second quarter of 2022, total GTV mix compared to the second quarter of 2021 increased by 6 percentage points in the transportation sector driven by large inventory contracts in Canada, primarily offset by a 5 percentage points decrease in the construction sector.

Graphic

Total Auction Metrics

We review a number of metrics including the following key metrics, to evaluate our business, measure our performance and identify trends affecting our business.

Bids per lot sold. Each bid is completed electronically through our real-time online bidding system. A lot is defined as a single asset to be sold, or a group of assets bundled for sale as one unit. This metric calculates the total number of bids received for a lot divided by the total number of lots sold.

Total lots sold. We define a lot as a single asset to be sold, or a group of assets bundled for sale as one unit. Low value assets are sometimes bundled into a single lot, collectively referred to as “small value lots”.

Three months ended June 30, 

Six months ended June 30, 

% Change

% Change


2022


2021


2022 over 2021


2022


2021


2022 over 2021


Bids per lot sold *


28


27

4

%  

28


28

%

Total lots sold *


144,167


148,206

(3)

%  

249,934


263,035

(5)

%

* Management reviews industrial equipment auction metrics excluding GovPlanet; as a result, GovPlanet business metrics are excluded from these metrics

The total number of bids per lot sold increased 4% to 28 in the second quarter of 2022 compared to the second quarter of 2021 and remained flat for the first six months of 2022, reflecting continued strong demand for used equipment from buyers in a tight supply market.

The total lots sold decreased 3% to 144,167 in the second quarter of 2022 primarily impacted by the tight supply market, the shift to a lower proportion of small value lots sold across all regions, as well as reduction in lot counts, partially offset by higher average selling prices. For the first six months of 2022, the total lots sold decreased 5% to 249,934, primarily for the same reasons as discussed above.

Ritchie Bros.

38

Table of Contents

A&M revenue

Total A&M revenue increased 22% to $433.0 million in the second quarter of 2022.

A&M revenue by geographical region are presented below:

Three months ended June 30, 

Six months ended June 30, 

% Change

% Change

(in U.S. $000's, except percentages)


2022


2021

2022 over 2021

2022


2021

2022 over 2021

A&M Revenue by Geography

United States


Service revenue

$

127,318

$

112,183

13

%

$

266,188


$

236,388

13

%

Inventory sales revenue


67,337


53,853

25

%

156,028


120,190

30

%

A&M revenue - United States


194,655


166,036

17

%

422,216


356,578

18

%

Canada


Service revenue


80,702


76,021

6

%

119,517


104,080

15

%

Inventory sales revenue


39,444


7,928

398

%

48,509


17,643

175

%

A&M revenue - Canada


120,146


83,949

43

%

168,026


121,723

38

%

International


Service revenue


26,971


24,464

10

%

50,290


44,271

14

%

Inventory sales revenue


91,263


81,832

12

%

142,567


131,305

9

%

A&M revenue - International


118,234


106,296

11

%

192,857


175,576

10

%

Total


Service revenue


234,991


212,668

10

%

435,995


384,739

13

%

Inventory sales revenue


198,044


143,613

38

%

347,104


269,138

29

%

Total A&M revenue


433,035


356,281

22

%

783,099


653,877

20

%

United States

In the second quarter of 2022, service revenue increased 13% partially due to the 7% increase in service GTV. The remaining increase was primarily due to higher buyer fee rates implemented in early 2022. In addition, we saw positive rate performances in our straight commission contracts from a lower proportion of GTV sourced from strategic accounts. These increases were partially offset by lower buyer fees on a lower proportion of small value lots.

For the first six months of 2022, service revenue increased 13% while Service GTV increased 4% primarily for the same reasons as discussed above. In addition, we saw lower fees associated with online inspections driven by lower online lot counts.

In the second quarter of 2022, inventory sales revenue increased 25% primarily due to higher volume of inventory contracts, including higher volumes sold through our GovPlanet business as a result of the new non-rolling and rolling stock contracts effective June 1, 2021. For the first six months of 2022, inventory sales revenue increased 30% primarily due to a large dispersal of construction equipment in our Phoenix, Arizona auction, as well as for the same reasons as discussed earlier. These increases were partially offset by a lower volume of inventory contracts in Orlando, Florida and Atlanta, Georgia auctions.

Canada

In the second quarter of 2022, service revenue increased 6%, slightly less than the 8% increase in Service GTV primarily driven by the non-repeat of several high performing guarantee contracts in the prior year, as well as lower commissions from a higher proportion of GTV contributed by RBFS. These were partially offset by an increase in fees from the higher buyer fee rates implemented in early 2022.

For the first six months of 2022, service revenue increased 15% while Service GTV increased 19%. Service revenue growth was lower than the increase in Service GTV primarily for the same reasons as discussed above.

In the second quarter of 2022, inventory sales revenue increased 398% primarily driven by two large inventory contracts in the transportation sector.

For the first six months of 2022, inventory sales revenue increased 175% primarily for the same reason.

Ritchie Bros.

39

Table of Contents

International

In the second quarter of 2022, service revenue increased 10% partially due to the 6% increase in Service GTV. The remaining increase was due to higher buyer fees in Australia arising from a favourable mix of contracts resulting in net higher buyer fees rate.

For the first six months of 2022, service revenue increased 14% primarily due to the 12% increase in Service GTV for the same reason as discussed above.

In the second quarter of 2022, inventory sales revenue increased 12%, mainly in Australia driven by a higher number of inventory contracts sold at a large new national auction event, as well as from the overall improvement in market conditions and the lifting of border restrictions.

For the first six months of 2022, inventory sales revenue increased 9% primarily driven by growth in Australia as discussed above, combined with the addition of one new event and two agricultural events.

Costs of services

A&M costs of services increased 15% to $29.0 million in the second quarter of 2022 compared to the second quarter of 2021 in line with total GTV increase of 10%. In addition, we incurred additional fees paid to third parties in connection with profit sharing arrangements on inventory packages.

For the first six months of 2022, A&M costs of services increased 10% to $54.6 million, in line with total GTV increase of 11% and for the same reason as discussed above. We also incurred higher building, facilities and technology expenses to support our flagship Orlando event, which returned to live in-person onsite bidding.

Cost of inventory sold

A&M cost of inventory sold increased 34% to $176.2 million in the second quarter of 2022 compared to the second quarter of 2021 primarily in line with 38% increase in inventory sales revenue. Cost of inventory sold increased at a lower rate than the increase in inventory sales revenue, indicating an increase in the revenue rates, primarily in Canada.

For the first six months of 2022, A&M cost of inventory sold increased 27% to $307.8 million primarily in line with the 29% increase in inventory sales revenue.

Selling, general and administrative

A&M selling, general and administrative increased 27% to $125.5 million in the second quarter of 2022 compared to the second quarter of 2021. This increase was primarily due to higher short-term incentive expenses and higher share-based payments driven by strong performance. Share-based payments also increased as a result of a higher expense relating to share-based awards issued to senior executives, and higher expense from the premium-priced options and PSU’s with market conditions granted in late 2021. Building, facilities and technology costs also increased mainly due to the amortization of the right-of-use asset of the Bolton property from the sale and lease back arrangement completed in the first quarter of 2022, as well as higher costs as we shift to cloud-based solutions to improve customer experiences. In addition, we saw higher wages, salaries and benefits expenses, as well as higher headcount to accelerate our growth initiatives and our transformational journey to become a trusted global marketplace. We also saw higher travel, advertising and promotion costs from increased activity in global travel, and higher marketing expenses to promote new initiatives. Inflation has also driven higher personnel and travel costs. Professional fees also increased primarily driven by our investment in new modern architecture to support our future marketplace and services strategy. These increases were partially offset by a favourable impact of foreign exchange.

For the first six months of 2022, A&M selling, general and administrative increased 16% to $234.3 million primarily due to higher building, facilities and technology costs, higher share-based payments, higher professional fees, higher wages, salaries and benefits expenses and travel, advertising and promotion for the same reasons as discussed above.

Ritchie Bros.

40

Table of Contents

Other Services Segment

Results of Other Services segment operations are presented below for the comparative reporting periods.

Three months ended June 30, 

Six months ended June 30, 

% Change

% Change

(in U.S. $000's, except percentages)


2022


2021

2022 over 2021


2022


2021

2022 over 2021


Service revenue

$

51,511

$

40,080

29

%  

$

95,368

$

74,039

29

%

Ancillary and logistical service expenses


13,446


14,819

(9)

%


24,201


27,088

(11)

%

Other costs of services


2,608


1,306

100

%  


5,294


2,599

104

%

Selling, general and administrative


18,742


10,345

81

%  


36,537


21,803

68

%

Other services profit

$

16,715

$

13,610

23

%  

$

29,336

$

22,549

30

%

In the second quarter of 2022, Other Services revenue increased 29% to $51.5 million primarily due to higher RBFS revenues of $8.1 million, and $5.0 million of second full quarter revenue recognized since the acquisition of SmartEquip on November 2, 2021. These increases were partially offset by lower ancillary revenue of $1.4 million driven by lower fees earned on redeployment of assets in the United States.

In the first six months of 2022, Other Services revenue increased 29% to $95.4 million due to higher RBFS revenues of $14.6 million and $9.7 million of revenue from SmartEquip. These increases were partially offset by lower ancillary revenue of $2.2 million.

Ancillary and logistical service expenses decreased 9% to $13.4 million in the second quarter of 2022 and decreased 11% to $24.2 million in the first six months of 2022, in line with lower ancillary revenue. Other costs of services increased 100% to $2.6 million in the second quarter of 2022 and increased 104% to $5.3 million in the first six months of 2022 mainly due to the inclusion of SmartEquip since its acquisition on November 2, 2021. Selling, general and administrative increased 81% to $18.7 million in the second quarter of 2022 and increased 68% to $36.5 million in the first six months of 2022, primarily in wages, salaries and benefits expenses due to the growth in our RBFS business, the inclusion of SmartEquip and higher headcount in Rouse to support our growth initiatives.

RBFS revenue increased 69% in the second quarter of 2022 and increased 70% in the first six months of 2022, driven by higher funded volumes and improved rate on fees earned from facilitating financing arrangements. In the second quarter of 2022, our funded volume, which represents the amount of lending brokered by RBFS, increased 51% to $298.0 million, and increased 57% when excluding the impact of foreign exchange. In the first six months of 2022, our funded volume increased 55% to $531.6 million, and increased 58% when excluding the impact of foreign exchange.

In the second quarter of 2022, Other Services profit increased 23% to $16.7 million mainly driven by RBFS. In the first six months of 2022, Other Services profit increased 30% to $29.3 million also driven by RBFS.

Additionally, in the first quarter of 2021, we launched a business version of our IMS, which offers our customers end-to-end asset management and disposition services, data analytics, dashboards, branded e-commerce sites and multiple external sales channels to help our customers achieve optimal returns. We continue to grow the number of organizations activated on IMS. During the second quarter of 2022, the number of organizations activated on our IMS increased by 50% compared to the first quarter of 2022.

As we evolve to a marketplace, we also facilitate retail and peer-to-peer auction events and equipment sale transactions via our online technology in exchange for hosting fees. During the second quarter of 2022, customers that used this service disposed of $31.9 million of assets, which is a decrease of 12% from the second quarter of 2021 primarily driven by an unfavourable supply environment. For the first six months of 2022, this service facilitated transactions of $68.3 million, a 14% decrease as compared to the prior year for the same reason mentioned above.

Ritchie Bros.

41

Table of Contents

Liquidity and Capital Resources

Our principal sources of liquidity are our cash provided by operating activities and borrowings from our revolving credit facilities, which we renewed on September 21, 2021.

We believe that our existing working capital and availability under our credit facilities are sufficient to satisfy our present operating requirements and contractual obligations. Our material short-term cash requirements include (i) inventory purchases, (ii) capital expenditures for intangible assets and property, plant and equipment (iii) payment of quarterly dividends on an as-declared basis, (iv) settlement of contracts with consignors and other suppliers, (v) personnel expenditures, with a majority of bonuses paid annually in the first quarter following each fiscal period, (vi) income tax payments, primarily paid in quarterly installments, (vii) lease payments, and (viii) principal payments on short-term and current portions of long-term debt, and (ix) interest payments related to our current debt obligations. We also have inventory purchase commitments, related to our GovPlanet business, which is described in Note 26 of our consolidated financial statements.

During the first quarter of 2022, we completed the sale and leaseback of the Bolton property for a total sale consideration and net proceeds of approximately $165.0 million. The proceeds from the sale were used to repay our revolving credit facilities. We have also leased back the Bolton property while we complete the acquisition and development of a replacement property and auction site located in Amaranth, Ontario over the next two to three years. We intend to fund the material cash requirement for the acquisition and development of the Amaranth property from cash flows from ongoing operations.

During the second quarter of 2022, as a result of the Company’s decision to discontinue the phase 2 review by the United Kingdom’s Competition and Markets Authority (“CMA”), the Company redeemed all of the 2021 Notes, which were held in escrow, at a redemption price equal to 100% of the original offering price of the notes, plus accrued and unpaid interest. As such, on May 4, 2022, the Company paid net proceeds of approximately $931 million to its bondholders.

Other long-term cash requirements include long-term debt principal repayments, which are disclosed according to maturity date in Note 21 in our Annual Report on Form 10-K for the year ended December 31, 2021, as well as interest payments related to our non-current debt obligations. We are also committed under various letters of credit and provide certain guarantees in the normal course of business.

If we were to consider further acquisitions to deliver on our strategic growth drivers, we may seek financing through equity markets or additional debt markets. The sale of equity securities may result in dilution to our shareholders. Issuance of preferred equity securities could provide for rights, preferences or privileges senior to those of our common stock. Further, this additional capital may not be available on reasonable terms, or at all.

We assess our liquidity based on our ability to generate cash and secure credit to fund operating, investing, and financing activities. Our liquidity is primarily affected by fluctuations in cash provided by operating activities, significant acquisitions of businesses, payment of dividends, share repurchases, our net capital spending1, and voluntary repayments of debt. We believe our principal sources of liquidity, which include cash flow from operations, our current unused capacity under our revolving credit facilities of $683 million, is sufficient to fund our current operating activities and future growth strategies.

Cash provided by operating activities can fluctuate significantly from period to period due to factors such as differences in the timing, size and number of auctions during the period, the volume of our inventory contracts, the timing of the receipt of auction proceeds from buyers and of the payment of net amounts due to consignors, as well as the location of the auction with respect to restrictions on the use of cash generated therein.

1We calculate net capital spending as property, plant and equipment additions plus intangible asset additions less proceeds on disposition of property, plant and equipment.

Ritchie Bros.

42

Table of Contents

Cash flows

Six months ended June 30, 

% Change

(in U.S. $000's, except percentages)

2022


2021

2022 over 2021


Cash provided by (used in):


Operating activities

$

198,026

$

211,381

(6)

%

Investing activities


140,278


(23,303)

(702)

%

Financing activities


(1,156,323)


(50,861)

2,173

%

Effect of changes in foreign currency rates


(12,773)


(1,389)

820

%

Net (decrease) increase in cash, cash equivalents, and restricted cash

$

(830,792)

$

135,828

(712)

%

Net cash provided by operating activities decreased $13.4 million in the first six months of 2022, mainly due to lower cash inflows from the change in operating assets and liabilities. This change arose primarily due to the timing, size and number of auctions. We also saw a net higher outflow from inventory, with an increase in purchases in the United States partially offset by higher sales in International mainly in Australia, as well as an increase in advances paid against auction contracts for several consignment contracts in Europe, which are expected to be sold in the third quarter of 2022. These outflows were offset by cash inflows from income taxes for the accrual of the taxable gain portion on the sale of our Bolton propertyCredit Agreement made in the first quarter of 2022, and lower-income tax payments as a result of timing of instalments. We also saw a positive net cash flow impact from prepaying in the fourth quarter of 2021 and the first quarter of 2022 interest on the 2021 Notes held in escrow and from lower bonus payments.

Net cash provided by investing activities increased $163.6 million in the first six months of 2022. This increase was primarily due to the sale of our Bolton property for total net cash proceeds of approximately $165.0 million.

Net cash used in financing activities increased $1.1 billion in the first six months of 2022, primarily due to the $931 million repayment of long-term debt as a result of the redemption of our 2021 Notes on May 4, 2022. We also made a $164.0 million repayment of debt on our long-term revolving credit facilities from the proceeds from the sale of the Bolton property in the first quarter of 2022. In addition, we also saw lower proceeds of $7.8 million from the exercise of stock options and higher dividends of $6.8 million paid to our shareholders compared to the comparative period in 2021. Partially offsetting these changes were a $15.4 million increase in draws on our short-term debt and a decrease of $5.4 million in withholding tax payments on the issuance of shares.

Dividend information

We declared a dividend of $0.25 per common share for each of the quarter ended June 30, 2021, September 30, 2021, December 31, 2021, and March 31, 2022. We have declared, but not yet paid, a dividend of $0.27 per common share for the quarter ended June 30, 2022. All dividends that we pay are “eligible dividends” for Canadian income tax purposes unless indicated otherwise.

Return on average invested capital

Our return on average invested capital is calculated as net income attributable to stockholders divided by our average invested capital. We calculate average invested capital over a trailing 12-month period by adding the average long-term debt over that period to the average stockholders’ equity over that period.

Return on average invested capital increased 500 bps to 16.4% for the 12-month period ending June 30, 2022 from 11.4% for the 12-month period ending June 30, 2021. This increase is primarily due to an increase in net income attributable to stockholders over the comparative period, mainly driven by the gain from the sale of the Bolton property. This increase was offset by a higher average invested capital over the comparative period as a result of the senior notes issued into escrow on December 21, 2021. Return on invested capital (“ROIC”) excluding escrowed debt (non-GAAP measure) decreased 60 bps to 13.4% during the 12 months ended June 30, 2022 compared to 14.0% in 2021, primarily due to the inclusion of the gain on the Bolton property in the non-GAAP adjusted average invested capital.

Credit facilities

We have a credit agreement which is comprised of multicurrency revolving facilities (the “Revolving Facilities”) and a delayed-draw term loan facility (the “DDTL Facility”, together with the Revolving Facilities, the “Facilities”). The credit agreement was most recently amended in September 2021 which, among other things (i) extended the maturity date of the Facilities from October 27, 2023 to September 21, 2026, (ii) increased the total size of the Facilities provided under the Credit Agreement to up to $1.045 billion,

Ritchie Bros.

43

Table of Contents

including $295.0 million of commitments under the DDTL Facility, (iii) reduced the applicable margin for base rate loans and LIBOR loans at each pricing tier level, (iv) reduced the applicable percentage per annum used to calculate the commitment fee in respect of the unused commitments under the Facilities at each pricing tier level, and (v) included customary provisions to provide for the eventual replacement of LIBOR as a benchmark interest rate.

Immediately prior to Under the amendment,terms of the aggregate principal amount outstanding under the DDTL Facility was $90.0 million ($118.9 million CAD). In connection with theSeptember 2021 amendment, the Company refinanced that amount with the proceeds from a borrowing under the DDTL Facility. There are no mandatory principal repayments of borrowings under the DDTL Facility until the earlier of when the remaining $205.0 million is drawn or third quarter of 2022. The Company did not draw on the remaining $205,000,000 before it expired on June 28, 2022 and, therefore, mandatory principal repayments will beginbegan in the third quarter of 2022. Once principal payments become mandatory, they are2022 and were subject to an annual amortization rate of 5%, payable in quarterly installments, with the balance payable at maturity. The remaining $205.0 million commitment under the DDTL Facility was not drawn and accordingly expired on June 28, 2022. We did not make any voluntary prepayments to our drawn DDTL in 2022.

On March 20, 2023, under the terms of the December 2022 amendment to the Credit Agreement, with the close of the acquisition of IAA, certain amended terms became effective. Specifically, the Credit Agreement amendment (i) increased the total size of the Facilities provided under the Credit Agreement to up to $2.7 billion, including $1.9 billion of commitments under the TLA Facility, (ii) increased the appropriate margin for base rate loans, and SOFR loans at each pricing tier level, (iii) and increased the applicable percentage per annum used to calculate the various fees such as the commitment fees and letter of credit fees under the Facilities at each pricing tier level. In addition, on March 20, 2023, the Company converted its existing CAD DDTL Facility into the CAD TLA Facility, which continues to be subject to an annual amortization rate of 5% payable in quarterly installments, with the balance also payable at maturity. Under the amended terms, mandatory principal repayments on the USD TLA Facility begin in the second quarter of 2023 and are subject to quarterly instalments of 1.25% of the $1.8 billion principal amount outstanding with the balance payable at maturity.

Credit facilities at June 30, 2022

Senior Secured and Unsecured Notes

At December 31, 2022, we had senior unsecured notes (the “2016 Notes”) outstanding that were to expire on January 15, 2025 for an aggregate principal amount of $500.0 million, bearing an interest rate of 5.375% per annum. The proceeds of the offering of the 2016 Notes were used to finance the IronPlanet acquisition. The 2016 Notes were redeemed on March 20, 2023 at 100.0% of the original offering price of the notes, plus accrued and unpaid interest. The Company expensed the unamortized debt issue costs of $3.3 million in interest expense in the consolidated income statement during the first quarter of 2023.

On March 15, 2023, to finance the acquisition of IAA, we completed the offering of two series of senior notes: (i) $550.0 million aggregate principal amount of 6.750% senior secured notes due March 15, 2028 and (ii) $800.0 million aggregate principal amount of 7.750% senior unsecured notes due March 15, 2031 (together the “2023 Notes”).

On December 21, 2021, werewe completed the offering of two series of senior notes: (i) $600.0 million aggregate principal amount of 4.750% senior notes due December 15, 2031 and (ii) $425.0 million Canadian dollar aggregate principal amount of 4.950% due December 15, 2029 (together the “2021 Notes”). On May 4, 2022, the Company redeemed all of the 2021 Notes at a redemption price equal to 100% of the original offering price of the notes, plus accrued and unpaid interest as follows:the proposed Euro Auctions Acquisition was not completed.

(in U.S. $000's, except percentages)


June 30, 2022


December 31, 2021


% Change


Committed


DDTL Facility

$

92,349

$

298,284


(69)

%

Revolving credit facilities


750,000


750,000


%

Uncommitted

Revolving credit facilities

10,000

10,000

%

Total credit facilities

$

852,349

$

1,058,284


(19)

%

Unused


DDTL Facility

$

$

205,000


(100)

%

Revolving credit facilities


683,459


525,581


30

%

Total credit facilities unused

$

683,459

$

730,581


(6)

%

Debt covenantsCovenants

We were in compliance with all financial and other covenants applicable to our credit facilities at June 30, 2022.March 31, 2023.

Our ability to borrow under our syndicated revolving credit facility is subject to compliance with financial covenants of a consolidated leverage ratio and a consolidated interest coverage ratio. In the event of sustained deterioration of global markets and economies, we expect the covenants pertaining to our leverage ratio would be the most restrictive to our ability to access funding under our credit agreement.Credit Agreement. We continue to evaluate courses of action to maintain current levels of liquidity and compliance with our debt covenants.

Ritchie Bros.

52

Table of Contents

Liquidity and Capital Resources

On March 20, 2023, the Company closed the acquisition of IAA for a total fair value of consideration transferred of $6.6 billion. This included cash consideration of $1.7 billion and repayment of approximately $1.2 billion of IAA’s debt which was not legally assumed as part of the transaction, which was funded through a combination of cash from our balance sheet, proceeds of $1.8 billion from the TLA Facility and proceeds from the completed offering of the 2023 Notes. As we repaid IAA’s net debt at acquisition, which included all borrowings under its existing credit agreement and senior notes, IAA was acquired debt-free. During the first quarter of 2023, we also completed the acquisition of VeriTread and paid $28.2 million cash consideration.

On February 1, 2023, the Company issued $485.0 million Series A Senior Preferred Shares, a participating security, convertible into common shares at a price of $73.00 per share and $15.0 million of common shares to Starboard.

In addition, the Company redeemed our 2016 Notes of $500.0 million principal at 100% of its original offering price, plus accrued and unpaid interest at the closing of the IAA acquisition.

Our short-term cash requirements include (i) payment of quarterly dividends to common shareholders on an as-declared basis, and payment of participating dividends and preferential dividends to preferred equity holders, (ii) settlement of contracts with consignors and other suppliers, (iii) personnel expenditures, with a majority of bonuses paid annually in the first quarter following each fiscal year, (iv) income tax payments, primarily paid in quarterly installments, (v) payments on short-term debt and long-term debt, (vi) payment of amounts committed under certain service agreements to build our modern IT architecture, (vii) payments on our operating and finance lease obligations, and (vii) other capital expenditures and working capital needs.

We believe that our existing working capital and availability under our credit facilities are sufficient to satisfy our present operating requirements and contractual obligations. Our long-term cash requirements include:

Debt principal repayments of $3.3 billion, of which $119.6 million is due within one year, as well as associated interest payments of $242.3 million due within one year. For more information on our debt, including long-term debt principal repayments listed according to maturity, see Note 18 in our consolidated financial statements.
Operating and finance lease obligations relating to the Company’s commercial leases for various auctions sites, branches and offices, operating leases for computer equipment, software, motor vehicles and small office equipment, and finance lease arrangements for certain vehicles, computers, yard equipment, fixtures, and office furniture. For more information on our leases, see Note 22 in our consolidated financial statements. Our payment obligations on our lease obligations increased during the quarter as a result of the inclusion of IAA, as IAA leases most of its auction sites and properties.

Cash provided by operating activities can fluctuate significantly from period to period. We assess our liquidity based on our ability to generate cash and secure credit to fund operating, investing, and financing activities. Our liquidity is primarily affected by fluctuations in cash provided by operating activities, significant acquisitions of businesses, payment of dividends, our net capital spending1, and repayments of debt.We are also committed under various letters of credit and provide certain guarantees in the normal course of business. We believe our principal sources of liquidity, which include cash flow from operations and our unused capacity under our revolving credit facilities of $719.4 million, is sufficient to fund our current and planned operating activities.

Most of the financial institutions IAA utilizes place a temporary hold on the availability of funds deposited for up to two business days, resulting in the deposited cash being unavailable for use until the temporary hold is lifted. These are considered outstanding checks, or book overdrafts, to sellers and vendors. As a portion of these outstanding checks for operations are drawn upon bank accounts at financial institutions other than the financial institutions that hold the deposited cash, we are unable to offset all the cash and the outstanding checks on our consolidated balance sheet at any given time. Book overdrafts are recognized on our consolidated balance sheet within trade and other liabilities.

If we were to consider further acquisitions to deliver on our strategic growth drivers, we may seek financing through equity markets or additional debt markets. The issuance of additional equity securities may result in dilution to our shareholders. Issuance of preferred equity securities could provide for rights, preferences or privileges senior to those of our common stock. Further, this additional capital may not be available on reasonable terms, or at all.

1We calculate net capital spending as property, plant and equipment additions plus intangible asset additions less proceeds on disposition of property, plant and equipment.

Ritchie Bros.

53

Table of Contents

Cash Flows

Three months ended March 31, 

% Change

(in U.S. dollars in millions, except percentages)

2023


2022

2023 over 2022


Cash provided by (used in):


Operating activities

$

(57.3)

$

185.1

(131)

%

Investing activities


(2,823.0)


154.9

(1,922)

%

Financing activities


2,958.5


(180.3)

(1,741)

%

Effect of changes in foreign currency rates


2.9


7.8

(63)

%

Net increase in cash, cash equivalents, and restricted cash

$

81.1

$

167.6

(52)

%

Net cash used in operating activities was $57.3 million in the first three months of 2023 as compared to net cash provided by operating activities of $185.1 million in the first three months of 2022. Net cash used in operating activities increased $235.2 million mainly due to a net cash outflow from the change in operating assets and liabilities. This change was mainly driven by the timing, size, and number of auctions, and higher income tax payments made in the current quarter as a result of timing of instalments and the payment of taxes owed for the taxable gain portion on the sale of the Bolton property. We also saw net higher outflows for inventory purchases relating to some significant inventory contracts purchased during the quarter, a non-repeat of interest prepayments in the prior year quarter relating to senior notes issued in 2021 and the timing of payments for inventory purchases. With the inclusion of IAA from March 20, 2023, the increase in prepaid consigned vehicle charges also contributed to cash outflows in the period. The above increases were partially offset by the timing of payments for third party charges and the timing of employee compensation payments.

Net cash used in investing activities was $2.8 billion in the first three months of 2023 as compared to net cash provided by investing activities of $154.9 million in the first three months of 2022. Net cash used in investing activities increased $2.8 billion primarily due to approximately $2.8 billion cash outflow in the current quarter for the acquisitions of IAA and VeriTread, compared to minimal cash outflows in the first quarter of 2021 relating to acquisition activities. Further increases in outflows relate to the non-repeat of proceeds received for the sale of the Bolton property in the first quarter of 2022 of $165.0 million and increases in property, plant and equipment purchases of $21.5 million and intangible asset additions of $9.2 million, as compared to the same quarter in the prior year.

Net cash provided by financing activities was $3.0 billion in the first three months of 2023, as compared to net cash used in financing activities of $180.3 million in the first three months of 2022. Net cash provided by financing activities increased $3.1 billion. In the first quarter of 2023, we raised financing through the new TLA Facility for $1.8 billion and the issuances of the 2023 Notes to fund the IAA acquisition. Additionally, we received net proceeds of $496.9 million in the current quarter from the issuance of $485.0 million of participating Series A Senior Preferred Shares and $15.0 million of common stock, net of issuance costs. These increases were partially offset by the redemption of our 2016 Notes on March 20, 2023, as compared to $164.0 million debt repayment made in the prior year quarter on our long-term revolving credit facilities, as well as higher dividends paid this quarter as a result of a special dividend that was paid out on March 28, 2023, and preferential dividends paid out on March 15, 2023 on a pro-rated basis (refer to “Dividend Information”). In addition, we also incurred $40.4 million of debt issuance costs in the current quarter relating to the TLA Facility and the 2023 Notes, compared to $2.3 million in the prior year quarter.

Dividend Information

We declared a dividend of $0.25 per common share for the quarter ended March 31, 2022. We declared a dividend of $0.27 per common share for each of the quarters ended June 30, 2022, September 30, 2022, and December 31, 2022. On March 7, 2023, we declared a special cash dividend of $1.08 per share, contingent on the closing of the acquisition of IAA, payable to stockholders of record at the close of business on March 17, 2023, excluding holders of Series A Preferred Shares (the “Special Dividend”). The Special Dividend was paid in cash on March 28, 2023 following the acquisition of IAA. We also recorded Preferential Dividends of $4.3 million to the holders of the Series A Senior Preferred, of which $3.1 million was paid on March 15, 2023 and $1.2 million was accrued and unpaid at March 31, 2023, and Participating Dividends of $1.8 million on March 3, 2023. We have declared, but not yet paid, a dividend of $0.27 per common share for the quarter ended March 31, 2023. All dividends that we pay are “eligible dividends” for Canadian income tax purposes unless indicated otherwise.

Ritchie Bros.

54

Table of Contents

Debt over Net Income

Debt at the end of the first quarter of 2023 represented 28.6 times net income at and for the twelve months ended March 31, 2023, compared to debt at the first quarter of 2022, which represented 5.3 times net income at and for the twelve months ended March 31, 2022. The increase in this debt/net income multiplier was primarily due to higher debt related to the IAA acquisition, plus the inclusion of only 11 days of IAA’s net income for the twelve months ended March 31, 2023. Additionally, acquisition costs in the twelve months ended March 31, 2023 were $116.9 million higher and the (loss) gain on disposition of property, plant and equipment was $174.1 million lower than the twelve months ended March 31, 2022. The adjusted net debt/adjusted EBITDA was 5.4 times at and for the twelve months ended March 31, 2023, compared to 0.5 times at and for the twelve months ended March 31, 2022. The increase in this debt/net income multiplier was primarily due to higher debt from the IAA acquisition, plus the inclusion of only 11 days of IAA’s adjusted EBITDA for the twelve months ended March 31, 2023. 

Return on Average Invested Capital

During the quarter ended September 30, 2022, we updated our calculation of return on average invested capital (“ROIC”) and adjusted ROIC. Refer to the non-GAAP measures section below, specifically our Adjusted Return and Adjusted ROIC Reconciliation, for further information.

ROIC decreased 1,240 bps to 2.6% for the twelve month period ended March 31, 2023 from 15.0% for the twelve month period ended March 31, 2022. This decrease is primarily due to an increase in the denominator mainly from the issuance of 70.3 million shares of the Company’s common stock for the acquisition of IAA and the issuance of the Series A Senior Preferred Shares in the current quarter and a decrease in net income driven by acquisition and integration costs incurred for the IAA and VeriTread acquisitions, as well as the non-repeat gain from the sale of the Bolton property in the first quarter of 2022. Adjusted return on average invested capital decreased 900 bps to 5.9% during the twelve months ended March 31, 2023 compared to 14.9% in 2022, primarily due to the changes in the denominator as discussed above, partially offset by a higher adjusted return as a result of higher adjusted net income available to common stockholders.

Critical Accounting Policies, Judgments, Estimates and Assumptions

In preparing our consolidated financial statements in conformity with US GAAP, we must make decisions that impact the reported amounts and related disclosures. Such decisions include the selection of the appropriate accounting principles to be applied and the assumptions on which to base accounting estimates. In reaching such decisions, we apply judgments based on our understanding and analysis of the relevant circumstances and historical experience and related circumstances. As at June 30, 2022, other than the estimates in accounting for the sale and leaseback transaction related to the sale of our Bolton property in the first quarter of 2022, as described below,At March 31, 2023, there were no material changes in our critical accounting policies, other than as described in Note 2(b) of the interim consolidated financial statements, and there were no material changes in judgments, estimates and assumptions from those disclosed in our Annual Report on Form 10-K for the year ended December 31, 2021,2022, or in the notes to our consolidated financial statements included in “Part I, Item 1: Consolidated Financial Statements” in this Quarterly Report on Form 10-Q.10-Q, other than as described below.

For a discussion of our new accounting standards, refer to Note 3 Significant Judgements, Estimates and Assumptions.

Effective October 1, 2021, we early adopted ASU 2021-08, Business Combinations (Topic 805): Accounting for Contract Assets and Contract Liabilities from Contracts with Customers. The update primarily addresses the accounting for contract assets and contract liabilities from revenue contracts with customers acquired in a business combination. An entity that early adopts in an interim period should apply the amendments (i) retrospectively to all business combinations for which the acquisition date occurs on or after the beginning of the fiscal year that includes the interim period of early application and (ii) prospectively to all business combinations that occur on or after the date of initial application. We have applied the amendments to the SmartEquip acquisition, which was completed on November 2, 2021.

Significant items subject to estimates and judgements during the six month period ended June 30, 2022 were made in accounting for the completed sale and leaseback transaction of our Bolton property. We determined the following estimates in calculating the gain on

Ritchie Bros.

4455

Table of Contents

sale: the present value of market rental payments of the Bolton property sold, the expected lease term in the leaseback arrangement and our incremental borrowing rate based on information available at the commencement date of the lease.

For a discussion of our new and amended accounting standards, refer to Note 2(b) of the Consolidated Financial Statements, Significant Accounting Policies.

Non-GAAP Measures

We reference various non-GAAP measures throughout this Quarterly Report on Form 10-Q. These measures do not have a standardized meaning and are, therefore, unlikely to be comparable to similar measures presented by other companies. The presentation of this financial information, which is not prepared under any comprehensive set of accounting rules or principles, is not intended to be considered in isolation of, or as a substitute for, the financial information prepared and presented in accordance with US GAAP. Non-GAAP financial measures included in this Quarterly Report on Form 10-Q are labeled as “non-GAAP measure”.

Non-GAAP Adjusted Operating Income Reconciliation

We believe that non-GAAP adjusted operating income provides useful information about the growth or decline of our operating (loss) income for the relevant financial period and eliminates the financial impact of adjusting items we do not consider to be part of our normal operating results. Adjusted operating income enhances our ability to evaluate and understand ongoing operations, underlying business profitability, and facilitate the allocation of resources.

Non-GAAP adjustedAdjusted operating income eliminates the financial impact of adjusting items from operating (loss) income, which are significant recurring and non-recurring items that we do not consider to be part of our normal operating results, such as share-based payments expense, acquisition-related and integration costs, amortization of acquired intangible assets, management reorganization costs, and certain other items, which we refer to as “adjusting items”.

In 2021, we updated the calculation of non-GAAPThe following table reconciles adjusted operating income to add-back share-based payments expense, all acquisition-related costs (including any share based continuing employment costs recognized in acquisition-related costs), amortization of acquired intangible assets, and gain or loss on disposition of property, plant and equipment. We have also adjusted for certain non-recurring advisory, legal and restructuring costs. These adjustments have been applied retrospectively to all periods presented, as applicable.

The following table reconciles non-GAAP adjusted operating income to operating(loss) income, which is the most directly comparable GAAP measure in our consolidated financial statements.

Three months ended June 30, 

Six months ended June 30, 

% Change

% Change

(in U.S. $000's, except percentages)


2022

2021

2022 over 2021


2022

2021

2022 over 2021


Operating income

$

91,867

$

89,517

3

%  

$

324,707

$

134,019

142

%

Share-based payments expense

13,640

7,540

81

%  

19,026

11,318

68

%  

Acquisition-related costs

3,399

3,049

11

%  

13,036

5,971

118

%  

Amortization of acquired intangible assets

8,426

6,802

24

%  

16,958

13,443

26

%  

Gain on disposition of property, plant and equipment and related costs

1,153

(175)

(759)

%  

(168,667)

(243)

69,310

%  

Non-recurring advisory, legal and restructuring costs

1,094

240

356

%  

3,379

240

1,308

%  

Non-GAAP adjusted operating income

$

119,579

$

106,973

12

%  

$

208,439

$

164,748

27

%

Three months ended March 31, 

% Change

(in U.S. dollars in millions, except percentages)


2023

2022

2023 over 2022


Operating (loss) income

$

(24.9)

$

232.7

(111)

%  

Share-based payments expense

6.7

5.4

24

%  

Acquisition-related and integration costs

126.2

9.6

1,215

%  

Amortization of acquired intangible assets

16.6

8.5

95

%  

Loss (gain) on disposition of property, plant and equipment and related costs

0.0

(169.8)

(100)

%  

Prepaid consigned vehicles charges

(12.4)

(100)

%  

Other advisory, legal and restructuring costs

0.2

2.3

(91)

%  

Adjusted operating income

$

112.4

$

88.7

27

%  

(1)Please refer to pages 51-5362-64 for a summary of adjusting items during the three and six months ended June 30, 2022March 31, 2023 and June 30, 2021.March 31, 2022.
(2)Non-GAAP adjustedAdjusted operating income represents operating (loss) income excluding the effects of adjusting items.

Ritchie Bros.

4556

Table of Contents

Non-GAAP Adjusted Net Income AttributableAvailable to Common Stockholders and Non-GAAP Diluted Adjusted EPS AttributableAvailable to Common Stockholders Reconciliation

We believe that non-GAAP adjusted net (loss) income attributableavailable to common stockholders provides useful information about the growth or decline of our net (loss) income attributableavailable to common stockholders for the relevant financial period and eliminates the financial impact of adjusting items we do not consider to be part of our normal operating results. Non-GAAP diluted AdjustedDiluted adjusted EPS attributableavailable to common stockholders eliminates the financial impact of adjusting items from net (loss) income attributableavailable to common stockholders which are after-tax effects of significant non-recurring or recurring items that we do not consider to be part of our normal operating results, such as share-based payments expense, acquisition-related and integration costs, amortization of acquired intangible assets, management reorganization costs, and certain other items, which we refer to as “adjusting items”.

In 2021,

On February 1, 2023, we updatedsold $485.0 million of participating Series A Senior Preferred Shares, convertible into common shares of the calculationCompany at an initial conversion price of non-GAAP diluted adjusted$73.00 per share, and $15.0 million of common shares of the Company. The preferred equity is considered a participating security, and as a result, beginning in the first quarter of 2023, the Company calculated Diluted EPS attributableusing the two-class method, which includes the effects of the assumed conversion of the Series A Senior Preferred Shares to common shares as well as the effect of any shares issuable under the Company’s stock-based incentive plans, if such effect is dilutive. Under this method, earnings are allocated to holders of common stock and preferred stock based on dividends declared and their respective participation rights in undistributed earnings. During the first quarter of 2023, as a result, our net income available to common stockholders decreased, which further contributed to add-back certain adjustments that have been applied retrospectively to all periods presented, as applicable (refer to non-GAAP adjusted operating income reconciliation above).the decrease in Diluted EPS.

The following table reconciles non-GAAP adjusted net income attributableavailable to common stockholders and non-GAAP diluted adjusted EPS attributableavailable to common stockholders to net (loss) income attributableavailable to common stockholders and diluted EPS attributableavailable to common stockholders, which are the most directly comparable GAAP measures in our consolidated financial statements.

(in U.S. $000's, except share and per share data, and percentages)

Three months ended June 30, 

Six months ended June 30, 


% Change


% Change


2022


2021

2022 over 2021

2022


2021

2022 over 2021


Three months ended March 31, 

Net income attributable to stockholders

$

53,365

$

60,749

(12)

%  

$

231,459

$

88,937

160

%


% Change

(in U.S. dollars in millions, except share, per share data, and percentages)


2023


2022

2023 over 2022

Net (loss) income available to common stockholders

$

(34.2)

$

178.1

(119)

%  

Share-based payments expense

13,640

7,540

81

%  

19,026

11,318

68

%  

6.7

5.4

24

%  

Acquisition-related costs

3,399

3,049

11

%  

13,036

5,971

118

%  

Acquisition-related and integration costs

126.2

9.6

1,215

%  

Amortization of acquired intangible assets

8,426

6,802

24

%  

16,958

13,443

26

%  

16.6

8.5

95

%  

Gain on disposition of property, plant and equipment and related costs

1,153

(175)

(759)

%  

(168,667)

(243)

69,310

%  

Loss on redemption of the 2021 Notes and certain related interest expense

9,664

100

%  

9,664

100

%  

Loss (gain) on disposition of property, plant and equipment and related costs

0.0

(169.8)

(100)

%  

Gain on remeasurement of previously held interest in VeriTread

(1.4)

(100)

%  

Prepaid consigned vehicles charges

(12.4)

(100)

%  

Loss on redemption of the 2016 Notes

3.3

100

%  

Change in fair value of derivatives


%  


(1,263)


(100)

%


(1.3)

(100)

%  

Non-recurring advisory, legal and restructuring costs


1,094

240

356

%  

3,379

240

1,308

%

Other advisory, legal and restructuring costs


0.2

2.3

(91)

%  

Related tax effects of the above

(7,669)

(3,660)

110

%

10,443

(9,126)

(214)

%


(33.6)


18.1

(286)

%

Non-GAAP adjusted net income attributable to stockholders

$

83,072

$

74,545

11

%  

$

134,035

$

110,540

21

%

Remeasurement of deferred tax in connection with business combination


(1.5)


(100)

%  

Related allocation of the above to participating securities

(0.7)

(100)

%  

Adjusted net income available to common stockholders

$

69.2

$

50.9

36

%  

Weighted average number of dilutive shares outstanding


111,705,102


111,334,184


0

%  


111,681,644


111,302,711


0

%


120,487,251


111,655,861


8

%  

Diluted earnings per share attributable to stockholders

$

0.48

$

0.55

(13)

%  

$

2.07

$

0.80

159

%

Non-GAAP diluted adjusted EPS attributable to stockholders

$

0.74

$

0.67

10

%  

$

1.20

$

0.99

21

%

Diluted (loss) earnings per share available to common stockholders

$

(0.28)

$

1.60

(118)

%  

Diluted adjusted earnings per share available to common stockholders

$

0.57

$

0.46

24

%  

(1)Please refer to pages 51-5362-64 for a summary of adjusting items during the three and six months ended June 30, 2022March 31, 2023 and June 30, 2021.March 31, 2022.
(2)Non-GAAP adjustedNet (loss) income available to common stockholders is computed as: net (loss) income attributable to controlling interests less cumulative dividends on Series A Senior Preferred Shares and allocated earnings to participating securities.
(3)Adjusted net income available to common stockholders represents net (loss) income attributableavailable to common stockholders excluding the effects of adjusting items.
(3)(4)Non-GAAP dilutedDiluted adjusted EPS attributableavailable to common stockholders is calculated by dividing non-GAAP adjusted net income attributableavailable to common stockholders net of the effect of dilutive securities, by the weighted average number of dilutive shares outstanding.outstanding, except that it is computed based upon the lower of the two-class method or the if-converted method, which includes the effects of the assumed conversion of the Series A Senior Preferred Shares, and the effect of shares issuable under the Company’s stock-based incentive plans if such effect is dilutive.

Ritchie Bros.

4657

Table of Contents

Non-GAAP Adjusted EBITDA

We believe non-GAAP adjusted EBITDA provides useful information about the growth or decline of our net income when compared between different financial periods. We use non-GAAP adjusted EBITDA as a key performance measure because we believe it facilitates operating performance comparisons from period to period.

In 2021, we updatedperiod and it provides management with the calculation of non-GAAP adjusted EBITDAability to add-back certain adjustments which have been applied retrospectively to all periods presented, as applicable (refer to non-GAAP adjusted operating income reconciliation above).monitor its controllable incremental revenues and costs.

The following table reconciles non-GAAP adjusted EBITDA to net (loss) income, which is the most directly comparable GAAP measure in, or calculated from, our consolidated financial statements:

Three months ended June 30, 

Six months ended June 30, 

Three months ended March 31, 


% Change


% Change


% Change


2022 over


2022 over


2023 over


(in U.S. $000's, except percentages)


2022


2021

2021


2022


2021

2021


Net income

$

53,411

$

60,781

(12)

%  

$

231,512

$

88,920

160

%

(in U.S. dollars in millions, except percentages)


2023


2022

2022


Net (loss) income

$

(28.2)

$

178.1

(116)

%  

Add: depreciation and amortization


24,298


21,935


11

%  


48,523


43,005


13

%


36.2


24.2


50

%  

Add: interest expense


18,463


8,867


108

%  


39,149


17,813


120

%


20.9


20.7


1

%  

Less: interest income


(871)


(332)


162

%  


(1,415)


(634)


123

%


(6.3)


(0.5)


1,160

%  

Add: income tax expense


21,632


21,065


3

%  


57,867


29,484


96

%


(9.3)


36.2


(126)

%  

EBITDA


116,933


112,316


4

%  


375,636


178,588


110

%


13.3


258.7


(95)

%  

Share-based payments expense

13,640

7,540

81

%  

19,026

11,318

68

%  

6.7

5.4

24

%  

Acquisition-related costs


3,399


3,049


11

%  


13,036


5,971


118

%  

Gain on disposition of property, plant and equipment and related costs

1,153

(175)

(759)

%  

(168,667)

(243)

69,310

%  

Acquisition-related and integration costs


126.2


9.6


1,215

%  

Loss (gain) on disposition of property, plant and equipment and related costs

0.0

(169.8)

(100)

%  

Gain on remeasurement of previously held interest in VeriTread

(1.4)

(100)

%  

Prepaid consigned vehicles charges

(12.4)

(100)

%  

Change in fair value of derivatives


%  


(1,263)


(100)

%


(1.3)


(100)

%  

Non-recurring advisory, legal and restructuring costs

1,094

240

356

%  

3,379

240

1,308

%

Non-GAAP adjusted EBITDA

$

136,219

$

122,970

11

%  

$

241,147

$

195,874

23

%

Other advisory, legal and restructuring costs

0.2

2.3

(91)

%  

Adjusted EBITDA

$

132.6

$

104.9

26

%  

(1)Please refer to pages 51-5362-64 for a summary of adjusting items during the three and six months ended June 30, 2022March 31, 2023 and June 30, 2021.March 31, 2022.
(2)Non-GAAP adjustedAdjusted EBITDA is calculated by adding back depreciation and amortization, interest expense, income tax expense, and subtracting interest income from net (loss) income, as well as adding back share-based payments expense, acquisition-related and integration costs, loss (gain) on disposition of property, plant and equipment and related costs, gain on remeasurement of previously held interest in VeriTread, prepaid consigned vehicle charges, change in fair value of derivatives, other advisory, legal and restructuring costs, which include terminated and ongoing transaction costs, and excluding the effects of any non-recurring orother unusual adjusting items.

Ritchie Bros.

4758

Table of Contents

Non-GAAP Adjusted Net Debt and Non-GAAP Adjusted Net Debt/Non-GAAP Adjusted EBITDA Reconciliation

We believe that comparing non-GAAP adjusted net debt/non-GAAP adjusted EBITDA on a trailing 12-monthtwelve months basis for different financial periods provides useful information about the performance of our operations as an indicator of the amount of time it would take us to settle both our short and long-term debt. We do not consider this to be a measure of our liquidity, which is our ability to settle only short-term obligations, but rather a measure of how well we fund liquidity. Measures of liquidity are noted under “Liquidity and Capital Resources”.

The following table reconciles non-GAAP adjusted net debt to debt, non-GAAP adjusted EBITDA to net income, and non-GAAP adjusted net debt/ non-GAAP adjusted EBITDA to debt/ net income, respectively, which are the most directly comparable GAAP measures in, or calculated from, our consolidated financial statements.

As at and for the 12 months ended June 30, 

At and for the twelve months ended March 31, 

% Change

% Change

(in U.S. $millions, except percentages)

2022

2021

2022 over 2021

(in U.S. dollars in millions, except percentages)

2023

2022

2023 over 2022

Short-term debt


$

8.6


$

35.2


(76)

%


$

23.6


$

22.1


7

%

Long-term debt


644.4


636.5

1

%


3,220.4


1,582.0

104

%

Debt


653.0


671.7

(3)

%


3,244.0


1,604.1

102

%

Less: long-term debt in escrow

(939.8)

(100)

%

Less: cash and cash equivalents


(367.3)


(301.8)

22

%


(568.3)


(440.1)

29

%

Non-GAAP adjusted net debt


285.7


369.9

(23)

%

Adjusted net debt


2,675.7


224.2

1,093

%

Net income

$

294.4

$

183.3

61

%

$

113.4

$

301.8

(62)

%

Add: depreciation and amortization


93.4


80.8

16

%


109.2


91.0

20

%

Add: interest expense


58.3


35.3

65

%


58.1


48.7

19

%

Less: interest income


(2.2)


(1.7)

29

%


(12.7)


(1.6)

694

%

Add: income tax expense


81.8


61.7

33

%


40.7


81.2

(50)

%

EBITDA


525.7


359.4

46

%


308.7


521.1

(41)

%

Share-based payments expense


30.8


24.4

26

%


38.3


24.7

55

%

Acquisition-related costs


37.3


12.0

211

%

Gain on disposition of property, plant and equipment and related costs

(169.9)

(0.5)

33,880

%

Change in fair value of derivatives

%

Non-recurring advisory, legal and restructuring costs


6.6


4.2

57

%

Non-GAAP adjusted EBITDA

$

430.5

$

399.5

8

%

Acquisition-related and integration costs


153.8


36.9

317

%

Loss (gain) on disposition of property, plant and equipment and related costs

2.9

(171.2)

(102)

%

Gain on remeasurement of previously held interest in VeriTread

(1.4)

(100)

%

Prepaid consigned vehicles charges

(12.4)

(100)

%

Other advisory, legal and restructuring costs


2.9


5.8

(50)

%

Adjusted EBITDA

$

492.8

$

417.3

18

%

Debt/net income


2.2

x


3.7

x

(41)

%


28.6

x


5.3

x

440

%

Non-GAAP adjusted net debt/non-GAAP adjusted EBITDA


0.7

x


0.9

x

(22)

%

Adjusted net debt/adjusted EBITDA


5.4

x


0.5

x

980

%

(1)Please refer to pages 51-5362-64 for a summary of adjusting items during the trailing 12-monthstwelve months ended June 30, 2022March 31, 2023 and June 30, 2021.March 31, 2022.
(2)Non-GAAP adjustedAdjusted EBITDA is calculated by adding back depreciation and amortization, interest expense, income tax expense, and subtracting interest income from net income, as well as adding back share-based payments expense, acquisition-related and integration costs, gain/ loss (gain) on disposition of property, plant and equipment and related costs, gain on remeasurement of previously held interest in VeriTread, prepaid consigned vehicle charges, other advisory, legal and restructuring costs which includes terminated and ongoing transaction costs, and excluding the effects of any non-recurring orother unusual adjusting items.
(3)Non-GAAP adjustedAdjusted net debt is calculated by subtracting cash and cash equivalents from short and long-term debt.debt and long-term debt in escrow.
(4)Non-GAAP adjustedAdjusted net debt/Non-GAAP adjustedAdjusted EBITDA is calculated by dividing non-GAAP adjusted net debt by non-GAAP adjusted EBITDA.

Ritchie Bros.

4859

Table of Contents

Operating Free Cash Flow (“OFCF”) Reconciliation

We believe OFCF, when compared on a trailing 12-monthtwelve months basis to different financial periods, provides an effective measure of the cash generated by our business and provides useful information regarding cash flows remaining for discretionary return to stockholders, mergers and acquisitions, or debt reduction. Our balance sheet scorecard includes OFCF as a performance metric. OFCF is also an element of the performance criteria for certain annual short-term and long-term incentive awards.

The following table reconciles OFCF to cash provided by operating activities, which is the most directly comparable GAAP measure in, or calculated from, our consolidated statements of cash flows:

12 months ended June 30, 

Twelve months ended March 31, 

% Change

% Change

(in U.S. $ millions, except percentages)


2022


2021

2022 over 2021


(in U.S. dollars in millions, except percentages)


2023


2022

2023 over 2022


Cash provided by operating activities

$

304.2

$

270.9

12

%

$

221.3

$

322.0

(31)

%

Property, plant and equipment additions


9.7


12.7


(24)

%


53.5


10.3


419

%

Intangible asset additions


32.0


33.0


(3)

%


49.1


32.7


50

%

Proceeds on disposition of property plant and equipment


(166.7)


(0.6)


27,683

%


(2.3)


(166.5)


(99)

%

Net capital spending

$

(125.0)

$

45.1

(377)

%

$

100.3

$

(123.5)

(181)

%

OFCF

$

429.2

$

225.8

90

%

$

121.0

$

445.5

(73)

%

(1)OFCF is calculated by subtracting net capital spending from cash provided by operating activities.

Ritchie Bros.

4960

Table of Contents

Non-GAAP Adjusted Net Income Attributable to StockholdersReturn and Adjusted ROIC Reconciliation

We believe that comparing adjusted ROIC on a trailing 12-monthtwelve months basis for different financial periods provides useful information about the after-tax return generated by our investments. Adjusted ROIC is a measure used by management to determine how productively the Company uses its long-term capital to gauge investment decisions.

In 2021,Previously, we calculated ROIC as net income available to common stockholders divided by average invested capital. During the quarter ended September 30, 2022, we updated our calculation of ROIC to better align to industry standards. ROIC is now calculated as reported return divided by average invested capital. Reported return is defined as net income available to common stockholders excluding the impact of net interest expense, tax effected at the Company’s adjusted annualized effective tax rate. We also updated the calculation of non-GAAPaverage invested capital to include average short-term debt and updated the calculation in the first quarter of 2023 to also include preferred equity.

Similarly, we updated our calculation of adjusted net income attributableROIC. Adjusted ROIC is calculated as adjusted return divided by adjusted average invested capital. Adjusted return is defined as reported return, updated as noted above, and adjusted for items that we do not consider to stockholders to add-back certain adjustments thatbe part of our normal operating results, tax effected at the applicable tax rate. Adjusted average invested capital is calculated as average invested capital, updated as noted above, but excludes any long-term debt in escrow.

These changes have been applied retrospectively to all periods presented, as applicable (refer toapplicable. Accordingly, the Company will no longer report adjusted ROIC excluding escrowed debt as one of our non-GAAP adjusted operating income reconciliation above).measures as previously labeled.

Ritchie Bros.

61

Table of Contents

The following table reconciles non-GAAP adjusted net income attributable to stockholdersreturn and adjusted ROIC to net income attributableavailable to common stockholders and return onadjusted average invested capital to average invested capital, which are the most directly comparable GAAP measures in, or calculated from, our consolidated financial statements:

As at and for the 12 months ended June 30, 


% Change


(in U.S. $millions, except percentages)


2022


2021


2022 over 2021


Net income attributable to stockholders

$

294.4

$

183.2

61

%

Share-based payments expense


30.8


24.4


26

%  

Acquisition-related costs


37.3


12.0


211

%  

Amortization of acquired intangible assets

31.5

24.1

31

%  

Gain on disposition of property, plant and equipment and related costs

(169.9)

(0.5)

33,880

%  

Loss on redemption of the 2021 Notes and certain related interest expense

9.7

100

%  

Non-recurring advisory, legal and restructuring costs


6.6


4.2


57

%

Related tax effects of the above


(0.8)


(23.3)


(97)

%

Change in uncertain tax provision - tax effect


1.5


(100)

%  

Non-GAAP adjusted net income attributable to stockholders

$

239.6

$

225.6

6

%

Long-term debt - opening balance

$

636.5

$

632.0

1

%

Long-term debt - ending balance


644.4


636.5

1

%

Non-GAAP adjusted ending long-term debt

644.4

636.5

1

%

Average long-term debt

640.5

634.3

1

%

Non-GAAP adjusted average long-term debt

640.5

634.3

1

Stockholders' equity - opening balance

$

1,056.3

$

899.1

17

%

Stockholders' equity - ending balance


1,244.1


1,056.3

18

%

Average stockholders' equity


1,150.2


977.7

18

%

Average invested capital

$

1,790.8

$

1,612.0

11

%

Return on average invested capital


16.4

%  


11.4

%  

500

bps

Non-GAAP ROIC


13.4

%  


14.0

%  

(60)

bps

Non-GAAP ROIC excluding escrowed debt

13.4

%  

14.0

%  

(60)

bps

At and for the twelve months ended March 31, 


% Change


(in U.S. dollars in millions, except percentages)


2023


2022


2023 over 2022


Net income (loss) attributable to controlling interests

$

113.4

$

301.8

(62)

%

Add:

Interest expense

58.1

48.7

19

%  

Interest income

(12.7)

(1.6)

694

%  

Interest, net

45.4

47.1

(4)

%  

Tax on interest, net

(11.1)

(12.3)

(10)

%  

Reported return

$

147.7

$

336.6

(56)

%  

Add:

Share-based payments expense


38.3


24.7


55

%  

Acquisition-related and integration costs


153.8


36.9


317

%  

Amortization of acquired intangible assets

33.4

29.9

12

%  

Loss (gain) on disposition of property, plant and equipment and related costs

2.9

(171.2)

(102)

%  

Gain on remeasurement of previously held interest in VeriTread

(1.4)

(100)

%  

Prepaid consigned vehicles charges

(12.4)

(100)

%  

Other advisory, legal and restructuring costs


2.9


5.8


(50)

%

Related tax effects of the above


(52.2)


3.2


(1,731)

%

Remeasurement of deferred tax in connection with business combination


(1.5)


(100)

%  

Adjusted return

$

311.5

$

265.9

17

%

Short-term debt - opening balance

$

22.1

$

25.9

(15)

%

Short-term debt - ending balance

23.6

22.1

7

%

Average short-term debt

22.9

24.0

(5)

%

Long-term debt - opening balance

1,582.0

636.7

148

%

Less: long-term debt in escrow

(939.8)

(100)

%

Adjusted opening long-term debt

642.2

636.7

1

%

Long-term debt - ending balance


3,220.4


1,582.0

104

%

Less: long-term debt in escrow

(939.8)

(100)

%

Adjusted ending long-term debt

3,220.4

642.2

401

%

Average long-term debt

2,401.2

1,109.4

116

%

Adjusted average long-term debt

1,931.3

639.5

202

%

Preferred equity - opening balance

%

Preferred equity - ending balance

482.0

100

%

Average preferred equity

241.0

100

%

Stockholders' equity - opening balance

1,225.0

1,005.5

22

%

Stockholders' equity - ending balance


4,861.5


1,225.0

297

%

Average stockholders' equity


3,043.3


1,115.3

173

%

Average invested capital

$

5,708.4

$

2,248.7

154

%

Adjusted average invested capital

$

5,238.5

$

1,778.8

194

%

ROIC


2.6

%  


15.0

%  

(1,240)

bps

Adjusted ROIC


5.9

%  


14.9

%  

(900)

bps

(1)Please refer to pages 51-5362-64 for a summary of adjusting items during the trailing 12-monthstwelve months ended June 30, 2022March 31, 2023 and June 30, 2021.March 31, 2022.
(2)Return on average invested capitalROIC is calculated as net income attributable to stockholdersreported return divided by average invested capital. We calculate average invested capital as the average short-term, long-term debt and average stockholders’ equity over a trailing 12-monthtwelve months period.
(3)Adjusted ROIC is calculated as non-GAAP adjusted net income attributable to stockholdersreturn divided by adjusted average invested capital.
(4)Leases (Topic 842) requires lessees to recognize almost all leases, including operating leases, on the balance sheet through a right-of-use asset and a corresponding lease liability. The lease liability is not included in the calculation of debt.

Ritchie Bros.

5062

Table of Contents

Adjusting Items Non-GAAP Measures

In 2021, we began adjusting for share-based payment expenses, amortization of acquired intangible assets and all gains or losses on disposition of property, plant and equipment, which we did not consider to be part of our normal operating results. These adjustments in 2021 have been applied retrospectively to all periods presented.

Adjusting items during the trailing 12-monthstwelve months ended June 30,March 31, 2023 were:

Recognized in the first quarter of 2023

$6.7 million share-based payments expense.
$126.2 million of acquisition-related and integration costs primarily relating to the acquisition of IAA, which was completed on March 20, 2023. Acquisition-related and integration costs include financing, severance for certain IAA executives, related accelerated share-based payment expenses and other consulting, legal and other costs incurred to effect the acquisition or integration of the combined businesses.
$16.6 million amortization of acquired intangible assets, which includes $7.7 million of amortization relating to the acquired intangible assets from IAA for the 11-day period since its acquisition, $0.7 million from the acquisition of VeriTread, as well as amortization of acquired intangible assets from past acquisitions of SmartEquip and Rouse, completed in 2022 and 2021 respectively.
$4.0 thousand loss on disposition of property, plant and equipment and related costs includes a $1.2 million non-cash cost in the quarter relating to the adjustment made to recognize the Bolton property sale proceeds at fair value when calculating the $169.0 million gain on the Bolton property in the first quarter of 2022, offset by $1.2 million gain related to a sale of a property located in Dubai, United Arab Emirates.
$1.4 million gain relating to the remeasurement of the Company’s previously held 11% interest in VeriTread, in connection with the acquisition of VeriTread in January 2023.
$12.4 million relating to a fair value adjustment made to the prepaid consigned vehicle charges on the opening balance sheet of IAA, which do not have a future benefit at acquisition, and therefore has created a favorable reduction to our cost of services in the quarter.
$3.3 million loss on redemption of the 2016 Notes due to the difference between the reacquisition price of the 2016 Notes and the net carrying amount of the extinguishment debt (primarily unrecognized deferred debt issuance costs).
$0.2 million of legal and other consulting costs associated with our contestation of the assertion by the Canada Revenue Agency (“CRA”) that one of the Company’s Luxembourg subsidiaries was resident in Canada from 2010 through 2015 and that its worldwide income should be subject to Canadian income taxation.
$1.5 million from the remeasurement of the Company’s US opening deferred tax balances driven by a recalculation of a new U.S. tax rate for the Company following the acquisition of IAA.

Recognized in the fourth quarter of 2022 were:

$9.1 million share-based payments expense.
$22.2 million of acquisition-related and integration costs primarily relating to the proposed acquisition of IAA, and the share-based continuing employment costs for the acquisitions of Rouse and SmartEquip.
$8.2 million amortization of acquired intangible assets primarily from the acquisitions of Iron Planet, SmartEquip, and Rouse.
$0.9 million loss on disposition of property, plant and equipment and related costs includes a $1.3 million non-cash cost in the quarter relating to the adjustment made to recognize the Bolton property sale proceeds at fair value when calculating the $169.0 million gain on the Bolton property in the first quarter of 2022, partially offset by $0.3 million gain on disposition of property, plant and equipment in the quarter.
$0.2 million of restructuring costs relating to retention costs in connection with the restructuring of our information technology team during the year.

Ritchie Bros.

63

Table of Contents

Recognized in the third quarter of 2022

$8.8 million share-based payments expense.
$2.0 million of acquisition-related and integration costs primarily relating to the share-based continuing employment costs for the acquisitions of Rouse and SmartEquip.
$8.2 million amortization of acquired intangible assets primarily from the acquisitions of Iron Planet, SmartEquip, and Rouse.
$0.9 million loss on disposition of property, plant and equipment and related costs includes a $1.3 million non-cash cost in the quarter relating to the adjustment made to recognize the Bolton property sale proceeds at fair value when calculating the $169.0 million gain on the Bolton property in the first quarter of 2022, offset by $0.3 million gain on disposition of property, plant and equipment in the quarter.
$1.5 million of other advisory, legal and restructuring costs, which include $1.1 million of terminated and ongoing transaction and legal costs relating to mergers and acquisition activity, $0.3 million of severance and retention costs in connection with the restructuring of our information technology team during the first quarter of 2022, driven by our strategy to build a new digital technology platform, and $0.1 million of advisory costs relating to a cybersecurity incident detected in the fourth quarter of 2021.

Recognized in the second quarter of 2022

$13.6 million share basedshare-based payments expense.
$3.4 million of acquisition-related and integration costs related to the proposedterminated acquisition of Euro Auctions and the completed acquisitions of SmartEquip and Rouse.
$8.4 million amortization of acquired intangible assets primarily from the acquisitions of Iron Planet, SmartEquip, and Rouse.
$1.2 million gain on disposition of property, plant and equipment and related costs includes a $1.3 million non-cash cost in the quarter relating to the adjustment made to recognize the Bolton property sale proceeds at fair value when calculating the $169.0 million gain on the Bolton property in the first quarter of 2022, and $0.1 million gain on disposition of property, plant and equipment in the quarter.
$9.7 million loss on redemption of the 2021 Notes and certain related interest expense includes (a) $4.8 million of loss on redemption of the 2021 Notes due to a difference between the reacquisition price of the 2021 Notes and the net carrying amount of the extinguished debt (primarily the write off of the unamortized debt issuance costs), (b) $0.7 million of deferred debt issuance costs written off due to the expiry of the undrawn $205.0 million DDTL Facility in the quarter, and (c) non-recurring interest expense of $4.2 million incurred in the quarter relating to the 2021 Notes, which were redeemed as a result of the discontinuedterminated Euro Auctions acquisition in April 2022.
$1.1 million of non-recurringother advisory, legal and restructuring costs, which include $0.6 million of terminated and ongoing transaction and legal costs relating to mergers and acquisition activity, $0.3 million of severance and retention costs in connection with the restructuring of our information technology team driven by our strategy to build a new digital technology platform, and $0.2 million of advisory costs relating to a cybersecurity incident detected in the fourth quarter of 2021.

Ritchie Bros.

64

Table of Contents

Adjusting items during the trailing twelve months ended March 31, 2022 were:

Recognized in the first quarter of 2022

$5.4 million share basedshare-based payments expense.
$8.5 million amortization of acquired intangible assets primarily from the acquisitions of Iron Planet, SmartEquip, and Rouse.
$169.8 million gain recognized on the disposition of property, plant and equipment of which $169.1 million related to the sale of a property located in Bolton, Ontario.
$9.6 million of acquisition-related and integration costs related to the proposed acquisition of Euro Auctions and the completed acquisitions of SmartEquip and Rouse.
$1.3 million gain due to the change in fair value of derivatives to manage our exposure to foreign currency exchange rate fluctuations on the purchase consideration for the proposed acquisition of Euro Auctions.
$2.3 million of non-recurringother advisory, legal and restructuring costs, which include $0.9 million related to severance and retention costs in connection with the restructuring of our information technology team driven by our strategy to build a new digital technology platform, $0.5 million of terminated and ongoing transaction and legal costs relating to mergers and acquisition activity, $0.4 million of SOX remediation costs, and $0.6 million of advisory costs relating to a cybersecurity incident detected in the fourth quarter of 2021.

Ritchie Bros.

51

Table of Contents

Recognized in the fourth quarter of 2021

$6.2 million share basedshare-based payments expense.
$7.9 million amortization of acquired intangible assets primarily from the acquisitions of Iron Planet, SmartEquip, and Rouse.
$14.0 million of acquisition-related and integration costs related to the proposed acquisition of Euro Auctions and the completed acquisitions of SmartEquip and Rouse.
$0.1 million gain recognized on the disposition of property, plant and equipment
$1.3 million loss due to the change in fair value of derivatives to manage our exposure to foreign currency exchange rate fluctuations on the purchase consideration for the proposed acquisition of Euro Auctions.
$2.6 million of non-recurringother advisory, legal and restructuring costs, which include $1.4 million of terminated and ongoing transaction and legal costs relating to mergers and acquisition activity, $0.7 million of SOX remediation costs relating to our efforts to remediate the material weaknesses identified in 2020, and $0.5 million of advisory costs relating to a cybersecurity incident detected in the fourth quarter of 2021.

Recognized in the third quarter of 2021

$5.6 million share basedshare-based payments expense.
$6.6 million amortization of acquired intangible assets primarily from the acquisitions of Iron Planet and Rouse.
$10.3 million of acquisition-related and integration costs related to the acquisitions of Rouse, and SmartEquip and proposed acquisition of Euro Auctions.
$1.1 million gain recognized on the sale of a property in Denver, Colorado.
$0.7 million of non-recurring advisory, legalconsulting and restructuringlegal costs related to SOX remediation costs relating to our efforts to remediate the material weaknesses identified in 2020, which has been retrospectively applied to the third quarter of 2021.

Recognized in the second quarter of 2021

$7.5 million share basedshare-based payments expense.
$6.8 million amortization of acquired intangible assets primarily from the acquisitions of Iron Planet and Rouse.
$3.0 million of acquisition-related and integration costs related to the acquisition of Rouse.
$0.2 million gain recognized on the disposition of property, plant and equipment
$0.2 million of non-recurring advisory, legalconsulting and restructuringlegal costs related to SOX remediation costs relating to our efforts to remediate the material weaknesses identified in 2020,, which has been retrospectively applied to the second quarter of 2021.

Ritchie Bros.

52

Table of Contents

Adjusting items during the trailing 12-months ended June 30, 2021 were:

Recognized in the first quarter of 2021

$3.8 million share based payments expense.
$6.6 million amortization of acquired intangible assets primarily from the acquisitions of Iron Planet and Rouse.
$2.9 million of acquisition-related costs related to the acquisition of Rouse.

Recognized in the fourth quarter of 2020

$4.6 million share based payments expense.
$5.6 million amortization of acquired intangible assets primarily from the acquisitions of Iron Planet and Rouse.
$6.0 million of acquisition-related costs related to the acquisition of Rouse.
$1.5 million of current income tax expense recognized related to an unfavourable adjustment to reflect final regulations published in the second quarter of 2020 regarding hybrid financing arrangements. 

Recognized in the third quarter of 2020

$8.6 million share based payments expense.
$5.0 million amortization of acquired intangible assets primarily from the acquisitions of Iron Planet.
$0.3 million gain recognized on the disposition of property, plant and equipment
$3.9 million of severance costs, recognized in non-recurring advisory, legal and restructuring costs, related to the realignment of leadership to support the new global operations organization, in line with strategic growth priorities led by the new CEO. These severance costs were reclassified to non-recurring advisory, legal and restructuring costs in 2021.

Ritchie Bros.

5365

Table of Contents

ITEM 3:     QUANTITATIVE AND QUALITATIVE DISCLOSURES ABOUT MARKET RISK

There have been no material changes to our market risk during the sixthree months ended June 30, 2022March 31, 2023 from those disclosed in Item 7A in our Annual Report on Form 10-K for the year ended December 31, 2021,2022, which is available on our website at www.rbauction.comhttps://investor.rbglobal.com, on EDGAR at www.sec.gov, or on SEDAR at www.sedar.com.

ITEM 4:     CONTROLS AND PROCEDURES

Disclosure Controls and Procedures

Management of the Company, including the Chief Executive Officer (“CEO”) and Chief Financial Officer (“CFO”), have evaluated the effectiveness of the Company’s disclosure controls and procedures as at June 30, 2022.of March 31, 2023. The term “disclosure controls and procedures” means controls and other procedures established by the Company that are designed to ensure that information required to be disclosed by the Company in the reports that it files or submits under the Exchange Act is recorded, processed, summarized and reported within the time periods specified in the SEC’s rules and forms. Disclosure controls and procedures include, without limitation, controls and procedures designed to ensure that information required to be disclosed by the Company in the reports that it files or submits under the Exchange Act is accumulated and communicated to the Company’s management, including its CEO and CFO, as appropriate, to allow timely decisions regarding required disclosure.

Based upon their evaluation of the Company’s disclosure controls and procedures, the CEO and the CFO concluded that, as of June 30, 2022,March 31, 2023, the disclosure controls are effective to provide reasonable assurance that information required to be disclosed by the Company in the reports that it files or submits under the Exchange Act is accumulated and communicated to management, including the CEO and CFO, as appropriate, to allow timely decisions regarding required disclosure and are effective to provide reasonable assurance that such information is recorded, processed, summarized and reported within the time periods specified by the SEC’s rules and forms.

On November 2, 2021, the Company completed the acquisition of SmartEquip. SEC guidance permits management to exclude acquisitions from their assessment of internal control over financial reporting during the first year of an acquisition. The Company, is inincluding its CEO and CFO, does not expect that its internal controls and procedures will prevent or detect all error and all fraud. A control system, no matter how well conceived or operated, can provide only reasonable, not absolute, assurance that the process of incorporating SmartEquip into its system of internal control over financial reporting. SmartEquip’s total assets and revenues constituted 6.8% and 1.0%, respectively,objectives of the Company’s total assets and revenues as shown in its consolidated financial statements for the three month period ended June 30, 2022.control system are met.

Changes in Internal Control over Financial Reporting

Management, withOther than related to the participationacquisition of the CEO and CFO, concluded thatIAA, there were no changes in our internal control over financial reporting during the quarter ended June 30, 2022March 31, 2023 that have materially affected, or areis reasonably likely to materially affect, the Company’s internal controlcontrols over financial reporting. We are currently in the process of integrating the IAA operations, control processes and information systems into our systems and control environment. We believe that we have taken the necessary steps to monitor and maintain appropriate internal controls over financial reporting during this integration.

Ritchie Bros.

5466

Table of Contents

PART II – OTHER INFORMATION

ITEM 1:     LEGAL PROCEEDINGS

We have no material legal proceedings pending, other than ordinary routine litigation incidental to the business, and we do not know of any material proceedings contemplated by governmental authorities.

ITEM 1A:     RISK FACTORS

Our business is subject to a number of risks and uncertainties, and our past performance is no guarantee of our performance in future periods. In addition to the other information set forth in this Quarterly Report on Form 10-Q, you should carefully consider the risks and uncertainties discussed in “Part I, Item 1A: Risk Factors” of our Annual Report on Form 10-K for the year ended December 31, 2021,2022, which is available on our website at www.rbauction.com,https://investor.rbglobal.com, on EDGAR at www.sec.gov,, or on SEDAR at www.sedar.comwww.sedar.com.

The following risk factors supplement the risk factors described in “Part I, Item 1A: Risk Factors” of our Annual Report on Form 10-K for the year ended December 31, 2022 and should be read in conjunction with the other risk factors presented in such Annual Report on Form 10-K (unless the context otherwise requires, references to “Ritchie Bros.”, before purchasingthe “Company”, “we”, “our” or “us” in such risk factors shall refer to the combined company).

Information in this section may include “forward-looking statements.” See “Cautionary Note Regarding Forward-Looking Statements” for a discussion of certain qualifications regarding such statements.

Risks Related to Our Recently Completed Acquisition of IAA

Combining the businesses of Ritchie Bros. and IAA may be more difficult, costly or time-consuming than expected, and we may fail to realize the anticipated benefits of the acquisition, which may adversely affect our business results and negatively affect the value of our common shares. Our

The success of our acquisition of IAA will depend on, among other things, our ability to realize the anticipated benefits and operational scale efficiencies from combining the business of IAA with the Ritchie Bros. business. This success will depend largely on our ability to successfully integrate the business of IAA. If we are not able to successfully integrate IAA’s business within the anticipated time frame, or at all, the anticipated operational scale efficiencies and other benefits of the acquisition may not be realized fully, or at all, or may take longer to realize than expected. An inability to realize the full extent of the anticipated benefits of the acquisition of IAA, as well as any delays encountered in the integration process, could alsohave an adverse effect upon our revenue, level of expenses and operating results, which may adversely affect the value of our common shares.

Until the completion of the acquisition, Ritchie Bros. and IAA operated independently, and there can be no assurances that the two businesses can be integrated successfully. It is possible that the integration process could result in the loss of key employees. If key employees terminate their employment, or if an insufficient number of employees are retained to maintain effective operations, our business activities may be adversely affected by additional risks not currently knownand management’s attention may be diverted from integrating the companies to hiring suitable replacements. Moreover, the integration process could result in the loss of customers or other key business relationships, the disruption of our ongoing business, inconsistencies in standards, controls, procedures and policies, unexpected integration issues, higher than expected integration costs and an overall post-completion integration process that takes longer than originally anticipated, any of which may cause our business to suffer.

The challenges involved in this integration, which will be complex and time-consuming, include the following:

combining the companies’ businesses, operations and corporate functions;
meeting our capital requirements in a manner that permits us to achieve any revenue opportunities or operational scale efficiencies anticipated to result from the acquisition, the failure of which would result in the anticipated benefits of the acquisition not being realized in the time frame currently anticipated or at all;
integrating and retaining personnel;
integrating the companies’ technologies;
integrating and unifying the companies’ intellectual property;
integrating operating licenses across our network of physical properties;
identifying and eliminating redundant and underperforming functions and assets;

Ritchie Bros.

67

Table of Contents

harmonizing our operating practices, employee development and compensation programs, internal controls and other policies, procedures and processes;
maintaining existing agreements with customers, business partners, suppliers, landlords and vendors, avoiding delays in entering into new agreements with prospective customers, business partners, suppliers, landlords and vendors, and leveraging relationships with such third parties for our benefit;
addressing possible differences in business backgrounds, corporate cultures and management philosophies;
consolidating our administrative and information technology infrastructure;
coordinating sales strategies and go-to-market efforts; and
coordinating geographically dispersed organizations.

In addition, at times, the attention of certain members of management and other key employees may be focused on the integration of the businesses of the two companies and diverted from day-to-day business operations or other opportunities that may have been beneficial to us, which may disrupt our ongoing business.

We may be unable to realize the anticipated cost synergies and other opportunities expected from the acquisition of IAA, which could adversely affect our business, financial condition and results of operations.

The success of our acquisition of IAA will depend, in part, on our ability to realize the anticipated cost synergies from combining the respective businesses of the two companies. Our ability to achieve such anticipated cost synergies in the time frame expected, or that we currently deemat all, is subject to various assumptions, which may or may not prove to be immaterial.accurate. In addition, we will incur restructuring and integration costs in connection with the acquisition, and the amount of such costs may exceed our expectations. Consequently, we may not be able to realize the net benefits of these cost synergies within the time frame expected or at all. In addition, we may incur additional or unexpected costs in order to realize these benefits. Failure to achieve cost synergies could significantly reduce the expected benefits associated with the acquisition of IAA.

The acquisition of IAA also is expected to create revenue, growth, operational enhancement, expansion and other opportunities for us, including, among others, through cross-selling opportunities, accelerated marketplace innovation, cross-utilization of yards, strengthening IAA’s catastrophic event response and insurance carrier relationships, growing services attachment rates, and/or acceleration of IAA’s international expansion. The identification and scope of these opportunities is based on various assumptions, which may or may not prove to be accurate. These opportunities may not arise as expected, or we may not be able to realize the anticipated benefits from these opportunities, from the sources or in the amount, manner or time frame expected, or at all. In addition, we may incur additional or unexpected costs in order to pursue and/or realize these opportunities. Failure to realize these opportunities could significantly reduce the expected benefits associated with the acquisition of IAA.

Certain contractual counterparties may seek to modify contractual relationships with us, which could have an adverse effect on the Company’s business and operations.

As a result of the acquisition of IAA, we may experience impacts on relationships with contractual counterparties (such as business partners, customers, vendors or other third party service providers) that may harm our business and results of operations. Certain counterparties may seek to terminate or modify contractual obligations following the acquisition whether or not contractual rights are triggered as a result of the acquisition. There can be no guarantee that our contractual counterparties will remain with or continue to have a relationship with Ritchie Bros. or IAA or do so on the same or similar contractual terms following the acquisition. If any contractual counterparties (such as business partners, vendors or other third party service providers) seek to terminate or modify contractual obligations or discontinue the relationship with us, our business and results of operations may be harmed.

Completion of the risks actually occur,acquisition may trigger change in control, assignment or other provisions in certain agreements to which IAA is a party, which may have an adverse impact on the Company’s business and results of operations.

The completion of the acquisition may trigger change in control, assignment and other provisions in certain agreements to which IAA is a party. If we are unable to negotiate waivers of or consents under those provisions, the counterparties may exercise their rights and remedies under the agreements, potentially terminating the agreements or seeking monetary damages or other remedies. Even if we are able to negotiate waivers, the counterparties may require a fee for such waivers or seek to renegotiate the agreements on terms less favorable to the combined company. Any of the foregoing or similar developments may have an adverse impact on our business, financial condition and results of operations, or our ability to successfully integrate IAA’s business.

Ritchie Bros.

68

Table of Contents

We may be exposed to increased litigation, which could have an adverse effect on our business and operations.

We may be exposed to increased litigation from shareholders, customers, partners, suppliers, consumers and other third parties as a result of the acquisition of IAA. Such litigation may have an adverse impact on our business and results of operations and may cause disruptions to our operations.

We have incurred a substantial amount of debt to complete the acquisition of IAA, which could have a material adverse effect on our business, cash flows and financial condition.

We incurred significant debt to complete the acquisition of IAA, including $1.8 billion of borrowings under the Company’s Term Loan A Facility and the issuance of $550.0 million aggregate principal amount of 6.750% Senior Secured Notes due 2028 and $800.0 million aggregate principal amount of 7.750% Senior Notes due 2031. As of March 31, 2023, our Company and its subsidiaries, including IAA, had $3.2 billion of indebtedness, excluding $709.4 million of undrawn commitments under our revolving credit facility. Our ability to make payments on our debt, fund our other liquidity needs and make planned capital expenditures will depend on our ability to generate cash in the future. Our historical financial results have been, and we anticipate that our future financial results will be, subject to fluctuations. Our ability to generate cash is subject in part to general economic, financial, competitive, legislative, regulatory and other factors that are beyond our control. We cannot guarantee that our business will generate sufficient cash flow from our operations or that future borrowings will be available to us in an amount sufficient to enable us to make payments of our debt, de-lever in the time frame expected or at all, fund other liquidity needs and make planned capital expenditures. If our cash flows and capital resources are insufficient to fund debt service obligations, we could face substantial liquidity problems and could be forced to reduce or delay investments and capital expenditures or to dispose of material assets or operations, seek additional debt or equity capital or restructure or refinance our indebtedness.

The degree to which we are currently leveraged could have important consequences for shareholders. For example, it could:

limit our ability to obtain additional financing to fund future working capital, capital expenditures, acquisitions or other general corporate requirements;
require us to dedicate a substantial portion of our cash flow from operations to the payment of debt service, reducing the availability of our cash flow to fund working capital, capital expenditures, acquisitions, dividends and other corporate purposes;
increase our vulnerability to general adverse economic or industry conditions;
expose us to the risk of increased interest rates for any borrowings at variable rates of interest;
limit our flexibility in planning for and reacting to changes in our industry; and
place us at a competitive disadvantage compared to businesses in our industry that have less debt.

Additionally, our debt agreements contain a number of covenants that impose operating and financial restrictions on us and may limit our ability to engage in acts that may be in our long-term best interests. Any failure to comply with covenants in the instruments governing our debt could result in an event of default which, if not cured or waived, would have a material adverse effect on us.

Significant costs have been incurred and are expected to be incurred in connection with the consummation and integration of the acquisition of IAA.

We have incurred, and expect to continue to incur, costs in connection with integrating the operations, products and personnel of Ritchie Bros. with those of IAA, in addition to costs related directly to completing the acquisition. Additional unanticipated costs may be incurred as we continue to integrate the two businesses. Although we expect that the elimination of duplicative costs, as well as the realization of other efficiencies related to the integration of the two businesses may offset incremental transaction and transaction-related costs over time, this net benefit may not be achieved in the near term, to the extent anticipated or at all. While we have assumed that certain expenses would be incurred in connection with the acquisition, there are many factors beyond our control that could affect the total amount or the timing of the integration and implementation expenses.

The IRS may not agree that our Company should be treated as a foreign corporation for U.S. federal income tax purposes.

Under current U.S. federal income tax law, a corporation generally will be considered to be a U.S. corporation for U.S. federal income tax purposes only if it is created or organized in the U.S. or under the law of the U.S. or of any State or the District of Columbia. Accordingly, under generally applicable U.S. federal income tax rules, the Company, which is organized under the laws of Canada, generally would be classified as a foreign corporation. Section 7874 of the Internal Revenue Code of 1986, as amended (the “Code”), and the Treasury Regulations promulgated thereunder, however, contain specific rules that may cause a foreign corporation to be

Ritchie Bros.

69

Table of Contents

treated as a U.S. corporation for U.S. federal income tax purposes (or to be subject to certain other adverse tax consequences) if it acquires, directly or indirectly, substantially all of the assets held, directly or indirectly, by a U.S. corporation. These rules apply only if certain conditions are met, including that the former shareholders of the acquired U.S. corporation hold, by reason of their ownership of shares of that corporation, more than a specified percentage of the shares of the acquiring foreign corporation. Based on the percentage of the merger consideration received by shareholders of IAA that was comprised of Ritchie Bros. shares, these conditions were not met and thus our indirect acquisition of IAA is not expected to cause the Company to be treated as a U.S. corporation (or to be subject to certain other adverse tax consequences) under Section 7874 of the Code. We cannot assure you, however, that the Internal Revenue Service will not take a contrary position or that the relevant U.S. federal income tax law will not be changed (possibly with retroactive effect) in a manner that would result in a contrary conclusion. If it were determined that the Company is treated as a U.S. corporation for U.S. federal income tax purposes under Section 7874 of the Code and the Treasury Regulations promulgated thereunder, the Company could be subject to substantial U.S. tax liability and its non-U.S. shareholders could be subject to U.S. withholding tax on any dividends.

Our business and operating results would be adversely affected due to the loss of one or more significant suppliers, a reduction in significant volume from suppliers, an adverse change in our supplier relationships, or a disruption to our supply of damaged, total loss and low-value vehicles.

With the acquisition of IAA, our business depends on suppliers of damaged, total loss and low-value vehicles. Approximately one-third of IAA’s revenue is associated with vehicles supplied by suppliers or sellers. IAA’s vehicle suppliers include insurance companies, used-vehicle dealers, rental car and fleet lease companies, auto lenders and charitable organizations, among others. IAA has established long-term relationships with virtually all of the major automobile insurance companies. During fiscal 2022, approximately 40% of IAA’s revenue was associated with vehicles supplied by its four largest insurance customers in the United States. IAA’s agreements with insurance company suppliers are generally subject to cancellation by either party upon 30 to 90 days’ notice. There can be no assurance that IAA’s existing agreements will not be canceled or that we will be able to enter into future agreements on favorable terms with these suppliers. We work to develop strong relationships with our suppliers to better understand their needs. From time to time, however, we may experience the loss of suppliers or a reduction in volume from suppliers, including top vehicle suppliers. If we lose one or more of our significant suppliers, or if one or more of our large suppliers were to significantly reduce volume for any reason or favor competitors or new entrants, we may not be successful in replacing such business and our profitability and operating results could be materially adversely affected.

Generally, institutional and dealer suppliers make non-binding long-term commitments to IAA regarding consignment volumes. Changes in the consignment patterns of our key suppliers could have a material adverse effect on our business and operations. There are many factors that can adversely affect volume from suppliers, many of which are beyond our control. These factors include, but are not limited to, the following:

a decrease in the number of vehicles in operation or miles driven;
mild weather conditions that cause fewer traffic accidents;
reduction of policy writing by insurance providers that would affect the number of claims over a period of time;
increases in fuel prices that could lead to a reduction in the miles driven per vehicle, which may reduce the accident rate;
changes in vehicle technology, an increase in autonomous vehicles and vehicles equipped with advanced driver-assistance systems (ADAS);
a decrease in the percentage of claims resulting in a total loss or elimination of automotive collision coverage by consumers;
delays or changes in state title processing;
government regulations on the standards for producing vehicles; and
changes in direct repair procedures that would reduce the number of newer, less damaged total loss vehicles, which tend to have higher salvage values.

Furthermore, in periods when the supply of vehicles from the insurance sector declines, salvage operators have acquired and in the future may acquire vehicles on their own. Also, when used vehicle prices are high, used-vehicle dealers may retail more of their trade-in vehicles on their own rather than selling them at auction.If the supply or value of damaged, total loss and low-value vehicles coming to auction declines significantly, our revenues and profitability may be adversely affected.

Ritchie Bros.

70

Table of Contents

Our business and operating results would be adversely affected if we are unable to meet or exceed our buyer customers’ demand and expectations or due to a disruption in demand of damaged, total loss and low-value vehicles.

We believe our future success depends in part on our ability to respond to changes in buyer requirements, our ability to meet service level expectations of both buyers and sellersand our ability to meet regulatory requirements for such customers. IAA’s buyer customers include automotive body shops, rebuilders, used car dealers, automotive wholesalers, exporters, dismantlers, recyclers, brokers, and the general public, among others. We work to develop strong relationships and interactive dialogue with our customers to better understand current trends and customer needs. If we are not successful in meeting our customers’ expectations, our customer relationships could be negatively affected and result in a loss of future business, which would adversely affect our operating results and financial condition.

IAA’s market position and competitive advantage could be threatened by our competitors and/or disruptive new entrants.

IAA faces significant competition for the supply of damaged and total loss vehicles and the buyers of those vehicles. IAA’s principal sources of competition historically have come from (1) direct competitors (e.g., Copart, Inc. and Total Resource Auctions, a subsidiary of Cox Enterprises, Inc.), (2) new entrants, including new vehicle remarketing venues, and (3) existing alternative vehicle remarketing venues, including used-vehicle auctions and certain salvage buyer groups. Due to the increasing use of the Internet and other technology as marketing and distribution channels, we may face increasing competition from online wholesale and retail marketplaces (generally without any meaningful physical presence) and from our own customers, including insurance companies, when they sell directly to end users through such platforms rather than remarket vehicles through our marketplaces. Increased competition could result in price reductions, reduced margins or loss of market share.

Our future success also depends on our ability to respond to evolving industry trends, changes in customer requirements and new technologies. Some of IAA’s competitors may have greater financial and marketing resources than we do, may be able to respond more quickly to evolving industry dynamics and changes in customer requirements, or may be able to devote greater resources to the development, promotion and sale of new or emerging services and technologies. Our ability to successfully grow through investments in the area of emerging opportunities depends on many factors, including advancements in technology, regulatory changes and other factors that are difficult to predict, or that may significantly affect the future of electrification, autonomy, and mobility. If we are unable to compete successfully or to successfully adapt to industry changes, our business, revenues and profitability could be materially adversely affected.

If our facilities lack the capacity to accept additional vehicles, then our relationships with insurance companies or other vehicle suppliers could be adversely affected.

Capacity at our facilities varies from period to period and by region as a result of various factors, including natural disasters. We may not be able to reach agreements to purchase or lease storage facilities in markets where we have limited available capacity, and zoning restrictions or difficulties obtaining use permits may limit our ability to expand our capacity through acquisitions of new land. If we fail to have sufficient capacity at one or more of our facilities, our relationships with insurance companies or other vehicle suppliers could be adversely affected, which could adversely affect our operating results and financial condition.

We may be unable to keep existing facilities or open new facilities in desirable locations and on favorable terms, which could materially suffer. Asand adversely affect our results of operations.

Local land use and zoning regulations, environmental regulations and other regulatory requirements may impact our ability to find suitable locations and influence the cost of our operations. Most of IAA’s salvage auction vehicle facilities are leased. The termination or expiration of leases at existing facilities may adversely affect us if the renewal terms of those leases are unacceptable to us and we are forced to close the facilities. If we determine to close a location, we may remain obligated under the applicable lease for the remaining lease term and may have to expense the unamortized portion of the right-of-use assets, in part or in full, as an impairment which may have a material impact on our consolidated results of operations and financial position. Also, if we are unable to maintain our existing facilities or open new facilities in desirable locations and on favorable terms, our results of operations could be materially and adversely affected. Further, in an increasing number of markets where we experience significant capacity constraints together with pressing customer demand and a lack of viable alternatives for expansion due to zoning and land use restrictions, we may be required to purchase, lease or occupy industrial sites which may contain significant environmental impacts. 

In addition, some of the facilities on which we operate are impacted by significant recognized environmental concerns and pollution conditions. IAA has incurred, and we may in the future incur, expenditures relating to compliance and risk mitigation efforts, releases of hazardous materials, investigative, remedial or corrective actions, claims by third parties and other environmental issues, and such

Ritchie Bros.

71

Table of Contents

expenditures, individually or in the aggregate, could be significant. Federal and state environmental authorities are currently investigating IAA’s role in contributing to contamination at the Lower Duwamish Waterway Superfund Site in Seattle, Washington and the role of one of IAA’s subsidiaries in contributing to the Pyrite Canyon Plume in Jurupa Valley, California. Our potential liability at these sites cannot be estimated at this time.

Macroeconomic factors, including high fuel prices, high labor costs, rising inflation and changes in used car prices, may have an adverse effect on our revenues and operating results.

Macroeconomic factors that affect oil prices and the vehicle and commodity markets can have adverse effects on our revenue and operating results. Significant increases in the cost of fuel, whether due to inflationary pressures, the current war between Ukraine and Russia or otherwise, could lead to a reduction in miles driven per car and a reduction in accident rates. A materialreduction in accident rates, whether due to a reduction in miles driven or other factors, could reduce our vehicle assignment volumes which, in turn, could have a material adverse impact on our revenues. In addition, significant increases in the cost of fuel have resulted and could continue to result in an increase in the prices charged to us by our independent subhaulers and trucking fleet operators. Further, we have recently experienced labor shortages, which have resulted in an increase in associated costs, such as increased overtime to meet demand and increased wages to attract and retain employees. If these conditions or other inflationary pressures continue, our costs for towing and branch labor may continue to rise. To the extent we are unable to pass these costs on to our customers, the increase in prices charged by our independent subhaulers and trucking fleet operators and the increase in labor costs could negatively impact our profitability.

Volatility in used car prices could have a material adverse effect on our revenues in future periods. While increased used vehicle prices have recently resulted in an increase in our revenue per unit, a sustained increase in used vehicle prices may result in vehicle owners holding on to their vehicles for longer periods of time, which could negatively impact our vehicle assignment volumes.

Adverse economic conditions, including increases in interest rates and lease rates, real estate values and real estate development and construction costs, may increase the costs required to invest in capacity expansion or delay our ability to open new facilities, both of which could have a material impact on our consolidated results of operations and financial position.

Reliance on our subhaulers and trucking fleet operations could materially and adversely affect our business and reputation.

We rely on independent subhaulers and trucking fleet operations to pick up and deliver vehicles to and from our auction facilities. Consistent with the economy generally, we have recently experienced a shortage of towers and haulers, which has resulted in an increase in costs charged to us by towers and subhaulers for these services, and we cannot provide assurances that towers and subhaulers will be available in a timely manner to pick up and deliver vehicles. Failure to pick up and deliver vehicles in a timely manner could harm our brand and reputation, and adversely impact our overall business and results of operations. Further, an increase in fuel cost may lead to increased prices charged by our independent subhaulers and trucking fleet operators, which may significantly increase our cost. We may not be able to pass these costs on to our suppliers or buyers. We are also exposed to risks associated with inclement weather, disruptions in the transportation infrastructure and increase in the price of fuel, any of which could increase our operating costs. If we experience problems or are unable to negotiate or obtain favorable terms with our subhaulers, our results of operations could be materially and adversely affected.

Weather-related and other events beyond our control may adversely impact operations.

Extreme weather or other events, such as hurricanes, tornadoes, earthquakes, forest fires, floods, global pandemics or other health crises, terrorist attacks or war, may adversely affect the overall economic environment, the markets in which we compete, and our operations and profitability. These events, which may increase in frequency and magnitude as a result of climate change, may impact our physical auction facilities, causing a material increase in costs, or delays or cancellation of auction sales, which could have a material adverse impact on our revenues and profitability. In some instances, for example with the trading pricesevere storms in August 2021 and September 2022 known as “Hurricane Ida” and “Hurricane Ian”,these events may result in a sharp influx in the available supply of damaged and total loss vehicles and there can be no assurance that our common sharesbusiness will have sufficient resources to handle such extreme increases in supply. Our failure to meet our customers’ demands in such situations could decline,negatively affect our relationships with such customers and youresult in a loss of future business, which would adversely affect our operating results and financial condition. In addition, revenues generated as a result of the total loss of vehicles associated with such a catastrophe are typically recognized subsequent to the incurrence of incremental costs and such revenues may lose all or partnot be sufficient to offset the costs incurred.

Mild weather conditions tend to result in a decrease in the available supply of your investment.damaged and total loss vehicles because traffic accidents decrease and fewer vehicles are damaged. Accordingly, mild weather can have an adverse effect on our damaged and total

Ritchie Bros.

72

Table of Contents

loss vehicle inventories, which would be expected to have an adverse effect on our revenue and operating results and related growth rates.

There

An increase in the number of damaged and total loss vehicles we purchase could adversely affect our profitability.

In certain countries, the salvage market typically operates on a principal basis, in which a vehicle is purchased and then resold, rather than on an agent basis, in which the auction acts as a sales agent for the owner of the vehicle. Operating on a principal basis exposes us to inventory risks, including losses from theft, damage and obsolescence. If we purchase vehicles, the increased costs associated with acquiring the vehicles could have a material adverse effect on our gross profit margin and operating results. Vehicles sold under purchase agreements were no materialapproximately 6% of IAA’s vehicles sold both domestically and internationally for fiscal 2022. In addition, when vehicles are purchased, we are subject to changes in vehicle values, such as those caused by changes in commodity prices or changes in used car prices. Decreases in commodity prices, such as steel and platinum, may negatively affect vehicle values and demand at auctions. In addition, declines in used car prices, especially if they occur faster than anticipated, can lead to a significant gap between pre-accident value and sales price, which IAA recently experienced with respect to its UK business.

A significant change in used-vehicle prices could impact the proceeds and revenue from the sale of damaged and total loss vehicles.

The volume of new vehicle production, accuracy of lease residual estimates, interest rate fluctuations, customer demand and changes in regulations, among other things, all potentially affect the pricing of used vehicles. A sustained reduction in used-vehicle pricing could result in lower proceeds from the sale of damaged and total loss vehicles and a related reduction in revenue per vehicle, a potential loss of consignors and decreased profitability. Conversely, when used vehicle prices are high, used-vehicle dealers may retail more of their trade-in vehicles on their own rather than selling them at auction, which could adversely affect our revenues and profitability.

IAA assumes the settlement risk factors duringfor vehicles sold through its marketplaces.

Typically, following the three monthssale of a vehicle, IAA does not release the vehicle to a buyer until such time as it has received full payment for the vehicle. We may be obligated, however, to remit payment to a seller before receiving payment from a buyer and in those circumstances, we may not have recourse against sellers for any buyer’s failure to satisfy its payment obligations. Because we retain possession of the vehicle, we can resell the vehicle to mitigate any potential losses. Since revenue for most vehicles does not include the gross sales proceeds, failure to collect the receivables in full may result in a net loss up to the amount of gross sales proceeds on a per vehicle basis in addition to any expenses incurred to collect the receivables and to provide the services associated with the vehicle. If we are unable to collect payments on a large number of vehicles and we are unable to resell them and recover our costs, the resulting payment obligations to the seller and decreased fee revenues may have a material adverse effect on our results of operations and financial condition.

Changes in laws affecting the import and export of damaged and total loss vehicles may have an adverse effect on our business and financial condition.

Changes in laws, regulations and treaties that restrict the importation of damaged and total loss vehicles into foreign countries may reduce the demand for damaged and total loss vehicles and impact our ability to maintain or six months endedincrease IAA’s international buyer base. The adoption of such laws or regulations in other jurisdictions that have the effect of reducing or curtailing our activities abroad could have a material adverse effect on our results of operations and financial condition by reducing the demand for our products and services.

We are subject to potential liabilities with respect to IAA’s prior separation from KAR Auction Services, Inc.

On February 27, 2018, KAR Auction Services, Inc. (“KAR”) announced a plan to pursue the separation and spin-off (the “Separation”) of IAA (its salvage auction services business) into a separate public company. On June 30, 2022.28, 2019, KAR completed the distribution of 100% of the issued and outstanding shares of common stock of IAA to the holders of record of KAR’s common stock on June 18, 2019, on a pro rata basis (the “Distribution”). Under the terms of the Separation and Distribution, each of IAA and KAR is required to indemnify the other party from and with respect to certain liabilities. IAA’s and KAR’s ability to satisfy these indemnities, if called upon to do so, will depend respectively upon our and KAR’s future financial strength. If we are required to indemnify KAR, or if we are not able to collect on indemnification rights from KAR, our financial condition, liquidity or results of operations could be materially and adversely affected.

Ritchie Bros.

73

Table of Contents

ITEM 2: UNREGISTERED SALES OF EQUITY SECURITIES AND USE OF PROCEEDS

None.

ITEM 3:     DEFAULTS UPON SENIOR SECURITIES

None.

ITEM 4:     MINE SAFETY DISCLOSURES

Not applicable.

ITEM 5:     OTHER INFORMATION

None.

Ritchie Bros.

5574

Table of Contents

ITEM 6:     EXHIBITS

Exhibits

The exhibits listed in below are filed as part of this Quarterly Report on Form 10-Q and incorporated herein by reference.

Exhibit

Number


Document

10.12.1

EmploymentAmendment to the Agreement and Plan of Merger and Reorganization, dated January 22, 2023, by and among Ritchie Bros. Auctioneers Incorporated, Ritchie Bros, Holdings Inc., Impala Merger Sub I, LLC, Impala Merger Sub II, LLC, and IAA, Inc. (incorporated by reference to Exhibit 2.1 to the Company’s Current Report on Form 8-K filed on January 23, 2023).

3.1

Articles of Amendment, dated February 1, 2023 (incorporated by reference to Exhibit 3.1 to the Company’s Current Report on Form 8-K filed on February 1, 2023).

4.1

Indenture, dated as of March 15, 2023, among Ritchie Bros. Auctioneers Incorporated, Ritchie Bros. Holdings Inc. and U.S. Bank Trust Company, National Association, as trustee, and U.S. Bank Trust Company, National Association, as collateral agent, relating to Ritchie Bros. Holdings Inc.’s 6.750% Senior Secured Notes due 2028 (includes form of note) (incorporated by reference to Exhibit 4.1 to the Company’s Current Report on Form 8-K filed on March 15, 2023).

4.2

Indenture, dated as of March 15, 2023, among Ritchie Bros. Auctioneers Incorporated, Ritchie Bros. Holdings Inc. and U.S. Bank Trust Company, National Association, as trustee, relating to Ritchie Bros. Holdings Inc.’s 7.750% Senior Notes due 2031 (includes form of note) (incorporated by reference to Exhibit 4.2 to the Company’s Current Report on Form 8-K filed on March 15, 2023).

4.3

Supplemental Indenture, dated as of March 20, 2023, by and between Ritchie Bros. Holdings Inc., as issuer, the parties that are signatories thereto as Subsidiary Guarantors, as subsidiary guarantors, and U.S. Bank Trust Company, National Association, as trustee and collateral agent (incorporated by reference to Exhibit 4.2 to the Company’s Current Report on Form 8-K filed on March 21, 2023).

4.4

Supplemental Indenture, dated as of March 20, 2023, by and between Ritchie Bros. Holdings Inc., as issuer, the parties that are signatories thereto as Subsidiary Guarantors, as subsidiary guarantors, and U.S. Bank Trust Company, National Association, as trustee (incorporated by reference to Exhibit 4.4 to the Company’s Current Report on Form 8-K filed on March 21, 2023).

4.5

Intercreditor Agreement, dated as of March 20, 2023, by and between Bank of America, N.A., as administrative agent, and U.S. Bank Trust Company, National Association, as collateral agent, and consented to by the Company and the subsidiaries of the Company party to such consent as grantors of Collateral (incorporated by reference to Exhibit 4.5 to the Company’s Current Report on Form 8-K filed on March 21, 2023).

10.1*

Securities Purchase Agreement, dated as of January 22, 2023, by and among Ritchie Bros. Auctioneers (Canada) Ltd.Incorporated, Starboard Value LP, Jeffrey Smith and Eric Jacobs,the purchasers named therein (incorporated by reference to Exhibit 10.1 to the Company’s Current Report on Form 8-K filed on January 23, 2023).

10.2*

Registration Rights Agreement, dated May 31, 2022as of February 1, 2023, by and among Ritchie Bros. Auctioneers Incorporated and the Purchasers named therein (incorporated by reference to Exhibit 10.1 to the Company’s Current Report on Form 8-K filed on February 1, 2023).

31.1

Certification of Chief Executive Officer pursuant to Rule 13a-14(a) under the Securities Exchange Act of 1934, as amended

31.2

Certification of Chief Financial Officer pursuant to Rule 13a-14(a) under the Securities Exchange Act of 1934, as amended

32.1

Certification of Chief Executive Officer pursuant to 18 U.S.C. Section 1350, as adopted pursuant to Section 906 of the Sarbanes-Oxley Act of 2002

32.2

Certification of Chief Financial Officer pursuant to 18 U.S.C. Section 1350, as adopted pursuant to Section 906 of the Sarbanes-Oxley Act of 2002

101

Interactive Data Files Pursuant to Rule 405 of Regulation S-T, , for the Company’s Quarterly Report on Form 10-Q for the quarter ended June 30, 2022,March 31, 2023, formatted in Inline XBRL: (i) Condensed Consolidated Income Statements; (ii) Condensed Consolidated Balance Sheets; (iii) Condensed Consolidated Statements of Changes in Equity; (iv) Condensed Consolidated Statements of Cash Flows; and (v) Notes to the Condensed Consolidated Financial Statements

104

Cover page from the Company’s Quarterly Report on Form 10-Q for the quarter ended June 30, 2022,March 31, 2023, formatted in Inline XBRL and contained in Exhibit 101

* Certain schedules and similar attachments have been omitted pursuant to Item 601(a)(5) of Regulation S-K.

Ritchie Bros.

5675

Table of Contents

SIGNATURES

Pursuant to the requirements of the Securities Exchange Act of 1934, the registrant has duly caused this report to be signed on its behalf by the undersigned, thereunto duly authorized.

RITCHIE BROS. AUCTIONEERS INCORPORATED

Dated: August 4, 2022May 10, 2023

By:

/s/ Ann Fandozzi

Ann Fandozzi

Chief Executive Officer

Dated: August 4, 2022May 10, 2023

By:

/s/ Eric Jacobs

Eric Jacobs

Chief Financial Officer

Ritchie Bros.

5776