UNITED STATES
SECURITIES AND EXCHANGE COMMISSION
WASHINGTON, D.C. 20549
FORM 10-Q
|
| |
| x | QUARTERLY REPORT PURSUANT TO SECTION 13 OR 15(d) OF THE SECURITIES EXCHANGE ACT OF 1934 |
For the quarterly period ended September 30, 2015March 31, 2016
OR
|
| |
| ¨ | TRANSITION REPORT PURSUANT TO SECTION 13 OR 15(d) OF THE SECURITIES EXCHANGE ACT OF 1934 |
For the transition period from to
Commission file number 001-35896
Ellington Residential Mortgage REIT
(Exact Name of Registrant as Specified in Its Charter)
|
| | |
| Maryland | | 46-0687599 |
| (State or Other Jurisdiction of Incorporation) | | (IRS Employer Identification No.) |
53 Forest Avenue
Old Greenwich, CT 06870
(Address of principal executive offices, zip code)
(203) 698-1200
(Registrant's Telephone Number, Including Area Code)
Indicate by check mark whether the registrant (1) has filed all reports required to be filed by Section 13 or 15(d) of the Securities Exchange Act of 1934 during the preceding 12 months (or for such shorter period that the registrant was required to file such reports), and (2) has been subject to such filing requirements for the past 90 days. Yes x No ¨
Indicate by check mark whether the registrant has submitted electronically and posted on its corporate Web site, if any, every Interactive Data File required to be submitted and posted pursuant to Rule 405 of Regulation S-T (§ 232.405 of this chapter) during the preceding 12 months (or for such shorter period that the registrant was required to submit and post such files). Yes x No ¨
Indicate by check mark whether the registrant is a large accelerated filer, an accelerated filer, a non-accelerated filer, or a smaller reporting company. See definitions of "large accelerated filer," "accelerated filer" and "smaller reporting company" in Rule 12b-2 of the Exchange Act.
|
| | | | |
| Large Accelerated Filer | ¨ | | Accelerated Filer | x |
| Non-Accelerated Filer (do not check if a smaller reporting company) | ¨ | | Smaller Reporting Company | ¨ |
Indicate by check mark whether the registrant is a shell company (as defined in Rule 12b-2 of the Exchange Act). Yes ¨ No x
Indicate the number of shares outstanding of each of the issuer's classes of common stock, as of the latest practicable date.
|
| | |
| Class | | Outstanding at October 30, 2015April 29, 2016 |
| Common Shares of Beneficial Interest, $0.01 par value per share | | 9,135,0219,117,183 |
ELLINGTON RESIDENTIAL MORTGAGE REIT
INDEX
|
| |
| PART I. Financial Information | |
| Item 1. Consolidated Financial Statements (unaudited) | |
| Item 2. Management's Discussion and Analysis of Financial Condition and Results of Operations | |
| Item 3. Quantitative and Qualitative Disclosures about Market Risk | |
| Item 4. Controls and Procedures | |
| PART II. Other Information | |
| Item 1. Legal Proceedings | |
| Item 1A. Risk Factors | |
| Item 2. Unregistered Sales of Equity Securities and Use of Proceeds | |
| Item 5. Other Information | |
| Item 6. Exhibits | |
PART I. FINANCIAL INFORMATION
Item 1. Consolidated Financial Statements (unaudited)
ELLINGTON RESIDENTIAL MORTGAGE REIT
CONSOLIDATED BALANCE SHEET
(UNAUDITED)
| | | | September 30, 2015 | | December 31, 2014 | March 31, 2016 | | December 31, 2015 |
| (In thousands except for share amounts) | | | | | | |
| ASSETS | | | | | | |
| Cash and cash equivalents | $ | 40,482 |
| | $ | 45,237 |
| $ | 41,242 |
| | $ | 40,166 |
|
| Mortgage-backed securities, at fair value | 1,280,892 |
| | 1,393,303 |
| 1,173,593 |
| | 1,242,266 |
|
| Due from brokers | 41,068 |
| | 18,531 |
| 30,206 |
| | 33,297 |
|
| Financial derivatives–assets, at fair value | 1,527 |
| | 3,072 |
| 1,635 |
| | 2,183 |
|
| Reverse repurchase agreements | 76,610 |
| | 13,987 |
| 69,575 |
| | 78,632 |
|
| Receivable for securities sold | 70,087 |
| | 41,834 |
| 64,243 |
| | 155,526 |
|
| Interest receivable | 4,784 |
| | 4,793 |
| 4,092 |
| | 4,325 |
|
| Other assets | 407 |
| | 317 |
| 523 |
| | 289 |
|
| Total Assets | $ | 1,515,857 |
| | $ | 1,521,074 |
| $ | 1,385,109 |
| | $ | 1,556,684 |
|
| LIABILITIES AND SHAREHOLDERS' EQUITY | | | | | | |
| LIABILITIES |
| | |
| | |
| Repurchase agreements | $ | 1,225,905 |
| | $ | 1,323,080 |
| $ | 1,133,841 |
| | $ | 1,222,719 |
|
| Payable for securities purchased | 45,333 |
| | 4,227 |
| 16,433 |
| | 98,949 |
|
| Due to brokers | 2,654 |
| | 583 |
| 127 |
| | 439 |
|
| Financial derivatives–liabilities, at fair value | 16,414 |
| | 8,700 |
| 18,284 |
| | 4,725 |
|
| U.S. Treasury securities sold short, at fair value | 70,671 |
| | 13,959 |
| 69,607 |
| | 78,447 |
|
| Dividend payable | 4,111 |
| | 5,032 |
| 4,103 |
| | 4,111 |
|
| Accrued expenses | 771 |
| | 890 |
| 447 |
| | 533 |
|
| Management fee payable | 557 |
| | 551 |
| 528 |
| | 545 |
|
| Interest payable | 1,416 |
| | 687 |
| 1,382 |
| | 1,361 |
|
| Total Liabilities | 1,367,832 |
| | 1,357,709 |
| 1,244,752 |
| | 1,411,829 |
|
| SHAREHOLDERS' EQUITY | | | | | | |
Preferred shares, par value $0.01 per share, 100,000,000 shares authorized; (0 shares issued and outstanding, respectively) | — |
| | — |
| — |
| | — |
|
Common shares, par value $0.01 per share, 500,000,000 shares authorized; (9,135,021 and 9,149,274 shares issued and outstanding, respectively) | 91 |
| | 91 |
| |
Common shares, par value $0.01 per share, 500,000,000 shares authorized; (9,117,183 and 9,135,103 shares issued and outstanding, respectively) | | 92 |
| | 92 |
|
| Additional paid-in-capital | 181,066 |
| | 181,282 |
| 180,871 |
| | 181,027 |
|
| Accumulated deficit | (33,132 | ) | | (18,008 | ) | (40,606 | ) | | (36,264 | ) |
| Total Shareholders' Equity | 148,025 |
| | 163,365 |
| 140,357 |
| | 144,855 |
|
| Total Liabilities and Shareholders' Equity | $ | 1,515,857 |
| | $ | 1,521,074 |
| $ | 1,385,109 |
| | $ | 1,556,684 |
|
See Notes to Consolidated Financial Statements
3
ELLINGTON RESIDENTIAL MORTGAGE REIT
CONSOLIDATED STATEMENT OF OPERATIONS
(UNAUDITED)
| | | | | Three Month Period Ended
September 30, 2015 | | Three Month Period Ended
September 30, 2014 | | Nine Month Period Ended
September 30, 2015 | | Nine Month Period Ended
September 30, 2014 | | Three Month Period Ended
March 31, 2016 | | Three Month Period Ended
March 31, 2015 |
| (In thousands except for per share amounts) | | | | | | | | | | | | |
| INTEREST INCOME (EXPENSE) | | | | | | | | | | | | |
| Interest income | | $ | 11,315 |
| | $ | 11,484 |
| | $ | 31,436 |
| | $ | 35,018 |
| | $ | 9,651 |
| | $ | 10,280 |
|
| Interest expense | | (1,642 | ) | | (1,121 | ) | | (4,420 | ) | | (3,346 | ) | | (2,051 | ) | | (1,258 | ) |
| Total net interest income | | 9,673 |
| | 10,363 |
| | 27,016 |
| | 31,672 |
| | 7,600 |
| | 9,022 |
|
| EXPENSES | | | | | | | | | | | | |
| Management fees | | 557 |
| | 574 |
| | 1,759 |
| | 1,733 |
| | 528 |
| | 610 |
|
| Professional fees | | 144 |
| | 123 |
| | 422 |
| | 399 |
| | 218 |
| | 143 |
|
| Other operating expenses | | 574 |
| | 597 |
| | 1,774 |
| | 1,873 |
| |
Compensation expense(1) | | | 151 |
| | 193 |
|
Other operating expenses(1) | | | 454 |
| | 470 |
|
| Total expenses | | 1,275 |
| | 1,294 |
| | 3,955 |
| | 4,005 |
| | 1,351 |
| | 1,416 |
|
| OTHER INCOME (LOSS) | | | | | | | | | | | | |
| Net realized gains (losses) on mortgage-backed securities | | 596 |
| | 2,030 |
| | 8,760 |
| | (613 | ) | |
| Net realized losses on financial derivatives | | (3,252 | ) | | (4,391 | ) | | (15,838 | ) | | (18,955 | ) | |
| Change in net unrealized gains (losses) on mortgage-backed securities | | 4,862 |
| | (5,455 | ) | | (7,674 | ) | | 37,550 |
| |
| Net realized gains (losses) on securities | | | 3,010 |
| | 6,722 |
|
| Net realized gains (losses) on financial derivatives | | | (3,996 | ) | | (8,743 | ) |
| Change in net unrealized gains (losses) on securities | | | 8,633 |
| | 5,186 |
|
| Change in net unrealized gains (losses) on financial derivatives | | (15,421 | ) | | 2,280 |
| | (9,258 | ) | | (28,305 | ) | | (14,135 | ) | | (7,094 | ) |
| Total other loss | | (13,215 | ) | | (5,536 | ) | | (24,010 | ) | | (10,323 | ) | |
| Total other income (loss) | | | (6,488 | ) | | (3,929 | ) |
| NET INCOME (LOSS) | | $ | (4,817 | ) | | $ | 3,533 |
| | $ | (949 | ) | | $ | 17,344 |
| | $ | (239 | ) | | $ | 3,677 |
|
| NET INCOME (LOSS) PER COMMON SHARE: | | | | | | | | | | | | |
| Basic and Diluted | | $ | (0.53 | ) | | $ | 0.39 |
| | $ | (0.10 | ) | | $ | 1.90 |
| | $ | (0.03 | ) | | $ | 0.40 |
|
| CASH DIVIDENDS PER COMMON SHARE: | | | | | | | | | | | | |
| Dividends declared | | $ | 0.45 |
| | $ | 0.55 |
| | $ | 1.55 |
| | $ | 1.65 |
| | $ | 0.45 |
| | $ | 0.55 |
|
| |
| (1) | Conformed to current period presentation. |
See Notes to Consolidated Financial Statements
4
ELLINGTON RESIDENTIAL MORTGAGE REIT
CONSOLIDATED STATEMENT OF SHAREHOLDERS' EQUITY
(UNAUDITED)
| | | | Common Shares | | Common Shares, par value | | Preferred Shares | | Preferred Shares, par value | | Additional Paid-in-Capital | | Accumulated (Deficit) Earnings | | Total | Common Shares | | Common Shares, par value | | Preferred Shares | | Preferred Shares, par value | | Additional Paid-in-Capital | | Accumulated (Deficit) Earnings | | Total |
| (In thousands except for share amounts) | | | | | | | | | | | | | | | | | | | | | | | | | | |
| BALANCE, December 31, 2013 | 9,139,842 |
| | $ | 91 |
| | — |
| | $ | — |
| | $ | 181,147 |
| | $ | (14,058 | ) | | $ | 167,180 |
| |
| Issuance of restricted shares | 9,432 |
| | — |
| | — |
| | — |
| | — |
| | | | — |
| |
| BALANCE, December 31, 2014 | | 9,149,274 |
| | $ | 91 |
| | — |
| | $ | — |
| | $ | 181,282 |
| | $ | (18,008 | ) | | $ | 163,365 |
|
| Share based compensation | | | | | | | | | 105 |
| | | | 105 |
| | | | | | | | | 30 |
| | | | 30 |
|
| Dividends declared | | | | | | | | | | | (15,086 | ) | | (15,086 | ) | | | | | | | | | | | (5,032 | ) | | (5,032 | ) |
| Net income | | | | | | | | | | | 17,344 |
| | 17,344 |
| | | | | | | | | | | 3,677 |
| | 3,677 |
|
| BALANCE, September 30, 2014 | 9,149,274 |
| | $ | 91 |
| | — |
| | $ | — |
| | $ | 181,252 |
| | $ | (11,800 | ) | | $ | 169,543 |
| |
| BALANCE, March 31, 2015 | | 9,149,274 |
| | 91 |
| | — |
| | — |
| | 181,312 |
| | (19,363 | ) | | 162,040 |
|
| | | | | | | | | | | | | | | | | | | | | | | | | | | |
| BALANCE, December 31, 2014 | 9,149,274 |
| | $ | 91 |
| | — |
| | $ | — |
| | $ | 181,282 |
| | $ | (18,008 | ) | | $ | 163,365 |
| |
| Issuance of restricted shares | 9,228 |
| | — |
| | — |
| | — |
| | — |
| | | | — |
| |
| BALANCE, December 31, 2015 | | 9,135,103 |
| | 92 |
| | — |
| | — |
| | 181,027 |
| | (36,264 | ) | | 144,855 |
|
| Share based compensation | | | | | | | | | | 40 |
| | | | 40 |
|
| Repurchase of common shares | (23,481 | ) | | — |
| | — |
| | — |
| | (304 | ) | | | | (304 | ) | (17,920 | ) | | — |
| | — |
| | — |
| | (196 | ) | | | | (196 | ) |
| Share based compensation | | | | | | | | | 88 |
| | | | 88 |
| |
| Dividends declared | | | | | | | | | | | (14,175 | ) | | (14,175 | ) | | | | | | | | | | | (4,103 | ) | | (4,103 | ) |
| Net loss | | | | | | | | | | | (949 | ) | | (949 | ) | | | | | | | | | | | (239 | ) | | (239 | ) |
| BALANCE, September 30, 2015 | 9,135,021 |
| | $ | 91 |
| | — |
| | $ | — |
| | $ | 181,066 |
| | $ | (33,132 | ) | | $ | 148,025 |
| |
| BALANCE, March 31, 2016 | | 9,117,183 |
| | $ | 92 |
| | — |
| | $ | — |
| | $ | 180,871 |
| | $ | (40,606 | ) | | $ | 140,357 |
|
See Notes to Consolidated Financial Statements
5
ELLINGTON RESIDENTIAL MORTGAGE REIT
CONSOLIDATED STATEMENT OF CASH FLOWS
(UNAUDITED)
| | | | | Nine Month Period Ended September 30, 2015 | | Nine Month
Period Ended
September 30, 2014 | | Three Month Period Ended March 31, 2016 | | Three Month Period Ended
March 31, 2015 |
| (In thousands) | | | | | | | | |
| Cash flows provided by (used in) operating activities: | | | | | | | | |
| Net income (loss) | | $ | (949 | ) | | $ | 17,344 |
| | $ | (239 | ) | | $ | 3,677 |
|
| Reconciliation of net income (loss) to net cash provided by (used in) operating activities: | | | | | | | | |
| Net realized (gains) losses on mortgage-backed securities | | (8,760 | ) | | 613 |
| |
| Change in net unrealized (gains) losses on mortgage-backed securities | | 7,674 |
| | (37,550 | ) | |
| Net realized losses on financial derivatives | | 15,838 |
| | 18,955 |
| |
| Net realized (gains) losses on securities | | | (3,010 | ) | | (6,722 | ) |
| Change in net unrealized (gains) losses on securities | | | (8,633 | ) | | (5,186 | ) |
| Net realized (gains) losses on financial derivatives | | | 3,996 |
| | 8,743 |
|
| Change in net unrealized (gains) losses on financial derivatives | | 9,258 |
| | 28,305 |
| | 14,135 |
| | 7,094 |
|
| Amortization of premiums and accretion of discounts (net) | | 6,468 |
| | 5,254 |
| | 1,850 |
| | 2,477 |
|
| Share based compensation | | 88 |
| | 105 |
| | 40 |
| | 30 |
|
| (Increase) decrease in assets: | | | | | | | | |
| Due from brokers | | (22,537 | ) | | (1,724 | ) | | 3,091 |
| | (10,209 | ) |
| Interest receivable | | 9 |
| | (835 | ) | | 233 |
| | 342 |
|
| Other assets | | (90 | ) | | (258 | ) | | (234 | ) | | (293 | ) |
| Increase (decrease) in liabilities: | | | | | | | | |
| Due to brokers | | 2,071 |
| | (18,899 | ) | | (312 | ) | | 1,026 |
|
| Accrued expenses | | (119 | ) | | (69 | ) | | (86 | ) | | 18 |
|
| Interest payable | | 729 |
| | (173 | ) | | 21 |
| | 164 |
|
| Management fees payable | | 6 |
| | (26 | ) | | (17 | ) | | 59 |
|
| Net cash provided by operating activities | | 9,686 |
| | 11,042 |
| |
| Net cash provided by (used in) operating activities | | | 10,835 |
| | 1,220 |
|
| Cash flows provided by (used in) investing activities: | | | | | | | | |
| Purchases of mortgage-backed securities | | (1,479,612 | ) | | (1,478,619 | ) | |
| Proceeds from sale of mortgage-backed securities | | 1,496,506 |
| | 1,506,513 |
| |
| Purchases of securities | | | (723,002 | ) | | (482,987 | ) |
| Proceeds from sale of securities | | | 782,510 |
| | 584,903 |
|
| Principal repayments of mortgage-backed securities | | 103,189 |
| | 72,761 |
| | 30,044 |
| | 31,207 |
|
| Proceeds from investments sold short | | 675,693 |
| | 141,527 |
| | 157,931 |
| | 214,417 |
|
| Repurchase of investments sold short | | (619,180 | ) | | (138,957 | ) | | (169,090 | ) | | (165,926 | ) |
| Proceeds from disposition of financial derivatives | | 10,700 |
| | 7,592 |
| | 3,004 |
| | 4,457 |
|
| Purchase of financial derivatives | | (26,538 | ) | | (26,547 | ) | | (7,028 | ) | | (13,200 | ) |
| Payments made on reverse repurchase agreements | | (10,639,503 | ) | | (712,899 | ) | | (4,546,558 | ) | | (2,092,173 | ) |
| Proceeds from reverse repurchase agreements | | 10,576,879 |
| | 710,415 |
| | 4,555,615 |
| | 2,043,187 |
|
| Net cash provided by investing activities | | 98,134 |
| | 81,786 |
| |
| Net cash provided by (used in) investing activities | | | 83,426 |
| | 123,885 |
|
| Cash flows provided by (used in) financing activities: | | | | | | | | |
| Offering costs paid | | — |
| | (239 | ) | |
| Repurchase of common shares | | (304 | ) | | — |
| | (196 | ) | | — |
|
| Dividends paid | | (15,096 | ) | | (14,624 | ) | | (4,111 | ) | | (5,032 | ) |
| Borrowings under repurchase agreements | | 2,010,434 |
| | 4,484,173 |
| | 559,785 |
| | 1,421,636 |
|
| Repayments of repurchase agreements | | (2,107,609 | ) | | (4,561,187 | ) | | (648,663 | ) | | (1,533,606 | ) |
| Cash used in financing activities | | (112,575 | ) | | (91,877 | ) | |
| Cash provided by (used in) financing activities | | | (93,185 | ) | | (117,002 | ) |
| NET INCREASE (DECREASE) IN CASH AND CASH EQUIVALENTS | | (4,755 | ) | | 951 |
| | 1,076 |
| | 8,103 |
|
| CASH AND CASH EQUIVALENTS, BEGINNING OF PERIOD | | 45,237 |
| | 50,112 |
| | 40,166 |
| | 45,237 |
|
| CASH AND CASH EQUIVALENTS, END OF PERIOD | | $ | 40,482 |
| | $ | 51,063 |
| | $ | 41,242 |
| | $ | 53,340 |
|
| Supplemental disclosure of cash flow information: | | | | | | | | |
| Interest paid | | $ | 3,691 |
| | $ | 3,520 |
| | $ | 2,030 |
| | $ | 1,094 |
|
| Dividends payable | | $ | 4,111 |
| | $ | 5,032 |
| | $ | 4,103 |
| | $ | 5,032 |
|
See Notes to Consolidated Financial Statements
6
ELLINGTON RESIDENTIAL MORTGAGE REIT
NOTES TO CONSOLIDATED FINANCIAL STATEMENTS
September 30, 2015March 31, 2016
(UNAUDITED)
1. Organization and Investment Objective
Ellington Residential Mortgage REIT, or "EARN," was formed as a Maryland real estate investment trust, or "REIT," on August 2, 2012, and commenced operations on September 25, 2012. EARN conducts its business through its wholly owned subsidiaries, EARN OP GP LLC, or the "General Partner," and Ellington Residential Mortgage LP, or the "Operating Partnership," which were formed as a Delaware limited liability company and a Delaware limited partnership, respectively, on July 31, 2012 and commenced operations on September 25, 2012. The Operating Partnership conducts its business of acquiring, investing in, and managing residential mortgage-related and real estate-related assets through its wholly owned subsidiaries. EARN, the General Partner, the Operating Partnership, and their consolidated subsidiaries are hereafter defined as the "Company."
Ellington Residential Mortgage Management LLC, or the "Manager," serves as the Manager of the Company pursuant to the terms of the ThirdFourth Amended and Restated Management Agreement (the "Management Agreement"). The Manager is an affiliate of Ellington Management Group, L.L.C., or "EMG," an investment management firm that is registered as an SEC-registered investment adviser with a 20-year21-year history of investing in a broad spectrum of mortgage-backed securities and related derivatives, with an emphasis on the residential mortgage-backed securities, or "RMBS," market. In accordance with the terms of the Management Agreement and the Services Agreement, as discussed in Note 10, the Manager is responsible for administering the Company's business activities and day-to-day operations, and performs certain services, subject to oversight by the Board of Trustees. See Notes 8 and 10Note 9 for further information on the Management Agreement.
The Company acquires and manages RMBS, for which the principal and interest payments are guaranteed by a U.S. government agency or a U.S. government-sponsored entity, or "Agency RMBS," and RMBS that do not carry such guarantees, or "non-Agency RMBS," such as RMBS backed by prime jumbo, Alternative A-paper, manufactured housing, and subprime residential mortgage loans. Agency RMBS include both Agency pools and Agency collateralized mortgage obligations, or "CMOs," and non-Agency RMBS primarily consist of non-Agency CMOs, both investment grade and non-investment grade. The Company may also acquire and manage mortgage servicing rights, residential mortgage loans, and other mortgage- and real estate-related assets. The Company may also invest in other instruments including, but not limited to, forward-settling To-Be-Announced Agency pass-through certificates, or "TBAs," interest rate swaps and swaptions, U.S. Treasury securities, Eurodollar and U.S. Treasury futures, other financial derivatives, and cash equivalents. The Company's targeted investments may range from unrated first loss securities to AAA senior securities.
The Company has elected to be taxed as a REIT under the Internal Revenue Code of 1986, as amended, or "the Code".Code," and intends to conduct its operations to be qualified and taxed as REIT. As a REIT, the Company is required to distribute annually at least 90% of its taxable income. As long as the Company continues to qualify as a REIT, it will not be subject to U.S. federal or state corporate taxes on its taxable income to the extent that it distributes all of its annual taxable income to its shareholders. It is the intention of the Company to distribute at least 100% of its taxable income, after application of available tax attributes, within the time limits prescribed by the Code, which may extend into the subsequent taxable year.
2. Significant Accounting Policies
(A) Basis of Presentation: The Company's unaudited interim consolidated financial statements have been prepared in conformity with generally accepted accounting principles in the United States of America, or "U.S. GAAP." Entities in which the Company has a controlling financial interest, through ownership of the majority of the entities' voting equity interests, or through other contractual rightrights that give the Company control, are consolidated by the Company. All inter-company balances and transactions have been eliminated. The preparation of consolidated financial statements in conformity with U.S. GAAP requires management to make estimates and assumptions that affect the reported amounts of assets and liabilities at the date of the consolidated financial statements and the reported amounts of revenues and expenses during the reporting period. Actual results could differ from those estimates and those differences could be material. In management's opinion, all material adjustments, considered necessary for a fair presentation of the Company's interim consolidated financial statements have been included and are only of a normal recurring nature. Interim results are not necessarily indicative of the results that may be expected for the entire fiscal year. The information included in this Quarterly Report on Form 10-Q should be read in conjunction with the Company's Annual Report on Form 10-K for the year ended December 31, 2014.2015.
(B) Valuation: The Company applies ASC 820-10, Fair Value Measurement and Disclosures ("ASC 820-10"), to its holdings of financial instruments. ASC 820-10 establishes a three-level valuation hierarchy for disclosure of fair value
measurements. The valuation hierarchy is based upon the observability of inputs to the valuation of an asset or liability as of the measurement date. The three levels are defined as follows:
Level 1—inputs to the valuation methodology are observable and reflect quoted prices (unadjusted) for identical assets or liabilities in active markets. Currently, the types of financial instruments the Company generally includes in this category are, exchange-traded derivatives, and cash equivalents;derivatives;
Level 2—inputs to the valuation methodology other than quoted prices included in Level 1 are observable for the asset or liability, either directly or indirectly. Currently, the types of financial instruments that the Company generally includes in this category are Agency RMBS, non-Agency RMBS determined to have sufficiently observable market data, U.S. Treasury securities, actively traded derivatives such as TBAs, interest rate swaps, and swaptions; and
Level 3—inputs to the valuation methodology are unobservable and significant to the fair value measurement. Currently, this category includes RMBS where there is less price transparency.
For certain financial instruments, the various inputs that management uses to measure fair value for such financial instrument may fall into different levels of the fair value hierarchy. In such cases, the determination of which category within the fair value hierarchy is appropriate for such financial instrument is based on the lowest level of input that is significant to the fair value measurement. ASC 820 prioritizes the various inputs that management uses to measure fair value with the highest priority to inputs that are observable and reflect quoted prices (unadjusted) for identical assets or liabilities in active markets (Level 1) and the lowest priority to inputs that are unobservable and significant to the fair value measurement (Level 3). The assessment of the significance of a particular input to the fair value measurement in its entirety requires judgment and considers factors specific to the financial instrument. The Company may use valuation techniques consistent with the market and income approaches to measure the fair value of its assets and liabilities. The market approach uses third-party valuations and information obtained from market transactions involving identical or similar assets or liabilities. The income approach uses projections of the future economic benefits of an instrument to determine its fair value, such as in the discounted cash flow methodology. The inputs or methodology used for valuing financial instruments are not necessarily an indication of the risk associated with investing in these financial instruments. Transfers between levels of the fair value hierarchy are assumed to occur at the end of the reporting period.
Summary Valuation Techniques
For financial instruments that are traded in an "active market," the best measure of fair value is the quoted market price. However, many of the Company's financial instruments are not traded in an active market. Therefore, management generally uses third-party valuations when available. If third-party valuations are not available, management uses other valuation techniques, such as the discounted cash flow methodology. The following are summary descriptions, for the various categories of financial instruments, of the valuation methodologies management uses in determining fair value of the Company's financial instruments in such categories. Management utilizes such methodologies to assign a good faith fair value (the estimated price that, in an orderly transaction at the valuation date, would be received to sell an asset, or paid to transfer a liability, as the case may be) to each such financial instrument.
Valuations for fixed rate RMBS pass-throughs issued by a U.S government agency or government-sponsored enterprise, or "GSE," are typically based on observable pay-up data (pay-ups are price premiums for specified categories of fixed rate pools relative to their TBA counterparts) or models that use observable market data, such as interest rates and historical prepayment speeds, and are validated against third-party valuations. With respect to the Company's other RMBS investments and TBAs, management seeks to obtain at least one third-party valuation, and often obtains multiple valuations when available. Management has been able to obtain third-party valuations on the vast majority of these instruments and expects to continue to solicit third-party valuations in the future. Management generally values each financial instrument at the average of third-party valuations received and not rejected as described below. Third-party valuations are not binding, and while management generally does not adjust the valuations it receives, management may challenge or reject a valuation when, based on its validation criteria, management determines that such valuation is unreasonable or erroneous. Furthermore, based on its validation criteria, management may determine that the average of the third-party valuations received for a given instrument does not result in what management believes to be the fair value of such instrument, and in such circumstances management may override this average with its own good faith valuation. The validation criteria may take into account output from management's own models, recent trading activity in the same or similar instruments, and valuations received from third parties. The use of proprietary models requires the use of a significant amount of judgment and the application of various assumptions including, but not limited to, assumptions concerning future prepayment rates and default rates.
Given their relatively high level of price transparency, Agency RMBS pass-throughs and TBAs are typically designated as Level 2 assets, although Agency interest only and inverse interest only RMBS are currently designated as Level 3 assets since they generally have less price transparency. Non-Agency RMBS are generally classified as either Level 2 or Level 3 based on
analysis of available market data such as recent trades and executable bids, and reported "market color."bids. Furthermore, the methodology used by the third-party valuation providers is reviewed at least annually by management, so as to ascertain whether such providers are utilizing observable market data to determine the valuations that they provide.
Interest rate swaps and swaptions are typically valued based on internal models that use observable market data, including applicable interest rates in effect as of the measurement date; the model-generated valuations are then typically compared to counterparty valuations for reasonableness. These financial derivatives are generally designated as Level 2 instruments.
In valuing its derivatives, the Company also considers the creditworthiness of both the Company and its counterparties, along with collateral provisions contained in each derivative agreement.
The Company's repurchase and reverse repurchase agreements are carried at cost, which approximates fair value. Repurchase agreements and reverse repurchase agreements are classified as Level 2 assets and liabilities based on the adequacy of the collateral and their short term nature.
The Company's valuation process, including the application of validation criteria, is overseen by the Manager's Valuation Committee. The Valuation Committee includes senior level executives from various departments within the Manager, and each quarter the Valuation Committee reviews and approves the valuations of the Company's investments. The valuation process also includes a monthly review by the Company's third party administrator. The goal of this review is to replicate various aspects of the Company's valuation process based on the Company's documented procedures.
Because of the inherent uncertainty of valuation, the estimated fair value of the Company's financial instruments may differ significantly from the values that would have been used had a ready market for the financial instruments existed, and the differences could be material to the consolidated financial statements.
(C) Accounting for Mortgage-Backed Securities: Purchases and sales of investments are recorded on trade date and realized and unrealized gains and losses are calculated based on identified cost.
The Company has chosen to make a fair value election pursuant to ASC 825-10, Financial Instruments, for its mortgage-backed securities portfolio. Electing the fair value option allows the Company to record changes in fair value in the Consolidated Statement of Operations, which, in management's view, more appropriately reflects the results of operations for a particular reporting period as all securities activities will be recorded in a similar manner. As such, mortgage-backed securities are recorded at fair value on the Consolidated Balance Sheet and the period change in fair value is recorded in current period earnings on the Consolidated Statement of Operations as a component of Change in net unrealized gains (losses) on mortgage-backed securities.
(D) Interest Income: Coupon interest income on investment securities is accrued based on the outstanding principal balance or notional amount and the current coupon rate on each security. The Company amortizes purchase premiums and accretes purchase discounts on its fixed income securities. For RMBS that are deemed to be of high credit quality at the time of purchase, premiums and discounts are generally amortized/accreted into interest income over the life of such securities using the effective interest method. For securities whose cash flows vary depending on prepayments, an effective yield retroactive to the time of purchase is periodically recomputed based on actual prepayments and changes in projected prepayment activity, and a catch-up adjustment is made to amortization to reflect the cumulative impact of the change in effective yield. For RMBS that are deemed not to be of high credit quality at the time of purchase, interest income is recognized based on the effective interest method. For purposes of determining the effective interest rate, management estimates the future expected cash flows of its investment holdings based on assumptions including, but not limited to, assumptions for future prepayment rates, default rates, and loss severities (each of which may in turn incorporate various macro-economic assumptions, such as future housing prices). These assumptions are re-evaluated not less than quarterly. Principal write-offs are generally treated as realized losses. Changes in projected cash flows, as applied to the current amortized cost of the security, may result in a prospective change in the yield/interest income recognized on such securities.
The Company's accretion of discounts and amortization of premiums on securities for U.S. federal and other tax purposes is likely to differ from the accounting treatment under U.S. GAAP of these items as described above.
(E) Cash and Cash Equivalents: Cash and cash equivalents include cash and short term investments with original maturities of three months or less at the date of acquisition. Cash and cash equivalents typically include amounts held in an interest bearing overnight account and amounts held in money market funds, and these balances generally exceed insured limits. The Company holds its cash at institutions that it believes to be highly creditworthy.
(F) Due from brokers/Due to brokers: Due from brokers and Due to brokers accounts on the Consolidated Balance Sheet include collateral transferred to or received from counterparties, including clearinghouses, along with receivables and payables for open and/or closed derivative positions.
(G) Financial Derivatives: The Company may enterenters into various types of financial derivatives subject to its investment guidelines, which include restrictions associated with maintaining its qualification as a REIT. The Company's financial derivatives are predominantly subject to bilateral collateral arrangements or clearing in accordance with the Dodd-Frank Wall Street Reform and Consumer Protection Act of 2010. The Company may be required to deliver or may receive cash or securities as collateral upon entering into derivative transactions. In addition, changes in the relative value of financial derivative
transactions may require the Company or the counterparty to post or receive additional collateral. In the case of cleared financial derivatives, the clearinghouse becomes the Company's counterparty and a futures commission merchant acts as intermediary between the Company and the clearinghouse with respect to all facets of the related transaction, including the posting and receipt of required collateral. Collateral received by the Company is reflected on the Consolidated Balance Sheet as "Due to Brokers." Conversely, collateral posted by the Company is reflected as "Due from Brokers" on the Consolidated Balance Sheet. The types of financial derivatives that have been utilized by the Company to date are interest rate swaps, TBAs, swaptions, and futures.
Swaps: The Company has enteredenters into interest rate swaps. Interest rate swaps which are contractual agreements whereby one party pays a floating interest rate on a notional principal amount and receives a fixed rate payment on the same notional principal, or vice versa, for a fixed period of time. The Company enters into interest rate swap contracts primarily to mitigate interest rate risk. The Company is subject to interest rate risk exposure in the normal course of pursuing its investment objectives.
Swaps change in value with movements in interest rates or total return of the reference securities. During the term of swap contracts, changes in value are recognized as unrealized gains or losses on the Consolidated Statement of Operations. When a contract is terminated, the Company realizes a gain or loss equal to the difference between the proceeds from (or cost of) the closing transaction and the Company's basis in the contract, if any. Periodic payments or receipts required by swap agreements are recorded as unrealized gains or losses when accrued and realized gains or losses when received or paid. Upfront payments paid and/or received by the Company to open swap contracts are recorded as an asset and/or liability on the Consolidated Balance Sheet and are recorded as a realized gain or loss on the termination date.
TBA Securities: The Company has transactedtransacts in the forward settling TBA market. A TBA position is a forward contract for the purchase ("long position") or sale ("short position") of Agency RMBS at a predetermined price, face amount, issuer, coupon, and maturity on an agreed-upon future delivery date. For each TBA contract and delivery month, a uniform settlement date for all market participants is determined by the Securities Industry and Financial Markets Association. The specific Agency RMBS to be delivered into the contract at the settlement date are not known at the time of the transaction. The Company typically does not take delivery of TBAs, but rather enters into offsetting transactions and settles the associated receivable and payable balances with its counterparties. The Company primarily uses TBAs to mitigate interest rate risk, but from time to time it also holds net long positions in certain TBA securities as a means of acquiring exposure to Agency RMBS.
TBAs are accounted for by the Company as financial derivatives. The difference between the contract price and the fair value of the TBA position as of the reporting date is included in Change in net unrealized gains (losses) on financial derivatives in the Consolidated Statement of Operations. Upon settlement of the TBA contract, the realized gain (loss) on the TBA contract is equal to the net cash amount received (paid).
Options: The Company has enteredenters into swaption contracts. It may purchase or write put, call, straddle, or other similar options contracts. The Company enters into options contracts primarily to help mitigate interest rate risk. When the Company purchases an options contract, the option asset is initially recorded at an amount equal to the premium paid, if any, and is subsequently marked-to-market. Premiums paid for purchasing options contracts that expire unexercised are recognized on the expiration date as realized losses. If an options contract is exercised, the premium paid is subtracted from the proceeds of the sale or added to the cost of the purchase to determine whether the Company has realized a gain or loss on the related investment transaction. When the Company writes an options contract, the option liability is initially recorded at an amount equal to the premium received, if any, and is subsequently marked-to-market. Premiums received for writing options contracts that expire unexercised are recognized on the expiration date as realized gains. If an options contract is exercised, the premium received is subtracted from the cost of the purchase or added to the proceeds of the sale to determine whether the Company has realized a gain or loss on the related investment transaction. When the Company enters into a closing transaction, the Company will realize a gain or loss depending upon whether the amount from the closing transaction is greater or less than the premiums paid or received. In general, the Company's options contracts contain forward-settling premiums. In this case, no money is exchanged upfront; instead, the agreed-upon premium is paid by the buyer upon expiration of the options contract, regardless of whether or not the options contract is exercised.
Futures Contracts: The Company enters into Eurodollar futures contracts. A futures contract is an exchange-traded agreement to buy or sell an asset for a set price on a future date. Initial margin deposits are made upon entering into futures contracts and can be either in the form of cash or securities. During the period the futures contract is open, changes in the value of the contract are recognized as unrealized gains or losses by marking-to-market to reflect the current market value of the
contract. Variation margin payments are made or received periodically, depending upon whether unrealized losses or gains are incurred. When the contract is closed, the Company records a realized gain or loss equal to the difference between the proceeds of the closing transaction and the Company's basis in the contract.
Financial derivative assets are included in Financial derivatives–assets, at fair value on the Consolidated Balance Sheet while financial derivative liabilities are included in Financial derivatives–liabilities, at fair value on the Consolidated Balance Sheet.
(H) Repurchase Agreements and Reverse Repurchase Agreements: The Company enters into repurchase agreements with third-party broker-dealers, whereby it sells securities under agreements to repurchase at an agreed upon price and date. The Company also enters into reverse repurchase agreement transactions with third-party broker-dealers, whereby it purchases securities under agreements to resell at an agreed upon price and date. The Company accounts for repurchase agreements as collateralized borrowings, with the initial sale price representing the amount borrowed, and with the future repurchase price consisting of the amount borrowed plus interest, at the implied interest rate of the repurchase agreement, on the amount borrowed over the term of the repurchase agreement. The interest rate on a repurchase agreement or a reverse repurchase agreement is based on competitive market rates (or competitive market spreads, in the case of agreements with floating interest rates) at the time such agreement is entered into. When the Company enters into a repurchase agreement, the lender establishes and maintains an account containing cash and/or securities having a value not less than the repurchase price, including accrued interest, of the repurchase agreement. Repurchase agreements are carried at their contractual amounts, which approximate fair value due to their short-term nature.
(I) Reverse Repurchase Agreements: The Company enters into reverse repurchase agreement transactions with third-party broker-dealers, whereby it purchases securities under agreements to resell at an agreed upon price and date. The interest rate on a reverse repurchase agreement is based on competitive market rates (or competitive market spreads, in the case of agreements with floating interest rates) at the time such agreement is entered into. Reverse repurchase agreements are carried at their contractual amounts, which approximate fair value due to their short-term nature. Repurchase and reverse repurchase agreements that are conducted with the same counterparty can be reported on a net basis if they meet the requirements under the authoritative guidance. Repurchase agreementsof ASC 210-20, Balance Sheet Offsetting. There are no repurchase and reverse repurchase agreements are carried at their contractual amounts, which approximate fair value.reported on a net basis in the Company's consolidated financial statements.
(I) U.S. Treasury Securities:(J) Securities Sold Short: The Company may purchase or sellengage in short sales of U.S. Treasury securities to help mitigate the potential impact of changes in interest rates on the performance of its portfolio. When the Company sells securities short, it typically satisfies its security delivery settlement obligation by obtaining the security sold short from the same or a different counterparty. The Company may borrow securities under reverse repurchase agreements to enable itgenerally is required to deliver U.S. Treasurycash or securities that it has sold short.as collateral to the counterparty for the Company's obligation to return the borrowed security.
(J)The Company has chosen to make a fair value election pursuant to ASC 825-10, Financial Instruments, for its securities sold short. Electing the fair value option allows the Company to record changes in fair value in the Consolidated Statement of Operations, which, in management's view, more appropriately reflects the results of operations for a particular reporting period as all securities activities will be recorded in a similar manner. As such, securities sold short are recorded at fair value on the Consolidated Balance Sheet and the period change in fair value is recorded in current period earnings on the Consolidated Statement of Operations as a component of Change in net unrealized gains (losses) on securities. A realized gain or loss will be recognized upon the termination of a short sale if the market price is less or greater than the proceeds originally received. Such realized gain or loss is recorded on the Company's Consolidated Statement of Operations in Net realized gains (losses) on securities.
(K) Offering Costs/Deferred Offering Costs: Offering costs are charged against shareholders' equity within Additional paid-in-capital, and typically include legal, accounting, printing, and other fees associated with the cost of raising equity capital.
(K)(L) Share Based Compensation: The Company applies the provisions of ASC 718, Compensation—Stock Compensation ("ASC 718"), with regard to its equity incentive plans. ASC 718 covers a wide range of share-based compensation arrangements including share options, restricted share plans, performance-based awards, share appreciation rights, and employee share purchase plans. ASC 718 requires that compensation cost relating to share-based payment transactions be recognized in financial statements. The cost is measured based on the fair value, at the grant date, of the equity or liability instruments issued.issued and is amortized over the vesting period. Restricted shares issued to the Company's independent directors and partially dedicated personnel are participating securities and receive dividends prior to vesting. Fair value for such awards is based on the closing stock price on the New York Stock Exchange at the grant date. The vesting period for restricted share awards is typically one to two years.
(L)(M) Dividends: Dividends payable are recorded on the declaration date.
(M)(N) Expenses: Expenses are recognized as incurred on the Consolidated Statement of Operations.
(N)(O) Earnings Per Share: In accordance with the provisions of ASC 260, Earnings per Share, the Company calculates basic income (loss) per share by dividing net income (loss) for the period by the weighted average of the Company's common shares outstanding for that period. Diluted income (loss) per share takes into account the effect of dilutive instruments, such as share options and warrants, and uses the average share price for the period in determining the number of incremental shares that are to be added to the weighted average number of shares outstanding.
(O)(P) Share Repurchases: Common shares that are repurchased by the Company subsequent to issuance decrease the total number of shares issued and outstanding.outstanding and are immediately retired upon settlement. The cost of such share repurchases is charged against Additional paid-in-capital on the Company's Consolidated Balance Sheet.
(P)(Q) Income Taxes: The Company has elected to be taxed as a REIT under Sections 856 to 860 of the Code. As a REIT, the Company is generally not subject to corporate-level federal and state income tax on net income it distributes to its stockholders.shareholders. To qualify as a REIT, the Company must meet a number of organizational and operational requirements, including the distribution of at least 90% of its annual taxable income to shareholders. Even if the Company qualifies as a REIT, it may be subject to certain federal, state, local and foreign taxes on its income and property and to federal income and excise taxes on its undistributed taxable income. If the Company fails to qualify as a REIT, and does not qualify for certain statutory relief provisions, it will be subject to U.S. federal, state, and local income taxes and may be precluded from qualifying as a REIT for the four taxable years following the year in which the Company fails to qualify as a REIT.
The Company follows the authoritative guidance on accounting for and disclosure of uncertainty on tax positions, which requires management to determine whether a tax position of the companyCompany is more likely than not to be sustained upon examination by the applicable taxing authority, including resolution of any related appeals of the litigation process, based on the technical merits of the position. For uncertain tax positions, the tax benefit to be recognized is measured as the largest amount of benefit that is greater than fifty percent50% likely of being realized upon ultimate settlement. The Company did not have any unrecognized tax benefits at September 30, 2015.resulting from tax positions related to the current period or to 2015, 2014, 2013, or 2012 (its open tax years. In the normal course of business, the Company may be subject to examination by federal, state, local, and foreign jurisdictions, where applicable, for the current period, 2015, 2014, 2013, and 2012 (its open tax years). The Company may take positions with respect to certain tax issues which depend on legal interpretation of facts or applicable tax regulations. Should the relevant tax regulators successfully challenge any of such positions, the Company might be found to have a tax liability that has not been recorded in the accompanying consolidated financial statements. Also,
management's conclusions regarding the authoritative guidance may be subject to review and adjustment at a later date based on changing tax laws, regulations, and interpretations thereof. There were no amounts accrued for penalties or interest as of or during the periods presented in these consolidated financial statements.
(Q)(R) Recent Accounting Pronouncements: Under the Jumpstart Our Business Startups Act, or the "JOBS Act," the Company meets the definition of an "emerging growth company." The Company has elected to follow the extended transition period for complying with new or revised U.S. accounting standards pursuant to Section 107(b) of the JOBS Act. As a result, the Company will comply with new or revised accounting standards on the relevant dates on which adoption of such standards is required for non-public entities.
In June 2014, the FASB issued ASU No. 2014-11, Repurchase-to-Maturity Transactions, Repurchase Financings, and Disclosures ("ASU 2014-11"). This amends ASC 860, Transfers and Servicing ("ASC 860"), to require disclosure of repurchase-to-maturity transactions to be accounted for as secured borrowings rather than sales of an asset, and transfers of financial assets with a contemporaneous repurchase agreement will no longer be evaluated to determine whether they should be accounted for on a combined basis as forward contracts. The new guidance also prescribes additional disclosures particularly on the nature of collateral pledged under repurchase agreements accounted for as secured borrowings. ASU 2014-11 is effective for annual periods beginning after December 15, 2014 and interim periods beginning after December 31, 2015. The adoption of ASC 860, as amended by ASU 2014-11 isdid not expected to have a material impact on the Company's consolidated financial statements.
In August 2014, the FASB issued ASU 2014-15, Disclosure of Uncertainties about an Entity's Ability to Continue as a Going Concern ("ASU 2014-15"). ASU 2014-15 requires management to perform interim and annual assessments of an entity's ability to continue as a going concern and to provide disclosure if events or conditions arise that would place substantial doubt on the entity's ability to continue as a going concern. ASU 2014-15 is effective for the annual period ending after December 15, 2016, and subsequent interim and annual periods with early adoption permitted. The adoption of ASU 2014-15 is not expected to have a material impact on the Company's consolidated financial statements.
In February 2015, the FASB issued ASU 2015-02, Amendments to the Consolidation Analysis ("ASU 2015-02"). This amends ASC 810, Consolidation (ASC "810"), to improve targeted areas of consolidation guidance by simplifying the requirements of consolidation and placing more emphasis on risk of loss when determining a controlling financial interest. ASU 2015-02 is effective for annual periods beginning after December 15, 2016 and interim periods beginning after December 15,
2017 with early adoption permitted. The adoption of ASU 2015-02 is not expected to have a material impact on the Company's consolidated financial statements.
3. Mortgage-Backed Securities
The following tables present details of the Company's mortgage-backed securities portfolio at September 30, 2015March 31, 2016 and December 31, 2014,2015, respectively. The Company's Agency RMBS include mortgage pass-through certificates and CMOs representing interests in or obligations backed by pools of residential mortgage loans issued or guaranteed by a U.S. government agency or GSE. The non-Agency RMBS portfolio is not issued or guaranteed by the Federal National Mortgage Association, the Federal Home Loan Mortgage Corporation, or any agency of the U.S. Government and is therefore subject to greater credit risk.
By RMBS Type –
September 30, 2015March 31, 2016:
| | | ($ in thousands) | | | | | | | Gross Unrealized | | | | Weighted Average | | | | | | | Gross Unrealized | | | | Weighted Average |
| | Current Principal | | Unamortized Premium (Discount) | | Amortized Cost | | Gains | | Losses | | Fair Value | | Coupon | | Yield | | Weighted Average Life(Years)(1) | Current Principal | | Unamortized Premium (Discount) | | Amortized Cost | | Gains | | Losses | | Fair Value | | Coupon | | Yield | | Life
(Years)(1) |
| Agency RMBS: | | | | | | | | | | | | | | | | | | | | | | | | | | | | | | | | | | |
| 15-year fixed rate mortgages | $ | 162,453 |
| | $ | 7,874 |
| | $ | 170,327 |
| | $ | 1,585 |
| | $ | (88 | ) | | $ | 171,824 |
| | 3.37% | | 2.28% | | 5.04 | $ | 143,705 |
| | $ | 7,240 |
| | $ | 150,945 |
| | $ | 1,632 |
| | $ | (41 | ) | | $ | 152,536 |
| | 3.43% | | 2.26% | | 4.57 |
| 20-year fixed rate mortgages | 9,094 |
| | 508 |
| | 9,602 |
| | 235 |
| | — |
| | 9,837 |
| | 4.00% | | 2.89% | | 5.97 | 17,991 |
| | 1,235 |
| | 19,226 |
| | 262 |
| | — |
| | 19,488 |
| | 4.00% | | 2.73% | | 5.75 |
| 30-year fixed rate mortgages | 894,774 |
| | 55,922 |
| | 950,696 |
| | 15,628 |
| | (1,933 | ) | | 964,391 |
| | 4.08% | | 3.15% | | 7.94 | 788,135 |
| | 52,863 |
| | 840,998 |
| | 12,218 |
| | (890 | ) | | 852,326 |
| | 4.11% | | 3.04% | | 7.48 |
| Adjustable rate mortgages | 36,782 |
| | 2,415 |
| | 39,197 |
| | 96 |
| | (163 | ) | | 39,130 |
| | 4.12% | | 2.96% | | 5.64 | 35,122 |
| | 2,110 |
| | 37,232 |
| | 108 |
| | (207 | ) | | 37,133 |
| | 4.05% | | 2.70% | | 4.98 |
| Reverse mortgages | 53,986 |
| | 5,697 |
| | 59,683 |
| | 276 |
| | (418 | ) | | 59,541 |
| | 4.75% | | 2.57% | | 6.11 | 70,867 |
| | 6,312 |
| | 77,179 |
| | 597 |
| | (228 | ) | | 77,548 |
| | 4.56% | | 2.45% | | 5.48 |
| Interest only securities | n/a | | n/a | | 8,229 |
| | 167 |
| | (1,122 | ) | | 7,274 |
| | 3.84% | | 4.81% | | 2.12 | n/a | | n/a | | 8,660 |
| | 50 |
| | (1,779 | ) | | 6,931 |
| | 3.88% | | 4.89% | | 1.91 |
| Total Agency RMBS | 1,157,089 |
| | 72,416 |
| | 1,237,734 |
| | 17,987 |
| | (3,724 | ) | | 1,251,997 |
| | 4.00% | | 3.01% | | 7.00 | 1,055,820 |
| | 69,760 |
| | 1,134,240 |
| | 14,867 |
| | (3,145 | ) | | 1,145,962 |
| | 4.03% | | 2.89% | | 6.45 |
| Non-Agency RMBS | 42,978 |
| | (15,187 | ) | | 27,791 |
| | 2,043 |
| | (939 | ) | | 28,895 |
| | 2.62% | | 8.43% | | 5.11 | 42,649 |
| | (16,474 | ) | | 26,175 |
| | 2,358 |
| | (902 | ) | | 27,631 |
| | 2.62% | | 8.47% | | 4.55 |
| Total RMBS | $ | 1,200,067 |
| | $ | 57,229 |
| | $ | 1,265,525 |
| | $ | 20,030 |
| | $ | (4,663 | ) | | $ | 1,280,892 |
| | 3.95% | | 3.13% | | 6.93 | $ | 1,098,469 |
| | $ | 53,286 |
| | $ | 1,160,415 |
| | $ | 17,225 |
| | $ | (4,047 | ) | | $ | 1,173,593 |
| | 3.98% | | 3.02% | | 6.38 |
| |
(1) | Average lives of RMBS are generally shorter than stated contractual maturities. Average lives are affected by the contractual maturities of the underlying mortgages, scheduled periodic payments of principal, and unscheduled prepayments of principal. |
For the ninethree month period ended September 30, 2015,March 31, 2016, the weighted average holdings of RMBS investments based on amortized cost was $1.3281.225 billion.
December 31, 20142015:
| | | ($ in thousands) | | | | | | | Gross Unrealized | | | | Weighted Average | | | | | | | Gross Unrealized | | | | Weighted Average |
| | Current Principal | | Unamortized Premium (Discount) | | Amortized Cost | | Gains | | Losses | | Fair Value | | Coupon | | Yield | | Weighted Average Life(Years)(1) | Current Principal | | Unamortized Premium (Discount) | | Amortized Cost | | Gains | | Losses | | Fair Value | | Coupon | | Yield | | Life (Years)(1) |
| Agency RMBS: | | | | | | | | | | | | | | | | | | | | | | | | | | | | | | | | | | |
| 15-year fixed rate mortgages | $ | 130,720 |
| | $ | 6,304 |
| | $ | 137,024 |
| | $ | 1,113 |
| | $ | (109 | ) | | $ | 138,028 |
| | 3.40% | | 2.46% | | 5.43 | $ | 162,546 |
| | $ | 7,839 |
| | $ | 170,385 |
| | $ | 531 |
| | $ | (655 | ) | | $ | 170,261 |
| | 3.38% | | 2.31% | | 4.99 |
| 20-year fixed rate mortgages | 9,764 |
| | 577 |
| | 10,341 |
| | 227 |
| | — |
| | 10,568 |
| | 4.00% | | 3.04% | | 6.92 | 18,477 |
| | 1,277 |
| | 19,754 |
| | 153 |
| | (77 | ) | | 19,830 |
| | 4.00% | | 2.75% | | 6.50 |
| 30-year fixed rate mortgages | 1,042,550 |
| | 61,089 |
| | 1,103,639 |
| | 20,379 |
| | (1,764 | ) | | 1,122,254 |
| | 4.09% | | 3.29% | | 8.48 | 842,524 |
| | 53,832 |
| | 896,356 |
| | 8,117 |
| | (3,679 | ) | | 900,794 |
| | 4.12% | | 3.11% | | 8.29 |
| Adjustable rate mortgages | 41,710 |
| | 2,813 |
| | 44,523 |
| | 90 |
| | (330 | ) | | 44,283 |
| | 4.60% | | 3.08% | | 5.97 | 36,433 |
| | 2,196 |
| | 38,629 |
| | 81 |
| | (180 | ) | | 38,530 |
| | 4.05% | | 2.68% | | 5.44 |
| Reverse mortgages | 31,412 |
| | 2,741 |
| | 34,153 |
| | 300 |
| | (28 | ) | | 34,425 |
| | 4.91% | | 2.56% | | 4.74 | 68,690 |
| | 6,515 |
| | 75,205 |
| | 34 |
| | (1,547 | ) | | 73,692 |
| | 4.63% | | 2.54% | | 5.64 |
| Interest only securities | n/a | | n/a | | 10,780 |
| | 1,190 |
| | (726 | ) | | 11,244 |
| | 4.04% | | 11.82% | | 2.68 | n/a | | n/a | | 8,491 |
| | 248 |
| | (981 | ) | | 7,758 |
| | 3.82% | | 3.30% | | 2.36 |
| Total Agency RMBS | 1,256,156 |
| | 73,524 |
| | 1,340,460 |
| | 23,299 |
| | (2,957 | ) | | 1,360,802 |
| | 4.05% | | 3.24% | | 7.54 | 1,128,670 |
| | 71,659 |
| | 1,208,820 |
| | 9,164 |
| | (7,119 | ) | | 1,210,865 |
| | 4.03% | | 2.94% | | 7.16 |
| Non-Agency RMBS | 50,668 |
| | (20,377 | ) | | 30,291 |
| | 2,896 |
| | (686 | ) | | 32,501 |
| | 2.29% | | 10.76% | | 4.97 | 48,408 |
| | (18,013 | ) | | 30,395 |
| | 2,264 |
| | (1,258 | ) | | 31,401 |
| | 2.48% | | 20.97% | | 4.81 |
| Total RMBS | $ | 1,306,824 |
| | $ | 53,147 |
| | $ | 1,370,751 |
| | $ | 26,195 |
| | $ | (3,643 | ) | | $ | 1,393,303 |
| | 3.99% | | 3.41% | | 7.45 | $ | 1,177,078 |
| | $ | 53,646 |
| | $ | 1,239,215 |
| | $ | 11,428 |
| | $ | (8,377 | ) | | $ | 1,242,266 |
| | 3.97% | | 3.39% | | 7.07 |
| |
| (1) | Average lives of RMBS are generally shorter than stated contractual maturities. Average lives are affected by the contractual maturities of the underlying mortgages, scheduled periodic payments of principal, and unscheduled prepayments of principal. |
For the year ended December 31, 2014,2015, the weighted average holdings of RMBS investments based on amortized cost was $1.363$1.323 billion.
By Estimated Weighted Average Life
As of September 30, 2015:March 31, 2016:
| | | ($ in thousands) | | Agency RMBS | | Agency Interest Only Securities | | Non-Agency RMBS | | Agency RMBS | | Agency Interest Only Securities | | Non-Agency RMBS |
Estimated Weighted Average Life | | Fair Value | | Amortized Cost | | Weighted Average Coupon | | Fair Value | | Amortized Cost | | Weighted Average Coupon | | Fair Value | | Amortized Cost | | Weighted Average Coupon | | Fair Value | | Amortized Cost | | Weighted Average Coupon | | Fair Value | | Amortized Cost | | Weighted Average Coupon | | Fair Value | | Amortized Cost | | Weighted Average Coupon |
| Less than three years | | $ | 25,126 |
| | $ | 25,141 |
| | 5.08 | % | | $ | 5,401 |
| | $ | 6,331 |
| | 3.67 | % | | $ | 2,362 |
| | $ | 1,363 |
| | 3.07 | % | | $ | 56,198 |
| | $ | 55,792 |
| | 4.72 | % | | $ | 4,859 |
| | $ | 6,335 |
| | 3.67 | % | | $ | 2,395 |
| | $ | 1,371 |
| | 3.23 | % |
| Greater than three years and less than seven years | | 330,143 |
| | 326,873 |
| | 3.93 | % | | 1,873 |
| | 1,898 |
| | 4.96 | % | | 19,440 |
| | 19,935 |
| | 3.25 | % | | 426,760 |
| | 420,717 |
| | 4.05 | % | | 2,072 |
| | 2,325 |
| | 5.06 | % | | 23,144 |
| | 23,498 |
| | 2.70 | % |
| Greater than seven years and less than eleven years | | 877,994 |
| | 866,086 |
| | 4.02 | % | | — |
| | — |
| | — | % | | 7,093 |
| | 6,493 |
| | 0.93 | % | | 654,427 |
| | 647,435 |
| | 3.98 | % | | — |
| | — |
| | — | % | | 2,092 |
| | 1,306 |
| | 0.59 | % |
| Greater than eleven years | | 11,460 |
| | 11,405 |
| | 3.67 | % | | — |
| | — |
| | — | % | | — |
| | — |
| | — | % | | 1,646 |
| | 1,636 |
| | 4.00 | % | | — |
| | — |
| | — | % | | — |
| | — |
| | — | % |
| Total | | $ | 1,244,723 |
| | $ | 1,229,505 |
| | 4.01 | % | | $ | 7,274 |
| | $ | 8,229 |
| | 3.84 | % | | $ | 28,895 |
| | $ | 27,791 |
| | 2.62 | % | | $ | 1,139,031 |
| | $ | 1,125,580 |
| | 4.04 | % | | $ | 6,931 |
| | $ | 8,660 |
| | 3.88 | % | | $ | 27,631 |
| | $ | 26,175 |
| | 2.62 | % |
| |
| (1) | Average lives of RMBS are generally shorter than stated contractual maturities. |
As of December 31, 2014:2015:
| | | ($ in thousands) | | Agency RMBS | | Agency Interest Only Securities | | Non-Agency RMBS | | Agency RMBS | | Agency Interest Only Securities | | Non-Agency RMBS |
Estimated Weighted Average Life | | Fair Value | | Amortized Cost | | Weighted Average Coupon | | Fair Value | | Amortized Cost | | Weighted Average Coupon | | Fair Value | | Amortized Cost | | Weighted Average Coupon | | Fair Value | | Amortized Cost | | Weighted Average Coupon | | Fair Value | | Amortized Cost | | Weighted Average Coupon | | Fair Value | | Amortized Cost | | Weighted Average Coupon |
| Less than three years | | $ | 18,428 |
| | $ | 18,418 |
| | 5.13 | % | | $ | 5,197 |
| | $ | 5,563 |
| | 3.42 | % | | $ | 2,837 |
| | $ | 1,785 |
| | 3.02 | % | | $ | 30,054 |
| | $ | 30,227 |
| | 4.76 | % | | $ | 4,974 |
| | $ | 5,701 |
| | 3.55 | % | | $ | 2,558 |
| | $ | 1,543 |
| | 3.21 | % |
| Greater than three years and less than seven years | | 410,759 |
| | 405,739 |
| | 4.12 | % | | 6,047 |
| | 5,217 |
| | 5.19 | % | | 17,660 |
| | 17,662 |
| | 2.63 | % | | 273,477 |
| | 273,107 |
| | 3.78 | % | | 2,784 |
| | 2,790 |
| | 4.97 | % | | 24,736 |
| | 25,478 |
| | 2.66 | % |
| Greater than seven years and less than eleven years | | 920,371 |
| | 905,523 |
| | 4.00 | % | | — |
| | — |
| | — | % | | 12,004 |
| | 10,844 |
| | 1.28 | % | | 893,730 |
| | 891,112 |
| | 4.10 | % | | — |
| | — |
| | — | % | | 4,107 |
| | 3,374 |
| | 0.55 | % |
| Greater than eleven years | | | 5,846 |
| | 5,883 |
| | 3.81 | % | | — |
| | — |
| | — | % | | — |
| | — |
| | — | % |
| Total | | $ | 1,349,558 |
| | $ | 1,329,680 |
| | 4.05 | % | | $ | 11,244 |
| | $ | 10,780 |
| | 4.04 | % | | $ | 32,501 |
| | $ | 30,291 |
| | 2.29 | % | | $ | 1,203,107 |
| | $ | 1,200,329 |
| | 4.04 | % | | $ | 7,758 |
| | $ | 8,491 |
| | 3.82 | % | | $ | 31,401 |
| | $ | 30,395 |
| | 2.48 | % |
| |
| (1) | Average lives of RMBS are generally shorter than stated contractual maturities. |
The following table reflects the components of interest income on the Company's RMBS for the three and nine month periods ended September 30,March 31, 2016 and 2015:
| | | | | Three Month Period Ended September 30, 2015 | | Nine Month Period Ended
September 30, 2015 | | Three Month Period Ended March 31, 2016 | | Three Month Period Ended
March 31, 2015 |
| ($ in thousands) | | Coupon Interest | | Net Amortization | | Interest Income | | Coupon Interest | | Net Amortization | | Interest Income | | Coupon Interest | | Net Amortization | | Interest Income | | Coupon Interest | | Net Amortization | | Interest Income |
| Agency RMBS | | $ | 12,392 |
| | $ | (1,744 | ) | | $ | 10,648 |
| | $ | 37,071 |
| | $ | (7,795 | ) | | $ | 29,276 |
| | $ | 11,144 |
| | $ | (2,194 | ) | | $ | 8,950 |
| | $ | 12,491 |
| | $ | (2,959 | ) | | $ | 9,532 |
|
| Non-Agency RMBS | | 294 |
| | 373 |
| | 667 |
| | 873 |
| | 1,256 |
| | 2,129 |
| | 276 |
| | 343 |
| | 619 |
| | 283 |
| | 456 |
| | 739 |
|
| Total | | $ | 12,686 |
| | $ | (1,371 | ) | | $ | 11,315 |
| | $ | 37,944 |
| | $ | (6,539 | ) | | $ | 31,405 |
| | $ | 11,420 |
| | $ | (1,851 | ) | | $ | 9,569 |
| | $ | 12,774 |
| | $ | (2,503 | ) | | $ | 10,271 |
|
The following table reflects the components of interest income on the Company's RMBS for the three and nine month periods ended September 30, 2014:
|
| | | | | | | | | | | | | | | | | | | | | | | | |
| | | Three Month Period Ended
September 30, 2014 | | Nine Month Period Ended
September 30, 2014 |
| ($ in thousands) | | Coupon Interest | | Net Amortization | | Interest Income | | Coupon Interest | | Net Amortization | | Interest Income |
| Agency RMBS | | $ | 13,254 |
| | $ | (2,575 | ) | | $ | 10,679 |
| | $ | 39,323 |
| | $ | (6,618 | ) | | $ | 32,705 |
|
| Non-Agency RMBS | | 303 |
| | 502 |
| | 805 |
| | 947 |
| | 1,359 |
| | 2,306 |
|
| Total | | $ | 13,557 |
| | $ | (2,073 | ) | | $ | 11,484 |
| | $ | 40,270 |
| | $ | (5,259 | ) | | $ | 35,011 |
|
4. Valuation
The following tables present the Company's financial instruments measured at fair value on:
September 30, 2015March 31, 2016:
| | | (In thousands) | | | | | | | | | | | | | | | | |
| Description | | Level 1 | | Level 2 | | Level 3 | | Total | | Level 1 | | Level 2 | | Level 3 | | Total |
| Assets: | | | | | | | | | | | | | | | | |
| Cash equivalents | | $ | 20,000 |
| | $ | — |
| | $ | — |
| | $ | 20,000 |
| |
| Mortgage-backed securities, at fair value: | | | | | | | | | | | | | | | | |
| Agency RMBS: | | | | | | | | | | | | | | | | |
| 15-year fixed rate mortgages | | $ | — |
| | $ | 171,824 |
| | $ | — |
| | $ | 171,824 |
| | $ | — |
| | $ | 152,536 |
| | $ | — |
| | $ | 152,536 |
|
| 20-year fixed rate mortgages | | — |
| | 9,837 |
| | — |
| | 9,837 |
| | — |
| | 19,488 |
| | — |
| | 19,488 |
|
| 30-year fixed rate mortgages | | — |
| | 964,391 |
| | — |
| | 964,391 |
| | — |
| | 852,326 |
| | — |
| | 852,326 |
|
| Adjustable rate mortgages | | — |
| | 39,130 |
| | — |
| | 39,130 |
| | — |
| | 37,133 |
| | — |
| | 37,133 |
|
| Reverse mortgages | | — |
| | 59,541 |
| | — |
| | 59,541 |
| | — |
| | 77,548 |
| | — |
| | 77,548 |
|
| Interest only securities | | — |
| | — |
| | 7,274 |
| | 7,274 |
| | — |
| | — |
| | 6,931 |
| | 6,931 |
|
| Non-Agency RMBS | | — |
| | 22,775 |
| | 6,120 |
| | 28,895 |
| | — |
| | 25,487 |
| | 2,144 |
| | 27,631 |
|
| Mortgage-backed securities, at fair value | | — |
| | 1,267,498 |
| | 13,394 |
| | 1,280,892 |
| | — |
| | 1,164,518 |
| | 9,075 |
| | 1,173,593 |
|
| Financial derivatives–assets, at fair value: | | | | | | | | | | | | | | | | |
| TBAs | | — |
| | 575 |
| | — |
| | 575 |
| | — |
| | 365 |
| | — |
| | 365 |
|
| Interest rate swaps | | — |
| | 952 |
| | — |
| | 952 |
| | — |
| | 1,269 |
| | — |
| | 1,269 |
|
| Futures | | | 1 |
| | — |
| | — |
| | 1 |
|
| Total financial derivatives–assets, at fair value | | — |
| | 1,527 |
| | — |
| | 1,527 |
| | 1 |
| | 1,634 |
| | — |
| | 1,635 |
|
| Total mortgage-backed securities and financial derivatives–assets, at fair value | | $ | — |
| | $ | 1,269,025 |
| | $ | 13,394 |
| | $ | 1,282,419 |
| | $ | 1 |
| | $ | 1,166,152 |
| | $ | 9,075 |
| | $ | 1,175,228 |
|
| Liabilities: | | | | | | | | | | | | | | | | |
| U.S. Treasury securities sold short, at fair value | | $ | — |
| | $ | (70,671 | ) | | $ | — |
| | $ | (70,671 | ) | | $ | — |
| | $ | (69,607 | ) | | $ | — |
| | $ | (69,607 | ) |
| Financial derivatives–liabilities, at fair value: | | | | | | | | | | | | | | | | |
| TBAs | | — |
| | (1,159 | ) | | — |
| | (1,159 | ) | | — |
| | (1,157 | ) | | — |
| | (1,157 | ) |
| Interest rate swaps | | — |
| | (15,255 | ) | | — |
| | (15,255 | ) | | — |
| | (17,122 | ) | | — |
| | (17,122 | ) |
| Futures | | | (5 | ) | | — |
| | — |
| | (5 | ) |
| Total financial derivatives–liabilities, at fair value | | — |
| | (16,414 | ) | | — |
| | (16,414 | ) | | (5 | ) | | (18,279 | ) | | — |
| | (18,284 | ) |
| Total U.S. Treasury securities sold short and financial derivatives–liabilities, at fair value | | $ | — |
| | $ | (87,085 | ) | | $ | — |
| | $ | (87,085 | ) | | $ | (5 | ) | | $ | (87,886 | ) | | $ | — |
| | $ | (87,891 | ) |
There were no transfers of financial instruments between Levels 1 and 2 of the fair value hierarchy during the ninethree month period ended September 30, 2015.March 31, 2016.
December 31, 2014:2015:
|
| | | | | | | | | | | | | | | | |
| (In thousands) | | | | | | | | |
| Description | | Level 1 | | Level 2 | | Level 3 | | Total |
Assets(1): | | | | | | | | |
| Cash equivalents | | $ | 35,000 |
| | $ | — |
| | $ | — |
| | $ | 35,000 |
|
| Mortgage-backed securities, at fair value: | | | | | | | | |
| Agency RMBS: | | | | | | | | |
| 15-year fixed rate mortgages | | $ | — |
| | $ | 138,028 |
| | $ | — |
| | $ | 138,028 |
|
| 20-year fixed rate mortgages | | — |
| | 10,568 |
| | — |
| | 10,568 |
|
| 30-year fixed rate mortgages | | — |
| | 1,122,254 |
| | — |
| | 1,122,254 |
|
| Adjustable rate mortgages | | — |
| | 44,283 |
| | — |
| | 44,283 |
|
| Reverse mortgages | | — |
| | 34,425 |
| | — |
| | 34,425 |
|
| Interest only securities | | — |
| | — |
| | 11,244 |
| | 11,244 |
|
| Non-Agency RMBS | | — |
| | 22,419 |
| | 10,082 |
| | 32,501 |
|
| Mortgage-backed securities, at fair value | | — |
| | 1,371,977 |
| | 21,326 |
| | 1,393,303 |
|
| Financial derivatives–assets, at fair value: | | | | | | | | |
| TBAs | | — |
| | 476 |
| | — |
| | 476 |
|
| Interest rate swaps | | — |
| | 2,518 |
| | — |
| | 2,518 |
|
| Fixed payer swaptions | | — |
| | 78 |
| | — |
| | 78 |
|
| Total financial derivatives–assets, at fair value | | — |
| | 3,072 |
| | — |
| | 3,072 |
|
| Total mortgage-backed securities and financial derivatives–assets, at fair value | | $ | — |
| | $ | 1,375,049 |
| | $ | 21,326 |
| | $ | 1,396,375 |
|
| Liabilities: | | | | | | | | |
| U.S. Treasury securities sold short, at fair value | | $ | — |
| | $ | (13,959 | ) | | $ | — |
| | $ | (13,959 | ) |
| Financial derivatives–liabilities, at fair value: | | | | | | | | |
| TBAs | | — |
| | (1,674 | ) | | — |
| | (1,674 | ) |
| Interest rate swaps | | — |
| | (7,026 | ) | | — |
| | (7,026 | ) |
| Total financial derivatives–liabilities, at fair value | | — |
| | (8,700 | ) | | — |
| | (8,700 | ) |
| Total U.S. Treasury securities sold short and financial derivatives–liabilities, at fair value | | $ | — |
| | $ | (22,659 | ) | | $ | — |
| | $ | (22,659 | ) |
(1) Conformed to current period presentation. |
| | | | | | | | | | | | | | | | |
| (In thousands) | | | | | | | | |
| Description | | Level 1 | | Level 2 | | Level 3 | | Total |
| Assets: | | | | | | | | |
| Mortgage-backed securities, at fair value: | | | | | | | | |
| Agency RMBS: | | | | | | | | |
| 15-year fixed rate mortgages | | $ | — |
| | $ | 170,261 |
| | $ | — |
| | $ | 170,261 |
|
| 20-year fixed rate mortgages | | — |
| | 19,830 |
| | — |
| | 19,830 |
|
| 30-year fixed rate mortgages | | — |
| | 900,794 |
| | — |
| | 900,794 |
|
| Adjustable rate mortgages | | — |
| | 38,530 |
| | — |
| | 38,530 |
|
| Reverse mortgages | | — |
| | 73,692 |
| | — |
| | 73,692 |
|
| Interest only securities | | — |
| | — |
| | 7,758 |
| | 7,758 |
|
| Non-Agency RMBS | | — |
| | 27,381 |
| | 4,020 |
| | 31,401 |
|
| Mortgage-backed securities, at fair value | | — |
| | 1,230,488 |
| | 11,778 |
| | 1,242,266 |
|
| Financial derivatives–assets, at fair value: | | | | | | | | |
| TBAs | | — |
| | 417 |
| | — |
| | 417 |
|
| Interest rate swaps | | — |
| | 1,748 |
| | — |
| | 1,748 |
|
| Futures | | 18 |
| | — |
| | — |
| | 18 |
|
| Total financial derivatives–assets, at fair value | | 18 |
| | 2,165 |
| | — |
| | 2,183 |
|
| Total mortgage-backed securities and financial derivatives–assets, at fair value | | $ | 18 |
| | $ | 1,232,653 |
| | $ | 11,778 |
| | $ | 1,244,449 |
|
| Liabilities: | | | | | | | | |
| U.S. Treasury securities sold short, at fair value | | $ | — |
| | $ | (78,447 | ) | | $ | — |
| | $ | (78,447 | ) |
| Financial derivatives–liabilities, at fair value: | | | | | | | | |
| TBAs | | — |
| | (364 | ) | | — |
| | (364 | ) |
| Interest rate swaps | | — |
| | (4,361 | ) | | — |
| | (4,361 | ) |
| Total financial derivatives–liabilities, at fair value | | — |
| | (4,725 | ) | | — |
| | (4,725 | ) |
| Total U.S. Treasury securities sold short and financial derivatives–liabilities, at fair value | | $ | — |
| | $ | (83,172 | ) | | $ | — |
| | $ | (83,172 | ) |
There were no transfers of financial instruments between Levels 1 or 2 of the fair value hierarchy during the year ended December 31, 2014.2015.
The following tables present additional information about the Company's investments which are measured at fair value for which the Company has utilized Level 3 inputs to determine fair value:
Three month period ended September 30, 2015:March 31, 2016:
| | | (In thousands) | Non-Agency RMBS | | Agency RMBS | Non-Agency RMBS | | Agency RMBS |
| Beginning balance as of June 30, 2015 | $ | 5,556 |
| | $ | 7,070 |
| |
| Beginning balance as of December 31, 2015 | | $ | 4,020 |
| | $ | 7,758 |
|
| Purchases | — |
| | 1,696 |
| — |
| | 861 |
|
| Proceeds from sales | — |
| | — |
| — |
| | — |
|
| Principal repayments | (512 | ) | | — |
| (351 | ) | | — |
|
| (Amortization)/accretion, net | 208 |
| | (737 | ) | 109 |
| | (691 | ) |
| Net realized gains (losses) | — |
| | — |
| — |
| | — |
|
| Change in net unrealized gains (losses) | 44 |
| | (755 | ) | 214 |
| | (997 | ) |
| Transfers: | | | | | | |
| Transfers into level 3 | 824 |
| | — |
| — |
| | — |
|
| Transfers out of level 3 | — |
| | — |
| (1,848 | ) | | — |
|
| Ending balance as of September 30, 2015 | $ | 6,120 |
| | $ | 7,274 |
| |
| Ending balance as of March 31, 2016 | | $ | 2,144 |
| | $ | 6,931 |
|
All amounts of net realized and changes in net unrealized gains (losses) in the table above are reflected in the accompanying Consolidated Statement of Operations. The table above incorporates changes in net unrealized gains (losses) for both Level 3 financial instruments held by the Company at September 30, 2015,March 31, 2016, as well as Level 3 financial instruments disposed of by the Company during the three month period ended September 30, 2015.March 31, 2016. For Level 3 financial instruments held by the Company at September 30, 2015,as of March 31, 2016, change in net unrealized gains (losses) of $26$49.0 thousand and $(0.8)$(1.0) million, for the three month period ended September 30, 2015March 31, 2016 relate to non-Agency RMBS and Agency RMBS, respectively.
For the three month period ended September 30, 2015,March 31, 2016, the Company transferred $0.8 million of non-Agency RMBS from Level 2 to Level 3. Since the end of the prior quarter, these securities have exhibited indications of a reduced level of price transparency. Examples of such indications include wider spreads and/or higher delinquencies relative to similar securities and a reduction in observable transactions or executable quotes involving these and similar securities. Changes in these indications could impact price transparency, and thereby cause a change in the level designation in future periods.
Three month period ended September 30, 2014:
|
| | | | | | | |
| (In thousands) | Non-Agency RMBS | | Agency RMBS |
| Beginning balance as of June 30, 2014 | $ | 35,668 |
| | $ | 14,276 |
|
| Purchases | 2,543 |
| | 545 |
|
| Proceeds from sales | (3,688 | ) | | — |
|
| Principal repayments | (1,373 | ) | | — |
|
| (Amortization)/accretion, net | 502 |
| | (906 | ) |
| Net realized gains (losses) | 1,145 |
| | — |
|
| Change in net unrealized gains (losses) | (1,065 | ) | | 327 |
|
| Transfers: | | | |
| Transfers into level 3 | — |
| | — |
|
| Transfers out of level 3 | — |
| | — |
|
| Ending balance as of September 30, 2014 | $ | 33,732 |
| | $ | 14,242 |
|
All amounts of net realized and changes in net unrealized gains (losses) in the table above are reflected in the accompanying Consolidated Statement of Operations. The table above incorporates changes in net unrealized gains (losses) for both Level 3 financial instruments held by the Company at September 30, 2014, as well as Level 3 financial instruments disposed of by the Company during the three month period ended September 30, 2014. For Level 3 financial instruments held by the Company at September 30, 2014, change in net unrealized gains (losses) of $0.3 million and $(0.1) million, for the three month period ended September 30, 2014 relate to non-Agency RMBS and Agency RMBS, respectively.
Nine month period ended September 30, 2015:
|
| | | | | | | |
| (In thousands) | Non-Agency RMBS | | Agency RMBS |
| Beginning balance as of December 31, 2014 | $ | 10,082 |
| | $ | 11,244 |
|
| Purchases | — |
| | 3,397 |
|
| Proceeds from sales | (2,861 | ) | | (4,538 | ) |
| Principal repayments | (1,381 | ) | | — |
|
| (Amortization)/accretion, net | 806 |
| | (2,012 | ) |
| Net realized gains | 791 |
| | 602 |
|
| Change in net unrealized gains (losses) | (649 | ) | | (1,419 | ) |
| Transfers: | | | |
| Transfers into level 3 | 4,025 |
| | — |
|
| Transfers out of level 3 | (4,693 | ) | | — |
|
| Ending balance as of September 30, 2015 | $ | 6,120 |
| | $ | 7,274 |
|
All amounts of net realized and changes in net unrealized gains (losses) in the table above are reflected in the accompanying Consolidated Statement of Operations. The table above incorporates changes in net unrealized gains (losses) for both Level 3 financial instruments held by the Company at September 30, 2015, as well as Level 3 financial instruments disposed of by the Company during the nine month period ended September 30, 2015. For Level 3 financial instruments held by the Company at September 30, 2015, change in net unrealized gains (losses) of $80 thousand and $(0.6) million, for the nine month period ended September 30, 2015 relate to non-Agency RMBS and Agency RMBS, respectively.
For the nine month period ended September 30, 2015, the Company transferred $4.7$1.8 million of non-Agency RMBS from Level 3 to Level 2. These assets were transferred from Level 3 to Level 2 based on an increased volume of observed trading of these and similar assets. This increase in observed trading activity has led to greater price transparency for these assets, thereby making a Level 2 designation appropriate in the Company's view. However, changes in the volume of observable inputs for these assets, such as a decrease in observed trading, could impact price transparency, and thereby cause a change in the level designation for these assets in future periods.
For the nineThree month period ended September 30,March 31, 2015:
|
| | | | | | | |
| (In thousands) | Non-Agency RMBS | | Agency RMBS |
| Beginning balance as of December 31, 2014 | $ | 10,082 |
| | $ | 11,244 |
|
| Purchases | — |
| | 1,099 |
|
| Proceeds from sales | (2,861 | ) | | (4,538 | ) |
| Principal repayments | (601 | ) | | — |
|
| (Amortization)/accretion, net | 309 |
| | (656 | ) |
| Net realized gains (losses) | 791 |
| | 601 |
|
| Change in net unrealized gains (losses) | (276 | ) | | (1,307 | ) |
| Transfers: | | | |
| Transfers into level 3 | 3,359 |
| | — |
|
| Transfers out of level 3 | (4,977 | ) | | — |
|
| Ending balance as of March 31, 2015 | $ | 5,826 |
| | $ | 6,443 |
|
All amounts of net realized and changes in net unrealized gains (losses) in the table above are reflected in the accompanying Consolidated Statement of Operations. The table above incorporates changes in net unrealized gains (losses) for both Level 3 financial instruments held by the Company as of March 31, 2015, as well as Level 3 financial instruments disposed of by the Company during the three month period ended March 31, 2015. For Level 3 financial instruments held by the Company as of March 31, 2015, change in net unrealized gains (losses) of $0.2 million and $(0.4) million, for the three month period ended March 31, 2015 relate to non-Agency RMBS and Agency RMBS, respectively.
At March 31, 2015, the Company transferred $4.0$5.0 million of non-Agency RMBS from Level 3 to Level 2. The decision to transfer these assets from Level 3 to Level 2 was based on observed market developments, including an increased volume of buying and selling of these and similar assets, greater consensus among market participants on price based on market quotes, and generally tighter credit spreads driven by improved performance in the underlying collateral as well as increased demand from investors seeking higher yielding assets. These factors have led to greater price transparency for these assets, thereby making a Level 2 designation appropriate in the Company's view. However, changes in observed market developments could impact future price transparency, and thereby cause a change in the level designation in subsequent periods.
At March 31, 2015, the Company transferred $3.4 million of non-Agency RMBS from Level 2 to Level 3. Since year end,December 31, 2014, these securities have exhibited indications of a reduced level of price transparency. Examples of such indications include wider spreads and/or higher delinquencies relative to similar securities and a reduction in observable transactions or executable quotes involving these and similar securities. Changes in these indications could impact price transparency, and thereby cause a change in the level designation in future periods.
Nine month period ended September 30, 2014:
|
| | | | | | | |
| (In thousands) | Non-Agency RMBS | | Agency RMBS |
| Beginning balance as of December 31, 2013 | $ | 30,681 |
| | $ | 13,527 |
|
| Purchases | 14,711 |
| | 4,640 |
|
| Proceeds from sales | (11,104 | ) | | (1,282 | ) |
| Principal repayments | (3,945 | ) | | — |
|
| (Amortization)/accretion, net | 1,359 |
| | (2,326 | ) |
| Net realized gains | 1,518 |
| | 358 |
|
| Change in net unrealized gains (losses) | 512 |
| | (675 | ) |
| Transfers: | | | |
| Transfers into level 3 | — |
| | — |
|
| Transfers out of level 3 | — |
| | — |
|
| Ending balance as of September 30, 2014 | $ | 33,732 |
| | $ | 14,242 |
|
All amounts of net realized and changes in net unrealized gains (losses) in the table above are reflected in the accompanying Consolidated Statement of Operations. The table above incorporates changes in net unrealized gains (losses) for both Level 3 financial instruments held by the Company as of September 30, 2014, as well as Level 3 financial instruments disposed of by the Company during the nine month period ended September 30, 2014. For Level 3 financial instruments held
by the Company as of September 30, 2014, change in net unrealized gains (losses) of $(0.5) million and $0.8 million, for the nine month period ended September 30, 2014 relate to non-Agency RMBS and Agency RMBS, respectively.
The following tables identify the significant unobservable inputs that affect the valuation of the Company's Level 3 assets and liabilities as of September 30, 2015March 31, 2016 and December 31, 2014:2015:
September 30, 2015:March 31, 2016:
| | | | | | Range | | | | | Range | | |
| Description | | Fair Value | | Valuation Technique | | Significant Unobservable Input | | Min | | Max | | Weighted Average(1) | | Fair Value | | Valuation Technique | | Significant Unobservable Input | | Min | | Max | | Weighted Average(1) |
| | | (In thousands) | | | | | | | | (In thousands) | | | | | | |
| Non-Agency RMBS | | $ | 4,025 |
| | Market quotes | | Non-Binding Third-Party Valuation | | $ | 53.50 |
| | $ | 98.50 |
| | $ | 63.43 |
| |
| Non-Agency RMBS | | 2,095 |
| | Discounted Cash Flows | | Yield | | 8.3 | % | | 24.5 | % | | 15.3 | % | | $ | 2,144 |
| | Discounted Cash Flows | | Yield | | 4.8 | % | | 23.8 | % | | 11.9 | % |
| | | | | Projected Collateral Prepayments | | 32.9 | % | | 41.1 | % | | 37.5 | % | | | | Projected Collateral Prepayments | | 32.3 | % | | 67.5 | % | | 54.4 | % |
| | | | | Projected Collateral Losses | | 1.3 | % | | 3.4 | % | | 2.5 | % | | | | Projected Collateral Losses | | 2.2 | % | | 3.4 | % | | 3.0 | % |
| | | | | Projected Collateral Recoveries | | 4.2 | % | | 5.1 | % | | 4.6 | % | | | | Projected Collateral Recoveries | | 3.0 | % | | 4.6 | % | | 3.6 | % |
| | | | | Projected Collateral Scheduled Amortization | | 51.3 | % | | 60.7 | % | | 55.4 | % | | | | Projected Collateral Scheduled Amortization | | 26.1 | % | | 60.9 | % | | 39.0 | % |
| | | | | | | | | 100.0 | % | | | | | | | | 100.0 | % |
| Agency RMBS–Interest Only Securities | | 5,035 |
| | Market quotes | | Non-Binding Third-Party Valuation | | $ | 3.26 |
| | $ | 21.08 |
| | $ | 11.19 |
| | 4,692 |
| | Market quotes | | Non-Binding Third-Party Valuation | | $ | 4.29 |
| | $ | 21.68 |
| | $ | 10.93 |
|
| Agency RMBS–Interest Only Securities | | 2,239 |
| | Option Adjusted Spread ("OAS") | | LIBOR OAS (2) | | 341 |
| | 1,518 |
| | 820 |
| | 2,239 |
| | Option Adjusted Spread ("OAS") | | LIBOR OAS (2) | | 510 |
| | 2,219 |
| | 777 |
|
| | | | | Projected Collateral Prepayments | | 55.4 | % | | 76.6 | % | | 67.4 | % | | | | Projected Collateral Prepayments | | 61.5 | % | | 83.8 | % | | 77.4 | % |
| | | | | Projected Collateral Scheduled Amortization | | 23.4 | % | | 44.6 | % | | 32.6 | % | | | | Projected Collateral Scheduled Amortization | | 16.2 | % | | 38.5 | % | | 22.6 | % |
| | | | | | | | | 100.0 | % | | | | | | | | 100.0 | % |
| |
| (1) | Averages are weighted based on the fair value of the related instrument. |
| |
| (2) | Shown in basis points. |
December 31, 2014:2015:
| | | | | | Range | | | | | Range | | |
| Description | | Fair Value | | Valuation Technique | | Significant Unobservable Input | | Min | | Max | | Weighted Average(1) | | Fair Value | | Valuation Technique | | Significant Unobservable Input | | Min | | Max | | Weighted Average(1) |
| | | (In thousands) | | | | | | | | | | | | (In thousands) | | | | | | | | | | |
| Non-Agency RMBS | | $ | 7,819 |
| | Market quotes | | Non-Binding Third-Party Valuation | | $ | 21.38 |
| | $ | 84.91 |
| | $ | 54.11 |
| |
| Non-Agency RMBS | | 2,263 |
| | Discounted Cash Flows | | Yield | | 6.3 | % | | 6.3 | % | | 6.3 | % | | $ | 4,020 |
| | Discounted Cash Flows | | Yield | | 8.8 | % | | 25.7 | % | | 13.4 | % |
| | | | | Projected Collateral Prepayments | | 35.9 | % | | 35.9 | % | | 35.9 | % | | | | Projected Collateral Prepayments | | 32.5 | % | | 68.7 | % | | 60.5 | % |
| | | | | Projected Collateral Losses | | 7.5 | % | | 7.5 | % | | 7.5 | % | | | | Projected Collateral Losses | | 1.3 | % | | 9.0 | % | | 5.3 | % |
| | | | | Projected Collateral Recoveries | | 11.0 | % | | 11.0 | % | | 11.0 | % | | | | Projected Collateral Recoveries | | 3.4 | % | | 9.2 | % | | 6.4 | % |
| | | | | Projected Collateral Scheduled Amortization | | 45.6 | % | | 45.6 | % | | 45.6 | % | | | | Projected Collateral Scheduled Amortization | | 13.1 | % | | 60.1 | % | | 27.8 | % |
| | | | | | | | | 100.0 | % | | | | | | | | 100.0 | % |
| Agency RMBS–Interest Only Securities | | 7,006 |
| | Market quotes | | Non-Binding Third-Party Valuation | | $ | 4.74 |
| | $ | 20.38 |
| | $ | 13.35 |
| | 5,645 |
| | Market quotes | | Non-Binding Third-Party Valuation | | $ | 4.39 |
| | $ | 21.63 |
| | $ | 11.88 |
|
| Agency RMBS–Interest Only Securities | | 4,238 |
| | Option Adjusted Spread ("OAS") | | LIBOR OAS(2) | | 83 |
| | 1,952 |
| | 490 |
| | 2,113 |
| | Option Adjusted Spread ("OAS") | | LIBOR OAS(2) | | 221 |
| | 984 |
| | 576 |
|
| | | | | Projected Collateral Prepayments | | 63.3 | % | | 92.3 | % | | 75.2 | % | | | | Projected Collateral Prepayments | | 52.7 | % | | 88.0 | % | | 74.1 | % |
| | | | | Projected Collateral Scheduled Amortization | | 7.7 | % | | 36.7 | % | | 24.8 | % | | | | Projected Collateral Scheduled Amortization | | 12.0 | % | | 47.3 | % | | 25.9 | % |
| | | | | | | | | 100.0 | % | | | | | | | | 100.0 | % |
| |
| (1) | Averages are weighted based on the fair value of the related instrument. |
| |
| (2) | Shown in basis points. |
Third-party non-binding valuations are validated by comparing such valuations to internally generated prices based on the Company's models and to recent trading activity in the same or similar instruments. For those instruments valued using discounted cash flows, collateral prepayments, losses, recoveries, and scheduled amortization are projected over the remaining life of the collateral and expressed as a percentage of the collateral's current principal balance. For those assets valued using the LIBOR Option Adjusted Spread, or "OAS," valuation methodology, cash flows are projected using the Company's models over multiple interest rate scenarios, and these projected cash flows are then discounted using the LIBOR rates implied by each interest rate scenario. The LIBOR OAS of an asset is then computed as the unique constant yield spread that, when added to all LIBOR rates in each interest rate scenario generated by the model, will equate (a) the expected present value of the projected asset cash flows over all model scenarios to (b) the actual current market price of the asset. LIBOR OAS is therefore model-dependent. Generally speaking, LIBOR OAS measures the additional yield spread over LIBOR that an asset provides at its current market price after taking into account any interest rate options embedded in the asset.
Material changes in any of the inputs above in isolation could result in a significant change to reported fair value measurements. Fair value measurements are impacted by the interrelationships of these inputs. For example, a higher expectation of collateral prepayments will generally result in a lower expectation of collateral losses. Conversely, higher losses will generally result in lower prepayments.
The following table summarizes the estimated fair value of all other financial instruments not included in the disclosures above as of September 30, 2015March 31, 2016 and December 31, 2014:2015:
| | | | | September 30, 2015 | | December 31, 2014 | | March 31, 2016 | | December 31, 2015 |
| (In thousands) | | Fair Value | | Carrying Value | | Fair Value | | Carrying Value | | Fair Value | | Carrying Value | | Fair Value | | Carrying Value |
| Other financial instruments | | | | | | | | | | | | | | | | |
| Assets | | | | | | | | | |
| Cash | | $ | 20,482 |
| | $ | 20,482 |
| | $ | 10,237 |
| | $ | 10,237 |
| |
| Assets: | | | | | | | | | |
| Cash and cash equivalents | | | $ | 41,242 |
| | $ | 41,242 |
| | $ | 40,166 |
| | $ | 40,166 |
|
| Due from brokers | | 41,068 |
| | 41,068 |
| | 18,531 |
| | 18,531 |
| | 30,206 |
| | 30,206 |
| | 33,297 |
| | 33,297 |
|
| Reverse repurchase agreements | | 76,610 |
| | 76,610 |
| | 13,987 |
| | 13,987 |
| | 69,575 |
| | 69,575 |
| | 78,632 |
| | 78,632 |
|
| Liabilities | | | | | | | | | |
| Liabilities: | | | | | | | | | |
| Repurchase agreements | | 1,225,905 |
| | 1,225,905 |
| | 1,323,080 |
| | 1,323,080 |
| | 1,133,841 |
| | 1,133,841 |
| | 1,222,719 |
| | 1,222,719 |
|
| Due to brokers | | 2,654 |
| | 2,654 |
| | 583 |
| | 583 |
| | 127 |
| | 127 |
| | 439 |
| | 439 |
|
Cash and cash equivalents includes cash held in an interest bearing overnight account for which fair value equals the carrying value and iscash held in money market accounts which are liquid in nature and for which fair value equals the carrying value; such assets are considered a Level 1 asset.assets. Due from brokers and Due to brokers include collateral transferred to or received from counterparties, along with receivables and payables for open and/or closed derivative positions. These balances consist primarily of cash and are short term in nature; fair value approximates carrying value and such balances are considered Level 1 assets and liabilities. The Company's repurchase and reverse repurchase agreements are carried at cost, which approximates fair value.value due to their short term nature. Repurchase agreements and reverse repurchase agreements are classified as Level 2 assets and liabilities based on the adequacy of the collateral and their short term nature.
5. Financial Derivatives
The Company is exposed to certain risks arising from both its business operations and economic conditions. Specifically, the Company's primary source of financing is repurchase agreements and the Company enters into financial derivative and other instruments to manage exposure to variable cash flows on portions of its borrowings under those repurchase agreements. Since the interest rates on repurchase agreements typically change with market interest rates such as LIBOR, the Company is exposed to constantly changing interest rates, which accordingly affects cash flows associated with these rates on its borrowings. To mitigate the effect of changes in these interest rates and their related cash flows, the Company may enter into a variety of derivative contracts, including interest rate swaps, swaptions, and TBAs. Additionally, from time to time, the Company may use short positions in U.S. Treasury securities to mitigate its interest rate risk.
The following table details the fair value of the Company's holdings of financial derivatives as of September 30, 2015March 31, 2016 and December 31, 2014:2015:
| | | | | September 30, 2015 | | December 31, 2014 | | March 31, 2016 | | December 31, 2015 |
| | | (In thousands) | | (In thousands) |
| Financial derivatives–assets, at fair value: | | | | | | | | |
| TBA securities purchase contracts | | $ | 558 |
| | $ | 387 |
| | $ | 365 |
| | $ | 115 |
|
| TBA securities sale contracts | | 17 |
| | 89 |
| | — |
| | 302 |
|
| Fixed payer interest rate swaps | | 5 |
| | 2,518 |
| | 4 |
| | 891 |
|
| Fixed receiver interest rate swaps | | 947 |
| | — |
| | 1,265 |
| | 857 |
|
| Swaptions | | — |
| | 78 |
| |
| Total financial derivatives–assets, at fair value: | | 1,527 |
| | 3,072 |
| |
| Futures | | | 1 |
| | 18 |
|
| Total financial derivatives–assets, at fair value | | | 1,635 |
| | 2,183 |
|
| Financial derivatives–liabilities, at fair value: | | | | | | | | |
| TBA securities purchase contracts | | (1 | ) | | (5 | ) | | — |
| | (49 | ) |
| TBA securities sale contracts | | (1,158 | ) | | (1,669 | ) | | (1,157 | ) | | (315 | ) |
| Fixed payer interest rate swaps | | (15,255 | ) | | (7,026 | ) | | (17,122 | ) | | (4,361 | ) |
| Total financial derivatives–liabilities, at fair value: | | (16,414 | ) | | (8,700 | ) | |
| Futures | | | (5 | ) | | — |
|
| Total financial derivatives–liabilities, at fair value | | | (18,284 | ) | | (4,725 | ) |
| Total | | $ | (14,887 | ) | | $ | (5,628 | ) | | $ | (16,649 | ) | | $ | (2,542 | ) |
Interest Rate Swaps
The following tables provide information about the Company's fixed payer interest rate swaps as of September 30, 2015March 31, 2016 and December 31, 2014:2015:
September 30,March 31, 2016:
|
| | | | | | | | | | | | | | | | |
| | | | | | | Weighted Average |
| Maturity | | Notional Amount | | Fair Value | | Pay Rate | | Receive Rate | | Remaining Years to Maturity |
| | | (In thousands) | | | | | | |
| 2016 | | $ | 48,000 |
| | $ | (79 | ) | | 0.80 | % | | 0.62 | % | | 0.52 |
| 2017 | | 74,750 |
| | (546 | ) | | 1.21 |
| | 0.63 |
| | 1.34 |
| 2018 | | 71,529 |
| | (559 | ) | | 1.11 |
| | 0.62 |
| | 2.03 |
| 2020 | | 107,461 |
| | (2,371 | ) | | 1.50 |
| | 0.62 |
| | 4.08 |
| 2021 | | 10,400 |
| | 1 |
| | 1.15 |
| | 0.62 |
| | 4.87 |
| 2022 | | 19,444 |
| | (587 | ) | | 1.76 |
| | 0.62 |
| | 6.26 |
| 2023 | | 131,400 |
| | (7,080 | ) | | 2.10 |
| | 0.63 |
| | 7.14 |
| 2024 | | 9,200 |
| | (428 | ) | | 1.99 |
| | 0.61 |
| | 8.01 |
| 2025 | | 34,022 |
| | (1,503 | ) | | 2.05 |
| | 0.62 |
| | 8.86 |
| 2043 | | 19,047 |
| | (3,966 | ) | | 3.02 |
| | 0.62 |
| | 27.14 |
| Total | | $ | 525,253 |
| | $ | (17,118 | ) | | 1.59 | % | | 0.62 | % | | 5.16 |
December 31, 2015:
|
| | | | | | | | | | | | | | | | |
| | | | | | | Weighted Average |
| Remaining Maturity | | Notional Amount | | Fair Value | | Pay Rate | | Receive Rate | | Remaining Years to Maturity |
| | | (In thousands) | | | | | | |
| 2016 | | $ | 48,000 |
| | $ | (214 | ) | | 0.80 | % | | 0.31 | % | | 1.02 |
| 2017 | | 74,750 |
| | (815 | ) | | 1.21 |
| | 0.32 |
| | 1.84 |
| 2018 | | 71,529 |
| | (620 | ) | | 1.11 |
| | 0.30 |
| | 2.54 |
| 2020 | | 134,620 |
| | (2,402 | ) | | 1.65 |
| | 0.31 |
| | 4.64 |
| 2022 | | 27,700 |
| | (828 | ) | | 2.04 |
| | 0.33 |
| | 6.57 |
| 2023 | | 131,164 |
| | (4,222 | ) | | 2.13 |
| | 0.32 |
| | 7.64 |
| 2024 | | 12,900 |
| | (977 | ) | | 2.73 |
| | 0.31 |
| | 8.70 |
| 2025 | | 83,740 |
| | (2,021 | ) | | 2.17 |
| | 0.31 |
| | 9.54 |
| 2043 | | 26,000 |
| | (3,151 | ) | | 3.04 |
| | 0.32 |
| | 27.65 |
| Total | | $ | 610,403 |
| | $ | (15,250 | ) | | 1.74 | % | | 0.31 | % | | 6.24 |
December 31, 2014:
| | | | | | | | | Weighted Average | | | | | | Weighted Average |
| Remaining Maturity | | Notional Amount | | Fair Value | | Pay Rate | | Receive Rate | | Remaining Years to Maturity | |
| Maturity | | | Notional Amount | | Fair Value | | Pay Rate | | Receive Rate | | Remaining Years to Maturity |
| | | (In thousands) | | | | | | | (In thousands) | | | | | |
| 2016 | | $ | 48,000 |
| | $ | (91 | ) | | 0.80 | % | | 0.23 | % | | 1.77 | | $ | 48,000 |
| | $ | (83 | ) | | 0.80 | % | | 0.39 | % | | 0.77 |
| 2017 | | 74,750 |
| | (388 | ) | | 1.21 |
| | 0.24 |
| | 2.59 | | 74,750 |
| | (445 | ) | | 1.21 |
| | 0.41 |
| | 1.59 |
| 2018 | | 10,000 |
| | 167 |
| | 0.84 |
| | 0.23 |
| | 3.33 | | 71,529 |
| | 80 |
| | 1.11 |
| | 0.34 |
| | 2.28 |
| 2020 | | 23,500 |
| | 471 |
| | 1.42 |
| | 0.23 |
| | 5.38 | | 119,893 |
| | 220 |
| | 1.51 |
| | 0.33 |
| | 4.36 |
| 2022 | | | 19,444 |
| | 86 |
| | 1.76 |
| | 0.34 |
| | 6.51 |
| 2023 | | 209,350 |
| | 140 |
| | 2.13 |
| | 0.23 |
| | 8.40 | | 131,400 |
| | (1,367 | ) | | 2.10 |
| | 0.38 |
| | 7.39 |
| 2024 | | 12,900 |
| | (605 | ) | | 2.73 |
| | 0.23 |
| | 9.45 | | 9,200 |
| | 11 |
| | 1.99 |
| | 0.32 |
| | 8.26 |
| 2025 | | | 58,560 |
| | (5 | ) | | 2.06 |
| | 0.33 |
| | 9.32 |
| 2043 | | 46,320 |
| | (4,202 | ) | | 3.12 |
| | 0.23 |
| | 28.42 | | 21,067 |
| | (1,967 | ) | | 3.03 |
| | 0.36 |
| | 27.39 |
| Total | | $ | 424,820 |
| | $ | (4,508 | ) | | 1.87 | % | | 0.23 | % | | 8.56 | | $ | 553,843 |
| | $ | (3,470 | ) | | 1.63 | % | | 0.36 | % | | 5.67 |
The following tables provide information about the Company's fixed receiver interest rate swaps as of September 30, 2015. There were no fixed receiver interest rate swaps held as ofMarch 31, 2016 and December 31, 2014:2015.
September 30,March 31, 2016:
|
| | | | | | | | | | | | | | | | |
| | | | | | | Weighted Average |
| Maturity | | Notional Amount | | Fair Value | | Pay Rate | | Receive Rate | | Remaining Years to Maturity |
| | | (In thousands) | | | | | | |
| 2025 | | $ | 9,700 |
| | $ | 1,255 |
| | 0.62 | % | | 3.00 | % | | 9.30 |
| 2026 | | 3,000 |
| | 10 |
| | 0.63 | % | | 1.68 | % | | 10.01 |
| Total | | $ | 12,700 |
| | $ | 1,265 |
| | 0.62 | % | | 2.69 | % | | 9.46 |
December 31, 2015:
| | | | | | | | | Weighted Average | | | | | | Weighted Average |
| Remaining Maturity | | Notional Amount | | Fair Value | | Pay Rate | | Receive Rate | | Remaining Years to Maturity | |
| Maturity | | | Notional Amount | | Fair Value | | Pay Rate | | Receive Rate | | Remaining Years to Maturity |
| | | (In thousands) | | | | | | | (In thousands) | | | | | |
| 2025 | | $ | 9,700 |
| | $ | 947 |
| | 0.29 | % | | 3.00 | % | | 9.80 | | $ | 9,700 |
| | $ | 857 |
| | 0.32 | % | | 3.00 | % | | 9.55 |
| Total | | $ | 9,700 |
| | $ | 947 |
| | 0.29 | % | | 3.00 | % | | 9.80 | | $ | 9,700 |
| | $ | 857 |
| | 0.32 | % | | 3.00 | % | | 9.55 |
Interest Rate SwaptionsFutures
The following table provides information about the Company's swaptionsshort positions in Eurodollar futures as of March 31, 2016 and December 31, 2014 The Company had no swaptions as of September 30, 2015.
March 31, 2016:
|
| | | | | | | | | | |
| Maturity | | Notional Amount | | Fair Value | | Remaining Months to Expiration |
| ($ in thousands) | | | | | | |
| 2016 | | $ | (9,000 | ) | | $ | 1 |
| | 5.66 |
| 2017 | | (9,000 | ) | | (5 | ) | | 14.76 |
| Total | | $ | (18,000 | ) | | $ | (4 | ) | | 10.21 |
December 31, 2014:2015:
|
| | | | | | | | | | | | | | |
| Option | | Underlying Swap |
| Type | | Fair Value | | Months to Expiration | | Notional Amount | | Term (Years) | | Fixed Rate |
| ($ in thousands) | | | | | | | | | | |
| Straddle | | $ | 78 |
| | 6.5 | | $ | 9,700 |
| | 10 | | 3.00% |
|
| | | | | | | | | | |
| Maturity | | Notional Amount | | Fair Value | | Remaining Months to Expiration |
| ($ in thousands) | | | | | | |
| 2016 | | $ | (12,000 | ) | | $ | 10 |
| | 7.13 |
| 2017 | | (9,000 | ) | | 8 |
| | 17.79 |
| Total | | $ | (21,000 | ) | | $ | 18 |
| | 11.70 |
TBAs
The Company transacts in the forward settling TBA market. Pursuant to these TBA transactions, the Company agrees to purchase or sell, for future delivery, Agency RMBS with certain principal and interest terms and certain types of underlying collateral, but the particular Agency RMBS to be delivered is not identified until shortly before the TBA settlement date. TBAs are liquid and have quoted market prices and represent the most actively traded class of MBS. The Company primarily uses TBAs to mitigate interest rate risk, typically in the form of short positions. However, from time to time the Company also invests in TBAs as a means of acquiring additional exposure to Agency RMBS, or for speculative purposes, including holding long positions. Overall, the Company typically holds a net short position.
The Company does not generally take delivery of TBAs; rather, it settles the associated receivable and payable with its trading counterparties on a net basis. Transactions with the same counterparty for the same TBA that result in a reduction of the position are treated as extinguished.
As of September 30, 2015March 31, 2016 and December 31, 2014,2015, the Company had outstanding contracts to purchase ("long positions") and sell ("short positions") TBA securities as follows:
| | | | | September 30, 2015 | | December 31, 2014 | | March 31, 2016 | | December 31, 2015 |
| TBA Securities | | Notional Amount(1) | | Cost Basis(2) | | Market Value(3) | | Net Carrying Value(4) | | Notional Amount (1) | | Cost Basis(2) | | Market Value(3) | | Net Carrying Value(4) | | Notional Amount(1) | | Cost Basis(2) | | Market Value(3) | | Net Carrying Value(4) | | Notional Amount (1) | | Cost Basis(2) | | Market Value(3) | | Net Carrying Value(4) |
| (In thousands) | | | | | | | | | | | | | | | | | | | | | | | | | | | | | | | | |
| Purchase contracts: | | | | | |
| | | | | | | | | | | | | | | |
| | | | | | | | | | |
| Assets | | $ | 78,601 |
| | $ | 80,367 |
| | $ | 80,925 |
| | $ | 558 |
| | $ | 53,319 |
| | $ | 54,757 |
| | $ | 55,144 |
| | $ | 387 |
| | $ | 76,904 |
| | $ | 79,928 |
| | $ | 80,293 |
| | $ | 365 |
| | $ | 60,291 |
| | $ | 61,638 |
| | $ | 61,753 |
| | $ | 115 |
|
| Liabilities | | 2,908 |
| | 3,046 |
| | 3,045 |
| | (1 | ) | | 15,000 |
| | 15,603 |
| | 15,598 |
| | (5 | ) | | — |
| | — |
| | — |
| | — |
| | 23,418 |
| | 24,208 |
| | 24,159 |
| | (49 | ) |
| | | 81,509 |
|
| 83,413 |
|
| 83,970 |
|
| 557 |
|
| 68,319 |
|
| 70,360 |
|
| 70,742 |
|
| 382 |
| | 76,904 |
|
| 79,928 |
|
| 80,293 |
|
| 365 |
|
| 83,709 |
|
| 85,846 |
|
| 85,912 |
|
| 66 |
|
| Sale contracts: | | | | | | | | | | | | | | | | | | | | | | | | | | | | | | | | |
| Assets | | (33,420 | ) | | (36,220 | ) | | (36,203 | ) | | 17 |
| | (79,090 | ) | | (85,730 | ) | | (85,641 | ) | | 89 |
| | — |
| | — |
| | — |
| | — |
| | (170,800 | ) | | (181,476 | ) | | (181,174 | ) | | 302 |
|
| Liabilities | | (402,026 | ) | | (429,041 | ) | | (430,199 | ) | | (1,158 | ) | | (525,986 | ) | | (559,219 | ) | | (560,888 | ) | | (1,669 | ) | | (311,246 | ) | | (332,743 | ) | | (333,900 | ) | | (1,157 | ) | | (252,746 | ) | | (268,973 | ) | | (269,288 | ) | | (315 | ) |
| | | (435,446 | ) |
| (465,261 | ) |
| (466,402 | ) |
| (1,141 | ) |
| (605,076 | ) |
| (644,949 | ) |
| (646,529 | ) |
| (1,580 | ) | | (311,246 | ) |
| (332,743 | ) |
| (333,900 | ) |
| (1,157 | ) |
| (423,546 | ) |
| (450,449 | ) |
| (450,462 | ) |
| (13 | ) |
| Total TBA securities, net | | $ | (353,937 | ) | | $ | (381,848 | ) | | $ | (382,432 | ) | | $ | (584 | ) | | $ | (536,757 | ) | | $ | (574,589 | ) | | $ | (575,787 | ) | | $ | (1,198 | ) | | $ | (234,342 | ) | | $ | (252,815 | ) | | $ | (253,607 | ) | | $ | (792 | ) | | $ | (339,837 | ) | | $ | (364,603 | ) | | $ | (364,550 | ) | | $ | 53 |
|
| |
| (1) | Notional amount represents the principal balance of the underlying Agency RMBS. |
| |
| (2) | Cost basis represents the forward price to be paid for the underlying Agency RMBS. |
| |
| (3) | Market value represents the current market value of the underlying Agency RMBS (on a forward delivery basis) as of period end. |
| |
| (4) | Net carrying value represents the difference between the market value of the TBA contract as of period end and the cost basis and is reported in Financial derivatives-assets at fair value and Financial derivatives-liabilities at fair value on the Consolidated Balance Sheet. |
The tables below detaildetails the average notional values of the Company's financial derivatives, using absolute value of month end notional values, for the ninethree month period ended September 30, 2015March 31, 2016 and the year ended December 31, 2014:2015:
| | | Derivative Type | | Nine Month Period Ended September 30, 2015 | | Year Ended
December 31, 2014 | | Three Month Period Ended
March 31, 2016 | | Year Ended
December 31, 2015 |
| | | (In thousands) | | (In thousands) |
| Interest rate swaps | | $ | 511,689 |
| | $ | 566,379 |
| | $ | 545,110 |
| | $ | 525,037 |
|
| TBAs | | 632,638 |
| | 545,646 |
| | 430,152 |
| | 606,665 |
|
| Interest rate swaptions | | 6,790 |
| | 20,631 |
| | — |
| | 5,223 |
|
| Futures | | | 20,250 |
| | 5,308 |
|
Gains and losses on the Company's financial derivatives for the three and nine month periods ended September 30,March 31, 2016 and 2015 and 2014 are summarized in the tables below:
| | | | | Three Month Period Ended September 30, 2015 | | Three Month Period Ended March 31, 2016 |
| Derivative Type | | Net Realized Gains (Losses) on Periodic Settlements of Interest Rate Swaps | | Net Realized Gains (Losses) Other Than Periodic Settlements of Interest Rate Swaps | | Net Realized Gains (Losses) on Financial Derivatives | | Change in Net Unrealized Gains (Losses) on Accrued Periodic Settlements of Interest Rate Swaps | | Change in Net Unrealized Gains (Losses) Other Than on Accrued Periodic Settlements of Interest Rate Swaps | | Change in Net Unrealized Gains (Losses) on Financial Derivatives | | Net Realized Gains (Losses) on Periodic Settlements of Interest Rate Swaps | | Net Realized Gains (Losses) Other Than Periodic Settlements of Interest Rate Swaps | | Net Realized Gains (Losses) on Financial Derivatives | | Change in Net Unrealized Gains (Losses) on Accrued Periodic Settlements of Interest Rate Swaps | | Change in Net Unrealized Gains (Losses) Other Than on Accrued Periodic Settlements of Interest Rate Swaps | | Change in Net Unrealized Gains (Losses) on Financial Derivatives |
| (In thousands) | | | | | | | | | | | | | | | | | | | | | | | | |
| Interest rate swaps | | $ | (1,044 | ) | | $ | (19 | ) | | $ | (1,063 | ) | | $ | (1,066 | ) | | $ | (13,559 | ) | | $ | (14,625 | ) | | $ | (672 | ) | | $ | (1,226 | ) | | $ | (1,898 | ) | | $ | (726 | ) | | $ | (12,543 | ) | | $ | (13,269 | ) |
| Swaptions | | | | (500 | ) | | (500 | ) | | | | 17 |
| | 17 |
| |
| TBAs | | | | (1,689 | ) | | (1,689 | ) | | | | (813 | ) | | (813 | ) | | | | (2,099 | ) | | (2,099 | ) | | | | (844 | ) | | (844 | ) |
| Futures | | | | | 1 |
| | 1 |
| | | | (22 | ) | | (22 | ) |
| Total | | $ | (1,044 | ) | | $ | (2,208 | ) | | $ | (3,252 | ) | | $ | (1,066 | ) | | $ | (14,355 | ) | | $ | (15,421 | ) | | $ | (672 | ) | | $ | (3,324 | ) | | $ | (3,996 | ) | | $ | (726 | ) | | $ | (13,409 | ) | | $ | (14,135 | ) |
|
| | | | | | | | | | | | | | | | | | | | | | | | |
| | | Three Month Period Ended September 30, 2014 |
| Derivative Type | | Net Realized Gains (Losses) on Periodic Settlements of Interest Rate Swaps | | Net Realized Gains (Losses) Other Than Periodic Settlements of Interest Rate Swaps | | Net Realized Gains (Losses) on Financial Derivatives | | Change in Net Unrealized Gains (Losses) on Accrued Periodic Settlements of Interest Rate Swaps | | Change in Net Unrealized Gains (Losses) Other Than on Accrued Periodic Settlements of Interest Rate Swaps | | Change in Net Unrealized Gains (Losses) on Financial Derivatives |
| (In thousands) | | | | | | | | | | | | |
| Interest rate swaps | | $ | (678 | ) | | $ | 502 |
| | $ | (176 | ) | | $ | (1,475 | ) | | $ | (10 | ) | | $ | (1,485 | ) |
| Swaptions | | | | (935 | ) | | (935 | ) | | | | 898 |
| | 898 |
|
| TBAs | | | | (3,280 | ) | | (3,280 | ) | | | | 2,867 |
| | 2,867 |
|
| Total | | $ | (678 | ) | | $ | (3,713 | ) | | $ | (4,391 | ) | | $ | (1,475 | ) | | $ | 3,755 |
| | $ | 2,280 |
|
|
| | | | | | | | | | | | | | | | | | | | | | | | |
| | | Nine Month Period Ended September 30, 2015 |
| Derivative Type | | Net Realized Gains (Losses) on Periodic Settlements of Interest Rate Swaps | | Net Realized Gains (Losses) Other Than Periodic Settlements of Interest Rate Swaps | | Net Realized Gains (Losses) on Financial Derivatives | | Change in Net Unrealized Gains (Losses) on Accrued Periodic Settlements of Interest Rate Swaps | | Change in Net Unrealized Gains (Losses) Other Than on Accrued Periodic Settlements of Interest Rate Swaps | | Change in Net Unrealized Gains (Losses) on Financial Derivatives |
| (In thousands) | | | | | | | | | | | | |
| Interest rate swaps | | $ | (3,900 | ) | | $ | (4,826 | ) | | $ | (8,726 | ) | | $ | (1,647 | ) | | $ | (8,147 | ) | | $ | (9,794 | ) |
| Swaptions | | | | (500 | ) | | (500 | ) | | | | (79 | ) | | (79 | ) |
| TBAs | | | | (6,612 | ) | | (6,612 | ) | | | | 615 |
| | 615 |
|
| Total | | $ | (3,900 | ) | | $ | (11,938 | ) | | $ | (15,838 | ) | | $ | (1,647 | ) | | $ | (7,611 | ) | | $ | (9,258 | ) |
| | | | | Nine Month Period Ended September 30, 2014 | | Three Month Period Ended March 31, 2015 |
| Derivative Type | | Net Realized Gains (Losses) on Periodic Settlements of Interest Rate Swaps | | Net Realized Gains (Losses) Other Than Periodic Settlements of Interest Rate Swaps | | Net Realized Gains (Losses) on Financial Derivatives | | Change in Net Unrealized Gains (Losses) on Accrued Periodic Settlements of Interest Rate Swaps | | Change in Net Unrealized Gains (Losses) Other Than on Accrued Periodic Settlements of Interest Rate Swaps | | Change in Net Unrealized Gains (Losses) on Financial Derivatives | | Net Realized Gains (Losses) on Periodic Settlements of Interest Rate Swaps | | Net Realized Gains (Losses) Other Than Periodic Settlements of Interest Rate Swaps | | Net Realized Gains (Losses) on Financial Derivatives | | Change in Net Unrealized Gains (Losses) on Accrued Periodic Settlements of Interest Rate Swaps | | Change in Net Unrealized Gains (Losses) Other Than on Accrued Periodic Settlements of Interest Rate Swaps | | Change in Net Unrealized Gains (Losses) on Financial Derivatives |
| (In thousands) | | | | | | | | | | | | | | | | | | | | | | | | |
| Interest rate swaps | | $ | (5,574 | ) | | $ | 4,013 |
| | $ | (1,561 | ) | | $ | (1,315 | ) | | $ | (24,720 | ) | | $ | (26,035 | ) | | $ | (707 | ) | | $ | (3,441 | ) | | $ | (4,148 | ) | | $ | (851 | ) | | $ | (6,383 | ) | | $ | (7,234 | ) |
| Swaptions | | | | (935 | ) | | (935 | ) | | | | 60 |
| | 60 |
| | | | — |
| | — |
| | | | 237 |
| | 237 |
|
| TBAs | | | | (16,478 | ) | | (16,478 | ) | | | | (2,330 | ) | | (2,330 | ) | | | | (4,595 | ) | | (4,595 | ) | | | | (97 | ) | | (97 | ) |
| Futures | | | | 19 |
| | 19 |
| | | | — |
| | — |
| |
| Total | | $ | (5,574 | ) | | $ | (13,381 | ) | | $ | (18,955 | ) | | $ | (1,315 | ) | | $ | (26,990 | ) | | $ | (28,305 | ) | | $ | (707 | ) | | $ | (8,036 | ) | | $ | (8,743 | ) | | $ | (851 | ) | | $ | (6,243 | ) | | $ | (7,094 | ) |
As of September 30,March 31, 2016, the Company also held short positions in U.S. Treasury securities, with a principal amount of $68.8 million and a fair value of $69.6 million. As of December 31, 2015, the Company also held short positions in U.S. Treasury securities, with a principal amount of $70.0$79.6 million and a fair value of $70.7$78.4 million. As of December 31, 2014,Such securities are included on the Company also held short positions inCompany's Consolidated Balance Sheet under the caption U.S. Treasury securities with a principal amount of $13.9 million and asold short, at fair value of $14.0 million.value.
6. Borrowings under Repurchase Agreements
The Company enters into repurchase agreements. A repurchase agreement involves the sale of an asset to a counterparty together with a simultaneous agreement to repurchase the transferred asset or similar asset from such counterparty at a future date. The Company accounts for its repurchase agreements as collateralized borrowings, with the transferred assets effectively serving as collateral for the related borrowing. The Company's repurchase agreements typically range in term from 30 to 180 days. The principal economic terms of each repurchase agreement—such as loan amount, interest rate, and maturity date—are typically negotiated on a transaction-by-transaction basis. Other terms and conditions, such as relating to events of default, are typically governed under the Company's master repurchase agreements. Absent an event of default, the Company maintains beneficial ownership of the transferred securities during the term of the repurchase agreement and receives the related principal and interest payments. Interest rates on these borrowings are generally fixed based on prevailing rates corresponding to the terms of the borrowings, and interest is paid at the termination of the repurchase agreement at which time the Company may enter into a new repurchase agreement at prevailing market rates with the same counterparty, repay that counterparty and possibly negotiate financing terms with a different counterparty, or choose to no longer finance the related asset. In response to a decline in the fair value of the transferred securities, whether as a result of changes in market conditions, security paydowns, or other factors, repurchase agreement counterparties will typically make a margin call, whereby the Company will be required to post additional securities and/or cash as collateral with the counterparty in order to re-establish the agreed-upon collateralization requirements. In the event of increases in fair value of the transferred securities, the Company generally can require the counterparty to post collateral with it in the form of cash or securities. The Company is generally permitted to sell or re-pledge any securities posted by the counterparty as collateral; however, upon termination of the repurchase agreement, or other circumstance in which the counterparty is no longer required to post such margin, the Company must return to the counterparty the same security that had been posted. The contractual amount (loan amount) of the Company's repurchase agreements approximates fair value, based on the short-term nature of the debt and the adequacy of the collateral.
At any given time, the Company seeks to have its outstanding borrowings under repurchase agreements with several different counterparties in order to reduce the exposure to any single counterparty. As of September 30, 2015March 31, 2016 and December 31, 2014,2015, the Company had outstanding borrowings under repurchase agreements with thirteentwelve and tenthirteen counterparties, respectively.
The following table details the Company's outstanding borrowings under repurchase agreements as of September 30, 2015March 31, 2016 and December 31, 2014:2015:
| | | | | September 30, 2015 | | December 31, 2014 | | March 31, 2016 | | December 31, 2015 |
| | | | | Weighted Average | | | | Weighted Average | | | | Weighted Average | | | | Weighted Average |
| Remaining Days to Maturity | | Borrowings Outstanding | | Interest Rate | | Remaining Days to Maturity | | Borrowings Outstanding | | Interest Rate | | Remaining Days to Maturity | | Borrowings Outstanding | | Interest Rate | | Remaining Days to Maturity | | Borrowings Outstanding | | Interest Rate | | Remaining Days to Maturity |
| | | (In thousands) | | | | | | | | | | | | (In thousands) | | | | | | | | | | |
| 30 days or less | | $ | 472,278 |
| | 0.43 | % | | 15 |
| | $ | 437,633 |
| | 0.33 | % | | 15 |
| | $ | 537,508 |
| | 0.63 | % | | 15 |
| | $ | 666,124 |
| | 0.52 | % | | 14 |
|
| 31-60 days | | 371,885 |
| | 0.46 |
| | 44 |
| | 417,009 |
| | 0.34 |
| | 44 |
| | 268,670 |
| | 0.67 |
| | 43 |
| | 336,350 |
| | 0.53 |
| | 45 |
|
| 61-90 days | | 169,786 |
| | 0.47 |
| | 74 |
| | 333,580 |
| | 0.36 |
| | 72 |
| | 292,395 |
| | 0.71 |
| | 74 |
| | 89,142 |
| | 0.70 |
| | 74 |
|
| 91-120 days | | 211,956 |
| | 0.57 |
| | 107 |
| | — |
| | — |
| | — |
| | — |
| | — |
| | — |
| | 131,103 |
| | 0.53 |
| | 106 |
|
| 151-180 days | | — |
| | — |
| | — |
| | 85,917 |
| | 0.41 |
| | 165 |
| | 35,268 |
| | 0.82 |
| | 167 |
| | — |
| | — |
| | — |
|
| 301-330 days | | — |
| | — |
| | — |
| | 48,941 |
| | 0.47 |
| | 317 |
| |
| Total | | $ | 1,225,905 |
| | 0.47 | % | | 48 |
| | $ | 1,323,080 |
| | 0.35 | % | | 60 |
| | $ | 1,133,841 |
| | 0.66 | % | | 42 |
| | $ | 1,222,719 |
| | 0.54 | % | | 37 |
|
Repurchase agreements involving underlying investments that the Company sold prior to period end, for settlement following period end, are shown using their original maturity dates even though such repurchase agreements may be expected to be terminated early upon settlement of the sale of the underlying investment.
As of September 30, 2015March 31, 2016 and December 31, 2014,2015, the fair value of Agency RMBS transferred as collateral under outstanding borrowings under repurchase agreements was $1.3$1.2 billion and $1.41.3 billion, respectively. Collateral transferred under outstanding borrowings as of September 30, 2015March 31, 2016 includes Agency RMBS in the amount of $34.646.2 million that were sold prior to period end but for which such sale had not yet settled. Collateral transferred under outstanding borrowings as of December 31, 20142015 includes Agency RMBS in the amount of $41.8$63.4 million that were sold prior to period end but for which such sale had not yet settled. In addition the Company posted net cash collateral of $15.26.7 million and additional securities with a fair value of $9.61.0 million as of September 30, 2015March 31, 2016 as a result of margin calls from various counterparties. The Company posted additional net cash collateral of $5.720.7 million and additional securities with a fair value of $2.12.0 million as of December 31, 20142015 as a result of margin calls from various counterparties. The Company also held investments with an aggregate value of approximately $0.4 million, as of December 31, 2014, which were received to satisfy collateral requirements for various repurchase agreements.
7. Offsetting of Assets and Liabilities
The Company records financial instruments at fair value as described in Note 2. All financial instruments are recorded on a gross basis on the Consolidated Balance Sheet. In connection with its financial derivatives, repurchase agreements, and related trading agreements, the Company and its counterparties are required to pledge collateral. Cash or other collateral is exchanged as required with each of the Company's counterparties in connection with open derivative positions and repurchase agreements.
The following tables present information about certain assets and liabilities representing financial instruments as of September 30, 2015March 31, 2016 and December 31, 2014.2015. The Company has not previously entered into master netting agreements with any of its counterparties. Certain of the Company's repurchase and reverse repurchase agreements and financial derivative transactions are governed by underlying agreements that generally provide a right of offset in the event of default or in the event of a bankruptcy of either party to the transaction.
September 30, 2015:March 31, 2016:
| | | Description | | Amount of Assets (Liabilities) Presented in the Consolidated Balance Sheet(1) | | Financial Instruments Available for Offset | | Financial Instruments Transferred or Pledged as Collateral(2)(3) | | Cash Collateral (Received) Pledged(2)(3) | | Net Amount | | Amount of Assets (Liabilities) Presented in the Consolidated Balance Sheet(1) | | Financial Instruments Available for Offset | | Financial Instruments Transferred or Pledged as Collateral(2)(3) | | Cash Collateral (Received) Pledged(2)(3) | | Net Amount |
| (In thousands) | | | | | | | | | | | | | | | | | | | | |
| Assets: | | | | | | | | | | | | | | | | | | | | |
| Financial derivatives–assets | | $ | 1,527 |
| | $ | (1,379 | ) | | $ | — |
| | $ | — |
| | $ | 148 |
| | $ | 1,635 |
| | $ | (1,473 | ) | | $ | — |
| | $ | — |
| | $ | 162 |
|
| Reverse repurchase agreements | | 76,610 |
| | (76,610 | ) | | — |
| | — |
| | — |
| | 69,575 |
| | (69,575 | ) | | — |
| | — |
| | — |
|
| Liabilities: | | | | | | | | | | | | | | | | | | | | |
| Financial derivatives–liabilities | | (16,414 | ) | | 1,379 |
| | — |
| | 14,702 |
| | (333 | ) | | (18,284 | ) | | 1,473 |
| | — |
| | 16,085 |
| | (726 | ) |
| Repurchase agreements | | (1,225,905 | ) | | 76,610 |
| | 1,134,134 |
| | 15,161 |
| | — |
| | (1,133,841 | ) | | 69,575 |
| | 1,057,542 |
| | 6,724 |
| | — |
|
| |
| (1) | In the Company's Consolidated Balance Sheet, all balances associated with the repurchase agreements and financial derivatives are presented on a gross basis. |
| |
| (2) | For the purpose of this presentation, for each row the total amount of financial instruments transferred or pledged and cash collateral (received) or pledged may not exceed the applicable gross amount of assets or (liabilities) as presented here. Therefore, the Company has reduced the amount of financial instruments transferred or pledged as collateral related to the Company's repurchase agreements and cash collateral pledged on the Company's financial derivative assets and liabilities. Total financial instruments transferred or pledged as collateral on the Company's repurchase agreements as of September 30, 2015March 31, 2016 were $1.28$1.19 billion. As of September 30, 2015March 31, 2016 total cash collateral on financial derivative assets and liabilities excludes $8.6$0.2 million and $7.0 million, respectively of net excess cash collateral. |
| |
| (3) | When collateral is pledged to or pledged by a counterparty, it is often pledged or posted with respect to all positions with such counterparty, and in such cases such collateral cannot be specifically identified as relating to a specific asset or liability. As a result, in preparing the above table, the Company has made assumptions in allocating pledged or posted collateral among the various rows. |
December 31, 2014:2015:
| | | Description | | Amount of Assets (Liabilities) Presented in the Consolidated Balance Sheet(1) | | Financial Instruments Available for Offset | | Financial Instruments Transferred or Pledged as Collateral(2)(3) | | Cash Collateral (Received) Pledged(2)(3) | | Net Amount | | Amount of Assets (Liabilities) Presented in the Consolidated Balance Sheet(1) | | Financial Instruments Available for Offset | | Financial Instruments Transferred or Pledged as Collateral(2)(3) | | Cash Collateral (Received) Pledged(2)(3) | | Net Amount |
| (In thousands) | | | | | | | | | | | | | | | | | | | | |
| Assets: | | | | | | | | | | | | | | | | | | | | |
| Financial derivatives–assets | | $ | 3,072 |
| | $ | (2,722 | ) | | $ | — |
| | $ | — |
| | $ | 350 |
| | $ | 2,183 |
| | $ | (1,529 | ) | | $ | — |
| | $ | — |
| | $ | 654 |
|
| Reverse repurchase agreements | | 13,987 |
| | (13,987 | ) | | — |
| | — |
| | — |
| | 78,632 |
| | (78,632 | ) | | — |
| | — |
| | — |
|
| Liabilities: | | | | | | | | | | | | | | | | | | | | |
| Financial derivatives–liabilities | | (8,700 | ) | | 2,722 |
| | — |
| | 5,783 |
| | (195 | ) | | (4,725 | ) | | 1,529 |
| | — |
| | 3,089 |
| | (107 | ) |
| Repurchase agreements | | (1,323,080 | ) | | 13,987 |
| | 1,303,360 |
| | 5,733 |
| | — |
| | (1,222,719 | ) | | 78,632 |
| | 1,123,409 |
| | 20,678 |
| | — |
|
| |
| (1) | In the Company's Consolidated Balance Sheet, all balances associated with the repurchase agreements and financial derivatives are presented on a gross basis. |
| |
| (2) | For the purpose of this presentation, for each row the total amount of financial instruments transferred or pledged and cash collateral (received) or pledged may not exceed the applicable gross amount of assets or (liabilities) as presented here. Therefore the Company has reduced the amount of financial instruments transferred or pledged as collateral related to the Company's repurchase agreements and cash collateral pledged on the Company's financial derivative assets and liabilities. Total financial instruments transferred or pledged as collateral on the Company's repurchase agreements as of December 31, 20142015 were $1.39$1.26 billion. As of December 31, 20142015 total cash collateral on financial derivative assets and liabilities excludes $0.5$6.8 million and $6.3$2.5 million, respectively of net excess cash collateral. |
| |
| (3) | When collateral is pledged to or pledged by a counterparty, it is often pledged or posted with respect to all positions with such counterparty, and in such cases such collateral cannot be specifically identified as relating to a specific asset or liability. As a result, in preparing the above table, the Company has made assumptions in allocating pledged or posted collateral among the various rows. |
8. Management Fees
The Manager receives an annual management fee in an amount equal to 1.50% per annum of shareholders' equity (as defined in the Management Agreement) as of the end of each fiscal quarter (before deductions for any management fee with respect to such fiscal period). The management fee is payable quarterly in arrears. For both the three month periods ended September 30, 2015 and 2014, the total management fee incurred was approximately $0.6 million. For the nine month periods ended September 30, 2015 and 2014, the total management fee incurred was approximately $1.8 million and $1.7 million.
Effective January 1, 2015 the Company entered into a Third Amended and Restated Management Agreement with the Manager, which replaced and superseded the Second Amended and Restated Management Agreement. The Third Amended and Restated Management Agreement was adopted and executed for the primary purpose of redefining shareholders' equity. Shareholders' equity per the Second Amended and Restated Management Agreement had the definition as described below. Effective January 1, 2015, shareholders' equity is defined in the Third Amended and Restated Management Agreement, as of the end of any fiscal quarter, as (a) the sum of (1) the net proceeds from any issuances of common shares or other equity securities of the Company or the Operating Partnership (without double counting) since inception, plus (2) the Company's and the Operating Partnership's (without double counting) retained earnings or accumulated deficit calculated in accordance with U.S. GAAP at the end of the most recently completed fiscal quarter (without taking into account any non-cash equity compensation expense incurred in current or prior periods), less (b) any amount that the Company or the Operating Partnership has paid to repurchase common shares, limited partnership interests in the Operating Partnership or other equity securities since inception. Shareholders' equity excludes (1) non-cash equity compensation expenses that have impacted shareholders' equity as reported in the financial statements prepared in accordance with U.S. GAAP, and (2) one-time events pursuant to changes in U.S. GAAP, and certain non-cash items not otherwise described above, in each case, after discussions between the Manager and the Company's independent trustees and approval by a majority of the Company's independent trustees.
From inception through December 31, 2014, Shareholders' equity was defined in the Second Amended and Restated Management Agreement, as of the end of any fiscal quarter, as (a) the sum of (1) the net proceeds from any issuances of common shares or other equity securities of the Company or the Operating Partnership (without double counting) since inception, plus (2) the Company's and the Operating Partnership's (without double counting) retained earnings or accumulated deficit calculated in accordance with U.S. GAAP at the end of the most recently completed fiscal quarter (without taking into account any non-cash equity compensation expense incurred in current or prior periods), less (b) any amount that the Company or the Operating Partnership has paid to repurchase common shares, limited partnership interests in the Operating Partnership or other equity securities since inception. Shareholders' equity excludes (1) any unrealized gains, losses, or non-cash equity compensation expenses that have impacted shareholders' equity as reported in the financial statements prepared in accordance with U.S. GAAP, regardless of whether such items are included in net income, and (2) one-time events pursuant to changes in U.S. GAAP, and certain non-cash items not otherwise described above, in each case, after discussions between the Manager and the Company's independent trustees and approval by a majority of the Company's independent trustees.
9. Earnings Per Share
Basic earnings per share, or "EPS," is calculated by dividing net income (loss) for the period by the weighted average of the Company's common shares outstanding for the period. Diluted EPS takes into account the effect of outstanding dilutive instruments, such as share options and warrants, if any, and uses the average share price for the period in determining the number of incremental shares that are to be added to the weighted average number of shares outstanding. As of September 30,March 31, 2016 and 2015, and 2014, the Company did not have any dilutive instruments outstanding.
The following table presents a reconciliation of the earnings/(losses) and shares used in calculating basic EPS for the three and nine month periods ended September 30, 2015March 31, 2016 and 2014:2015:
| | | (In thousands except for share amounts) | | Three Month Period Ended
September 30, 2015 | | Three Month
Period Ended
September 30, 2014 | | Nine Month
Period Ended
September 30, 2015 | | Nine Month
Period Ended
September 30, 2014 | | Three Month Period Ended
March 31, 2016 | | Three Month Period Ended
March 31, 2015 |
| Numerator: | | | | | | | | | | | | |
| Net income (loss) | | $ | (4,817 | ) | | $ | 3,533 |
| | $ | (949 | ) | | $ | 17,344 |
| | $ | (239 | ) | | $ | 3,677 |
|
| Denominator: | | | | | | | | | | | | |
| Basic and diluted weighted average shares outstanding | | 9,140,452 |
| | 9,141,892 |
| | 9,146,301 |
| | 9,140,533 |
| | 9,121,198 |
| | 9,149,274 |
|
| Basic and Diluted Earnings Per Share | | $ | (0.53 | ) | | $ | 0.39 |
| | $ | (0.10 | ) | | $ | 1.90 |
| | $ | (0.03 | ) | | $ | 0.40 |
|
10.9. Related Party Transactions
Management Agreement
The Company is party to the Management Agreement, which provides for an initial term through September 24, 2017, and which will be renewed automatically each year thereafter for an additional one-year period, subject to certain termination rights. The Company is externally managed and advised by the Manager. Pursuant to the terms of the Management Agreement, the Manager provides the Company with its management team, including its officers, and appropriate support personnel. The Company does not have any employees. The Manager is responsible for the day-to-day operations of the Company.
The Manager receives an annual management fee in an amount equal to 1.50% per annum of shareholders' equity (as defined in the Management Agreement) as of the end of each fiscal quarter (before deductions for any management fee with respect to such fiscal period). The management fee is payable quarterly in arrears. For the three month periods ended March 31, 2016 and 2015, the total management fee incurred was $0.5 million and $0.6 million, respectively.
Services Agreement
The Manager and EMG are parties to a services agreement, pursuant to which EMG is required to provide to the Manager sufficient personnel, services, and resources to enable the Manager to carry out its obligations and responsibilities under the Management Agreement. The Company is a named third-party beneficiary to the services agreement and, as a result, has, as a non-exclusive remedy, a direct right of action against EMG in the event of any breach by the Manager of any of its duties, obligations, or agreements under the Management Agreement that arise out of or result from any breach by EMG of its obligations under the services agreement. The services agreement will terminate upon the termination of the Management Agreement. Pursuant to the services agreement, the Manager makes certain payments to EMG in connection with the services provided. The Manager and EMG have overlapping ownership and are under common control.
Expense Reimbursement
Under the terms of the Management Agreement the Company is required to reimburse the Manager for operating expenses related to the Company that are incurred by the Manager, including expenses relating to legal, accounting, due diligence, other services, and all other costs and expenses. The Company's reimbursement obligation is not subject to any dollar limitation. Expenses will be reimbursed in cash within 60 days following delivery of the expense statement by the Manager; provided, however, that such reimbursement may be offset by the Manager against amounts due to the Company from the Manager. The Company will not reimburse the Manager for the salaries and other compensation of the Manager's personnel except that the Company will be responsible for expenses incurred by the Manager in employing certain dedicated or partially dedicated personnel as further described below.
The Company reimburses the Manager for the allocable share of the compensation, including, without limitation, wages, salaries, and employee benefits paid or reimbursed, as approved by the Compensation Committee of the Board of Trustees, to certain dedicated or partially dedicated personnel who spend all or a portion of their time managing the Company's affairs, based upon the percentage of time devoted by such personnel to the Company's affairs. In their capacities as officers or
personnel of the Manager or its affiliates, such personnel will devote such portion of their time to the Company's affairs as is necessary to enable the Company to operate its business.
For the ninethree month periods ended September 30,March 31, 2016 and 2015 and 2014, the Company reimbursed the Manager $1.2$0.9 million and $1.9$0.4 million, respectively, for previously incurred operating and compensation expenses.
Termination Fee
The Management Agreement requires the Company to pay a termination fee to the Manager in the event of (1) the Company's termination or non-renewal of the Management Agreement without cause or (2) the Manager's termination of the Management Agreement upon a default by the Company in the performance of any material term of the Management Agreement. Such termination fee will be equal to 5% of Shareholders' Equity, as defined in the Management Agreement (see Note 8 above) as of the month-end preceding termination.the date of the notice of termination or non-renewal of the Management Agreement.
Registration Rights Agreement
The Company is a party to a registration rights agreement with an affiliate of EMG and with the Blackstone Tactical Opportunities Funds (the "Blackstone Funds") pursuant to which the Company has granted its initial investors and each of their permitted transferees and other holders of the Company's "registrable common shares" (as such term is defined in the registration rights agreement) who become parties to the registration rights agreement with certain demand and/or piggy-back registration and shelf takedown rights.
11.10. Capital
The Company has authorized 500,000,000 common shares, $0.01 par value per share, and 100,000,000 preferred shares, $0.01 par value per share. The Board of Trustees may authorize the issuance of additional shares of either class. As of September 30, 2015March 31, 2016 and December 31, 2014,2015, there were 9,135,0219,117,183 and 9,149,2749,135,103 common shares outstanding, respectively. No preferred shares have been issued.
On September 15,During the three month periods ended March 31, 2016 and 2015, the Company's Board of TrusteesDirectors authorized dividends totaling $0.45 per share and $0.55 per share, respectively. Total dividends declared during the issuancethree month periods ended March 31, 2016 and 2015 were $4.1 million and $5.0 million, respectively.
Detailed below is a roll forward of 9,228the Company's common shares to its independent trustees pursuant to director share award agreements. These shares will vestoutstanding for the three month periods ended March 31, 2016 and become non-forfeitable on September 14, 2016.2015:
|
| | | | | |
| | Three Month Period Ended March 31, 2016 | | Three Month Period Ended March 31, 2015 |
Common Shares Outstanding (12/31/2015 and 12/31/2014, respectively) | 9,135,103 |
| | 9,149,274 |
|
| Share Activity: | | | |
| Shares repurchased | (17,920 | ) | | — |
|
Common Shares Outstanding (3/31/2016 and 3/31/2015, respectively) | 9,117,183 |
| | 9,149,274 |
|
Unvested restricted shares outstanding (3/31/2016 and 3/31/2015, respectively) | 15,390 |
| | 6,912 |
|
The below table provides details cash dividends declared byon the Board of Trustees during the nine month period ended September 30,Company's restricted shares granted pursuant to share award agreements which are unvested at March 31, 2016 and 2015:
|
| | | | | | | | | |
| | Dividend Per Share | | Dividend Amount | | Declaration Date | | Record Date | | Payment Date |
| | | | (In thousands) | | | | | | |
| First Quarter | $0.55 | | $5,032 | | March 11, 2015 | | March 31, 2015 | | April 27, 2015 |
| Second Quarter | $0.55 | | $5,032 | | June 16, 2015 | | June 30, 2015 | | July 27, 2015 |
| Third Quarter | $0.45 | | $4,111 | | September 15, 2015 | | September 30, 2015 | | October 26, 2015 |
|
| | | | | | | |
| Grant Recipient | | Number of Restricted Shares Granted | | Grant Date | | Vesting Date(1) |
| Independent trustees: | | | | | | |
| | 9,228 |
| | September 15, 2015 | | September 14, 2016 |
| | 6,912 |
| | September 11, 2014 | | September 10, 2015 |
| Partially dedicated employees: | | | | | | |
| | 3,157 |
| | December 15, 2015 | | December 15, 2016 |
| | 324 |
| | December 15, 2015 | | December 31, 2016 |
| | 2,359 |
| | December 15, 2015 | | December 15, 2017 |
| | 322 |
| | December 15, 2015 | | December 31, 2017 |
The below table details cash dividends declared by the Board of Trustees during the nine month period ended September 30, 2014:
|
| | | | | | | | | |
| | Dividend Per Share | | Dividend Amount | | Declaration Date | | Record Date | | Payment Date |
| | | | (In thousands) | | | | | | |
| First Quarter | $0.55 | | $5,027 | | March 12, 2014 | | March 31, 2014 | | April 28, 2014 |
| Second Quarter | $0.55 | | $5,027 | | June 17, 2014 | | June 30, 2014 | | July 25, 2014 |
| Third Quarter | $0.55 | | $5,032 | | September 11, 2014 | | September 30, 2014 | | October 27, 2014 |
| |
| (1) | Date at which such restricted shares will vest and become non-forfeitable. |
On August 13, 2013, the Company's Board of Trustees approved the adoption of a $10 million share repurchase program. The program, which is open-ended in duration, allows the Company to make repurchases from time to time on the open market or in negotiated transactions.transactions, including through Rule 10b5-1 plans. Repurchases are at the Company's discretion, subject to applicable law, share availability, price and the Company's financial performance, among other considerations. During the quarterthree month period ended September 30, 2015,March 31, 2016, the Company made its first repurchases under the program, purchasing 23,481purchased 17,920 common shares at an aggregate cost of $0.3$0.2 million, and an average price per share of $12.93.$10.94. Since inception of the share repurchase program through March 31, 2016, the Company has purchased 47,481 common shares at an aggregate cost of $0.6 million, and an average price per share of $12.03.
Distribution Policy
The timing and frequency of distributions will be determined by the Board of Trustees based upon a variety of factors deemed relevant by the Company's trustees, including restrictions under applicable law, capital requirements of the Company, and the REIT requirements of the Code. Distributions to shareholders generally will be taxable as ordinary income, although a portion of such distributions may be designated as long-term capital gain or qualified dividend income, or may constitute a return of capital. The Company will furnish annually to each shareholder a statement setting forth distributions paid or deemed paid during the preceding year and their U.S. federal income tax treatment.
It is the intention of the Company to distribute at least 100% of its taxable income, after application of available tax attributes, within the time limits prescribed by the Internal Revenue Code, which may extend into the subsequent taxable year.
12.11. Commitments and Contingencies
From time to time, the Company may become involved in various claims and legal actions arising in the ordinary course of business. ManagementThe Company provides current directors and officers with a limited indemnification against liabilities arising in connection with the performance of their duties to the Company.
In the normal course of business the Company may also enter into contracts that contain a variety of representations, warranties, and general indemnifications. The Company's maximum exposure under these arrangements, including future claims that may be made against the Company that have not yet occurred, is unknown. The Company has not incurred any costs to defend lawsuits or settle claims related to these indemnification agreements. The Company has no liabilities recorded for these agreements as of March 31, 2016 and December 31, 2015 and management is not aware of any significant contingencies at September 30, 2015.March 31, 2016.
Item 2. Management's Discussion and Analysis of Financial Condition and Results of Operations
In this Quarterly Report on Form 10-Q, except where the context suggests otherwise, "EARN," "we," "us," and "our" refer to Ellington Residential Mortgage REIT and its subsidiaries, our "Manager" refers to Ellington Residential Mortgage Management LLC, our external manager, and "Ellington" refers to Ellington Management Group, L.L.C. and its affiliated investment advisory firms.
SPECIAL NOTE REGARDING FORWARD-LOOKING STATEMENTS
When used in this quarterly report on Form 10-Q, in future filings with the Securities and Exchange Commission ("SEC") or in press releases or other written or oral communications, statements which are not historical in nature, including those containing words such as "believe," "expect," "anticipate," "estimate," "project," "plan," "continue," "intend," "should," "would," "could," "goal," "objective," "will," "may," "seek" or similar expressions, are intended to identify "forward-looking statements" within the meaning of Section 27A of the Securities Act of 1933, as amended, or the "Securities Act," and Section 21E of the Securities Exchange Act of 1934, as amended, and, as such, may involve known and unknown risks, uncertainties, and assumptions.
Forward-looking statements are based on our beliefs, assumptions, and expectations of our future performance, taking into account all information currently available to us. These beliefs, assumptions and expectations are subject to risks and uncertainties and can change as a result of many possible events or factors, not all of which are known to us. If a change occurs, our business, financial condition, liquidity and results of operations may vary materially from those expressed in our forward-looking statements. The following factors are examples of those that could cause actual results to vary from our forward-looking statements: changes in interest rates and the market value of our securities; our use and dependence on leverage; the impact of Fannie Mae and Freddie Mac being placed into conservatorship and related events, including the lack of certainty as to the future roles and structures of these entities and changes to legislation and regulations affecting these entities; market volatility; changes in the prepayment rates on the mortgage loans underlying the securities we own and intend to acquire; changes in rates of default and/or recovery rates on our non-agency assets; our ability to borrow to finance our assets and the costs of such borrowings; changes in government regulations affecting our business; our ability to maintain our exclusion from registration under the Investment Company Act of 1940, as amended (the "Investment Company Act"); and risks associated with investing in real estate related assets, including changes in business conditions and the general economy. These and other risks, uncertainties and factors, including the risk factors described under Item 1A of our Annual Report on Form 10-K for the fiscal year ended December 31, 20142015 as filed with the SEC, could cause our actual results to differ materially from those projected in any forward-looking statements we make. All forward-looking statements speak only as of the date on which they are made. New risks and uncertainties arise over time and it is not possible to predict those events or how they may affect us. Except as required by law, we are not obligated to, and do not intend to, update or revise any forward-looking statements, whether as a result of new information, future events or otherwise.
Executive Summary
We are a Maryland real estate investment trust, or "REIT," formed in August 2012 that specializes in acquiring, investing in, and managing residential mortgage- and real estate-related assets. Our primary objective is to generate attractive current yields and risk-adjusted total returns for our shareholders by making investments that we believe compensate us appropriately for the risks associated with them. We seek to attain this objective by constructing and actively managing a portfolio comprised primarily of residential mortgage-backed securities, or "RMBS," for which the principal and interest payments are guaranteed by a U.S. government agency or a U.S. government-sponsored entity, or "Agency RMBS," and, to a lesser extent, RMBS that do not carry such guarantees, or "non-Agency RMBS," such as RMBS backed by prime jumbo, Alternative A-paper, manufactured housing, and subprime residential mortgage loans. We also may opportunistically acquire and manage other types of residential mortgage-related and real estate-related asset classes, such as residential mortgage loans, and mortgage servicing rights, or "MSRs." We believe that being able to combine Agency RMBS with non-Agency RMBS and other residential mortgage- and real estate-related asset classes enables us to balance a range of mortgage-related risks.
We were formed through an initial strategic venture among affiliates of Ellington, an investment management firm and registered investment adviser with a 20-year21-year history of investing in a broad spectrum of mortgage-backed securities and related derivatives, with an emphasis on the RMBS market, and the Blackstone Tactical Opportunity Funds, or the "Blackstone Funds." As of September 30, 2015,March 31, 2016, the Blackstone Funds owned approximately 28%30% of our outstanding common shares.
We are externally managed and advised by our Manager, an affiliate of Ellington.
We use leverage in our Agency RMBS strategy and, while we have not done so meaningfully to date, we may use leverage in our non-Agency RMBS strategy as well, although we expect such leverage to be lower. We have financed our purchases of Agency RMBS exclusively through repurchase agreements, which we account for as collateralized borrowings. As
of September 30, 2015,March 31, 2016, we had outstanding borrowings under repurchase agreements in the amount of $1.2$1.1 billion with thirteentwelve counterparties.
We have elected to be taxed as a REIT for U.S. federal income tax purposes. Accordingly, we generally will not be subject to U.S. federal income taxes on our taxable income that we distribute currently to our shareholders as long as we maintain our qualification as a REIT. We intend to conduct our operations so that neither we nor any of our subsidiaries is required to register as an investment company under the Investment Company Act of 1940, as amended.amended, or "Investment Company Act."
As of September 30, 2015,March 31, 2016, our book value per share was $16.20$15.39 as compared to $17.18 as of June 30, 2015 and $17.86$15.86 as of December 31, 2014.2015.
Trends and Recent Market Developments
Key trends and recent market developments for the mortgage-backed security, or "MBS," market include the following:
U.S. Federal Reserve and U.S. Monetary Policy—TheIn March 2016, the U.S. Federal Reserve, or "Federal Reserve," continues to monitor the U.S. economy to determine when it should begin increasingmaintained its target interestrange for the federal funds rate and it is maintaining its existing policy of reinvesting principal payments from its U.S. Treasury security and Agency RMBS holdings;
Global Macroeconomic Events—Various macroeconomic events in the third quarter, particularly in China, led to increased volatility in global financial markets, a drop in long-term U.S. Treasury yields, and wider yield spreads in most credit-sensitive fixed income markets;
Housing and Mortgage Market Statistics—Data released by S&P Indices for its S&P/Case-Shiller Home Price Indices for February showed modest year-to-datea continuation of mid-single-digit home price appreciation through August;nationally; meanwhile the Freddie Mac survey 30-year mortgage rate ended the thirdfirst quarter of 2016 at 3.85%3.71%, decreasingdown from 4.08%4.01% at the end of the second quarter;2015;
Prepayment Rate Trends—Prepayment rates fell slightly during the third quarter of 2015 as compared to the second quarter, ashave spiked in early 2016, primarily driven by a seasonal decline in purchase activity outweighed lower mortgage rates;rates. Both the timing and the magnitude of the increases were very similar to what was experienced in early 2015;
Government Sponsored Enterprise, or "GSE," and Government Agency Developments—The Federal Housing Finance Agency, or "FHFA," and the GSEs continued to announce program and policy changes and clarifications intended to increase mortgage credit availability;
Portfolio Overview and Outlook—OutlookWith both Agency and non-Agency RMBS yield spreads widening in—In the face of declining interestsubstantial market volatility, yield spreads widened significantly in the first quarter for most sectors of the fixed-income market, including Agency RMBS. Most of the yield spread widening occurred in the early part of the quarter and many credit sector spreads only partially recovered by the end of the quarter. Interest rates and concerns of a weakening global economy, and with interest rate swap spreads narrowing significantly, our MBS assets significantly underperformed our interest rate hedges on a mark-to-market basisdropped sharply during the quarter. However, given their favorable prepayment characteristics and now-wider yieldGiven the drop in interest rates, pay-ups on specified pools increased. Non-Agency RMBS was also impacted by widening credit spreads, we believe that our specified pool portfolio is positioned to perform well in the current environment. More generally, we believe that the Agency RMBS market currently presents excellent investment opportunities for us, as wider yield spreads throughout the sector have led to larger net interest margins in many of our targeted asset classes.but less so than other credit-sensitive fixed-income sectors.
Federal Reserve and U.S. Monetary Policy
Heading into the September meeting ofOn March 16, 2016, the Federal Open Market Committee, or "FOMC," market participants and observers were nearly split on whether the FOMCannounced that it would finally decide to raise short-term interest rates. Those predicting inaction ultimately prevailed, as the FOMC maintainedmaintain the target range for the federal funds rate at 0%0.25% to 0.25%0.50%. In its SeptemberMarch statement following the meeting, the FOMC stated that while economic activity has been expanding at a moderate pace, global economic and financial developments continue to pose risks. The FOMC also indicated that, based on its assessment of labor market conditions, inflationaryindicators of inflation pressures and inflation expectations, and other factors,readings on financial and international developments, it expects that economic conditions will be appropriate to raise the target rate when it has seen further improvementevolve in a manner that will warrant only gradual increases in the labor marketfederal funds rate, and that the federal funds rate is reasonably confidentlikely to remain, for some time, below levels that inflation will moveare expected to its 2% inflation objective overprevail in the medium term.longer run. The FOMC also noted that it continues to expectexpects that, with appropriategradual adjustments in the stance on monetary policy, accommodation, economic activity will continue to expand at a moderate pace. Currently the FOMC anticipates that economic conditions may warrant keeping the target rate below normal long-run levels for "some time," even once employmentpace and inflation have reached levels consistent with the Federal Reserve's mandate.
In additionlabor market indicators will continue to its September statement, the FOMC also released its "dot plot" in its Summary of Economic Projections, an overview of FOMC participants' assessments of monetary policy going forward. The September dot plot was overall more "dovish" (i.e., in favor of keeping interest rates low) than it had been in June, and one FOMC member (out of 17) predicted that the target federal funds rate might actually become negative in the coming several months, an unprecedented prediction. In response to the FOMC's September announcement, yield spreads widened considerably in many fixed income markets, and equity markets declined in the face of increasing concerns over economic growth. On September 18, 2015, the day following the FOMC statement, the 10-year U.S. Treasury yield fell six basis points to 2.13%, and the S&P 500 Index fell 1.6%. Markets generally continued to decline through the end of the quarter, with the 10-year U.S. Treasury yield falling an additional 10 basis points, and with the S&P 500 falling an additional 1.9%, from September 18, 2015 through September 30, 2015.strengthen.
Over the course of the entire thirdfirst quarter, the 10-year U.S. Treasury yield fell by 3150 basis points, from 2.35%2.27% as of June 30,December 31, 2015 to 2.04%1.77% as of September 30, 2015. While interest rates have dropped overall since the Federal Reserve's initial taper
announcement in December 2013,March 31, 2016. Despite this, we believe that there remains substantial risk that interest rates will increase, driven by a tightening of Federal Reserve monetary policy in response to employment and economic growth in the United States and other factors. The risk of rising interest rates reinforces the importance of our ability, subject to our qualifying and maintaining our qualification as a REIT, to hedge interest rate risk in both our Agency RMBS and non-Agency MBS portfolios using a variety of tools, including TBAs,forward-settling To-Be-Announced Agency pass-through certificates, or "TBAs," interest rate swaps, and various other instruments. Additional uncertainty surrounds the Federal Reserve's timeline to curtail its reinvestment of principal payments from its U.S. Treasury security and Agency RMBS holdings. The current pace of monthly reinvestments under this program is approximately $24$33 billion, thus providing significant market support.
Global Macroeconomic Events
Global financial markets continued to experience a heightened level of volatility in the third quarter, primarily driven by concerns regarding a slowdown in the growth of the Chinese economy. The Shanghai Stock Exchange Composite Index plunged 20% in the latter half of August, and ended August down 38% from its high on June 12, 2015. On August 25th, in response to this significant stock market volatility and signs of an overall economic slowdown, the People's Bank of China lowered benchmark interest rates for the fifth time since November 2014, and announced a selective cut in the reserve requirement ratio for banks, following three earlier reductions in 2015. U.S. equity markets also experienced significant volatility throughout the quarter, with the S&P 500 Index falling by more than 2% for three days in a row in August in response to the turmoil in Chinese markets. In a flight to quality, yields on long-term U.S. Treasury securities fell over the course of the quarter. While for the first part of the quarter the credit-sensitive sectors of the U.S. fixed income markets exhibited relative resilience in the face of the heightened global equity market volatility, in September most of the credit sensitive sectors experienced significant yield spread widening.
Housing and Mortgage Market Statistics
The following table demonstrates the decline in residential mortgage delinquencies and foreclosure inventory on a national level, as reported by CoreLogic in its AugustJanuary and July 2015February 2016 National Foreclosure Reports:
| | | | | As of | | As of |
Number of Units (In thousands) | | August 2015 | | August 2014 | | February 2016 | | November 2015 | | February 2015 |
Seriously Delinquent Mortgages(1) | | 1,319 |
| | 1,664 |
| | 1,252 |
| | 1,283 |
| | 1,563 |
|
| Foreclosure Inventory | | 470 |
| | 629 |
| | 434 |
| | 463 |
| | 571 |
|
| |
| (1) | Seriously Delinquent Mortgages are ninety days and over in delinquency and include foreclosures and real estate owned, or "REO," property. |
As the above table indicates, both the number of seriously delinquent mortgages and the number of homes in foreclosure have declined significantly over the past year. This decline supports the thesis that as many homeowners have re-established equity in their homes through recovering real estate prices, they have become less likely to become delinquent and default on their mortgages.
Monthly housing starts provide another indicator of market fundamentals. The following table shows the trailing three-month average housing starts for the periods referenced:
| | | | | September 2015 | | June 2015 | | March 2016 | | December 2015 |
Single-family(1) | | 746 |
| | 706 |
| | 792 |
| | 757 |
|
Multi-family(1) | | 408 |
| | 437 |
| | 327 |
| | 367 |
|
(1) Shown in thousands of units:
| |
| (1) | Shown in thousands of units. |
Source: U.S. Census Bureau
As of September 2015,March 2016, average single-family housing starts during the trailing three months rose 5.7%increased by 4.6% as compared to JuneDecember 2015, while multi-family housing starts decreased by approximately 6.6%10.9% during the same period. Overall, privately-owned housing starts in September 2015March 2016 came in at a seasonally adjusted annual rate of 1,206,0001,089,000 units, 17.5%14.2% higher than the September 2014March 2015 rate of 1,026,000 units,954,000 units.
Early 2016 showed a continuation of the trend of mid-single-digit home price appreciation seen in 2014 and marking the first month since October 2007 that this rate surpassed 1.2 million units.
2015. Data released by S&P Indices for its S&P/Case-Shiller Home Price Indices for August 2015February 2016 showed that, on average, home prices had increased from May 2015 by 1.9%posted a 0.7% month-over-month increase for its 20-City Composite and by 1.8%had increased 0.6% month-over-month for its 10-City Composite. Home price appreciation has been relatively modest in 2014 and 2015, following strong appreciation in 2013.Composite, after seasonal adjustments. According to the report, home prices remain below the peak levels of 2006, but, on average, are back to their February 2005 and March 2005winter 2007 levels for the 10- and 20-City Composites, respectively. Finally, as indicated in the table above, as of August 2015,February 2016, the national inventory of foreclosed homes fell to 470,000434,000 units, a 25.2%24.0% decline when compared to August 2014;February 2015; this represented the forty-sixth
fifty-second consecutive month with a year-over-year decline and the lowest level since November 2007. As a result, there are many fewer unsold foreclosed homes overhanging the housing market than there were a year ago. We believe that near-term home price trends are more likely to be driven by fundamental factors such as economic growth, mortgage rates, and affordability, rather than by technical factors such as shadow inventory. Shadow inventory represents the number of properties that are seriously delinquent, in foreclosure, or held as REO by mortgage servicers, but not currently listed on a multiple listing service.
On October 2, 2015,April 1, 2016, the U.S. Bureau of Labor Statistics, or "BLS," reported that, in September 2015,March 2016, the U.S. unemployment rate was 5.1%, falling from 5.3% in June 2015.5.0%. Another, perhaps more relevant, measure of labor market conditions is employment growth, which slowed in August and September afterhas been relatively robust growth in the second quarter.recent months. The BLS reported that non-farm payrolls rose by 136,000 during August and by 142,000 during September. Thus far215,000 in 2015, job growth has averaged 198,000 jobs per month, while 2014 averaged 260,000 jobs per month.March 2016. While it is difficult to quantify the relationship between employment data and the housing and mortgage markets, we believe that current levels of unemployment and job creation are generally supportive of the housing market. While the housing market is also currently supported by low mortgage rates, it faces a number of potential headwinds. These include high interest rate volatility, the constraining effects of still-tight credit standards on both housing starts and new loan originations, and the uneven pace of the recovery of the U.S. economy.
Prepayment Rate Trends
Prepayment rates fell slightlyspiked during the thirdfirst quarter of 2015 as compared to the second quarter,2016, driven primarily driven by a seasonal decline in housing turnover despite lowerfalling mortgage rates. The Mortgage Bankers Association’s Refinance Index, which measures refinancing application volumes, reached a one-year high on February 12, 2016, after being relatively muted levelfor most of 2015. Because of the time that it takes for a refinancing application to result in an actual prepayment, prepayment rates did not increase dramatically until March, as reported in early April. Nevertheless, prepayment rates still remain well below previous peak levels. Factors that continue to inhibit prepayment activity as interest rates broadly declined in recent years has in large part been the result of:include: (i) home price declines during the financial crisis, which has left some borrowers with minimal or negative home equity; (ii) more
restrictive underwriting guidelines, even for refinancings; and (iii) increased origination costs, especially related to underwriting and compliance. These factors have resulted in substantial variations in prepayment rates between Agency pools as a function of loan-to-value, or "LTV," ratio, loan balance, credit score, geography, property type, loan purpose, and other factors. In recognition of the importance of these underlying characteristics on prepayment behavior, the MBS market continues to promote the creation of "specified" Agency pools that emphasize or de-emphasize many of these characteristics, such as pools where the principal balance of every underlying mortgage loan is below $85,000. The Making Homes Affordable, or "MHA," refinancing program, which was initiated in response to the housing market crisis, has facilitated the origination of many of these kinds of specified Agency pools. The extension of the MHA refinancing program into 2015 should sustain creation of such pools in the coming years. We expect that the ongoing origination of Agency pools with a wide variety of loan characteristics will continue to create opportunities for us to exploit the resulting differences in prepayments.
The Freddie Mac survey 30-year fixed mortgage rate ended the third quarter at 3.85%, a 23-basis point decrease since the end of the second quarter. While the Refinance Index published by the Mortgage Bankers Association, or "MBA," rose steadily throughout most of the third quarter, it spiked 24% week-over-week for the week ended October 2, 2015 on account of the impending mortgage disclosure rule change known as the "TRID rule" (see below, "GSE/Government Agency Developments"). The spike was only temporary, as the following week the Refinance Index reverted back close to its previous level. Similarly, the MBA's Market Composite Index, a measure of mortgage application volume, also rose steadily during most of the third quarter, and experienced a comparable temporary jump at quarter-end. Existing home sales for the third quarter were 5.5 million units on a seasonally adjusted annualized basis, a 3.8% increase from the second quarter. By the end of the third quarter, monthly home sales had risen year-over-year for twelve consecutive months, and were 8.8% higher than a year earlier.
While refinancing activity overall has been relatively slowslower in recent periods as comparedrelative to earlier periods when mortgage rates were at comparable levels, recent trends suggest an ongoing divergence between the refinancing behavior of lower balance loans and higher balance loans. As illustrated in the figure below, the average loan size of refinance applications has increased over the past twothree years, with a 38.1%35.3% increase from SeptemberMarch 2013 through September 2015.March 2016. This steady increase in average loan sizes of mortgage refinances is reflective of a number of changes related to borrower behavior and mortgage credit availability in recent years.
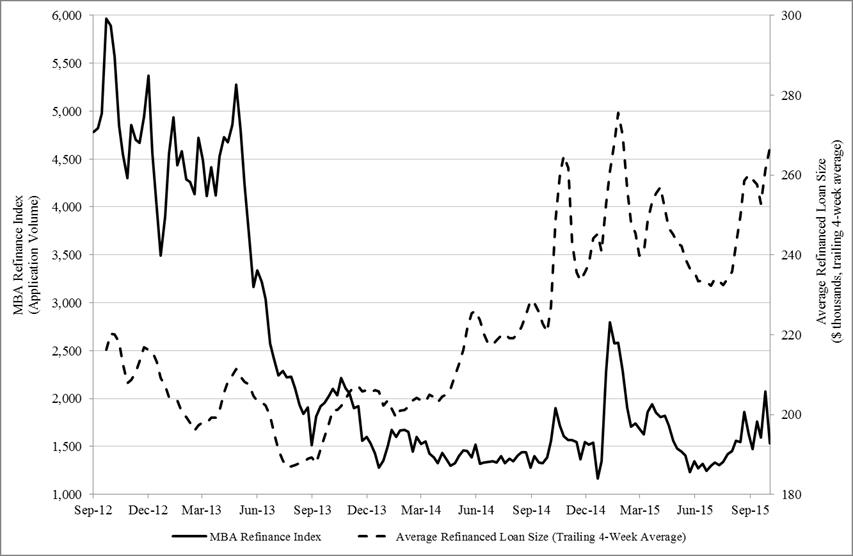
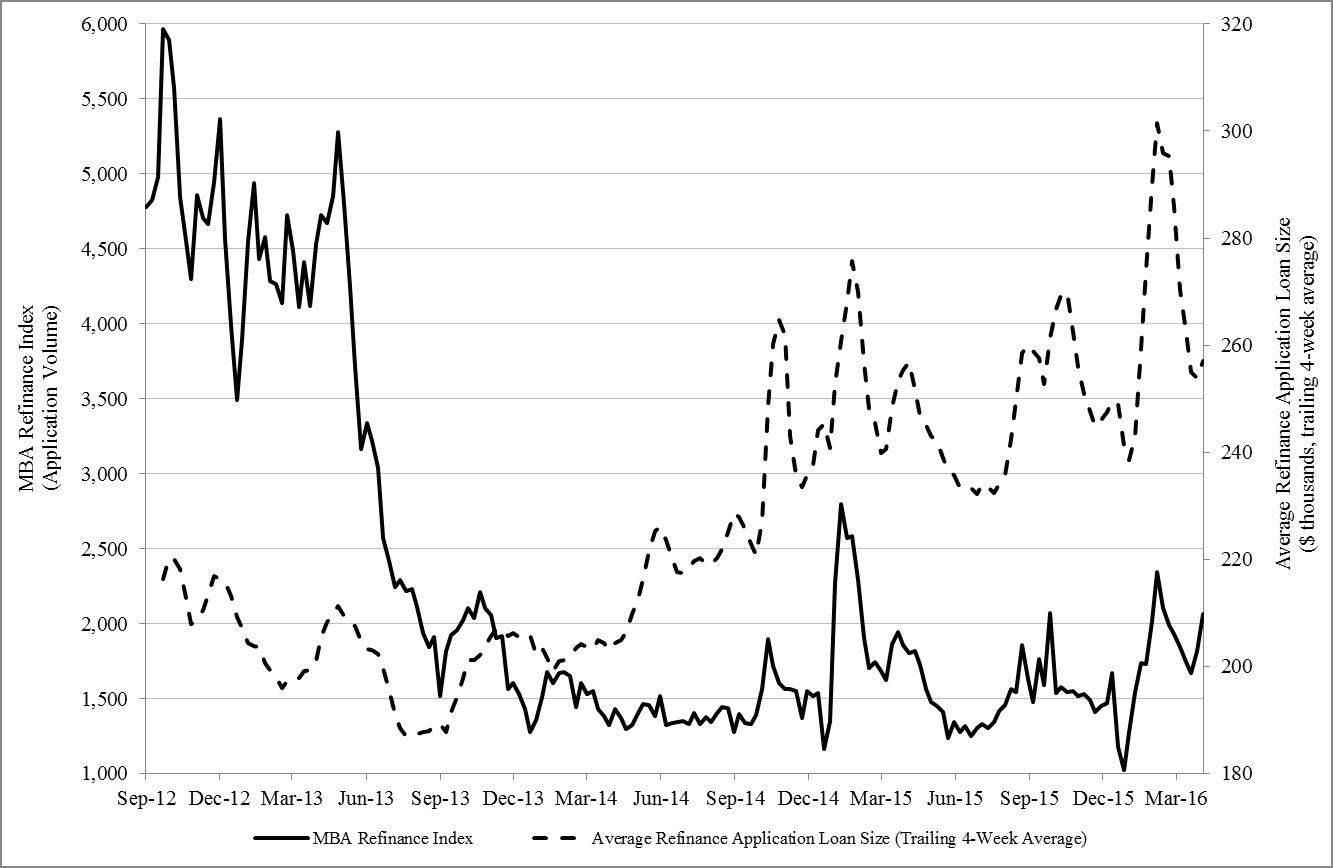
As shown in the figure above, higher loan balance borrowers tend to be more reactive to refinancing incentives, especially following steep declines in rates over a short period. After swift declinesdrops in mortgage rates in October 2014, January 2015, and March 2015, and the first six weeks of 2016, the average refinanced loan size spiked, reflecting a surge in higher loan balance borrowers reacting to the recent decline in mortgage rates. This greater prepayment sensitivity for higher loan size borrowers is well established, and is due in part to greater awareness among such borrowers about refinancing opportunities, as well as greater absolute dollar incentives to refinance relative to lower loan size borrowers.
Moreover, while overall mortgage credit availability continues to increase from the depressed levels that followed the financial crisis, credit availability for higher loan size borrowers has been particularly improving recently. In the past two years, a number of the largest lenders, including Bank of America, JP Morgan, Wells Fargo, and PNC Bank, have noticeably loosened lending standards for jumbo mortgage loans typically sought by more affluent borrowers, including lowering minimum FICO requirements and raising maximum LTVs. Affluent borrowers have also generally experienced greater improvements in their creditworthiness, thanks to rising asset prices and a strong rebound in high-end home prices, especially in wealthier cities such as New York and San Francisco. Jumbo mortgage loans have been a rare bright spot for the non-Agency mortgage origination sector in recent years, and for good reason given the excellent credit performance of jumbo mortgage loans originated since the financial crisis. Many banks are also competing more vigorously for affluent customers, in an effort to cross-sell other financial products such as investment and brokerage services. This competition has resulted in a narrowing of the spread between jumbo mortgage rates and conforming mortgage rates, further increasing the relative refinancing incentive for jumbo mortgage loans.
GSE/Government Agency Developments
On September 1, 2015,In addition, since the changes to guarantee fees, or "g-fees," that the FHFA announced on April 17, 2015 went into effect. In April, the FHFA had announced that it would not change the general level of g-fees on new Fannie Mae and Freddie Mac originations, but that it would make certain minor and targeted fee adjustments,financial crisis, financial reforms, including removing the 25 basis point
adverse market charge established in 2008, and applying small, targeted fee increases to a subset of Fannie Mae and Freddie Mac loans. G-fees are the fees charged by the GSEs to include mortgage loans in Agency pools, and thereby insure the mortgage loans against loss. Since these fees are passed on to borrowers whose loans are originated for inclusion in Agency pools, increased g-fees have the effect of reducing housing affordability for GSE borrowers, but potentially make it more attractive for private lenders to compete with the GSEs.
The FHFA continues to work with Fannie Mae and Freddie Mac to build a Common Securitization Platform, or "CSP," to be utilized by both agencies, which the FHFA believes will improve the liquidity of GSE securities and housing finance markets more broadly. On September 15, 2015, the FHFA released an update regarding details of the organization, structure, and timing of implementation of the CSP, which will occur in two phases. These phases will likely be implemented gradually over the next few years.
On October 3, 2015, the TILA-RESPA Integrated Disclosure, or "TRID," rule, issued by the Consumer Financial Protection Bureau, or "CFPB," went into effect for most residential real estate transactions. The TRID rule was developed at the direction of the Dodd-Frank Wall Street Reform and Consumer Protection Act, or "Dodd-Frank Act.Act," It integrates severaland qualified mortgage, loan disclosures into two new forms, a Loan Estimate formor "QM," mortgage guidelines, have dramatically increased the costs of underwriting, especially for niche products such as second lien and a Closing Disclosure form,adjustable rate mortgages. Banks have reduced their footprint in an attempt to simplify the mortgage application processlending space as the scars of the financial crisis and higher capital requirements have increased the costs of doing business. More recently, market share has been gravitating to helpnon-bank lenders, which do not face the same regulatory capital requirements as banks for servicing mortgages, and which possess superior technology to better assist borrowers better understand theirin making more efficient refinancing decisions.
One of these companies, Quicken Loans Inc., or "Quicken," has become a leader in efficient mortgage terms.origination in recent years. As shown in the figure below, prepayment speeds on Quicken loans are among the fastest in the industry. As improved technology spreads throughout the lending industry, we believe that the lending industry will change in a number of important ways. First, more efficient mortgage origination should mean that some cost savings will be passed on to borrowers. Smaller balance loans, which are disproportionately used by lower income borrowers, should benefit the most from a reduction in the fixed components of origination costs. Second, borrowers should start to prepay more efficiently, as demonstrated by the higher prepay speeds of mortgage loans serviced by Quicken, which reportedly uses proprietary algorithms to target borrowers who are more likely to refinance, and is particularly quick at contacting borrowers about refinancing incentives when mortgage rates drop enough to make refinancing potentially attractive. A technology-driven, broad-based increase in prepayment efficiency may put pressure on MBS prices and/or reduce the excess spread enjoyed by MBS investors. In the figure below, we show the 3-month constant prepayment rate, or "CPR," for Freddie Mac 30-year fixed rate mortgages with original loan balances between $200,000 and $400,000, loan ages between 12 and 47 months, and with interest rates that are 50–100 basis points above then current market rates.

GSE/Government Agency Developments
On October 7,December 17, 2015, the FHFA released its 2016 Scorecard for Fannie Mae, Freddie Mac, and Common Securitization Solutions, or the "2016 Scorecard." The 2016 Scorecard built on the strategic objectives and priorities outlined in the FHFA's 2014 and 2015 scorecards. It highlighted a number of important goals, including changing the appraisal framework to use third party sources for property valuation in order to reduce representation and warranty risks, as well as implementing a refinancing program aimed at high LTV borrowers in January 2017 to replace the directionHome Affordable Refinance Program, which expires in December 2016. In addition, the 2016 Scorecard called for full implementation of the FHFA,Common Securitization Platform, or "CSP," by 2018. The CSP is to be utilized by both Fannie Mae and Freddie Mac released their selling representationto improve the liquidity of GSE securities and warranty framework for origination defects and remedies, orhousing markets more broadly.
On April 14, 2016, the "remedies framework,"FHFA announced its Principal Reduction Modification program, offering one-time principal reductions to certain seriously delinquent, underwater borrowers in an effortorder to clarify rules relating to mortgage repurchases and to enable lenders to manage risk more effectively. This framework gives more clarity to lendershelp them avoid foreclosure on their rightshomes. The program applies to borrowers whose loans are owned or guaranteed by Fannie Mae or Freddie Mac, and responsibilities when sellingwho meet specific eligibility criteria, such as borrowers who are 90 or securitizing loansmore days delinquent as of March 1, 2016, with outstanding principal balances of no more than $250,000, and whose mark-to-market LTV ratios are greater than 115%. As there are estimated to or withbe only about 33,000 borrowers eligible for this program, it should have only a minor impact on the GSEs, specificallyoverall prepayment environment. However, the announcement does underline the continued risk from sudden changes in regards to identifying and correcting origination defects, as well as repurchase alternatives. The framework will apply to whole loans purchased and mortgage loans delivered into mortgage-backed securities on or after January 1, 2016.government policy.
To date, no definitive legislation has been enacted with respect to a possible unwinding of the GSEs or a material reduction in their roles in the U.S. mortgage market. There have been several proposals offered by members of Congress, including the Corker-Warner bill introduced in June 2013, the Johnson-Crapo bill introduced in March 2014, the Partnership to Strengthen Homeownership Act introduced in July 2014, and a Senate draft bill introduced in May 2015 by Senator Richard Shelby that pushes for increased credit risk transfers to private investors. To date, the GSEs have engaged predominantly in "second-loss" risk sharing transactions, where the GSEs bear losses on their mortgage pools up to a capped amount first, before private investors bear any losses. Furthermore, these risk sharing transactions to date have generally been "back-end" transactions, where the GSE seeks to offload its risk only after it has actually issued guarantees on a defined pool of mortgages. Under the Shelby bill, not only would the GSEs be required to engage in significant and increasing levels of risk sharing transactions generally, but for the first time the GSEs would be required to engage both in "first-loss" risk sharing transactions and in "front-end" risk sharing transactions. Many of these proposed bills could potentially increase private capital flows to the mortgage sector while reducing taxpayer risk. Though it appears unlikely that any of these bills will be passed in their current form, features may be incorporated into future proposals.
Portfolio Overview and Outlook
General Market Overview
Volatility was extremely high during the first quarter. In the first half of the quarter, credit-related fears stemming from depressed energy prices deepened, and caused a flight to quality that spilled over to many other sectors. The equity market sell-off in the early part of the quarter was one of the worst starts to a year on record, led by a severe sell-off in the Chinese stock market. The S&P 500 fell 9% year-to-date through January 20th, while the Shanghai Stock Exchange Composite Index plunged 25% year-to-date through January 28th. Credit spreads widened dramatically across most credit-sensitive fixed income sectors, including new issue CMBS, newer vintage CLOs, and high-yield corporate bonds, especially sectors with direct or indirect exposure to energy prices.
Towards the middle of the quarter, energy prices stabilized, and what seemed to begin as a relief rally in the equity and credit-sensitive markets turned into an outright whipsaw. Market participants became emboldened to add risk as they increasingly became convinced that, in light of the steep market declines and renewed concerns of a global economic slowdown, the Federal Reserve would significantly delay the interest rate hikes that it had previously signaled. On March 16th, the predictions of a dovish Federal Reserve reaction to the turbulent market conditions were confirmed, as Federal Reserve officials both refrained from raising rates and scaled back their predictions of interest rate hikes over the remainder of the year. The late February and March rally in most energy markets, equity markets, and credit-sensitive fixed income markets was strong, with many markets not only retracing their declines from earlier in the quarter, but ending the quarter at higher levels than where they had begun.
The turnaround during the first quarter was also significantly fueled by continued aggressive monetary easing by several foreign central banks. On January 29th, the Bank of Japan lowered its rate of interest on excess reserves from 0.1% to (0.1)%. On March 10th, the European Central Bank, or "ECB," announced in a surprise move that it would lower its benchmark rate to zero, and that it would increase the pace of its monthly bond purchases in its quantitative easing program, from €60 billion a month to €80 billion a month. The ECB also announced that it would begin buying investment-grade, euro-denominated corporate bonds to help combat weak growth and deflation; this raised expectations of a liquidity squeeze and much tighter yield spreads in the European corporate bond markets.
Interest rates fell sharply in the first half of the quarter in response to the flight to quality, but only rebounded slightly for the remainder of the quarter in light of the dovish signals and actions by central banks. Over the course of the entire quarter, the 10-year U.S. Treasury yield fell 50 basis points to end at 1.77%, and the 2-year U.S. Treasury yield fell 33 basis points to end at 0.72%. The average rate for a fixed rate 30-year conventional mortgage also decreased over the course of the first quarter, falling 30 basis points to end the quarter at 3.71%.
Agency
As of September 30, 2015,March 31, 2016, the value of our long Agency bond portfolio was $1.252$1.146 billion, as compared to $1.305$1.211 billion as of June 30,December 31, 2015.
Our Agency RMBS portfolio is principally comprised of "specified pools." Specified pools are fixed rate Agency pools with special characteristics, such as pools comprised of low loan balance mortgages, pools comprised of mortgages backed by investor properties, pools containing mortgages originated through the government-sponsored "Making Homes Affordable"MHA refinancing programs, and pools containing mortgages with various other characteristics. During the year, our Agency RMBS purchasing activity continued to focus primarily on specified pools, especially those with higher coupons.
Market volatility and uncertainty aroundYield spreads on Agency RMBS widened during the direction offirst quarter, as the declines in yields on Agency RMBS could not keep pace with the declines in yields on either interest rates continued in the third quarter. Slowing growth in the Chinese economy and weakening fundamentals in many emerging market economiesrate swaps or U.S. Treasury securities. The 10-year interest rate swap spread fears of slower global growth, leadingbecame more negative, tightening 5 basis points to a steep decline in long-term U.S. interest rates, a broad sell-off in global equity markets, and a significant widening in global credit spreads. Over the course ofend the quarter financial markets were grappling with conflicting forces: on the one hand a global economy that was slowing, and on the other hand a U.S. economy that appeared strong enough for the Federal Reserve to begin tightening monetary policy in September. Despite concerns over Federal Reserve tightening, long-term U.S. interest rates declined sharply and the yield curve flattened as investors sought the safe haven of U.S. Treasury securities, and this trend continued when the Federal Reserve chose not to raise the target federal funds rate in September. The 10-year U.S. Treasury yield ended the third quarter sharply lower at 2.04% as compared to 2.35% at the end of the second quarter, a drop of
31-13 basis points, while the 2-year U.S. Treasury yield dropped only 1 basis point, from 0.64% to 0.63% over the course of the quarter. Interest rate swap rates decreased even more than U.S. Treasury yields, with 2-year and 10-year swap rates falling 16 basis points and 46 basis points, respectively, over the course of the quarter.points. Since the majority of our interest rate hedges were in the formhedging portfolio is comprised of interest rate swaps, this further contributed tonegatively impacted our third quarter mark-to-market losses. The average rateresults for a fixed rate 30-year conventional mortgage also decreased over the course of the third quarter, falling 0.23% to 3.85% as of September 30, 2015.
Yield spreads on Agency RMBS widened in the third quarter, especially in the latter part of the quarter. While Agency RMBS are not generally considered to have credit risk, their yield spreads nevertheless widenedpay-ups on specified pools did increase as prepayment protection became more valuable in the third quarter in sympathy with many credit-sensitive sectors, including corporate bonds and CMBS. Typically, the principal factor that drives the underperformancelight of Agency RMBS relative tolower interest rate swaps and U.S. Treasury securities is an actual or market anticipatedrates, the increase in prepayments. While prepayments did increase slightly duringpay-ups was not enough to compensate for the third quarter, they remain low relative to the absolute leveleffects of mortgage rates. Thus the yield spread widening of Agency RMBS was considered more technical in nature, as opposed to reflecting fundamental underperformance.widening.
Interest rate swap spreads also exhibited an unusually high level of volatility during the quarter, with the 10-year swap spread to U.S Treasury securities actually becoming negative for the first time since 2010. These swap spread movements exacerbated the widening in yield spreads between Agency RMBS and interest rate swaps, which was the primary cause of the substantial underperformance of our Agency RMBS portfolio relative to our swap hedges during the third quarter. Specifically, for the quarter ended September 30, 2015,March 31, 2016, we had total net realized and unrealized gains of $5.5$13.7 million, or $0.60$1.50 per share, on our aggregate Agency RMBS portfolio, while we had total net realized and unrealized losses of $18.7$20.4 million, or $2.04$2.24 per share, on our interest rate hedging portfolio.
Notwithstanding the general underperformance of Agency RMBS relative to interest rate swaps during the third quarter, specified Agency pools performed well relative to their generic pool counterparts, as their inherent prepayment protection characteristics increased their attractiveness in light of falling interest rates and the heightened possibility of future prepayment increases.portfolio, including U.S. Treasury securities. Over the course of the first quarter, average pay-ups on our specified pools increased to 0.99%0.88% as of September 30, 2015March 31, 2016, from 0.81%0.73% as of June 30,December 31, 2015. Pay-ups are price premiums for specified pools relative to their TBA counterparts.
OverDuring the course of the thirdfirst quarter, TBA roll prices weakened. Because we generally carry a netcontinued to use short positionpositions in TBAs to hedge interest rate risk, and these positions generated net losses. However, TBAs underperformed specified pools during the quarter, and because we hold a net short
position in TBAs, this weakening augmentedunderperformance benefited our results for the performance of our Agency strategy.quarter. We actively traded our Agency RMBS portfolio during the third quarter in order to take advantage of volatility and to harvest modest gains. Our portfolio turnover for the quarter was 27%48% (as measured by sales and excluding paydowns), and we captured net realized gains of $0.6$4.0 million, excluding hedges.
During the thirdfirst quarter, we continued to focus our Agency RMBS purchasing activity primarily on specified pools, especially those with higher coupons. As of September 30, 2015,March 31, 2016, the weighted average coupon on our fixed rate specified pools remained at 3.97%was 4.0%, essentially unchanged from its level at June 30,December 31, 2015. We also continued to be active in theslightly increased our holdings of reverse mortgage pool sector,pools following their significant yield spread widening at the end of 2015. Yield spreads for reverse mortgage pools subsequently tightened somewhat toward the end of the first quarter, and we addedbelieve there is potential for additional meaningful yield spread tightening in this sector as recently enacted regulatory changes, designed to our holdings duringprotect reverse mortgage borrowers, could have the quarter, as their yield spreads increased in sympathy with thoseeffect of the broader market.reducing prepayment speeds. Our Agency RMBS portfolio also continues to include a small allocation to Agency ARMs and Agency IOs. Notwithstanding the recent declines in interest rates, weWe believe that there remains a heightened risk of substantial interest rate and prepayment volatility in the near term, thus reinforcing the importance of our ability to hedge our risksAgency RMBS portfolio using a variety of tools, including TBAs.
We expect to continue to target specified pools that, taking into account their particular composition and based on our prepayment projections: (1) should generate attractive yields relative to other Agency RMBS and U.S. Treasury securities, (2) should have less prepayment sensitivity to government policy shocks, and/or (3) should create opportunities for trading gains once the market recognizes their value, which for newer pools may come only after several months, when actual prepayment experience can be observed. We believe that our research team, our proprietary prepayment models, and our extensive databases remain essential tools in our implementation of this strategy.
The following table summarizes prepayment rates for our portfolio of fixed rate specified pools (excluding those backed by reverse mortgages) for the three month periods ended March 31, 2016 and December 31, 2015.
|
| | | | | | |
| | | Three Month Period Ended |
| | | March 31, 2016 | | December 31, 2015(2) |
Three Month Constant Prepayment Rates(1) | | 7.1 | % | | 6.5 | % |
| |
| (1) | Excludes Agency fixed rate RMBS without any prepayment history. |
| |
| (2) | Prior period calculation methodology has been conformed to current period calculation methodology. |
The following table provides details about the composition of our portfolio of fixed rate specified pools (excluding those backed by reverse mortgages) as of March 31, 2016 and December 31, 2015.
|
| | | | | | | | | | | | | | | | | | | | | | | | | |
| | | | | March 31, 2016 | | December 31, 2015 |
| | | Coupon | | Current Principal | | Fair Value | | Weighted
Average Loan
Age (Months) | | Current Principal | | Fair Value | | Weighted Average Loan Age (Months) |
| Fixed rate Agency RMBS: | | | | (In thousands) | | | | (In thousands) | | |
| 15-year fixed rate mortgages: | | | | | | | | | | | | | | |
| | | 3.00 |
| | $ | 28,659 |
| | $ | 30,030 |
| | 24 |
| | $ | 49,894 |
| | $ | 51,566 |
| | 24 |
|
| | | 3.50 |
| | 105,206 |
| | 111,897 |
| | 13 |
| | 102,118 |
| | 107,442 |
| | 13 |
|
| | | 4.00 |
| | 9,840 |
| | 10,609 |
| | 24 |
| | 10,534 |
| | 11,253 |
| | 21 |
|
| Total 15-year fixed rate mortgages | | | | 143,705 |
| | 152,536 |
| | 16 |
| | 162,546 |
| | 170,261 |
| | 17 |
|
| 20-year fixed rate mortgages | | 4.00 |
| | 17,991 |
| | 19,488 |
| | 16 |
| | 18,477 |
| | 19,830 |
| | 13 |
|
| 30-year fixed rate mortgages: | | | | | | | | | | | | | | |
| | | 3.00 |
| | 23,908 |
| | 24,589 |
| | 33 |
| | 29,515 |
| | 29,571 |
| | 36 |
|
| | | 3.50 |
| | 144,233 |
| | 152,372 |
| | 19 |
| | 137,826 |
| | 142,821 |
| | 22 |
|
| | | 4.00 |
| | 326,612 |
| | 352,007 |
| | 13 |
| | 343,776 |
| | 365,952 |
| | 15 |
|
| | | 4.50 |
| | 231,983 |
| | 254,873 |
| | 14 |
| | 266,547 |
| | 290,517 |
| | 14 |
|
| | | 5.00 |
| | 58,171 |
| | 64,838 |
| | 26 |
| | 61,541 |
| | 68,208 |
| | 23 |
|
| | | 5.50 |
| | 2,177 |
| | 2,444 |
| | 110 |
| | 2,261 |
| | 2,524 |
| | 107 |
|
| | | 6.00 |
| | 1,051 |
| | 1,203 |
| | 114 |
| | 1,058 |
| | 1,201 |
| | 111 |
|
| Total 30-year fixed rate mortgages | | | | 788,135 |
| | 852,326 |
| | 16 |
| | 842,524 |
| | 900,794 |
| | 18 |
|
| Total fixed rate Agency RMBS | | | | $ | 949,831 |
| | $ | 1,024,350 |
| | 13 |
| | $ | 1,023,547 |
| | $ | 1,090,885 |
| | 18 |
|
Our net Agency premium as a percentage of our long Agency RMBS holdings is one metric that we use to measure our overall prepayment risk. Net Agency premium represents the total premium (excess of market value over outstanding principal balance) on long Agency RMBS holdings less the total premium on related net short TBA positions. The lower our net Agency premium, the less we believe we are exposed to market-wide increases in Agency RMBS prepayments. As of September 30, 2015,March 31, 2016, our net Agency premium as a percentage of fair value on long Agency RMBS holdings was approximately 4.8%5.6% as compared to 3.8%4.1%, as of June 30,December 31, 2015. Excluding TBA positions used to hedge our long Agency RMBS portfolio, our Agency premium as a percentage of fair value was approximately 7.0%7.3% and 6.4%6.2% as of September 30, 2015March 31, 2016 and June 30,December 31, 2015, respectively. These percentages may fluctuate from period to period based on market factors, including interest rates and mortgage rates, as well as with respect to the net percentages, the degree to which we hedge prepayment risk with short TBAs.
We believe that our focus on purchasing pools with specific prepayment characteristics provides a measure of protection against prepayments.
In the aftermath of the significant third quarter yield spread widening, and with prepayments remaining relatively muted despite continued low levels of mortgage rates, weWe believe that Agency RMBS currently offer very attractive netwith the drop in interest marginsrates, prepayment concerns should continue to benefit the relative performance of specified pools, and overall relative value.could create opportunities in the IO markets. We believe that our adaptive and active style of portfolio management is well suited to the current MBS market environment, which continues to be shaped by shifting central bank policies, regulatory changes, and developing technologies.
Non-Agency
As of September 30, 2015,March 31, 2016, the value of our long non-Agency portfolio was $28.9$27.6 million, as compared to $30.3$31.4 million as of June 30, 2015, representingDecember 31, 2015.
The non-Agency RMBS market followed a decreasesimilar path to that of 4.6%.
Relative to certainmost other credit-sensitive fixed income sectors, in that yield spreads widened significantly in the early part of the fixed income marketquarter, and then abruptly reversed course and tightened significantly in the latter part of the quarter; however non-Agency RMBS yield spreads ended the quarter noticeably wider than
where they had begun. Nevertheless, the non-Agency RMBS sector performed better over the course of the quarter in comparison to many other structured product sectors, such as new issue CMBS, and high-yield corporate credit,in large part because the fundamentals underlying non-Agency RMBS, performed well duringled by a stable housing market, continue to be strong. During the third quarter. Yield spread widening forquarter, our non-Agency RMBS was relatively contained, asgenerated a positive return. Included in the quarter's return were strong housing fundamentals continued to support the sector. We did not actively add tocarry and appreciation from our held positions. On a quarter-over-quarter basis, our non-Agency RMBS portfolio during the third quarter as we believe that given the heightened level of overall market volatility, more attractive entry points may emerge over the near to medium term. As of September 30, 2015, our investmentdeclined in non-Agency RMBS was $28.9 million as compared to $30.3 million as of June 30, 2015.size slightly.
Financing
DuringOver the thirdcourse of the first quarter our cost of repo financing increased slightly.increased. Our weighted average borrowing rate for the three monthsquarter ended September 30, 2015March 31, 2016 increased fourtwelve basis points to 0.43%. Repo borrowing rates were generally slightly higher0.62% from 0.50% for most of the third quarter. However, following the September decision by the Federal Reserve not to raise the target federal funds rate, we saw a decline in the cost of repo borrowing, and this has persisted intoquarter ended December 31, 2015. During the early part of the fourth quarter. As of September 30, 2015,first quarter, repo borrowing rates generally trended higher across maturities. While the weighted average remaining term of our outstanding repo decreased to 48 days, down from 90 days as of June 30, 2015. At the end of each year, many lending banks trim theirmarket has remained liquid, widening asset spreads and constrained lender balance sheets have put upward pressure on the cost of repo. Also likely adding upward pressure to repo rates was the FHFA's decision to proceed with its ban of captive insurance company memberships in the face of capital constraints and in anticipation of issuing their year-end financial statements, and as a result financing that extends over year end tends to carry a higher interest spread premium. Towards the end of the third quarter,Federal Home Loan Bank System, or "FHLB," forcing many of the opportunities that we were seeingcurrent member companies to lock in financing past year end were, we believed, unattractive, evenfind alternative financing. However, in the contextlatter part of our expectations for year-end funding premiums. As a result, we intentionally shortened somethe first quarter, and following the Federal Reserve's toned down stance on its likely pace of ourfuture interest rate increases, repo maturities to avoid funding past year-end, on the belief that in the fourth quarter we would see more attractive opportunities to lock in our year-end funding. Under Dodd-Frank, bank capital treatment of repo transactions has become more onerous, thereby making it less attractive for banks to provide repo financing.rates declined slightly. While large banks still dominate the repo market, non-bank firms, not subject to the same regulations as large banks, are becoming more active in providing repo financing. The vast majority of our outstanding repo financing is still provided by larger banks and dealers; however, in limited amounts, we have also entered into repo agreements with smaller non-bank dealers. In general, we continue to see strong appetite and competitive terms from both types of lenders.
Our debt-to-equity ratio decreased to 8.1:1 as of March 31, 2016, as compared to 8.4:1 as of December 31, 2015. Adjusted for unsettled security purchases and sales, our debt-to-equity ratio was 7.7:1 as of March 31, 2016 as compared to 8.1:1 as of December 31, 2015. Our leverage ratio may fluctuate period over period based on portfolio management decisions, market conditions, and the timing of security purchase and sale transactions.
Critical Accounting Policies
Our consolidated financial statements have been prepared in conformity with generally accepted accounting principles in the United States of America, or "U.S. GAAP." Entities in which we have a controlling financial interest, through ownership of the majority of the entities' voting equity interests, or through other contractual right that give us control, are consolidated by us. All inter-company balances and transactions have been eliminated.
Certain of our critical accounting policies require management to make estimates and assumptions that affect the reported amounts of assets and liabilities at the date of the consolidated financial statements and the reported amounts of revenues and expenses during the reporting period. Actual results could differ from those estimates. We believe that all of the decisions and assessments upon which our consolidated financial statements are based were reasonable at the time made based upon information available to us at that time. We rely on our Manager and Ellington's experience and analysis of historical and current market data in order to arrive at what we believe to be reasonable estimates. See Note 2 of the notes to theour consolidated financial statements included in this Quarterly Report on Form 10-Q for a complete discussion of our significant accounting policies. We have identified our most critical accounting policies to be the following:
Valuation: We apply ASC 820-10, Fair Value Measurement and Disclosures ("ASC 820-10"), to our holdings ofFor financial instruments. ASC 820-10 establishes a three-level valuation hierarchy for disclosureinstruments that are traded in an "active market," the best measure of fair value measurements. Theis the quoted market price. However, many of our financial instruments are not traded in an active market. Therefore, management generally uses third-party valuations when available. If third-party valuations are not available, management uses other valuation hierarchy is based upontechniques, such as the observabilitydiscounted cash flow methodology. Summary descriptions, for the various categories of inputs tofinancial instruments, of the valuation methodologies management uses in determining fair value of our financial instruments are detailed in Note 2 of the notes to our consolidated financial statements. Management utilizes such methodologies to assign a good faith fair value (the estimated price that, in an orderly transaction at the valuation date, would be received to sell an asset, or paid to transfer a liability, as of the measurement date. The three levels are defined as follows:
Level 1—inputscase may be) to the valuation methodology are observable and reflect quoted prices (unadjusted) for identical assets or liabilities in active markets. Currently, the types ofeach such financial instruments we generally include in this category are, exchange-traded derivatives, and cash equivalents,
Level 2—inputs to the valuation methodology other than quoted prices included in Level 1 are observable for the asset or liability, either directly or indirectly. Currently, the types of financial instruments that we generally include in this category are Agency RMBS, non-Agency RMBS determined to have sufficiently observable market data, U.S. Treasury securities, actively traded derivatives such as TBAs, interest rate swaps, and swaptions, and
Level 3—inputs to the valuation methodology are unobservable and significant to the fair value measurement. Currently, this category includes RMBS where there is less price transparency.instrument.
See the notes to our consolidated financial statements for more information on valuation.valuation techniques used by management in the valuation of our assets and liabilities.
Accounting for Mortgage-Backed Securities: Investments in mortgage-backed securities are recorded on trade date. We have chosen to make a fair value election pursuant to ASC 825-10, Financial Instruments, for our mortgage-backed securities portfolio. Electing the fair value option allows us to record changes in fair value in our Consolidated Statement of Operations, which, in our view, more appropriately reflects the results of our operations for a particular reporting period as all securities activities will be recorded in a similar manner. As such, the mortgage-backed securities are recorded at fair market value on our Consolidated Balance Sheet and the period change in fair value is recorded in current period earnings on our Consolidated Statement of Operations as a component of Change in net unrealized gains (losses) on mortgage-backed securities.
Realized gains or losses on sales of mortgage-backed securities are included in Net realized gains (losses) on mortgage-backed securities on the Consolidated Statement of Operations, and are recorded at the time of disposition. The cost of positions sold is calculated based on identified cost. Principal write-offs are generally treated as realized losses.
Interest Income: Coupon interest income on investment securities is accrued based on the outstanding principal balance and the current coupon rate on each security. We amortize purchase premiums and accrete purchase discounts on our fixed income investments.investments using the effective interest method.
Our accretion of discounts and amortization of premiums on securities for U.S. federal and other tax purposes is likely to differ from the accounting treatment under U.S. GAAP of these items as described above.
See the Note 2 of the notes to our consolidated financial statements for more information on amortization ofthe assumptions and methods that we use to amortize purchase premiums and accretion ofaccrete purchase discounts.
Income Taxes: We made an election to be taxed as a REIT for U.S. federal income tax purposes. As a REIT, we generally are not subject to corporate-level federal and state income tax on net income we distribute to our stockholders.shareholders. To qualify as a REIT, we must meet a number of organizational and operational requirements, including a requirement to distribute at least 90% of our taxable income to our stockholders.shareholders. Even if we qualify as a REIT, we may be subject to certain federal, state, local and foreign taxes on our income and property and to federal income and excise taxes on our undistributed taxable income. If the Company fails to qualify as a REIT, and does not qualify for certain statutory relief provisions, it will be subject to U.S. federal, state, and local income taxes and may be precluded from qualifying as a REIT for the four taxable years following the year in which the Company fails to qualify as a REIT.
We follow the authoritative guidance on accounting for and disclosure of uncertainty on tax positions, which requires management to determine whether a tax position is more likely than not to be sustained upon examination by the applicable taxing authority, including resolution of any related appeals of the litigation process, based on the technical merits of the position. For uncertain tax positions, the tax benefit to be recognized is measured as the largest amount of benefit that is greater than fifty percent50% likely of being realized upon ultimate settlement. The Company did not have any unrecognized tax benefits resulting from tax positions related to the current period or to 2015, 2014, 2013, or 2012 (its open tax years. In the normal course of business, we may be subject to examination by federal, state, local, and foreign jurisdictions, where applicable, for the current period, 2015, 2014, 2013 or 2012 (our open tax years). We may take positions with respect to certain tax issues which depend on legal interpretation of facts or applicable tax regulations. Should the relevant tax regulators successfully challenge any such positions; we might be found to have a tax liability that has not been recorded in the accompanying consolidated financial statements. Also, management's conclusions regarding the authoritative guidance may be subject to review and adjustment at a later date based on changing tax laws, regulations, and interpretations thereof. There were no amounts accrued for penalties or interest as of or during the periods presented in the consolidated financial statements included in this Quarterly Report on Form 10-Q.
"Emerging Growth Company" Status: On April 5, 2012, the Jumpstart Our Business Startups Act, or the "JOBS Act," was signed into law. The JOBS Act contains provisions that, among other things, reduce certain reporting requirements for qualifying public companies. Because we qualify as an "emerging growth company," we may, under Section 7(a)(2)(B) of the Securities Act of 1933, or "the Securities Act," delay adoption of new or revised accounting standards applicable to public companies until such standards would otherwise apply to private companies. We may take advantage of this extended transition period until the first to occur of the date that we (i) are no longer an "emerging growth company" or (ii) affirmatively and irrevocably opt out of this extended transition period. We have elected to take advantage of the benefits of this extended transition period. As a result, our financial statements may not be comparable to those of other public companies that comply with such new or revised accounting standards. Until the date that we are no longer an "emerging growth company" or
affirmatively and irrevocably opt out of the exemption provided by Securities Act Section 7(a)(2)(B), upon issuance of a new or revised accounting standard that applies to our financial statements and that has a different effective date for public and private companies, we will disclose the date on which adoption is required for non-emerging growth companies and the date on which we will adopt the recently issued accounting standard.
Recent Accounting Pronouncements
Refer to the notes to our consolidated financial statements for a description of relevant recent accounting pronouncements.
Financial Condition
Investment portfolio
The following tables summarize our mortgage-backed securities portfolio of as of September 30, 2015March 31, 2016 and December 31, 2014:
September 30, 2015:
| | | ($ in thousands) | | | | | | | Gross Unrealized | | | | Weighted Average | |
| | Current Principal | | Unamortized Premium (Discount) | | Amortized Cost | | Gains | | Losses | | Fair Value | | Coupon | | Yield | | Weighted Average Life(Years)(1) | March 31, 2016 | | December 31, 2015 |
| Agency RMBS: | | | | | | | | | | | | | | | | | | |
| (In thousands) | | Current Principal | | Fair Value | | Average Price(1) | | Cost | | Average Cost(1) | | Current Principal | | Fair Value | | Average Price(1) | | Cost | | Average Cost(1) |
Agency RMBS(2) | | | | | | | | | | | | | | | | | | | | |
| 15-year fixed rate mortgages | $ | 162,453 |
| | $ | 7,874 |
| | $ | 170,327 |
| | $ | 1,585 |
| | $ | (88 | ) | | $ | 171,824 |
| | 3.37% | | 2.28% | | 5.04 | $ | 143,705 |
| | $ | 152,536 |
| | $ | 106.15 |
| | $ | 150,945 |
| | $ | 105.04 |
| | $ | 162,546 |
| | $ | 170,261 |
| | $ | 104.75 |
| | $ | 170,385 |
| | $ | 104.82 |
|
| 20-year fixed rate mortgages | 9,094 |
| | 508 |
| | 9,602 |
| | 235 |
| | — |
| | 9,837 |
| | 4.00% | | 2.89% | | 5.97 | 17,991 |
| | 19,488 |
| | 108.32 |
| | 19,226 |
| | 106.86 |
| | 18,477 |
| | 19,830 |
| | 107.32 |
| | 19,754 |
| | 106.91 |
|
| 30-year fixed rate mortgages | 894,774 |
| | 55,922 |
| | 950,696 |
| | 15,628 |
| | (1,933 | ) | | 964,391 |
| | 4.08% | | 3.15% | | 7.94 | 788,135 |
| | 852,326 |
| | 108.14 |
| | 840,998 |
| | 106.71 |
| | 842,524 |
| | 900,794 |
| | 106.92 |
| | 896,356 |
| | 106.39 |
|
| Adjustable rate mortgages | 36,782 |
| | 2,415 |
| | 39,197 |
| | 96 |
| | (163 | ) | | 39,130 |
| | 4.12% | | 2.96% | | 5.64 | |
| ARMs | | 35,122 |
| | 37,133 |
| | 105.73 |
| | 37,232 |
| | 106.01 |
| | 36,433 |
| | 38,530 |
| | 105.76 |
| | 38,629 |
| | 106.03 |
|
| Reverse mortgages | 53,986 |
| | 5,697 |
| | 59,683 |
| | 276 |
| | (418 | ) | | 59,541 |
| | 4.75% | | 2.57% | | 6.11 | 70,867 |
| | 77,548 |
| | 109.43 |
| | 77,179 |
| | 108.91 |
| | 68,690 |
| | 73,692 |
| | 107.28 |
| | 75,205 |
| | 109.48 |
|
| Interest only securities | n/a | | n/a | | 8,229 |
| | 167 |
| | (1,122 | ) | | 7,274 |
| | 3.84% | | 4.81% | | 2.12 | |
| Total Agency RMBS | 1,157,089 |
| | 72,416 |
| | 1,237,734 |
| | 17,987 |
| | (3,724 | ) | | 1,251,997 |
| | 4.00% | | 3.01% | | 7.00 | 1,055,820 |
| | 1,139,031 |
| | 107.88 |
| | 1,125,580 |
| | 106.61 |
| | 1,128,670 |
| | 1,203,107 |
| | 106.60 |
| | 1,200,329 |
| | 106.35 |
|
| Non-Agency RMBS | 42,978 |
| | (15,187 | ) | | 27,791 |
| | 2,043 |
| | (939 | ) | | 28,895 |
| | 2.62% | | 8.43% | | 5.11 | 42,649 |
| | 27,631 |
| | 64.79 |
| | 26,175 |
| | 61.37 |
| | 48,408 |
| | 31,401 |
| | 64.87 |
| | 30,395 |
| | 62.79 |
|
| Total RMBS | $ | 1,200,067 |
| | $ | 57,229 |
| | $ | 1,265,525 |
| | $ | 20,030 |
| | $ | (4,663 | ) | | $ | 1,280,892 |
| | 3.95% | | 3.13% | | 6.93 | |
Total RMBS(2) | | 1,098,469 |
| | 1,166,662 |
| | 106.21 |
| | 1,151,755 |
| | 104.85 |
| | 1,177,078 |
| | 1,234,508 |
| | 104.88 |
| | 1,230,724 |
| | 104.56 |
|
| Agency IOs | | n/a | | 6,931 |
| | n/a | | 8,660 |
| | n/a | | n/a | | 7,758 |
| | n/a | | 8,491 |
| | n/a |
| Total mortgage-backed securities | | | | 1,173,593 |
| | | | 1,160,415 |
| | | | | | 1,242,266 |
| | | | 1,239,215 |
| | |
| U.S. Treasury securities sold short | | (68,781) | | (69,607 | ) | | 101.20 |
| | (68,669 | ) | | 99.84 |
| | (79,550) | | (78,447 | ) | | 98.61 |
| | (79,003 | ) | | 99.31 |
|
| Reverse repurchase agreements | | 69,575 | | 69,575 |
| | 100.00 |
| | 69,575 |
| | 100.00 |
| | 78,632 | | 78,632 |
| | 100.00 |
| | 78,632 |
| | 100.00 |
|
| Total | | | | $ | 1,173,561 |
| | | | $ | 1,161,321 |
| | | | | | $ | 1,242,451 |
| | | | $ | 1,238,844 |
| | |
December 31, 2014:
|
| | | | | | | | | | | | | | | | | | | | | | | | | | | | | |
| ($ in thousands) | | | | | | | Gross Unrealized | | | | Weighted Average |
| | Current Principal | | Unamortized Premium (Discount) | | Amortized Cost | | Gains | | Losses | | Fair Value | | Coupon | | Yield | | Weighted Average Life(Years)(1) |
| Agency RMBS: | | | | | | | | | | | | | | | | | |
| 15-year fixed rate mortgages | $ | 130,720 |
| | $ | 6,304 |
| | $ | 137,024 |
| | $ | 1,113 |
| | $ | (109 | ) | | $ | 138,028 |
| | 3.40% | | 2.46% | | 5.43 |
| 20-year fixed rate mortgages | 9,764 |
| | 577 |
| | 10,341 |
| | 227 |
| | — |
| | 10,568 |
| | 4.00% | | 3.04% | | 6.92 |
| 30-year fixed rate mortgages | 1,042,550 |
| | 61,089 |
| | 1,103,639 |
| | 20,379 |
| | (1,764 | ) | | 1,122,254 |
| | 4.09% | | 3.29% | | 8.48 |
| Adjustable rate mortgages | 41,710 |
| | 2,813 |
| | 44,523 |
| | 90 |
| | (330 | ) | | 44,283 |
| | 4.60% | | 3.08% | | 5.97 |
| Reverse mortgages | 31,412 |
| | 2,741 |
| | 34,153 |
| | 300 |
| | (28 | ) | | 34,425 |
| | 4.91% | | 2.56% | | 4.74 |
| Interest only securities | n/a | | n/a | | 10,780 |
| | 1,190 |
| | (726 | ) | | 11,244 |
| | 4.04% | | 11.82% | | 2.68 |
| Total Agency RMBS | 1,256,156 |
| | 73,524 |
| | 1,340,460 |
| | 23,299 |
| | (2,957 | ) | | 1,360,802 |
| | 4.05% | | 3.24% | | 7.54 |
| Non-Agency RMBS | 50,668 |
| | (20,377 | ) | | 30,291 |
| | 2,896 |
| | (686 | ) | | 32,501 |
| | 2.29% | | 10.76% | | 4.97 |
| Total RMBS | $ | 1,306,824 |
| | $ | 53,147 |
| | $ | 1,370,751 |
| | $ | 26,195 |
| | $ | (3,643 | ) | | $ | 1,393,303 |
| | 3.99% | | 3.41% | | 7.45 |
| |
(1) | Average livesRepresents the dollar amount (not shown in thousands) per $100 of MBS are generally shorter than stated contractual maturities. Average lives are affected by the contractual livescurrent principal of the underlying mortgages, scheduled periodic payments of principal, and unscheduled prepayments of principal.price or cost for the security. |
The vast majority of our capital is allocated to our Agency RMBS strategy, which includes investments in Agency pools and Agency CMOs. Within this strategy, we generally target Agency RMBS pools that, taking into account their particular composition and based on our prepayment projections: (1) should generate attractive yields relative to other Agency RMBS and U.S. Treasury securities, (2) should have less prepayment sensitivity to government policy shocks and/or (3) should create opportunities for trading gains once the market recognizes their value, which for newer pools may come only after several months when actual prepayment experience can be observed. As of both September 30, 2015March 31, 2016 and December 31, 2014,2015, investments in non-Agency RMBS constituted a relatively small portion of our total investments.
Our most prevalent method of financing RMBS is through short-term repurchase agreements, which generally have maturities of 180 days or less. The weighted average life of the RMBS we own is generally much longer. Consequently, the weighted average term of our repurchase agreement financings will almost always be substantially shorter than the expected average maturity of our RMBS. This mismatch in maturities, together with the uncertainty of RMBS prepayments, and other potential changes in timing and/or amount of cash flows on our RMBS assets, creates the risk that changes in interest rates will cause our financing costs with respect to our RMBS to increase relative to the income on our RMBS over the term of our investments.
Financial Derivatives
The following table summarizes our portfolio of financial derivative holdings as of September 30, 2015March 31, 2016 and December 31, 2014:2015:
| | | (In thousands) | | September 30, 2015 | | December 31, 2014 | | March 31, 2016 | | December 31, 2015 |
| Financial derivatives–assets, at fair value: | | | | | | | | |
| TBA securities purchase contracts | | $ | 558 |
| | $ | 387 |
| | $ | 365 |
| | $ | 115 |
|
| TBA securities sale contracts | | 17 |
| | 89 |
| | — |
| | 302 |
|
| Fixed payer interest rate swaps | | 5 |
| | 2,518 |
| | 4 |
| | 891 |
|
| Fixed receiver interest rate swaps | | 947 |
| | — |
| | 1,265 |
| | 857 |
|
| Swaptions | | — |
| | 78 |
| |
| Total financial derivatives–assets, at fair value: | | $ | 1,527 |
| | $ | 3,072 |
| |
| Futures | | | 1 |
| | 18 |
|
| Total financial derivatives–assets, at fair value | | | 1,635 |
| | 2,183 |
|
| Financial derivatives–liabilities, at fair value: | | | | | | | | |
| TBA securities purchase contracts | | $ | (1 | ) | | $ | (5 | ) | | — |
| | (49 | ) |
| TBA securities sale contracts | | (1,158 | ) | | (1,669 | ) | | (1,157 | ) | | (315 | ) |
| Fixed payer interest rate swaps | | (15,255 | ) | | (7,026 | ) | | (17,122 | ) | | (4,361 | ) |
| Total financial derivatives–liabilities, at fair value: | | $ | (16,414 | ) | | $ | (8,700 | ) | |
| Futures | | | (5 | ) | | — |
|
| Total financial derivatives–liabilities, at fair value | | | (18,284 | ) | | (4,725 | ) |
| Total | | $ | (14,887 | ) | | $ | (5,628 | ) | | $ | (16,649 | ) | | $ | (2,542 | ) |
Pursuant to our hedging program, we engage in a variety of interest rate hedging activities that are designed to reduce the interest rate risk with respect to the liabilities incurred to acquire or hold RMBS. These interest rate hedges generally seek to reduce the interest rate sensitivity of our liabilities or, in other words, reduce the volatility of our financing cost over time attributable to interest rate changes. Our interest rate hedging transactions may include:
•Interest rate swaps (a contract exchanging a variable rate for a fixed rate, or vice versa);
•Interest rate swaptions (options to enter into interest rate swaps at a future date);
•TBA forward contracts on Agency pass-through certificates;
•Short sales of U.S. Treasury securities;
•Eurodollar and U.S. Treasury futures; and
•Other derivatives.
We generally enter into these transactions to offset the potential adverse effects of rising interest rates on short-term repurchase agreements. Our repurchase agreements generally have maturities of up to 180 days and carry interest rates that are determined by reference to LIBOR or correlated benchmark rates for those same periods. As each then-existing fixed rate repo borrowing matures, it will generally be replaced with a new fixed rate repo borrowing based on market interest rates established at that future date.
In the case of interest rate swaps, most of our agreements are structured such that we receive payments based on a variable interest rate and make payments based on a fixed interest rate. The variable interest rate on which payments are received is generally calculated based on various reset mechanisms for LIBOR. To the extent that our future repo borrowing costs continue to be highly correlated with LIBOR, our swap agreements help to reduce the variability of our overall repo borrowing costs, thus reducing risk to the extent we hold fixed rate assets that are financed with repo borrowings.
In the case of TBAs, most of our positions are short TBA positions with a negative duration, meaning that as interest rates rise, the value of the short position increases, so these positions serve as a hedge against increases in interest rates. In the event that interest rates rise, the increase in value of the short TBA position serves to offset corollary increases in our current and/or future borrowing costs under our repurchase agreements. While we primarily use TBAs to hedge interest rate risk, from time to time we also hold net long positions in certain TBA securities as a means of acquiring exposure to Agency RMBS. Our ability to engage in TBA transactions may be limited by our intention to remain qualified as a REIT.
As of September 30, 2015,March 31, 2016, as part of our interest rate hedging program, we also held short positions in U.S. Treasury securities, with a total principal amount of $70.0$68.8 million and a fair value of $70.7$69.6 million. As of December 31, 2014,2015, we also held short positions in U.S. Treasury securities, with a total principal amount of $13.9$79.6 million and a fair value of $14.0$78.4 million.
The composition and relative mix of instruments we use to hedge various risks may vary from period to period given the amount of our liabilities outstanding or anticipated to be entered into, the overall market environment and our view as to which instruments best enable us to execute our hedging goals.
Leverage
The following table summarizes our outstanding liabilities under repurchase agreements as of September 30, 2015March 31, 2016 and December 31, 2014.2015. We had no other borrowings outstanding.
| | | | | September 30, 2015 | | December 31, 2014 | | March 31, 2016 | | December 31, 2015 |
| | | | | Weighted Average | | | | Weighted Average | | | | Weighted Average | | | | Weighted Average |
| Remaining Days to Maturity | | Borrowings Outstanding | | Interest Rate | | Remaining Days to Maturity | | Borrowings Outstanding | | Interest Rate | | Remaining Days to Maturity | | Borrowings Outstanding | | Interest Rate | | Remaining Days to Maturity | | Borrowings Outstanding | | Interest Rate | | Remaining Days to Maturity |
| | | (In thousands) | | | | | | | | | | | | (In thousands) | | | | | | | | | | |
| 30 days or less | | $ | 472,278 |
| | 0.43 | % | | 15 |
| | $ | 437,633 |
| | 0.33 | % | | 15 |
| | $ | 537,508 |
| | 0.63 | % | | 15 |
| | $ | 666,124 |
| | 0.52 | % | | 14 |
|
| 31-60 days | | 371,885 |
| | 0.46 |
| | 44 |
| | 417,009 |
| | 0.34 |
| | 44 |
| | 268,670 |
| | 0.67 |
| | 43 |
| | 336,350 |
| | 0.53 |
| | 45 |
|
| 61-90 days | | 169,786 |
| | 0.47 |
| | 74 |
| | 333,580 |
| | 0.36 |
| | 72 |
| | 292,395 |
| | 0.71 |
| | 74 |
| | 89,142 |
| | 0.70 |
| | 74 |
|
| 91-120 days | | 211,956 |
| | 0.57 |
| | 107 |
| | — |
| | — |
| | — |
| | — |
| | — |
| | — |
| | 131,103 |
| | 0.53 |
| | 106 |
|
| 151-180 days | | — |
| | — |
| | — |
| | 85,917 |
| | 0.41 |
| | 165 |
| | 35,268 |
| | 0.82 |
| | 167 |
| | — |
| | — |
| | — |
|
| 301-330 days | | — |
| | — |
| | — |
| | 48,941 |
| | 0.47 |
| | 317 |
| |
| Total | | $ | 1,225,905 |
| | 0.47 | % | | 48 |
| | $ | 1,323,080 |
| | 0.35 | % | | 60 |
| | $ | 1,133,841 |
| | 0.66 | % | | 42 |
| | $ | 1,222,719 |
| | 0.54 | % | | 37 |
|
We finance our assets with what we believe to be a prudent amount of leverage, which will vary from time to time based upon the particular characteristics of our portfolio, availability of financing, and market conditions. As of both September 30, 2015 and December 31, 2014, our borrowings consisted entirely of repurchase agreements collateralized by our Agency RMBS. Because our strategy is flexible, dynamic, and opportunistic, our overall leverage will vary over time. As of September 30, 2015March 31, 2016 and December 31, 2014,2015, our total debt-to-equity ratio was 8.288.1 to 1 and 8.108.4 to 1, respectively. Collateral transferred with respect to our outstanding repo borrowings as of September 30, 2015March 31, 2016 and December 31, 20142015 had an aggregate fair value of $1.2 billion and $1.3 billion, respectively. Adjusted for unsettled security purchases and $1.4 billion, respectively,sales, our debt-to-equity ratios was 7.7 to 1 as of March 31, 2016 as compared to 8.1 to 1 as of December 31, 2015. Our leverage ratio may fluctuate period over period based on portfolio management decisions, market conditions, and was entirely comprisedthe timing of Agency RMBS.security purchase and sale transactions.
Shareholders' Equity
As of September 30, 2015,March 31, 2016, our shareholders' equity decreased to $148.0$140.4 million from $163.4$144.9 million as of December 31, 2014.2015. This decrease principally consisted of dividends declared of $14.2$4.1 million, net loss of $0.9$0.2 million, and the repurchase of common shares of $0.3 million.$0.2 million, partially offset by share based compensation of $40.0 thousand. As of September 30, 2015,March 31, 2016, our book value per share was $16.20$15.39 as compared to $17.86$15.86 as of December 31, 2014.2015.
Results of Operations for the Three Month Periods Ended September 30, 2015March 31, 2016 and 2014:2015:
The following table summarizes our results of operations for the three month periods ended September 30, 2015March 31, 2016 and 2014:2015:
| | | (In thousands except for per share amounts) | | Three Month Period Ended September 30, 2015 | | Three Month Period Ended
September 30, 2014 | | Three Month Period Ended
March 31, 2016 | | Three Month Period Ended
March 31, 2015 |
| Net Interest income | | | | | | | | |
| Net interest income | | $ | 9,673 |
| | $ | 10,363 |
| | $ | 7,600 |
| | $ | 9,022 |
|
| Expenses | | | | | | | | |
| Management fees | | 557 |
| | 574 |
| | 528 |
| | 610 |
|
| Other operating expenses | | 718 |
| | 720 |
| | 823 |
| | 806 |
|
| Total expenses | | 1,275 |
| | 1,294 |
| | 1,351 |
| | 1,416 |
|
| Other Income (Loss) | | | | | | | | |
| Net realized and change in net unrealized gains (losses) on mortgage-backed securities | | 5,458 |
| | (3,425 | ) | |
| Net realized and change in net unrealized gains (losses) on securities | | | 11,643 |
| | 11,908 |
|
| Net realized and change in net unrealized gains (losses) on financial derivatives | | (18,673 | ) | | (2,111 | ) | | (18,131 | ) | | (15,837 | ) |
| Total Other Loss | | (13,215 | ) | | (5,536 | ) | |
| Total Other Income (Loss) | | | (6,488 | ) | | (3,929 | ) |
| Net Income (Loss) | | $ | (4,817 | ) | | $ | 3,533 |
| | $ | (239 | ) | | $ | 3,677 |
|
| Net Income (Loss) Per Common Share | | $ | (0.53 | ) | | $ | 0.39 |
| | $ | (0.03 | ) | | $ | 0.40 |
|
Core Earnings
Core Earnings consists of net income (loss), excluding realized and change in net unrealized gains and losses(losses) on mortgage-backed securities and financial derivatives, and, if applicable, items of income or loss that are of a non-recurring nature. Core Earnings includes net realized and change in net unrealized gains and losses(losses) associated with payments and accruals of periodic payments on interest rate swaps. Our interest income is subject to fluctuations based on adjustments to premium amortization as a result of changes in prepayments of our Agency RMBS (accompanied by a corresponding offsetting adjustment to realized and unrealized gains and losses). We refer to this adjustment as a "Catch-up Premium Amortization Adjustment." Core Earnings is aexcluding Catch-up Premium Amortization Adjustment consists of Core Earnings but excludes the effect of the Catch-up Premium Amortization Adjustment on interest income. Core Earnings and Core Earnings excluding Catch-up Premium Amortization Adjustment are supplemental non-GAAP financial measure that we present as an additional measure of our operating performance.measures. We believe that Core Earnings providesand Core Earnings excluding Catch-up Premium Amortization Adjustment provide information useful to investors because it is a metric utilized by managementthey are metrics that we use to assess our performance and to evaluate the effective net yield provided by ourthe portfolio. Moreover, one of our objectives is to generate income from the net interest margin on ourthe portfolio, and we use Core Earnings and Core Earnings excluding Catch-up Premium Amortization Adjustment are used to help measure the extent to which we are achieving this objective.objective is being achieved. However, because Core Earnings is anand Core Earnings excluding Catch-up Premium Amortization Adjustment are incomplete measuremeasures of our financial results and differsdiffer from net income (loss) computed in accordance with U.S. GAAP, itthey should be considered as supplementary to, and not as a substitutesubstitutes for, our net income (loss) computed in accordance with U.S. GAAP.
The table below reconciles Core Earnings and Core Earnings excluding Catch-up Premium Amortization Adjustment for the three month periods ended September 30,March 31, 2016 and 2015 and 2014 to the line, Net Income (Loss), on our Consolidated Statement of Operations, which we believe is the most directly comparable U.S. GAAP measure:
| | | (In thousands except for share amounts) | | Three Month Period Ended
September 30, 2015 | | Three Month Period Ended
September 30, 2014 | | Three Month Period Ended
March 31, 2016 | | Three Month Period Ended
March 31, 2015 |
| Net Income (Loss) | | $ | (4,817 | ) | | $ | 3,533 |
| | $ | (239 | ) | | $ | 3,677 |
|
| Less: | | | | | | | | |
| Net realized gains on mortgage-backed securities | | 596 |
| | 2,030 |
| |
| Net realized gains (losses) on securities | | | 3,010 |
| | 6,722 |
|
Net realized losses on financial derivatives, excluding periodic payments(1) | | (2,208 | ) | | (3,713 | ) | | (3,324 | ) | | (8,036 | ) |
| Change in net unrealized gains (losses) on mortgage-backed securities | | 4,862 |
| | (5,455 | ) | |
| Change in net unrealized gains (losses) on securities | | | 8,633 |
| | 5,186 |
|
Change in net unrealized gains (losses) on financial derivatives, excluding accrued periodic payments(2) | | (14,355 | ) | | 3,755 |
| | (13,409 | ) | | (6,243 | ) |
| Subtotal | | (11,105 | ) | | (3,383 | ) | | (5,090 | ) | | (2,371 | ) |
| Core Earnings | | $ | 6,288 |
| | $ | 6,916 |
| | $ | 4,851 |
| | $ | 6,048 |
|
| Catch-up Premium Amortization Adjustment | | | 258 |
| | (441 | ) |
| Core Earnings excluding Catch-up Premium Amortization Adjustment | | | 4,593 |
| | 6,489 |
|
| Weighted Average Shares Outstanding | | 9,140,452 |
| | 9,141,892 |
| | 9,121,198 |
| | 9,149,274 |
|
| Core Earnings Per Share | | $ | 0.69 |
| | $ | 0.76 |
| | $ | 0.53 |
| | $ | 0.66 |
|
| Core Earnings Per Share excluding Catch-up Premium Amortization Adjustment | | | $ | 0.50 |
| | $ | 0.71 |
|
| |
(1) | For the three month period ended September 30, 2015,March 31, 2016, represents Net realized gains (losses) on financial derivatives of $(3,252)$(3,996) less Net realized gains (losses) on periodic settlements of interest rate swaps of $(1,044)$(672). For the three month period ended September 30, 2014,March 31, 2015, represents Net realized gains (losses) on financial derivatives of $(4,391)$(8,743) less Net realized gains (losses) on periodic settlements of interest rate swaps of $(678)$(707). See Note 5 in the notes to the consolidated financial statements. |
| |
(2) | For the three month period ended September 30, 2015,March 31, 2016, represents Change in net unrealized gains (losses) on financial derivatives of $(15,421)$(14,135) less Change in net unrealized gains (losses) on accrued periodic settlements of interest rate swaps of $(1,066)$(726). For the three month period ended September 30, 2014,March 31, 2015, represents Change in net unrealized gains (losses) on financial derivatives of $2,280$(7,094) less Change in net unrealized gains (losses) on accrued periodic settlements of interest rate swaps of $(1,475)$(851). See Note 5 in the notes to the consolidated financial statements. |
Net Income (Loss)
We had net loss for the three month period ended September 30, 2015 of $(4.8) million, or $(0.53) per share, and we had Core Earnings of $6.3 million, or $0.69 per share. For the three month period ended September 30, 2014, we had net income of $3.5 million, or $0.39 per share, and we had Core Earnings of $6.9 million, or $0.76 per share. The decrease in net income period over period was principally due to a decrease in net interest income, as discussed below, and an increase in net realized and unrealized losses on financial derivatives for the three month period ended March 31, 2016 as well as a decline in net interest income.compared the three month period ended March 31, 2015. Reduced net interest income resulted in a commensurate decline in our Core Earnings.
Interest Income
Our portfolio as of each of September 30,both March 31, 2016 and 2015 and 2014 consisted primarily of Agency RMBS, and to a lesser extent, non-Agency RMBS. Before interest expense, we earned approximately $11.3$9.6 million and $11.5$10.3 million in interest income on these securities for the three month periods ended September 30,March 31, 2016 and 2015, and 2014, respectively. The period-over-period decrease in interest income resulted primarily from lower yields on our non-Agency RMBS and lower average holdings ofon both our Agency and non-Agency RMBS, partially offset by a positive "Catch-up Premium Amortization Adjustment." This positive Catch-up Premium Amortization Adjustment toRMBS.
The following table details our interest income, reflectedaverage holdings of interest-earning assets, and weighted average yield based on amortized cost for the effects of a $0.9 million downward adjustment to premium amortization. This adjustment was caused by a reduction in actual and/or projected prepayments coming into the third quarter,three month periods ended March 31, 2016 and has the impact of increasing our interest income. However, the positive Catch-up Premium Amortization Adjustment to interest income was offset in overall net income by a corresponding $0.9 million downward adjustment to net realized and unrealized gains.2015:
|
| | | | | | | | | | | | | | | | | | | | | | | | | | | | | | | | |
| | Non-Agency(1) | | Agency(1) | | Total(1) |
| (In thousands) | Interest Income | | Average Holdings | | Yield | | Interest Income | | Average Holdings | | Yield | | Interest Income | | Average Holdings | | Yield |
| Three month period ended March 31, 2016 | $ | 619 |
| | $ | 28,450 |
| | 8.71 | % | | $ | 8,950 |
| | $ | 1,196,060 |
| | 2.99 | % | | $ | 9,569 |
| | $ | 1,224,510 |
| | 3.13 | % |
| Three month period ended March 31, 2015 | $ | 739 |
| | $ | 29,411 |
| | 10.05 | % | | $ | 9,532 |
| | $ | 1,279,363 |
| | 2.98 | % | | $ | 10,271 |
| | $ | 1,308,774 |
| | 3.14 | % |
| |
| (1) | Amounts exclude interest income on cash and cash equivalents (including when posted as margin) and long U.S. Treasury securities. |
Interest Expense
For the three month periods ended September 30,March 31, 2016 and 2015, and 2014, the majority of interest expense that we incurred was related to our repo borrowings, which we use to finance our assets. We also incur interest expense in connection with our short positions in U.S. Treasury securities. Our total interest expense for the three month period ended September 30, 2015March 31, 2016 was $1.6$2.1 million, of which $1.4$1.8 million represented interest expense on our repo borrowings and $0.2approximately $0.3 million represented interest expense related primarily to our short positions in U.S. Treasury securities. Our total interest expense for the three month period ended September 30, 2014 was $1.1 million, substantially all of which represented interest expense related to our repo borrowings. The period-over-period increase in our total interest expense was due to an increase in the average rate on our repo borrowings caused by slightly higher short-term interest rates, as well as an increase in interest expense paid on short positions in U.S. Treasury securities associated with our increase in the use of these instruments for hedging purposes. Our average outstanding repo borrowings for the three month period ended September 30,March 31, 2015 was $1.24 billion, resulting in an annualized cost of funds of 0.43%. Our average outstanding repo borrowings for the three month period ended September 30, 2014 was $1.25 billion, resulting in an annualized cost of funds of 0.34%.
The following table shows information related to our annualized average cost of funds for the three month periods ended September 30, 2015 and 2014.
|
| | | | | | | | | | | | | | | | | |
| ($ in thousands) | | Average Borrowed Funds | | Interest Expense | | Annualized Average Cost of Funds | | Average One-Month LIBOR | | Average Six-Month LIBOR |
| Three Month Period Ended September 30, 2015 | | $ | 1,242,650 |
| | $ | 1,357 |
| | 0.43 | % | | 0.20 | % | | 0.51 | % |
| Three Month Period Ended September 30, 2014 | | $ | 1,251,296 |
| | $ | 1,072 |
| | 0.34 | % | | 0.15 | % | | 0.33 | % |
As an alternative measure of our cost of funds, we add to our repo interest cost the net periodic amounts paid or payable by us on our interest rate swaps and interest expense we incur on our short positions in U.S. Treasury securities, and express the total as an annualized percentage of our average outstanding borrowings. The total of our net periodic expense paid or payable under our interest rate swaps and the interest expense on our short positions in U.S. Treasury securities was $2.4 million for the three month period ended September 30, 2015, or 0.77% of our average outstanding borrowings on an annualized basis, thereby resulting in an annualized average cost of funds including interest rate swaps and short positions in U.S. Treasury securities of 1.21%. The total of our net periodic expense paid or payable under our interest rate swaps was $2.2 million for the three month period ended September 30, 2014, or 0.68% of our average outstanding borrowings on an annualized basis, thereby resulting in an annualized average cost of funds including interest rate swaps of 1.02%. This metric does not take into account other instruments that we use to hedge interest rate risk, such as TBAs, swaptions, and futures.
Management Fees
For each of the three month periods ended September 30, 2015 and 2014, our management fee expense was approximately $0.6 million.
Other Operating Expenses
Other operating expenses include professional fees and various other expenses incurred in connection with the operation of our business. Other operating expenses for each of the three month periods ended September 30, 2015 and 2014 was approximately $0.7 million. Our expense ratio, which represents our management fees and other operating expenses as a percentage of our average shareholders' equity, was 3.3% and 3.0% on an annualized basis for each of the three month periods ended September 30, 2015 and 2014, respectively.
Other Loss
Other loss consisted of net realized and net change in unrealized gain (losses) on mortgage-backed securities and financial derivatives. For the three month period ended September 30, 2015, other loss was $13.2 million, and consisted of net realized and change in net unrealized gains (losses) of approximately $(18.7) million on our financial derivatives, partially offset by net realized and change in net unrealized gains (losses) of $5.5 million on our mortgage-backed securities, primarily our Agency RMBS. The performance of the hedging side of our portfolio was weakened by both declining interest rates and high levels of interest rate volatility during the quarter, and exceeded net realized and unrealized gains on our Agency RMBS. Yield spreads on both Agency and non-Agency RMBS widened in sympathy with most fixed income sectors in response to increased volatility in the global financial markets. Other loss for the three month period ended September 30, 2014 was $5.5 million and consisted of net realized and change in net unrealized gains (losses) of $(3.4) million on our mortgage-backed securities, principally our Agency RMBS, and net realized and change in net unrealized gains (losses) of approximately $(2.1) million on our financial derivatives.
Results of Operations for the Nine Month Periods Ended September 30, 2015 and 2014:
The following table summarizes our results of operations for the nine month periods ended September 30, 2015 and 2014:
|
| | | | | | | | |
| (In thousands except for per share amounts) | | Nine Month Period Ended
September 30, 2015 | | Nine Month
Period Ended
September 30, 2014 |
| Net Interest income | | | | |
| Net interest income | | $ | 27,016 |
| | $ | 31,672 |
|
| Expenses | | | | |
| Management fees | | 1,759 |
| | 1,733 |
|
| Other operating expenses | | 2,196 |
| | 2,272 |
|
| Total expenses | | 3,955 |
| | 4,005 |
|
| Other Income (Loss) | | | | |
| Net realized and change in net unrealized gains (losses) on mortgage-backed securities | | 1,086 |
| | 36,937 |
|
| Net realized and change in net unrealized gains (losses) on financial derivatives | | (25,096 | ) | | (47,260 | ) |
| Total Other Loss | | (24,010 | ) | | (10,323 | ) |
| Net Income (Loss) | | $ | (949 | ) | | $ | 17,344 |
|
| Net Income (Loss) Per Common Share | | $ | (0.10 | ) | | $ | 1.90 |
|
Core Earnings
Core Earnings consists of net income (loss), excluding realized and unrealized gains and losses on mortgage-backed securities and financial derivatives, and, if applicable, items of income or loss that are of a non-recurring nature. Core Earnings includes net realized and unrealized gains and losses associated with payments and accruals of periodic payments on interest rate swaps. Core Earnings is a supplemental non-GAAP financial measure that we present as an additional measure of our operating performance. We believe Core Earnings provides information useful to investors because it is a metric utilized by management to assess our performance and to evaluate the effective net yield provided by our portfolio. Moreover, one of our objectives is to generate income from the net interest margin on our portfolio, and we use Core Earnings to help measure the extent to which we are achieving this objective. However, because Core Earnings is an incomplete measure of our financial
results and differs from net income (loss) computed in accordance with GAAP, it should be considered as supplementary to, and not as a substitute for, our net income (loss) computed in accordance with GAAP.
The table below reconciles Core Earnings for the nine month periods ended September 30, 2015 and 2014 to the line, Net Income (Loss), on our Consolidated Statement of Operations, which we believe is the most directly comparable U.S. GAAP measure:
|
| | | | | | | | |
| (In thousands except for share amounts) | | Nine Month
Period Ended
September 30, 2015 | | Nine Month
Period Ended
September 30, 2014 |
| Net Income (Loss) | | $ | (949 | ) | | $ | 17,344 |
|
| Less: | | | | |
| Net realized gains (losses) on mortgage-backed securities | | 8,760 |
| | (613 | ) |
Net realized losses on financial derivatives, excluding periodic payments(1) | | (11,938 | ) | | (13,381 | ) |
| Change in net unrealized gains (losses) on mortgage-backed securities | | (7,674 | ) | | 37,550 |
|
Change in net unrealized gains (losses) on financial derivatives, excluding accrued periodic payments(2) | | (7,611 | ) | | (26,990 | ) |
| Subtotal | | (18,463 | ) | | (3,434 | ) |
| Core Earnings | | $ | 17,514 |
| | $ | 20,778 |
|
| Weighted Average Shares Outstanding | | 9,146,301 |
| | 9,140,533 |
|
| Core Earnings Per Share | | $ | 1.91 |
| | $ | 2.27 |
|
| |
(1)
| For the nine month period ended September 30, 2015, represents Net realized gains (losses) on financial derivatives of $(15,838) less Net realized gains (losses) on periodic settlements of interest rate swaps of $(3,900). For the nine month period ended September 30, 2014, represents Net realized gains (losses) on financial derivatives of $(18,955) less Net realized gains (losses) on periodic settlements of interest rate swaps of $(5,574). See Note 5 in the notes to the consolidated financial statements. |
| |
(2)
| For the nine month period ended September 30, 2015, represents Change in net unrealized gains (losses) on financial derivatives of $(9,258) less Change in net unrealized gains (losses) on accrued periodic settlements of interest rate swaps of $(1,647). For the nine month period ended September 30, 2014, represents Change in net unrealized gains (losses) on financial derivatives of $(28,305) less Change in net unrealized gains (losses) on accrued periodic settlements of interest rate swaps of $(1,315). See Note 5 in the notes to the consolidated financial statements. |
Net Income (Loss)
We had net loss for the nine month period ended September 30, 2015 of $(0.9) million, or $(0.10) per share, and we had Core Earnings of $17.5 million, or $1.91 per share. For the nine month period ended September 30, 2014, we had net income of $17.3 million, or $1.90 per share, and we had Core Earnings of $20.8 million, or $2.27 per share. The decrease in net income period over period was principally due to a decrease in net interest income and net realized and unrealized gains on mortgage-backed securities. Reduced net interest income resulted in a commensurate decline in our Core Earnings.
Interest Income
Our portfolio as of both September 30, 2015 and 2014 consisted primarily of Agency RMBS, and to a lesser extent, non-Agency RMBS. Before interest expense, we earned approximately $31.4 million and $35.0 million in interest income on these securities for the nine month periods ended September 30, 2015 and 2014, respectively. The period-over-period decrease in interest income resulted from lower yields and lower average holdings on both our Agency and non-Agency RMBS.
Interest Expense
For the nine month periods ended September 30, 2015 and 2014, the majority of interest expense that we incurred was related to our repo borrowings, which we use to finance our assets. We also incur interest expense in connection with our short positions in U.S. Treasury securities. Our total interest expense for the nine month period ended September 30, 2015 was $4.4$1.3 million, of which $3.7$1.1 million represented interest expense on our repo borrowings and approximately $0.7$0.2 million represented interest expense related primarily to our short positions in U.S. Treasury securities. Our total interest expense for the nine month period ended September 30, 2014 was $3.3 million, substantially all of which represented interest expense on our repo borrowings. The period-over-period increase in our total interest expense wasresulted mainly duefrom higher rates on our repo borrowings, and to a lesser extent from an increase in interest expense paid on short U.S. Treasury securities associated with an increase in the use of these instruments for hedging purposes. Our average outstanding repo borrowings for the ninethree month period ended September 30,March 31, 2016 was $1.14 billion, resulting in an annualized average cost of funds of 0.62%. Our average outstanding repo borrowings for the three month period ended March 31, 2015 was $1.24 billion, resulting in an annualized average cost of funds of 0.39%. Our average outstanding repo borrowings for the nine month period ended September 30, 2014 was $1.25 billion, resulting in an annualized average cost of funds of 0.35%0.36%.
The following table shows information related to our annualized average cost of funds for the ninethree month periods ended September 30, 2015March 31, 2016 and 2014.2015.
|
| | | | | | | | | | | | | | | | | |
| ($ in thousands) | | Average Borrowed Funds | | Interest Expense | | Annualized Average Cost of Funds | | Average One-Month LIBOR | | Average Six-Month LIBOR |
| Nine Month Period Ended September 30, 2015 | | $ | 1,243,157 |
| | $ | 3,666 |
| | 0.39 | % | | 0.18 | % | | 0.44 | % |
| Nine Month Period Ended September 30, 2014 | | $ | 1,250,334 |
| | $ | 3,277 |
| | 0.35 | % | | 0.15 | % | | 0.33 | % |
|
| | | | | | | | | | | | | | | | | |
| ($ in thousands) | | Average Borrowed Funds | | Interest Expense | | Annualized Average Cost of Funds | | Average One-Month LIBOR | | Average Six-Month LIBOR |
| Three Month Period Ended March 31, 2016 | | $ | 1,142,352 |
| | $ | 1,762 |
| | 0.62 | % | | 0.43 | % | | 0.88 | % |
| Three Month Period Ended March 31, 2015 | | $ | 1,239,167 |
| | $ | 1,106 |
| | 0.36 | % | | 0.17 | % | | 0.38 | % |
As an alternative measure of our cost of funds measure, we add to our repo interest cost the net periodic amounts paid or payable by us on our interest rate swaps and interest expense we incur on our short positions in U.S. Treasury securities and express the total as an annualized percentage of our average outstanding borrowings. The total of our net periodic expense paid or payable under our interest rate swaps and our interest expense on our short positions in U.S. Treasury securities was $6.4$1.7 million for the ninethree month period ended September 30, 2015,March 31, 2016, or 0.68%0.59% of our average outstanding repo borrowings on an annualized basis, thereby resulting in an annualized average cost of funds including interest rate swaps and short positions in U.S. Treasury securities of 1.08%1.21%. The total of our net periodic expense paid or payable under our interest rate swaps was $6.9$1.7 million for the ninethree month period ended September 30, 2014,March 31, 2015, or 0.74%0.57% of our average outstanding borrowings on an annualized basis, thereby resulting in an annualized average cost of funds including interest rate swaps of 1.09%0.93%. This metric does not take into account other instruments that we use to hedge interest rate risk, such as TBAs, swaptions, and futures.
Management Fees
For the ninethree month periods ended September 30,March 31, 2016 and 2015, and 2014, our management fee expense was approximately $1.80.5 million and $1.7$0.6 million, respectively. The decrease in management fees period over period was due to our smaller capital base.
Other Operating Expenses
Other operating expenses, as presented above, include professional fees, compensation expense, and various other expenses incurred in connection with the operation of our business. Other operating expenses for both the ninethree month periods ended September 30,March 31, 2016 and 2015 and 2014 were approximately $2.20.8 million and $2.3 million, respectively.. Our expense ratio, which represents our management fees and other operating expenses as a percentage of our average shareholders' equity, was 3.3%3.8% on an annualized basis for the ninethree month period ended September 30, 2015,March 31, 2016, as compared to 3.2%3.5% for the ninethree month period ended September 30, 2014.March 31, 2015. The increase in our annualized expense ratio iswas primarily due to a lower current capital base.decrease in our average shareholders' equity for the three month period ended March 31, 2016 as compared to the three month period ended March 31, 2015.
Other LossIncome (Loss)
Other lossincome (loss) consisted of net realized and net change in unrealized gain (losses) on mortgage-backed securities and financial derivatives. For the ninethree month period ended September 30, 2015,March 31, 2016, other loss was $24.0$(6.5) million, and consisted of net realized and change in net unrealized gains (losses)losses of $(25.1)$(18.1) million on our financial derivatives andpartially offset by net realized and change in net unrealized gains (losses) of approximately $1.1$11.6 million on our mortgage-backed securities, primarily our Agency RMBS. The first nine months of 2015 have beenperiod ended March 31, 2016 was marked by significant interest rate volatility. OverAs interest rates declined over the course of 2015,the quarter, both prices and pay-ups on our specified Agency pools increased but the net realized and unrealized gains on our Agency RMBS could not keep pace with the significant losses incurred on our interest rate hedges. In addition, during the quarter, as measured by sales and
excluding paydowns, we turned over approximately 48% of our Agency RMBS portfolio and, as a result, for the three month period ended March 31, 2016, we generated net realized gains of $4.0 million on our Agency RMBS portfolio. For the past several quarters, interest rates have moved both sharply higher and sharply lower, and overall, have resulted in net losses on our financial derivatives, most notably our interest rate swaps. Since over the course of the nine month period ended September 30, 2015, we have been using a greater amount of interest rate swaps relative to short TBAs to hedge interest rate risk, we have had to much more actively adjust our interest rate hedges as interest rates have moved sharply higher and lower. This increased interest rate swap adjustment activity, coupled with the significant overall decline in interest rate swap spreads, led to losses on our interest rate swaps over the period. Even though yield spreads widened on both Agency and non-Agency RMBS over the period, the decline in interest rates slightly more than offset that widening, enabling us to generate a small amount of net realized and unrealized gains on our mortgage-backed securities, as stated above.
Other loss for the ninethree month period ended September 30, 2014March 31, 2015 was $10.3$(3.9) million and consisted of net realized and change in net unrealized gains (losses)losses of $(47.3)$(15.8) million on our financial derivatives, partially offset by net realized and change in net unrealized gains (losses) of approximately $36.9$11.9 million on our mortgage-backed securities, principally our Agency RMBS.
Liquidity and Capital Resources
Liquidity refers to our ability to meet our cash needs, including repaying our borrowings, funding and maintaining RMBS and other assets, paying dividends, and other general business needs. Our short-term (one year or less) and long-term liquidity requirements include acquisition costs for assets we acquire, payment of our management fee, compliance with margin requirements under our repurchase agreements, TBA and other financial derivative contracts, repayment of repurchase agreement borrowings to the extent we are unable or unwilling to extend our repurchase agreements, the payment of dividends,
and payment of our general operating expenses. Our capital resources primarily include cash on hand, cash flow from our investments (including monthly principal and interest payments received on our RMBS and proceeds from the sale of MBS)RMBS), borrowings under repurchase agreements, and proceeds from equity offerings. We expect that these sources of funds will be sufficient to meet our short-term and long-term liquidity needs.
We borrow funds in the form of repurchase agreements. The terms of these borrowings under our Master Repurchase Agreements, or "MRAs," generally conform to the terms in the standard master repurchase agreement as published by the Securities Industry and Financial Markets Association as to repayment and margin requirements. In addition, each lender may require that we include supplemental terms and conditions to the standard master repurchase agreement. Typical supplemental terms and conditions include the addition of or changes to provisions relating to margin calls, net asset value requirements, cross default provisions, certain key person events, changes in corporate structure, and requirements that all controversies related to the repurchase agreement be litigated in a particular jurisdiction. These provisions may differ for each of our lenders.
As of September 30, 2015March 31, 2016 and December 31, 2014,2015, we had $1.2$1.1 billion and $1.3$1.2 billion, respectively, outstanding under our repurchase agreements. As of September 30, 2015, we had MRAs in place with fifteen counterparties andMarch 31, 2016, our outstanding repurchase agreements were with thirteentwelve counterparties.
Amount at risk represents the aggregate excess, if any, for each counterparty of the fair value of collateral held by such counterparty over the amounts outstanding under repurchase agreements. The following table reflects counterparties for which the amounts at risk relating to our repurchase agreements was greater than 5% of shareholders' equity as of September 30, 2015March 31, 2016 and December 31, 2014.2015.
September 30, 2015:March 31, 2016:
| | | Counterparty | | Amount at Risk(1) | | Weighted Average Remaining Days to Maturity | | Percentage of Shareholders' Equity | | Amount at Risk(1) | | Weighted Average Remaining Days to Maturity | | Percentage of Shareholders' Equity |
| | | (In thousands) | | | | (In thousands) | | |
| RBC Capital Markets LLC | | | $ | 11,502 |
| | 28 | | 8.2 | % |
| Deutsche Bank Securities | | | $ | 10,920 |
| | 26 | | 7.8 | % |
| J.P. Morgan Securities Inc. | | $ | 19,930 |
| | 77 | | 13.5 | % | | $ | 10,438 |
| | 60 | | 7.4 | % |
| Deutsche Bank Securities | | $ | 12,329 |
| | 25 | | 8.3 | % | |
| RBC Capital Markets LLC | | $ | 12,013 |
| | 42 | | 8.1 | % | |
| |
| (1) | Amounts at risk exclude, in aggregate, $1.7$1.4 million of net accrued interest, defined as accrued interest on securities held as collateral less interest payable on cash borrowed. |
December 31, 2014:2015:
| | | Counterparty | | Amount at Risk(1) | | Weighted Average Remaining Days to Maturity | | Percentage of Shareholders' Equity | | Amount at Risk(1) | | Weighted Average Remaining Days to Maturity | | Percentage of Shareholders' Equity |
| | | (In thousands) | | | | (In thousands) | | |
| Bank of America Securities | | $ | 15,754 |
| | 69 | | 9.6 | % | |
| Deutsche Bank Securities | | | $ | 12,950 |
| | 24 | | 8.9 | % |
| J.P. Morgan Securities Inc. | | $ | 12,012 |
| | 27 | | 7.4 | % | | $ | 12,377 |
| | 29 | | 8.5 | % |
| Deutsche Bank Securities | | $ | 11,919 |
| | 55 | | 7.3 | % | |
| RBC Capital Markets LLC | | $ | 10,374 |
| | 113 | | 6.3 | % | | $ | 9,630 |
| | 64 | | 6.6 | % |
| |
| (1) | Amounts at risk exclude, in aggregate, $2.7$1.5 million of net accrued interest, defined as accrued interest on securities held as collateral less interest payable on cash borrowed. |
The amounts borrowed under our repurchase agreements are generally subject to the application of "haircuts." A haircut is the percentage discount that a repo lender applies to the market value of an asset serving as collateral for a repo borrowing, for the purpose of determining whether such repo borrowing is adequately collateralized. As of September 30, 2015both March 31, 2016 and December 31, 2014,2015, the weighted average contractual haircut applicable to the assets that serve as collateral for our outstanding repo borrowings was 4.7% and 4.5%, respectively. As of both September 30, 2015 and December 31, 2014, all of our repo borrowings were related to our Agency RMBS..
The following table details total outstanding borrowings, average outstanding borrowings, and the maximum outstanding borrowings at any month end for each quarter under repurchase agreements for 2015, 2014, and 2013. There were no borrowings under repurchase agreements prior to May 2013.the past twelve quarters.
| | | Quarter Ended | | Borrowings Outstanding at Quarter End | | Average Borrowings Outstanding | | Maximum Borrowings Outstanding at Any Month End | | Borrowings Outstanding at Quarter End | | Average Borrowings Outstanding | | Maximum Borrowings Outstanding at Any Month End |
| | | (In thousands) | | (In thousands) |
| March 31, 2016 | | | $ | 1,133,841 |
| | $ | 1,142,501 |
| | $ | 1,175,531 |
|
| December 31, 2015 | | | 1,222,719 |
| | 1,228,964 |
| | 1,286,274 |
|
| September 30, 2015 | | $ | 1,225,905 |
| | $ | 1,242,650 |
| | $ | 1,248,604 |
| | 1,225,905 |
| | 1,242,650 |
| | 1,248,604 |
|
| June 30, 2015 | | 1,264,479 |
| | 1,247,617 |
| | 1,269,551 |
| | 1,264,479 |
| | 1,247,617 |
| | 1,269,551 |
|
| March 31, 2015 | | 1,211,110 |
| | 1,239,167 |
| | 1,255,568 |
| | 1,211,110 |
| | 1,239,167 |
| | 1,255,568 |
|
| December 31, 2014 | | 1,323,080 |
| | 1,275,874 |
| | 1,323,080 |
| | 1,323,080 |
| | 1,275,874 |
| | 1,323,080 |
|
| September 30, 2014 | | 1,233,333 |
| | 1,251,296 |
| | 1,275,122 |
| | 1,233,333 |
| | 1,251,296 |
| | 1,275,122 |
|
| June 30, 2014 | | 1,285,593 |
| | 1,239,899 |
| | 1,285,593 |
| | 1,285,593 |
| | 1,239,899 |
| | 1,285,593 |
|
| March 31, 2014 | | 1,281,470 |
| | 1,259,901 |
| | 1,281,470 |
| | 1,281,470 |
| | 1,259,901 |
| | 1,281,470 |
|
| December 31, 2013 | | 1,310,347 |
| | 1,304,452 |
| | 1,310,347 |
| | 1,310,347 |
| | 1,304,452 |
| | 1,310,347 |
|
| September 30, 2013 | | 1,292,946 |
| | 1,296,042 |
| | 1,371,881 |
| | 1,292,946 |
| | 1,296,042 |
| | 1,371,881 |
|
June 30, 2013(1) | | 1,215,696 |
| | 550,721 |
| | 1,215,696 |
| | 1,215,696 |
| | 550,721 |
| | 1,215,696 |
|
| |
| (1) | For the quarter ended June 30, 2013 the significant increase between average borrowings outstanding and total borrowings at June 30, 2013 was due to the deployment of proceeds from our initial public offering of common shares in May 2013 into investment in RMBS which we financed through repurchase agreements. |
We held cash and cash equivalents of approximately $40.541.2 million and $45.2$40.2 million as of September 30, 2015March 31, 2016 and December 31, 2014,2015, respectively.
We may declare dividends based on, among other things, our earnings, our financial condition, the REIT qualification requirements of the Internal Revenue Code of 1986, as amended, our working capital needs and new opportunities. The declaration of dividends to our shareholders and the amount of such dividends are at the discretion of our Board of Trustees. The following table sets forth the dividend distributions authorized by the Board of Trustees for the periods indicated below:
NineThree Month Period Ended September 30, 2015March 31, 2016
|
| | | | | | | | | |
| | Dividend Per Share | | Dividend Amount | | Declaration Date | | Record Date | | Payment Date |
| | | | (In thousands) | | | | | | |
| First Quarter | $0.55 | | $5,032 | | March 11, 2015 | | March 31, 2015 | | April 27, 2015 |
| Second Quarter | $0.55 | | $5,032 | | June 16, 2015 | | June 30, 2015 | | July 27, 2015 |
| Third Quarter | $0.45 | | $4,111 | | September 15, 2015 | | September 30, 2015 | | October 26, 2015 |
|
| | | | | | | | | |
| | Dividend Per Share | | Dividend Amount | | Declaration Date | | Record Date | | Payment Date |
| | | | (In thousands) | | | | | | |
| First Quarter | $0.45 | | $4,103 | | March 8, 2016 | | March 31, 2016 | | April 25, 2016 |
NineThree Month Period Ended September 30, 2014March 31, 2015
|
| | | | | | | | | |
| | Dividend Per Share | | Dividend Amount | | Declaration Date | | Record Date | | Payment Date |
| | | | (In thousands) | | | | | | |
| First Quarter | $0.55 | | $5,027 | | March 12, 2014 | | March 31, 2014 | | April 28, 2014 |
| Second Quarter | $0.55 | | $5,027 | | June 17, 2014 | | June 30, 2014 | | July 25, 2014 |
| Third Quarter | $0.55 | | $5,032 | | September 11, 2014 | | September 30, 2014 | | October 27, 2014 |
|
| | | | | | | | | |
| | Dividend Per Share | | Dividend Amount | | Declaration Date | | Record Date | | Payment Date |
| | | | (In thousands) | | | | | | |
| First Quarter | $0.55 | | $5,032 | | March 11, 2015 | | March 31, 2015 | | April 27, 2015 |
For the ninethree month period ended September 30, 2015,March 31, 2016, our operating activities provided net cash of $9.7$10.8 million and our investing activities provided net cash of $98.1$83.4 million. Our repo activity used to finance our Agency RMBSpurchase of securities (including repayments, in conjunction with the sales of Agency RMBS,securities, of amounts borrowed under our repurchase agreements) used net cash of $97.2$88.9 million. Thus our operating and investing activities, when combined with our net repo financing activities, provided net cash of $10.6$5.4 million. We used $15.1$4.1 million to pay dividends and $0.3$0.2 million for the repurchase of common shares. As a result of these activities, there was a decreasean increase in our cash holdings of $4.8$1.1 million from $45.2$40.2 million as of December 31, 20142015 to $40.5$41.2 million as of September 30, 2015.March 31, 2016.
For the ninethree month period ended September 30, 2014,March 31, 2015, our operating activities provided net cash of $11.0$1.2 million and our investing activities provided net cash of $81.8$123.9 million. Our repo activity used to finance our Agency RMBSpurchase of securities (including repayments, in conjunction with the sales of Agency RMBS,securities, of amounts borrowed under our repurchase agreements) used net cash of $77.0$112.0 million. Thus our operating and investing activities, when combined with our net repo financing activities, provided net cash of $15.8$13.1 million for the ninethree month period ended September 30, 2014.March 31, 2015. We used $14.6$5.0 million to pay dividends and $0.2 million to pay offering costs.dividends. As a result of these activities, there was an increase in our cash holdings of $1.0$8.1 million from $50.1$45.2 million as of December 31, 20132014 to $51.1$53.3 million as of September 30, 2014.March 31, 2015.
On August 13, 2013, our Board of Trustees approved the adoption of a $10 million share repurchase program. The program, which is open-ended in duration, allows us to make repurchases from time to time on the open market or in negotiated transactions. Repurchases are at our discretion, subject to applicable law, share availability, price and our financial performance, among other considerations. During the quarterthree month period ended September 30, 2015,March 31, 2016, we made our first repurchases under the program, purchasing 23,481purchased 17,920 common shares at an average price per share of $12.93$10.94 for an aggregate cost of approximately $0.3$0.2 million.
Based on our current portfolio, amount of free cash on hand, debt-to-equity ratio and current and anticipated availability of credit, we believe that our capital resources will be sufficient to enable us to meet anticipated short-term and long-term liquidity requirements.
We are not required by our investment guidelines to maintain any specific debt-to-equity ratio, and we believe that the appropriate leverage for the particular assets we hold depends on the credit quality and risk of those assets, as well as the general availability and terms of stable and reliable financing for those assets.
Contractual Obligations and Commitments
We are a party to a management agreement with our Manager. Pursuant to that agreement, our Manager is entitled to receive a management fee based on shareholders' equity, reimbursement of certain expenses and, in certain circumstances, a termination fee. Such fees and expenses do not have fixed and determinable payments. For a description of the management agreement provisions, see Note 109 to our consolidated financial statements.
We enter into repurchase agreements with third-party broker-dealers whereby we sell securities to such broker-dealers at agreed-upon purchase prices at the initiation of the repurchase agreements and agree to repurchase such securities at predetermined repurchase prices and termination dates, thus providing the broker-dealers with an implied interest rate on the funds initially transferred to us by the broker-dealers. We may enter into reverse repurchase agreements with third-party broker-dealers whereby we purchase securities under agreements to resell at an agreed-upon price and date. In general, we most often will enter into reverse repurchase agreement transactions in order to effectively borrow securities that we can then deliver to counterparties to whom we have made short sales of the same securities. The implied interest rates on the repurchase agreements and reverse repurchase agreements we enter into are based upon competitive market rates at the time of initiation. Repurchase agreements and reverse repurchase agreements that are conducted with the same counterparty may be reported on a net basis if they meet the requirements of ASC 210-20, Balance Sheet, Offsetting. As of each of September 30, 2015March 31, 2016 and December 31, 2014,2015, there were no repurchase agreements and reverse repurchase agreements reported on a net basis on the Consolidated Balance Sheet.
As of September 30,March 31, 2016 we had $1.1 billion of outstanding borrowings with twelve counterparties, and as of December 31, 2015 we had $1.2 billion of outstanding borrowings with thirteen counterparties and as of December 31, 2014 we had $1.3 billion of outstanding borrowings with ten counterparties. As of September 30, 2015, we had MRAs with fifteen counterparties. We expect to continue to have discussions with various other financial institutions in order to expand our repurchase agreement capacity.
Off-Balance Sheet Arrangements
As of September 30, 2015March 31, 2016 and December 31, 2014,2015, we did not have any relationships with unconsolidated entities or financial partnerships, such as entities often referred to as structured finance or special purpose entities, which would have been established for the purpose of facilitating off-balance sheet arrangements or other contractually narrow or limited purposes. Further, we have not guaranteed any obligations of unconsolidated entities nor do we have any commitment or intent to provide funding to any such entities. As such, we are not materially exposed to any market, credit, liquidity, or financing risk that could arise if we had engaged in such relationships.
Inflation
Virtually all of our assets and liabilities are interest rate-sensitive in nature. As a result, interest rates and other factors influence our performance far more so than does inflation. Changes in interest rates do not necessarily correlate with inflation rates or changes in inflation rates. Our activities and balance sheet are measured with reference to historical cost and/or fair
market value without considering inflation.
Item 3. Quantitative and Qualitative Disclosures About Market Risk
The primary components of our market risk are related to interest rate risk, prepayment risk, and credit risk. We seek to actively manage these and other risks and to acquire and hold assets that we believe justify bearing those risks, and to maintain capital levels consistent with those risks.
Interest Rate Risk
Interest rates are highly sensitive to many factors, including governmental monetary and tax policies, domestic and international economic and political considerations, and other factors beyond our control. We are subject to interest rate risk in connection with most of our assets and liabilities. For some securities in our portfolio, the coupon interest rates on, and therefore also the values of, such securities are highly sensitive to interest rate movements, such as inverse floating rate RMBS, which benefit from falling interest rates. Our repurchase agreements generally have maturities of up to 180 days and carry interest rates that are determined by reference to LIBOR or similar short-term benchmark rates for those same periods. Whenever one of our fixed rate repo borrowings matures, it will generally be replaced with a new fixed rate repo borrowing based on market interest rates prevailing at such time. Subject to qualifying and maintaining our qualification as a REIT and our exclusion from registration under the Investment Company Act, we opportunistically hedge our interest rate risk by entering into interest rate swaps, TBAs, U.S. Treasury securities, Eurodollar and U.S. Treasury futures, and other instruments. In general, such hedging instruments are used to offset the large majority of the interest rate risk we estimate to arise from our repurchase agreement indebtedness generally associated with our Agency RMBS positions. Hedging instruments may also be used to offset a portion of the interest rate risk arising from our repurchase agreement liabilities associated with non-Agency RMBS positions, if any.
In addition to measuring and mitigating the risk related to changes in interest rates with respect to the generally shorter-term liabilities we incur to acquire and hold generally longer-lived RMBS, we also monitor the effect of changes in interest rates on the discounted present value of our portfolio of assets and liabilities. The following sensitivity analysis table shows the estimated impact on the fair value of our portfolio segregated by certain identified categories as of September 30, 2015,March 31, 2016, assuming a static portfolio and immediate and parallel shifts in interest rates from current levels as indicated below.
| | | (In thousands) | | Estimated Change in Value for a Decrease in Interest Rates by | | Estimated Change in Value for an Increase in Interest Rates by | | Estimated Change in Value for a Decrease in Interest Rates by | | Estimated Change in Value for an Increase in Interest Rates by |
| Category of Instruments | | 50 Basis Points | | 100 Basis Points | | 50 Basis Points | | 100 Basis Points | | 50 Basis Points | | 100 Basis Points | | 50 Basis Points | | 100 Basis Points |
| Agency RMBS, excluding TBAs | | $ | 20,419 |
| | $ | 34,274 |
| | $ | (26,983 | ) | | $ | (60,531 | ) | | $ | 13,471 |
| | $ | 21,011 |
| | $ | (19,404 | ) | | $ | (44,741 | ) |
| TBAs | | (2,832 | ) | | (3,080 | ) | | 5,417 |
| | 13,418 |
| | (1,381 | ) | | (892 | ) | | 3,252 |
| | 8,376 |
|
| Non-Agency RMBS | | 350 |
| | 713 |
| | (336 | ) | | (658 | ) | | 191 |
| | 388 |
| | (185 | ) | | (364 | ) |
| U.S. Treasury Securities, Interest Rate Swaps, and Swaptions | | (19,242 | ) | | (39,367 | ) | | 18,359 |
| | 35,836 |
| |
| U.S. Treasury Securities, Interest Rate Swaps, and Futures | | | (14,093 | ) | | (28,792 | ) | | 13,486 |
| | 26,365 |
|
| Repurchase and Reverse Repurchase Agreements | | (751 | ) | | (800 | ) | | 794 |
| | 1,588 |
| | (650 | ) | | (912 | ) | | 650 |
| | 1,300 |
|
| Total | | $ | (2,056 | ) | | $ | (8,260 | ) | | $ | (2,749 | ) | | $ | (10,347 | ) | | $ | (2,462 | ) | | $ | (9,197 | ) | | $ | (2,201 | ) | | $ | (9,064 | ) |
Our analysis of interest rate risk is derived from Ellington's proprietary models as well as third-party information and analytics. Many assumptions have been made in connection with the calculations set forth in the table above and, as such, there can be no assurance that assumed events will occur or that other events will not occur that would affect the outcomes. For
example, for each hypothetical immediate shift in interest rates, assumptions have been made as to the response of mortgage prepayment rates, the shape of the yield curve, and market volatilities of interest rates; each of the foregoing factors can significantly and adversely affect the fair value of our interest rate sensitive instruments.
The above analysis utilizes assumptions and estimates based on management's judgment and experience, and relies on financial models, which are inherently imperfect; in fact, different models can produce different results for the same securities. While the table above reflects the estimated impacts of immediate parallel interest rate increases and decreases on specific categories of instruments in our portfolio, we intend to actively trade many of the instruments in our portfolio and intend to diversify our portfolio to reflect a portfolio comprised primarily of Agency RMBS, and, to a lesser extent, non-Agency RMBS and mortgage-related assets. Therefore, our current or future portfolios may have risks that differ significantly from those of our September 30, 2015March 31, 2016 portfolio estimated above. Moreover, the impact of changing interest rates on fair value can change significantly when interest rates change by a greater amount than the hypothetical shifts assumed above. Furthermore, our portfolio is subject to many risks other than interest rate risks, and these additional risks may or may not be correlated with
changes in interest rates. For all of the foregoing reasons and others, the table above is for illustrative purposes only and actual changes in interest rates would likely cause changes in the actual fair value of our portfolio that would differ from those presented above, and such differences might be significant and adverse. See "Special Note Regarding Forward-Looking Statements."
Prepayment Risk
Prepayment risk is the risk of change, whether an increase or a decrease, in the rate at which principal is returned in respect to mortgage loans underlying RMBS, including both through voluntary prepayments and through liquidations due to defaults and foreclosures. This rate of prepayment is affected by a variety of factors, including the prevailing level of interest rates as well as economic, demographic, tax, social, legal, and other factors. Changes in prepayment rates will have varying effects on the different types of securities in our portfolio, and we attempt to take these effects into account in making asset management decisions. Additionally, increases in prepayment rates may cause us to experience losses on our investment in interest-only securities, or "IOs" and inverse interest only securities, or "IIOs," as these securities are extremely sensitive to prepayment rates. Finally, prepayment rates, besides being subject to interest rates and borrower behavior, are also substantially affected by government policy and regulation.
Credit Risk
We are subject to credit risk in connection with our assets, especially our non-Agency RMBS. Credit losses on real estate loans underlying our non-Agency RMBS can occur for many reasons, including, but not limited to, poor origination practices, fraud, faulty appraisals, documentation errors, poor underwriting, legal errors, poor servicing practices, weak economic conditions, decline in the value of homes, special hazards, earthquakes and other natural events, over-leveraging of the borrower on the property, reduction in market rents and occupancies and poor property management services in the case of rented homes, changes in legal protections for lenders, reduction in personal income, job loss, and personal events such as divorce or health problems. Property values are subject to volatility and may be affected adversely by a number of factors, including, but not limited to, national, regional, and local economic conditions (which may be adversely affected by industry slowdowns and other factors), local real estate conditions (such as an oversupply of housing), changes or continued weakness in specific industry segments, construction quality, age and design, demographic factors, and retroactive changes to building or similar codes. For mortgage-related instruments, the two primary components of credit risk are default risk and severity risk.
Default Risk
Default risk is the risk that borrowers will fail to make principal and interest payments on their mortgage loans. Subject to qualifying and maintaining our qualification as a REIT and our exclusion from registration under the Investment Company Act, we may selectively attempt to mitigate our default risk by, among other things, opportunistically entering into credit default swaps and total return swaps. These instruments can reference various RMBS indices, corporate bond indices, or corporate entities, such as publicly traded REITs. We also rely on third-party mortgage servicers to mitigate our default risk, but such third-party mortgage servicers may have little or no economic incentive to mitigate loan default rates.
Severity Risk
Severity risk is the risk of loss upon a borrower default on a mortgage loan underlying our RMBS. Severity risk includes the risk of loss of value of the property underlying the mortgage loan as well as the risk of loss associated with taking over the property, including foreclosure costs. We rely on third-party mortgage servicers to mitigate our severity risk, but such third-party mortgage servicers may have little or no economic incentive to mitigate loan loss severities. Such mitigation efforts may include loan modification programs and prompt foreclosure and property liquidation following a default.
Item 4. Controls and Procedures
Disclosure Controls and Procedures
We maintain disclosure controls and procedures that are designed to ensure that information required to be disclosed in the reports that we file or submit under the Exchange Act is recorded, processed, summarized and reported within the time periods specified in the rules and forms of the SEC, and that such information is accumulated and communicated to our management as appropriate to allow timely decisions regarding required disclosures. An evaluation was performed under the supervision and with the participation of our management, including our Chief Executive Officer and Chief Financial Officer, of the effectiveness of our disclosure controls and procedures (as defined in Rules 13a-15(e) and 15d-15(e) underof the Exchange Act) as of September 30, 2015.March 31, 2016. Based upon that evaluation, our Chief Executive Officer and Chief Financial Officer concluded that our disclosure controls and procedures were effective as of September 30, 2015.March 31, 2016.
Internal Control Over Financial Reporting
There have been no changes in our internal control over financial reporting that occurred during the last fiscal quarterthree month period ended March 31, 2016 that have materially affected, or are reasonably likely to materially affect, our internal control over financial reporting.
PART II. OTHER INFORMATION
Item 1. Legal Proceedings
Neither we nor our Manager is currently subject to any legal proceedings that we or our Manager considers to be material. Nevertheless, at any time, industry-wide or company-specific regulatory inquiries or proceedings can be initiated and we cannot predict when or if any such regulatory inquiries or proceedings will be initiated that involve us, Ellington, or its affiliates, including our Manager. See "Risk"Risk Factors—We, Ellington, or its affiliates may be subject to regulatory inquiries or proceedings"proceedings" included in Part 1 Item 1A of our Annual Report on Form 10-K for the year ended December 31, 2014.2015. Ellington and its affiliates have, over the years, received, and we expect in the future that they may receive, inquiries and requests for documents and information from various regulators.
We can give no assurances that regulatory inquiries will not result in investigations of Ellington or its affiliates or enforcement actions, fines or penalties or the assertion of private litigation claims against Ellington or its affiliates. In the event regulatory inquiries were to result in investigations, enforcement actions, fines, penalties, or the assertion of private litigation claims against Ellington or its affiliates, our Manager's ability to perform its obligations to us under the Management Agreement between us and our Manager, or Ellington's ability to perform its obligations to our Manager under the services agreement between Ellington and our Manager, could be adversely impacted, which could in turn have a material adverse effect on our business, financial condition and results of operations, and our ability to make distributions to our shareholders.
Item 1A. Risk Factors
For information regarding factors that could affect our results of operations, financial condition, and liquidity, see the risk factors discussed under "Risk Factors" in Part I, Item 1A of our Annual Report on Form 10-K for the year ended December 31, 2014.2015. There have been no material changes from these previously disclosed risk factors. See also "Special Note Regarding Forward-Looking Statements," included in Part I, Item 2 of this Quarterly Report on Form 10-Q.
Item 2. Unregistered Sales of Equity Securities and Use of Proceeds
Unregistered Sales of Equity Securities
On September 15, 2015, we issued 2,307 restricted common shares to each of Robert B. Allardice, III, David Miller, Thomas Robards, and Ronald I. Simon, Ph.D., as compensation for serving as trustees. These restricted share grants were made pursuant to our 2013 Equity Incentive Plan and such grants were exempt from the registration requirements of the Securities Act based on the exemption provided by Section 4(2) of the Securities Act.
Purchases of Equity Securities
|
| | | | | | | | | | | | | | |
| | | Total Number of Shares Purchased | | Average Price Paid | | Total Number of Shares Purchased as Part of Publicly Announced Plans or Programs | | Approximate Dollar Value of Shares that May Yet be Purchased Under the Plans or Programs |
| | | | | | | | | (In thousands) |
| July 1, 2015 - July 31, 2015 | | — |
| | $ | — |
| | — |
| | $ | 10,000 |
|
| August 1, 2015 - August 31, 2015 | | 22,881 |
| | 12.93 |
| | 22,881 |
| | 9,704 |
|
| September 1, 2015 - September 30, 2015 | | 600 |
| | 12.78 |
| | 600 |
| | 9,696 |
|
| Total | | 23,481 |
| | $ | 12.93 |
| | 23,481 |
| | $ | 9,696 |
|
|
| | | | | | | | | | | | | | |
| | | Total Number of Shares Purchased | | Average Price Paid | | Total Number of Shares Purchased as Part of Publicly Announced Plans or Programs | | Approximate Dollar Value of Shares that May Yet be Purchased Under the Plans or Programs |
| | | | | | | | | (In thousands) |
| January 1, 2016 - January 31, 2016 | | 17,920 |
| | $ | 10.94 |
| | 17,920 |
| | $ | 9,429 |
|
| February 1, 2016 - February 29, 2016 | | — |
| | — |
| | — |
| | — |
|
| March 1, 2016 - March 31, 2016 | | — |
| | — |
| | — |
| | — |
|
| Total | | 17,920 |
| | $ | 10.94 |
| | 17,920 |
| | $ | 9,429 |
|
On August 13, 2013, our Board of Trustees approved the adoption of a $10 million share repurchase program. The program, which is open-ended in duration, allows us to make repurchases from time to time on the open market or in negotiated transactions. Repurchases are at our discretion, subject to applicable law, share availability, price and our financial performance, among other considerations.
Item 5. Other Information
ITRA Disclosure
Pursuant to Section 13(r) of the Exchange Act, if during the fiscal quarter ended September 30, 2015,March 31, 2016, we or any of our affiliates had engaged in certain transactions with Iran or with persons or entities designated under certain executive orders, we would be required to disclose information regarding such transactions in our Quarterly Report on Form 10-Q as required under Section 219 of the Iran Threat Reduction and Syria Human Rights Act of 2012 ("ITRA"). During the fiscal quarter ended September 30, 2015,March 31, 2016, we did not engage in any transactions with Iran or with persons or entities related to Iran.
Blackstone Tactical Opportunities EARN Holdings L.L.C., an affiliate of The Blackstone Group L.P. ("Blackstone"), is a holder of approximately 28%30% of the outstanding equity interests of our Common Shares and has a representative on our Board of Trustees. Accordingly, Blackstone may be deemed an "affiliate" of us, as that term is defined in Exchange Act Rule 12b-2. We have received notice from Blackstone that it may include in its Quarterly Report on Form 10-Q for the fiscal quarter ended September 30, 2015March 31, 2016 disclosures pursuant to ITRA regarding two of its portfolio companies that may be deemed to be affiliates of Blackstone. Because of the broad definition of "affiliate" in Exchange Act Rule 12b-2, these portfolio companies of Blackstone, through Blackstone's ownership of us, may also be deemed to be affiliates of ours.
We have reproduced below the disclosure of Travelport Limited, as provided to us by Blackstone. Travelport Limited may be considered an affiliate of Blackstone. We have no involvement in or control over the activities of Travelport Limited, any of its predecessor companies or any of its subsidiaries, and we have not independently verified or participated in the preparation of this disclosure.
"As part of our global business in the travel industry, we provide certain passenger travel-related Travel Commerce Platform and Technology Services to Iran Air. We also provide certain Technology Services to Iran Air Tours. All of these services are either exempt from applicable sanctions prohibitions pursuant to a statutory exemption permitting transactions ordinarily incident to travel or, to the extent not otherwise exempt, specifically licensed by the U.S. Office of Foreign Assets Control. Subject to any changes in the exempt/licensed status of such activities, we intend to continue these business activities, which are directly related to and promote the arrangement of travel for individuals.
The gross revenue and net profit attributable to these activities in the quarter ended September 30, 2015 were approximately $133,000March 31, 2016 are still being determined."
Neither Travelport Limited nor Blackstone has provided us with gross revenues and $94,000, respectively."net profits attributable to the activities described above.
We have also reproduced below the disclosure of Hilton Worldwide Holdings Inc.,NCR Corporation, or Hilton,NCR, as provided to us by Blackstone. HiltonNCR may be considered an affiliate of Blackstone. We have no involvement in or control over the activities of Hilton,NCR, any of its predecessor companies or any of its subsidiaries, and we have not independently verified or participated in the preparation of this disclosure.
"DuringPursuant to Section 13(r)(1)(D)(iii) of the fiscal quarter ended September 30, 2015, an Iranian governmental delegation stayedSecurities Exchange Act of 1934, as amended, we note that, during the period from January 1, 2016 through March 31, 2016, we maintained a bank account and guarantees at the Transcorp Hilton Abuja for one night. The staysCommercial Bank of Syria (“CBS”), which was designated as a Specially Designated National pursuant to Executive Order 13382 (“EO 13382”) on August 10, 2011. This bank account and the guarantees at CBS were booked and paid for bymaintained in the governmentnormal course of Nigeria. The hotel received revenuesbusiness prior to the listing of approximately $5,320 from these dealings. Net profitCBS pursuant to Hilton Worldwide Holdings Inc. ("Hilton") from these dealingsEO 13382. We note that the last known account balance as of March 31, 2016, was approximately $495. Hilton believes that$3,468. The bank account did not generate interest from January 1, 2016 through March 31, 2016, and the hotel stays were exempt fromguarantees did not generate any revenue or profits for the Iranian Transactions and Sanctions Regulations, 31 C.F.R. Part 560, pursuantCompany. Pursuant to a license granted to the International Emergency Economic Powers Act ("IEEPA")Company by OFAC on January 3, 2013, and under 31 C.F.R. Section 560.210 (d).subsequent licenses granted on April 29, 2013, July 12, 2013, February 28, 2014, November 12, 2014, and October 24, 2015, the Company has been winding down its past operations in Syria. The Transcorp Hilton Abuja intendsCompany’s current license expires on April 30, 2016. The Company has also received licenses from OFAC to continue engaging in future similar transactionsclose the CBS account and terminate any guarantees. The Company's application to renew the extent they remain permissible under applicable lawslicense to transact business with CBS, which was submitted to OFAC on May 18, 2015, remains pending. Following the termination of guarantees and regulations."
Management Agreement Amendment
On November 3, 2015, Ellington Residential Mortgage REIT (the "Company"), for itself and on behalf of eachthe closure of the Company's current and future subsidiaries, and Ellington Residential Mortgage Management LLC (the "Manager") entered into the Fourth Amended and Restated Management Agreement (the "Amended Management Agreement"). The Amended Management Agreement was amended to refine the definition of "Shareholders' Equity" set forth therein and to revise the date as of which the termination fee would be calculated in the event of a termination or non-renewal of the Amended Management Agreement. The Amended Management Agreement, which amends, restates and supersedes in all respects that certain Third Amended and Restated Management Agreement betweenaccount, the Company and the Manager, dated as of December 17, 2014.does not intend to engage in any further business activities with CBS."
A copy of the Amended Management Agreement is filed as Exhibit 10.1 hereto and incorporated herein by reference.
Item 6. Exhibits
|
| | |
| Exhibit | | Description |
10.1 | | Fourth Amended and Restated Management Agreement by and among Ellington Residential Mortgage REIT and Ellington Residential Mortgage Management LLC, dated as of November 3, 2015 |
| | |
| 31.1 | | Certification of Chief Executive Officer pursuant to Section 302 of the Sarbanes – Oxley Act of 2002 |
| | | |
| 31.2 | | Certification of Chief Financial Officer pursuant to Section 302 of the Sarbanes – Oxley Act of 2002 |
| | | |
| 32.1* | | Certification of Chief Executive Officer pursuant to 18 U.S.C. Section 1350, as adopted pursuant to Section 906 of the Sarbanes – Oxley Act of 2002 |
| | | |
| 32.2* | | Certification of Chief Financial Officer pursuant to 18 U.S.C. Section 1350, as adopted pursuant to Section 906 of the Sarbanes – Oxley Act of 2002 |
| | | |
| 101 | | The following financial information from Ellington Residential Mortgage REIT's Quarterly Report on Form 10-Q for the nine month periodquarter ended September 30, 2015,March 31, 2016, formatted in XBRL (Extensible Business Reporting Language): (i) Consolidated Balance Sheet, (ii) Consolidated Statement of Operations, (iii) Consolidated Statement of Shareholders' Equity, (iv) Consolidated Statement of Cash Flows and (v) Notes to Consolidated Financial Statements. |
| |
| * | Furnished herewith. These certifications are not deemed "filed" for purposes of Section 18 of the Securities Exchange Act of 1934, as amended. |
SIGNATURES
Pursuant to the requirements of Section 13 or 15(d) of the Securities Exchange Act of 1934, the registrant has duly caused this report to be signed on its behalf by the undersigned, thereunto duly authorized.
|
| | | | |
| | | | ELLINGTON RESIDENTIAL MORTGAGE REIT |
| Date: | NovemberMay 4, 20152016 | | By: | /s/ LAURENCE PENN |
| | | | | Laurence Penn Chief Executive Officer (Principal Executive Officer) |
| | | | | |
| | | | ELLINGTON RESIDENTIAL MORTGAGE REIT |
| Date: | NovemberMay 4, 20152016 | | By: | /s/ LISA MUMFORD |
| | | | | Lisa Mumford Chief Financial Officer (Principal Financial and Accounting Officer) |
EXHIBIT INDEX
|
| | |
| Exhibit | | Description |
| | |
10.1 | | Fourth Amended and Restated Management Agreement by and among Ellington Residential Mortgage REIT and Ellington Residential Mortgage Management LLC, dated as of November 3, 2015 |
| | |
| 31.1 | | Certification of Chief Executive Officer pursuant to Section 302 of the Sarbanes – Oxley Act of 2002 |
| | | |
| 31.2 | | Certification of Chief Financial Officer pursuant to Section 302 of the Sarbanes – Oxley Act of 2002 |
| | | |
| 32.1* | | Certification of Chief Executive Officer pursuant to 18 U.S.C. Section 1350, as adopted pursuant to Section 906 of the Sarbanes – Oxley Act of 2002 |
| | | |
| 32.2* | | Certification of Chief Financial Officer pursuant to 18 U.S.C. Section 1350, as adopted pursuant to Section 906 of the Sarbanes – Oxley Act of 2002 |
| | | |
| 101 | | The following financial information from Ellington Residential Mortgage REIT's Quarterly Report on Form 10-Q for the nine month periodquarter ended September 30, 2015,March 31, 2016, formatted in XBRL (Extensible Business Reporting Language): (i) Consolidated Balance Sheet, (ii) Consolidated Statement of Operations, (iii) Consolidated Statement of Shareholders' Equity, (iv) Consolidated Statement of Cash Flows and (v) Notes to Consolidated Financial Statements. |
| |
| * | Furnished herewith. These certifications are not deemed "filed" for purposes of Section 18 of the Securities Exchange Act of 1934, as amended. |